entrepreneurship and the evolution of income distributions
TRANSCRIPT
1
Entrepreneurship and the Evolution of
Income Distributions in Poland and Russia
Daniel Berkowitz John E. Jackson*
Department of Economics Department of Political Science
University of Pittsburgh University of Michigan
WWPH 4711 7766 Haven Hall
Pittsburgh, PA 15260 Ann Arbor, MI 48109
*Corresponding Author
December 14, 2005
Forthcoming in the Journal of Comparative Economics

2
Abstract
Differences in the evolution of Polish and Russian income distributions in the post-
socialist era can be attributed to different rates of entry of new enterprises. Using regional
differences during early privatization as instruments to estimate the impact of this entry, we find
that a one-standard-deviation increase in the share of the workforce in new or small enterprises
increases the share of income earned by the lowest forty percent of the population by 1.4% and by
1.25% in Polish and Russian regions respectively. Poland’s greater success in de novo firm entry
contributes to its more equitable income distribution during the transition.
JEL Codes: D3, O87, P2
3
1. Entrepreneurship and the Evolution of Income Distributions in Poland and Russia
Income inequality increased in the transitional economies in Central and Eastern Europe and
the former Soviet Union (CIS) according to UNICEF (2001) and World Bank (2000). The more
successful transitional economies in Central and Eastern Europe experienced relatively modest
increases in inequality of about 0.05 in their Gini coefficients from 1987-1989 to 1997-1999 with
coefficients still at or below the OECD average of 0.31 by the end of the 1990s. In contrast, the
CIS countries, which are regarded as having less successful transitions, had average increases in
their Gini coefficients of 0.17 during the same period so that, with the exception of Belarus, all
of these countries have Gini coefficients well above the OECD average. These observations raise
the intriguing issue of whether the relatively rapid and successful creation of a capitalist market
economy has a salutary impact on income distribution. In this paper, we investigate the increased
inequality by examining the relationship between the rates of creation and growth of new and
small private enterprises and the changes in the income share of the bottom two quintiles within
regions in Poland and Russia.
Russia and Poland illustrate two quite different transition experiences. Poland’s real GDP
increased annually beginning with the third year of the transition and exceeded its pre-transition
level by the sixth year. According to UNICEF data, the Gini coefficient measuring income
inequality increased from 0.28 to 0.33 between 1987-1989 and 1997-1999 in Poland.1 Russia,
however, experienced a major contraction from 1991 to 1998 and, by 2003, real GDP was still
below the pre-transition level despite significant growth after 1998. Accompanying this fall in
income is a considerable increase in inequality. According to the UNICEF data, the Gini
coefficient for income increased from 0.27 to 0.47 between 1987-1989 and 1997-1999 in Russia.2
We use these contrasting experiences to test propositions about how entry and growth of new
small firms is related to changes in the distribution of income. In the next section, we present
arguments for why increased small enterprise growth flattens the income distribution and benefits
those in the lower quintiles. Section 3 describes the regional variations in income distributions

4
and the size of the small enterprise sector in Poland and Russia. In the following section, we
discuss our estimation methods, which recognize the endogeneity of new firm creation and
growth, and present the statistical results. In the concluding section, we draw on our comparison
of the Polish and Russian experiences to suggest why Poland did not have the large increase in
income inequality that occurred in Russia.
2. New Firm Entry and Changes in Income Distribution
The entry of small enterprises consists of the creation of de novo firms, spin-offs from
state enterprises, and small scale privatization of state firms. In all three situations, we expect
higher rates of small enterprise creation to promote a more equitable income distribution. First,
new small enterprises were the sole source of job creation in many transitional economies and
offset layoffs resulting from the introduction of hard budget constraints, privatization, and
restructuring of state-owned firms. Bilsen and Konings (1998) provide evidence from Romania,
Bulgaria and Hungary; while Jackson, Klich and Poznańska, (2005) demonstrate this for Poland
and Jurajda and Terrell (2001) provide evidence from the Czech Republic and Estonia. The
wages earned in these jobs increase incomes at the lower end of the income distribution because
they are greater than unemployment benefits.
Second, based on the Schumpeterian notion of creative destruction, new small enterprises
will exhibit higher productivity than the firms that they are replacing. Using a detailed sample of
24 countries, Bartelsman, Haltiwanger and Scarpetta (2004) document that, in the post-socialist
transition economies, new firms are primarily small and the firms that they are replacing are large
state enterprises. These authors show that productivity gains from entry and exit are highest in
transition economies. Klapper, Laeven and Rajan (2004) corroborate this finding. Comparing
new and old manufacturing firms in Slovenia, DeLoecker and Konings (2006) find that the net
entry of de novo private firms is an important determinant of the growth in total factor
productivity. Using longitudinal data on cohorts of new and old enterprises in Poland, Jackson,

5
Klich and Poznańska (2005) find that both survival and growth are strongly related to average
sales per worker within new firms indicating that the most productive firms are employing a
larger share of the workforce. These authors also show that wage growth among surviving firms
in a cohort is strongly related to sales per worker and to sales growth. Moreover, their analysis
indicates that wage growth is tied more closely to productivity growth in the surviving small
enterprises than in state-owned and former-state-owned firms. In the short run, regional incomes
depend on factors other than the number and growth of new firms, e.g., unemployment.3
However, in the longer run, the equilibrium wage in a competitive labor market will reflect this
higher level of productivity in the surviving new firms.
Finally, a high rate of entry and survival of new firms increases the competitiveness of
product and labor markets so that monopoly rents are eliminated over time, as McMillan (1995)
discusses. Johnson, McMillan and Woodruff (2002) argue that, during the first years of
transition, small de novo and spin-off firms in Poland and Russia entered sectors that had been
dominated by large state enterprises under socialism, such as consumer goods, light
manufacturing, trade and services. The inefficiencies of the state enterprises created considerable
profit opportunities for initial entrants in these sectors. Over time, the continued entry of firms
reduced profits. Johnson, et. al. (2002) show that rents decreased as competition increased in
Poland starting in 1995. However, McMillan and Woodruff (2002) argues that the slow
development of supporting institutions and lower rates of firm entry led to the persistence of high
profits in Russia.4 Frye and Shleifer (1997) present evidence that, by 1996, small firms in Warsaw
were operating in a more competitive market than their counterparts in Moscow. Thus, the small
enterprise sector provides employment through job creation and also boosts productivity. If the
entry of small enterprises is accompanied by the reduction of monopoly rents because of
increased competition and if distortionary regulations are removed gradually, we expect payments
to labor to reflect more accurately the marginal productivity of labor over time so that the entry of
small enterprises leads to higher wages.

6
These arguments predict a positive association between the rate of new and small firm
creation and the equality of the income distribution in transitional economies. The remaining
sections test this prediction by relating changes in the income share of the lowest two quintiles to
the size and growth of the de novo firm sector in regions in Poland and in Russia.
3. Income Distribution and New Firm Creation in Poland and Russia
Our estimates of regional income distributions and of the size of the small enterprise
sector in Poland come from specialized data collections. The Polish Central Statistical Office
does not disseminate publicly data on the regional distribution of income. The Institute for Social
Studies at the University of Warsaw has conducted the Polish General Polish Social Survey
(PGSS) since 1992, as discussed by Cichomski and Morawski (2002). This survey contains a
nationally representative random sample of about 1,600 households in 1992, 1993, and 1994 and
about 2,300 households in 1997 and 1999.5 One of the questions asks for total monthly family
income. The 1992, 1993, and 1994 samples are pooled and family incomes in 1993 and 1994 are
adjusted to 1992 price levels using the consumer price index. These data constitute the 1993
sample. Similarly the 1997 and 1999 surveys are pooled and 1999 incomes are adjusted to 1997
levels. These data make up the 1998 sample. Each sample is disaggregated by region, i.e.,
voivodship, of which there are forty-nine.
Measures of income distribution, or inequality, are computed for each region based on
the respondents residing in that region. These measures are the income shares of the lowest and
the lowest two quintiles in 1993, in 1998, and the changes in these shares between 1993 and
1998. Table 1 provides descriptive statistics for the means and ranges of these measures among
voivodships with the Warsaw region omitted. The average income share of both the first and
second quintile is essentially equal in 1993 and 1998 at about 22%. The average share for the first
quintile is also comparable across the periods at about 8%. The standard deviation of regional
shares of the first two quintiles increased between 1993 and 1998 while the range decreased by
7
2.5%. For the first quintile, both the standard deviation and the range of income shares increased
between 1993 and 1998. The stability of mean income shares between 1993 and 1998 disguises
substantial variation in changes in the shares. The range of these changes is large, from -9.8% to
+12.2%, with a standard deviation of 4.3% for the first and second quintiles combined. These
statistics indicate considerable regional variations in the change in shares; our interest is to
investigate whether these changes are related to the size and growth of the small enterprise sector.
The lower half of Table 1 shows the regional sample sizes on which these distributional
statistics are calculated. Two important considerations must be given to the evaluation of these
statistics. First, their accuracy relative to the population values in the regions is a function of
sample size. In our statistical analysis, we weight by these sample sizes to adjust for sampling
errors. The alternative strategy of combining regions with smaller sample sizes presents two
problems. It reduces the degrees of freedom in our analysis relating changes in regional income
shares to the de novo sector. In addition, regions with small samples are not contiguous so that
any aggregation is arbitrary. For these reasons, we keep the regions intact and weight by sample
size. Second, the PGSS study is a representative sample for the nation but not for each
voivodship. Hence, our measure of a region’s income distribution may be calculated from a non-
representative subset of a region’s population.
Given the available data, we have no option but to use these regional income distributions
despite this potentially serious problem. To discern its likely severity, we compare the sample
sizes in each voivodship with the corresponding populations and conjecture that the greater is the
proportional difference the less likely is the voivodship to be represented adequately in the PGSS
sample. The simple correlation of the sample size and population variables is 0.93. The ratio of
the regional sample size to the voivodship population divided by ten is 1.19 with a standard
deviation of 0.37; the log of this ratio has a mean of 0.13 and a standard deviation of 0.32. We
correlated this ratio and its log with a series of variables characterizing each voivodship, e.g.,
population, average salary, and the rates of creation of both de novo firms and jobs. None of the

8
individual correlations is close to being statistically significant with the lowest p-level at 0.25.
The multiple regression in which all the variables are included has an adjusted r-squared of -0.13
and an F-statistic of 0.51 with eleven and thirty-six degrees of freedom, which implies a p-level
of 0.88. Based on these comparisons, we conclude that the regional sample sizes and populations
are highly correlated and we find no systematic variation in the deviations from this ratio. Thus,
with corrections for sampling error, we expect to obtain good estimates of the relationship
between small enterprise creation and income inequality and to have reliable estimates of their
uncertainty.
Measuring the size and growth of the small enterprise sector in transitional economies is
a daunting task. However, we have access to a dataset developed by the Economics and Statistics
Research Office of the Polish Central Statistical Office (GUS) that enables us to focus on small
de novo firms and spin-offs as opposed to small privatized firms in Poland. The GUS created
longitudinal data tracking individual firms from annual reports filed by individual enterprises that
measure the entry, survival, and growth of new firms for the period 1990 through 1997, as
Jackson, Klich, and Poznańska (1999) and (2005) describe. The filings are linked to follow the
survival and employment growth of small firms that existed in 1990 and the entry, survival, and
growth of new firms that entered after 1990. From these data, we calculate the number of firms
in each region in 1997 that were small in 1990 or had entered since then along with their total
employment. These numbers for employment and firms are denominated by the size of the
workforce and by population, respectively. Hence, we take the density of these firms per capita,
their employment share in 1997, and the change in their employment share from 1993 to 1997 as
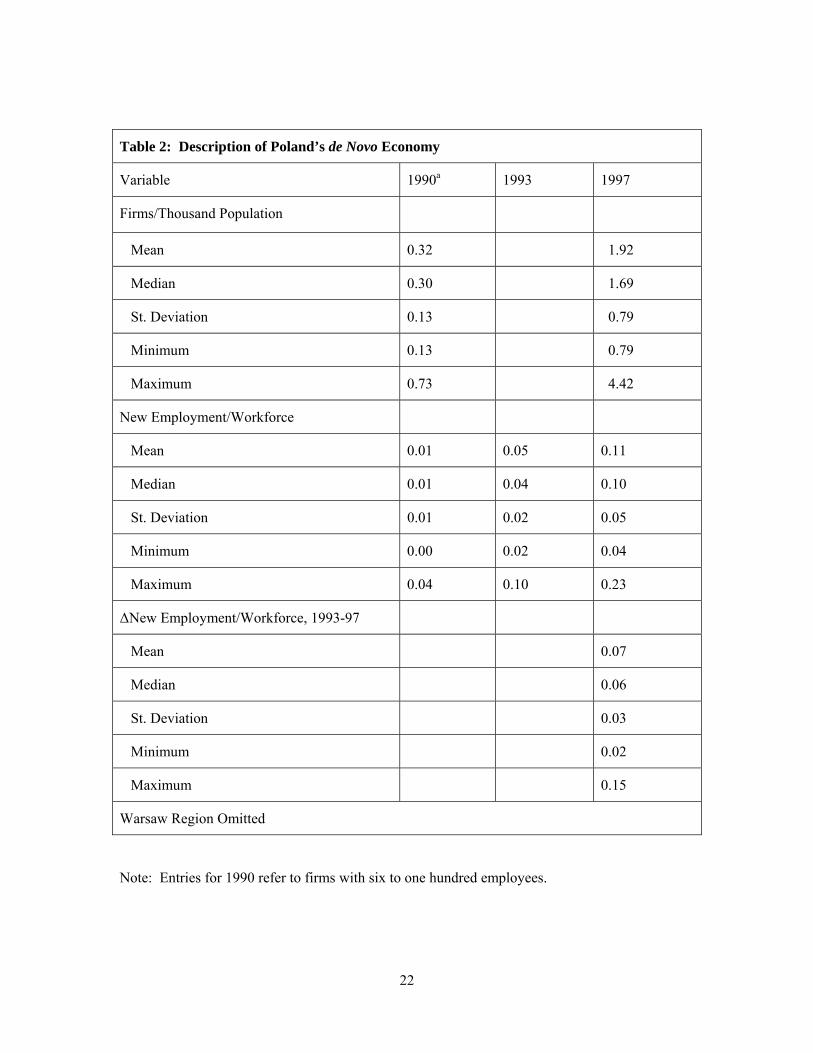
measures for the size of the small enterprise sector in each region. Table 2 reports the summary
statistics for these variables.
One limitation of these data is that the GUS did not require firms with five or fewer
employees to report. Consequently, the very smallest sector is omitted. Another agency collects
data on firm registrations by region but their data for firms with five or fewer employees overstate

9
considerably the number of de novo firms. Hence, these data are not reliable and we do not use
them in this study.6 Jackson, Klich and Poznańska (2005) compare the GUS and registry data for
firms of all sizes and find no evidence of systematic regional differences or biases between the
two data sources. These authors conclude that the GUS data provide more reliable estimates of
local de novo firms and spin-off activity because they track both growth and exit. Hence, we use
these data despite the omission of very small firms. The GUS data have several advantages over
the usual data that measure the size of the small and medium enterprise (SME) sector or that track
the registration of new firms. First, in the conventional data on SMEs, the most successful new
firms will no longer by classified as SMEs as they grow over time. Hence, the more successful is
a region in promoting entry and growth of a small enterprise sector, the more likely is the SME
data to understate its size and importance. Second, most data on the size of the private sector do
not separate de novo and spin-off firms from privatized firms. The latter may have a quite
different impact on promoting the competition and growth needed for a healthy market economy
than the former group. In summary, we conclude that the GUS data are the best available
information on the size and growth of small de novo and spin-off firms in Poland so that we use
them to measure the number and employment of the most successful of these firms on a regional
basis.
The Warsaw region is dropped from the Polish sample because it is an outlier whose
inclusion would influence the results unduly. As the capital city, Warsaw has a very high
proportion of government employees, whose wages are not determined by market forces but are
more reflective of political interests. Warsaw also had a large de novo private sector by 1997 and
received the dominant share of foreign investment, which accounted for about half of all
employment in new foreign owned firms. Hence, Warsaw has the largest proportion of
workforce in de novo private domestic and foreign firms of any region. Nonetheless, Table 2
indicates the substantial variation in the size of the de novo sector across regions.

10
For Russia, we use published regional data supplied by the official Russian statistical
agency in Goskomstat Rossii (1996, 2001, and 2002) to characterize the income distribution and
small enterprise formation. These data contain representative regional surveys of household
income, regional registries of small enterprises, and data on the number of employees and sales in
these new enterprises. The regional income distribution is reported in 1995, 2000 and 2001 and
the methodology does not change over time. Russia contains 89 regions; the 1995 national survey
covers 75 of the regions and the 2001 survey covers 77 of them. We match data from the national
sample with our regional data set, which includes early privatization data and other regional
covariates, and obtain a sub-sample of 66 regions in 1995 and 2001. The cities of Moscow and St.
Petersburg are excluded.
Table 3 reports the share of income held by the bottom 20-percent and the bottom 40-percent
of the regional income distribution in 1995 and 2001 and illustrates several patterns. First, income
distribution within Russian regions becomes slightly more inequitable during this time period
measured by either the national mean or the regional mean. Households in the bottom 40-percent
of the income distribution lose, on average, one percentage point of their share of overall income;
households in the bottom 20-percent lose about a half percentage point. Hence, the changes in the
Russian income distribution from 1995 to 2001 are considerably different from the relatively
stable income distribution in Poland from 1993 to 1998 reported in Table 1.
Second, comparing Tables 1 and 3 we see that the income distribution exhibits less variation
over time in Russia than in Poland. The standard deviation in regional income shares in Russia
decreases from 2.7% in 1995 to 1.7% in 2001, whereas in Poland it increased from 2.6% in 1993
to 3.0% in 1998. The changes in income shares within regions are also more stable in Russia
between 1995 and 2001 than in Poland between 1993 and 1998. For the lowest two quintiles, the
standard deviation of the change in income shares is smaller in Russia than in Poland, 2.5% and
4.3% respectively, and the range of the changes is smaller in Russia than in Poland, -6.5% to
5.2% compared to -9.9% to 12.2%. Nevertheless, we have sufficient variation in the change in

11
Russian regional income shares to estimate the relationship between income shares and the size
and growth of the small enterprise sector.
We use small enterprise employment as a share of the regional workforce and the registry
of small enterprises per 1,000 people as measures of small enterprise development. Legally
registered small enterprises include spin-offs from state enterprise and start-ups as well as
privatized small state enterprises. Thus, we can not separate small de novo and spin-off firms
from small privatized firms in Russia as we did in Poland. Before 1996, small enterprises were
defined by employment ceilings in that, over the course of a year, a small enterprise could hire no
more than 200 workers on average and employment ceilings varied across branches, e.g., 100 in
scientific services and 15 in retail trade. However, starting in 1996, small enterprises have been
defined by both ownership structure and employment in Russia. Regarding ownership, no matter
how small an enterprise may be, it is not legally defined as a small enterprise if it has an outside
owner, e.g., a large company, a charitable organization, or a social or religious organization, that
owns at least 25% of the initial enterprise capital. In addition, employment ceilings have changed
and become smaller; for example, the highest ceiling is 100 applying to industry, construction and
transport while the ceiling for retail trade has been increased to 30 employees on average per
year. Because the definition of a Russian and Polish small enterprise is different, our data cannot
be used to compare the penetration of small enterprise in these two countries.
Table 4 reports data on the evolution of small enterprises in Russia for pairs of years in which
the definitions are comparable and for which data are available. Remarkably, the number of small
enterprises per capita and the share of the labor force employed in small enterprises decreases
over time. Employment shares increase in only one region in our sub-sample, namely, Nizhni
Novgorod. The cities of Moscow and St. Petersburg are outliers because the increase in the labor
force employed in small enterprises in these cities is three to four standard deviations above the
median region in our sub-sample and one to two standard deviations above Nizhny Novgorod.
Moscow is 4.6, 2.6, and 4.8 standard deviations above the mean and St. Petersburg is 4.5, 3.5, and

12
5.2 standard deviations above the mean for the 2001 small enterprise employment share, the 1995
to 2001 change in small enterprise employment share, and in 2001 enterprises per capita.
Moreover, the extent of foreign activity in Moscow and St. Petersburg sets these two regions
apart from the rest of Russia. In 2001, they attracted 48% of foreign investment. Moscow and St.
Petersburg have the highest and second highest proportions of the regional workforce employed
in foreign joint enterprises that are also small enterprises. Hence, we exclude these two cities
from our analysis. However, even if we were to include Moscow and St. Petersburg in the
sample, small enterprise development would remain much more dynamic over time in Poland
than in Russia.
4. The Empirical Results
In this section, we present the empirical analysis of the influence of small enterprise
development on income distribution in Poland 1998 and Russia 2001. We begin with the
following equation:
,t1tt DISTXSMENTDIST εδδβα ++++=∆ − (1)
where ∆DISTt,, DISTt-1, SMENT, and X denote the change in income distribution measured as the
share of income going to the bottom 40-percent of the distribution in a region between periods t
and t-1, the income distribution in period t-1, small enterprise development, and a vector of
regional covariates, respectively. In this vector, we include log population to capture the extent
of the market and education because both of these variables are important determinants of income
distribution and small enterprise development. The primary measure for small enterprise
development, denoted SMENT, is the employment share of the sector in 1997 in Poland and in
2001 in Russia. This variable is also measured by the number of de novo private firms per
thousand people and by the change in the de novo firm share of private employment from 1993 to
1997 for Poland and from 1995 to 2001 for Russia.

13
Estimating equation (1) is complicated by the possibility of reverse causality. Using
formal models, Gabszewicz and Thisse (1980) and Shaked and Sutton (1982) show that the entry
of new firms in markets characterized by monopolistic competition is related to the distribution of
income. Empirical studies argue that more equitable income distributions are associated with
higher rates of economic growth. Aghion, Caroli and Garcia-Peñalosa (1999) provide a summary
of this research and Forbes (2000) gives a contrary view. Keane and Prassad (2002) report a
strong negative correlation between GDP growth and inequality for fourteen transition countries
during the first eight years of the transition. If GDP growth is related to the growth of de novo
firms as we hypothesize, our measures of small enterprise development will be endogenous.
To address this potential endogeneity problem, we use early privatization and initial
conditions as instruments that should provide consistent estimates for the relationship between
new enterprise development and changes in income equality. Because of differences in data
availability and in their approaches to reforms, the precise variables differ in each country. For
Russia, the two instruments are large and small scale privatizations in 1993, defined as the
number of privatized firms in each category per 1,000 population as reported in Goskomstat
(1994).7. In Poland, data for only large scale privatization, defined as the proportion of the 1993
workforce employed in firms privatized to that time, are available. Additional relevant initial
condition variables are the proportion of the 1990 non-farm workforce employed in state-owned
enterprises and the proportion of the workforce employed in private enterprises with fewer than
one hundred employees.8
The first requirement for our instruments is that they be related to the size of the de novo
enterprise sector. McMillan (1995) argues that early privatization leads to the emergence of a
regulatory environment that enhances the entry and development of small enterprises. If properly
implemented, privatization weakens the political connections of the controllers of formerly state
owned enterprises. Hence, both national and local governments would have no incentive to use
tax and regulatory policy to protect state-owned enterprises against entry by small enterprises.

14
Furthermore, governments can expand their tax base and enhance the standard of living by
developing a pro-small-business regulatory environment. Alternatively, if privatization fails to
eliminate these political connections, the old situation in which governments have an incentive to
protect the large enterprises remains. Berkowitz and Holland (2001) find strong positive
relationships between new firm registrations and federal and regional privatization in Russia, but
small negative relationships for local privatization. Hence, we conclude that the greater is the
degree of capture of government agencies by the privatized firms and the smaller is the separation
of these firms from the government, the weaker will be the relationship between privatization and
new firm entry.
Poland and Russia have quite different privatization experiences. Poland proceeded very
slowly with large scale privatization while Russia privatized very rapidly. Alexeev (1999),
Berkowitz and Li (2000), Black, Kraakman and Tarassova (2000), Frye and Shleifer (1997),
Hellman (1998) and Shleifer and Vishny (1993) argue that early Russian privatization led to a
corrupt regulatory environment that persisted through at least the mid-1990s, while early Polish
privatization had the opposite effect. Johnson, et al. (2002), Hellman, Jones and Kaufman (2000)
and Karatnycky, et al. (2001) and Transparency International (1996) document far less corruption
in Poland than in Russia, while Hellman, et al. (2000) reports relatively less governmental
capture in Poland. We expect these differences to produce a stronger association between large
scale privatization and new firm growth in Poland than in Russia.
Initial conditions are important to the development of the Polish de novo private sector.
Poland had a nascent small private sector and a varied mix of state-owned, collective, and large
domestic and foreign enterprises at the beginning of the transition, the concentration of which
varied substantially by region. Given the importance of agglomeration, learning, and political
effects, the presence of a significant number of small private enterprises at the beginning of the
transition gives a region a substantial advantage in expanding its de novo sector as the transition
proceeds. Moreover, we expect the presence of state-owned enterprises at the beginning of the

15
transition to depress the entrepreneurial process and, as a result, decrease the growth and
ultimately the size of the de novo sector. These enterprises pay higher wages, raising labor costs
and reducing labor supply for new enterprises. Even within the less-corrupt Polish environment,
large firms are able to exert undue influence on institutions ranging from financial organizations
to governments and obtain preferential treatment and various subsidies, which create an
unfavorable climate for enterprise creation. Finally, empirical evidence from the U. S. and
Poland in Jackson and Rodkey (1994) and Jackson and Marcinkowski (1999) indicates that both
individuals residing in regions dominated by large organizations, independent of the size of their
own employer, and employees in large organizations express less support for entrepreneurs and
are less likely to say they would undertake entrepreneurial activity. Considering these three
factors, we expect to find a negative relationship between a region’s density of state-owned
enterprises and the development of its de novo sector in Poland. However, these initial conditions
are relatively unimportant in explaining the development of the de novo sector in Russia due to
the lack of a small private sector and the fact that virtually all employment was in state-owned
firms at the beginning of the transition.
A second requirement for our instruments is that they are not related systematically to the
change in the income share of the bottom two quintiles after controlling for new firm entry,
lagged income shares, education and population. In other words, the effect of an instrument on
income shares is only through its relationship to new firm creation and growth. To validate
empirically this identifying assumption, we take a two-step approach. First, we control for the
influence of the initial income distribution in the estimating equation. Initial conditions and early
privatization are determined prior to our measure of initial income shares so that, if these
variables affect inequality directly, their strongest effects should be on this variable and not on the
subsequent change in income. Second, we validate our exclusion restrictions by employing over-
identification tests based on Hansen (1982) and Baum, Schaffer and Stillman (2003.) These tests
examine whether the identifying variables are correlated individually or jointly to the changes in

16
the income distribution conditional on firm entry and the other covariates in equation (1). If we
cannot reject the null hypothesis of no correlation, we find statistical corroboration for the
validity of this requirement.9
Based on these propositions the first stage regression used to identify the impact of
SMENT on ∆DIST is:
110311 XCONDPRIVSMENT εδββα ++++= , (2)
where PRIV denotes privatization during 1990 to 1993 for Poland and small and large
privatization in 1993 for Russia and COND0, which applies only to Poland, is the 1990
employment in small private and in state-owned firms.10 Therefore, we use the variables in PRIV
and in COND0 as over-identifying restrictions in estimating equation (1) for either Poland or
Russia.11
Table 5 contains the empirical results of estimating equations (1) and (2) for Poland.12. In
panel A, we report 2SLS estimates of equation (1) and, in panel B, we provide test statistics to
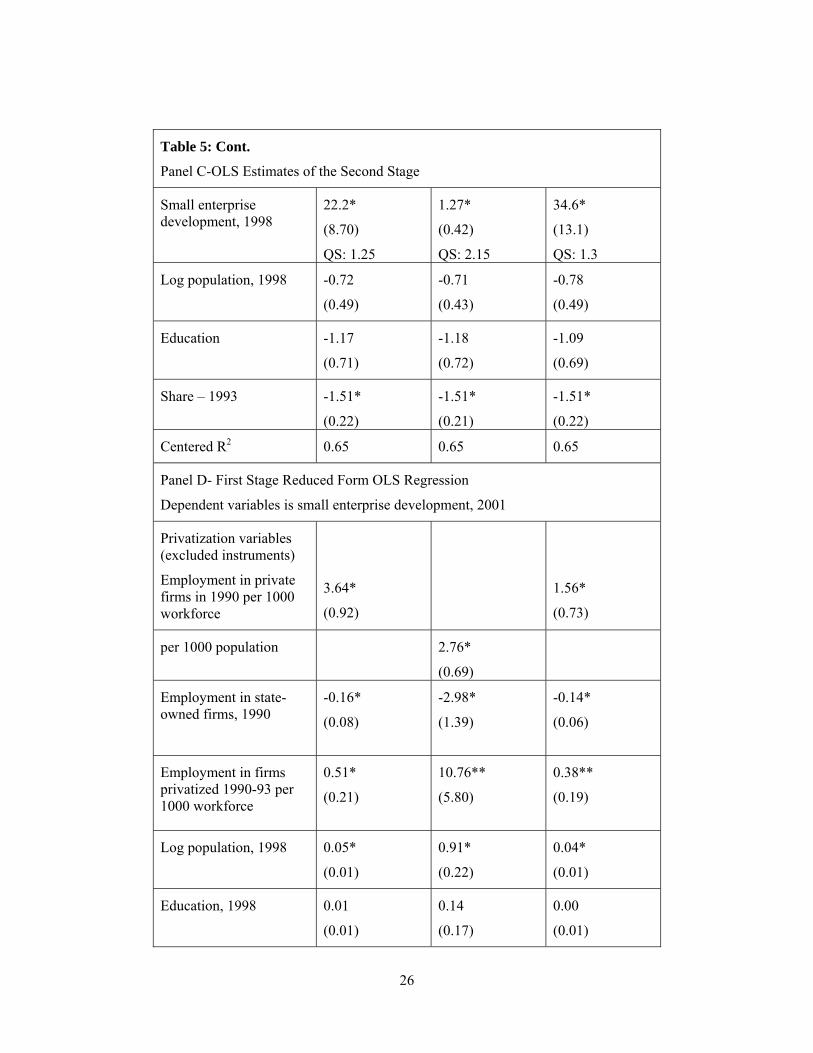
check for the validity of our instruments. Panel C contains corresponding Ordinary Least Squares
(OLS) estimates and panel D presents the first stage estimates of the influence of early
privatization and initial conditions on small enterprises.
Small enterprise development in 1997 in Poland, whether measured by employment
share, enterprises per capita, or change in employment share, has the expected positive impact on
the change in income distribution between 1993 and 1998 and is always significant at the 5
percent level. To gauge the quantitative significance (QS) of small enterprises, we compute the
impact of a one-standard-deviation increase in small enterprise development on income
distribution. These values for all three measures are about one half of a standard deviation of
income going to the bottom 40-percent in 1998, which is 3% in our sample. Panel B provides two
sets of tests to check the validity of excluding early privatization from the 2SLS estimates in
equation (1). First, we provide t-statistics and associated p-values to test the null hypothesis that

17
each instrument can be excluded separately from the second stage. For example, the t-statistic for
employment in private firms in 1990 divided by the workforce reported in the first regression
column tests the null hypothesis that this variable’s coefficient is not statistically different from
zero if only it is included in the second stage while using the identifying restriction that the other
instruments are excluded. In the nine cells for the three regression columns, the lowest p-value
associated with these t-statistics is 0.45 indicating that the null hypothesis for an individual test
can be rejected. Second, we report the J-statistic to test the null hypothesis that the three
privatization instruments are not jointly correlated with the error term in the second stage
estimates, as suggested by Hansen (1982) or Baum et al. (2003). All the p-values are above 0.75
indicating that the null hypothesis cannot be rejected for the joint tests. Hence, we conclude that
the variables characterizing early privatization and initial conditions are valid instruments.
Panel C reports OLS point estimates of the impact of small enterprises on income
distribution. In all three cases, the 2SLS points estimate are higher suggesting that the 2SLS
procedure has corrected for some simultaneity bias. Panel D reports the first-stage OLS estimates
of the impact of early privatization and employment in state-owned enterprises on small
enterprise development. In each case, early privatizations have strong positive and statistically
significant coefficients and the concentration of state-owned enterprises has a significant negative
impact on subsequent small enterprise development. The F-statistic to test for excluded
instruments indicates that the early privatization measures and the initial concentration of state
enterprise cannot be jointly excluded from the first stage. The partial R2 measures the share of the
variance explained by these instruments and corroborates the considerable strength of these
instruments.
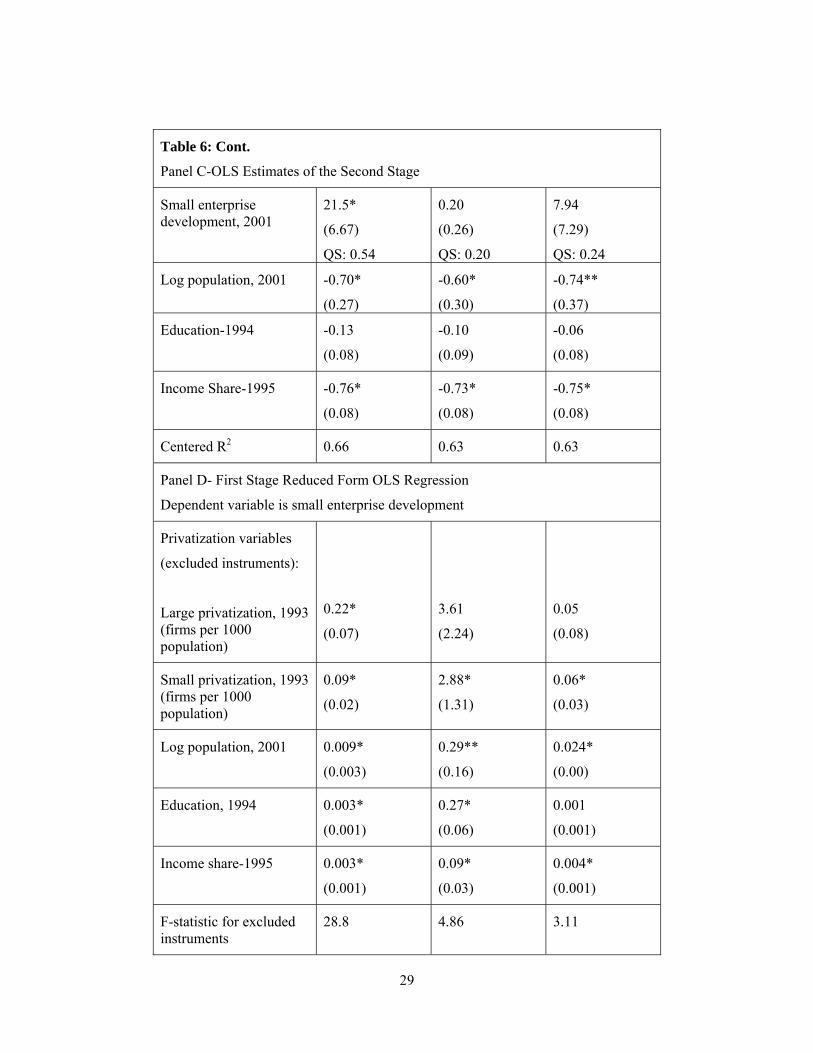
Table 6 is arranged similarly to present the results for Russia.13 Panel A shows that all
three variables measuring small enterprise employment have a positive and statistically
significant impact on income distribution in 2001. The quantitative significances of all three
variables are substantial compared to the 2.2 percent standard deviation in regional income
18
distribution. As in Poland, the entry of new firms and the consequent employment created is
strongly and positively related to the increases in income share of the lower two quintiles. The t-
test statistics and J-test statistics in panel B provide validation for using early large and small
privatization as instruments. The OLS estimates of the impact of these variables on income
distribution in Panel C are positive and substantially lower than the corresponding 2SLS
estimates. Panel D indicates that early privatization is always positively associated with
subsequent small enterprise development. The early small privatization measures are statistically
significant in all 3 models and the early large scale privatization variable is significant in one
model. The F-test for excluded instruments and the partial R2 values show that these instruments
are strongest in the equation for employment share in 2001 and weaker for the other two
measures.
In Table 7, we compute the indirect quantitative significance of early privatization on
income distribution in a two-step approach. First, we multiply a one-standard-deviation change in
one of the early privatization measures by its impact on small enterprise formation and obtain the
quantitative significance of a particular form of early privatization on small enterprises. Second,
we take this statistic and multiply it by that impact of small enterprises on the subsequent income
distribution. Regardless of whether we use employment, the number of small firms, or the change
in employment as the measure of early small enterprise development in Poland, early
privatization is associated with a 0.6 to 0.7 percentage point increase in the income shares of the
bottom 40-percent of the distribution. Privatizations from 1990 to 1993 are associated with only
about a 0.3 to 0.5 percentage point increase in shares while increases in the employment in state-
owned enterprises in 1990 are associated with a 0.4 to 0.7 percentage point decrease in these
income shares. In Russia, one standard deviations in small and large privatization are associated
with about a 0.45 and 0.20 percent increase in the income shares of the lowest two quintiles.
Hence, evidence from both countries indicates that early small privatization is relatively
more important than privatization and initial employment in state-owned firms for income

19
distribution. Moreover, as the table indicates, the impact of early privatization on income
distribution is much stronger in Poland than in Russia. Therefore, we conclude that early
privatization through its impact on small enterprise development has been a more powerful force
for promoting an equitable income distribution in Poland than in Russia.
5. Conclusion
In our empirical work, we find a strong positive relationship between the size and the growth
of the de novo sector and the income share of the bottom two quintiles of the distribution in both
Poland and Russia. The average impact of a one-standard-deviation increase in any measure of
new enterprise activity on the income share of this group is approximately 1.6%. Finding
consistent evidence for these two countries having two quite different transition experiences lends
credibility to the proposition that new firm creation leads to a more equitable distribution of
income in post-socialist countries. In addition, Berkowitz and DeJong (2005) find that a one–
standard-deviation increase in the size of the small firm sector is associated with a one and a half
percent increase in annual income growth from 1993 to 2000 in Russia. In a similar analysis for
Poland, we find that each measure of de novo firm activity used in this paper is significantly
related to income growth with a one-standard-deviation increase associated with a one percent
higher annual income growth rate.14 Taken together, these results indicate that new firm creation
is associated with both larger income and a larger portion of income distributed to the lower
quintiles, making the members of this group better off in both absolute and relative terms. These
results also suggest that a positive association between per capita income and income distribution
is due in part to small enterprise activity. In addition, according to United Nations (2005), overall
growth in Russia since 2001 is associated with some improvement in the income distribution.
Investigating these interesting issues requires additional data and sophisticated systems tests so
that we leave it to future research.
Our empirical work allows us to make inferences about the strikingly different changes in the
income distributions in Poland and Russia during the first decade of their respective transitions.
20
A critical aspect of the differences in the experiences of the two countries is the rate and character
of new private firm creation. Kornai (2000) considers Poland’s transition to be based on a high
level of organic de novo firm creation and of spin-offs from old state firms in contrast with Russia
where the emphasis was on privatization with much lower rates of de novo creation and of spin-
offs. Our Polish and Russian data are not comparable because the former measures new firm
creation and their employment growth while the latter measures the size of the small enterprise
sector, although most of this activity is likely to be new firms. However, the evidence presented
in this paper demonstrates strong growth of the de novo sector in Poland by 1997. Employment
in these firms more than doubled between 1993 and 1997 and the most successful regions exhibit
very dynamic de novo sectors. In contrast, the small enterprise sector in Russia actually
decreased between 1995 and 2001. Hence, our data indicate that the small private enterprise
sector is a much more dynamic part of the Polish transition relative to Russia, as Kornai contends.
Our empirical results show that these new firms are also crucial to promoting aggregate economy
growth, to creating an economic middle class, and to maintaining a relatively equitable income
distribution. Hence, we conclude that the different experiences with the creation of new small
firms are a major reason why the income distributions in Poland and Russia diverged so
dramatically during the 1990’s.

21
Table 1: Descriptive Measures of Income Distributions and Survey Sample Sizes for Poland
Variable 1993 Shares 1998 Shares ∆Shares
1st Quintile Income Shares
Regional Mean 7.9% 8.1% 0.1%
Regional Median 7.9% 7.8% 0.1%
Regional St. Deviation 1.1% 1.5% 1.7%
Regional Minimum 5.3% 5.9% -3.6%
Regional Maximum 10.34% 14.7% 4.7%
1st and 2nd Quintile Income Shares
Regional Mean 21.7% 21.9% 0.2%
Regional Median 21.4% 21.8% 0.3%
Regional St. Deviation 2.6% 3.0% 4.3%
Regional Minimum 15.7% 17.1% -9.9%
Regional Maximum 28.8% 27.8% 12.2%
Sample Sizes
National 4569 4151
Regional Mean 95.2 86.5
Regional Median 81 73.5
Regional Minimum 22 21
Regional Maximum 542 428
Note: The Warsaw region is omitted from all statistics.
22
Table 2: Description of Poland’s de Novo Economy
Variable 1990a 1993 1997
Firms/Thousand Population
Mean 0.32 1.92
Median 0.30 1.69
St. Deviation 0.13 0.79
Minimum 0.13 0.79
Maximum 0.73 4.42
New Employment/Workforce
Mean 0.01 0.05 0.11
Median 0.01 0.04 0.10
St. Deviation 0.01 0.02 0.05
Minimum 0.00 0.02 0.04
Maximum 0.04 0.10 0.23
∆New Employment/Workforce, 1993-97
Mean 0.07
Median 0.06
St. Deviation 0.03
Minimum 0.02
Maximum 0.15
Warsaw Region Omitted
Note: Entries for 1990 refer to firms with six to one hundred employees.

23
Table 3: Descriptive Measures of Income Distributions and Survey Sample Sizes for Russia
Variable 1995 Shares 2001 shares ∆Shares
1st Quintile Income Shares
National Mean (full sample) 7.6% 7.1%
Regional Mean (analyzed sub-sample) 7.7% 7.2% -0.5%
Regional Median 8.0% 7.3% -0.7%
Regional St. Deviation 1.3% 0.9% 1.2%
Regional Minimum 4.7% 4.7% -3.3%
Regional Maximum 10.1% 8.5% 2.5%
1st and 2nd Quintile Income Shares
National (full sample) 20.0% 19.0%
Regional Mean (analyzed sub-sample) 20.1% 19.1% -1.0%
Regional Median 20.9% 19.4% -1.4%
Regional St. Deviation 2.7% 1.7% 2.5%
Regional Minimum 13.9% 13.9% -6.5%
Regional Maximum 24.8% 21.8% 5.2%
Sample Sizes (number of regions)
National (full sample) 75 77
Regional (analyzed sample) 66 66
Actual number of regions 89 89
Note: The cities of Moscow and St. Petersburg are omitted from all statistics.

24
Table 4: Description of Russia’s Small Enterprises
Variable 1996 2001
Firms/Population (1000)
Mean 3.84 2.34
Median 3.76 2.18
St. Deviation 1.41 1.02
Minimum 1.71 1.09
Maximum 9.40 5.98
Small Employment/Workforce 1995 2001
Mean 0.13 0.07
Median 0.13 0.07
St. Deviation 0.02 0.03
Minimum 0.08 0.02
Maximum 0.20 0.14
∆ Employment share, 1995-2001
Mean -0.06
Median -0.06
St. Deviation 0.03
Minimum -0.15
Maximum 0.01

25
Table 5 - Income Distribution and Small Enterprises in Poland
Measure of small enterprise development
Employment share of workforce, 1997
New enterprises per capita, 1997
∆ Employment share, 1993-97
Panel A- Second Stage 2SLS Estimates Dependent Variable is Share of Income Going to Bottom 40-percent
Small enterprise development, (instrumented)
30.6*
(10.7)
QS: 1.44
2.00*
(0.79)
QS: 1.58
57.3*
(24.6)
QS: 1.72
Log population, 1998
-1.01*
(0.45)
-1.14*
(0.54)
-1.32*
(0.58)
Education, 1998
-1.35**
(0.77)
-1.46**
(0.85)
-1.36**
(0.80)
Income Share - 1993 -1.50*
(0.22)
-1.50*
(0.21)
-1.50*
(0.23)
Centered R2 0.64 0.64 0.63
Panel B-Over-identification Tests For 2SLS Estimates: t-statistics
Employment in private firms in 1990 per 1000 workforce (p-value)
-0.62
(0.54)
-0.09
(0.93)
1990 private employment per 1000 population (p-value)
-0.42
(0.68)
Employment in state-owned firms, 1990 (p-value)
0.01
(0.99)
0.09
(0.93)
0.34
(0.74)
Employment in firms privatized 1990-93 per 1000 workforce (p-value)
0.76
(0.45)
0.50
(0.62)
0.49
(0.63)
J-test for joint exclusion of privatization variables (p-value)
0.54
(0.76)
0.25
(0.88)
0.19
(0.91)
26
Table 5: Cont.
Panel C-OLS Estimates of the Second Stage
Small enterprise development, 1998
22.2*
(8.70)
QS: 1.25
1.27*
(0.42)
QS: 2.15
34.6*
(13.1)
QS: 1.3
Log population, 1998
-0.72
(0.49)
-0.71
(0.43)
-0.78
(0.49)
Education
-1.17
(0.71)
-1.18
(0.72)
-1.09
(0.69)
Share – 1993 -1.51*
(0.22)
-1.51*
(0.21)
-1.51*
(0.22)
Centered R2 0.65 0.65 0.65
Panel D- First Stage Reduced Form OLS Regression
Dependent variables is small enterprise development, 2001
Privatization variables (excluded instruments)
Employment in private firms in 1990 per 1000 workforce
3.64*
(0.92)
1.56*
(0.73)
per 1000 population 2.76*
(0.69)
Employment in state-owned firms, 1990
-0.16*
(0.08)
-2.98*
(1.39)
-0.14*
(0.06)
Employment in firms privatized 1990-93 per 1000 workforce
0.51*
(0.21)
10.76**
(5.80)
0.38**
(0.19)
Log population, 1998
0.05*
(0.01)
0.91*
(0.22)
0.04*
(0.01)
Education, 1998
0.01
(0.01)
0.14
(0.17)
0.00
(0.01)

27
Income Share - 1993 -0.001
(0.002)
-0.02
(0.03)
-0.001
(0.002)
F-statistic for excluded instruments
13.1 7.51 5.15
p-value of F-statistic 0.000 0.000 0.004
Partial R2 of excluded instruments
0.52 0.44 0.35
Notes
i. The standard errors of the point estimates are reported in parentheses.
ii. The symbols * and ** denote significance at the 5-percent and 10-percent levels,
respectively.
iii. The standard errors in the second stage have a small sample correction; first and second
stage standard errors are corrected for heteroskedasticity.
iv. QS denotes quantitative significance, which is the impact of a one-standard-deviation
difference in small enterprise development, using the actual sample, on income
distribution.
v. Small private firms in 1990 have fewer than 100 employees.

28
Table 6 - Income Distribution and Small Enterprises in Russia
Measure of small enterprise development
Employment share of workforce, 2001
New enterprises per capita, 2001
∆ Employment share, 1995-2001
Panel A- Second Stage 2SLS Estimates
Small enterprise development (instrumented)
38.9*
(10.5)
QS: 0.98
1.46*
(0.59)
QS: 1.49
76.5**
(38.4)
QS: 2.30
Log population -2001
-0.82*
(0.26)
-0.85*
(0.39)
-2.29*
(0.76)
Education-1994
-0.19*
(0.09)
-0.47*
(0.20)
-0.16
(0.16)
Income share-1995
-0.79*
(0.08)
-0.80*
(0.10)
-0.98*
(0.17)
Centered R2 0.64 0.44 0.16
Panel B-Over-identification Tests for 2SLS Estimates: t-statistics
Large privatization, 1993
(p-value)
0.08
(0.94)
0.60
(0.55)
0.90
(0.37)
Small privatization, 1993
(p-value)
-0.08
(0.94)
-0.48
(0.63)
-0.41
(0.68)
J-test for joint exclusion of privatization variables
(p-value)
0.01
(0.94)
0.35
(0.55)
0.64
(0.42)
29
Table 6: Cont.
Panel C-OLS Estimates of the Second Stage
Small enterprise development, 2001
21.5*
(6.67)
QS: 0.54
0.20
(0.26)
QS: 0.20
7.94
(7.29)
QS: 0.24
Log population, 2001 -0.70*
(0.27)
-0.60*
(0.30)
-0.74**
(0.37)
Education-1994
-0.13
(0.08)
-0.10
(0.09)
-0.06
(0.08)
Income Share-1995
-0.76*
(0.08)
-0.73*
(0.08)
-0.75*
(0.08)
Centered R2 0.66 0.63 0.63
Panel D- First Stage Reduced Form OLS Regression
Dependent variable is small enterprise development
Privatization variables
(excluded instruments):
Large privatization, 1993 (firms per 1000 population)
0.22*
(0.07)
3.61
(2.24)
0.05
(0.08)
Small privatization, 1993 (firms per 1000 population)
0.09*
(0.02)
2.88*
(1.31)
0.06*
(0.03)
Log population, 2001
0.009*
(0.003)
0.29**
(0.16)
0.024*
(0.00)
Education, 1994
0.003*
(0.001)
0.27*
(0.06)
0.001
(0.001)
Income share-1995
0.003*
(0.001)
0.09*
(0.03)
0.004*
(0.001)
F-statistic for excluded instruments
28.8 4.86 3.11

30
p-value of F-statistic 0.000 0.011 0.052
Partial R2 of excluded instruments
0.40 0.22 0.09
Notes
i. The standard errors of the point estimates are reported in parentheses.
ii. The symbols * and ** denote significance at the 5-percent and 10-percent levels,
respectively.
iii. The standard errors in the second stage include a small sample correction; first and
second stage standard errors are corrected for heteroskedasticity.
iv. QS denotes quantitative significance, which is the impact of a one-standard-deviation
difference in small enterprise development, using the actual sample, on income
distribution.

31
Table 7: Indirect Quantitative Significance of Early Privatization
On Income Distribution
Panel A-Poland
Measure of small enterprise development
Employment share of workforce, 1997
New enterprises per capita, 1997
∆ Employment share, 1993-1997
Early Privatization
Employment in private firms in 1990
0.686
0.549
Private firms in 1990 0.718
Employment in firms privatized 1990-93
0.335 0.467 0.465
State-Owned Employment 1990
-0.431 -0.513 -0.707
Panel B-Russia
Measure of small enterprise development
Employment share of workforce, 2001
New enterprises per capita, 2001
∆ Employment share, 1995-2001
Early Privatization:
Large privatization, 1993
0.31
0.19
0.15
Small privatization, 1993
0.41
0.48
0.50
Note: Indirect quantitative significance is computed as a one-standard-deviation increase
in the early privatization variable times the impact of that early privatization variable on
small enterprise formation times the impact of the small enterprise variable on income
distribution.

32
References
Acemoglu, Daron, Johnson, Simon, Robinson, James, 2001. The colonial origins of comparative
development: an empirical investigation. American Economic Review 91(5), 1369-1401.
Aghion, Philippe, Caroli, Eva, Garcia-Peñalosa, Cecilia, 1999. Inequality and economic growth:
the perspective of the new growth theories. Journal of Economic Literature 37(4), 1615-60.
Alexeev, Michael, 1999. The effect of privatization on wealth distribution in Russia.” The
Economics of Transition 7(2), 449-65.
Bartelsman, Eric J., Haltiwanger, John, Scarpetta, Stefano, 2004. Microeconomic evidence of
creative destruction in industrial and developing countries. Discussion Paper 114/3.
Tinbergen Institute.
Baum, Christopher,F., Schaffer, Mark, e., Stillman, Steven, 2003. Instrumental variables and
GMM: estimation and testing. The Stata Journal 3(1), 1-31.
Berkowitz, Daniel, DeJong, David, N., 2005. Entrepreneurship and post-socialist growth.
Oxford Bulletin of Economics and Statistics 67(1), 25-46.
Berkowitz, Daniel, Holland, Jonathan, 2001. Does privatization enhance or deter small enterprise
formation? Economics Letters 74, 53-60.
Berkowitz, Daniel, Li, Wei , 2000. Tax rights in transition economies: a tragedy of the
commons? Journal of Public Economics 76, 369-397.
Bilsen, Valentijn, Konings, Jozef, 1998. Job creation, job destruction and employment growth in
newly established firms in transition countries: survey evidence from Romania, Bulgaria and
Hungary. Journal of Comparative Economics 26(3), 429-445.
Black, B., Kraakman, R., Tarassova, A., 2000. Russian privatization and corporate governance:
what went wrong? Stanford Law Review 52, 1731-1810.
Boycko, M., Shleifer, Andrei, Vishny, Robert, 1995. Privatizing Russia. MIT Press, Cambridge,
MA.

33
Chao, John, Swanson, Norman, 2005. Alternative approximations of the bias and MSE of the IV
estimator under weak identification with an application to bias correction. Journal of
Econometrics Forthcoming.
De Loecker, Jan, Konings, Jozef, 2006. Creative destruction and productivity growth: evidence
from Slovenia. European Journal of Political Economy Forthcoming.
European Bank for Reconstruction and Development (EBRD), 2003. Transition report 2003:
integration and regional cooperation. EBRD, London.
Forbes, Kristin, 2000. A reassessment of the relationship between inequality and growth.
American Economic Review. 90(4), 869-87.
Frye, Timothy, Shleifer, Andrei, 1997. The invisible hand and the grabbing hand. American
Economic Review 87, 354-358.
Cichomski, Bogdan, Morawski, Pawel, 2002. Polish General Social Surveys: machine readable
data file 1992-1999. Institute for Social Studies, University of Warsaw, Warsaw, PL.
Gabszewicz , J., Jaskold, Thisse, J. –F., 1980, Entry (and exit) in a differential industry. Journal
of Economic Theory 22, 327-338.
Goskomstat Rossii. 1994 and 1996. Rossiskiy Statisticheskiy Yezhegodnik. Goskomstat Rossii,
Moskva.
Goskomstat Rossii, 2001 and 2002. Regiony Rossii, Goskomstat Rossii, Moskva
Hahn, Jinyong, Hausman, Jerry, 2002. Notes on bias in estimators for simultaneous equation
models. Economic Letters 75, 237-41.
Hansen, Lars, Peter, 1982. Large sample properties of generalized method of moment estimators.
Econometrica 50, 1029-1054.
Hellman, Joel, S., 1998. Winners take all: the politics of partial reforms in post-communist
transitions. World Politics 50(2), 203-234.
34
Hellman, Joel, S., Jones, Geraint, Kaufman, Daniel, 2003. Seize the state, seize the day: state
capture, corruption and influence in transition. Journal of Comparative Economics 31(4),
751-773.
Jackson, John, E., 2003. A computational political economy model of transition. In: Jan Fidrmuc
and Nauro Campos (eds.), Political Economy of Transition and Development: Institutions,
Politics, and Policies. Klewer Academic Publishers, Boston/Dordrecht/London, pp. 117-137.
Jackson, John, E., Klich, Jacek, Poznańska, Krystyna, 1999. Firm creation and economic
transitions. Journal of Business Venturing 14(5/6), 427-450.
Jackson, John, E., Klich, Jacek, Poznańska, Krystyna, 2005. The Political Economy of Poland’s
Transition: New Firms and Reform Governments. Cambridge University Press, Cambridge,
England/New York, NY.
Jackson, John, E., Marcinkowski, Aleksander S., 1999. The entrepreneurial attitudes of Poles. In:
Hauser, Ewa, Wasilewski, Jacek (eds.) Lessons in Democracy. University of Rochester
Press, Rochester, NY and Jagiellonian University Press, Kraków, PL, pp. 171-200.
Jackson, John, E., Rodkey, Gretchen R., 1994. The attitudinal climate for entrepreneurial activity.
Public Opinion Quarterly 58(3), 358-380.
Johnson, Simon, McMillan, John, Woodruff, Christopher, 2002. Property rights, finance and
entrepreneurship. American Economic Review 92, 1335-1356.
Jurjada, Štepán, Terrell, Katherine, 2001. What drives the speed of job reallocation during
episodes of massive adjustment? Working Paper #432. William Davidson Institute, Ann
Arbor, MI, USA.
Karatnycky, Adrian, Motyl, Alexander, Schnetzer, Amanda, 2001. Nations in Transit. Freedom
House, New York, NY.
Keane, Michael, Prassad, Enwar, 2002. Inequality, transfers and growth: new evidence from
economic transition in Poland. Review of Economics and Statistics 84(2), 324-341.

35
Klapper, Leora, Laeven, Luc, Rajan, Raghuram, 2004. Business environment and firm entry:
evidence from international data.” Working Paper 10380, NBER.
Kornai, János, 2000. Ten years after ‘The Road to a Free Economy’: the author’s self-evaluation.
Paper prepared for the Annual Bank Conference on Development Economics. World Bank
Washington, DC.
Luttmer, Erzo F.P., 2002. Measuring economic mobility and inequality: disentangling real events
from noisy data,” Available at http://www.nber.org/~luttmer/mobility.pdf. Harris School of
Public Policy Studies, University of Chicago, Chicago, IL.
McMillan, John, 1995. Markets in transition. In: Kreps, David, M., Wallis, K.F. (eds), Advances
in Economics and Econometrics. Cambridge University Press, Cambridge, chapter 6.
McMillan, John, Woodruff, Christopher, 2002. The central role of entrepreneurs in transition
economies. Journal of Economics Perspectives 16, 153-170.
Shaked, Avner, Sutton, John, 1982. Relaxing price competition through product differentiation.
Review of Economic Studies 49(1), 3-13.
Shleifer, Andrei, Vishny, Robert, 1993. Corruption.. Quarterly Journal of Economics 58(3),
599-617.
Tichit, Ariane, 2006. The optimal speed of transition revisited. European Journal of Political
Economy Forthcoming.
Transparency International, 1996. TI Corruption Perception Index 1996. Available at
http://www.transparency.org/cpi/1996/cpi1996.pdf. Berlin.
UNICEF. 2001. A Decade of Transition. Regional Monitoring Project No. 8. UNICEF Innocenti
Research Centre. Florence, Italy.
United Nations, 2005. Human Development Report 2005. United Nations Development Program,
New York.
White, Halbert, 1980. A heteroskedasticity-consistent covariance matrix estimator and direct test
for heteroskedasticity. Econometrica 48(4), 817-838.

36
World Bank. 2000. Making Transition Work for Everyone: Poverty and Inequality in Europe and
Central Asia. Washington, DC.

37
Acknowledgement Note
We thank Erik Berglof and Ariel Pakes for suggesting this topic. We also thank Yuri Andrienko
for help with the Russian data and Jacek Klich, Krystyna Poznańska and Jósef Chmiel for help
with the Polish economic data. We are grateful to the Institute for Social Studies at the University
of Warsaw for sharing the PGSS data. We also thank John Bonin, the Editor, and an anonymous
referee for useful comments.
Endnotes
1 Keane and Prassad (2002) provide an overview of the dynamics of the income distribution in
Poland during the 1990s.
2 Luttmer (2002) provides a comparison of the income distributions in Poland and Russia.
3 Jackson (2003) and Tichit (2006) discuss the relationship between wages and unemployment in
transition economies.
4 An additional explanation given for the elimination of monopoly rents in Poland and their
persistence in Russia is that Poland became more open to foreign trade. However, from EBRD
(2003) p. 178 and p.186, we calculate the share of trade in GDP during years seven through ten of
transition, i.e., 1996 to 1999 in Poland and 1998 to 2001 in Russia, to be 42.2%,in Poland and
54.0% in Russia. Furthermore, the share of trade with non-transition countries during these years
is 35.2% in Poland, which is less than the comparable share of 37.4% in Russia.
5 A study was made in 1995 but we do not include it in our analysis.
6 Some registrations are for tax purposes solely and the agency responsible for these data does not
record exits. Both of these considerations lead to overstatements of the size of this sector.
Including these data for firms with five or fewer employees with our data on those with over five

38
employees would imply more job creation than job loss during the transition, which is
inconsistent with the ten percent unemployment rate in 1997.
7 Regional privatization combined voucher and cash privatization of large and medium-sized
companies. To avoid potential problems associated with over-identification, we do not include
early regional privatization in Russia.
8 For the equation with new firms per thousand population as the measure for SMENT the initial
condition variables are the proportion of the 1990 non-farm workforce employed in state-owned
enterprises and the number of small firms per one thousand people in 1990.
9 As in all conventional statistical tests, a failure to reject the null hypothesis does not mean we
can accept it. However, the higher is the probability of getting our statistical results by chance
under the null, the more likely the null is to be correct.
10 Privatized employment in 1993 and state-owned employment in 1990 are measured by the non-
farm workforce because we are using these variables to measure the concentration of industrial
and commercial activity in these firms. For the small private and de novo sectors, we are seeking
variables to assess the level of participation of the entire workforce in these enterprises.
11 Hahn and Hausman (2002) and Chao and Swannson (2003) show that over-identification can
create bias when two stage least squares (2SLS) is used. Simulation results in Chao and
Swannson show that one way to offset this bias is to use limited information maximum likelihood
estimation (LIML). Because the difference between our 2SLS and LIML estimates are negligible,
we report only the 2SLS results but the LIML results are available upon request.
12 We also estimated the equations with Warsaw included. In each first-stage estimation, the dfits
statistic for Warsaw is about six times larger than both the next largest value and the conventional
threshold for concluding that the observation may be problematic. Hence, we report the results
with Warsaw excluded.

39
13 Although we exclude Moscow and St. Petersburg because of their potential to exert undue
influence, our results are robust to their inclusion if we use small enterprise shares to measure
new enterprises. However, the results are somewhat noisier if we use the small enterprises per
capita or the change in employment shares with these cities included. A table similar to Table 6
with Moscow and St. Petersburg included is available on request from the authors.
14 A table of the statistical results is available on request from the authors.