entrepreneurship as empowerment: economic mobility …
TRANSCRIPT

ENTREPRENEURSHIP AS EMPOWERMENT:
ECONOMIC MOBILITY IN THE UNITED STATES
Ryan R. Herron
An honors thesis submitted to the faculty of the
Kenan-Flagler Business School at the
University of North Carolina at Chapel Hill
Chapel Hill
2020
Approved by __________________________
(Dr. Larry Chavis)

ii
ABSTRACT
Ryan R. Herron
Entrepreneurship as Empowerment: Economic Mobility in the United States
(Under the direction of Dr. Larry Chavis)
Although many coin the United States as “the land of opportunity,” recent research
suggests the country does not provide the level of opportunity that many imagined it to
have. Research related to the underlying factors behind this lack of opportunity revealed
that economic mobility in the United States is impacted by residential segregation,
income inequality, school quality, social capital, and family stability. To date, researchers
in the United States have yet to explore the potential impact of entrepreneurship—known
to be a promoter of economic growth, job creation, and wealth accumulation—on
mobility despite a vast body of international literature surrounding the mobility-
entrepreneurship relationship. This study finds a significant relationship between
entrepreneurship and economic mobility in America by examining the relationship on a
county level across the United States.

iii
ACKNOWLEDGEMENTS
The completion of this thesis was made possible by the continuous support of
several individuals that I am so thankful for. Thank you to everyone who pushed me to
go the extra mile with this thesis and provided a helping hand every step along the way.
This research would not have been possible without the help of a few key individuals.
Dr. Larry Chavis – Thank you for providing guidance and support throughout this
process. Your passion for helping your students and your ability to relate on an individual
level with every student is truly inspiring.
Dr. Patricia Harms – Thank you for walking alongside during this process. Amid
the ups and downs of writing our theses, your presence and motivation kept us going.
Dr. Andrew Boysen – Thank you for taking the time to provide valuable data
sources and insights. When I was stuck and confused with my analysis, your words and
guidance through the data helped to solidify the results of my analysis.
Dr. Michael Meredith – Thank you for your constant support and knowledge
regarding business writing. You helped to form the foundation of my writing skills.
The Kenan Scholars Program and the Kenan Institute – Thank you for your
continued engagement with our research from the moment we stepped into the program.
You provided endless resources that supported our growth and helped us complete
original research.
Mom and Dad – Since the start of my education journey, you have encouraged
and motivated me to take on the next biggest challenge and make the most of every
opportunity. I would not be where I am today if it was not for your loving support.
Papa – Thank you for persistently supporting me throughout my life and
providing me with the opportunity to attend UNC for four spectacular years. Your
commitment and dedication to me, my brothers, and my cousins is inspirational. Thank
you for everything you do.

iv
TABLE OF CONTENTS
ABSTRACT ........................................................................................................................ ii
ACKNOWLEDGEMENTS ............................................................................................... iii
TABLE OF CONTENTS ................................................................................................... iv
LIST OF TABLES ............................................................................................................ vii
LIST OF FIGURES ......................................................................................................... viii
INTRODUCTION ...............................................................................................................1
Entrepreneurship’s Formative Influence on America’s History ................................ 2
The Entrepreneurial Spirit of America’s Founders ............................................ 3
The State of Entrepreneurship in the United States Today ................................ 3
The Structural Makeup of the U.S. is Conducive to Entrepreneurial Growth ........... 5
The High-Risk Tolerance of the United States Citizen ...................................... 6
A Legal System that Supports Failure ............................................................... 7
The Strength of the U.S. Venture Capital Industry ............................................ 8
The Benefits of Established University-Firm Relations in America ................. 9
LITERATURE REVIEW ..................................................................................................12
Situation Overview ................................................................................................... 12
The Mobility-Entrepreneurship Relationship in South America .............................. 14
Methods to Increase Entrepreneurship ..................................................................... 16
Economic Mobility in America ................................................................................ 19
Trends in Economic Mobility in the United States .......................................... 19
Discrepancies in Economic Mobility Across America .................................... 21

v
Conclusion ................................................................................................................ 23
METHODOLOGY ............................................................................................................25
Data Selection ........................................................................................................... 26
Economic Mobility Data .................................................................................. 26
Entrepreneurship Data ...................................................................................... 28
County Selection .............................................................................................. 30
Quantitative Analysis ............................................................................................... 33
Limitations ................................................................................................................ 34
The Availability of County-Level Entrepreneurship Data ............................... 34
The Potential for Reverse Causality ................................................................. 35
The Entrepreneur Gap for Women and Racial Minorities ............................... 35
The Sampling Method Used to Obtain Entrepreneurship Data ....................... 37
RESEARCH FINDINGS ...................................................................................................38
Section 1: The Factors with the Strongest Influence on Economic Mobility........... 38
Section 2: Understanding the Structure of Counties at Different Mobility Levels .. 41
Section 3: Understanding the Mobility-Entrepreneurship Relationship .................. 46
CONCLUSION ..................................................................................................................50
FUTURE RESEARCH OPPORTUNITIES ......................................................................53
Analyzing the Economic Mobility of Individual Entrepreneurs .............................. 53
The Effects of the Small Business Funding Gap ...................................................... 54
A Case Study on the Local Effects of Entrepreneurship .......................................... 54
APPENDIX ........................................................................................................................56
Appendix A: Intergenerational Correlations of Various OECD Countries .............. 56
Appendix B: Entrepreneurial Activity Rates Between 48 Economies ..................... 57

vi
Appendix C.1: The Most Developed Countries in 2018 .......................................... 58
Appendix C.2: Tracking Entrepreneurship ............................................................... 59
Appendix D: Average Risk Propensity by Count..................................................... 60
Appendix E: Venture Capital Investments by Country in 2018 ............................... 61
Appendix F: Ease of Doing Business Metrics in Developed Countries ................... 62
Appendix G: Income of America's Top 0.1% as a Multiple of Bottom 90 .............. 63
Appendix H: County-Level Covariates .................................................................... 64
Appendix I: Descriptions of Variables with the Largest Influence on Mobility ...... 65
REFERENCES ..................................................................................................................66

vii
LIST OF TABLES
Table 1 The Entrepreneurship Index of the 10 Most Developed Countries ....................6
Table 2 Global Entrepreneurship Index by Country ......................................................13
Table 3 The Variables Chetty et al. (2014) Found to Influence Economic Mobility ....28
Table 4 The Self-Employment Variables Used to Measure Entrepreneurship ..............30
Table 5 Counties with Available Economic Mobility and Entrepreneurship Data .......31
Table 6 The Metropolitan vs. Nonmetropolitan County Divide in the Dataset .............32
Table 7 Population Distribution by Region ...................................................................33
Table 8 Correlates of Economic Mobility .....................................................................39
Table 9 Self-Employment Measures Across Four Economic Mobility Tiers ................41
Table 10 Structural Differences Between Counties .........................................................42
Table 11 County-Level Racial and Segregation Differences ..........................................44
Table 12 Economic Mobility Comparison by U.S. Region .............................................45
Table 13 Economic Mobility Regressed Against Key Variables ....................................47

viii
LIST OF FIGURES
Figure 1 U.S. Business Application Statistics from 2004-2019 ......................................4

1
INTRODUCTION
Although many coin the United States as “the land of opportunity,” the
proliferation of recent research has resulted in a realization contrary to popular belief—
the United States is not the land of opportunity that so many have thought it to be.
Riddled with regions that are among some of the lowest opportunity areas in the world,
the United States has confounded researchers who have sought to understand and provide
policy solutions to this American Dream dilemma. One potential solution that researchers
have yet to examine is entrepreneurship. In this thesis, I test the validity of using
entrepreneurship to influence mobility trends in America. To understand the effects of
entrepreneurship on economic mobility, I analyze the relationship between
entrepreneurial activity and economic mobility on a county level across the United States.
The use of entrepreneurship as a potential lever to increase economic mobility
stems from the inherent positive effects entrepreneurship has on local economies. These
effects range from the creation of jobs to the promotion of economic development to the
accumulation of wealth. Ultimately, global economies rest on the continued development
of new firms to foster competition and continued economic growth (Klapper, Laeven, &
Rajan, 2006). Thus, this thesis examines whether entrepreneurship is a one-sided value-
creating activity, in that it only provides benefit to the economies through increased
competition, job creation, and wealth accumulation, or if it has potential two-sided effects
that contribute to the positive development of both the local economies and the
individuals spearheading the growth of entrepreneurial firms.

2
To understand how entrepreneurship will continue to influence America on a
local level, it is important to understand that entrepreneurship has played a vital role in
the development of the American economy and the American citizen. The remainder of
this introduction sets the backdrop for my analysis of the relationship between economic
mobility and entrepreneurship in the United States. I use this introduction to describe two
concepts regarding the history of entrepreneurship in the United States and the reasons
behind its continued success:
1. Entrepreneurship has had a formative influence on America’s economic
history
2. The structural makeup of the United States is conducive to entrepreneurial
growth
Entrepreneurship’s Formative Influence on America’s History
America’s history is largely dictated by the effects of entrepreneurship. From
Thomas Edison’s invention of the incandescent lightbulb in 1879 to Henry Ford’s Model
T in 1908 to the personal computer in 1971, innovative change and entrepreneurial
activity have played a pivotal role in the major structural shifts in the U.S. economy.
The major changes in the U.S. economy over the past two centuries surround the
structural shifts from an agrarian economy to a manufacturing-centric economy to a
service-based economy. The lifecycle of economic development within economies can
explain the fundamental reasoning behind these structural shifts. The commonly accepted
notion is that as economies become wealthier, they experience structural changes from
the industrial sector to the services sector, as evidenced by the historical shifts in the U.S.
economy. To best understand these shifts, one idea must be true—individuals must be

3
inventive and willing to take on the risks associated with business creation to enable these
changes to occur. In short, new business creation, or entrepreneurship, must exist at the
individual level for economies to continually develop. Thus, to examine the history of the
U.S. economy, one must analyze the history of the U.S. entrepreneur. The remainder of
this section will examine entrepreneurship from America’s conception to the present day.
The Entrepreneurial Spirit of America’s Founders
Entrepreneurs founded the United States over 200 years ago. The decision to
break away from England and start a new country brought with it intrinsically
entrepreneurial ideas. These ideas involved a high level of risk in light of the largely
uncertain ideal of creating a new country—a situation akin to the start of a new business.
These entrepreneurial attitudes held by the founders of the United States flowed into the
tangible forms of entrepreneurship that we know of today.
The State of Entrepreneurship in the United States Today
Individuals around the world view the United States as the supreme economic
prowess in the world. A primary reason behind this belief is due to the fact that the ease
of doing business in the United States is substantially higher than in other developed
countries. The World Bank’s “Doing Business 2020” report measured the ease of doing
business across 190 countries and found the United States to be the country where doing
business is easiest among the most developed countries (“Doing Business 2020,” 2020).
Moreover, the report ranked the United States at fifth in a ranking of the most developed
countries by the ease of business creation (“Doing Business 2020,” 2020). See Appendix

4
F for a breakdown of the metrics used to measure the ease of doing business on a country
level.
U.S. businesses have flourished within an economy that encourages
entrepreneurial growth, evidenced by the ease of doing business in America. Hundreds of
thousands of individuals are applying to start businesses every month. Figure 1 provides a
quarterly breakdown of the business application statistics in the United States from 2004
to 2019.
Figure 1 U.S. Business Application Statistics from 2004-2019
As seen in Figure 1, despite a small drop off in applications during the recession from
2007 to 2009, business applications have steadily risen over the past decade. However,
high-propensity business applications have remained at a level of around three hundred
thousand. High-propensity business applications refer to applications that have a higher
likelihood of becoming businesses. With over 300,000 business applications per quarter
0K
100K
200K
300K
400K
500K
600K
700K
800K
900K
1,000K
2004 Q3 2006 Q3 2008 Q3 2010 Q3 2012 Q3 2014 Q3 2016 Q3 2018 Q3
Num
ber
of
Appli
cati
ons
U.S. Business Application Statistics (2004-2019)
All Business Applications High-Propensity Business Applications

5
in the United States, the United States continues to churn out businesses, reinforcing its
image as an entrepreneurial and economic engine.
The stable trend of business conception in the United States over the past decade
coupled with the ease of business development places the country into an opportune
position to support the continued success of its entrepreneurial environment.
Entrepreneurship flourishes when the barriers to enter the business of doing business are
kept to a minimum (Klapper, Laeven, & Rajan, 2006). The United States has managed to
do exactly that—reduce the barriers to entry to encourage business creation. The
following section will expand on the structural advantages the United States has
purposefully implemented to encourage firm creation.
The Structural Makeup of the U.S. is Conducive to Entrepreneurial Growth
The United States is a country that naturally breeds entrepreneurs due to the high-
risk tolerance of its citizens, the structure of its legal system, the size and strength of its
venture capital resources, and the close relationships between academic institutions and
the private sector (“The United States,” 2009). For these reasons, the Global
Entrepreneurship Monitor (GEM) finds the United States to be the most entrepreneurially
active country. A description of the GEM, according to their website, is:
The GEM is an entrepreneurship-focused organization that surveys entrepreneurs
in over 100 countries around the world. The organization primarily uses academic
institutions around the globe to carry out an Adult Population Survey and
National Expert Survey to provide succinct analyses on the characteristics,
motivations, and ambitions of individuals starting businesses and social attitudes
toward entrepreneurship (“Mission,” para. 2).
The GEM provides resources that enable individuals to compare entrepreneurial attitudes
and behaviors across countries. Table 1 provides further detail into the entrepreneurial

6
indexes of the 10 most developed countries in the world. The Entrepreneurial Index is
derived from an average of each country’s ranking across 15 metrics tracked by the GEM
in 2018 (see Appendix C.2 for a list of these 15 metrics).
Table 1 The Entrepreneurship Index of the 10 Most Developed Countries
Country Entrepreneurship Index
United States 7.9
Canada 7.7
Germany 5.6
United Kingdom 5.5
Brazil 5.2
France 5.1
India 4.9
China 4.7
Italy 4.3
Japan 3.3
Note: The Entrepreneurship Index is based on a 10-point scale. See Appendix C.2 for a
detailed breakdown of the components of the Entrepreneurship Index.
As shown in Table 1, the United States has the highest Entrepreneurship Index out of the
10 most developed countries. The structural makeup of the United States fosters
entrepreneurship and helps to continue the tradition of a wealth of entrepreneurial activity
within the country.
The High-Risk Tolerance of the United States Citizen
The average United States citizen has a high tolerance for risk, fueling the growth
of entrepreneurship—a field known for high levels of risk. To analyze the risk level of
individuals in the United States relative to other developed countries, I studied attitudes
toward various investments to provide a risk benchmark across countries. An individual’s

7
financial behaviors provide one of the best proxies to understand risk on a country level
because one’s attitude toward risk is one of the most influential factors contributing to
one’s financial behaviors (Hoffman, Post, & Pennings, 2015). After analyzing the ING
International Survey on Savings, which asked 15,000 individuals several questions
regarding their likelihood of investing in different investment products characterized by
varying risk levels, Ferreira (2018) calculated an average measure of risk propensity by
country. The results validated the assumption that the average United States citizen has a
substantially higher tolerance for risk when compared to the citizens of other developed
countries (see Appendix D for a list of countries ranked by their average propensity
toward risk). A key point to note when analyzing risk tolerance between countries is that
developed countries have a much lower tolerance for risk than developing countries;
however, for the context of this analysis, I only considered developed countries due to
their structural similarities with the United States.
Higher tolerance for risk increases the likelihood that individuals would be
willing to consider the option of starting their own business. The risks associated with
entrepreneurship stem from the uncertainty of wages, benefits, and future growth
between early-stage ventures and established firms. Thus, a key reason behind the United
States’ high level of entrepreneurial activity is the risk tolerance of its citizens.
A Legal System that Supports Failure
The second structural advantage of the United States concerns the structure of the
U.S. legal system. The legal system’s tolerance toward bankruptcy stimulates and
maintains entrepreneurial activity. In the United States, if an individual were to go
bankrupt, they would still be able to start another venture and continue the process of

8
business creation once the bankruptcy has been discharged. Additionally, the United
States has established Chapter 11 bankruptcy protection, which is a form of protection
that gives individuals or businesses time to reorganize their assets and renegotiate the
payment terms with creditors. Moreover, the general mantra of the United States is that
failure is not an end in itself, but rather an opportunity to grow and learn in the future. As
a result, many entrepreneurial individuals in the United States end up starting multiple
businesses. On the contrary, the legal and social attitudes toward bankruptcy in other
developed countries are not as lenient in comparison to the same attitudes in the United
States. For instance, Germany has no equivalent to Chapter 11 bankruptcy protection,
providing very few options for indebted individuals. If an individual were to go bankrupt
in Germany, they cannot start a business for nine years. The social reaction toward
bankruptcy in Germany includes attitudes of shame and treatment as social pariahs (Hoff,
2011). The lack of these social and legal attitudes in the United States induces a space for
failure in the American economic system, helping fuel the entrepreneurial spirit of the
U.S. citizen.
The Strength of the U.S. Venture Capital Industry
Beyond the risk tolerance and legal and social attitudes toward failure, the size
and strength of the U.S. venture capital (VC) industry provides the fundamental resources
entrepreneurs need to start and grow their businesses in the United States. In 2018, the
amount of VC investments in the United State was 60% greater than China’s level of VC
investments (see Appendix E for a list of the countries with the 10 largest levels of VC
investments in 2018). The developed nature of the American VC industry allows

9
entrepreneurs to receive the funding needed to bring their ideas to fruition—a luxury not
available to citizens of other countries.
The Benefits of Established University-Firm Relations in America
The final structural advantage of the United States that leads to a high level of
entrepreneurial activity is the strong relationship between academic institutions and the
private sector. Companies, ranging from non-profits to public sector companies to private
sector firms, across America use universities as their main source of talent to fill entry-
level positions. Over 70% of companies recruit on college campuses (Laurano, 2018). A
central reason behind these recruiting efforts can be attributed to the proliferation of
internships in the twenty-first century. Companies are no longer just recruiting the
graduating population out of universities, they are recruiting students from all age groups
within the university. This mutually beneficial relationship between firms and
universities has helped establish universities as the main source of talent.
The university-firm relationship has turned universities from institutions of
knowledge creation into economic powerhouses. With incubators, venture capital funds,
and entrepreneurship-focused programs, universities have begun to realize that the
knowledge of their students and faculty is a valuable resource sought after by large VC
investors. Stanford Research Park is a core example of how universities and firms have
worked collaboratively to generate and monetize knowledge. Stanford developed the
Research Park in 1951 and exclusively leased the land to private, cutting-edge companies
for their research and development needs. The Research Park brought academics and
industry individuals together. Since its conception, it has helped breed some of the
world’s largest companies—Google, Yahoo!, Cisco, Intuit, and more than 40,000

10
others—and laid the framework for the eventual development of modern-day Silicon
Valley (Trikha, 2015). The Stanford Research Park is just one example of how the
interconnectedness of firms and universities has contributed to the development and
expansion of the entrepreneurial ecosystem of the United States.
******
The United States entrepreneurial ecosystem is evident from a historical
perspective due to various structural advantages that have placed the country in an
optimal position to produce high levels of entrepreneurial activity. Despite the wealth of
entrepreneurial activity in the United States, researchers have yet to fully examine the
potential effects of entrepreneurship on mobility. The economic mobility-focused
literature has primarily focused on the reasons behind the widespread variation in
economic mobility across the United States. Amid the vast body of literature surrounding
the potential causes of this variation in economic mobility, the economic mobility
literature lacks clarity regarding how the growing entrepreneurial environment of the
United States affects mobility. This thesis brings together ideas from the mobility and
entrepreneurship literature to better understand the potential link between
entrepreneurship and economic mobility in America.
The current research that studies the relationship between entrepreneurship and
economic mobility has been centralized in the developing nations of South America.
Researchers have yet to study the relationship in the United States, where
entrepreneurship takes on a different form. My research fills this gap in the literature by

11
analyzing the relationship between entrepreneurship and economic mobility in the United
States. I pair the South American approaches with new county-level data on economic
mobility in the United States.
My research assesses the validity of using entrepreneurship as an effective tool to
increase economic mobility in low-mobility areas across the United States. The goal of
the research is to influence the policy agenda to evaluate the inclusion of funding toward
sustainable methods of increasing entrepreneurship as a mechanism to encourage local
and national-level mobility growth.
I am hopeful that this introduction provides the foundation for the rest of my
analysis. The remainder of this paper will:
• examine the current state of the body of economic mobility and entrepreneurship
literature in the United States and South America,
• detail the processes used to collect and analyze economic mobility and
entrepreneurial data in the United States,
• present and discuss the results of my analysis, and
• summarize the research and provide avenues for future research.

12
LITERATURE REVIEW
This literature review will assess the bodies of literature surrounding economic
mobility, entrepreneurship, and the relationship between the two. The following sections
will explain (1) the mobility-entrepreneurship relationship, (2) the findings regarding the
relationship in South America, (3) the methods to increase entrepreneurial activity, (4)
the changing views on economic mobility in America, and (5) a conclusion to cite the
gaps in the literature that this research will expand on.
Situation Overview
The lack of research regarding the economic mobility-entrepreneurship
relationship in the United States led me to analyze a growing body of literature from
several studies performed in South America. The South American literature provides the
basis from which my research expounds upon in the United States; however, the specifics
of the findings are not perfectly transferrable across continental borders due to the
inherent differences in economic structure and rates of entrepreneurship between South
American countries and the United States. Table 2 elaborates on the specifics of the
entrepreneurial nature of the South American countries and the United States by
comparing the country’s Global Entrepreneurship Indexes.
The Global Entrepreneurship Index “collects data on the entrepreneurial attitudes,
abilities, and aspirations of the local population and then weights these against the
prevailing social and economic infrastructure. This includes aspects such as
broadband connectivity and the transport links to external markets” (“Global
Entrepreneurship Index,” para. 4).

13
Table 2 Global Entrepreneurship Index by Country
Country Global Entrepreneurship Index
United States 83.6
Colombia 38.2
Uruguay 35
Mexico 26.4
Ecuador 20.5
Bolivia 20.4
As shown in Table 2, the differences in entrepreneurial structure between the South
American countries studied in the literature (Bolivia, Colombia, Ecuador, Mexico,
Uruguay) and the United States are rather drastic. My research attempts to understand if
a mobility-entrepreneurship relationship exists in the highly entrepreneurial United
States—a country with an entrepreneurial makeup that is very different from the
entrepreneurial structure of countries in South America. Moreover, while the South
American literature studied individual entrepreneurs, my research provides a higher-level
overview of the mobility-entrepreneurship relationship by studying entrepreneurship and
economic mobility at the county level.
The developing nature of the South American countries is a confounding variable
to note when comparing the South American countries with the United States. Due to the
developing status of these countries, the literature agreed on the need to distinguish
“necessity” from “opportunity” entrepreneurs (e.g., Ardagna & Lusardi, 2008; Bukstein
& Gandelman, 2014; Castellani & Lora, 2014; Mwasalwiba, 2010). Researchers
distinguished between these two definitions of entrepreneurship to filter out individuals
engaged in purely subsistence-focused work—a practice that is not as prominent in the

14
United States—from individuals pursuing businesses in places where market opportunity
exists. However, distinguishing between subsistence-focused individuals and true
entrepreneurs will carry less weight in the United States where a much smaller portion of
people experience a subsistence standard of living. In the next section, I examine the key
findings regarding the mobility-entrepreneurship relationship in South America.
The Mobility-Entrepreneurship Relationship in South America
The consensus across the South American literature surrounding the mobility-
entrepreneurship relationship is that entrepreneurship leads to greater upward economic
mobility. Hernani-Limarino, Eid, & Villarroel (2011) first studied the mobility-
entrepreneurship relationship in Bolivia and found that entrepreneurs are more likely to
experience upward economic mobility. The researchers determined the relationship only
existed when defining entrepreneurs as those individuals who employed more than one
person (Hernani-Limarino et al., 2011). When analyzing all self-employed individuals,
the data produced opposing results—entrepreneurship did not contribute to an increase in
mobility (Hernani-Limarino et al., 2011).
Researchers examining the mobility-entrepreneurship in Uruguay reached the
same conclusion as found in Bolivia—entrepreneurs, defined as individuals running
companies with more than one employee, experienced greater upward economic mobility
than self-employed individuals (Bukstein and Gandelman, 2014). As evidenced by the
Bolivian study, researchers found it important in South America to distinguish
entrepreneurs from self-employed individuals to ensure that self-employed workers living
a subsistence lifestyle were not deemed as entrepreneurs in their analysis.

15
In Colombia and Uruguay, entrepreneurs both experience upward economic
mobility and transfer mobility to their children (Castellani & Lora, 2014). Entrepreneurs
in Colombia experience greater levels of upward mobility than non-entrepreneurs.
Castellani and Lora (2014) assessed economic mobility by comparing the number of
years of education received by the children and their respective parents. In Uruguay, the
authors focused on the economic mobility of the entrepreneur’s children. They found that
the children of entrepreneurs experience greater upward mobility than the children of
non-entrepreneurs (Castellani & Lora, 2014). This study paralleled the work of Bukstein
and Gandelman (2014) during the same year which found that entrepreneurs both
experience upward mobility and transfer mobility to the next generation through their
children. The transference of economic mobility from one generation to the next through
entrepreneurship creates a strong case to support policy initiatives to fund entrepreneurial
activities due to the sustainable impact of entrepreneurship.
Mexico, although riddled with inequality, provides additional evidence to support
entrepreneurship as a mechanism for upward economic mobility (Vélez-Grajales &
Vélez-Grajajes, 2014). Research in Mexico found that entrepreneurs have a higher level
of mobility than non-entrepreneurs—a consistent theme across the mobility literature in
South America (e.g., Vélez-Grajales & Vélez-Grajajes, 2014; Bukstein & Gandelman,
2014; Castellani & Lora, 2014; Gandelman & Robano, 2014; Hernani-Limarino et al.,
2011). Mexico is a unique country to study due to the persistence of high levels of
inequality. The persistence of inequality would presuppose a lack of economic mobility;
however, while Mexico has high levels of inequality, entrepreneurship remains an
effective method to increase mobility.

16
Methods to Increase Entrepreneurship
The South American literature that supports the use of entrepreneurship as a
vehicle for upward economic mobility naturally points to the methods used to increase
the level of entrepreneurship within a country. The five methods in the literature that are
effective means of increasing the level of entrepreneurship within a country are (1)
establishing role models, (2) strengthening social capital, (3) lowering the cost of
business, (4) building entrepreneurial education, and (5) defining the steps to exit a
business (e.g., Ardagna & Lusardi, 2008; Castellani & Lora, 2014; Kantis, Federico, &
Tratenberg, 2013; Ordeñana & Arteaga, 2013; Rauch & Hulsink, 2015; Vélez-Grajales &
Vélez-Grajajes, 2014).
A primary way individuals develop into entrepreneurs is by watching and learning
from others who model entrepreneurship around them. Some of the key role models of
entrepreneurs are their parents (Castellani & Lora, 2013). Researchers found in Mexico
that an individual’s decision to become an entrepreneur is largely dependent on the
father’s occupation, more so than the individual’s level of wealth or education (Vélez-
Grajales & Vélez-Grajajes, 2014). Furthermore, Ardagna and Lusardi (2008) revealed
that knowing any entrepreneur substantially increases the chance that an individual
becomes an entrepreneur. Role models play a significant role in expanding the level of
entrepreneurial activity within a region. Thus, to influence the level of entrepreneurship
within a region, communities can focus on increasing spaces that are dedicated to
entrepreneurial collaboration and mentorship. The development of shared spaces (such as
co-working spaces and incubators) that foster collaboration is a tangible method to
develop communication and networking opportunities between entrepreneurs.

17
Beyond the effects that parents and other role models play in modeling
entrepreneurship, networks and institutions play a vital role in establishing and
maintaining an entrepreneurial environment (e.g., Kantis et al., 2013; Ordeñana &
Arteaga, 2013). These networks and institutions are pivotal to sustaining a high level of
entrepreneurship within a country because they assist entrepreneurs in overcoming the
initial obstacles associated with starting a business (Ordeñana & Arteaga, 2013). While
the main source that entrepreneurs tend to rely on to overcome challenges is themselves,
commercial networks (suppliers, customers, and other entrepreneurs), universities, and
other institutions are valuable in supporting entrepreneurs during the early stages of their
business (Ordeñana & Arteaga, 2013).
Increasing the amount of time and cost associated with incorporating new
businesses substantially weakens the ease of new business creation (“Doing Business
2020”, 2020). To increase the level of entrepreneurship, policies that favor new firm
creation should reduce the number of steps and capital required to establish and maintain
a business (“Doing Business 2020”, 2020). These steps include reports, paperwork, and
taxes that businesses must complete at the inception of the business and on an annual
basis thereafter.
Beyond creating and maintaining businesses, the ease of firm destruction is
equally important to incentivize entrepreneurship. If individuals are aware of the steps
they can take to exit a business, they will be more likely to enter the business in the first
place (“Doing Business 2020”, 2020).
While many individuals have the know-how behind the development of an idea,
they do not have the knowledge required to manage the operations of a business.

18
Researchers have shown that education is an effective method to increase the level of
entrepreneurship in a region (Rauch & Hulsink, 2015). Postsecondary entrepreneurial
education encourages entrepreneurship within individuals that have ideas but lack the
fundamental business knowledge to grow their ideas (Castellani & Lora, 2014).
Individuals that participate in entrepreneurship education tend to have higher
entrepreneurial intentions to start a new business at the end of their educational program
(Rauch & Hulsink, 2015). The focus of this education should address the proper
management of finances, human resources, and technology (Castellani & Lora, 2014).
Capital requirements to start a new business seem to provide a barrier to
establishing a culture of entrepreneurship. However, the results from the literature are
mixed regarding whether capital requirements are indeed a hindrance to the start of new
businesses. Many researchers argue that increasing small businesses’ access to credit
helps to cultivate a region’s entrepreneurial environment by alleviating the barriers to
entry into entrepreneurship (Gentry & Hubbard, 2004; Castellani & Lora, 2014). While
other researchers found no relationship between household wealth and the propensity to
start a business; they concluded that the traditional views on capital requirements to start
a business do not hold up in the data (Hurst & Lusardi, 2004).
The literature reached five major conclusions regarding the methods to increase
entrepreneurship within a region:
1. Increase entrepreneurial education
2. Limit the time and cost associated with starting and maintaining
businesses

19
3. Develop shared spaces to establish collaboration, communication, and
mentorship within the entrepreneurial community
4. Establish networks and institutions to support entrepreneurs in the early
stages of their businesses
5. Clearly delineate the steps required to exit a business
Economic Mobility in America
In the United States, economic mobility research dates back to the early 1990s
when Solon (1992) wrote his seminal article that argued the United States was
dramatically less mobile than the world thought—challenging the idea of the American
Dream. While previous studies existed, none had cited a lack of economic mobility in
America. Recent studies have surfaced that built upon the seminal work completed in the
1990s and provided further substantiation to the lack of economic mobility in the United
States. A repeated new claim in the literature brings light to a new phenomenon that
researchers had not analyzed up to this point—the level of economic mobility in the
United States differs from region to region (Chetty, Hendren, Kline, & Saez, 2014). The
remainder of this section will discuss (a) the trends in the United States’ economic
mobility, (b) the discrepancies in economic mobility across the United States, and (c) the
key contributing factors to upward economic mobility in America.
Trends in Economic Mobility in the United States
The rising level of income inequality in the U.S. over the past century (see
Appendix G) has led many to presuppose that a decrease in economic mobility is the
primary driving factor. Early research in the field by Becker and Tomes (1986) found

20
high levels of economic mobility during the twentieth century. However, Becker and
Tomes (1986) used single-year earnings as their primary methodology, which was later
determined to not capture the whole story.
The 1990s brought with it new time-series methods of analyzing the economic
mobility of children by comparing the income levels of children with the income of their
parents (Solon, 1992). This method, commonly calculated through the intergenerational
correlation or the intergenerational elasticity of income, contrasted with the previously
used single-year earnings method by providing a more accurate portrait of economic
mobility in America through the use of longitudinal datasets that followed individuals
and their parents over 20- to 30-year time spans. Solon (1992) became one of the
pioneers to use this time-series method to study economic mobility in America. Using the
Panel Study of Income Dynamics (PSID), Solon (1992) found evidence that challenged
the popular belief that America was the land of opportunity—revealing dramatically less
economic mobility in America than previously thought.
Using this newly popularized method, other researchers sought to determine the
economic mobility of specific populations within America. The first of such populations
analyzed were immigrants (Borjas, 1993). Borjas (1993) demonstrated that an
immigrant’s source-country labor market economic mobility affects that of his or her
children. For instance, an Asian immigrant carries a different level of economic mobility
than a European immigrant due to the differences in mobility levels between the original
Asian and European countries.
Since the turn of the century, researchers have failed to reach a consensus
regarding whether economic mobility has increased, decreased, or remained the same in

21
America. During the early years of the century, researchers concluded that economic
mobility has been increasing in America (Aaronson and Mazumder, 2005). However,
later research that analyzed birth cohorts between 1952 and 1975 in the PSID concluded
that the level of economic mobility in America has remained stagnant (Lee & Solon,
2009). In recent years, researchers have sought out more robust measurements of
economic mobility by analyzing differences between quantiles of the income distribution
and mobility differences over time (Palomino, Marrerro, and Rodríguez, 2018). Using the
PSID, the researchers revealed a U-shaped relationship where mobility is highest at the
70th percentile of the income distribution and lowest at the tails of the distribution
(Palomino, Marrerro, and Rodríguez, 2018). Moreover, for the lower quantiles,
researchers found that economic mobility increased over the last two decades of the
twentieth century before decreasing in the 2000s (Palomino, Marrerro, and Rodríguez,
2018). The upper quantiles experienced little to no change in their economic mobility
levels (Palomino, Marrerro, and Rodríguez, 2018). Despite these differing viewpoints
regarding the changing level of economic mobility in the United States, recent research
has come to a consensus that economic mobility differs from region to region in America.
Discrepancies in Economic Mobility Across America
Although the direction of economic mobility on a macro level has been
ambiguous over the past decades, relatively recent research has found that the variation in
economic mobility between geographic regions within America is apparent (Chetty et al.,
2014). Children throughout the country are born into different levels of economic
mobility based on their birthplace (Chetty et al., 2014). For instance, economic mobility
is lowest in several Midwestern and Southeastern U.S. regions and highest in various

22
Western cities (Chetty et al., 2014). The researchers found that San Jose, California, and
Salt Lake City, Utah, are two of the highest mobility areas, while Cincinnati, Ohio, and
Milwaukee, Wisconsin, are two of the lowest mobility areas in the United States (Chetty
et al., 2014). Following this finding regarding the variation in economic mobility across
the United States, the authors sought to determine the primary drivers of the variation.
The main drivers of the variation of economic mobility within the United States
are segregation, income inequality, education quality, and family structure (Andrews &
Leigh, 2009; Chetty et al., 2014). First, areas with higher levels of segregation have lower
levels of economic mobility (Chetty et al., 2014). Second, regions that have greater
inequality are less mobile than regions with lower levels of inequality (Andrews & Leigh,
2009; Chetty et al., 2014). Third, the quality of education systems is positively correlated
with economic mobility (Chetty et al., 2014). Lastly, weaker family structures, measured
by the fraction of single-parent households in a region, are negatively correlated with
economic mobility (Chetty et al., 2014).
These measures to describe the variation in mobility across America can also be
used to generate a proxy for the quality of neighborhoods within the United States,
another strong predictor of economic mobility. The consensus across the literature is that
children who have prolonged exposure to better neighborhoods experience greater levels
of economic mobility (Chetty & Hendren, 2018). This exposure is linearly related to the
number of years that a child lives within the neighborhood (Chetty & Hendren, 2018).
Social networks, a concept closely related to the quality of neighborhoods, have
been found to be a great predictor of several qualities connected to economic mobility
(Chetty et al., 2014). Chetty et al. (2014) concluded that social capital, as measured by

23
the strength of social networks and community involvement, is positively correlated with
economic mobility. Commonly cited examples of strong social networks are religious
organizations. Areas in the United States with large densities of religious organizations
and individuals participating in civic organizations have high degrees of upward
economic mobility (Chetty et al., 2014). Salt Lake City, Utah, is a prime example of a
city with a large number of religious individuals (due to the presence of The Church of
Jesus Christ of Latter-day Saints) and a high degree of upward economic mobility.
Stronger social networks also influence health, crime rates, tolerance, inequality,
and child welfare (Putnam, 1995). Putnam (1995) presented evidence that pointed toward
increased health outcomes, lower crime rates, lower inequality levels, and greater child
welfare for those individuals with high social levels of social capital. These qualities are
strongly correlated with an individual’s level of economic mobility (Chetty et al., 2014).
Colleges across the United States generate substantial differences in economic
mobility for their respective students, largely due to differences in access to higher
education across income quantiles (Chetty, Friedman, Saez, Turner, & Yagan, 2017). The
highest rates of economic mobility are found at the elite colleges, namely the Ivy League
universities, and at several mid-tier public institutions (Chetty et al., 2017). However, the
lower-income students, where economic mobility can have the largest positive effect,
have seen stagnated attendance at the elite colleges and decreased attendance at the mid-
tier universities with the highest levels of mobility (Chetty et al., 2017).
Conclusion
The body of literature across South America validates entrepreneurship as a
vehicle for upward economic mobility. From Bolivia to Uruguay to Mexico to Colombia,

24
the evidence supports entrepreneurship as an effective mechanism to increase economic
mobility not only in one generation but in the next as well. The multigenerational impact
of entrepreneurship poses an interesting phenomenon to examine from a policy lens—
funding resources that focus on increasing entrepreneurship could leave a sustainable
impact for several generations.
The United States’ economic mobility-focused literature came alongside the
South American entrepreneurship research and found the U.S. to be riddled with
discrepancies in economic mobility across its different regions. The differences between
regions are evident in the literature; however, the research did not reach a consensus
regarding whether economic mobility has increased or decreased since the turn of the
century in America. Despite this ambiguity, one idea is certain—economic mobility
varies across America. The research has addressed this variation in economic mobility
and revealed the fundamental drivers of mobility to be residential segregation, income
inequality, school quality, social capital, family stability (Chetty et al., 2014).
The academic literature in the United States has yet to investigate the potential
impact of entrepreneurship on economic mobility. The purpose of my research is to (1)
substantiate the validity behind using entrepreneurship as a policy lever to increase
economic mobility and (2) to supplement the current knowledge on economic mobility
and the mobility-entrepreneurship relationship in America. I am hopeful that the results
of my research will further the discussion around how policy, business, and academia can
collaborate to level the mobility playing field in the United States.

25
METHODOLOGY
The purpose of this section is to describe the approach I employ to analyze the
relationship between entrepreneurship and economic mobility in the United States. To
best analyze this relationship, I use a quantitative analysis to analyze the mobility-
entrepreneurship relationship across all regions of the United States.
My methodology references specify terminology that may be unfamiliar but are
important to understanding many of my ideas. I have defined a few terms below:
• The Chetty Approach: Many aspects of my methodology mirrors the approach
taken by Chetty, Hendren, Kline, and Saez (2014), one of the most recognized
and cited papers in the mobility literature. When referencing the methodology
used by Chetty et al. (2014), I will refer to it as the Chetty Approach.
• Opportunity: I use economic mobility and opportunity interchangeably
throughout this section because economic mobility is often used as a proxy for
opportunity in the literature (Athreya and Romero, 2015; Chetty et al., 2014).
• Statistical Significance: A finding which implies that the coefficient of the given
variable is unlikely to be zero with 90%, 95%, or 99% confidence.
The remainder of this section will highlight (1) the data used in my analysis, (2)
the specifics of my quantitative approach, and (3) the limitations to my study.

26
Data Selection
The data needed for my study surrounds individual- and region-specific data
regarding levels of entrepreneurship and economic mobility over time. The
entrepreneurship-centric data requires an individual’s occupation status and geographic
location over a period of time. The economic mobility data is generated on a county level
across the United States by tracking the incomes of parents and children over 30 years.
Beyond the baseline entrepreneurship and economic mobility data, I collect other relevant
county-level covariates to use as controlling factors in my analysis of the relationship
between entrepreneurship and economic mobility in America. The remainder of this
section will examine the (a) economic mobility data, (b) entrepreneurship data, and (c)
choice of counties used in my analysis.
Economic Mobility Data
I use several datasets from The Opportunity Atlas’ public database, the data
source generated by Chetty et al. (2014), to retrieve economic mobility-related data on a
county level.
The Opportunity Atlas is a publicly available database based out of Harvard
University that provides datasets surrounding various life outcomes of American
citizens ranging from economic mobility to life expectancy to patent rates by
neighborhood, college, parental income level, and racial background (“Data
Library,” para. 1).
In this study, I use the Atlas database to gather time-period specific economic mobility
data across all regions of the United States. Using the Chetty Approach, I calculate
economic mobility through the use of the intergenerational elasticity of income (IGE)
coefficient. IGE is a common method to measure economic mobility in the literature
(Chetty et al. 2014; Solon, 1992). The method compares a child’s earnings to his or her

27
parents’ earnings to calculate a number between zero and one. A number closer to zero
implies a higher level of economic mobility and a number closer to one implies little to
no economic mobility. The Chetty Approach pairs parental income data from 1980 with
the child’s income data from 2012 to determine the levels of mobility for children born
between 1980 and 1982.
My study determines the IGE through the use of the economic mobility index. I
derive the economic mobility index from the rank-rank slope data in the Opportunity
Atlas. The rank-rank slope data is derived from the slope of the ordinary least squares
regression of the child’s income rank on the parent’s income rank. To determine the
economic mobility index, I multiply the rank-rank slope by -1 and add 1. The index is on
a scale from 0 to 1, where 1 represents the highest degree of economic mobility.
After collecting the economic mobility data, I gather relevant region
characteristics to limit confounding factors and increase the validity of my regression.
These region characteristics include the variables that Chetty et al. (2014) found to be
statistically significant in their relationship with economic mobility as well as various
other county covariates selected from the Atlas database (see Appendix H for a list of all
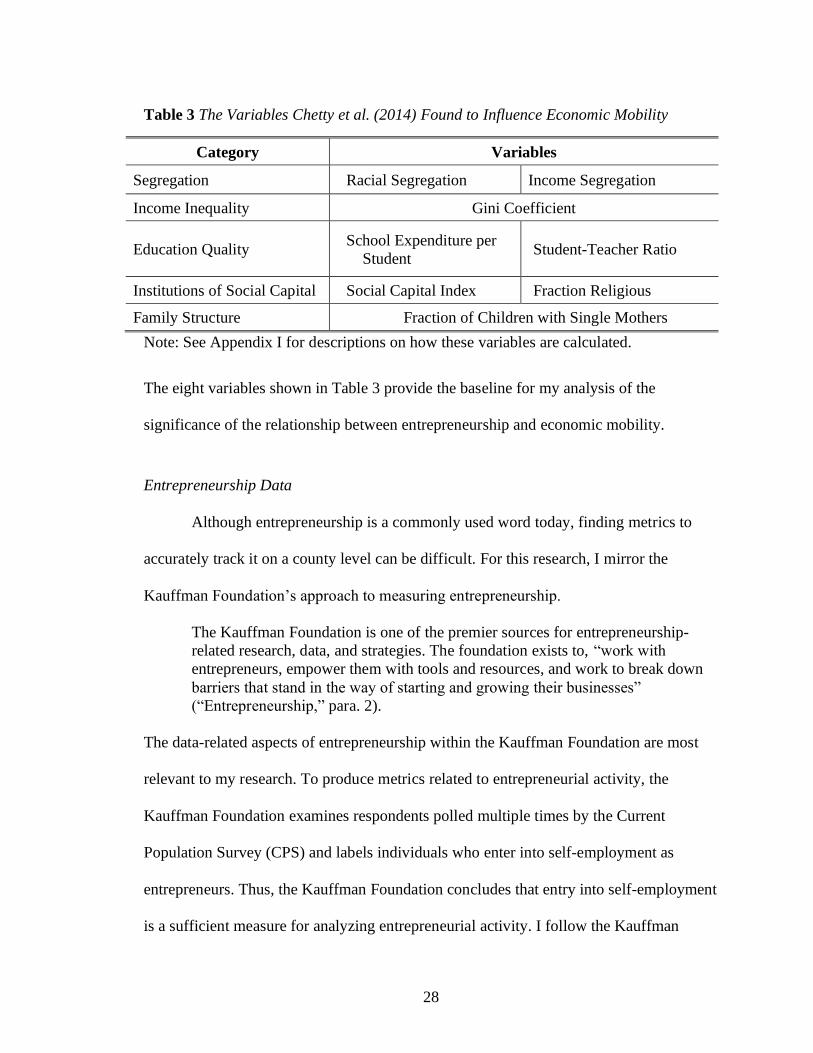
initial county covariates selected). Table 3 provides the five categories of variables that
Chetty et al. (2014) determined to have the largest effect on economic mobility.
28
Table 3 The Variables Chetty et al. (2014) Found to Influence Economic Mobility
Category Variables
Segregation Racial Segregation Income Segregation
Income Inequality Gini Coefficient
Education Quality School Expenditure per
Student Student-Teacher Ratio
Institutions of Social Capital Social Capital Index Fraction Religious
Family Structure Fraction of Children with Single Mothers
Note: See Appendix I for descriptions on how these variables are calculated.
The eight variables shown in Table 3 provide the baseline for my analysis of the
significance of the relationship between entrepreneurship and economic mobility.
Entrepreneurship Data
Although entrepreneurship is a commonly used word today, finding metrics to
accurately track it on a county level can be difficult. For this research, I mirror the
Kauffman Foundation’s approach to measuring entrepreneurship.
The Kauffman Foundation is one of the premier sources for entrepreneurship-
related research, data, and strategies. The foundation exists to, “work with
entrepreneurs, empower them with tools and resources, and work to break down
barriers that stand in the way of starting and growing their businesses”
(“Entrepreneurship,” para. 2).
The data-related aspects of entrepreneurship within the Kauffman Foundation are most
relevant to my research. To produce metrics related to entrepreneurial activity, the
Kauffman Foundation examines respondents polled multiple times by the Current
Population Survey (CPS) and labels individuals who enter into self-employment as
entrepreneurs. Thus, the Kauffman Foundation concludes that entry into self-employment
is a sufficient measure for analyzing entrepreneurial activity. I follow the Kauffman

29
Foundation’s method and use entry into self-employment as one of several proxies for
entrepreneurship.
The measurement of individual entry into self-employment requires data on
individuals and their work status over a period of time. I use the Integrated Public Use
Microdata Series (IPUMS), a subset of the monthly CPS, to retrieve and analyze data on
individual people. To effectively measure entrepreneurship, I use the Annual Social and
Economic Supplement (ASEC) of the IPUMS-CPS data to extract microdata on an
individual’s work status at the time of the survey and one year prior. Because the
economic mobility data is from 2012, I pull IPUMS-CPS data from 2010 to 2014 to
calculate an average level of entrepreneurship over these five years. I average
entrepreneurial activity over several years rather than a single year to mitigate the effects
of any large one-year changes in entrepreneurship.
While entry into self-employment is one of the key drivers of entrepreneurial
activity, I track four other variables to gain a broader grasp on entrepreneurship and its
relationship with self-employment. Table 4 provides explanations for all five self-
employment variables used in my analysis.

30
Table 4 The Self-Employment Variables Used to Measure Entrepreneurship
Variable Description
Becomes Self-Employed*
Individuals who were not self-employed in the prior year and
have moved into self-employment in the current year
*the Kauffman Foundation’s proxy for entrepreneurship
Stays Self-Employed Individuals who are self-employed in the current and prior year
Leaves Self-Employment Individuals who were self-employed in the prior year and have
moved to a different occupation in the current year
Self-Employed Either Year Individuals who are self-employed in the current or prior year
Change in Self-Employment
Between 2010-2014
The average change in self-employment between 2010 and
2014 on a county level
The inclusion of the change in self-employment between 2010 and 2014 (CSE) variable
in Table 4 is meant to control for potential economic factors that may encourage
individuals to become self-employed. Individuals who turn to self-employment during
economic downturns are known as necessity entrepreneurs. My analysis is focused on
opportunity entrepreneurs—those who start businesses when they see a market
opportunity—versus necessity entrepreneurs. By including the CSE variable, I filter out
the effects of necessity entrepreneurs on entrepreneurial activity within a county.
County Selection
I narrow the scope of my analysis to certain counties that have a sufficient number
of respondents and available economic mobility and entrepreneurship data. First, I
remove any counties with less than 100 respondents polled in the IPUMS-CPS data. I
remove these counties because the rates of entrepreneurship would be heavily influenced
by the inclusion of one additional self-employed individual. Second, while the Atlas
database provides a significant amount of economic mobility data for most counties

31
within the United States, the ASEC supplement of the IPUMS-CPS data does not list
county codes for every individual surveyed in order to retain anonymity within the
dataset. Thus, I limit the scope of my research to the counties where individuals have
available geographic identifiers. Table 5 provides a breakdown of the number of counties
with available economic mobility and entrepreneurship data.
Table 5 Counties with Available Economic Mobility and Entrepreneurship Data
Type of Data Number of Counties
with Available Data
Population of Available
Counties as a Percentage of the
Total U.S. Population in 2012
Economic Mobility 2,768 88.5%
Entrepreneurship 280 40.4%
Economic Mobility
+ Entrepreneurship 280 40.4%
a
As seen in Table 5, my analysis uses the 280 counties with available economic mobility
and entrepreneurship data. Although the 280 counties comprise less than 10% of the
3,031 counties in the United States in 2012, they represent over 40% of the total U.S.
population in 2012.
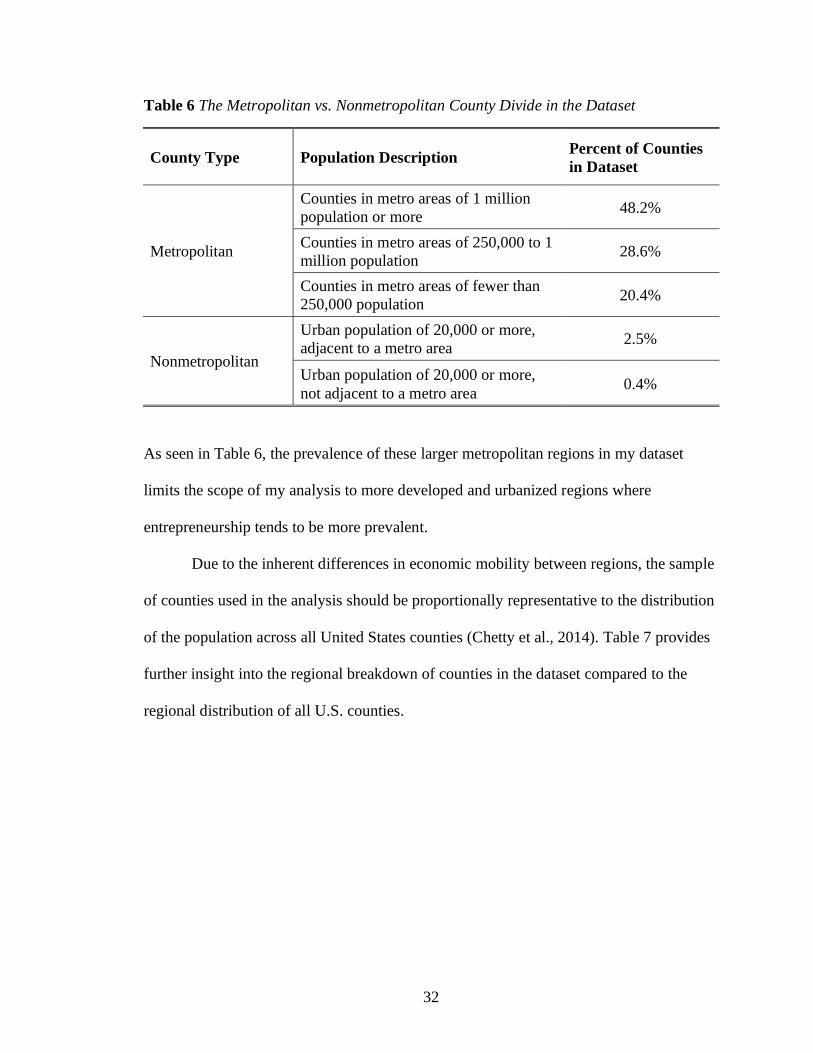
The 280 counties used in my analysis are primarily located in larger metropolitan
regions. Table 6 provides additional detail regarding the metropolitan versus
nonmetropolitan composition of county types in my sample dataset.
32
Table 6 The Metropolitan vs. Nonmetropolitan County Divide in the Dataset
County Type Population Description Percent of Counties
in Dataset
Metropolitan
Counties in metro areas of 1 million
population or more 48.2%
Counties in metro areas of 250,000 to 1
million population 28.6%
Counties in metro areas of fewer than
250,000 population 20.4%
Nonmetropolitan
Urban population of 20,000 or more,
adjacent to a metro area 2.5%
Urban population of 20,000 or more,
not adjacent to a metro area 0.4%
As seen in Table 6, the prevalence of these larger metropolitan regions in my dataset
limits the scope of my analysis to more developed and urbanized regions where
entrepreneurship tends to be more prevalent.
Due to the inherent differences in economic mobility between regions, the sample
of counties used in the analysis should be proportionally representative to the distribution
of the population across all United States counties (Chetty et al., 2014). Table 7 provides
further insight into the regional breakdown of counties in the dataset compared to the
regional distribution of all U.S. counties.

33
Table 7 Population Distribution by Region
Region
Proportion of
Population in Sample
Dataset
Proportion of Population in
the United States
Midwest 15.5% 24.0%
Northeast 22.6% 15.0%
South 27.2% 36.2%
West 34.7% 34.8%
Table 7 illustrates that the counties used in the sample are relatively proportionally
representative of the U.S. population distribution across all counties. Although the small
differences between the dataset and the actual data may pose as a limitation to my study,
I do not foresee significant changes in the results because the counties in the dataset are
relatively aligned with the actual population distribution.
Quantitative Analysis
In my quantitative analysis, I link the economic mobility and entrepreneurship
data to analyze the mobility-entrepreneurship relationship. I combine the two disparate
datasets through the use of state and county FIPS codes—unique numeric codes needed
to identify counties in the United States. I employ several correlations and multivariate
regressions to provide an overview of the relationship between economic mobility and
entrepreneurship in the United States. The multivariate regression regresses
entrepreneurship and several other county covariates against economic mobility. My goal
in regressing entrepreneurship on economic mobility is to determine if a statistically

34
significant relationship exists and provide evidence toward a potential relationship
between economic mobility and entrepreneurship in the United States.
I begin by performing a series of regressions to determine the strength and
significance of the mobility-entrepreneurship relationship. First, I regress several key
variables that Chetty et al. (2014) found to significantly influence economic mobility.
These variables fall into the categories described in Table 3: segregation, income
inequality, education quality, institutions of social capital, and family structure. I perform
this regression to determine the strength and explanatory power of these variables.
Subsequently, I add in the entry into self-employment variable to the previous regression
to identify the effects of entrepreneurship on economic mobility. By including these
variables, I can understand if entrepreneurship is significantly related to entrepreneurship
and discern whether the addition of these entrepreneurial variables increases the
explanatory power of the regression.
Limitations
I foresee several limitations to my methodology that may impact the measurement
of entrepreneurship and economic mobility in the United States. The following section
discusses (a) the lack of available entrepreneurship data, (b) the potential for reverse
causality, (c) the entrepreneur gap, and (d) the sampling method used to obtain the data.
The Availability of County-Level Entrepreneurship Data
The most significant limitation to my study surrounds the availability of the raw
county-level entrepreneurship data. Because individual occupation status data is not
available in all counties across the United States, the results of my analysis are biased
35
toward regions with developed entrepreneurial environments. This bias may leave out the
effects of entrepreneurship on smaller towns in America. However, the counties included
in the analysis still represent over 40% of the United States’ population and are regionally
distributed in a manner that is similar to the distribution of the U.S. population.
Moreover, the focus of my research is on opportunity entrepreneurs, which tend to be
located in larger towns. Necessity entrepreneurship tends to take precedent in smaller
towns due to the lack of formal employment. Consequently, the lack of individual
occupation data in smaller counties should not affect the intended results of the study.
The Potential for Reverse Causality
The second limitation of my research comes from the fact that reverse causation
may exist in the relationship between entrepreneurship and mobility. While my study
seeks to understand if higher levels of entrepreneurial activity lead to more economically
mobile communities, the reverse effect may be occurring: entrepreneurs may be drawn to
live in communities with higher degrees of mobility. The direction of the relationship
may be unclear regarding whether entrepreneurs affect communities or communities
affect entrepreneurs.
The Entrepreneur Gap for Women and Racial Minorities
A third limitation within my entrepreneurial-related data surrounds the concept
known as the “entrepreneur gap.” The entrepreneur gap refers to the gap in funding for
certain groups due to demographic differences. The most drastic gaps occur for female
and racial minorities.

36
The gender gap in entrepreneurship funding negatively affects women’s ability to
start businesses. Despite owning 40% of all businesses, women received just 2.2% of all
venture capital funds in 2018 (“The 2018 State”, 2018; Hinchliffe, 2019). This stark
disparity likely stems from a gender bias within venture capital partners—a group that is
92% male—who approach and question male- and female-owned businesses differently
during the capital raising process (Teare & Desmond, 2017; Kanze, Huang, Conley, &
Higgins, 2018). My methodology does not account for this gender discrepancy within
United States’ entrepreneurs because (1) the gender funding gap may have unforeseen
implications on women who choose not to become entrepreneurs due to the funding gap,
and (2) if less women-owned businesses are funded, the number of women entrepreneurs
may appear lower than the number of women entrepreneurs in a non-gender biased
funding environment. In turn, the gender gap in entrepreneurial funding weakens the
associated levels of entrepreneurial activity throughout the United States, creating a
confounding variable that has unforeseen implications on the relationship between
economic mobility and entrepreneurial activity in America.
The racial funding gap that exists between white and racial minority entrepreneurs
skews entrepreneurial activity toward majority-white regions. The racial funding gap
establishes barriers to capital for racial minorities. Take black entrepreneurs as an
example. Although black entrepreneurs are twice as likely to start a business than white
entrepreneurs, black entrepreneurs are significantly underrepresented within the
entrepreneurial landscape (Köllinger & Minniti, 2001). Moreover, black individuals who
start businesses must overcome the significant funding gap. The average black
entrepreneur starts a business with $35,000 in capital, while white entrepreneurs start

37
businesses with $106,000 in capital (Fairlie, Robb, & Robinson, 2016). As a result of this
smaller initial capital foundation, black entrepreneurs end up seeking businesses with
lower projected revenues compared to the ventures sought out by white entrepreneurs
(Singh, Knox, and Crump, 2008). Similar to the effect of the gender gap on
entrepreneurial activity in the United States, the racial funding gap presents a limitation
to my research by inhibiting the number of racial minorities that can start businesses.
Venture capitalists disproportionately support white entrepreneurs, skewing the level of
entrepreneurial activity across the United States away from regions with racial minorities
and toward regions with high concentrations of white individuals.
The Sampling Method Used to Obtain Entrepreneurship Data
Compounded with the fact that racial minorities receive less funding to start
businesses, the IPUMS-CPS data uses a non-random sampling method to oversample
these same racial minority groups. The CPS uses this non-random sampling method to
derive statistical insights from these groups. However, by using this method, the data
used in my analysis is not a true representation of entrepreneurial activity in the United
States. Additional information on entrepreneurial attitudes and motives would be needed
to adequately assess entrepreneurship; however, because of the lack of available data, the
results of my study should be taken in light of this fact.

38
RESEARCH FINDINGS
The following section highlights the findings of the research I performed to
understand the relationship between entrepreneurship and economic mobility in the
United States at the county level. Through an analysis that included several regressions
on 280 U.S. counties between 2010 to 2014, I determined that entrepreneurship is
significantly related to economic mobility. The remainder of this section will (1)
introduce the factors that have the strongest influence on economic mobility, (2) discuss
the structure of counties depending on the level of economic mobility, and (3) provide a
high-level overview of the results of the quantitative analysis performed to understand the
mobility-entrepreneurship relationship.
Section 1: The Factors with the Strongest Influence on Economic Mobility
I begin by describing the factors that have the strongest influence on economic
mobility. The correlation matrix in Table 8 highlights the relationship between economic
mobility, various entrepreneurship proxies, and the factors that Chetty et al. (2014) found
to have the greatest effect on mobility.

39
Table 8 Correlates of Economic Mobility
Economic
Mobility
Becomes
Self-
Employed
Self-
Employed
Both Years
Racial
Segregation
Income
Segregation
Gini
Coefficient
Student-
Teacher
Ratio
Social
Capital
Index
Percent
Religious
Fraction of
Children
with a
Single
Mother
Economic
Mobility 1.00 0.25*** 0.25*** -0.41*** -0.15** -0.02 0.22*** -0.22*** -0.12* -0.36***
Becomes Self-
Employed 1.00 0.95*** 0.18*** 0.31*** 0.29*** 0.20*** -0.14** 0.04 0.08
Self-Employed
Both Years 1.00 0.18*** 0.31*** 0.27*** 0.18*** -0.11* 0.06 0.05
Racial
Segregation 1.00 0.46*** 0.53*** -0.04 -0.01 0.30*** 0.60***
Income
Segregation 1.00 0.46*** -0.09 0.10* 0.18*** 0.29***
Gini
Coefficient 1.00 0.04 -0.24*** 0.22*** 0.58***
Student-
Teacher Ratio 1.00 -0.05 -0.10* -0.03
Social Capital
Index 1.00 0.15** -0.15**
Percent
Religious 1.00 0.02
Fraction of
Children with
a Single
Mother
1.00
Note: *, **, and *** denote statistical significance at the 90%, 95%, and 99% levels, respectively. See Appendix I for detailed descriptions of these
variables.

40
Table 8 reveals the strongest relationships exist between economic mobility and self-
employment, racial segregation, and the fraction of children with a single mother.
Segregation and family structure are negatively correlated with economic mobility while
self-employment is positively correlated. The negative correlation between segregation,
family structure, and economic mobility implies that more economically mobile counties
have a lower number of children with single mothers and are less racially segregated. The
fact that both family structure and segregation play an important role in dictating a
county’s economic mobility aligns with the results of the literature that found the two
categories to significantly impact mobility in the United States (Chetty et al., 2014). This
relationship suggests that in order to increase economic mobility, policymakers should
work to decrease racial segregation and encourage family stability in their communities.
The positive relationship between self-employment and economic mobility
implies that counties with more individuals who are self-employed—the key proxy for
entrepreneurship—tend to experience greater levels of upward economic mobility. This
finding aligns with the results of the South American literature that found a significant
relationship between entrepreneurship and upward economic mobility (Vélez-Grajales &
Vélez-Grajajes, 2014; Bukstein & Gandelman, 2014; Castellani & Lora, 2014;
Gandelman & Robano, 2014; Hernani-Limarino et al., 2011). While the correlation
matrix provides the direction of the relationship between entrepreneurship and economic
mobility, the regression output in Section 3 will illustrate the strength of the relationship
between mobility and entrepreneurship in comparison to the relationship between
economic mobility, segregation, and family structure.

41
Section 2: Understanding the Structure of Counties at Different Mobility Levels
As Section 1 confirmed that various factors are related to the level of economic
mobility of counties across the United States, this section will demonstrate the inherent
structural differences between U.S. counties. These differences evolve from the region’s
entrepreneurial activity, racial makeup, education quality, and family structure. Due to
the entrepreneurial-focus of this research, I begin by outlining the different self-
employment measures across the 280 counties in the dataset. Table 9 provides the
average self-employment measures across four economic mobility tiers.
Table 9 Self-Employment Measures Across Four Economic Mobility Tiers
(Fraction of Individuals)
Mobility
Tier
(n = 70
each)
Economic
Mobility
Index
Average
Unemployment
Rate 2010-2014
Became
Self-
Employed
Self-
Employment
Both Years
Self-
Employed
in Either
Year
Left Self-
Employment
1 0.76 0.089 0.0162 0.114 0.142 0.0114
2 0.70 0.077 0.0134 0.081 0.104 0.0093
3 0.66 0.075 0.0092 0.057 0.074 0.0073
4 0.61 0.082 0.0090 0.063 0.079 0.0072
Note: Tier 1 = 75th - 100th Percentile; Tier 2 = 50th - 75th Percentile; Tier 3 = 25th - 50th Percentile; Tier 4 =
0 - 25th Percentile. For all variables above except for Left Self-Employment, the Tier 1 value is statistically
different than the Tier 4 value at an 85% confidence level.
Table 9 demonstrates that counties with higher levels of economic mobility tend to have
more self-employed individuals, regardless of the measure of self-employment used.
Counties with more individuals that became self-employed, the traditional proxy for
entrepreneurship as defined by the Kauffman Foundation, is greatest at the first tier of
economic mobility. The remaining self-employment variables follow a similar positive
relationship as they increase when economic mobility increases. The lack of a clear
relationship between the average unemployment rate and economic mobility reveals that

42
individuals may not be entering into self-employment for potential economic reasons;
moreover, if individuals are entering into self-employment for economic reasons, the rate
at which they are entering is similar across all mobility tiers, weakening the
counterargument that links self-employment with economic hardship. In conclusion, this
preliminary analysis between counties with varying levels of economic mobility and
several self-employment measures reveals that higher rates of self-employment are
correlated with higher rates of economic mobility.
Beyond the entrepreneurial differences between counties with different economic
mobility levels, counties exhibit several other structural differences ranging from
disparities in county size, home value, obesity rates, and education quality. Table 10
provides averages across several categories to provide further insight into the structural
differences between counties across the four mobility tiers.
Table 10 Structural Differences Between Counties
Mobility Tier
(n = 692 each)
County
Population
Size
Median
House
Value
Percent of
Children
with a Single
Mother
Percent
Foreign
Born
Percent
Obese
Student-
Teacher
Ratio
1 115,357 $141,580 16.6 5.29 27.7 16.99
2 104,556 $120,907 18.2 3.68 30.8 16.81
3 93,420 $109,834 20.3 2.95 31.2 16.83
4 88,055 $97,416 25.2 2.26 34.6 16.66
Note: Tier 1 = 75th - 100th Percentile; Tier 2 = 50th - 75th Percentile; Tier 3 = 25th - 50th Percentile; Tier 4 =
0 - 25th Percentile. For all variables above except for County Population Size, the Tier 1 value is
statistically different than the Tier 4 value at a 99% confidence level.
All of the categories in Table 10 indicate clear relationships between the level of
economic mobility within the county and the respective category description. First, the

43
level of economic mobility and median home value is positively related to the size of the
county. More mobile counties tend to be larger and have homes of greater value. Second,
as Table 8 revealed, more economically mobile counties have a greater number of two-
parent households. Third, a greater population of foreigners tend to live in counties with
higher mobility levels. One potential explanation for this observation is that the level of
risk foreigners take when leaving their home country may induce the need to succeed
within their children, increasing economic mobility for their families. A second
explanation may be related to the fact that foreigners choose to immigrate to larger, more
economically mobile American cities. Fourth, more mobile counties tend to be healthier.
A potential explanation for this observation is that active and healthy individuals tend to
be located in larger cities where fitness and body-image plays a larger role. Lastly, the
student-teacher ratio is highest in the most economically mobile counties. This finding is
counterintuitive at first glance; however, one potential rationale for the higher student-
teacher ratio is county size. The first mobility tier is comprised of counties with larger
populations than the other three mobility tiers, which would naturally push the student-
teacher ratio up. On the other hand, the differences in the student-teacher ratio between
mobility tiers are so minor that they may solely be a product of chance.
The impact of racial disparities and segregation on a county’s economic mobility
level is prevalent across the literature. These racial differences stem from a history of
racism in America where different groups of people are treated differently when it comes
to buying homes, accessing schools, and several other common actions. Table 11
compares counties at different mobility tiers based on racial differences and segregation
levels.
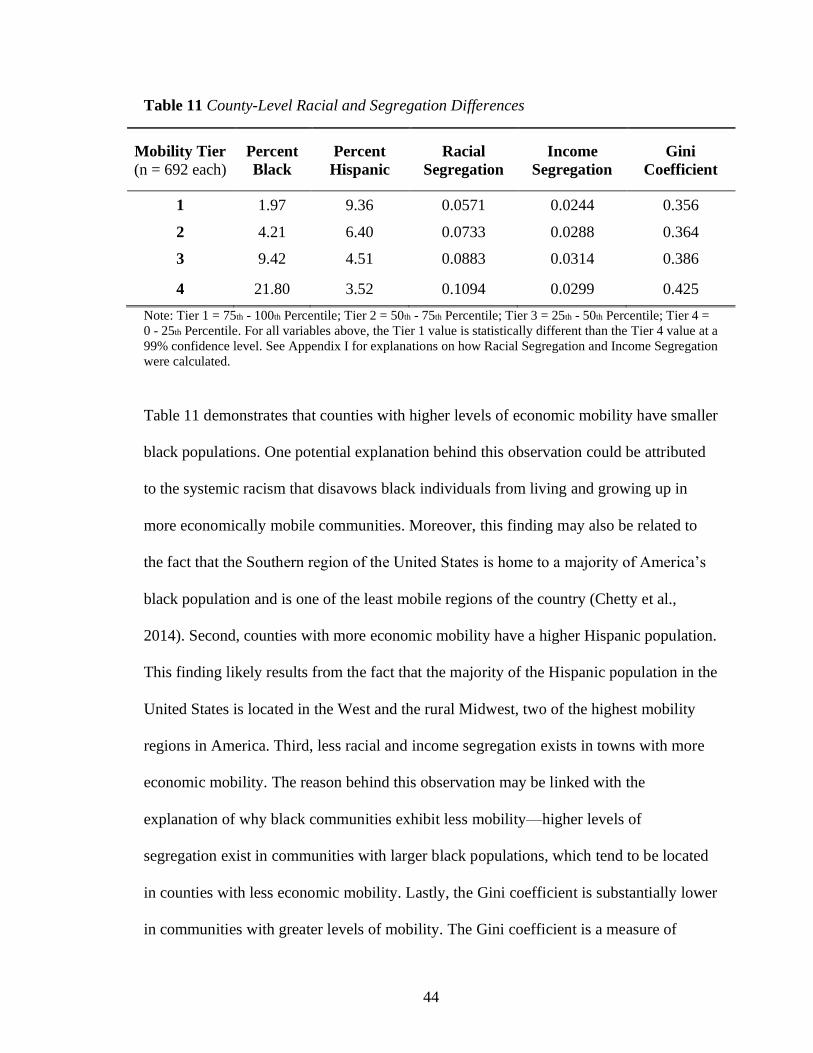
44
Table 11 County-Level Racial and Segregation Differences
Mobility Tier
(n = 692 each)
Percent
Black
Percent
Hispanic
Racial
Segregation
Income
Segregation
Gini
Coefficient
1 1.97 9.36 0.0571 0.0244 0.356
2 4.21 6.40 0.0733 0.0288 0.364
3 9.42 4.51 0.0883 0.0314 0.386
4 21.80 3.52 0.1094 0.0299 0.425
Note: Tier 1 = 75th - 100th Percentile; Tier 2 = 50th - 75th Percentile; Tier 3 = 25th - 50th Percentile; Tier 4 =
0 - 25th Percentile. For all variables above, the Tier 1 value is statistically different than the Tier 4 value at a
99% confidence level. See Appendix I for explanations on how Racial Segregation and Income Segregation
were calculated.
Table 11 demonstrates that counties with higher levels of economic mobility have smaller
black populations. One potential explanation behind this observation could be attributed
to the systemic racism that disavows black individuals from living and growing up in
more economically mobile communities. Moreover, this finding may also be related to
the fact that the Southern region of the United States is home to a majority of America’s
black population and is one of the least mobile regions of the country (Chetty et al.,
2014). Second, counties with more economic mobility have a higher Hispanic population.
This finding likely results from the fact that the majority of the Hispanic population in the
United States is located in the West and the rural Midwest, two of the highest mobility
regions in America. Third, less racial and income segregation exists in towns with more
economic mobility. The reason behind this observation may be linked with the
explanation of why black communities exhibit less mobility—higher levels of
segregation exist in communities with larger black populations, which tend to be located
in counties with less economic mobility. Lastly, the Gini coefficient is substantially lower
in communities with greater levels of mobility. The Gini coefficient is a measure of

45
inequality. Hence, communities that exhibit less inequality tend to be more economically
mobile.
The final analysis in Section 2 surrounds the differences in economic mobility
between regions within the United States. The differences stem from a wide variety of
reasons but are evident throughout Table 12, which reveals the differences across all
2,768 U.S. counties in 2012 with available mobility data.
Table 12 Economic Mobility Comparison by U.S. Region
Mobility Tier
(n = 692 each)
Percent in
Midwest
Percent in
Northeast
Percent in
South
Percent in
West
1 23.09 16.98 7.65 52.28
2 25.19 37.27 17.81 19.73
3 28.81 29.45 34.92 6.82
4 23.53 14.35 57.24 4.88
Note: Tier 1 = 75th - 100th Percentile; Tier 2 = 50th - 75th Percentile; Tier 3 = 25th - 50th Percentile; Tier 4 =
0 - 25th Percentile. Regions were normalized to 1000 counties per region to control for differences in region
size.
The most economically mobile counties are centralized in the West, Midwest, and
Northeast regions of the United States, while the lowest mobility counties are mainly in
the South. A deeper look into the economic mobility data reveals that 8 out of the 10
most mobile counties with populations larger than 50,000 are located in the West, and
five of the top 10 are located in California. The West and the South are the two regions
where economic mobility tends to be fixed within certain levels of mobility. While the
Midwest and Northeast exhibit a fairly uniform distribution across all levels of mobility.
46
To conclude, Section 2 illustrated the inherent differences that counties across
America exhibit dependent on their respective level of economic mobility. Counties with
greater levels of economic mobility tend to be located in larger counties in the Western
United States with higher levels of self-employment, less segregation, more foreign
individuals, larger home values, and healthier populations.
Section 3: Understanding the Mobility-Entrepreneurship Relationship
I conclude with a deeper look into the strength of the mobility-entrepreneurship
relationship to better understand how the level of entrepreneurial activity within a region
affects the level of mobility. To begin, I regress the variables that Chetty et al. (2014)
determined to have significant influences on economic mobility (see Table 3 for a list of
these variables). The first column of Table 13 illustrates the regression output between
these variables and economic mobility.

47
Table 13 Economic Mobility Regressed Against Key Variables
Dependent variable: Economic Mobility Index
(1) (2) (3) (4)
Racial Segregation –0.219
(0.000)
–0.185
(0.000)
–0.201
(0.000)
–0.209
(0.000)
Income Segregation 0.010
(0.936)
–0.136
(0.236)
–0.119
(0.264)
–0.179
(0.096)
Gini Coefficient 0.199
(0.041)
0.109
(0.008)
0.007
(0.856)
0.003
(0.934)
School Expenditure per
Student
0.002
(0.359)
0.000
(0.953)
–0.001
(0.653)
–0.001
(0.682)
Student-Teacher Ratio 0.001
(0.010)
0.002
(0.000)
0.002
(0.000)
0.001
(0.001)
Social Capital Index –0.010
(0.003)
–0.014
(0.000)
–0.016
(0.000)
–0.015
(0.000)
Percent Religious –0.0001
(0.502)
0.000
(0.773)
0.000
(0.239)
0.000
(0.257)
Percent of Children with
Single Mothers
–0.317
(0.000)
–0.210
(0.000)
–0.087
(0.127)
–0.081
(0.151)
Level of Obesity –0.450
(0.000)
–0.281
(0.000)
–0.237
(0.001)
Median House Value 0.000
(0.000)
0.000
(0.000)
Become Self-Employed
(i.e. Entrepreneur)
0.0004
(0.006)
R-squared 0.356 0.443 0.523 0.536
Observations 280 280 280 280
Note: The top number in each cell represents the coefficient of the variable in the regression
output. The number in parentheses represents the p-value of that coefficient.

48
As evidenced by the first regression in Table 13, racial segregation, Gini coefficient,
student-teacher ratio, social capital index, and percent of children with single mothers are
significant at a 95% confidence level. However, the explanatory power of the regression
is rather weak due to the r-squared value of 0.36. This r-squared value implies that the
variables in this regression explain 36% of the variation in economic mobility across the
United States. The variables with the largest impact on the regression’s output are racial
segregation, Gini coefficient, and the fraction of children with single mothers. The
strength of the racial segregation variable and the Gini coefficient is consistent with the
output of Table 11, which showed a distinct relationship between the level of racial
segregation, the Gini coefficient, and the level of economic mobility. Lastly, the positive
relationship between the percent of children with single mothers and economic mobility
aligns with the results of Table 10.
The subsequent two regressions in columns two and three reveal the strength of
the relationship between economic mobility and the community’s health and home
values. The explanatory power of the regression, as measured by the r-squared value,
increases by almost 20 percentage points with the addition of these two variables. The
negative relationship between the level of obesity and the economic mobility index
indicates that healthier communities tend to be more economically mobile. Moreover,
albeit small, the positive relationship between mobility and the county’s median home
value suggests that counties with larger home values tend to be more mobile. These two
findings are aligned with the results of Table 10, which revealed these same relationships.
The last regression in Table 13 represents the regression output between
economic mobility, entrepreneurship, and all of the variables included in the first three

49
regressions. The fourth regression finds the entry into self-employment variable, which
the Kauffman uses to define entrepreneurship, significant at a 99% confidence level. The
coefficient on the entry into self-employment variable is 0.0004. This coefficient value
means that for every additional person that entered into self-employment within a county,
the county’s economic mobility index increases by 0.0004 points. A more realistic
reading of this coefficient would be for every 100 people that enter into self-employment,
the county’s economic mobility index increases by 0.04 points. Thus, increased levels of
entrepreneurship are significantly related to increased levels of economic mobility. The
findings of this regression validate the hypothesis for this study that increases in
entrepreneurial activity are significantly correlated to increases in economic mobility on a
county level across the United States.

50
CONCLUSION
In the introduction of this thesis, I discussed how the history of entrepreneurship
in the United States has benefited from specific structural advantages that encouraged
entrepreneurial growth in America. In the literature review, I explored the different sects
of the literature that study entrepreneurship and economic mobility both domestically and
internationally to identify and draw parallels between other countries and the United
States. The main conclusion from the literature regarding the mobility-entrepreneurship
relationship was that individuals who engaged in entrepreneurship tended to experience
greater upward economic mobility. The literature does not reach a consensus regarding
whether mobility has increased or decreased since the turn of the century; however,
researchers agree that the level of mobility differs from region to region within the United
States. In the methodology, I walked through how I derived and analyzed entrepreneurial
activity and economic mobility on a county level across the United States. And in the
research findings section, I revealed a positive correlation between rates of
entrepreneurship, measured through various measures of self-employment, and economic
mobility at the county level. To conclude, I explain the potential future policy
repercussions of my research, comment on the need for sustainable entrepreneurship, and
close with a series of opportunities for future research.
The resultant policy implications of this study regard the continued need to
encourage entrepreneurship due to the strong relationship between rates of
entrepreneurship and levels of economic mobility across the United States. If
policymakers at the local level can implement measures that focus on increasing

51
entrepreneurial activity, they will be able to use the positive effects of entrepreneurship as
a mechanism to increase the economic mobility of their regions.
When encouraging entrepreneurship on a local or national level, policymakers
need to encourage the growth of sustainable enterprises. Entrepreneurship is most
effective when individuals are willing to take the risk to start a new business but aren’t
taking that risk haphazardly. Temporary upticks in the number of firms created will only
increase short-term growth. However, to best encourage long-term, sustainable growth
within economies, policymakers need to focus on developing and fostering the growth of
sustainable entrepreneurs. To understand the sustainable level of entrepreneurship within
their economy, policymakers can refer to the GEM’s approach to analyzing the level of
entrepreneurial activity. The GEM controls for short-term business creation measures
when measuring the entrepreneurial activity of countries by comparing the total
entrepreneurial activity (TEA) of a country with the established business (EB) activity.
While the TEA tracks individuals with businesses under 42 months old, EB owners run
businesses that are older than 42 months. By focusing the data and analysis on the
success of the EB activity metric, policymakers can better cater to the needs of their local
economies.
Entrepreneurship is fundamental to the history of America’s economic
development. Moving forward, entrepreneurship can and should be used to empower
those individuals with ideas that could change the course of modern technology,
healthcare, entertainment, and so many other fields. However, it is first imperative to
overcome the current barriers to entrepreneurship. The largest of such being the
entrepreneur gap, which impedes women and racial minorities from receiving adequate

52
funding to become entrepreneurs. Encouraging entrepreneurship in America means
breaking down the entrepreneur gap, building entrepreneurial outlets (such as incubators
and coworking spaces), and funding all Americans who bring disruptive ideas to the table
regardless of gender or race.
53
FUTURE RESEARCH OPPORTUNITIES
The research I performed to analyze the relationship between entrepreneurship
and economic mobility in the United States appears to be the first of its kind. However, I
foresee the need for future research to dive deeper into the specifics of this research area
to address some of the limitations that I posed. In this section, I propose several ideas for
future research including (1) a controlled study of individual entrepreneurs, (2) the effect
of the small business funding gap on entrepreneurial activity and economic mobility, and
(3) the trickle-down effects of business creation within communities.
Analyzing the Economic Mobility of Individual Entrepreneurs
An individualized study on the effects of entrepreneurship on economic mobility
is the natural next step in my research as it provides an opportunity to study individual
entrepreneurs over time. My research studied the relationship between self-employment
and economic mobility on a macro-level across the United States. This future research
opportunity would track individuals and their entrepreneurial attitudes over time. By
creating a controlled study that analyzed individual entrepreneurs, the research would
generate a greater understanding of the factors that most strongly influence
entrepreneurship. First, such a study would gather additional insight into whether
communities encourage the formation of entrepreneurs or entrepreneurs increase the
economic mobility of their communities. Second, the study would be able to understand
the mobility of both failed and successful entrepreneurs as well as necessity and
opportunity entrepreneurs. And third, the research would be able to understand the effects

54
of various parental factors on entrepreneurship, including the role model effect and the
effect of parental income level on entrepreneurship development. The results of this
research could add significant value to the research I performed in this study.
The Effects of the Small Business Funding Gap
Another potential avenue for future research that would build on my research is a
study that identified the effects of the small business funding gap on entrepreneurial
activity and economic mobility in America. Such a study would dive deeper into the
entrepreneur gap and focus on the reasons small businesses receive less funding. The
results of such a study could encourage the funding of small businesses on a local level,
further increasing entrepreneurial activity and economic mobility in America.
Additionally, this research would be able to understand how the economic mobility of
entrepreneurs changes depending on the success, or lack thereof, of their business over
time.
A Case Study on the Local Effects of Entrepreneurship
The last area for additional research surrounds a case study on individual
communities to better understand how new business creation affects the community's
economic mobility. While my research provided a high-level relationship between
entrepreneurship and economic mobility, this study would examine the effects of
individual business creation on the mobility of the community. For instance, if one, or
many, new business forms, how does this business formation affect the economic
mobility of the community members? Thus, should entrepreneurship be encouraged at the
local level to not only increase the economic mobility of the entrepreneur but also

55
increase the mobility of the community? This study would provide valuable insight to
policymakers as they generate new means to increase entrepreneurial activity within their
local communities.

56
APPENDIX
Appendix A
Intergenerational Correlations of Various OECD Countries
Appendix A: Intergenerational Correlations of Various OECD Countries
Source: Adapted from Corak (2011, Figure 1)
0.54
0.52
0.5
0.5
0.47
0.46
0.41
0.4
0.34
0.32
0.29
0.27
0.26
0.19
0.18
0.17
0.15
0 0.1 0.2 0.3 0.4 0.5 0.6
Slovenia
Chile
Itay
United Kingdom
United States
Switzerland
France
Spain
Japan
Germany
New Zealand
Sweden
Australia
Canada
Finland
Norway
Denmark

57
Appendix B
Entrepreneurial Activity Rates Between 48 Economies
Appendix B: Entrepreneurial Activity Rates Between 48 Economies
Source: Mission. (n.d.). Global Entrepreneurship Monitor. Retrieved from
https://www.gemconsortium.org/about/gem/5
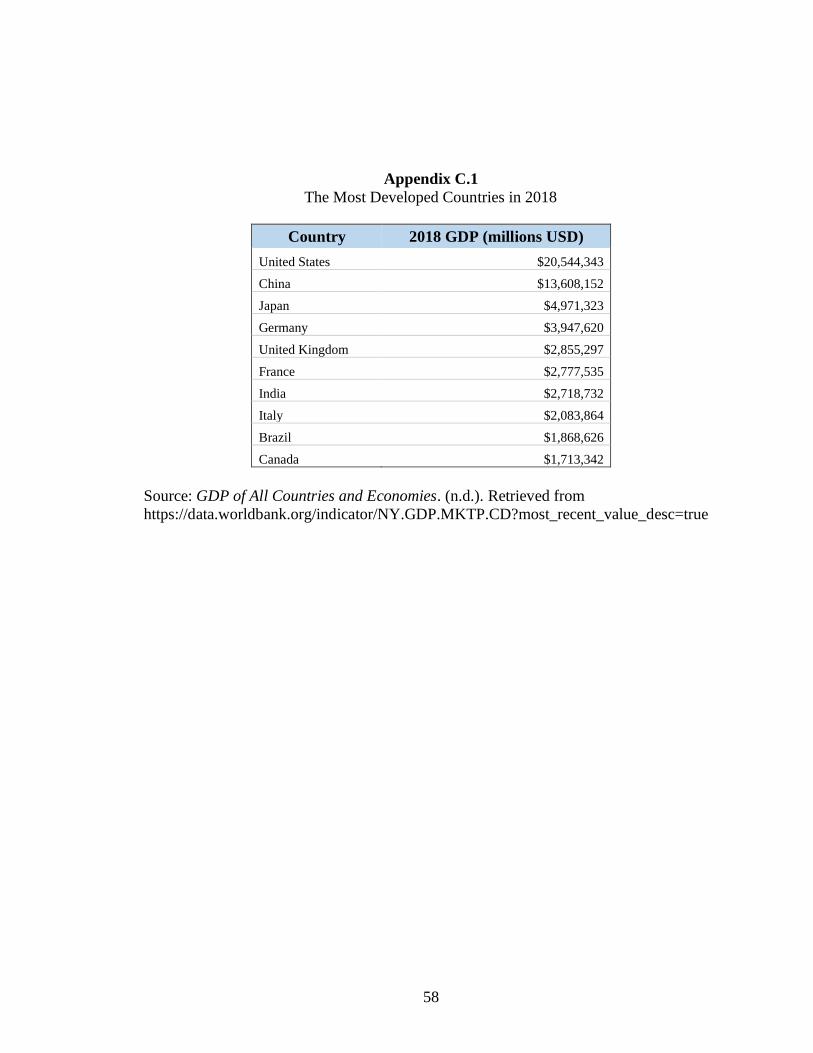
58
Appendix C.1
The Most Developed Countries in 2018
Appendix C.1: The Most Developed Countries in 2018
Country 2018 GDP (millions USD)
United States $20,544,343
China $13,608,152
Japan $4,971,323
Germany $3,947,620
United Kingdom $2,855,297
France $2,777,535
India $2,718,732
Italy $2,083,864
Brazil $1,868,626
Canada $1,713,342
Source: GDP of All Countries and Economies. (n.d.). Retrieved from
https://data.worldbank.org/indicator/NY.GDP.MKTP.CD?most_recent_value_desc=true

59
Appendix C.2: Tracking Entrepreneurship
Appendix C.2
Tracking Entrepreneurship Between Countries in 2018
Source: Global Entrepreneurship Monitor. (2019). Entrepreneurial Behavior and Attitudes Between Economies.
https://www.gemconsortium.org/data
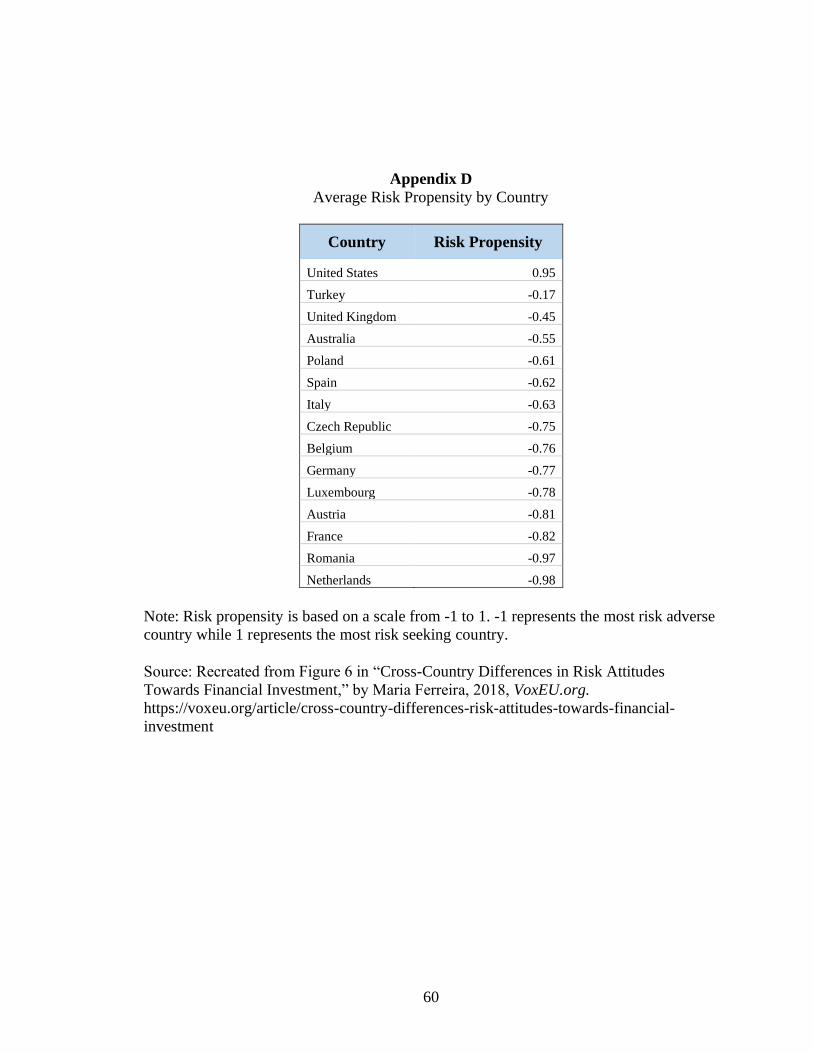
60
Appendix D
Average Risk Propensity by Country
Appendix D: Average Risk Propensity by Count
Country Risk Propensity
United States 0.95
Turkey -0.17
United Kingdom -0.45
Australia -0.55
Poland -0.61
Spain -0.62
Italy -0.63
Czech Republic -0.75
Belgium -0.76
Germany -0.77
Luxembourg -0.78
Austria -0.81
France -0.82
Romania -0.97
Netherlands -0.98
Note: Risk propensity is based on a scale from -1 to 1. -1 represents the most risk adverse
country while 1 represents the most risk seeking country.
Source: Recreated from Figure 6 in “Cross-Country Differences in Risk Attitudes
Towards Financial Investment,” by Maria Ferreira, 2018, VoxEU.org.
https://voxeu.org/article/cross-country-differences-risk-attitudes-towards-financial-
investment

61
Appendix E
Venture Capital Investments by Country in 2018
Appendix E: Venture Capital Investments by Country in 2018
Country
2018 Venture Capital
Investments ($USD
millions)
United States $113,142.9
China $70,500.0
Canada $2,923.6
United Kingdom $2,185.1
Korea $1,975.8
France $1,766.9
Germany $1,731.1
Japan $1,678.8
Israel $1,165.0
South Africa $695.1
Source: Organization for Economic Cooperation and Development. (2019). Venture
Capital Investments. https://stats.oecd.org/Index.aspx?DataSetCode=VC_INVEST

62
Appendix F
Ease of Doing Business Metrics in Developed Countries
Appendix F: Ease of Doing Business Metrics in Developed Countries
Source: Doing Business 2020 (Washington, DC: World Bank; pp. 1–149). (2020). World Bank Group. 10.1596/978-1-4648-1440-2
Country
Starting
Business
Score
Ease of
Dealing With
Construction
Permits Score
Ease of
Getting
Electricity
Score
Ease of
Registering
Property
Score
Ease of
Getting
Credit
Score
Ease of
Paying
Taxes Score
Ease of
Trading
Across
Borders
Score
Ease of
Enforcing
Contracts
Score
Ease of
Resolving
Insolvency
Score
Overall
Ease of
Doing
Business
Score
United States 91.6 80.0 82.2 76.9 95.0 86.8 92.0 73.4 90.5 84.0
United Kingdom 94.6 80.3 96.9 75.7 75.0 86.2 93.8 68.7 80.3 83.5
Germany 83.7 78.2 98.8 66.6 70.0 82.2 91.8 74.1 89.8 79.7
Canada 98.2 73.0 63.8 77.8 85.0 88.1 88.4 57.1 81.0 79.6
Japan 86.1 83.1 93.2 75.6 55.0 81.6 85.9 65.3 90.2 78.0
China 94.1 77.3 95.4 81.0 60.0 70.1 86.5 80.9 62.1 77.9
France 93.1 74.3 92.0 63.3 50.0 79.2 100.0 73.5 74.6 76.8
Italy 86.8 68.3 86.1 81.7 45.0 64.0 100.0 53.1 77.5 72.9
India 81.6 78.7 89.4 47.6 80.0 67.6 82.5 41.2 62.0 71.0
Brazil 81.3 51.9 72.8 54.1 50.0 34.4 69.9 64.1 50.4 59.1

63
0
50
100
150
200
250
2018
2015
2012
2009
2006
2003
2000
1997
1994
1991
1988
1985
1982
1979
1976
1973
1970
1967
1964
1961
1958
1955
1952
1949
1946
1943
1940
1937
1934
1931
1928
1925
Top 0
.1%
to B
ott
om
90%
Mult
iple
Appendix G
Income of America's Top 0.1% as a Multiple of Bottom 90%
Appendix G: Income of America's Top 0.1% as a Multiple of Bottom 90
Source: Saez, E. (n.d.). Income Inequality. Inequality.Org.
https://inequality.org/facts/income-inequality/

64
Appendix H: County-Level Covariates
Appendix H
County-Level Covariates
1. School Expenditure per Student
2. Student-Teacher Ratio
3. Test Score Percentile (Income Adjusted)
4. High School Dropout Rate (Income
Adjusted)
5. Percent College Grads tuition College
Tuition
6. College Tuition
7. Percent College Grads
8. Absolute Mobility (Expected Rank at
p25)
9. Fraction of Children with Single Mother
10. Total Crime Rate
11. Local Government Expenditures
12. Local Tax Rate
13. Tax Progressivity
14. Rank-Rank Slope
15. Absolute Upward Mobility
16. Top 1% Income Share
17. Interquartile Income Range
18. Gini Coefficient
19. Teenage Birth Rate
20. County Population in 2000
21. Commuting Zone Population in 2000
22. Urban Area
23. BRFSS: Fraction Current Smokers in Q1
24. BRFSS: Fraction Current Smokers in Q2
25. BRFSS: Fraction Current Smokers in Q3
26. BRFSS: Fraction Current Smokers in Q4
27. BRFSS: Fraction Obese in Q1
28. BRFSS: Fraction Obese in Q2
29. BRFSS: Fraction Obese in Q3
30. BRFSS: Fraction Obese in Q4
31. BRFSS: Fraction Exercised in Past 30
Days in Q1
32. BRFSS: Fraction Exercised in Past 30
Days in Q2
33. BRFSS: Fraction Exercised in Past 30
Days in Q3
34. BRFSS: Fraction Exercised in Past 30
Days in Q4
35. Percent Uninsured
36. Medicare $ Per Enrollee
37. 30-day Hospital Mortality Rate Index
38. 30-day Mortality for Heart Attacks
39. 30-day Mortality for Heart Failure
40. 30-day Mortality for Pneumonia
41. Mean of Z-Scores for Dartmouth Atlas
Ambulatory Care Measures
42. Percent of Medicare Enrollees with at
Least One Primary Care Visit
43. Percent Diabetic with Annual
Hemoglobin Test
44. Percent Diabetic with Annual Eye Test
45. Percent Diabetic with Annual Lipids Test
46. Percent Female Aged 67-69 with
Mammogram
47. Discharges for Ambulatory Care
Sensitive Conditions Among Medicare
Enrollees\
48. Income Segregation
49. Segregation of Poverty (< p25)
50. Segregation of Affluence (>p75)
51. Racial Segregation
52. Gini Index Within Bottom 99%
53. Poverty Rate
54. Top 1% Income Share
55. Fraction Middle Class (p25-p75)
56. Social Capital Index
57. Percent Religious
58. Percent Black
59. Percent Hispanic
60. Unemployment Rate in 2000
61. Percent Change in Population 1980-2000
62. Percent Change in Labor Force 1980-
2000
63. Labor Force Participation
64. Share Working in Manufacturing
65. Percent Foreign Born
66. Migration Inflow Rate
67. Migration Outflow Rate
68. Population Density
69. Fraction with Commute < 15 Min
70. Mean Household Income
71. Median House Value

65
Appendix I
Descriptions of Variables with the Largest Influence on Mobility
Appendix I: Descriptions of Variables with the Largest Influence on Mobility
Source: Opportunity Insights. (n.d.) Geography of Mobility: County Intergenerational
Mobility Statistics and Selected Covariates. https://opportunityinsights.org/data/
Category Variable Description
Segregation
Racial Segregation
Multi-group Theil Index calculated at the
census-tract level over four groups: White
alone, Black alone, Hispanic, and Other
(“Theil Index,” 2016). 0 represents no racial
segregation and higher numbers represent a
higher level of segregation.
Income Segregation
Rank-Order index estimated at the census-tract
level using equation (13) in Reardon (2011);
the δ vector is given in Appendix A4 of
Reardon's paper. H(pk) is computed for each of
the income brackets given in the 2000 census.
Income Inequality Gini Coefficient
The Gini coefficient is a statistical
measurement of inequality that is calculated by
analyzing the wealth distribution of a certain
region.
Education Quality
School Expenditure
per Student
Average expenditures per student in public
schools
Student Teacher Ratio Average student-teacher ratio in public schools
Institutions of Social
Capital
Social Capital Index
Institutions of social capital will be calculated
through the use of the social capital index,
developed by Rupasingha and Goetz (2008),
which analyzes voter turnout rates, the fraction
of people who return their census forms, and
various other measures of community
participation (Chetty et al., 2014).
Fraction Religious Share of religious adherents
Family Structure Fraction of Children
with Single Mothers
Number of single female households with
children divided by total number of households
with children

66
REFERENCES
Aaronson, D., & Mazumder, B. (2005). Intergenerational economic mobility in the U.S., 1940
to 2000. SSRN Electronic Journal. https://doi.org/10.2139/ssrn.869435
Andrews, D., & Leigh, A. (2009). More inequality, less social mobility. Applied Economics
Letters, 16(15), 1489–1492. https://doi.org/10.1080/13504850701720197
Ardagna, S., & Lusardi, A. (2008). Explaining international differences in entrepreneurship:
The role of individual characteristics and regulatory constraints (Working Paper No.
14012). National Bureau of Economic Research. https://doi.org/10.3386/w14012
Athreya, K., & Romero, J. (2015). Land of opportunity: Economic mobility in the United
States. Economic Quarterly (10697225), 101(2), 169–191.
http://dx.doi.org/10.21144/eq1010205
Becker, G. S., & Tomes, N. (1986). Human capital and the rise and fall of families. Journal of
Labor Economics, 4(3, Part 2), S1–S39. https://doi.org/10.1086/298118
Borjas, G. J. (1993). The intergenerational mobility of immigrants. Journal of Labor
Economics, 11(1), 113. https://doi.org/10.1086/298319
Bukstein, D., & Gandelman, N. (2014). Intra-generational social mobility and
entrepreneurship in Uruguay. Latin American Journal of Economics; Santiago, 51(2),
227–245. http://dx.doi.org/10.7764/LAJE.51.2.227
Castellani, F., & Lora, E. (2013). Entrepreneurship in Latin America: A step up the social
ladder? The World Bank. https://doi.org/10.1596/978-1-4648-0008-5
Castellani, F., & Lora, E. (2014). Is entrepreneurship a channel of social mobility in Latin
America? Latin American Journal of Economics, 51(2), 179–194.
https://doi.org/10.7764/LAJE.51.2.179
Chetty, R., Friedman, J. N., Saez, E., Turner, N., & Yagan, D. (2017). Mobility report cards:
The role of colleges in intergenerational mobility (Working Paper No. 23618). National
Bureau of Economic Research. https://doi.org/10.3386/w23618
Chetty, R., & Hendren, N. (2018). The impacts of neighborhoods on intergenerational
mobility I: Childhood exposure effects. The Quarterly Journal of Economics, 133(3),
1107–1162. https://doi.org/10.1093/qje/qjy007

67
Chetty, R., Hendren, N., Kline, P., & Saez, E. (2014). Where is the land of opportunity? The
geography of intergenerational mobility in the United States. The Quarterly Journal of
Economics, 129(4), 1553–1623. https://doi.org/10.1093/qje/qju022
Corak, M., & Piraino, P. (2011). The intergenerational transmission of employers. Journal of
Labor Economics, 29(1), 37–68. https://doi.org/10.1086/656371
Data Library. (n.d.). [Opportunity Insights]. Retrieved from
https://opportunityinsights.org/data/
Doing Business 2020 (Washington, DC: World Bank; pp. 1–149). (2020). World Bank Group.
10.1596/978-1-4648-1440-2
Entrepreneurship. (n.d.). Ewing Marion Kauffman Foundation. Retrieved from
https://www.kauffman.org/entrepreneurship/
Fairlie, R., Robb, A., & Robinson, D. T. (2016). Black and white: Access to capital among
minority-owned startups. Stanford Institute for Economic Policy Research.
https://siepr.stanford.edu/sites/default/files/publications/17-003.pdf
Ferreira, M. (2018, September 21). Cross-country differences in risk attitudes towards
financial investment. VoxEU.Org. https://voxeu.org/article/cross-country-differences-
risk-attitudes-towards-financial-investment
Gandelman, N., & Robano, V. (2014). Intergenerational mobility and entrepreneurship in
Uruguay. Latin American Journal of Economics; Santiago, 51(2), 195–226.
http://dx.doi.org/10.7764/LAJE.51.2.195
GDP of All Countries and Economies. (n.d.). Retrieved from
https://data.worldbank.org/indicator/NY.GDP.MKTP.CD?most_recent_value_desc=true
Gentry, W. M., & Hubbard, R. G. (2004). Entrepreneurship and household saving. Advances
in Economic Analysis & Policy, 4(1). https://doi.org/10.2202/1538-0637.1053
Global Entrepreneurship Index. (2018). Global Entrepreneurship Development Institute.
https://thegedi.org/global-entrepreneurship-and-development-index/
Hernani-Limarino, W. L., Eid, A., & Villarroel, P. (2011). Entrepreneurship and economic
mobility: A case study of Bolivia. Fundacion ARU, 62.
http://www.aru.org.bo/REPEC/pdf/Entrepreneurship_and_Economic_Mobility.pdf
Hinchliffe, E. (2019, January 28). In 2018, all female founders put together got $10 billion
less than Juul. Fortune. https://fortune.com/2019/01/28/funding-female-founders-2018/

68
Hoff, J. (2011, November 28). Bankruptcy support group in Germany helps down-and-outs.
DW.COM. https://www.dw.com/en/bankruptcy-support-group-in-germany-helps-down-
and-outs/a-15491202
Hoffmann, A. O. I., Post, T., & Pennings, J. M. E. (2015). How investor perceptions drive
actual trading and risk-taking behavior. Journal of Behavioral Finance, 16(1), 94–103.
https://doi.org/10.1080/15427560.2015.1000332
Hurst, E., & Lusardi, A. (2004). Liquidity constraints, household wealth, and
entrepreneurship. Journal of Political Economy, 112(2), 319–347.
https://doi.org/10.1086/381478
Kantis, H., Federico, J., & Trajtenberg, L. (2013). Entrepreneurship in Latin America: A step
up the social ladder? (E. Lora & F. Castellani, Eds.). The World Bank.
https://doi.org/10.1596/978-1-4648-0008-5
Kanze, D., Huang, L., Conley, M. A., & Higgins, E. T. (2018). We ask men to win and women
not to lose: Closing the gender gap in startup funding. Academy of Management Journal,
61(2), 586–614. https://doi.org/10.5465/amj.2016.1215
Klapper, L., Laeven, L., & Rajan, R. (2006). Entry regulation as a barrier to entrepreneurship.
Journal of Financial Economics, 82(3), 591–629.
https://doi.org/10.1016/j.jfineco.2005.09.006
Köllinger, P., & Minniti, M. (2006). Not for lack of trying: American entrepreneurship in
black and white. Small Business Economics, 27(1), 59–79.
https://doi.org/10.1007/s11187-006-0019-6
Laurano, M. (2018). A New Era of Campus Recruiting. Aptitude Research Partners.
https://yello.co/resource/white-paper/new-era-for-campus-recruiting/
Lee, C.-I., & Solon, G. (2009). Trends in intergenerational income mobility. Review of
Economics & Statistics, 91(4), 766–772. https://doi.org/10.1162/rest.91.4.766
Mission. (n.d.). Global Entrepreneurship Monitor. Retrieved from
https://www.gemconsortium.org/about/gem/5
Mwasalwiba, E. S. (2010). Entrepreneurship education: A review of its objectives, teaching
methods, and impact indicators. Education + Training, 52(1), 20–47.
https://doi.org/10.1108/00400911011017663
Ordeñana, X., & Arteaga, E. (2013). The effect of social capital on middle-class
entrepreneurship in Ecuador (E. Lora & F. Castellani, Eds.). The World Bank.
https://doi.org/10.1596/978-1-4648-0008-5

69
Palomino, J. C., Marrero, G. A., & Rodríguez, J. G. (2018). One size doesn’t fit all: A quantile
analysis of intergenerational income mobility in the U.S. (1980–2010). Journal of
Economic Inequality, 16(3), 347–367. https://doi.org/10.1007/s10888-017-9372-8
Putnam, R. (1995). Social capital: Measurement and consequences. In J. F. Helliwell (Ed.),
The Contribution of Human and Social Capital to Sustained Economic Growth and Well-
Being (pp. 117–135). http://www.sietmanagement.fr/wp-
content/uploads/2016/04/Putnam_SocialCapital.pdf
Rauch, A., & Hulsink, W. (2015). Putting entrepreneurship education where the intention to
act lies: An investigation into the impact of entrepreneurship education on entrepreneurial
behavior. Academy of Management Learning & Education, 14(2), 187–204.
https://doi.org/10.5465/amle.2012.0293
Reardon, S. F. (2011). Measures of income segregation. Stanford Center on Poverty and
Inequality (CEPA Working Papers).
https://inequality.stanford.edu/sites/default/files/reardon_measures-income-seg.pdf
Rupasingha, A., & Goetz, S. J. (2008). US County-Level Social Capital Data, 1990–2005.
Northeast Regional Center for Rural Development, Penn State University.
https://aese.psu.edu/nercrd/community/social-capital-resources
Saez, E. (n.d.). Income Inequality. Inequality.Org. Retrieved from
https://inequality.org/facts/income-inequality/
Singh, R. P., Knox, E. L., & Crump, M. E. S. (2008). Opportunity recognition differences
between black and white nascent entrepreneurs: A test of bhave’s model. Journal of
Developmental Entrepreneurship, 13(01), 59–75.
https://doi.org/10.1142/S1084946708000855
Solon, G. (1992). Intergenerational income mobility in the United States. The American
Economic Review, 82(3), 393–408. https://www.jstor.org/stable/2117312
Teare, G., & Desmond, N. (2017, October 4). Announcing the 2017 update to the Crunchbase
Women in Venture report | TechCrunch. https://techcrunch.com/2017/10/04/announcing-
the-2017-update-to-the-crunchbase-women-in-venture-report/
The 2018 State of Women-Owned Businesses Report (p. 15). (2018). American Express.
https://ventureneer.com/wp-content/uploads/2017/11/2018-state-of-women-owned-
businesses-report_FINAL.pdf
The United States of Entrepreneurs. (2009, May 14). The Economist.
https://www.economist.com/special-report/2009/03/14/the-united-states-of-entrepreneurs

70
Theil Index. (2016, May 24). United States Census Bureau.
https://www.census.gov/topics/income-poverty/income-inequality/about/metrics/theil-
index.html
Trikha, R. (2015, September 4). The interdependency of Stanford and Silicon Valley
[TechCrunch]. http://social.techcrunch.com/2015/09/04/what-will-stanford-be-without-
silicon-valley/
Vélez-Grajales, V., & Vélez-Grajales, R. (2014). Is Entrepreneurship inherited? A study of
intergenerational social mobility in Mexico. Latin American Journal of Economics,
51(2), 247–278. https://doi.org/10.7764/LAJE.51.2.247