entrepreneurship, technological regimes, and productivity ... · entrepreneurship, technological...
TRANSCRIPT
Entrepreneurship, technological regimes, and
productivity growth
Integrated taxonomies of firms and sectors
Michael Peneder*
ABSTRACT
This research is aimed at the interlinkages between the micro-and the meso-level of innovation. It
focuses first on heterogeneous innovation behaviour among individual firms, and then derives new
taxonomies from the distribution of distinct firm types within sectors. The outcome is a set of
integrated classifications both at the firm and sectoral levels, which focuses on (i) the kind of
entrepreneurship; (ii) technological opportunity; (iii) appropriability conditions; (iv) the
cumulativeness of knowledge, and (v) a sector’s general ‘innovation intensity’. Final validations of the
clusters confirm, e.g, a significant positive but non-linear impact of a sector’s innovation intensity on
labour productivity growth.
Key Words: Entrepreneurship, technological regimes, productivity growth, sectoral taxonomy,
industry classification.
JEL Codes: D21, D28, O31, O33, O34.
* Corresponding author: Michael Peneder Austrian Institute of Economic Research (WIFO) P.O. Box 91; A-1030 Vienna Austria Tel.: + 43-1-798 26 01 – 480 Fax.: + 43-1-798 93 86 E-mail: [email protected]

– 2 –
1. Introduction
Firm data on innovation and performance consistently show much heterogeneity of behaviour and
capabilities among individual companies. At the same time, sectoral data repeatedly demonstrate
persistent and significant differences (e.g., with respect to average factor intensities, firm duration,
etc.) between sectors. Malerba (2007) points at the apparent tension between these two stylised facts:
while the first stresses variety, the latter emphasises common contingencies among firms operating
within the same markets.
In most empirical analyses, this tension remains unresolved. The variety of firm behaviour causes
many researchers to focus on micro-data, frequently discarding the more aggregate levels of analysis.
Conversely, persistent differences between sectors draw much attention towards sectors, where
observed regularities are often interpreted as if there were no variety within them. What is largely
missing, however, is an integrated perspective, which simultaneously takes account of firm-level
variety and sectoral contingencies. Building an integrated set of new innovation classifications for
firms and sectors from a joint micro-datasource, that is precisely where this paper aims to make a
contribution.
One can distinguish two major reasons for the creation of industry classifications: First, from an
analytical point of view, sectoral taxonomies facilitate investigations into the impact of specific
characteristics of the market environment on economic activity. Substituting structural knowledge for
exhaustive information concerning single attributes, the intractable diversity of real-life phenomena is
condensed into a smaller number of salient types. Classifications thus direct our attention towards a
few characteristic dimensions, according to which relative similarities or differences can be identified.
They allow us to take account of heterogeneity, while simultaneously forcing us to be selective.
Secondly, from a purely practical perspective, the taxonomic approach is particularly useful when
referring to data that are not easily available in a comparable format across countries or firms. The
reason is that it builds upon data from those entities, which offer the best coverage of specific

– 3 –
attributes and then produces typical profiles of the relevant variables. The resulting classification can
then be applied to other data on economic activity, which is available on a broader comparable basis
(e.g., value added, employment, or labour productivity).
A number of innovation taxonomies already exists, from which Pavitt (1984) and Hatzichronoglou
(1997) stand out as the best known and most influential examples. Furthermore, there are many others
(see Section 2.2), which leads to the question why we should long for yet another innovation
classification? The first and most obvious reason is the availability of new data. More specifically, this
paper taps the micro-data from the newly established Eurostat Safe Center, which provides access to
CIS firm level data for a considerable range of European countries. With a huge number of individual
observations at hand, the empirical basis for the new taxonomies offers a wealth of opportunities to
test new ideas. Second, the methods of classification have only recently begun to capture a noticeable
share of debate among economists. In contrast to the attention given to the tremendous mass of
econometric literature, the proper construction and use of classifications has remained largely under-
researched within the realm of economics. Many taxonomies lack a theoretical justification and are
purely data driven, while others suffer from ad hoc methods of empirical identification, missing out on
the available statistical toolbox. Fortunately, the degree of sophistication aspired in the creation of
industry classifications is gradually growing (Peneder, 2003, 2007a). One of the intentions of this
paper is to provide an example of good practice –in terms of both the theoretical justification and the
methodological rigour that can be applied to the classification process.
When more than one taxonomy cover a similar topic, the frequently encountered question ‘but which
is the correct one?’ proves how widespread the lack of understanding still is. Any classification is a
social construct that emanates from a specific context of use, availability of data, and methodology.
There is neither much objective ground for, nor meaning in ranking them against each other. However,
some benchmark criteria do exist, and it is against them that a new taxonomy ought to prove its worth:

– 4 –
⎯ First of all, industry classifications ought to have an economic rationale in the sense that they
relate to theoretical concepts and categories. Apart from being a general attitude (which one
may or may not share), this has the practical advantage that new taxonomies can be used as
discriminatory variables in empirical tests of hypotheses received from the literature.
⎯ Secondly, the taxonomies must prove their discriminatory power with respect to the variables
chosen for the classification process. Rather than being trivial, this is to say that the objects
being classified must exhibit true structural differences.
⎯ Finally, the taxonomies should be able to discriminate significantly along dimensions other than
those already applied in the classification process. Even though this is not a definite requirement
for validation, it demonstrates its usefulness for further analytical purposes.
This is the third in a series of papers producing new sectoral classifications, all of which aim to stand
their ground with respect to the above criteria. All three apply the same approach to statistical cluster
analysis and target the NACE 2-digit level of industry disaggregation, comprising both the
manufacturing and the services sectors. The two previous papers focused on the sectoral
characteristics of educational intensity (Peneder, 2007b) and firm demography (Peneder, 2008). None
of them offered the opportunity to investigate the interlinkages between firm-level variety and sectoral
contingencies, which is unique to the research pursued in this paper.
The research plan comprises three consecutive parts. In the first stage, we focus on heterogeneity
among firms. Characterising firm types with respect to innovation behaviour, we take on two
analytical themes that appear in distinct strands of economic literature. One emphasis is on
entrepreneurship, where we distinguish different ways of how firms pursue opportunities to make a
profit and which relate to innovation in varying kinds and degree. Another emphasis is on
technological regimes, which highlight intrinsic differences in the knowledge environment between
sectors that are supposed to constrain available options for firm behaviour (Malerba and Orsenigo,
1993). Each subsection begins with a brief theoretical discussion and then explains the empirical

– 5 –
strategy for identifying firms to particular innovation types. In the second stage, we classify industries
by the relative distribution of the firm types previously identified. In contrast to the direct
categorisation of firms by means of specific rules of identification derived from the theoretical
literature, we now ‘let the data speak’ and apply statistical cluster algorithms to detect the structural
differences between sectors. In the final stage, we validate the new taxonomies and test for their
discriminatory power, first in terms of the distribution of firm types within sector classes, and then by
applying them to a set of panel regressions explaining the sectoral growth of labour productivity.
While the former demonstrate the simultaneous interplay between firm heterogeneity and sector
contingencies, the latter provides an illustrative example for the general usefulness of the new
taxonomy in applied empirical research.
The new classifications are based upon the micro-data of the Third Community Innovation Survey
(CIS3), which was made available by Eurostat through its newly established Safe Center. These data
cover the innovation activities of more than 78,000 firms from 22 European countries over the period
1998 to 2000.1 For the purpose of this study, the major advantage of the CIS database is its very
detailed account of variables on innovation behaviour. Another strength is the use of a stratified
sample of companies. While the sampling rates differ across countries, the stratification by size-class
and sector of activity should ensure that the samples are representative. Conversely, one major
disadvantage of the CIS surveys is the lack of time-series, which means that researchers only have
access to cross sectional information and are not allowed to analyse different waves of the survey
within a joint panel design. More generally, one must also be prepared to find a considerable amount
of unsystematic noise in the individual data, especially with respect to questions, for which it is
difficult to define any general objective criteria for assessment.
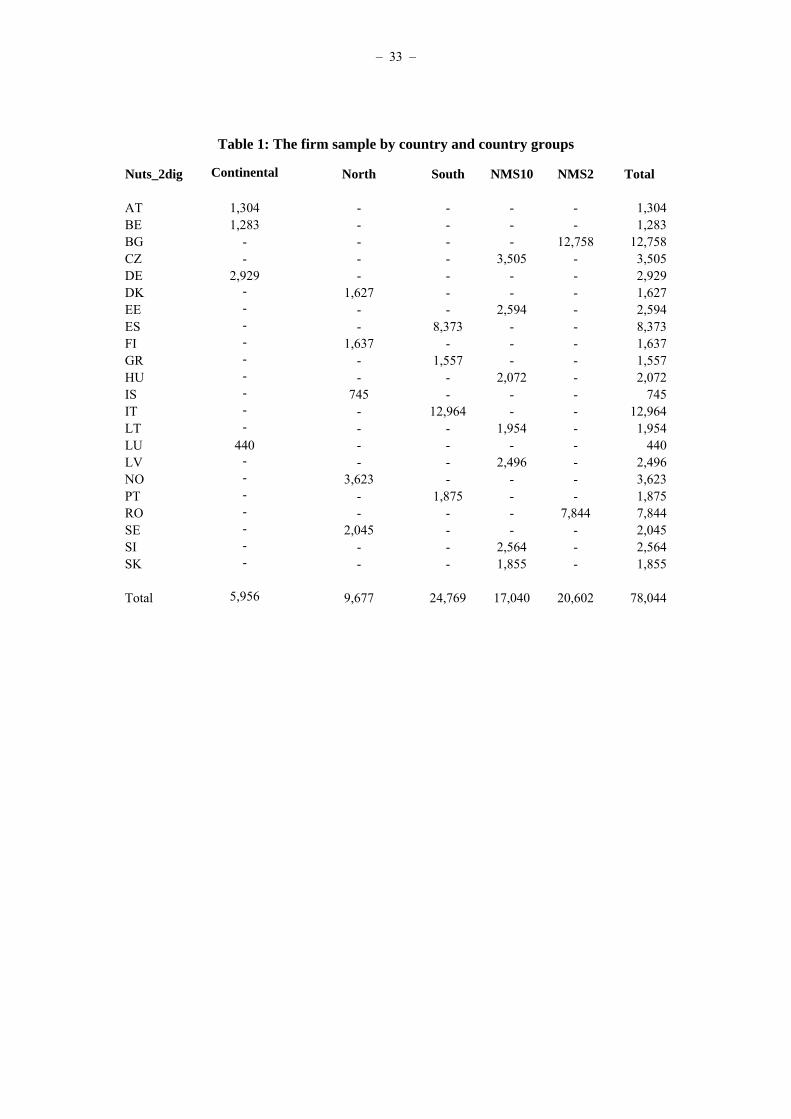
In order to increase the sample sizes per sector and render our sectoral results more robust, we
aggregate the data by broad country groups in the second stage of the classification process. We

– 6 –
thereby distinguish between (i) Continental Europe (Austria, Belgium, Germany, and Luxembourg);
(ii) Northern Europe (Denmark, Finland, Iceland, Norway and Sweden); (iii) Southern Europe
(Greece, Italy, Spain and Portugal); (iv) NMS10 (the Czech Republic, Estonia, Latvia, Lithuania,
Hungary, the Slovak Republic, and Slovenia - i.e. the new EU member states from the first wave of
eastern expansion); and finally (v) NMS2 (Bulgaria and Romania, which represent the latest wave of
accession countries). Table 1 reports the sample sizes by country and country groups.
{Insert Table 1: The firm sample by country and country groups}
The remainder of this paper is organised according to the three stages of research as sketched above.
Section 2 explains the theoretical rationales and rules for the empirical identification of innovation
types at the firm-level. Section 3 discusses the statistical cluster analysis and presents the new sectoral
taxonomies. Section 4 validates the final cluster solutions, while Section 5 summarises and concludes.
2. Identification of firm types
2.1 Entrepreneurship
Despite the variety of theories and definitions, a common emphasis on opportunity seeking behaviour
has emerged as the core element in most of the contemporary literature on entrepreneurship. For
example, we find that in the widely used textbook by Sahlman et al. (1999, p. 7), where
entrepreneurship is defined as ‘the pursuit of opportunity without regard to resources currently
controlled’. Similarly, Venkataraman (1997, p. 120) states that ‘entrepreneurship as a scholarly field
seeks to understand how opportunities to bring into existence “future” goods and services are
discovered, created, and exploited, by whom, and with what consequences’. Further elaborating this
approach, Shane and Eckhardt (2003, p. 165) define entrepreneurial opportunities ‘as situations in
1 We use the third survey (CIS3) because it is the most recent one for which the EUROSTAT Safe Center has cleared access
to firm-level data.

– 7 –
which new goods, services, raw materials, markets and organising methods can be introduced through
the formation of new means, ends, or means-ends relationships.’ However, establishing a more
specific relationship between entrepreneurship and innovation behaviour can best be achieved through
distinguishing three functions, which are heralded in different strands of the literature, namely the
Austrian theory of market co-ordination, the human capital theory of imitative entrepreneurship, and
the Schumpeterian theory of endogenous innovation (see Peneder, 2006).
Market co-ordination
The modern concept of entrepreneurial competition as an opportunity seeking discovery process has
its origins in the Austrian school of economics, which progressively developed the idea of the
informational function of market prices and the related entrepreneurial task of processing information
about the conditions of demand and supply. Hayek (1945, 1978), in particular, explained how the
competitive process stimulates the discovery of profit opportunities through the information revealed
by movements in the price system. It is the entrepreneurial discovery of variations in prices that incites
a business owner to increase supply where shortages of a particular commodity are most severe. The
same entrepreneurial alertness to price signals causes continuous adjustments in the allocation of
resources between competing uses (Kirzner, 1997). In other words, entrepreneurs enhance the process
of market co-ordination, but otherwise have no specific connections to innovation activities per se.
Technology adoption
An alternative perspective was championed by the founder of human capital theory, Theodore Schultz
(1975), who highlights the entrepreneurial function of enhancing efficiency through moves towards
the current technology frontier. This frontier is continuously upset by exogenous changes, for example
from publicly funded R&D or innovations produced in other sectors of the economy. Schultz thus
draws our attention to what we may call ‘imitative entrepreneurship’ and its importance for the
adoption and wide-spread diffusion of new technologies. Being mainly interested in the explanation of
occupational choices, Schultz postulates the ‘ability to deal with disequilibria’ as the distinguishing

– 8 –
personal characteristic of entrepreneurs. Arguing that this ability can be enhanced by education and
experience, he also emphasises the particular responsibility of educational policies.
Among later writers, Baumol (1993) stresses the role of entrepreneurial initiative in the process of
technology adoption. Within the strand of human capital theory, Schmitz (1989) builds strongly on the
notion of imitative entrepreneurship, assuming exogenous opportunities which continuously arise in
the form of disequilibria.
Endogenous innovation
Finally, the entrepreneurship theory by Joseph Schumpeter (1911, 1938) heads in a different direction
by stressing endogenous innovation as its defining characteristic. For Schumpeter (1911, 1938.
entrepreneurship is the particular economic function responsible for introducing novelty to the system
and thus driving economic change. Schumpeter consequently separates entrepreneurship from other
economic functions, which may or may not be fulfilled by the same individual, e.g. the capitalist
function (characterised by the ‘ownership of means’); management (the ‘administration of a going
concern’. or the inventor (who ‘produces ideas’). Each of these functions constitutes an analytically
separable source of income. Someone who is simultaneously an inventor, owner, and manager of a
business draws on all of them. The particular earnings that accrue to the entrepreneurial function are
the rents attributable to the (temporary) monopoly position established through successful innovation.
As is well known, Schumpeter distinguished five different kinds of innovation. For the purpose of the
current research, we will focus only on technological innovation by means of introducing either new
products or new processes, leaving aside the pursuit of new resources, new markets, or new forms of
industrial organisation.
Empirical implementation
To summarise, all three theories of entrepreneurship share a dynamic view of markets being
persistently out of equilibrium. However, the Austrian School and the theory developed by Theodore

– 9 –
Schultz focus on equilibrating tendencies caused by the entrepreneurial pursuit of profit opportunities
in response to exogenous disturbances, whereas Schumpeter championed a diametrically opposite
view, with the entrepreneur being the principal ‘agent of change’ (Audretsch, 1995) in the economy.
Apparently, each of the three economic functions of market co-ordination, technology diffusion, and
innovation originates in the entrepreneurial pursuit and exploitation of opportunities to make a profit.
Hence, they are all consistent with the aforementioned general behavioural definition of
entrepreneurship. Still they are fundamentally different. Following the terminology formulated by
Schumpeter (1947), endogenous innovation represents a ‘creative response‘, while market co-
ordination and technology adoption are two distinct forms of ‘adaptive response’ to the challenges
posed by a dynamic market environment.
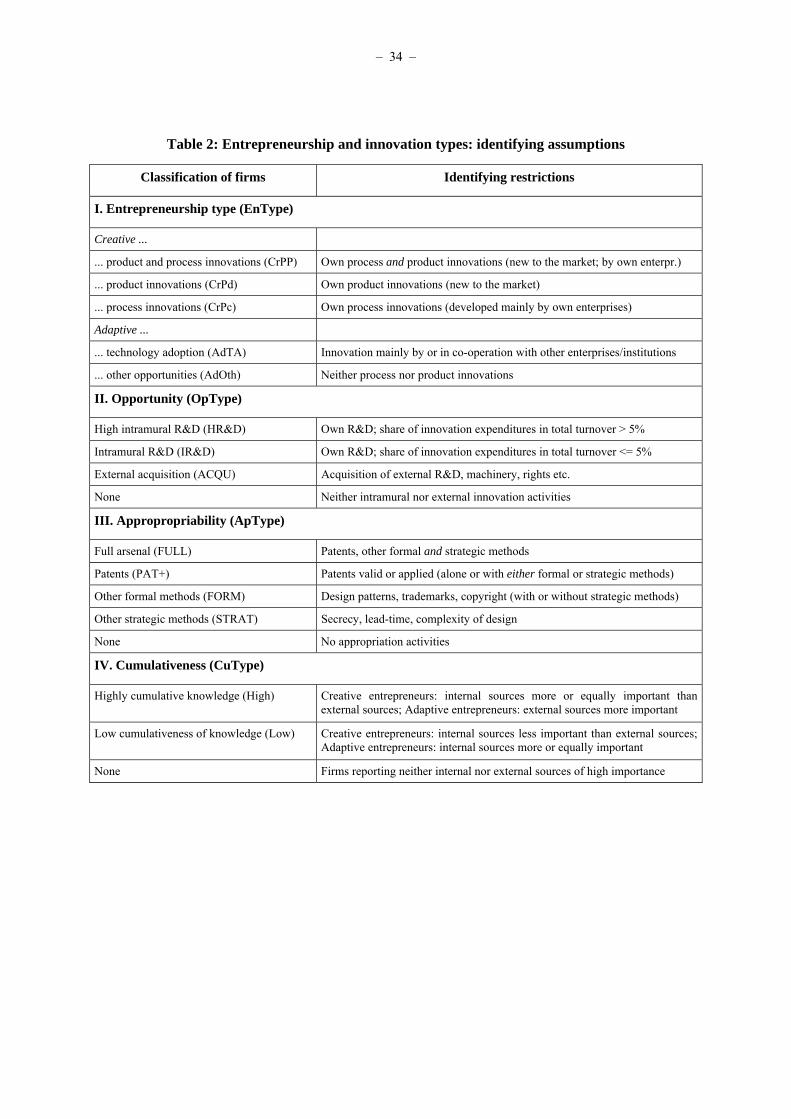
Based on these considerations, the empirical identification of different types of entrepreneurship
among the firms sampled in the European Community Innovation Survey turns out to be surprisingly
straightforward:
⎯ Creative entrepreneurs, as defined by Schumpeter, are characterised by own innovations. For
the purpose of this study, we further distinguish between firms performing either process
innovations, developed mainly by their own enterprise or enterprise group (CrPc), product
innovations that are new to the market (CrPd), or both (CrPP).
⎯ All other firms are characterised as adaptive entrepreneurs. Among them we further identify the
group of technology adopters (AdTA), which is motivated by Schultz’ entrepreneurship theory
and comprises firms that either record product innovations that are new to the firm, but not to
the market, or process innovations mainly in co-operation with other enterprises or institutions.
⎯ Finally, there is a large residual group of adaptive entrepreneurs that pursue opportunities other
than from technological innovation (AdOth). These may originate in pure market co-ordination
(in the sense of Hayek and Kirzner) as well as from non-technological innovations (e.g. in terms
– 10 –
of exploiting new resources, markets, or industrial organisation in the sense of Schumpeter’s
broader definition of innovation).2
2.2 Technological regimes
In contrast to the prevalent individualism of entrepreneurship theories, the concept of technological
regimes (Nelson and Winter, 1982; Winter, 1984; Malerba and Orsenigo, 1993) points at the intrinsic
differences between technologies, claiming that firms operating within the same regime are likely to
share some proximate organisational and behavioural features (Dosi and Malerba, 1996). In the words
of Winter (1984, p. 293)
“there are differences in a variety of related aspects, including such matters as the intrinsic ease or difficulty
of imitation, the number of distinguishable knowledge-bases relevant to a productive routine, the degree to
which successes in basic research translate easily into successes in applied research (and vice versa), the size
of the resource commitment typical of a ‘project’ and so forth. To characterise the key features of a particular
knowledge environment in these various respects is to define a ‘technological regime’.”
In the same year, Pavitt (1984) presented an empirical classification of ‘sectoral technological
trajectories‘, which classifies industries according to whether they can be characterised as being
‘science based’, ‘production intensive‘, or ‘supplier dominated‘, with the second group subdivided
further into ‘scale intensive production’ or ‘specialised suppliers‘. This classification proved extremely
influential and motivated numerous extensions and further refinements. Since the 1990s, the
availability of firm data from national innovation surveys induced several papers which relate to the
tradition of the Pavitt classification, but are more critical of the presumed sectoral regularities in
innovation patterns. Rather than classifying industries or sectors, they focus on the distinct innovation
types observed at the firm level. Examples are Cesaratto and Mangano (1993), Arvanitis and
Hollenstein (1998), Hollenstein (2003), or Arundel and Hollanders (2004). Among sectoral
2 Forming classes which are mutually exclusive, the identification also requires a certain order among these rules. This
implies, for example, that firms which simultaneously adopt external technologies and generate their own innovations are

– 11 –
classifications in the tradition of Pavitt’s taxonomy, the most refined example is Marsili (2001). Other
notable examples are Evangelista (2000), who was probably the first to apply Pavitt’s approach to the
services industries, and deJong and Marsili (2006).
In contrast to most of the above examples, this paper departs from the endurable but well-worn trails
followed by Pavitt (1984). Instead, the focus is on the theoretical concept of technological regimes as
introduced by Malerba and Orsenigo (1993). They characterise technological regimes very specifically
in terms of opportunity, appropriability, and cumulativeness, the combination of which defines the
knowledge and learning environment within which a firm operates. Abstract as these concepts may
appear, the following arguments demonstrate the possibility of relating them to the empirical data
available from the CIS surveys. Table 2 summarises the rules for identifying the new firm-level types.
{Insert Table 2: Entrepreneurship and innovation types: identifying assumptions}
Opportunity
Beginning with ‘opportunity conditions’, Malerba and Orsenigo (1993, p. 48) explain that these
“reflect the ease of innovating for any given amount of money invested in research.” But how can we
empirically identify opportunity conditions? One tempting choice would be measures of innovation
success. One example of such a variable available in the Community Innovation Survey is the share of
new products in a firm’s total turnover. However, opportunity is not the same as success. It refers to
potential and not to actual realisation; this distinction is especially important under the conditions of
fundamental uncertainty prevalent in innovation processes. Instead, “technological opportunities
reflect the likelihood of innovating for any given amount of money invested in research” and thus
“provide powerful incentives for the undertaking of innovative activities” (Malerba and Orsenigo,
1993, p. 48).
classified within the group of creative entrepreneurs.
– 12 –
However, opportunities cannot be explained solely by technology. Opportunities relate to profit and
hence depend on the characteristics of demand. For instance, Sutton (1998) defines technological
opportunities in the context of an equilibrium model of market concentration as “the extent to which a
fragmented industry can be destabilized by the actions of a firm which outspends its many small rivals
on R&D. ... Hence it reflects both the patterns of technology and tastes and the nature of price
competition in the market” (Sutton, 1998, p. 70).3
We therefore indicate opportunities by providing data on the effort and resources invested in
innovation activity. While these efforts may either succeed or fail, dependent on capabilities,
exogenous shocks, or the accurateness of individual perceptions, they serve as the best proxies
available, indicating the opportunities from technological innovation as perceived by the market
participants. Using the CIS micro-data, we discriminate four firm types according to the perceived
technological opportunities revealed by the particular innovation activities:
⎯ None, if the firm undertakes neither intramural R&D nor any purchase of external innovations;
⎯ Acquisitions (ACQU), if the firm innovates only by means of purchasing external R&D,
machinery, or rights (patents, trademarks, etc.);
⎯ Intramural R&D (IR&D), if the firm undertakes its own R&D, but the ratio of innovation
expenditures to total turnover is less than five per cent; and finally
⎯ High R&D (HR&D), if the firm reports intramural R&D and a share of innovation expenditures
in total turnover of more than 5 per cent.
Appropriability
Quoting Malerba and Orsenigo (1993, p. 48), appropriability conditions “summarise the possibilities
of protecting innovations from imitation and of extracting profits.” Firms have a number of formal and
3 Sutton (1998) depicts this general opportunity condition as the ‘alpha-coefficient’ and the aforementioned ease of
innovation (i.e. an elasticity relating R&D expenditures to product quality) as the ‘beta-coefficient’.
– 13 –
informal means at hand with which they can protect their innovations. But depending on the particular
nature of the knowledge to be protected (i.e. its complexity, tacitness, etc.), the precise institutional
arrangements (e.g. patent laws) or industrial organisation (such as the degree of vertical or horizontal
integration), only few, if any, might be truly effective for an entrepreneur’s specific innovation.
The CIS offers a comprehensive set of tools in the questionnaire, among which we use the following
rules of identification to separate firms according to their appropriability regime:
⎯ None if firms apply neither of the tools for appropriation;
⎯ Strategic (STRAT) if firms rely exclusively on either secrecy, complexity of design, or lead-
time advantage to protect their innovations;
⎯ Formal means other than patents (FORM), if firms use the registration of design patterns,
trademarks, or copyright;
⎯ Patents (PAT+) if these are applied (with or without either strategic or other formal means), and
finally
⎯ Full arsenal (FULL) if firms simultaneously use all the three methods of protection.4
Cumulativeness
Our third characterisation of technological regimes regards the degree of cumulativeness of knowledge
as experienced by the individual firm. The question therefore is, to what extent a firm’s ability to
create new knowledge depends on the stock of knowledge it has already acquired. Cumulativeness is
high if firms with a head start can more easily add to their existing stock of knowledge than
technological laggards, and thus create first mover advantages. It therefore “denotes economic
4 Again it is necessary to impose certain priorities among the identification rules, so that the firm types become mutually
exclusive. For example, the use of patents overrules any other means, except the simultaneous use of all three categories.
Similarly, other formal methods overrule strategic methods.

– 14 –
environments characterised by increasing returns” to knowledge creation (Malerba and Orsenigo,
1993, p.49).5
Given the rather abstract nature of the concept, the CIS does not provide any direct measure of
cumulativeness. However, we pursue an indirect identification, combining two aspects which are
covered by the CIS. First, we distinguish according to the relative importance of internal vs. external
sources of information. Second, we apply opposite rules of identification depending on whether the
firm appears to be a technological leader or follower.
⎯ If a firm that was characterised as a ‘creative entrepreneur’ in Section 2.1, reports that internal
sources of knowledge are more or at least as important as external sources, we infer that it
operates under a regime of high cumulativeness. For the firms belonging to the type of ‘adaptive
entrepreneurship’, we reverse the rule. We consider their knowledge environment to be highly
cumulative, if they report that internal sources of information for innovation are less important
than external ones.
⎯ Conversely, we identify cumulativeness to be low, if a ‘creative’ firm sources more information
for its innovations from external than from internal sources, or if an ‘adaptive’ firm reports that
internal sources are more or at least as important than external sources.
While these rules may seem rather complex at first sight, they follow from one straightforward
consideration. If knowledge is highly cumulative, creative entrepreneurs, whom we presume to be
closer to the technological frontier, will more heavily rely on their own sources of information due to
increasing returns of own knowledge generation. Conversely, adaptive entrepreneurs, who presumably
are more distant from the technological frontier, will have to acquire knowledge for their innovation
activities from external sources. The reason is that their lower stock of accumulated knowledge
5 Cumulativeness and appropriability conditions are related, but nevertheless different concepts. Consider, e.g., how
appropriability conditions feature prominently in static welfare analysis (external effects. whereas cumulativeness refers to
dynamic properties of a system, such as path dependence and lock-in effects.

– 15 –
reduces their chances to succeed by own R&D. However, when creative firms operate within a regime
of low cumulativeness, the lack of increasing returns to own knowledge creation implies a stronger
need to source external knowledge in order to stay at the technological frontier. At the same time, the
internal creation of knowledge becomes a viable strategy for adaptive entrepreneurs, whose aim is to
catch-up and reduce the technology gap.
Interrelationships among firm types
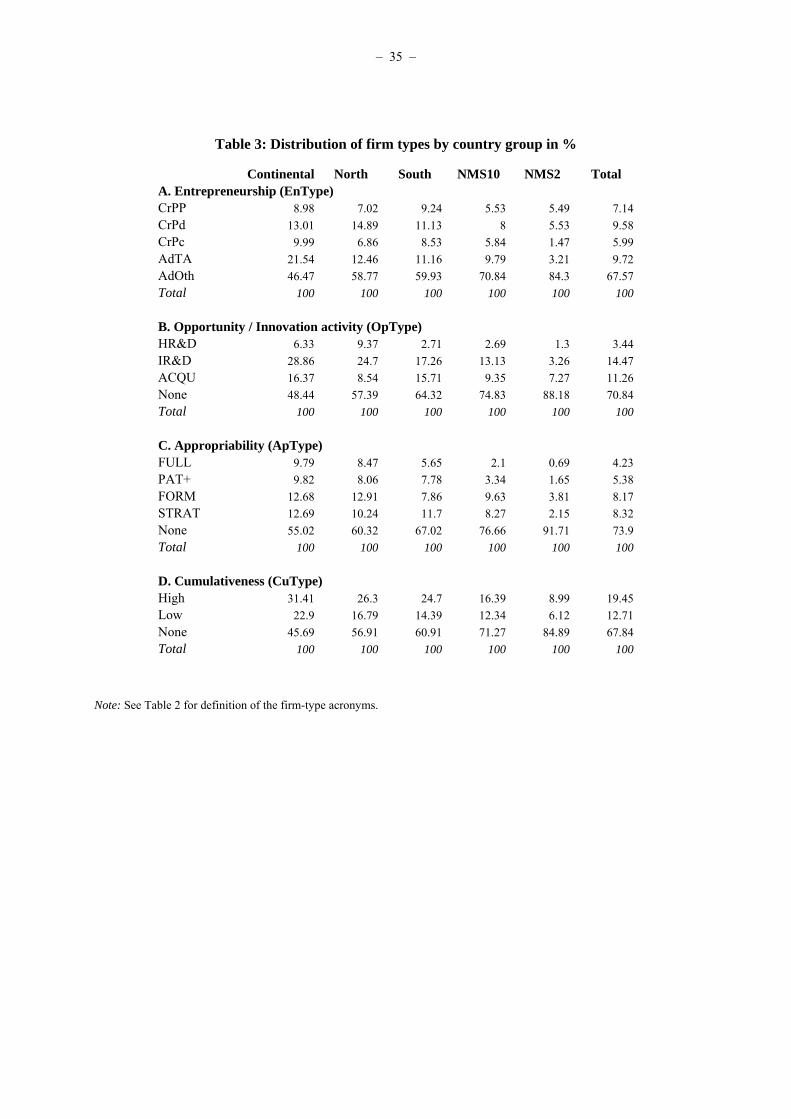
It is apparent from the above discussion that the various dimensions are interrelated. Table 3 therefore
provides additional detail on the pairwise co-identification of firms in the different taxonomies.
Overall, the shared properties appear reasonable and consistent with a priori expectations. For
example, firms characterised as either intramural or even high R&D performers exhibit the highest
share of creative entrepreneurs doing product innovations. Conversely, firms that innovate primarily
through the acquisition of new technology exhibit the highest share of firms depicted as process
innovators or technology adopters. Similarly, the share of firms using patents is highest among
creative entrepreneurs, followed by technology adopters and finally the firms pursuing opportunities
other than from innovation. Also, the cumulativeness of knowledge is largest among creative
entrepreneurs and high R&D performers, whereas the share of firms operating within a regime of low
cumulativeness is largest among technology adopters and firms pursuing opportunities through the
acquisition of new technology.
{Insert Table 3: Distribution of firm types by country group in %}
In addition to this overall consistency of firm types, the crosstabulation also demonstrates that each
taxonomy represents an independent analytical dimension (as supposed, e.g., by the received theory on
technological regimes). Neither classification is redundant in the sense that it could be replaced by one
of the others. In every instance except one, we see that firms belonging to the same class of a certain
taxonomy are distributed among different classes in the other. The only exception is the largely
– 16 –
overlapping group of non-innovating firms, which is consistently comprised of an almost identical set
of firms in each of the classifications.
Finally, Table 4 compares the share of firm types with respect to the five broad country groups. In
addition to the considerable heterogeneity between countries, the table displays a consistent
congruence in the relative importance of firm types that relate to ‘more innovativeness’ with higher
levels of economic development (e.g., GDP per capita). For example, we find considerably higher
shares of creative entrepreneurs in the Continental and Northern European countries than in the
NMS10 and NMS2. The same applies to the shares of high R&D performers and firms using the full
arsenal of appropriation methods. In contrast, the share of firms, to which neither internal nor external
sources of information for innovation are important is highest in the NMS2, followed by NMS10, the
South, North and Continental Europe.
{Insert Table 4: Crosstabulation of firm types (shares in %)}
3. The sector taxonomies
For the identification of the sectoral taxonomies, we apply statistical cluster analysis, which is defined
as “the art of finding groups in data” such that the degree of natural association is high among
members within the same class and low between members of different categories (Kaufmann and
Rousseuw, 1990). The clustering procedure starts with a given data matrix of i = 1, ..., n observations
for which characteristic attributes x are reported for j = 1, ..., p variables. The discriminatory variables
are the standardised shares of the various firm types in the overall firm population of a sector. The
shares are aggregated by four broad country groups (Continental and North, South, NMS10, and
NMS2). Each sector per region is treated as an independent observation, thereby creating independent
taxonomies for each country group in addition to the synthesis of a common ‘consensus’ classification
(Gordon, 1999).

– 17 –
The initial data set of the dimension n x p is transformed into a symmetric (dis)similarity matrix of
dimensions n x n observations with dih being the coefficients of (dis)similarity for observations xi and
xh.
(1)
⎥⎥⎥⎥⎥⎥⎥⎥⎥
⎦
⎤
⎢⎢⎢⎢⎢⎢⎢⎢⎢
⎣
⎡
=
− 0
0
...
...
...
...0...0
...0
)1(21
3231
21
,
M
M
MM
nn
ih
nn
nn
d
d
dd
ddd
D
For any observations xi , xh and xg with i, h, and g = 1, ..., n, located within measurement space E, the
desired formal properties of the (dis)similarity matrix Dnn are defined as follows (Anderberg, 1973):
1. dih = 0 if and only if xi = xh, i.e. for all observations the distance from itself is zero and any two
observations with zero distance are identical;
2. dih >= 0, i.e. all distances are non-negative;
3. dih = dhi, i.e. all distances are symmetric; and finally
4. dih <= dig + dhg, known as the triangle inequality, which states that going directly from xi to xh is
shorter than making a detour over object xg.
The combination of the first and second properties assures that Dnn is fully specified by its values in
the lower triangle. The fourth property establishes that E is an Euclidean space and that we can
correctly interpret distances by applying elementary geometry. Any dissimilarity function that fulfils
the above four conditions is said to be a metric.
The cluster analysis is proceeded by a two-step approach which combines k-means and agglomerative
hierarchical methods. The k-means method produces a first partition, which reduces the large initial

– 18 –
data sets, so they can be used more effectively in the second step of hierarchical clustering.6 The k-
means method also has the advantage that the initial case assignments remain reversible during the
course of iterations. In this first step, we use the Euclidean distance eih, which is a direct application of
the Pythagorean Theorem and has the advantage of separating outliers particularly well:
(2) ∑=
−=p
jhjijih xxeuc
1
2)( ∞<≤ iheuc0
For the purpose of further refinement, the resulting cluster centers are redefined as objects for the
subsequent agglomeration method, which provides a more detailed hierarchical representation. For
this final identification, we use the Angular Separation measure angih, which has the particular
advantage of focusing on differences in the shape of the sector profiles, while remaining sensitive to
size displacements:
(3)
∑ ∑
∑
= =
==p
j
p
jhjij
p
jhjij
ih
xx
xxang
1 1
22
1 0,10,1 ≤≤− ihang
The cluster dendrograms in Figure 1 illustrate the outcome of the hierarchical clustering. The branches
on the bottom of the charts represent the clusters which resulted from the first k-means algorithm,
while the root on top represents the entire set of objects. As we move upwards on the chart, the degree
of association between objects is higher, the sooner they are connected by a common root. Conversely,
objects or groups are the more dissimilar, the longer they remain disconnected.
{Insert Figure 1: Dendrograms for Average Linkage Method and Angular Separation Measure of
Similarity }
6 For determining the initial number of partitions k, we consistently apply the following self-binding rule-of-thumb: “Choose
the lowest number k that maximizes the quantity of individual clusters l which include more than 5% of the observed cases“
(see Peneder, 2001).

– 19 –
The resulting sectoral taxonomies for each country group are documented in Table A.1 to A.4 in the
Annex. They demonstrate a certain degree of heterogeneity among the country groups and are
therefore the more accurate tools, e.g. when applied to datasets specific to these countries. For
identifying the joint consensus classification, we choose the most frequent characterisation of a sector.
Only in cases when two different types occur with the same frequency, do we give priority to the
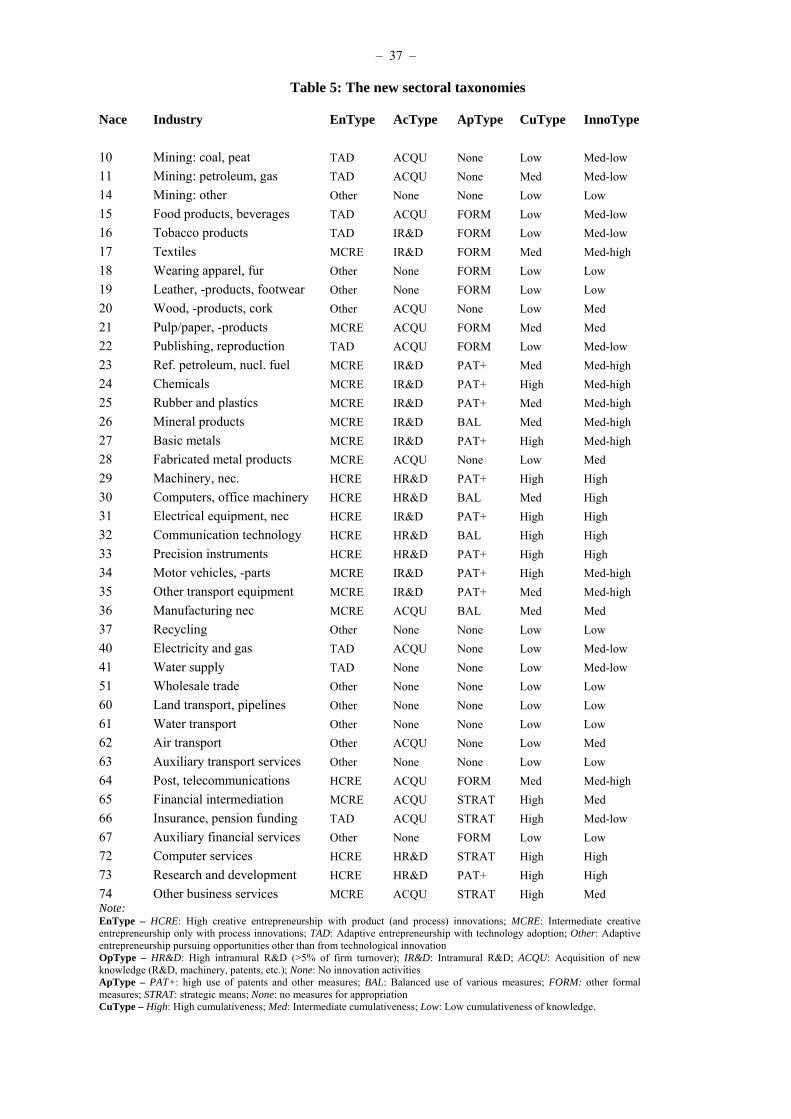
characterisation as identified for the country group ‘Continental/North’. Table 5 summarises the final
consensus classifications for each of the four resulting taxonomies.
{Insert Table 5: The new sectoral taxonomies}
Finally, Table 5 presents another sectoral classification (InnoType) which aims to summarise the
‘relative innovation intensity’ inherent in the characterisation of the other taxonomies. It is important
to understand that this final taxonomy is not meant to be the culmination of the others. It rather
represents a simplification that might be useful for some applied analyses, by drawing attention to the
general ‘innovativeness’ of sectors without necessarily invoking the abstract and relatively theory-
loaded interpretation of the four original sector classifications.
Even though the respective labels depict only the characteristic most pronounced in the firm
distribution, one must always acknowledge the heterogeneity within each sector group. To summarise,
this final taxonomy comprises the following types:
⎯ High innovation intensity: Sectors are characterised by a high share of creative entrepreneurship
focused on product innovations (either alone or in combination with process innovations) and
many firms performing high intramural R&D. Typically, the appropriability regime depends on
the use of patents (frequently applied together with other measures) and knowledge is highly
cumulative. This group is mainly comprised of ICT-related sectors such as computers and office
machinery, electrical equipment, communication technology, precision instruments, and
computer related services. Other sectors within this group are machinery and R&D services.

– 20 –
⎯ Intermediate-to-high innovation intensity: This group is comprised of sectors with an
intermediate share of creative entrepreneurship mostly involved in process innovations, and
many firms performing R&D, albeit less than 5% of turnover. Cumulativeness of knowledge is
high or intermediate and patents are frequently used for appropriation. Examples are chemicals,
motor vehicles, other transport equipment, or telecommunication and postal services. The latter
is distinctly characterised by high creative entrepreneurship with product innovations in
combination with a strong dependence on the external acquisition of new technology.
⎯ Intermediate innovation intensity: This group is the most heterogeneous of classes, but all
sectors share a large number of firms pursuing opportunities through the acquisition of external
innovations. Accordingly, appropriability measures are relatively weak, with some importance
ascribed to strategic means. In this group we find wood and wood products, pulp and paper,
metal products, as well as air transport, financial intermediation and other business services.
⎯ Intermediate-to-low innovation intensity: The main characteristic of this group is the high share
of adaptive entrepreneurship, pursuing opportunities through the adoption of new technology.
Accordingly, the prevalent mode of innovation activity is the acquisition of new technology.
Appropriability conditions are generally weak and the cumulativeness of knowledge is low.
Examples are the food sector, publishing and reproduction, electricity and gas, or insurance and
pension funding.
⎯ Low innovation intensity: Finally, this relatively homogenous group is characterised by a
predominance of entrepreneurs pursuing opportunities other than from new technologies,
typically performing no innovation activities nor applying any measures for appropriation. The
cumulativeness of knowledge is low or irrelevant, since no information regarding innovations is
pursued. Examples are wearing apparel, leather products, recycling, as well as wholesale trade
and land and water transport.

– 21 –
4. Cluster validation
4.1 The distribution of firm types within sector classes
For the purpose of cluster validation, the boxplots in Figure 2 and Figure A.1 (in the Annex) provide
us with an integrated view, displaying the differences in the shape and dispersion of firm types
between the various sector types. The boxplots are also evidence of the degree of discrimination
between the different categories and allow us to assess the accurateness of our interpretation. The
charts are easy to read. The box itself comprises the middle 50 percent of observations. The line within
the box is the median. The lower end of the box signifies the first quartile, while the upper end of the
box corresponds to the third quartile. In addition, the lowest and the highest lines outside the box
indicate the minimum and maximum values, respectively.
The charts in Figure A.1 (in the Annex) document the distribution of firm types within their own
respective sector classifications. They best summarise the integrated perspective of firm-type variety
together with systematic differences between sector-types. For instance, the first chart in Panel A
reveals a distinctive descending order in the standardised value of the share of creative entrepreneurs
doing product innovation for the different categories of the EnType classification. Consistently, we
find an opposite ascending order with respect to the industry shares of non-innovating firms. In
contrast, firms classified as pure process innovators or technology adopters are more evenly spread
across the sector types. A different pattern applies to opportunity conditions (Panel B), where the share
of firms classified as high R&D performers is extremely concentrated among a few sectors. For
appropriability conditions (Panel C), the share of firms applying patents to protect their innovations
peaks in the according class of sectors, and then decreases continuously. Finally, with respect to
cumulativeness (Panel D), the boxplots exhibit a pronounced descending order for the share of firms
operating within a knowledge environment characterised by high cumulativeness, a moderate
descending order for the share of firms subject to low cumulativeness of knowledge, and a strictly
rising order for the share of firms reporting no sources of information for innovation.
– 22 –
The boxplots in Figure 2 provide a similar window, but spot the main features of the distribution of
firms classified according to the four initial firm level taxonomies across the categories formed in the
final sectoral classification of innovation intensity (InnoType). For example, we find an almost linear
positive association between the degree of innovativeness in the sector and the share of firms
characterised as creative entrepreneurs, carrying out product innovations (Panel A.a), firms applying
patents (Panel C.a), and firms experiencing a high cumulativeness of knowledge (Panel D.a). In
contrast, firms pursuing opportunities by means of high R&D expenditures are extremely concentrated
among the sectors classified as highly innovative (Panel B.a). The share of firms pursuing
opportunities through the acquisition of new technology peaks in the categories of intermediate and
intermediate-to-low innovativeness (Panel B.b). The share of firms applying only strategic measures
for appropriation is relatively evenly spread across the distinct sector classes (Panel C.b). Finally, the
figures reveal consistent negative associations with respect to the share of entrepreneurs pursuing
opportunities other than in innovation (Panel A.b) and for firms operating with more or less common
knowledge about their technologies (Panel D.b).
{Insert Figure 2: Distribution of selected firm types by the InnoType sector classification}
4.2 Labour productivity growth
In this section, we want to put the new sector classification of innovation intensity (InnoType) to a
final test by applying its classes as explanatory variables within a joint set of panel regressions, while
the sectoral growth of labour productivity is implemented as a dependent variable. In contrast to the
previous boxplots, this is not a validation in its strict sense. Since the clustering procedure was not
aiming at grouping industries according to their productivity performance, one cannot judge the
quality of the classification process dependent on this outcome. However, by testing whether the new
taxonomy exerts a significant and robust impact within a joint and reasonable econometric model, we
aim to demonstrate its usefulness for further empirical analyses.

– 23 –
More specifically, we ask whether sectors characterised by a distinct innovation intensity differ in
their contributions to the average growth of labour productivity. It is for this purpose that we build a
two-way data panel made up of sectors i in countries j as independent observations, while all
performance variables refer to average values over the period 1995 to 2004. The econometric model
thus estimates the impact of k sector types, n additional control variables x, and the fixed country
effects j on the performance variable yij:
(4) ijj
nnnkkij xInnoTypecy εγβα ++++= ∑
In the baseline specification, the fixed country effects control for all constant differences between
countries that are not captured by the other explanatory variables. Among the control variables x, we
include in each of the estimated models the logarithm of the sector’s initial level of labour productivity
in 1995 to control for catching-up effects. We further take into account differences in capital intensity,
by including the mean and log change of the share of capital in total factor income.
For a number of other explanatory variables, multicollinearity and the additional loss of observations
bars us from including all of them within one integrated model. We therefore apply separate
specifications to test how robust the growth impact of the InnoType taxonomy is to the inclusion of
the share of information and communication technologies (ICT) in total capital income, the average
share of high-skilled labour in total hours worked, firm turnover (as a proxy for ‘creative destruction’),
average firm size, the average Herfindahl-Hirschman concentration index (HHI), or measures of
export openness and import penetration.
All the three performance measures, as well as those on (ICT) capital and high-skill labour inputs, are
extracted from the EU KLEMS database of sectoral accounts for productivity analysis (see O’Mahony,
Rincon-Aznar, and Robinson, 2008).7 The control variables on firm turnover, average firm size and
market concentration are based on Eurostat’s Structural Business Statistics (see Hölzl and Reinstaller,

– 24 –
2008). The data on export and import openness originate in the UN Comtrade database (see Sieber and
Porto, 2008).
With the exception of the average capital share in factor income and the average firm size, all the
variables are expressed in logarithm. We generally expect the control variables x to be ‘growth
drivers’ with an accordingly positive coefficient in the estimations. Two exceptions are the initial level
of labour productivity and industry concentration. Considering them to be ‘growth barriers’, we expect
negative signs. Another exception is average firm size, where we find no strong a priori reasoning for
either a positive or negative impact.
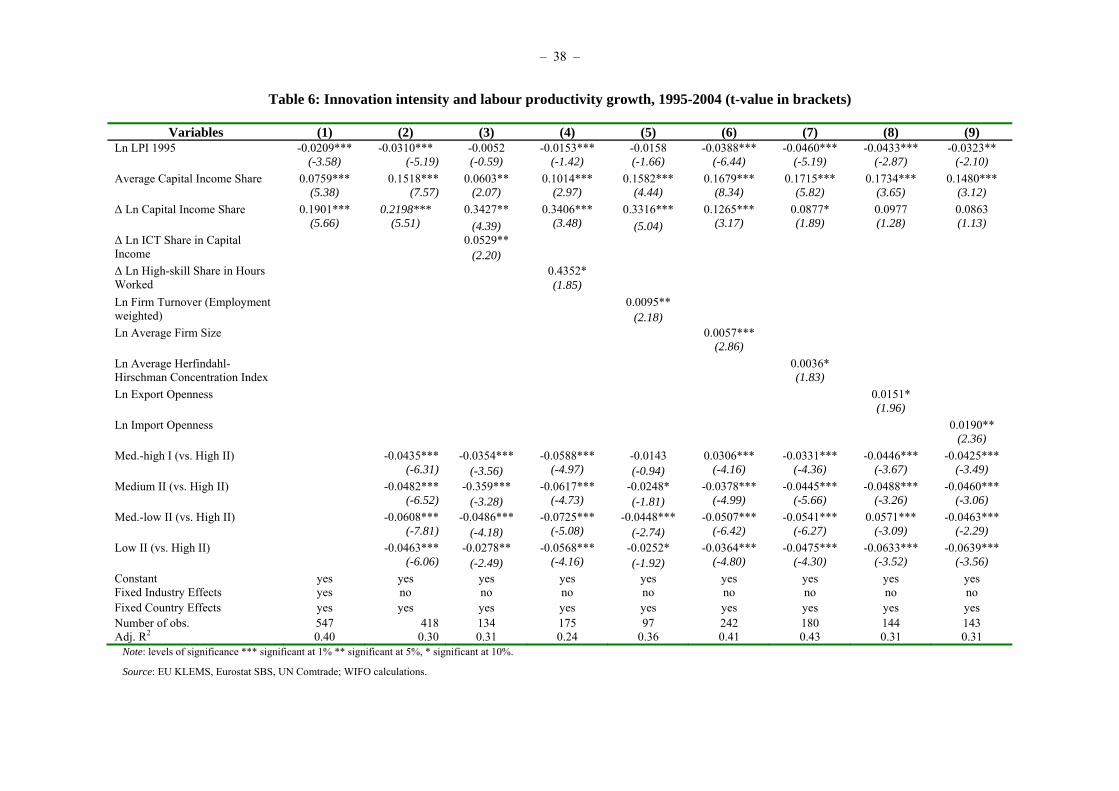
Table 6 reports the estimation results. To begin with, specifications (1) and (2) compare two
alternative baseline models. The first model is with fixed industry effects for each NACE 2-digit
sector, while the second replaces them with the new sectoral taxonomy (InnoType). The overall
variation explained by the model is of course higher when we use fixed industry effects, because of the
larger number of dummy variables. All coefficients for the industry-type dummies need to be
interpreted relative to the group of sectors with a ‘high innovation intensity’, which is used for a
comparative control.
In short, the estimates show a significant positive but not necessarily linear relationship between an
industry’s innovation intensity and labour productivity growth. It is in particular the group of sectors
classified as ‘highly innovative’ which consistently outperforms the others. In contrast, the sectors
characterised by an ‘intermediate-to-low innovation intensity’ often perform worse than those
classified in the group with ‘low innovation intensity’. This indicates that the sectors with the lowest
innovation intensity are capable of exploiting opportunities from sources other than technological
innovation in order to expand demand and output.
{Insert Table 6: Innovation intensity and labour productivity growth, 1995-2004 (t-value in brackets)}
7 For further information, data access and a detailed methodological description see Timmer, O’Mahony and van Ark (2007)
available at http://www.euklems.net.
– 25 –
Apart from offering a deliberate economic interpretation, another advantage of applying the sectoral
taxonomy in place of the fixed industry effects is the considerable degrees of freedom thus saved.
These pay off, when the baseline model is extended by the other independent variables in the
specifications (3) to (9). Being significant and displaying the expected impact on sectoral growth, the
additional control variables live up to expectations. The pleasant surprise, however, is that the
InnoTypes prove to be extremely robust to the inclusion of these additional control variables. Not only
are the coefficients significant across a wide range of different model specifications, also they exhibit
identical signs and relatively small variations in size.
5. Summary and conclusions
This paper presents an integrated set of taxonomies of firms and sectors and focuses on the distinction
between creative and adaptive entrepreneurship, as well as the varying kinds and degree of
technological opportunities, appropriability conditions and cumulativeness of knowledge. The new
taxonomies are built from the micro-data of the Third Community Innovation Survey (CIS3) and
cover 22 European countries.
The analysis proceeded in three stages: It first classified individual firms according to selected
innovation characteristics, which are based on rationales derived from entrepreneurship theory and the
literature on technological regimes. In the second stage, the paper characterised NACE 2-digit
industries by means of standardised shares of the respective firm types and then applied statistical
cluster techniques to derive the respective sectoral taxonomies. In the third stage, boxplot charts and
panel growth regressions validated the new classifications. The former provides a window through
which we can glance at the distribution of firm types within sector classes, while the latter proves that
the innovation intensity of a sector does have a significant impact on labour productivity growth.
In short, the new classification system offers three major strengths:
– 26 –
⎯ First, the taxonomies combine an explicit theoretic rationale together with the use of statistical
tools for final identification. The theoretic motivation makes the results contestable and eases
further progress through cumulative improvements. In addition, the new types can be used as
discriminatory variables in empirical tests of hypotheses received from the literature. The
additional use of statistical cluster techniques has the advantage of letting the data draw the
boundaries between sector groups. This reduces the scope of exogenous intervention and fosters
the credibility of the final results.8
⎯ A second major strength is the joint classification of firms and industries. Apart from extending
the theoretic motivation from the firm to the sector level, the new sector types are identified by
the distribution of firms (and not, e.g., by an industry average that may be misinterpreted as
being representative). This eases the apparent tension between firm variety and sector
contingencies. For example, the frequently cited observation of a highly innovative firm within
an industry characterised by low innovativeness (or vice versa, an imitating firm competing
successfully in an industry with much creative entrepreneurship) does no longer contradict or
compromise the validity of the sector type. While it is true that such firms are situated outside
the mode of the distribution, they nevertheless are part of it and can be particularly interesting
cases to study (see, e.g., von Tunzelmann and Acha, 2005).
⎯ Finally, the new taxonomies apply to both manufacturing and the services sectors, treating them
within a joint analytical framework.
Nevertheless, one must stress that this paper is only an early travelogue on the longer road before us.
Among others, future research will have to explore and advance along the following directions:
⎯ First, we need to extend the analysis to additional aspects of innovation behaviour, such as
organisational change, or modes of co-operation and networking. For example, the focus on
8 A direct theoretical rationale seemed more appropriate with respect to micro-behaviour, and we therefore did not apply statistical cluster analysis for the identification of firm types. Using their share as the input for the statistical clustering of sectors, this had the additional

– 27 –
technological innovation in the current attempt may put the services sectors at a certain
disadvantage in terms of their attributed degree of ‘innovativeness’. If that is true, one will
ultimately need new or more precise analytical categories that better capture the nature of
innovation in services.
⎯ Second, starting from the micro-data, the approach allows us to increase the degree of
disaggregation, e.g., to the level of NACE 3-digit industries. However, one must be careful
about small sample sizes, which are likely to affect the robustness of the results.
⎯ Third, it would be desirable to further extend the number of observations. For example, in order
to test the robustness of the sector types over time, the analysis should be updated as soon as
Eurostat clears the micro-data for the recent waves of the CIS. Also, several important countries
such as France and the UK are missing from the Eurostat files. One can only hope that these
data are also cleared by the national statistical institutes, in which case they can be included and
clustered jointly with the other European countries.
Acknowledgements
I gratefully acknowledge financial support from the European Commission’s EU KLEMS and
InnoWatch (Systematic) projects. I am particularly indebted to Sergiu Parvan, who supported and very
efficiently managed my stay at the Safe Center at Eurostat. Special thanks are also due to Lucia
Glinsner and Klaus Friesenbichler, who helped to prepare my visit there.
For the growth regressions presented in the final section, I am indebted to Mary O’Mahony, Ana
Rincon-Aznar, and Katherine Robinson for providing extractions from the EU KLEMS data on labour
productivity, as well as capital and labour inputs; to Werner Hölzl and Andreas Reinstaller for
allowing me to use their extractions and estimations on market structure and firm demography from
Eurostat’s Structural Business Statistics; and finally to Susanne Sieber and Maria Porto for making
advantage that the interpretation of the final industry classifications remained relatively straightforward. The exogenous rules for identification in the first stage had thus been necessary to allow for a precise interpretation of the final sector types.

– 28 –
accessible their extractions from the UN Comtrade database. Finally, the paper has benefited from
manifold constructive comments and suggestions, most notably by Werner Hölzl, Jürgen Janger,
Andreas Reinstaller, and Hugo Hollanders.
References
Acs, Z.J., Audretsch, D.B., 2003. Handbook of Entrepreneurship Research, Kluwer, Boston.
Anderberg, M.R., 1973. Cluster Analysis for Applications, Academic Press, New York.
Arvanitis, S., Hollenstein, H., 1998. Innovative Activity and Firm Characteristics – A Cluster Analysis with Firm-level Data
of Swiss Manufacturing, paper presented at the 25th Annual EARIE Conference, Copenhagen, August 27-30, 1998.
Arundel, A., Hollanders, H., 2004. European Innovation Scoreboard – EXIS: An Exploratory Approach to Innovation
Scoreboards, European Commission, Brussels.
Audretsch, D.B., 1995. Innovation and Industry Evolution, MIT Press, Cambridge MA.
Baumol, W.J., 1993. Entrepreneurship, Management, and the Structure of Payoffs, MIT Press, Cambridge MA.
Cesaratto, S., Mangano, S., 1993. Technological Profiles and Economic Performance in the Italian Manufacturing Sector,
Economics of Innovation and New Technology 2, 237-256.
de Jong, J.P.J, Marsili, O., 2006. The Fruit Flies of Innovations: A Taxonomy of Innovative Small Firms, Research Policy,
35 (2), 213-229.
Dosi, G., Malerba, F., (eds.), 1996. Organization and Strategy in the Evolution of the Enterprise, MacMillan, London.
Evangelista, R., 2000. Sectoral Patterns of Technological Change in Services, Economics of Innovation and New Technology
9, 183-221.
Gordon, A.D., 1999. Classification, 2nd ed., Chapman & Hall, Boca Raton.
Hatzichronoglou T., 1997. Revision of the High-Technology Sector and Product Classification. STI Working Papers, 2,
OECD, Paris.
Hayek, F.A., 1978. New Studies in Philosophy, Politics, Economics and the History of Ideas, Routledge, London.
Hayek, F.A., 1945. The Use of Knowledge in Society, American Economic Review 35, 519-530.

– 29 –
Hollenstein, H., 2003. Innovation modes in the Swiss service sector: A cluster analysis based on firm-level data. Research
Policy 32, 845-863.
Hölzl, W., Reinstaller, A., 2008. Market structure – sectoral indicators, in: Peneder et al., Sectoral Growth Drivers.
Kaufmann, L., Rousseuw, P.J., 1990. Finding Groups in Data. An Introduction to Cluster Analysis, Wiley, New York.
Kirzner I.M., 1997. Entrepreneurial Discovery and the Competitive Market Process: An Austrian Approach, Journal of
Economic Literature 35, 60-85.
Malerba, F. (2007. Innovation and the dynamics and evolution of industries: Progress and challenges, International Journal
of Industrial Organization 25, 675-699.
Malerba, F. (2004. Sectoral systems of innovation. Concepts, issues and analyses of six major sectors in Europe, Cambridge
University Press, Cambridge.
Malerba, F., Orsenigo, L. (1997. Technological regimes and sectoral patterns of innovative activities, Industrial and
Corporate Change 6, 83-117.
Malerba, F., Orsenigo, L., 1996. The dynamics and evolution of industries, Industrial and Corporate Change 5 (1), 51-87.
Malerba, F., Orsenigo, L., 1993. Technological regimes and firm behaviour, Industrial and Corporate Change 2 (1), 45-71.
Marsili, O., 2001. The Anatomy and Evolution of Industries. Technological Change and Industrial Dynamics, Edward Elgar:
Cheltenham.
Menger, C., 1871. Grundsätze der Volkswirtschaftslehre. 2nd edn. Vienna: Hölder-Pichler-Tempsky.
Mises, L., 1949. Human Action. A Treatise on Economics. London: William Hodge and Company.
Nelson, R.R., Winter, S.G., 1982. An Evolutionary Theory of Economic Change, Cambridge, Mass: Belknap Press.
O’Mahony, M., Rincon-Aznar, A., Robinson, C., 2008. Inputs to production, in: Peneder et al., Sectoral Growth Drivers.
Pavitt, K., 1984. Sectoral Patterns of Technical Change: Towards a Taxonomy and a Theory, Research Policy, 13 (6) 343-
373.
Peneder, M. (co-ordination), Apollonova N., Barrett, J.S., Donohue-Rolfe, A., Falk, M., Hölzl, W., Loveridge, P.,
O’Mahony, M., Matt, I., Peng, F., Reinstaller, A., Rincon-Aznar, A., Robinson, C., Sieber, S., Silva-Porto, M.,
Vasilikos, N., Zislin, J., forthcoming 2008. Sectoral Growth Drivers, study for the European Commission DG
Enterprise and Industry, Brussels.

– 30 –
Peneder, M., 2008. Firm Entry and Turnover: the Nexus with Profitability and Growth, forthcoming in Small Business
Economics.
Peneder, M., 2007b. A Sectoral Taxonomy of Educational Intensity, Empirica, 34(3), 189-212, July.
Peneder, M., 2007a. Sectoral Taxonomies: Identifying Competitive Regimes by Statistical Cluster Analysis, in Hanusch H.
and Pyka A. (eds.), The Elgar Companion to Neo-Schumpeterian Economics, Edward Elgar, Cheltenham UK,
pp. 525-543.
Peneder, M., 2006. The Meaning of Entrepreneurship: Towards a Modular Concept, available at SSRN:
http://ssrn.com/abstract=894401.
Peneder, M., 2003. Industry Classifications. Aim, Scope and Techniques, Journal of Industry, Competition and Trade,
3 (1-2), 109-129.
Romesburg, H.C., 1984. Cluster Analysis for Researchers, Waldsworth Inc., Belmont.
Schmitz J. A., 1989. Imitation, Entrepreneurship, and Long-run Growth, Journal of Political Economy 97, 721-739.
Schumpeter, J.A., 1947. The Creative Response in Economic History, Journal of Economic History, 7 (2), 149-159.
Schumpeter, J.A., 1938. Unternehmer, in Handwörterbuch der Staatswissenschaften Jena: Gustav Fischer, 4th edn., Vol. 8,
pp. 476-486.
Schumpeter, J.A., 1911. Theorie der wirtschaftlichen Entwicklung. 4th edn., Duncker & Humblot, Berlin.
Schultz, T. W., 1975. The Value of the Ability to Deal with Disequilibria, Journal of Economic Literature 13, 827-846.
Shane, S., Eckhardt, J., 2003. The Individual-Opportunity Nexus, in Acs, Zoltan J and David B Audretsch (eds), Handbook of
Entrepreneurship Research. An Interdisciplinary Survey and Introduction, Kluwer, Boston (MA), 161-194.
Sahlman, W.A., Stevenson H.H., Roberts M.J. and Bhidé A., 1999. The Entrepreneurial Venture. 2nd ed., Harvard Business
School Press, Cambridge MA.
Sieber, S., Silva-Porto, M., 2008. Openness and barriers to trade, in: Peneder et al., Sectoral Growth Drivers.
Sutton, J., 1998. Technology and market structure. Theory and History, MIT Press, Cambridge MA.
Timmer, M., O’Mahony M., van Ark, B., 2007. The EU KLEMS Growth and Productivity Accounts: An Overview,
University of Groningen & University of Birmingham.
Venkataraman, S., 1997. The Distinctive Domain of Entrepreneurship Research, in Katz, Jerome A (ed). Advances in
Entrepreneurship, Firm Emergence and Growth. Volume 3, JAI Press, Greenwich, Connecticut, pp. 119-138.
– 31 –
Von Tunzelmann, N., Acha, B., 2005. Innovation in ‘Low-Tech’ industries, in Fagerberg, J., Nelson, R.R., Mowery, D.C.,
The Oxford Handbook of Innovation, Oxford University Press, Oxford, pp. 407-32.
Winter, S.G., 1984. Schumpeterian competition in alternative technological regimes, Journal of Economic Behaviour and
Organization 5, 287-320.
Annex – Supplementary Tables and Figures
{Insert Table A.1: The sectoral taxonomy of entrepreneurship types (EnType)
Table A.2: The sectoral taxonomy of opportunity conditions (OpType)
Table A.3: The sectoral taxonomy of appropriability conditions (ApType)
Table A.4: The sectoral taxonomy of cumulativeness of knowledge (CuType)
Figure A.1: Distribution of firm types’ shares by sector classification }

– 32 –
Tables and Figures
Table 1: The firm sample by country and country groups
Table 2: Entrepreneurship and innovation types: identifying assumptions
Table 3: Distribution of firm types by country group in %
Table 4: Crosstabulation of firm types (shares in %)
Table 5: The new sectoral taxonomies (consensus classifications)
Table 6: Innovation intensity and labour productivity growth, 1995-2004
Table A.1: The sectoral taxonomy of entrepreneurship types (EnType)
Table A.2: The sectoral taxonomy of opportunity conditions (OpType)
Table A.3: The sectoral taxonomy of appropriability conditions (ApType)
Table A.4: The sectoral taxonomy of cumulativeness of knowledge (CuType)
Figure 1: Dendrograms for Average Linkage Method and Angular Separation Measure of Similarity
Figure 2: Distribution of selected firm types by the InnoType sector classification
Figure A.1: Distribution of firm types’ shares by sector classification
– 33 –
Table 1: The firm sample by country and country groups
Nuts_2dig Continental North South NMS10 NMS2 Total AT 1,304 - - - - 1,304BE 1,283 - - - - 1,283BG - - - - 12,758 12,758CZ - - - 3,505 - 3,505DE 2,929 - - - - 2,929DK - 1,627 - - - 1,627EE - - - 2,594 - 2,594ES - - 8,373 - - 8,373FI - 1,637 - - - 1,637GR - - 1,557 - - 1,557HU - - - 2,072 - 2,072IS - 745 - - - 745IT - - 12,964 - - 12,964LT - - - 1,954 - 1,954LU 440 - - - - 440LV - - - 2,496 - 2,496NO - 3,623 - - - 3,623PT - - 1,875 - - 1,875RO - - - - 7,844 7,844SE - 2,045 - - - 2,045SI - - - 2,564 - 2,564SK - - - 1,855 - 1,855 Total 5,956 9,677 24,769 17,040 20,602 78,044
– 34 –
Table 2: Entrepreneurship and innovation types: identifying assumptions
Classification of firms Identifying restrictions
I. Entrepreneurship type (EnType)
Creative ...
... product and process innovations (CrPP) Own process and product innovations (new to the market; by own enterpr.)
... product innovations (CrPd) Own product innovations (new to the market)
... process innovations (CrPc) Own process innovations (developed mainly by own enterprises)
Adaptive ...
... technology adoption (AdTA) Innovation mainly by or in co-operation with other enterprises/institutions
... other opportunities (AdOth) Neither process nor product innovations
II. Opportunity (OpType)
High intramural R&D (HR&D) Own R&D; share of innovation expenditures in total turnover > 5%
Intramural R&D (IR&D) Own R&D; share of innovation expenditures in total turnover <= 5%
External acquisition (ACQU) Acquisition of external R&D, machinery, rights etc.
None Neither intramural nor external innovation activities
III. Appropropriability (ApType)
Full arsenal (FULL) Patents, other formal and strategic methods
Patents (PAT+) Patents valid or applied (alone or with either formal or strategic methods)
Other formal methods (FORM) Design patterns, trademarks, copyright (with or without strategic methods)
Other strategic methods (STRAT) Secrecy, lead-time, complexity of design
None No appropriation activities
IV. Cumulativeness (CuType)
Highly cumulative knowledge (High) Creative entrepreneurs: internal sources more or equally important than external sources; Adaptive entrepreneurs: external sources more important
Low cumulativeness of knowledge (Low) Creative entrepreneurs: internal sources less important than external sources; Adaptive entrepreneurs: internal sources more or equally important
None Firms reporting neither internal nor external sources of high importance
– 35 –
Table 3: Distribution of firm types by country group in %
Continental North South NMS10 NMS2 Total A. Entrepreneurship (EnType)CrPP 8.98 7.02 9.24 5.53 5.49 7.14 CrPd 13.01 14.89 11.13 8 5.53 9.58 CrPc 9.99 6.86 8.53 5.84 1.47 5.99 AdTA 21.54 12.46 11.16 9.79 3.21 9.72 AdOth 46.47 58.77 59.93 70.84 84.3 67.57 Total 100 100 100 100 100 100 B. Opportunity / Innovation activity (OpType)HR&D 6.33 9.37 2.71 2.69 1.3 3.44 IR&D 28.86 24.7 17.26 13.13 3.26 14.47 ACQU 16.37 8.54 15.71 9.35 7.27 11.26 None 48.44 57.39 64.32 74.83 88.18 70.84 Total 100 100 100 100 100 100 C. Appropriability (ApType) FULL 9.79 8.47 5.65 2.1 0.69 4.23 PAT+ 9.82 8.06 7.78 3.34 1.65 5.38 FORM 12.68 12.91 7.86 9.63 3.81 8.17 STRAT 12.69 10.24 11.7 8.27 2.15 8.32 None 55.02 60.32 67.02 76.66 91.71 73.9 Total 100 100 100 100 100 100 D. Cumulativeness (CuType) High 31.41 26.3 24.7 16.39 8.99 19.45 Low 22.9 16.79 14.39 12.34 6.12 12.71 None 45.69 56.91 60.91 71.27 84.89 67.84 Total 100 100 100 100 100 100
Note: See Table 2 for definition of the firm-type acronyms.
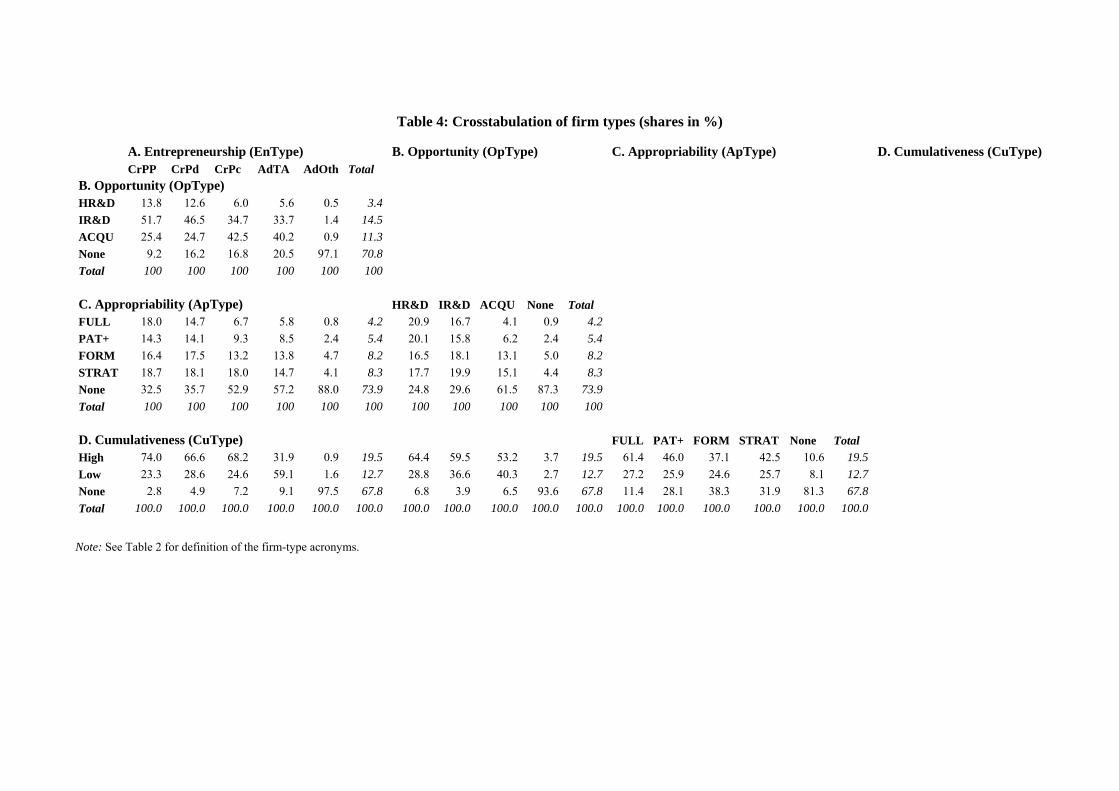
Table 4: Crosstabulation of firm types (shares in %)
A. Entrepreneurship (EnType) B. Opportunity (OpType) C. Appropriability (ApType) D. Cumulativeness (CuType) CrPP CrPd CrPc AdTA AdOth Total B. Opportunity (OpType) HR&D 13.8 12.6 6.0 5.6 0.5 3.4 IR&D 51.7 46.5 34.7 33.7 1.4 14.5 ACQU 25.4 24.7 42.5 40.2 0.9 11.3 None 9.2 16.2 16.8 20.5 97.1 70.8 Total 100 100 100 100 100 100 C. Appropriability (ApType) HR&D IR&D ACQU None Total FULL 18.0 14.7 6.7 5.8 0.8 4.2 20.9 16.7 4.1 0.9 4.2 PAT+ 14.3 14.1 9.3 8.5 2.4 5.4 20.1 15.8 6.2 2.4 5.4 FORM 16.4 17.5 13.2 13.8 4.7 8.2 16.5 18.1 13.1 5.0 8.2 STRAT 18.7 18.1 18.0 14.7 4.1 8.3 17.7 19.9 15.1 4.4 8.3 None 32.5 35.7 52.9 57.2 88.0 73.9 24.8 29.6 61.5 87.3 73.9 Total 100 100 100 100 100 100 100 100 100 100 100 D. Cumulativeness (CuType) FULL PAT+ FORM STRAT None Total High 74.0 66.6 68.2 31.9 0.9 19.5 64.4 59.5 53.2 3.7 19.5 61.4 46.0 37.1 42.5 10.6 19.5 Low 23.3 28.6 24.6 59.1 1.6 12.7 28.8 36.6 40.3 2.7 12.7 27.2 25.9 24.6 25.7 8.1 12.7 None 2.8 4.9 7.2 9.1 97.5 67.8 6.8 3.9 6.5 93.6 67.8 11.4 28.1 38.3 31.9 81.3 67.8 Total 100.0 100.0 100.0 100.0 100.0 100.0 100.0 100.0 100.0 100.0 100.0 100.0 100.0 100.0 100.0 100.0 100.0
Note: See Table 2 for definition of the firm-type acronyms.
– 37 –
Table 5: The new sectoral taxonomies
Nace Industry EnType AcType ApType CuType InnoType 10 Mining: coal, peat TAD ACQU None Low Med-low 11 Mining: petroleum, gas TAD ACQU None Med Med-low 14 Mining: other Other None None Low Low 15 Food products, beverages TAD ACQU FORM Low Med-low 16 Tobacco products TAD IR&D FORM Low Med-low 17 Textiles MCRE IR&D FORM Med Med-high 18 Wearing apparel, fur Other None FORM Low Low 19 Leather, -products, footwear Other None FORM Low Low 20 Wood, -products, cork Other ACQU None Low Med 21 Pulp/paper, -products MCRE ACQU FORM Med Med 22 Publishing, reproduction TAD ACQU FORM Low Med-low 23 Ref. petroleum, nucl. fuel MCRE IR&D PAT+ Med Med-high 24 Chemicals MCRE IR&D PAT+ High Med-high 25 Rubber and plastics MCRE IR&D PAT+ Med Med-high 26 Mineral products MCRE IR&D BAL Med Med-high 27 Basic metals MCRE IR&D PAT+ High Med-high 28 Fabricated metal products MCRE ACQU None Low Med 29 Machinery, nec. HCRE HR&D PAT+ High High 30 Computers, office machinery HCRE HR&D BAL Med High 31 Electrical equipment, nec HCRE IR&D PAT+ High High 32 Communication technology HCRE HR&D BAL High High 33 Precision instruments HCRE HR&D PAT+ High High 34 Motor vehicles, -parts MCRE IR&D PAT+ High Med-high 35 Other transport equipment MCRE IR&D PAT+ Med Med-high 36 Manufacturing nec MCRE ACQU BAL Med Med 37 Recycling Other None None Low Low 40 Electricity and gas TAD ACQU None Low Med-low 41 Water supply TAD None None Low Med-low 51 Wholesale trade Other None None Low Low 60 Land transport, pipelines Other None None Low Low 61 Water transport Other None None Low Low 62 Air transport Other ACQU None Low Med 63 Auxiliary transport services Other None None Low Low 64 Post, telecommunications HCRE ACQU FORM Med Med-high 65 Financial intermediation MCRE ACQU STRAT High Med 66 Insurance, pension funding TAD ACQU STRAT High Med-low 67 Auxiliary financial services Other None FORM Low Low 72 Computer services HCRE HR&D STRAT High High 73 Research and development HCRE HR&D PAT+ High High 74 Other business services MCRE ACQU STRAT High Med Note: EnType – HCRE: High creative entrepreneurship with product (and process) innovations; MCRE: Intermediate creative entrepreneurship only with process innovations; TAD: Adaptive entrepreneurship with technology adoption; Other: Adaptive entrepreneurship pursuing opportunities other than from technological innovation OpType – HR&D: High intramural R&D (>5% of firm turnover); IR&D: Intramural R&D; ACQU: Acquisition of new knowledge (R&D, machinery, patents, etc.); None: No innovation activities ApType – PAT+: high use of patents and other measures; BAL: Balanced use of various measures; FORM: other formal measures; STRAT: strategic means; None: no measures for appropriation CuType – High: High cumulativeness; Med: Intermediate cumulativeness; Low: Low cumulativeness of knowledge.
– 38 –
Table 6: Innovation intensity and labour productivity growth, 1995-2004 (t-value in brackets)
Variables (1) (2) (3) (4) (5) (6) (7) (8) (9) Ln LPI 1995 -0.0209*** -0.0310*** -0.0052 -0.0153*** -0.0158 -0.0388*** -0.0460*** -0.0433*** -0.0323**
(-3.58) (-5.19) (-0.59) (-1.42) (-1.66) (-6.44) (-5.19) (-2.87) (-2.10) Average Capital Income Share 0.0759*** 0.1518*** 0.0603** 0.1014*** 0.1582*** 0.1679*** 0.1715*** 0.1734*** 0.1480***
(5.38) (7.57) (2.07) (2.97) (4.44) (8.34) (5.82) (3.65) (3.12) Δ Ln Capital Income Share 0.1901*** 0.2198*** 0.3427** 0.3406*** 0.3316*** 0.1265*** 0.0877* 0.0977 0.0863
(5.66) (5.51) (4.39) (3.48) (5.04) (3.17) (1.89) (1.28) (1.13) Δ Ln ICT Share in Capital Income
0.0529** (2.20)
Δ Ln High-skill Share in Hours Worked
0.4352* (1.85)
Ln Firm Turnover (Employment weighted)
0.0095** (2.18)
Ln Average Firm Size 0.0057*** (2.86)
Ln Average Herfindahl-Hirschman Concentration Index
0.0036* (1.83)
Ln Export Openness 0.0151* (1.96)
Ln Import Openness 0.0190** (2.36)
Med.-high I (vs. High II) -0.0435*** -0.0354*** -0.0588*** -0.0143 0.0306*** -0.0331*** -0.0446*** -0.0425*** (-6.31) (-3.56) (-4.97) (-0.94) (-4.16) (-4.36) (-3.67) (-3.49)
Medium II (vs. High II) -0.0482*** -0.359*** -0.0617*** -0.0248* -0.0378*** -0.0445*** -0.0488*** -0.0460*** (-6.52) (-3.28) (-4.73) (-1.81) (-4.99) (-5.66) (-3.26) (-3.06)
Med.-low II (vs. High II) -0.0608*** -0.0486*** -0.0725*** -0.0448*** -0.0507*** -0.0541*** 0.0571*** -0.0463*** (-7.81) (-4.18) (-5.08) (-2.74) (-6.42) (-6.27) (-3.09) (-2.29)
Low II (vs. High II) -0.0463*** -0.0278** -0.0568*** -0.0252* -0.0364*** -0.0475*** -0.0633*** -0.0639*** (-6.06) (-2.49) (-4.16) (-1.92) (-4.80) (-4.30) (-3.52) (-3.56)
Constant yes yes yes yes yes yes yes yes yes Fixed Industry Effects yes no no no no no no no no Fixed Country Effects yes yes yes yes yes yes yes yes yes Number of obs. 547 418 134 175 97 242 180 144 143 Adj. R2 0.40 0.30 0.31 0.24 0.36 0.41 0.43 0.31 0.31
Note: levels of significance *** significant at 1% ** significant at 5%, * significant at 10%.
Source: EU KLEMS, Eurostat SBS, UN Comtrade; WIFO calculations.
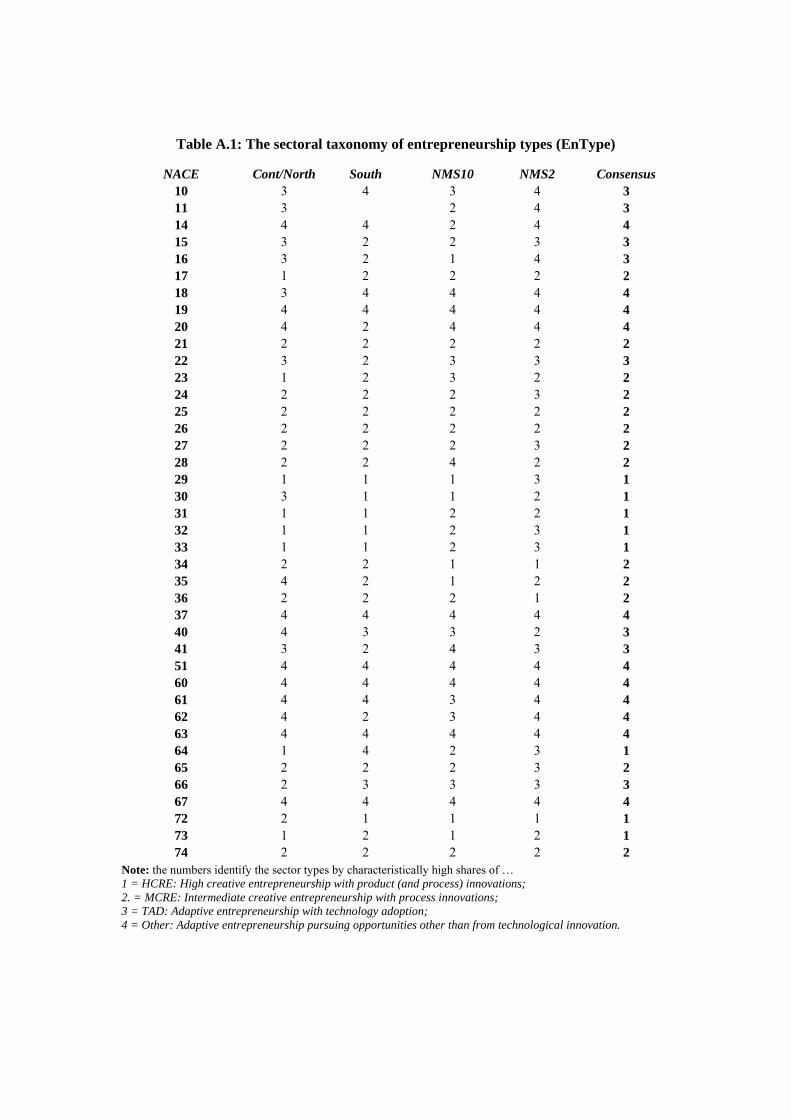
Table A.1: The sectoral taxonomy of entrepreneurship types (EnType)
NACE Cont/North South NMS10 NMS2 Consensus 10 3 4 3 4 3 11 3 2 4 3 14 4 4 2 4 4 15 3 2 2 3 3 16 3 2 1 4 3 17 1 2 2 2 2 18 3 4 4 4 4 19 4 4 4 4 4 20 4 2 4 4 4 21 2 2 2 2 2 22 3 2 3 3 3 23 1 2 3 2 2 24 2 2 2 3 2 25 2 2 2 2 2 26 2 2 2 2 2 27 2 2 2 3 2 28 2 2 4 2 2 29 1 1 1 3 1 30 3 1 1 2 1 31 1 1 2 2 1 32 1 1 2 3 1 33 1 1 2 3 1 34 2 2 1 1 2 35 4 2 1 2 2 36 2 2 2 1 2 37 4 4 4 4 4 40 4 3 3 2 3 41 3 2 4 3 3 51 4 4 4 4 4 60 4 4 4 4 4 61 4 4 3 4 4 62 4 2 3 4 4 63 4 4 4 4 4 64 1 4 2 3 1 65 2 2 2 3 2 66 2 3 3 3 3 67 4 4 4 4 4 72 2 1 1 1 1 73 1 2 1 2 1 74 2 2 2 2 2
Note: the numbers identify the sector types by characteristically high shares of … 1 = HCRE: High creative entrepreneurship with product (and process) innovations; 2. = MCRE: Intermediate creative entrepreneurship with process innovations; 3 = TAD: Adaptive entrepreneurship with technology adoption; 4 = Other: Adaptive entrepreneurship pursuing opportunities other than from technological innovation.
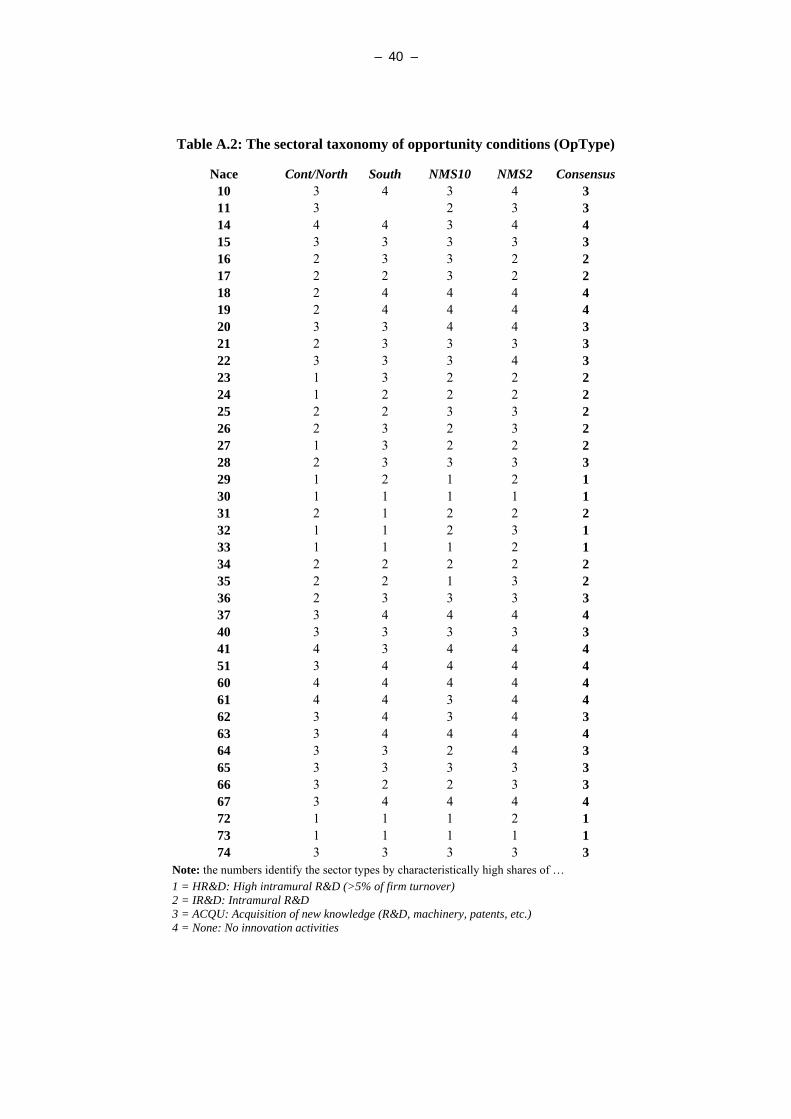
– 40 –
Table A.2: The sectoral taxonomy of opportunity conditions (OpType)
Nace Cont/North South NMS10 NMS2 Consensus 10 3 4 3 4 3 11 3 2 3 3 14 4 4 3 4 4 15 3 3 3 3 3 16 2 3 3 2 2 17 2 2 3 2 2 18 2 4 4 4 4 19 2 4 4 4 4 20 3 3 4 4 3 21 2 3 3 3 3 22 3 3 3 4 3 23 1 3 2 2 2 24 1 2 2 2 2 25 2 2 3 3 2 26 2 3 2 3 2 27 1 3 2 2 2 28 2 3 3 3 3 29 1 2 1 2 1 30 1 1 1 1 1 31 2 1 2 2 2 32 1 1 2 3 1 33 1 1 1 2 1 34 2 2 2 2 2 35 2 2 1 3 2 36 2 3 3 3 3 37 3 4 4 4 4 40 3 3 3 3 3 41 4 3 4 4 4 51 3 4 4 4 4 60 4 4 4 4 4 61 4 4 3 4 4 62 3 4 3 4 3 63 3 4 4 4 4 64 3 3 2 4 3 65 3 3 3 3 3 66 3 2 2 3 3 67 3 4 4 4 4 72 1 1 1 2 1 73 1 1 1 1 1 74 3 3 3 3 3
Note: the numbers identify the sector types by characteristically high shares of … 1 = HR&D: High intramural R&D (>5% of firm turnover) 2 = IR&D: Intramural R&D 3 = ACQU: Acquisition of new knowledge (R&D, machinery, patents, etc.) 4 = None: No innovation activities
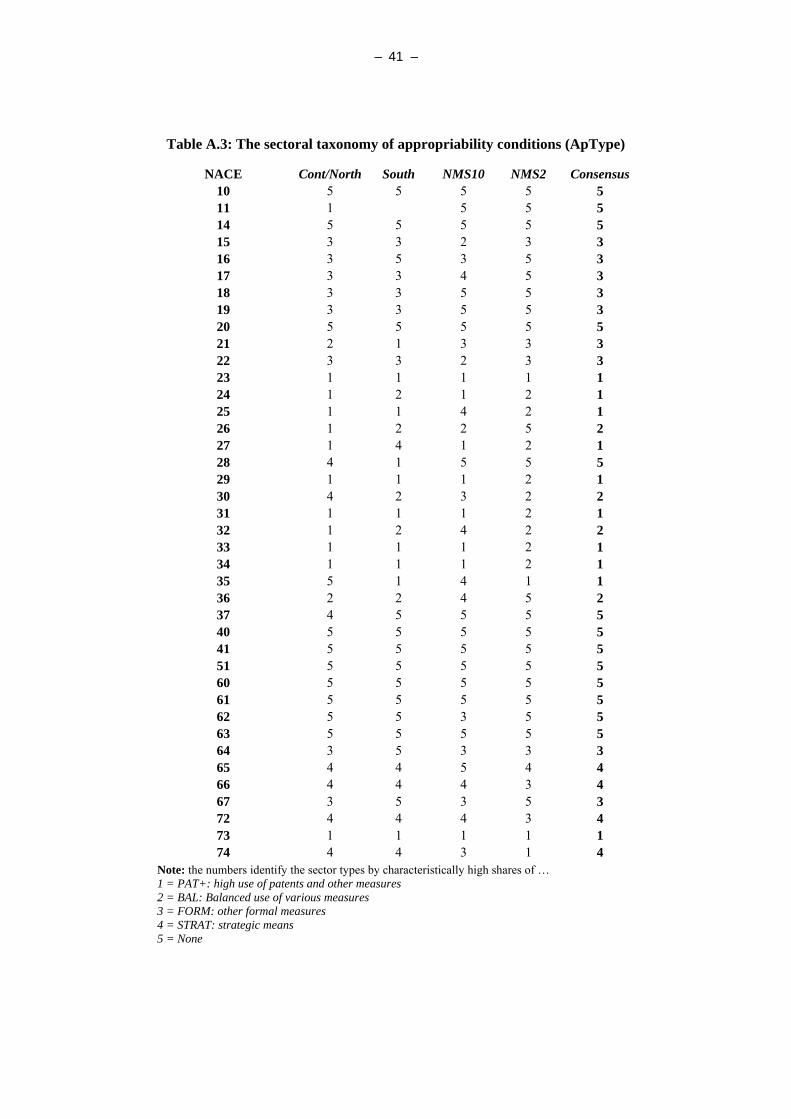
– 41 –
Table A.3: The sectoral taxonomy of appropriability conditions (ApType)
NACE Cont/North South NMS10 NMS2 Consensus 10 5 5 5 5 5 11 1 5 5 5 14 5 5 5 5 5 15 3 3 2 3 3 16 3 5 3 5 3 17 3 3 4 5 3 18 3 3 5 5 3 19 3 3 5 5 3 20 5 5 5 5 5 21 2 1 3 3 3 22 3 3 2 3 3 23 1 1 1 1 1 24 1 2 1 2 1 25 1 1 4 2 1 26 1 2 2 5 2 27 1 4 1 2 1 28 4 1 5 5 5 29 1 1 1 2 1 30 4 2 3 2 2 31 1 1 1 2 1 32 1 2 4 2 2 33 1 1 1 2 1 34 1 1 1 2 1 35 5 1 4 1 1 36 2 2 4 5 2 37 4 5 5 5 5 40 5 5 5 5 5 41 5 5 5 5 5 51 5 5 5 5 5 60 5 5 5 5 5 61 5 5 5 5 5 62 5 5 3 5 5 63 5 5 5 5 5 64 3 5 3 3 3 65 4 4 5 4 4 66 4 4 4 3 4 67 3 5 3 5 3 72 4 4 4 3 4 73 1 1 1 1 1 74 4 4 3 1 4
Note: the numbers identify the sector types by characteristically high shares of … 1 = PAT+: high use of patents and other measures 2 = BAL: Balanced use of various measures 3 = FORM: other formal measures 4 = STRAT: strategic means 5 = None
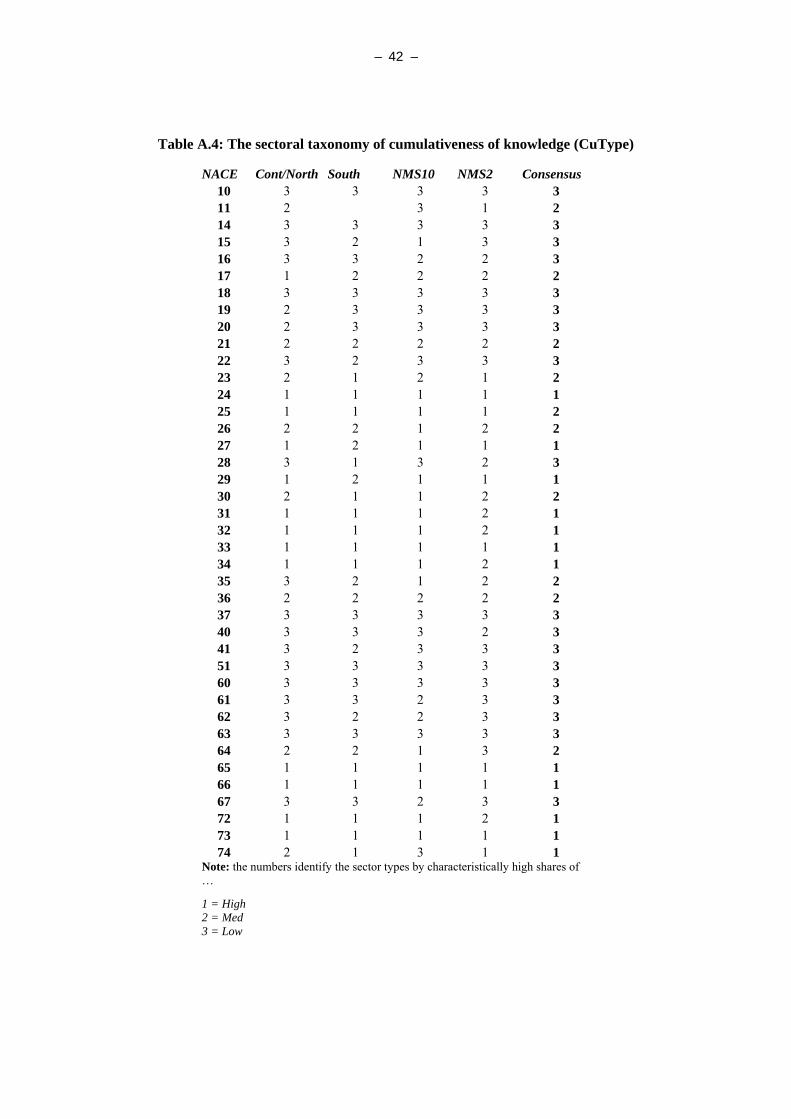
– 42 –
Table A.4: The sectoral taxonomy of cumulativeness of knowledge (CuType)
NACE Cont/North South NMS10 NMS2 Consensus 10 3 3 3 3 3 11 2 3 1 2 14 3 3 3 3 3 15 3 2 1 3 3 16 3 3 2 2 3 17 1 2 2 2 2 18 3 3 3 3 3 19 2 3 3 3 3 20 2 3 3 3 3 21 2 2 2 2 2 22 3 2 3 3 3 23 2 1 2 1 2 24 1 1 1 1 1 25 1 1 1 1 2 26 2 2 1 2 2 27 1 2 1 1 1 28 3 1 3 2 3 29 1 2 1 1 1 30 2 1 1 2 2 31 1 1 1 2 1 32 1 1 1 2 1 33 1 1 1 1 1 34 1 1 1 2 1 35 3 2 1 2 2 36 2 2 2 2 2 37 3 3 3 3 3 40 3 3 3 2 3 41 3 2 3 3 3 51 3 3 3 3 3 60 3 3 3 3 3 61 3 3 2 3 3 62 3 2 2 3 3 63 3 3 3 3 3 64 2 2 1 3 2 65 1 1 1 1 1 66 1 1 1 1 1 67 3 3 2 3 3 72 1 1 1 2 1 73 1 1 1 1 1 74 2 1 3 1 1
Note: the numbers identify the sector types by characteristically high shares of …
1 = High 2 = Med 3 = Low
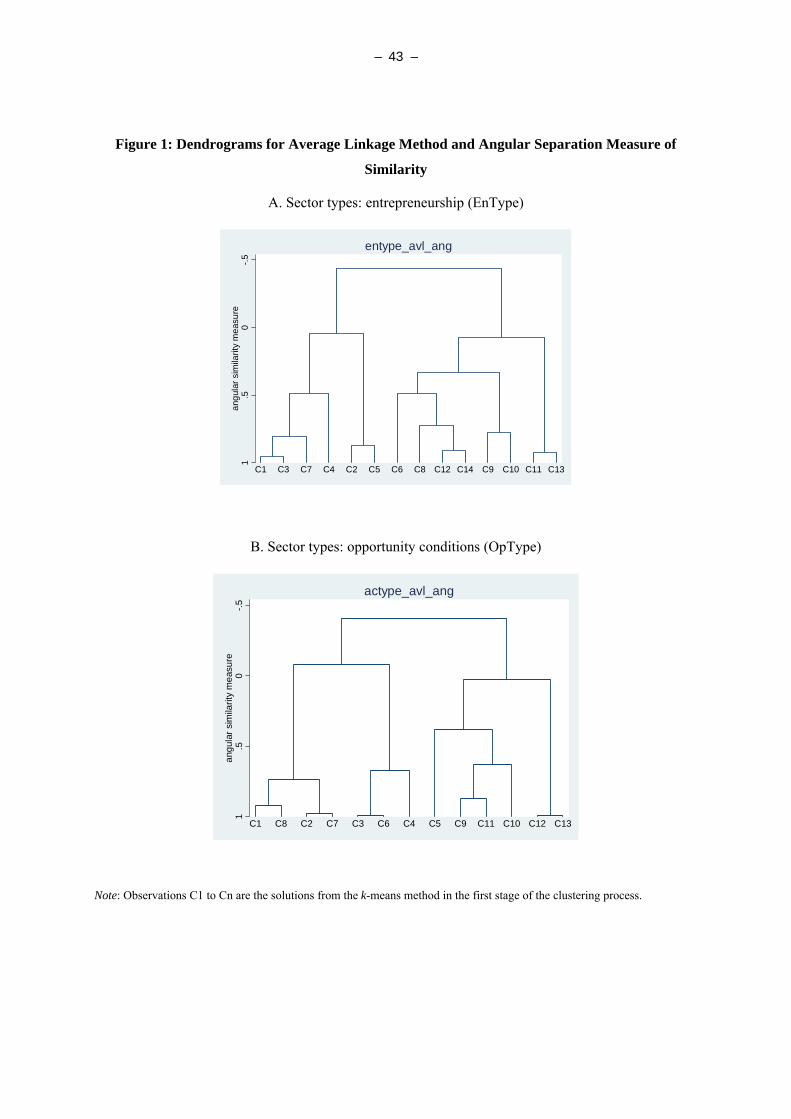
– 43 –
Figure 1: Dendrograms for Average Linkage Method and Angular Separation Measure of
Similarity
A. Sector types: entrepreneurship (EnType)
B. Sector types: opportunity conditions (OpType)
Note: Observations C1 to Cn are the solutions from the k-means method in the first stage of the clustering process.
-.50
.51
angu
lar s
imila
rity
mea
sure
C1 C8 C2 C7 C3 C6 C4 C5 C9 C11 C10 C12 C13
actype_avl_ang
-.50
.51
angu
lar s
imila
rity
mea
sure
C1 C3 C7 C4 C2 C5 C6 C8 C12 C14 C9 C10 C11 C13
entype_avl_ang
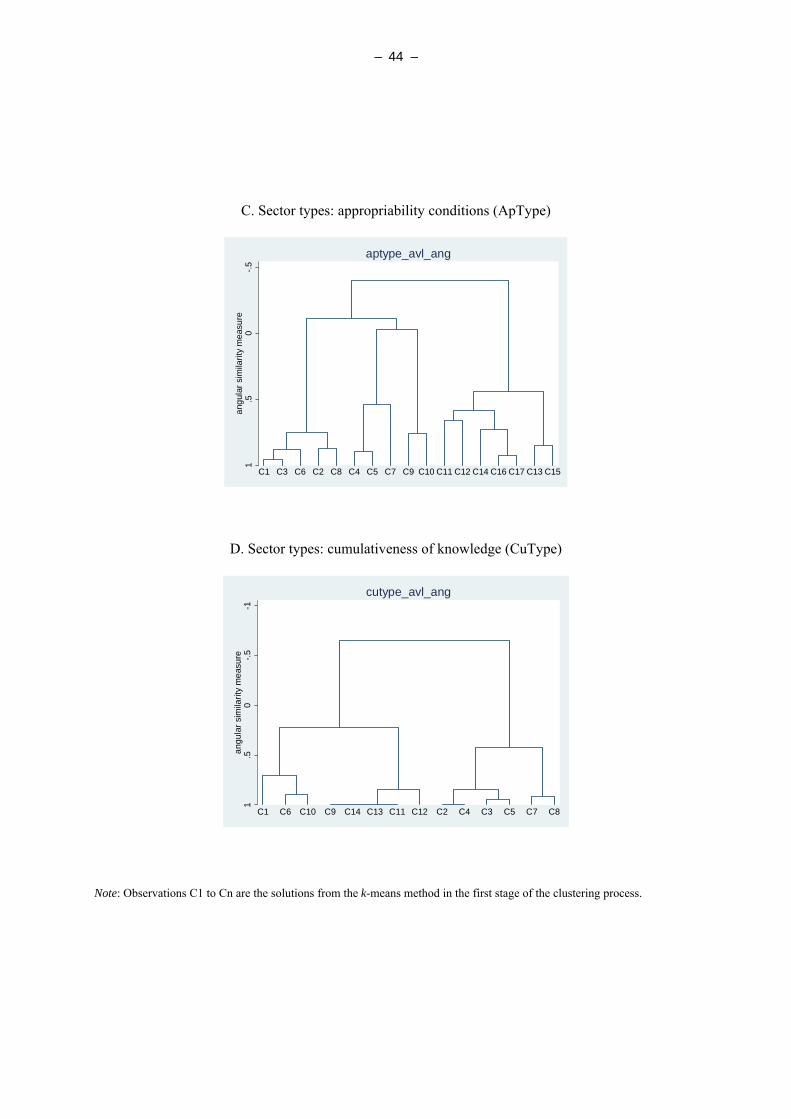
– 44 –
C. Sector types: appropriability conditions (ApType)
D. Sector types: cumulativeness of knowledge (CuType)
Note: Observations C1 to Cn are the solutions from the k-means method in the first stage of the clustering process.
-1-.5
0.5
1an
gula
r sim
ilarit
y m
easu
re
C1 C6 C10 C9 C14 C13 C11 C12 C2 C4 C3 C5 C7 C8
cutype_avl_ang
-.50
.51
angu
lar s
imila
rity
mea
sure
C1 C3 C6 C2 C8 C4 C5 C7 C9 C10 C11 C12 C14 C16 C17 C13 C15
aptype_avl_ang
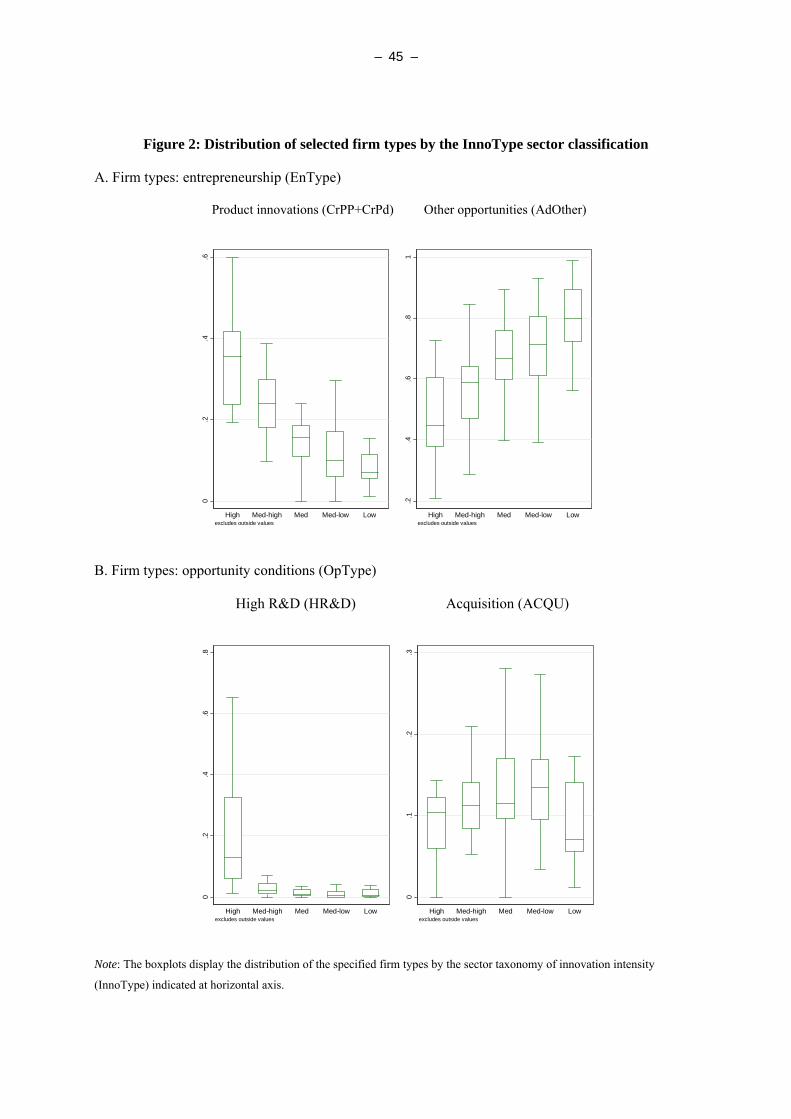
– 45 –
Figure 2: Distribution of selected firm types by the InnoType sector classification
A. Firm types: entrepreneurship (EnType)
Product innovations (CrPP+CrPd) Other opportunities (AdOther) 0
.2.4
.6
High Med-high Med Med-low Lowexcludes outside values
.2.4
.6.8
1
High Med-high Med Med-low Lowexcludes outside values
B. Firm types: opportunity conditions (OpType)
High R&D (HR&D) Acquisition (ACQU)
0.2
.4.6
.8
High Med-high Med Med-low Lowexcludes outside values
0.1
.2.3
High Med-high Med Med-low Lowexcludes outside values
Note: The boxplots display the distribution of the specified firm types by the sector taxonomy of innovation intensity
(InnoType) indicated at horizontal axis.
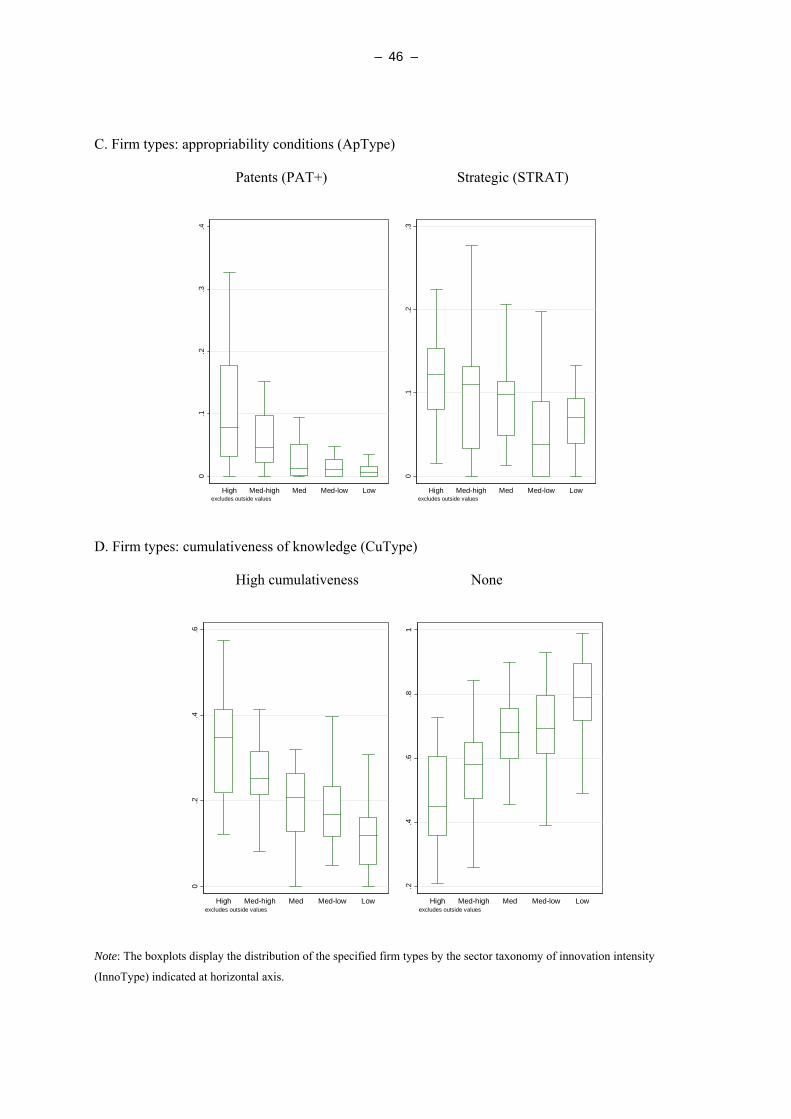
– 46 –
C. Firm types: appropriability conditions (ApType)
Patents (PAT+) Strategic (STRAT) 0
.1.2
.3.4
High Med-high Med Med-low Lowexcludes outside values
0.1
.2.3
High Med-high Med Med-low Lowexcludes outside values
D. Firm types: cumulativeness of knowledge (CuType)
High cumulativeness None
0.2
.4.6
High Med-high Med Med-low Lowexcludes outside values
.2.4
.6.8
1
High Med-high Med Med-low Lowexcludes outside values
Note: The boxplots display the distribution of the specified firm types by the sector taxonomy of innovation intensity
(InnoType) indicated at horizontal axis.
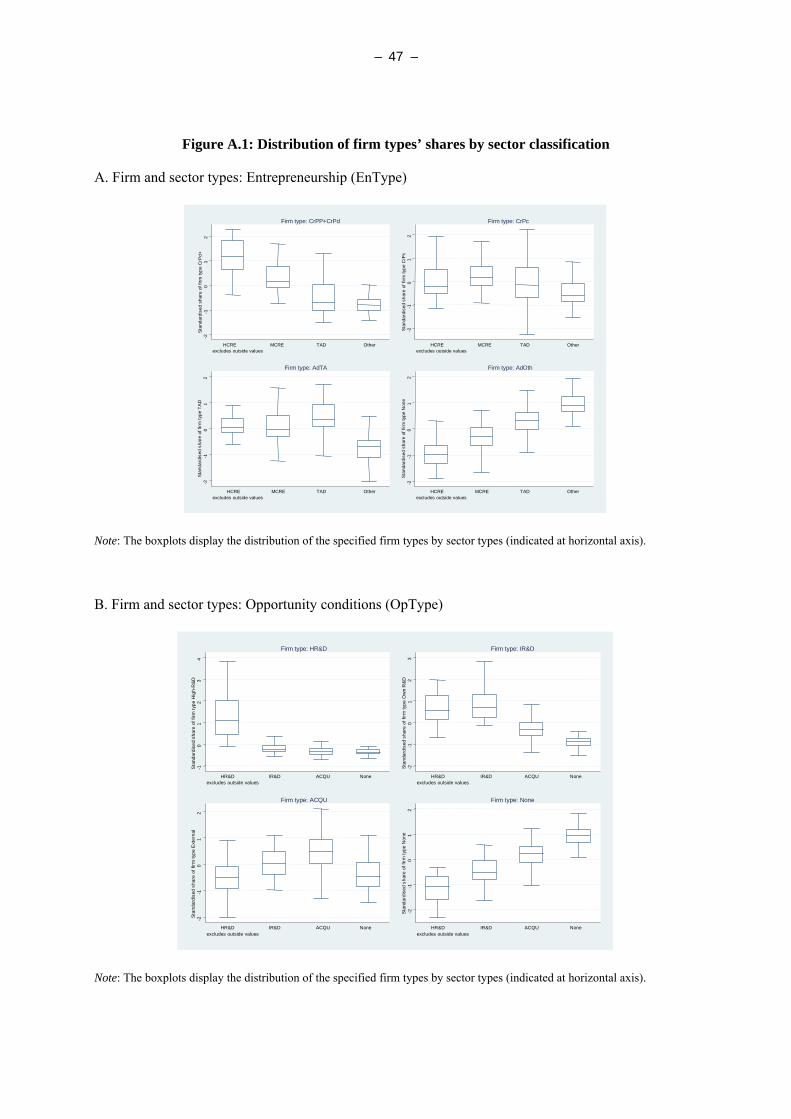
– 47 –
Figure A.1: Distribution of firm types’ shares by sector classification
A. Firm and sector types: Entrepreneurship (EnType)
-2-1
01
2St
anda
rdis
edsh
are
of fi
rm ty
peC
rPd+
HCRE MCRE TAD Otherexcludes outside values
Firm type: CrPP+CrPd
-2-1
01
2St
anda
rdis
edsh
are
of fi
rm ty
peC
rPc
HCRE MCRE TAD Otherexcludes outside values
Firm type: CrPc
-2-1
01
2St
anda
rdis
edsh
are
of fi
rm ty
peTA
D
HCRE MCRE TAD Otherexcludes outside values
Firm type: AdTA
-2-1
01
2S
tand
ardi
sed
shar
eof
firm
type
Non
e
HCRE MCRE TAD Otherexcludes outside values
Firm type: AdOth
-2-1
01
2St
anda
rdis
edsh
are
of fi
rm ty
peC
rPd+
HCRE MCRE TAD Otherexcludes outside values
Firm type: CrPP+CrPd
-2-1
01
2St
anda
rdis
edsh
are
of fi
rm ty
peC
rPc
HCRE MCRE TAD Otherexcludes outside values
Firm type: CrPc
-2-1
01
2St
anda
rdis
edsh
are
of fi
rm ty
peTA
D
HCRE MCRE TAD Otherexcludes outside values
Firm type: AdTA
-2-1
01
2S
tand
ardi
sed
shar
eof
firm
type
Non
e
HCRE MCRE TAD Other
-2-1
01
2St
anda
rdis
edsh
are
of fi
rm ty
peC
rPd+
HCRE MCRE TAD Otherexcludes outside values
Firm type: CrPP+CrPd
-2-1
01
2St
anda
rdis
edsh
are
of fi
rm ty
peC
rPc
HCRE MCRE TAD Otherexcludes outside values
Firm type: CrPc
-2-1
01
2St
anda
rdis
edsh
are
of fi
rm ty
peTA
D
HCRE MCRE TAD Otherexcludes outside values
Firm type: AdTA
-2-1
01
2S
tand
ardi
sed
shar
eof
firm
type
Non
e
HCRE MCRE TAD Otherexcludes outside values
Firm type: AdOth
Note: The boxplots display the distribution of the specified firm types by sector types (indicated at horizontal axis).
B. Firm and sector types: Opportunity conditions (OpType)
-10
12
34
Stan
dard
ised
shar
eof
firm
type
Hig
h-R
&D
HR&D IR&D ACQU Noneexcludes outside values
Firm type: HR&D
-2-1
01
23
Sta
ndar
dise
dsh
are
of fi
rm ty
peO
wn
R&D
HR&D IR&D ACQU Noneexcludes outside values
Firm type: IR&D
-2-1
01
2S
tand
ardi
sed
shar
eof
firm
type
Ext
erna
l
HR&D IR&D ACQU Noneexcludes outside values
Firm type: ACQU
-2-1
01
2St
anda
rdis
edsh
are
of fi
rm ty
peN
one
HR&D IR&D ACQU Noneexcludes outside values
Firm type: None
-10
12
34
Stan
dard
ised
shar
eof
firm
type
Hig
h-R
&D
HR&D IR&D ACQU Noneexcludes outside values
Firm type: HR&D
-2-1
01
23
Sta
ndar
dise
dsh
are
of fi
rm ty
peO
wn
R&D
HR&D IR&D ACQU Noneexcludes outside values
Firm type: IR&D
-2-1
01
2S
tand
ardi
sed
shar
eof
firm
type
Ext
erna
l
HR&D IR&D ACQU Noneexcludes outside values
Firm type: ACQU
-2-1
01
2
-10
12
34
Stan
dard
ised
shar
eof
firm
type
Hig
h-R
&D
HR&D IR&D ACQU Noneexcludes outside values
Firm type: HR&D
-2-1
01
23
Sta
ndar
dise
dsh
are
of fi
rm ty
peO
wn
R&D
HR&D IR&D ACQU Noneexcludes outside values
Firm type: IR&D
-2-1
01
2S
tand
ardi
sed
shar
eof
firm
type
Ext
erna
l
HR&D IR&D ACQU Noneexcludes outside values
Firm type: ACQU
-2-1
01
2St
anda
rdis
edsh
are
of fi
rm ty
peN
one
HR&D IR&D ACQU Noneexcludes outside values
Firm type: None
Note: The boxplots display the distribution of the specified firm types by sector types (indicated at horizontal axis).
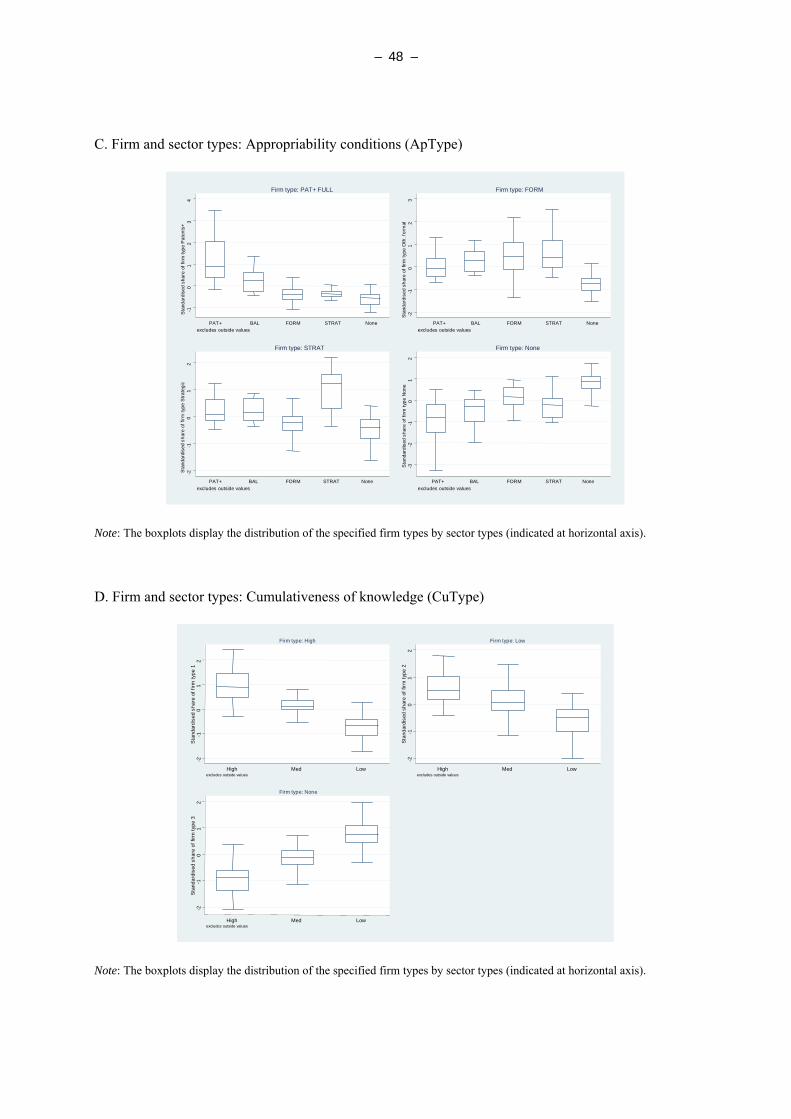
– 48 –
C. Firm and sector types: Appropriability conditions (ApType)
-10
12
34
Stan
dard
ised
shar
eof
firm
type
Pat
ents
+
PAT+ BAL FORM STRAT Noneexcludes outside values
Firm type: PAT+ FULL
-2-1
01
23
Stan
dard
ised
shar
eof
firm
type
Oth
. for
mal
PAT+ BAL FORM STRAT Noneexcludes outside values
Firm type: FORM-2
-10
12
Stan
dard
ised
shar
eof
firm
type
Stra
tegi
c
PAT+ BAL FORM STRAT Noneexcludes outside values
Firm type: STRAT
-3-2
-10
12
Stan
dard
ised
shar
eof
firm
type
Non
e
PAT+ BAL FORM STRAT Noneexcludes outside values
Firm type: None
-10
12
34
Stan
dard
ised
shar
eof
firm
type
Pat
ents
+
PAT+ BAL FORM STRAT Noneexcludes outside values
Firm type: PAT+ FULL
-2-1
01
23
Stan
dard
ised
shar
eof
firm
type
Oth
. for
mal
PAT+ BAL FORM STRAT Noneexcludes outside values
Firm type: FORM-2
-10
12
Stan
dard
ised
shar
eof
firm
type
Stra
tegi
c
PAT+ BAL FORM STRAT Noneexcludes outside values
Firm type: STRAT
-10
12
34
Stan
dard
ised
shar
eof
firm
type
Pat
ents
+
PAT+ BAL FORM STRAT Noneexcludes outside values
Firm type: PAT+ FULL
-2-1
01
23
Stan
dard
ised
shar
eof
firm
type
Oth
. for
mal
PAT+ BAL FORM STRAT Noneexcludes outside values
Firm type: FORM-2
-10
12
Stan
dard
ised
shar
eof
firm
type
Stra
tegi
c
PAT+ BAL FORM STRAT Noneexcludes outside values
Firm type: STRAT
-3-2
-10
12
Stan
dard
ised
shar
eof
firm
type
Non
e
PAT+ BAL FORM STRAT Noneexcludes outside values
Firm type: None
Note: The boxplots display the distribution of the specified firm types by sector types (indicated at horizontal axis).
D. Firm and sector types: Cumulativeness of knowledge (CuType)
-2-1
01
2S
tand
ardi
sed
shar
eof
firm
type
1
High Med Lowexcludes outside values
Firm type: High
-2-1
01
2S
tand
ardi
sed
shar
eof
firm
type
2
High Med Lowexcludes outside values
Firm type: Low
-2-1
01
2S
tand
ardi
sed
shar
eof
firm
type
3
High Med Lowexcludes outside values
Firm type: None
-2-1
01
2S
tand
ardi
sed
shar
eof
firm
type
1
High Med Lowexcludes outside values
Firm type: High
-2-1
01
2S
tand
ardi
sed
shar
eof
firm
type
2
High Med Lowexcludes outside values
Firm type: Low
-2-1
01
2S
tand
ardi
sed
shar
eof
firm
type
3
High Med Lowexcludes outside values
Firm type: None
Note: The boxplots display the distribution of the specified firm types by sector types (indicated at horizontal axis).