environment and health indicators · instituto de salud carlos iii/ escuela nacional de sanidad...
TRANSCRIPT

Draft Baseline Report on
”Environment & Health Indicators”
under the framework of the European Environment and Health Strategy (COM 2003)338 final)
Produced by the Technical Working Group on Indicators & Priority diseases
subgroup Environment & Health Indicators
05 December 2003

1
This report reflects the opinions of the members of the Working Group and it highlights the
different opinions contained within the group where appropriate. It should not be considered as an official statement of the position of the European Commission.
Further information relating to this work is available on the project website: www.brussels-conference.org or from the Technical Secretariat: Dr. Anke Joas BiPRO GmbH Grauertstr. 12 81545 Munich Germany Telephone +49 89 18979050 Facsimile +49 89 18979052 Email: [email protected]

2
List of members TWG Dafina Dalbokova* WHO European Centre for Environment and Health, Bonn Office
Marie-Christine De Wolf* EPHA, Environmental Network, Belgium
Antonio Doronzo DG Sanco
Ingeborg Fiala Ministry of the Agriculture, Forestry, Environment and Water Management, Austria
Michael Hübel DG Sanco
Patricia Koundakjian EUROFER, Belgium
Michal Krzyzanowski WHO, Regional Office for Europe
Paloma Martin ENSP European Network for smoking Prevention
Mark McCarthy* European Public Health Association, University College London,UK
Antoni Montserrat DG Sanco
Monica Nordberg* Institute Environmental Medicine, Karolinska Institutet, Sweden
Anna Páldy National Centre for Public Health, Hungary
Dirk Pallapies* BASF AG
Philippe Pirard* INVS, National Institute of Public Health Surveillance, France
Cesaltina Ramos Portugal
D. Benjamin Sanchez Fernandez-Murias
Instituto de Salud Carlos III/ Escuela Nacional de sanidad
Ulrike Ravens-Sieberer Robert Koch Institut, Germany
Luciana Sinisi* APAT, National Environment Agency, Italy
Vesna Smaka Kincl Municipality of Maribor - Environmental Protection Agency, Slovenia
Brigit Staatsen* RIVM, National Institute of Public Health and Environment, The Netherlands
David Stanners EEA
Jürgen Thelen* Federal Environmental Agency, Germany
Ronan Uhel* EEA
Friedrich Wiebel ENSP European Network for Smoking Prevention
Chair: Vesna Smaka Kincl Co- Chair: Brigit A.M. Staatsen Contractor: BiPRO GmbH, Munich * main authors of the report

3
Additional contacts: Marguerite Cammilleri Environment and Planning Authority, Malta Alexandra Cucu Ministry of Health, Romania Helga Grønnegaard Danish Environmental Protection Agency, Denmark Dorata Jaroskinska Institute of Occupational Medicine and Environmental Health,
Poland Ruzena Kubinova National Institute of Public Health, Czech Republic Francisco Marques Sanidad Ambiental y Salud Laboral, Spain Hristina Mileva State Health Control, Promotion & Diseases Prevention,
Ministry of Health Bulgaria Ingrida Zurlyte Environmental Health Centre, Lithuania Inga Turk Ministry of Environment, Slovenia Peter Otorepec
Slovenia

4
Table of Contents Executive summary .................................................................................................................... 6
1 Introduction: background and objective of EH Indicators .............................................. 10
2 Use and construction of Environment and Health Indicators, framework for linkages............................................................................................................................ 11
2.1 Definitions and different approaches to Indicators for Health and Environment...................................................................................................... 11
2.2 Use of indicators ............................................................................................... 12
2.3 Construction of indicators ................................................................................. 13
2.4 Considerations for selection of Environmental Health issues and indicators ........................................................................................................... 14
OECD ....................................................................................................................................... 15
3 Overview on knowledge and activities on Environment & Health Indicators................ 16
3.1 Current systems to collect data for the development of Environment & Health Indicators ............................................................................................... 16
3.1.1 International projects......................................................................................... 16
3.1.2 WHO-‘Environmental Health Indicator System’ (EHIS) ................................. 17
3.1.3 Public Health Indicator projects (ECHI)........................................................... 19
3.1.4 The Child Health Indicators of Life and Development (CHILD) Project ........ 21
3.1.5 European Environmental Information System (EEIS)...................................... 22
Legend 25
ISTAT: National Statistical Institute............................................................................... 25
3.1.6 Indicator projects at local level (Sustainable cities).......................................... 26
3.1.7 Sustainable development-EUROSTAT ............................................................ 27
3.2 Overview of national initiatives in Europe ....................................................... 27
4 Problems and deficits ...................................................................................................... 33
4.1 General problems .............................................................................................. 33
4.2 Specific problems of the existing environment and health information systems .............................................................................................................. 34

5
4.2.1 Problems and deficits related to operational definitions ................................... 34
4.2.2 Problems and deficits related to indicators where data collection is difficult.............................................................................................................. 34
4.2.3 Problems and deficits related to data knowledge gaps...................................... 35
4.2.4 Problems and deficits related to the geographical scope of existing systems. ............................................................................................................. 35
5 Conclusions and recommendations ................................................................................. 36
5.1 Advantages and limitations of harmonised EH indicators................................ 36
5.2 Requirements for development of a harmonised EU-indicator set ................... 38
5.3 Missing links/data ............................................................................................. 38
5.4 Guidance for further development of international indicator set ...................... 39
Annex I: Questionnaires........................................................................................................... 41
Annex II: Tables....................................................................................................................... 85
Annex III: Exemplary International and National Indicator sets ........................................... 156

page 6
Executive summary
This report gives an overview of current activities with regard to environment and health indicator sets and (inter)national agencies and projects that collect data on environment and health. The scope of this report (environmental health issues covered) is wider than the priority areas mentioned in the SCALE- initiative, taking into account a broad definition of the living-environment (physical, chemical and biological factors) and looking at those factors with the highest burden of disease (in adults AND children). Food safety and working place indicators are discussed only when part of existing environment and health activities.
The information provided in this report is based on a summary of recent literature and international programmes on Environment and Health indicators. An inventory has been of national activities by sending out questionnaires and tables (see annex) to national contacts in EU and accession countries. Fifteen countries responded to this request for information. Due to the limited timeframe for reporting, this review is not complete. The most relevant projects are described though and the countries covered reflect a good mix of both EU and accessing countries.
Information is needed by decision-makers and the public to identify and quantify existing environmental health impacts, set priorities and develop and evaluate policies to prevent or diminish these problems. Indicators can play a role in turning data into relevant information. Environmental health (E&H) indicators are an expression of the link between environment and health, targeted at an issue of specific policy or management concern and presented in a form which facilitates interpretation for effective decision-making.
Before the construction of E&H indicators along a conceptual framework (preferably a multi-exposure multiple-effect framework) can take place, one has to decide which issues or key problems need to be addressed. In the area of environmental health there is no broad consensus about the key problems though, making the definition of a core set of indicators difficult. The most obvious method for selecting environmental health issues and indicators is by looking at the (estimated) burden of disease. Other important criteria for selecting and defining indicators are: fitness to a purpose (which issue to address, who will use it and why, eg high policy relevance), sensitivity to factor of interest (i.e. valid environment and health relationship), data-availability and comparability between countries/regions and methodological criteria (validity, sensitivity, timeliness, accuracy).
The weight of these criteria may differ depending on the scale or situation to cover. Since construction of indicators that meet all the abovementioned criteria is rather difficult a reasonable compromise should be made i.e. a set of ‘core’ indicators.
Problems and deficits of current systems
Current indicator systems (e.g. EEA-EEIS) are typically driven from the environmental perspective, mainly due to the fact that most environment-related diseases have a multi-exposure origin. An exception is the Environmental Health Information System project of WHO-Europe (WHO-EHIS). The WHO Europe approach is to provide a harmonised methodology of integrating environment and health information, which serves country needs and, at the same time allows for reliable international comparisons. Indicators have been developed for the following environmental issues: air (ambient and indoor ) quality, housing, traffic, noise, radiation, waste and contaminated lands, water and sanitation, food safety and chemical emergencies. Selection and further development of indicators was based on the

page 7
evidence for health-environment links, scale and severity of the problem, policy relevance, evidence for effective interventions and possibilities for actions. The current system of the WHO needs further development in order to provide comparable information, which can be regularly updated according to state-of-the art evidence and guidance on integrated health-environment assessments. Some of the topics included in the WHO-EHIS project are relevant for children (eg indoor/outdoor air pollution, water pollution). The SCALE priority diseases are not addressed in the current core indicator set. Current indicator systems or databases (HFA, ECHI, CHILD) address a broader range of issues than the priority diseases discussed in the SCALE-Initiative.
The main problems encountered in (inter)national data-collection and reporting activities are:
• differences in indicator definitions (geographical scale, age groups, time periods)
• differences in data collection/ reporting systems;
• lack of data quality control
• limitations of international reporting mechanisms in providing EH relevant data;
• many different dataholders;
• organizational aspects (mandates, roles and responsibilities).
Mechanisms for interagency cooperation and a shared information infrastructure such as EIONET and REPORTNET of EEA are urgently needed. EEA and WHO are already collaborating in the WHO-EHIS project, but the EHIS database and data-processing is no part of the EEA infrastructure.
Advantages and limitations of using harmonised environment and health indicators
Indicators play a valuable role in highlighting problems, identifying trends, and contributing to the process of priority setting, policy formulation and evaluating progress.
Indicators alone cannot identify cause-effect relationships between risk factors and health outcomes. If there is scientific evidence for a dose response relationship and population exposure estimates are available, quantitative health impact assessments can be carried out which may illustrate the environment-related health burden. Health impact assessments (HIA) can be included as part of the assessment of a specific indicator in the context of reporting (e.g. years of life lost due to air pollution). The results of these assessments have to be judged carefully though, since health status is also influenced by other risk factors.
There are numerous indicator sets available at local, national and international level which contain one or more indicators relevant to environment and health. Information about changes in time or between/within- countries may be more important than the absolute levels of the indicators. Thus, comparability of the underlying databases is of the utmost importance. Unfortunately, the indicators in the current international databases and indicator sets vary in operational definitions (age, diagnosis), geographical scale and quality. In addition, countries have to report to different organizations on the same issues, but sometime using slightly other indicator definitions. Thus, the development and use of a harmonised E&H indicator set to enhance data-comparability is recommended, taking into account different user needs at different levels, i.e. by developing different subsets or user-windows as has been done in the ECHI-project. The development of a harmonised indicator set and data-warehouse will enable

page 8
bench-marking, save resources, stimulate better use of existing data, increase comparability of data and enhance, easier and better communication to stakeholders and to the public and identification and prioritisation of research areas.
The added value of using EH indicators to address policy questions is in the combined analysis of both exposure and effect to obtain an expression, understandable by the decision-makers of the health risk associated with a specific environmental hazard. The purpose of the indicators to be selected/developed should be clearly defined (e.g. which policy aims should be evaluated).
It is important that the existing international agencies developing environment and health indicators (WHO, EEA, EUROSTAT) should cooperate to ensure the development of a harmonised set that can serve the different purposes of the organizations and countries.
Prerequisites for the development of a set of indicators which can be used to examine overall trends in health and environment in the EU are:
• Clear definitions of issues of current or future interest or concern • Standardisation of definitions • Establishment of centralized data base/information system • Standardisation of data collection (e.g. surveys or biomonitoring programmes) • Quality control for sampling and analytical control • Wide share of know how and access to data for countries and NGOs • Sufficient resources (personal and technical resources for data analysis and reporting) • Technical support for the development of an information exchange platform • Prevention of unnecessary reporting burdens for the countries to enhance compliance • Definition of the level (local, regional, national, EU) at which respective indicators
should be analysed Research and data needs
EH indicators are currently provided for areas such as air pollution, water, noise where the evidence of health impacts is widely accepted and appropriate epidemiological measures for health impact assessment exist. When the health–environmental linkages are less well understood e.g. health effects of housing conditions or long-term exposure to chemicals the priorities, including research, are in identifying appropriate health outcomes and epidemiological measures as well as in harmonising the methods applied. An important missing link in the data-analysis is the lack of socio-demographic data which could be delivered from other databases (e.g. Eurostat New Chronos).
The countries who responded to our inventory mentioned the following priorities for development and standardisation of indicators (in order of frequency of nomination): Noise, Water, Food, Housing, Air pollution, allergy and asthma, traffic. Most countries stress the need for harmonisation of indicators for asthma and allergy. Improvement and harmonisation of health surveillance and survey methods is needed in order to assess exposures in the living environment, their determinants and related effects on health.
The development of E&H indicators for the EU strategy for environment and health has to focus on the objectives of the strategy. Because no specific or quantitative objectives have been formulated so far, indicators cannot be proposed at this stage. The results of the different TWGs looking at the SCALE-priority diseases should be examined for the need of specific indicators that are not regarded yet in current information systems.
page 9
It will be extremely difficult to get more insight in the effects and interactions of combined exposures while using monitoring systems. Well- designed and population-based multicentre-studies will probably yield more insight in that complex question than the outcomes of monitoring programmes.
Guidance for further development of international indicator set
• An organisational framework should be set up, including a steering group with representatives from EU, WHO, EEA and Eurostat and a project group with representatives from the countries, NGOs and international projects. Main tasks of the steering group could be to ensure cooperation between the different agencies and relevant projects on the further development of EH indicators and enhance harmonised data-collection and exchange.
• Selection of priority areas to focus on, depending on the policy questions (eg transport, air quality, water quality, housing, food safety and the priority diseases mentioned in the EH strategy).
• Selection and definition of indicators. For the selection of European Union relevant indicators the set of WHO recommended indicators can be a starting point. Countries in different stages of development will need to focus on different indicator sets or specific selections out of the indicator sets. Since construction of indicators that meet all the criteria described in 2.3 is rather difficult, a reasonable compromise should be made i.e. a set of ‘core’ indicators.
• Testing of indicators for data-availability should only be done for newly-developed indicators. For the others the results of recent feasibility studies should be taken into account
• Development of data-exchange and data-control procedures as well as an information system structure. For this, the experience and data warehouse-infrastructure from EEA may be a basis. The WHO website under preparation could be basis for a web-based portal of EH information system. It would be extremely helpful if this portal can be linked to both the EU (EUPHIN) and EEA information systems.
In conclusion, the indicator activities of different organisations – WHO, EEA, European institutions and projects funded by them, OECD, UN-ECE – should be brought together and made compatible

page 10
1 Introduction: background and objective of EH Indicators
Environmental health is an important challenge facing decision-makers in the public health arena, balancing possible impacts on health and quality of life against costs of measures.
Information is needed by decision-makers and the public to identify and quantify existing and potential environmental health impacts, set priorities and develop and evaluate policies to prevent or diminish these problems. Indicators can play a role in turning data into relevant information. Information currently available from monitoring and surveillance programmes is of varying quality, not always comparable and not always in a form relevant for decision-makers to set policies. Based on the experience of the National Environmental Health Action Plans in Central and Eastern Europe, there is an urgent need for strengthening (inter)national environment and health information systems improving the quality of information, reporting and policy evaluation.
The European Commission’s recent ‘European Environment and Health strategy’ aims at describing the relationship between environmental factors and adverse health effects and will provide the information for a Community policy dealing with sources, impacts and pathways of health stressors. The Strategy has been launched as the SCALE-initiative. It comprises the development of information systems as well as the compilation of adequate political measures. Its themes are: Scientific evidence, focus on Children, raise Awareness, improve the situation by use of Legal instruments and allow Evaluation of the progress made. An Action Plan 2004-2010 is to be developed which will be the Commission’s contribution to the Fourth Ministerial Conference on Environment and Health in Budapest in 2004. Technical Working Groups have been established to contribute to the development of the Action Plan and priorities identified in the strategy.
This report is prepared by the Working group on Environment and Health Indicators. Our overview provides information on current Environment and Health (E&H) indicator sets and (inter)national projects that collect data on health, environment or general statistics, with a special focus on projects at a European scale. Problems and deficits of current systems are discussed, as well as the advantages of developing and using harmonised environment and health indicators.
International indicator systems may enable international comparisons, but should also reflect country-specific environmental health problems. National initiatives have also been evaluated, taking into account a broad definition of the living-environment (physical, chemical and biological factors). However, food safety and working place indicators are discussed only when part of an E&H project. Specific attention is paid when possible to children and the priority diseases mentioned in the SCALE-strategy (respiratory diseases, childhood cancer, neurodevelopmental diseases). The report concludes with requirements and guidance for the development of harmonised E&H indicators and the possibilities for integration of existing activities and programmes.
The information provided in this report is based on a summary of recent literature and international programmes on (E&H) indicators. An inventory of national activities has been realised by sending out questionnaires and tables to national contacts in EU and accession countries. About 15 countries (60% of Accession Countries and Member States contacted ) responded to this request for information. Due to the limited timeframe this review is not complete. The most relevant projects are described though and the countries covered reflect a good mix of both EU and accessing countries.

page 11
2 Use and construction of Environment and Health Indicators, framework for linkages
Environmental health (EH) indicators are an expression of the link between environment and health, targeted at an issue of specific policy or management concern and presented in a form which facilitates interpretation for effective decision-making. Criteria for selecting and defining indicators are: the (estimated) burden of disease, fitness to the purpose (which issue to address, who will use it and why), sensitivity to factor of interest (i.e. .valid environment and health relationship), methodological criteria (validity, sensitivity, timeliness, accuracy), understandable and usable.
2.1 Definitions and different approaches to Indicators for Health and Environment
Indicators for Environment and Health are information tools regarding the link between environment and health. Therefore their design depends largely on the target group for which the information is provided.
Indicators give statistics or primary data added value by converting them into information which is of direct use to the target group. This may be political decision-makers as well as the public. In general, a specific indicator is designed because of, or reflecting, a political question (issue).
Indicators can be used for monitoring changes over time and space. But they cannot replace carefully maintained monitoring systems and scientific analysis, neither are they meant to establish cause-effect relations. Moreover, indicator systems are dynamic and flexible. They should be open to emerging new issues or environmental factors of concern.
The OECD describes indicators as: ‘parameters which describe the state of a certain environment/area with a significance extending beyond that directly associated with a parameter value’, e.g. measurements of air pollution results in raw data which can be aggregated. These statistics can be analysed and combined with population data in the form of indicators such as the number of days on which air quality guidelines are exceeded or the share of the population exposed to certain air pollutant concentrations.
According to the EEA and WHO, environmental health (EH) indicators are an expression of the link between environment and health, targeted at an issue of specific policy or management concern and presented in a form which facilitates interpretation for effective decision-making. Environmental indicators represent indicators, which describe the environment without any explicit or direct implications for health; health indicators are those, which describe the status of, or trends in health without any direct reference to the environment.
As such, an EH indicator can be seen as a 'measure' which summarises in easily understandable and relevant terms some aspect of the relationship between the environment and health which is amenable to action. To be useful EH indicators must relate to an issue of current or future interest or concern. This implies that we know what purpose we want them for and who will use them in order to define and design them accordingly (Briggs).
According to EEA different types of indicators can be distinguished (EEA):

page 12
descriptive: baseline information on spatial and temporal trends in environment or human health (e.g. biomonitoring of Persistent Organic Pollutants (POP) or Heavy Metals (HM))
performance: linked to reference value or policy target, illustrating how far the indicator is from a desired level (e.g. exposure indicators)
efficiency: illustrates efficiency of political measures (e.g. reduction of air pollutant emissions)
total welfare indicators (e.g. perceived quality of life)
2.2 Use of indicators
Some indicators are more relevant to national or international/global issues while others are more relevant locally. The roles and responsibilities of different tiers of government in managing various health and environment problems, the degree of decentralization of powers and factors such as data availability and quality will influence the extent to which data for indicators at different level should be examined (WHO).
Current indicator systems address a broader range of issues than the priority diseases discussed in the SCALE-Initiative. They are typically driven from the environmental perspective (e.g. air quality, water quality, housing (eg indoor air quality) and sanitation, noise, radiation, chemical safety, hazardous waste and contaminated lands, traffic accidents) and do not focus on specific health outcomes (endpoints) that are associated with environmental factors.
This is mainly due to the fact that health outcomes (e.g. priority diseases in SCALE) are a result of combined exposure to several health determinants (endogenous and exogenous: physical and social environment, life style). Not only environment is relevant. Moreover the association between exposure and health effect show a considerable time-lag so that indicators, even if defined properly, may not be sensitive enough to provide timely information.
Illustrative scheme for environmental determinants of health Host State → Exposures → Health effects Genetics Age Gender Individual Susceptibility
Air pollutants (e.g. PM10/2.5, Ozone, NOx) Noise Chemicals (e.g. PCDD, ED, HM) Radiation (e.g. UV, Radon) Biological vectors
Quality of Life Morbidity Mortality
EH indicators are currently provided for areas such as air pollution, water, noise where the evidence of health impacts is widely accepted and appropriate epidemiological measures for health impact assessment exist. When the health–environmental linkages are less well understood e.g. health effects of housing conditions or long-term exposure to chemicals the priorities, including research, are in identifying appropriate health outcomes and epidemiological measures as well as in harmonising the methods applied.
page 13
2.3 Construction of indicators
There are many requirements as to how indicators should be selected and defined in order to be useful. Current indicator sets are typically constructed in a certain framework. These frameworks try to resemble the cause-effect chain by linking the exposure of a population to the conditions that lead to the observed situation. They can be used to assess the efficiency of political actions implemented to respond to these problems. Several conceptual frameworks are used currently.
Environmental Information Systems in Europe adopted the DPSIR conceptual model (Driving forces, Pressure, State, Impact, Responses) derived by the PSR model (Pressure, State, Responses) of OECD.
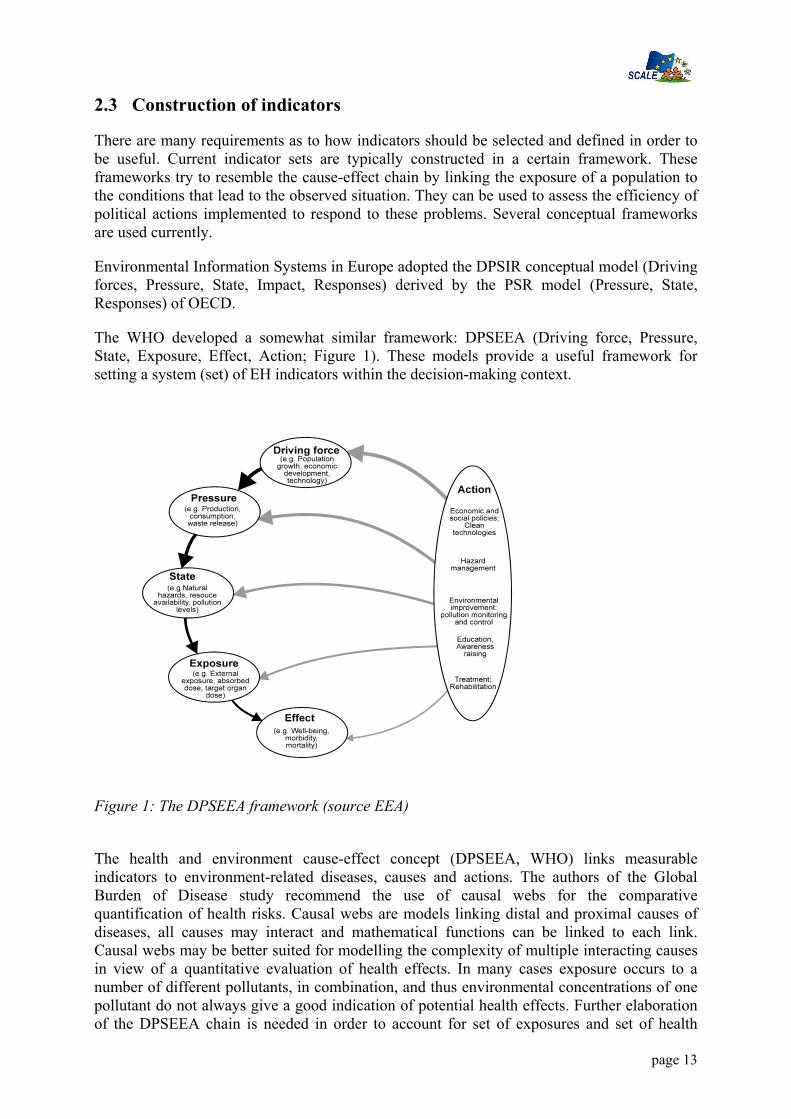
The WHO developed a somewhat similar framework: DPSEEA (Driving force, Pressure, State, Exposure, Effect, Action; Figure 1). These models provide a useful framework for setting a system (set) of EH indicators within the decision-making context.
Figure 1: The DPSEEA framework (source EEA)
The health and environment cause-effect concept (DPSEEA, WHO) links measurable indicators to environment-related diseases, causes and actions. The authors of the Global Burden of Disease study recommend the use of causal webs for the comparative quantification of health risks. Causal webs are models linking distal and proximal causes of diseases, all causes may interact and mathematical functions can be linked to each link. Causal webs may be better suited for modelling the complexity of multiple interacting causes in view of a quantitative evaluation of health effects. In many cases exposure occurs to a number of different pollutants, in combination, and thus environmental concentrations of one pollutant do not always give a good indication of potential health effects. Further elaboration of the DPSEEA chain is needed in order to account for set of exposures and set of health

page 14
effects rather than a single pollutant exposure – effect model. A multiple-exposure, multiple-effect (MEME) framework has been proposed, which focuses on a situation with multiple exposures to environmental risk factors (Fig. 2 Briggs, 2003).
It will be extremely difficult though to get more insight in the effects and interactions of combined exposures while using monitoring systems. Well- designed and population-based multicentre-studies will probably yield more insight in that complex question than the outcomes of monitoring programmes.
FFig. 3 The MEME framework
A conceptual framework can be useful where information about determinants of an environmental condition is not available.
If this information is already available it can be used to reduce the amount of data analysis and reporting. Most of the indicator projects discussed in Chapter 3, however, underline the need for groups of indicators for policy analysis (pressure, state of environment, health and socio-demographic indicators/data).
2.4 Considerations for selection of Environmental Health issues and indicators
The construction of E&H indicators along a conceptual framework faces one more challenge: the definitions of issues to address. In some areas of application, such as environment and economy, a broad consensus exists about what the key problems are. Core set of indicators can thus be developed on this basis. In the area of environmental health, however, this consensus is less established, and this makes their definition more difficult.
The most obvious method for selecting environmental health issues and indicators is by looking at the (estimated) burden of disease. In the Netherlands around 2-5% of the total disease burden (expressed in DALYs) may be attributed to environmental risk factors. The main contributors to the environment-related disease burden in the Netherlands are air pollution, noise and the indoor environment (Melse & de Hollander; RIVM, 2000). The environmental burden of diseases in high-income countries in the OECD-region is 1-4 % and in low-income countries 4-7 %. In non-OECD countries the burden of disease is much higher (8-12%). Based on this burden of disease approach the following (tentative) prioritisation of diseases and issues can be made (RIVM, 2001):

page 15
OECD
High income Lower income Diseases Cardiopulmonary diseases Communicable diseases Cancer Cardiopulmonary diseases Depression Cancer Issues Air pollution Sanitation/food/housing Chemicals Air pollution Noise / quality living
environment Chemicals
Sectors Transport Public hygiene/housing Industry/agriculture Transport/energy Housing Industry/agriculture
Criteria and guidelines for Indicators
The following criteria are important in identifying and developing environmental health indicators. In general, the indicators should:
• Relate directly to the specific environmental health issue and to environmental and/ or health conditions that are amenable to action (‘fitness to a purpose’)
• Allow addressing specific policy questions related to environmental health impacts in vulnerable groups, in particular children.
• Consistent and comparable over time and space, hence appropriateness for monitoring • Be based on a valid environmental exposure – health outcome relationship according to
the best available scientific evidence and at the same time allowing for some flexibility according to the “precautionary principle”.
• Prevent duplication of efforts by taking closer account of national and international work and related indicator sets in practice
• Be clearly defined hence understandable and usable at different levels • Be measurable – based as much as possible on existing routinely collected and quality-
controlled data and accessible (input/ output of the information system) at different levels (e.g. national, regional, municipal)
• Meet a number of general methodological criteria concerning validity, sensitivity, timeliness, accuracy.
• Transparent (e.g. composite indicators are less transparent, useful for comparison, less useful for disentangling influence of actions)
• Acceptable for all stakeholders involved
The weight of these criteria may differ depending on the scale or situation to cover. Since construction of indicators that meet all the abovementioned criteria is rather difficult a reasonable compromise should be made i.e. a set of ‘core’ indicators.

page 16
3 Overview on knowledge and activities on Environment & Health Indicators
This chapter gives an overview of international (3.2.1) and national (3.2.2) experiences of existing environmental, statistical and health information systems (indicators, databases, data-exchange and reporting mechanisms). Detailed description of the main indicators for a given set is described in annex II and III. Comparability of the indicators and underlying datasets is important. Based on the questionnaires and tables returned by the international contacts we evaluated the (inter)national activities and systems with regard to the following major issues:
1. Indicators identified: the main groups are identified. Information on the operational definition is presented in the annex.
2. Relevance/usefulness of the indicators identified: relation to a policy objective or existing standards, ease of understanding and interpretation, with an action orientation.
3. Data quality and reliability: use of standardised methodology for data collection and quality control/ quality assurance system, spatial coverage and spatial resolution concerning sources/ pollutants and population concerned, stratification/ aggregation (age, gender, area, time), existence of regular population-based surveys;
4. Collecting tools and accessibility: existence of inter-institutional framework for data access/exchange, accessibility through electronic networks in common, simple format, accessibility of the data at central level, resources data collection;
5. Problems, benefits and priorities for further harmonisation of indicators
3.1 Current systems to collect data for the development of Environment & Health Indicators
3.1.1 International projects
The international indicator sets and databases can be divided in the following areas:
1. Environment & Health: the Environment and Health Information System (EHIS) of WHO-Europe.
2. Public health: the Health For All (HFA) database of the WHO, European Community Health Indicators programme (ECHI – EU), the project CHILD dedicated to children’s health and the OECD Health;
3. Environment: with OECD and EEA as the main responsible agencies
4. Sustainable development: with UN CSD, OECD, World bank as main organisations.
5. Local: A number of international initiatives exist with a particular focus on local scale such as WHO Healthy cities, European sustainability cities and Local agenda 21.

page 17
6. General: Eurostat indicators address different areas based on the statistics reported/collected by them.
The public health indicator systems are built mainly according to the following structure: socio-demographic, health status, health determinants and health care systems. The EHIS project of WHO is one of the few projects specifically aimed at developing an information system for environment and health problems.
3.1.2 WHO-‘Environmental Health Indicator System’ (EHIS)
The WHO Europe approach is to provide a harmonised methodology of integrating environment and health information, which serves country needs and, at the same time allows for reliable international comparisons. The indicators and main tools have been developed and tested by an internationally coordinated network of experts (http://www.euro.who.int/EHindicators ).
15 WHO-Member States and the EEA participate in the WHO-EHI project:
EU Member States: Finland, Germany, The Netherlands, Spain, Sweden (technical support);
Accession Countries: Armenia, Bulgaria, Czech Republic, Estonia, Hungary, Lithuania, Romania, Slovak Republic
and Switzerland.
Between 1999 and 2003, project activities aimed at combining dispersed results, experiences and analyses into a comprehensive and practical framework.
Indicators/Relevant issues:
10 health-relevant environmental issues were selected:
• air (ambient and indoor ) quality
• housing
• traffic
• noise
• radiation
• waste and contaminated lands
• water and sanitation
• food safety
• chemical emergencies and
• workplace conditions.
Selection and further development of indicators was based on the evidence for health-environment links, scale and severity of the problem, policy relevance, evidence for effective interventions and possibilities for actions. Indicators are constructed as interlinked in terms of upstream determinants, environmental risks and health effects, actions according to the

page 18
DPSEEA structure (chapter 2). A feasibility study to test data-availability was carried out in some of the participating countries to reach a multinational consensus among experts on a set of “core” indicators, allowing assessment of the environment and health situation in the countries and across Europe. An extended set was also developed with indicators which need further development (see Table 1 Annex III).
Testing:
Pilot testing took place in 12 WHO Member States participating in the project to identify and analyse the national databases, test the mechanisms of data exchange & integration, processing, information analysis as well as reporting for selected indicators. A clearly structured indicator fact-sheet was adopted as the basic reporting tool.
Collection tools:
Tools and methods for the technical system infrastructure have been developed consisting of specialized software for uniform collection, processing and exchange of environment and health data at the sub-national, national and international levels. A web-based ‘portal’ for the EH information system is currently under development. It will provide a common forum for data exchange and information sharing, and facilitate access to information of different levels of details depending on the user needs.
Reporting:
An International Indicator-based Report demonstrating the system (including chapters on air pollution, water and sanitation, noise and traffic accidents, guidance on the national implementation and software tools for system operation) for the Budapest Conference in 2004 is under preparation.
ECOEHIS:
In 2002 WHO/Europe launched the project ‘Environmental Health Indicators for European Union’ which is co-funded by DG Sanco. Participating EU Member States are Austria, Sweden, Germany, Italy, Spain, Portugal, Finland, Belgium, The Netherlands, Denmark and France.
The ECOEHIS scope is set in Annex II of the decision No. 1400/97/EC and comprises Housing conditions: Home and leisure activities (the subset “accidents at home”); Transport: Road accidents; External environment: air pollution, water pollution, radiation and other types of pollution, including noise but excluding food safety. The main objective is to propose an EH indicator set applicable in supporting national policies and action on protecting health and preventing risk across the European Union.
Substantial part of the work is the verification of the EH indicators compatibility with the European Community legislation to assess applicability in supporting national policies and action on protecting health and preventing risk across the European Union. A substantial part of the WHO-developed EH indicators can be based on the existing reporting systems required by current EC legislation. Health related indicators for housing conditions, noise and road transport safety will be further developed. The refined indicator set as a part of the ECHI framework is to serve the European Community Health Monitoring system. The proposal for a refined indicator set will be discussed with the participating MS in January 2004. The proposed indicators will be assessed for feasibility and pilot tested.

page 19
Relevance, problems, benefits of the system and priorities for further development
The current system of the WHO needs further development in order to provide comparable information, which can be regularly updated according to state-of-the art evidence and guidance on integrated health-environment assessments. It allows use and re-use of existing information and where necessary guidance for setting priorities for data collection and monitoring (e.g.of WHO when dealing with environmental monitoring).
Some of the topics included in the system are relevant for children (eg indoor/outdoor air pollution, water pollution). Specific age groups are currently not analysed. The SCALE priority diseases are not addressed in the current core indicator set, since they require major work on harmonistion of the methodological approaches. Several survey methods on e.g. respiratory health, exposure to indoor air pollution – have been selected and recommended (WHO, 2002). For housing, tools are under development.
The main problems encountered are:
• differences in data collection/ reporting systems;
• limitations of international reporting mechanisms in providing EH relevant data;
• data exchange with many holders;
• organizational aspects (mandates, roles and responsibilities).
Mechanisms for interagency cooperation; priority data-flow and a shared information infrastructure (together with EEA) are urgently needed. Improving health surveillance and survey methods have to be considered in order to assess exposures in the living environment, their determinants and related effects on health.
3.1.3 Public Health Indicator projects (ECHI)
Indicators/relevant issues
The European Community Health Indicator project (ECHI) has presented a proposal for a set of Health Indicators. The set covers the public health priority areas of the EU Member States and the Commission (including items such as inequity and children’s health). Indicators are included on demographic and socio-economic factors, health status, determinants of health (including physical environment) and health systems. Driving forces are not included in the set. Selection of disease categories has been primarily based on the size of population impacts (expressed as DALYs). In addition, diseases have been selected because they are related to specific determinants or may be an emerging threat. Table 6 in Annex III gives an overview of the proposed diseases and their data source.
Data collection
In the second phase of the project the implementation of these indicators is enhanced. No new databases are being developed. The project takes place in close cooperation with all relevant EU-HMP projects and Eurostat. All MS and Acceding Countries are involved in the project. The statistical results will be directly loaded in the database NewCronos of Eurostat. The project deliverables as well as all databases from other international organisations will be

page 20
directly accessible via the EUPHIN (European Union Public Health Information Network) currently developed by DG SANCO.

page 21
Relevance and benefits of the indicator set:
At present the ECHI indicator list is based on available data existing in WHO, OECD, Eurostat, plus results of some HMP projects. The WHO-ECOEHIS set is part of the ECHI-project. Harmonisation of the operational definition of selected EH diseases (eg age breakdown) with the ECHI-set is currently under way. The ECHI set is flexible. It has developed a concept of ‘User-Windows’ which allows to work with interest-oriented subsets of indicators (e.g. EH indicators). For different purposes different sets of indicators can be studied (eg environmental health). ECHI is increasingly used as focus for co-ordination between HMP projects in different areas. The project also gives guidance for the stratification of data by age, gender and (if possible) by SES and region. In the HMP project on regional use of data regional levels are recommended for each MS.
3.1.4 The Child Health Indicators of Life and Development (CHILD) Project
The Child Health Indicators of Life and Development (CHILD) Project is a third-wave project in the European Union Community Health Monitoring Programme. It is the first project to cover a particular population group, namely children. The project philosophy was underscored by recognition of the multiplier effect of the burden of ill health in children, when compared with that upon adults. It can have not only a much longer life-time effect given the greater lifespan ahead for a child, but will also have an extended impact upon parents, families, and society. In essence, ill health in children, particularly when it is medium to long term or produces impairment and disabling effects, has the following potential generation of burden:
• Burden of discomfort and pain on the child
• Burden of anxiety, distress, and possibly loss of earnings for the parent(s) looking after the sick child
• Burden on society funding the health services, and on occasion special education and social services support
• Burden in more severe cases on the social welfare system, potentially for a lifetime.
• Burden caused by medium or long term illness causing loss of normal play and socialisation, thus impeding normal development with potential life long effects
• Burden caused by lost education which may jeopardise career and thus income potential for a lifetime
• Burden on future generations, as the child with an extended ill health burden becomes a parent with restrictions on their parenting skills, and becomes an older family member dependent on their successor generation.
In essence, the responsibility of child health services is an exponential one – not just to maintain and protect the health of the child for the immediate benefit of health in childhood, but with recognition that failure in this respect can have life-long health, lifestyle, social and economic impacts. Whilst Disability Adjusted Life Years (DALYs) have been postulated as a means of calculating ongoing burden of illness or accident, they are not adequate alone in the child health context.

page 22
3.1.5 European Environmental Information System (EEIS)
Indicators/relevant issues:
The European Environmental Agency (EEA) has, since 1999, given higher priority to the development and publication of policy relevant indicator-based reports including Environmental Signals reports, and sector-specific reports on transport (TERM), and energy (EERM). These experiences suggest indicators should be replicated for the other sectors and the environmental issues that the Agency supports through its work programme. The added value of a core set of indicators explicitly linked to policy objectives, includes:
• stability to data flows with EIONET and elsewhere
• a solid basis for the use of Reportnet (see below) infrastructure and tools
• improved data quality and comparability due to more stable data flows
• policy relevant assessment support to EU policy processes, promoting the use of the same information for many purposes.
In 2002 EEA launched a European consultation asking countries and NGOs to comment on the overall EEA set and the individual indicators. EEA has revised the core set based on the country comments and other considerations, like high priority score, the consistency and linkage in the indicator sets or the linkage between the EEA core set and other international environmental indicator activities. A 2nd round consultation was launched (ended on October 2003) asking clients to comment on the proposed indicators and their coherence/balance across environmental issues and sectors and the “short-term indicators’ identified within the core set. A short term-indicator implied:
• High policy relevance + existing fact sheet; • Methodology well developed and in many cases also in other international sets. • Indicator can illustrate temporal trend and comparability between countries. • Data are available for most countries in 2003. • Data expected for all countries 2004/05. This is the basis for the development of the 2003 EEA core set of policy-relevant indicators for six environmental issues (air pollution, climate change, water, waste and material flows, biodiversity and terrestrial environment) and five sectors (transport, energy, agriculture, tourism and fisheries). The proposed EEA core set (available on www.eea.eu.int) contains in total 354 indicators. The indicators relevant for environment and health are shown in table 4 in Annex III. Indicators describe exceedance days of air quality targets; increased ultraviolet radiation due to ozone layer depletion; potential impact of climate change on human health; aspects related to water, sanitation and the quality of drinking and bathing water and shellfish poisoning due harmful algae blooms and the quality of fish for human consumption. In addition, there are indicators covering the impact of transport such as people affected by transport noise and transport accidents, fatalities and number of people injured.
European Environment Information System
There is a wide international and European environmental reporting community, i.e., a network of environmental information providers. Their joint networks can be called the European Environment Information System (EEIS). The community that makes the EEIS also consists of other networks such as Eurostat and its data providers, or the various permanent or ad-hoc networks which are built around European and national scientific organisations or
page 23
NGOs. All these are providers or users of reported environmental data. Inside EEIS, the European Environmental Agency (EEA) leads the necessary standardisation and harmonisation efforts. The heart of the European Environment Information System is a shared information infrastructure that enables information exchange and dissemination.
The information provided by the EEA focuses in particular on assessing the current and future state of the environment across Europe and the pressures upon it. The Agency's tasks also include disseminating best practice in environmental protection and technologies, and supporting the European Commission in diffusing information on the results of environmental research. The Agency both gathers and distributes its data and information through the European environment information and observation network (EIONET), which brings together just over 300 environment bodies, agencies, public and private research centres and centres of expertise across Europe. The EEA is responsible for coordinating the EIONET. EIONET is only one network contributing to the shared information pool. EEA networking activities recognizes several partners: EIONET partners in the 31 member Countries, EC services and programmes and international organizations (UNEP, UNECE, WHO, OECD, WMO).
Data collection, exchange and reporting infrastructure
Reportnet is the new architecture and application suite proposed by EEA to support the development of a European Environment Information System (EEIS). This new system is conceived as a shared information infrastructure that should allow better use and reuse of the reporting information, leading to reduction of the reporting burden at the national level, while providing the international community with better, faster and more policy-relevant information.
The EEA long-term vision is to get agreement between countries and international institutions (both EU and non-EU) on a common core set of indicators and underlying data flows. These would then be implemented through the EEIS, so that data would be reported once by countries (e.g. through Reportnet’s content repositories) and are made accessible to all the institutions and networks that form the EEIS, for their own institutional purposes. Reportnet will have components for reporting obligations, metadata, directory services, data repositories, and process monitoring, and would be built using - and contributing to - IDA (Interchange of Data between Administrations) common tools and techniques. EEA – with the support of the IDA Programme – has already developed a basic technical infrastructure for a network for environmental data exchange (e-EIONET).
This basic infrastructure will be further extended to cover also data harmonisation. It will be supported by a framework of data standards, data exchange formats, communication protocols, and directories that form an information infrastructure enabling information sharing and interoperability of applications and tools. More tools are on their way and soon form an integrated suite that covers most functions required from a data collection network. These tools and the applications they make will be implemented more and more in Open Source allowing for better exchangeability and maintenance. EEA aims at showing a best practice example to be shared with other stakeholders through the development of the EEIS concept, the supporting information infrastructure and its implementation through Reportnet. While the architecture shall serve the immediate EIONET needs on one hand, it is open to interface with other networks’ technical solutions.

page 24
Data-exchange
National repositories are a stable location for national data deliveries instead of ad-hoc data transmission in form of e-mail attachments. Systematic implementation of data repositories for EIONET Priority Data Flows started in 2002 when countries were offered the following two options for the storage of national data:
• distributed national data repositories implemented in CIRCA • the Central Data Repository (CDR) at EEA. The basic requirement for a successful implementation of this core element of the Reportnet framework is that every country clearly identifies and uses one of the proposed repository options. In both cases, countries have the responsibility for uploading their data. 23 countries have chosen CDR as the place for storing their data files, 7 countries have decided to use their national CIRCA for this purpose. This is linked to a content registry that enables transparent tracking of data delivered under the EIONET Priority Data Flows. Meta-information about data uploads is harvested every night and searchable through a web-interface.
Besides networking activities to develop and interconnect the means for Europe-wide environmental data gathering and processing, a major activity of the EEA is offering a reliable, cohesive, simple, low cost routine monitoring to reporting system on the environment. It seeks to deliver timely, comparable, harmonised data and integrated environmental assessments. To support policy action EEA is also acting as a centre of excellence and as a single clearing house for environmental data by encouraging harmonisation of methods of measurement and providing uniform assessment criteria.
EIONET is a collaborative network of the European Environment Agency and its Member Countries, connecting National Focal Points (NFP, responsible for coordination of national activties related to EEA work programme) in the EU and accession countries, European Topic Centres (multi-national consortia responsible for data collection in their topic area) and National Reference Centres (NRC, providers of national environmental data). These organisations jointly provide the information that is used for making decisions for improving the state of environment in Europe and making EU policies more effective.

page 25
An example of Integration and data-exchange between European and National Systems:
EIONET and the Italian Environmental Information and Monitoring System
Legend
ISTAT: National Statistical Institute
SINAnet : The Italian Environmental Information and Monitoring System APAT: National Environmental Protection Agency (RFPs)Regional Focal Points RFPs are the territorial partners within the System. PFRs are appointed by the Italian Regions and Autonomous Provinces to ensure data-flows and information relevant to national and European level, as a result of monitoring and inspection activities performed in their territories. (NTCs)National Topic Centres NTCs are the thematic nodes of the System with reference to specific environmental topics; they are operated by a group of ARPA/APPA, and integrated by selected MRIs. NTCs support APAT in the role of National Reference Centre of EIONET. The work programmes are defined on a multi-annual basis. (MRIs)Main Reference Institutions MRIs are Institutions or public organisations having - at the national and European level - knowledge relevant to NTCs’ environmental topics.
Benefits, problems and priorities for further development
The EEA has the following priorities with regard to indicator production and data collection: To confirm with other organisations respective responsibilities on indicator production and data flows, in particular with Eurostat, but also with OECD and international conventions interested in co-operation on common approaches to indicators.
• To build into the EIONET Priority data flows for those indicators for which the EEA has responsibility and put these on a regular cycle, either annual or regular.

page 26
• To link the EEA indicator management system to those managed by others e.g. Eurostat as a component of the “shared information system” envisaged as part of the streamlining process.
• To produce regular (non-annual) thematic and sector indicator-based reports.
• To review the core set of indicators in three years time after the publication of the next EEA State and Outlook report.
Moreover the EEA has announced the establishment of a methodological framework in which to analyse environment and health issues and the development of a set of environment and health indicators to track key environmental stressors, such as air quality and indoor pollution on human health, in consultation with EEA member countries and the World Health Organization (EEA Strategy 2003). The EEA is fully involved in and benefits from the WHO Regional Office for Europe-EHIS approach (see 3.2 andWHO document EUR/03/5045637/8). The main tools and methods have been developed and tested through internationally coordinated work in the framework of the WHO Regional Office for Europe project on environmental health indicators, carried out in collaboration with the EEA and the EC (DG SANCO), as well as 22 Member States. At present, internally to EEA own developments, there are already a number of relevant environment and health indicators in the EEA core set (Annex III). Most of these indicators are state or health-relevant exposure indicators; a few environment-related health indicators (noise annoyance, transport accidents) are included.
3.1.6 Indicator projects at local level (Sustainable cities)
WHO Healthy Cities Project collected indicators in phases I and II of the project from 47 cities. In phase I there were 53 indicators, with definitions, method of calculation and unit of measurement, in four domains -health, health services, environment, socio-economic. A report 'Healthy Cities Indicators' was published by WHO (Copenhagen) in 1996. No full report has been made of the phase II indicators. The work stimulated collection of indicators by the European Sustainable Towns and Cities Campaign, which has these published on http://www.sustainable-cities.org/home.html.
Indicators/relevant issues
The scope of the EC-project 'European common indicators – Towards a local sustainability profile' is to develop an information system about sustainable development in the city. Up till now there are 150 towns from 22 countries involved in the project. The indicators devloped (see table 8 Annex III) are programmed special for the use at the local (city) level.
Datacollection and reporting
The coordination of data collection is done through city administrations (local level). Citizens, NGO, enterprises and city administrations are involved in the local projects. Public accessibility is crucial. The results are presented through pressconferences, web sites, and regular reports, in the booklet European Common Indicators and on the web site www.sustainable-cities.org/indicators. The results are reported at least once per two years or more frequenty depending on nesessity. The project is payed from municipal budgets. The cost of collecting an indicator set is around 40.000 EUR for cities up to half million inhabitants.

page 27
Relevance, problems and benefits of the indicators for local level
A major benefit of the project is that cities measure impacts of urban activities and monitor progress on Local Agenda 21 with the same methodology. The exchange of experiences between the cities and cities network is also important. There is no established processing methodology for data control, except for the indicators on local contribution to global climate change, air quality and noise pollution. There are no specific indicators for children except the children's journeys to and from school (6 – 15 years).
3.1.7 Sustainable development-EUROSTAT
Eurostat is developing environmental and health indicators as part of the sustainable development indicators set. It includes 4 sets of indicators related to human health protection, food safety and quality, chemicals management and environmental quality affected to life.
(see table 7 Annex III). The objectives of these sustainable development indicators are to address some themes developed in the 6 European Action Program or other policies such as:
• contribution to a better quality of life,
• the enhancement of health education,
• tackling issues related to outbreak of infectious diseases and resistance to antibiotics,
• safety of food at all levels in the food chain,
• the production and usage of chemicals,
• air quality aspects,
• water quality aspects,
• noise
It includes short and long term environmental and health indicators. The methodology to collect the different indicators or the availability of the information is not clear and should be further identified.
3.2 Overview of national initiatives in Europe
16 countries responded to the request for information: 10 from EU member states, 6 from accession countries (see annex I & II). In these countries the domain of environmental health is very broad and concerns many issues ranging from air pollution to infectious diseases related to water and food safety. All the countries who responded are partners of the EEA, and provide information on the indicators in the EEA set. But although the EEA set includes many indicators that are relevant to health they are not constructed as E & H indicators.
Indicators/Relevant issues (developing or in use)
In 1999 countries in the WHO-Europe region agreed to implement National Environmental Health Action Plans (NEHAPs) stressing priorities and action targets before 2003.
Many countries except some Mediterranean ones (e.g. not Italy, Spain, Portugal) did this effort.

page 28
Denmark has developed a national strategy for sustainable development, for which the main target is the constant decrease of pollutant levels in products, food, working environment, traffic and indoor conditions. One of the targets of the Dutch NEHAP is to develop a permanent monitoring and information system based on a centralised manageable set of indicators illustrating the relationship between environmental factors and health.
For the Netherlands, the main goal of the NEHAP is a healthy, safe, clean and attractive living environment, integrating environmental health in urban renewal plans. Thus, for the Netherlands the current WHO-EHIS set of indicators is not sufficient to evaluate their EH policies.
Germany published the NEHAP in 1999. The Federal Environmental Agency (UBA) and the Federal Ministry of Environment in 2002 started an initiative to develop a core indicator system that gives information according to the thematic structure given by the 6th Environmental Action Plan of the EU. It includes 11 indicators for environmental health, some where derived from the WHO-EHI project. The indicator based trend report will be published biannually starting in 2004.
In the United Kingdom national initiatives focus mainly on EH indicators for the topics housing and water.
Most countries collect data and produce information for their specific national laws. At the same time most countries have or are in the process of translating the European Directives on Air, Water, Food Quality and radiation protection in national laws.
As a consequence following indicators are available at a central organisation in every country:
• Air quality indicators are collected in most cities of Europe.
• Drinking water and bathing water quality monitoring and
• Food quality
• Traffic and noise indicators (usually annoyance)
(see tables in Annex II).
For the different environmental issues the following indicators are most often used:
1. Noise The main indicator is the % of population exposed to noise annoyance.
2. Water % of results above national legal limits (or rates) cases of diarrhoea among children attributed to water pollution. France is actually implementing practical research in order to link gastro-enteritis and diarrhoea syndromes detected by medical insurance reimbursement with water measurements coming from water monitoring systems.
3. Housing Most indicators concern housing quality, e.g. number of persons per flat, satisfaction with/perception of housing quality (e.g. in the Netherlands). Some countries also monitor the amount of pollutants in indoor air using surveys at permanent or at irregular intervals (e.g. France, Germany).

page 29
France has recently implemented a surveillance system on carbon monoxide accidents in home since most of those accidents can be avoided and they are severe.
Member States seem to base their monitoring system on the measurement of air pollution, whereas Accession countries also focus on health monitoring (number of children with respiratory diseases).
France, the Netherlands and other countries target their surveillance on the measurement of the correlations between air pollution indices and effects (hospital admissions) on the basis of time series.
Data quality and control
Most of the national data described in the tables are considered to be adequately controlled for quality. Nevertheless for some Accession countries that have to implement a new monitoring network (e.g. Czech Republic, Bulgaria) the quality of some indicators is not yet adequately controlled.
In the new surveillance monitoring projects such as “surveillance of 9 cities air pollution” in France, evaluation of the data quality and reliability is an ongoing and continuous process.
Data collection and exchange
In almost all countries environment and health data are located at different organisations that up to now are also the data-holders.
• Food measurements are very often the responsibility of Ministries of Agriculture.
• Air and water quality measurements are often under the responsibility of the Ministry of Environment,
• Effect-indicators are almost always under responsibility of the Ministry of Health.
• For radiation measurements some countries (France, Germany, UK, Sweden) have established specific institutes which collects information concerning radioprotection and ionising radiation.
In many countries information is currently still divided among various organisations which produce different parts of the EH information.
Additional problems occur due to the federal structure of some countries.
In Countries like e.g. Belgium, Germany with a strong federal structure or structured autonomous regions centralised information at the national level is not available or difficult to collect.
Furthermore in most countries, except perhaps at the European level (WHO-EHIS), there is no central data warehouse or network with centralisation of the data. This can lead to the curious situation that in some cases information from one organisation passes to the other one via European databases such as HFA or Eurostat.
To tackle the problem in France specific agencies have been created in the last time to co-ordinate the information collection or centralisation of the data.

page 30
The AFSSE (French National Agency for Environmental Sanitary Security) is in charge of co-ordinating the environmental health expertise but is not a data producer in itself.
The InVS (National Institute for Health Surveillance) has the mission of implementing surveillance of environmental health problems to support policy strategies and of launching the alert for urgent environmental events dangerous for public health.
In the Netherlands one of the actions in the NEHAP is to develop such a central data-warehouse as part of the Environmental Health information system.
In Italy specific laws define reporting obligations and rules for data collection for the different institutions (health, statistical and environmental) belonging to the National Statistical information network SISTAN.
In Belgium, initiatives are being developed at different levels. An integrated project has been developed in the Flemish region and is in its implementation phase. The “Steunpunt project” in Flanders has identified a list of 42 indicators. Part of those indicators is already integrated in the annual yearly environmental report (MIRA report).
In Wallonia, the recent development of the environmental and health platform is aimed to give an overview on existing initiatives, identify specific local needs and to develop and implement the collection processes and relation between the existing data banks.
Problems and Deficits of existing Systems
Considering environmental and health monitoring systems, the current situation in European countries is the result of historic developments.
As a consequence even in Countries with established environment and health information systems the data often are divided among many data-holders and collected for very different purposes.
One the other hand even in those countries that do not have an integrated and centralised environment and health information system (eg UK, Austria), information would be available at different data-holders.
While Member States often have indicator systems based on national indicators sets most Accession countries are adopting new indicators in the framework of the EEA and WHO-EHIS (definition of indicators, and collecting process).
Analysing and clarifying the possibility of obtaining more information by parallel processing databases containing environmental and geographical information with health databases is a great challenge (data comparability and legal applications).
Every country stresses that data- availability is a critical issue. Often experts complain about the number of data-holders and the difficulties of data availability due to technical and legal constraints.
The division of information sources also causes the problem of technical comparability (for example different geographical scales, age or time periods). The amount of data collection can also cause a problem of reliability and compliance to quality control. Some experts indicate that maintenance of the monitoring systems at long term is at risk due to budget cuts.

page 31
When implementation of a monitoring system is new the experts try to propose indicators in EU and WHO indicators framework. The national programs enable the ministries to examine possible ways of attaining more relevant information to assess health risks.
Centralisation of data can save money and human resources on the long term, and help the production of relevant indicators for environmental health problems. In that regard the WHO-ECOEHIS program is considered to be very useful.
Priorities for further development/harmonisation
The most frequently mentioned issues for priorities of action, monitoring, and development and standardisation of indicators are (in order of frequency of nomination):
1. Noise
2. Water
3. Food
4. Housing
5. Air pollution
6. Allergy and asthma
7. Traffic
Most countries stress the need for harmonisation of indicators for asthma and allergy. Agreement is needed at an European level on the definition of asthma cases, and indicators used (prevalence of asthma, of hospitalisation for asthma, of deaths linked to asthma).
Other issues of concern reported at national level in the ECOEHIS project are:
• Health effects related to transport in non urban dwellers
• Radon exposure
• Hearing impairment and cognitive development related to noise exposure
• Indoor air and housing indicators as (e.g.CO, NOx, dampness, mould growth, winter death and high temperature)
• Common definitions of traffic injuries
• Access to green areas
• Chemicals indicators (Nickel, Cadmium, heavy metals and pesticides, everyday life indicators)
Targeting the harmonisation efforts on a limited amount of indicators should be cost effective. When delineating new indicators to meet these new targets, harmonising the definition and methodology of collection of these indicators is a very important issue. These new indicators should be compliant with the WHO list, and if a new set of indicators is necessary it should be discussed between experts from different countries and with WHO working groups.
Relevance of national activities for SCALE
Up to now only few indicators in the national sets are directly related to children.

page 32
Whereas with respect to Air pollution indicators already exist in most countries, although not measured with focus on children cancer and neurodevelopmental diseases are not mentioned in the questionnaires as priority areas for the E&H indicator systems. Indicators on air pollution and housing can give useful information on respiratory diseases. It’s more difficult to delineate the specific position of children. But background information (urban air pollution) can be also useful for children.
Childhood cancer
Limited knowledge exists on the relation between childhood cancer and environmental factors (apart from UV-radiation) and the perhaps different mechanisms from adult cancers. Furthermore the lag time between exposure to an environmental risk factor and fully manifest cancer might be less long than compared to the cancer in adults, thus investigations and research might be easier than with adults. Even if the number/incidence of childhood cancer is lower than of adult cancer, monitoring systems of childhood cancer are very relevant.
Some information on determinants could be centralised: e.g. housing distance from power line, exposure to mobile phones and exposure to pesticides to help research mainly.
Endocrine disruptors
Hormonal disruptors are suspected of causing congenital malformations. Thus, organisation of surveillance systems on congenital malformations is necessary. France stressed the existence of such registers at the regional level in the country. The German Environmental Survey (GerES) is a representative population study conducted since mid-1980s. At present the GerES IV is conducted, the first survey for children only (www.kiggs.de).The results of this survey can contribute substantially to the development of indicators for the exposure of children to environmental strains. The GerES IV-survey is currently investigating the level of internal and external exposure to selected endocrine disrupting compounds (e.g. DEHP). The results will enable a description of the current background burden.
Pesticides use mapping, pesticide exposure surveys and more specifically exposure of children to pesticides could be relevant indicators.
Neurodevelopment
Only limited knowledge is available about the impact of environmental factors on neurodevelopmental disorders. Most of the factors under suspicion are still subject to exploratory research. Because neurodevelopmental disorders are not specifically defined in the Communication on the E&H strategy, no statement on the availability of monitoring systems could be made. Nevertheless, lead and metal mercury are known to have effects on the central nervous systems, particularly on children whose brain development is not finished. Furthermore PCB is highly suspected to have an effect on neurodevelopment. Therefore indicators and monitoring systems on lead level in blood, PCB in blood, or methyl mercury (hair, blood) are important. Measurements can be based on regular surveys or real alert and monitoring systems (e.g. for lead in France, Germany, Czech Republic). Available indicators demonstrate that policy measures aiming at the reduction of lead emissions have lead to a significant reduction of blood lead levels. Monitoring surveys of lead in blood in children in the Netherlands have been stopped after the introduction of unleaded gasoline in the Netherlands, based on information from inidcators showing decreasing trends in lead emissions, lead exposure and lead blood levels.

page 33
4 Problems and deficits
Major problems are the lack of harmonisation of existing indicator systems as well as the definition of indicators (geographical scale, age groups, time periods, disease coding). This increases the difficulty of comparing indicators internationally or at other geographical levels.
4.1 General problems
There are many valuable environment indicators used worldwide to measure progress and trends towards a clean and healthy environment such as measures of air quality, water quality, traffic and industry emissions etc. The indicator activities of different organisations – WHO, EEA, European institutions and projects funded by them, OECD, UN-ECE – should be brought together and made compatible.
Many environmental health outcomes are thought to be affected by several, often interacting risk factors. These are genetic as well as environment-related which could be defined broadly to include physical, chemical, biological, economic, social and psychosocial factors. Examples are infectious agents, behavioural risks, ultraviolet radiation, tobacco smoke, chemicals in the environment, food-borne illness, poverty, and temperature extremes. For several of these factors, well-defined indicators still have to be developed. For example, concentrations of pollutants are often measured as peak or average exposures at a specific site which is not necessarily relevant and representative for children’s exposure.
Harmonisation of already existing indicators between different geographical entities is necessary for comparisons on a geographical scale. For example, if in one geographical area average concentrations of a pollutant are measured, and in another area number of hours per year during which this pollutant exceeds standards, comparability of the data is limited.
If it comes to measures, reducing or avoiding an environmental factor does not necessarily mean that an associated health outcome will be reduced similarly. A difficulty for comparing environmental indicators with health indicators is that the effect on health may be later rather than contemporaneous. Thus, a current environmental exposure to radiation will have its effect as cancer up to several decades later. Sometimes the length of this time lag is not well understood.
There are many examples of traditional health indicators that have been used successfully for many years in the public health arena. These include measures such as lifespan, infant mortality, birth parameters, and mortality rates for specific diseases. These measures are generally not controversial because there are standardized and agreed criteria for information collection and reporting. However, for more subjective indicators, such as well being, there is less information available, even though people themselves may give these greater attentions. Currently, representative population surveys on quality of life are available for Germany and European social population surveys are developing similar instruments for the European Scale (Euromodule). Also, obtaining comparable data on more specific health outcomes like cryptorchidism or asthma prevalence is much more difficult, evaluation / registration does not occur at the same age of the children, or registration is passive and depending on individual physicians. Nevertheless, the standardised ICD coding and regular surveillance of children’s health status (e.g. preventive examinations of children and adolescents in Germany and the Netherlands) provide a valuable data source for the investigation of the health status.

page 34
An aspect of environmental exposure is that the risk to an individual may be low, but if there is wide population exposure then the cumulative social impact is of concern. In some cases, environmental factors might only be of relevance for particularly susceptible/vulnerable groups.
Environmental and health indicators often represent populations. A link on population level does not mean that such a link exists within individuals of the population.
4.2 Specific problems of the existing environment and health information systems
4.2.1 Problems and deficits related to operational definitions
The lack of harmonisation in the definition of indicators as well as the variation in national interpretation increase the difficulty of comparing indicators internationally. There can also be difficulty in harmonisation between systems in the age groups and time periods covered. When environmental and health indicators depend on surveys (in comparison with routinely collected data) time series data may be missing. Due to different languages and databases used, the information exchange between various regions may be significantly limited. There can be some difficulty in relating environmental exposure to distinct populations, and in making comparisons when different sized populations are affected. Perhaps from a user’s point of view, a concern may be that data collection may delay available results, while users want the latest year.
4.2.2 Problems and deficits related to indicators where data collection is difficult
When data are difficult to collect, there is a possibility that inappropriate data are used instead. For example, there is a concern that the sperm count of males is being reduced because of EDCs. Information from unrepresentative samples may be used instead of truly representative populations, giving false results.
In several European countries, data protection limitations restrict the collection of potentially relevant public health data. It may be difficult to link data on individuals to make necessary analyses. Data on, or linkage with, individual characteristics may not be available.
Tissue sampling requires the agreement and participation of both children and parents. However, their willingness to provide samples depends on various factors such as particular concerns about exposures or health problems, ethnicity, socio-economic status. Thus, samples might not be representative for the whole population.
Differences in the system of data collection between the different countries is another major problem.

page 35
4.2.3 Problems and deficits related to data knowledge gaps
Focusing on indicators and data availability for the four priority areas of the EU E&H strategy:
• data on childhood cancer are more complete on the health indicator side, and the number of children concerned relatively small; on the other hand the environmental causes are not well understood.
• indicators for child neurodevelopment are not well developed on a population basis
• for respiratory health (in particular asthma) diagnostic criteria differ between countries; indicators proposed have been hospital admissions of children for respiratory problems or absence in school (the latter is difficult to relate to respiratory issues). Better information may come from specific multicentre studies like ISAAC. There are difficulties in defining true prevalence of asthma, in comparision with diagnosis rates, since the medical care system has incentives to increase the diagnosis rate (e.g. sales of drugs).
• perinatal/infantile conditions like hypospadia and cryptorchidism (perhaps related to EDCs) can be more accurately measured if children are assessed at a defined age by physicians aware of standardised diagnostic criteria.
In general, there is a lack of understanding/gap in knowledge how to use environmental and health indicators for decision making at national and local levels. This is implied by the differences in approach currently being used by international bodies.
4.2.4 Problems and deficits related to the geographical scope of existing systems.
The available data may refer to health and environmental conditions at different levels of resolution. It may be difficult to link data which is only available at different levels of resolution. Data for different geographical areas may be available only for limited time periods. Indicators may be a starting point for considering disease ‘clusters’ suspected to be associated with specific local exposure situations; epidemiological studies and studies of mechanisms (e.g. toxicological) are then needed to examine the problem further.
In order to identify environmental or health problems associated with a particular geographical area, indicators with a more local focus may be required. If children’s environmental health is addressed explicitly, one has to be aware that indicators based on the general population might be inadequate.
Children may be at a higher risk of developing adverse health effects than adults when exposed to environmental pollution. Children have a higher intake of food per kg body weight than adults and for some toxic agents also a higher absorption, e.g. children absorb 25 to 50% of lead in food compared to 5-25% for adults.
For some countries or regions it might not be feasible or cost-effective to collect information on some indicators with complete coverage; under such circumstances, focussing on a specific region or population is recommended.

page 36
5 Conclusions and recommendations
5.1 Advantages and limitations of harmonised EH indicators
Indicators play a valuable role in highlighting problems, identifying trends, and contributing to the process of priority setting, policy formulation and evaluating progress. Indicators can help to simplify a complex array of information concerning health and environment.
Some indicators are direct measures of environmental quality (e.g. levels of contaminants in drinking water) or public health (e.g. infant mortality rates). Recent indicator reports, however, have begun to use environmental levels (e.g. environmental exposure, environmental release data) juxtaposed with health effects data (e.g. rates of disease, years of life lost) and attempted to link one to the other. While it is necessary for governments to collect, use and publish data that reflect national or regional progress toward improving public health and environmental quality, such cause-and-effect extrapolations should be done with great care. For example, general population exposures do not necessarily reflect childhood exposures. Furthermore, given the complexity of the factors that influence health, it is in most cases not scientifically justified to link environmental information to specific health effects, while not takinginto account other risk factors such as life style. As a result, indicators that attempt to do so, do not provide a sufficiently rigorous basis for either regulatory or non-regulatory activities. The information gathered from such indicator efforts can be useful as input to developing hypotheses for further study in the fields of epidemiology, toxicology, exposure assessment, risk assessment. However they should not be used as a basis for action or policy making, unless the scientific linkages are well understood.
If the link is not quite fully defined and an environmental factor is suspicious of causing serious health effects it is recommended to apply the ALARP (as low as reasonably possible) principle in the meantime.
Indicators alone cannot identify cause-effect relationships between risk factors and health outcomes. They have to rely on scientific evidence that such a causal link exists. If there is scientific evidence for a dose response relationship and population exposure estimates are availabe, quantitative health impact assessments can be carried out which may illustrate the environment-related health burden. Health impact assessments (HIA) can be included as part of the assessment of a specific indicator in the context of reporting (e.g. years of life lost due to air pollution). The results of these assessments have to be judged carefully though, since health status is more influenced more by risk factors such as life style than the environment.
If narrowly focused on only a subset of potential risk factors, indicators may fail to identify the most relevant risk factors. The identification of potential risk factors therefore has to be guided by scientific evidence. Otherwise interventions may be misguided and public health resources misallocated.
Health indicators can be useful for better understanding of changes over time or differences between regions in the incidence or prevalence of health effects in populations. Indicators can shift the focus from debate and speculation about disease trends to improved understanding of disease trends, based on scientific evidence.
Both environment and health indicators together can be useful to generate hypotheses for broader research on risk factors for health effects in children and adults. The information

page 37
provided by the indicators can help prioritise children’s environment and health issues and guide the development of policies that aim at the reduction of child specific exposures to health relevant environmental factors and the allocation of necessary resources.
There are numerous indicator sets available at local, national and international level which contain one or more indicators relevant to environment and health. Information about changes in time or between/within- countries may be more important than the absolute levels of the indicators. Thus, comparability of the underlying databases is of the utmost importance. Unfortunately, the indicators in the different sets vary in operational definitions (age, diagnosis), geographical scale and quality. In addition, countries have to report to different organizations on the same issues, but sometime using slightly other indicator definitions. Thus, the development and use of a harmonised E&H indicator set to enhance data-comparability is recommended, taking into account different user needs at different levels, i.e. by developing different subsets or user-windows as has been done in the ECHI-project.
Advantages of a harmonised EH indicator set are the following:
• saving of resources
The development of a harmonised indicator set can save resources in the member states as well as in the Commission services which analyse and assess the data and convert them into information. Currently different authorities and experts are involved in the different processes and effective cooperation can release some manpower.
• better use of existing data
Much information about the state of the environment and health is already present in the Member States. Efforts should be supported to use these data for environment and health indicators.
• increased comparability
The standardisation of environmental and health monitoring has made enormous progress during the last decade. If common measures (health and environment monitoring, chemical and physical measurements, standards and guidelines for assessments) were further harmonised the comparability of the data would be enhanced.
• Benchmarking
International comparisons can be useful in the assessment of country differences in a specific area. They can help national authorities to identify priority areas and to elaborate their own policy taking into account the experiences from other countries.
• relevance for public health and environment policy
Well-defined indicators that rely on a scientific sound basis can help public health authorities to communicate the effects of environmental risks and to assess the actions implemented to reduce these risks.
• easier and better communication to stakeholders and to the public
When the indicators are widely accepted they can serve as a valuable tool for information strategies (e.g. as a component for the E&H Strategy).
• identification and prioritisation of research areas

page 38
• increased understanding of local environmental threats
(e.g. near old landfills or specific activities) A harmonised collection process can allow comparisons and eventually transpose observations and actions (preventive or corrective actions) from one local emerging threat to another one.
• Increased understanding of the cause–effect relationships
5.2 Requirements for development of a harmonised EU-indicator set
The added value of using EH indicators to address policy questions is in the combined analysis of both exposure and effect to obtain an expression, understandable by the decision-makers of the health risk associated with a specific environmental hazard. The purpose of the indicators to be selected/developed should be clearly defined (e.g. which policy aims should be evaluated). It is important that the existing international agencies developing environment and health indicators (WHO, EEA, EUROSTAT) should cooperate to ensure the development of a harmonised set that can serve the different purposes of the organizations and countries.
Prerequisites for the development of a set of indicators which can be used to examine overall trends in health and environment in the EU are:
• Clear definitions of issues of current or future interest or concern
• Integration of the many already existing programmes within the EU with WHO, EEA and EUROSTAT
• Standardisation of definitions
• Establishment of centralized data base/information system
• Standardisation of data collection (e.g. harmonisation of surveys or biomonitoring programmes)
• Quality control for sampling and analytical control
• Wide share of know how and access to data for countries and NGOs
• Sufficient resources (personal and technical resources for data analysis and reporting)
• Technical support for the development of an information exchange platform
• Prevention of unnecessary reporting burdens for the countries to enhance the compliance
• Definition of the level (local, regional, national, EU) at which respective indicators should be analysed
5.3 Missing links/data
EH indicators are currently provided for areas such as air pollution, water, noise where the evidence of health impacts is widely accepted and appropriate epidemiological measures for health impact assessment exist. When the health–environmental linkages are less well understood e.g. health effects of housing conditions or long-term exposure to chemicals the priorities, including research, are in identifying appropriate health outcomes and epidemiological measures as well as in harmonising the methods applied. An important missing link in the data-analysis is the lack of socio-demographic data which could be delivered from other databases (e.g. Eurostat New Chronos).

page 39
Environmental information, which can be derived from the reporting obligations within the existing (mostly environmental) legislation, is mostly about compliance e.g. number of exceedance days of air quality targets is of limited use for health-relevant assessments. When information on the state of the environment is available (e.g. the EEA AirBase which contains the air pollution levels in the European cities http://etc-acc.eionet.eu.int/databases/dobris.html) and the appropriate methodology is in place, environment and health indicators can be produced to quantify potential health benefits from reducing environmental pollution. Establishing, maintaining and making accessible of such databases should be encouraged and supported.
The countries who responded to our inventory mentioned the following priorities for development and standardisation of indicators (in order of frequency of nomination): Noise, Water, Food, Housing, Air pollution, allergy and asthma, traffic. Most countries stress the need for harmonisation of indicators for asthma and allergy.
The development of E&H indicators for the EU strategy for environment and health has to focus on the objectives of the strategy. Because no specific or quantitative objectives have been formulated so far, indicators cannot be proposed at this stage. The results of the different TWGs looking at the SCALE-priority diseases should be examined for the need of specific indicators that are not regarded yet in current information systems. A preliminary analysis of the available data for the four priority areas of the EH strategy indicates that:
• Data on childhood cancer are rather complete on the health indicator side, the environmental causes are not well understood.
• Indicators for child neurodevelopment are not well developed on a population basis.
• For respiratory health (in particular asthma) diagnostic criteria differ between countries. Agreement is needed at an European level on the definition of asthma cases, and indicators used (prevalence of asthma, of hospitalisation for asthma, of deaths linked to asthma).
• Perinatal/infantile conditions like hypospadia and cryptorchidism (perhaps related to EDCs) are currently not accurately measured. Measurements of pharmaceuticals in the environment should be considered because of potential human effects, for example hormonal effects of contraceptives.
For some areas, e.g. housing and noise, harmonised data collection methods are missing or not used. Further development of harmonised survey methods should be reinforced in collboration with the TWG on priority diseases.
5.4 Guidance for further development of international indicator set
The following steps should be taken to enhance further development of a harmonised international EH indicator set
• An organisational framework should be set up, including a steering group with representatives from EU, WHO, EEA and Eurostat and a projectgroup with representatives from the countries, NGOs and international projects. Main tasks of the steering group could be to ensure cooperation between the different agencies and relevant projects on the further development of EH indicators and enhance harmonised data-collection and exchange.

page 40
• Selection of priority areas to focus on, depending on the policy questions (eg transport, air quality, water quality, housing, food safety and the priority diseases mentioned in the EH strategy).
• Selection and definition of indicators. For the selection of European Union relevant indicators the set of WHO recommended indicators can be a starting point. Countries in different stages of development will need to focus on different indicator sets or specific selections out of the indicator sets. Selecting and applying indicators should follow a dynamic process starting with something ‘doable’ and iteratively improving according to new evidence, data and metrics to better meet the informed decision-making and priority issues of concern. This will also assure continuity in harmonisation of the data collection and data processing and gradual fill of the priority data-gaps. Since construction of indicators that meet all the criteria described in 2.3 is rather difficult, a reasonable compromise should be made i.e. a set of ‘core’ indicators. When data on exposure cannot be obtained “proxies” of exposures relating to the upper links in the framework (e.g. distance of dwellings to roads) can also be included. The indicators should be selected based on the “magnitude” (in terms of population number) of the potential health effects. Indicators higher-up the framework e.g. driving forces can also be useful as early warning signals.
• Testing of indicators for data-availability should only be done for newly-developed indicators. For the others the results of recent feasibility studies should be taken into account
• Harmonisation of data collection methods
• Development of data-exchange and data-control procedures as well as an information system structure. For this, the experience and datawarehouse-infrastructure from EEA may be a basis. The WHO website under preparation could be basis for a web-based portal of EH information system. It would be extremely helpful if this portal can be linked to both the EU (EUPHIN) and EEA information systems.

page 41
Annex I: Questionnaires
Austria
Bulgaria
Czech Republic
Denmark
Germany
Italy
Lithuania
Netherlands
Poland
Portugal
Romania
Slovenia
Sweden
United Kingdom
European Environmental Agency

page 42
Austria
Question Answer
1 Please fill in your name and address Name: Ingeborg Fiala
Email: [email protected]
Address: Bundesministerium für Land- und Forstwirtschaft, Umwelt und Wasserwirtschaft
Stubenbastei 5
A-1010 Wien
ÖSTERREICH
2 For which country/ project are you answering? Austria
3 Do you have indicator-based environment and health information?
No
4 Where is it located? Health or environment services?
5 Is environmental health an issue in the regular public health or environmental reporting?
No
6 Which specific issues (environment: eg air, water, health: eg respiratory diseases, annoyance) are being addressed?
Noise annoyance
7 What scale do your projects have? (local/regional/national/ international)
National
8 Can you name the E&H indicators you are using for the reporting? If yes, please fill in the names and methodology in the table attached
9 What is the purpose of the use of the indicators?
(e.g. Monitoring actions, awareness raising, warning, Planning actions)
10 Which methods for data collection do you use? (eg. Air quality surveillance, drinking and bathing water surveillance, surveys with environmental health questions, community noise surveys, mortality or morbidity statistics)
Survey with the question whether people feel heavily to not annoyed by noise in their flat (scale with 5 classes)
11 Do you specify age groups? No
12 Are there gender specifications? No

page 43
Question Answer
13 Do you see a link to the topics addressed in the commission initiative (respiratory diseases, childhood cancer, neurodevelopmental disorders)?
No
14 Which difficulties do you face with your system?
15 Where do you see major benefits?
16 If you still don't have an established indicator based E&H information system, are there initiatives to start such a project?
No, but we are following the processes on EU-level
17 Please name those environmental factors and health endpoints for which you believe development/standardisation of indicators has the highest priority. Examples might be : noise exposure metrics, noise annoyance, asthma, education on indoor air ventilation etc. Can you propose indicators for these factors/endpoints?
18 In your view, which of your national agencies/authorities should be involved in the development of an EU-wide indicator system? If possible give names and e-mail addresses of contact people
19 Do you know other projects than the ones mentioned above and the international ones listed at the annexed table which are related to the field of environment and health?

page 44
Bulgaria Question Answer 1 Please fill in your name and address Name: Hristina Mileva
Email: [email protected] Address: Ministry of Health, Sveta Nedelya sq.5, Sofia 1000, Bulgaria
2 For which country/ project are you answering?
Bulgaria, Environmental Health Indicator System; WHO
3 Do you have indicator-based environment and health information?
Yes. We are at the beginning in establishing such a system by participating in the above project
4 Where is it located? Health or environment services?
Health services
5 Is environmental health an issue in the regular public health or environmental reporting?
Yes. Again we are at the beginning. For this year it will be a part from the environmental reporting. After adoption of the new Public Health Low which is forthcoming it will be part from the health reporting
6 Which specific issues (environment: eg air, water, health: eg respiratory diseases, annoyance) are being addressed?
Environmental issues: ambient air quality, drinking and bathing water quality, food safety, traffic accidents, workplace, noise, waste, radiation, housing and settlements. Health issues: air pollution related diseases, traffic injuries, skin cancer, occupational diseases, water-born and food-borne diseases.
7 What scale do your projects have? (local/regional/national/ international)
National and international
8 Can you name the E&H indicators you are using for the reporting? If yes, please fill in the names and methodology in the table attached
Yes
9 What is the purpose of the use of the indicators? (e.g. Monitoring actions, awareness raising, warning, Planning actions)
Monitoring, planning actions, environmental impact assessment, policy making
10 Which methods for data collection do you use? (eg. Air quality surveillance, drinking and bathing water surveillance, surveys with environmental health questions, community noise surveys, mortality or morbidity statistics)
Ambient air surveillance, drinking and bathing waters surveillance, food safety surveillance, occupational health surveillance, communicable diseases surveillance, mortality and morbidity statistics, population census data
11 Do you specify age groups? Yes 12 Are there gender specifications? Yes 13 Do you see a link to the topics addressed in
the commission initiative (respiratory diseases, childhood cancer, neurodevelopmental disorders)?
Yes

page 45
Question Answer 14 Which difficulties do you face with your
system? Too many dataholders. Lack of quality assurance. Lack of human and financial resources in order to ensure the necessary data for the whole environment and health indicators
15 Where do you see major benefits? Very useful for assessment the environment and health situation at regional, national and international level, helps for problems prioritisation and more effective allocation of the limited resources available, allow international comparisons, gives possibility for relevant and timely information to the citizens
16 If you still don't have an established indicator based E&H information system, are there initiatives to start such a project?
17 Please name those environmental factors and health endpoints for which you believe development/standardisation of indicators has the highest priority. Examples might be : noise exposure metrics, noise annoyance, asthma, education on indoor air ventilation etc. Can you propose indicators for these factors/endpoints?
Ambient air quality, allergies (asthma in children), skin cancer, noise
18 In your view, which of your national agencies/authorities should be involved in the development of an EU-wide indicator system? If possible give names and e-mail addresses of contact people
Ministry of Health Dr.Snezana Altankova, Director Tel.: + 359 2 9301 250 e-mail: [email protected] National Centre of Hygiene, Medical Ecology and Nutrition, Nikolai Rizov, Director Tel: + 359 2 5812 274 Ministry of Environment Fatme Iliaz, Deputy minister Tel: + 359 2 940 62 57 Environmental Agency Dimitar Vergiev, Director Tel: + 359 2 955 90 11
19 Do you know other projects than the ones mentioned above and the international ones listed at the annexed table which are related to the field of environment and health?
No

page 46
Czech Republic
Question Answer
1 Please fill in your name and address Name: Dr. Ruzena Kubinova
Email: [email protected]
Address: National Institute of Public Health, Srobarova 48, 100 49 Praha 10, Czech Republic
2 For which country/ project are you answering? Environmental Health Monitoring System in the Czech Republic
3 Do you have indicator-based environment and health information?
Yes
4 Where is it located? Health or environment services?
Health
5 Is environmental health an issue in the regular public health or environmental reporting?
Yes
6 Which specific issues (environment: eg air, water, health: eg respiratory diseases, annoyance) are being addressed?
Air, drinking water, bathing water (since 2003), quality of food in relation to the exposure, community noise annoyance and sleep disturbances, acute respiratory diseases, allergy incl. asthma in children, water-borne and alimentary diseases, occupational diseases, bio-monitoring, health status, socio-economic factors, health and life perception
7 What scale do your projects have? (local/regional/national/ international)
Local (urban), national
8 Can you name the E&H indicators you are using for the reporting? If yes, please fill in the names and methodology in the table attached
Yes
9 What is the purpose of the use of the indicators?
(e.g. Monitoring actions, awareness raising, warning, Planning actions)
Monitoring, planning actions, priority settings, using in HIA process, awareness raising
10 Which methods for data collection do you use? (eg. Air quality surveillance, drinking and bathing water surveillance, surveys with environmental health questions, community noise surveys, mortality or morbidity statistics)
Air quality surveys, drinking and bathing water surveillance data collecting, surveys with environmental health questions, community noise surveys, medical records from physicians, notification systems ( EPIDAT, Register of occupational

page 47
Question Answer diseases), morbidity statistics
11 Do you specify age groups? Partly
12 Are there gender specifications? Partly
13 Do you see a link to the topics addressed in the commission initiative (respiratory diseases, childhood cancer, neurodevelopmental disorders)?
Yes
14 Which difficulties do you face with your system?
So far no fatal problems
15 Where do you see major benefits? Time trends describing, objectification of the health threats, tool for identification of the main health risks, knowledge of the health status and people perception for preventive programmes setting and health risk communication
16 If you still don't have an established indicator based E&H information system, are there initiatives to start such a project?
17 Please name those environmental factors and health endpoints for which you believe development/standardisation of indicators has the highest priority. Examples might be : noise exposure metrics, noise annoyance, asthma, education on indoor air ventilation etc. Can you propose indicators for these factors/endpoints?
Allergy incidence incl. asthma in children, noise annoyance level, urban air quality, life style and health perception indicators
18 In your view, which of your national agencies/authorities should be involved in the development of an EU-wide indicator system? If possible give names and e-mail addresses of contact people
Ministry of Health Karla Rihova [email protected] National Institute of Public Health Ruzena Kubinova [email protected] Ministry of Environment Karel Blaha [email protected] Transport Research Centre Milan Brich [email protected] Czech Statistical Office Dep.of international cooperation

page 48
Question Answer Hana Slegrova tel. +4202 266107776 +4202 266107775 Institute for Health Information and Statistics [email protected]
19 Do you know other projects than the ones mentioned above and the international ones listed at the annexed table which are related to the field of environment and health?
Some of EH indicators are collected and reported in the frame of plenty of national and regional systems within Ministry of Environment, M. of Agriculture, M. of Transport, M. for Municipal Development, and several agencies (Czech ecological institute, Centre for environment by Charles University, Czech Statistical Office, Institute for Health Information and Statistics etc.).
But there is no other comprehensive EH indicator system in the contemporary sense.

page 49
Denmark
Question Answer
For which country/ project are you answering? Denmark
Do you have indicator-based environment–health information?
Yes, a chapter in Denmark’s national Indicator Report for sustainable development concerns environment and health containing indicators for
- Chemicals
- Environmental quality and other environmental factors
- Food
- Health and safety
Where is it located? Health or environment services?
Both the Danish Environmental Protection Agency, the Danish Ministry of Food, Agriculture and Fisheries, the Ministry of Employment and the National Board of Health are responsible for collecting data for environment and health indicators.
Is environmental health an issue in the regular public health or environmental reporting?
Yes, Denmarks national strategy for sustainable development and the related yearly indicator report contain environment and health chapters.
Which specific issues (air, water, etc.) are addressed?
Harmful effects (asthma), chemicals, air, soil contamination, drinking water, food, and bathing water.
What scale do your projects have? (local/regional/national/ international)
National
Can you name the E&H indicators you are using? If yes, please fill in the table
Please, see table
What is the purpose of the use of the indicators?
(e.g. Monitoring actions, awareness raising, warning, Planning actions)
In Denmark’s national strategy for sustainable development the goal is that Denmark should be a country where pollution from products, food, working environment, traffic, and physical indoor conditions affecting the population’s quality of life and health is constantly falling. The development of indicators for health and the environment will be carefully monitored with a view to using relevant new indicators to elucidate the objectives.
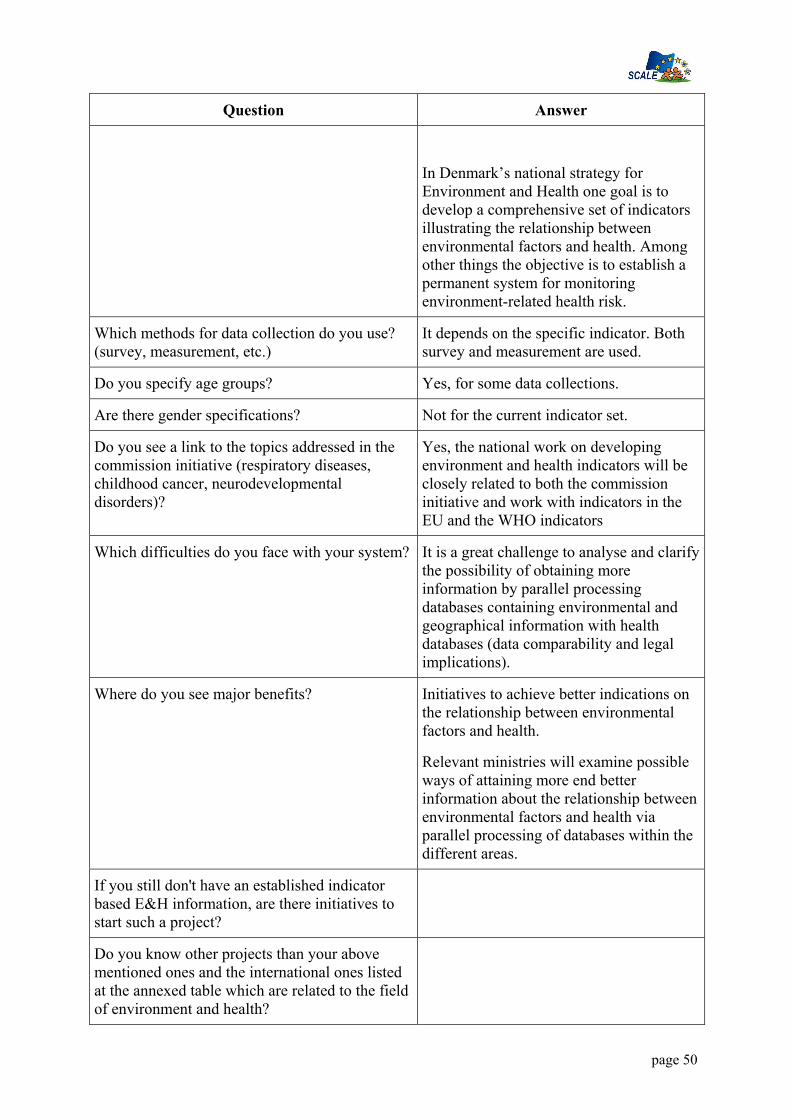
page 50
Question Answer
In Denmark’s national strategy for Environment and Health one goal is to develop a comprehensive set of indicators illustrating the relationship between environmental factors and health. Among other things the objective is to establish a permanent system for monitoring environment-related health risk.
Which methods for data collection do you use? (survey, measurement, etc.)
It depends on the specific indicator. Both survey and measurement are used.
Do you specify age groups? Yes, for some data collections.
Are there gender specifications? Not for the current indicator set.
Do you see a link to the topics addressed in the commission initiative (respiratory diseases, childhood cancer, neurodevelopmental disorders)?
Yes, the national work on developing environment and health indicators will be closely related to both the commission initiative and work with indicators in the EU and the WHO indicators
Which difficulties do you face with your system? It is a great challenge to analyse and clarify the possibility of obtaining more information by parallel processing databases containing environmental and geographical information with health databases (data comparability and legal implications).
Where do you see major benefits? Initiatives to achieve better indications on the relationship between environmental factors and health.
Relevant ministries will examine possible ways of attaining more end better information about the relationship between environmental factors and health via parallel processing of databases within the different areas.
If you still don't have an established indicator based E&H information, are there initiatives to start such a project?
Do you know other projects than your above mentioned ones and the international ones listed at the annexed table which are related to the field of environment and health?

page 51
France
Question Answer
1 Please fill in your name and address Name: Philippe PIRARD Email: [email protected] Address: Philippe PIRARD INVS 12 rue du Val d’Osnes 94415 Saint-Maurice FRANCE
2 For which country/ project are you answering?
FRANCE
3 Do you have indicator-based environment and health information?
Yes
4 Where is it located? Health or environment services?
Health, Environmental, Agriculture, National Institute of Radioprotection and Nuclear Safety, InVS…
5 Is environmental health an issue in the regular public health or environmental reporting?
Yes
6 Which specific issues (environment: eg air, water, health: eg respiratory diseases, annoyance) are being addressed?
Environmental 1- Air quality, admissions and mortality
linked with air quality 2 - Drinking /Swimming water and
sanitation, Outbreaks of water-borne
diseases/Diarrhoea morbidity 3 - Radiations (Air, water, soil..)
exposures 4 - Food Toxics and bacteriae in flesh and
vegetables and outbreaks of specific diseases
5 – Waste and contaminated land 6 - Housing 7 – lead level in blood mortality, congenital malformations, cancers (national for childhood, regional for adults), asthma, traffic accident
7 What scale do your projects have? (local/regional/national/ international)
National or regional it depends
8 Can you name the E&H indicators you are using for the reporting? If yes, please fill in the names and methodology in the table attached
Yes (see table attached)

page 52
Question Answer
9 What is the purpose of the use of the indicators? (e.g. Monitoring actions, awareness raising, warning, Planning actions)
Planning, Warning and Monitoring actions, research,
10 Which methods for data collection do you use? (eg. Air quality surveillance, drinking and bathing water surveillance, surveys with environmental health questions, community noise surveys, mortality or morbidity statistics)
Several: mandatory declarations, administrative automatic registrations, surveillance plans, community surveys, statistics, medical registries, accident registration
11 Do you specify age groups? Only in demographic, mortality or morbidity statistics and in Community surveys
12 Are there gender specifications? Only in demographic, mortality or morbidity statistics and in Community surveys
13 Do you see a link to the topics addressed in the commission initiative (respiratory diseases, childhood cancer, neurodevelopmental disorders)?
Yes for respiratory diseases and asthma , yes for cancer in childhood, Yes for neurodevelopmental disorders ( lead level in blood) Not for endocrine disruptors
14 Which difficulties do you face with your system?
To establish a link, after collecting data, between environmental exposure and health status, with an or several indicators Haronisation and sharing of the data collected from different sources
15 Where do you see major benefits? Standardisation of indicators, in various settings
16 If you still don't have an established indicator based E&H information system, are there initiatives to start such a project?
Yes
17 Please name those environmental factors and health endpoints for which you believe development/standardisation of indicators has the highest priority. Examples might be : noise exposure metrics, noise annoyance, asthma, education on indoor air ventilation etc. Can you propose indicators for these factors/endpoints?
1. Asthma and respiratory diseases 2. Housing conditions 3. Drinking /Swimming Water and
sanitation
18 In your view, which of your national agencies/authorities should be involved in the development of an EU-wide indicator system? If possible give names and e-mail addresses of contact people
InVS: National Institute of Public HealthMinistry of Heath, Environment Ministry Agence Française de Sécurité Sanitaire de l’Environnement and Ministry of Agriculture

page 53
Question Answer
19 Do you know other projects than the ones mentioned above and the international ones listed at the annexed table which are related to the field of environment and health?
No

page 54
Germany
Question Answer
1 Please fill in your name and address Name: Jürgen Thelen
Email: [email protected]
Address: Federal Environmental Agency, Germany, Correnplatz 1, 14195 Berlin
2 For which country/ project are you answering?
Germany
3 Do you have indicator-based environment and health information?
Information System operating on Federal and Federal State Level; mainly Environmental Indicators with link to health;
Participant in WHO-EHI and WHO-ECOEHIS Project;
4 Where is it located? Health or environment services?
Federal Information Systems: Environment: Federal Environmental Agency http://www.env-it.de/umweltdaten/jsp/dispatcher?event=WELCOME Health: Robert Koch-Institute and Federal Statistical Office www.gbe-bund.de
Federal State Systems: Environmental or Public Health Authorities (in some States e.g. NRW, Bavaria)
5 Is environmental health an issue in the regular public health or environmental reporting?
Both, in Environment and Public Health reporting; Environmental Trend Report of the MoE scheduled for Autum 2004
6 Which specific issues (environment: eg air, water, health: eg respiratory diseases, annoyance) are being addressed?
Drinking and bathing water quality, outdoor and indoor air quality (Radon), Human Biomonitoring (HM, POP), Noise Annoyance,
7 What scale do your projects have? (local/regional/national/ international)
Mainly National and Federal State Level, Participant in international projects
8 Can you name the E&H indicators you are using for the reporting? If yes, please fill in the names and methodology in the table attached
National Level: yes
9 What is the purpose of the use of the indicators?
Environmental performance Indicators (e.g. SD, Climate Protection), Public Information, Stakeholder Information; Monitoring of time

page 55
Question Answer
(e.g. Monitoring actions, awareness raising, warning, Planning actions)
trends, Warning systems
10 Which methods for data collection do you use? (eg. Air quality surveillance, drinking and bathing water surveillance, surveys with environmental health questions, community noise surveys, mortality or morbidity statistics)
Environmental Surveys, Community Surveys with environmental questions, Surveillance (Air Quality, Water, Radiation, Food), Registers, Mortality and morbidity statistics
11 Do you specify age groups? For some purposes; environmental Survey: adults; Environmental Survey for children and adolescent
12 Are there gender specifications? For some issues
13 Do you see a link to the topics addressed in the commission initiative (respiratory diseases, childhood cancer, neurodevelopmental disorders)?
Respiratory diseases are investigated in the ongoing children and adolescence health and environment survey, Register on Childhood cancer operating at the University of Mainz,
14 Which difficulties do you face with your system?
Connection of environmental and health data due to different resolution (geographical), assessment of health effects uncertain (lack of evidence); Responsibilities distributed; no Resources
15 Where do you see major benefits? For known impacts of env. factors, assessment of development is possible, Communication is proactive, Policy Evaluation partly possible
16 If you still don't have an established indicator based E&H information system, are there initiatives to start such a project?
17 Please name those environmental factors and health endpoints for which you believe development/standardisation of indicators has the highest priority. Examples might be : noise exposure metrics, noise annoyance, asthma, education on indoor air ventilation etc. Can you propose indicators for these factors/endpoints?
s. table
18 In your view, which of your national agencies/authorities should be involved in the development of an EU-wide indicator system? If possible give names and e-mail addresses of contact people
Federal Environmental Agency Robert Koch-Institute Federal Radiation Protection Agency Federal Institute for Risk Assessment Federal Office for Consumer Protection and Food Safety

page 56
Question Answer
19 Do you know other projects than the ones mentioned above and the international ones listed at the annexed table which are related to the field of environment and health?

page 57
Italy
Question Answer
1 Please fill in your name and address Name: Luciana Sinisi Email: [email protected] Address: APAT National Environmental Protection Agency Via Vitaliano Brancati, 48 – 00144 Rome, Italy
2 For which country/ project are you answering?
3 Do you have indicator-based environment and health information?
A)No, yet. Environment and health information system are self-governing and not linked in a common structure for environmental health issues.
Environmental indi ators are developed on DPSIR model.
B) Two specific projects are in initial phase to develop E&H indicators:
1. participation feasibility ECOEHIS WHO Project,
2. Environmental and health project of the Dept. of the State of the Environment of National Environmental Agency
4 Where is it located? Health or environment services?
A) Information system: 1) National Environment information
system (EIS) cooperating to EIONET and Regional EIS. –( Env. Agency
2) Health information system – (Min. of Health)
3) National Statistical Institute Many environmental health issue of the Health information system collate to national statistical system
B)Projects b) projects 1&2 APAT (National Environmental Protection Agency) .
5 Is environmental health an issue in the regular public health or environmental reporting?
Reporting are basically independent but many of them regard environmental health issues
6 Which specific issues (environment: eg air, water, health: eg respiratory diseases, annoyance) are being addressed?
See annex table of main indicators on E&H relevance
7 What scale do your projects have? (local/regional/national/ international)
National/International

page 58
8 Can you name the E&H indicators you are using for the reporting? If yes, please fill in the names and methodology in the table attached
See annex table where has been reported also the referring institutions for developed indicators
9 What is the purpose of the use of the indicators?
(e.g. Monitoring actions, awareness raising, warning, Planning actions)
Monitoring and planning actions, planning investments and funding, address research needs on data collections and measurements
10 Which methods for data collection do you use? (eg. Air quality surveillance, drinking and bathing water surveillance, surveys with environmental health questions, community noise surveys, mortality or morbidity statistics)
Generally Environmental ones are based on direct measurements.
There is also a system to collect mortality data and hospital dismissions diagnosis of all national territory.
Methods of collection are specified for each indicators in the annex table
11 Do you specify age groups? See annex
12 Are there gender specifications? See annex
13 Do you see a link to the topics addressed in the commission initiative (respiratory diseases, childhood cancer, neurodevelopmental disorders)?
There are already developed indicators in all information system (health statistical and environment) that can be useful, but there is a need of ad hoc adjustment and planning
14 Which difficulties do you face with your system?
Many data holders, lack of a specific E&H informative system, that is linkage and overlapping of exposure and effects indicators, although we have good organized informative systems
15 Where do you see major benefits? Added value for health prevention policy and health promotion in environmental policy both for local management and for overall European monitoring.
16 If you still don't have an established indicator based E&H information system, are there initiatives to start such a project?
Projects already mentioned of the National Environmental Protection Agency :
a)participation as NFP to ECOEHIS WHO Project,
b) “Environment and health project “of the Dept. of the State of the Environment of the Agency
17 Please name those environmental factors and health endpoints for which you believe development/standardisation of indicators has
In general I would refer to the environmental determinants of health evidence-base indicated by WHO

page 59
the highest priority. Examples might be : noise exposure metrics, noise annoyance, asthma, education on indoor air ventilation etc. Can you propose indicators for these factors/endpoints?
(www.who.int/hia/evidence/doh/en/index5.html)
Biomonitoring of children must be stressed
18 In your view, which of your national agencies/authorities should be involved in the development of an EU-wide indicator system? If possible give names and e-mail addresses of contact people
1) Ministry of Environment
Ministero dell’Ambiente e tutela del territorio Viale Cristoforo Colombo, 44 – 00147 Rome, Italy www.minambiente.it e-mail: [email protected]
2) APAT
National Environmental Protection Agency
General Director
Via Vitaliano Brancati, 48
00144 Rome, Italy
www.apat.it
3) Ministry of Health Ministero della Salute Piazzale dell'Industria, 20 - 00144 ROMA www.ministerosalute.it 4) National Institute of Health Istituto Superiore di Sanità. Viale Regina Elena 299 00161 - Roma Italy www.iss.it 5) National Statistical Office
ISTAT - Istituto Nazionale di Statistica
Via Cesare Balbo 16 00184 – Rome, Italy
www.istat.it

page 60
19 Do you know other projects than the ones mentioned above and the international ones listed at the annexed table which are related to the field of environment and health?
no other the ones already mentioned

page 61
Lithuania
Question Answer
1 Please fill in your name and address Name: Ingrida Zurlyte
Email: [email protected]
Name: Aida Laukaitiene
Email: [email protected]
Address:
Environment and Health Division
State Environmental Health Centre
Kalvariju street 153,
LT-2042 Vilnius, Lithuania
2 For which country/ project are you answering?
Lithuania
3 Do you have indicator-based environment and health information?
Yes
(initial phase)
Participating in the WHO/ECEH Project “Environmental Health Indicator System”
4 Where is it located? Health or environment services?
State Environmental Health Centre, Ministry of Health
Data from Environmental Protection Agency, Lithuanian Health Information Centre, Statistical Department and other institutions according to specific topics are collected and processed.
5 Is environmental health an issue in the regular public health or environmental reporting?
No.
Recently, environmental health became part of health statistics reports, but to a very limited extent.
As initial stage pilot testing of core set of Environmental Health Indicators (developed within the WHO/ECEH project) has been carried out.
National list of Environmental Health indicators (based on core set of EH indicators developed within the WHO/ECEH project) was established by

page 62
Question Answer the order of the Minister of Health in 2002. Procedure for data collection, processing, analysis and distribution is under development.
Draft National Public Health Monitoring Programme is developed. It includes environmental health part too (limited).
6 Which specific issues (environment: eg air, water, health: eg respiratory diseases, annoyance) are being addressed?
Ten environmental issues according the WHO/ECEH Environmental Health Indicator system project: Air Quality, Housing and Settlements, Traffic Accidents, Noise, Waste and Contaminated Lands, Radiation, Water and Sanitation, Food Safety, Chemical Emergencies, Workplace; and related health issues: respiratory diseases, circulatory diseases, accident related traumas, injuries, skin cancer, communicable diseases transmitted by food, occupational diseases / injuries.
7 What scale do your projects have? (local/regional/national/ international)
International, national.
It is planned to pilot it on regional and local levels in the future.
8 Can you name the E&H indicators you are using for the reporting? If yes, please fill in the names and methodology in the table attached
Yes (but at the moment they are used separately for environmental reporting and for health reporting, synthesized (integrated) reporting on environmental health is not developed). Information provided in the table is based on WHO/ECEH EH indicators project feasibility study report.
9 What is the purpose of the use of the indicators?
(e.g. Monitoring actions, awareness raising, warning, Planning actions)
Evidence on environment and health links, possible use for environmental health impact assessment, monitoring actions, planning actions.
10 Which methods for data collection do you use? (eg. Air quality surveillance, drinking and bathing water surveillance, surveys with environmental health questions, community noise surveys, mortality or morbidity statistics)
Air quality surveillance, drinking and bathing water surveillance, mortality and morbidity statistics, population census data, household surveys, communicable disease surveillance, waste generation statistics, environmental radiation activity surveillance, food safety surveillance, chemical incidents surveillance,

page 63
Question Answer occupational health surveillance, routine statistical data.
11 Do you specify age groups? Yes, for health indicators
12 Are there gender specifications? Yes, for health indicators
13 Do you see a link to the topics addressed in the commission initiative (respiratory diseases, childhood cancer, neurodevelopmental disorders)?
Yes. Direct link. Additional health and environmental data would be available.
14 Which difficulties do you face with your system?
- lack of cooperation between stakeholders (data holders) and inadequate data exchange mechanisms;
- lack of human and financial recourses for management of integrated environmental health information system;
- insufficient resources/capacities for producing data on human exposure (for all specific issues);
- no resources for specific environmental health population surveys.
15 Where do you see major benefits? System based on Environmental Health Indicators is an effective tool for synthesis of those data, in detecting the major environmental health problems and in suggesting the best political solutions.
16 If you still don't have an established indicator based E&H information system, are there initiatives to start such a project?
Establishment of indicators based environmental health information system is one of the objectives of the National Environmental Health Action Programme (2003 – 2006) of Lithuania adopted by the Government.
Lithuania is in the first stage of development of indicator based E&H information system by participating in the WHO/ECEH Project on Environmental Health Indicator System.
17 Please name those environmental factors and health endpoints for which you believe development/standardisation of indicators has the highest priority. Examples might be: noise exposure metrics, noise annoyance,
Air pollution exposure (WHO E&H ind. Exposure to ambient air pollutants (urban)), noise annoyance (WHO E&H ind. Population annoyance by certain sources of noise, Sleep disturbance by

page 64
Question Answer asthma, education on indoor air ventilation etc. Can you propose indicators for these factors/endpoints?
noise), noise exposure (Population exposed to various noise level ranges per source (air, road, rail, industrial, others)), housing indicators (WHO E&H ind. Population living in substandard housing), traffic injuries (WHO E&H ind. Rate of injuries by traffic accidents), incorporation of children environmental health indicators into the core set.
18 In your view, which of your national agencies/authorities should be involved in the development of an EU-wide indicator system? If possible give names and e-mail addresses of contact people
1. Ministry of Health, Head of Public Health Division, Mr. Romualdas Sabaliauskas, [email protected]
2. State Environmental Health Centre, Deputy Director, Ms. Ingrida Zurlyte, [email protected]
3. Ministry of Environment, Secretary, Mr. Aleksandras Spruogis, [email protected]
4. Environmental Protection Agency, Director, Mr. Liutauras Stoskus, [email protected]
19 Do you know other projects than the ones mentioned above and the international ones listed at the annexed table, which are related to the field of environment and health?
No

page 65
The Netherlands
Question Answer
1 Please fill in your name and address Name: Brigit Staatsen
Email: [email protected]
Address: PO.box 1, 4720 BA Bilthoven, Netherlands
2 For which country/ project are you answering? The Netherlands
3 Do you have indicator-based environment and health information?
Information System on national level; mainly Environmental Indicators with link to health;
Participant in WHO-EHI and WHO-ECOEHIS Project
4 Where is it located? Health or environment services?
National Information Systems: National Institute of Public health and Environment (RIVM:www.rivm.nl Health: Kompas Environment: Milieucompendium (in English)
Environmental health: in development at RIVM
Regional information Systems: Environmental or Public Health Authorities (eg Rijnmondregion DCMR)
5 Is environmental health an issue in the regular public health or environmental reporting?
Both, in Environment and Public Health reporting; Environmental Balance with new environmental health impact assessment scheduled for Spring 2004
6 Which specific issues (environment: eg air, water, health: eg respiratory diseases, annoyance) are being addressed?
Drinking and bathing water quality, outdoor and indoor air quality (Radon), Human Biomonitoring (POP, breast milk), Noise exposure and Annoyance/sleep disturbance, Quality of living environment (satisfaction surroundings, risk perception, % green or quiet areas etc). health status: resp and cardiovasc diseases, Calculations of environment-related health loss (mort, morb, DALYs) Regional hot spots: eg Schiphol and Rijnmond region

page 66
Question Answer
7 What scale do your projects have? (local/regional/national/ international)
Mainly National and Regional, Participant in international projects
8 Can you name the E&H indicators you are using for the reporting? If yes, please fill in the names and methodology in the table attached
National level: yes
9 What is the purpose of the use of the indicators?
(e.g. Monitoring actions, awareness raising, warning, Planning actions)
Evaluation of policy measures (mainly by monitoring environmental quality)
Monitoring of time and (sometimes) spatial trends, priority setting
Basis for health impact assessment
Public Information
Warning system
10 Which methods for data collection do you use? (eg. Air quality surveillance, drinking and bathing water surveillance, surveys with environmental health questions, community noise surveys, mortality or morbidity statistics)
Limited biomonitoring (POP-breast milk), Community Surveys with environmental health questions. Community noise surveys, Surveillance (Air Quality, Drinking and bathing water, Radiation, Food), Health Registries: Mortality and morbidity statistics (hospital records, physicians)
11 Do you specify age groups? Sometimes
12 Are there gender specifications? Sometimes
13 Do you see a link to the topics addressed in the commission initiative (respiratory diseases, childhood cancer, neurodevelopmental disorders)?
Respiratory diseases in children are investigated in several research projects and some regional children and adolescent health surveys, Childhood cancer registered at regional cancer registries but not an environmental issue
Cognition and behavioural aspects studied in relation to noise in Health Monitoring Programme Schiphol (RANCH)
14 Which difficulties do you face with your system?
Difficult to link environmental and health data due to different resolution (geographical), privacy restrictions, assessment of health effects uncertain (lack of data on important confounders); Responsibilities distributed; very limited Resources

page 67
Question Answer
15 Where do you see major benefits? For known impacts of env. factors, assessment of time trends and policy evaluation . Tool for identifying possible emerging risks (sentinel function). But risk of ecological fallacy. Data on confounders at small area level needed for better analysis of trends in less well-known risks
16 If you still don't have an established indicator based E&H information system, are there initiatives to start such a project?
17 Please name those environmental factors and health endpoints for which you believe development/standardisation of indicators has the highest priority. Examples might be : noise exposure metrics, noise annoyance, asthma, education on indoor air ventilation etc. Can you propose indicators for these factors/endpoints?
Noise exposure, annoyance/sleep disturbance
Asthma in children
Urban air quality
Perceived health
Action indicators
18 In your view, which of your national agencies/authorities should be involved in the development of an EU-wide indicator system? If possible give names and e-mail addresses of contact people
RIVM
Central Bureau of Statistics
Ministry of Environment
Ministry of Public Health
19 Do you know other projects than the ones mentioned above and the international ones listed at the annexed table which are related to the field of environment and health?
Eurostat

page 68
Poland
Question Answer
1 Please fill in your name and address Name: Dorota Jarosińska
Email:[email protected]
Address: Institute of Occupational Medicine and Environmental Health,
13 Koscielna, 41-200 Sosnowiec, Poland
2 For which country/ project are you answering?
Poland
3 Do you have indicator-based environment and health information?
There is no integrated E&H information based on indicators. However, there are data collection systems for several environmental and for health indicators
4 Where is it located? Health or environment services?
Indicator based information on health and environment is located in the respective sectors
5 Is environmental health an issue in the regular public health or environmental reporting?
No
EH issues are not subject to regular public health or environmental reporting yet. However, the relevance of this issue is recognized, and there are attempts to incorporate EH topics in regular reporting. In 2001, many-year governmental programme “Environment and health” has been established, with one of the objectives to implement integrated E&H information system.
6 Which specific issues (environment: eg air, water, health: eg respiratory diseases, annoyance) are being addressed?
For environmental reporting: ambient air, surface water, drinking water,
For the health reporting: respiratory diseases, cardiovascular diseases, diarrhoeal diseases, cancer (mortality/morbidity); traffic accidents
7 What scale do your projects have? (local/regional/national/ international)
Poland participates in the project on Environmental Health Indicators led by the WHO Europe, ECEH Bonn Office. This is collaborative international project,

page 69
Question Answer
aiming to establish indicator based E&H information system useful on the local, regional, national and international levels.
8 Can you name the E&H indicators you are using for the reporting? If yes, please fill in the names and methodology in the table attached
Currently, no E&H indicators are regularly reported. Several of the EH indicators from the core set of the WHO developed indicators are pilot tested in Poland.
9 What is the purpose of the use of the indicators?
(e.g. Monitoring actions, awareness raising, warning, Planning actions)
To monitor, to plan and/or to modify actions
Once the comprehensive EH indicator system with the well structured “information modules” (fact sheets) is implemented, its awareness raising function is expected to increase.
10 Which methods for data collection do you use? (eg. Air quality surveillance, drinking and bathing water surveillance, surveys with environmental health questions, community noise surveys, mortality or morbidity statistics)
Ambient air quality surveillance, drinking and bathing water surveillance, mortality and morbidity statistics
Census data
11 Do you specify age groups? For some of the health indicators
12 Are there gender specifications? For some of the health indicators
13 Do you see a link to the topics addressed in the commission initiative (respiratory diseases, childhood cancer, neurodevelopmental disorders)?
Yes.
Respiratory diseases are included in the WHO Europe project on EH indicator (with the potential to extend information using survey methods).
Based on the growing scientific evidence, neurodevelopmental disorders and childhood cancer are considered relevant E&H issues; in terms of indicators, development of the adequate and feasible tools may be a serious challenge.
14 Which difficulties do you face with your system?
The E&H indicator system is pilot tested now. At this stage the main difficulties are: availability and accessibility of data;

page 70
Question Answer
availability and reliability of additional information necessary for the indicator interpretation and assessment; consistency of currently collected data with the proposed indicator methodology; in some cases insufficiency of the existing data collection systems for E&H indicators
Not clearly set responsibilities for E&H indicator based information system. Lack of the organizational mechanisms, within and across the sectors providing data and involved in the EH indicator system operation.
15 Where do you see major benefits? Better use of the systematically collected data on environment and health. Generation of the relevant EH information which will be used for policy making on different levels (sub-, and national).
Identification of the relevant data needs and gaps in the existing reporting systems; potential for improvement, aiming at the system allowing for a comprehensive “view” of the EH situation in the country
Gradual improvement of the E&H data collection and reporting systems, resulting from application of the harmonized methodology, facilitating reliable international comparisons
16 If you still don't have an established indicator based E&H information system, are there initiatives to start such a project?
Yes – Implementation of the governmental program “Environment and Health”, and participation in the WHO Europe ECEH Bonn Office, currently at the stage of pilot testing, are the most relevant initiatives to establish and implement indicator based E&H information system in Poland.
17 Please name those environmental factors and health endpoints for which you believe development/standardisation of indicators has the highest priority. Examples might be :
Asthma/ respiratory health (mild health effects), taking into account susceptible sub-populations (mainly standardization/harmonization)

page 71
Question Answer
noise exposure metrics, noise annoyance, asthma, education on indoor air ventilation etc. Can you propose indicators for these factors/endpoints?
Exposure to microbiological/chemical factors in the indoor environment (development/harmonization)
Annoyance to noise and other factors in the immediate living environment (harmonization/development)
Housing standard and the perceived housing quality (development/harmonization)
ETS exposure in different subgroups (mainly standarization/harmonization)
18 In your view, which of your national agencies/authorities should be involved in the development of an EU-wide indicator system? If possible give names and e-mail addresses of contact people
For development of the system, Institute of Occupational Medicine and Environmental Health could be a national partner: a state managed research institute, the national partner in the WHO EHI project and leading institution in the governmental program “Environment and Health”.
Director: JA Sokal
Email: [email protected]
19 Do you know other projects than the ones mentioned above and the international ones listed at the annexed table which are related to the field of environment and health?
No

page 72
Portugal
Question Answer
1 Please fill in your name and address Name: Cesaltina Ramos
Email: [email protected]
Address: Alameda D. Afonso Henriques, 45
1049-055 LISBOA
2 For which country/ project are you answering?
Portugal
3 Do you have indicator-based environment and health information?
Yes
4 Where is it located? Health or environment services?
Health, Environmental and other services
5 Is environmental health an issue in the regular public health or environmental reporting?
Yes
6 Which specific issues (environment: eg air, water, health: eg respiratory diseases, annoyance) are being addressed?
1- Drinking /Swimming water and sanitation
Outbreaks of water-borne diseases/Diarrhoea morbidity
7 What scale do your projects have? (local/regional/national/ international)
National
8 Can you name the E&H indicators you are using for the reporting? If yes, please fill in the names and methodology in the table attached
Yes ( see table)
9 What is the purpose of the use of the indicators?
(e.g. Monitoring actions, awareness raising, warning, Planning actions)
Planning, Warning and Monitoring actions
10 Which methods for data collection do you use? (eg. Air quality surveillance, drinking and bathing water surveillance, surveys with environmental health questions, community noise surveys, mortality or morbidity statistics)
Several: Surveillance plans, community surveys, statistics, medical registries, accident registration
11 Do you specify age groups? Only in demographic, mortality or morbidity statistics and in Community surveys

page 73
Question Answer
12 Are there gender specifications? Only in demographic, mortality or morbidity statistics and in Community surveys
13 Do you see a link to the topics addressed in the commission initiative (respiratory diseases, childhood cancer, neurodevelopmental disorders)?
Yes
14 Which difficulties do you face with your system?
To establish a link, after collecting data, between environmental exposure and health status, with an or several indicators
15 Where do you see major benefits? Standardisation of indicators, in various settings
16 If you still don't have an established indicator based E&H information system, are there initiatives to start such a project?
Yes
17 Please name those environmental factors and health endpoints for which you believe development/standardisation of indicators has the highest priority. Examples might be : noise exposure metrics, noise annoyance, asthma, education on indoor air ventilation etc. Can you propose indicators for these factors/endpoints?
Drinking /Swimming Water and sanitation
18 In your view, which of your national agencies/authorities should be involved in the development of an EU-wide indicator system? If possible give names and e-mail addresses of contact people
Ministry of Heath,
Environment Ministry and
Ministry of Agriculture.
19 Do you know other projects than the ones mentioned above and the international ones listed at the annexed table which are related to the field of environment and health?
No
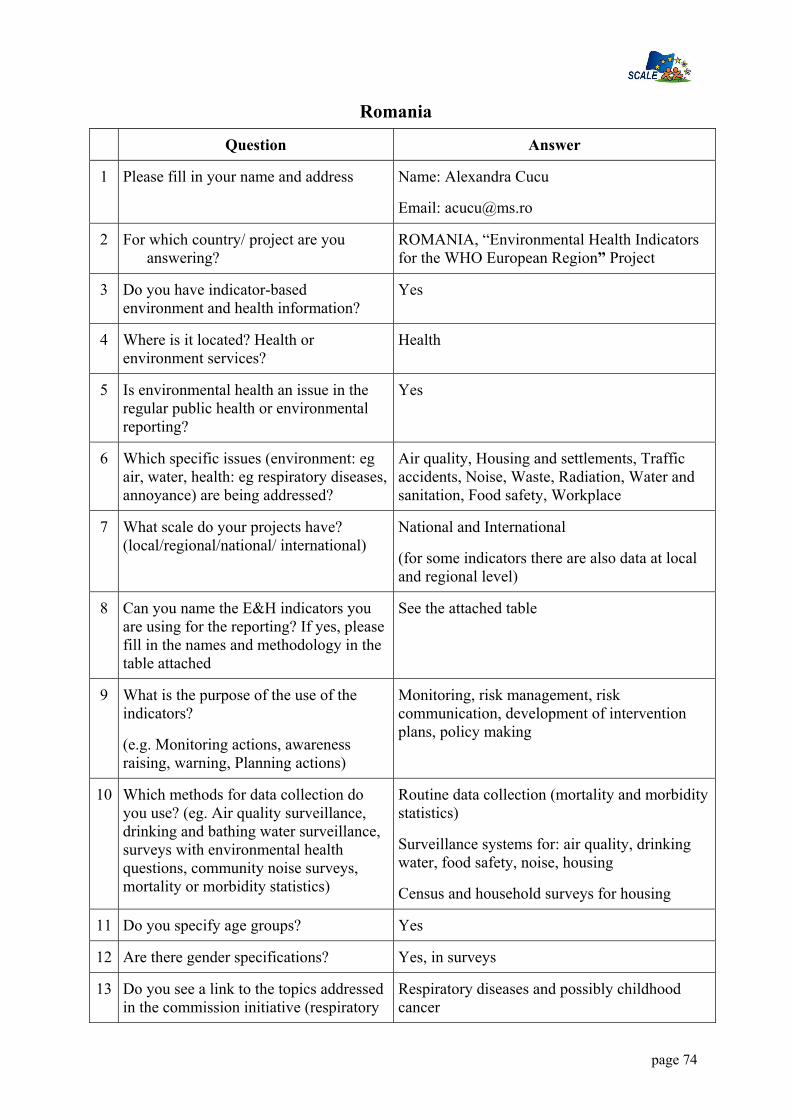
page 74
Romania
Question Answer
1 Please fill in your name and address Name: Alexandra Cucu
Email: [email protected]
2 For which country/ project are you answering?
ROMANIA, “Environmental Health Indicators for the WHO European Region” Project
3 Do you have indicator-based environment and health information?
Yes
4 Where is it located? Health or environment services?
Health
5 Is environmental health an issue in the regular public health or environmental reporting?
Yes
6 Which specific issues (environment: eg air, water, health: eg respiratory diseases, annoyance) are being addressed?
Air quality, Housing and settlements, Traffic accidents, Noise, Waste, Radiation, Water and sanitation, Food safety, Workplace
7 What scale do your projects have? (local/regional/national/ international)
National and International
(for some indicators there are also data at local and regional level)
8 Can you name the E&H indicators you are using for the reporting? If yes, please fill in the names and methodology in the table attached
See the attached table
9 What is the purpose of the use of the indicators?
(e.g. Monitoring actions, awareness raising, warning, Planning actions)
Monitoring, risk management, risk communication, development of intervention plans, policy making
10 Which methods for data collection do you use? (eg. Air quality surveillance, drinking and bathing water surveillance, surveys with environmental health questions, community noise surveys, mortality or morbidity statistics)
Routine data collection (mortality and morbidity statistics)
Surveillance systems for: air quality, drinking water, food safety, noise, housing
Census and household surveys for housing
11 Do you specify age groups? Yes
12 Are there gender specifications? Yes, in surveys
13 Do you see a link to the topics addressed in the commission initiative (respiratory
Respiratory diseases and possibly childhood cancer

page 75
Question Answer diseases, childhood cancer, neurodevelopmental disorders)?
14 Which difficulties do you face with your system?
Lack of data quality assurance
Too many information sources
15 Where do you see major benefits? EHIS Is a very useful managerial tool, able to meet real needs of communication and transparency.
This core set of indicators provides useful information for policy
making at local and national level, and facilitates international comparability and data exchange.
16 If you still don't have an established indicator based E&H information system, are there initiatives to start such a project?
17 Please name those environmental factors and health endpoints for which you believe development/standardisation of indicators has the highest priority. Examples might be : noise exposure metrics, noise annoyance, asthma, education on indoor air ventilation etc. Can you propose indicators for these factors/endpoints?
Noise, noise annoyance, indoor air ventilation
18 In your view, which of your national agencies/authorities should be involved in the development of an EU-wide indicator system? If possible give names and e-mail addresses of contact people
National Institute of Statistics
Institute of Public Health Bucharest
Ministry of Agriculture, Forests, Water and Environment
Ministry of Internal Affairs
19 Do you know other projects than the ones mentioned above and the international ones listed at the annexed table which are related to the field of environment and health?
ENHIS

page 76
Slovenia
Question Answer
1 Please fill in your name and address Name: Inga Turk
Email: [email protected]
Address:Ministry of the Environment,
Spatial Planning and Energy,
Dunajska 48,
Ljubljana 1000
Slovenia
Name: Peter Otorepec
Email: [email protected]
Address:IVZ Trubarjeva 2 Ljubljana 1000
2 For which country/ project are you answering? Slovenia Institute of public health of the republic of Slovenia
3 Do you have indicator-based environment and health information?
no no
4 Where is it located? Health or environment services?
5 Is environmental health an issue in the regular public health or environmental reporting?
Yes/no
Different topics are included in different reports.
Yes/no
Different topics are included in different reports.
6 Which specific issues (environment: eg air, water, health: eg respiratory diseases, annoyance) are being addressed?
Environment:
- list of environmental indicator (attached)
Environment:
Water (drinking and bathing water, waterborne outbreaks)
Food (microbiological foodborne diseases)
Health: most of HFA indicators
7 What scale do your projects have? (local/regional/national/ international)
national/ international regional/national/ international
8 Can you name the E&H indicators you are using for the reporting? If yes, please fill in the names and methodology in the table attached
No
9 What is the purpose of the use of the indicators?
(e.g. Monitoring actions, awareness raising, warning, Planning actions)
Monitoring actions, awareness raising, warning, Planning actions
Monitoring actions, awareness raising, warning, Planning actions
10 Which methods for data collection do you use? (eg. Air quality surveillance, drinking and bathing water surveillance, surveys with environmental health questions, community noise surveys,)
EEA methodology
(fact sheets for indicators of the European Environmental Agency)
Drinking and bathing water surveillance,
mortality and morbidity statistics,
WHO methodology.
11 Do you specify age groups? / Yes for some data
12 Are there gender specifications? / Yes for some data
13 Do you see a link to the topics addressed in the commission initiative (respiratory diseases, childhood cancer, neurodevelopmental
/ Yes

page 77
disorders)?
14 Which difficulties do you face with your system? accessibility of data
lack of methodology for indicators, harmonization of the methodology
Different bases,
accessibility of data.
15 Where do you see major benefits? Time trend analysis, plan for action Time trend analysis, plan for action.
16 If you still don't have an established indicator based E&H information system, are there initiatives to start such a project?
Yes Yes
17 Please name those environmental factors and health endpoints for which you believe development/standardisation of indicators has the highest priority. Examples might be : noise exposure metrics, noise annoyance, asthma, education on indoor air ventilation etc. Can you propose indicators for these factors/endpoints?
/ - Noise (no. of people especially children exposed harmful levels of noise and time of exposure)
- indoor air
18 In your view, which of your national agencies/authorities should be involved in the development of an EU-wide indicator system? If possible give names and e-mail addresses of contact people
Ministry of Health and Ministry of Environment, Spatial Planning and Energy
Ministry of Health,
Ministry of Environment,
Institute of public health
Cancer registry
Ministry of internal affairs (traffic accidents)
19 Do you know other projects than the ones mentioned above and the international ones listed at the annexed table which are related to the field of environment and health?
/ APHEIS
PHEWE
PEOPLE

page 78
Sweden Question Answer
For which country/ project are you answering? Sweden/ indicators
Do you have indicator-based environment–health information?
Yes
Where is it located? Health or environment services?
National Board of health and Welfare;
www.sos.se
Swedish Environmental Protection Agency
www.environ.se
Is environmental health an issue in the regular public health or environmental reporting?
Yes, both
Which specific issues (air, water, etc.) are addressed?
Metals (lead, mercury, cadmium) concentration in blood, PCB, dioxin mothers milk, benzene in air
What scale do your projects have? (local/regional/national/ international)
Both, Swedish national monitoring programme concerning human exposure
Can you name the E&H indicators you are using? If yes, please fill in the table
Yes see table
What is the purpose of the use of the indicators?
(e.g. Monitoring actions, awareness raising, warning, Planning actions)
Monitoring actions, exposure current, ongoing
awareness raising
Planning actions
Which methods for data collection do you use? (survey, measurement, etc.)
measure and estimate human exposure to substances that are hazardous to health.
Do you specify age groups? To some extent
Are there gender specifications?
Do you see a link to the topics addressed in the commission initiative (respiratory diseases, childhood cancer, neurodevelopmental disorders)?
Respiratory diseases (airpollution), neurobehavioral disorders (related to Methyl mercury and/or PCB),
Which difficulties do you face with your system?
Economical resources
Where do you see major benefits? Knowledge about exposure to humans, both current and ongoing
If you still don't have an established indicator based E&H information, are there initiatives to start such a project?
Ongoing
Do you know other projects than your above National Environmental Health related

page 79
Question Answer mentioned ones and the international ones listed at the annexed table which are related to the field of environment and health?
report , National Board of Health and Welfare;
National health related report –children underway, Institute of Environmental Medicine, Karolinska Institutet and National Board of Health and Welfare;

page 80
United Kingdom Question Answer
1 Please fill in your name and address Name: Mark McCarthy
Email: [email protected]
Address: Department of Epidemiology and Public Health
University College London
London WC1E 6BT
UK
2 For which country/ project are you answering? UK / EUPHA
3 Do you have indicator-based environment and health information?
No
4 Where is it located? Health or environment services?
There is no systematic collection of environment and health information together in UK, nor does EUPHA collect
5 Is environmental health an issue in the regular public health or environmental reporting?
no
6 Which specific issues (environment: eg air, water, health: eg respiratory diseases, annoyance) are being addressed?
7 What scale do your projects have? (local/regional/national/ international)
none
8 Can you name the E&H indicators you are using for the reporting? If yes, please fill in the names and methodology in the table attached
9 What is the purpose of the use of the indicators?
(e.g. Monitoring actions, awareness raising, warning, Planning actions)
10 Which methods for data collection do you use? (eg. Air quality surveillance, drinking and bathing water surveillance, surveys with environmental health questions, community noise surveys, mortality or morbidity statistics)
11 Do you specify age groups?
12 Are there gender specifications?
13 Do you see a link to the topics addressed in the commission initiative (respiratory diseases, childhood cancer, neurodevelopmental disorders)?

page 81
Question Answer
14 Which difficulties do you face with your system?
15 Where do you see major benefits?
16 If you still don't have an established indicator based E&H information system, are there initiatives to start such a project?
Not at the moment
17 Please name those environmental factors and health endpoints for which you believe development/standardisation of indicators has the highest priority. Examples might be : noise exposure metrics, noise annoyance, asthma, education on indoor air ventilation etc. Can you propose indicators for these factors/endpoints?
18 In your view, which of your national agencies/authorities should be involved in the development of an EU-wide indicator system? If possible give names and e-mail addresses of contact people
The central point for contact in department of environment, food and rural affairs is
19 Do you know other projects than the ones mentioned above and the international ones listed at the annexed table which are related to the field of environment and health?

page 82
European Environmental Agency
Question Answer
For which country/ project are you answering?
European Environment Agency
www.eea.eu.int
Do you have indicator-based environment–health information?
- In development with WHO and EC
- At present, EEA information system mainly contains data on environment conditions and very few exposure data (focus on air and water, limited on chemicals, none on in-door pollution)
Where is it located? Health or environment services?
Environment
Is environmental health an issue in the regular public health or environmental reporting?
Regular environment reporting (Assessment reports/publications)
http://themes.eea.eu.int/Environmental_issues/human
Which specific issues (air, water, etc.) are addressed?
All health environment-related issues are tentatively addressed in the assessments but this is not backed up at the moment by a comprehensive and structured health& environment indicator-based system
What scale do your projects have? (local/regional/national/ international)
European region (up to WHO-Europe coverage)
EEA membership covers 31 countries but cooperation is in place with Western Balkans and EECCA (Eastern Europe, Caucasus & Central Asia countries)
Can you name the E&H indicators you are using? If yes, please fill in the table
The EEA core set of indicators (under review – see link below) includes many indicators that are relevant to health but are not as such constructed as E&H indicators. This is being done in partnership with WHO - see http://www.euro.who.int/eprise/main/WHO/Progs/EHI/Methodology/20030528_1
http://eea.eionet.eu.int:8980/Public/irc/eionet-circle/core_set/library?l=/material2&vm=detailed&sb=Title (Section 5.1 & 5.2)
What is the purpose of the use of the indicators?
To answer in a structured and repeatable way policy questions and progress (trends) over time related as far as possible to targets,

page 83
Question Answer
(e.g. Monitoring actions, awareness raising, warning, Planning actions)
environmental objectives or (sustainability) reference values.
Indicators help organise the structuring and logic of the regular reporting system. This is approached with MDIAK chain of EEA system and production processes (the logical iterative flows in Monitoring – Data – Information – Assessment – Knowledge).
Indicators are thus used both to answer policy questions and to streamline monitoring needs while at the same time raising awareness and supporting policy analysis (use of the analytical framework DPSIR)
Which methods for data collection do you use? (survey, measurement, etc.)
Data is coming from national systems or international data bases, which means methods are depending on the national processes. EEA & WHO are focusing on harmonization of methods and comparability of data from national sources.
Do you specify age groups? Not as a rule - In some specific case studies
Indicators for Children, health & environment are under development (WHO, EEA)
http://www.euro.who.int/childhealthenv/Monitoring/20030627_1
Are there gender specifications? Not as a rule - In some specific case studies
Do you see a link to the topics addressed in the commission initiative (respiratory diseases, childhood cancer, neurodevelopmental disorders)?
Yes, a direct link as our indicator development is to cover causality
Which difficulties do you face with your system?
Difficulties are being overcome thanks to the positive development of indicator work, which identification and organisation underpin the system structure and contents.
Where do you see major benefits? (see point above). The link with national capacities and systems brings in the necessary discussion on harmonization, compatibility and inter-operability.
The partnership with WHO and EC (as well as in consultation with Eurostat, UNEP, OECD) also brings the appropriate implementation of

page 84
Question Answer a shared information system.
If you still don't have an established indicator based E&H information, are there initiatives to start such a project?
Partnership with WHO & EC (SANCO & ENV)
http://www.euro.who.int/EHindicators
http://www.euro.who.int/EHindicators/Methodology/20030527_12
Do you know other projects than your above mentioned ones and the international ones listed at the annexed table which are related to the field of environment and health?
Not for Europe

page 85
Annex II: Tables
Belgium
Czech Republic
Denmark
France
Germany
Italy
Lithuania
Poland
Portugal
Romania
Slovenia
Spain
Sweden

page
86
Bel
gium
Nam
e: D
ewol
f Mar
ie-C
hris
tine
–
Dire
ctor
of H
ECTO
R, H
ealth
and
Env
ironm
enta
l Car
e Te
chni
cal O
rgan
isat
ion
Mem
ber o
f the
Exe
cutiv
e C
omm
ittee
of t
he E
PHA
Env
ironm
enta
l Net
wor
k E-
mai
l: m
cdw
@he
ctor
-asb
l.be
ou m
cdw
@sk
ynet
.be
Te
l: +3
2.10
.81.
07.4
7 A
ddre
ss: R
ue d
e la
Sap
iniè
re, 1
0 –
1340
Otti
gnie
s-Lo
uvai
n-la
-Neu
ve -
BEL
GIU
M
Cou
ntry
or p
roje
ct: B
ELG
IUM
& E
EN (E
urop
ean
Net
wor
k)
Y=
yes,
N=
No
The
me
Indi
cato
r na
me
T
ype
Ope
ratio
nal
de
finiti
on
Purp
ose
use
of
indi
cato
r
Geo
gra-
phic
al S
cale
G
ende
r
Age
V
alid
atio
n D
ata
qual
ity
Dat
a co
llect
ion;
m
etho
d an
d fr
eque
ncy
Dat
a co
ntro
l A
cces
-si
bilit
y R
epor
ting
Com
men
ts
Air
qua
lity
1. E
nerg
y us
e by
road
traf
fic
(1)
Ex
/hab
itant
M
IRA
repo
rt R
egio
nal
N
w
ww
.mili
eur
appo
rt.be
year
ly
2.
Em
issi
ons o
f SO
2, N
Ox
en
VO
C (1
)
Ex
Kto
n M
IRA
repo
rt R
egio
nal
N
w
ww
.mili
eur
appo
rt.be
Yea
rly
3.
Yea
rly
emis
sion
s of
heav
y m
etal
s (1)
Ex
K to
n/ye
ar
MIR
A re
port
Reg
iona
l N
ww
w.m
ilieu
r
appo
rt.be
Yea
rly
4.
Em
issi
ons o
f 17
dio
xins
(1)
Ex
gTEQ
/yea
r
Reg
iona
l N
ww
w.m
ilieu
r
appo
rt.be
Yea
rly
5.
Yea
rly
aver
age
conc
entra
tion
of
NO
2 (1)
Ex
µg/m
³ M
IRA
repo
rt Lo
cal a
nd
Reg
iona
l N
ww
w.m
ilieu
r
appo
rt.be
Yea
rly
6.
Yea
rly
aver
age
conc
entra
tion
of
PM10
(1)
Ex
µg/m
³ M
IRA
repo
rt Lo
cal a
nd
Reg
iona
l N
ww
w.m
ilieu
r
appo
rt.be
Yea
rly
Som
e th
inki
ng
abou
t de
velo
ping
th
e us
e of
PM
2.5
indi
cato
r is
on g
oing

page
87
The
me
Indi
cato
r na
me
T
ype
Ope
ratio
nal
de
finiti
on
Purp
ose
use
of
indi
cato
r
Geo
gra-
phic
al S
cale
G
ende
r
Age
V
alid
atio
n D
ata
qual
ity
Dat
a co
llect
ion;
m
etho
d an
d fr
eque
ncy
Dat
a co
ntro
l A
cces
-si
bilit
y R
epor
ting
Com
men
ts
7.
Yea
rly
aver
age
conc
entra
tion
of
SO2 (
1)
Ex
µg/m
³ M
IRA
repo
rt Lo
cal a
nd
Reg
iona
l N
ww
w.m
ilieu
r
appo
rt.be
Yea
rly
8.
Ozo
ne
conc
entra
tion
(1)
Ex
Num
ber o
f da
ys w
here
th
e hi
ghes
t oz
one
conc
entra
tion
(ave
rage
d on
8 h
ours
) ex
ceed
ed
MIR
A re
port
Loca
l and
R
egio
nal
N
w
ww
.mili
eur
appo
rt.be
Yea
rly
9.
Exc
eedi
ng o
f re
fere
nce
conc
entra
tion
of
sele
cted
po
lluta
nts i
n ci
ty a
rea’
s (r
epor
ted
to
popu
latio
n) (1
)
Ex
µg/m
³ Se
lect
ed
pollu
ttant
s :
NO
2, PM
10
(yea
rly a
nd
daily
) SO
2, O
zone
, Pb,
TS
P, B
S
R
egio
nal
N
Yea
rly
10
. Yea
rly
aver
age
conc
entra
tion
of
benz
ene
and
1,2-
dich
loro
etha
ne
(1)
Ex
µg/m
³ M
IRA
repo
rt R
egio
nal
N
w
ww
.mili
eur
appo
rt.be
year
ly
11
. Yea
rly
aver
age
conc
entra
tion
of
benz
o(a)
pyre
ne
en 1
0 re
pres
enta
tive
HA
P (1
)
Ex
ng/m
³ M
IRA
repo
rt Lo
cal a
nd
Reg
iona
l N
ww
w.m
ilieu
r
appo
rt.be
Yea
rly
12
. Pol
lutio
n fr
om d
ioxi
nes
(1)
Ex
Pg
TEQ
/m³.d
ay
Lo
cal a
nd
Reg
iona
l N
Y
early
13
. C
once
ntra
tion
of h
eavy
met
als
(1)
Ex
µg/m
³ H
eavy
m
etal
s: A
s, C
d, C
r, Pb
, H
g, N
i
Lo
cal a
nd
Reg
iona
l N
ye
arly
14
. Yea
ly
E N
umbe
r per
Reg
iona
l <
5
ye
arly
- C
hild
ren

page
88
The
me
Indi
cato
r na
me
T
ype
Ope
ratio
nal
de
finiti
on
Purp
ose
use
of
indi
cato
r
Geo
gra-
phic
al S
cale
G
ende
r
Age
V
alid
atio
n D
ata
qual
ity
Dat
a co
llect
ion;
m
etho
d an
d fr
eque
ncy
Dat
a co
ntro
l A
cces
-si
bilit
y R
epor
ting
Com
men
ts
child
ren
mor
talit
y du
e to
ac
ute
resp
irato
ry
dise
ases
(1)
1 00
0 ch
ildre
n (<
5
year
s)
orie
nted
- g
ood
polit
ical
and
aw
aren
ess
rais
ing
indi
cato
r - l
ong
term
in
dica
tor
(non
pr
oact
ive
at
shor
t ter
m)
15
. Yea
rly
mor
talit
y du
e to
ac
ute
resp
irato
ry
dise
ases
(1)
E N
umbe
r per
10
0 00
0 pe
rson
s
R
egio
nal
N
year
ly
- goo
d po
litic
al a
nd
awar
enes
s ra
isin
g in
dica
tor
- lon
g te
rm
indi
cato
r (n
on
proa
ctiv
e at
sh
ort t
erm
)
16. I
ncid
ence
on
lung
can
cer
(1)
E N
umbe
r of
case
s per
100
00
0
R
egio
nal
N
year
ly
17
. DA
LY’s
du
e to
PM
10 (1
) E
Num
ber o
f lif
e ye
ars l
ost
MIR
A re
port
Reg
iona
l N
ww
w.m
ilieu
r
appo
rt.be
year
ly
18
. Lev
el o
f ur
bani
satio
n ?
(ver
sted
elijk
ing
) (1)
Ex
%
R
egio
nal
N
year
ly
19
. im
porta
nce
of p
erso
nal
trans
port
(1)
Ex
Pkm
(typ
e tra
nspo
rt us
e: p
erso
nal
cars
, tra
in,
cycl
es,
pede
stria
ns,
…)/y
ear.h
ead
R
egio
nal
N
year
ly
20
. Dai
ly h
ours
st
ayin
g in
the
cars
(1)
Ex
Hou
rs a
nd
min
utes
Reg
iona
l N
ye
arly
21
. Inc
iden
ce o
f as
thm
a on
E
Num
ber o
f ca
ses o
f
Reg
iona
l <
5
ye
arly
- C
hild
ren
orie
nted

page
89
The
me
Indi
cato
r na
me
T
ype
Ope
ratio
nal
de
finiti
on
Purp
ose
use
of
indi
cato
r
Geo
gra-
phic
al S
cale
G
ende
r
Age
V
alid
atio
n D
ata
qual
ity
Dat
a co
llect
ion;
m
etho
d an
d fr
eque
ncy
Dat
a co
ntro
l A
cces
-si
bilit
y R
epor
ting
Com
men
ts
child
ren
(1)
asth
ma
per
1 00
0 ch
ildre
n <
5 ye
ars o
ld
- sho
rt an
d lo
ng te
rm
indi
cato
r
22
. Yea
rly
mor
talit
y du
e to
C
O (1
)
E N
umbe
r of
deat
h pe
r 10
0 00
0
R
egio
nal
N
year
ly
Ach
ievi
ng
leve
ls o
f air
qual
ity th
at d
o no
t giv
e ris
e to
si
gnifi
cant
ne
gativ
e im
pact
s on
and
risks
to h
uman
he
alth
and
the
envi
ronm
ent
112.
Ex
ceed
ance
of
air q
ualit
y th
resh
olds
(2)
Ex to
E
(fut
ure
wis
hes)
Fu
ture
w
ishe
s:
Res
pira
tory
di
seas
es,
asth
ma
Noi
se
23. t
ypic
al
nois
e em
issi
ons
by c
ivil
airp
orts
(1
)
Ex
No
unit
Es
timat
ion
of th
e le
vel
(pro
porti
on)
MIR
A re
port
Loca
l and
R
egio
nal
N
w
ww
.mili
eur
appo
rt.be
Yea
rly
24
. %
popu
latio
n ex
pose
d to
no
ise
resu
lting
fr
om ro
ad
traff
ic (1
)
E %
M
IRA
repo
rt Lo
cal a
nd
Reg
iona
l N
ww
w.m
ilieu
r
appo
rt.be
Yea
rly
25
. %
popu
latio
n ex
pose
d to
no
ise
resu
lting
fr
om a
irpla
nes
(1)
E %
w
ithin
LA
dn =
65
dB
(A)
MIR
A re
port
Loca
l N
ww
w.m
ilieu
r
appo
rt.be
Yea
rly
26
. Pot
entia
l po
pula
tion
serio
usly
di
stur
bed
by
nois
e nu
isan
ce
(1)
E %
MIR
A re
port
Loca
l and
R
egio
nal
N
w
ww
.mili
eur
appo
rt.be
> ye
arly
Subs
tant
ially
re
duci
ng th
e nu
mbe
r of
peop
le
regu
larly
113.
% o
f ho
useh
olds
ex
pose
d to
no
ise,
a su
rvey
(2)
Ex to
E
(fut
ure
wis
hes)
Fe
asib
le
com
bine
d w
ith %
of
popu
latio
n af
fect
ed b
y
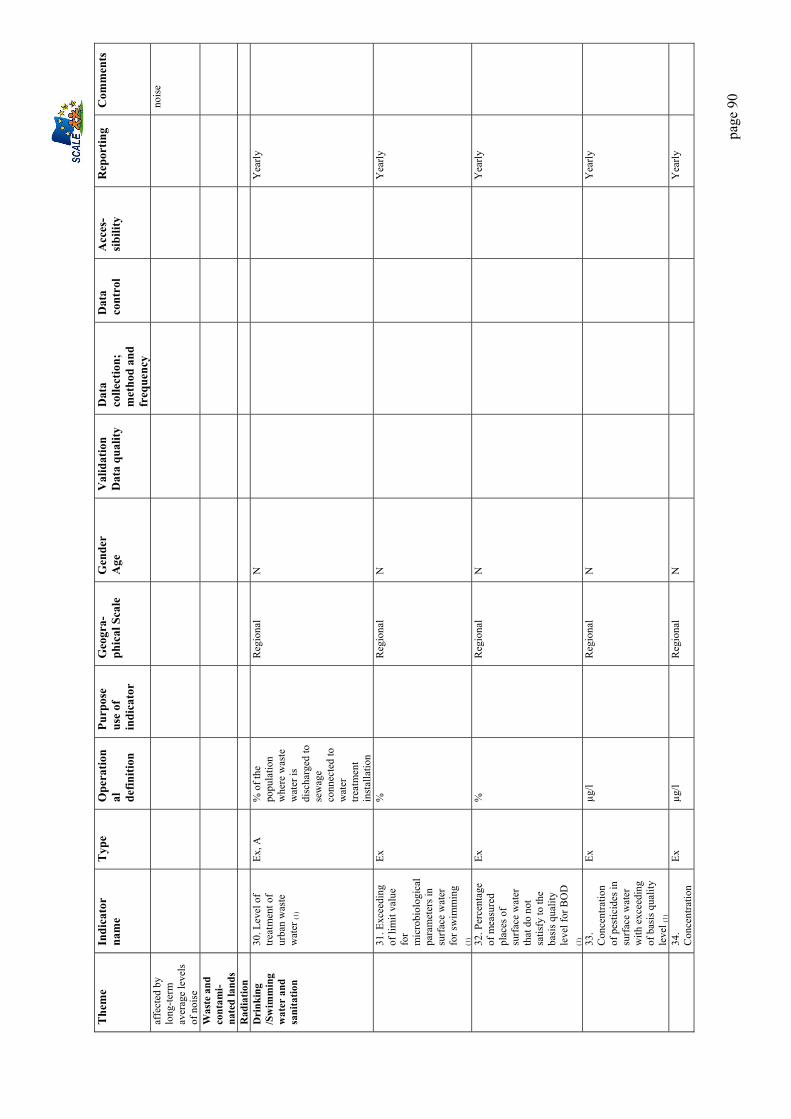
page
90
The
me
Indi
cato
r na
me
T
ype
Ope
ratio
nal
de
finiti
on
Purp
ose
use
of
indi
cato
r
Geo
gra-
phic
al S
cale
G
ende
r
Age
V
alid
atio
n D
ata
qual
ity
Dat
a co
llect
ion;
m
etho
d an
d fr
eque
ncy
Dat
a co
ntro
l A
cces
-si
bilit
y R
epor
ting
Com
men
ts
affe
cted
by
long
-term
av
erag
e le
vels
of
noi
se
nois
e
Was
te a
nd
cont
ami-
nate
d la
nds
Rad
iatio
n
D
rink
ing
/Sw
imm
ing
wat
er a
nd
sani
tatio
n
30. L
evel
of
treat
men
t of
urba
n w
aste
w
ater
(1)
Ex, A
%
of t
he
popu
latio
n w
here
was
te
wat
er is
di
scha
rged
to
sew
age
conn
ecte
d to
w
ater
tre
atm
ent
inst
alla
tion
R
egio
nal
N
Yea
rly
31
. Exc
eedi
ng
of li
mit
valu
e fo
r m
icro
biol
ogic
al
para
met
ers i
n su
rfac
e w
ater
fo
r sw
imm
ing
(1)
Ex
%
R
egio
nal
N
Yea
rly
32
. Per
cent
age
of m
easu
red
plac
es o
f su
rfac
e w
ater
th
at d
o no
t sa
tisfy
to th
e ba
sis q
ualit
y le
vel f
or B
OD
(1
)
Ex
%
R
egio
nal
N
Yea
rly
33
. C
once
ntra
tion
of p
estic
ides
in
surf
ace
wat
er
with
exc
eedi
ng
of b
asis
qua
lity
leve
l (1)
Ex
µg/l
R
egio
nal
N
Yea
rly
34
. C
once
ntra
tion
Ex
µg/l
R
egio
nal
N
Yea
rly

page
91
The
me
Indi
cato
r na
me
T
ype
Ope
ratio
nal
de
finiti
on
Purp
ose
use
of
indi
cato
r
Geo
gra-
phic
al S
cale
G
ende
r
Age
V
alid
atio
n D
ata
qual
ity
Dat
a co
llect
ion;
m
etho
d an
d fr
eque
ncy
Dat
a co
ntro
l A
cces
-si
bilit
y R
epor
ting
Com
men
ts
of p
estic
ides
in
grou
nd w
ater
w
ith e
xcee
ding
of
bas
is q
ualit
y le
vel
(1)
35
. C
once
ntra
tion
of p
estic
ides
in
eel (
1)
E ng
/g fa
t cf
. 300
po
ints
of
mea
sure
R
egio
nal
N
36
. Exc
eedi
ng
of W
HO
gu
idan
ce v
alue
s fo
r drin
king
w
ater
for
mic
robi
olog
ical
pa
ram
eter
s (1)
Ex
%
R
egio
nal
N
Yea
rly
37
. Exc
eedi
ng
of W
HO
gu
idan
ce v
alue
s fo
r drin
king
w
ater
for
chem
ical
pa
ram
eter
s (1)
Ex
Reg
iona
l N
Y
early
38
. Out
brea
ks
of d
isea
ses
rela
ted
to w
ater
co
ntam
inat
ion
(1)
E N
umbe
r of
outb
reak
s/ye
ar
R
egio
nal
N
Yea
rly
Ach
ievi
ng
qual
ity le
vels
of
gro
und
and
surf
ace
wat
er
that
do
not
give
rise
to
sign
ifica
nt
impa
cts o
n an
d ris
ks to
hum
an
heal
th a
nd th
e en
viro
nmen
t
114.
Saf
e dr
inki
ng w
ater
(%
of f
aile
d te
sts)
(2)
Ex, E
Food
Saf
ety
39. r
esid
ues o
f pe
stic
ides
in
food
(1)
Ex
% sa
mpl
es >
M
axim
um
resi
due
limit
R
egio
nal
N
Yea
rly
Mak
e fo
od
safe
ty a
nd
109.
salm
onel
la
case
s (2)
E
Inte
rnat
iona
l an
d R
egio
nal
N

page
92
The
me
Indi
cato
r na
me
T
ype
Ope
ratio
nal
de
finiti
on
Purp
ose
use
of
indi
cato
r
Geo
gra-
phic
al S
cale
G
ende
r
Age
V
alid
atio
n D
ata
qual
ity
Dat
a co
llect
ion;
m
etho
d an
d fr
eque
ncy
Dat
a co
ntro
l A
cces
-si
bilit
y R
epor
ting
Com
men
ts
qual
ity th
e ob
ject
ive
of a
ll pl
ayer
s in
the
food
cha
in
11
0. R
esid
ues
of p
estic
ides
in
food
(tes
ts) (
2)
Ex
Inte
rnat
iona
l an
d R
egio
nal
N
Th
ere
are
regu
lar
chec
k-up
s on
food
in
Euro
pe a
nd
thos
e re
sults
co
uld
indi
cate
food
sa
fety
C
hem
ical
em
erge
ncie
s
Che
mic
al
man
agem
ent:
By
2020
, en
sure
that
ch
emic
als a
re
only
pro
duce
d an
d us
ed in
w
ays t
hat d
o no
t pos
e si
gnifi
cant
th
reat
s to
hum
an h
ealth
an
d th
e en
viro
nmen
t.
111.
Con
tent
s of
toxi
ns in
br
east
milk
, bl
ood,
(fis
h) (2
)
Futu
re
wis
hes:
C
hem
ical
in
dex
Tra
ffic
ac
cide
nts
Hou
sing
G
roun
d 27
. Num
ber o
f gr
ound
s/so
ils
whe
re
sani
tatio
n is
ne
cess
ary
and
whe
re
sani
tatio
n ha
s be
en st
arte
d (1
)
Ex, A
%
M
ina
plan
M
IRA
repo
rt R
egio
nal
N
w
ww
.mili
eur
appo
rt.be
Yea
rly
Was
tes
28. T
otal
am
ount
s of
Ex, A
To
n/ye
ar
(/hab
itant
) M
ina
plan
Reg
iona
l N
Y
early

page
93
The
me
Indi
cato
r na
me
T
ype
Ope
ratio
nal
de
finiti
on
Purp
ose
use
of
indi
cato
r
Geo
gra-
phic
al S
cale
G
ende
r
Age
V
alid
atio
n D
ata
qual
ity
Dat
a co
llect
ion;
m
etho
d an
d fr
eque
ncy
Dat
a co
ntro
l A
cces
-si
bilit
y R
epor
ting
Com
men
ts
was
tes
land
fille
d (1
)
29. T
otal
am
ount
s of
inci
nera
ted
(1)
Ex, A
To
n/ye
ar
(/hab
itant
) M
ina
plan
Reg
iona
l N
Y
early
U.V
40
. U.V
. lig
ht
inde
x (1
) Ex
W
/m²
R
egio
nal
N
Yea
rly
41
. Yea
rly
inci
denc
e of
sk
in c
ance
r or
mel
anom
as (1
)
E N
umbe
r of
case
s per
100
00
0
R
egio
nal
N
Yea
rly
Odo
ur
42. P
erce
ntag
e of
inha
bita
nts
dist
urbe
d by
od
our n
uisa
nce
(1)
E %
of t
he
popu
latio
n
Loca
l and
R
egio
nal
N
Yea
rly
Oth
ers:
C
ontri
butin
g to
a b
ette
r qu
ality
of l
ife
thro
ugh
an
inte
grat
ed
appr
oach
co
ncen
tratin
g on
urb
an a
reas
101.
Ave
rage
lif
e ex
pect
ancy
at
birt
h (2
)
Futu
re
wis
hes:
di
sabi
lity-
free
life
ex
pect
ancy
D
epen
denc
y fr
ee li
fe
10
2. P
rem
atur
e m
orta
lity (
2)
10
3. D
ecla
red
stat
e of
hea
lth
(sur
vey)
, (S
uici
des,
Chi
ldre
n?) (
2)
10
4. A
ccid
ents
at
wor
k or
wor
k re
late
d lo
ng-
term
illn
ess (
2)
10
5. N
ew
canc
ers
diag
nose
d (2
)
Oth
ers:
En
hanc
e he
alth
ed
ucat
ion
with
th
e ob
ject
ive
106.
Bod
y m
ass
inde
x (2
)
Fu
ture
w
ishe
s:
Alc
ohol
co
nsum
ptio
n N
arco
tics

page
94
The
me
Indi
cato
r na
me
T
ype
Ope
ratio
nal
de
finiti
on
Purp
ose
use
of
indi
cato
r
Geo
gra-
phic
al S
cale
G
ende
r
Age
V
alid
atio
n D
ata
qual
ity
Dat
a co
llect
ion;
m
etho
d an
d fr
eque
ncy
Dat
a co
ntro
l A
cces
-si
bilit
y R
epor
ting
Com
men
ts
of a
chie
ving
im
prov
ed
heal
th li
tera
cy
on a
glo
bal
basi
s by
2010
Smok
ing
Oth
ers:
Ta
ckle
issu
es
rela
ted
to
outb
reak
s of
infe
ctio
us
dise
ases
and
re
sist
ance
to
antib
iotic
s
107.
Infe
ctio
us
dise
ases
(tu
berc
ulos
is,
pertu
ssis
) (2)
10
8. R
epor
ted
case
s of
resi
stan
ce to
an
tibio
tics
or
cons
umpt
ion
of
antib
iotic
s by
hum
ans (
2)
Futu
re
wis
hes:
A
ntib
iotic
s in
agr
icul
ture
1 : r
ef. I
ndic
ator
Bel
gium
Fle
mis
h re
gion
(Ste
unpu
nt) (
Indi
cato
rs 1
to 4
2) –
see
docu
men
t atta
ched
+ M
IRA
repo
rt on
ww
w.m
ilieu
rapp
ort.b
e
2 : r
ef. E
uros
tat S
usta
inab
le D
evel
opm
ent I
ndic
ator
s (SD
I) a
ddre
ssin
g th
e fo
llow
ing
sub-
them
es:
* H
uman
hea
lth p
rote
ctio
n
* Fo
od sa
fety
and
qua
lity
* C
hem
ical
s man
agem
ent
* En
viro
nmen
tal q
ualit
y af
fect
ed to
hea
th
Euro
stat
pro
ject
is u
nder
dev
elop
men
t. Th
e lis
ted
indi
cato
rs re
fer t
o th
e re
sults
of t
he E
uros
tat t
ask
forc
e on
sust
aina
ble
deve
lopm
ent i
ndic
ator
s, su
b-gr
oup
publ
ic h
ealth
Se
cond
mee
ting,
Lux
embo
urg
25.1
1.20
03
3 : I
n th
e Fl
emis
h re
gion
, oth
ers u
sed
indi
cato
rs a
re u
sed
at lo
cal l
evel
:
- t
oxin
s in
fishe
s and
milk
- P
CB
’s v
alue
s
- bio
mon
itorin
g
4: In
the
Wal
loon
regi
on, s
ome
indi
cato
rs a
re u
sed
at th
e lo
cal l
evel
:
- min
imum
clin
ical
sum
mar
y (r
epor
ting
all h
ospi
tal a
dmis
sion
s (cf
. int
erna
tiona
l dis
ease
s cla
ssifi
catio
n))
- Mor
talit
y re
gist
ratio
n

page
95
- Eur
ocat
regi
ster
- Med
ical
regi
ster
s (cf
. def
ined
cod
ifica
tion)
5. N
o in
tegr
ated
dat
a co
llect
ion
seem
s to
be e
xist
ing
yet i
n B
elgi
um. D
iffer
ent d
ata
base
s nee
d to
be
coor
dina
ted

page
96
Cze
ch R
epub
lic
Nam
e:
Dr.
Ruz
ena
Kub
inov
a E-
mai
l: ku
bino
va@
szu.
cz
Tel:
+4
202
6708
262
2 A
ddre
ss:
NIP
H, S
roba
rova
48,
100
49
Prah
a 10
, Cze
ch R
epub
lic
Cou
ntry
or p
roje
ct:
Envi
ronm
enta
l Hea
lth M
onito
ring
Syst
em
The
me
Indi
cato
r na
me
T
ype
Ope
ratio
nal
defin
ition
Pu
rpos
e us
e of
indi
cato
r G
eogr
a-ph
ical
Sca
le
Gen
der
A
ge
Val
idat
ion
Dat
a qu
ality
Dat
a co
llect
ion;
m
etho
d an
d fr
eque
ncy
Dat
a co
ntro
l A
cces
sibi
lity
Rep
ortin
g C
omm
ents
Air
qual
ity
Expo
sure
to
am
bien
t ai
r po
lluta
nts
Ex
% p
opul
atio
n ex
pose
d to
ce
rtain
po
llutio
n
leve
ls
Mon
itorin
g 20
– 3
0 ci
ties
acco
rdin
g to
th
e po
lluta
nt
type
N
Y
Air
pollu
tion
mea
sure
men
ts,
year
ly
Y
Y
ww
w.sz
u.cz
Y
year
ly w
eb
and
repo
rt
A
cute
re
spira
tory
di
seas
es
inci
denc
e
E Tr
eate
d ac
ute
resp
irato
ry
dise
ases
in
cide
nce
Mon
itorin
g 25
citi
es
N
0-1
year
, 1-
5, 6
-14,
14-
18, a
dults
Y
Med
ical
reco
rds
from
phy
sici
ans
and
pedi
atric
ians
, ye
arly
Y
Y
ww
w.sz
u.cz
Y
year
ly w
eb
and
repo
rt
A
llerg
y in
cide
nce
E A
llerg
y in
cide
nce
in
child
ren
Mon
itorin
g,
risk
fact
ors
expl
orin
g
18 c
ities
Y
5,
9, 1
3, 1
7 ye
ars
Y
Med
ical
reco
rds
from
pe
diat
ricia
ns,
ques
tionn
aire
s fr
om p
aren
ts,
once
per
4-5
ye
ars
Y
Y
ww
w.sz
u.cz
Y
web
and
re
port
Noi
se
Expo
sure
to
co
mm
unity
no
ise
Ex
Noi
se le
vels
in
day
and
ni
ght
Mon
itorin
g 21
citi
es, i
n ea
ch o
ne q
uiet
an
d no
isy
loca
lity
N
Y
Com
mun
ity
nois
e m
easu
rem
ents
ye
arly
Y
Y
ww
w.sz
u.cz
Y
year
ly w
eb
and
repo
rt
C
omm
unity
no
ise
anno
yanc
e,
slee
p di
stur
banc
e
E Pe
rcen
tage
of
peop
le
anno
yed
Mon
itorin
g 21
citi
es, i
n ea
ch o
ne q
uiet
an
d no
isy
loca
lity
N
Y
Que
stio
nnai
re
surv
ey, o
nce
per 5
yea
rs
Y
Y
ww
w.sz
u.cz
Y
web
and
re
port
Was
te a
nd
*

page
97
The
me
Indi
cato
r na
me
T
ype
Ope
ratio
nal
defin
ition
Pu
rpos
e us
e of
indi
cato
r G
eogr
a-ph
ical
Sca
le
Gen
der
A
ge
Val
idat
ion
Dat
a qu
ality
Dat
a co
llect
ion;
m
etho
d an
d fr
eque
ncy
Dat
a co
ntro
l A
cces
sibi
lity
Rep
ortin
g C
omm
ents
cont
ami-
nate
d la
nds
Rad
iatio
n
* D
rinki
ng
/Sw
imm
ing
wat
er a
nd
sani
tatio
n
Drin
king
w
ater
qu
ality
in
dica
tors
Ex
Freq
uenc
y of
lim
its
exce
edin
gs,
popu
latio
n ex
posu
re
asse
ssm
ent
Mon
itorin
g,
emer
genc
ies
repo
rting
33 c
ities
and
im
porta
nt
supp
lies
with
in
dist
ricts
N
Y
Not
ifica
tion
from
the
dist
ribut
ors,
publ
. hea
lth
serv
ice,
ca
lcul
atio
n of
ex
posu
re,
year
ly
Y
Y
ww
w.sz
u.cz
Y
year
ly w
eb
and
repo
rt
W
ater
-bo
rne
dise
ases
E W
ater
– b
orne
di
seas
es
prev
alen
ce
Mon
itorin
g 33
citi
es
Y
Y
EPID
AT
data
base
, yea
rly
Y
Y
ww
w.sz
u.cz
Y
year
ly w
eb
and
repo
rt
Food
Saf
ety
Die
tary
ex
posu
re
Ex
Popu
latio
n di
etar
y ex
posu
re
Mon
itorin
g N
atio
nal l
evel
N
Y
A
naly
ses o
f fo
od fr
om
cons
umer
ba
sket
Y
Y
ww
w.sz
u.cz
Y
year
ly w
eb
and
repo
rt
A
limen
tary
di
seas
es
E A
limen
tary
di
seas
es
prev
alen
ce
and
inci
denc
e
Mon
itorin
g N
atio
nal l
evel
Y
Y
EP
IDA
T da
taba
se, y
early
Y
Y
w
ww
.szu.
cz
Y
year
ly w
eb
and
repo
rt
Che
mic
al
emer
genc
ies
*
Traf
fic
acci
dent
s
*
Hou
sing
* O
ther
:
B
io –
m
onito
ring
Le
vels
of
cont
amin
ants
and
be
nefit
el
emen
ts
Le
vels
of
cont
amin
ants
an
d be
nefit
el
emen
ts in
hu
man
s
Mon
itorin
g,
natio
nal
refe
renc
e va
lues
setti
ng
Nat
iona
l lev
el
N
(but
pos
sibl
e)
child
ren
8-10
ye
ars
adul
ts
Y
Surv
eys i
n in
terv
als
acco
rdin
g to
the
cont
amin
ant
and
mat
rix 1
–
2 ye
ars
Y
Y
ww
w.sz
u.cz
Y
year
ly w
eb
and
repo
rt
Occ
upat
iona
l en
viro
nmen
t O
ccup
atio
nal
dis
ease
s E
Occ
upat
iona
l di
seas
es
Prev
alen
ce
and
inci
denc
e
Mon
itorin
g N
atio
nal a
nd
regi
onal
leve
l, Y
Y
R
egis
ter o
f oc
cupa
tiona
l di
seas
es
Y
Y
ww
w.sz
u.cz
Y
year
ly w
eb
and
repo
rt
Hea
lth st
atus
Lo
ng-te
rm
E Fr
eque
nce
of
Mon
itorin
g 27
citi
es
Y
N
Que
stio
nnai
re
Y
Y
Y

page
98
The
me
Indi
cato
r na
me
T
ype
Ope
ratio
nal
defin
ition
Pu
rpos
e us
e of
indi
cato
r G
eogr
a-ph
ical
Sca
le
Gen
der
A
ge
Val
idat
ion
Dat
a qu
ality
Dat
a co
llect
ion;
m
etho
d an
d fr
eque
ncy
Dat
a co
ntro
l A
cces
sibi
lity
Rep
ortin
g C
omm
ents
heal
th
com
plai
nts
long
-term
he
alth
co
mpl
aint
s
Bas
e fo
r pr
even
tive
prog
ram
mes
co
ncep
tion
45 –
54
year
s su
rvey
w
ww
.szu.
cz
ye
arly
web
an
d re
port
R
isk
fact
ors
inci
denc
e
E Fr
eque
nce
of
risk
fact
ors o
f ch
roni
c no
n co
mm
unic
abl
e di
seas
es
Mon
itorin
g B
ase
for
prev
entiv
e pr
ogra
mm
es
conc
eptio
n
27 c
ities
Y
45
– 5
4 ye
ars
N
Que
stio
nnai
re
surv
ey
Y
Y
ww
w.sz
u.cz
Y
year
ly w
eb
and
repo
rt
Life
styl
e Li
fe st
yle
indi
cato
rs
Fr
eque
nce
of
sele
cted
life
st
yle
indi
cato
rs (%
sm
oker
s ac
tive,
pa
ssiv
e,
exce
ssiv
e al
coho
l etc
.)
Mon
itorin
g B
ase
for
prev
entiv
e pr
ogra
mm
es
conc
eptio
n
27 c
ities
Y
45
– 5
4 ye
ars
Y
Que
stio
nnai
re
surv
ey
Y
Y
ww
w.sz
u.cz
Y
year
ly w
eb
and
repo
rt
Perc
eptio
n En
viro
nme
ntal
risk
s pe
rcep
tion
Fr
eque
ncy
of
nega
tive
and
posi
tive
envi
ronm
ent
perc
eptio
n
Mon
itorin
g,
base
for
heal
th ri
sks
com
mun
icat
ion
27 c
ities
Y
45
– 5
4 ye
ars
Q
uest
ionn
aire
su
rvey
Y
Y
w
ww
.szu.
cz
Y
year
ly w
eb
and
repo
rt
Sa
tisfa
ctio
n w
ith o
wn
life
and
with
ow
n he
alth
Pe
rcen
tage
of
peop
le w
ith
nega
tive
or
posi
tive
perc
eptio
n of
th
eir o
wn
life
and
heal
th
Mon
itorin
g,
Bas
e fo
r co
mm
unic
atio
n, p
reve
ntiv
e pr
ogra
mm
es
27 c
ities
Y
45
– 5
4 ye
ars
Q
uest
ionn
aire
su
rvey
Y
Y
w
ww
.szu.
cz
Y
year
ly w
eb
and
repo
rt
* Th
ese
issu
es a
re n
ot in
volv
ed in
the
Mon
itorin
g sy
stem
, som
e in
dica
tors
are
regi
ster
ed a
nd r
epor
ted
by o
ther
dep
artm
ents
– e
nviro
nmen
tal,
trans
port,
radi
atio
n sa
fety
, sta
tistic
al o
ffice
. Als
o he
alth
an
d so
ciod
emog
raph
ic s
tatis
tics
data
are
ava
ilabl
e w
ithin
Cze
ch R
epub
lic. T
he it
ems
pres
ente
d ab
ove
are
colle
cted
exc
lusi
vely
with
in E
H M
onito
ring
Sys
tem
in N
IPH
.
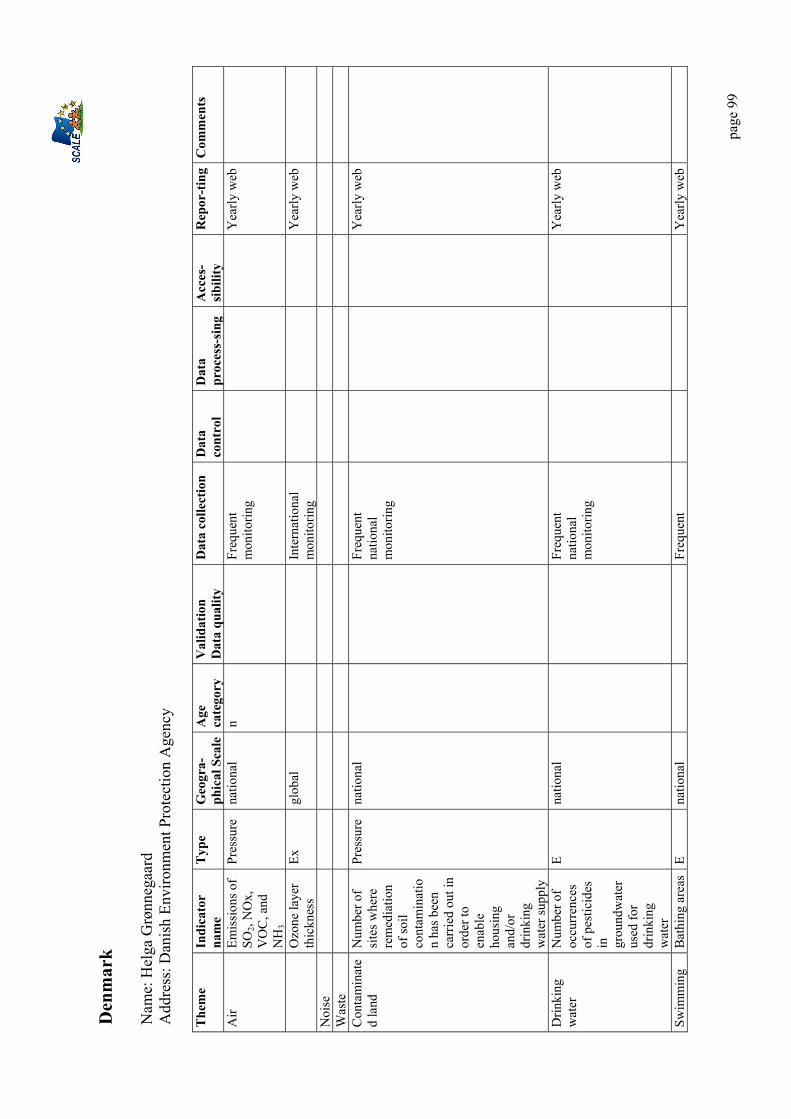
page
99
Den
mar
k N
ame:
Hel
ga G
rønn
egaa
rd
Add
ress
: Dan
ish
Envi
ronm
ent P
rote
ctio
n A
genc
y The
me
Indi
cato
r na
me
T
ype
Geo
gra-
phic
al S
cale
Age
ca
tego
ry
Val
idat
ion
Dat
a qu
ality
D
ata
colle
ctio
n D
ata
cont
rol
Dat
a pr
oces
s-si
ng
Acc
es-
sibi
lity
Rep
or-t
ing
Com
men
ts
Air
Emis
sion
s of
SO2,
NO
x,
VO
C, a
nd
NH
3
Pres
sure
na
tiona
l n
Fr
eque
nt
mon
itorin
g
Yea
rly w
eb
O
zone
laye
r th
ickn
ess
Ex
glob
al
Inte
rnat
iona
l m
onito
ring
Y
early
web
Noi
se
W
aste
Con
tam
inat
ed
land
N
umbe
r of
site
s whe
re
rem
edia
tion
of so
il co
ntam
inat
ion
has b
een
carr
ied
out i
n or
der t
o en
able
ho
usin
g an
d/or
dr
inki
ng
wat
er su
pply
Pres
sure
na
tiona
l
Fr
eque
nt
natio
nal
mon
itorin
g
Y
early
web
Drin
king
w
ater
N
umbe
r of
occu
rren
ces
of p
estic
ides
in
gr
ound
wat
er
used
for
drin
king
w
ater
E na
tiona
l
Fr
eque
nt
natio
nal
mon
itorin
g
Y
early
web
Swim
min
g B
athi
ng a
reas
E
natio
nal
Freq
uent
Yea
rly w
eb

page
100
The
me
Indi
cato
r na
me
T
ype
Geo
gra-
phic
al S
cale
Age
ca
tego
ry
Val
idat
ion
Dat
a qu
ality
D
ata
colle
ctio
n D
ata
cont
rol
Dat
a pr
oces
s-si
ng
Acc
es-
sibi
lity
Rep
or-t
ing
Com
men
ts
wat
er
whe
re w
ater
qu
ality
is so
po
or th
at
bath
ing
is n
ot
reco
mm
ende
d
natio
nal
mon
itorin
g
Rad
iatio
n
Food
Le
vel o
f se
lect
ed
inci
denc
es o
g ch
emic
al
pollu
tion
in
food
Ex
natio
nal
Freq
uent
na
tiona
l m
onito
ring
Y
early
web
PC
Bs i
n co
d liv
er fr
om
Dan
ish
wat
ers 1
988-
2000
Ex
natio
nal
Surv
ey
Y
early
web
C
onsu
mpt
ion
of 4
hea
vy
met
als i
n D
anis
h di
ets
(all
food
s) in
th
ree
5-ye
ar
mon
itorin
g pe
riods
an
alys
ed in
m
icro
gram
s pe
r day
Ex
natio
nal
Freq
uent
na
tiona
l sur
vey
Y
early
web
Hou
sing
Che
mic
als
Num
ber o
f ch
emic
als
clas
sifie
d
Ex
natio
nal
Freq
uent
na
tiona
l m
onito
ring
Y
early
web
Th
e vo
lum
e of
sale
s of
pest
icid
e ac
tive
Ex/p
ress
ure
natio
nal
Nat
iona
l
Freq
uent
na
tiona
l m
onito
ring
Y
early
web
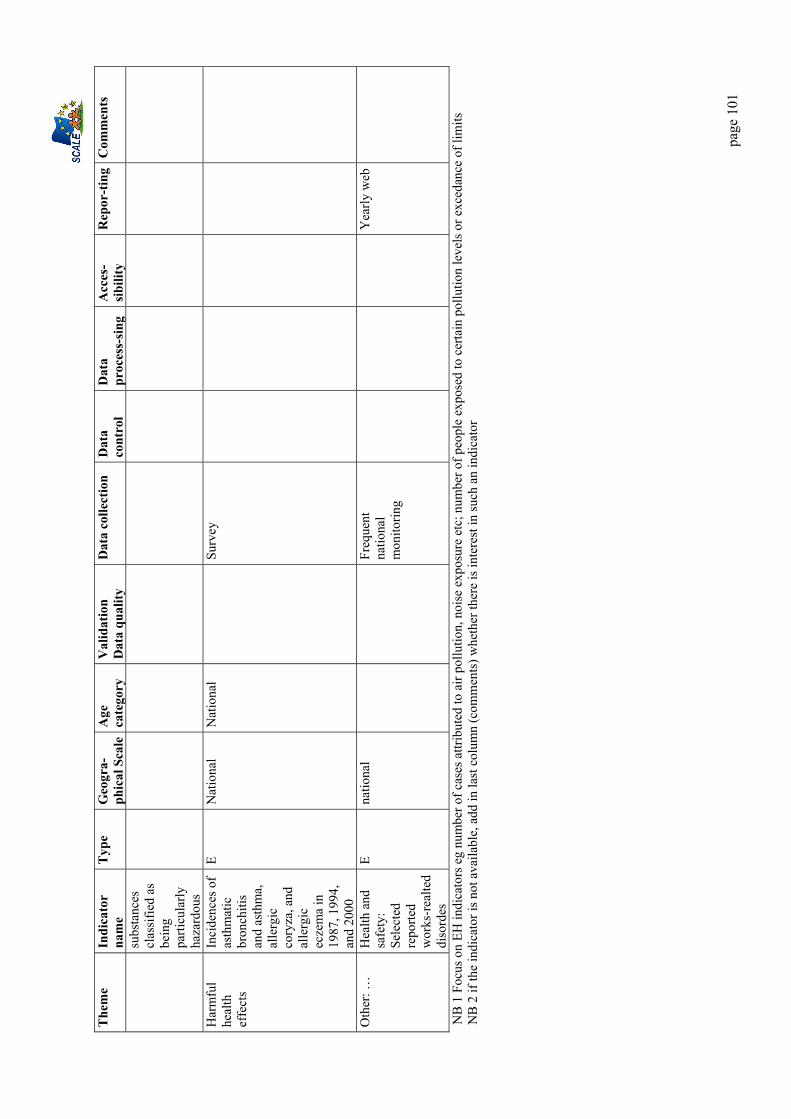
page
101
The
me
Indi
cato
r na
me
T
ype
Geo
gra-
phic
al S
cale
Age
ca
tego
ry
Val
idat
ion
Dat
a qu
ality
D
ata
colle
ctio
n D
ata
cont
rol
Dat
a pr
oces
s-si
ng
Acc
es-
sibi
lity
Rep
or-t
ing
Com
men
ts
subs
tanc
es
clas
sifie
d as
be
ing
parti
cula
rly
haza
rdou
s H
arm
ful
heal
th
effe
cts
Inci
denc
es o
f as
thm
atic
br
onch
itis
and
asth
ma,
al
lerg
ic
cory
za, a
nd
alle
rgic
ec
zem
a in
19
87, 1
994,
an
d 20
00
E N
atio
nal
Nat
iona
l
Surv
ey
Oth
er: …
H
ealth
and
sa
fety
: Se
lect
ed
repo
rted
wor
ks-r
ealte
d di
sord
es
E na
tiona
l
Fr
eque
nt
natio
nal
mon
itorin
g
Y
early
web
NB
1 F
ocus
on
EH in
dica
tors
eg
num
ber o
f cas
es a
ttrib
uted
to a
ir po
llutio
n, n
oise
exp
osur
e et
c; n
umbe
r of p
eopl
e ex
pose
d to
cer
tain
pol
lutio
n le
vels
or e
xced
ance
of l
imits
N
B 2
if th
e in
dica
tor i
s not
ava
ilabl
e, a
dd in
last
col
umn
(com
men
ts) w
heth
er th
ere
is in
tere
st in
such
an
indi
cato
r

page
102
Fran
ce
Nam
e: P
hilip
pe P
irard
E-
mai
l: p.
pira
rd@
invs
.sant
e.fr
Te
l: 00
.33.
1.41
.79.
67.6
0 In
stitu
t de
Vei
lle S
anita
ire14
rue
du v
al d
’Osn
es 9
4415
Sai
nt-M
auric
e The
me
Nom
ad
dres
s In
dica
tor
nam
e
Typ
e O
pera
tiona
l de
finiti
on
Purp
ose
use
of
indi
cato
r G
eogr
aphi
cal S
cale
A
ge
cate
gory
E
x =
expo
sure
E
= e
ffec
t A
= a
ctio
n
Nat
iona
l, R
egio
nal,
Loc
al, c
ity o
r po
stal
co
de
age
cate
gori
es
Y/N
A
ir
CIT
EPA
C
ITEP
A
Emis
sion
s Ex
To
ns
prod
ucte
d
Mon
itorin
g em
issi
ons
Nat
iona
l N
S
Air
Su
rvei
llanc
e ai
r et s
anté
9
ville
s In
VS
No2
, TSP
, Bla
ck S
mok
e, O
3 H
ospi
tal a
dmis
sion
s (he
art,
resp
irato
ry,)
Gen
eral
Car
diov
ascu
lar ,
re
spira
tory
dis
ease
s dea
th
EX /
E µg
/m3
Inci
denc
e :
Nb/
1000
00
Mon
itorin
g H
ealth
Ris
k du
e to
Air
Pollu
tion
9 C
ities
in F
ranc
e N
S
Air
B
DQ
A
AD
EME
No2
, TSP
, Bla
ck S
mok
e, O
3 N
i, C
d, A
s, Pb
…
EX
µg/m
3 M
onito
ring
Air
Qua
lity
Nat
iona
l cen
tralis
atio
n of
inf
orm
atio
n fr
om
citie
s,
NS
Noi
se
Cla
ssifi
catio
n of
exp
ositi
on
to n
oise
due
to tr
affic
in
fras
truct
ures
MED
D
Leve
ls o
f mea
n D
ecib
els,
clas
sific
atio
n of
traf
fic
EX
Map
s with
cl
assi
ficat
ion
in fi
ve
cate
gorie
s
Gui
ding
and
m
onito
ring
po
licie
s
Nat
iona
l /D
epar
tmen
tal/
Com
mun
al
NS
Was
te
BA
SOL
B
ASI
AS
MED
D
BR
GM
Met
als,
HO
V, H
AP,
C
yanu
res,
Solv
ants
, Pe
stic
ides
, Oth
ers
Con
tam
inat
ed so
ils a
nd
indu
stria
l site
s
EX/S
tate
Ex
/Sta
te
Qua
lity
not
quan
tity
Kee
p m
emor
y of
an
cien
t site
s Id
entif
y pr
evio
us
indu
stria
l site
s an
d se
rvic
e ac
tiviti
es
Nat
iona
l, Lo
cal
Nat
iona
l, Lo
cal
Cov
erag
e no
t fin
ishe
d
Con
tam
inat
ed
land
/IN
FOSO
L ((
InR
A)
ASP
ITET
(InR
A)
RM
QS
INR
A
AD
EME
S =
agric
ultu
ral a
nd fo
rest
si
tes -
surf
ace
and
deep
ho
rizon
s and
gra
ssla
nd si
tes
(grid
sam
plin
g 16
x 1
6 km
) M
etal
/trac
e el
emen
ts
EX
µg/k
g of
soil
To m
onito
r soi
l qu
ality
N
atio
nal
NS
Dri
nkin
g SI
SE-E
AU
X
DG
S C
OV
–En
viro
nmen
tal c
onte
xt
EX
Dep
ends
of
Mon
itorin
g w
ater
N
atio
nal/D
epar
tmen
tal/
NS

page
103
The
me
Nom
ad
dres
s In
dica
tor
nam
e
Typ
e O
pera
tiona
l de
finiti
on
Purp
ose
use
of
indi
cato
r G
eogr
aphi
cal S
cale
A
ge
cate
gory
E
x =
expo
sure
E
= e
ffec
t A
= a
ctio
n
Nat
iona
l, R
egio
nal,
Loc
al, c
ity o
r po
stal
co
de
age
cate
gori
es
Y/N
w
ater
B
RG
M
Org
anol
eptic
cha
ract
eris
tics -
C
hlor
oben
zene
s -
Mic
robi
olog
ic p
rodu
cts -
Pe
stic
ides
–D
esin
fect
ants
–Pl
astic
iser
s
indi
cato
r (>
971
diff
eren
ts)
qual
ity
loca
l
Dri
nkin
g w
ater
H
ealth
risk
due
to w
ater
qu
ality
In
VS
SISE
–Ea
ux in
dica
tors
D
rug
and
med
ical
act
co
nsum
ptio
n
Ex/ E
N
umbe
r of
spec
ific
acts
M
onito
ring
heal
th ri
sk d
ue to
w
ater
qua
lity
Loca
l and
regi
onal
(tes
t) Y
Whe
n po
ssib
le
Swim
min
g w
ater
SI
SE-E
aux
(SIS
E-B
aign
ades
) M
inis
try
of H
ealth
In
dica
tors
of D
irect
ive
76/1
60/C
EE
Ger
ms (
Col
iform
ae
Eshe
richi
a C
oli –
st
rept
ococ
ci),
Oil,
Te
nsio
activ
e su
bsta
nces
Ph
énol
, Tra
npar
ency
, C
olor
atio
n
EX
Dep
ends
of
indi
cato
r Tu
rbid
ity
Mon
itorin
g w
ater
qu
ality
N
atio
nal/L
ocal
N
S
Rad
iatio
n Te
lera
y , h
ydro
ray,
SA
RA
…
(O
PER
A) O
bser
vato
ire
Perm
anen
t Rad
ioac
tivité
N
atio
nal N
etw
ork
of
Rad
ioac
tivity
M
easu
rem
ents
in
Envi
ronm
ent (
RN
SE)
IRSN
R
adon
./gam
ma
EX
B
q.m
-3 –
G
y(Sv
) µG
y.h
(Sv)
Det
ectio
n an
d al
ert s
yste
m
Mon
itorin
g qu
ality
(air,
w
ater
, soi
l, fo
od)
2/de
partm
ent f
or te
lera
y 30
for
hydr
oray
15
for S
AR
A
8 on
mai
nlan
d N
atio
nal/L
ocal
/ D
epar
tmen
tal
NS
Food
N
atio
nal R
egul
ator
y m
onito
ring
Min
istè
re
de
l’Agr
icul
tur
e
Spec
ified
in E
urop
ean
Dire
ctiv
es
Ex
depe
nds o
f in
dica
tor
Mon
itorin
g re
spec
t of
nor
ms
Nat
iona
l // R
egio
nal
NS
Hou
sing
In
door
Air
Qua
lity
perm
anen
t sur
vey
CST
B
Alle
rgen
s, C
O, r
adon
, ga
mm
a, H
OV
, <PM
10,
CO
2, ra
don,
noi
se,
satu
rnis
m
Ex/E
D
epen
ds o
f in
dica
tor
Kno
wle
dge
of
expo
sure
leve
ls
Futu
re
mon
itorin
g
Nat
iona
l Y
Hou
sing
C
O
InV
S H
ospi
tal a
dmis
sion
s for
CO
in
toxi
catio
ns,
Dea
ths f
or C
O in
toxi
catio
n//
Situ
atio
ns a
t ris
k
E //EX
Nb
Mon
itorin
g ris
k,
polic
ies,
D
etec
tion
of
situ
atio
ns a
t ris
k
Nat
iona
l N
S

page
104
The
me
Nom
ad
dres
s In
dica
tor
nam
e
Typ
e O
pera
tiona
l de
finiti
on
Purp
ose
use
of
indi
cato
r G
eogr
aphi
cal S
cale
A
ge
cate
gory
E
x =
expo
sure
E
= e
ffec
t A
= a
ctio
n
Nat
iona
l, R
egio
nal,
Loc
al, c
ity o
r po
stal
co
de
age
cate
gori
es
Y/N
L
ead
leve
l in
bloo
d N
atio
nal l
ead
leve
l in
bloo
d m
onito
ring
syst
em
InV
S B
lood
Lea
d Le
vel
EX/E
B
lood
leve
l in
bloo
d in
µg/
l M
onito
ring
lead
le
vel i
n bl
ood
Nat
iona
l 0-
6 an
s
Can
cer
Nat
iona
l reg
istry
of
mal
igna
nt tu
mor
s in
child
hood
INSE
RM
C
ases
of s
olid
tum
ors a
nd
leuk
emia
e E
Cas
es
Mon
itorin
g ca
ncer
inci
denc
e Fa
cilit
atin
g re
sear
ch
Nat
iona
l 0-
14 a
ns
(<20
ans
for
thyr
oïd
canc
er)
Can
cer
N
atio
nal s
urve
illan
ce
syst
em fo
r thy
roïd
can
cer
InV
S C
ases
of t
hyro
ïd c
ance
rs o
n th
e ba
se o
f PM
SI1 a
nd
anat
omop
atho
logi
c sh
ifts
E N
umbe
rs a
nd
in th
e fu
ture
ca
ses
Mon
itorin
g ca
ncer
inci
denc
e N
atio
nal a
nd r
egio
nal
Y
Con
geni
tal
mal
form
atio
ns
Reg
iona
l reg
istri
es o
f co
ngen
ital m
alfo
rmat
ions
In
VS
Con
geni
tal m
alfo
rmat
ions
C
ases
of
Spin
a bi
fida,
an
ence
phal
y, p
alat
ine
mal
form
atio
n, p
lurip
loid
iae,
ge
nita
l mal
form
atio
ns
E N
umbe
r, ra
tes
Mon
itorin
g in
cide
nce
faci
litat
ing
rese
arch
Reg
iona
l B
irth
Rep
rodu
ctio
n Pe
rman
ent s
urve
y on
fe
rtili
ty
INSE
RM
Ex
posu
re to
ioni
sing
ra
diat
ions
, ben
zene
, oth
ers
Del
ays n
eces
sary
to
conc
eive
d, m
edic
al a
ssis
ted
conc
eptio
n
Ex//E
C
ases
, sam
ple
Res
earc
h R
egio
nal (
sam
ple)
Y
Tra
ffic
A
ccid
ents
R
egis
tre
of th
e R
hône
IN
RET
S C
orpo
ral V
ictim
s of T
raff
ic
Acc
iden
ts
E A
ccid
ent c
ases
, le
sion
s,circ
onst
ance
s of
ac
cide
nt
Res
earc
h M
onito
ring
in
cide
nce
Reg
iona
l (de
partm
enta
l) Y
Tra
ffic
A
ccid
ents
B
AA
C
Obs
erva
toire
N
atio
nal
inte
rmin
isté
riel d
e Sé
curit
é R
outiè
re
Cor
pora
l vic
tims o
f Tra
ffic
ac
cide
nts
E N
umbe
r of
ca
ses
Mon
itorin
g
inci
denc
e N
atio
nal
Y
Usu
al li
fe
acci
dent
s E
PAC
In
VS
Cas
ualti
es a
nd d
escr
iptio
n of
ac
cide
nts a
nd c
ause
s EX
//E
Num
ber
of
casu
altie
s M
onito
ring
and
de
scrip
tion
of
acci
dent
s and
th
eir c
ause
10 h
ospi
tals
(3%
of
glob
al h
ospi
tal a
ctiv
ity)
Y
1 P
rogr
amm
e m
édic
alis
é de
s sys
tèm
es d
’info
rmat
ion
(med
ical
ised
pro
gram
of i
nfor
mat
ion
syst
ems

page
105
The
me
Nom
ad
dres
s In
dica
tor
nam
e
Typ
e O
pera
tiona
l de
finiti
on
Purp
ose
use
of
indi
cato
r G
eogr
aphi
cal S
cale
A
ge
cate
gory
E
x =
expo
sure
E
= e
ffec
t A
= a
ctio
n
Nat
iona
l, R
egio
nal,
Loc
al, c
ity o
r po
stal
co
de
age
cate
gori
es
Y/N
A
sthm
a Su
rvei
llanc
e sy
stem
In
VS
Self
repo
rted
prev
alen
ce
Ast
hma-
asso
ciat
ed
hosp
italia
stio
ns
Ast
hma-
asso
ciat
ed m
orta
lity
Ast
hma-
asso
ciat
ed e
mer
genc
yD
epar
tmen
t vis
its
Occ
upat
iona
l ast
hma
E N
ot y
et
Mon
itorin
g as
thm
a pr
eval
ence
and
se
verit
y
N
Y
Mor
talit
y C
epi-D
C
INSE
RM
m
orta
lity
E C
ases
M
onito
ring
de
aths
and
thei
r ca
uses
N
Y

page
106
The
me
Nom
In
dica
tor
nam
e
Val
idat
ion
Dat
a qu
ality
m
etho
d an
d fr
eque
ncy
Dat
a co
llect
ion
Dat
a co
ntro
l A
cces
sibi
lity
Rep
ortin
g C
omm
ents
Y/
N (e
g in
tern
atio
nal
stan
dard
s suc
h as
IC
D u
sed
or n
ot)
R=
regi
stry
S=
surv
ey
Mo
= m
odel
ling
M=m
easu
rem
ent
C=c
ontin
ue
D=
decl
arat
ions
Y/N
(eg
diag
nosi
s, co
ding
of
dise
ases
ch
ecke
d)
Ava
ilabl
e fo
r oth
ers:
Y/
N, n
ame
web
site
or d
atab
ase
Fre
quen
cy
How
E
g ye
arly
, w
eb
Ben
efits
Pr
oble
ms
Def
icits
R
elev
ance
for
prio
rity
are
as
Air
C
ITEP
A
So2,
NO
2, T
PS
2,5,
10, O
3, fu
rane
s m
etal
s, ot
hers
Y
Cor
inai
r Eur
opea
n M
etho
dolo
gy
S,M
///
ht
tp://
ww
w.c
itepa
.org
Yea
rly
Not
hing
Air
9
ville
s N
o2, T
SP, B
lack
Sm
oke,
O3
// Hos
pita
l ad
mis
sion
s (he
art,
resp
irato
ry),
Gen
eral
C
ardi
ovas
cula
r ,
resp
irato
ry d
isea
ses
deat
h
Yes
M
out
door
s//
PMSI
– D
eath
ce
rtific
ates
Y b
ut n
ot
finis
hed
R
egul
ar b
alan
ces
Not
de
fined
, ea
ch fe
w
year
s
Use
d to
gui
de
Fren
ch la
w o
n A
ir Q
ualit
y
Air
C
O
CO
into
xica
tions
C
O in
toxi
catio
n de
aths
Si
tuat
ions
at r
isk
Yes
D
and
M C
PM
SI
Cep
iDC
R
egio
nal
pilo
t gr
oups
Futu
re w
eb si
te
cont
inue
N
ew st
ruct
ure
exte
nded
to
situ
atio
ns a
t ris
k (s
till t
o be
im
plem
ente
d-
test
s)
Air
B
DQ
A
No2
, TSP
, Bla
ck
Smok
e, O
3, N
i, C
d, A
s, Pb
..
y C
,S
Y
ww
w.a
dem
e.fr
sa
mpl
ing
on fi
lters
pe
rman
ent
,h ,
daily
…
Mon
itorin
g of
la
w e
ffec
ts
Noi
se
Noi
se
map
ping
C
lass
ifica
tion
of
expo
sitio
n to
noi
se
of tr
affic
in
fras
truct
ures
Y
S Y
ht
tp://
ww
w.e
nviro
nnem
ent.g
ouv.
fr/d
ossi
ers/
brui
t/dos
sier
s-br
uit-2
0021
1-br
uits
-tran
spor
ts.h
tm
ex. :
ht
tp://
ww
w.a
ude.
pref
.gou
v.fr
/ser
vice
s/dd
e/ra
yonb
ruit/
Bru
it.ht
m
Each
few
ye
ars
Not
pre
cise
No
dead
line
for
such
im
plem
enta
tion
/ No
freq
uenc
y de
fined
W
aste
B
ASO
L
Met
als,
HO
V,
HA
P, C
yanu
res,
Solv
ants
, Pe
stic
ides
, Oth
ers
Y
D a
nd S
?
http
://ba
sol.e
nviro
nnem
ent.g
ouv.
fr fo
r Bas
ol ;
http
://ba
sias
.brg
m.fr
N
ot
prec
ised
C
ontin
ue ?
No
quot
ed
quan
titie
s for
po
lluta
nts

page
107
The
me
Nom
In
dica
tor
nam
e
Val
idat
ion
Dat
a qu
ality
m
etho
d an
d fr
eque
ncy
Dat
a co
llect
ion
Dat
a co
ntro
l A
cces
sibi
lity
Rep
ortin
g C
omm
ents
Y/
N (e
g in
tern
atio
nal
stan
dard
s suc
h as
IC
D u
sed
or n
ot)
R=
regi
stry
S=
surv
ey
Mo
= m
odel
ling
M=m
easu
rem
ent
C=c
ontin
ue
D=
decl
arat
ions
Y/N
(eg
diag
nosi
s, co
ding
of
dise
ases
ch
ecke
d)
Ava
ilabl
e fo
r oth
ers:
Y/
N, n
ame
web
site
or d
atab
ase
Fre
quen
cy
How
E
g ye
arly
, w
eb
Ben
efits
Pr
oble
ms
Def
icits
R
elev
ance
for
prio
rity
are
as
BA
SIA
S C
onta
min
ated
soils
an
d in
dust
rial s
ites
Con
tam
inat
ed
land
/IN
FOSO
L
ASP
ITET
R
MQ
S
S =
agric
ultu
ral a
nd
fore
st si
tes -
su
rfac
e an
d de
ep
horiz
ons
Met
al/tr
ace
elem
ents
Y
M, S
N
S w
ww
.ade
me.
fr
http
://et
m.o
rlean
s.inr
a.fr
/
Not
pr
ecis
ed
Con
tinue
,
Dri
nkin
g w
ater
SI
SE-E
AU
X
CO
V –
Envi
ronm
enta
l co
ntex
t O
rgan
olep
tic
char
acte
ristic
s -
Chl
orob
enze
nes -
M
icro
biol
ogic
pr
oduc
ts -
Pest
icid
es –
Des
infe
ctan
ts –
Plas
ticis
ers
Y
C
Y
SI
SE-E
aux
: Min
istè
re (a
cces
s on
ly f
or m
embe
rs o
f the
M
inis
tery
)
Perm
anen
t N
ot e
noug
h fe
edba
ck u
se
Dri
nkin
g w
ater
H
ealth
risk
du
e to
wat
er
qual
ity
SISE
-EA
UX
in
dica
tors
D
rug
and
med
ical
ac
t con
sum
ptio
n
Y
D,C
,S
Y
C
Te
st fo
r fe
asib
ility
Swim
min
g w
ater
SI
SE-E
AU
X
Ger
ms (
Col
iform
ae
Eshe
richi
a C
oli –
st
rept
ococ
ci),
Oil,
Te
nsio
activ
e su
bsta
nces
, Phé
nol,
Tran
pare
ncy,
co
lora
tion
Y
M,S
Sw
imm
ing
pool
s:
Mon
thly
B
each
es :
befo
re
seas
on a
nd e
very
w
eek
Y
http
://ba
igna
des.s
ante
.gou
v.fr
/ Sw
imm
ing
pool
s:
Mon
thly
B
each
es :
befo
re
seas
on
and
ever
y w
eek
Que
stio
ns fo
r re
leve
nce
of
idic
ator
s
Rad
iatio
n Te
lera
y,
Hyd
rora
y,
Gam
ma,
ra
dion
ucle
ides
Y
M
–S
– C
Y
http
://w
ww
.opr
i.fr/o
pri/h
tml_
opri/
mes
ures
_som
.htm
w
ww
.irsn
.fr
Ever
y 15
m
n EC
RIN
, O
PER
A e
xist

page
108
The
me
Nom
In
dica
tor
nam
e
Val
idat
ion
Dat
a qu
ality
m
etho
d an
d fr
eque
ncy
Dat
a co
llect
ion
Dat
a co
ntro
l A
cces
sibi
lity
Rep
ortin
g C
omm
ents
Y/
N (e
g in
tern
atio
nal
stan
dard
s suc
h as
IC
D u
sed
or n
ot)
R=
regi
stry
S=
surv
ey
Mo
= m
odel
ling
M=m
easu
rem
ent
C=c
ontin
ue
D=
decl
arat
ions
Y/N
(eg
diag
nosi
s, co
ding
of
dise
ases
ch
ecke
d)
Ava
ilabl
e fo
r oth
ers:
Y/
N, n
ame
web
site
or d
atab
ase
Fre
quen
cy
How
E
g ye
arly
, w
eb
Ben
efits
Pr
oble
ms
Def
icits
R
elev
ance
for
prio
rity
are
as
SAR
A,
OPE
RA
, EC
RIN
, R
NSE
Rad
on, g
amm
as
Aut
our d
es si
tes
Not
yet
ava
ilabl
e fo
r pub
lic
Var
ious
RN
SE (c
reat
ed
by la
w n
ot y
et
impl
emen
ted)
Hou
sing
O
QA
I SI
SE-H
abita
t
Alle
rgen
s, C
O,
rado
n, g
amm
a,
HO
V, <
PM10
, C
O2,
R
adon
, N
oise
, Sa
turn
ism
Y
S S
Y
http
://w
ww
.air-
inte
rieur
.org
O
rgan
ism
s of t
he M
inis
try o
f Hea
lth
Surv
ey
Var
ious
Obs
erva
tory
us
eful
for
surv
eilla
nce
begi
nnin
g
Satu
rnis
m
Chi
ldho
od
lead
poi
soni
ng
surv
eilla
nce
syst
em
Lead
leve
l in
bloo
d Y
labo
rato
ry
D
Labo
rato
ryR
epor
ts
C
Yea
r
Rec
ently
re
stru
ctur
ed
Can
cer
Nat
iona
l R
egis
try fo
r m
alig
nant
tu
mor
s in
ch
ildho
od
Cas
es o
f sol
id
tum
ors a
nd
leuk
emia
e
Y –
CIM
10
C,D
,S
Y
Spec
ific
dem
and
of e
xtra
ctio
n ne
eded
Fe
w y
ears
In
pro
gres
s
Can
cer
Nat
iona
l su
rvei
llanc
e sy
stem
for
thyr
oïd
canc
er
Cas
es o
f thy
roïd
ca
ncer
s on
the
base
of
PMSI
2 and
fu
ture
an
atom
opat
holo
gic
shift
s
Y (I
CD
10)
C,D
,S
Y
Prop
ositi
ons o
n w
ww
.invs
.fr
Not
yet
pr
ecis
ed
(yea
rly ?
)
Feas
ibili
ty in
te
st
Con
geni
tal
mal
form
atio
nsR
egio
nal
regi
strie
s of
cong
enita
l
Cas
es o
f Sp
ina
bifid
a,
anen
ceph
aly,
Y
C,D
,S
Y
Spec
ific
dem
and
of e
xtra
ctio
n ne
eded
Fe
w y
ears
M
ore
rele
vent
fo
r en
viro
nmen
tal
2 P
rogr
amm
e m
édic
alis
é de
s sys
tèm
es d
’info
rmat
ion
(med
ical
ised
pro
gram
of i
nfor
mat
ion
syst
ems

page
109
The
me
Nom
In
dica
tor
nam
e
Val
idat
ion
Dat
a qu
ality
m
etho
d an
d fr
eque
ncy
Dat
a co
llect
ion
Dat
a co
ntro
l A
cces
sibi
lity
Rep
ortin
g C
omm
ents
Y/
N (e
g in
tern
atio
nal
stan
dard
s suc
h as
IC
D u
sed
or n
ot)
R=
regi
stry
S=
surv
ey
Mo
= m
odel
ling
M=m
easu
rem
ent
C=c
ontin
ue
D=
decl
arat
ions
Y/N
(eg
diag
nosi
s, co
ding
of
dise
ases
ch
ecke
d)
Ava
ilabl
e fo
r oth
ers:
Y/
N, n
ame
web
site
or d
atab
ase
Fre
quen
cy
How
E
g ye
arly
, w
eb
Ben
efits
Pr
oble
ms
Def
icits
R
elev
ance
for
prio
rity
are
as
mal
form
atio
ns
pala
tine
mal
form
atio
n,
plur
iplo
idia
e
heal
th if
na
tiona
l
Rep
rodu
ctio
n Pe
rman
ent
surv
ey o
f fe
rtili
ty
Expo
sure
to
ioni
sing
radi
atio
ns,
, oth
ers
Sper
m q
ualit
y,
Con
cept
ion
dela
y
Y
S Y
N
ot y
et a
vaila
ble
In a
few
ye
ars
In c
onst
ruct
ion
Tra
ffic
ac
cide
nts
Reg
istry
of t
he
Rhö
ne
Traf
fic a
ccid
ent
vict
ims
Y
C,S
Y
In
RET
S, sp
ecifi
c de
man
ds, r
epor
ts w
ww
.inre
ts.fr
ye
arly
A
vaila
ble
sinc
e 19
95
Tra
ffic
ac
cide
nts
BA
AC
C
orpo
ral a
ccid
ents
, de
ath
from
traf
fic
acci
dent
s
Y
C, D
N
O
bser
vato
ire N
atio
nal I
nter
min
isté
riel d
e Sé
curit
é R
outiè
re
Rep
ort “
La D
ocum
enta
tion
fran
çais
e”
Yea
rly
//
Usu
al li
fe
acci
dent
s Su
rvei
llanc
e Sy
stem
of
acci
dent
s of
us
ual l
ife
Cor
pora
l Y
C
, D,S
Y
w
ww
.invs
.fr
perm
anen
t A
vaila
ble
sinc
e 19
86
Ast
hma
Surv
eilla
nce
syst
em
Self
repo
rted
prev
alen
ce
Ast
hma-
asso
ciat
ed
hosp
italia
stio
ns
Ast
hma-
asso
ciat
ed
mor
talit
y A
sthm
a-as
soci
ated
em
erge
ncy
Dep
artm
ent v
isits
O
ccup
atio
nal
asth
ma
Y (n
ot f
inis
hed)
C
, S
Y
Not
yet
ava
ilabl
e 5
year
s In
con
stru
ctio
n
Mor
talit
y C
epi-D
C
Spec
ific
mor
talit
y Y
C
, D
Y
http
://sc
8.ve
sine
t.ins
erm
.fr:1
080/
ye
arly
NB
1 F
ocus
on
EH in
dica
tors
eg
num
ber o
f cas
es a
ttrib
uted
to a
ir po
llutio
n, n
oise
exp
osur
e et
c; n
umbe
r of p
eopl
e ex
pose
d to
cer
tain
pol
lutio
n le
vels
or e
xced
ance
of l
imits
N
B 2
if th
e in
dica
tor i
s not
ava
ilabl
e, a
dd in
last
col
umn
(com
men
ts) w
heth
er th
ere
is in
tere
st in
such
an
indi
cato
r

page
110
SYN
OPS
IS
AD
EME
Age
nce
de l
’Env
ironn
emen
t et d
e la
Maî
trise
de
l’Ene
rgie
A
FSSE
A
genc
e Fr
ança
ise
de S
écur
ité S
anita
ire d
e l’E
nviro
nnem
ent
AFS
SA
Age
nce
Fran
çais
e de
Séc
urité
San
itaire
de
l’Alim
enta
tion
BA
AC
Bas
e A
nnue
lle d
es A
ccid
ents
Cor
pore
ls
BR
GM
B
urea
u de
s Rec
herc
hes G
éolo
giqu
es e
t Min
ière
s C
ITEP
A
Cen
tre I
nter
prof
essi
onne
l Tec
hniq
ue d
’Etu
des d
e la
Pol
lutio
n A
tmos
phér
ique
C
STB
Cen
tre S
cien
tifiq
ue e
t Tec
hniq
ue d
u B
âtim
ent
ECR
IN
no tr
aduc
tion
EPA
C
En
quêt
e P
erm
anen
te su
r les
Acc
iden
ts d
e la
Vie
Cou
rant
e IN
FOSO
L In
form
atio
n su
r les
élé
men
ts tr
aces
dan
s les
sols
en
Fran
ce
INR
A
In
stitu
t Nat
iona
l de
Rec
herc
he A
gron
omiq
ue
INR
ETS
Inst
itut N
atio
nal d
e R
eche
rche
sur l
e Tr
affic
et l
a Sé
curit
é IN
SER
M
Inst
itut N
atio
nal d
e la
San
té e
t de
la R
eche
rche
Méd
ical
e IN
VS
In
stitu
t Nat
iona
l de
Vei
lle S
anita
ire
IRSN
Inst
itut d
e R
adio
prot
ectio
n et
Sûr
eté
Nuc
léai
re
MED
D
Min
istè
re d
e l’E
nviro
nnem
ent e
t du
Dév
elop
pem
ent D
urab
le
OPE
RA
O
bser
vato
ire P
erm
anen
t de
la R
adio
activ
ité
OQ
AI
O
bser
vato
ire d
e la
Qua
lité
de l’
Air
Inté
rieur
PM
SI
Pr
ogra
mm
e M
édic
alis
é de
s Sys
tèm
es d
’Inf
orm
atio
n R
MQ
S
Rés
eau
de M
esur
es d
e la
Qua
lité
des
Sol
R
NSE
Rés
eau
Nat
iona
l de
Surv
eilla
nce
de l
’Env
ironn
emen
t SI
SE
Sy
stèm
e d’
Info
rmat
ion
en S
anté
Env
ironn
emen
t

page
111
Ger
man
y
Nam
e:
Jürg
en T
hele
n E-
mai
l: ju
erge
n.th
elen
@ub
a.de
Te
l:
+49
30 8
903
1280
A
ddre
ss:
Fede
ral E
nviro
nmen
tal A
genc
y, C
orre
nspl
atz
1, D
-141
95 B
erlin
C
ount
ry o
r pro
ject
: Ger
man
y T
hem
e In
dica
tor
nam
e
Typ
e O
pera
tion
al
defin
ition
Purp
ose
use
of
indi
cato
r
Geo
gra-
phic
al S
cale
G
ende
r
Age
V
alid
atio
n D
ata
qual
ity
Dat
a co
llect
ion;
m
etho
d an
d fr
eque
ncy
Dat
a co
ntro
l A
cces
-sib
ility
R
epor
ting
C
omm
ent
s
Air
qual
ity
Expo
sure
Ex
M
odifi
ed
from
WH
O
Met
hodo
loy
Mon
itorin
g, a
ir po
licy
eval
uatio
n,
expo
sure
as
sess
men
t
Nat
iona
l, se
lect
ed c
ities
N
Y
Tr
ansm
issi
on o
f ai
r qua
lity
mea
surin
g da
ta
Y
Onl
ine
Info
rmat
ion
of
stat
ion
data
Pu
blic
/ Que
ries
from
the
natio
nal
data
base
on
requ
est
Y
Web
and
R
epor
ts
(Nat
iona
l an
d Fe
dera
l st
ates
)
Met
hod
not
offic
ially
ap
prov
ed
yet
O
zone
-Ex
posu
reW
arni
ng
S Ex
pect
ed
Ozo
ne
conc
.
War
ning
sy
stem
R
egio
nal
N
forc
ast
fore
cast
ww
w.u
mw
eltb
und
esam
t.de
Ozo
ne-f
orec
ast:
http
://w
ww
.env
-it.
de/lu
ftdat
en/p
rog
nosi
s.fw
d?pr
ogD
ay=0
&pr
ogT
ype=
1TM
AX
Y W
eb
and
Rep
orts
(N
atio
nal,
Reg
iona
l an
d lo
cal),
W
arni
ngs
on ra
dio
and
TV if
lim
it va
lues
are
ex
pect
ed
to b
e ex
ceed
ed
Noi
se
Ann
oyan
ce
Effe
ct
(Ann
oyan
ce)
Perc
enta
ge
of
popu
latio
n th
at is
an
noye
d by
se
vera
l no
ise
sour
ces
(roa
d/ai
r/rai
Eval
uatio
n of
Ef
ficie
ncy
of n
oise
po
licy
Nat
iona
l/Reg
ion
al
(dep
endi
ng o
n th
e sa
mpl
e si
ze)
Cur
rent
ly
only
adu
lts
18-6
5; g
ende
r sp
ecifi
c an
alys
is
poss
ible
Val
idat
ion
of
the
ques
tionn
aire
by
Popu
latio
n Su
rvey
, CA
PI
5-st
ep sc
ale
on a
nnoy
ance
ro
ad, r
ail a
nd
air t
raff
ic,
Indu
stry
and
m
anuf
actu
re,n
Y q
ualit
y ch
eck
for
data
en
try
Y, r
epor
t: w
ww
.um
wel
tbe
wus
stse
in.d
e W
eb :
http
://w
ww
.env
-it.
de/u
mw
eltd
ate
n/js
p/di
spat
cher
?ev
ent=
WEL
CO
ME
Web
and
R
epor
ts

page
112
The
me
Indi
cato
r na
me
T
ype
Ope
ratio
nal
de
finiti
on
Purp
ose
use
of
indi
cato
r
Geo
gra-
phic
al S
cale
G
ende
r
Age
V
alid
atio
n D
ata
qual
ity
Dat
a co
llect
ion;
m
etho
d an
d fr
eque
ncy
Dat
a co
ntro
l A
cces
-sib
ility
R
epor
ting
C
omm
ent
s
l tra
ffic
, ei
ghbo
urho
od,
Was
te a
nd
cont
ami-
nate
d la
nds
Num
ber o
f co
ntam
inat
ed si
des
and
aban
done
d pl
ants
Stat
e N
umbe
r of
cont
amin
ated
side
s an
d ab
ando
ned
plan
ts
Rem
edia
tion
of
cont
amin
ated
site
s
Nat
iona
l/Fed
era
l Sta
tes
- -
- -
Yes
W
eb a
nd
repo
rts
Rad
iatio
n Po
pula
tion Ex
posu
re
to R
adon
in
ho
useh
old
s
Ex
Rad
on
conc
entra
tion
in
dwel
lings
Mon
itorin
g N
atio
nal
Sele
cted
re
gion
s
no
lim
ited
U
V-
Rad
iatio
n Ex
posu
re
War
ning
(U
V-I
ndex
)
Ex
Expe
cted
Le
vel o
f su
nbur
n ef
fect
ive
UV
Lev
el
at n
oon
(inte
rnat
ion
al
defin
ition
)
War
ning
of
Po
pula
tion
Nat
iona
l, R
egio
nal
No,
spec
ial
reco
mm
enda
tion
s for
ch
ildre
n ar
e gi
ven
Fore
cast
Fo
reca
st
UV
-M
easu
rem
ents
fr
om
stat
ions
http
://w
ww
.bfs
.de/
uv/u
v2/u
vi
Dai
ly
(spr
ing,
su
mm
er), W
ebsi
te
Publ
ic
avai
labl
e/In
for
mat
ion
on T
V
Drin
king
w
ater
Q
ualit
y of
dr
inki
ng
wat
er fr
om
cent
ral
supl
iers
Stat
e N
umbe
r of
anal
yses
th
at e
xcee
d th
e lim
it va
lue
(che
mic
al/
mic
robi
olo
gica
l pa
ram
eter
s)
Ass
essm
ent
of d
rinki
ng
wat
er
qual
ity
from
C
entra
l su
pplie
rs
(Trin
kwV
O), C
ompl
ianc
e ch
ecki
ng
Nat
iona
l no
R
esul
ts o
f A
naly
ses a
re
revi
ewed
by
mun
icip
al
heal
th o
ffic
es;
Res
ults
(2
kate
gorie
s)
are
repo
rted
to U
BA
Res
ults
of
anal
ysis
from
C
entra
l wat
er
supp
liers
Y
Web
site
UB
A
http
://w
ww
.env
-it.
de/u
mw
eltd
ate
n/js
p/di
spat
cher
?ev
ent=
WEL
CO
ME
Yes
; bi
annu
all
y; W
eb-
sire
s of
UB
A
and
fede
ral
stat
es
No
cent
ral
asse
ssm
ent
bas
ed
on th
e or
igin
al
mea
sure
s; ag
greg
ate
resu
lts
are
repo
rted
Q
ualit
y of
D
rinki
ng
Stat
e Fr
eque
ncy
of
Ass
essm
ent
of d
rinki
ng
Nat
iona
l; ol
d &
new
Län
der
Gen
der,
adul
t po
pula
tion,
Su
rvey
with
ex
tern
al Q
M
Surv
ey (G
erm
an
Envi
ronm
enta
l Y
lim
ited
Rep
ort
and

page
113
The
me
Indi
cato
r na
me
T
ype
Ope
ratio
nal
de
finiti
on
Purp
ose
use
of
indi
cato
r
Geo
gra-
phic
al S
cale
G
ende
r
Age
V
alid
atio
n D
ata
qual
ity
Dat
a co
llect
ion;
m
etho
d an
d fr
eque
ncy
Dat
a co
ntro
l A
cces
-sib
ility
R
epor
ting
C
omm
ent
s
Wat
er
hous
ehol
ds
exce
edan
ce
of li
mit
valu
es o
f ch
emic
al
para
met
ers
wat
er
qual
ity in
ho
useh
olds
preg
nant
w
omen
Su
rvey
) W
eb-s
ite
http
://w
ww
.env
-it.
de/u
mw
eltd
ate
n/js
p/di
spa
tche
r?ev
ent=
WEL
CO
ME
Bat
hing
W
ater
Q
ualit
y of
ba
thin
g w
ater
Stat
e Ex
ceed
ance
of
re
crea
tiona
l w
ater
lim
it va
lues
at
offic
ially
de
sign
ated
ba
thin
g si
tes
(mar
ine/
fre
shw
ater
)
Mon
itorin
g of
bat
hing
w
ater
qu
ality
, C
ompl
ianc
e ch
ecki
ng
Reg
iona
l (L
ände
r); T
he
Res
ults
of t
he
bath
ing
wat
er
repo
rt ar
e av
aila
ble
at
web
site
s ho
sted
by
mun
icip
aliti
es
or re
spon
sibl
e fe
dera
l sta
te
auth
oriti
es
No
Forth
nigh
tly
Ana
lysi
s of
para
met
ers
spec
ified
in
EC D
irect
ive
Ana
lysi
s and
as
sess
men
t of
bath
ing
wat
er
qual
ity b
y re
spon
sibl
e m
unic
ipal
or
stat
e au
thor
ity
Y
Rep
ort a
nd
Web
site
s Y
es,
year
ly,
Rep
ort
and
Web
site
s
Del
ay o
f Pu
blic
ati
on (o
ne
year
la
ter)
, M
onito
ring
of
Off
icia
l de
sign
ate
d si
tes
rest
ricts
us
e
Food
Saf
ety
Surv
eilla
nce
of
infe
ctio
us
dise
ases
S N
umbe
r of
case
s of
acut
e ga
stro
ente
ritis
in
outb
reak
s (>
2 ca
ses)
Surv
eilla
nce
of
infe
ctio
us
dise
ases
(I
fSG
)
Reg
iona
l, lo
cal;
Surv
eilla
nce
of in
fect
ious
di
seas
es b
y R
ober
Koc
h In
stitu
te
Gen
der a
nd
age
are
reco
rded
as
part
of th
e su
rvei
llanc
e pr
ogra
mm
e
Che
mic
al
emer
genc
ies
Inju
ries a
nd
Cas
ualti
es
in
haza
rdou
s in
cide
nts
with
re
porti
ng
oblig
atio
n in
pla
nts
E N
umbe
r of
casu
altie
s an
d In
jurie
s in
su
bgro
ups
(em
ploy
ees
, rel
ief
units
, Po
pula
tion)
Surv
eilla
nce
of
haza
rdou
s in
cide
nts (
Reg
iona
l, lo
cal,
cent
ral
regi
ster
of
haza
rdou
s in
cide
nts i
s an
nual
ly
repo
rting
No
Y
Que
stio
nnai
res
subm
itted
by
the
oper
atin
g co
mpa
ny
Y
Y
Yea
rly,
repo
rt an
d w
eb
Traf
fic
acci
dent
s M
orta
lity
and
Effe
ct
(cas
ualti
es
Num
ber o
f ca
sual
ties
Mon
itorin
g of
traf
fic
Nat
iona
l, R
egio
nal a
nd
Gen
der a
nd
age
? R
egis
tratio
n of
ac
cide
nts b
y th
e ?
Y
Y;
mon
thly
H
arm
oni
satio
n of

page
114
The
me
Indi
cato
r na
me
T
ype
Ope
ratio
nal
de
finiti
on
Purp
ose
use
of
indi
cato
r
Geo
gra-
phic
al S
cale
G
ende
r
Age
V
alid
atio
n D
ata
qual
ity
Dat
a co
llect
ion;
m
etho
d an
d fr
eque
ncy
Dat
a co
ntro
l A
cces
-sib
ility
R
epor
ting
C
omm
ent
s
mor
bidi
ty
due
to ro
ad
traff
ic
acci
dent
s
and
inju
ries)
an
d in
jurie
s du
e to
road
tra
ffic
ac
cide
nts
(als
o ra
il/ai
r/nav
iga
tion)
acci
dent
s an
d ro
ad
safe
ty
loca
l po
lice,
as
sess
men
t of
seve
rity
of
inju
ry b
y po
lice
offic
er, c
urre
ntly
no
cro
ss c
heck
w
ith M
orta
lity-
Reg
iste
r
to y
early
, re
port
and
web
inju
ry
regi
stra
tion
on
a eu
rope
an
scal
e
Hou
sing
Li
ving
are
a pe
r per
son
- A
vera
ge
livin
g ar
ea
per p
erso
n
Mon
itorin
g of
de
velo
pme
nt o
f soc
ial
cond
ition
s
Nat
iona
l (o
ld/n
ew
Länd
er)
No
Cal
cula
ted
from
po
pula
tion
stat
istic
s and
re
side
ntia
l bu
ildin
g st
atis
tics
Surv
ey
(Mik
roze
nsus
)
Add
ition
al
Hou
sing
In
dica
tors
Syst
em o
f So
cial
In
dica
tors
No
desc
riptiv
e fr
amew
ork
of in
dica
tor
inte
rlink
age
A
sses
sme
nt o
f Li
ving
co
nditi
ons
, perc
eive
d Q
ualit
y of
lif
e;
Cha
nges
of
the
Soci
al
stru
ctur
e
Nat
iona
l, pe
rtly
regi
onal
Gen
der,
adul
t po
pula
tion
V
ario
us S
urve
ys;
Soci
o-Ec
onom
ic
Pane
l (SO
EP;
carr
ied
out
annu
ally
), M
ikro
cens
us
(1%
Ran
dom
Po
pula
tion
Sam
ple,
car
ried
out a
nnua
lly),
ALL
BU
S (c
arrie
d ou
t bi
annu
ally
)
Y
Oth
er:
Hum
an
Bio
mon
itorin
g
POP
in
Hum
an
milk
Expo
sure
(in
tern
al)
Con
cent
rati
on o
f PC
DD
and
PC
DF
in
brea
st m
ilk
Mon
itorin
g of
tren
d of
ha
zard
ous
subs
tanc
es
in b
reas
t m
ilk,
asse
ssm
ent
of d
ieta
ry
upta
ke
thro
ugh
brea
st
Nat
iona
l, R
egio
nal
“Län
der”
Bre
ast
feed
ing
mot
hers
; no
age
grou
ps
Y
Sam
ple
of 2
400
brea
st fe
edin
g w
omen
, not
re
pres
enta
tive
Y
limite
d R
epor
t of
Fe
dera
l En
viro
nm
enta
l A
genc
y an
d Fe
dera
l In
stitu
te
for R
isk
Ass
essm
Ass
ocia
tion
to
spec
ific
heal
th
effe
cts
deba
tabl
e

page
115
The
me
Indi
cato
r na
me
T
ype
Ope
ratio
nal
de
finiti
on
Purp
ose
use
of
indi
cato
r
Geo
gra-
phic
al S
cale
G
ende
r
Age
V
alid
atio
n D
ata
qual
ity
Dat
a co
llect
ion;
m
etho
d an
d fr
eque
ncy
Dat
a co
ntro
l A
cces
-sib
ility
R
epor
ting
C
omm
ent
s
feed
ing
ent
PO
P in
B
lood
Ex
posu
re
(inte
rnal
) C
once
ntra
tion
of
chlo
rinat
ed
orga
nic
com
poun
ds
in h
uman
bl
ood
Mon
itorin
g of
tren
d of
ch
lorin
ated
or
gani
c co
mpo
unds
in
hum
an
bloo
d
Nat
iona
l, ne
w/o
ld
Länd
er
Adu
lt po
pula
tion
(18-
69),
age
Y
Rep
rese
ntat
ive
Popu
latio
n sa
mpl
e G
erm
an
Envi
ronm
enta
l Su
rvey
199
8
(add
ition
al :
Envi
ronm
enta
l Sp
ecim
en B
ank,
U
nive
rsity
st
uden
ts
Y
limite
d R
epor
ts
and
web
si
te
Ass
ocia
tion
to
spec
ific
heal
th
effe
cts
deba
tabl
e
Le
ad in
B
lood
Ex
posu
re
(inte
rnal
) C
once
ntra
tion
of L
ead
in h
uman
B
lood
Mon
itorin
g of
HM
in
Blo
od
(tren
d)
Nat
iona
l (n
ew/o
ld
Länd
er)
Gen
der,
Adu
lt po
pula
tion;
Y
R
epre
sent
ativ
e Po
pula
tion
sam
ple
Ger
man
En
viro
nmen
tal
Surv
ey 1
998,
ad
ditio
nal:
Envi
ronm
enta
l Sp
ecim
en B
ank,
U
nive
rsity
st
uden
ts
Y
limite
d R
epor
t of
UB
A;
web
site
se
e ab
ove
Indo
or a
ir Ex
posu
re
to S
HS
Expo
sure
Pe
rcen
tage
of
ho
useh
olds
w
ith
child
ren
whe
re o
ne
pers
on
smok
es
insi
de th
e dw
ellin
g
Ass
esm
ent
of c
hild
rens
ex
posu
re to
SH
S at
ho
me
Nat
iona
l Fo
r chi
ldre
n un
der u
nder
18
livi
ng a
t ho
me
Y
Surv
ey, C
API
or
Tele
phon
e Su
rvey
; Ger
man
En
viro
nmen
tal
Surv
ey;
Chi
ldre
n an
d A
dole
scen
t H
ealth
Sur
vey
Y
Y (R
epor
t) Y
Web
an
repo
rt
1)
eg
air o
r wat
er p
ollu
tion
surv
eilla
nce,
com
mun
ity n
oise
surv
eys,
traff
ic a
ccid
ent r
egis
tratio
n, m
orta
lity
stat
istic
s, m
edic
al re
gist
ries s
uch
as h
ospi
tal d
isch
arge
regi
strie
s etc
2)
if th
ere
is n
o in
dica
tor a
vaila
ble
for t
he is
sue
men
tione
d, a
dd in
last
col
umn
(com
men
ts) w
heth
er th
ere
is in
tere
st in
such
an
indi
cato
r R
epre
sent
ativ
e Po
pula
tion
sam
ple
Ger
man
Env
ironm
enta
l Sur
vey
1998
,

page
116
Ital
y N
ame:
Dot
t.ssa
Luc
iana
Sin
isi
E-m
ail:
sini
si@
apat
.it
Tel:
+390
6 50
07 2
566
Add
ress
: V. B
ranc
ati 4
8, 0
0144
Rom
a, It
aly
T
ype
DPS
EE
A
(DPS
IR)
Geo
grap
hica
l sca
le
The
me
Indi
cato
r n
ame
Ref
erri
ng in
stitu
tions
L
evel
of
info
rmat
ion
BG
Lev
el o
f ag
greg
atio
n
Age
cat
egor
y V
alid
atio
n da
ta q
ualit
y
Qua
lity
&
type
dat
a co
llect
ion
Dat
a co
ntro
l A
cces
sibi
lity
Rep
ortin
g co
mm
ents
D=D
rivin
g Fo
rce
P=Pr
essu
re
S=St
ate
Ex=E
xpos
ure
E=Ef
fect
A
=Act
ion
D
=Driv
ing
Forc
e P=
Pres
sure
S=
Stat
e I=
Impa
ct
R=R
espo
nse
Dis
tinct
ion
diff
eren
t age
ca
tego
ries
poss
ible
: Y
/N
Y/N
(eg
inte
rnat
iona
l st
anda
rds s
uch
as IC
D u
sed
or
not
R=m
edic
al
regi
stry
, S=
surv
ey,
Mo=
mod
ellin
g,
O=o
utdo
or
mea
sure
men
ts
Mss
: mul
ti sc
ope
stat
istic
s
Y/N
(eg
diag
nosi
s, co
ding
of
dise
ase
chec
ked
Ava
ilabl
e fo
r ot
hers
: Y/N
, re
port
or
data
base
Freq
uenc
y ho
w e
g ye
arly
, web
Ben
efits
pro
blem
s de
ficits
rele
vanc
e fo
r prio
rity
area
s
Air
pollu
tion
Air
conc
entra
tions
of
nitro
gen
oxyd
e Ex
(S)
EPA
R
N
Y
O
N
Y, E
DY
A
Yea
rly,
web
A
ir co
ncen
tratio
ns o
f sul
phur
di
oxyd
e Ex
(S)
EPA
R
N
Y
O
N
Y, E
DY
A
Yea
rly,
web
A
ir co
ncen
tratio
ns o
f oz
one
to le
vel o
f the
gro
und
Ex (S
) EP
A
R
N
Y
O
N
Y
, ED
YA
Y
early
, w
eb
A
ir co
ncen
tratio
ns o
f be
nzen
e Ex
(S)
EPA
R
N
Y
O
N
Y, E
DY
A
Yea
rly,
web
A
ir co
ncen
tratio
ns o
f ca
rbon
m
onox
ide
Ex (S
) EP
A
R
N
Y
O
N
Y
, ED
YA
Y
early
, w
eb
A
ir co
ncen
tratio
ns o
f PM
10
Ex
(S)
EPA
R
N
Y
O
N
Y, E
DY
A
Yea
rly,w
eb

page
117
Typ
e D
PSE
EA
(D
PSIR
) G
eogr
aphi
cal s
cale
The
me
Indi
cato
r n
ame
Ref
erri
ng in
stitu
tions
L
evel
of
info
rmat
ion
BG
Lev
el o
f ag
greg
atio
n
Age
cat
egor
y V
alid
atio
n da
ta q
ualit
y
Qua
lity
&
type
dat
a co
llect
ion
Dat
a co
ntro
l A
cces
sibi
lity
Rep
ortin
g co
mm
ents
D=D
rivin
g Fo
rce
P=Pr
essu
re
S=St
ate
Ex=E
xpos
ure
E=Ef
fect
A
=Act
ion
D
=Driv
ing
Forc
e P=
Pres
sure
S=
Stat
e I=
Impa
ct
R=R
espo
nse
Dis
tinct
ion
diff
eren
t age
ca
tego
ries
poss
ible
: Y
/N
Y/N
(eg
inte
rnat
iona
l st
anda
rds s
uch
as IC
D u
sed
or
not
R=m
edic
al
regi
stry
, S=
surv
ey,
Mo=
mod
ellin
g,
O=o
utdo
or
mea
sure
men
ts
Mss
: mul
ti sc
ope
stat
istic
s
Y/N
(eg
diag
nosi
s, co
ding
of
dise
ase
chec
ked
Ava
ilabl
e fo
r ot
hers
: Y/N
, re
port
or
data
base
Freq
uenc
y ho
w e
g ye
arly
, web
Ben
efits
pro
blem
s de
ficits
rele
vanc
e fo
r prio
rity
area
s
In
fant
mor
tality
due
to
resp
irato
ry d
iseas
es
E M
in H
ealth
L
N,R
Y
Y
R
Y
Y
, Rep
MH
/ I
Yea
rly, w
eb
M
ortal
ity d
ue to
resp
irato
ry
dise
ases
E
Min
Hea
lth
L N
,R
Y
Y
R
Y
Y, R
ep M
in./
I Y
early
, web
Ca
ncer
Res
pira
tory
A
ppar
atus
E M
in H
ealth
L
R,N
Y
Y
R
Y
Y
, Rep
MH
/ I/
ISS
Yea
rly, w
eb
Loca
l Can
cer
regi
stries
, NO
T at
all
natio
nal l
evel
Po
licies
to re
duce
en
viro
nmen
tal to
bacc
o sm
oke e
xpos
ure
A
Min
Hea
lth
N
N
N
Y
Mo
N
Y, M
H
Po
pulat
ion
anno
yanc
e by
air
pollu
tion
E IS
TAT
N
N
N
Y
O M
ss*
N
Y, R
ep.I
Yea
rly, w
eb
Ra
te of
resp
irato
ry d
iseas
e (c
hron
ic br
onch
itis,
bron
chial
as
thm
a)
E M
in H
ealth
R
N
Y
Y
R
Y
Y
, Rep
MH
./ I
Yea
rly, w
eb
M
ortal
ity d
ue to
isch
emic
hear
th d
iseas
es
E M
in H
ealth
, ISS
, L
R,N
Y
Y
R
Y
Y
, Rep
.I Y
early
, web
Popu
latio
n an
noya
nce b
y ce
rtain
sour
ces o
f noi
se
E IS
TAT
, Env
Age
ncie
s
N
N
O
Mss
* N
Y
, Rep
.I ED
YA
Slee
p di
sturb
ance
by
noise
E
IS
TAT
L N
,R
N
O
Mss
* N
Y
, Rep
.I
Noi
se
Insp
ected
sour
ces a
nd th
eir
perc
entag
e of t
hese
with
at
least
one l
imit
exce
eded
Ex
En
v A
genc
ies
R
N
Y
O
N
Y
, ED
YA
Y
early
, web
O
utdo
or/in
door
hom
e en
viro
nmen
t

page
118
Typ
e D
PSE
EA
(D
PSIR
) G
eogr
aphi
cal s
cale
The
me
Indi
cato
r n
ame
Ref
erri
ng in
stitu
tions
L
evel
of
info
rmat
ion
BG
Lev
el o
f ag
greg
atio
n
Age
cat
egor
y V
alid
atio
n da
ta q
ualit
y
Qua
lity
&
type
dat
a co
llect
ion
Dat
a co
ntro
l A
cces
sibi
lity
Rep
ortin
g co
mm
ents
D=D
rivin
g Fo
rce
P=Pr
essu
re
S=St
ate
Ex=E
xpos
ure
E=Ef
fect
A
=Act
ion
D
=Driv
ing
Forc
e P=
Pres
sure
S=
Stat
e I=
Impa
ct
R=R
espo
nse
Dis
tinct
ion
diff
eren
t age
ca
tego
ries
poss
ible
: Y
/N
Y/N
(eg
inte
rnat
iona
l st
anda
rds s
uch
as IC
D u
sed
or
not
R=m
edic
al
regi
stry
, S=
surv
ey,
Mo=
mod
ellin
g,
O=o
utdo
or
mea
sure
men
ts
Mss
: mul
ti sc
ope
stat
istic
s
Y/N
(eg
diag
nosi
s, co
ding
of
dise
ase
chec
ked
Ava
ilabl
e fo
r ot
hers
: Y/N
, re
port
or
data
base
Freq
uenc
y ho
w e
g ye
arly
, web
Ben
efits
pro
blem
s de
ficits
rele
vanc
e fo
r prio
rity
area
s
State
of i
mpl
emen
tatio
n of
m
unici
pal n
oise
clas
sifica
tion
plan
s S
Env
Age
ncie
s L
N
Y
O
Y
Y
Y
early
, web
Airp
ort t
raffi
c Ex
M
in T
rans
. L
N
N
S
N
Y, E
DY
A
Yea
rly, w
eb
Ra
ilway
traf
fic
Ex
Min
Tra
ns.
R
N
N
S
N
Y, E
DY
A
Yea
rly, w
eb
Hig
hway
traf
fic
Ex
Min
Tra
ns.
N
N
N
S
N
Y, E
DY
A
Yea
rly, w
eb
G
ener
ation
of m
unici
pal
was
te Ex
(P)
EPA
L
N
Y
O
Y
Am
ount
of m
unici
pal w
aste
incin
erate
d Ex
(P,R
) EP
A
L N
, R
N
N
S N
Y
, ED
YA
Y
early
, web
Indu
strial
was
te re
cove
ry
Ex (P
,R)
EPA
L
R,N
N
N
S
N
Y, E
DY
A
Yea
rly, w
eb
Am
ount
of s
pecia
l w
aste
reco
vere
d
Ex
EPA
L
R,N
N
N
S
N
Y, E
DY
A
Yea
rly, w
eb
Inco
mpl
ete re
liabi
lity
for l
ack
of a
com
paris
on w
ith
auth
oriza
tions
A
mou
nt o
f mun
icipa
l was
te w
ith d
ispos
al in
land
fills
Ex (P
,R)
Env
Age
ncie
s L
N
Y
O
Y
Y
, ED
YA
Y
early
web
Num
ber o
f lan
dfill
s Ex
(P)
Haz
ardo
us w
aste
gene
ratio
n Ex
EP
A M
in. E
nv.
R
N
N
N
S N
Y
, ED
YA
Y
early
, web
Haz
ardo
us w
aste
polic
ies
A
EPA
Min
. Env
. L,
R
N
N
Y
Mo
N
Was
te
Popu
latio
n an
noya
nce b
y
stree
t soi
l E
ISTA
T
N
N
N
O m
ss
N
Y,
Rep.
ISTA
T Y
early
, web
Con
tam
inat
ed
land
s To
tal n
umbe
r of
cont
amin
ated
land
sites
Ex
En
v A
genc
ies
R
N
N
N
O m
ss,S
N
Y
, ED
YA
Re
p. I
Yea
rly, w
eb

page
119
Typ
e D
PSE
EA
(D
PSIR
) G
eogr
aphi
cal s
cale
The
me
Indi
cato
r n
ame
Ref
erri
ng in
stitu
tions
L
evel
of
info
rmat
ion
BG
Lev
el o
f ag
greg
atio
n
Age
cat
egor
y V
alid
atio
n da
ta q
ualit
y
Qua
lity
&
type
dat
a co
llect
ion
Dat
a co
ntro
l A
cces
sibi
lity
Rep
ortin
g co
mm
ents
D=D
rivin
g Fo
rce
P=Pr
essu
re
S=St
ate
Ex=E
xpos
ure
E=Ef
fect
A
=Act
ion
D
=Driv
ing
Forc
e P=
Pres
sure
S=
Stat
e I=
Impa
ct
R=R
espo
nse
Dis
tinct
ion
diff
eren
t age
ca
tego
ries
poss
ible
: Y
/N
Y/N
(eg
inte
rnat
iona
l st
anda
rds s
uch
as IC
D u
sed
or
not
R=m
edic
al
regi
stry
, S=
surv
ey,
Mo=
mod
ellin
g,
O=o
utdo
or
mea
sure
men
ts
Mss
: mul
ti sc
ope
stat
istic
s
Y/N
(eg
diag
nosi
s, co
ding
of
dise
ase
chec
ked
Ava
ilabl
e fo
r ot
hers
: Y/N
, re
port
or
data
base
Freq
uenc
y ho
w e
g ye
arly
, web
Ben
efits
pro
blem
s de
ficits
rele
vanc
e fo
r prio
rity
area
s
Co
ntam
inate
d lan
d sit
es o
f na
tiona
l int
eres
t Ex
EP
A M
in. E
nv.
L N
, R
N
N
O, S
N
Y
, ED
YA
Yea
rly, w
eb
A
reas
use
d fo
r int
ensiv
e ag
ricul
ture
Ex
EP
A M
in. E
nv.
R
N
N
N
O, S
N
Y
, ED
YA
Y
early
, web
A
mou
nt o
f he
avy
meta
ls in
ag
ricul
tura
l gro
unds
Ex
EP
A
L N
, R
N
Y
O
Y
Y, E
DY
A
Yea
rly, w
eb
Def
icien
cy in
the n
et of
mon
itorin
g of
gr
ound
s
Clea
ned-
up si
tes
A
EPA
R
N
N
N
O
, S
N
Y, E
DY
A
Yea
rly, w
eb
D
rinki
ng
wat
er
Popu
latio
n an
noya
nce b
y
irreg
ular
dist
ribut
ion
of th
e w
ater
E IS
TAT
R
N
N
N
O m
ss
N
Y, R
ep. I
Y
early
, web
Pe
rcen
tage o
f fam
ilies
that
does
not
drin
k (u
ntru
st) ta
p w
ater
E IS
TAT
R
N
N
N
O m
ss
N
Y, R
ep. I
Y
early
, web
*inf
orm
ation
on
use
of b
ottle
d dr
inki
ng
wate
r whi
ch ar
e not
re
gulat
ed b
y m
ain
drin
king
wate
r law
Acc
ess t
o ad
equa
te sa
nitat
ion
Ex
Min
Hea
lth
R
N
N
Y
R
N
Y, R
ep I
Yea
rly, w
eb
Rate
of re
nal c
alcul
osis
E IS
TAT
R
N
N
Y
R
Y
Y, R
ep.I
Yea
rly, w
eb
Rate
of in
fecti
ous d
iarrh
oea
E IS
TAT
R
N
Y
Y
R
Y
Y, R
ep.I
Yea
rly, w
eb
W
ater a
bstra
ction
for
dr
inka
ble u
se (s
uper
ficial
and
grou
nd w
aters)
S
EPA
R
N
N
Y
O
Y, E
DY
A
*
Sea-
bath
ing
wat
er
Bacte
riolo
gica
l Qua
lity
Inde
x (B
QI)
Ex (S
) EP
A
L R,
N
N
Y
O
Y
Y, E
DY
A
Yea
rly, w
eb

page
120
Typ
e D
PSE
EA
(D
PSIR
) G
eogr
aphi
cal s
cale
The
me
Indi
cato
r n
ame
Ref
erri
ng in
stitu
tions
L
evel
of
info
rmat
ion
BG
Lev
el o
f ag
greg
atio
n
Age
cat
egor
y V
alid
atio
n da
ta q
ualit
y
Qua
lity
&
type
dat
a co
llect
ion
Dat
a co
ntro
l A
cces
sibi
lity
Rep
ortin
g co
mm
ents
D=D
rivin
g Fo
rce
P=Pr
essu
re
S=St
ate
Ex=E
xpos
ure
E=Ef
fect
A
=Act
ion
D
=Driv
ing
Forc
e P=
Pres
sure
S=
Stat
e I=
Impa
ct
R=R
espo
nse
Dis
tinct
ion
diff
eren
t age
ca
tego
ries
poss
ible
: Y
/N
Y/N
(eg
inte
rnat
iona
l st
anda
rds s
uch
as IC
D u
sed
or
not
R=m
edic
al
regi
stry
, S=
surv
ey,
Mo=
mod
ellin
g,
O=o
utdo
or
mea
sure
men
ts
Mss
: mul
ti sc
ope
stat
istic
s
Y/N
(eg
diag
nosi
s, co
ding
of
dise
ase
chec
ked
Ava
ilabl
e fo
r ot
hers
: Y/N
, re
port
or
data
base
Freq
uenc
y ho
w e
g ye
arly
, web
Ben
efits
pro
blem
s de
ficits
rele
vanc
e fo
r prio
rity
area
s
Ba
thin
g w
ater q
ualit
y Ex
M
in H
ealth
EPA
L
R,N
N
Y
O
Y
Y
, Rep
. MH
, ED
YA
Y
early
, web
Nuc
lear p
lants:
activ
ity o
f ra
dioi
soto
pes d
ischa
rged
in
the a
ir an
d w
ater
Ex (P
) EP
A
L N
N
Y
S
Y
, ED
YA
Y
early
, web
Wor
k ac
tiviti
es w
ith N
atura
l O
ccur
ring
Radi
oacti
ve
Mate
rials
(NO
RM)
Ex (D
) EP
A
N
N
N
Y
S
Y, E
DY
A
Conc
entra
tion
of ra
don
indo
or
Ex (S
) EP
A
R
N
N
Y
O
Y
, ED
YA
Y
early
, web
Radi
oacti
vity
conc
entra
tions
of
artif
icial
radi
onuc
lides
in
the
envi
ronm
ental
and
food
m
atrice
s
Ex (S
) EP
A
N
N
Y
S
Y
, ED
YA
Ave
rage
indi
vidu
al ef
fecti
ve
dose
in o
ne y
ear
Ex (I
) EP
A
N
N
Y
S
Y
, ED
YA
Rad
iatio
n
Incid
ence
of s
kin
canc
er
E IS
TAT/
ISS
N
N
Y
Y
R
Y
Y, R
ep I
Ca
ncer
regi
stries
N
OT
at all
nati
onal
level
Broa
dcas
ting
and
telec
omm
unica
tion
sites
fo
und
to ex
ceed
lim
its an
d re
med
iatio
n sta
te (m
onito
red
sites
)
Ex (P
) EP
A
N
N
Y
O
Y, E
DY
A
Yea
rly, w
eb
Agr
icul
ture
D
istrib
utio
n of
ferti
lizer
s fo
r ag
ricul
tura
l use
Ex
(P)
EPA
/ IST
AT
R
N
Y
S
Y
, ED
YA
Y
early
, web

page
121
Typ
e D
PSE
EA
(D
PSIR
) G
eogr
aphi
cal s
cale
The
me
Indi
cato
r n
ame
Ref
erri
ng in
stitu
tions
L
evel
of
info
rmat
ion
BG
Lev
el o
f ag
greg
atio
n
Age
cat
egor
y V
alid
atio
n da
ta q
ualit
y
Qua
lity
&
type
dat
a co
llect
ion
Dat
a co
ntro
l A
cces
sibi
lity
Rep
ortin
g co
mm
ents
D=D
rivin
g Fo
rce
P=Pr
essu
re
S=St
ate
Ex=E
xpos
ure
E=Ef
fect
A
=Act
ion
D
=Driv
ing
Forc
e P=
Pres
sure
S=
Stat
e I=
Impa
ct
R=R
espo
nse
Dis
tinct
ion
diff
eren
t age
ca
tego
ries
poss
ible
: Y
/N
Y/N
(eg
inte
rnat
iona
l st
anda
rds s
uch
as IC
D u
sed
or
not
R=m
edic
al
regi
stry
, S=
surv
ey,
Mo=
mod
ellin
g,
O=o
utdo
or
mea
sure
men
ts
Mss
: mul
ti sc
ope
stat
istic
s
Y/N
(eg
diag
nosi
s, co
ding
of
dise
ase
chec
ked
Ava
ilabl
e fo
r ot
hers
: Y/N
, re
port
or
data
base
Freq
uenc
y ho
w e
g ye
arly
, web
Ben
efits
pro
blem
s de
ficits
rele
vanc
e fo
r prio
rity
area
s
D
istrib
utio
n of
pes
ticid
es fo
r ag
ricul
tura
l use
. Ex
(P)
ISTA
T R
N
Y
S
Y, E
DY
A
Yea
rly, w
eb
Indu
strial
sites
Sev
eso
dire
ctory
. Ex
(P)
Env.
Min
R
N
Y
S
Y, E
DY
A
Num
ber o
f mun
icipa
lities
w
ith 4
or m
ore i
ndus
trial
sites
Se
vero
dire
ctory
. Ex
(P)
Env.
Min
L
R, N
Y
S
Y, R
ep. E
nv.
Min
, ED
YA
Typo
logy
of i
ndus
trial
sites
Se
veso
dire
ctory
. Ex
(P)
Env.
Min
L
R, N
Y
S
Y, R
ep. E
nv.
Min
, ED
YA
Che
mic
al
safe
ty
Am
ount
of h
azar
d su
bstan
ces
in th
e ind
ustri
al sit
es S
eves
o di
recto
ry.
Ex (P
) En
v. M
in
N
N
Y
S
Y
, Rep
. Env
. M
in, E
DY
A
Popu
latio
n liv
ing
in
subs
tand
ard
hous
ing
Ex
ISTA
T L
R, N
Y
S m
ss
Y
, Rep
I Y
early
, web
Mor
talit
y du
e to
ext
erna
l ca
uses
in c
hild
ren
unde
r 5
year
s of a
ge
E IS
S
R
N
Y
Y
R
Y
Y, R
ep IS
S Y
early
, web
Scop
e an
d ap
plic
atio
n of
bu
ildin
g re
gula
tions
for
hous
ing
A
Inst
itutio
ns in
volv
ed
Mo
Y
Hou
sing
Land
use
and
urb
an
plan
ning
regu
latio
ns
A
Inst
itutio
ns in
volv
ed
Mo,
O
Y
Traf
fic
acci
dent
s M
orta
lity
from
roa
d ac
cide
nts
E IS
TAT,
Reg
iona
l ag
enci
es P
ublic
hea
lth
Min
.Tra
ns.,M
in.In
terio
rN
N
Y
Y
S
Y
, Rep
. I
Age
ncy
of p
ublic
he
alth
they
are
not
on
all
natio
nal
terr
itory

page
122
Typ
e D
PSE
EA
(D
PSIR
) G
eogr
aphi
cal s
cale
The
me
Indi
cato
r n
ame
Ref
erri
ng in
stitu
tions
L
evel
of
info
rmat
ion
BG
Lev
el o
f ag
greg
atio
n
Age
cat
egor
y V
alid
atio
n da
ta q
ualit
y
Qua
lity
&
type
dat
a co
llect
ion
Dat
a co
ntro
l A
cces
sibi
lity
Rep
ortin
g co
mm
ents
D=D
rivin
g Fo
rce
P=Pr
essu
re
S=St
ate
Ex=E
xpos
ure
E=Ef
fect
A
=Act
ion
D
=Driv
ing
Forc
e P=
Pres
sure
S=
Stat
e I=
Impa
ct
R=R
espo
nse
Dis
tinct
ion
diff
eren
t age
ca
tego
ries
poss
ible
: Y
/N
Y/N
(eg
inte
rnat
iona
l st
anda
rds s
uch
as IC
D u
sed
or
not
R=m
edic
al
regi
stry
, S=
surv
ey,
Mo=
mod
ellin
g,
O=o
utdo
or
mea
sure
men
ts
Mss
: mul
ti sc
ope
stat
istic
s
Y/N
(eg
diag
nosi
s, co
ding
of
dise
ase
chec
ked
Ava
ilabl
e fo
r ot
hers
: Y/N
, re
port
or
data
base
Freq
uenc
y ho
w e
g ye
arly
, web
Ben
efits
pro
blem
s de
ficits
rele
vanc
e fo
r prio
rity
area
s
R
ate
of in
jure
s by
road
ac
cide
nts
E IS
TAT
L R
,N
Y
Y
S
Y, R
ep I
Mon
itorin
g ch
emic
al
haza
rds i
n fo
od: p
oten
tial
expo
sure
Ex
M
in H
ealth
, ISS
N
N
N
Y
O
,S
Y
, Rep
.MH
Out
brea
ks o
f foo
d-bo
rne
illne
ss
E M
in H
ealth
L
R,N
Y
R,S
Y
Y
, Rep
.MH
Y
early
,web
Inci
denc
e of
food
-bor
ne
illne
ss
E M
in H
ealth
L
R,N
Y
R,S
Y
Y
, Rep
.MH
Y
early
,web
Food
safe
ty
Gen
eral
food
safe
ty p
olic
y A
M
in H
ealth
, ISS
N
N
N
Y
S

page
123
Typ
e D
PSE
EA
(D
PSIR
) G
eogr
aphi
cal s
cale
The
me
Indi
cato
r n
ame
Ref
erri
ng in
stitu
tions
L
evel
of
info
rmat
ion
BG
Lev
el o
f ag
greg
atio
n
Age
cat
egor
y V
alid
atio
n da
ta q
ualit
y
Qua
lity
&
type
dat
a co
llect
ion
Dat
a co
ntro
l A
cces
sibi
lity
Rep
ortin
g co
mm
ents
D=D
rivin
g Fo
rce
P=Pr
essu
re
S=St
ate
Ex=E
xpos
ure
E=Ef
fect
A
=Act
ion
D
=Driv
ing
Forc
e P=
Pres
sure
S=
Stat
e I=
Impa
ct
R=R
espo
nse
Dis
tinct
ion
diff
eren
t age
ca
tego
ries
poss
ible
: Y
/N
Y/N
(eg
inte
rnat
iona
l st
anda
rds s
uch
as IC
D u
sed
or
not
R=m
edic
al
regi
stry
, S=
surv
ey,
Mo=
mod
ellin
g,
O=o
utdo
or
mea
sure
men
ts
Mss
: mul
ti sc
ope
stat
istic
s
Y/N
(eg
diag
nosi
s, co
ding
of
dise
ase
chec
ked
Ava
ilabl
e fo
r ot
hers
: Y/N
, re
port
or
data
base
Freq
uenc
y ho
w e
g ye
arly
, web
Ben
efits
pro
blem
s de
ficits
rele
vanc
e fo
r prio
rity
area
s
MO
RTA
LITY
D
UE
TO
SEV
ERA
L C
AU
SES
- IN
FEC
TOU
S D
ISEA
SES
- - E
ndoc
rine
diso
rder
s -
- neo
plas
tic
dise
ases
-
psyc
hiat
ric
diso
rder
s -
nerv
ous s
yste
m
diso
rder
s -
isch
emic
hea
rth
dise
ases
-
cere
brov
ascu
lar
diso
rder
s -
obst
ruct
ive
pulm
onar
y di
sord
ers
- ep
athi
c di
sord
ers
-
E IS
TAT
L R
,N
Y
Y
R
Y
Y, R
ep I
Not
ye
arly
,web
The
syst
em u
tiliz
e W
HO
Hea
lh fo
r All
Dat
a ba
se
LIFE
STY
LE
Sm
okin
g, d
iet a
nd a
lcho
ol
drin
king
Ex
IS
TAT
R
N
Y
Y
S Y
Y
, Rep
I ib
idem
ib
idem

page
124
Typ
e D
PSE
EA
(D
PSIR
) G
eogr
aphi
cal s
cale
The
me
Indi
cato
r n
ame
Ref
erri
ng in
stitu
tions
L
evel
of
info
rmat
ion
BG
Lev
el o
f ag
greg
atio
n
Age
cat
egor
y V
alid
atio
n da
ta q
ualit
y
Qua
lity
&
type
dat
a co
llect
ion
Dat
a co
ntro
l A
cces
sibi
lity
Rep
ortin
g co
mm
ents
D=D
rivin
g Fo
rce
P=Pr
essu
re
S=St
ate
Ex=E
xpos
ure
E=Ef
fect
A
=Act
ion
D
=Driv
ing
Forc
e P=
Pres
sure
S=
Stat
e I=
Impa
ct
R=R
espo
nse
Dis
tinct
ion
diff
eren
t age
ca
tego
ries
poss
ible
: Y
/N
Y/N
(eg
inte
rnat
iona
l st
anda
rds s
uch
as IC
D u
sed
or
not
R=m
edic
al
regi
stry
, S=
surv
ey,
Mo=
mod
ellin
g,
O=o
utdo
or
mea
sure
men
ts
Mss
: mul
ti sc
ope
stat
istic
s
Y/N
(eg
diag
nosi
s, co
ding
of
dise
ase
chec
ked
Ava
ilabl
e fo
r ot
hers
: Y/N
, re
port
or
data
base
Freq
uenc
y ho
w e
g ye
arly
, web
Ben
efits
pro
blem
s de
ficits
rele
vanc
e fo
r prio
rity
area
s
CH
RO
NIC
A
ND
IN
FEC
TIO
US
DIS
EASE
S
E
ISTA
T
N
Y m
ainl
y fo
r in
fect
ious
di
sord
ers
Y
S Y
Y
, Rep
I ib
idem
ib
idem
EPA
: Nat
iona
l Env
ironm
enta
l Pro
tect
ion
Age
ncy
– A
PAT
Env.
Age
ncie
s: R
egio
nal &
Loc
al E
nviro
nmen
tal P
rote
ctio
n A
genc
ies
EDY
A:
Envi
ronm
enta
l Dat
a Y
earb
ook
APA
T R
ep. I
: rep
ort I
STA
T –
Nat
iona
l Sta
tistic
s Ins
titut
e
Rep
. MH
: rep
ort M
in. H
ealth
M
in. E
nv.:
Min
istry
for t
he E
nviro
nmen
t and
Ter
ritor
y IS
S: N
atio
nal I
nstit
ute
of H
ealth
IS
PEL:
Nat
iona
l Ins
titut
e fo
r Saf
ety
Wor
k Pl
aces

page
125
Lith
uani
a N
ame:
Ingr
ida
Zurly
te, A
ida
Lauk
aitie
ne
E-m
ail:
ingr
ida@
post
.om
nite
l.net
, aid
a.l@
taka
s.lt
Tel:
+370
5 2
3604
81
Add
ress
: Sta
te E
nviro
nmen
tal H
ealth
Cen
tre, E
nviro
nmen
t and
Hea
lth D
ivis
ion
K
alva
riju
stre
et 1
53, L
T-20
42 V
ilniu
s, Li
thua
nia
T
hem
e In
dica
tor
nam
e
Typ
e O
pera
tiona
l de
finiti
on
Purp
ose
use
of
indi
cato
r
Geo
gra-
phic
al S
cale
G
ende
r
Age
V
alid
atio
n D
ata
qual
ity
Dat
a co
llect
ion;
m
etho
d an
d fr
eque
ncy
Dat
a co
ntro
l A
cces
-si
bilit
y R
epor
ting
Com
men
ts
Air
qual
ity
Infa
nt
mor
talit
y du
e to
resp
irato
ry
dise
ases
E A
nnua
l m
orta
lity
rate
du
e to
re
spira
tory
di
seas
es in
ch
ildre
n ol
der
than
one
m
onth
and
un
der o
ne
year
of a
ge
Hea
lth
mon
itori
ng, a
ir co
ntro
l po
licy
eval
uatio
n
Loca
l –
mun
icip
ality
Y
Y
M
orta
lity
stat
istic
s, us
er
acce
ssib
le d
ata
base
upd
ated
an
nual
y
Y
Y
Stat
istic
al
anna
ls;
ww
w.ls
ic.lt
H
ealth
in
dica
tors
sy
stem
Y
Yea
rly,
web
, rep
ort
Air
qual
ity
Mor
talit
y du
e to
resp
irato
ry
dise
ases
E A
nnua
l m
orta
lity
rate
du
e to
re
spira
tory
di
seas
es
Mon
itori
ng, a
ir co
ntro
l po
licy
eval
uatio
n
Loca
l –
mun
icip
ality
, ci
ty
Y
Y
Mor
talit
y st
atis
tics,
user
ac
cess
ible
dat
a ba
ses a
re
upda
ted
year
ly
Y
Y
Stat
istic
al
anna
ls;
ww
w.ls
ic.lt
H
ealth
in
dica
tors
sy
stem
Y
Yea
rly,
web
, rep
ort
Air
qual
ity
Mor
talit
y du
e to
dis
ease
s of
the
circ
ulat
ory
syst
em
E A
nnua
l m
orta
lity
rate
du
e to
car
dio-
or
cer
ebro
-va
scul
ar
dise
ases
all
ages
Mon
itori
ng, a
ir co
ntro
l po
licy
eval
uatio
n
Loca
l –
mun
icip
ality
, ci
ty
Y
Y
Mor
talit
y st
atis
tics,
user
ac
cess
ible
dat
a ba
ses a
re
upda
ted
year
ly
Y
Y
Stat
istic
al
anna
ls;
ww
w.ls
ic.lt
H
ealth
in
dica
tors
sy
stem
Y
Yea
rly,
web
, rep
ort
Air
qual
ity
Polic
ies t
o re
duce
en
viro
nmen
tal
A
Com
posi
te
inde
x of
ca
pabi
lity
for
Envi
ron
men
tal
toba
cco
Nat
iona
l N
N
Q
uest
ionn
aire
fo
r pilo
t pro
ject
of
N
Proj
ect
repo
rt N
o re
gula
r re
porti
ng
yet

page
126
The
me
Indi
cato
r na
me
T
ype
Ope
ratio
nal
defin
ition
Pu
rpos
e us
e of
in
dica
tor
Geo
gra-
phic
al S
cale
G
ende
r
Age
V
alid
atio
n D
ata
qual
ity
Dat
a co
llect
ion;
m
etho
d an
d fr
eque
ncy
Dat
a co
ntro
l A
cces
-si
bilit
y R
epor
ting
Com
men
ts
toba
cco
smok
e ex
posu
re
impl
emen
ting
polic
ies t
o re
duce
en
viro
nmen
tal
toba
cco
smok
e ex
posu
re a
nd
prom
otin
g sm
oke
free
ar
eas
smok
e co
ntro
l po
licy
eval
uatio
n
Envi
ronm
enta
l H
ealth
In
dica
tors
, onc
e co
llect
ed fo
r the
ye
ar 1
996
-20
00.
Noi
se
Popu
latio
n an
noya
nce
by
certa
in
sour
ces o
f no
ise
E Pe
rcen
tage
of
the
popu
latio
n an
noye
d by
ce
rtain
so
urce
s of
envi
ronm
enta
l no
ise
Mon
itori
ng, n
oise
po
licy
eval
uatio
n
Pl
ans i
n th
e fu
ture
, in
clud
ed
into
the
Nat
iona
l lis
t of E
H
indi
cato
rs
Noi
se
Slee
p di
stur
banc
e by
noi
se
E Pe
rcen
tage
of
the
popu
latio
n w
ith se
lf-re
porte
d sl
eep
dist
urba
nce
by
envi
ronm
enta
l no
ise
Mon
itori
ng, n
oise
po
licy
eval
uatio
n
Pl
ans i
n th
e fu
ture
, in
clud
ed
into
the
Nat
iona
l lis
t of E
H
indi
cato
rs
Noi
se
App
licat
ion
of re
gula
tions
, re
stric
tions
an
d no
ise
abat
emen
t m
easu
res
A
Com
posi
te
inde
x of
ca
pabi
lity
to
impl
emen
t re
gula
tions
, re
stric
tions
an
d no
ise
abat
emen
t m
easu
res
Noi
se
polic
y ev
alua
tion
Nat
iona
l N
N
Q
uest
ionn
aire
fo
r pilo
t pro
ject
of
En
viro
nmen
tal
Hea
lth
Indi
cato
rs, o
nce
colle
cted
for t
he
year
199
6 -
2000
.
N
Y
Proj
ect
repo
rt
No
regu
lar
repo
rting
ye
t
Was
te a
nd
cont
ami-
nate
d la
nds
Haz
ardo
us
was
te p
olic
ies
A
Com
posi
te
inde
x on
the
leve
ls o
f ha
zard
ous
was
te p
olic
ies
Haz
ardo
us w
aste
po
licy
eval
uatio
n
Nat
iona
l N
N
Q
uest
ionn
aire
fo
r pilo
t pro
ject
of
En
viro
nmen
tal
Hea
lth
N
Y
Proj
ect
repo
rt
No
regu
lar
repo
rting
ye
t

page
127
The
me
Indi
cato
r na
me
T
ype
Ope
ratio
nal
defin
ition
Pu
rpos
e us
e of
in
dica
tor
Geo
gra-
phic
al S
cale
G
ende
r
Age
V
alid
atio
n D
ata
qual
ity
Dat
a co
llect
ion;
m
etho
d an
d fr
eque
ncy
Dat
a co
ntro
l A
cces
-si
bilit
y R
epor
ting
Com
men
ts
and
regu
latio
ns
Indi
cato
rs o
nce
colle
cted
for t
he
year
199
6 -
2000
. R
adia
tion
Inci
denc
e of
sk
in c
ance
r E
Ann
ual
inci
denc
e ra
te
of sk
in c
ance
r
Mon
itori
ng
Indi
vidu
al
data
Y
Y
Sp
ecia
lized
ca
ncer
regi
stry
, da
ta a
re
colle
cted
dai
ly,
but u
ser
acce
ssib
le d
ata
upda
ted
year
ly.
Y
Y
ww
w.ls
ic.lt
H
ealth
in
dica
tors
sy
stem
Web
, re
ports
Rad
iatio
n C
umul
ativ
e ra
diat
ion
doze
Ex
Pe
rcen
tage
of
popu
latio
n re
ceiv
ing
a cu
mul
ativ
e ra
diat
ion
dose
in
exc
ess o
f 5
mS/
year
Mon
itori
ng,
radi
atio
n po
licy
eval
uatio
n
Ave
rage
st
atis
tical
in
habi
tant
? Y
Sa
mpl
ing,
ca
lcul
atio
ns,
regi
stry
, m
onito
ring
of
radi
atio
n ex
posu
re,
daily
.
Y
Y
Dat
a ba
se
in
Rad
iatio
n Pr
otec
tion
Cen
tre,
repo
rt
Rep
ort
Rad
iatio
n U
V li
ght
inde
x Ex
U
V li
ght
inde
x M
onito
ring
N
N
Y
St
atis
tical
dat
a,
calc
ulat
ions
, da
ily, b
ut u
ser
acce
ssib
le d
ata
base
s are
up
date
d m
onth
ly
Y
Y,
Dat
a ba
se
in
Lith
uani
anH
ydro
met
eor
olog
ical
se
rvic
e
Y, y
early
to
Envi
ronm
ent
al
Prot
ectio
n A
genc
y
Rad
iatio
n N
umbe
r of
wor
kers
w
orki
ng w
ith
ioni
zing
ra
diat
ion
sour
ces
Ex
Num
ber o
f w
orke
rs
wor
king
with
io
nizi
ng
radi
atio
n so
urce
s
Mon
itori
ng,
radi
atio
n po
licy
eval
uatio
n
Pl
ans i
n th
e fu
ture
in
clud
ed
into
the
Nat
iona
l lis
t of E
H
indi
cato
rs.
Dat
a av
aila
ble
in
Rad
iatio
n Pr
otec
tion
cent
re
Rad
iatio
n Ef
fect
ive
A
Exis
tenc
e of
R
adia
tioN
atio
nal
N
Y
Que
stio
nnai
re
N
Y
No
regu
lar
Envi
ronm
e

page
128
The
me
Indi
cato
r na
me
T
ype
Ope
ratio
nal
defin
ition
Pu
rpos
e us
e of
in
dica
tor
Geo
gra-
phic
al S
cale
G
ende
r
Age
V
alid
atio
n D
ata
qual
ity
Dat
a co
llect
ion;
m
etho
d an
d fr
eque
ncy
Dat
a co
ntro
l A
cces
-si
bilit
y R
epor
ting
Com
men
ts
envi
ronm
enta
l m
onito
ring
of
radi
atio
n ac
tivity
effe
ctiv
e en
viro
nmen
tal
mon
itorin
g of
ra
diat
ion
activ
ity in
co
mpl
ianc
e w
ith n
atio
nal
and
inte
rnat
iona
l qu
ality
as
sura
nce
prog
ram
s
n po
licy
eval
uatio
n
for p
ilot p
roje
ct
of
Envi
ronm
enta
l H
ealth
In
dica
tors
, onc
e co
llect
ed fo
r the
ye
ar 1
996
-20
00.
Proj
ect
repo
rt re
porti
ng
on su
ch
indi
cato
r ye
t
ntal
ra
diat
ion
mon
itorin
g sy
stem
is
prop
erly
w
orki
ng in
Li
thua
nia.
D
ata
avai
labl
e in
En
viro
nme
ntal
Pr
otec
tion
agen
cy a
nd
Rad
iatio
n Pr
otec
tion
Cen
tre
Rad
iatio
n To
pica
lity
of
perm
its o
n th
e us
e of
ra
dioa
ctiv
e su
bsta
nces
A
Frac
tion
of
com
pani
es,
acco
rdin
g to
di
ffer
ent
cate
gorie
s, ha
ving
an
actu
al p
erm
it fo
r han
dlin
g pr
oces
sing
, em
issi
on e
ct.
of ra
dioa
ctiv
e su
bsta
nces
Rad
iatio
n po
licy
eval
uatio
n
Nat
iona
l N
Y
Q
uest
ionn
aire
fo
r pilo
t pro
ject
of
En
viro
nmen
tal
Hea
lth
Indi
cato
rs, o
nce
colle
cted
for t
he
year
199
6 -
2000
.
N
Y
Proj
ect
repo
rt
No
regu
lar
repo
rting
on
such
in
dica
tor
yet
Dat
a av
aila
ble
in
Rad
iatio
n Pr
otec
tion
Cen
tre
Drin
king
/S
wim
min
g w
ater
and
sa
nita
tion
Acc
ess t
o sa
fe
drin
king
w
ater
Ex
Perc
enta
ge o
f th
e po
pula
tion
with
co
ntin
uous
ac
cess
to
adeq
uate
am
ount
of
safe
drin
king
w
ater
in th
e ho
me
Mon
itori
ng,
drin
king
w
ater
po
licy
eval
uatio
n
Pl
ans i
n th
e fu
ture
, in
clud
ed
into
the
Nat
iona
l lis
t of E
H
indi
cato
rs
Drin
king
Su
pply
from
Ex
Pe
rcen
tage
of
Mon
itori
Loca
l, N
Y
R
outin
e Y
Y
, Y
,

page
129
The
me
Indi
cato
r na
me
T
ype
Ope
ratio
nal
defin
ition
Pu
rpos
e us
e of
in
dica
tor
Geo
gra-
phic
al S
cale
G
ende
r
Age
V
alid
atio
n D
ata
qual
ity
Dat
a co
llect
ion;
m
etho
d an
d fr
eque
ncy
Dat
a co
ntro
l A
cces
-si
bilit
y R
epor
ting
Com
men
ts
/Sw
imm
ing
wat
er a
nd
sani
tatio
n
publ
ic w
ater
su
pplie
s th
e po
pula
tion
supp
lied
from
pu
blic
wat
er
supp
ly to
the
hom
e
ng,
drin
king
w
ater
po
licy
eval
uatio
n
mun
icip
aliti
es
stat
istic
al d
ata
colle
ctio
n fr
om
ente
rpris
es,
year
ly
Stat
istic
al
anna
ls
year
ly,
repo
rt
Drin
king
/S
wim
min
g w
ater
and
sa
nita
tion
Effe
ctiv
e m
onito
ring
of
recr
eatio
nal
wat
er
A
Prop
ortio
n of
th
e ba
thin
g w
ater
s th
at
are
mon
itore
d an
d su
bjec
t to
syst
emat
ic
cont
rol
(des
igna
ted
bath
ing
wat
ers)
R
epor
ted
sepa
rate
ly f
or
(a)
fres
hwat
er
and
(b)
mar
ine
wat
er
Rec
reat
ion
al
wat
er
polic
y ev
alua
tion
Loca
l, m
unic
ipal
ities
N
Y
R
ecre
atio
nal
wat
er p
ollu
tion
surv
eilla
nce,
ye
arly
Y
Y,
Rec
reat
iona
l wat
er
mon
itorin
g da
ta b
ase
at
the
Inst
itute
of
Hyg
iene
, Pi
lot
proj
ect
repo
rt in
St
ate
Envi
ronm
ent
al H
ealth
C
entre
Y,
EH
indi
cato
rs
pilo
t pr
ojec
t re
port
Food
Saf
ety
Out
brea
ks o
f fo
od-b
one
illne
ss
E N
umbe
r of
outb
reak
s of
com
mun
icab
le
dise
ases
tra
nsm
itted
by
food
per
yea
r; In
cide
nce
num
ber i
n th
e ou
tbre
aks o
f co
mm
unic
abl
e di
seas
es
trans
mitt
ed b
y fo
od p
er y
ear
Mon
itori
ng, f
ood
safe
ty
polic
y ev
alua
tion
Loca
l, m
unic
ipal
ity
Y- b
y ag
e (a
ge g
roup
s:
0-2,
3-6
, 7-1
4,
15 a
nd m
ore)
N
– b
y ge
nder
Y
Com
mun
icab
le
dise
ase
surv
eilla
nce,
da
ily, b
y us
er
acce
ssib
le d
ata
by m
onth
ly
N
Y,
Dat
a ba
se
at th
e C
omm
unic
able
D
isea
se
Prev
entio
n an
d C
ontro
l C
entre
Y,
Yea
rly,
repo
rt
Food
Saf
ety
Inci
denc
e of
fo
od-b
one
illne
ss
E In
cide
nce
rate
of
acu
te
inte
stin
al
com
mun
icab
le
dise
ases
and
Mon
itori
ng, f
ood
safe
ty
polic
y ev
alua
tio
Loca
l, m
unic
ipal
ity
Y- b
y ag
e (a
ge g
roup
s:
0-2,
3-6
, 7-1
4,
15 a
nd m
ore)
N
– b
y ge
nder
Y
Com
mun
icab
le
dise
ase
surv
eilla
nce,
da
ily, b
y us
er
acce
ssib
le d
ata
N
Y,
Dat
a ba
se
at th
e C
omm
unic
able
Y,
Yea
rly,
repo
rt

page
130
The
me
Indi
cato
r na
me
T
ype
Ope
ratio
nal
defin
ition
Pu
rpos
e us
e of
in
dica
tor
Geo
gra-
phic
al S
cale
G
ende
r
Age
V
alid
atio
n D
ata
qual
ity
Dat
a co
llect
ion;
m
etho
d an
d fr
eque
ncy
Dat
a co
ntro
l A
cces
-si
bilit
y R
epor
ting
Com
men
ts
bact
eria
l foo
d to
xic
infe
ctio
ns
n by
mon
thly
D
isea
se
Prev
entio
n an
d C
ontro
l C
entre
Fo
od S
afet
y G
ener
al fo
od
safe
ty p
olic
y A
C
ompo
site
in
dex
for
basi
c fo
od
safe
ty
mea
sure
s
Food
sa
fety
po
licy
eval
uatio
n
Nat
iona
l N
Y
Q
uest
ionn
aire
fo
r pilo
t pro
ject
of
En
viro
nmen
tal
Hea
lth
Indi
cato
rs, o
nce
colle
cted
for t
he
year
199
6 -
2001
.
N
Y,
Pilo
t pr
ojec
t re
port
No
regu
lar
repo
rting
on
such
in
dica
tor
yet
For t
he
indi
cato
r da
ta fo
r 20
01 a
re
avai
labl
e
Food
Saf
ety
Effe
ctiv
enes
s of
food
safe
ty
cont
rols
A
Com
posi
te
inde
x fo
r qu
antit
ativ
e ou
tput
pa
ram
eter
s of
food
safe
ty
cont
rol
Food
sa
fety
po
licy
eval
uatio
n
Nat
iona
l N
Y
Q
uest
ionn
aire
fo
r pilo
t pro
ject
of
En
viro
nmen
tal
Hea
lth
Indi
cato
rs, o
nce
colle
cted
for t
he
year
199
6 -
2001
.
N
Y,
Pilo
t pr
ojec
t re
port
No
regu
lar
repo
rting
on
such
in
dica
tor
yet
For t
he
indi
cato
r da
ta fo
r 20
01 a
re
avai
labl
e
Che
mic
al
emer
genc
ies
Reg
ulat
ory
requ
irem
ents
fo
r lan
d-us
e pl
anni
ng
A
Reg
ulat
ory
requ
irem
ent
for l
and-
use
plan
ning
ar
ound
site
s co
ntai
ning
la
rge
quan
titie
s of
chem
ical
s ac
cord
ing
to
the
crite
ria fo
r up
per t
ier o
f th
e EU
‘S
eves
o II
’ di
rect
ive
Che
mic
al em
erge
nci
es
polic
y ev
alua
tion
Nat
iona
l N
Y
Q
uest
ionn
aire
fo
r pilo
t pro
ject
of
En
viro
nmen
tal
Hea
lth
Indi
cato
rs, o
nce
colle
cted
for t
he
year
199
6 -
2000
.
N
Y,
Pilo
t pr
ojec
t re
port
No
regu
lar
repo
rting
on
such
in
dica
tor
yet
Che
mic
al
emer
genc
ies
Che
mic
al
inci
dent
s A
Pr
esen
ce o
f an
act
ive,
C
hem
ica
l N
atio
nal
N
Y
Que
stio
nnai
re
for p
ilot p
roje
ct
N
Y,
Pilo
t N
o re
gula
r re
porti
ng

page
131
The
me
Indi
cato
r na
me
T
ype
Ope
ratio
nal
defin
ition
Pu
rpos
e us
e of
in
dica
tor
Geo
gra-
phic
al S
cale
G
ende
r
Age
V
alid
atio
n D
ata
qual
ity
Dat
a co
llect
ion;
m
etho
d an
d fr
eque
ncy
Dat
a co
ntro
l A
cces
-si
bilit
y R
epor
ting
Com
men
ts
regi
ster
cu
mul
ativ
e re
gist
er o
f ch
emic
al
inci
dent
s with
na
tiona
l co
vera
ge
emer
gen
cies
po
licy
eval
uatio
n
of
Envi
ronm
enta
l H
ealth
In
dica
tors
, onc
e co
llect
ed fo
r the
ye
ar 1
996
-20
00.
proj
ect
repo
rt on
such
in
dica
tor
yet
Che
mic
al
emer
genc
ies
Pois
on c
ente
r se
rvic
e A
Po
ison
cen
tre
serv
ice
staf
f pe
r hea
d of
po
pula
tion
Che
mic
al em
erge
nci
es
polic
y ev
alua
tion
Nat
iona
l N
Y
Q
uest
ionn
aire
fo
r pilo
t pro
ject
of
En
viro
nmen
tal
Hea
lth
Indi
cato
rs, o
nce
colle
cted
for t
he
year
199
6 -
2000
.
N
Y,
Pilo
t pr
ojec
t re
port
No
regu
lar
repo
rting
on
such
in
dica
tor
yet
Che
mic
al
emer
genc
ies
Gov
ernm
ent
prep
ared
ness
fo
r che
mic
al
inci
dent
s
A
Gov
ernm
ent
prep
ared
ness
fo
r che
mic
al
inci
dent
s
Che
mic
al em
erge
nci
es
polic
y ev
alua
tion
Nat
iona
l N
Y
Q
uest
ionn
aire
fo
r pilo
t pro
ject
of
En
viro
nmen
tal
Hea
lth
Indi
cato
rs, o
nce
colle
cted
for t
he
year
199
6 -
2000
.
N
Y,
Pilo
t pr
ojec
t re
port
No
regu
lar
repo
rting
on
such
in
dica
tor
yet
Traf
fic
acci
dent
s M
orta
lity
from
traf
fic
acci
dent
s
E D
eath
rate
du
e to
tra
nspo
rt ac
cide
nts
Mon
itori
ng,
traff
ic
safe
ty
polic
y ev
alua
tion
Loca
l –
mun
icip
ality
, ci
ty
Y
Y
Mor
talit
y st
atis
tics,
user
ac
cess
ible
dat
a ba
ses a
re
upda
ted
year
ly
Y
Y
Stat
istic
al
anna
ls;
ww
w.ls
ic.lt
H
ealth
in
dica
tors
sy
stem
Y
Yea
rly,
web
, rep
ort
Traf
fic
acci
dent
s R
ate
of
inju
ries b
y tra
ffic
ac
cide
nts
E In
jury
rate
du
e to
traf
fic
acci
dent
s
Mon
itori
ng,
traff
ic
safe
ty
polic
y ev
alua
tion
Loca
l, m
unic
ipal
ity,
city
, stre
et
addr
ess
Y
N
Traf
fic
acci
denc
e su
rvei
llanc
e,
daily
N
Y,
Stat
istic
al
anna
ls;
ww
w.p
olic
ija.
lt/ke
liu/
Y,
Yea
rly –
St
atis
tical
de
partm
ent,
Dai
ly –
R
oad
polic
e,

page
132
The
me
Indi
cato
r na
me
T
ype
Ope
ratio
nal
defin
ition
Pu
rpos
e us
e of
in
dica
tor
Geo
gra-
phic
al S
cale
G
ende
r
Age
V
alid
atio
n D
ata
qual
ity
Dat
a co
llect
ion;
m
etho
d an
d fr
eque
ncy
Dat
a co
ntro
l A
cces
-si
bilit
y R
epor
ting
Com
men
ts
repo
rt, w
eb
Hou
sing
Po
pula
tion
livin
g in
su
bsta
ndar
d ho
usin
g
Ex
Perc
enta
ge o
f th
e po
pula
tion
livin
g in
su
bsta
ndar
d ho
usin
g, th
at
is w
ithou
t the
ex
clus
ive
use
of a
toile
t, sh
ower
or
bath
and
pr
ivat
e co
okin
g fa
cilit
ies.
Mon
itori
ng,
hous
ing
polic
y ev
alua
tion
Pl
ans i
n th
e fu
ture
, in
clud
ed
into
the
Nat
iona
l lis
t of E
H
indi
cato
rs
Hou
sing
M
orta
lity
due
to e
xter
nal
caus
es in
ch
ildre
n un
der 5
yea
rs
of a
ge
E A
nnua
l m
orta
lity
rate
du
e to
the
exte
rnal
ca
uses
: do
mes
tic
acci
dent
s, po
ison
ing
in
child
ren
unde
r fiv
e ye
ars o
f age
Mon
itori
ng,
hous
ing
safe
ty
polic
y ev
alua
tion
Loca
l –
mun
icip
ality
, ci
ty
Y
Y
Mor
talit
y st
atis
tics,
user
ac
cess
ible
dat
a ba
ses a
re
upda
ted
year
ly
Y
Y
Stat
istic
al
anna
ls;
ww
w.ls
ic.lt
H
ealth
in
dica
tors
sy
stem
Y
Yea
rly,
web
, rep
ort
Hou
sing
Sc
ope
and
appl
icat
ion
of
build
ing
regu
latio
ns
for h
ousi
ng
A
Com
posi
te
inde
x fo
r the
sc
ope
and
appl
icat
ion
of
build
ing
regu
latio
ns
for h
ousi
ng
Hou
sing
po
licy
eval
uatio
n
Nat
iona
l N
Y
Q
uest
ionn
aire
fo
r pilo
t pro
ject
of
En
viro
nmen
tal
Hea
lth
Indi
cato
rs, o
nce
colle
cted
for t
he
year
199
6 -
2000
.
N
Y,
Pilo
t pr
ojec
t re
port
No
regu
lar
repo
rting
on
such
in
dica
tor
yet
Hou
sing
La
nd u
se a
nd
urba
n pl
anni
ng
regu
latio
ns
A
Com
posi
te
inde
x fo
r the
sc
ope
and
appl
icat
ion
of
regu
latio
ns
Hou
sing
po
licy
eval
uatio
n
Nat
iona
l N
Y
Q
uest
ionn
aire
fo
r pilo
t pro
ject
of
En
viro
nmen
tal
Hea
lth
N
Y,
Pilo
t pr
ojec
t re
port
No
regu
lar
repo
rting
on
such
in
dica
tor
yet

page
133
The
me
Indi
cato
r na
me
T
ype
Ope
ratio
nal
defin
ition
Pu
rpos
e us
e of
in
dica
tor
Geo
gra-
phic
al S
cale
G
ende
r
Age
V
alid
atio
n D
ata
qual
ity
Dat
a co
llect
ion;
m
etho
d an
d fr
eque
ncy
Dat
a co
ntro
l A
cces
-si
bilit
y R
epor
ting
Com
men
ts
for l
and
use
and
urba
n pl
anni
ng in
hu
man
se
ttlem
ents
Indi
cato
rs, o
nce
colle
cted
for t
he
year
199
6 -
2000
.
Wor
kpla
ce
Occ
upat
iona
l fa
talit
y ra
te
E O
ccup
atio
nal
fata
lity
rate
in
the
wor
king
po
pula
tion
Mon
itori
ng,
occu
pati
onal
he
alth
po
licy
eval
uatio
n
Nat
iona
l N
Y
Q
uest
ionn
aire
fo
r pilo
t pro
ject
of
En
viro
nmen
tal
Hea
lth
Indi
cato
rs, o
nce
colle
cted
for t
he
year
199
6 -
2000
.
N
Y,
Pilo
t pr
ojec
t re
port
No
regu
lar
repo
rting
on
such
in
dica
tor
yet
Wor
kpla
ce
Rat
es o
f in
jurie
s E
Rat
es o
f in
jurie
s in
the
wor
king
po
pula
tion
Mon
itori
ng,
occu
pati
onal
he
alth
po
licy
eval
uatio
n
Reg
ions
Y
, age
gr
oups
: 20-
29, 3
0-39
, 40-
49, 5
0-59
, 60
and
mor
e
Y
Occ
upat
iona
l ac
cide
nts
surv
eilla
nce,
w
eekl
y
Y
Y,
Stat
e O
ccup
atio
nal
In
spec
tion
data
bas
e
Y,
Ann
ual
repo
rt
Wor
kpla
ce
Stat
utor
y re
ports
of
occu
patio
nal
dise
ases
A
Exis
tenc
e of
a
natio
nal
form
al sy
stem
fo
r rep
ortin
g ca
ses o
f di
seas
es
diag
nose
d an
d co
nfirm
ed a
s du
e to
wor
k in
spec
ific
occu
patio
n at
ris
k (r
egis
ter
of
occu
patio
nal
dise
ases
)
Occ
upat
ion
al
heal
th
polic
y ev
alua
tion
Nat
iona
l N
Y
Q
uest
ionn
aire
fo
r pilo
t pro
ject
of
En
viro
nmen
tal
Hea
lth
Indi
cato
rs, o
nce
colle
cted
for t
he
year
199
6 -
2000
.
N
Y,
Pilo
t pr
ojec
t re
port
No
regu
lar
repo
rting
on
such
in
dica
tor
yet
1) e
g ai
r or w
ater
pol
lutio
n su
rvei
llanc
e, c
omm
unity
noi
se su
rvey
s, tra
ffic
acc
iden
t reg
istra
tion,
mor
talit
y st
atis
tics,
med
ical
regi
strie
s suc
h as
hos
pita
l dis
char
ge re
gist
ries e
tc
2) if
ther
e is
no
indi
cato
r ava
ilabl
e fo
r the
issu
e m
entio
ned,
add
in la
st c
olum
n (c
omm
ents
) whe
ther
ther
e is
inte
rest
in su
ch a
n in
dica
tor

page
134
Pola
nd
Nam
e: D
orot
a Ja
rosińs
ka
E-m
ail:
d.ja
rosi
nska
@im
p.so
snow
iec.
pl
Tel:
48 3
2 26
6088
5 A
ddre
ss: 1
3 K
osci
elna
, 41-
200
Sosn
owie
c,
This
Tab
le is
bas
ed o
n th
e in
dica
tors
pro
pose
d in
the
WH
O E
HI (
envi
ronm
enta
l hea
lth in
dica
tors
) pro
ject
, whi
ch a
re c
urre
ntly
pilo
t tes
ted
in
Pola
nd. T
he T
able
is n
ot e
xhau
stiv
e –
it co
ntai
ns e
xam
ples
of t
he E
xpos
ure,
Eff
ect a
nd A
ctio
n in
dica
tors
. T
hem
e In
dica
tor
nam
e
Typ
e O
pera
tiona
l de
finiti
on
Purp
ose
use
of
indi
cato
r
Geo
gra-
phic
al S
cale
G
ende
r
Age
V
alid
atio
n D
ata
qual
ity
Dat
a co
llect
ion;
m
etho
d an
d fr
eque
ncy
Dat
a co
ntro
l A
cces
-si
bilit
y R
epor
ting
Com
men
ts
Air
qual
ity
In
fant
m
orta
lity
due
to
resp
irato
ry
dise
ases
E A
nnua
l nu
mbe
r of
deat
hs in
ch
ildre
n un
der 1
yea
r of
age
due
to
resp
irato
ry
dise
ases
Mon
itorin
g, e
valu
atio
n N
atio
nal,
regi
onal
. C
hild
ren
unde
r 1
year
of a
ge
ICD
cod
e J0
0-J9
9 ac
cord
ing
to
ICD
–10
Dat
a on
num
ber o
f de
aths
and
live
birt
hs is
co
llect
ed o
n th
e re
gula
r ba
sis a
s a p
art o
f the
ro
utin
e st
atis
tics.
Full
natio
nal r
egis
ter o
f de
aths
/live
birt
hs is
ba
sed
on th
e in
form
atio
n re
porte
d by
re
gion
al st
atis
tical
of
fices
. IC
D 1
0-co
ding
si
nce
1997
.
Y
Dat
a qu
ality
go
od.
QA
/QC
us
ed fo
r the
da
ta e
ntry
, co
ding
, di
agno
ses.
A
popu
latio
n co
vera
ge is
ov
er 9
0%.
Fee
for
full
data
ac
cess
Mai
n St
atis
tical
O
ffic
e.
ww
w.st
at.g
ov.p
l Pu
blis
hed
annu
ally
.
A tw
o ye
ars g
ap
in
colle
ctin
g in
form
atio
n ex
ists
(1
997-
1998
)
M
orta
lity
due
to
resp
irato
ry
dise
ases
E A
nnua
l nu
mbe
r of
deat
hs d
ue to
re
spira
tory
di
seas
es.
Mon
itorin
g, e
valu
atio
n N
atio
nal,
regi
onal
ICD
cod
e J0
0-J9
9 ac
cord
ing
to
ICD
–10
Dat
a on
num
ber o
f de
aths
is c
olle
cted
re
gula
rly a
s a p
art o
f the
ro
utin
e st
atis
tics.
Full
natio
nal r
egis
ter o
f de
aths
bas
ed o
n th
e in
form
atio
n re
porte
d by
re
gion
al st
atis
tical
of
fices
. IC
D
10-c
odin
g us
ed
sinc
e 19
97.
Dea
ths s
tand
ardi
zed
acco
rdin
g to
gen
der,
age,
cau
se o
f dea
th.
Y
Dat
a qu
ality
is
good
. Q
ualit
y as
sura
nce
and
qual
ity
cont
rol i
s us
ed fo
r the
da
ta e
ntry
, co
ding
and
di
agno
ses.
A
popu
latio
n
M
ain
Stat
istic
al
Off
ice.
w
ww
.stat
.gov
.pl
Publ
ishe
d an
nual
ly.
Info
rmat
ion
abou
t de
aths
ac
cess
ible
ac
cord
ing
to th
e pl
ace
of d
eath
an
d pl
ace
of
resi
denc
e.
A tw
o ye
ars g
ap
in
colle
ctin
g

page
135
The
me
Indi
cato
r na
me
T
ype
Ope
ratio
nal
defin
ition
Pu
rpos
e us
e of
in
dica
tor
Geo
gra-
phic
al S
cale
G
ende
r
Age
V
alid
atio
n D
ata
qual
ity
Dat
a co
llect
ion;
m
etho
d an
d fr
eque
ncy
Dat
a co
ntro
l A
cces
-si
bilit
y R
epor
ting
Com
men
ts
cove
rage
is
over
90%
. in
form
atio
n ex
ists
(1
997-
1998
)
M
orta
lity
due
to
dise
ases
of
the
circ
ulat
ory
sy
stem
E A
nnua
l nu
mbe
r of
deat
hs d
ue to
ca
rdio
-va
scul
ar
dise
ases
.
Mon
itorin
g, e
valu
atio
n N
atio
nal,
regi
onal
To
tal
popu
latio
n/ye
ar.
ICD
cod
e I0
0-I9
9 ac
cord
ing
to IC
D –
10
Dat
a on
num
ber o
f de
aths
col
lect
ed o
n th
e re
gula
r bas
is a
s a p
art o
f th
e ro
utin
e st
atis
tics.
Full
natio
nal r
egis
ter o
f de
aths
bas
ed o
n th
e in
form
atio
n re
porte
d by
re
gion
al st
atis
tical
of
fices
. IC
D 1
0-co
ding
si
nce
1997
. D
eath
s are
stan
dard
ized
ac
cord
ing
to g
ende
r, ag
e an
d ca
use
of d
eath
.
Y
Dat
a qu
ality
is
good
. Q
ualit
y as
sura
nce
and
qual
ity
cont
rol i
s us
ed fo
r the
da
ta e
ntry
, co
ding
and
di
agno
ses.
A
popu
latio
n co
vera
ge is
ov
er 9
0%.
M
ain
Stat
istic
al
Off
ice.
w
ww
.stat
.gov
.pl
Publ
ishe
d an
nual
ly
Info
rmat
ion
abou
t de
aths
is
acce
ssib
le
acco
rdin
g to
the
plac
e of
dea
th
and
plac
e of
re
side
nce
of a
per
son
who
die
d.
A
two
year
s ga
p in
co
llect
ing
info
rmat
ion
abou
t de
aths
ex
ists
(1
997-
1998
)
Polic
ies
to re
duce
ex
posu
re
to E
TS
A
Fo
r pol
icy
eval
uatio
n
Nat
iona
l -
- -
- Su
bjec
tive
asse
ssm
ent;
need
for
obje
ctiv
e m
easu
res t
o ev
alua
te
effic
ienc
y of
the
polic
ies
Noi
se
App
licat
ion
of
regu
latio
ns,
A
Fo
r pol
icy
eval
uatio
n
Nat
iona
l -
- -
- A
sses
smen
t bi
as
poss
ible
.

page
136
The
me
Indi
cato
r na
me
T
ype
Ope
ratio
nal
defin
ition
Pu
rpos
e us
e of
in
dica
tor
Geo
gra-
phic
al S
cale
G
ende
r
Age
V
alid
atio
n D
ata
qual
ity
Dat
a co
llect
ion;
m
etho
d an
d fr
eque
ncy
Dat
a co
ntro
l A
cces
-si
bilit
y R
epor
ting
Com
men
ts
rest
rictio
ns a
nd
nois
e ab
atem
ent
m
easu
res
Drin
king
/S
wim
min
g w
ater
and
sa
nita
tion
Dia
rrho
ea m
orbi
dit
y in
ch
ildre
n
E N
umbe
r of
case
s of
diar
rhea
and
in
cide
nce
rate
pe
r 100
000
po
pula
tion
of
child
ren
less
th
en 2
yea
rs
old.
Mon
itorin
g N
atio
nal,
regi
onal
(v
oivo
dshi
p).
Dat
a on
the
loca
l (di
stric
t) le
vel n
ot
publ
ishe
d ro
utin
ely,
but
av
aila
ble
for
the
requ
est
IC
D-1
0 co
ding
use
d (A
04, A
08,
A09
).
Dia
rrhe
a in
chi
ldre
n le
ss th
en 2
yea
rs o
ld is
am
ong
the
infe
ctio
us
dise
ases
for w
hich
no
tific
atio
n an
d re
gist
ratio
n is
ob
ligat
ory.
Dat
a ar
e co
llect
ed, v
erifi
ed a
nd
anal
yzed
by
the
NIH
, as
repo
rted
by th
e re
gion
al
Sani
tary
-Ep
idem
iolo
gica
l St
atio
ns.
Dat
a ba
sed
on a
co
mpl
ete
inve
ntor
y,
coun
t the
da
ta q
ualit
y is
ver
y go
od
Fee
for
data
ac
cess
Publ
ishe
d by
the
Nat
iona
l In
stitu
te o
f H
ygie
ne
(NIH
), an
nual
, se
mi-
annu
al a
nd
biw
eekl
y “R
epor
ts
on c
ases
of
infe
ctio
us
dise
ases
an
d to
xic
effe
cts o
f ch
emic
al
subs
tanc
es
in P
olan
d”
O
utbr
eak
s of
wat
erbo
rne
di
seas
es
E
Und
erre
por
ting
poss
ible
Food
Saf
ety
Che
mic
al
emer
genc
ies
Traf
fic
acci
dent
s M
orta
lity
from
tra
ffic
ac
cide
nts
E N
umbe
r of
deat
h do
e to
tra
ffic
ac
cide
nts
IC
D-1
0 co
ding
use
d
Polic
e st
atis
tics
In
jurie
s du
e to
tra
ffic
E

page
137
The
me
Indi
cato
r na
me
T
ype
Ope
ratio
nal
defin
ition
Pu
rpos
e us
e of
in
dica
tor
Geo
gra-
phic
al S
cale
G
ende
r
Age
V
alid
atio
n D
ata
qual
ity
Dat
a co
llect
ion;
m
etho
d an
d fr
eque
ncy
Dat
a co
ntro
l A
cces
-si
bilit
y R
epor
ting
Com
men
ts
acci
dent
s H
ousi
ng
Mor
talit
y du
e to
ex
tern
al
caus
es in
ch
ildre
n un
der 5
ye
ars o
f ag
e
E A
nnua
l nu
mbe
r of
deat
hs in
ch
ildre
n un
der 5
yea
r of
age
due
to
exte
rnal
ca
uses
. *)
N
atio
nal,
regi
onal
ICD
cod
e W
00.0
or
W.0
0-Y
34.0
or
Y.3
4.1
acco
rdin
g to
IC
D –
10
Dat
a on
num
ber o
f de
aths
col
lect
ed o
n th
e re
gula
r bas
is a
s a p
art o
f th
e ro
utin
e st
atis
tics.
Full
natio
nal r
egis
ter o
f de
aths
/live
birt
hs is
ba
sed
on th
e in
form
atio
n re
porte
d by
re
gion
al st
atis
tical
of
fices
. IC
D 1
0-co
ding
si
nce
1997
.
Dat
a qu
ality
go
od.
QA
/QC
us
ed fo
r the
da
ta e
ntry
, co
ding
and
di
agno
ses.
Popu
latio
n co
vera
ge is
ov
er 9
0%..
Fee
for
data
ac
cess
Mai
n st
atis
tical
O
ffic
e w
ww
.stat
.gov
.pl
Publ
ishe
d an
nual
ly
A tw
o ye
ars g
ap
in
colle
ctin
g in
form
atio
n ex
ists
(1
997-
1998
). D
ata
on
deat
hs is
co
llect
ed
acco
rdin
g to
the
plac
e of
/dea
th
and
plac
e of
a
resi
denc
e of
a
mot
her/p
ers
on w
ho
died
.
Scop
e an
d ap
plic
ati
on o
f bu
ildin
g re
gula
tions
for
hous
ing
A
Ev
alua
tion;
pl
anni
ng
Nat
iona
l
O
bjec
tive
tool
s to
eval
uate
ef
fect
iven
ess
nee
ded
La
nd u
se
and
urba
n pl
anni
ng
A
Ev
alua
tion,
pl
anni
ng
Nat
iona
l
O
bjec
tive
tool
s to
eval
uate
ef
fect
iven
ess
nee
ded
*) P
opul
atio
n da
ta c
once
rnin
g ch
ildre
n u
nder
6 y
ears
of a
ge is
acc
essi
ble
for f
ree
from
the
repo
rts w
hich
are
pub
lishe
d an
nual
ly fo
r yea
rs 1
998
and
1999
. Dat
a on
chi
ldre
n un
der 5
yea
rs o
f age
not
acc
essi
ble
from
the
rout
ine
stat
istic
al re
ports

page
138
Port
ugal
N
ame:
Ces
altin
a R
amos
E-
mai
l:cra
mos
@dg
saud
e.m
in-s
aude
.pt
Tel:2
1843
0500
A
ddre
ss:A
lam
eda
D. A
fons
o H
enriq
ues,
45 -
1059
-005
LIS
BO
A
The
me
Indi
cato
r na
me
T
ype
Ope
ratio
nal
defin
ition
Pu
rpos
e us
e of
indi
cato
r G
eogr
aphi
cal
Scal
e G
ende
r
Age
V
alid
atio
n D
ata
qual
ity
Dat
a co
llect
ion;
m
etho
d an
d fr
eque
ncy
Dat
a co
ntro
l A
cces
-si
bilit
y R
epor
ting
Com
men
ts
Drin
king
/S
wim
min
g w
ater
and
sa
nita
tion
Wat
San_
P1 W
atSa
n_S1
Wat
San_
S2 W
atSa
n_S3
Wat
San_
Ex1 W
atSa
n_Ex
2 Wat
San_
E1 W
atSa
n_E2
A
A
A
A
Ex
Ex
E E
% c
over
age
Exce
edan
ce
VM
A/ri
sk
Exce
edan
ce
VM
A/ri
sk
Exce
edan
ce
VM
A/ri
sk
% c
over
age
% c
over
age
Out
brea
ks o
f w
ater
-bor
ne
dise
ases
D
iarr
hoea
m
orbi
dity
in
Mon
itorin
g ev
alua
tion
wat
er
qual
ity
Mon
itorin
g ev
alua
tion
wat
er
qual
ity
Mon
itorin
g ev
alua
tion
wat
er
qual
ity
Acc
ess t
o ad
equa
te
sani
tatio
n
Acc
ess t
o ad
equa
te
sani
tatio
n A
cces
s to
adeq
uate
sa
nita
tion
Rou
tine
pass
ive
case
re
porti
ng
N.º
of c
ases
/
Nat
iona
l N
atio
nal
Nat
iona
l N
atio
nal
Nat
iona
l N
atio
nal
Nat
iona
l N
atio
nal
N
N
N
N
N
N
Y
Y
Y
Y
Y
Y
Y
Y
Y
Y
Com
mun
ity
surv
eys
Mon
itorin
g/Y
ear
ly u
pdat
e da
ta
Mon
itorin
g/Y
ear
ly u
pdat
e da
ta
Mon
itorin
g/Y
ear
ly u
pdat
e da
ta
Com
mun
ity
surv
eys/
Nat
iona
l ce
nsus
es
Com
mun
ity
surv
eys/
Nat
iona
l ce
nsus
N
otifi
catio
n sy
stem
s M
edic
al
Y
Y
Y
Y
Y
Y
Y
Y
Y
Y
Y
Y
Y
Y
Y
Y
Y
Y
Y
Y
Y
Y
Y
Y
inte
rest
in a
n in
dica
tor
inte
rest
in a
n in
dica
tor
inte
rest
in a
n in
dica
tor
inte
rest
in a
n in
dica
tor
inte
rest
in a
n in
dica
tor
inte
rest
in a
n in
dica
tor
inte
rest
in a
n in
dica
tor
inte
rest
in a
n

page
139
Wat
San_
A1
A
child
ren
Inte
nsity
of
recr
eatio
nal
wat
er
mon
itorin
g
child
ren/
yea
r N.º
of v
alid
m
easu
rem
ents
per
po
lluta
nt/re
cre
atio
nal
area
/yea
r
Nat
iona
l
N
Rec
reat
iona
l w
ater
su
rvei
llanc
e
regi
strie
s/no
tific
atio
n sy
stem
s M
onito
ring
Y
Y
Y
indi
cato
r in
tere
st in
an
indi
cato
r
Hou
sing
and
Se
ttlem
ents
H
ous_
S1
Hou
s_Ex
1 H
ous_
E1
Hou
s_A
1 H
ous_
A2
A
Ex
E A
A
Mor
talit
y du
e to
ex
tern
al
caus
es
Dom
estic
ac
cide
nts
and
pois
onin
g
Nat
iona
l N
atio
nal
Nat
iona
l N
atio
nal
Reg
iona
l/Loc
al
N
N
Y
Y
Y
Y
Com
mun
ity
surv
eys/
Nat
iona
l ce
nsus
es
Com
mun
ity
surv
eys/
Nat
iona
l ce
nsus
es
Med
ical
re
gist
ries
Y
Y
Y
Y
Y
Y
Y
Y
Y
Y
Y
Y
Y
Y
Y
Air
qual
ity
Air_
P1
Air_
Ex1
Air_
E1
Air_
E2
Air_
E3
Air_
A1
Ex
Ex
E E E A
Mon
itorin
g ev
alua
tion
Mon
itorin
g ev
alua
tion
Reg
iona
l Lo
cal
Nat
iona
l N
atio
nal
Nat
iona
l N
atio
nal
Y
N
Y
Y
Y
Y
Y
Y
Y
Y
Y
Y
Com
mun
ity
surv
eys
Traf
fic a
ccid
ent
regi
stra
tion
Med
ical
re
gist
ries
Med
ical
re
gist
ries
Med
ical
re
gist
ries
Com
mun
ity
surv
eys
Y
Y
Y
Y
Y
Y
Y
Y
Y
Y
Y
Y
Y
Y
Y
Y
Y
Y
Was
te a
nd
cont
amin
ated
la
nds
Was
te_P
1 W
aste
_A1
A
A
Reg
iona
l N
atio
nal
N
N
Y
Y
Com
mun
ity
surv
eys
Y
Y
Y
Y
Y
Che
mic
al
emer
genc
ies
Che
m_E
1 C
hem
_A1
Che
m_A
2 C
hem
_A3
A
E A
A
Reg
iona
l N
atio
nal
Nat
iona
l N
atio
nal
N
Y
N
Y
Y
Y
Y
Com
mun
ity
surv
eys
Med
ical
re
gist
ries
Acc
iden
t re
gist
ratio
n
Y
Y
Y
Y
Y
Y
Y
Y
Y
Y
Y
Y

page
140
Che
m_A
4 C
hem
_A5
A
A
Nat
iona
l N
atio
nal
Y
Y
Y
Y
Y
Y
Food
Saf
ety
Food
_Ex1
Food
_E1
Food
_E2
Food
_A1
A
A
E A
Reg
iona
l N
atio
nal
Nat
iona
l R
egio
nal
N
Y
Y
N
Y
Y
Y
Y
Mon
itorin
g M
edic
al
regi
strie
s M
edic
al
regi
strie
s C
omm
unity
su
rvey
s
Y
Y
Y
N
Y
Y
Y
Y
Y
Y
Y
Y
Noi
se
Noi
se_A
1 A
N
atio
nal
N
Y
Com
mun
ity
surv
eys
Y
Y
Y
Rad
iatio
n R
ad_E
1 E
Nat
iona
l Y
Y
M
edic
al
regi
strie
s Y
Y
Y
Traf
fic
acci
dent
s Tr
af_E
1 Tr
af_E
2
E E
Nat
iona
l N
atio
nal
Y
Y
Y
Y
Med
ical
re
gist
ries
Acc
iden
t re
gist
ratio
n
Y
Y
Y
Y
Y
Y
Oth
er:
Wor
kpla
ce
Wor
k_E1
W
ork_
E2
Wor
k_E3
W
ork_
A1
Stat
istic
s St
atis
tics
Stat
istic
s E
Nat
iona
l N
atio
nal
Nat
iona
l N
atio
nal
Y
Y
Y
Y
Y
Y
Y
Y
Acc
iden
t re
gist
ratio
n A
ccid
ent
regi
stra
tion
Med
ical
re
gist
ries
Y
Y
Y
Y
Y
Y
Y
Y
Y
Y
Y
Y
Y

page
141
Rom
ania
N
ame:
Ale
xand
ra C
ucu
Add
ress
: Min
istry
of H
ealth
The
me
Indi
cato
r na
me
T
ype
Ope
ratio
nal
defin
ition
Pu
rpos
e us
e of
indi
cato
r G
eogr
aphi
cal
Scal
e G
ende
r
Age
V
alid
atio
n D
ata
qual
ity
Dat
a co
llect
ion;
m
etho
d an
d fr
eque
ncy
Dat
a co
ntro
l A
cces
-si
bilit
y R
epor
ting
Com
men
ts
Air
qual
ity
1. E
xpos
ure
to a
mbi
ent
air
pollu
tant
s (u
rban
) 2.
In
fant
m
orta
lity
due
to
resp
irato
ry
dise
ases
3.
Po
licie
s to
redu
ce
envi
ronm
ent
al to
bacc
o sm
oke
expo
sure
Ex
E A
1.
popu
latio
n-w
eigh
ted
mea
n ex
ceed
ance
of
the
refe
renc
e co
ncen
tratio
ns
for a
ir po
llutio
n in
ur
ban
setti
ngs
2.
Ann
ual
mor
talit
y ra
te
due
to
resp
irato
ry
dise
ases
in
child
ren
olde
r th
an o
ne m
onth
an
d un
der o
ne
year
of a
ge
3.
Com
posi
te
inde
x of
ca
pabi
lity
for
impl
emen
ting
polic
ies t
o re
duce
en
viro
nmen
tal
toba
cco
smok
e ex
posu
re a
nd
prom
otin
g sm
oke
free
ar
eas
1.
Mon
itorin
g,
impa
ct
eval
uatio
n 2.
M
onito
ring,
es
timat
ion
of th
e bu
rden
of
dise
ase
attri
buta
ble
to in
door
air
pollu
tion.
3.
Ev
alua
tion
of c
apab
ility
to
im
plem
ent
polic
ies f
or
redu
cing
en
viro
nmen
tal
toba
cco
smok
e ex
posu
re
1.
Loca
l (ur
ban
setti
ngs)
2.
N
atio
nal
Reg
iona
l 3.
N
atio
nal
N
Y
N
Y
Yea
rly
Rou
tine
data
co
llect
ion
(mon
thly
, qu
arte
rly,
year
ly)
N
Y
(reg
iona
l an
alys
is
com
mis
sio
n)
on re
ques
t Y
Y
Yea
rly
publ
ishe
d re
port
Y
Qua
rterly
, ye
arly
pu
blis
hed
repo
rts
Poor
ge
ogra
phic
al
cove
rage
Noi
se
1.
1.
1.
1.

page
142
The
me
Indi
cato
r na
me
T
ype
Ope
ratio
nal
defin
ition
Pu
rpos
e us
e of
indi
cato
r G
eogr
aphi
cal
Scal
e G
ende
r
Age
V
alid
atio
n D
ata
qual
ity
Dat
a co
llect
ion;
m
etho
d an
d fr
eque
ncy
Dat
a co
ntro
l A
cces
-si
bilit
y R
epor
ting
Com
men
ts
Pop
ulat
ion
anno
yanc
e by
ce
rtain
so
urce
s of
no
ise
2.
Slee
p di
stur
banc
e by
noi
se
E E
%
of
the
popu
latio
n an
noye
d by
ce
rtain
sou
rces
of
en
viro
nmen
tal
nois
e 2.
%
of t
he
popu
latio
n w
ith se
lf-re
porte
d sl
eep
dist
urba
nce
by
envi
ronm
enta
l no
ise
long
-term
he
alth
ef
fect
s ev
alua
tion,
po
licy-
mak
ing,
new
re
gula
tions
2.
lo
ng-te
rm
heal
th
effe
cts
eval
uatio
n,
polic
y-m
akin
g, n
ew
regu
latio
ns
Loca
l (ur
ban
setti
ngs)
2.
Lo
cal (
urba
n se
tting
s)
N
N
N
N
Ever
y 2
year
s Ev
ery
2 ye
ars
N
N
N
N
Rep
orts
ev
ery
2 ye
ars
Rep
orts
ev
ery
2 ye
ars
Nee
d fu
rther
m
etho
dolo
gica
l st
anda
rdis
ati
on
Was
te a
nd
cont
amin
ated
la
nds
Rad
iatio
n In
cide
nce
of
skin
can
cer
E A
nnua
l in
cide
nce
rate
of
skin
can
cer
Mon
itorin
g,
risk
com
mun
ica-
tion
Reg
iona
l, N
atio
nal
Y
Y
R
outin
e co
llect
ion
(yer
aly)
Y
(reg
iona
l an
alys
is
com
mis
sio
n)
Y
Yea
rly
repo
rt Fr
om th
e N
atio
nal
Can
cer
Reg
istry
Drin
king
/S
wim
min
g w
ater
and
sa
nita
tion
1.
Exce
edan
ce
of W
HO
dr
inki
ng
wat
er
guid
elin
es
for
mic
robi
olo-
gica
l pa
ram
eter
s 2.
O
utbr
eaks
of
wat
er-b
orne
di
seas
es
Ex
E
1.
% o
f drin
king
w
ater
sam
ples
w
ith E
col
i or
faec
al
stre
ptoc
occi
ex
ceed
ing
the
guid
elin
e va
lue
of 0
/ 100
ml
wat
er ov
er a
gi
ven
time
perio
d 2.
N
umbe
r of
outb
reak
s of
wat
er-b
orne
di
seas
es a
nd
tota
l num
ber o
f
1.
Mon
itorin
g,
eval
uatio
n of
drin
king
w
ater
m
icro
biol
o-gi
cal s
afet
y 2.
M
onito
ring,
aw
arne
ss
rais
ing,
risk
co
mm
unic
a-tio
n,
Loca
l Lo
cal
N
Y
No
qual
ity
assu
ranc
e sy
stem
in p
lace
Y
Yea
rly
Qua
rterly
, yea
rly
N
N
On
requ
est
Y
Yea
rly
publ
ishe
d re
ports
Y
early
pu
blis
hed
repo
rts
Prob
lem
s of
info
rmat
ion
flow

page
143
The
me
Indi
cato
r na
me
T
ype
Ope
ratio
nal
defin
ition
Pu
rpos
e us
e of
indi
cato
r G
eogr
aphi
cal
Scal
e G
ende
r
Age
V
alid
atio
n D
ata
qual
ity
Dat
a co
llect
ion;
m
etho
d an
d fr
eque
ncy
Dat
a co
ntro
l A
cces
-si
bilit
y R
epor
ting
Com
men
ts
case
s rep
orte
d se
para
tely
for
drin
king
wat
er
and
recr
eatio
nal
wat
ers
inte
rven
tion
plan
s
Food
Saf
ety
1.
Mon
itorin
g ch
emic
al
haza
rds
in
food
: po
tent
ial
expo
sure
2.
O
utbr
eaks
of
food
-bor
ne
illne
ss
Ex
E
1.
Die
tary
ex
posu
re
asse
ssm
ent t
o po
tent
ially
ha
zard
ous
chem
ical
s m
onito
red
in
food
acc
ordi
ng
to th
e GEM
S /
Food
Pr
ogra
mm
e 2.
N
umbe
r of
outb
reak
s of
food
-bor
ne
illne
ss a
nd
tota
l num
ber o
f ca
ses i
n th
e ou
tbre
aks
Mon
itorin
g M
onito
ring,
in
terv
entio
n pl
ans
Loca
l, R
egio
nal
Loca
l
N
Y
N
Y
Yea
rly
year
ly
N
N
On
requ
est
On
requ
est
Yea
rly
publ
ishe
d re
ports
Y
early
pu
blis
hed
repo
rts
Prob
lem
s of
info
rmat
ion
flow
Che
mic
al
emer
genc
ies
Traf
fic
acci
dent
s M
orta
lity
from
tra
ffic
acci
dent
s
E D
eath
rate
due
to
tran
spor
t ac
cide
nts
Mon
itorin
g,
traff
ic p
olic
y ev
alua
tion
Reg
iona
l, N
atio
nal
Y
Y
Rou
tine
colle
ctio
n (q
uarte
rly,
year
ly)
N
Y
Yea
rly
publ
ishe
d re
ports
2 da
ta
sour
ces:
M
inis
try o
f H
ealth
M
inis
try o
f In
tern
al
Aff
airs
H
ousi
ng
Livi
ng fl
oor
area
per
pe
rson
Ex
Mea
n ha
bita
ble
floor
are
a pe
r pe
rson
Ris
k as
sess
men
t R
egio
nal,
Nat
iona
l

page
144
Spai
n N
ame:
Fra
ncis
co M
arqu
es
Add
ress
: San
idad
Am
bien
tal y
Sal
ud L
abor
al, M
inis
terio
de
Sani
dad
y C
onsu
mo
The
me
IND
ICA
TO
R ID
/NA
ME
T
ype
Geo
gra-
phic
al S
cale
A
ge
cate
gory
V
alid
atio
n D
ata
qual
ity
Dat
a co
llect
ion
Dat
a co
ntro
l D
ata
proc
ess-
ing
Acc
essi
bilit
y R
epor
ting
Com
men
ts
A
ir D
2 C
onsu
mpt
ion
of fu
el b
y ty
pe fr
om ro
ad tr
ansp
ort
Driv
ing
forc
e N
atio
nal
N/A
In
tern
atio
nal
Ener
gy
Age
ncy
N
/A
Y
es,
ww
w.ie
a.or
g
Yea
rly
(inte
rnat
ion
al e
nerg
y ag
ency
)
A
ir P2
Em
issi
ons o
f air
pollu
tant
s Pr
essu
re
Nat
iona
l R
egio
nal
N/A
EU
agr
eed
met
hodo
logy
O
utdo
or
Mea
sure
men
ts
N/A
Yes
, acc
essi
ble
in re
ports
A
s req
uire
d by
EU
di
rect
ives
A
ir_Ex
1 A
mbi
ent C
once
ntra
tions
of
air
pollu
tant
s (ur
ban
popu
latio
n-ba
sed
expo
sure
).
Expo
sure
R
egio
nal,
urba
n (lo
cal)
N/A
EU
agr
eed
met
hodo
logy
O
utdo
or
Mea
sure
men
ts
N/A
Yes
, acc
essi
ble
in re
ports
A
s req
uire
d by
EU
di
rect
ives
A
ir_E1
In
fant
mor
talit
y du
e to
re
spira
tory
dis
ease
s.
Effe
ct
Nat
iona
l Y
es
ICD
-10
Nat
iona
l st
atis
tics
Yes
Yes
w
ww
.ine.
es
Yea
rly
A
ir_E2
M
orta
lity
due
to
resp
irato
ry d
isea
ses a
ll ag
es
Effe
ct
Nat
iona
l Y
es
ICD
-10
Nat
iona
l st
atis
tics
Yes
Yes
w
ww
.ine.
es
Yea
rly
A
ir_E3
M
orta
lity
due
to d
isea
ses
of th
e ci
rcul
ator
y sy
stem
, al
l age
s
Effe
ct
Nat
iona
l Y
es
ICD
-10
Nat
iona
l st
atis
tics
Yes
Yes
w
ww
.ine.
es
year
ly
HO
USI
NG
H
ous_
S1
Livi
ng fl
oow
per
are
a pe
r pe
rson
Stat
e N
atio
nal
N/A
N
/A
Nat
iona
l St
atis
tics
N/A
Yes
w
ww
.ine.
es
Yea
rly
H
ouse
_Ex1
Po
pula
tion
livin
g is
Su
bsta
ndar
d H
ousi
ng
Expo
sure
N
atio
nal
N/A
N
/A
Surv
ey
N/A
Yes
, w
ww
.ine.
es
Yea
rly
H
ous_
E1
Effe
ct
Nat
iona
l Y
es
ICD
-10
Nat
iona
l Y
es
Y
es
Yea
rly

page
145
The
me
IND
ICA
TO
R ID
/NA
ME
T
ype
Geo
gra-
phic
al S
cale
A
ge
cate
gory
V
alid
atio
n D
ata
qual
ity
Dat
a co
llect
ion
Dat
a co
ntro
l D
ata
proc
ess-
ing
Acc
essi
bilit
y R
epor
ting
Com
men
ts
Mor
talit
y du
e to
ext
erna
l ca
uses
in c
hild
ren
And
er 5
ye
ars o
f age
stat
istic
s w
ww
.ine.
es
H
ous_
A1
Scop
e an
d ap
plic
atio
n of
bu
ildin
g re
gula
tions
for
hous
ing
Act
ion
Nat
iona
l N
/A
N/A
N
/A
N/A
Yes
, in
Bol
etín
O
ficia
l del
Es
tado
w
ww
.boe
.es
N/A
H
ous_
A2
Land
use
and
urb
an
plan
ning
regu
latio
n
Act
ion
N
/A
N/A
N
/A
N/A
Yes
, in
Bol
etín
O
ficia
l del
Es
tado
w
ww
.boe
.es
N/A
TR
AFF
IC
Traf
_E1
Mor
talit
y fr
om tr
affic
ac
cide
nts
Effe
ct
Nat
iona
l Y
es
Yes
N
atio
nal
Stat
istic
s Y
es
Y
es.
ww
w.in
e.es
Yea
rly,
Tr
af_E
2 R
ate
of in
jurie
s by
traff
ic
acci
dent
s
Effe
ct
Nat
iona
l Y
Es
YEs
Su
rvey
Y
es, u
pon
requ
est t
o w
ww
.dgt
.es
Yea
rly,
NO
ISE
N
oise
_E1
Popu
latio
n an
noya
nce
by
certa
in so
urce
s of n
oise
Effe
ct
Nat
iona
l N
o N
o Su
rvey
N
o
Yes
, ww
w.in
e.es
Yea
rly
sinc
e 19
98
N
oise
_A1
App
licat
ion
of re
gula
tion,
re
stric
tions
and
noi
se
abat
emen
t mea
sure
s
Act
ion
Nat
iona
l Lo
cal
N/A
N
/A
N/A
N
/A
Y
es, i
n B
olet
ín
Ofic
ial d
el
Esta
do
ww
w.b
oe.e
s
N/A
Con
tam
inat
ed L
and
Che
m_P
1
Site
s con
tain
ing
larg
qu
antit
ies o
f che
mic
als
Pres
sure
N
atio
nal
N/A
N
o R
egis
try
N/A
Onl
y th
e nu
mbe
r of
site
s, no
t the
lo
catio
n
C
hem
_E1
Mor
talit
y fr
om C
hem
ical
A
ccid
ents
Effe
ct
Nat
iona
l Y
es
ICD
-10
Nat
iona
l St
atis
tics
N/A
Yes
, w
ww
.ine.
es
year
ly
C
hem
_A1
egul
ator
y re
quire
men
ts fo
r la
nd-u
se p
lann
ing
Act
ion
Nat
iona
l N
/A
N/A
N
/A
N/A
Yes
, in
Bol
etín
O
ficia
l del
Es
tado
w
ww
.boe
.es
N/A
C
hem
_A2
Act
ion
Reg
iona
l N
/A
N/A
R
egis
tries
N
/A
N/A

page
146
The
me
IND
ICA
TO
R ID
/NA
ME
T
ype
Geo
gra-
phic
al S
cale
A
ge
cate
gory
V
alid
atio
n D
ata
qual
ity
Dat
a co
llect
ion
Dat
a co
ntro
l D
ata
proc
ess-
ing
Acc
essi
bilit
y R
epor
ting
Com
men
ts
Che
mic
al in
cide
nts
regi
ster
Che
m_A
5 G
over
nmen
t pre
pare
dnes
s A
ctio
n N
atio
nal
N/A
N
/A
N/A
N
/A
Y
es
N/A
Rad
iatio
n R
ad_E
1 In
cide
nce
of sk
in c
ance
r Ef
fect
R
egio
nal
Reg
iona
l, on
ly fo
r so
me
regi
ons
Yes
M
edic
al
regi
stry
Y
es,
publ
icat
ions
R
ad_A
1 Ef
fect
ive
envi
ronm
enta
l m
onito
ring
of ra
diat
ion
activ
ity
Act
ion
Nat
iona
l N
/A
N/A
N
/A
N/A
Yes
, in
Bol
etín
O
ficia
l del
Es
tado
w
ww
.boe
.es
Was
te
Was
t_A
1 H
azar
dous
was
te p
olic
ies
Act
ion
Nat
iona
l N
/A
N/A
N
/A
Yes
, in
Bol
etín
O
ficia
l del
Es
tado
w
ww
.boe
.es
N/A
Wat
er
Wat
San_
P1
Was
te W
ater
trea
tem
ent
cove
rage
Pres
sure
N
atoi
nal
N/A
N
/A
Surv
ey
N/A
Yes
, w
ww
.ine.
es
Yea
rly
W
atSa
n_S1
Ex
ceed
ance
of
recr
eatio
nal w
ater
lim
it va
lues
for m
icro
biol
ogic
al
para
met
ers
Stat
e N
atio
nal
N/A
Y
es
Mea
sure
men
ts
N/A
Yes
, w
ww
.msc
.es
Yea
rly
W
atSa
n_S2
Ex
ceed
ance
of W
HO
dr
inki
ng w
ater
gui
delin
es
for m
icro
biol
ogic
al
para
met
ers
Stat
e N
atio
nal
N/A
Y
es
Mea
sure
men
ts
N/A
Yes
, w
ww
.msc
.es
Yea
rly
W
atSa
n_S3
Ex
ceed
ance
of W
HO
dr
inki
ng w
ater
gui
delin
es
for c
hem
ical
par
amen
ters
Stat
e N
atio
nal
N/A
Y
es
Mea
sure
men
ts
N/A
Yes
, w
ww
.msc
.es
Yea
rly
W
atSa
n_Ex
1 A
cces
s to
drin
king
wat
er
com
plyi
ng w
ith W
HO
gu
idel
ine
valu
es
Expo
sure
N
atio
nal
N/A
N
/A
Surv
ey
Yes
, w
ww
.ine.
es
Yea
rly

page
147
The
me
IND
ICA
TO
R ID
/NA
ME
T
ype
Geo
gra-
phic
al S
cale
A
ge
cate
gory
V
alid
atio
n D
ata
qual
ity
Dat
a co
llect
ion
Dat
a co
ntro
l D
ata
proc
ess-
ing
Acc
essi
bilit
y R
epor
ting
Com
men
ts
W
atSa
n_Ex
2 A
cces
s to
adeq
uate
sa
nita
tion
Expo
sure
N
atio
nal
N/A
N
/A
Surv
ey
Yes
, w
ww
.ine.
es
Yea
rly
W
atSa
n_E1
O
utbr
eaks
of
w
ater
born
e di
seas
es
Effe
ct
Nat
iona
l Y
es
Yes
M
edic
al
regi
stry
Y
es, u
pon
requ
est t
o In
stitu
to d
e Sa
lud
Car
los I
II
ww
w.is
ciii.
es
Yea
rly
W
atSa
n_A
1 Ef
fect
ive
mon
itorin
g of
re
crea
tiona
l wat
er
Act
ion
Nat
iona
l N
/A
N/A
N
/A
N/A
Yes
, w
ww
.msc
.es
Yea
rly
Food
Fo
od_E
1 N
umbe
r of o
utbr
eaks
of
food
born
e ill
ness
Effe
ct
Nat
iona
l,
Yes
Y
es
Med
ical
re
gist
ry
Yes
, upo
n re
ques
to to
In
stitu
to d
e Sa
lud
Car
los I
II
ww
w.is
ciii.
es
Yea
rly
Fo
od_E
2 In
cide
nce
rate
of
food
born
e ill
ness
es
Effe
ct
Nat
iona
l Y
es
Yes
M
edic
al
regi
stry
Y
es, u
pon
requ
est t
o In
stitu
to d
e Sa
lud
Car
los I
II
ww
w.is
ciii.
es
Yea
rly
Fo
od _
A1
Act
ion
Nat
iona
l N
/A
N/A
N
/A
N/A
Yes
, in
Bol
etín
O
ficia
l del
Es
tado
w
ww
.boe
.es
Wor
k W
ork_
E1
Occ
upat
iona
l fat
ality
rate
Ef
fect
N
atio
nal
Yes
IC
D-1
0 N
atio
nal
Stat
istic
s
Y
es, u
pon
requ
est t
o M
inis
try o
f W
ork
and
Soci
al
Aff
airs
Yea
rly
W
ork_
E2
Occ
upat
iona
l inj
ury
rate
Ef
fect
N
atio
nal
IC
D-1
0 re
gist
ry
Yes
, upo
n re
ques
t to
Min
istry
of
Yea
rly

page
148
The
me
IND
ICA
TO
R ID
/NA
ME
T
ype
Geo
gra-
phic
al S
cale
A
ge
cate
gory
V
alid
atio
n D
ata
qual
ity
Dat
a co
llect
ion
Dat
a co
ntro
l D
ata
proc
ess-
ing
Acc
essi
bilit
y R
epor
ting
Com
men
ts
Wor
k an
d So
cial
A
ffai
rs
W
ork_
A1
Stat
utor
y re
ports
of
occu
patio
nal d
isea
ses
Act
ion
Nat
iona
l N
/A
N/A
N
/A
N/A
NB
1 F
ocus
on
EH in
dica
tors
eg
num
ber o
f cas
es a
ttrib
uted
to a
ir po
llutio
n, n
oise
exp
osur
e et
c; n
umbe
r of p
eopl
e ex
pose
d to
cer
tain
pol
lutio
n le
vels
or e
xced
ance
of l
imits
N
B 2
if th
e in
dica
tor i
s not
ava
ilabl
e, a
dd in
last
col
umn
(com
men
ts) w
heth
er th
ere
is in
tere
st in
such
an
indi
cato
r N
B 1
Foc
us o
n EH
indi
cato
rs e
g nu
mbe
r of c
ases
attr
ibut
ed to
air
pollu
tion,
noi
se e
xpos
ure
etc;
num
ber o
f peo
ple
expo
sed
to c
erta
in p
ollu
tion
leve
ls o
r exc
edan
ce o
f lim
its
NB
2 if
the
indi
cato
r is n
ot a
vaila
ble,
add
in la
st c
olum
n (c
omm
ents
) whe
ther
ther
e is
inte
rest
in su
ch a
n in
dica
tor

page
149
Slov
enia
N
ame:
Ves
na S
mak
a K
incl
E-
mai
l: ve
sna.
smak
a@m
arib
or.si
Te
l: +
+ 3
86 2
220
1 44
5 A
ddre
ss: M
unic
ipal
ity o
f Mar
ibor
, Slo
vens
ka 4
0, 2
000
Mar
ibor
, Slo
veni
a C
ount
ry o
r pro
ject
: Eur
opea
n co
mm
on in
dica
tors
- To
war
ds a
loca
l sus
tain
abili
ty p
rofil
e Y
= ye
s, N
= N
o T
hem
e In
dica
tor
nam
e
Typ
e O
pera
tion
al
defin
ition
Purp
ose
use
of
indi
cato
r
Geo
gra-
phic
al S
cale
G
ende
r
Age
V
alid
atio
n D
ata
qual
ity
Dat
a co
llect
ion;
m
etho
d an
d fr
eque
ncy
Dat
a co
ntro
l A
cces
-si
bilit
y R
epor
ting
Com
men
ts
Air
qual
ity
Loca
l co
ntrib
utio
n to
cl
imat
ic
chan
ges
Ex
CO
2 em
issi
on
per c
apita
Mon
itorin
g Lo
cal
N
N
Ever
y 2
year
s N
w
ww
.sust
aina
ble-
citie
s.org
/indi
cato
rs
ww
w.m
arib
or.si
Ever
y 2
year
s
Air
qual
ity
Loca
l m
obili
ty
and
publ
ic
trans
port
A
% o
f trip
s by
m
otor
ised
pr
ivat
e tra
nspo
rt
Cal
cula
tion
Loca
l N
N
Ev
ery
2 ye
ars
N
ww
w.su
stai
nabl
e-ci
ties.o
rg/in
dica
tors
w
ww
.mar
ibor
.si
Ever
y 2
year
s
Hou
sing
A
vaila
bilit
y of
loca
l pu
blic
ope
n ar
eas
and
serv
ices
A
% o
f ci
tizen
s liv
ing
with
in 3
00
m fr
om
publ
ic o
pen
area
s >
5000
m2
Cal
cula
tion
Loca
l N
N
Ev
ery
2 ye
ars
N
ww
w.su
stai
nabl
e-ci
ties.o
rg/in
dica
tors
w
ww
.mar
ibor
.si
Ever
y 2
year
s
Air
qual
ity
Qua
lity
of
the
air
Ex
the
num
ber
of ti
mes
th
e lim
it
Mon
itorin
g lo
cal
N
Y
Dai
ly
w
ww
.sust
aina
ble-
citie
s.org
/in
Y w
eb a
nd
repo
rt

page
150
valu
e is
ex
ceed
ed
fo
r SO
2, N
O2,
PM10
, C
O, O
3
dica
tors
w
ww
.mar
ibor
.si
Air
qual
ity
Chi
ldre
n's
jour
neys
to
and
from
sc
hool
A
% o
f ch
ildre
n go
ing
to
scho
ol b
y ca
r
Mea
sure
me
nts,
Lo
cal
6-
18
N
Ever
y 2
year
s N
w
ww
.sust
aina
ble-
citie
s.org
/indi
cato
rs
ww
w.m
arib
or.si
Ever
y 2
year
s
Noi
se
Noi
se
pollu
tion
E %
po
pula
tion
expo
sed
to
Ligh
t > 5
5 dB
(A)
Mea
sure
me
nts,
calc
ulat
ions
Loca
l N
Y
Ev
ery
2 ye
ars
N
ww
w.su
stai
nabl
e-ci
ties.o
rg/in
dica
tors
w
ww
.mar
ibor
.si
Ever
y 2
year
s
Hou
sing
Su
stai
nabl
e la
nd u
se
A
% o
f pr
otec
ted
area
Mea
sure
me
nts
Loca
l N
N
Ev
ery
2 ye
ars
N
ww
w.su
stai
nabl
e-ci
ties.o
rg/in
dica
tors
w
ww
.mar
ibor
.si
Ever
y 2
year
s
Food
sa
fety
Pr
oduc
t pr
omot
ing
sust
aina
bili
ty
A
% o
f pe
ople
bu
ying
su
stai
nabl
e pr
oduc
t
Mea
sure
me
nts ,
ca
lcul
atio
ns
loca
l N
N
Ev
ery
2 ye
ars
N
ww
w.su
stai
nabl
e-ci
ties.o
rg/in
dica
tors
w
ww
.mar
ibor
.si
Ever
y 2
year
s
Oth
er –
su
stai
nabl
e man
agem
ent
Citi
zens
’ sa
tisfa
ctio
n w
ith
the
loca
l co
mm
unity
A
aver
age
satis
fact
ion
with
loca
l co
mm
unity
Que
stio
ner
– calc
ulat
ion
Loca
l N
N
Ev
ery
2 ye
ars
N
ww
w.su
stai
nabl
e-ci
ties.o
rg/in
dica
tors
w
ww
.mar
ibor
.si
Ever
y 2
year
s
Oth
er -
Sust
aina
ble m
anag
eme
nt
Sust
aina
ble
man
agem
ent
of l
ocal
au
thor
ity
and
loca
l en
terp
rises
A
% o
f en
viro
nmen
tal
Cer
tific
atio
ns o
n to
tal
ente
rpris
es
mea
sure
me
nts
Loca
l N
N
Ev
ery
2 ye
ars
N
ww
w.su
stai
nabl
e-ci
ties.o
rg/in
dica
tors
w
ww
.mar
ibor
.si
Ever
y 2
year
s

page
151
Slov
enia
N
ame:
Pet
er O
tore
pec
E-m
ail:
pete
r.oto
repe
c@iv
z-rs
.si
Add
ress
: Tru
barje
va 2
, 100
0 Lj
ublja
na
The
me
Indi
cato
r na
me
T
ype
Ope
ratio
nal
defin
ition
Pu
rpos
e us
e of
indi
cato
r G
eogr
a-ph
ical
Sc
ale
Gen
der
A
ge
Val
idat
ion
Dat
a qu
ality
D
ata
colle
ctio
n;
met
hod
and
freq
uenc
y
Dat
a co
ntro
l A
cces
-si
bilit
y R
epor
ting
Com
men
ts
Air
qual
ity
Noi
se
Was
te a
nd
cont
ami-n
ated
la
nds
Rad
iatio
n
D
rinki
ng
/Sw
imm
ing
wat
er a
nd
sani
tatio
n
wat
erbo
rne
dise
ases
Ex
E
%
popu
latio
n ex
pose
d to
ce
rtain
ha
rmfu
l m
icro
biol
ogi
cal o
r ch
emic
al
pollu
tant
s,
% o
f op
ulat
ion
with
co
nnec
tion
to p
ublic
w
ater
supp
ly
syst
ems,
w
ater
born
e ou
tbre
aks
na
tiona
l, re
gion
al
N
Y
N
wat
er q
ualit
y su
rvei
llanc
e,
wat
erbo
rne
outb
reak
s (n
otify
ing
syst
em)
N
Y
early
Food
Saf
ety
Mic
robi
olog
ical
fo
odbo
rne di
seas
es
(HFA
W
HO
)
E M
icro
biol
ogic
al
food
born
e di
seas
es
No
of
outb
reak
s,
mic
robi
olog
ica
l

page
152
food
born
e di
seas
es/1
00
000,
m
icro
biol
ogi
cal
food
born
e di
seas
es N
o of
cas
es
Che
mic
al
emer
genc
ies
Traf
fic
acci
dent
s M
orta
lity
due
to t.
a.
rate
H
ospi
talis
atio
n du
e to
t.a.
rate
A
ttend
anc
es d
ue to
t.a
. in
out-
patie
nt
heal
th
care
se
rvic
es
Atte
ndan
ces
due
to
t.a. i
n ou
t-pa
tient
sp
ecia
list
clin
ics
E Ex
E
Num
ber o
f ca
ses p
er
100.
000
inha
bita
nts
Num
ber o
f ac
cide
nts
Inju
ry
surv
eilla
nce,
plan
ning
pr
even
tive
stra
tegi
es,
polic
y ev
alua
tion
Nat
iona
l/reg
iona
l, in
divi
dual
N
atio
nal/r
egio
nal,
indi
vidu
al
Nat
iona
l/reg
iona
l N
atio
nal/r
egio
nal
Nat
iona
l/reg
iona
l/ind
ivid
ual
Y/Y
Y
/Y (1
-3, 4
-6,
7-9,
10-
14, 1
5-19
, 20-
29, 3
0-39
, 40-
49, 5
0-59
, 60-
64,
65+)
Y (I
CD
-9,
from
199
7 IC
D-1
0 us
ed)
Ever
y ye
ar
(mor
talit
y st
atis
tics,
hosp
ital
disc
harg
e re
gist
ries,
out-
patie
nt
atte
ndan
ces
data
base
)
Y
Y
Stat
istic
al
year
book
, N
atio
nal
heal
th
stat
istic
s da
taba
ses
Ever
y ye
ar
Hou
sing
O
ther
:
Y
= ye
s, N
= N
o

page
153
Swed
en
Nam
e: M
onic
a N
ordb
erg,
Ass
ocia
te P
rofe
ssor
E-
mai
l: m
onic
a.no
rdbe
rg@
imm
.ki.s
e Te
l: +4
6-8-
7287
-400
A
ddre
ss: I
nstit
ute
for E
nviro
nmen
tal M
edic
ine,
Kar
olin
ska
Inst
itute
t; B
ox 2
10, S
E-17
1 77
Sto
ckho
lm
The
me
Indi
cato
r na
me
T
ype
Geo
gra-
phic
al S
cale
A
ge
cate
gory
V
alid
atio
n D
ata
qual
ity
Dat
a co
llect
ion
Dat
a co
ntro
l D
ata
proc
ess-
sing
Acc
es-
sibi
lity
Rep
ortin
g C
omm
ent
s
Air
Ex
=
expo
sure
E
= ef
fect
A
=
actio
n
Nat
iona
l, R
egio
nal,
Loca
l, eg
ci
ty o
r pos
tal
code
PM
this
is
the
leve
l at
whi
ch d
ata
are
avai
labl
e.
Leve
l of d
ata
colle
ctio
n m
ay b
e lo
wer
(in
divi
dual
)
Dis
tinc-
tion
diff
eren
t ag
e ca
tego
ries
poss
ible
: Y
/N
Y
Y/N
(eg
inte
rnat
iona
l st
anda
rds s
uch
as IC
D u
sed
or
not)
R=
med
ical
re
gist
ry
S= su
rvey
M
o =
mod
ellin
g O
= o
utdo
or
mea
sure
men
ts
??
Y/N
(eg
diag
nosi
s, co
ding
of
dise
ases
ch
ecke
d)
EG m
etho
d.
for i
ndic
ator
ca
lcul
atio
n Th
is c
olum
n m
ay b
e de
lete
d?
Ava
ilabl
e fo
r oth
ers:
Y
/N,
nam
e w
ebsi
te o
r da
taba
se
Freq
uenc
y H
ow
Eg y
early
, w
eb
Ben
efits
Pr
oble
ms
Def
icits
R
elev
ance
fo
r pr
iorit
y ar
eas
vo
latil
e or
gani
c su
bsta
nces
NO
x, S
Ox,
03
, par
ticle
s, PA
H,
benz
opyr
en,
benz
ene,
ete
n
nu
mbe
r of
pers
ons
expo
sed
to
high
leve
ls o
f N
O2.
Ex
N
atio
nal,
Reg
iona
l, Lo
cal,
http
://w
ww
.inte
rna
t.nat
urva
rdsv
erke
t.se/
inde
x.ph
p3?
mai
n=/d
ocum
ent
s/is
sues
/mon
itor/m
onito
r.htm
so
s.se

page
154
The
me
Indi
cato
r na
me
T
ype
Geo
gra-
phic
al S
cale
A
ge
cate
gory
V
alid
atio
n D
ata
qual
ity
Dat
a co
llect
ion
Dat
a co
ntro
l D
ata
proc
ess-
sing
Acc
es-
sibi
lity
Rep
ortin
g C
omm
ent
s
nu
mbe
r of
pers
ons
expo
sed
to
high
noi
se
R
adon
Noi
se
num
ber o
f pe
rson
s ex
pose
d to
hi
gh n
oise
Ex
Th
resh
old
limit
valu
es
Was
te
Loca
l pr
ogra
ms,
Inve
ntor
y pr
ogra
ms
Per
mis
sion
Con
tam
inat
ed
land
Loca
l pr
ogra
mm
es ,
inve
ntor
y pr
ogra
ms
Per
mis
sion
Drin
king
w
ater
Reg
ulat
ed b
y ag
enci
es,
Swim
min
g w
ater
Reg
ulat
ed b
y ag
enci
es,
Rad
iati
on
Rad
on
Mon
itorin
g vi
cini
ty o
f nu
clea
r pow
er
plan
ts
Food
or
gani
c po
lluta
nts i
n m
othe
rs m
ilk
http
://w
ww
.inte
rna
t.nat
urva
rdsv
erke
t.se/
inde
x.ph
p3?
mai
n=/d
ocum
ent
s/is
sues
/mon
itor/m
onito
r.htm
so
s.se

page
155
The
me
Indi
cato
r na
me
T
ype
Geo
gra-
phic
al S
cale
A
ge
cate
gory
V
alid
atio
n D
ata
qual
ity
Dat
a co
llect
ion
Dat
a co
ntro
l D
ata
proc
ess-
sing
Acc
es-
sibi
lity
Rep
ortin
g C
omm
ent
s
H
uman
ex
posu
re to
m
etal
s and
or
gani
c po
lluta
nts
Food
m
easu
rem
ents
of
met
als i
n th
e bl
ood
of
preg
nant
w
omen
expo
sure
to
mer
cury
expo
sure
to
cadm
ium
Food
expo
sure
to
orga
nic
pollu
tant
s R
esid
ues
pest
icid
es,
PCB
, MeH
g
Hou
sin
g
Oth
er:
…
Hum
an
biol
ogy
spec
imen
ban
k to
be
used
for
stor
ing
hum
an
sam
ples
http
://w
ww
.inte
rna
t.nat
urva
rdsv
erke
t.se/
inde
x.ph
p3?
mai
n=/d
ocum
ent
s/is
sues
/mon
itor/m
onito
r.htm
so
s.se
NB
1 F
ocus
on
EH in
dica
tors
eg
num
ber o
f cas
es a
ttrib
uted
to a
ir po
llutio
n, n
oise
exp
osur
e et
c; n
umbe
r of p
eopl
e ex
pose
d to
cer
tain
pol
lutio
n le
vels
or e
xced
ance
of l
imits
N
B 2
if th
e in
dica
tor i
s not
ava
ilabl
e, a
dd in
last
col
umn
(com
men
ts) w
heth
er th
ere
is in
tere
st in
such
an
indi
cato
r

page 156
Annex III: Exemplary International and National Indicator sets
Title Project management
Funded by Information
1 Environmental Health Indicator System; WHO
WHO-ECEH, Bonn Office M. Krzyzanowski, D. Dalbokova
WHO and resources in the participating Member States
www.who.dk/EHindicators
2 ECOEHIS WHO-ECEH, Bonn Office,
EC, DG SANCO http://www.who.dk/eprise/main/WHO/Progs/EHI/Methodology/20030527_5
3 Children’s health and environment indicators
WHO-ECEH, Rome Division
WHO and resources in the participating Member States
www.who.dk/childhealthenv/Monitoring/20020802_1
4 Environmental indicators with focus on health issues
EEA D. Stanners, R. Uhel
EEA www.eea.eu.int
5 CHILD M. Rigby, L. Köhler EC, DG SANCO
EC, DG SANCO http://europa.eu.int/comm/health/ph_projects/2000/monitoring/fp_monitoring_2000_exs_08_en.pdf
6 European Community Health Indicators ECHI (I & II)
P. Kramers RIVM (NL) EC, DG SANCO
EC, DG SANCO http://europa.eu.int/comm/health/ph_information/indicators/project_indicators_en.htm http://europa.eu.int/comm/health/ph_information/documents/monitoring_projlead_en.pdf
7 Sustainable Development Project
EC, DG Environment
www.sustainable -cities.org/indicators
8 Healthy Cities Project Expert Group on the Urban Environment
EC, DG Environment
www.sustainable-cities.org/indicators
9 EEA Indicators Slovenia
10 Sustainable Development Indicators Malta
http:// home.um.edu.mt/islands
11 Sweden
http://www.miljomal.nu/english/english.php

page 157
Description of projects: 1 Project Environmental Health Indicator System WHO-ECEH, Bonn Office and participating Member States The indicator set and the methodology is published (http://www.who.dk/document/e76979.pdf) WHO List of indicators: Issue Ind. Code Ind. Title Air Quality Air_D1 Passenger transport demand by mode of transport Air_D2 Road transport fuel consumption Air_P1 Emissions of air pollutants Air_Ex1 Exposure to ambient air pollutants (urban) Air_E1 Infant mortality due to respiratory diseases Air_E2 Mortality due to respiratory diseases Air_E3 Mortality due to diseases of the circulatory system Air_A1 Policies to reduce environmental tobacco smoke exposure Housing and Settlements Hous_S1 Living floor area per person Hous_Ex1 Population living in substandard housing Hous_E1 Mortality due to external causes in children under 5 years of age Hous_A1 Scope and application of building regulations for housing Hous_A2 Land use and urban planning regulations Traffic Accidents Traf_E1 Mortality from traffic accidents Traf_E2 Rate of injuries by traffic accidents Noise Noise_E1 Population annoyance by certain sources of noise Noise_E2 Sleep disturbance by noise Noise_A1 Application of regulations, restrictions and noise abatement measures Waste and Contaminated Lands Waste_P1 Hazardous waste generation Waste_S1 Contaminated land sites Waste_A1 Hazardous waste policies Radiation Rad_E1 Incidence of skin cancer Rad_A1 Effective environmental monitoring of radiation activity Water and Sanitation WatSan_P1 Waste water treatment coverage
WatSan_S1 Exceedance of recreational water limit values for microbiological parameters
WatSan_S2 Exceedance of WHO drinking water guidelines for microbiological parameters
WatSan_S3 Exceedance of WHO drinking water guidelines for chemical parameters WatSan_Ex1 Access to safe drinking water WatSan_Ex2 Access to adequate sanitation WatSan_E1 Outbreaks of water-borne diseases WatSan_E2 Diarrhoea morbidity in children

page 158
WatSan_A1 Effective monitoring of recreational water Food Safety Food_Ex1 Monitoring chemical hazards in food: potential exposure Food_E1 Outbreaks of food-borne illness Food_E2 Incidence of food-borne illness Food_A1 General food safety policy Food_A2 Effectiveness of food safety controls Chemical Emergencies Chem_P1 Sites containing large quantities of chemicals Chem_E1 Mortality from chemical incidents Chem_A1 Regulatory requirements for land-use planning Chem_A2 Chemical incidents register Chem_A3 Poison centre service Chem_A4 Medical treatment guidelines Chem_A5 Government preparedness Workplace Work_E1 Occupational fatality rate Work_E2 Rates of injuries Work_E3 Sickness absence rate Work_A1 Statutory reports of occupational diseases 3 Children’s health and environment indicators WHO-ECEH, Rome Division and participating Member States www.who.dk/childhealthenv/Monitoring/20020802_1 Operational Definitions so far not available Core set of Indicators (last revised: December 2002) Health status indicators Mortality indicators Infant mortality rate (MR) Infant mortality under 5 (MR) RI under 5 (MR) Mortality from diarrhoeal disease under 5 (MR) External causes (under 5, 5-18) (MR) Mortality from violence and suicide (under 5, 5-18) (MR) Morbidity indicators Low birth weigth (percentage) Underweight (percentage) Stunted (percentage) Obesity Hospital admission for home accidents (0-18 years) Incidence of congenital anomalies Incidence of childhood cancer Hospital admissions for road accidents (0 -18 yrs) Exposure indicators Indoor air pollution Children exposed to biomass fuel burning

page 159
Children exposed to ETS at home Outdoor air pollution Children exposed to average yearly concentration of particulate matter (PM10) over 40 µg/m3 Poor water supply & inadequate sanitation Children living without basic infrastructure for water supply, sanitation and hygiene in day care centres, schools, and homes Inadequate dietary intake Children with adequate dietary intakes Inadequate building standards and materials Homes and schools which do not comply to safety standards for children Occupational hazards Working children under 14 Specific adverse social environments Abandoned children Institutionalized children Policy indicators (LPP = legislation, policies and programmes) Indoor air pollution LPP to make safer heating and cooking devices available to households LPP to reduce exposure of children to ETS Outdoor air pollution LPP to raise awareness about the hazards to children’s health from outdoor air pollution Poor water supply & inadequate sanitation LPP to ensure proper water supply, sanitation and hygiene in day care centres, schools, and homes LPP to improve hygienic practices among children, parents, school teachers and administrators Inadequate dietary intake LPP to improve dietary intakes Food contamination LPP to improve infant food safety Inadequate building standards and materials Ensure minimum safety standards for children in homes and schools Provision of information to parents and children to prevent home accidents Hazardous chemicals LPP to ban lead from building materials and industrial production LPP to protect pregnant women from occupational exposures Mobility and transport LPP to increase road safety LPP to promote safe mobility and physical activity Environmental emergencies LPP to increase emergency preparedness among caretakers, teachers and children Occupational hazards LPP to protect children and adolescents from hazardous working conditions Specific adverse social environments LPP to prevent abandonment and reduce institutionalisation

page 160
4 Environmental indicators with focus on health issues EEA; www.eea.eu.int
4a) Indicators related to environment and health in the EEA core set.
ST= short term, MT= medium term, LT= long term

page 161
4b) Indicators related to chemicals and hazardous substances in the EEA core set

page 162
5 Children Health Indicators of Life & Development (CHILD project) M. Rigby, L. Köhler; EC, DG SANCO; http://europa.eu.int/comm/health/ph_projects/2000/monitoring/fp_monitoring_2000_exs_08_en.pdf Class 1: Demography &Socio-economic situation (Upstream health determinants)
• Economic Circumstances
• Poverty • Parental
Education Attainment
• Single Parent Household
• Asylum Seeking
• Total Mortality • Mortality • Selected Cause-
specific Child Mortality Rates
• Infectious diseases
• Congenital Malformations
• Malignant Neoplasm (Cancer)
• Unintentional Injuries
• (Burns, Poisoning, Transport, Drowning, Suicide, Assault & Homicide, Perinatal)
• Morbidity • Incidence of Childhood Cancer
• Incidence of Childhood Diabetes
• Prevalence of Asthma
• Incidence of Specific Childhood Infectional Diseases
• Child Dental Morbidity
• Injuries • Burns • Poisoning • Fractures
Class 2: Health Status and Well-being
• Mental Health • Attempted Suicide

page 163
• Mental Health (Indicators to be developed)
• Child Abuse
• Mental Health (Indicators to be developed)
• Behavioural Disorders
• Hyperactivity • Conduct
disorders • Adolescence
depression • Adolescence
anxiety • Learning
disorders • Educational
development • Perceived well-
being • Permanent or
Severe Disability
• Parental Determinants
• Breastfeeding • Exposure to
Household Environmental Tobacco Smoke
• Parental support
• Lifestyle Determinants
• Physical Activity • Tobacco smoking • Alcohol Abuse • Substance Misuse
Class 3: Determinants of health, Risk & Protective Factors
• Other Health Determinant Factors
• Overweight/Obesity • Children in Care • Early School leavers • Pre-primary
Education Enrolment • Air pollution
Exposure of Children
• Health Systems Policy
• Health Systems Quality
Class 4: Health
systems and Policy • Social Policy
Indicators

page 164
• Transportation safety • Protection from
Exposure to Lead • Protection from
Exposure to potentially Hazardous Noise
• Reduction of Exposure to Environmental Tobacco smoke
• Play & Leisure • (to be developed)
• Access to safe facilities
• Physical Protection Policy
• Healthy Parenting • (to be developed)
• % of children whose parents have attended educational programmes

page 165
6 European Community Health Indicators ECHI project P. Kramers, RIVM (NL); EC, DG SANCO http://europa.eu.int/comm/health/ph_information/indicators/project_indicators_en.htm http://europa.eu.int/comm/health/ph_information/documents/monitoring_projlead_en.pdf The proposed set of European Community Health Indicators Class 1: Demography &Socio-economic situation
• Population • Socio-economic
factors
• Mortality • Life expectancy and related indicators
• General mortality • Cause-specific
mortality
• Morbidity • Morbidity, disease-specific
• Diseases/disorders of large impact
• Diseases selected for other reasons
• Generic health status
Class 2: Health Status
• Composite measures of health status
• Personal and biological factors
• Biological risk factors • Personal conditions
• Health behaviours • Substance use • Nutrition • Other health related
behaviours
• Physical environment • Outdoor air • Housing • Drinking water
supply • Sewage system • Ionising radiation • Noise
Class 3: Determinants of health
• Living and working conditions
• Working conditions • Physical workplace exposure
• Mental work place exposure
• Accidents related to work
• Occupational diseases

page 166
• Social & cultural environment
• Social support • Social
isolation/networks• Life events
• Prevention, health protection and promotion
• Disease prevention • Health promotion • Health protection
• Class 4: • Health
systems • Health care resources • Facilities
• Manpower • Education • Technology
• Health care utilisation • In-patient care utilisation
• Pu-patient care utilisation
• Surgical operations • Medicine use/medical
aids
• Health expenditures • /financing
• Health are system • National expenditures
on health • Expenditures • on medical services • Medical goods
dispended to out-patients
• Total health expenditure by age group
• Health expenditure by fund source
• Class 4: • Health
systems
• Health care • Subjective indicators • Health acre process
indicators • Health outcomes
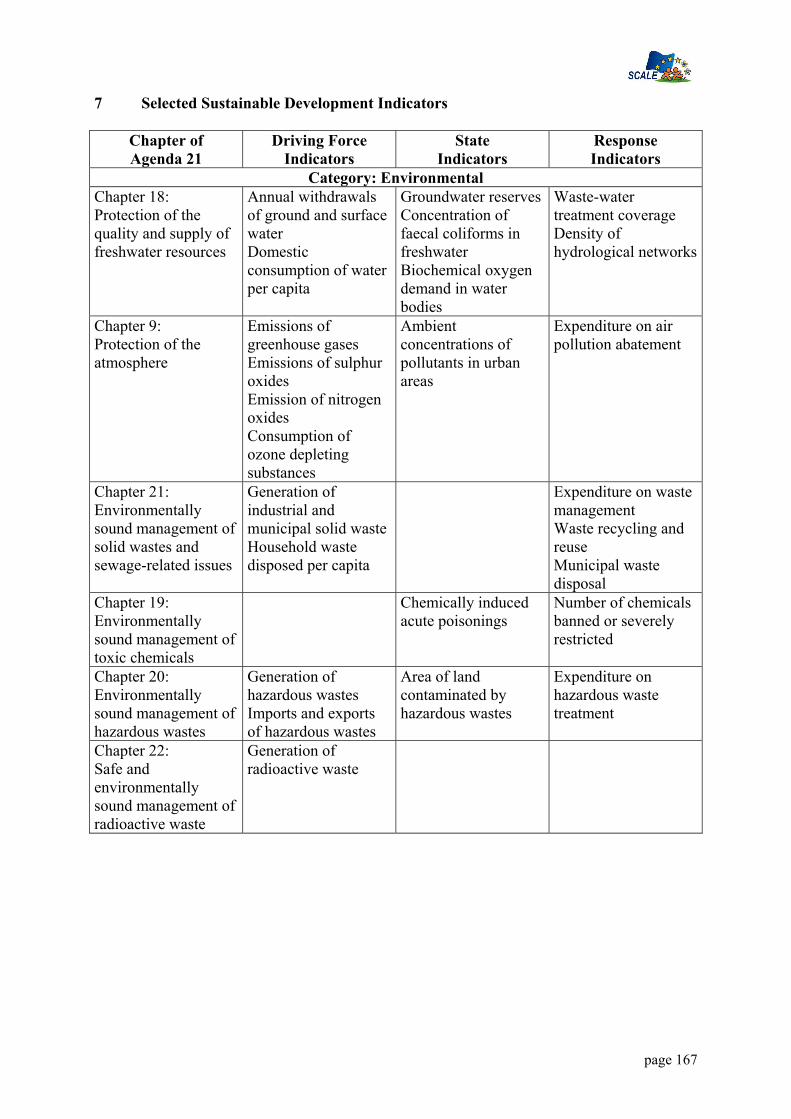
page 167
7 Selected Sustainable Development Indicators
Chapter of Agenda 21
Driving Force Indicators
State Indicators
Response Indicators
Category: Environmental Chapter 18: Protection of the quality and supply of freshwater resources
Annual withdrawals of ground and surface water Domestic consumption of water per capita
Groundwater reserves Concentration of faecal coliforms in freshwater Biochemical oxygen demand in water bodies
Waste-water treatment coverage Density of hydrological networks
Chapter 9: Protection of the atmosphere
Emissions of greenhouse gases Emissions of sulphur oxides Emission of nitrogen oxides Consumption of ozone depleting substances
Ambient concentrations of pollutants in urban areas
Expenditure on air pollution abatement
Chapter 21: Environmentally sound management of solid wastes and sewage-related issues
Generation of industrial and municipal solid waste Household waste disposed per capita
Expenditure on waste management Waste recycling and reuse Municipal waste disposal
Chapter 19: Environmentally sound management of toxic chemicals
Chemically induced acute poisonings
Number of chemicals banned or severely restricted
Chapter 20: Environmentally sound management of hazardous wastes
Generation of hazardous wastes Imports and exports of hazardous wastes
Area of land contaminated by hazardous wastes
Expenditure on hazardous waste treatment
Chapter 22: Safe and environmentally sound management of radioactive waste
Generation of radioactive waste

page 168
8 Sustainable Cities Indicator set
Indicators of Healthy Cities (European Region) Health Indicators Mortality: all causes
• Cause of death • Low birth weight
Health Service Indicators
Existence within city of inventory of self-help organisations • Existence within the city of a support
programme for self-help organisations • Existence of a city health education
programme • Percentage of six-year old children fully
immunised (having received all compulsory vaccinations)
• Number of inhabitants per practising general practitioner
• Number of inhabitants per nurse • Percentage of population covered by health
insurance • Percentage of population having access to
an emergency medical service which is less than 30 minutes away by car
• Availability of primary health care services in foreign languages
• Health information communication • Number of health questions examined by
the city council every year Environmental Indicators Atmospheric pollution
• Microbiological quality of the water supply• Chemical quality of the water supply • Percentage of water pollutants removed
from total sewage produced • Household waste collection quality index • Household waste treatment quality index • Pollution level indicator as perceived by
the population • Quantity of drinking-water used per
inhabitant per day • Relative surface area of green spaces in the
city • Public access to green spaces • Derelict industrial sites • Sport and leisure • Pedestrian streets • Cycling in city • Public transport • Public transport network cover • Living space

page 169
• Comfort and hygiene • Emergency services
Socioeconomic Indicators Number of square metres of living space per inhabitant • Percentage of population living in
substandard dwellings • Estimated number of homeless people • Unemployment rate • Work absenteeism rate • Percentage of families below the national
poverty level • Percentage of total employment provided
by the 10 most important economic activities
• Percentage of one-person households • Percentage of single-parent families • Percentage of children leaving school after
compulsory education • Illiteracy rate • Percentage of city’s budget allocated to
health and social actions • Crime rate • Percentage of dwellings for elderly people
who have emergency call facilities • Main causes for emergency calls • Percentage of young children on waiting
lists for child-care facilities • Median age of women giving birth for the
first time • Abortion rate in relation to total number of
births • Percentage of people under 18 “under
police surveillance” • Percentage of disabled people in
employment compared to total number of disabled people of working age (between 18 and 65).
Source: WHO

page 170
9 Environmental Indicators from Slovenia Following EEA indicators are executed in Slovenia
State and changes in the environment Water Water use Urban waste water treatment River water quality index Nitrates in groundwater Pesticides in groundwater Air Sulphur dioxide emissions ☺ Nitrogen oxide emissions Exceedance days of sulphur dioxide threshold values ☺ Exceedance days of ozone threshold values Ozone and climate change Consumption of ozone depleting substances ☺ Greenhouse gas emissions Soil Land use and land cover change Nitrate directive implementation Nature and biodiversity Protected areas Forest decline and tree defoliation Waste Generation of municipal waste Generation of hazardous waste Transboundary movements of hazardous waste ☺ Integration of environmental considerations into sectoral policies Agriculture, forestry, hunting and fishing Agri-environmental measures ☺ Pesticide consumption Fertiliser consumption Energy Final energy consumption ☺ Renewable electricity ☺ Transport Average age of vehicle fleet ☺ Vehicles meeting emission standards ☺ Freight transport – modal split Health Drinking water quality ☺ Bathing water quality Financing and economic instruments of environmental protection Environmental expenditure ☺

page 171
10 Malta (Blue Plan Indicators for Sustainable Development) P = Pressure, S = State, R = Response.
Theme N° Type Indicator Name 1 P Population growth rate
Demography and population 2 R Total fertility rate 3 S Women per hundred men in the labour force 4 S Human poverty index (HPI)
Standard of living, employment, social inequities, poverty,
unemployment 5 R Employment rate 6 P School enrolment gross ratio
7 S Difference between male and female school enrolment ratios
8 S Production of cultural goods
9 R Share of private and public finances allocated to the professional training
Culture, education, training, awareness improvement
10 R Public expenditure for the conservation and value enhancement of natural, cultural and historical patrimony
11 S Life expectancy at birth 12 S Infant mortality rate Health, public health 13 R Access to safe drinking water 14 P Annual energy consumption per inhabitant 15 P Number of passenger cars per 100 inhabitants 16 S Main telephone lines per 100 inhabitants
Consumption and production patterns
17 S Distribution of food consumption per income decile 18 P Urban population growth rate 19 P Loss of agricultural land due to the urbanisation 20 S Urbanisation rate
Habitat and urban systems
21 S Floor area per person 22 P Population change in mountain areas
Rural and dry areas, mountains and hinterland 23 R Existence of program(s) concerning the less
favoured rural zones 24 P Exploitation index of forest resources 25 S Forest area Forests 26 R Forest protection rate 27 P Artificialized coastline / total coastline 28 P Number of tourists per km of coastline 29 P Number of moorings in yachting harbours 30 S Population growth in Mediterranean coastal regions 31 S Population density in coastal regions 32 S Coastline erosion
Littoral and "littoralisation"
33 R Protected coastal area 34 P Oil tanker traffic 35 S Global quality of coastal waters 36 S Density of the solid waste disposed in the sea 37 S Coastal waters quality in some main “hot spots” 38 S Quality of biophysical milieu 39 R Protection of specific ecosystems
Sea
40 R Existence of monitoring programs concerning pollutant inputs

page 172
Theme N° Type Indicator Name
41 R Wastewater treatment rate before sea release for coastal agglomerations over 100 000 inhabitants
42 R Harbour equipment ratio in unballasting facilities 43 P Distribution of GDP (Agriculture, Industry, Services) 44 P Foreign Direct Investment 45 S External debt / GDP 46 S Saving / investment 47 S Public deficit / GDP 48 S Current payments / GDP
Global economy
49 S Employment distribution (Agriculture, Industry, Services)
50 P Use of agricultural pesticides 51 P Use of fertilisers per hectare of agricultural land 52 P Share of irrigated agricultural land 53 P Agriculture water demand per irrigated area 54 S "Arable land" per capita 55 S Rate of food dependence 56 S Annual average of wheat yield
Agriculture
57 R Water use efficiency for irrigation 58 P Value of halieutic catches at constant prices 59 P Number and average power of fishing boats 60 S Fishing production per broad species groups 61 S Production of aquaculture
Fisheries, aquaculture
62 R Public expenditures on fish stocks monitoring 63 P Industrial Releases into water 64 S Intensity of material use Mines, industry 65 R Number of mines and carries rehabilitated after
exploitation 66 S Turnover distribution of commerce according to the
number of employees 67 S Share of merchant services to the enterprises Services and commerce
68 R Existence of legislations on the hypermarket setting up restriction
69 P Energy intensity 70 P Energy balance Energy 71 R Share of consumption of renewable energy
resources 72 P Average annual distance covered per passenger
car 73 S Structure of transport by mode 74 S Density of the road network
Transports
75 R Share of collective transport 76 P Number of nights per 100 inhabitants
77 P Number of secondary homes over total number of residences
78 P Number of bed-places per 100 inhabitants 79 P Public expenditure on tourism development 80 P Number of international tourists per 100 inhabitants81 S Share of tourism receipts in the exportations
Tourism
82 S Currency balance due to tourism activities

page 173
Theme N° Type Indicator Name 83 R Public expenditure on tourism sites conservation
84 P Exploitation index of renewable resources 85 P Non-sustainable water production index
86 S Share of distributed water not conform to quality standards
87 S Water global quality index
88 R Share of collected and treated wastewater by the public sewerage system
89 R Existence of economic tools to recover the water cost in various sector
90 R Drinking water use efficiency
Freshwater and Wastewater
91 R Share of Industrial wastewater treated on site 92 P Ratio of land exploitation 93 S Land use change Soils, vegetation and
desertification 94 S "Arable land" change 95 P Wetland area 96 P Number of turtles catched per year 97 P Share of fishing fleet using barge 98 S Threatened species
Biological diversity, ecosystems
99 R Total expenditure on protected areas management 100 P Generation of municipal solid waste 101 P Generation of hazardous wastes 102 P Imports and exports of hazardous wastes 103 P Generation of industrial solid waste 104 S Area of land contaminated by hazardous wastes 105 S Distribution of municipal wastes 106 R Minimisation of waste production 107 R Cost recovery index of municipal wastes 108 R Destination of household wastes
Solid, industrial and hazardous waste
109 R Collection rate of household wastes 110 P Emissions of greenhouse gasses 111 P Emissions of sulphur oxides 112 P Emissions of nitrogen oxides 113 P Consumption of ozone depleting substances 114 S Frequency of excess over air standard (ozone) 115 R Expenditure on air pollution abatement
116 R Share of clean fuels consumption in total motor fuels consumption
Air quality
117 R Share of agglomerations over 100 000 inhabitants equipped with a air pollution monitoring network
118 P Number of sites with high risk 119 S Economic impact of natural disasters 120 S Burnt area per year
Natural and technological risks
121 R Existence of intervention plans
122 R Number of direct employments linked to the environment
123 R Number of associations involved in environment and/or sustainable development
Actors of the sustainable development
124 R Number of enterprises engaged in “environment management" processes

page 174
Theme N° Type Indicator Name
125 R Public expenditure on environmental protection as a percent of GDP
126 R Existence of environment national plans and/or sustainable development strategies Policies and strategies of the
sustainable development
127 R Number of Agendas 21 adopted by local authorities
International trade, Free trade zone and environment 128 P Openness rate of GDP Others Mediterranean
exchanges 129 P Net migration rate Mediterranean cooperation in the fields of environment and
sustainable development 130 R Public development assistance coming from abroad