environment report 2016-17 - northern powergrid · · 2017-10-31local homes & businesses we...
TRANSCRIPT

Environment Report 2016-17

Environment Report 1
Part 1: Introduction1 Introduction Page 21.1 Executive summary Page 21.2 Our business Page 31.3 Purpose of the report Page 4
Part 2: Environment2 Managing our environmental impact Page 52.1 Introduction Page 52.2 Visual amenity: Moving overhead lines underground to reduce their visual
and environmental impact Page 52.3 Prevention and remediation of fluid leakage Page 102.4 Carbon impact and climate change Page 11
Part 3: Innovation3 Smart grids, innovation and our role in the low carbon transition Page 163.1 Introduction Page 163.2 Progress of the innovation strategy Page 173.3 Roll-out of smart grids and innovation into business as usual Page 183.4 Providing customers with the most benefit from smart meters Page 20
Contents
Environment Report 32 Northern Powergrid
1.1 Executive summary Our strong performance in environment protection is made possible by our investment in emerging technology that continues to redefine expectations and has allowed us to confidently forecast that we will achieve even more than we anticipated over the regulatory period to 2023 in undergrounding, SF6 losses and in oil leakage. Our internal business carbon footprint continues to reduce in line with plan and our policy of installing over-sized cables has saved almost 2GWh of losses.
Our four innovation priorities of smart grids, smart meters, digital-enabled services and issues of affordability continue to be highly relevant to our stakeholders, the country’s transition to a low carbon economy, and our own transition to the role of Distribution System Operator.
As a company, we aim to improve our customers’ experience through new understanding and processes across all parts of our business – both today and in the future. This year, we’ve invested £1.4m in regulated innovation projects and made more progress on our mission to modernise our business and to roll out innovation projects into our everyday business.
Innovation has brought the equivalent of £14.6m of societal and customer benefits, and helped to deliver an enhanced level of service to our most vulnerable customers. At any point in time, we are working on an average of 15 innovation projects, building on work that’s been done across the industry, and turning our innovation strategy into action.
1.2 Our business
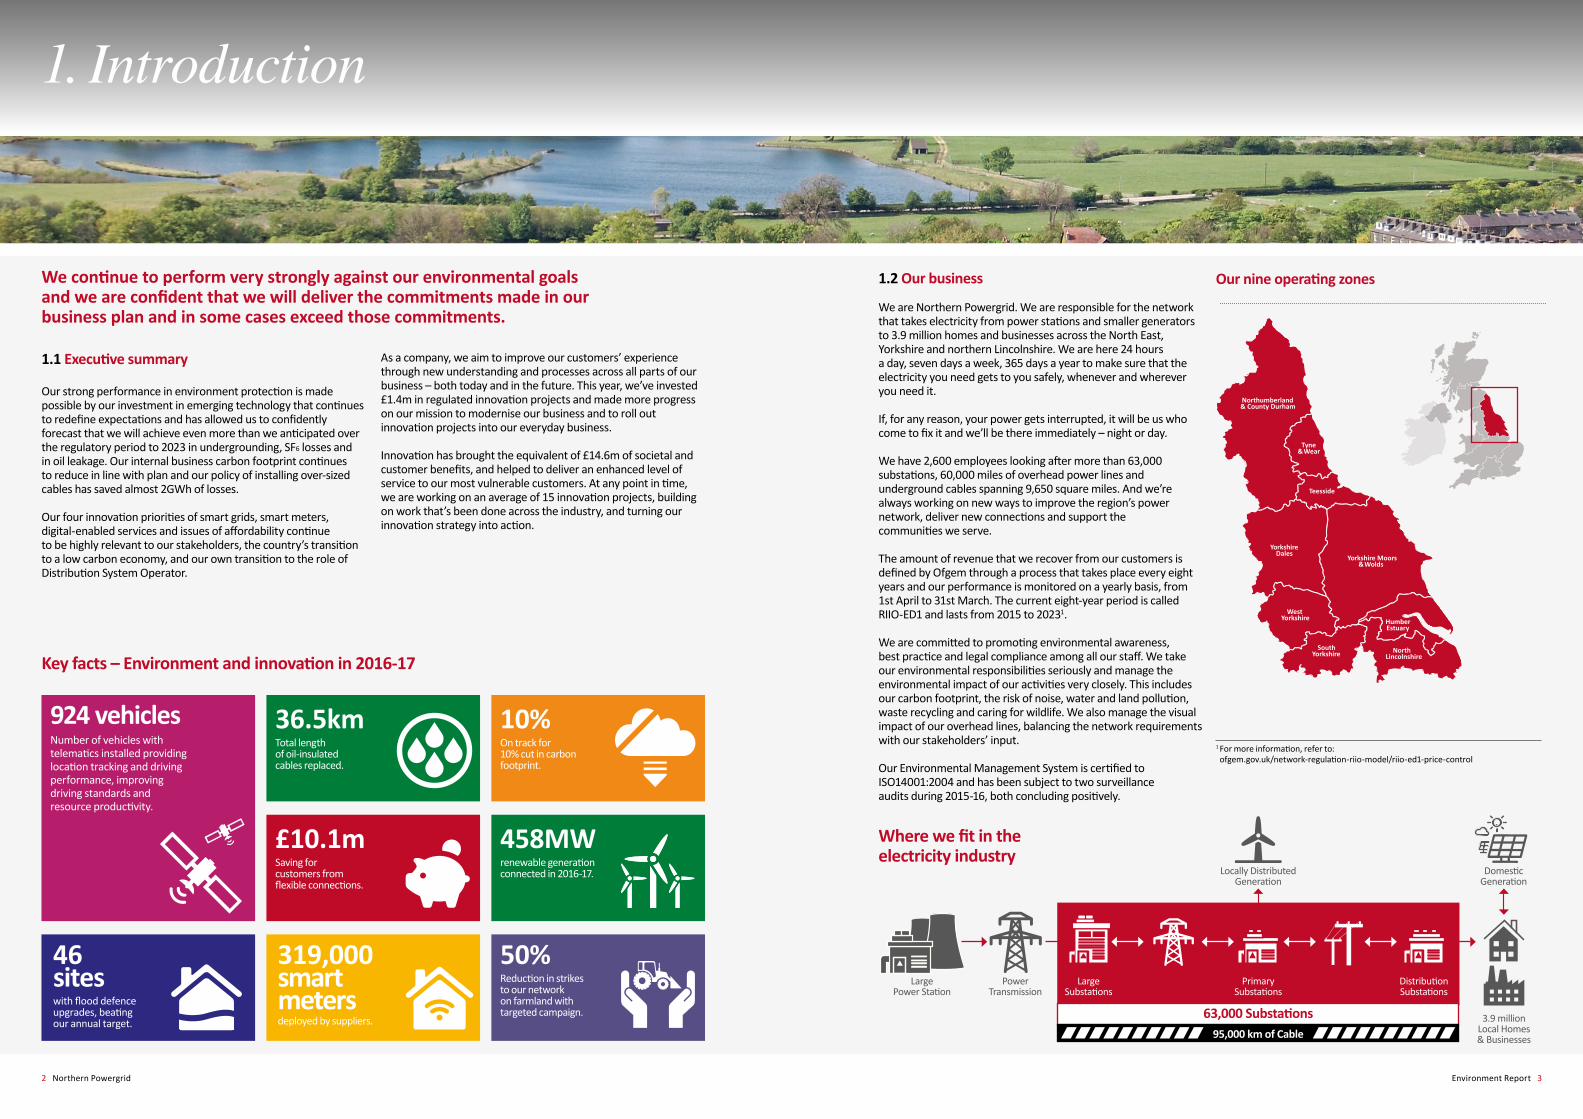
We are Northern Powergrid. We are responsible for the network that takes electricity from power stations and smaller generators to 3.9 million homes and businesses across the North East, Yorkshire and northern Lincolnshire. We are here 24 hours a day, seven days a week, 365 days a year to make sure that the electricity you need gets to you safely, whenever and wherever you need it.
If, for any reason, your power gets interrupted, it will be us who come to fix it and we’ll be there immediately – night or day.
We have 2,600 employees looking after more than 63,000 substations, 60,000 miles of overhead power lines and underground cables spanning 9,650 square miles. And we’re always working on new ways to improve the region’s power network, deliver new connections and support the communities we serve.
The amount of revenue that we recover from our customers is defined by Ofgem through a process that takes place every eight years and our performance is monitored on a yearly basis, from 1st April to 31st March. The current eight-year period is called RIIO-ED1 and lasts from 2015 to 20231.
We are committed to promoting environmental awareness, best practice and legal compliance among all our staff. We take our environmental responsibilities seriously and manage the environmental impact of our activities very closely. This includes our carbon footprint, the risk of noise, water and land pollution, waste recycling and caring for wildlife. We also manage the visual impact of our overhead lines, balancing the network requirements with our stakeholders’ input.
Our Environmental Management System is certified to ISO14001:2004 and has been subject to two surveillance audits during 2015-16, both concluding positively.
Northumberland& County Durham
Tyne& Wear
Teesside
YorkshireDales
Yorkshire Moors& Wolds
WestYorkshire
SouthYorkshire North
Lincolnshire
HumberEstuary
Our nine operating zones
Where we fit in the electricity industry
Key facts – Environment and innovation in 2016-17
1. Introduction
Locally Distributed Generation
Domestic Generation
Large Substations
PowerTransmission
Large Power Station
DistributionSubstations
Primary Substations
63,000 Substations95,000 km of Cable
3.9 million Local Homes & Businesses
We continue to perform very strongly against our environmental goals and we are confident that we will deliver the commitments made in our business plan and in some cases exceed those commitments.
1 For more information, refer to: ofgem.gov.uk/network-regulation-riio-model/riio-ed1-price-control
£10.1m Saving for customers from flexible connections.
924 vehicles Number of vehicles with telematics installed providing location tracking and driving performance, improving driving standards and resource productivity.
50% Reduction in strikes to our networkon farmland with targeted campaign.
458MW renewable generation connected in 2016-17.
36.5km Total lengthof oil-insulatedcables replaced.
10% On track for 10% cut in carbon footprint.
46 sites with flood defence upgrades, beating our annual target.
319,000smart meters deployed by suppliers.

Environment Report 54 Northern Powergrid
1.3 Purpose of the report We recognise the wider role and the impact our activity can have in the communities where our customers live and work because we live and work there too.
We believe our reputation and the trust held by our stakeholders, be they customers, special interest groups, the energy industry or partners, should be nurtured and this report shows how we turn words into deeds.
In this report we provide stakeholders with an account of what we are doing to address environmental matters including our role in the transition to a low carbon future. All year round we listen to what stakeholders tell us they would like to see from us, and they are able to read here about the progress that we have made. We describe all of our innovation activity to provide stakeholders with a single source of information, even if it is not all directly related to the environment. Included as annexes to this report are the data and information that was submitted to our regulator as part of the annual regulatory reporting cycle. This information is available on our website and accessed using the links described below.
The information presented in this report meets the guidance issued by our regulator. Significantly, the structure of the report is consistent with those produced by other Distribution Network Operators to aid comparison and cross-referencing between companies. If you have any views or additional questions, get in touch at [email protected].
Associated documents:— Annexes 1 to 7 to the Environment Report 2016-17,
October 2017 – this is a copy of our submission to the regulator and consists of data tables.
— Detailed commentary associated with the annexes to the Environment Report 2016-17, October 2017 – this is a copy of our submission to the regulator and consists of commentary associated with the data tables.
— Cost benefit analyses – these are numerous analyses that support net benefit calculations as submitted to our regulator.
All are available from northernpowergrid.com/your-powergrid/environment
— The Stakeholder Annual Report, October 2017 – this report sets out the commitments we made and our progress against them, for the main areas of the business. It is available from: northernpowergrid.com/your-powergrid.
2.1 Introduction
The impact on the environment of our activities is diverse. About a third of the total length of our cables and lines is overhead, and we work with our stakeholders to minimise the visual impact on National Parks and Areas of Outstanding Natural Beauty. Some of our cables are filled with oil, and we report here on what we’re doing to reduce the risk of leakage.
We also explain how we manage our carbon footprint, particularly that coming from our use of the SF6 gas and losses from our network. Finally, we provide an overview of our climate change adaptation plans and of how we help train our employees on these matters.
2.2 Visual amenity: Moving overhead lines underground to reduce their visual and environmental impact
Overhead electricity lines can have an impact on the appearance of the landscape and affect local wildlife. It’s our statutory duty to bear in mind the purpose of National Parks and Areas of Outstanding Natural Beauty (collectively known as ‘Designated Areas’) and conserve the biodiversity within them. We have a special programme of work dedicated to removing selected overhead lines and replacing them with underground cables in these Designated Areas. Four National Parks and five Areas of Outstanding Natural Beauty (AONB) fall either partly or entirely in our two licence areas. The lengths of overhead line within each area as of April 2017 are shown in Figure 1.
2. Managing ourenvironmental impact
Northumberland& County Durham
Tyne& Wear
Teesside
YorkshireDales
7
5
2
4
3
1
6
89
Yorkshire Moors& Wolds
WestYorkshire
SouthYorkshire
North Lincolnshire
HumberEstuary
2 These amounts include some spending associated with schemes initiated prior to April. For more information about costs and length of cables undergrounded, refer to Annex 1 (our annual submission to the regulator).
Designated area and stakeholder
Length of overhead line (km) – March 2017
1 North York Moors 1,171
2 North Pennines 718
3 Nidderdale 584
4 Yorkshire Dales 596
5 Northumberland 342
6 Howardian Hills 260
7 Northumberland Coast 83
8 Lincolnshire Wolds 445
9 Peak District 203
Total 4,402
In 2016-17 we spent £600,000 in Yorkshire and £2,240,000 in the Northeast2 and put 13km of overhead lines underground. Our total budget for the eight-year regulatory period which ends in 2023 is £14.7m and this budget is split between the Designated Areas according to how much overhead line falls within its footprint (see Figure 1). We’re on target to meet our commitment to place 100km of overhead lines underground earlier than expected (by 2021) and expect to remove 20km more than we planned in ED1 at a cost of £2 millions.
Figure 1: Designated areas in our regions
Our performance measures 2015-16actual
2016-17actual
2016-17target
Status 2017-18target
ED1target
Trend
Smart meter intervention performance n/a 86% 90% Missed 90% 90% –
* Our intervention target is based on achieving an agreed level of service on an expected defect rate of 2% of all smart meter installations. We have received twice as many defect reports than forecast but only narrowly missed our target by 4 percentage points.
Our performance measures 2015-16actual
2016-17actual
2016-17target
Status 2017-18target
ED1target
Trend
Carbon footprint excl contractors (tonnes) 25,115 23,286 24,135 Achieved – –
Carbon footprint inc contractors (tonnes) 48,761 63,966 59,104 Missed 59,500 53,730
SF6 lost to atmosphere (kg) 108 114 112 Missed 100 100
Oil loss from all sources (litres) 31,753 36,791 52,104 Achieved 51,435 45,258
Cumulative km fluid-filled cables replaced to reduce oil loss 20.4 39.9 51.0 Missed 73.6 133.6
Cumulative km overhead lines undergrounded in protected landscape
16.9 29.9 24.4 Achieved 36.6 97.9
Street works inspection compliance (%) 94% 93% >90% Achieved >90% >90%
Number of Environment Agency reportable incidents each year
9 10 28 Achieved 32 22
Environment Report 76 Northern Powergrid
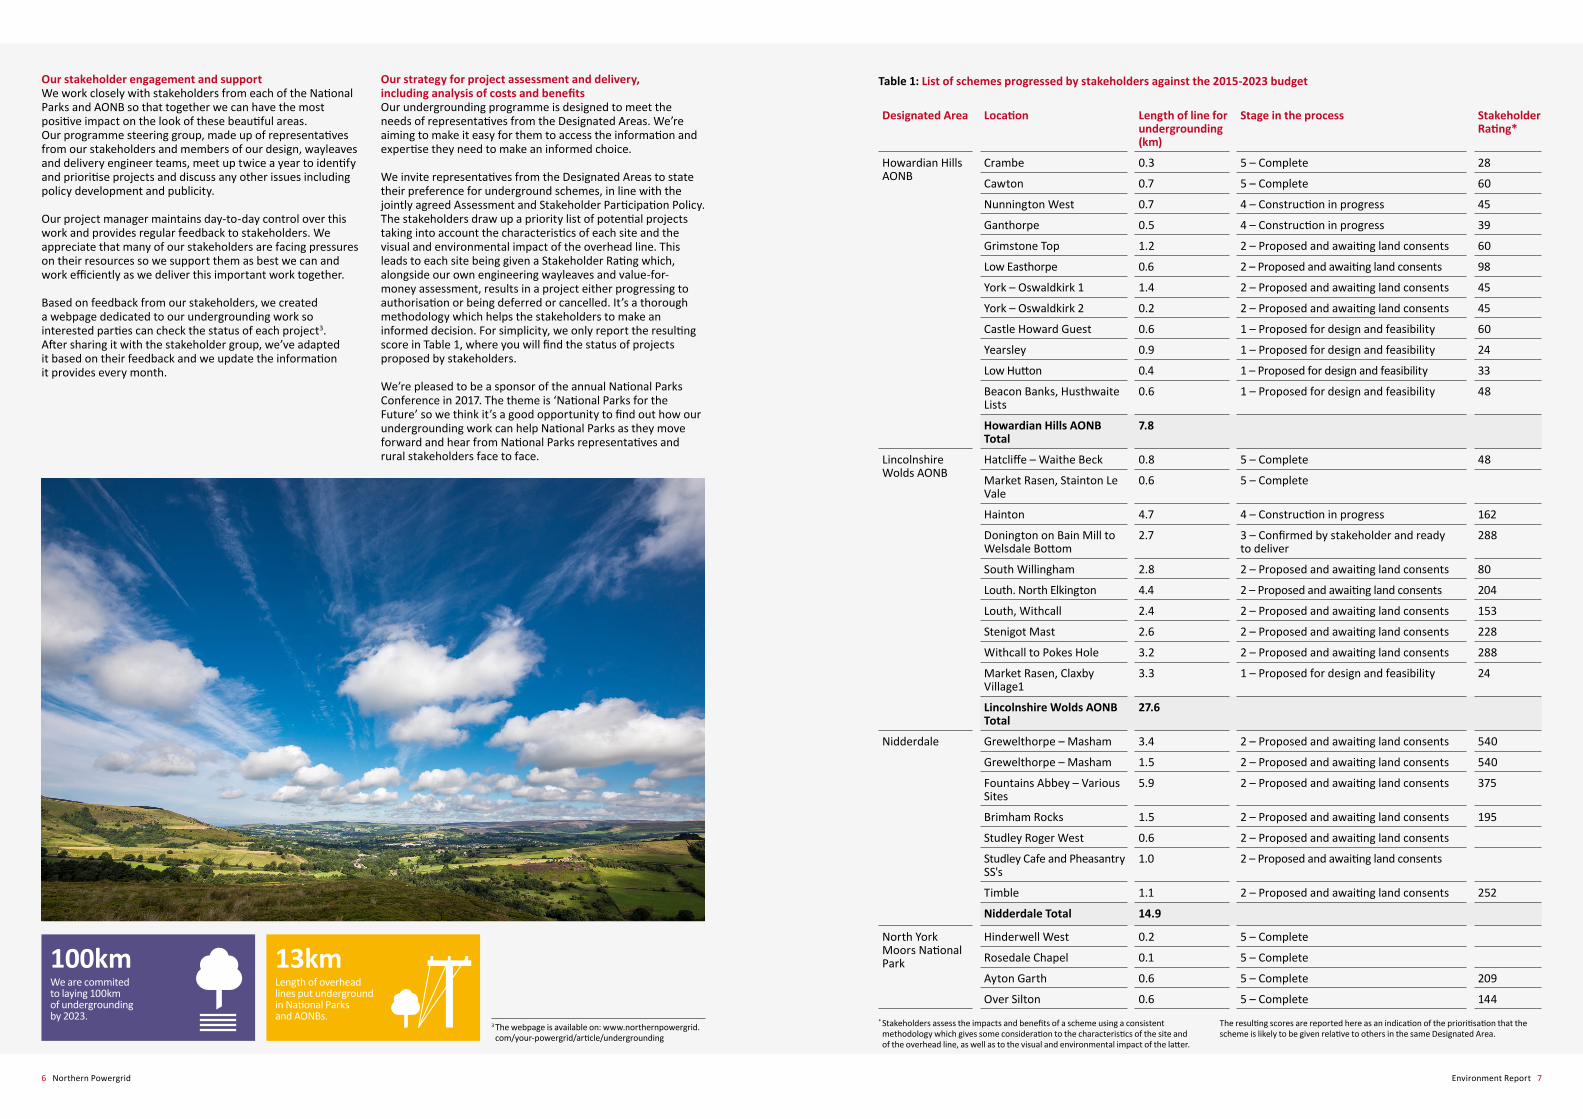
Our stakeholder engagement and supportWe work closely with stakeholders from each of the National Parks and AONB so that together we can have the most positive impact on the look of these beautiful areas. Our programme steering group, made up of representatives from our stakeholders and members of our design, wayleaves and delivery engineer teams, meet up twice a year to identify and prioritise projects and discuss any other issues including policy development and publicity.
Our project manager maintains day-to-day control over this work and provides regular feedback to stakeholders. We appreciate that many of our stakeholders are facing pressures on their resources so we support them as best we can and work efficiently as we deliver this important work together.
Based on feedback from our stakeholders, we created a webpage dedicated to our undergrounding work so interested parties can check the status of each project3. After sharing it with the stakeholder group, we’ve adapted it based on their feedback and we update the information it provides every month.
Our strategy for project assessment and delivery, including analysis of costs and benefits Our undergrounding programme is designed to meet the needs of representatives from the Designated Areas. We’re aiming to make it easy for them to access the information and expertise they need to make an informed choice.
We invite representatives from the Designated Areas to state their preference for underground schemes, in line with the jointly agreed Assessment and Stakeholder Participation Policy. The stakeholders draw up a priority list of potential projects taking into account the characteristics of each site and the visual and environmental impact of the overhead line. This leads to each site being given a Stakeholder Rating which, alongside our own engineering wayleaves and value-for- money assessment, results in a project either progressing to authorisation or being deferred or cancelled. It’s a thorough methodology which helps the stakeholders to make an informed decision. For simplicity, we only report the resulting score in Table 1, where you will find the status of projects proposed by stakeholders.
We’re pleased to be a sponsor of the annual National Parks Conference in 2017. The theme is ‘National Parks for the Future’ so we think it’s a good opportunity to find out how our undergrounding work can help National Parks as they move forward and hear from National Parks representatives and rural stakeholders face to face.
Table 1: List of schemes progressed by stakeholders against the 2015-2023 budget
Designated Area Location Length of line for undergrounding (km)
Stage in the process Stakeholder Rating*
Howardian Hills AONB
Crambe 0.3 5 – Complete 28
Cawton 0.7 5 – Complete 60
Nunnington West 0.7 4 – Construction in progress 45
Ganthorpe 0.5 4 – Construction in progress 39
Grimstone Top 1.2 2 – Proposed and awaiting land consents 60
Low Easthorpe 0.6 2 – Proposed and awaiting land consents 98
York – Oswaldkirk 1 1.4 2 – Proposed and awaiting land consents 45
York – Oswaldkirk 2 0.2 2 – Proposed and awaiting land consents 45
Castle Howard Guest 0.6 1 – Proposed for design and feasibility 60
Yearsley 0.9 1 – Proposed for design and feasibility 24
Low Hutton 0.4 1 – Proposed for design and feasibility 33
Beacon Banks, Husthwaite Lists
0.6 1 – Proposed for design and feasibility 48
Howardian Hills AONB Total
7.8
Lincolnshire Wolds AONB
Hatcliffe – Waithe Beck 0.8 5 – Complete 48
Market Rasen, Stainton Le Vale
0.6 5 – Complete
Hainton 4.7 4 – Construction in progress 162
Donington on Bain Mill to Welsdale Bottom
2.7 3 – Confirmed by stakeholder and ready to deliver
288
South Willingham 2.8 2 – Proposed and awaiting land consents 80
Louth. North Elkington 4.4 2 – Proposed and awaiting land consents 204
Louth, Withcall 2.4 2 – Proposed and awaiting land consents 153
Stenigot Mast 2.6 2 – Proposed and awaiting land consents 228
Withcall to Pokes Hole 3.2 2 – Proposed and awaiting land consents 288
Market Rasen, Claxby Village1
3.3 1 – Proposed for design and feasibility 24
Lincolnshire Wolds AONB Total
27.6
Nidderdale Grewelthorpe – Masham 3.4 2 – Proposed and awaiting land consents 540
Grewelthorpe – Masham 1.5 2 – Proposed and awaiting land consents 540
Fountains Abbey – Various Sites
5.9 2 – Proposed and awaiting land consents 375
Brimham Rocks 1.5 2 – Proposed and awaiting land consents 195
Studley Roger West 0.6 2 – Proposed and awaiting land consents
Studley Cafe and Pheasantry SS's
1.0 2 – Proposed and awaiting land consents
Timble 1.1 2 – Proposed and awaiting land consents 252
Nidderdale Total 14.9
North York Moors National Park
Hinderwell West 0.2 5 – Complete
Rosedale Chapel 0.1 5 – Complete
Ayton Garth 0.6 5 – Complete 209
Over Silton 0.6 5 – Complete 144
3 The webpage is available on: www.northernpowergrid.com/your-powergrid/article/undergrounding
* Stakeholders assess the impacts and benefits of a scheme using a consistent methodology which gives some consideration to the characteristics of the site and of the overhead line, as well as to the visual and environmental impact of the latter.
The resulting scores are reported here as an indication of the prioritisation that the scheme is likely to be given relative to others in the same Designated Area.
100km We are commited to laying 100km of undergroundingby 2023.
13km Length of overhead lines put underground in National Parks and AONBs.

Environment Report 98 Northern Powergrid
Table 1: continued Table 1: continued
Designated Area Location Length of line for undergrounding (km)
Stage in the process Stakeholder Rating*
North York Moors National Park
Farndale Lowna 0.3 5 – Complete 280
Wass 0.2 5 – Complete
Pockley 0.9 5 – Complete 108
Ellerby 1 0.4 5 – Complete 108
Ellerby 2 0.2 5 – Complete 108
Mickleby 1.4 5 – Complete 77
Danby Castle 0.3 5 – Complete 306
Newholme 0.9 5 – Complete 420
Newholme North SS 0.3 5 – Complete
Hawsker York 0.3 5 – Complete 120
Silpho 0.8 5 – Complete 126
Ainthorpe Davidson & Ainthorpe Brook
0.7 4 – Construction in progress 110
Ayton Yedmandale 0.4 4 – Construction in progress 209
Fylingdale – Hawsker Sea View
3.4 4 – Construction in progress 391
Egton Bridge West 0.8 4 – Construction in progress 168
Staithes Bank Top SS 0.5 4 – Construction in progress 272
Ainthorpe East 0.4 4 – Construction in progress 110
Cowesby 0.6 3 – Confirmed by stakeholder and ready to deliver
100
Low Dalby Beck 1.6 3 – Confirmed by stakeholder and ready to deliver
224
Dunsley village 0.4 2 – Proposed and awaiting land consents 420
Hawsker and Hawsker West 1.9 2 – Proposed and awaiting land consents 99
Port Mulgrave 2.7 2 – Proposed and awaiting land consents 238
Hawsker Summerfield 0.3 2 – Proposed and awaiting land consents 100
Danby 1.1 2 – Proposed and awaiting land consents 110
Thornton Dale Westgate 1.9 2 – Proposed and awaiting land consents 160
Low Mill South 1.0 1 – Proposed for design and feasibility 120
North York Moors National Park Total
25.3
North Pennines AONB
Westgate West SS, Bishop Auckland
0.3 5 – Complete
St Johns Chapel 0.9 5 – Complete
Newbiggin Teesdale 0.4 4 – Construction in progress
County Durham, Rookhope Village
3.5 3 – Confirmed by stakeholder and ready to deliver
County Durham, Rookhope Village
0.5 1 – Proposed for design and feasibility
North Pennines AONB Total
5.6
Northumberland Coast AONB
Howick Village 1.1 5 – Complete 144
Northumberland Coast AONB Total
1.1
Designated Area Location Length of line for undergrounding (km)
Stage in the process Stakeholder Rating*
Northumberland National Park
Ingram Village 0.3 5 – Complete 99
Rochester SS 0.9 5 – Complete 220
Barden Mill, Hexham – Twice Brewed East & West
0.4 4 – Construction in progress
Hareshaw Head – Hareshaw Cottages Td
3.5 3 – Confirmed by stakeholder and ready to deliver
216
Greenwood 0.5 1 – Proposed for design and feasibility 171
Tower Tie – Greencarts 1.4 2 – Proposed and awaiting land consents 136
Beggar Bog – Moss Kennels 0.8 2 – Proposed and awaiting land consents 176
Grindon 1.2 2 – Proposed and awaiting land consents 210
Shield Vallum – Milestone House
0.5 2 – Proposed and awaiting land consents 207
Carvoran – Thirlwell Castle 1.5 1 – Proposed for design and feasibility 253
Northumberland NP Total 13.4
Peak District NP Sheffield, Bolsterstone, Heads Lane
0.6 3 – Confirmed by stakeholder and ready to deliver
A57, EMGB Moscar 3566 – Moscar Cross Cell 6560
1.9 2 – Proposed and awaiting land consents
Sheffield, Redmires Road 2.0 1 – Proposed for design and feasibility
Peak District NP Total 4.5
Yorkshire Dales National Park
Marrick 4.0 3 – Confirmed by stakeholder and ready to deliver
216
Buckden Area. Oughtershaw – Cam Houses
4.7 2 – Proposed and awaiting land consents 390
Grassington. Old Hall 2606 – Kirk Bank 2523
2.5 2 – Proposed and awaiting land consents 260
Kilnsey Crag. Kirk Bank 2523 – Skirfare Bridge 2791
4.3 2 – Proposed and awaiting land consents 260
Keld 2.9 2 – Proposed and awaiting land consents 252
Yorkshire Dales NP Total 18.4
GRAND TOTAL 118.7
9 stakeholders National Park Authorities and Areas of Outstanding Natural Beauty stakeholders consulted.
83 schemes Undergrounding schemes being evaluated in National Parks and AONBs.

Environment Report 1110 Northern Powergrid
2.3 Prevention and remediation of oil leakage
Our targetWe are significantly ahead of our business plan commitment to reduce oil/fluid lost to ground by 15% by the end of ED1. We now forecast that oil/fluid loss will be reduced by 60% by 2023 due to our investment in new technologies such as perfluorocarbon (PFT) leak detection and self-healing cable additives.
Our strategy for reducing and mitigating the environmental impactOur management of fluid-filled cables compares well with other electricity Distribution Network Operators (DNOs) in the country, although our exposure is still high because we have more route length of fluid-filled cable in service than most other DNOs. We’re addressing this through our fluid-filled cable replacement programme: — Although our fluid-filled cable replacement programme is
slightly behind schedule, we still expect to meet out 2023 target (134km). The slow start is due to network loading and outage restrictions stopping us from being able to have the cable circuits out of service so that we could replace them. However, we have identified all of the cables that we’ll replace by 2023 which includes more cables than we originally forecasted in our business plan for ED1. Our new target is to replace 147.5km by the end of the regulatory period – 10% more than we originally planned.
The results of innovation project research into self-healing fluid additives is looking very promising and we plan to deploy this technology into the field this year: — All major GB electricity utilities have fluid-filled cable circuits
on their distribution networks. These are mostly of the low pressure fluid-filled type, typically designed to operate at 1–4 bar pressure with short-term peaking pressures up to 6 bar. Over time these cables may begin to leak cable fluid and subsequently the cable pressure may drop and the cable insulation system (fluid impregnated paper or paper-polypropylene laminate) may eventually fail. In some cases the leaks may cause environmental contamination that is of concern to the network operator, and to the public.
— This innovation research and development seeks to exploit the use of naturally occurring, environmentally friendly resins which, when added in measured quantities to the fluid in our cables, has a congealing effect around a variety of sheath defects and minor leaks, that seals the cable and prevents further fluid loss.
Our performanceIf any fluid does leak from our cables then this is considered an environmental incident and we have thorough procedures in place to report these incidents to the Environment Agency and deal with them quickly and effectively to minimise how much is lost.
Since 2012 we have been able to reduce the amount of fluid lost into the ground by 53% – this has led to a 70% reduction in the number of incidents we’ve reported to the Environment Agency. We’re working to continue to reduce the number of reportable events ahead of our phased plan and we expect the number of these incidents to keep decreasing over the rest of the regulatory period to 2023. Unfortunately 2017 got off to a bad start and January saw several circuits leaking and a third party cable strike. Since then, however, performance has been good and we’re now back on track.
In 2016-17, we set up 131 mitigation schemes which include4:— Remedial works at substations to safely remove the water
build-up from the inside of the wall that retains any oil leakage and prevents contamination of the surrounding area.
— The installation and replenishing of oil spill kits which act as a temporary ‘first aid’ solution until the leak can be resolved or the plant replaced. All our field staff working with oil-filled equipment have had spill kit training and they carry spill kits in their vehicles.
— Drainage plans for key sites so that mitigation action can be taken more quickly after an accident such as an oil spill or fire.
Looking forward, we will continue to look for new ways to improve our performance so we can try and outperform our targets. To help us achieve that, we have set a headline environmental goal to reduce the amount of oil/fluid lost in 2018 to 30,900 litres so we can outperform our ED1 commitment of a 15% reduction during the regulatory period. To make this happen, we will:— Replace another 25km of fluid-filled cable in 2018 and
continue our progress towards exceeding our commitment to replace 134km by the end of 2023.
— Continue to pre-dose selected fluid-filled cables with perfluorocarbon tracer chemicals to speed up leak locations.
— Deploy ‘self-heal’ additive to fluid-filled cable circuits in a field trial to evaluate the performance of the product.
— We have also set ourselves ambitious targets for other key measures including reducing our 2018 target for the amount of Environment Agency reportable incidents from 10 to 9.
2.4 Carbon impact and climate change
2.4.1 Business carbon footprintAlthough our internal carbon footprint continued to fall during the regulatory year 2016-17, the carbon footprint of Northern Powergrid combined with our suppliers has increased. This is because of the fuel used by mobile generators to keep homes and businesses running during power cuts and we’re looking into ways to keep doing this, while meeting our environmental goal. If we exclude the contractors’ contribution, our internal carbon footprint for 2016-17 was 23,286 tonnes, which is 7.3% lower than the previous year. We report our Business Carbon Footprint in accordance with the Greenhouse Gas Protocol as shown in Table 25.
We have been working hard to reduce our own fleet and business fuel usage through enhanced work programming and the installation of telematics systems to fleet vehicles. We believe that this explains the reduction in fleet fuel use by 100,000 litres. We have also reduced air travel by almost a third and train travel by nearly a quarter. We have reduced our depot electricity and gas use by 2% and 6% respectively in the 12 months to March 2017 by running environment awareness training for our staff and refurbishing some depots (taking the opportunity to install low energy lighting with motion sensor activation).
All these actions mean we’re firmly on track to achieve our commitment to reduce our carbon footprint by 10% by 2023. We had already achieved a 12% reduction by the end of the regulatory year 2015-16 and our comparative performance is in line with that of the other DNOs. We are working on new targets so we can continue to keep the pressure on protecting our environment.
2.4.2 Monitoring and reducing the emissions from sulphur hexafluorideSulphur hexafluoride (SF6) is an excellent electrical insulator which is widely used in high voltage equipment. However, it is also a potent greenhouse gas – one tonne of SF6 gas is equivalent to 22,800 tonnes of CO2. There is currently no economically
viable substitute to SF6 so we have no option but to continue to use it until a suitable alternative is developed by the equipment manufacturers.
The nature of SF6 means it’s important to keep the amount that leaks out of our equipment to an absolute minimum. We monitor all SF6 losses on a daily basis by measuring how much we have injected back into the equipment to replace gas which has leaked into the atmosphere. We report our SF6 gas losses as one of our environmental key performance indicators. We estimate that annually 0.33% of the total SF6 volume escapes into the atmosphere (refer to Table 36).
If we discover, either by a remote pressure alarm or on-site inspection, that some gas has leaked, then we schedule maintenance and repair work. If the leak is persistent and maintenance and repair options aren’t stopping it, we invest in replacing the equipment. In last year’s Environment Report, we explained that we were putting together a business case for the funding to replace 132kV volt equipment that was proving difficult to repair. We are pleased to report that the equipment on the Drax-Osgodby No2 132kV circuit was successfully replaced in February, helping to reduce our overall gas loss.
As we install more SF6 gas equipment and the total volume of gas increases, we have to work even harder to contain the gas within the equipment. To help us with this challenge, we have recently invested in a state of the art thermal imaging camera which is able to detect very small quantities of SF6 gas leaking from equipment. We have already used the camera to successfully pinpoint several troublesome leaks which were previously invisible and this has enabled us to maintain and repair the affected equipment. The camera will play an important role in helping to reduce our SF6 gas losses and its initial success has given us the confidence to reduce our targets by 10% for 2018 to 100kg and to continue targeting lower emissions each year thereafter.
Table 3: Summary of performance in SF6 leakage
Table 2: Our carbon footprint 2016-17
5 For more information about our carbon footprint, refer to Annex 3 (a copy of our annual submission to the regulator). 6 For more information, see Annex 2 (a copy of our annual submission to the regulator).
4 Further information is provided in Annex 2 (a copy of our annual submission to the regulator).
Greenhouse Gas Protocol classification Emissions sources Tonnes CO2e
Scope 1 – sources owned or controlled by the company Gas used for heating buildings 133
Operational travel (own fleet vehicles) 5,182
Leakage of SF6 2,591
Scope 2 – from the generation of purchased electricity, heat and steam
Electricity used in buildings 2,552
Electricity used in substations 8,985
Losses from our network 836,305
Scope 3 – all others sources Network losses from purchased electricity 1,043
Business travel (car, rail, air) 2,801
Operational travel (contractors’ fleet vehicles) 32,032
Fuel combustion (contractors’ use of small generators)
8,647
Total 900,271
Total (excluding losses from our network) 63,966
Total (excluding losses from our network and contractors) 23,286
Figure 2: Reportable environmental events Figure 3: Leaks to groundFluid lost to ground (litres)
45 2009
43 2010
38 2011
30 2012
21 2013
11 2014
9 2015
8 2016
10 2017F
61,6852009 68,404
2010
52,6252011 69,774
2012
63,4992013 44,526
2014
32,7342015 32,766
2016
31,5002017F
SF6 bank (kg) 34,030
Estimate of SF6 emitted (kg) 114
SF6 emitted as a percentage of SF6 Bank (%) 0.33

Environment Report 1312 Northern Powergrid
2.4.3 Distribution losses
What distribution losses areWhile transporting electricity, the transmission and distribution networks incur losses which amount to about 7% of electricity entering the network. These are accounted for in the energy consumer’s bill and carbon footprint. That is why reducing losses on distribution networks can have a significant effect on overall CO2 emissions for the country.
There are several types of distribution losses:— Electrical energy losses – the natural effect of wires heating
up while conducting electricity. These losses vary in proportion to the load transported and are an unavoidable consequence of the laws of physics.
— Electricity consumed by network operations – some equipment, tools and functions in our substations need a power supply to work. This is provided by the electricity transported. This is for instance the command and control equipment, and general substation facilities on site (transformer cooling fans and pumps, heating and lighting, and voltage control relays).
— Electricity theft – activity conducted by people who access an electricity supply illegally.
— Inaccuracies in metered and unmetered data – our routine meter registration processes seek to prevent and remedy any misallocated data flows to ensure that electricity use is linked to customers and their energy suppliers.
Our strategy to manage distribution losses We estimate that losses on our network amounted this year to 2,029GWh, equivalent to 836,305 tCO2e. We have a strategy in place, dedicated to monitoring and reviewing our options to reduce electrical energy losses that occur on our own network7. Our forecast is that losses will reduce by up to 9% between 2015 and 2023 thanks to the effect of the general energy efficiency improvements of our customers’ equipment, network density, transformer and cable choice and smart meters. It is important to note that the deployment of smart grids presents a more complex picture as some solutions assist loss reduction objectives, but others increase losses while delivering other benefits.
The investment profile associated with activities to reduce losses falls into two categories: ongoing programmes and one-off improvements.
The ongoing activities that we plan to implement between 2015 and 2023 are:— Implementing the policy of oversizing conductors (relative to
existing utilisation levels): We install a minimum cable size of 300mm2 at 11kV where practical (e.g. if bending radii and termination arrangements allow) and continue to install a minimum of 300mm2 mains LV cables that are of a larger capacity than the minimum size option, having taken into account capitalised electrical losses in the assessment of lifetime cost within our designs. Using larger cables to deliver electricity will help us save up to 10,500MWh, enough to power 700 homes for a year. Over the last two years, we have invested in larger electricity cables in order to reduce energy losses , and in 2016-17, this led to a saving of 1,767MWh (refer to Table 4).
— Sizing the transformer for losses: We will continue with our current distribution transformer oversizing policy for pole- and ground-mounted transformers with demand customers connected. However, for distribution transformers with dedicated solar or wind generation connected we do not oversize the transformer, as the intermittent generation profiles do not justify the cost for an increased transformer size.
— Procuring transformers with new loss specification: We will continue with our current policy to purchase transformers that have lower electrical losses than the minimum cost units available based on having taken into account capitalised electrical losses in the assessment of lifetime cost rather than simply purchase price.
Our performanceIn 2016-17, we have addressed 6 of the 14 strategies and actions recommended in our losses strategy. The remaining items are shared on Table 6. Specifically this year:— Theft reduction: We’ve entered a partnership with a new
national initiative to tackle electricity theft: Stay Energy Safe, a dedicated platform for anybody to report energy theft8. Our role is to contribute to raise awareness around the initiative, and to share background information helping to solve reported cases.
— Investment decision: We’ve carried out some additional cost benefit analysis related to losses:
• We now include separate iron and copper loss capitalised values for pole-mounted, ground-mounted and system transformers.
• For 20kV feeders, and concluded that it is not beneficial to increase the size of such cables.
7 The strategy is available in full on our website document library on www.northernpowergrid.com/document-library/ 8 More information on: www.stayenergysafe.co.uk/
Table 4: Summary of losses costs and benefits from activities in RIIO-ED1
Table 5: Summary of amount of losses activities in regulatory reporting year and estimate for the following year11
9 The Ecodesign regulation is a European legislation that imposes a maximum level of losses for transformers sold from 1st July 2015 onwards. Ecodesign aims for two major objectives on the Transformer product: 1. to reduce electrical losses and 2. to clarify and make more visible indication of performance.
10 More information, including the Cost Benefit Analysis, is provided in Annex 4 (a copy of our annual submission to the regulator).
11 We report here activities where some of the costs incurred relate to managing distribution losses, but where losses are not the principal reason for the expenditure. This excludes activities that may help to manage losses but where distribution losses are not associated with the DNO’s decision to undertake the activity and where any benefits of losses are purely coincidental (such as the product specification for new transformers, and the programme of voltage reduction which we report in Innovative Solutions). For an overview of all of our activities to reduce losses, refer to our Losses Strategy located at www.northernpowergrid.com/document-library/
Programme title
Regulatory Reporting Year 2016-17 RIIO-ED1 (2015 to 2023)
Estimated distribution losses justified costs (investment)
Estimated reduced losses due to 2016-17 investment
Reduced emissions associated with losses
Cumulative estimated reduced losses to date
£ MWh tCO2e MWh
NPgY Oversizing cables (300mm2) HV
0.3 256 105 510
Oversizing cables (300mm2) LV
0.2 301 124 706
NPgN Oversizing cables (300mm2) HV
0.2 120 49 165
Oversizing cables (300mm2) LV
0.1 121 50 386
Total 0.8 798 329 1,767
Programme title Description of unit Volumes in 2016-17 Forecast volumes in 2017-18
Oversizing cables (300mm2) HV Length (Kilometres) 166 120
Oversizing cables (300mm2) LV Length (Kilometres) 120 104
— Low loss transformers: We now procure Ecodesign Tier 1 transformers and are awaiting the Tier 2 transformer offerings from manufacturers (from 2021). Capitalised losses figures may lead us to procure more efficient transformers than Ecodesign where economic.
— Increasing transformer sizing: We have updated part of our LV design policy (Code of Practice for the Economic Development of Low Voltage Networks) to reflect new guidance around the maximum economic loading for new low-loss transformers, in line with the Ecodesign Directive9.
— Network configuration: we’ve reviewed the network design policy on the optimal loading of circuits with a view to assess the impact on losses. This led to changes to the secondary output in our network automation assessments.
— Increasing monitoring: Our newly established Smart Grid team is planning to invest in wide-spread LV board monitoring, and as part of this investment, analyse the economic benefits of power factor correction, installing harmonic filters and phase re-allocation.
Loss Discretionary RewardsIn 2016 we published our Losses Discretionary Reward submission. This document sets out the steps we are taking to better understand losses over and above our work programmes to reduce losses where practical. We will report on progress of this work in February 2018 in tranche 2 of the submission.
Tables 4 and 5 show the volume and impact of loss reduction activity in this first year of the price control period10.
The one-off activities under consideration for the period to 2023 are described in Table 6. We are interested in the views of stakeholders on the relative merits of these opportunities to improve further our understanding and management of losses.
Figure 4:The inside of a LV 300mm2 cable used to reduce losses on our network
10.5GWhsaving Using larger cables to transport electricity by 2023. This is enough to power 700 homes for a year.

Environment Report 1514 Northern Powergrid
Table 6: Losses projects under consideration
Action
Design of the energy efficient substation to be carbon neutral
We led an innovation project to gain an understanding of the electrical and thermal energy demands of EHV substations in relation to their local climate.Learning from this project may be used to develop Ecodesign solutions that reduce the net energy requirement of both existing and new substations.An immediate example of this is to review the substation building fabric specifications such that the use of higher thermal insulation levels may be incorporated into the design policy where economically beneficial.
Power factor correction Commission trial installation of power factor correction equipment at distribution substations and primary substations. Capture learning from other innovation projects to combine with our own experience with a view to establishing a firm design policy.
Power quality Commission trial installation of harmonic filters at distribution substations and primary substations as part of innovation projects with a view to gaining experience and establishing a firm design policy.
Load imbalance Commission trial installation of equipment to improve phase imbalance as part of innovation projects with a view to gaining experience and establishing a firm design policy.
Loss measurement Commission trial installation of equipment to improve phase imbalance as part of innovation projects with a view to gaining experience and establishing a firm design policy.
Superconductors Monitor the development of low temperature superconductors and research projects (such as WPDs Superconducting Cables project) in the next regulatory period. Pursue the most promising developments via innovation projects to understand their potential exploitation.
Voltage reduction at night No action as unlikely to reduce losses but watching brief on ENWL project.
Switching out under-utilised plant Investigate the effects of frequent switching off plant and how network performance will be affected once our new Network Management System is implemented and incorporate findings into our operational policies.
2.4.4 Climate change adaptationThere is a strong consensus that the UK’s climate is changing and that weather events which we currently consider to be ‘extreme’ will become the norm. The climate change that will occur in the medium term has already largely been determined by greenhouse gas emissions so we need to get ourselves ready to deal with the effect this will have on our weather patterns.
From flood defences and vegetation management, to improved weather prediction systems and increased staff availability, we’ve developed a climate change adaptation strategy12 that outlines the impact that we anticipate climate change will have on our business and, most importantly, how we propose to tackle it. In 2016-17, our region suffered three declared major incidents, where localised lightning, heavy rain and strong wind caused power cuts to our customers.
We have committed to making our network more resilient to flooding by investing £40m in improving flood defences by 2023 and building 141 new permanent flood defences in that time. This year, we delivered flood defences at 46 sites, beating our annual target of 42. Although we delivered less than we’d aimed for last year, we are now ramping up activity, so that we can exceed the target from our business plan and deliver defences to 141 sites during the eight-year regulatory period ED1 (refer to Table 7).
Table 7: Annual number of permanent flood defences installed
Following several severe weather incidents in 2015-16, this year we sought views about business resilience and the impact of extreme events on Small and Medium-Sized Enterprises (SMEs). We surveyed 100 SMEs and found they needed more information and advice. Our next step was to work with emergency responders, our online community and the Federation of Small Businesses to develop and test relevant guidance. As a result:— We published a guidance document aimed at small
businesses13 helping them to deal with power cuts and updated our written advice for customers facing flooding14.
— We organised a co-ordinated cross-utility resilience-themed Community Week of advice and events through our Infrastructure North partnership15.
This year, we’ve also worked with local authorities including Leeds, Hull, York and Calderdale to compare notes on flood defence investment and help shape their flood risk infrastructure plans.
In 2016, the Government commissioned a National Flood Resilience Review to assess how the country can be better protected from future flooding and increasingly extreme weather events. As the provider of a key infrastructure within the scope of the review, we supported this by providing information on the flood risk, impacts, existing and proposed flood defences for our major substations (those which provide supplies to 10,000 customers or more). We’re continuing to work with government and industry partners to review the standard for major substation flood resilience and will update our ongoing programme of building flood defences in line with any revision.
Also during 2016 we took part in an innovative cross-sector project, run by the Infrastructure Operator’s Adaptation Forum, co-ordinated by the Environment Agency, to assess our organisational capacity for climate adaptation. The project concluded that our adaptation programme is ahead of the field and we were given some areas to focus on going forwards, which we are now looking at.
2.4.5 Engaging our employeesAll of our employees receive formal training on caring for the environment. To bring our environmental policy to life we have appointed Environmental Champions, who play an important part in delivering our environmental objectives, shaping our improvement plans and communicating with stakeholders across our sites. We’re still in the early days of this initiative which aims to raise awareness, share learning of good practice and encourage local accountability for environmental issues at each of our sites. Some of the champions have already put forward ideas for initiatives they could trial or support roll-out around including:— Introducing food waste caddies to recycle in our key sites
– we’ve already put this in place in two of our main sites;— Creating natural habitats at local sites to support our
commitment to the national bee pollinator strategy;— Increasing the capacity and capability of our people by
continuing to expand the ‘Environment Champions’ group, promoting environmental volunteering opportunities.
12Available from: northernpowergrid.com/asset/0/document/2032.pdf13Available from: northernpowergrid.com/asset/0/document/2793.pdf14Available from: northernpowergrid.com/asset/0/document/1004.pdf15More on this partnership on: infrastructurenorth.co.uk/safewarmincontrol/
2016-17 Actual
2017-18 Target
2015-2023 Cumulative
2015-2023 Target
46 31 55 141
Environment Report 1716 Northern Powergrid
16 This benefits calculation builds on Ofgem’s Cost Benefit Analysis tool and reflects the monetised value of avoided costs to the network operator, to our customers and the societal benefits. CBA tables are published on: www.northernpowergrid.com/your-powergrid/environment
17 For more information, refer to Annex 7 (a copy of our annual submission to the regulator).
3.1 Introduction
Developing our innovation portfolioAs a company, we aim to improve our customers’ experience through new understanding and processes across all parts of our business – both today and in the future. This year, we’ve made more progress on our mission to modernise our business and rolled out innovation projects into our everyday business, bringing the equivalent of £14.6m of benefits to our customers and society16. We’re currently working on around 15 innovation projects, building on work that’s already been done in the industry, to help us deliver our innovation strategy.
Changing markets and system operationGovernment policy has had a big effect on electricity generation this year including scaling back feed-in tariffs and renewable heat incentives. There has been more extra-high voltage (EHV) generation (such as solar farms) but less small-scale generation than was forecasted. Take-up up of electric heating and electric vehicles has also been behind forecast and it’s difficult to predict the scale of the introduction of new technology. It’s important for us to stay flexible and keep our options open to manage the uncertainty. One of the things we can do to prepare for the future is to plan out the transition from our current status – Distribution Network Operator (DNO) – to becoming a Distribution System Operator (DSO).
Smart meter foundationsAlthough energy suppliers are leading the roll-out of smart meters, network companies have an important role to play supporting the roll-out and using smart meters as the foundation of a future smart grid which will deliver an improved service for our customers. We’ve achieved our industry milestones this year and started modifying our business processes to deliver the most benefits for our customers. You can read more about this in section 3.4.
Drivers and prioritiesOur commitment to operational excellence and customer service means that we are always looking for better ways to do things, at a reduced cost for our customers. Our role is to provide the electrical infrastructure for the future and as the UK energy landscape changes to meet carbon reduction targets, new demand for renewable electricity, electric vehicles and heat pumps is placed on our network. We need to manage the network so it continues to provide a secure supply of electricity.
Developing trends present both challenges and opportunities for the electricity system and we keep it under review to make sure our approaches and priorities remain appropriate. Changes are driven by technological advances and the need to reduce carbon:— Customer engagement – our priorities need to be linked to
those of our customers.— Security of supply and cost remain a top priority.— Local and intermittent generation – driven by incentives for
renewables and placing new demands on the system.— Decarbonisation of heat and transport – a heat pump or an
electric vehicle charger can double the peak load on a domestic property with most impact when clustered in the same location on the network.
— Digitisation – the pace of technological change is leading to a rapid increase of data and functionality to engage customers in an actively managed network.
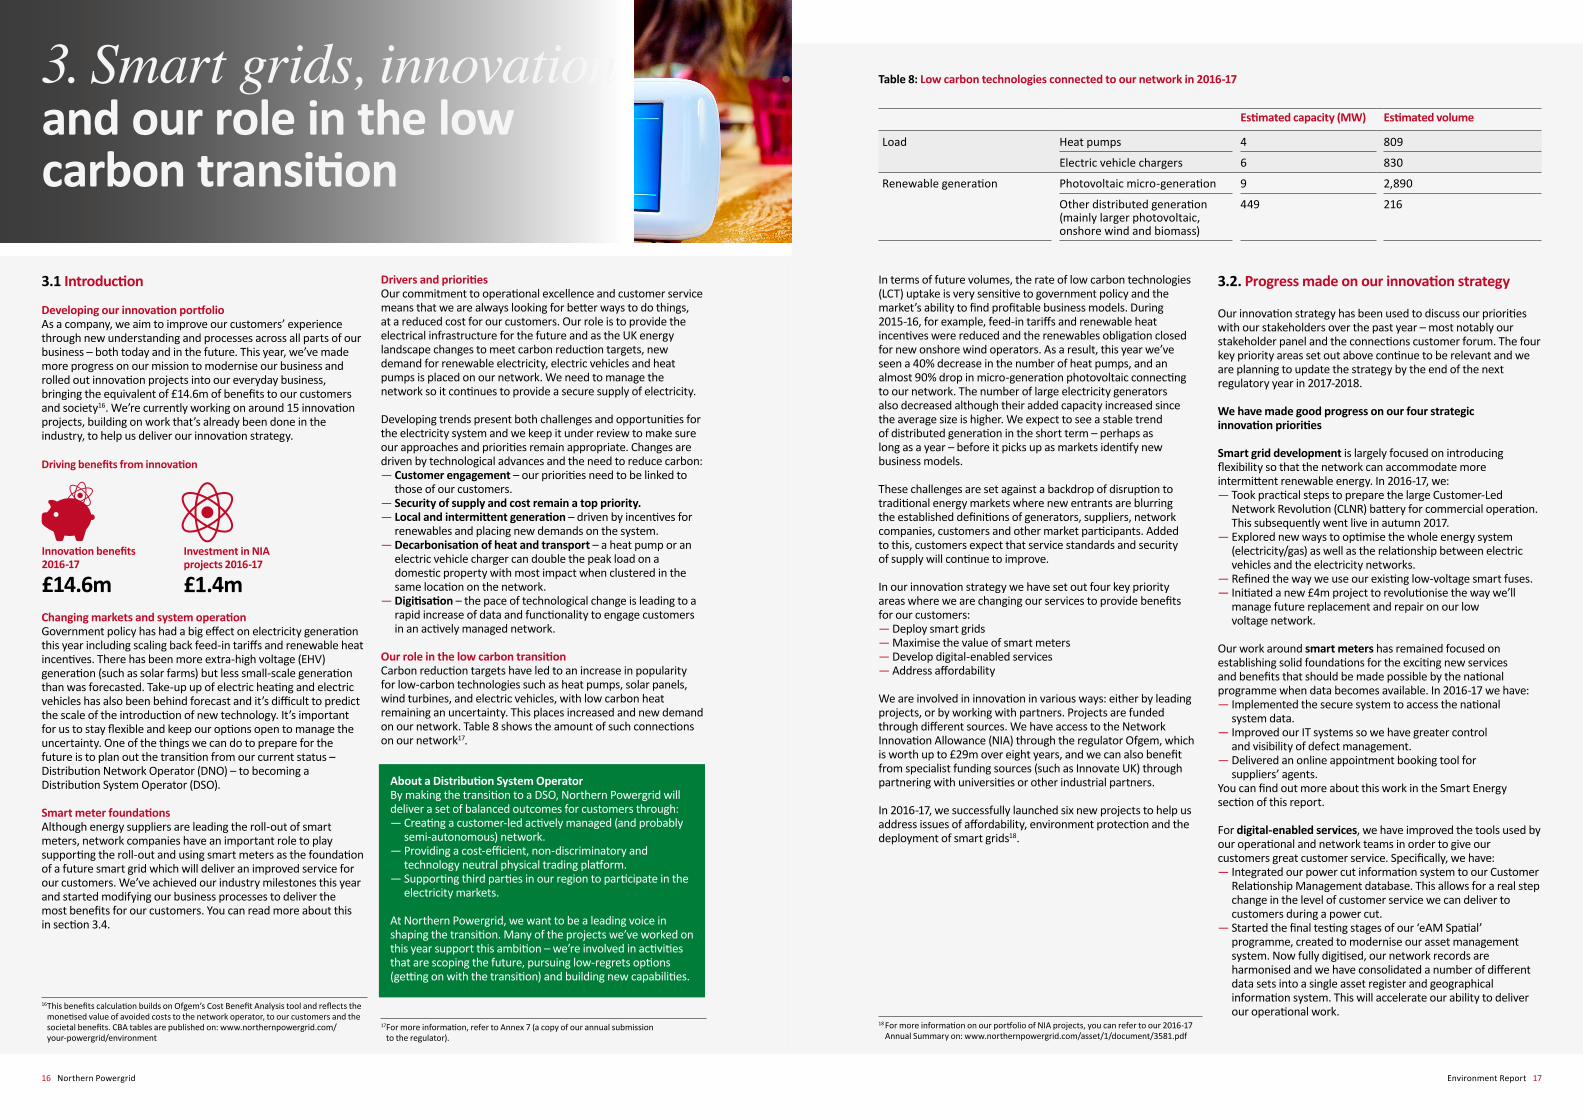
Our role in the low carbon transition Carbon reduction targets have led to an increase in popularity for low-carbon technologies such as heat pumps, solar panels, wind turbines, and electric vehicles, with low carbon heat remaining an uncertainty. This places increased and new demand on our network. Table 8 shows the amount of such connections on our network17.
18 For more information on our portfolio of NIA projects, you can refer to our 2016-17 Annual Summary on: www.northernpowergrid.com/asset/1/document/3581.pdf
Table 8: Low carbon technologies connected to our network in 2016-17
In terms of future volumes, the rate of low carbon technologies (LCT) uptake is very sensitive to government policy and the market’s ability to find profitable business models. During 2015-16, for example, feed-in tariffs and renewable heat incentives were reduced and the renewables obligation closed for new onshore wind operators. As a result, this year we’ve seen a 40% decrease in the number of heat pumps, and an almost 90% drop in micro-generation photovoltaic connecting to our network. The number of large electricity generators also decreased although their added capacity increased since the average size is higher. We expect to see a stable trend of distributed generation in the short term – perhaps as long as a year – before it picks up as markets identify new business models.
These challenges are set against a backdrop of disruption to traditional energy markets where new entrants are blurring the established definitions of generators, suppliers, network companies, customers and other market participants. Added to this, customers expect that service standards and security of supply will continue to improve.
In our innovation strategy we have set out four key priority areas where we are changing our services to provide benefits for our customers:— Deploy smart grids — Maximise the value of smart meters — Develop digital-enabled services — Address affordability
We are involved in innovation in various ways: either by leading projects, or by working with partners. Projects are funded through different sources. We have access to the Network Innovation Allowance (NIA) through the regulator Ofgem, which is worth up to £29m over eight years, and we can also benefit from specialist funding sources (such as Innovate UK) through partnering with universities or other industrial partners.
In 2016-17, we successfully launched six new projects to help us address issues of affordability, environment protection and the deployment of smart grids18.
3.2. Progress made on our innovation strategy
Our innovation strategy has been used to discuss our priorities with our stakeholders over the past year – most notably our stakeholder panel and the connections customer forum. The four key priority areas set out above continue to be relevant and we are planning to update the strategy by the end of the next regulatory year in 2017-2018.
We have made good progress on our four strategic innovation priorities
Smart grid development is largely focused on introducing flexibility so that the network can accommodate more intermittent renewable energy. In 2016-17, we:— Took practical steps to prepare the large Customer-Led
Network Revolution (CLNR) battery for commercial operation. This subsequently went live in autumn 2017.
— Explored new ways to optimise the whole energy system (electricity/gas) as well as the relationship between electric vehicles and the electricity networks.
— Refined the way we use our existing low-voltage smart fuses.— Initiated a new £4m project to revolutionise the way we’ll
manage future replacement and repair on our low voltage network.
Our work around smart meters has remained focused on establishing solid foundations for the exciting new services and benefits that should be made possible by the national programme when data becomes available. In 2016-17 we have:— Implemented the secure system to access the national
system data.— Improved our IT systems so we have greater control
and visibility of defect management.— Delivered an online appointment booking tool for
suppliers’ agents.You can find out more about this work in the Smart Energy section of this report.
For digital-enabled services, we have improved the tools used by our operational and network teams in order to give our customers great customer service. Specifically, we have:— Integrated our power cut information system to our Customer
Relationship Management database. This allows for a real step change in the level of customer service we can deliver to customers during a power cut.
— Started the final testing stages of our ‘eAM Spatial’ programme, created to modernise our asset management system. Now fully digitised, our network records are harmonised and we have consolidated a number of different data sets into a single asset register and geographical information system. This will accelerate our ability to deliver our operational work.
Estimated capacity (MW) Estimated volume
Load Heat pumps 4 809
Electric vehicle chargers 6 830
Renewable generation Photovoltaic micro-generation 9 2,890
Other distributed generation (mainly larger photovoltaic, onshore wind and biomass)
449 216
3. Smart grids, innovation and our role in the low carbon transition
Driving benefits from innovation
Investment in NIA projects 2016-17
£1.4m
Innovation benefits 2016-17
£14.6m
About a Distribution System Operator By making the transition to a DSO, Northern Powergrid will deliver a set of balanced outcomes for customers through:— Creating a customer-led actively managed (and probably
semi-autonomous) network.— Providing a cost-efficient, non-discriminatory and
technology neutral physical trading platform.— Supporting third parties in our region to participate in the
electricity markets.
At Northern Powergrid, we want to be a leading voice in shaping the transition. Many of the projects we’ve worked on this year support this ambition – we’re involved in activities that are scoping the future, pursuing low-regrets options (getting on with the transition) and building new capabilities.

Environment Report 1918 Northern Powergrid
— Delivered an innovation project to improve how well we can forecast customer electricity use, based on roll-out scenarios for electric cars, heat pumps and distributed generation. We are now in the process of finding out how we can adopt this tool in our normal working methods.
Affordability work has focused on cheaper supply models for electricity customers. In 2016-17, we have: — Funded a new domestic storage project to show how clusters
of home batteries can increase capacity on the electricity network, allow more social housing to install solar panels and create savings for the tenants. This has resulted in the Distributed Storage and Solar Study innovation project19 in social housing in Barnsley where solar PV is part of the council’s strategy to fight fuel poverty.
— Stimulated and contributed to research work on new business models for local supply (with Cornwall Energy, APSE Energy and some of our local authorities). This culminated in an event organised as part as Community Energy Fortnight 2017, and informed by high-class speakers20.
3.3 Roll-out of smart grids and innovation into business as usual
Delivering innovative change is the only way we can continue to serve our customers and deliver the outcomes they value. This means that when we’re considering innovation, our focus is as much on delivering change as it is on opening trials. Innovation comes through a variety of routes – from changes to how we run our business every day to collaborating with external parties and delivering projects we have funded through a variety of rates.
3.3.1 Innovative solution deployed: Turning innovation into business as usualInspired by new ideas promoted by third parties or by other network operators, and basing our decision on cost-benefit assessments, we deploy new solutions as standard practice. In 2016-17, we’ve deployed (or continued to deploy) 10 such solutions, and report on them in Table 921. The value of these projects is estimated at £14.6m.
3.3.2 Innovation in connectionsThe connection of renewable energy was one of our main focus areas again this year and we’ve connected a further 458MW. Our innovation in this area has progressed in three directions, as set out in table 9.
Releasing connections capacity There is the potential to recover some of the underused capacity from half-hourly metered customers if these customers are confident that they won’t need it in future. This can release capacity for use by other connectees and also save the customer money through reduced capacity charges. In 2016-17 we contacted a total of 170 customers including all EHV and HV generators who used less than 75% of their capacity. We received 79 responses and recovered an additional 18MW of export capacity from four customers.
Voltage reductionWe’ve continued to roll out our voltage reduction initiative at primary substations at a further 85 sites, creating an extra 765MW of headroom for new micro-generation.
Flexible connectionsDuring 2016-17, we started work for the connections of 152MVA of generation on constrained connections agreements, at four schemes in Yorkshire. This meant we could connect an additional 22MVA and avoided £10.1m of reinforcement costs for the connectees.
We currently have over 700MW of active network management (ANM) operational. There were no new ANM multi-generator constraint management schemes connected in 2016-17 but a new replicable ANM solution continues to be developed in the Driffield area and we have quoted five next generation customers for connection to this scheme. If accepted by the customers in this area, we could be commissioning these new connections from 2018 and releasing further benefits at that time.
Battery storageBattery storage is increasingly popular with our customers, and this year we quoted 7,300MW worth of new connections. Volumes for next years are expected to be much higher. It is a really useful source of flexibility that adds value to the customer and has a key role to play in the future of the energy system. We facilitate the introduction of this new type of energy asset by providing guidance to our customers, and by getting familiar ourselves with the provision of dynamic frequency response services, as we start a one-year contract with National Grid using a 2.5MW unit, installed in Darlington.
3.3.3 Rolling out the smart gridIn order to pre-empt the high levels of growth in LCTs that we expect beyond 2023, we invest in enabling technology such as modern communications and control equipment. This lays the foundations of a smartgrid, on which we expect to spend a total of £83m up to 2023. Our Smart Grid Implementation team is getting started on the procurement and design phases for three important areas:— Substation control units (to make them compatible
with a modern digital communication system).— Primary communications network.— Transformer control units.
Innovative solution deployed (benefiting operational outcome)
Estimated benefits and impact 2016-17, resulting from the deployment
Deployment volumes 2016-17
Estimated deployment volumes 2017-18
Relevant innovation trial (when applicable)
Increase Network Capacity, Optimise Utilisation (Connections)Releasing capacity – generation and demand Voluntary renegotiation of connection agreements with EHV and HV customers which are not using their reserved capacity.This reduces the capacity charges for those willing to renegotiate and releases capacity to connect other customers, avoiding network reinforcement.
Freed generation capacity: 18MVA
4 agreements successfully renegotiated
7 N/A
Voltage reduction at primary Lowering the voltage on the HV networks creates headroom for the connection of rooftop solar panels on the LV system which would otherwise cause the voltage to rise above the upper statutory limit for penetrations greater than 30%.
Freed LV generation capacity: 765MVA
Deployed to 85 substations
20 Customer-Led Network Revolution, Northern Powergrid and Voltage Reduction Analysis project, WPD
Improve Connection Performance (Connections)Flexible connection agreements for generators Generation customers are offered an alternative connection quotation at a lower cost in exchange for occasional constraints on their export.
Facilitated connection capacity:22MVAGross avoided costs: £10.1m
4 customers accepted offer
4 N/A
Improve Asset Life Cycle ManagementTransformer insulating oil online regeneration Treatment of the oil used as an insulator in a transformer to remove any acidity and moisture which extends its life.
Gross avoided costs: £0.3m Deployed at 3 substations
6 N/A
Improve Network Performance (Reliability and availability)LV technology programmeA proactive approach to LV network intermittent faults by using new technology which will automatically restore intermittent faults and locate faulty kit.
Avoided customer minutes lost: c. 3.4 millionAvoided customer interruptions: c. 35,400Gross avoided costs: £0.2m
424 units deployed
No new units, re-deployment of existing instead
The Smart Fuse, ENW
Automatic Power Restoration System (APRS) Identifies the location of faults on the HV network and speeds up resolution.
Avoided customer minutes lost: c. 219,400Avoided customer interruptions: c. 42,000
Deployed to 41 substations
42 N/A
Improve Safety (Safety)Telematics in operational vehiclesKeeps track of the driver’s location and speed.
Carbon reduction: 280tCO2eGross avoided costs: £0.1m
110 vehicles All fleet now equipped – new deployment on new vehicles only
N/A
Fire retardant workwear This workwear provides arc-flash protection to our operational employees who work on the electricity distribution system.
Avoided serious injuries: 13 Gross avoided costs: £0.1m
1,600 employees
All staff now equipped
N/A
Farm safety communication campaign New ways of communicating with the farming community on safety issues to try to reduce the number of accidental contact incidents between farm machinery and our high voltage overhead lines.
Avoided customer minutes lost: c. 235,000Avoided customer interruptions: c. 2,300Avoided fatality: 13 every 100 yearsAvoided serious injuries: 7.5 every 100 yearsGross avoided costs: £0.01m
Communication campaign deployed at 7 shows
7 shows N/A
Improve Environmental Impact (Environment)Fluid-filled cable leak detection by perfluorocarbon tracer Method to locate, with improved precision, a leak in our cables.
Avoided oil leakage: c. 9,750 litresGross avoided costs: £1m
Deployed on 6 circuits
8 circuits N/A
Table 9: Innovative solution deployed
19 For more information on the actual volumes, refer to Annex 7 (a copy of our annual submission to the regulator), and to the ‘Detailed commentary associated with the annexes’ for more information on our view of future trends.
20 We published an summary outcome of the debate on: www.northernpowergrid.com/your-powergrid/article/reporting-back-from-our-local-supply-event
21 For more information on the cost and benefit analysis that guide our investment decisions, see Annex 6 (a copy of our annual submission to the regulator of related information). For more information on network innovation projects, refer to www.smarternetworks.org/
805MVA Generation headroom created by rolling out innovation solutions in connections.
£

Environment Report 2120 Northern Powergrid
3.4. Providing customers with the most benefit from smart meters
We expect the first smart meters to be connected to the central meter reading services in Q42017. Our goal through 2016-17 has been to ensure we have our system in place and our people ready to start delivering a better service to our customers from the first days of these meters being connected, and we are close to achieving that goal25.
3.4.1 Progress towards mass roll-outThe roll-out of ‘foundation stage’ smart meters has begun and we expect it to pick up pace over the next few years up to five times its current rate. We’re continuing to support the roll-out of smart meters, in line with our business plan commitments and our strategy (see Figure 4).
Delays with the central meter reading systems on the smart meter programme mean that the information generated by smart meters, which we’ll use to improve our network performance, isn’t available yet. This year we’ve been focusing on getting our system and processes ready for the roll-out, in line with our strategy for using smart meter data.
Table 10: Smart meter installations 2016-17
3.4.2 Supporting the roll-outThe roll-out of the smart meters is being led by energy suppliers, but Distribution Network Operators (DNOs) have an important role in delivering them and setting up the two-way communications with the smart meters through an IT Gateway, to make sure customers get all the possible benefits from the smart meters. We have:— Improved our systems so we can see and manage defects
better. We now process industry data flows within our Customer Relationship Management (CRM) system so we can assign work efficiently to our service providers, comply with new regulatory reporting requirements and keep customers updated via their preferred communication method.
— Created an online appointment booking tool for suppliers’ agents. The meter installer can now arrange for defects to be dealt with directly with our service provider with the customer’s agreement, allowing the installer to co-ordinate their return and avoid unnecessary disruption for customers.
— Delivered defect repairs at customer premises in line with agreed industry service level agreements.
Safety, planning and innovation underpin our approach to collaborating with energy suppliers and meter operators in order to make sure the UK’s smart meter roll-out runs as smoothly as possible in our region.— Last year, we authorised just over 600 meter operator
installers to work safely on our equipment, over 400 of them having been accredited at our own training facilities.
— When meter operatives encounter an issue meaning installation cannot go ahead on the initial visit, we’ve ensured that we’ve got the manpower in place to resolve the defect as soon as we can.
— We want to give our customers a great experience if they encounter Northern Powergrid in the installation process so we have developed a new, industry-leading web-based appointments system that allows installers to book an appointment at the customer’s convenience so the defect can be resolved. Suppliers are already showing a keen interest in this online facility.
Northeast Yorkshire Northern Powergrid
Smart meters deployed by suppliers in the Regulatory Year 2016-17
136,535 182,390 318,925
Total meters eligible for transition to smart 1,589,863 2,281,093 3,870,956
% penetration 8.59% 8.00% 8.24%
Smarter powergridA smarter network makes use of real-time information on network performance and energy consumption to respond to and manage demand and maintain a more efficient, affordable and low-carbon flow of energy. By doing so, a smarter network will also enable the growth of new customer technologies such as electric vehicles, renewable generation and heat pumps, among others.
26 More information is provided in Annex 5 (a copy of our annual submission to the regulator of related information) and in the ‘Detailed commentary’ document associated with it.
Table 11: IT and communications costs for 2016-17
£m
Smart Meter Communication Licensee Costs (pass through) 2.19
Smart Meter Information Technology Costs 2.71
Elective Communication Services 0
Smart Meter Communication Licensee Costs (outside price control) 0
Total 4.90
Notes for Table 11— Smart Meter Communication Licensee Costs: the charges
paid by the licensee to the holder of the Smart Meter Communication Licence as a requirement for it to be a party to the Smart Energy Code.
— Smart Meter Information Technology Costs: any information technology costs that the licensee reasonably incurs and are necessary for them to use data from smart meters effectively for the efficient and economic operation and maintenance of its Distribution System.
— Elective Communication Services: Payments for discretionary data services purchased through bilateral agreements with the Data Communications Company (DCC). The DCC data services were not live during any part of the 2016-17 regulatory year so no non-elective data or Elective Communication Services have been bought from the DCC.
3.4.3 IT and communications investmentWe’ve been busy making all the necessary changes to systems and business processes. This year we have:— Built the technology to connect to the national infrastructure
and shown that we are compliant with the security obligations. Table 11 summarises the smart meter IT and data costs that are passed through to our customers that we have incurred this year26.
— Worked with the suppliers who operate in our region to ensure the safety of roll-out activities.
— Looked at our business processes to see what needs to change and our network planning use cases to work out the best way to deliver the most benefits for customers.
25 For more information on the smart meter roll-out, refer to the government website www.smartenergygb.org
2017Implement and learn
— Initial operating processes— Gateway system implementation— Define how to use smart data— Revise organisational structure— Become DCC User— Process SMETS2 meter alerts
— SMETS2 mass roll-out begins Q3, continue support and defect resolution
— Start benefits realisation tracking— Refine organisational structure— Innovation projects – support
early benefits
— Systems Integration Roadmap defined— Remaining smart meter process in place— Deliver enduring integration projects— Develop benefits tracking— Innovation projects – wider benefits
2018Optimise and develop
2019Integrate and innovate
Figure 4: A summary of our strategic plan to support the smart meter roll-out and maximise its benefits
16,778smart meterdefects resolved within target timeframes.
319,000smart meters installed by energy suppliers.

Environment Report 2322 Northern Powergrid
3.4.4 Actions we expect to take next yearIn 2017-18, we will move from the Implement & Learn phase to the Optimise & Develop stage (Figure 4) as we expect mass roll-out will begin during the summer of 2018. We will be developing our process and organisational structure to meet the increased amount of work.
Next year we look forward to delivering benefits to our customers as energy suppliers are expected to start rolling out SMETS2 specification meters connected to the DCC. We will start tracking benefits and begin some innovation projects.
Table 12: Smart meter benefits actions for consideration in 2017-18
Actions Benefits for customers
— Upgrade our IT systems to process smart meter data which may help us better understand power used by our low-voltage electricity customers and how to measure network losses more accurately.
Avoided losses to network operators.
— Upgrade our IT systems to process smart meter data (including automated power cut alerts) and make it available to our operational teams.
— Integrate alerts in the redesign of our operational process to allocate staff to power cut repairs.
Reduction in the length of power cuts.
— Upgrade our IT systems to process smart meter data (including automated power cut alerts) and make it available to our operational teams.
— Integrate alerts in the redesign of our operational process to locate faults.
Reduction in operational costs to fix faults.
— Upgrade our IT systems to process smart meter data (including automated power cut alerts) and make it available to our operational teams.
— Integrate alerts in our distribution network outage management system. Although levels of inbound calls may drop, outbound contact with our customers will remain high as we proactively update customers about power cuts and the time they can expect their power back on.
Reduction in calls to faults and emergencies lines.
— Upgrade our IT systems to process smart meter data (including automated voltage alerts) and make it available to our operational teams.
— Integrate the information flowing from the data in the redesign of our network planning processes relating to new connection design, reinforcement design and voltage quality assessment.
Better informed investment decisions for electricity network reinforcement for quality of supply.
— Upgrade our IT systems to receive smart meter data (including automated power cut alerts)— Integrate alerts in the redesign of our operational process to allocate staff to power cut repairs— Integrate the information flowing from the data in the redesign of our network planning
processes relating to voltage quality assessment. This is particularly exciting as it is an area where we currently hold very little data, other than when a customer notifies us of a voltage problem.
Avoided cost of investigation of customer complaints about quality of supply.
— Progress our request to Ofgem for half-hourly consumption data from smart meters to help us better understand the usage profiles of low-voltage electricity customers and explore ways to save money on network improvements.
Network capacity investment savings from electricity demand shift.
Contact usregarding our plan
We always believe that our customers and stakeholders are the best judges of our performance. We always want to hear your views and opinions on the services we provide and your ideas for what we could be doing. If you would like to comment, you can contact us in a number of ways:
By emailyourpowergrid@northernpowergrid
On twitter
@northpowergrid(for power cut information and advice)
@powergridnews (for information about the company and the work we do in communities)
Via our online communitynorthern-powergrid.explainonline.co.uk
Online at:www.northernpowergrid.com
Connections enquiries
By telephone0800 011 3433
General enquiries
By telephone0800 011 3332

Environment Report 2524 Northern Powergrid
Notes

26 Northern Powergrid