environmental and social impact assessment 12...december 2008 high-level qra for erc refinery at...
TRANSCRIPT

EGYPTIAN REFINING COMPANY ENVIRONMENTAL AND SOCIAL IMPACT ASSESSMENT ERC HYDRO-CRACKING COMPLEX PROJECT AT MOSTOROD
APPENDIX 12.9 – QUANTITATIVE RISK ASSESSMENT
ENVIRONMENTAL AND SOCIAL IMPACT ASSESSMENT ERC Hydro-Cracking Complex Project at MostorodFINAL VERSION Appendix 12.9 – Quantitative Risk Assessment
51287-1
December 2008
Infrastructure & Environment
10th Floor 21, Misr Helwan Agriculture Road Maadi, Cairo, Egypt Telephone: +202 2359 5628 / 1487 / 1576 / 3819 Facsimile: +202 2359 1038 www.worleyparsons.com © Copyright 2008 WorleyParsons Infrastructure and Environment Limited

DNV ENERGY
High-level Quantitative Risk
Assessment for Additional Refinery
Facilities at Mostorod, Egypt
Report for Egyptian Refining Company (ERC)
Final Report - Rev 2, 8th December 2008
DNV Report No. 32345260

December 2008
High-level QRA for ERC Refinery at Mostorod, Egypt – Final, Rev 2
Egyptian Refining Company
Page i
DNV ENERGY
32345260
Proposal: High-level Quantitative Risk Assessment (QRA) for Additional Refinery Facilities at Mostorod, Egypt
For
Egyptian Refining Company c/o Citadel Capital 1089 Corniche El-Nil, Four Seasons Nile Plaza Office Building, third floor
Garden City, Cairo 11519 – Egypt
Client ref: Mr Ahmed El-Saghir
DET NORSKE VERITAS DNV Energy
Palace House 3 Cathedral Street London SE1 9DE
Tel: +44 (0)20 7357 6080 Fax: +44 (0) 20 7716 6730
Registered in England Company No. 1503799
Issue Date Report No. Content
08/12/2008 32345260 Rev 2 Further update for latest (Case 10) plot plan / layout
22/07/2008 32345260 Rev 1 Final report incorporating client comments
01/07/2008 32345260 Rev 0 Draft report for client comments
Prepared by: Sébastien Cochet, Senior Consultant
Kehinde Shaba, Consultant
Verified by: Jeff Daycock, Principal Consultant
Authorised by: Frank Ketelaars, Associate Director
No distribution without permission from the client or responsible organisational unit (however, free distribution for internal use within DNV after 3 years)
No distribution without permission from the client or responsible organisational unit
Strictly confidential
Unrestricted distribution
All copyrights reserved Det Norske Veritas Ltd. This publication or parts thereof may not be reproduced or transmitted in any form or by any means, including photocopying or recording, without the prior written consent of Det Norske Veritas Ltd.
December 2008
High-level QRA for ERC Refinery at Mostorod, Egypt – Final, Rev 2
Egyptian Refining Company
Page ii
DNV ENERGY
32345260
executive summary: Egyptian Refining Company (ERC) has plans to add additional processing units to the Cairo Oil Refining Company (CORC) refinery situated near Cairo. The new facilities are to include diesel hydrotreating, vacuum distillation and hydrocracker units, among other units, with the particular aim of expanding the production of high-quality diesel products. This document sets out DNV Energy’s Quantitative Risk Assessment (QRA) of the proposed additional facilities, noting that this is a high-level QRA in order to identify the key hazards and risks in a timely manner. By conducting this type of high-level QRA it should be emphasised that the focus is on the major, worst-case, hazards - essentially in order to prioritise the off-site risks and potential impacts to the public. This (Rev 2) analysis is based on the Case 10 layout, which has accounted for several of the recommendations from previous revisions of this study. Risk Criteria
Individual risks are the key measure of risk acceptability for this type of study, where it is proposed that: • Risks to the public can be considered to be broadly acceptable (or negligible) if below 10-6
per year (one in 1 million years). Although risks of up to 10-4 per year (1 in 10,000 years) may be considered acceptable if shown to be As Low As Reasonably Practicable (ALARP), it is recommended that 10-5 per year (1 in 100,000 years) is adopted for this study as the maximum tolerable criterion.
• Risks to workers can be considered to be broadly acceptable (or negligible) if below 10-5 per year and where risks of up to 10-3 per year (1 in 1000 years) may be considered acceptable if ALARP.
Societal risk criteria are also proposed, although these should be used as guidance only. A criterion of 10-4 per year is recommended for determining design accidental loads for on-site buildings, i.e. buildings should be designed against the fire and explosion loads that occur with a frequency of 1 in 10,000 years. Risk Results - Public
The individual risks to the off-site residential populations can be shown to be broadly acceptable. This is based on the fact that the 10-7 (and 10-8) per year contours only just reach the edge of the key residential population to the South East of the facility, leaving a reasonable safety margin between the 10-6 per year contours and the residential populations. It should be noted that the largest hazards and the associated risk contours extend towards the nearest residential populations, although they do not reach, and that the results are based on necessarily high-level analysis. Hence, it is important that the above conclusions are confirmed by updated risk analysis as the detailed design is developed.

December 2008
High-level QRA for ERC Refinery at Mostorod, Egypt – Final, Rev 2
Egyptian Refining Company
Page iii
DNV ENERGY
32345260
Risk Results - Workers
The predicted 10-4 and 10-5 per year individual risk contours have potential to affect the adjacent industrial populations, including the existing refinery, as well as the on-site workers associated with the expansion facilities. These risks are potentially significant but are likely to be at manageable levels (i.e. tolerable if ALARP) when accounting for the time spent in different areas and the potential mitigation afforded by existing buildings. As for the risks to the public, these risks should be considered further when the layout and manning levels are finalised, i.e. by updated risk analysis as the detailed design is developed. On-site Hazards
The potential for escalation and significant asset damage, against the widely used 10-4 per year criterion, will primarily apply to the main parts of the HCU as well as the process units to the East of the proposed plot, the DHT / DEU, NHT / CCR and DCU units. This suggests that attention should be given to the layout of these units during detailed design, such whether greater separation is achievable or whether passive fire protection is needed on key inventories / equipment items (such as adjacent piperacks). Note that, the explosion frequency contours suggest that all buildings within the main process units should have protection against blast loads of at least 0.1 barg, if designing against a 10-4 per year criterion. Location of such buildings should consider (and hence avoid) the peak 10-4 per year explosion loads, which can exceed 0.3 barg in these areas. Off-site Hazards
The predicted 0.07 barg contours can be taken as broadly indicative of the threshold against which unprotected buildings (e.g. houses) should be located. These contours do not reach the residential areas to the East of the facility. Lower overpressure levels, such as the 0.03 barg contours, will reach the residential areas to the East – and potentially also to the West and South - with a frequency of greater than 10-5 per year. This level of overpressure is generally taken as the threshold for window breakage and corresponds to the potential for light building damage. Fatalities would not normally be expected at this level of overpressure and hence it is not considered practical to locate buildings outside these contours.

December 2008
High-level QRA for ERC Refinery at Mostorod, Egypt – Final, Rev 2
Egyptian Refining Company
Page iv
DNV ENERGY
32345260
Recommendations
Although the results of this high-level analysis show that the risks to the public are broadly acceptable (or negligible), they will be sensitive to the specific design and/or modelling assumptions used. Hence it is considered to be essential that the detailed design is accompanied by further (updated) risk analysis to demonstrate (i.e. confirm) that the risks to off-site populations are within acceptable levels and that they can be shown either to be broadly acceptable, or at least to be As Low As Reasonably Practicable (ALARP). The further risk analysis should also cover the on-site risks, to people, as well as the potential for escalation and risks to assets. Other key recommendations are: • The potentially affected populations should be assessed in more detail, including
consideration / confirmation of the limits of the future land-use near to the refinery.
• Given that the risks to the residential populations are sensitive to the wind conditions, it would be prudent to obtain more detailed wind rose data for the site if possible.
• The emergency response procedures for the facility should be common with the adjacent industrial facilities. If practical the emergency response / plan should be developed for the site / complex as a whole, based on understanding of the risks to and from each of the different plants / units / facilities.
• The on-site explosion hazards should be considered in more detail once the layout is confirmed, where:
- The 10-4 per year 0.3 barg contours are expected to cover significant parts of the HCU as well as the process units to the East of the proposed plot, the DHT / DEU, NHT / CCR and DCU units. This suggests that attention should be given to the detailed layout of these units and associated piperacks / pipeways with respect to the potential for escalation.
- All buildings within the main process units should have protection against blast loads of at least 0.1 barg, if designing against a 10-4 per year criterion, and should be located to ensure that the peak explosion loads (which can exceed 0.3 barg in these areas) are avoided.
• The emphasis on risk reduction should be on preventative measures, i.e. to minimise the potential for leaks to occur. This would chiefly be achieved through appropriate design (to recognised standards) and through effective inspection, testing and maintenance plans / procedures.
• Best practice fire and gas detection systems, with associated shutdown systems and procedures, will be important mitigation measures. Consideration should also be given to the philosophy required for shutdown (i.e. whether automatic shutdown is a desired option or not).

December 2008
High-level QRA for ERC Refinery at Mostorod, Egypt – Final, Rev 2
Egyptian Refining Company
Page v
DNV ENERGY
32345260
contents:
1.0 Introduction.........................................................................................................1
1.1 Background ........................................................................................................1
1.2 Objectives and Scope.........................................................................................1
1.3 Layout of study ...................................................................................................2
2.0 Risk Acceptance Criteria ....................................................................................3
2.1 Risk Assessment Framework .............................................................................3
2.2 Individual Risk Criteria........................................................................................4
2.3 Societal Risk Criteria ..........................................................................................5
2.4 Risks to Assets...................................................................................................6
3.0 Methodology.......................................................................................................7
3.1 Failure Case Definition .......................................................................................7
3.2 Assumptions.......................................................................................................7
3.3 Risk Software .....................................................................................................8
4.0 Benchmark Results ............................................................................................9
5.0 Risk Results .....................................................................................................10
5.1 Individual Risk Contours...................................................................................10
5.2 Risks to the Public (Off-site) .............................................................................12
5.3 Risks to Workers (On-site) ...............................................................................13
5.4 Societal Risk.....................................................................................................13
6.0 Hazard Frequency Contours ............................................................................14
6.1 Explosion Hazards ...........................................................................................14
6.2 Flash Fire Hazards ...........................................................................................15
6.3 Toxic Hazards ..................................................................................................16
6.4 Jet and Pool Fire, Fireball Hazards ..................................................................16
7.0 Conclusions......................................................................................................18
7.1 Risk criteria.......................................................................................................18
7.2 Risks to the Public (Off-site) .............................................................................18
7.3 Risks to Workers (On-site) ...............................................................................18
7.4 Key Hazards.....................................................................................................19
8.0 Recommendations ...........................................................................................20
8.1 Further Risk Assessment .................................................................................20
8.2 General Recommendations..............................................................................20
Appendix I: Risk Acceptance Criteria Appendix II: Assumptions Appendix III: Failure Case Definition Appendix IV: Benchmark Results Appendix V: High-level QRA Results

December 2008
High-level QRA for ERC Refinery at Mostorod, Egypt – Final, Rev 2
Egyptian Refining Company
Page vi
DNV ENERGY
32345260
abbreviations: The abbreviations used within this report are listed below:
ALARP As Low As Reasonably Practicable
API (RP) American Petroleum Institution (Recommended Practice)
B/L Battery Limit
CCB Central Control Building
CCTV Closed Circuit Television
CORC Cairo Oil Refining Company
DNV Det Norske Veritas Limited
EC European Commission
ERC Egyptian Refining Company
HSE (UK) Health and Safety Executive
PFD Process Flow Diagram
PFP Passive Fire Protection
PPE Personal Protective Equipment
QRA Quantitative Risk Assessment
UDM Unified Dispersion Model
VCE Vapour Cloud Explosion

December 2008
High-level QRA for ERC Refinery at Mostorod, Egypt – Final, Rev 2
Egyptian Refining Company
Page 1
DNV ENERGY
32345260
1.0 Introduction
1.1 Background
The Mostorod refinery is situated near Cairo and is already one of Egypt’s largest refineries with a throughput of 142,000 bpd, operated by Cairo Oil Refining Co (CORC). A venture capital group called Egyptian Refining Company (ERC) has plans to install additional processing units adjacent to the existing refinery. The new facilities are to include diesel hydrotreating, vacuum distillation and hydrocracker units, among other units, with the particular aim of expanding the production of high-quality diesel products. A number of layouts have been developed for this project, where “Case 10” is the preferred layout (noting that it accounts for several recommendations from previous revisions of this study) and forms the basis of the analysis contained in this study. This document sets out DNV Energy’s Quantitative Risk Assessment (QRA) in support of the above. Note that this is a high-level QRA in order to identify the key hazards and risks in a timely manner. By conducting this type of initial screening QRA it should be emphasised that the focus is on the major, worst-case, hazards - in order to prioritise the off-site risks and potential impacts to the public. Hence, the QRA is relatively high-level and will not provide realistic measures of the risks within each unit, only to the key buildings, adjacent (existing) facilities and to the off-site populations. The aims are to meet the basic requirements of QRA, and the key requirements of the project, and identify whether there is a need for more detailed assessment, which may then be focussed on specific units, rather than the whole refinery.
1.2 Objectives and Scope
The main objectives of this Quantitative Risk Assessment (QRA) study are:
• To identify and quantify the major process hazards associated with the proposed additional facilities proposed by ERC.
• Assess the acceptability of the risks to people (primarily third party - off-site - populations), against internationally recognised criteria.
• Identify the main risk contributors in order to establish potential risk reduction measures and to demonstrate to the relevant stakeholders that the key risks are understood, and are being managed throughout the design process.
The scope covered is for a high-level QRA, which is focussed on the worst-case hazards, and associated risks. The scope is restricted to analysis of the risks associated with the additional / ERC facilities, rather than the existing / CORC facilities.

December 2008
High-level QRA for ERC Refinery at Mostorod, Egypt – Final, Rev 2
Egyptian Refining Company
Page 2
DNV ENERGY
32345260
1.3 Layout of study
The layout of the remainder of this document consists of the following sections: • Section 2.0 sets out the risk criteria proposed for this study, on which the determination of
acceptability will be based. This is covered in detail by Appendix I.
• Section 3.0 summarises the methodology, noting that this is covered in detail by Appendix II (detailed assumptions / methodology) and Appendix III (failure case definition).
• Section 4.0 summarises a very high-level assessment of the risk and hazard ranges associated with ‘typical’ refinery units. This is covered in detail by Appendix IV.
• Section 5.0 details the risk results, which are primarily based around the individual risk contours. These are discussed separately with respect to the potential off-site risks to the public and to the on-site risks to workers (including workers in adjacent industrial facilities). These results are detailed in Appendix V.
• Section 6.0 aims to support the discussion of the above risk results by presenting and discussing the different hazards contributing to the risks, also detailed in Appendix V.
• Section 7.0 and 8.0 present the Conclusions and Recommendations from the analysis.

December 2008
High-level QRA for ERC Refinery at Mostorod, Egypt – Final, Rev 2
Egyptian Refining Company
Page 3
DNV ENERGY
32345260
2.0 Risk Acceptance Criteria
In the absence of local legislation, the risks evaluated within this study are to be referenced against internationally accepted criteria, in order to determine the acceptability of the risks and any need for risk reduction measures to be implemented within the design process. The risk criteria proposed to be used are drawn from the widely used framework set out by the UK’s HSE, using the As Low As Reasonably Practicable (ALARP) principle, and proposes risk acceptance criteria to be used as guidance for this study. The derived criteria, and the ALARP framework, are described in full in Appendix I and summarised in the following sections.
2.1 Risk Assessment Framework
The following measures of acceptability should be evaluated in assessing the risks from any hazardous activity:
• Individual risk criteria should be used to limit risks to individual workers and members of the public.
• Societal risk criteria should also be used to limit risks to the affected population as a whole.
• Cost-benefit analysis should be used to ensure that, once the above criteria are satisfied, an optimum level of safety measures is chosen for the activity, taking costs as well as risks into account. (Note that this is outside the scope of this study.)
The simplest framework for risk criteria is a single risk level which divides tolerable risks from intolerable ones. Such criteria give attractively simple results, but they need to be used very carefully, because they do not reflect the uncertainties both in estimating risks and in assessing what is tolerable. A more flexible framework specifies a level, usually known as the maximum tolerable criterion, above which the risk is regarded as intolerable whatever the benefit may be, and must be reduced. Below this level, the risks should also be made As Low As Reasonably Practicable (ALARP). This means that when deciding whether or not to implement risk reduction measures, their cost may be taken into account, using cost-benefit analysis. In this region, the higher the risks, the more it is worth spending to reduce them. If the risks are low enough, it may not be worth spending anything, and the risks are then regarded as negligible. This approach can be interpreted as dividing risks into three tiers (as is illustrated in Appendix I):
• An upper band where risks are intolerable whatever the benefit the activity may bring. Risk reduction measures or design changes are considered essential.
• A middle band (or ALARP region) where the risk is considered to be tolerable only when it has been made ALARP. This requires risk reduction measures to be implemented if they are reasonably practicable, as evaluated by cost-benefit analysis.

December 2008
High-level QRA for ERC Refinery at Mostorod, Egypt – Final, Rev 2
Egyptian Refining Company
Page 4
DNV ENERGY
32345260
• A negligible region where the risks are negligible and no risk reduction measures are needed.
2.2 Individual Risk Criteria
Individual risk is widely defined as the risk of fatality (or serious injury) experienced by an individual, noting that the acceptability of individual risks should be based on that experienced by the most exposed (i.e. ‘worst-case’) individual. The most widely-used criteria for individual risks are the ones proposed by the UK HSE, noting that these have also been interpreted for projects in Egypt in a number of previous studies conducted by DNV. These UK HSE criteria are: • The maximum tolerable individual risk for workers is taken as 10-3 per year (i.e. 1 in 1,000
years). • The maximum tolerable individual risk for members of the public is 10-4 per year (i.e. 1 in
10,000 years). • The acceptable criterion, for both workers and public, corresponding to the level below
which individual risks can be treated as effectively negligible, is 10-6 per year (i.e. 1 in 1,000,000 years)
• Between these criteria the risks are in the ‘ALARP’ or tolerability region. In this region the risks are acceptable only if demonstrated to be As Low As Reasonably Practicable (ALARP).
In terms of the acceptability of individual risks, it should be noted that:
• Individual risks are typically presented as contours that correspond to the risk experienced by a person continuously present, outdoors, at each location.
• While people are unlikely to remain “continuously present, outdoors” at a given point, the individual risk levels used to assess residential developments are not modified to account for any presence factor or the proportion of time spent indoors. That is, it should be conservatively assumed that dwellings are occupied at all times and that domestic properties offer no real protection against the potential hazards.
• Hence, the individual risks contours can be used directly with respect to the public, while for workers it is more appropriate to consider the most exposed individual (accounting for the time they spend in different areas, indoors, away from the hazards, etc).
• It should also be noted that lower criteria are often adopted with respect to vulnerable populations, such that schools and hospitals, for example, should be located such that the individual risks are well below 10-6 per year.
• The maximum criterion for the public of 10-4 per year is maintained in this study as a representative maximum. However, it should be emphasised that this is a maximum value and it would be extremely rare for this level to be considered acceptable for a new facility / development. That is, there is unlikely to be sufficient justification that there are no practicable methods of reducing this level of risk. In fact, it is considered to be best practice to treat 10-6 per year as the target criterion, while risks of up to 10-5 per year would require strong justification and risks above 10-5 per year should be avoided with respect to the public.
• It should, in any case, be emphasised that risks above 10-6 per year are acceptable only if shown to be ALARP.

December 2008
High-level QRA for ERC Refinery at Mostorod, Egypt – Final, Rev 2
Egyptian Refining Company
Page 5
DNV ENERGY
32345260
• Conversely, for most workers (particularly those in a refinery) it is accepted that 10-6 per year risk levels are not practical to achieve and the target typically adopted is to achieve individual risks to workers of between 10-5 and 5 x 10⁻⁵ per year.
In summary, it is proposed that the following criteria are adopted for this study (as illustrated by Figure 2.1): • Risks to the public can be considered to be broadly acceptable if below 10-6 per year,
although noting that societal risk factors should also be considered (including the type of population potentially exposed). Although risks of up to 10-4 per year may be considered acceptable if shown to be ALARP, it is recommended that 10-5 per year is adopted for this study as the maximum tolerable criterion.
• Risks to workers can be considered to be broadly acceptable if below 10-5 per year and where risks of up to 10-3 per year may be considered acceptable if ALARP.
Figure 2.1 – Individual Risk Criteria Proposed for ERC
Risks to the Public Risks to Workers
1 in 100 years (10-2 per year) Unacceptable Unacceptable
1 in 1000 years (10-3 per year)
ERC maximum tolerable criterion -
public
ERC maximum tolerable criterion -
workers
1 in 10,000 years (10-4 per year)ERC maximum tolerable criterion -
public Acceptable if ALARP
1 in 100,000 years (10-5 per year)
ERC maximum tolerable criterion -
public
ERC broadly acceptable
(negligible) criterion - workers
Acceptable if ALARP
1 in 1,000,000 years (10-6 per year)
ERC broadly acceptable
(negligible) criterion - public
Broadly acceptable (negligible) Broadly acceptable (negligible)
2.3 Societal Risk Criteria
A proposed criterion for Societal Risk is set out in Appendix I in the form of an F-N curve, which gives the cumulative frequency (F) of exceeding a number of fatalities (N). It is, however, important to note that the acceptability of societal risks can be subjective and depends on a number of factors (such as the benefits versus the risks that a facility provides). There is not a single established indicator in terms of societal risk. The proposed societal (F-N) criteria are considered to provide useful guidance on the acceptability of the societal risk, although it should be emphasised that the criteria are not as widely accepted as individual risk and should be used as guidance only.

December 2008
High-level QRA for ERC Refinery at Mostorod, Egypt – Final, Rev 2
Egyptian Refining Company
Page 6
DNV ENERGY
32345260
2.4 Risks to Assets
Criteria used with respect to asset damage or the potential for escalation are open to interpretation, since they do not directly affect risks to people. However, a 10-4 per year frequency is widely adopted for both of the following: • As the frequency used to define the design accidental load against which buildings
should be designed. For example, ensuring that a building will withstand the explosion loads that is predicted to occur with a cumulative frequency of 1 every 10,000 years (10-4 per year).
• As the frequency of potential escalation that should be designed against. For example, ensuring that a significant escalation (such as from one unit to another) will not occur with a frequency of greater than 1 in 10,000 years.
Thus, 10-4 per year is referred to in this study for guidance, noting that these criteria apply primarily to on-site aspects that are not covered in detail by this study.

December 2008
High-level QRA for ERC Refinery at Mostorod, Egypt – Final, Rev 2
Egyptian Refining Company
Page 7
DNV ENERGY
32345260
3.0 Methodology
The methodology adopted in this study is detailed in Appendix II (which describes the main assumptions) and Appendix III (which details the approach adopted to deriving the failure cases to be modelled in this study). A very brief summary of the approach contained within the above appendices is given in the following sections.
3.1 Failure Case Definition
For the purposes of this high-level risk assessment it is not practical (or necessary) to attempt to model all of the potential hazards associated with the different units. The basic approach adopted instead is summarised below. • Previous ‘reference’ QRA studies evaluating similar units to those proposed for the
additional / ERC facilities are reviewed, to identify the scenarios that contribute to the risks beyond the immediate unit area. Note that these ‘reference’ studies are not detailed for confidentiality reasons but are discussed in Appendix IV.
• All significant risk contributors at locations a moderate distance outside of each unit are then defined as failure cases for this study, on the basis of having potential off-site impacts.
• In each case, brief review of the representative scenarios against the additional / ERC facility PFDs is undertaken to ensure that the key sections of each unit have been covered by using this approach. The representative parameters for the ‘reference’ failure cases are also reviewed and updated to ensure they are consistent with the corresponding sections in the proposed additional / ERC facility PFDs.
• These failure cases are then superimposed upon the appropriate location of the latest plot plan for the additional / ERC facilities. (As discussed in Section 1.1 the “Case 10” plot is used, which is illustrated in Appendix II.)
The failure cases derived for each unit are detailed in Appendix III. Consistent with the focus on the off-site / significant hazard range risks, only the larger, Rupture and Large leak (75 mm equivalent diameter hole) leak sizes are modelled for each of the failure cases identified. Note that the general methodology adopted in deriving the initial failure cases, and the subsequent development of each, is summarised in Section 3.2 and detailed in Appendix II. Note also that the subsequent modelling approach, using the PHAST and BLAST software is also described in Appendix II, with the software summarised briefly in Section 3.3.
3.2 Assumptions
The basic aim of Appendix II is to document the details underpinning this Quantitative Risk Assessment (QRA) study. Being a high-level study, there are two distinct aspects to the assumptions and methodology. Background data: • The site-specific aspects that apply (or potentially apply) to each of the release scenarios
(failure cases) modelled are referred to as ‘background data’. This covers the

December 2008
High-level QRA for ERC Refinery at Mostorod, Egypt – Final, Rev 2
Egyptian Refining Company
Page 8
DNV ENERGY
32345260
meteorological conditions, as well as potential ignition sources and congested volumes that are specific to the site (and to the proposed layout), and the potentially exposed populations.
• These aspects are modelled as realistically as possible to represent the proposed layout / design of the new refinery facilities at Mostorod, drawing on the unit plot plans and the latest (“Case 10”) overall plot plan to identify the congested volumes and ignition sources in particular.
General assumptions: • For the purposes of this QRA a relatively high-level approach has been adopted in
focussing on the key risk contributors, particularly with respect to the potential off-site hazards, as discussed in the previous section. The failure cases defined are derived from previous studies and applied directly to the background data described above. Hence, the detailed assumptions underpinning the analysis primarily relate to the overall approach, which has been applied in the ‘reference’ studies from which the failure cases are derived.
• However, the basic methodology adopted by DNV for studies of this kind is set out in detail in Appendix II, in order to describe the basis for the defined scenarios and modelling approach. It should be emphasised that elements of these sections are generic and are intended to define the broad approach only, where specific assumptions may vary from failure case to failure case.
• The general assumptions covered within Appendix II are grouped as follows:
- Impact criteria assumptions - Failure case definition assumptions - Frequency analysis assumptions - Consequence analysis assumptions - Risk analysis assumptions
3.3 Risk Software
DNV Software are responsible for the development of a number of established, world-leading, hazard and risk modelling software tools. These commercially available software tools include the consequence modelling package PHAST, the risk analysis tools SAFETI / PHAST RISK and Neptune, and the leak frequency analysis tool LEAK. DNV Energy staff have been involved in the development of these tools, and have a wide range of experience in their use. In addition to these tools, DNV Energy have developed (together with DNV Software) the BLAST software, which is an in-house risk analysis tool for the prediction of process risks at onshore facilities. The PHAST suite of consequence models is fully integrated into the BLAST package, and it is BLAST and (hence) PHAST that is used as the basis for the analysis conducted for this study. These packages are summarised briefly below, while further details are readily available upon request. • PHAST is a comprehensive hazard analysis software tool which is applicable to all
stages of design and operation across a wide range of process industries. The Unified
December 2008
High-level QRA for ERC Refinery at Mostorod, Egypt – Final, Rev 2
Egyptian Refining Company
Page 9
DNV ENERGY
32345260
Dispersion Model (UDM) at its heart is respected as one of the world’s leading dispersion models for process safety applications. The theory and performance has been independently reviewed as part of the EC funded project SMEDIS, and it has excelled in both areas.
• BLAST is a comprehensive in-house onshore QRA package, which was originally developed to address on-site risk modelling in applications where explosion risks are of particular significance. Explosions are modelled using the TNO Multi-Energy Model, taking account of the congestion in process units and other areas. BLAST has been developed to combine the output from the consequence models in PHAST with meteorological data, population, frequency and, in the case of explosions, process congestion data to produce risk predictions. The program models toxic and flammable consequences to produce on and offsite risks.
• BLAST has been developed specifically to enable onshore QRA studies to provide relevant design inputs (such as fire and explosion loads at all locations within a site, for a range of design levels, enabling design decisions to be based either on worst-case loads or to use a risk-based approach). Risk can be presented by BLAST in a number of formats: individual risk contours, societal FN-curves, risk ranking tables, etc. Individual consequences or combined hazard frequencies can be overlaid onto site plans.
4.0 Benchmark Results
Analysis of previous refinery studies has been conducted in order to provide a benchmark of the likely results associated with different refinery units. This provides a particularly high-level assessment of the risks around different units, in a typical refinery, which was originally conducted to provide support to the comparison of the different ERC refinery layout options. This analysis is of less relevance now that the layout has been finalised as being within the South plot. However, it is considered to provide a useful guideline to the order of magnitude of the different risks and the analysis is presented in Appendix IV.

December 2008
High-level QRA for ERC Refinery at Mostorod, Egypt – Final, Rev 2
Egyptian Refining Company
Page 10
DNV ENERGY
32345260
5.0 Risk Results
The following sections aim to summarise the risk (and hazard frequency) results that are set out in more detail in Appendix V.
5.1 Individual Risk Contours
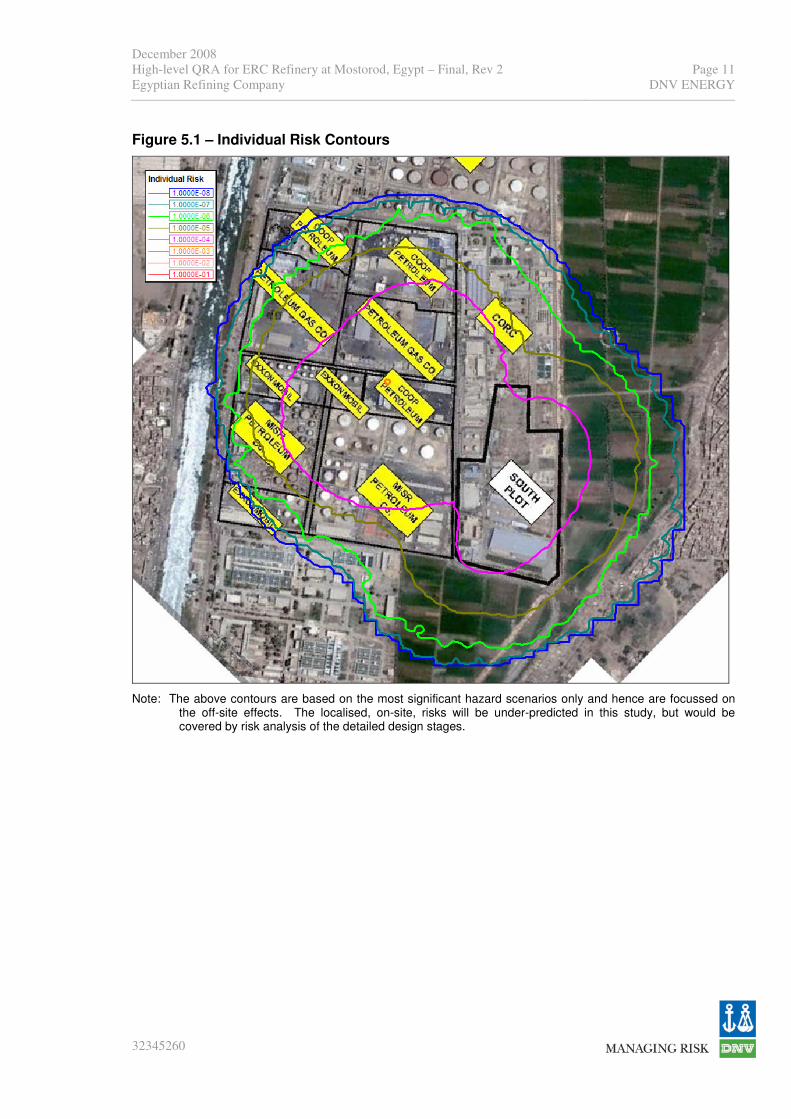
At this early / high-level stage in the design / risk assessment process the most useful measure of risk is individual risk, which is presented in the form of contours. The individual risk contours for the initial high-level risk assessment are shown in Figure 5.1. This gives the risk of fatality (or serious injury) experienced by a person continuously present, outdoors. It should be emphasised when interpreting the results shown in Figure 5.1 that: • These results are based only on the major accident hazards identified as having the key
hazard ranges (as discussed in Appendix III) and hence are focussed on the off-site risks. The on-site risks will be under-predicted by neglecting the smaller hazard range events that do not affect the off-site populations but will have relatively high frequencies and, hence, will be significant in terms of on-site risk.
• Although based on the risks to people outdoors, these contours are considered to be directly applicable to the risks to residential populations. That is, no risk benefit (i.e. protection) is claimed for being indoors for residential buildings. Thus, the 10-6 per year individual risk contour can be taken as the target risk level for the public in terms of individual risk (see Appendix I for derivation of the proposed risk criteria).
The contours shown in Figure 5.1 are discussed in the following sections in terms of the risks to the off-site / public and on-site / worker populations in Sections 5.2 and 5.3, respectively. The potential societal risks are discussed in Section 5.4.
December 2008
High-level QRA for ERC Refinery at Mostorod, Egypt – Final, Rev 2
Egyptian Refining Company
Page 11
DNV ENERGY
32345260
Figure 5.1 – Individual Risk Contours
Note: The above contours are based on the most significant hazard scenarios only and hence are focussed on the off-site effects. The localised, on-site, risks will be under-predicted in this study, but would be covered by risk analysis of the detailed design stages.
December 2008
High-level QRA for ERC Refinery at Mostorod, Egypt – Final, Rev 2
Egyptian Refining Company
Page 12
DNV ENERGY
32345260
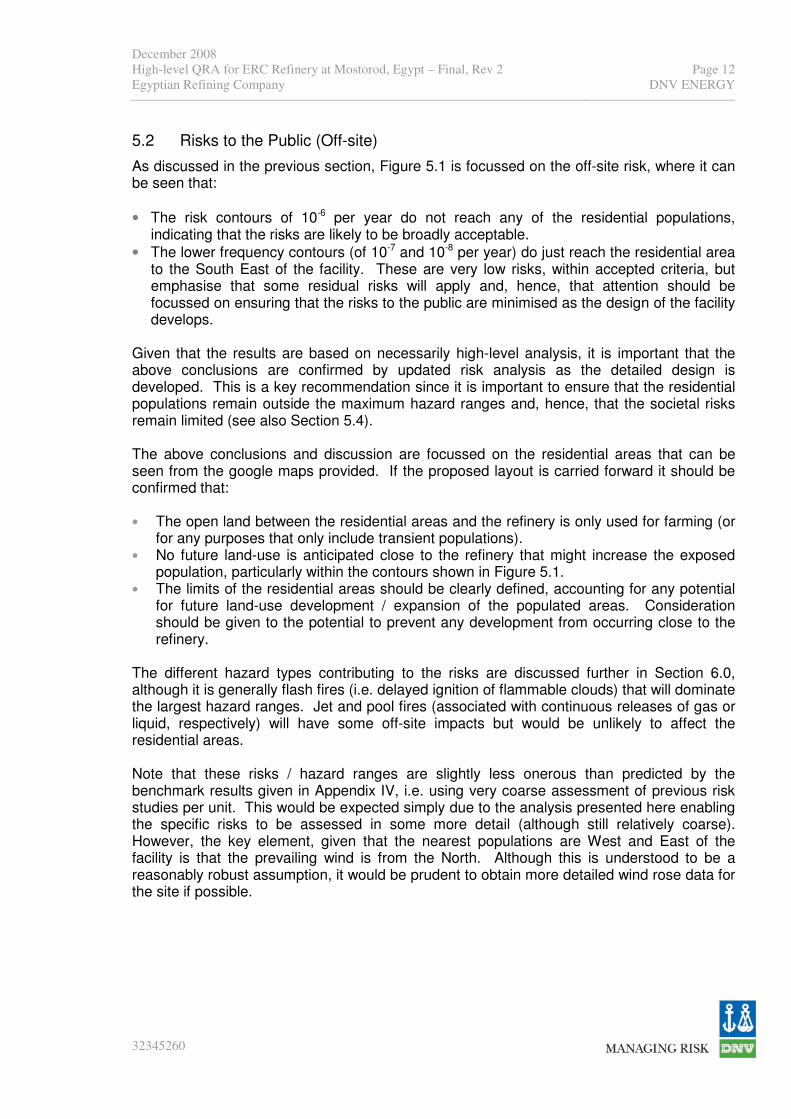
5.2 Risks to the Public (Off-site)
As discussed in the previous section, Figure 5.1 is focussed on the off-site risk, where it can be seen that:
• The risk contours of 10-6 per year do not reach any of the residential populations, indicating that the risks are likely to be broadly acceptable.
• The lower frequency contours (of 10-7 and 10-8 per year) do just reach the residential area to the South East of the facility. These are very low risks, within accepted criteria, but emphasise that some residual risks will apply and, hence, that attention should be focussed on ensuring that the risks to the public are minimised as the design of the facility develops.
Given that the results are based on necessarily high-level analysis, it is important that the above conclusions are confirmed by updated risk analysis as the detailed design is developed. This is a key recommendation since it is important to ensure that the residential populations remain outside the maximum hazard ranges and, hence, that the societal risks remain limited (see also Section 5.4). The above conclusions and discussion are focussed on the residential areas that can be seen from the google maps provided. If the proposed layout is carried forward it should be confirmed that: • The open land between the residential areas and the refinery is only used for farming (or
for any purposes that only include transient populations). • No future land-use is anticipated close to the refinery that might increase the exposed
population, particularly within the contours shown in Figure 5.1. • The limits of the residential areas should be clearly defined, accounting for any potential
for future land-use development / expansion of the populated areas. Consideration should be given to the potential to prevent any development from occurring close to the refinery.
The different hazard types contributing to the risks are discussed further in Section 6.0, although it is generally flash fires (i.e. delayed ignition of flammable clouds) that will dominate the largest hazard ranges. Jet and pool fires (associated with continuous releases of gas or liquid, respectively) will have some off-site impacts but would be unlikely to affect the residential areas. Note that these risks / hazard ranges are slightly less onerous than predicted by the benchmark results given in Appendix IV, i.e. using very coarse assessment of previous risk studies per unit. This would be expected simply due to the analysis presented here enabling the specific risks to be assessed in some more detail (although still relatively coarse). However, the key element, given that the nearest populations are West and East of the facility is that the prevailing wind is from the North. Although this is understood to be a reasonably robust assumption, it would be prudent to obtain more detailed wind rose data for the site if possible.

December 2008
High-level QRA for ERC Refinery at Mostorod, Egypt – Final, Rev 2
Egyptian Refining Company
Page 13
DNV ENERGY
32345260
5.3 Risks to Workers (On-site)
It should, again, be emphasised that the on-site risks shown by Figure 5.1 (and more detailed on-site plots in Appendix V) are coarse and that below 10-4 per year the contours will tend to be under-predicted due to the high-level approach adopted. However, the 10-4 and 10-5 per year contours are broadly representative and emphasise that: • The 10-5 per year contours extend up to 150 m off-site to the East and South of the facility
battery limits. It should be confirmed that there are no significant 3rd party (i.e. public) populations in the off-site areas covered by these 10-5 per year contours.
• The 10-4 and 10-5 per year contours have potential to affect the adjacent industrial populations, including the existing CORC refinery. These risks are potentially significant but should be considered in the context of the overall risks that will apply to workers in these areas. These risks may be considered to be manageable when accounting for the time spent in different areas and the potential mitigation afforded by existing buildings, etc. However, it is important that:
- Consideration is given to the number and location of the potentially affected industrial
populations in order to determine the likely acceptability. - The risks experienced by each must consider the cumulative effects of all potential
hazards (including those from the existing refinery, for example). - In any case, the risks are clearly of sufficient magnitude that the emergency response
procedures for these facilities should be common. That is, alarms in the new refinery should be acted upon in an appropriate manner by workers in adjacent facilities, such that there are common procedures, training, etc. If practical the emergency response / plan should be developed for the site / complex as a whole, based on understanding of the risks to and from each of the different plants / units / facilities.
5.4 Societal Risk
As discussed in Section 2.0, it is important that risk acceptability considerations account for both individual and societal risk, as well as the cost of mitigating against the identified risks. However, at this stage of the analysis it should be noted that: • The base case risk results suggest that the societal risk to the public will be broadly
acceptable (or negligible), based on the maximum (representative) hazard ranges not quite reaching the residential areas.
• As discussed in Section 5.2, the key conclusion / recommendation is to ensure that the detailed design process includes demonstration that the maximum hazard ranges remain within the predicted levels, or – at least – are mitigated against. This is an important aspect due to the significant populations (and hence societal risk) that lie outside the maximum hazard ranges.
• The risk to onsite workers should not be neglected. The on-site populations are not yet available and should, ideally, also include consideration of the complex as a whole. As a minimum, the future assessment of risks from the refinery expansion project should include the other potentially affected populations, such as workers within the existing refinery areas and the neighbouring industrial facilities.

December 2008
High-level QRA for ERC Refinery at Mostorod, Egypt – Final, Rev 2
Egyptian Refining Company
Page 14
DNV ENERGY
32345260
6.0 Hazard Frequency Contours
The specific hazards contributing to the predicted risk results are presented and discussed in Appendix V and summarised in the following sections.
6.1 Explosion Hazards
The explosion hazard frequency contours presented in Appendix V show that: • 0.3 barg contours will not extend any significant distance off-site.
• Most of the 0.3 barg effects will be restricted to the respective unit, but where the 10-5 per year contours will cover most of the new / additional facilities and the 10-6 per year contours will extend into the existing facility.
• The 10-4 per year 0.3 barg contours are indicative of the typical criterion for potential escalation and significant asset damage. These would be expected to cover significant parts of the HCU as well as the process units to the East of the proposed plot, the DHT / DEU, NHT / CCR and DCU units. This suggests that attention should be given to the detailed layout of these units with respect to the potential for escalation and, hence, whether greater separation is achievable or whether passive fire protection is needed on key inventories / equipment items (such as adjacent piperacks).
• These results are highly indicative with respect to the on-site hazards and risks, but a reasonably robust recommendation can be made that no buildings are located within the above areas (i.e. within the 10-4 per year 0.3 barg contours).
• The 0.1 barg overpressure contours do not extend significant distances off-site, but where the 10-4 per year contours will be likely to cover the whole of the HCU and the main process units to the East of the facility (i.e. the DHT / DEU, NHT / CCR and DCU units). Hence, as a general guide, any building located in these areas should have blast protection of at least 0.1 barg. The explosion loads in other parts of the facility will not be negligible, but will tend to be well below 0.1 barg, in terms of the 10-4 per year loads.
The extent of the 0.07 barg and 0.03 barg contours is significant. Note that these are broadly consistent with the discussion given in Appendix IV (with respect to the benchmark results) and show that: • The predicted 0.07 barg contours can be taken as broadly indicative of the threshold
against which unprotected buildings (e.g. houses) should be located. These contours do not reach the nearest residential areas to the South East of the facility.
• Lower overpressure levels, such as the 0.03 barg contours, will reach the residential areas to the South East – and the neighbouring facility to the South - with a frequency of greater than 10-5 per year. This level of overpressure is generally taken as the threshold for window breakage and corresponds to the potential for light building damage. Fatalities would not normally be expected at this level of overpressure (although there is always some potential where breaking glass is involved) and hence it is not considered practical to locate buildings outside these contours.

December 2008
High-level QRA for ERC Refinery at Mostorod, Egypt – Final, Rev 2
Egyptian Refining Company
Page 15
DNV ENERGY
32345260
6.2 Flash Fire Hazards
The contours shown in Appendix V show that the largest individual risk contours, i.e. those that almost reach the residential populations / areas, are dominated by the flash fire hazards. The on-site risks are generally dominated more by the immediate ignition hazards – jets, pools, fireballs – although it should be emphasised (again) that the on-site effects modelled in this study are under-predicted by neglecting the smaller (higher frequency) hazards that will apply. Given that flash fires are the key influence on the potential risks to the public (or at least to the key off-site populations), it should be noted that: • It is not credible to expect off-site populations to control ignition sources or to be able to
escape / shelter in the event of a major release. Hence the emphasis on risk reduction should be on preventative measures, i.e. to minimise the potential for leaks to occur. This would chiefly be achieved through appropriate design (to recognised standards) and through effective inspection, testing and maintenance plans / procedures.
• Rapid isolation of significant leaks will not eliminate the risks but will help to minimise the hazards and, particularly, the ignition probability (by limiting the total mass of flammable vapour released). For isolation to be effective, first requires detection to occur and hence best practise fire and gas detection systems, with associated shutdown systems and procedures, will be important mitigation measures.
• Note that some of the more significant vapour cloud hazard ranges will occur from vaporisation of pools, leading to dense vapour clouds. There is some potential to mitigate against vaporisation through the application of foam. However, the success of such techniques is dependent on the judgement of personnel regarding when to apply and the benefits are difficult to quantify. Hence this kind of measure may be part of the demonstration that all practical measures to reduce risks are in place, but should not be a measure that is relied on solely
It should be recognised that it is not necessarily practical for refineries to have automatic shutdown systems and there will inevitably be a tendency for operators to establish the exact nature of a release before isolation occurs. This is reasonably well accepted, and it is unusual to rely on isolation occurring in less than 5 minutes for a typical refinery QRA study. However, two alternative approaches, or philosophies, that should be considered in this respect are to: • Specify automatic shutdown on confirmed gas detection (or appropriate process alarms)
for identified key inventories. This is not typically done, but may be considered either for inventories over a certain size of volatile liquid, or for certain sections of the plant that are identified as “higher risk” by detailed risk analysis.
• Ensure that the systems, procedures and training are in place to enable operators to rapidly determine the scale of any release that occurs, with particular regard to the potential for off-site effects. This may include CCTV, best-practice control systems, wind direction information, etc, where the key aspect will be to ensure that isolation can be rapidly activated when significant off-site risk potential is likely (noting that releases of this magnitude will, inevitably, also have significant on-site and asset risk issues).

December 2008
High-level QRA for ERC Refinery at Mostorod, Egypt – Final, Rev 2
Egyptian Refining Company
Page 16
DNV ENERGY
32345260
6.3 Toxic Hazards
The extent of the toxic hazard ranges will be sensitive to the composition of the feed to each unit in terms of the proportion of H2S that applies, where: • The greatest toxicity will apply to the Amine Treatment, Sour Water Stripper and Sulphur
Recovery units, each of which will include some process streams that contain close to 100% H2S. These will have potentially significant hazard ranges, although it should be noted that the pressure of these units is low, which limits the maximum effects.
• Toxic impacts will depend on the combination of the exposure duration and the toxic concentration.
• Significant hazard ranges will also apply to other units, where flammable vapour cloud releases from some sections may also contain significant compositions of H2S. Typically the H2S content is a maximum of 10% (by mole), although this can increase for certain sections. The toxic effects associated with these releases should not be neglected, noting that these will apply for any release, as opposed to flammable impacts which are only realised if ignition occurs.
• However, the hazard range for significant toxic impacts is generally less than the distance to the lower flammable limit. Hence, although the toxic impacts are significant, in terms of the maximum hazard ranges the flammable effects are generally the dominant aspect.
On the basis of the above, toxic impacts have not been considered to be a high priority for this high-level study, due to the focus on identifying the maximum hazard ranges, i.e. the flammable vapour clouds will tend to be the key aspects for off-site populations. However, as indicated above, it is essential that toxic risk contributions are considered in any subsequent detailed risk analysis, as their contribution to both on and off site risks will be significant in refineries with significant sour feed (i.e. high H2S compositions). Although there are various measures that can protect workers from toxic effects (PPE, toxic refuges, etc), the measures discussed in Section 6.2 are also applicable with respect to the toxic hazards that would accompany some of the major release scenarios. That is, escape of ‘the public’ cannot be relied upon and hence the emphasis should be on prevention of leaks and on rapid detection / isolation of any major releases that do occur. Note that the latter will be more effective with respect to toxic effects, which are dependent on the exposure duration than for flammable hazards.
6.4 Jet and Pool Fire, Fireball Hazards
Each of the jet, pool and fireball hazards shown in Appendix V have significant consequences and frequencies, but do not represent significant hazards to the residential populations. Note that the above conclusion is based on modification of the initial pool fire results, as discussed in Appendix V. That is, the ‘initial base case’ pool fire results assume unrestricted pool spread, which is considered to lead to overly conservative analysis, particularly for off-site hazards. The ‘base case’ results presented in this study have been adjusted by ensuring that the maximum extent of a pool fire is restricted to the extent of the relevant unit. In this case there will be potential for radiation effects to extend beyond the facility limits, but not to result in credible hazards to the residential populations.

December 2008
High-level QRA for ERC Refinery at Mostorod, Egypt – Final, Rev 2
Egyptian Refining Company
Page 17
DNV ENERGY
32345260
These jet, pool and fireball hazards hazards are, therefore, not considered further with respect to off-site populations. However, the on-site hazards for these events will be significant and will tend to dominate the risks to workers. They will also have potential impacts to the adjacent industrial facilities. The primary mitigation measures are to prevent leaks from occurring as far as is possible, as well as to minimise the potential for ignition to occur. For pool fires, drainage and active fire protection systems will also mitigate the hazards to some extent. The on-site buildings should be designed against the potential fire impacts, or loads, i.e. the combination of thermal radiation and duration that may potentially lead to damage. It should be noted that: • The hazard frequency contours represent radiation levels and durations (i.e. all durations)
that are relevant to risks to people; building damage will typically require longer duration events and/or much higher radiation levels.
• In general, buildings that are designed to withstand explosion impacts (i.e. blast loads) will inherently have an appropriate degree of resistance to fire loads. The fire loads should be confirmed during the detailed design stage, but at this stage it can reasonably be assumed that the explosion loads will drive the location and/or design of the on-site buildings.

December 2008
High-level QRA for ERC Refinery at Mostorod, Egypt – Final, Rev 2
Egyptian Refining Company
Page 18
DNV ENERGY
32345260
7.0 Conclusions
7.1 Risk criteria
Individual risks are the key measure of risk acceptability for this type of study, where it is proposed that: • Risks to the public can be considered to be broadly acceptable (i.e. ‘negligible’ in terms of
risk acceptance criteria) if below 10-6 per year. Although risks of up to 10-4 per year may be considered acceptable if shown to be As Low As Reasonably Practicable (ALARP), it is recommended that 10-5 per year is adopted for this study as the maximum tolerable criterion.
• Risks to workers can be considered to be broadly acceptable (or ‘negligible’) if below 10-5 per year and where risks of up to 10-3 per year may be considered acceptable if ALARP.
Societal risk criteria are also proposed, although these should be used as guidance only. A criterion of 10-4 per year is recommended for determining design accidental loads for on-site buildings, i.e. buildings should be designed against the fire and explosion loads that occur with a frequency of 1 in 10,000 years.
7.2 Risks to the Public (Off-site)
In relation to the individual risk contours to the identified off-site populations, for the latest layout option, Case 10, it can be concluded that:
• The risks to the off-site residential populations can be shown to be broadly acceptable.
• This is based on the fact that the 10-7 (and 10-8) per year contours only just reach the edge of the key residential population to the South East of the facility, leaving a reasonable safety margin between the 10-6 per year contours and the residential populations.
It should be noted that the largest hazards and the associated risk contours extend towards the nearest residential populations, although they do not reach, and that the results are based on necessarily high-level analysis. Hence, it is important that the above conclusions are confirmed by updated risk analysis as the detailed design is developed. The potential risks to the identified residential populations (i.e. the hazards / risks that extend closest to these populations) are dominated by the flash fire hazards, i.e. delayed ignition of vapour clouds that disperse significant distances. Some toxic impacts may also apply at a similar range. Jet and pool fire hazards, i.e. immediate ignition events, will extend off-site and will be significant risk contributors close to the facility, but will not reach close to the residential populations considered.
7.3 Risks to Workers (On-site)
The predicted 10-4 and 10-5 per year individual risk contours have potential to affect the adjacent industrial populations, including the existing refinery, as well as the on-site workers associated with the expansion facilities. These risks are potentially significant but are likely to be at manageable levels (i.e. tolerable if ALARP) when accounting for the time spent in different areas and the potential mitigation afforded by existing buildings. As for the risks to

December 2008
High-level QRA for ERC Refinery at Mostorod, Egypt – Final, Rev 2
Egyptian Refining Company
Page 19
DNV ENERGY
32345260
the public, these risks should be considered further when the layout and manning levels are finalised, i.e. by updated risk analysis as the detailed design is developed.
7.4 Key Hazards
7.4.1 On-site
The 10-4 per year 0.3 barg contours are indicative of the typical criterion for potential escalation and significant asset damage. These would be expected to cover significant parts of the HCU as well as the process units to the East of the proposed plot, the DHT / DEU, NHT / CCR and DCU units. This suggests that attention should be given to the detailed layout of these units with respect to the potential for escalation and, hence, whether greater separation is achievable or whether passive fire protection is needed on key inventories / equipment items (such as adjacent piperacks). Note that, the explosion frequency contours suggest that all buildings within the main process units should have protection against blast loads of at least 0.1 barg, if designing against a 10-4 per year criterion. Location of such buildings should consider (and hence avoid) the peak 10-4 per year explosion loads, which can exceed 0.3 barg in these areas. Despite the analysis of on-site risks being relatively high-level, the above can be concluded with reasonable confidence, based on numerous similar studies conducted by DNV combined with the initial results.
7.4.2 Off-site
The predicted 0.07 barg contours can be taken as broadly indicative of the threshold against which unprotected buildings (e.g. houses) should be located. These contours do not reach the residential areas to the East of the facility. Lower overpressure levels, such as the 0.03 barg contours, will reach the residential areas to the South East – and potentially also to the West and South - with a frequency of greater than 10-5 per year. This level of overpressure is generally taken as the threshold for window breakage and corresponds to the potential for light building damage. Fatalities would not normally be expected at this level of overpressure (although there is always some potential where breaking glass is involved) and hence it is not considered practical to locate buildings outside these contours.

December 2008
High-level QRA for ERC Refinery at Mostorod, Egypt – Final, Rev 2
Egyptian Refining Company
Page 20
DNV ENERGY
32345260
8.0 Recommendations
8.1 Further Risk Assessment
Although the results of this high-level analysis show that the risks to the public are broadly acceptable (or negligible), they will be sensitive to the specific design and/or modelling assumptions used. Hence it is considered to be essential that the detailed design is accompanied by further (updated) risk analysis to demonstrate (i.e. confirm) that the risks to off-site populations are within acceptable levels and that they can be shown either to be broadly acceptable, or at least to be As Low As Reasonably Practicable (ALARP). The further risk analysis should also cover the on-site risks, to people, as well as the potential for escalation and risks to assets. The main aim of further analysis would be to demonstrate that the risks are, and remain, acceptable through the detailed design stage, with particular respect to: • Ensuring that the maximum hazard ranges predicted in this study are not exceeded
(given the potential for a step change in societal risks). • Quantifying (and subsequently managing) the potentially significant risks to workers in
adjacent facilities. • Assessing the implications of the limited space that is available – to ensure that the
potential for escalation / asset damage is within ‘best-practice’ levels, or at least has adequate mitigation.
8.2 General Recommendations
The discussion given in Sections 5.0 and 6.0 includes a number of recommendations. To avoid repetition, the following aims to present a simplified list of the key recommendations, where more detail is provided on each within Sections 5.0 and 6.0. • The potentially affected populations should be assessed in more detail, including
confirmation of:
- The land-use of the open land between the residential areas and the refinery. - The extent of the nearest residential areas and the population density in each. - The limits of the future land-use near to the refinery. - The detailed on-site populations, such as for the adjacent facilities.
• Given that the flash fire hazards (i.e. delayed ignition of flammable vapour clouds) are key with respect to the risks to residential populations, and are sensitive to the wind conditions, it would be prudent to obtain more detailed wind rose data for the site if possible.
• The emergency response procedures for the facility should be common to the ERC facilities and those of the adjacent industrial facilities. If practical the emergency response / plan should be developed for the site / complex as a whole, based on understanding of the risks to and from each of the different plants / units / facilities.

December 2008
High-level QRA for ERC Refinery at Mostorod, Egypt – Final, Rev 2
Egyptian Refining Company
Page 21
DNV ENERGY
32345260
• The on-site explosion hazards should be considered in more detail once the layout is confirmed, although it is likely that:
- The 10-4 per year 0.3 barg contours are expected to cover significant parts of the HCU as well as the process units to the East of the proposed plot, the DHT / DEU, NHT / CCR and DCU units. This suggests that attention should be given to the detailed layout of these units and associated piperacks / pipeways with respect to the potential for escalation.
- All buildings within the main process units should have protection against blast loads of at least 0.1 barg, if designing against a 10-4 per year criterion.
- Location of such buildings should avoid the peak 10-4 per year explosion loads, which can exceed 0.3 barg in these areas.
• The emphasis on risk reduction should be on preventative measures, i.e. to minimise the potential for leaks to occur. This would chiefly be achieved through appropriate design (to recognised standards) and through effective inspection, testing and maintenance plans / procedures.
• Rapid isolation of significant leaks will not eliminate the risks but will help to minimise the hazards and, particularly, the ignition probability (by limiting the total mass of flammable vapour released). For isolation to be effective, first requires detection to occur and hence best practise fire and gas detection systems, with associated shutdown systems and procedures, will be important mitigation measures.
• Consideration should also be given to the philosophy required for shutdown (i.e. whether automatic shutdown is a desired option or not).

December 2008
High-level QRA for ERC Refinery at Mostorod, Egypt – RISK CRITERIA
Egyptian Refining Company DNV ENERGY
32345260 r2
Appendix I – Risk Acceptance Criteria

December 2008
High-level QRA for ERC Refinery at Mostorod, Egypt – RISK CRITERIA
Egyptian Refining Company DNV ENERGY
32345260 r2
contents:
I.1.0 Introduction.........................................................................................................1
I.2.0 Basis for Criteria.................................................................................................1
I.2.1 Need for Criteria .................................................................................................1
I.2.2 Principles for Setting Risk Criteria ......................................................................1
I.2.3 Framework .........................................................................................................2
I.3.0 Proposed Risk Criteria........................................................................................4
I.3.1 Individual Risk ....................................................................................................4
I.3.2 Societal Risk.......................................................................................................7
I.4.0 References .........................................................................................................8
abbreviations: The abbreviations used within this appendix are listed below:
ALARP As Low As Reasonably Practicable
DNV Det Norske Veritas
HSE (UK) Health and Safety Executive

December 2008
High-level QRA for ERC Refinery at Mostorod, Egypt – RISK CRITERIA
Egyptian Refining Company
Page I.1
DNV ENERGY
32345260 r2
Appendix I – Risk Acceptance Criteria
I.1.0 Introduction
This appendix introduces the concept of risk acceptance criteria and the As Low As Reasonably Practicable (ALARP) principle, and proposes risk acceptance criteria to be used as guidance for this study. It should be emphasised that the selection of criteria is open to interpretation, in the absence of any formal local regulations, but where the intention of this study is to use criteria that are consistent with internationally accepted practice. • Section I.2.0 describes the basis for the risk criteria, introducing the widely accepted As
Low As Reasonably Practicable (ALARP) concept. • Section I.3.0 sets out the criteria that are proposed for this study, covering both individual
and societal risk criteria.
I.2.0 Basis for Criteria
I.2.1 Need for Criteria
A risk analysis provides measures of the risk resulting from a particular facility or activity. However, the assessment of the acceptability (or otherwise) of that risk is left to the judgement and experience of the people undertaking and/or using the risk analysis work. The normal approach adopted is to relate the risk measures obtained to acceptable risk criteria. A quantitative risk analysis produces only numbers, which in themselves provide no inherent use. It is the assessment of those numbers that allows conclusions to be drawn and recommendations to be developed. The assessment phase of a study is therefore of prime importance in providing value from a risk assessment study.
I.2.2 Principles for Setting Risk Criteria
Given that society accepts hazardous activities in principle, and does not have limitless resources to devote to their safety, the following set of principles is considered by some to be appropriate when making decisions about their acceptability in specific cases: (1) The activity should not impose any risks which can reasonably be avoided. (2) The risks should not be disproportionate to the benefits (in terms of jobs, tax
revenues and finished products) which the activity produces. (3) The risks should be equitably distributed throughout the society in proportion to the
benefits received. (4) The risks should be revealed in minor accidents which the emergency services can
cope with, rather than in catastrophes. In reality, principles such as these are impossible to achieve. In fact, when resources are limited, such principles may be in conflict with each other. For example, reducing catastrophic risks may require expenditure that could have saved more lives from low-fatality accidents.
December 2008
High-level QRA for ERC Refinery at Mostorod, Egypt – RISK CRITERIA
Egyptian Refining Company
Page I.2
DNV ENERGY
32345260 r2
The following approach is proposed for assessing the risks from any hazardous activity, being the nearest practical approach to the ideal situation:
• Individual risk criteria should be used to limit risks to individual workers and members of the public. These address the equity requirement (3) above insofar as it applies to individuals.
• Societal risk criteria should be used to limit risks to the affected population as a whole. These attempt to address requirement (2) above, although in a necessarily crude fashion since the benefits of hazardous activities are even more difficult to quantify than their risks. They also address the equity requirement (3) above insofar as it applies to communities. By expressing societal risk criteria on a frequency-fatality (FN) curve, they can also address the catastrophe risk in requirement (4) above.
• Cost-benefit analysis should be used to ensure that, once the above criteria are satisfied, an optimum level of safety measures is chosen for the activity, taking costs as well as risks into account. This addresses requirement (1) above.
An activity is said to have tolerable risks if it satisfies all three aspects of this approach, and intolerable risks if it fails to meet any of them. Leaving aside other inputs to the decision, an activity with tolerable risks would generally be regarded as acceptable to the company, the regulatory authority and the public, while an activity with intolerable risks would generally be regarded as unacceptable.
I.2.3 Framework
The simplest framework for risk criteria is a single risk level which divides tolerable risks from intolerable ones (i.e. acceptable activities from unacceptable ones). Such criteria give attractively simple results, but they need to be used very carefully, because they do not reflect the uncertainties both in estimating risks and in assessing what is tolerable. For instance, if applied rigidly, they could indicate that an activity which just exceeded the criteria would become acceptable as a result of some minor remedial measure which in fact scarcely changed the risk levels. A more flexible framework specifies a level, usually known as the maximum tolerable criterion, above which the risk is regarded as intolerable whatever the benefit may be, and must be reduced. Below this level, the risks should also be made as low as reasonably practicable (ALARP). This means that when deciding whether or not to implement risk reduction measures, their cost may be taken into account, using cost-benefit analysis. In this region, the higher the risks, the more it is worth spending to reduce them. If the risks are low enough, it may not be worth spending anything, and the risks are then regarded as negligible. This approach can be interpreted as dividing risks into three tiers as is illustrated in Figure I.2.1.
• An upper band where risks are intolerable whatever the benefit the activity may bring. Risk reduction measures or design changes are considered essential.
• A middle band (or ALARP region) where the risk is considered to be tolerable only when it has been made ALARP. This requires risk reduction measures to be implemented if they are reasonably practicable, as evaluated by cost-benefit analysis.

December 2008
High-level QRA for ERC Refinery at Mostorod, Egypt – RISK CRITERIA
Egyptian Refining Company
Page I.3
DNV ENERGY
32345260 r2
• A negligible region where the risks are negligible and no risk reduction measures are needed.
There is some consensus on this three-band approach, and versions are used by the UK, Dutch, Swiss and US Santa Barbara criteria. Figure I.2.1 - ‘ALARP’ Framework for Risk Criteria
HIGH RISK
LOW RISK
Maximum
Tolerable
Criterion
Negligible
Criterion
INTOLERABLE
RISK
RISK TOLERABLE IF
ALARP
(AS LOW AS REASONABLY
PRACTICABLE)
NEGLIGIBLE RISK
December 2008
High-level QRA for ERC Refinery at Mostorod, Egypt – RISK CRITERIA
Egyptian Refining Company
Page I.4
DNV ENERGY
32345260 r2
I.3.0 Proposed Risk Criteria
I.3.1 Individual Risk
Individual risk is widely defined as the risk of fatality (or serious injury) experienced by an individual, noting that the acceptability of individual risks should be based on that experienced by the most exposed (i.e. ‘worst-case’) individual. The most widely-used criteria for individual risks are the ones proposed by the UK HSE (Reference 1), noting that these have also been interpreted for projects in Egypt in a number of previous studies conducted by DNV. These UK HSE criteria are: • A maximum tolerable individual risk for workers of 10-3 per year (1 in 1000 years). • A maximum tolerable individual risk for members of the public of 10-4 per year (i.e. 1 in
10,000 years). • The acceptable criterion, for both workers and public, corresponding to the level below
which individual risks can be treated as effectively negligible, is 10-6 per year (i.e. 1 in 1,000,000 years)
• Between these criteria the risks are in the ‘ALARP’ or tolerability region. In this region the risks are acceptable only if demonstrated to be As Low As Reasonably Practicable.
In terms of the acceptability of individual risks, it should be noted that:
• Individual risks are typically presented as contours that correspond to the risk experienced by a person continuously present, outdoors, at each location.
• While people are unlikely to remain “continuously present, outdoors” at a given point, the individual risk levels used to assess residential developments are not modified to account for any presence factor or the proportion of time spent indoors. That is, it should be conservatively assumed that dwellings are occupied at all times and that domestic properties offer no real protection against the potential hazards. Hence, the individual risks contours can be used directly with respect to the public, while for workers it is more appropriate to consider the most exposed individual (accounting for the time they spend in different areas, indoors, away from the hazards, etc).
• The individual risk criteria proposed for the public correspond to an individual having a chance of death or serious injury (due to the hazards assessed) of between 1 in 10,000 and 1,000,000 years. To put these risks into context, note that the risk of death in the UK due to road accidents is just over 1 in 10,000 years, while the risk of an individual being struck by lightning is widely quoted as being 1 in 10,000,000 years.
• For risks approaching the maximum tolerable individual risk level for the public of 10-4 per year (1 in 10,000 years) to be considered to be acceptable, it should be demonstrated that all reasonably practicable measures to minimise the risks have been, or will be, taken. The same applies for risks closer to the acceptable criterion of 10-6 per year, but where the degree of effort (and expenditure) that would be considered to be practicable would be less.
It should be emphasised that a variety of individual risk criteria are used worldwide, as shown by selected examples given in Table I.3.1, below: • For risks to the public a lower / tolerable criterion of 10-6 per year is widely accepted.
However, lower values are adopted by some companies and legislators. For example,

December 2008
High-level QRA for ERC Refinery at Mostorod, Egypt – RISK CRITERIA
Egyptian Refining Company
Page I.5
DNV ENERGY
32345260 r2
Statoil have a lower criterion of 10-7 per year and where for new facilities the Dutch authorities use 10-6 per year as the upper / maximum criterion.
• It should also be noted that lower criteria are often adopted with respect to vulnerable populations, such that schools and hospitals, for example, should be located such that the individual risks are well below 10-6 per year.
• The maximum criterion for the public varies between 10-3 and 10-5 per year (or lower in some cases – as indicated above). The UK HSE value of 10-4 per year is maintained in this study as a representative maximum. However, it should be emphasised that this is a maximum value and it would be extremely rare for this level to be considered acceptable for a new facility / development. That is, there is unlikely to be sufficient justification that there are no practicable methods of reducing this level of risk. In fact, it is considered to be best practice to treat 10-6 per year as the target criterion, while risks of up to 10-5 per year would require strong justification and risks above 10-5 per year should be avoided with respect to the public.
• It should, in any case, be emphasised that risks above 10-6 per year are acceptable only if shown to be ALARP.
• The converse applies to some extent to for risks to workers. Table I.3.1 shows that, although the maximum criterion does vary, the ALARP / tolerable region is generally between 10-3 and 10-6 per year, as per the UK HSE approach. However, for most workers (particularly those in a refinery) it is accepted that 10-6 per year risks levels are not practical to achieve and the target typically adopted is to achieve individual risks to workers of between 10-5 and 5 x 10⁻⁵ per year.
In summary, it is proposed that the following criteria are adopted for this study: • Risks to the public can be considered to be broadly acceptable if below 10-6 per year,
although noting that societal risk factors should also be considered (including the type of population potentially exposed). Although risks of up to 10-4 per year may be considered acceptable if shown to be ALARP, it is recommended that 10-5 per year is adopted for this study as the maximum tolerable criterion.
• Risks to workers can be considered to be broadly acceptable if below 10-5 per year and where risks of up to 10-3 per year may be considered acceptable if ALARP.
• The above have been added to Table I.3.1 and are illustrated by Figure I.3.1. Table I.3.1 – Comparison of Selected Individual Risk Criteria
Public Workers
Body / Company Maximum
Broadly
Acceptable Maximum
Broadly
Acceptable
UK HSE 10-4 / 10-5 * 10-6 10-3 10-6
Qatar Petroleum 10-3 / 10-4 * 10-6 10-3 / 10-4 * 10-6
ADNOC / KOC 10-4 10-6 10-3 10-5
BG Corporate 10-5 - 10-3 10-6
Chevron 10-4 / 10-5 * 10-6 10-3 / 5 x 10-4 * 10-6
Repsol 10-5 10-6 (10-8) # 10-3 10-4 (10-6) #
Proposed ERC 10-5 10-6 10-3 10-5
Note *: Where two values are given the lower value is for new plant and the higher for existing plant.
Note #: Two levels of ALARP used – as indicated by the values in brackets.

December 2008
High-level QRA for ERC Refinery at Mostorod, Egypt – RISK CRITERIA
Egyptian Refining Company
Page I.6
DNV ENERGY
32345260 r2
Figure I.3.1 – Individual Risk Criteria Proposed for ERC
Risks to the Public Risks to Workers
1 in 100 years (10-2 per year) Unacceptable Unacceptable
1 in 1000 years (10-3 per year)
ERC maximum tolerable criterion -
public
ERC maximum tolerable criterion -
workers
1 in 10,000 years (10-4 per year)ERC maximum tolerable criterion -
public Acceptable if ALARP
1 in 100,000 years (10-5 per year)
ERC maximum tolerable criterion -
public
ERC broadly acceptable
(negligible) criterion - workers
Acceptable if ALARP
1 in 1,000,000 years (10-6 per year)
ERC broadly acceptable
(negligible) criterion - public
Broadly acceptable (negligible) Broadly acceptable (negligible)

December 2008
High-level QRA for ERC Refinery at Mostorod, Egypt – RISK CRITERIA
Egyptian Refining Company
Page I.7
DNV ENERGY
32345260 r2
I.3.2 Societal Risk
A proposed criterion for Societal Risk is set out in Figure I.3.2 in the form of an F-N curve, which gives the cumulative frequency (F) of exceeding a number of fatalities (N). It is important to note that the acceptability of societal risks can be subjective and depends on a number of factors (such as the benefits versus the risks that a facility provides). There is not a single established indicator in terms of societal risk. For example, the UK HSE do not apply specific societal risk criteria in general, although they are applied to particular sites such as ports. Instead, the emphasis is placed on demonstrating that the risks are ALARP, where judgement on the ultimate acceptability of the risks is determined on a case by case basis. However, the UK HSE do quote a single point risk criterion which has been interpreted to form a F-N criterion, as shown in Figure I.3.2, which has been applied in a number of recent studies conducted by DNV. The maximum tolerable risk line is based on a standard 1:1 slope through the UK HSE’s quoted intolerable societal risk level of “50 or more fatalities occurring with a frequency of 1 in 5000 years”1. The minimum (broadly acceptable) risk line is simply assumed to be two orders of magnitude lower. This is considered to provide a useful guidance on the acceptability of societal risk, although it should be emphasised that the criteria are not as widely accepted as individual risk and should be used as guidance only.
1 This is N = 50 and F = 2 x 10
-4 per year.

December 2008
High-level QRA for ERC Refinery at Mostorod, Egypt – RISK CRITERIA
Egyptian Refining Company
Page I.8
DNV ENERGY
32345260 r2
Figure I.3.2 - ‘UK HSE’ (DNV Interpretation) Societal Risk Criteria (F-N Curve)
1.0E-07
1.0E-06
1.0E-05
1.0E-04
1.0E-03
1.0E-02
1.0E-01
1.0E+00
1 10 100 1000
Number of fatalities (N)
Fre
qu
en
cy
pe
r y
ea
r (F
)
Minimum (broadly acceptable)
Maximum tolerable
INTOLERABLE RISK
NEGLIGIBLE RISK
TOLERABLE
IF ALARP
1.0E-07
1.0E-06
1.0E-05
1.0E-04
1.0E-03
1.0E-02
1.0E-01
1.0E+00
1 10 100 1000
Number of fatalities (N)
Fre
qu
en
cy
pe
r y
ea
r (F
)
Minimum (broadly acceptable)
Maximum tolerable
INTOLERABLE RISK
NEGLIGIBLE RISK
TOLERABLE
IF ALARP
I.4.0 References
1 UK HSE, Reducing Risk Protecting People – HSE’s decision making process (R2P2),
1999, HMSO, 2001, ISBN 0 717621510.

December 2008
High-level QRA for ERC Refinery at Mostorod, Egypt – ASSUMPTIONS
Egyptian Refining Company DNV ENERGY
32345260 r2
Appendix II – Assumptions

December 2008
High-level QRA for ERC Refinery at Mostorod, Egypt – ASSUMPTIONS
Egyptian Refining Company DNV ENERGY
32345260 r2
contents: II.1.0 Introduction.........................................................................................................1
II.2.0 Background Data Assumptions ..........................................................................3
II.2.1 Weather Categories............................................................................................3
II.2.2 Wind Direction ....................................................................................................4
II.2.3 Atmospheric Parameters ....................................................................................5
II.2.4 Ignition Sources..................................................................................................6
II.2.5 Congested Volumes ...........................................................................................8
II.2.6 Populations.......................................................................................................11
II.3.0 Impact Criteria Assumptions.............................................................................12
II.3.1 Vulnerability / Impact Criteria - Summary .........................................................12
II.3.2 Vulnerability / Impact Criteria – Fires and Explosions ......................................13
II.3.3 Vulnerability / Impact Criteria - Toxics ..............................................................14
II.4.0 Failure Case Definition Assumptions................................................................15
II.4.1 Failure Cases (Sections) - Definition ................................................................15
II.4.2 Failure Cases (Sections) - Parameters.............................................................16
II.4.3 Failure Cases (Sections) – Release Types ......................................................17
II.4.4 Failure Case Parameters – Release Rate / Duration .......................................18
II.4.5 Failure Case Parameters - Inventory................................................................20
II.4.6 Failure Case Parameters – Release Duration ..................................................21
II.4.7 Failure Case Parameters – Others...................................................................22
II.5.0 Frequency Analysis Assumptions.....................................................................23
II.5.1 Generic Failure Data - Process ........................................................................23
II.6.0 Consequence Analysis Assumptions................................................................25
II.6.1 Consequences – General.................................................................................25
II.6.2 Dispersion Modelling ........................................................................................26
II.6.3 Explosion Modelling..........................................................................................27
II.6.4 Fire Modelling...................................................................................................28
II.7.0 Risk Analysis Assumptions...............................................................................29
II.7.1 The BLAST Risk Software................................................................................29
II.7.2 Ignition Probability Model .................................................................................32
II.7.3 Explosion Probability Model .............................................................................33
II.8.0 References .......................................................................................................34

December 2008
High-level QRA for ERC Refinery at Mostorod, Egypt – ASSUMPTIONS
Egyptian Refining Company DNV ENERGY
32345260 r2
abbreviations: The abbreviations used within this appendix are listed below:
API (RP) American Petroleum Institution (Recommended Practice)
BLEVE Boiling Liquid Expanding Vapour Explosion
CIA Chemical Industries Association (UK)
CLA Cox, Lees and Ang (ignition model)
DNV Det Norske Veritas
ERC Egyptian Refining Company
ESD Emergency Shut Down (Valve)
HCRD HydroCarbon Release Database
HSE (UK) Health and Safety Executive
HX Heat Exchanger
HVAC Heating Ventilation Air Conditioning
LFL Lower Flammable Limit
LPG Liquefied Petroleum Gas
NFPA National Fire Protection Association (US)
NFR Normal Flow Rate
PFD Process Flow Diagram
QRA Quantitative Risk Assessment
TNO TNO Bedrijven BV (Dutch)
VCE Vapour Cloud Explosion

December 2008
High-level QRA for ERC Refinery at Mostorod, Egypt – ASSUMPTIONS
Egyptian Refining Company
Page II.1
DNV ENERGY
32345260 r2
Appendix II – Assumptions
II.1.0 Introduction
The basic aim of this Assumptions appendix is to document the details underpinning this Quantitative Risk Assessment (QRA) study. Being a high-level study, there are two distinct aspects to the assumptions and methodology. Background data: • The site-specific aspects that apply (or potentially apply) to each of the release scenarios
(failure cases) modelled are referred to as ‘background data’. This covers the meteorological conditions, as well as potential ignition sources and congested volumes that are specific to the site (and to the proposed layout), and the potentially exposed populations.
• These aspects are modelled as realistically as possible to represent the proposed layout / design of the new refinery facilities at Mostorod, and are covered within Section II.2.0.
• Note that the layout used as the basis for this study is the “Case 10” layout, which is shown in Figure II.1.1, below.
General assumptions: • For the purposes of this high-level QRA a relatively coarse approach has been adopted in
focussing on the key risk contributors, particularly with respect to the potential off-site hazards.
• Most of the failure cases defined (see Appendix III) are derived from previous studies and applied directly to the background data described above. Hence, the detailed assumptions underpinning the analysis primarily relate to the overall approach, which is described in the main report (see also Appendix III).
• However, the basic methodology adopted by DNV for studies of this kind is set out in Sections II.3.0 to II.7.0, in order to describe the basis for the defined scenarios and modelling approach. It should be emphasised that elements of these sections are generic and are intended to define the broad approach only, where specific assumptions may vary from failure case to failure case.
- Section II.3.0 - Impact Criteria Assumptions, - Section II.4.0 - Failure Case Definition Assumptions - Section II.5.0 - Frequency Analysis Assumptions - Section II.6.0 - Consequence Analysis Assumptions - Section II.7.0 - Risk Analysis Assumptions
References are given in Section II.8.0.

December 2008
High-level QRA for ERC Refinery at Mostorod, Egypt – ASSUMPTIONS
Egyptian Refining Company
Page II.2
DNV ENERGY
32345260 r2
Figure II.1.1 – “Case 10” Layout (Main Plant Sections)

December 2008
High-level QRA for ERC Refinery at Mostorod, Egypt – ASSUMPTIONS
Egyptian Refining Company
Page II.3
DNV ENERGY
32345260 r2
II.2.0 Background Data Assumptions
II.2.1 Weather Categories
Project: 32345260: ERC Refinery, Mostorod
Calculation Run: All Rev.: 0 Date: June 2008
As well as the wind direction (see Assumption II.2.2), the actual weather conditions, in terms of the wind speed and the stability (a measure of atmospheric turbulence), determine how quickly the flammable plume disperses to lower non-hazardous concentrations. In the absence of detailed meteorological data (i.e. covering the stability categories), two representative weather conditions are applied to model the dispersion of each release scenario. These are D5 and F2 conditions, which are widely adopted (such as by NFPA and the UK HSE) as broadly representative of ‘typical’ and ‘worst-case’ dispersion conditions, respectively:
• D5 – neutral stability (D) and 5 m/s wind speed.
• F2 – stable (F) conditions and 2 m/s wind speed. UK HSE guidance suggests that good practice for QRA studies is to assume that D5 conditions apply for 80% of the time and F2 for the remaining 20% - again, in the absence of detailed data only. Although based on the UK, DNV’s experience of conducting QRA worldwide suggests that this provides a reasonably representative (and slightly conservative) basis when compared against local weather conditions.
Comments:
The weather conditions can have a significant influence on flammable (and toxic) vapour cloud dispersion, which will be of most relevance with respect to the largest release scenarios and their potential off-site impacts. Typically (but not always) F2 conditions will represent the maximum hazard ranges, noting that they are unlikely to occur for as much as 20% of the time in practice. The risks will, therefore, be sensitive to the above assumption, although it should be noted that the above is widely used for this kind of study and considered to be sufficiently representative for a high-level assessment. (One aim of the study is to identify potential off-site risks and the need for more detailed consideration of specific details such as the prevailing weather categories.)

December 2008
High-level QRA for ERC Refinery at Mostorod, Egypt – ASSUMPTIONS
Egyptian Refining Company
Page II.4
DNV ENERGY
32345260 r2
II.2.2 Wind Direction
Project: 32345260: ERC Refinery, Mostorod
Calculation Run: All Rev.: 0 Date: June 2008
Wind rose data has been taken from a previous study conducted by DNV at Damietta, as summarised in Figure II.2.1, below. Due to the significant distance between Damietta and Cairo it must be emphasised that this is representative only, and should be updated if wind rose data for Cairo is available. However, it is understood that the prevailing wind direction throughout Egypt is from the North, as shown below (and confirmed by the prevailing wind direction of 355
o for Mostorod), and
hence the wind rose given is considered to be sufficiently representative for the purposes of this high-level QRA.
Figure II.2.1 – Wind Rose (Probability of Wind Direction)
0.0
0.1
0.1
0.2
0.20
30
60
90
120
150
180
210
240
270
300
330 All
D5
F2
Note that there is an offset of 9
o between True North and Plant North, which is accounted for in the risk
model. The above figure is based on True North. The data provided is based on annual averages and, hence, is applied to the risk model as being the same for all time periods (e.g. day and night).
Comments:
The probability of wind being from a particular direction will have a direct influence on the downwind risks and hence the prevailing wind will have an influence on the risks experienced at specific locations. Hence, it is important to consider the influence of the above on the results. This can be done qualitatively, using the base case results, although it is proposed that a uniform wind rose is used as a sensitivity case.

December 2008
High-level QRA for ERC Refinery at Mostorod, Egypt – ASSUMPTIONS
Egyptian Refining Company
Page II.5
DNV ENERGY
32345260 r2
II.2.3 Atmospheric Parameters
Project: 32345260: ERC Refinery, Mostorod
Calculation Run: All Rev.: 0 Date: June 2008
The representative atmospheric parameters that are applied to the consequence modelling are summarised in Table II.2.1, below. These are largely based on the data provided, measured at Mostorod between 2002 and 2006.
Table II.2.1 – Atmospheric Parameters
Parameter Value Unit Notes
Air Temperature 20 oC The range of min / max temperatures is 2 oC to 41oC, where 20 oC is taken as a representative base value.
Surface Temperature 20 oC Taken as the same as the air temperature, above.
Relative humidity 70 % Assumed. Note that the influence on dispersion / consequences is minor.
Surface roughness
1 m Representative parameter for regular large obstacles (process plants), based on PHAST default / TNO ‘Purple Book’ guidance.
Solar radiation 1 kW/m2 Assumed. Note that this will have a negligible influence on dispersion / consequences (with a minor influence on pool vaporisation and thermal radiation impacts).
Atmospheric pressure 1.013 bara PHAST default. Negligible influence on dispersion / consequences.
Comments:
As indicated in the above table, assumptions such as surface roughness can significantly affect the hazard ranges predicted for the worst-case release scenarios. However, the influence on most releases is minor and the purpose of the risk study is to determine the frequency of the most representative outcomes rather than to determine absolute worst-case dispersion ranges. Hence, the overall risks will be reasonably robust to the above assumptions.

December 2008
High-level QRA for ERC Refinery at Mostorod, Egypt – ASSUMPTIONS
Egyptian Refining Company
Page II.6
DNV ENERGY
32345260 r2
II.2.4 Ignition Sources
Project: 32345260: ERC Refinery, Mostorod
Calculation Run: All Rev.: 0 Date: June 2008
As detailed in Assumption II.7.2, the risk model applies release rate dependent ignition probabilities to each release scenario to account for the probability of ignition. Hence each release is assumed to have some probability of ignition, according to the size of the release, irrespective of the release / dispersion direction. In addition, any very strong ignition sources that are identified (open flames, or similar, that will result in certain ignition in the event that it comes into contact with a flammable release) are defined within the model. This provides an additional delayed ignition probability to account for any particularly strong ignition sources that will apply in specific release directions. Strong ignition sources typically include heaters, furnaces and boilers, but exclude gas turbines, substations, pumps, etc. Flares are also excluded on the basis of sufficient elevation. The default taken for furnaces, and similar, is a 1 m height, with an ignition probability of 1 and continuous presence / activation frequency. These default parameters are varied as appropriate to specific sources identified. The ignition sources identified for the base case analysis are listed in Table II.2.2 with the locations identified in Figure II.2.2 (both of which are appended to this Assumption sheet, below). As discussed above, these are strong ignition sources only, primarily boilers / furnaces only. The sources are identified from the respective unit plot plans (GS E&C Drawing No. 7T04-MP-15-PP-001, etc.), while the locations are determined using the overall plot plan (GS E&C Drawing No. 7T04-MP-00-PP-001 “move to south case 2”, May 2008).
Comments:
The strong ignition sources will have a significant local influence on the risks. However, due to the ‘background’ release rate based ignition probability all releases will have a representative ignition probability. This reduces the sensitivity of the results to specific ignition sources, although the overall ignition probability will have a direct influence on the risks, noting that the base case approach is considered to be consistent with ‘conservative best practice’. Note that the locations shown in Figure II.2.2 correspond to the previous revision of this report, based on the “Case 2” layout. The same ignition sources apply to the “Case 10” layout, but where the locations have been adjusted accordingly.

December 2008
High-level QRA for ERC Refinery at Mostorod, Egypt – ASSUMPTIONS
Egyptian Refining Company
Page II.7
DNV ENERGY
32345260 r2
Table II.2.2 – Strong Ignition Sources Applied to the Risk Model
ID Description (Tag Number) Type Notes
I1 VDU-H-2101 Heater Default of 1 m height, continuous
I2 DCU-H-2201 Heater As above
I3 DHT/DEU-H-1401 Heater As above
I4 HCU-H-1502 Heater As above
I5 HCU-H-1501 Heater As above
I6 NHT-H-1101 Heater As above
I7 NHT-H-1102 Heater As above
I8 NHT-H-1103 Heater As above
I9 CCR-H-1205 Heater As above
I10 CCR-H-1201/04 Heater As above
I11 H-3301A Heater As above
I12 H-3301B Heater As above
I13 SRU-Representative Furnace / etc As above
Figure II.2.2 – Locations of Strong Ignition Sources
I1 (VDU)
I4-5 (HCU)
I6-10 (CCR)
I11-12 (Utils) I3 (DHT/DEU)
I2 (DCU)
I13 (SRU)
I1 (VDU)
I4-5 (HCU)
I6-10 (CCR)
I11-12 (Utils) I3 (DHT/DEU)
I2 (DCU)
I13 (SRU)
Note: The locations shown correspond to the “Case 2” layout used for the previous (Rev 1) version of this QRA. The same ignition sources apply to the “Case 10” layout, but where the locations have been adjusted accordingly in the Rev 2 model.

December 2008
High-level QRA for ERC Refinery at Mostorod, Egypt – ASSUMPTIONS
Egyptian Refining Company
Page II.8
DNV ENERGY
32345260 r2
II.2.5 Congested Volumes
Project: 32345260: ERC Refinery, Mostorod
Calculation Run: All Rev.: 0 Date: June 2008
The explosion assessment is based on the Multi Energy Model (TNO, Reference 1) and is based around definition of congested volumes that have the potential to be explosion sources. The broad rule-set used to define the congested volumes within each of the units is set out below.
• All air coolers are assumed to provide a ‘roof’ which would constrain the expansion of any ignited gas, where the pipe-rack / pipework underneath would typically provide sufficient congestion for an explosion source. Where the height of the air coolers is not clear, a default height of either 10 or 15 m is assumed (drawing on experience of similar facilities).
• Where platforms are indicated on a plot plan it is assumed that they are there to provide access to equipment and taken to indicate a degree of congestion. The height of the congestion is generally taken as that of the platform, although a degree of judgement is applied according to the specific equipment / platform.
• Compressor (and other) shelters are to be included as appropriate, taken as the shelter volume less the equipment volume.
• Other congestions are more judgemental, but can include:
- The volume around reactors and columns, where the plot plan indicates a likelihood of congestion, up to a fraction of the height – usually taken as that of the nearest piperack.
- The volume associated with banks of vessels or heat exchangers where the gap between the equipment is small enough that flame propagation will occur.
• Linked volumes will form a single explosion source in the event of a vapour cloud covering some or all of the respective volumes; volumes that are not linked will lead to separate explosions occurring. Very broadly, the largest width or ‘diameter’ is used to estimate the likelihood of flame propagation between volumes, and hence to determine whether they are linked.
Each congested region is assessed against TNO guidance (References 1 and 2) to determine the peak overpressure that may arise following an explosion. For example, a 2-dimensional confinement, low obstacle density obstructed region is assigned a peak explosion overpressure of 0.5 barg (Multi-Energy explosion strength 6). The majority of volumes have higher obstacle density, which results in a Multi-Energy explosion strength of 7 being used in most cases. Note that the peak explosion overpressure assigned to any congested volume is capped at a maximum (default) value of 1 barg. Furthermore, the effect of flame reactivity is taken into consideration, where by default all flammable materials are assigned a conservative explosion strength of 7, while higher reactivity materials (e.g. ethylene and hydrogen) would be assigned higher explosion strengths (default value = 8). The congested volumes identified for the base case analysis are listed in Table II.2.3, with the locations identified in Figure II.2.3 (both of which are appended to this Assumption sheet, below). The sources are identified from the respective unit plot plans (GS E&C Drawing No. 7T04-MP-15-PP-001, etc.), while the locations are determined using the overall plot plan (GS E&C Drawing No. 7T04-MP-00-PP-001 “move to south case 2”, May 2008).
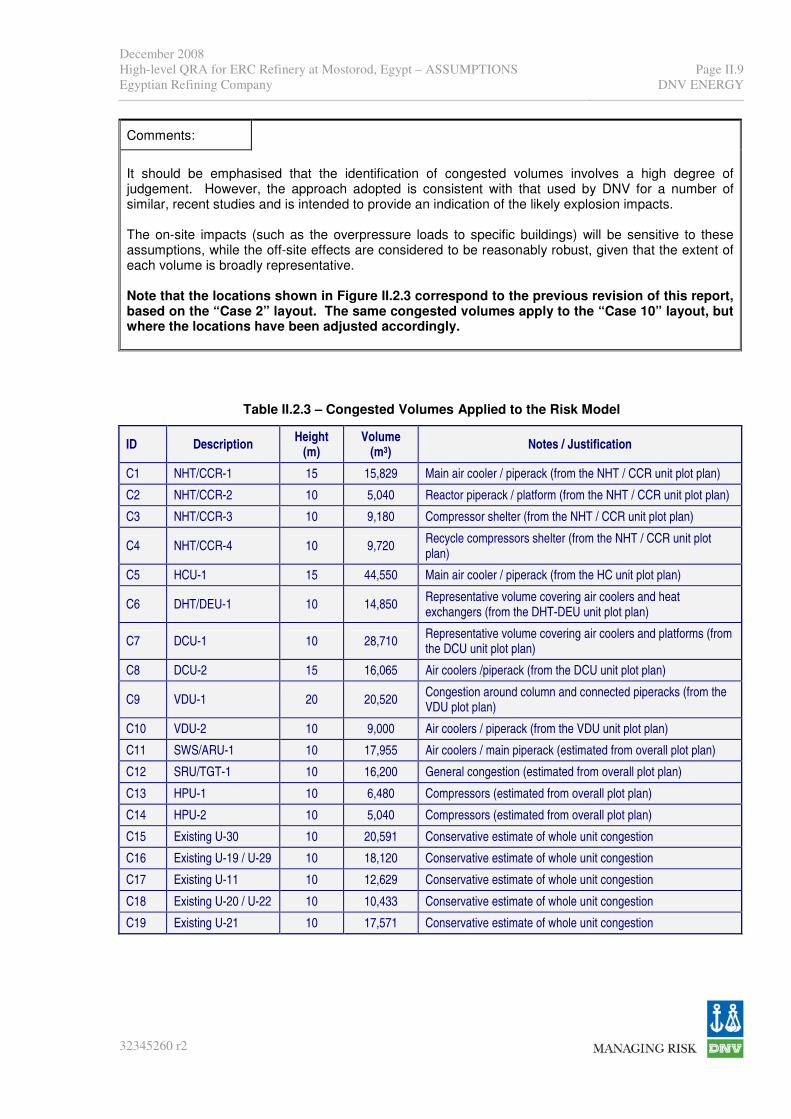
December 2008
High-level QRA for ERC Refinery at Mostorod, Egypt – ASSUMPTIONS
Egyptian Refining Company
Page II.9
DNV ENERGY
32345260 r2
Comments:
It should be emphasised that the identification of congested volumes involves a high degree of judgement. However, the approach adopted is consistent with that used by DNV for a number of similar, recent studies and is intended to provide an indication of the likely explosion impacts. The on-site impacts (such as the overpressure loads to specific buildings) will be sensitive to these assumptions, while the off-site effects are considered to be reasonably robust, given that the extent of each volume is broadly representative. Note that the locations shown in Figure II.2.3 correspond to the previous revision of this report, based on the “Case 2” layout. The same congested volumes apply to the “Case 10” layout, but where the locations have been adjusted accordingly.
Table II.2.3 – Congested Volumes Applied to the Risk Model
ID Description Height
(m)
Volume
(m3) Notes / Justification
C1 NHT/CCR-1 15 15,829 Main air cooler / piperack (from the NHT / CCR unit plot plan)
C2 NHT/CCR-2 10 5,040 Reactor piperack / platform (from the NHT / CCR unit plot plan)
C3 NHT/CCR-3 10 9,180 Compressor shelter (from the NHT / CCR unit plot plan)
C4 NHT/CCR-4 10 9,720 Recycle compressors shelter (from the NHT / CCR unit plot plan)
C5 HCU-1 15 44,550 Main air cooler / piperack (from the HC unit plot plan)
C6 DHT/DEU-1 10 14,850 Representative volume covering air coolers and heat exchangers (from the DHT-DEU unit plot plan)
C7 DCU-1 10 28,710 Representative volume covering air coolers and platforms (from the DCU unit plot plan)
C8 DCU-2 15 16,065 Air coolers /piperack (from the DCU unit plot plan)
C9 VDU-1 20 20,520 Congestion around column and connected piperacks (from the VDU plot plan)
C10 VDU-2 10 9,000 Air coolers / piperack (from the VDU unit plot plan)
C11 SWS/ARU-1 10 17,955 Air coolers / main piperack (estimated from overall plot plan)
C12 SRU/TGT-1 10 16,200 General congestion (estimated from overall plot plan)
C13 HPU-1 10 6,480 Compressors (estimated from overall plot plan)
C14 HPU-2 10 5,040 Compressors (estimated from overall plot plan)
C15 Existing U-30 10 20,591 Conservative estimate of whole unit congestion
C16 Existing U-19 / U-29 10 18,120 Conservative estimate of whole unit congestion
C17 Existing U-11 10 12,629 Conservative estimate of whole unit congestion
C18 Existing U-20 / U-22 10 10,433 Conservative estimate of whole unit congestion
C19 Existing U-21 10 17,571 Conservative estimate of whole unit congestion

December 2008
High-level QRA for ERC Refinery at Mostorod, Egypt – ASSUMPTIONS
Egyptian Refining Company
Page II.10
DNV ENERGY
32345260 r2
Figure II.2.3 – Locations of Congested Volumes
C6
C5
C4
C3C2
C1
C7
C12
C11
C9
C10
C8C13
C14
C15-C19 Existing
refinery units
C6
C5
C4
C3C2
C1
C7
C12
C11
C9
C10
C8C13
C14
C15-C19 Existing
refinery units
Note: The locations shown correspond to the “Case 2” layout used for the previous (Rev 1) version of this QRA. The same congested volumes apply to the “Case 10” layout, but where the locations have been adjusted accordingly in the Rev 2 model.

December 2008
High-level QRA for ERC Refinery at Mostorod, Egypt – ASSUMPTIONS
Egyptian Refining Company
Page II.11
DNV ENERGY
32345260 r2
II.2.6 Populations
Project: 32345260: ERC Refinery, Mostorod
Calculation Run: All Rev.: 0 Date: June 2008
The focus of this study is on the off-site risks, where the primary risk measure is individual risk. Hence, only very coarse consideration is given to the populations until the individual risk estimates, where the aim is to ensure that the order of magnitude of societal risks is considered. The on-site populations are, therefore, not considered – on the basis that they will be consistent with a typical facility and would not affect any decisions at this pre-construction stage in the development. The off-site populations are to be considered semi-quantitatively on the basis of the populated areas potentially affected (i.e. once the individual risk contours have been derived). The following population density estimates will be used:
• Urban, high density – 5000 people per km2
• Urban, medium density – 2000 people per km2
• Urban, low density – 750 people per km2
The above are derived from previous studies conducted by DNV and should be recognised as coarse estimates. The aim will be to use the upper and lower values to provide a realistic range of the potential societal risks that may apply.
Comments:
As discussed above, the uncertainty in this assumption should be recognised, although the importance will depend on the initial off-site risk results (and hence the maximum hazard ranges).

December 2008
High-level QRA for ERC Refinery at Mostorod, Egypt – ASSUMPTIONS
Egyptian Refining Company
Page II.12
DNV ENERGY
32345260 r2
II.3.0 Impact Criteria Assumptions
II.3.1 Vulnerability / Impact Criteria - Summary
Project: 32345260: ERC Refinery, Mostorod
Calculation Run: All Rev.: 0 Date: June 2008
Risks to people are based on defined fatality / impact probabilities for given exposures. These are summarised in Table II.3.1, below, for personnel outdoors, and within the following building types:
• ‘typical’ on-site buildings
• reinforced concrete buildings (assumed to be representative of a typical control building). The values given for each are a summary only – see Assumption II.3.2 for justification of the fire and explosion impact criteria, which includes discussion of the API (Reference 3) building type assigned to each. Toxic impacts are assessed on a different basis, using a probit function, described in Assumption II.3.3. Note that the outdoor values are used in the derivation of the general individual risks, which is of particular relevance to off-site populations. As discussed in Appendix I, the criteria used for residential populations is based on the assumption that all personnel are effectively outdoors (i.e. no credit is claimed for protection by residential buildings).
Table II.3.1 – Human Impact Criteria
Fatality Rate for Defined Impact
Hazard Impact Level Outdoors
Indoors – Typical
(API B1,B2,B4)
Indoors – Control
Building (API B5)
Flame (>37.5 kW/m2) 1 0.2 0.2 Jet Fire
Radiation (>12.5 kW/m2) 0.5 0.1 0.1
Flame (>37.5 kW/m2) 0.7 0.2 0.2 Pool Fire
Radiation (>12.5 kW/m2) 0.35 0.1 0.1
Flash Fire Flame (to LFL) 1 0.1 0.1
Flame (>37.5 kW/m2) 1 0.2 0.2 Fireball
Radiation (>12.5 kW/m2) 0.5 0.1 0.1
P1 (30-70 mbar) 0 0.005 0.001
P2 (70-110 mbar) 0 0.16 0.001
P3 (110-160 mbar) 0 0.32 0.001
P4 (160-300 mbar) 0.01 0.65 0.01
P5 (300-500 mbar) 0.1 1 0.15
Overpressure
P6 (>500 mbar) 0.25 1 1
Comments:

December 2008
High-level QRA for ERC Refinery at Mostorod, Egypt – ASSUMPTIONS
Egyptian Refining Company
Page II.13
DNV ENERGY
32345260 r2
II.3.2 Vulnerability / Impact Criteria – Fires and Explosions
Project: 32345260: ERC Refinery, Mostorod
Calculation Run: All Rev.: 0 Date: June 2008
The basis for the fire impact levels and criteria set out in Assumption II.3.1 is summarised below.
• The levels at which impairment from fires occurs are defined for two radiation levels, of greater than 37.5 kW/m
2 and 12.5 kW/m
2, which are referenced within the risk model as ‘flame’ and
‘radiation’ impacts, respectively.
• A fatality rate of 100% is assumed at radiation levels of 37.5 kW/m2 or greater and 50% for
12.5 kW/m2 or greater for personnel outdoors that are exposed to radiation effects from jet fires
and fireballs / BLEVEs. These values involve a degree of judgement, but are consistent both with standard practice (and slightly conservative) and with previous similar studies conducted by DNV.
• Although the radiation levels are the same, in order to recognise the greater potential for exposed personnel to escape from pool fires, a reduced vulnerability is applied for personnel outdoors for pool fires. A fatality rate of 70% is assumed at radiation levels of 37.5 kW/m
2 or greater for pool
fires, and 35% for values of 12.5 kW/m2 or greater.
• People outdoors exposed to flash fires are conservatively assumed to have a 100% probability of fatality, noting that the flash fire envelope is based on the concentration above the Lower Flammable Limit (LFL), while buildings are typically assumed to offer good protection to occupants from the potential impacts of flash fires. Based on previous studies, and CIA guidance, a 10% fatality rate is assumed for each building.
The basis for the explosion impact levels and criteria set out in Assumption II.3.1 is summarised below.
• The fatality rates applied for the (six) different explosion overpressures are based on guidance
contained within API RP 752 (Reference 3). This defines different fatality rate curves, which are used to derive the values listed in Assumption II.3.1, for the following building categories:
a) B1 - Wood-frame trailer or shack b) B2 - Steel-frame, metal-siding or pre-engineered building c) B3 - Unreinforced masonry bearing wall building d) B4 - Steel or concrete framed with reinforced masonry infill or cladding e) B5 - Reinforced concrete building
• The default for the on-site buildings is taken as ‘B4’.
Comments:
Note that the above approach is taken from previous studies that are focussed on on-site risks. The vulnerability values are equally appropriate to off-site populations, but where the building types are more likely to be API type “B1”. Note, however, that residential populations are treated as – effectively – outdoors, as discussed in Assumption II.3.1.
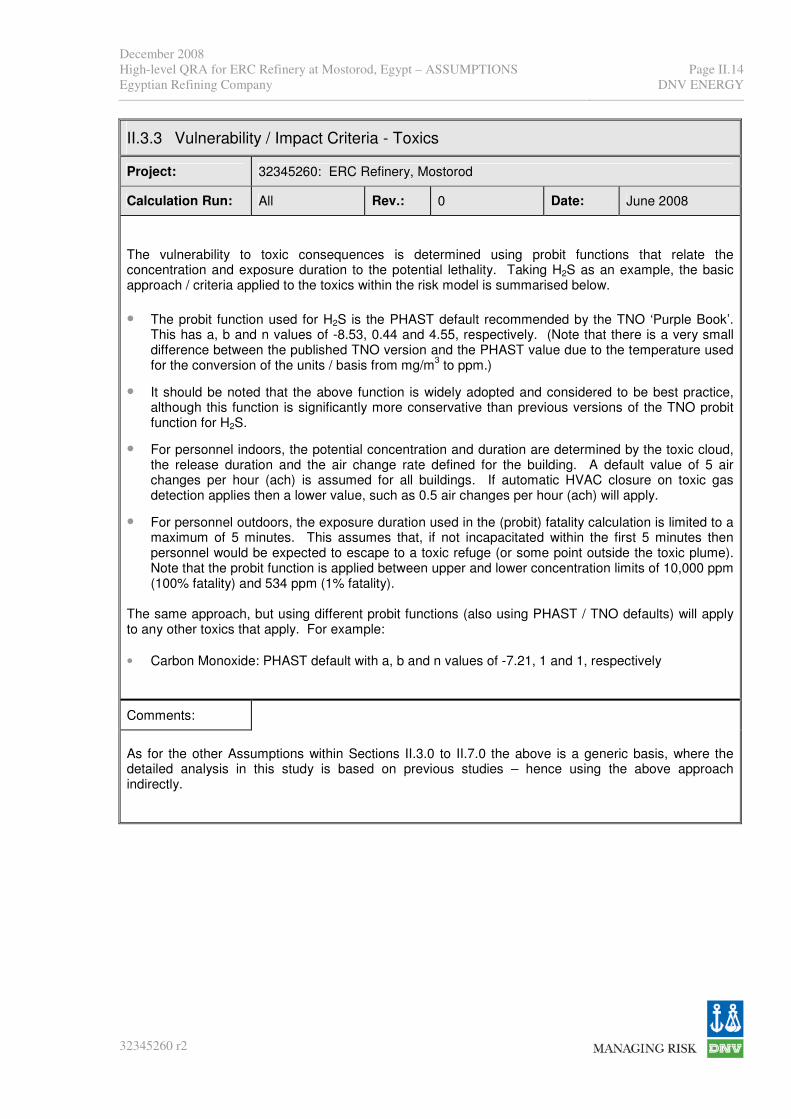
December 2008
High-level QRA for ERC Refinery at Mostorod, Egypt – ASSUMPTIONS
Egyptian Refining Company
Page II.14
DNV ENERGY
32345260 r2
II.3.3 Vulnerability / Impact Criteria - Toxics
Project: 32345260: ERC Refinery, Mostorod
Calculation Run: All Rev.: 0 Date: June 2008
The vulnerability to toxic consequences is determined using probit functions that relate the concentration and exposure duration to the potential lethality. Taking H2S as an example, the basic approach / criteria applied to the toxics within the risk model is summarised below.
• The probit function used for H2S is the PHAST default recommended by the TNO ‘Purple Book’. This has a, b and n values of -8.53, 0.44 and 4.55, respectively. (Note that there is a very small difference between the published TNO version and the PHAST value due to the temperature used for the conversion of the units / basis from mg/m
3 to ppm.)
• It should be noted that the above function is widely adopted and considered to be best practice, although this function is significantly more conservative than previous versions of the TNO probit function for H2S.
• For personnel indoors, the potential concentration and duration are determined by the toxic cloud, the release duration and the air change rate defined for the building. A default value of 5 air changes per hour (ach) is assumed for all buildings. If automatic HVAC closure on toxic gas detection applies then a lower value, such as 0.5 air changes per hour (ach) will apply.
• For personnel outdoors, the exposure duration used in the (probit) fatality calculation is limited to a maximum of 5 minutes. This assumes that, if not incapacitated within the first 5 minutes then personnel would be expected to escape to a toxic refuge (or some point outside the toxic plume). Note that the probit function is applied between upper and lower concentration limits of 10,000 ppm (100% fatality) and 534 ppm (1% fatality).
The same approach, but using different probit functions (also using PHAST / TNO defaults) will apply to any other toxics that apply. For example:
• Carbon Monoxide: PHAST default with a, b and n values of -7.21, 1 and 1, respectively
Comments:
As for the other Assumptions within Sections II.3.0 to II.7.0 the above is a generic basis, where the detailed analysis in this study is based on previous studies – hence using the above approach indirectly.
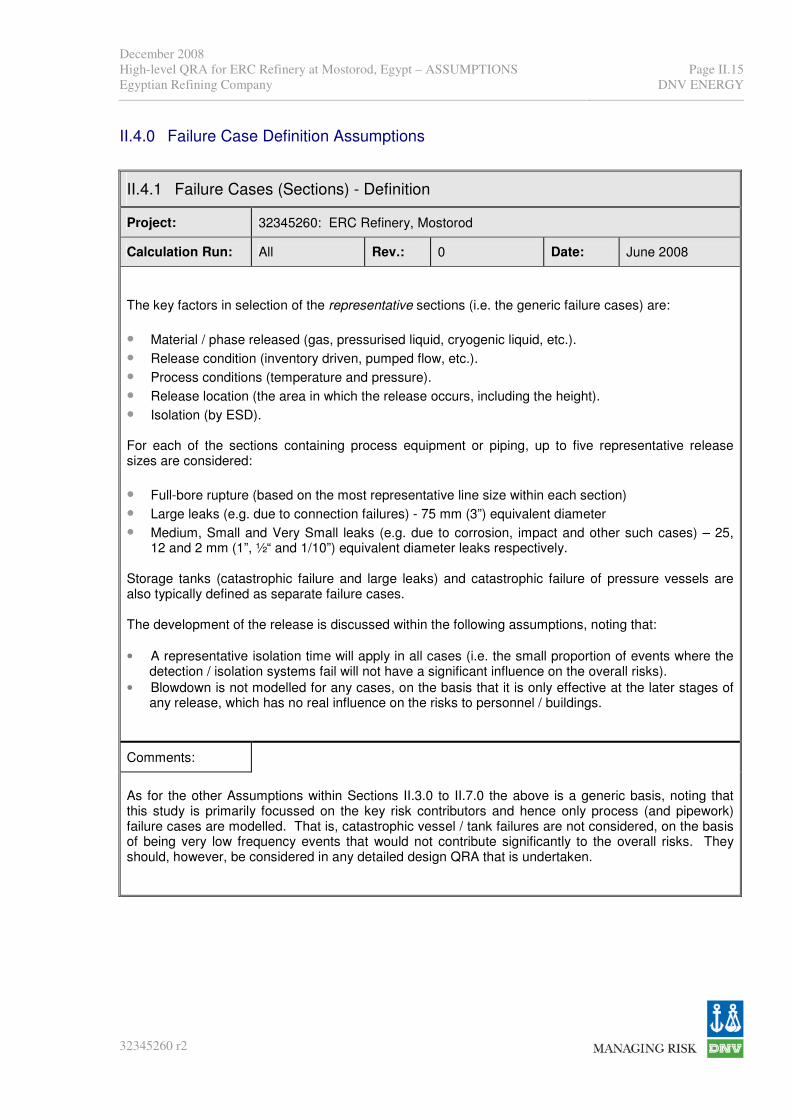
December 2008
High-level QRA for ERC Refinery at Mostorod, Egypt – ASSUMPTIONS
Egyptian Refining Company
Page II.15
DNV ENERGY
32345260 r2
II.4.0 Failure Case Definition Assumptions
II.4.1 Failure Cases (Sections) - Definition
Project: 32345260: ERC Refinery, Mostorod
Calculation Run: All Rev.: 0 Date: June 2008
The key factors in selection of the representative sections (i.e. the generic failure cases) are:
• Material / phase released (gas, pressurised liquid, cryogenic liquid, etc.).
• Release condition (inventory driven, pumped flow, etc.).
• Process conditions (temperature and pressure).
• Release location (the area in which the release occurs, including the height).
• Isolation (by ESD). For each of the sections containing process equipment or piping, up to five representative release sizes are considered:
• Full-bore rupture (based on the most representative line size within each section)
• Large leaks (e.g. due to connection failures) - 75 mm (3”) equivalent diameter
• Medium, Small and Very Small leaks (e.g. due to corrosion, impact and other such cases) – 25, 12 and 2 mm (1”, ½“ and 1/10”) equivalent diameter leaks respectively.
Storage tanks (catastrophic failure and large leaks) and catastrophic failure of pressure vessels are also typically defined as separate failure cases. The development of the release is discussed within the following assumptions, noting that:
• A representative isolation time will apply in all cases (i.e. the small proportion of events where the detection / isolation systems fail will not have a significant influence on the overall risks).
• Blowdown is not modelled for any cases, on the basis that it is only effective at the later stages of any release, which has no real influence on the risks to personnel / buildings.
Comments:
As for the other Assumptions within Sections II.3.0 to II.7.0 the above is a generic basis, noting that this study is primarily focussed on the key risk contributors and hence only process (and pipework) failure cases are modelled. That is, catastrophic vessel / tank failures are not considered, on the basis of being very low frequency events that would not contribute significantly to the overall risks. They should, however, be considered in any detailed design QRA that is undertaken.

December 2008
High-level QRA for ERC Refinery at Mostorod, Egypt – ASSUMPTIONS
Egyptian Refining Company
Page II.16
DNV ENERGY
32345260 r2
II.4.2 Failure Cases (Sections) - Parameters
Project: 32345260: ERC Refinery, Mostorod
Calculation Run: All Rev.: 0 Date: June 2008
For each of the release scenarios to be modelled, the key inputs to the derivation of release parameters are the phase, process conditions, flowrate, location and section volume / inventory, where the parameters are derived as follows:
• Phase: The phase of the material at the process conditions is the key factor. Hence, 2-phase releases are accounted for in the modelling, but are defined as liquid releases for the purposes of the initial discharge, to ensure that the corresponding release rate is derived on the maximum mass flow basis.
• Process conditions (temperature and pressure): Taken from the PFDs and Heat & Mass Balances. Where the conditions vary within a section, those associated with the main inventory are used, and where there is no ‘main’ inventory the stream with the highest pressure
• Flowrate: Also taken from the PFDs and Heat & Mass Balances.
• Release location: The release location selected is necessarily representative, but is generally taken as that corresponding to the largest inventory within a section. The default height of all releases is taken as 1 m, with the exception of any sections where all of the components included are at height.
• Volume / inventory: The section volume is derived from the vessel volumes, together with estimates of line lengths associated with each section and the estimated fill fraction of each vessel. Note that at the input stage the volume of each section is defined. This is not necessarily the isolatable volume and the inventory available for release is derived from the representative density and the volume of all connected sections, including the flash fraction of connected liquid inventories. See also Assumption II.4.5.
Note also that the potential for impingement of the release is considered with respect to flammable clouds (in order to ensure a conservative basis for vapour cloud explosions), as discussed with respect to Assumption II.6.2. (Impingement is not considered with respect to ignited releases – e.g. jet fires - to ensure the analysis is conservative in this respect.)
Comments:
As for the other Assumptions within Sections II.3.0 to II.7.0 the above is a generic basis, where the detailed analysis in this study is based on previous studies – hence using the above approach indirectly.

December 2008
High-level QRA for ERC Refinery at Mostorod, Egypt – ASSUMPTIONS
Egyptian Refining Company
Page II.17
DNV ENERGY
32345260 r2
II.4.3 Failure Cases (Sections) – Release Types
Project: 32345260: ERC Refinery, Mostorod
Calculation Run: All Rev.: 0 Date: June 2008
The outcome, and hence the way in which the discharge and subsequent dispersion parameters are modelled, for each release varies according to the type, where four basic release types are considered:
• Vapour releases. These are relatively straightforward scenarios where the process fluid is gas, and hence the discharge parameters applied to the model are based on the gas properties. These are modelled as user-defined vapour releases in PHAST.
• Liquid releases. For the purposes of this analysis, note that this refers to releases of liquid, which remain as liquid. These are defined as all releases where the vapour fraction is less than 20% (by mole) and where the flash fraction upon release also remains below 20%. Hence, these are release scenarios where the dominant outcomes are potential pool fires, with a limited potential for vapour clouds and associated hazards. These are, generally, releases of stabilised crude oil or heavy hydrocarbon products. These are modelled as user-defined liquid releases in PHAST.
• Vaporising liquid releases. This release type aims to cover ‘2-phase’ releases, where the fluid is primarily liquid that will not flash, but where some gas will vaporise from the pool that is formed (e.g. unstabilised crude oil). The liquid component and vapour cloud are, therefore, modelled separately as user-defined releases within PHAST.
• ‘Flashing’ liquid releases. These are releases where the process fluid is 2-phase or liquid, where a significant flash will occur upon release (i.e. 20% or greater). These releases are generally those due to lighter hydrocarbons. They are modelled as 2-phase (or liquid) releases within PHAST and tend to result in jet fires in the event of immediate ignition, or vapour clouds if not immediately ignited. Note that pool fires are also credible, but are usually minor in comparison to the other outcomes / hazard ranges.
Note that discharge calculations will use the Pseudo-Component model in PHAST (Version 6.53) as deemed necessary (e.g. for mixtures where the degree of flash is uncertain, and potentially less than 50%). The basic rule-set used in relation to determining a representative fluid for each section (release scenario) is summarised below.
• Noting that the consequences do not vary significantly for heavy hydrocarbons, fluids with more carbon content than decane (or equivalent) are defined in simple terms as either C10, C14 or C20.
• Streams are generally defined as a single equivalent component on the basis of the equivalent molecular weight where practicable. However, consideration is given to whether hydrogen or water content affects the average molecular weight, or whether the composition is such that the material should be modelled as a mixture.
Comments:
As for the other Assumptions within Sections II.3.0 to II.7.0 the above is a generic basis, where the detailed analysis in this study is based on previous studies – hence using the above approach indirectly.

December 2008
High-level QRA for ERC Refinery at Mostorod, Egypt – ASSUMPTIONS
Egyptian Refining Company
Page II.18
DNV ENERGY
32345260 r2
II.4.4 Failure Case Parameters – Release Rate / Duration
Project: 32345260: ERC Refinery, Mostorod
Calculation Run: All Rev.: 0 Date: June 2008
The representative release rate and duration are derived according to whether the release is inventory driven or downstream of a pump:
Type Conditions Release Rate, Q (kg/s) Duration, T
(s) Notes
Instantaneous (Flammable) T = Ms / Q Initial peak dominates for flammables – model as instantaneous release of
section inventory (Ms). Illustrated by Figure II.4.1.
Qo > NFR and To < 20s
Q = NFR (Toxic) T = Tiso + Miso / Q More conservative to model longer duration for toxics – use residual flowrate,
NFR. Illustrated by Figure II.4.1.
Qo > NFR and 20 s < To < 120s
Q = Average release rate over 2 minutes
T = Miso / Q
Rapid release, depletes section inventory rapidly. Initial peak is reduced rapidly and not representative, hence average over first 2 minutes taken as representative. Residual release at NFR, once initial inventory depleted, will
be negligible in comparison. Illustrated by Figure II.4.2.
The inventory in this case, Miso, is the isolatable inventory of the section.
Inventory Driven
(Gas or Liquid)
Qo < NFR or To > 120s
Q = Qo T = Tiso + Miso / Q Initial release rate will continue until isolation occurs. See also Figure II.4.3.
The inventory in this case, Miso,, is the isolatable inventory of the section.
Qo > 2 NFR Q = f x NFR T = Tiso + Miso / Q
Rapid release of inventory downstream of release point, but subsequent forward flow past pump / compressor (allowing for factor of f on NFR due to
over-run) will be the key risk influence.
The inventory in this case, Miso, is the isolatable inventory of the section.
Restricted (Pumped) Flow
(Liquid)
(NB Approach valid for ‘Compressed’ Gas, but back-flow assumed to
dominate.) Qo < 2 NFR
Q = Qo
(up to max of f x NFR)
T = Tiso + Miso / Q Initial release rate will continue until isolation occurs.
The inventory in this case, Miso, is the isolatable inventory of the section.
Terms: Q – release rate used; Qo – initial (maximum) release rate; NFR – normal flow rate; f – factor to allow for centrifugal pump over-run (1.25); Tiso – time for isolation; To – time to deplete inventory available for release (M / Qo); Ms – section inventory; Miso - isolatable inventory (plus connected inventories where appropriate).

December 2008
High-level QRA for ERC Refinery at Mostorod, Egypt – ASSUMPTIONS
Egyptian Refining Company
Page II.19
DNV ENERGY
32345260 r2
II.4.4 Failure Case Parameters – Release Rate / Duration
Figure II.4.1: Figure II.4.2: Figure II.4.3:
Comments:
As for the other Assumptions within Sections II.3.0 to II.7.0 the above is a generic basis, where the detailed analysis in this study is based on previous studies – hence using the above approach indirectly.
Qo
NFR
Re
lea
se
Ra
te,
Q
Time, T
Qo > NFR and To < 20 s
(To = M / Qo; time to deplete inventory at continuous Qo)
To
Flammable: Instantaneous
Toxic: Q = NFR
Qo
NFR
Re
lea
se
Ra
te,
Q
Time, T
Qo > NFR and To < 20 s
(To = M / Qo; time to deplete inventory at continuous Qo)
To
Flammable: Instantaneous
Toxic: Q = NFR
Qo
NFR
Re
lea
se
Ra
te,
Q
Time, T
Qo > NFR and 20 s < To < 120 s
(To = M / Qo; time to deplete inventory at continuous Qo)
To 120 s
Q
Q = Average Rate (2 mins)
Qo
NFR
Re
lea
se
Ra
te,
Q
Time, T
Qo > NFR and 20 s < To < 120 s
(To = M / Qo; time to deplete inventory at continuous Qo)
To 120 s
Q
Q = Average Rate (2 mins)
Qo
NFR
Re
lea
se
Ra
te,
Q
Time, T
Qo < NFR or To > 120 s
(To = M / Qo; time to deplete inventory at continuous Qo)
To
Q = Qo
Qo
NFR
Re
lea
se
Ra
te,
Q
Time, T
Qo < NFR or To > 120 s
(To = M / Qo; time to deplete inventory at continuous Qo)
To
Q = Qo

December 2008
High-level QRA for ERC Refinery at Mostorod, Egypt – ASSUMPTIONS
Egyptian Refining Company
Page II.20
DNV ENERGY
32345260 r2
II.4.5 Failure Case Parameters - Inventory
Project: 32345260: ERC Refinery, Mostorod
Calculation Run: All Rev.: 0 Date: June 2008
The basic rule-set used in relation to determining the inventory of each section (release scenario) is summarised below.
• The length of piping in each section is estimated from the plot plans on the basis of the x, y and z distances between the main components, with a degree of judgement included for short distances. A simple default of 10 m is included for distances to components that are not indicated on the plot plans (such as to ESDs downstream of a vessel).
• The vessel inventory is based on the volumes derived from the available data, and the density of the respective stream, or streams. Note that the volume calculations include a factor of 1.1 to account for torisphoidal ends.
• The fill fraction of each vessel is an important factor, where the basic fill fraction is assumed to be:
- 30% for vertical vessels, including columns; - 50% for horizontal vessels; - The exceptions to the above are vessels that are intended for vapour only (e.g. compressor
suction drums) or liquid only (e.g. surge drums) service, in which case 0 or 100% fill is used as appropriate.
• An important additional factor is whether the vessel is likely to be packed or not, which is generally assumed to apply to reactors only. A default of 50% packing is assumed, such that the hydrocarbon volume is taken as half of the actual vessel volume.
Comments:
As for the other Assumptions within Sections II.3.0 to II.7.0 the above is a generic basis, where the detailed analysis in this study is based on previous studies – hence using the above approach indirectly.

December 2008
High-level QRA for ERC Refinery at Mostorod, Egypt – ASSUMPTIONS
Egyptian Refining Company
Page II.21
DNV ENERGY
32345260 r2
II.4.6 Failure Case Parameters – Release Duration
Project: 32345260: ERC Refinery, Mostorod
Calculation Run: All Rev.: 0 Date: June 2008
The fire and gas detection philosophy adopted within the refinery is assumed to be consistent with best-practice and detection of a major release (and most small releases) is likely to occur rapidly for the majority of release locations. However, the key factor in determining whether and when isolation occurs is the human factor aspect of the operators’ response to the alarms. This, of course, can only be quantified as a representative isolation time, where a simple rule set is proposed below, based on the size of the initial release rate relative to the normal flow rate. The release rate is taken as an indication of the severity of the release in terms of the number of gas detection alarms that may be activated, and of the likelihood of process alarms being activated. This approach does not suggest that rapid isolation will only occur for certain sized releases, or via process alarms only, but it is assumed to be reasonably representative of the significance of each release, which is likely to determine the delay between detection and action (i.e. isolation). For the initial release rate, Qo, in relation to the Normal Flow Rate (NFR):
• If Qo > 0.2 × NFR, an isolation time of 5 minutes is assumed.
• For smaller release rates (i.e. Qo < 0.2 × NFR), an isolation time of 15 minutes is assumed. The above isolation times are consistent with those used by DNV on many previous studies, where:
• Detection is assumed to be rapid (or, specifically, is not reliant on visual detection due to the presence of adequate detectors and/or process alarms);
• Activation of ESDs is remotely actuated, such as from the Control Room, but requires manual control, i.e. there are no automatic isolation actions on detection of a hazardous release.
The release duration applied is determined from consideration of the inventory of the isolatable section, and the selected release rate, in relation to the isolation time, as per Assumption II.4.4.
Comments:
As for the other Assumptions within Sections II.3.0 to II.7.0 the above is a generic basis, where the detailed analysis in this study is based on previous studies – hence using the above approach indirectly.

December 2008
High-level QRA for ERC Refinery at Mostorod, Egypt – ASSUMPTIONS
Egyptian Refining Company
Page II.22
DNV ENERGY
32345260 r2
II.4.7 Failure Case Parameters – Others
Project: 32345260: ERC Refinery, Mostorod
Calculation Run: All Rev.: 0 Date: June 2008
Release Inventory
The total inventory released is calculated simply as the product of the representative release rate and the duration for which it is applied, i.e. Mreleased = Q x T.
Velocity (Release Momentum)
The discharge velocity is applied within the PHAST dispersion model as a measure of the amount of momentum in the release, and determines the initial rate of air entrainment. This is a theoretical expansion velocity taking into account the velocity through the leak orifice and the expansion from the process pressure to atmospheric.
The velocity is calculated within the PHAST discharge model for each release. However, if Qo is not used in the model (see Assumption II.4.4), such as if the release rate is restricted by the pumping rate, the velocity used is decreased by the same proportion as the release rate (i.e. a factor of Q/Qo is applied).
Discharge Temperature
The discharge temperature required for input to the PHAST dispersion model is the temperature of the material after expansion to atmospheric pressure and before the addition of any air for pre-dilution. This is generally calculated within the PHAST discharge model, although it is noted that the approach used within PHAST is theoretical and generally reduces the temperature of vapour releases to close to the boiling point. In many cases, the process temperature is significantly above the material’s boiling point and the maximum temperature drop that is considered credible, for vapour releases, is to 40
oC
below the process temperature.
Additional Liquid Release Data
In addition to the parameters defined in the above sections, the droplet diameter and liquid fraction are required to define liquid releases. Together with the velocity, these parameters determine how far the droplets will travel in the release before raining out, or conversely whether they will evaporate before rain-out occurs. These parameters are derived from the initial discharge modelling conducted within PHAST.
The droplet diameter for non-flashing flows (i.e. fluids in the mechanical break-up regime) is set to a minimum of 0.2 mm, based on experimental data given in a UK HSE research project conducted by
DNV (Reference 4).
Comments:
As for the other Assumptions within Sections II.3.0 to II.7.0 the above is a generic basis, where the detailed analysis in this study is based on previous studies – hence using the above approach indirectly.

December 2008
High-level QRA for ERC Refinery at Mostorod, Egypt – ASSUMPTIONS
Egyptian Refining Company
Page II.23
DNV ENERGY
32345260 r2
II.5.0 Frequency Analysis Assumptions
II.5.1 Generic Failure Data - Process
Project: 32345260: ERC Refinery, Mostorod
Calculation Run: All Rev.: 0 Date: June 2008
The basis of the process and pipeline frequency analysis is DNV’s interpretation of the Hydrocarbon Release Database (known as the “HCRD” database), Reference 5. Although providing the most comprehensive available failure data, for a wide variety of equipment types, the HCRD, provides data on leak sizes that requires some interpretation to be used effectively. Experience shows that using the data directly, i.e. assuming that all releases occur at normal operating conditions, provides overly conservative inputs to a QRA study. A proportion of all leaks occur at conditions that produce releases with less serious consequences than would be modelled using standard QRA assumptions:
• Depressurised (maintenance)
• Rapid isolation (process trips) Analysis has been conducted, which derives ‘equivalent’ hole sizes, based on the recorded release quantity (rather than the recorded hole size), hence making allowance for the proportion of incidents where limited releases occur. The resulting failure data is used as the basis for the frequency analysis in this study. The components, or parts, for which failure rates are derived and the generic failure rates applied to each are listed in Table II.5.1 (appended below this assumption sheet). Note that for interconnecting pipelines the Process data frequency for pipework is conservatively used. Other failure rates that are typically utilised are:
• Catastrophic Pressure Vessel Failure: 4 x 10⁻⁶
per year (applied to all pressure vessels)
• BLEVE of Pressure Vessel: 1 x 10⁻⁶
per year (applied to pressure vessels with BLEVE potential – containing pressurised volatile liquid, such as LPG and light hydrocarbons)
Each of the above are based on DNV’s Technical Reference Data, which reviews a large number of
relevant data sources – the key source with respect to the above is UK HSE data, from Reference 6.
Comments:
As for the other Assumptions within Sections II.3.0 to II.7.0 the above is a generic basis, noting that this study is primarily focussed on the key risk contributors and hence only process (and pipework) failure cases are modelled. That is, catastrophic vessel / tank failures are not considered as very low frequency events that would not contribute significantly to the overall risks. They should, however, be considered in any detailed design QRA that is undertaken. The frequency data used is a key assumption in any risk assessment.

December 2008
High-level QRA for ERC Refinery at Mostorod, Egypt – ASSUMPTIONS
Egyptian Refining Company
Page II.24
DNV ENERGY
32345260 r2
Table II.5.1 - Generic Process Leak Frequencies
Generic Leak Frequency (per year), by Leak Size
Equipment Item Very Small
(2mm)
Small
(12mm)
Medium
(25mm)
Large
(75mm)
Rupture
(Full-bore)
Air cooler 3.60E-03 0.00E+00 0.00E+00 0.00E+00 0.00E+00
Block valve <3in 7.20E-05 3.70E-05 4.10E-06 4.10E-06 0.00E+00
Block valve >3in 2.10E-04 2.30E-05 3.80E-06 0.00E+00 3.80E-06
Centrifugal Pump 4.70E-03 1.50E-03 0.00E+00 0.00E+00 0.00E+00
Centrifugal Compressor 2.80E-03 3.60E-03 0.00E+00 7.10E-04 0.00E+00
Check valve <3in 1.40E-04 0.00E+00 0.00E+00 0.00E+00 0.00E+00
Check valve >3in 2.10E-04 7.10E-05 3.60E-05 7.10E-05 0.00E+00
Control valve <3in 5.20E-04 2.40E-04 3.40E-05 0.00E+00 0.00E+00
Control valve >3in 9.00E-04 1.30E-04 3.20E-05 0.00E+00 0.00E+00
Filter 1.80E-03 1.60E-03 0.00E+00 0.00E+00 0.00E+00
Fitting 4.10E-04 2.00E-04 2.60E-06 0.00E+00 0.00E+00
Flange <3in 3.10E-05 1.20E-05 1.10E-06 0.00E+00 0.00E+00
Flange >3in 4.70E-05 1.70E-05 2.10E-06 0.00E+00 1.40E-06
HX-s 1.70E-03 2.80E-03 5.60E-04 0.00E+00 0.00E+00
HX-t 2.00E-03 4.00E-04 0.00E+00 0.00E+00 0.00E+00
Piping <3in 1.20E-04 4.80E-05 6.30E-06 0.00E+00 0.00E+00
Piping >3in 4.80E-05 1.30E-05 5.60E-07 5.60E-07 5.60E-07
Plate & Fin HX 5.90E-03 6.60E-03 0.00E+00 0.00E+00 0.00E+00
Relief valve <3in 6.10E-04 2.70E-04 0.00E+00 0.00E+00 0.00E+00
Relief valve >3in 7.50E-04 4.30E-04 1.10E-04 1.10E-04 0.00E+00
Vessel / Column 2.40E-03 1.70E-03 2.40E-04 2.40E-04 2.00E-06
Note: HX denotes Heat Exchanger.

December 2008
High-level QRA for ERC Refinery at Mostorod, Egypt – ASSUMPTIONS
Egyptian Refining Company
Page II.25
DNV ENERGY
32345260 r2
II.6.0 Consequence Analysis Assumptions
II.6.1 Consequences – General
Project: 32345260: ERC Refinery, Mostorod
Calculation Run: All Rev.: 0 Date: June 2008
For each release event defined, dispersion modelling and fire size calculations are conducted within DNV’s consequence modelling software tool PHAST. These consequence results are either used directly (pool and jet fires, fireballs) by the risk model, BLAST, or form inputs (dispersion modelling) for the flash fire and explosion analysis that is conducted within the BLAST software. PHAST Version 6.53 and BLAST Global Version 8.21 are used within this study. The consequences are input to the risk model in groups of hazard type, which depend upon the type of release (see Assumption II.4.3) and when ignition occurs, as summarised in Table II.6.1, below. Note that this table addresses flammable impacts only; toxic impacts will also apply for unignited releases depending on the composition.
Table II.6.1 - Summary of Ignited Release Outcomes, or Hazard Types
Hazard Type (Consequence) Release Type
Immediate Ignition Delayed Ignition
Gas release Jet fire
(or fireball for short duration release)
Flash fire / explosion
Liquid release Pool fire Pool fire
Flashing liquid release Jet fire
(or fireball for short duration release)
Flash fire / explosion
Vaporising liquid release Pool fire Pool fire
+ flash fire / explosion of vaporised cloud
The different hazard types (fires, explosions, toxics) are discussed further in the following sections. However, the basic assumptions are dominated by:
• The derivation of the representative release parameters, as described in Assumptions II.4.1 to II.4.7.
• Hence, it is – for all consequences – the User Defined modelling option in PHAST that is used.
• The use of PHAST default assumptions (unless stated otherwise within these assumptions).
Comments:

December 2008
High-level QRA for ERC Refinery at Mostorod, Egypt – ASSUMPTIONS
Egyptian Refining Company
Page II.26
DNV ENERGY
32345260 r2
II.6.2 Dispersion Modelling
Project: 32345260: ERC Refinery, Mostorod
Calculation Run: All Rev.: 0 Date: June 2008
Dispersion of unignited gas releases is conducted within PHAST to determine the shape of the vapour cloud for input to BLAST, where it is used to determine both flash fire and vapour cloud explosion (VCE) consequences. These impacts are applied if delayed ignition is determined to occur. Two types of dispersion are modelled, intended to represent the two extremes of release behaviour:
• Horizontal clouds correspond to the idealised (i.e. unobstructed) release conditions, where the dispersion will tend to be dominated by the release momentum.
• Zero momentum clouds are modelled as an estimate of the cloud behaviour for releases that are impinged (either on adjacent equipment or the ground), where the initial momentum will be lost and the dispersion will take the form of a cylindrical cloud. The cloud volume is applied to the risk model as a cylindrical cloud centred at the release point with no momentum.
The vast majority of releases will behave somewhere between the two extremes described above, where these outcomes are modelled to ensure that the full range of representative outcomes may occur. The probability assigned to each of the above dispersion modes can be varied as required, where the assumed default is proposed to be a 50/50 split (which may be increased to 60/40 – impinged / horizontal – for more congested units). Note that the above approach applies to flammable vapour clouds only. Only the consequences associated with unobstructed, horizontal releases are used for toxic effects, on the basis of ensuring a conservative assessment of potential toxic impacts. Note that the toxic modelling is taken directly from PHAST (i.e. from the defined flammable cloud dispersion), but with different impact criteria defined to track the toxic components of the cloud, as discussed in Assumption II.3.3. The PHAST output is read directly by the BLAST risk model, such that the dimensions of the resulting cloud are defined in detail (for up to 10 segments).
Comments:
Note: The way in which the BLAST risk model uses the dispersion results is described further in Assumption II.7.1.
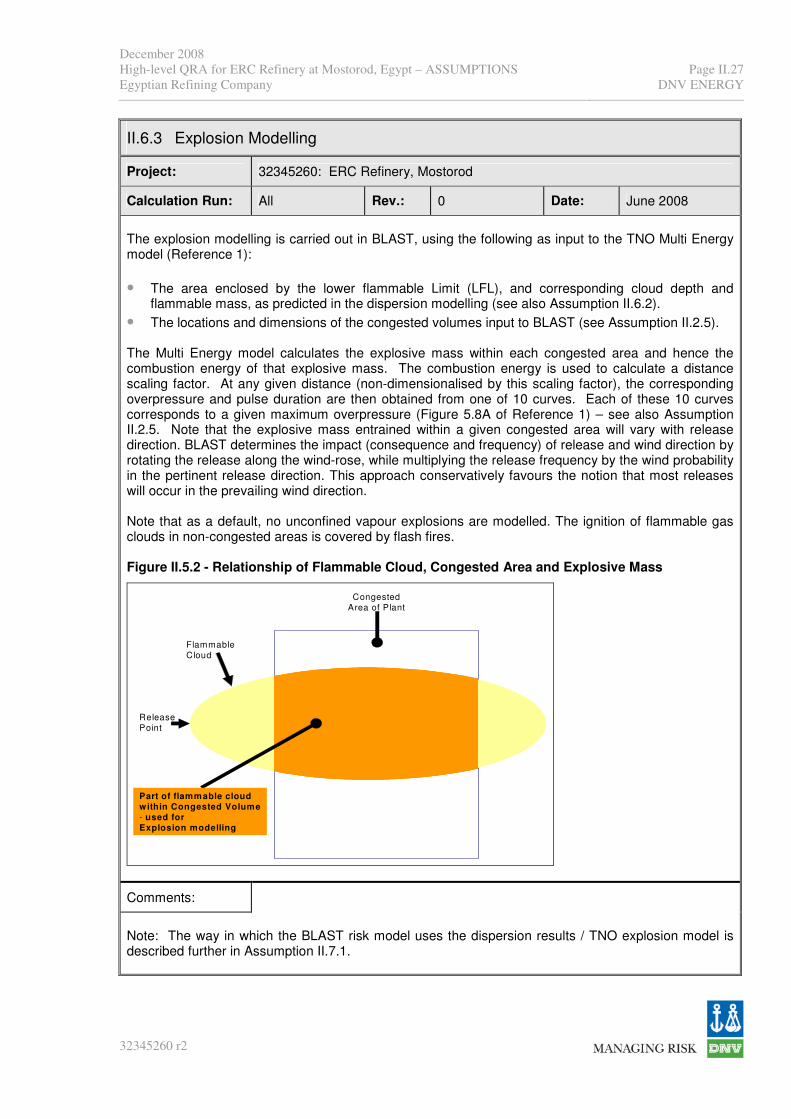
December 2008
High-level QRA for ERC Refinery at Mostorod, Egypt – ASSUMPTIONS
Egyptian Refining Company
Page II.27
DNV ENERGY
32345260 r2
II.6.3 Explosion Modelling
Project: 32345260: ERC Refinery, Mostorod
Calculation Run: All Rev.: 0 Date: June 2008
The explosion modelling is carried out in BLAST, using the following as input to the TNO Multi Energy model (Reference 1):
• The area enclosed by the lower flammable Limit (LFL), and corresponding cloud depth and flammable mass, as predicted in the dispersion modelling (see also Assumption II.6.2).
• The locations and dimensions of the congested volumes input to BLAST (see Assumption II.2.5). The Multi Energy model calculates the explosive mass within each congested area and hence the combustion energy of that explosive mass. The combustion energy is used to calculate a distance scaling factor. At any given distance (non-dimensionalised by this scaling factor), the corresponding overpressure and pulse duration are then obtained from one of 10 curves. Each of these 10 curves corresponds to a given maximum overpressure (Figure 5.8A of Reference 1) – see also Assumption II.2.5. Note that the explosive mass entrained within a given congested area will vary with release direction. BLAST determines the impact (consequence and frequency) of release and wind direction by rotating the release along the wind-rose, while multiplying the release frequency by the wind probability in the pertinent release direction. This approach conservatively favours the notion that most releases will occur in the prevailing wind direction. Note that as a default, no unconfined vapour explosions are modelled. The ignition of flammable gas clouds in non-congested areas is covered by flash fires. Figure II.5.2 - Relationship of Flammable Cloud, Congested Area and Explosive Mass
ReleasePoint
Congested
Area of Plant
Flammable
Cloud
Part of flammable cloudwithin Congested Volume- used forExplosion modelling
Comments:
Note: The way in which the BLAST risk model uses the dispersion results / TNO explosion model is described further in Assumption II.7.1.

December 2008
High-level QRA for ERC Refinery at Mostorod, Egypt – ASSUMPTIONS
Egyptian Refining Company
Page II.28
DNV ENERGY
32345260 r2
II.6.4 Fire Modelling
Project: 32345260: ERC Refinery, Mostorod
Calculation Run: All Rev.: 0 Date: June 2008
Based on the derivation of the release parameters described in Assumptions II.4.1 to II.4.7, the determination of the initial fire effects is handled by the PHAST software. The PHAST default options are intended to be used in all cases, but where:
• All immediately ignited releases are modelled as either jet or pool fires, unless the release is instantaneous or very rapid (less than 20 seconds) in which case a fireball is applied.
• All delayed ignition events are modelled as flash fires or VCEs, where pool fires will additionally apply for liquid spills.
• Flash fires are based on the LFL distance.
• The maximum velocity is increased for hydrogen releases (from 500 m/s to 1500 m/s). Note that the use of PHAST default options is important in modelling a very large number of scenarios effectively, noting that all failure cases are representative in any case. However, it is equally important that the initial results are used to determine the key risk contributors and to consider the modelling assumptions for these, as necessary. (This may include adjustments to the detailed modelling, such as the release orientation, assumed discharge temperature / flash fraction, Finite Duration Correction factor, etc.) Any specific adjustments to the modelling will be described within the appropriate parts of the main report. Note that pool fires are modelled assuming no drainage or containment, in order to determine the base case pool fire loads. Note also that jet fires (and fireballs) are modelled on the basis of the theoretical (unobstructed) releases, as discussed in Assumption II.6.2.
Comments:
Note: The way in which the BLAST risk model uses the fire modelling results is described further in Assumption II.7.1.

December 2008
High-level QRA for ERC Refinery at Mostorod, Egypt – ASSUMPTIONS
Egyptian Refining Company
Page II.29
DNV ENERGY
32345260 r2
II.7.0 Risk Analysis Assumptions
II.7.1 The BLAST Risk Software
Project: 32345260: ERC Refinery, Mostorod
Calculation Run: All Rev.: 0 Date: June 2008
Although the BLAST risk software is an in-house DNV tool, it is purpose-designed to enable users to have control over the modelling and hence the majority of assumptions are covered in the inputs to, rather than within, the software. The basic principles of BLAST are:
• Dispersion results are drawn in directly from the PHAST software, taking flammable and toxic hazard ranges separately. These are used for delayed ignition hazards, such as toxic impacts, flash fires and Vapour Cloud Explosions (VCEs).
• The consequences of other fires (jet, pool, fireball / BLEVE) are specified in the form of downwind and crosswind distances (together with an offset) to specified impact levels. These can be derived from any source, where PHAST is the approach adopted for this study. Two impact levels are used for each fire type, for example jet fire radiation levels of 12.5 and 37.5 kW/m
2.
• The flammable vapour clouds are superimposed on the defined grid by BLAST, according to the wind rose, in order to determine:
- The probability of ignition, according to the defined ignition sources and cloud duration (noting that this is in addition to a specific background ignition probability)
- The probability and extent of any explosion that will occur, according to whether the specified cloud will reach any congested volumes (or groups of congested volumes) and ignition sources, in the respective weather conditions and wind direction.
• The resulting consequences, together with those specified directly (i.e. toxics, jet fires, etc.), are compared against the populations that are reached, and the defined vulnerabilities, to determine the appropriate risk (i.e. individual / societal, indoor / outdoor).
• The explosion modelling is conducted according to the Multi-Energy Model requirements, while all other consequences are inputs, rather than calculated within BLAST. Hence, the vast majority of assumptions within BLAST are those specified within this document, as inputs rather than BLAST assumptions / calculations.
Similarly, the way the risks are calculated, via event trees, is part of the user-defined input, rather than in-built within BLAST. The inputs to BLAST are consequences in the form specified above, where each will have an event frequency together with an immediate ignition probability or a background delayed ignition probability. The probability of weather category and wind direction is determined within BLAST (as per Assumptions II.2.1 and II.2.2), as are the ignition and explosion probabilities (as discussed further in Assumptions II.7.2 and II.7.3). All other variations on the outcome frequency are defined before input to BLAST, e.g. the probability of isolation failure or variation in release orientation. Example event trees, deriving the BLAST inputs, by Release Type (see Assumption II.4.3) are given below (appended to this Assumption Sheet).
Comments:

December 2008
High-level QRA for ERC Refinery at Mostorod, Egypt – ASSUMPTIONS
Egyptian Refining Company
Page II.30
DNV ENERGY
32345260 r2
Note that event trees summarising the potential outcomes for each release type (from Assumption II.4.3) are given in Figure II.7.1 to Figure II.7.3. The notes in each case aim to clarify whether the respective probabilities are calculated before input to BLAST or within BLAST.
Figure II.7.1 – Event Tree for ‘Vapour’ and ‘Flashing Liquid’ Release Types
Release
Type
Rapid
Release *1
Immediate
Ignition *2
Delayed
Ignition *3
Congestion /
Explosion
Probability *4
Toxic
Hazard *5 Outcome
Fireball
Y Y
VCE (Instantaneous Cloud)
N Y Y
Flash Fire (Instantaneous Cloud)
Vapour N
or Toxic Impacts
Flashing N Y
Liquid No hazard
*6 N
Jet Fire
N Y
VCE (Continuous Cloud)
N Y Y
Flash Fire (Continuous Cloud)
N
Toxic Impacts
N Y
No hazard
N
Note *1: A release is defined as rapid if the section inventory will be released in less than 20 seconds at the initial, peak release rate. Input to BLAST – Assumption II.4.4.
Note *2: Immediate ignition is calculated according to the release rate (and phase). Input to BLAST – Assumption II.7.2.
Note *3: Delayed ignition is calculated according to the release rate (and phase) and any strong ignition sources that are encountered. Input to BLAST + calculation within BLAST - Assumption II.7.2.
Note *4: Vapour Cloud Explosions (VCEs) are modelled if the ignited cloud coincides with a congested volume, subject to a release rate dependent explosion probability. Calculation within BLAST – Assumptions II.6.3 and II.7.3.
Note *5: Toxic impacts are modelled for scenarios where there is potential for the H2S (or equivalent) in air concentration to exceed 500 ppm for 5 minutes or more. Note that the unignited cloud probability is conservatively based on the cloud probability less the immediate ignition only. Input to BLAST – Assumptions II.3.3 and II.7.2.
Note *6: PHAST discharge calculations and the fluid composition are used to determine whether a release is vapour, liquid that won’t flash / vaporise (i.e. ‘liquid’ release type), or liquid that won’t flash but will have a vapour fraction (i.e. ‘vaporising liquid’ release type); all other releases are modelled as ‘flashing liquid’ releases. Input to BLAST – Assumption II.4.3.

December 2008
High-level QRA for ERC Refinery at Mostorod, Egypt – ASSUMPTIONS
Egyptian Refining Company
Page II.31
DNV ENERGY
32345260 r2
Figure II.7.2 – Event Tree for ‘Liquid’ Release Type
Release
Type
Immediate
Ignition *2
Delayed Ignition
*3 Outcome
Pool Fire
Liquid Y
(Vapour / Pool Fire *1
Flash N Y
<20%) No hazard
N
Note *1: Pool fires arising due to delayed ignition are not typically included within the risk calculations on the basis that personnel will have had opportunity to escape from the vicinity of the pool before ignition occurs.
Note *2: Immediate ignition is calculated according to the release rate (and phase). Input to BLAST – Assumption II.7.2.
Note *3: Delayed ignition is calculated according to the release rate (and phase) and any strong ignition sources that are encountered. Input to BLAST + calculation within BLAST - Assumption II.7.2.
Figure II.7.3 – Event Tree for ‘Vaporising Liquid’ Release Type
Release
Type
Immediate
Ignition *2
Delayed Ignition
*3
Congestion /
Explosion
Probability *4
Toxic
Hazard *5 Outcome
Liquid with Pool Fire
Vapour Y
Fraction VCE + Pool Fire *6
(No Flash) N Y Y
*1 Flash Fire + Pool Fire *6
N
Toxic Impacts
N Y
No hazard
N
Note *1: Liquids that would not have significant flash fraction but do have vapour content that will subsequently boil-off from the pool are defined as Vaporising Liquid releases.
Note *2: Immediate ignition is calculated according to the release rate (and phase). Input to BLAST – Assumption II.7.2.
Note *3: Delayed ignition is calculated according to the release rate (and phase) and any strong ignition sources that are encountered. Input to BLAST + calculation within BLAST - Assumption II.7.2.
Note *4: Vapour Cloud Explosions (VCEs) are modelled if the ignited cloud coincides with a congested volume, subject to a release rate dependent explosion probability. Calculation within BLAST – Assumptions II.6.3 and II.7.3.
Note *5: Toxic impacts are modelled for scenarios where there is potential for the H2S (or equivalent) in air concentration to exceed 500 ppm for 5 minutes or more. Note that the unignited cloud probability is conservatively based on the cloud probability less the immediate ignition only. Input to BLAST – Assumptions II.3.3 and II.7.2.
Note *6: Pool fires arising due to delayed ignition are not included within the risk calculations on the basis that personnel will have had opportunity to escape from the vicinity of the pool before ignition occurs (noting that there is also potential for double-counting if delayed ignition also results in a VCE or flash fire).

December 2008
High-level QRA for ERC Refinery at Mostorod, Egypt – ASSUMPTIONS
Egyptian Refining Company
Page II.32
DNV ENERGY
32345260 r2
II.7.2 Ignition Probability Model
Project: 32345260: ERC Refinery, Mostorod
Calculation Run: All Rev.: 0 Date: June 2008
The overall, background probability of ignition is based on the release rate dependent model developed by Cox, Lees and Ang, CLA (Reference 8). For liquid releases, the probability of ignition is derived as follows:
P ignition = exp (0.392 ln (m) - 4.333) where: m = release rate (kg/s) maximum probability of 0.3 applied
The overall ignition probability for gas releases is derived in the same way, where:
P ignition = exp (0.642 ln (m) - 4.16) where: m = release rate (kg/s) maximum probability of 0.3 applied
The corresponding ignition probability is split equally between immediate and delayed ignition. This results in a maximum immediate ignition probability of 0.15, which applies to the majority of the Rupture release cases. The approach adopted for determining the probability of delayed ignition is:
• Assign a ‘background’ ignition probability to each release. This is based on the release rate dependent CLA approach and results in the same values as for the immediate ignition probabilities derived in the previous section. Note that this ‘background’ ignition probability applies to each release irrespective of the location or direction.
• Additionally, strong ignition sources on the site are identified and applied to the risk model. These provide an additional delayed ignition probability (of up to 100%) to any releases that are of sufficient size and directionality to reach the defined ignition sources.
This results in a maximum ‘background’ delayed ignition probability of 0.15, while the maximum ignition probability for releases that come into contact with the above sources (at the appropriate height) is 1.
Comments:
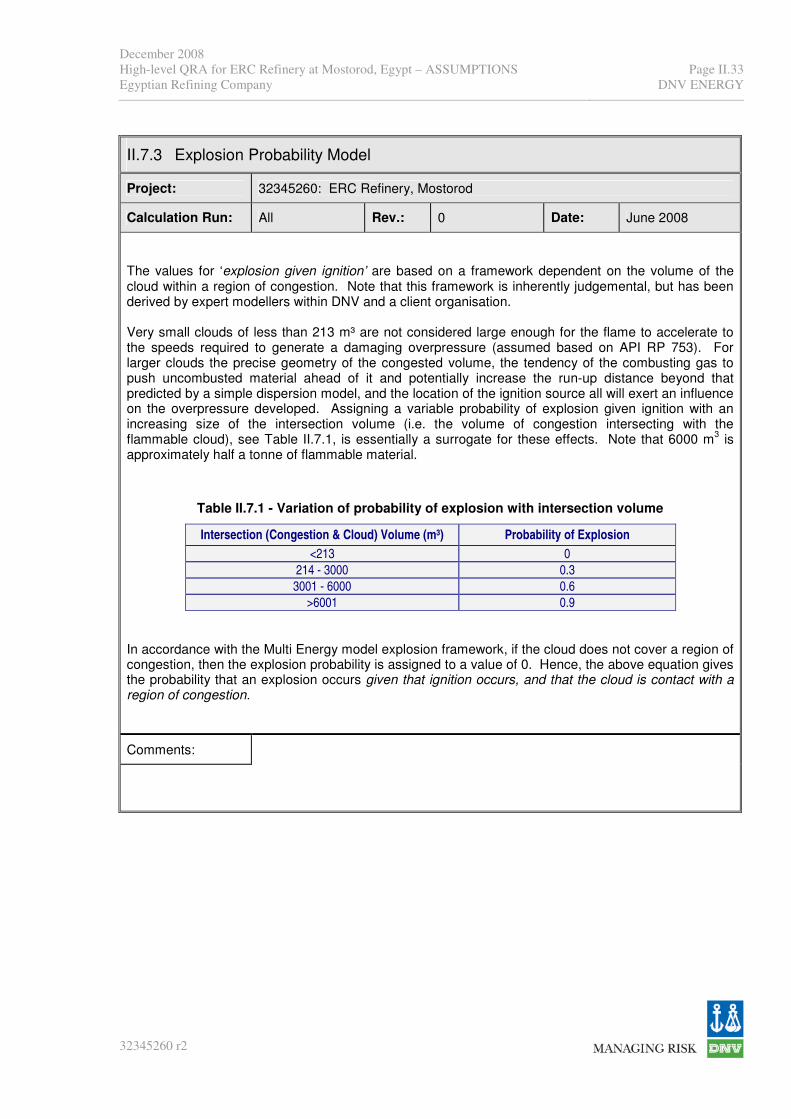
December 2008
High-level QRA for ERC Refinery at Mostorod, Egypt – ASSUMPTIONS
Egyptian Refining Company
Page II.33
DNV ENERGY
32345260 r2
II.7.3 Explosion Probability Model
Project: 32345260: ERC Refinery, Mostorod
Calculation Run: All Rev.: 0 Date: June 2008
The values for ‘explosion given ignition’ are based on a framework dependent on the volume of the cloud within a region of congestion. Note that this framework is inherently judgemental, but has been derived by expert modellers within DNV and a client organisation. Very small clouds of less than 213 m³ are not considered large enough for the flame to accelerate to the speeds required to generate a damaging overpressure (assumed based on API RP 753). For larger clouds the precise geometry of the congested volume, the tendency of the combusting gas to push uncombusted material ahead of it and potentially increase the run-up distance beyond that predicted by a simple dispersion model, and the location of the ignition source all will exert an influence on the overpressure developed. Assigning a variable probability of explosion given ignition with an increasing size of the intersection volume (i.e. the volume of congestion intersecting with the flammable cloud), see Table II.7.1, is essentially a surrogate for these effects. Note that 6000 m
3 is
approximately half a tonne of flammable material.
Table II.7.1 - Variation of probability of explosion with intersection volume
Intersection (Congestion & Cloud) Volume (m³) Probability of Explosion
<213 0
214 - 3000 0.3
3001 - 6000 0.6
>6001 0.9
In accordance with the Multi Energy model explosion framework, if the cloud does not cover a region of congestion, then the explosion probability is assigned to a value of 0. Hence, the above equation gives the probability that an explosion occurs given that ignition occurs, and that the cloud is contact with a region of congestion.
Comments:

December 2008
High-level QRA for ERC Refinery at Mostorod, Egypt – ASSUMPTIONS
Egyptian Refining Company
Page II.34
DNV ENERGY
32345260 r2
II.8.0 References
1 TNO, 1997. Methods for the calculation of physical effects, Part 2, 3rd. ed., CPR 14E,
The Hague: Committee for the Prevention of Disasters.
2 Eggen, J.B.M.M., GAME: development of guidance for the application of the Multi-Energy Method, TNO Report PML 1995-C44, August 1995.
3 Management of Hazards Associated With Location of Process Plant Buildings, API Recommended Practice 752, First Edition, May 1995.
4 HSE, 2002. Flashing liquid jets and two-phase dispersion – A review, Witlox, H.W.M. and Bowen, P.J., HSE Books, Contract Research Report 403/2001.
5 UK HSE, Offshore Hydrocarbon Release Statistics, 1999, Offshore Technology Report – OTO 1999 079.
6 UK HSE, Planning Case Assessment Guidance, Chapter K, UK HSE, 2000.
7 LASTFIRE, Large Atmospheric Storage Tank Fires – A Joint Oil Industry Project …, Resource Protection International, 1997.
8 Cox, A. W., Lees, F.P., & Ang, M. L, Classification of Hazardous Locations, Institute of Chemical Engineers, Rugby, 1990
9 Van den Berg, A.C. and Mos, A.L., RIGOS The Critical Separation Distance, April 2002, TNO PML 2002-C50, Rijswijk, NL.

December 2008
High-level QRA for ERC Refinery at Mostorod, Egypt – FAILURE CASES
Egyptian Refining Company DNV ENERGY
32345260 r2
Appendix III – Failure Case Definition

December 2008
High-level QRA for ERC Refinery at Mostorod, Egypt – FAILURE CASES
Egyptian Refining Company DNV ENERGY
32345260 r2
contents:
III.1.0 Introduction.........................................................................................................1
III.2.0 Methodology.......................................................................................................1
III.3.0 Failure Cases .....................................................................................................2

July 2008
High-level QRA for ERC Refinery at Mostorod, Egypt – FAILURE CASES
Egyptian Refining Company
Page III.1
DNV ENERGY
32345260 r2
III.1.0 Introduction
The basic aim of the Failure Case Definition stage is to identify the failure cases, or major accident hazards, that will have the potential to result in risks to people, in particular to external populations, and hence will be inputs to the risk modelling. For the purposes of this study, the failure cases are derived from previous studies, based on the larger hazards that apply to different refinery units. The basic approach adopted is summarised in Section III.2.0, with the derived failure cases listed in Section III.3.0. Note that the failure case definition presented in this appendix is underpinned by the methodology set out in Appendix II.
III.2.0 Methodology
For the purposes of this high-level risk assessment it is not practical (or necessary) to attempt to model all of the potential hazards associated with the different units. The basic approach adopted instead is summarised below. • Previous ‘reference’ QRA studies evaluating similar units to those proposed for the
Mostorod expansion project (as discussed further in Appendix IV) are reviewed, to identify the scenarios that contribute to the risks beyond the immediate unit area.
• All significant risk contributors at locations a moderate distance outside of each unit are then defined as failure cases for this study, on the basis of having potential off-site impacts.
• In each case, brief review of the representative scenarios against the Mostorod refinery PFDs is undertaken to ensure that the key sections of each unit have been covered by using this approach. The representative parameters for the ‘reference’ failure cases are also reviewed and updated to ensure they are consistent with the corresponding sections in the proposed Mostorod PFDs.
• These failure cases are then superimposed upon the appropriate location of the latest, “Case 10”, plot plan for the Mostorod facilities.
Note that the general methodology adopted in deriving the initial failure cases, and the subsequent development of each, is detailed in Appendix II. Note also that the subsequent modelling approach, using the PHAST and BLAST software is also described in Appendix II. The failure cases derived for each unit are presented in the following section. The tables given include a basic description of the failure case, as well as the representative process conditions and the primary hazard outcome(s) of each release. Note that the full modelling details of each scenario are included in MS Excel spreadsheets that can be provided as required. This includes the leak frequency assigned to each (taken directly from the reference failure case in each case) and the detailed parameters assigned to each (such as the representative diameter, release height, section inventory, etc.).

July 2008
High-level QRA for ERC Refinery at Mostorod, Egypt – FAILURE CASES
Egyptian Refining Company
Page III.2
DNV ENERGY
32345260 r2
This exercise identified that some units (ATU, SRU, VDU) did not contribute significantly to the ‘far-field’ risk picture; hence no failure cases associated with those units have been included in the model. Consistent with the focus on the off-site / significant hazard range risks, only the larger, Rupture and Large leak (75 mm equivalent diameter hole) leak sizes are modelled for each of the failure cases identified.
III.3.0 Failure Cases
The list of representative failure cases is presented in Table III.3.1 to Table III.3.6: • Table III.3.1 – NHT, Naphtha Hydrotreater Unit (Unit 11) Failure Cases – 9 cases • Table III.3.2 – CCR, Catalytic Reformer Unit (Unit 12) Failure Cases – 4 cases • Table III.3.3 – DHT, Diesel Hydrotreater Unit (Unit 14) Failure Cases – 10 cases • Table III.3.4 – HCU, Hydrocracker Unit (Unit 15) Failure Cases – 16 cases • Table III.3.5 – HPU, Hydrogen Unit (Unit 16) Failure Cases – 4 cases • Table III.3.6 – DCU, Delayed Coker (Unit 22) Failure Cases – 5 cases Table III.3.1 – NHT, Naphtha Hydrotreater Unit (Unit 11) Failure Cases
Case
No. Description
Pressure
(barg)
Temperature
(degC) Hazard Type
11-1 Feed Surge Drum 5 43 Vessel Fireball
11-2 Naphtha Splitter Receiver 11 64 Vessel Fireball
11-3 Stripper Overheads Condenser 11 59 Pool Fire
11-4 Flammable Gas Cloud (Flash Fire, VCE)
11-5 Stripper Receiver Bottoms (LPG) 13 43
Pool Fire
11-6 Flammable Gas Cloud (Flash Fire, VCE)
11-7 Naphtha Splitter Bottoms 2 150
Jet Fire
11-8 Light Naphtha to Storage and Reflux to splitter
11 64 Flammable Gas Cloud (Flash Fire, VCE)
11-9 Reactor Effluent 25 60 Pool Fire
Table III.3.2 – CCR, Catalytic Reformer Unit (Unit 12) Failure Cases
Case
No. Description
Pressure
(barg)
Temperature
(degC) Hazard Type
12-1 Condensed Gas at Compression interstage
13 52 Pool Fire
12-2 Bottoms of interstage suction drum to debutaniser
12 192 Flammable Gas Cloud (Flash Fire, VCE)
12-3 Bottoms of interstage suction drum 30 60 Pool Fire
12-4 Cooled Reactor Effluent 2 57 Flammable Gas Cloud (Flash Fire, VCE)

July 2008
High-level QRA for ERC Refinery at Mostorod, Egypt – FAILURE CASES
Egyptian Refining Company
Page III.3
DNV ENERGY
32345260 r2
Table III.3.3 – DHT, Diesel Hydrotreater Unit (Unit 14) Failure Cases
Case
No. Description
Pressure
(barg)
Temperature
(degC) Hazard Type
14-1 HP Stripper 81 100 Vessel Fireball
14-2 Fireball
14-3 HDA Reactor Effluent 74 272
Jet Fire
14-4 Fireball
14-5
HDA Reactor Effluent Separator Bottoms
74 232 Jet Fire
14-6 HDA Hot Separator 73 200 Vessel Fireball
14-7 Product Stripper Bottoms 8 229 Jet Fire
14-8 Product Stripper Overheads 8 59 Pool Fire
14-9 HDS Reactor Effluent 81 232 Jet Fire
14-10 Stripper Bottoms 82 223 Jet Fire
Table III.3.4 – HCU, Hydrocracker Unit (Unit 15) Failure Cases
Case
No. Description
Pressure
(barg)
Temperature
(degC) Hazard Type
15-1 Stripper Receiver 9 56 Vessel Fireball
15-2 Product Fractionator Receiver 1 91 Vessel Fireball
15-3 LPG Amine Absorber 22 43 Vessel Fireball
15-4 Debutaniser Receiver 12 43 Vessel Fireball
15-5 Kerosene export to storage 7 172 Flammable Gas Cloud (Flash Fire, VCE)
15-6 Debutaniser Feed 14 75 Flammable Gas Cloud (Flash Fire, VCE)
15-7 Debutaniser Overheads 13 71 Fireball
15-8 Flammable Gas Cloud (Flash Fire, VCE)
15-9 Debutaniser Receiver 12 43
Pool Fire
15-10 Reaction Train 181 410 Jet Fire
15-11 Stripper receiver 9 56 Flammable Gas Cloud (Flash Fire, VCE)
15-12 Stripper receiver 9 56 Jet Fire
15-13 Cold Separator 165 56 Pool Fire
15-14 Flammable Gas Cloud (Flash Fire, VCE)
15-15 Cold Separator Effluent 27 51
Jet Fire
15-16 Cold Flash Drum Effluent 10 239 Flammable Gas Cloud (Flash Fire, VCE)

July 2008
High-level QRA for ERC Refinery at Mostorod, Egypt – FAILURE CASES
Egyptian Refining Company
Page III.4
DNV ENERGY
32345260 r2
Table III.3.5 – HPU, Hydrogen Unit (Unit 16) Failure Cases
Case
No. Description
Pressure
(barg)
Temperature
(degC) Hazard Type
16-1 Condensed Gas at Compression interstage
13 52 Pool Fire
16-2 Bottoms of interstage suction drum to debutaniser
12 192 Flammable Gas Cloud (Flash Fire, VCE)
16-3 Bottoms of interstage suction drum 30 60 Pool Fire
16-4 Cooled Reactor Effluent 2 57 Flammable Gas Cloud (Flash Fire, VCE)
Table III.3.6 – DCU, Delayed Coker (Unit 22) Failure Cases
Case
No. Description
Pressure
(barg)
Temperature
(degC) Hazard Type
22-1 Flammable Gas Cloud (Flash Fire, VCE)
22-2 Stabilised Naphtha 12 190
Jet Fire
22-3 Absorber Ovhds 16 55 Flammable Gas Cloud (Flash Fire, VCE)
22-4 Debutaniser Overhead Drum Effluent
11 40 Flammable Gas Cloud (Flash Fire, VCE)
22-5 Stripper Condenser Feed 17 73 Flammable Gas Cloud (Flash Fire, VCE)

December 2008
High-level QRA for ERC Refinery at Mostorod, Egypt – BENCHMARK
Egyptian Refining Company DNV ENERGY
32345260 r2
Appendix IV – Benchmark Results

December 2008
High-level QRA for ERC Refinery at Mostorod, Egypt – BENCHMARK
Egyptian Refining Company DNV ENERGY
32345260 r2
contents: IV.1.0 Introduction.........................................................................................................1
IV.2.0 Basis for Comparisons .......................................................................................2
IV.3.0 Individual Risk Contours.....................................................................................4
IV.3.1 Indicative Results ...............................................................................................4
IV.3.2 Discussion of Indicative Results .........................................................................5
IV.4.0 Maximum Hazard Ranges ..................................................................................6
IV.4.1 Explosions ..........................................................................................................6
IV.4.2 Fires ...................................................................................................................7
IV.4.3 Toxic Impacts .....................................................................................................8
IV.4.4 Overview ............................................................................................................9
IV.5.0 Hazard Frequency............................................................................................10
IV.5.1 Explosions ........................................................................................................10
IV.5.2 Flash Fires........................................................................................................11
IV.5.3 Immediate Ignition Events (Pool and Jet Fires / Fireballs)................................11
abbreviations: The abbreviations used within this appendix are listed below:
API (RP) American Petroleum Institution (Recommended Practice)
B/L Battery Limit
DNV Det Norske Veritas
ERC Egyptian Refining Company
QRA Quantitative Risk Assessment
VCE Vapour Cloud Explosion

December 2008
High-level QRA for ERC Refinery at Mostorod, Egypt – BENCHMARK
Egyptian Refining Company
Page IV.1
DNV ENERGY
32345260 r2
Appendix IV – Benchmark Results
IV.1.0 Introduction
While the detailed aspects of individual refinery units can vary significantly, the basic hazards and the order of magnitude of the risks associated with each unit are generally the same. The above applies to some extent to all refinery units (i.e. the risks in and around any process unit are broadly similar, in order of magnitude), but applies particularly in terms of comparing the same type of unit in different facilities. The above is the basis for this appendix, which aims to summarise the risk results for relevant refinery units from recent QRA studies conducted by DNV. The aim of this is to: • Provide a very high-level indication of the risk results that can be expected for the units that
are the subject of this study. • Provide benchmark results against which the results of this study can be validated. This is
important for a high-level study, such as this, since the results can only be indicative (i.e. while attempting to reflect the local conditions and specific design, it is necessary to ensure that the results are reflective of what is ‘typical’).
The following sections cover: • Section IV.2.0 sets out the basis for the comparisons presented in the subsequent sections.
Note that this includes important caveats, emphasising that the comparisons should only be used as indicative results.
• Section IV.3.0 presents typical risk results, in terms of the extent of individual risk contours around each unit.
• Section IV.4.0 discusses the extent of the different hazards that apply to different units, primarily in terms of the hazard frequency contours that can be expected but also the maximum hazard ranges that may apply.
• Section IV.5.0 presents a brief overview of the frequency of different hazard types. Note that this is of limited relevance to this high-level study (since only the major scenarios are modelled), but is intended to provide a basis for comparison of future studies (as the design and associated risk analyses increase in detail).

December 2008
High-level QRA for ERC Refinery at Mostorod, Egypt – BENCHMARK
Egyptian Refining Company
Page IV.2
DNV ENERGY
32345260 r2
IV.2.0 Basis for Comparisons
While a large number of refinery QRA studies have been conducted by DNV in recent years, the most appropriate basis is considered to be to use the two most recent studies, both of which use the same basic methodology as proposed for this study (i.e. as set out in Appendix II)1. For confidentiality reasons it is not appropriate to describe the reference refineries used or show the actual results, but where: • Both of the reference refinery QRAs contain units that are equivalent to those included within
the scope of this study, although noting that only one has a delayed coker unit. • The relative size of the refineries and units is broadly similar. However, the sizes have not
been considered in any detail, since the throughput and overall scale of each unit will not have a key influence on the risks. That is, the hazards and risks are generally dominated by the release rate (which is largely driven by the pressure) and material released, rather than the size of the different vessels / pipework or the flow rate through them (although these latter aspects will have some influence).
The detailed design of each unit will vary significantly, which will lead to different failure cases and different frequencies assigned to each. However the overall leak frequency and the types of releases involved will be broadly consistent. Similarly, the extent of the congested volumes and number of ignition sources will inevitably vary, leading to localised differences, although the overall effect will tend to be similar. The key differences will be in the prevailing wind and the layout / location of units relative to each other. This means there is no advantage in considering the variation of the hazard and risk contours in and around the unit, and each is instead simplified to predict a hazard / risk radius from the unit. It should be emphasised that this is simplistic; in practice the layout of the unit, the proximity of different ignition sources and the prevailing wind direction will lead to the hazard / risk contours around each unit being irregular, and often biased in one direction. The above is the key caveat in terms of the validity (or accuracy) of the results. However, it is also important to note that the results will be sensitive to the methodology adopted. The reference studies were both conducted in a similar manner (using the same failure data and ignition probability approach, for example), but where:
• The results could be an order of magnitude higher or lower if different failure data is used.
• The same applies to some extent to the ignition probability model, although it will be generally less sensitive to this since the ignition probability in refineries is dominated by the number of sections that are above their Auto Ignition Temperature (AIT).
The following table lists the units considered within this study and gives brief notes on the hazards, based on the analysis conducted in the reference studies.
1 While this study is high-level, the same basic methodology has been applied in the reference studies but
in full detail.

December 2008
High-level QRA for ERC Refinery at Mostorod, Egypt – BENCHMARK
Egyptian Refining Company
Page IV.3
DNV ENERGY
32345260 r2
Table IV.2.1 – Hazard Summary by Unit Type
Unit
No.
Unit
Code Unit Name Hazard Identification / Failure Case Definition Notes
11 NHT Naphtha Hydrotreating
Significant hydrocarbon inventory and flows. Includes light hydrocarbons and hydrogen, as well as vapour fractions, at high temperatures and pressures. Hence, significant flammable vapour cloud potential in addition to pool (and jet / spray) fire hazards. Toxic concentrations are relatively low.
12/13 CCR
Reformer / Continuous Catalytic Reformer
Significant hydrocarbon inventory and flows. Includes light hydrocarbons and hydrogen, as well as vapour fractions, at high temperatures and pressures. Hence, significant flammable vapour cloud potential in addition to pool (and jet / spray) fire hazards. Toxic concentrations are relatively low.
14 DHT Diesel Hydrotreating
Significant hydrocarbon inventory and flows. Includes hydrocarbons and hydrogen at high temperatures and pressures. Hence, significant flammable vapour cloud potential in addition to pool (and jet / spray) fire hazards. Toxic concentrations are relatively low.
15 HCU Hydrocracker Unit
Significant hydrocarbon inventory, flows and very high pressure and temperature (AIT). Primarily light hydrocarbons up to C6 (plus some hydrogen) and at high temperatures and pressures, so significant flammable vapour cloud potential in addition to pool (and jet / spray) fire hazards. Some vapour streams may have up to 25% H2S by mole.*
16 HPU Hydrogen Production Unit
Methane and hydrogen streams, including some toxics also. Primary hazards are jet fires and potential flammable vapour clouds.
21 VDU Vacuum Distillation Unit
Significant hydrocarbon inventory and flows. Primarily heavy hydrocarbons, with relatively minor vapour cloud potential – pool fires likely to be the dominant hazard. Vapour streams are very low flows, also under vacuum or low pressure, but with H2S of up to 15% by mole. *
22 DCU Delayed Coker
Significant hydrocarbon inventory and flows. Includes heavy hydrocarbons and specific hazards associated with coke / dust and high temperatures, although there are also significant hazards due to gas concentration (debutanisation, etc) with vapour fractions at high temperatures and pressures. Hence, significant flammable vapour cloud potential in addition to pool and jet / spray fire hazards. Toxic concentrations are relatively low.
23 DEU De-ethaniser Significant hydrocarbon inventory but limited flows. Primarily light hydrocarbons (C3 and C4), with important vapour cloud explosion potential, and significant flammable gas dispersion distances.
25-28 ATU / SWS
Amine Treatment / Sour Water Stripper
Primarily lean / rich amine with limited hazard potential, but some sections with potential to flash vapour containing H2S and product of unit is toxic stream (close to 100% H2S). Low flow-rates, temperatures and pressures.
80 SRU / TGT
Sulphur Recovery Unit / Tail Gas Treatment
Primarily toxic hazard due to the feed streams being close to 100% H2S / NH3. The toxicity reduces through the process, as sulphur is produced. Limited flammable hazard. Low flow-rates and pressures, some very high temperatures.
Note *: Maximum H2S concentrations of between 5 and 10% are anticipated for the ERC facilities covered by this study.

December 2008
High-level QRA for ERC Refinery at Mostorod, Egypt – BENCHMARK
Egyptian Refining Company
Page IV.4
DNV ENERGY
32345260 r2
IV.3.0 Individual Risk Contours
IV.3.1 Indicative Results
The most widely used, and generally useful, measure of risk is individual risk contours, which show the variation of the risk to an individual continuously present, outdoors. Table IV.3.1 summarises estimates of the distance to different individual risk contours from the different units considered for this study. These estimates are derived from the previous studies described in Section IV.2.0 and are discussed in the following section. It should be emphasised that the distances are approximate. They will vary in all directions, as well as for specific units / refineries, where: • In general, the risks of up to 10-5 per year will tend to be dominated by jet and pool fire
effects, while the risks of less than 10-5 per year will be due to the larger hazard range events associated with flammable vapour clouds and the associated flash fire potential.
• The flammable vapour cloud dispersion will be sensitive to the wind direction and, hence, the 10-5 and 10-6 per year values given above are particularly coarse estimates, noting that the actual radius, for individual risk contours, may vary between 25 and more than 500 m according to the prevailing wind direction.
• It should also be noted that these results are per unit. The individual risks around the refinery will tend to be slightly higher due to the overlap of the risks from different units.
Most of the results given in Table IV.3.1 are given as an approximate radius (or locus) around the battery limit (B/L) of each unit. For example, for the Naphtha Hydrotreating (NHT) unit the 10-4 per year contours cover the whole unit and extend up to 100 m from the battery limit. Table IV.3.1 – Indicative Risk Contour Distances from Unit
Approximate Radius / Distance (m) to Individual Risk (per year) Contour Unit
No. Unit Code
10-2 10-3 10-4 10-5 10-6
11 NHT - Within unit (to B/L) B/L + 100m B/L + 175m B/L + 250m
12/13 CCR - Within unit (to B/L) B/L + 100m B/L + 175m B/L + 250m
14 DHT Localised
(within unit only) B/L + 25m B/L + 100m B/L + 175m B/L + 250m
15 HCU Localised
(within unit only) B/L + 50m B/L + 150m B/L + 300m B/L + 450m
16 HPU - - Within unit (to B/L) B/L + 100m B/L + 100m
21 VDU - Within unit (to B/L) B/L + 100m B/L + 200m B/L + 300m
22 DCU Localised
(within unit only) Within unit (to B/L) B/L + 100m B/L + 250m B/L + 350m
23 DEU - - Within unit (to B/L) B/L + 200m B/L + 350m
25-28 ATU / SWS - - B/L + 100m B/L + 200m B/L + 250m
80 SRU / TGT - - B/L + 100m B/L + 200m B/L + 250m
Note: “B/L” above refers to the respective unit battery limit (B/L).

December 2008
High-level QRA for ERC Refinery at Mostorod, Egypt – BENCHMARK
Egyptian Refining Company
Page IV.5
DNV ENERGY
32345260 r2
IV.3.2 Discussion of Indicative Results
Focussing on the 10-6 per year contours, which are the target in terms of negligible individual risk to people (members of the public): • The results from Table IV.3.1 suggest that the idealised scenario would be to have 450 m or
more separation between residential areas and the nearest edge of a refinery. This very simplistic approach would avoid the need to consider the relative location of different units, but is unlikely to be very practical (and would be overly conservative in most cases).
• Ensuring that there is around 450 m separation from residential areas would be a realistic target for Hydrocracker units.
• Using the same approach, the delayed coker and de-ethaniser units should have separation distances of up to 350 m between the nearest residential areas and the unit battery limits.
• 250 m is the separation distance suggested for the majority of other units. • Due to the materials involved (methane and hydrogen) being relatively buoyant, the
hydrogen production unit is the one unit where a separation distance of less than 250 may be justifiable, where this may be of the order of 100m.
It should be emphasised that these are indicative distances, broadly representative of the conservative case, corresponding to the downwind direction, but very much indicative only. Hazards may apply at greater distances, while more detailed considerations (particularly where the wind probability is limited) may show that significantly shorter distances apply. Note that individual risk levels of below 10-6 per year are also relevant, particularly if they may potentially affect significant populations. The 10-7 and 10-8 per year contours, will extend greater distances than the above, although these will tend to be dominated by very specific scenarios. These are not considered in any detail for this high-level study, although it should be noted that: • The 10-7 and 10-8 per year contours do not typically extend much further than the 10-6 per
year contours, typically no more than an additional 100 m. • Although these are low frequency risks and would be broadly acceptable in terms of
individual risk, they may affect a large number of people, in which case the cumulative risk to a large number of individuals will lead to significant societal risk.
The focus of this assessment is on the key off-site risks, where 10-6 per year is the key measure. However, the 10-4 per year and 10-5 per year contours are also important in that: • It should be confirmed that there are no significant populations within these contours other
than the refinery workers. • Where 10-5 per year risks (or higher) affect adjacent industrial populations the risks should
be considered carefully. These risk levels may potentially be shown to be tolerable but they are still significant and would lead to a requirement for common emergency response procedures, as a minimum.
While the individual risk contours are used directly with respect to the public, i.e. assuming that continuous presence at a location is credible, the individual risks to workers should account for the time they spend at a location and whether they are indoors or outdoors. Hence, risk contours of 10-3 per year do not mean that the risks are unacceptable. The actual individual risk to someone working normal shift patterns will be 20-25% of the risk indicated by the contours themselves.

December 2008
High-level QRA for ERC Refinery at Mostorod, Egypt – BENCHMARK
Egyptian Refining Company
Page IV.6
DNV ENERGY
32345260 r2
IV.4.0 Maximum Hazard Ranges
This section aims to provide an overview of the different hazard types that apply within refinery units and, specifically, to give an indication of the extent of the hazard ranges that typically apply. The key focus is on the potential off-site impacts, although the following also considers the more localised, on-site, hazards. Note that the frequency of different hazards are considered throughout the following sections to put the likelihood of each hazard range into context. Generally speaking, a frequency of 10-4 per year can be taken as the hazard frequency at which facilities are designed against, although this is very general and is not as widely accepted a criterion as for individual risks. It should be emphasised that the frequencies quoted in the following sections are hazard frequencies, rather than individual risk values. It should also be emphasised that the following discussion is indicative only, being based on generalisation of the results obtained for a wide range of different units.
IV.4.1 Explosions
Most refinery units will have a combination of flammable release scenarios and congested volumes that will result in the potential for significant explosions. Overpressures in excess of 0.5 barg are, therefore, credible for almost all units. However, it should be noted that the frequency of significant explosions is limited and the extent of the 0.5 barg hazard range will be relatively localised. In general, 0.5 barg overpressures will have a maximum frequency of less than 10-4 per year and will generally be restricted to the ‘source’ unit. The maximum extent of 0.5 barg hazards is typically no more than 50 m beyond the battery limit of a unit. The same applies to 0.3 barg contours, noting that 0.3 barg is widely used as the threshold for significant escalation potential. It is typically the case that 0.3 barg contours do not exceed the respective unit battery limits with a frequency of more than 10-5 per year, with the possible exception of the “higher risk” units such as the Hydrocracker. For overpressures of 0.1 barg, which have significant damage potential for unprotected buildings, the peak frequency is typically between 10-4 and 10-3 per year for the majority of units. For the “higher risk” units, such as the Hydrocracker, the 10-4 per year contours will tend to extend around 50 m beyond the edge of the unit. This distance will increase with decreasing frequency, up to a maximum distance of approximately 300 m from the battery limit for the worst-case units. Note that the maximum distance to 0.1 barg is generally around 100 m from the battery limit for a typical unit. Note that most buildings within the main refinery areas, i.e. within a unit, would be expected to have blast protection of the order of 0.1 barg if designed against 10-4 per year explosion loads. This would tend to increase if the building is close to a significant congestion or if more stringent design loads are used (such as if the building is occupied or has specific safety functions). Overpressures of less than 0.1 barg will potentially have significant hazard ranges, where: • API 753 recommends that temporary buildings are located outside the range of 0.06 barg
contours, noting that this can also be used as general guidance with respect to residential
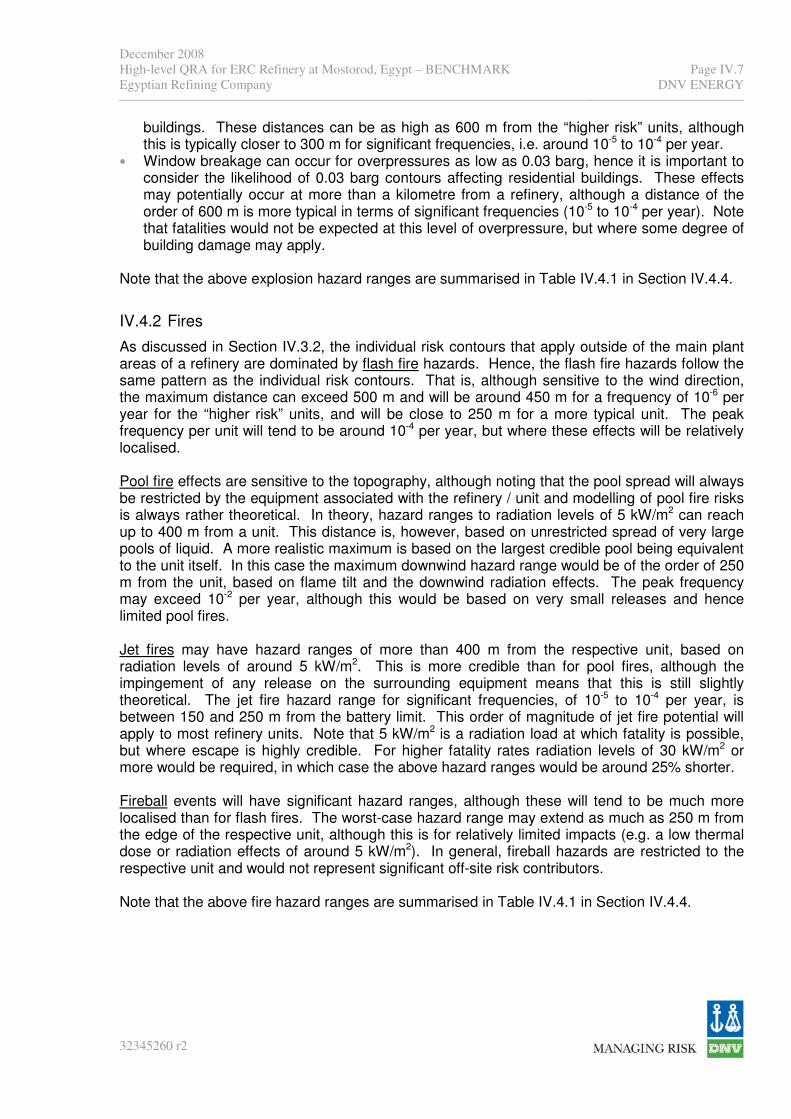
December 2008
High-level QRA for ERC Refinery at Mostorod, Egypt – BENCHMARK
Egyptian Refining Company
Page IV.7
DNV ENERGY
32345260 r2
buildings. These distances can be as high as 600 m from the “higher risk” units, although this is typically closer to 300 m for significant frequencies, i.e. around 10-5 to 10-4 per year.
• Window breakage can occur for overpressures as low as 0.03 barg, hence it is important to consider the likelihood of 0.03 barg contours affecting residential buildings. These effects may potentially occur at more than a kilometre from a refinery, although a distance of the order of 600 m is more typical in terms of significant frequencies (10-5 to 10-4 per year). Note that fatalities would not be expected at this level of overpressure, but where some degree of building damage may apply.
Note that the above explosion hazard ranges are summarised in Table IV.4.1 in Section IV.4.4.
IV.4.2 Fires
As discussed in Section IV.3.2, the individual risk contours that apply outside of the main plant areas of a refinery are dominated by flash fire hazards. Hence, the flash fire hazards follow the same pattern as the individual risk contours. That is, although sensitive to the wind direction, the maximum distance can exceed 500 m and will be around 450 m for a frequency of 10-6 per year for the “higher risk” units, and will be close to 250 m for a more typical unit. The peak frequency per unit will tend to be around 10-4 per year, but where these effects will be relatively localised. Pool fire effects are sensitive to the topography, although noting that the pool spread will always be restricted by the equipment associated with the refinery / unit and modelling of pool fire risks is always rather theoretical. In theory, hazard ranges to radiation levels of 5 kW/m2 can reach up to 400 m from a unit. This distance is, however, based on unrestricted spread of very large pools of liquid. A more realistic maximum is based on the largest credible pool being equivalent to the unit itself. In this case the maximum downwind hazard range would be of the order of 250 m from the unit, based on flame tilt and the downwind radiation effects. The peak frequency may exceed 10-2 per year, although this would be based on very small releases and hence limited pool fires. Jet fires may have hazard ranges of more than 400 m from the respective unit, based on radiation levels of around 5 kW/m2. This is more credible than for pool fires, although the impingement of any release on the surrounding equipment means that this is still slightly theoretical. The jet fire hazard range for significant frequencies, of 10-5 to 10-4 per year, is between 150 and 250 m from the battery limit. This order of magnitude of jet fire potential will apply to most refinery units. Note that 5 kW/m2 is a radiation load at which fatality is possible, but where escape is highly credible. For higher fatality rates radiation levels of 30 kW/m2 or more would be required, in which case the above hazard ranges would be around 25% shorter. Fireball events will have significant hazard ranges, although these will tend to be much more localised than for flash fires. The worst-case hazard range may extend as much as 250 m from the edge of the respective unit, although this is for relatively limited impacts (e.g. a low thermal dose or radiation effects of around 5 kW/m2). In general, fireball hazards are restricted to the respective unit and would not represent significant off-site risk contributors. Note that the above fire hazard ranges are summarised in Table IV.4.1 in Section IV.4.4.

December 2008
High-level QRA for ERC Refinery at Mostorod, Egypt – BENCHMARK
Egyptian Refining Company
Page IV.8
DNV ENERGY
32345260 r2
IV.4.3 Toxic Impacts
The extent of the toxic hazard ranges will be sensitive to the composition of the feed to each unit in terms of the proportion of H2S that applies. However, it is important that toxic impacts are considered in the overall risk analysis, where the following general aspects will typically apply: • The greatest toxicity will apply to the Amine Treatment, Sour Water Stripper and Sulphur
Recovery units, each of which will include some process streams that are 100% H2S. These will have potentially significant hazard ranges, although it should be noted that the pressure of these units is low, which limits the maximum effects. The maximum hazard ranges would be expected to exceed 350 m from the relevant unit battery limit, although these would be for relatively low frequency events.
• It should be emphasised that toxic impacts will depend on the combination of the exposure duration and the toxic concentration. Hence, while the hazard ranges corresponding to significant risk levels may be around 350 m, low concentrations of H2S that may have potential health2 impacts (as opposed to fatality impacts) may have much greater hazard ranges.
• Significant hazard ranges (100 to 300 m) will also apply to the process units where potential flammable vapour cloud releases from some sections may also contain significant compositions of H2S. Typically the H2S content is a maximum of 10% (by mole), although this can increase for certain sections. The toxic effects associated with these releases should not be neglected, noting that these will apply for any release, as opposed to flammable impacts which are only realised if ignition occurs. Also, as above, the distances to some toxic health impact may be greater than the flammable hazard range.
• However, the hazard range for significant toxic impacts is generally less than the distance to the lower flammable limit. Hence, although the toxic impacts are significant in terms of the maximum hazard ranges the flammable effects are generally the dominant aspect.
On the basis of the above, toxic impacts have not been considered to be a high priority for this high-level study, due to the focus on identifying the maximum hazard ranges, where the flammable vapour clouds will tend to be the key aspects for off-site populations. However, as indicated above, it is essential that toxic risk contributions are considered, as their contribution to both on and off site risks will be significant in refineries with significant sour feed (i.e. high H2S compositions).
2 The focus of QRA studies is on major accident hazards. Potential impacts to health (as opposed to
potential fatality / serious injury) are, therefore, not typically considered. While health impacts are of course important, these aspects are normally considered in terms of more routine events (e.g. flaring) and where the health effects from low frequency accident hazards would not typically be relevant to the overall design / layout considerations.

December 2008
High-level QRA for ERC Refinery at Mostorod, Egypt – BENCHMARK
Egyptian Refining Company
Page IV.9
DNV ENERGY
32345260 r2
IV.4.4 Overview
Table IV.4.1 aims to summarise the discussion given in Sections IV.4.1 to IV.4.3. It should be emphasised that these results are very approximate and are intended to give a simple overview of the most likely hazard ranges and the relative frequency of each, for each main hazard type. The intention of this summary is to provide a guide to the expected hazard ranges, to compare against the results for a particular unit, etc. Initially this will also provide a very high-level indication of the hazard ranges that may apply. These results should, of course, be superseded by more detailed analysis of the actual units under consideration (i.e. by Appendix V). Table IV.4.1 – Summary of Indicative Hazard Ranges
Approximate Radius / Distance (m) to Hazardous Impacts Hazard
Type Peak frequency >10-4 per year
hazard range
10-5 per year
hazard range
<10-6 per year
hazard range Notes
>0.3 barg < 10-3 per year Localised, within
unit 0-50 m from unit
B/L 0-50 m from unit
B/L Escalation and significant
damage potential
0.1-0.3 barg < 10-3 per year 0-50 m from unit
B/L
0-150 m from unit B/L, depending
on unit
100-300 m from B/L, depending
on unit Building damage
< 0.1 barg > 10-3 per year for higher risk
units
200 / 600 m for 0.07 / 0.03 barg
300 / 800 m for 0.07 / 0.03 barg
600 / 1000+ m for 0.07 / 0.03
barg
Minor damage / window breakage / etc
Flash fire < 10-3 per year Localised, within
unit
100-300 m from B/L, depending
on unit
> 500 m from B/L for higher risk
units
Sensitive to wind direction and unit type
Jet fire 10-2 per year Can reach 100 m from the unit B/L for 10-4 per year
100-200 m from B/L, depending
on unit
> 350 m from B/L for higher risk
units
These results are for 5 kW/m2 and hence are
conservative
Pool fire 10-2 per year Localised, within
unit
0-250 m from unit B/L, depending
on unit
0-250 m from unit B/L, depending
on unit
These results are for 5 kW/m2 and hence are
conservative
Fireball Around 10-3 per
year
Up to 150 m from B/L in some cases, but
typically <B/L
0-250 m from unit B/L, depending
on unit
0-250 m from unit B/L, depending
on unit
Max ranges given are for relatively low doses – significant impacts are
more localised
Toxic Impacts
> 10-3 per year for higher risk
units
Up to 200 m from most toxic
process units – localised for SRU
/ ATU / etc
100-300 m for all units with toxics
> 350 m from B/L for higher risk
units
Sensitive to the worst-case toxic composition. Peak
hazard ranges for the toxic / utility units (SRU, etc), but
higher frequency for process units (HCU, etc).
Note: It should be emphasised that the frequencies given above are for hazards and do not correspond to risks. There are no specific criteria that apply to hazard frequencies, only the risks that result from combining all hazards. Hence the frequencies given are to differentiate between the relative likelihood of different effects only.

December 2008
High-level QRA for ERC Refinery at Mostorod, Egypt – BENCHMARK
Egyptian Refining Company
Page IV.10
DNV ENERGY
32345260 r2
IV.5.0 Hazard Frequency
Comparison of the predicted hazard frequencies against incident experience is an important ‘sense-check’ on QRA results, wherever possible. Although this study is high-level, such that the site-specific hazards are not assessed in sufficient detail to compare against incident experience, the following should provide a relevant benchmark for very coarse comparisons and for more relevant comparisons for future phases of the facility’s development.
IV.5.1 Explosions
Guidance on the frequency of explosions within petrochemical facilities are given below: • Guidance from previous studies that DNV use for comparison of QRA results (from internal
BP and DNV references) suggest that the frequency of “catastrophic VCE” in “higher risk” refinery units is around 1.3 x 10⁻³ per year, and around an order of magnitude lower in “standard” process units.
• Worldwide experience (from internal TOTAL and DNV reference data), indicates a total explosion frequency of 4.8 x 10⁻³ per year for cracker units.
• Both of the above are broadly consistent with other very general published guidance given by API RP 752, Lees, etc, which suggests that explosion frequencies of the order of 10-4 per year are typical for process plant.
The explosion frequency values derived by DNV in previous QRA studies (such as the reference studies discussed in Section IV.2.0) typically exclude smaller release scenarios and hence can be considered to be broadly consistent with the “catastrophic VCE” scenario considered above. However, it should be emphasised that this is a very broad term and it is likely that a number of the scenarios modelled result in explosions that may be better described as “major” rather than catastrophic. Nevertheless, it can generally be said that: • The peak explosion frequency in Hydrocracker and other “higher risk” units approaches 10-3
per year. • The explosion frequency reduces by up to an order of magnitude for the other units, to
around 10-4 per year, which is considered to be consistent with the above. Taking more specific conclusions from the ‘reference’ QRA studies: • For each of the main process units, the predicted explosion frequency is between 5 x 10⁻⁵
per year and almost 10-3 per year. Most are towards the upper end of this range, and hence of the order of 5 x 10⁻⁴ per year.
• The maximum explosion frequency predicted is around 9 x 10⁻⁴ per year, for a Hydrocracker unit, noting that this tends to have the greatest number of potential release scenarios and also tends to be one of the more congested units. Fluid Catalytic Cracker (FCC) units and the gas concentration units (such as associated with Delayed Coker units) also tend to be significant contributors to the overall explosion frequency at around 6 x 10⁻⁴ per year.

December 2008
High-level QRA for ERC Refinery at Mostorod, Egypt – BENCHMARK
Egyptian Refining Company
Page IV.11
DNV ENERGY
32345260 r2
IV.5.2 Flash Fires
Guidance from previous studies that DNV use for comparison of QRA results (internal DNV reference) suggests that the frequency of “catastrophic and major flash fire” in “higher risk” refinery units is around 6 x 10⁻³ per year, and an order of magnitude lower in “standard” process units. Taking the range of units within a typical refinery as covering “standard” through to “higher risk” units, the flash fire frequencies predicted in previous QRA studies by DNV tend to be consistent with the above guidance. The maximum (higher risk) units in the ‘reference’ studies (see Section IV.2.0) have a flash frequency of 5 to 8 x 10⁻³ per year, while the minimum (standard) process units have a frequency of the order of 5 x 10⁻⁴ per year. In general, the pattern of results relating to flash fire frequencies is broadly the same as for explosions, but with the frequency being an order of magnitude higher.
IV.5.3 Immediate Ignition Events (Pool and Jet Fires / Fireballs)
Guidance from previous studies that DNV use for comparison of QRA results (internal BP / DNV reference) suggests that the frequency of “catastrophic and major local fire” in “higher risk” refinery units is around 3 x 10⁻³ per year, and an order of magnitude lower in “standard” process units. However, most QRA studies of refineries conducted by DNV, including the ‘reference’ studies (see Section IV.2.0), tend to result in fire frequencies that are considerably higher than the above guidance. These results are, however, highly dependent on the definition of “catastrophic / major” fires, since the predicted jet and pool fire frequencies will reduce significantly if Small and Medium releases are screened out. Note also that the frequencies are dominated by the releases predicted for sections that are above their Auto Ignition Temperature (AIT), which will tend to result in very high ignition frequencies for specific parts of specific units.
In terms of pool fires: • Where there are significant parts of the unit that are above their AIT, such as for Vacuum
Distillation or Delayed Coker units, the predicted pool fire frequencies are around 10-2 per year.
• The frequency of pool fires in other units is markedly lower, with the other units generally having pool fire frequencies of less than 10-3 per year, and typically closer to 10-4 per year.
In terms of jet fires and fireballs: • The biggest contribution to the jet fire frequency can be as high as 10-1 per year, based on
the results of previous QRAs conducted by DNV. This can potentially apply to Hydrocracker, Fluid Catalytic Cracker (FCC) and other (e.g. Hydrogenation) units. This high frequency is dominated by the relatively small, but high frequency jet fire events associated with sections that are above their AIT.
• AIT sections also contribute to the jet fire frequencies for other units, but to a lesser extent, where the full range of jet fire frequencies per unit is more typically between just under 10-3 per year and just over 10-2 per year.
• The pattern is similar for fireballs, although these generally apply only for Rupture / large scenarios, so the frequency is generally lower (by around an order of magnitude).

December 2008 High-level QRA for ERC Refinery at Mostorod, Egypt – RESULTS Egyptian Refining Company DNV ENERGY
32345260 r2
Appendix V – High-level QRA Results
December 2008 High-level QRA for ERC Refinery at Mostorod, Egypt – RESULTS Egyptian Refining Company DNV ENERGY
32345260 r2
contents: V.1.0 Introduction.........................................................................................................1
V.2.0 Risk Results .......................................................................................................1 V.2.1 Individual Risk Contours.....................................................................................1 V.2.2 Risks to the Public (Off-site) ...............................................................................2 V.2.3 Risks to Workers (On-site) .................................................................................5 V.2.4 Societal Risk.......................................................................................................5
V.3.0 Hazard Frequency Contours ..............................................................................6 V.3.1 Explosion Hazards .............................................................................................6 V.3.2 Fire Hazards.....................................................................................................12
December 2008 High-level QRA for ERC Refinery at Mostorod, Egypt – RESULTS Egyptian Refining Company
Page V.1DNV ENERGY
32345260 r2
Appendix V – High-level QRA Results
V.1.0 Introduction
This appendix aims to provide the detailed results of the high-level risk assessment conducted for the proposed refinery expansion at Mostorod. This appendix is set out as follows: • Section V.2.0 details the risk results, which are primarily based around the individual risk
contours. These are discussed separately with respect to the potential off-site risks to the public and to the on-site risks to workers (including workers in adjacent industrial facilities).
• Section V.3.0 aims to support the discussion of the above risk results by presenting and discussing the different hazards contributing to the risks.
Note that conclusions and recommendation are included within the discussion in this appendix and are summarised in the main report. Note that the google-plot used to present the results in this appendix is based on the existing facilities, in order to show the surrounding areas. The layout used within the risk model cannot be seen on the plots, but is based on the “Case 10” layout, as discussed in Appendix II.
V.2.0 Risk Results
V.2.1 Individual Risk Contours
At this early / high-level stage in the design / risk assessment process the most useful measure of risk is individual risk, which is presented in the form of contours. The individual risk contours for the initial high-level risk assessment are shown in Figure V.2.1. This gives the risk of fatality (or serious injury) experienced by a person continuously present, outdoors. It should be emphasised when interpreting the results shown in Figure V.2.1 that: • These results are based only on the major accident hazards identified as having the key
hazard ranges (as discussed in Appendix III) and hence are focussed on the off-site risks. The on-site risks will be under-predicted by neglecting the smaller hazard range events that do not affect the off-site populations but will have relatively high frequencies and, hence, will be significant in terms of on-site risk.
• Although based on the risks to people outdoors, these contours are considered to be directly applicable to the risks to residential populations. That is, no risk benefit (i.e. protection) is claimed for being indoors for residential buildings. Thus, the 10-6 per year individual risk contour can be taken as the target risk level for the public in terms of individual risk (see Appendix I for derivation of the proposed risk criteria).
The contours shown in Figure V.2.1 are discussed in the following sections in terms of the risks to the off-site/public and on-site/worker populations in Sections V.2.2 and V.2.3, respectively. The potential societal risks are discussed in Section V.2.4. Note that Figure V.2.1 represents a conservative initial assessment and adjustment of the results to account for over-conservatism in the pool fire modelling is discussed in Section V.2.2.

December 2008 High-level QRA for ERC Refinery at Mostorod, Egypt – RESULTS Egyptian Refining Company
Page V.2DNV ENERGY
32345260 r2
Figure V.2.1 – Individual Risk Contours (Initial Ba se Case)
Note: The above contours are based on the most significant hazard scenarios only and hence are focussed on the
off-site effects. The localised, on-site, risks will be under-predicted in this study, but would be covered by risk analysis of the detailed design stages.
V.2.2 Risks to the Public (Off-site)
The initial, ‘base case’, results are shown in the previous section, Figure V.2.1, where it can be seen that the risks potentially affecting the residential areas are: • Broadly acceptable to the South East, based on the risk contours of 10-6 per year only just
reach the edge of the nearest residential area. Note, however, that the lower frequency contours do extend into the residential area, indicating that the societal risks may be significant and that there is limited safety margin with respect to the individual risks (i.e. the 10-6 per year contours).
• Broadly acceptable to the West, where the risk contours of 10-6 per year, or less, only just reach the canal and hence do not reach any residential areas.

December 2008 High-level QRA for ERC Refinery at Mostorod, Egypt – RESULTS Egyptian Refining Company
Page V.3DNV ENERGY
32345260 r2
It should be noted, however, that a key contributors to the ‘base case’ results shown in Figure V.2.1 include a contribution to the risks to the residential areas due to the largest pool fires modelled for the NHT / CCR unit. These pool fire risks are relatively theoretical for the larger cases, being based on unrestricted pool spread: • The approach adopted with respect to pool fires is consistent with best practice for this kind
of study, i.e. being conservative – as a preliminary assessment of risks to the public should be. Nevertheless, in practice, it is highly unlikely that any pools will spread to the theoretical size and there is potential for appropriate drainage to ensure that any liquid spills remain within the unit itself. Hence, the predicted ‘unrestricted pool spread’ contours are considered to be overly conservative with respect to off-site risks, particularly at the distances relevant to the residential areas.
• It is, therefore, assumed that the pool fire risks can be mitigated against, with respect to the off-site populations, in which case the NHT / CCR pool fire contribution is reduced and the ‘revised base case’ individual risk contributors are shown in Figure V.2.2.
In this case it can be seen that the conclusions with respect to the residential populations are more clear: • The risk contours of 10-6 per year do not reach any of the residential populations, indicating
that the risks are likely to be broadly acceptable. • The lower frequency contours (of 10-7 and 10-8 per year) do just reach the residential area to
the South East of the facility. These are very low risks, within accepted criteria, but emphasise that some residual risk will apply and, hence, that attention should be focussed on ensuring that the risks to the public are minimised as the design of the facility develops.
Note that the above discussion is focussed on the residential areas that can be seen from the google maps provided. If the proposed layout is carried forward it should be confirmed that: • The open land between the residential areas and the refinery is only used for farming (or for
any purposes that only include transient populations). • No future land-use is anticipated close to the refinery that might increase the exposed
population, particularly within the contours shown in Figure V.2.1 / Figure V.2.2. • The limits of the residential areas should be clearly defined, accounting for any potential for
future land-use development / expansion of the populated areas. Consideration should be given to the potential to prevent any development from occurring close to the refinery.
Note that the different hazard types contributing to the risks are discussed further in Section V.3.0. Note also that these risks / hazard ranges are slightly less onerous than predicted by the benchmark results given in Appendix IV, i.e. using very coarse assessment of previous risk studies per unit. This would be expected simply due to the analysis presented here enabling the specific risks to be assessed in some more detail (although still relatively coarse). However, the key element, given that the nearest populations are West and East of the facility is that the

December 2008 High-level QRA for ERC Refinery at Mostorod, Egypt – RESULTS Egyptian Refining Company
Page V.4DNV ENERGY
32345260 r2
prevailing wind is from the North. Although this is understood to be a reasonably robust assumption, it would be prudent to obtain more detailed wind rose data for the site if possible. Figure V.2.2 – Individual Risk Contours (Revised Ba se Case - Pool Fires Adjusted)
Note: The above contours are based on the most significant hazard scenarios only and hence are focussed on the
off-site effects. The localised, on-site, risks will be under-predicted in this study, but would be covered by risk analysis of the detailed design stages.

December 2008 High-level QRA for ERC Refinery at Mostorod, Egypt – RESULTS Egyptian Refining Company
Page V.5DNV ENERGY
32345260 r2
V.2.3 Risks to Workers (On-site)
The following discussion is based on the overall individual risk contours shown in Figure V.2.2. It should be emphasised that the on-site risk results are relatively coarse and that below 10-4 per year the contours will be under-predicted (i.e. they will be much greater in practice, when all hazards are modelled). However, the 10-4 and 10-5 per year contours are broadly representative and emphasise that: • The 10-5 per year contours extend up to 150 m off-site to the East and South of the facility
battery limits. It should be confirmed that there are no significant 3rd party (i.e. public) populations in the off-site areas covered by these 10-5 per year contours.
• The 10-4 and 10-5 per year contours have potential to affect the adjacent industrial populations, including the existing CORC refinery. These risks are potentially significant2 but should be considered in the context of the overall risks that will apply to workers in these areas. These risks may be considered to be manageable when accounting for the time spent in different areas and the potential mitigation afforded by existing buildings, etc. However, it is important that:
- Consideration is given to the number and location of the potentially affected industrial
populations in order to determine the likely acceptability. - The risks experienced by each must consider the cumulative effects of all potential
hazards (including those from the existing refinery, for example). - In any case, the risks are clearly of sufficient magnitude that the emergency response
procedures for these facilities should be common. That is, alarms in the new refinery should be acted upon in an appropriate manner by workers in adjacent facilities, such that there are common procedures, training, etc. If practical the emergency response / plan should be developed for the site / complex as a whole, based on understanding of the risks to and from each of the different plants / units / facilities.
V.2.4 Societal Risk
As discussed in Appendix I, it is important that risk acceptability considerations account for both individual and societal risk, as well as the cost of mitigating against the identified risks. However, at this stage of the analysis it should be noted that: • Accounting for the potential to mitigate the pool fire(s), the base case risk results suggest
that the societal risk to the public will be limited, based on the maximum (representative) hazard ranges not quite reaching the residential areas.
• As discussed in Section V.2.2, it is the potentially limited ‘safety margin’ in the above results that is the key aspect with respect to the overall risks and their acceptability. That is, any significant increase in the maximum hazard ranges and individual risks would be likely to lead to the residential areas being within range, with an associated step change in the societal risks. Hence the key conclusion / recommendation is to ensure that the detailed design process includes demonstration that the maximum hazard ranges remain within the predicted levels, or – at least – are mitigated against.
2 Note that a 10-4 per year risk contour corresponds to a maximum individual risk contribution to a worker spending all of their working time at that location of around 2 x 10⁻⁵ per year, outdoors. This risk will be lower if the affected person is indoors or spends a proportion of their time in lower risk areas. This level of risk is broadly acceptable for process workers, although it should be emphasised that this is only the contribution from the expanded refinery and should be added to the risks that they will experience form all other sources.

December 2008 High-level QRA for ERC Refinery at Mostorod, Egypt – RESULTS Egyptian Refining Company
Page V.6DNV ENERGY
32345260 r2
• The risk to onsite workers should not be neglected. The on-site populations are not yet available and should, ideally, also include consideration of the complex as a whole. As a minimum, the risks from the refinery expansion project should include the other potentially affected populations, such as workers within the existing refinery areas and the neighbouring industrial facilities.
V.3.0 Hazard Frequency Contours
As for the individual risk results presented in Section V.2.1, it should be emphasised that the following plots are based on a limited number of the more significant failure case scenarios. Hence, they are intended to be representative for the off-site impacts but will tend to under-predict the on-site effects. It should also be emphasised that the contours in the following sections give the frequency of different hazards occurring. The corresponding risks will be a combination of the hazard frequency and the vulnerability of people to that hazard, and hence these hazard frequency contours are not directly representative of risk contours. Note that toxic hazards have not been modelled, based on the discussion given in Appendix IV (Section IV.4.3). The toxic hazard frequency contours will tend to have a similar pattern to the flash fire contours but with generally slightly shorter ranges.
V.3.1 Explosion Hazards
Figure V.3.1 shows the frequency of exceeding 0.3 barg predicted for the “Case 10” layout. This overpressure level is of interest as it is often taken as the threshold of (significant) plant / building damage and escalation potential. It should, again, be emphasised that these results are very coarse and non-conservative with respect to on-site hazards. From experience (see also Appendix IV) it can be assumed that each of the on-site contours can be increased by an order of magnitude to provide an indicative set of results for the on-site explosion frequency. That is, the peak 0.3 barg frequency contours, in this case, would be 10-4 per year rather than 10-5 per year. Hence it can be interpreted from Figure V.3.1 that: • 0.3 barg contours will not extend any significant distance off-site.
• Most of the 0.3 barg effects will be restricted to the respective unit, but where the 10-5 per year (10-6 per year in Figure V.3.1) contours will cover most of the ‘additional facilities’ area and the 10-6 per year (10-7 per year in Figure V.3.1) contours will extend into the existing facility.
• As discussed in Appendix I, 10-4 per year is the proposed criterion for escalation potential / asset damage.
• 10-4 per year peak contours would be expected to occur within the HCU, noting that this has a reasonable degree of separation from adjacent units, but may be relevant to any piperacks that pass the HCU.
• The proximity of the DHT / DEU, NHT / CCR and DCU units leads to the potential for overlap of the 10-4 per year 0.3 barg contours. This can only be quantified by more detailed analysis,

December 2008 High-level QRA for ERC Refinery at Mostorod, Egypt – RESULTS Egyptian Refining Company
Page V.7DNV ENERGY
32345260 r2
but consideration should be given to the available space and the potential for greater separation between all of the key units. (Given that the space is limited, the congested volumes are likely to be significant and it is unlikely that the initial analysis is overly conservative.)
• Similar considerations apply with respect to any main pipeway or piperack in the above areas.
These results are highly indicative with respect to the on-site hazards and risks, but a reasonably robust recommendation can be made that no buildings are located within the 10-4 per year 0.3 barg contours (10-5 per year in Figure V.3.1). Note that the above is not a direct safety / risk aspect (although there are obviously safety / risk implications), but is more relevant to risk to assets and loss of production considerations. The 0.1 barg overpressure contours are shown in Figure V.3.2, which show that the maximum extent of these contours does not extend significant distances off-site, but where the 10-4 per year contours (10-5 per year in Figure V.3.1) will cover the HCU and the main process units to the East of the facility (i.e. the DHT / DEU, NHT / CCR and DCU units). Hence, as a general guide, any building located in these areas should have blast protection of at least 0.1 barg. The explosion loads in other parts of the facility will not be negligible, but can be seen to be proportionally lower. Figure V.3.3 and Figure V.3.4, respectively, show that the extent of the 0.07 barg and 0.03 barg contours is significant. Note that these are broadly consistent with the discussion given in Appendix IV (with respect to the benchmark results) and show that: • The predicted 0.07 barg contours can be taken as broadly indicative of the threshold against
which unprotected buildings (e.g. houses) should be located. These contours do not reach the nearest residential areas to the South East of the facility.
• Lower overpressure levels, such as the 0.03 barg contours, will reach the residential areas to the South East – and the neighbouring facility to the South - with a frequency of greater than 10-5 per year. This level of overpressure is generally taken as the threshold for window breakage and corresponds to the potential for light building damage. Fatalities would not normally be expected at this level of overpressure (although there is always some potential where breaking glass is involved) and hence it is not considered to be practical to locate buildings outside these contours.

December 2008 High-level QRA for ERC Refinery at Mostorod, Egypt – RESULTS Egyptian Refining Company
Page V.8DNV ENERGY
32345260 r2
Figure V.3.1 – 0.3 barg Overpressure Frequency Cont ours (On-site Plot)
Note: The above contours are based on the most significant hazard scenarios only and hence are focussed on the
off-site effects. The localised, on-site, risks will be under-predicted in this study, but would be covered by risk analysis of the detailed design stages. Very broadly speaking, the above contours should be increased by an order of magnitude to interpret the anticipated on-site hazard frequency results.

December 2008 High-level QRA for ERC Refinery at Mostorod, Egypt – RESULTS Egyptian Refining Company
Page V.9DNV ENERGY
32345260 r2
Figure V.3.2 – 0.1 barg Overpressure Frequency Cont ours (On-site Plot)
Note: The above contours are based on the most significant hazard scenarios only and hence are focussed on the
off-site effects. The localised, on-site, risks will be under-predicted in this study, but would be covered by risk analysis of the detailed design stages. Very broadly speaking, the above contours should be increased by an order of magnitude to interpret the anticipated on-site hazard frequency results.

December 2008 High-level QRA for ERC Refinery at Mostorod, Egypt – RESULTS Egyptian Refining Company
Page V.10DNV ENERGY
32345260 r2
Figure V.3.3 – 0.07 barg Overpressure Frequency Con tours
Note: The above contours are based on the most significant hazard scenarios only and hence are focussed on the
off-site effects. The localised, on-site, risks will be under-predicted in this study, but would be covered by risk analysis of the detailed design stages.
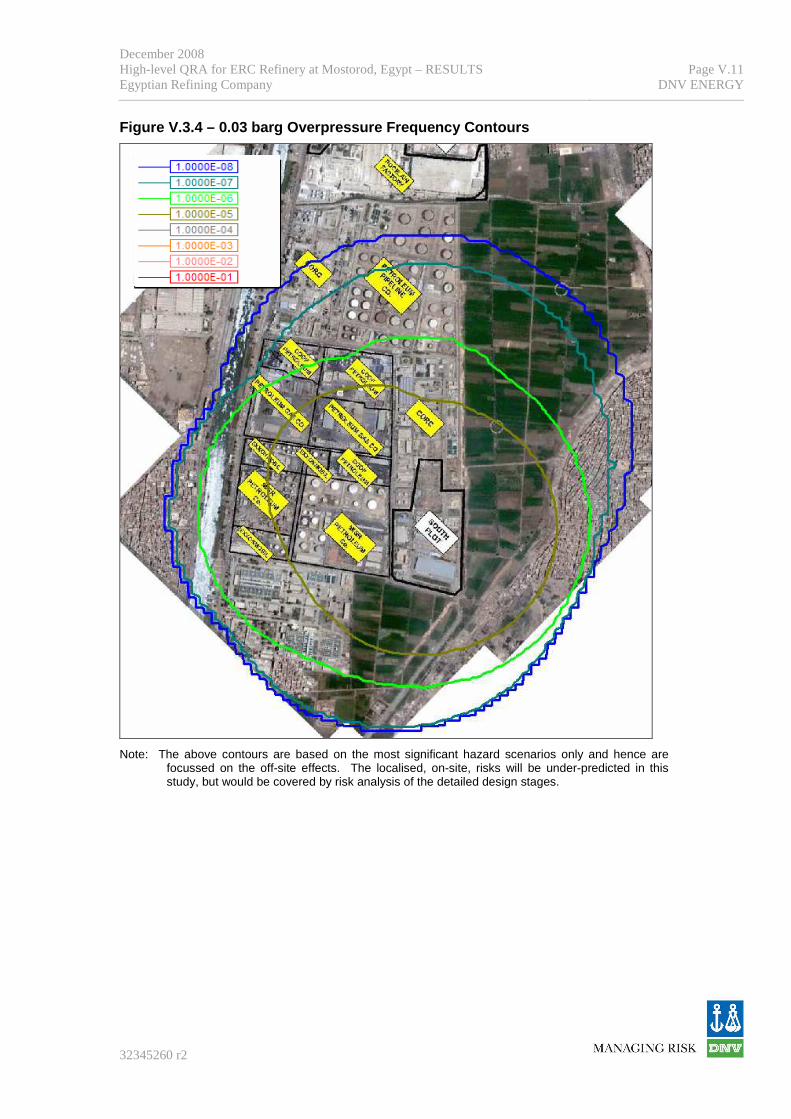
December 2008 High-level QRA for ERC Refinery at Mostorod, Egypt – RESULTS Egyptian Refining Company
Page V.11DNV ENERGY
32345260 r2
Figure V.3.4 – 0.03 barg Overpressure Frequency Con tours
Note: The above contours are based on the most significant hazard scenarios only and hence are
focussed on the off-site effects. The localised, on-site, risks will be under-predicted in this study, but would be covered by risk analysis of the detailed design stages.

December 2008 High-level QRA for ERC Refinery at Mostorod, Egypt – RESULTS Egyptian Refining Company
Page V.12DNV ENERGY
32345260 r2
V.3.2 Fire Hazards
Figure V.3.5 to Figure V.3.10 illustrate the fire hazard frequency contours that are predicted for the base case: • Figure V.3.5 shows the frequency contours for exposure to flash fire hazards (based on the
distance to the Lower Flammable Limit, LFL). • Figure V.3.6 shows the predicted fireball exposure frequency contours (based on radiation
levels of 12.5 kW/m2). • Figure V.3.7 and Figure V.3.8 show the predicted jet fire exposure frequency contours (based
on radiation levels of 37.5 and 12.5 kW/m2, respectively). • Figure V.3.9 and Figure V.3.10 show the predicted pool fire exposure frequency contours
(based on radiation levels of 37.5 and 12.5 kW/m2, respectively). The hazards that potentially reach the populations to the South East are the flash fires (Figure V.3.5) and the lower of the pool fire radiation impacts (Figure V.3.10), noting that the frequency is very low in both cases. However, as discussed in Section V.2.2, the pool fire contours in Figure V.3.10 correspond to the conservative ‘initial base case’ results, assuming unrestricted pool spread. These are considered to be overly conservative for off-site hazards and are adjusted, as shown in Figure V.3.11, to allow for the pool fire to be restricted to the extent of the relevant unit. In this case there will be potential for radiation effects to extend beyond the facility limits, but not to result in credible hazards to the residential populations. (Note that the adjusted pool fire contours in Figure V.3.11 only include reductions to the extent of the NHT / CCR pools.) On the above basis it is only the flash fire hazards that are predicted to affect the residential populations. Nevertheless, the very worst-case effects from jet fires, pool fires and toxic hazards may potentially reach the nearest residential populations, albeit with a very low frequency, and hence should be included in the emergency response plans. Given that flash fires are the key influence on the potential risks to the public (or at least to the key off-site populations), it should be noted that: • It is not credible to expect off-site populations to control ignition sources or to be able to
escape / shelter in the event of a major release. Hence the emphasis on risk reduction should be on preventive measures, i.e. to minimise the potential for leaks to occur. This would chiefly be achieved through appropriate design (to recognised standards) and through effective inspection, testing and maintenance plans / procedures.
• Rapid isolation of significant leaks will not eliminate the risks but will help to minimise the hazards and, particularly, the ignition probability (by limiting the total mass of flammable vapour released). For isolation to be effective, first requires detection to occur and hence best practise fire and gas detection systems, with associated shutdown systems and procedures, will be important mitigation measures.
• Note that some of the more significant vapour cloud hazard ranges will occur from vaporisation of pools, leading to dense vapour clouds. There is some potential to mitigate against vaporisation through the application of foam. However, the success of such techniques is dependent on the judgment of personnel regarding when to apply and the benefits are difficult to quantify. Hence this kind of measure may be part of the demonstration that all practical measures to reduce risks are in place, but should not be a measure that is relied on solely.

December 2008 High-level QRA for ERC Refinery at Mostorod, Egypt – RESULTS Egyptian Refining Company
Page V.13DNV ENERGY
32345260 r2
Although there are various measures that can protect workers from toxic effects (PPE, toxic refuges, etc), the above are also applicable with respect to the toxic hazards that would accompany some of the major release scenarios. That is, escape of ‘the public’ cannot be relied upon and hence the emphasis should be on prevention of leaks and on rapid detection / isolation of any major releases that do occur. Note that the latter will be more effective with respect to toxic effects, which are more dependent on the exposure duration than the corresponding flammable hazards. It should be recognised that it is not necessarily practical for refineries to have automatic shutdown systems and there will inevitably be a tendency for operators to establish the exact nature of a release before isolation occurs. This is reasonably well accepted practice, and it is unusual to rely on isolation occurring in less than 5 minutes for a typical refinery QRA study. However, two alternative approaches, or philosophies, that should be considered in this respect are to: • Specify automatic shutdown on confirmed gas detection (or appropriate process alarms) for
identified key inventories. This is not typically done, but may be considered either for inventories over a certain size of volatile liquid, or for certain sections of the plant that are identified as “higher risk” by detailed risk analysis.
• Ensure that the systems, procedures and training are in place to enable operators to rapidly determine the scale of any release that occurs, with particular regard to the potential for off-site effects. This may include CCTV, best-practice control systems, wind direction information, etc, where the key aspect will be to ensure that isolation can be rapidly activated when significant off-site risk potential is likely (noting that releases of this magnitude will inevitably have significant on-site and asset-risk issues also).
Each of the jet, pool and fireball hazards shown in Figure V.3.6 to Figure V.3.10 have significant consequences and frequencies, but do not represent significant hazards to the residential populations. However, the on-site hazards for these events will be significant and will tend to dominate the risks to workers. They will also have potential impacts to the adjacent industrial facilities. The primary mitigation measures are, again, to prevent leaks from occurring as far as is possible, as well as to minimise the potential for ignition to occur. For pool fires, drainage and active fire protection systems will also mitigate the hazards to some extent. The on-site buildings should be designed against the potential fire loads, where it should be noted that: • The hazard frequency contours represent radiation levels and durations (i.e. all durations)
that are relevant to risks to people; building damage will typically require longer duration events and/or much higher radiation levels.
• In general, buildings that are designed to withstand blast loads will inherently have an appropriate degree of resistance to fire loads. The fire loads should be confirmed during the detailed design stage, but at this stage it can reasonably be assumed that the explosion loads will drive the location and/or design of the on-site buildings.

December 2008 High-level QRA for ERC Refinery at Mostorod, Egypt – RESULTS Egyptian Refining Company
Page V.14DNV ENERGY
32345260 r2
Figure V.3.5 – Flash Fire Exposure Frequency Contou rs
Figure V.3.6 – Fireball 12.5 kW/m 2 Radiation Exposure Frequency Contours
Note: The contours in both of the above figures are based on the most significant hazard scenarios only and hence
are focussed on the off-site effects. The localised, on-site, risks will be under-predicted in this study, but would be covered by risk analysis of the detailed design stages.

December 2008 High-level QRA for ERC Refinery at Mostorod, Egypt – RESULTS Egyptian Refining Company
Page V.15DNV ENERGY
32345260 r2
Figure V.3.7 – Jet Fire 37.5 kW/m 2 Radiation Exposure Frequency Contours
Figure V.3.8 – Jet Fire 12.5 kW/m 2 Radiation Exposure Frequency Contours
Note: The contours in both of the above figures are based on the most significant hazard scenarios only and hence
are focussed on the off-site effects. The localised, on-site, risks will be under-predicted in this study, but would be covered by risk analysis of the detailed design stages.

December 2008 High-level QRA for ERC Refinery at Mostorod, Egypt – RESULTS Egyptian Refining Company
Page V.16DNV ENERGY
32345260 r2
Figure V.3.9 – Pool Fire 37.5 kW/m 2 Radiation Exposure Frequency Contours
Figure V.3.10 – Pool Fire 12.5 kW/m 2 Radiation Exposure Frequency Contours
Note: The contours in both of the above figures are based on the most significant hazard scenarios only and hence
are focussed on the off-site effects. The localised, on-site, risks will be under-predicted in this study, but would be covered by risk analysis of the detailed design stages.
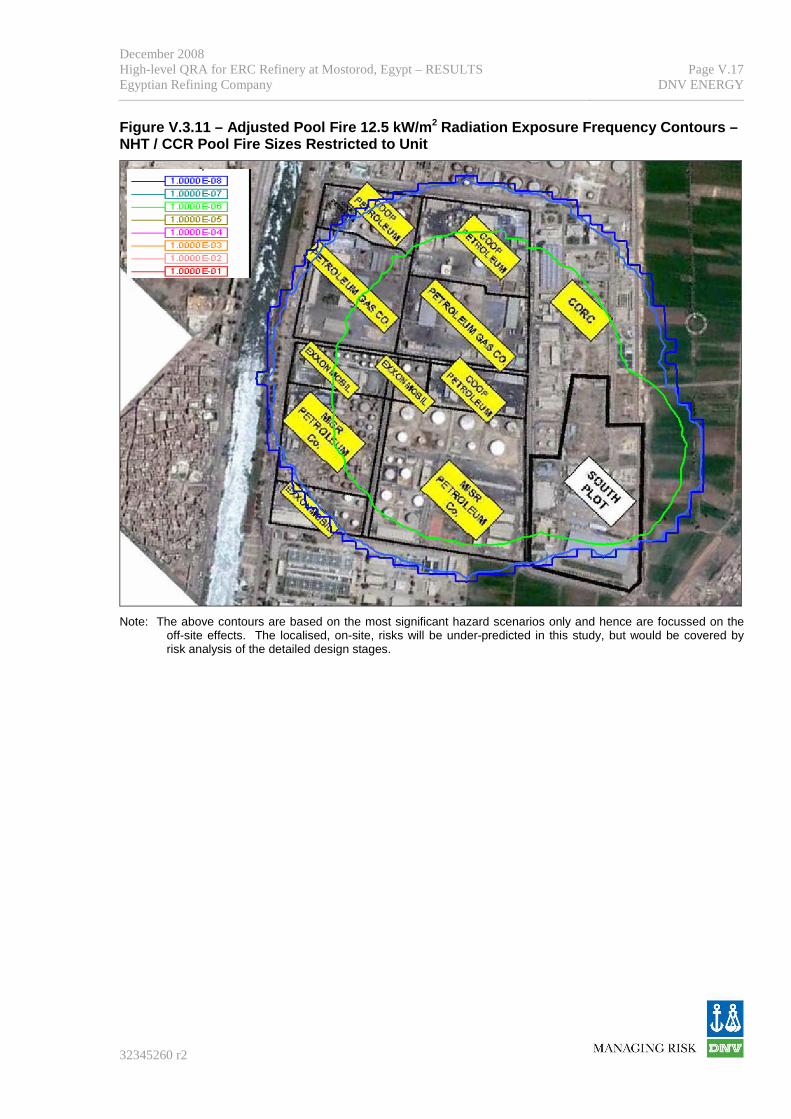
December 2008 High-level QRA for ERC Refinery at Mostorod, Egypt – RESULTS Egyptian Refining Company
Page V.17DNV ENERGY
32345260 r2
Figure V.3.11 – Adjusted Pool Fire 12.5 kW/m 2 Radiation Exposure Frequency Contours – NHT / CCR Pool Fire Sizes Restricted to Unit
Note: The above contours are based on the most significant hazard scenarios only and hence are focussed on the
off-site effects. The localised, on-site, risks will be under-predicted in this study, but would be covered by risk analysis of the detailed design stages.