environmental and social impact assessment report (esia) … · ino: eastern indonesia renewable...
TRANSCRIPT

Environmental and Social Impact Assessment Report (ESIA) — Appendices 16 and 17
Project No.: 51209-001 November 2017
INO: Eastern Indonesia Renewable Energy Project
Prepared by ESC for PT Energi Bayu Jeneponto (EBK) (Republic of Indonesia)
The environmental and social impact assessment is a document of the project sponsor. The views
expressed herein do not necessarily represent those of ADB’s Board of Directors, Management,
or staff, and may be preliminary in nature. Your attention is directed to the “Terms of Use” section
of this website.
In preparing any country program or strategy, financing any project, or by making any designation
of or reference to a particular territory or geographic area in this document, the Asian
Development Bank does not intend to make any judgments as to the legal or other status of or
any territory or area.

Appendix 16
UKL-UPL (Mini EIA) for 150
kV Transmission Line

Environmental Management Efforts (UKL)-
Environmental Monitoring Efforts (UPL)
Development of 150 kV Transmission Line
for Wind Farm Power Plant (PLTB) Tolo, Jeneponto
PT Energi Bayu Jeneponto
March 2017

Development of 150 kV Transmission Line for Wind Power Plant (PLTB) Tolo, Jeneponto i
Foreword
PT. Energi Bayu Jeneponto (PT EBJ) plans to develop the 150 kV transmission line as supporting
facility of PLTB with the capacity of 76 MW in Jeneponto Regency, South Sulawesi. The 150 kV
transmission line will be built along 3.4 km. PT EBJ will manage the development of this
transmission line in the stage of preconstruction and construction. Meanwhile during the
operation stage, all of the management will be managed by PT PLN (Persero).
Based on the Regulation of Environmental Minister No. 5 Year 2012 about Type of Business /
Development Plan required to possess Analysis of Environmental Impact (AMDAL), it is
concluded that the development of 150 kV transmission line is not required to possess the study
of AMDAL because it is a business and/ activity that does not have significant impact in
environment. This activity further is obliged to compose UKL-UPL study (Environmental
Management Efforts and Environmental Monitoring Efforts).
Based on the Regulation of Minister of Environment No. 8 Year 2013 about Assessment
Procedures and Environmental Document Examination and the Issuance of Environmental
License, this form of UKL-UPL is the authorization of Jeneponto Regency in respect to the
project location which is located in Binamu District and Arungkeke District, where both locations
are in administrative region of Jeneponto Regency.
This document of UKL-UPL is composed by referring to the Regulation of Minister of
Environment No. 16 Year 2012 about Guidelines of Composing Environmental Document,
Appendix 4 about Guidelines of Filling UKL-UPL Form.
In this chance, we would like to thank all parties who involved in composing and completing this
document.
Jeneponto, Februari 27th, 2017
PT Energi Bayu Jeneponto
Signed & Stamped
President Director

PT Energi Bayu Jeneponto
Development of 150 kV Transmission Line for Wind Power Plant (PLTB) Tolo, Jeneponto ii
LIST OF CONTENTS
FOREWORD ........................................................................................................................... I
LIST OF CONTENTS ................................................................................................................ II
LIST OF TABLES..................................................................................................................... IV
LIST OF FIGURES .................................................................................................................. VII
LIST OF MAPS ..................................................................................................................... VIII
LIST OF APPENDIX ................................................................................................................ IX
1 IDENTITY OF INITIATOR .............................................................................................. 1-1
1.1 Identity of Initiator .................................................................................................. 1-1
1.2 Composer Identity in the Study of UKL-UPL .............................................................. 1-1
1.3 Background.............................................................................................................. 1-2
1.4 Objective and Benefit of Development Activity of 150 kV Transmission Line .............. 1-3
1.5 Purpose, Objective and Use of UKL-UPL .................................................................... 1-3
1.5.1 Purpose of Composing UKL-UPL Document ..................................................... 1-3
1.5.2 Objective od Composing UKL-UKL Document .................................................. 1-3
1.5.3 Use of Composing UKL-UPL Document ............................................................ 1-3
2 DESCRIPTION OF DEVELOPMENT PLAN ....................................................................... 2-1
2.1 Name of Development Plant .................................................................................... 2-1
2.2 Location of Activity .................................................................................................. 2-1
2.3 Scale / Magnitude of Business Plan and / or Activity ................................................. 2-4
2.3.1 Land Needed for Business Plan and/ or Activity ............................................... 2-4
2.3.2 Determination of Pathway ............................................................................... 2-7
2.3.3 Design of Main Equipment GI 150 kV ............................................................... 2-8
2.3.4 Conductor ......................................................................................................... 2-8
2.3.5 Selection of Transmission Line and Equipment ................................................ 2-9
2.3.6 Tower .............................................................................................................. 2-10
2.3.7 Insulator .......................................................................................................... 2-11
2.3.8 Foundation ...................................................................................................... 2-17
2.3.9 Route of Transmission Line ............................................................................. 2-18
2.3.10 Schedule of Activity Implementation ............................................................. 2-18
2.3.11 Use of Clean Water ......................................................................................... 2-19
2.3.12 Management of Liquid Waste ........................................................................ 2-20
2.3.13 Management of Solid Waste .......................................................................... 2-20
2.4 Outline of Business/ Development Components ..................................................... 2-21
2.4.1 Suitability of Development area with Spatial ................................................. 2-21
2.4.2 Principle Agreement on Development Plant .................................................. 2-26
2.4.3 Description of Development Plan Impacting Environmental Issue ................ 2-26

PT Energi Bayu Jeneponto
Development of 150 kV Transmission Line for Wind Power Plant (PLTB) Tolo, Jeneponto iii
3 DESCRIPTION OF ENVIRONMENTAL COMPONENTS ..................................................... 3-1
3.1 Chemistry-Physical Components ............................................................................... 3-1
3.1.1 Climate .............................................................................................................. 3-1
3.1.2 Quality of Air and Noise .................................................................................... 3-5
3.1.3 Electromagnetic Field ....................................................................................... 3-9
3.1.4 Water Quality ................................................................................................. 3-11
3.1.5 Ground Condition ........................................................................................... 3-17
3.2 Biology Components .............................................................................................. 3-18
3.2.1 Land Vegetation .............................................................................................. 3-20
3.2.2 Land Fauna ...................................................................................................... 3-22
3.3 Component of Socio-Economic-Culture ................................................................... 3-24
3.3.1 Condition of Socio-Economic .......................................................................... 3-26
4 IMPACT ARISING AND ENVIRONMENTAL MANAGEMENT EFFORTS AND
ENVIRONMENTAL MONITORING EFFORTS .................................................................. 4-1
5 LICENSE FOR PROTECTION AND ENVIRONMENTAL MANAGEMENT ............................. 5-1
6 STATEMENT LETTER ................................................................................................... 6-1
7 REFERENCE ................................................................................................................ 7-1

PT Energi Bayu Jeneponto
Development of 150 kV Transmission Line for Wind Power Plant (PLTB) Tolo, Jeneponto iv
LIST OF TABLES
Ta le - Co posito of Co posi g Tea i the Stud of UKL-UPL a d E pe tise ............... -
Ta le - Ad i ist ati e A ea Passed the De elop e t A ti it of kV T a s issio Li e ........................................................................................................................... -
Ta le - Need fo La d a d Spa e ......................................................................................... -
Ta le - Spe ifi atio of T a s issio Li e kV Desig fo PLTB Tolo .............................. -
Ta le - Su ou di g Cli ate Co ditio ............................................................................... -
Ta le - Co ditio of To e Desig o To e ...................................................................... -
Ta le - T pe of To e ......................................................................................................... -
Ta le - Data of I sulato .................................................................................................... -
Ta le - Clea i g I sulatio ................................................................................................ -
Ta le - Cha a te isti s of Sta da d Me ha i al of Cla p ................................................. -
Ta le - Data of Co du to .................................................................................................. -
Ta le - Data of G ou d Ca le ............................................................................................ -
Ta le - Detail of I fo atio of T a s issio To e ......................................................... -
Ta le - S hedule of kV T a s issio Li e Co st u tio ............................................. -
Ta le - Esti ated Use of Clea Wate ............................................................................... -
Ta le - Esti ated Li uid Waste ......................................................................................... -
Ta le - Esti ated Do esti Solid Waste ........................................................................... -
Ta le - Co positio of Co st u tio Wo ke s................................................................... -
Ta le - Co st u tio E uip e t of the de elop e t kV T a s issio Li e fo PLTB Tolo, Je epo to ...................................................................................................... -
Ta le - Re ui e e t i Ope atio Stage ........................................................................... -
Ta le - Mo thl Su light - i % ......................................................................... -
Ta le - Sa pli g Lo atio of Ai Qualit a d Noise ............................................................ -
Ta le - Results of Ai Qualit Test ........................................................................................ -
Ta le - Results of Noise Test ................................................................................................ -
Ta le - Ele t o ag eti Field O se atio Results ........................................................... -
Ta le - Wate Qualit Testi g Results ................................................................................ -
Ta le - Results of Su fa e Wate Qualit Testi g ............................................................... -
Ta le - Results of G ou d Qualit Testi g .......................................................................... -
Ta le - List of T pes of La d Vegetatio ............................................................................ -
Ta le - List of T pes of La d Fau a at the Stud A ea ....................................................... -
Ta le - Populatio a d Household a d Regio Spa ious i dist i t a d Village i Stud A ea -
Ta le - Total Populatio Age G oup i Stud A ea ........................................................ -
Ta le - A e age Age of Respo de ts at the Stud A ea .................................................... -

PT Energi Bayu Jeneponto
Development of 150 kV Transmission Line for Wind Power Plant (PLTB) Tolo, Jeneponto v
Ta le - Total of S hools, Class, Stude ts, Tea he s i Ju io High S hool at the Stud A ea A ade i Yea - ..................................................................................... -
Ta le - Total of S hools, Class, Stude ts, a d Tea he s i Se io High S hool at the Stud A ea A ade i Yea - ............................................................................. -
Ta le - Total of Stude ts Taki g E a s a d G aduated f o P i a S hool at the Stud A ea A ade i Yea - ............................................................................. -
Ta le - Total of Stude t Taki g E a s a d G aduated f o Ju io High S hool at the Stud A ea A ade i Yea - ............................................................................. -
Ta le - Total of Stude ts Taki g E a s a d G aduated f o Se io High S hool at the Stud A ea A ade i Yea - ............................................................................. -
Ta le - Total of Reide ts Based o Li elihood at the Stud A ea ...................................... -
Ta le - Co positio of Reside ts Based o Li elihood Based o the Results of Su e at the Stud A ea .............................................................................................................. -
Ta le - Total of Reside ts Seeki g fo Jo s Based o Edu atio a d Se i Je epo to Dist i t, Yea .................................................................................................. -
Ta le - G oss Do esti P odu t GDP At Cu e t Ma ket P i es I dust ial i Je epo to Rege Yea - illio Rupiah ............................................................. -
Ta le - Regio al Ad issio s i Je epo to Rege Yea - ................................ -
Ta le - A e age Esti atio of Respo de ts’ I o e Rate Pe Mo th at the Stud A ea . -
Ta le - La d A ea a d Utilizatio i Bi a u Dist i t a d A u gkeke Dist i t, Je epo to Rege .................................................................................................................. -
Ta le - Pe eptio of Co u it A out T aditio al A ti it a d E e ts at the De elop e t A ea De elop e t of kV T a s issio Li e, Je epo to ................................. -
Ta le - So iet K o ledge Respo de t a ou d de elop e t a ea a d I fo atio sou e to a ds the De elop e t of kV T a s issio Li e Fo PLTB Tolo , Je epo to ..... -
Ta le - Attitudes a d Pu li Pe eptio Respo de ts A ou d the de elop e t a ea of KV T a s issio Li e, Je epo to Rege ..................................................... -
Ta le - Respo de ts opi io o the e iste e of Cultu al Site, A haeologi al Sites a d Sa ed Pla es i the a ea of kV T a s issio Li e to PLTB Tolo , Je epo to . -
Ta le - Data of te ajo diseases i Bi a u Dist i t Puskes as Je epo to Rege ....................................................................................................................... -
Ta le - Co o Diseases Suffe ed Reside ts i the Last Mo ths i the de elop e t a ea of kV T a s issio Li e to PLTB Tolo, Je epo to ................................... -
Ta le - Respo de ts Beha io Agai st Disease Patte s i the Last Mo ths at the Pla Stud A ea of kV T a s issio Li e De elop e t A ti ities to PLTB Tolo, Je epo to .............................................................................................................. -
Ta le - Total of health hu a esou es i health e te s i Je epo to Rege ........... -
Ta le - Clea Wate Sou e of Household Respo de ts i the De elop e t A ea of kV T a s issio Li e fo PLTB Tolo, Je epo to .......................................................... -
Ta le - Respo de ts Household Waste Ma age e t i the Pla ed A ea of kV T a s issio Li e De elop e t fo PLTB Tolo, Je epo to .................................... -

PT Energi Bayu Jeneponto
Development of 150 kV Transmission Line for Wind Power Plant (PLTB) Tolo, Jeneponto vi
Ta le - Total of Health Fa ilit i Je epo to Rege Yea ....................................... -
Ta le - Mat i of E i o e tal Mo ito i g Effo t a d E i o e tal Mo ito i g Effo t . -

PT Energi Bayu Jeneponto
Development of 150 kV Transmission Line for Wind Power Plant (PLTB) Tolo, Jeneponto vii
LIST OF FIGURES
Figu e - Re o al of Dead E d To e E isti g Ci uit ith Ci uit Dead E d To e ....... -
Figu e - T pe of Suspe sio I sulato a d Te sio ............................................................. -
Figu e - Des iptio of Ope atio P o ess .......................................................................... -
Figu e - Mo thl A e age Rai fall at the Lo atio of Je epo to Rege ........................... -
Figu e - Va iatio of Mo thl A e age Wi d Te pe atu e at the Lo atio of Je epo to Rege .................................................................................................................... -
Figu e - Va iatio s of Mo thl A e age Relati e Moistu e at the Lo atio of Je epo to Rege .................................................................................................................... -
Figu e - P ofile of Mo thl A e age Wi d Rose at the Lo atio of Je epo to Rege ...... -
Figu e - P ofile of Yea l A e age Wi d Rose at the Lo atio of Je epo to Rege .......... -
Figu e - Lo atio of p oje t footp i t.................................................................................. -

PT Energi Bayu Jeneponto
Development of 150 kV Transmission Line for Wind Power Plant (PLTB) Tolo, Jeneponto viii
LIST OF MAPS
Map - Lo atio of A ti it ...................................................... E o ! Book a k ot defi ed.
Map - Satellite I age of P oje t Site ................................... E o ! Book a k ot defi ed.
Map - La out Pla of the De elop e t of kV T a s issio Li e ................................ -
Map - Buildi g o e la of kV T a s issio Li e ith Pla i g La d Use ................... -
Map - O e la of A ti it Lo atio ith Regio al Spatial pla Je epo to Rege ........ -
Map - O e la of A ti it Lo atio ith Spa e St u tu e Je epo to Rege ................ -
Map - O e la of A ti it Lo atio ith St ategi A ea Je epo to Rege ................... -
Map - O e la of A ti it Lo atio ith PIPIB .................................................................. -
Map - Sa pli g Lo atio of Ai Qualit a d Noise ............................................................ -
Map - Lo atio of Ele t o ag eti Field Tests ................................................................. -
Map - Lo atio of Clea Wate Sa pli g a d Su fa e Wate .......................................... -
Map - Lo atio of Biolog Co po e ts ........................................................................... -
Map - Lo atio of So io-E o o i Su e fo E i o e t Colo .................................. -
Map - Lo atio of Ma age e t a d Mo ito i g of E i o e t i the Stage of P e-
Co st u tio .......................................................................................................... -
Map - Lo atio of Ma age e t a d Mo ito i g of E i o e t i the Stage of Co st u tio .......................................................................................................... -
Map - Lo atio of Ma age e t a d Mo ito i g of E i o e t i the Stage of Ope atio -
PT Energi Bayu Jeneponto
Development of 150 kV Transmission Line for Wind Power Plant (PLTB) Tolo, Jeneponto 1-1
1 IDENTITY OF INITIATOR
1.1 Identity of Initiator
Name of Company : PT. Energi Bayu Jeneponto
Type of Legal Entity : PT (Perseroan Terbatas)
Address of Company : The Plaza Office Tower 25th Floor
Jl. MH. Thamrin Kav. 28-30
Jakarta 10340 Indonesia
Phone number/
Facsimile : +6221-2992-1540/+6221-2992-1547
Email :
Person in Charge :
Position : President Director
1.2 Composer Identity in the Study of UKL-UPL
Executive Institution : PT. Greencap NAA Indonesia
Registration of Competence : 0014/LPJ/AMDAL-1/LRK/KLH
Address of Office : Intiland Tower, Lantai 18
Jl. Jend. Sudirman Kav. 32, Jakarta 10220
Phone Number : (021) 5790 1344
Facsimile : (021) 5790 1348
Person in Charge : Dr. Karlheinz Spitz
Posision : Director
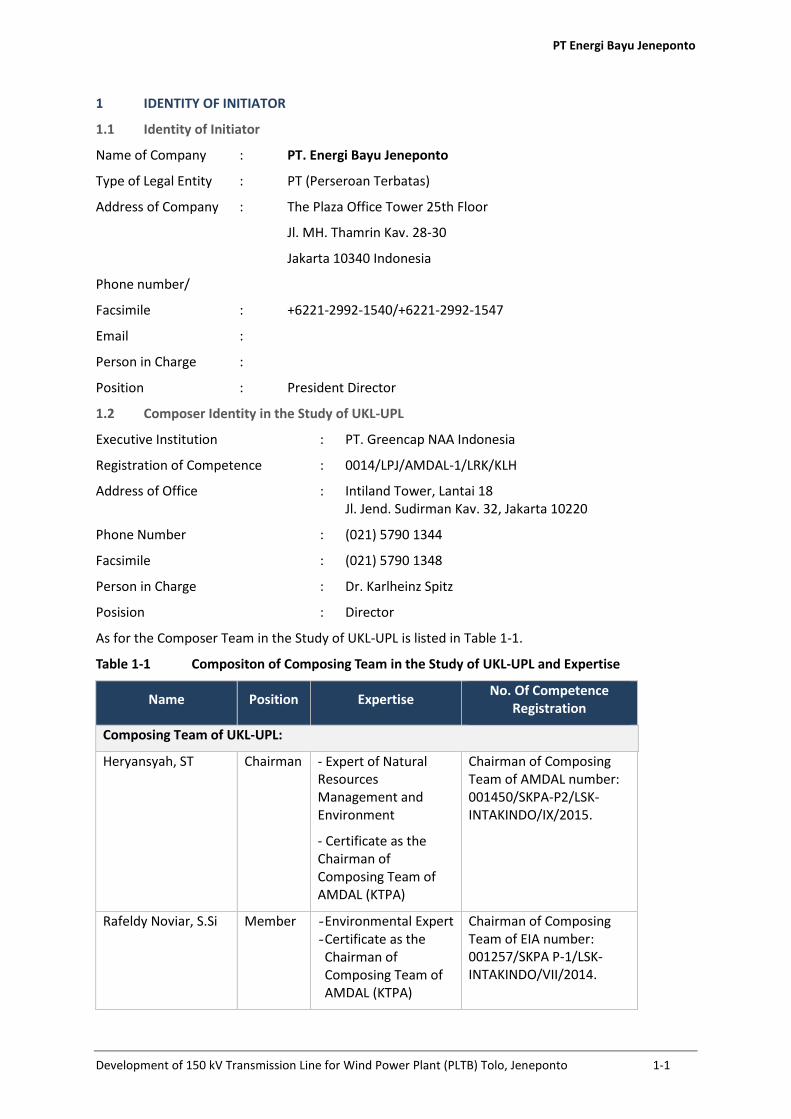
As for the Composer Team in the Study of UKL-UPL is listed in Table 1-1.
Ta le - Co posito of Co posi g Tea i the Stud of UKL-UPL a d E pe tise
Name Position Expertise No. Of Competence
Registration
Composing Team of UKL-UPL:
Heryansyah, ST Chairman - - Expert of Natural
Resources
Management and
Environment
- - Certificate as the
Chairman of
Composing Team of
AMDAL (KTPA)
Chairman of Composing
Team of AMDAL number:
001450/SKPA-P2/LSK-
INTAKINDO/IX/2015.
Rafeldy Noviar, S.Si Member - Environmental Expert
- Certificate as the
Chairman of
Composing Team of
AMDAL (KTPA)
Chairman of Composing
Team of EIA number:
001257/SKPA P-1/LSK-
INTAKINDO/VII/2014.

PT Energi Bayu Jeneponto
Development of 150 kV Transmission Line for Wind Power Plant (PLTB) Tolo, Jeneponto 1-2
Name Position Expertise No. Of Competence
Registration
Anik Farida, ST, M.Sc Member - Physical Chemistry
Expertise
- Certificate as the
Member of
Composing Team
from AMDAL (ATPA)
of BNSP – LSP LHI
Member of Composing
Team of AMDAL number :
71201 2133 4 0000237
2017.
Ir. M. Nuhung Member - Social
- Certificate as the
Member of
Composing Team of
AMDAL (ATPA) of
BNSP – LSP LHI
Member of Composing
Team of EIA number. LHK
564 00234 2016
Ir. Ricky Sulistyo Member - Space, Land, Soil
Expertise
Bakhtiar Santri Aji,
S.Si
Member - Biologist
Gita Lestari, ST Member - Assistant of
Environmental Expert
- Certificate as the
Member of
Composing Team of
AMDAL (ATPA) of
BNSP – LSP LHI
Member of Composing
Team of AMDAL number:
71201 2133 4 0000179
2016.
Dimas Haryo Adi
Prakoso, ST
Member - Assistant of
Environmental Expert
Working Experience (Curriculum Vitae), competency certificate and a copy of the certificate of
training of experts involved can be found in Appendix 8.
1.3 Background
PT. Energi Bayu Jeneponto (PT EBJ) is planning on the construction of Wind Power with a capacity of
76 MW in Jeneponto Regency, South Sulawesi. To support the planning of this electric power, it
requires the development of 150 kV transmission lines to flow the generated energy from pooling
station to the closest substation of PLN. The 150 kV transmission line will be built along 3.4 km. For
the record, PT EBJ will only manage the construction of the transmission line for the pre-
construction and construction. While at the stage of operation, authorities and operation of the
entirety of the transmission line will be managed by PT PLN (Persero).
Based on the Regulation of the Minister of Environment No. 5 Year 2012 regarding the type of
planned business and/or activities that must have Environmental Impact Assessment (AMDAL), the
construction of electricity transmission lines with a capacity of 150 kV IS not required to have the
study of AMDAL for a planned business and/or activities that do not incur significant impact on the
environment. This activity further is required to prepare the study of UKL-UPL (Environmental
Management Effort and Environmental Monitoring Effort) as a prerequisite to obtain Environmental
PT Energi Bayu Jeneponto
Development of 150 kV Transmission Line for Wind Power Plant (PLTB) Tolo, Jeneponto 1-3
Permit, as stated in the Indonesian Government Regulation No. 27 Year 2012 on Environmental
Permit.
Based on the Regulation of the Minister of Environment No. 8 Year 2013 on Procedures of
Assessment and Environmental Document Examination and Issuance of Environmental Permit, UKL-
UPL form is the authorization of Jeneponto Regency, given the location of the project is located in
two districts, namely Binamu District and Arungkeke District, located in the administrative area of
Jeneponto Regency. Systematics of UKL-UPL document preparation refers to the Minister of
Environment No. 16 Year 2012 on Guidelines for the Preparation of Environmental Document,
Appendix 4 of the Guidelines for Completion of UKL-UPL Form.
1.4 Objective and Benefit of Development Activity of 150 kV Transmission Line
The objective development activities of 150 kV transmission line is to flow the energy from PLTB
Tolo with a capacity of 76 MW to the closest substation of PLN. Furthermore, the distribution of
electricity to its use to the consumer will be managed by PLN.
The direct beneficiaries of this activity to the surrounding community is the addition of the electric
energy distribution around the site of PLTB Tolo managed by PLN. Furthermore, there are also
indirect benefits of this activity such as an increase income to the residents by the presence of
recruitment activities, providing opportunities for the surrounding communities and an increase in
infrastructure development.
The development of 150 kV transmission line has a role in both national and regional development,
among others, support the plan of the power interconnection in Sulawesi Island (Electrical Systems
of Sulawesi), supports the fulfillment of electricity demand, both domestic and industry in South
Sulawesi in particular and the island of Sulawesi in general and encourage the implementation of
development activities in various sectors because of the sufficient distribution of electrical energy.
1.5 Purpose, Objective and Use of UKL-UPL
1.5.1 Purpose of Composing UKL-UPL Document
Referring to the Minister of Environment No. 16 Year 2012 regarding Guidelines for the Preparation
of Environmental Document, the purpose of preparation of UKL-UPL is to manage and monitor the
activities and / or businesses that do not have a significant impact on the environment.
1.5.2 Objective od Composing UKL-UKL Document
Referring to the Minister of Environment No. 27 Year 2012 regarding the Environmental Permit, the
purpose of preparation of UKL-UPL is to obtain environmental permits as a prerequisite for obtaining
permits of Business and / or Activity.
1.5.3 Use of Composing UKL-UPL Document
The usefulness of the preparation of UKL-UPL refers to the Minister of Environment No. 16 Year
2012 regarding Guidelines for the Preparation of Environmental Document namely a reference in
the decision-making process regarding business and / or activity.

PT Energi Bayu Jeneponto
Development of 150 kV Transmission Line for Wind Power Plant (PLTB) Tolo, Jeneponto 2-1
2 DESCRIPTION OF DEVELOPMENT PLAN
2.1 Name of Development Plant
Activities to be performed is the development of 150 kV Transmission Line to transfer the generated
energy of Wind Power Plant (PLTB) Tolo to the closest PLN substation (GI). The development of the
transmission line is planned to use 10 towers with the length of transmission lines is approximately
3.4 km, which starts from the PLTB Tolo substation in Binamu District to PLN Jeneponto substation in
Arungkeke District, Jeneponto Regency.
2.2 Location of Activity
The development of 150 kV Transmission Line for PLTB Tolo is located in Jeneponto Regency of
South Sulawesi province, which is planned to possess 10 towers with a length of 3.4 km and will
connect GI PLTB Tolo substation with PLN Jeneponto substation. With the existence of transmission
that connects between the substation, it is expected that the electricity in Jeneponto Regency can
be improved.
Administratively, the location of the activities is included in Binamu District (Empoang Village) and
Arungkeke District (Kalumpang Loe Village) in Jeneponto Regency of South Sulawesi province. The
activity location administratively can be seen in Table 2-1, Error! Reference source not found. and
Error! Reference source not found..
Ta le - Ad i ist ati e A ea Passed the De elop e t A ti it of kV T a s issio Li e
No No. of Tower Village District Total of
Tower
1 T.001 A Empoang Binamu 1
2 T.002 A Empoang Binamu 1
3 T.003 A Kalumpang Loe Arungkeke 1
4 T.004 A Kalumpang Loe Arungkeke 1
5 T.005 A Kalumpang Loe Arungkeke 1
6 T.006 A Kalumpang Loe Arungkeke 1
7 T.007 A Kalumpang Loe Arungkeke 1
8 T.008 A Kalumpang Loe Arungkeke 1
9 T.009 A Kalumpang Loe Arungkeke 1
10 T.0010 A Kalumpang Loe Arungkeke 1
Source: Conceptual Design Tolo#1 Wind Farm Project, PT EBJ, December 2016

PT Energi Bayu Jeneponto
Development of 150 kV Transmission Line for Wind Power Plant (PLTB) Tolo, Jeneponto 2-2

PT Energi Bayu Jeneponto
Development of 150 kV Transmission Line for Wind Power Plant (PLTB) Tolo, Jeneponto 2-3

PT Energi Bayu Jeneponto
Development of 150 kV Transmission Line for Wind Power Plant (PLTB) Tolo, Jeneponto 2-4
2.3 Scale / Magnitude of Business Plan and / or Activity
2.3.1 Land Needed for Business Plan and/ or Activity
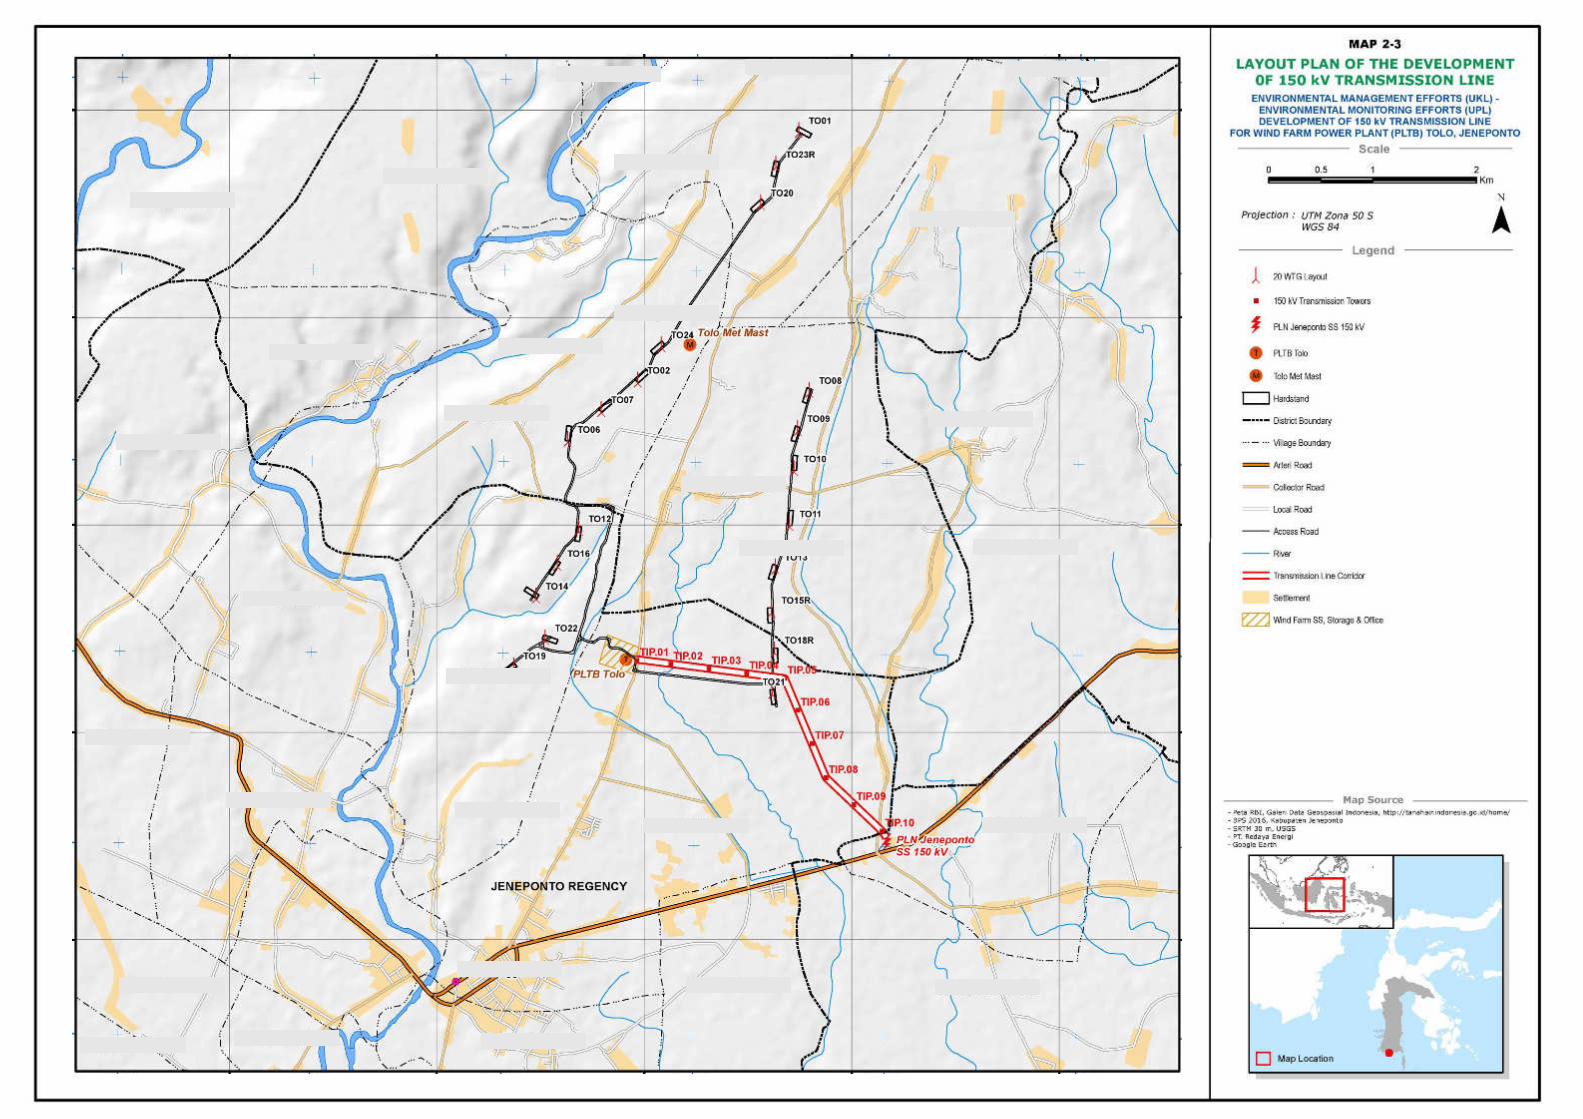
The 150 kV Transmission line to be constructed is of 3.4 km long, consisting of 10 towers. The line
will pass Empoang Village, Binamu District and Kalumpang Loe Village, Arungkeke District (Map 2-
3).
The land needed consists of land for the purpose of tower site and free space below the line (ROW)
with the details shown in Table 2-2.
Ta le - Need fo La d a d Spa e
No Need for Land and
Space Dimension
Total of
Tower
Length
(m2) Note
1 Tower Site* 15 m x 15 m 6 1,350 Exempt
20 m x 20 m 4 1,600 Exempt
Total 10 2,950
2 ROW **
10 m left – 10 m
Right from the
axis of as
Along the
line of
SUTT
80,000
With
compensation/
indemnity
Source:
*) Conceptual Design Tolo#1 Wind Farm Project, PT EBJ, December 2016
**) Indonesian National Standard (SNI) 04-6908-2002
Overall land use at the site of transmission line development activities will pass the rice fields owned
by citizens (Map 2-4). As for the paddy fields exempted is approximately 2,950 m2 which is the tower
site whereas the width of ROW which will be given compensation or indemnity is 15% of the market
value of land from the assessing agency, according to the Regulation of Ministry of Energy and
Mineral Resources No. 38 Year 2013 is about 80,000 m2.
PT Energi Bayu Jeneponto
Development of 150 kV Transmission Line for Wind Power Plant (PLTB) Tolo, Jeneponto 2-5
Map - La out Pla of the De elop e t of kV T a s issio Li e

PT Energi Bayu Jeneponto
Development of 150 kV Transmission Line for Wind Power Plant (PLTB) Tolo, Jeneponto 2-6
Map - Buildi g o e la of kV T a s issio Li e ith Pla i g La d Use

PT Energi Bayu Jeneponto
Development of 150 kV Transmission Line for Wind Power Plant (PLTB) Tolo, Jeneponto 2-7
2.3.2 Determination of Pathway
Referring to the document of Conceptual Design PLTB Tolo, the determination of pathway for
transmission line is done by taking into account five aspects, namely: (1) technical aspects, (2)
aspects of construction, (3) aspects of operation and maintenance, (4) the cost of land acquisition
and (5) the cost of equipment. The activities undertaken to support the selection of this pathway
among others by surveying measurements and soil investigation consisting of:
• Determination of location or network configuration, namely topographical survey to
determine the location or line that will be traversed by the construction of 150 kV
transmission line Tolo.
• Measurement of longitudinal profile and the network situation namely the main polygon
measurement, stacking out centreline, and the measurement of longitudinal situation and
the situation of network using theodolites measuring tool to determine the placement of
the tower, then the scoping and measurement of tower situation.
• Investigation of land (sondir boring) is an analysis of the carrying capacity of soil or rock
intended to know the ability of soil or rock in favour of a load from the foundation of the
building without experiencing a collapse.
• Land and building registration, class of building and building owners affected by the line,
covers a total area of buildings and land, building status, class of building and ownership of
the building.
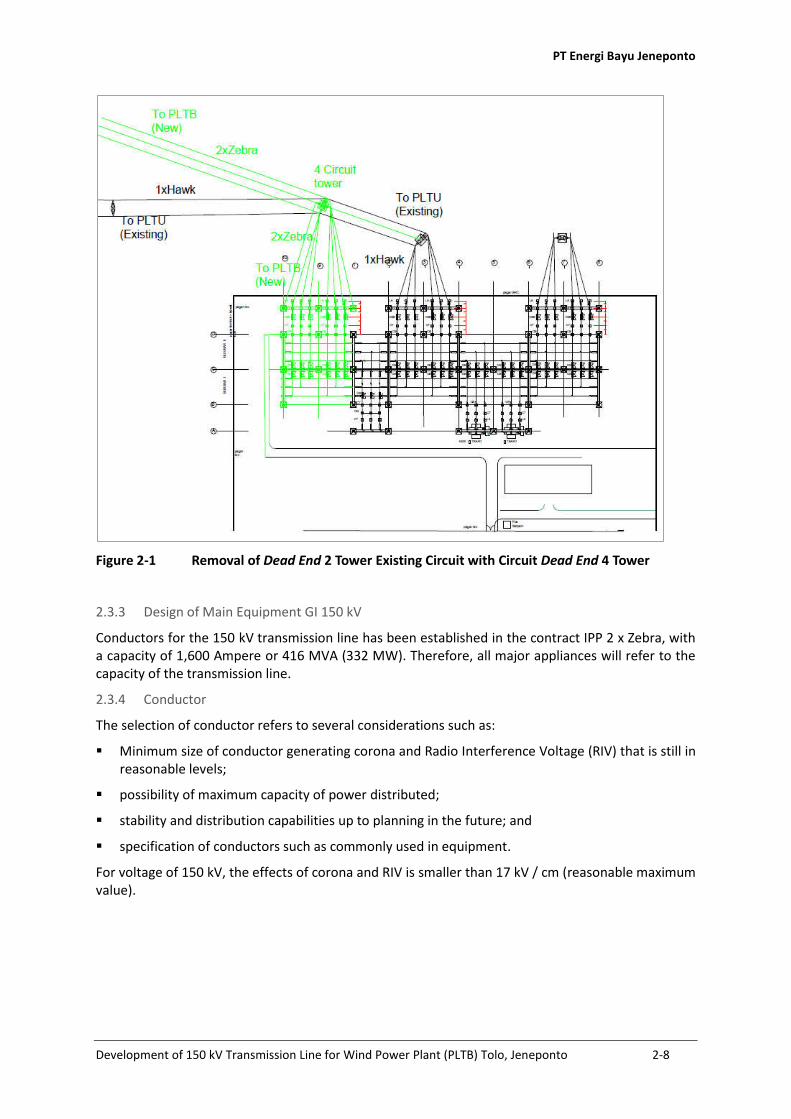
Pathways to the chosen transmission line will be built on the existing directions Tower 2 where there
will be a cross between the existing lines with the transmission line. This transmission line will use
one new dead end tower with 4 circuits coupled with a foundation and a line conductors to
additional substation and existing dead end tower. The new dead end tower with 2 circuits will
facilitate cross between existing line with the new line (Figure 2-1).
PT Energi Bayu Jeneponto
Development of 150 kV Transmission Line for Wind Power Plant (PLTB) Tolo, Jeneponto 2-8
Figu e - Re o al of Dead End To e E isti g Ci uit ith Ci uit Dead End To e
2.3.3 Design of Main Equipment GI 150 kV
Conductors for the 150 kV transmission line has been established in the contract IPP 2 x Zebra, with
a capacity of 1,600 Ampere or 416 MVA (332 MW). Therefore, all major appliances will refer to the
capacity of the transmission line.
2.3.4 Conductor
The selection of conductor refers to several considerations such as:
▪ Minimum size of conductor generating corona and Radio Interference Voltage (RIV) that is still in
reasonable levels;
▪ possibility of maximum capacity of power distributed;
▪ stability and distribution capabilities up to planning in the future; and
▪ specification of conductors such as commonly used in equipment.
For voltage of 150 kV, the effects of corona and RIV is smaller than 17 kV / cm (reasonable maximum
value).
PT Energi Bayu Jeneponto
Development of 150 kV Transmission Line for Wind Power Plant (PLTB) Tolo, Jeneponto 2-9
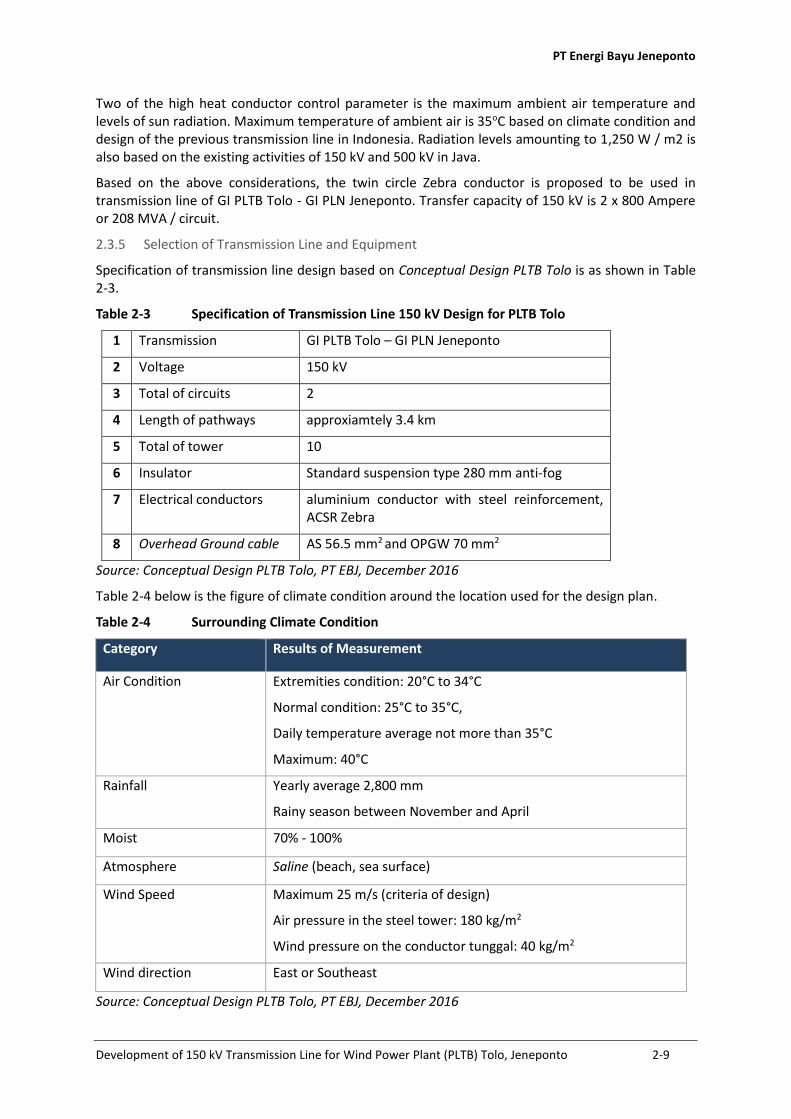
Two of the high heat conductor control parameter is the maximum ambient air temperature and
levels of sun radiation. Maximum temperature of ambient air is 35oC based on climate condition and
design of the previous transmission line in Indonesia. Radiation levels amounting to 1,250 W / m2 is
also based on the existing activities of 150 kV and 500 kV in Java.
Based on the above considerations, the twin circle Zebra conductor is proposed to be used in
transmission line of GI PLTB Tolo - GI PLN Jeneponto. Transfer capacity of 150 kV is 2 x 800 Ampere
or 208 MVA / circuit.
2.3.5 Selection of Transmission Line and Equipment
Specification of transmission line design based on Conceptual Design PLTB Tolo is as shown in Table
2-3.
Ta le - Spe ifi atio of T a s issio Li e kV Desig fo PLTB Tolo
1 Transmission GI PLTB Tolo – GI PLN Jeneponto
2 Voltage 150 kV
3 Total of circuits 2
4 Length of pathways approxiamtely 3.4 km
5 Total of tower 10
6 Insulator Standard suspension type 280 mm anti-fog
7 Electrical conductors aluminium conductor with steel reinforcement,
ACSR Zebra
8 Overhead Ground cable AS 56.5 mm2 and OPGW 70 mm2
Source: Conceptual Design PLTB Tolo, PT EBJ, December 2016
Table 2-4 below is the figure of climate condition around the location used for the design plan.
Ta le - Su ou di g Cli ate Co ditio
Category Results of Measurement
Air Condition - Extremities condition: 20°C to 34°C
- Normal condition: 25°C to 35°C,
Daily temperature average not more than 35°C
- Maximum: 40°C
Rainfall Yearly average 2,800 mm
Rainy season between November and April
Moist 70% - 100%
Atmosphere Saline (beach, sea surface)
Wind Speed Maximum 25 m/s (criteria of design)
Air pressure in the steel tower: 180 kg/m2
Wind pressure on the conductor tunggal: 40 kg/m2
Wind direction East or Southeast
Source: Conceptual Design PLTB Tolo, PT EBJ, December 2016
PT Energi Bayu Jeneponto
Development of 150 kV Transmission Line for Wind Power Plant (PLTB) Tolo, Jeneponto 2-10
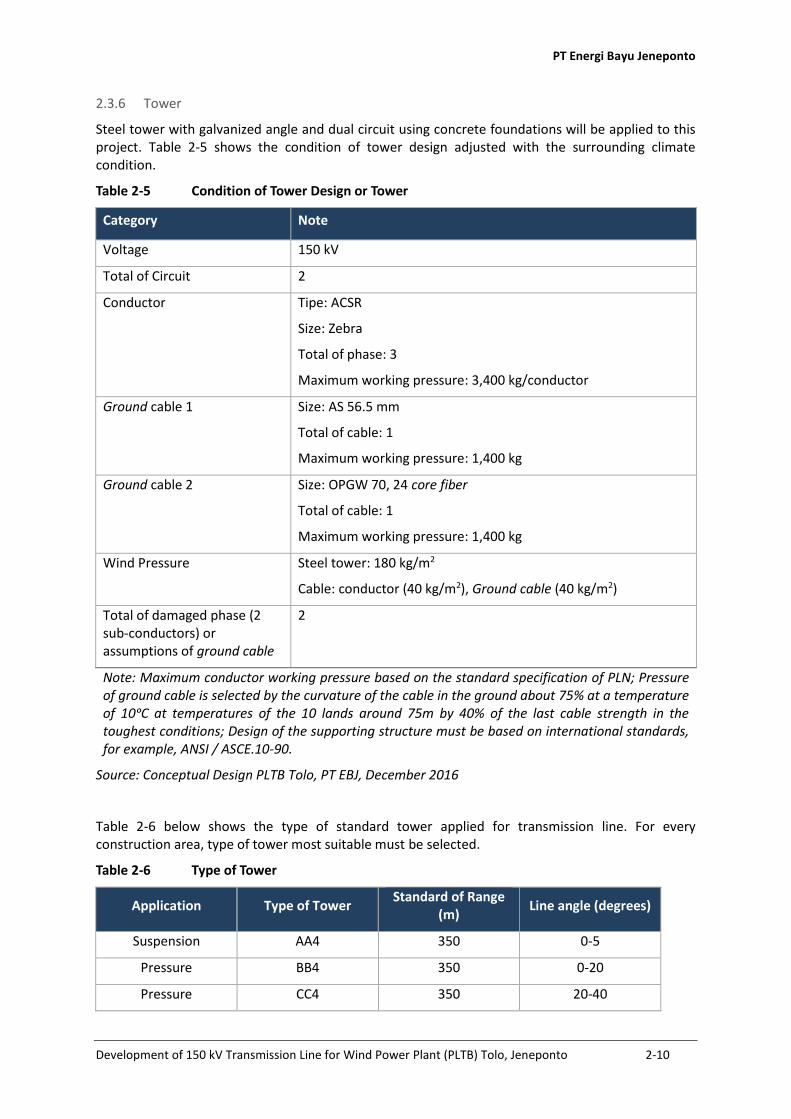
2.3.6 Tower
Steel tower with galvanized angle and dual circuit using concrete foundations will be applied to this
project. Table 2-5 shows the condition of tower design adjusted with the surrounding climate
condition.
Ta le - Co ditio of To e Desig o To e
Category Note
Voltage 150 kV
Total of Circuit 2
Conductor Tipe: ACSR
Size: Zebra
Total of phase: 3
Maximum working pressure: 3,400 kg/conductor
Ground cable 1 Size: AS 56.5 mm
Total of cable: 1
Maximum working pressure: 1,400 kg
Ground cable 2 Size: OPGW 70, 24 core fiber
Total of cable: 1
Maximum working pressure: 1,400 kg
Wind Pressure Steel tower: 180 kg/m2
Cable: conductor (40 kg/m2), Ground cable (40 kg/m2)
Total of damaged phase (2
sub-conductors) or
assumptions of ground cable
2
Note: Maximum conductor working pressure based on the standard specification of PLN; Pressure
of ground cable is sele ted y the ur ature of the a le i the grou d a out 7 % at a te perature of ᵒC at te peratures of the la ds arou d 7 y % of the last a le stre gth i the toughest conditions; Design of the supporting structure must be based on international standards,
for example, ANSI / ASCE.10-90.
Source: Conceptual Design PLTB Tolo, PT EBJ, December 2016
Table 2-6 below shows the type of standard tower applied for transmission line. For every
construction area, type of tower most suitable must be selected.
Ta le - T pe of To e
Application Type of Tower Standard of Range
(m) Line angle (degrees)
Suspension AA4 350 0-5
Pressure BB4 350 0-20
Pressure CC4 350 20-40

PT Energi Bayu Jeneponto
Development of 150 kV Transmission Line for Wind Power Plant (PLTB) Tolo, Jeneponto 2-11
Application Type of Tower Standard of Range
(m) Line angle (degrees)
Pressure DD4/DDR4 350 60 or dead end
Pressure EE4 350 60-90
Source: Conceptual Design PLTB Tolo, PT EBJ, December 2016
Some of the provisions applied in the design of the tower are as follows:
▪ Determining the location of the tower and the determination of the type and tower height
refers to the topography. Height of conductor above ground and minimum obstacle
clearance must be in accordance with SNI 04-6908-2002 because it is essential to provide
approximately . fo se u it pu poses a o du to te pe atu e of ᵒC;
▪ Checking primary topographic survey should be emphasized with an emphasis on the range -
length, angle of line and the new object. Inaccuracies in this case will affect the height of the
conductor and tower loads and sometimes re-selection of the type and height of the tower
has to be done;
▪ Tower pressure is used at intervals of every 10 towers in the ongoing suspension tower line
to assemble and absorb the load in the event of damage to the electrical conductor and / or
ground cable. Therefore, the reliability of transmission line can be improved;
▪ Tower with standard height is used in the data area. In terms of construction, it is done at
the crossroads of the main road, conductor of cables, distribution line and other
transmission line; will use additional weight tower if necessary. The addition of weight is +
3m, + 6m, + 9m for each tower type.
▪ In another case, the reduction of the tower weight (-3m) may be economical and can be
applied in transmission line; in the case network parts passing through the mountainous
area where the short-range and across the valley reach is inevitable. The tower can be used
on top of the hill to lower tower vertical load.
▪ Tower design procedure must be conducted in accordance with international standards for
steel materials ASCE 52 (ANSI 10 – 90).
2.3.7 Insulator
Standard number of insulator is selected based on the highest utility voltage of 150 kV. In the area
around the transmission lines that cross the eastern coast of South Sulawesi, insulator design must
be considered as related to salt contamination. Based on these considerations, the number of
insulators for each row is 12 insulators size 25 mm with standard suspension as the type.
This transmission lines will use insulators with suspension type of "ball and socket" that has
mechanical strength and electrical. Suspension insulator is made of alumina porcelain or glass. Data
of basic insulator can be seen in Table 2-7 below.
Ta le - Data of I sulato
Information Insulator of Suspension
Supporting Insulator U120BP U210B
Diameter (mm) 280 (max) 330 (max) 180-160
Height(mm) 146 170 110+990

PT Energi Bayu Jeneponto
Development of 150 kV Transmission Line for Wind Power Plant (PLTB) Tolo, Jeneponto 2-12
Information Insulator of Suspension
Supporting Insulator U120BP U210B
Length of Leakage
(mm)
440 (min) 440 (min) 4.280
Voltage of Flashover
(kV)
Low Frequency
Dry: 75
Wet: 40
Low Frequency
Dry: 80
Wet: 41
Low Frequenyc
Dry: 635
Wet: 495
Impulse (kV) 105 115 1.105
Electrical Mechanical
Strength Combination
(kg)
12,000 21,000 210*
Note: *) Strength of cantilever
Source: Conceptual Design PLTB Tolo, PT EBJ, December 2016
Total of insulator of each series as well as cleaning between charging of portion at the conductor
and insulator equipment and supporting equipment will be assessed by:
1. Diversion – Leap
Ration of voltage increase due to diversion-leap is estimated amounting to 2.8 times of the direct
grounding system at 150 kV. It needs around 20% of leeway for the characteristic of flashover to
insolator diversion-leap, thus the decrease of insulation strength occurs below the worst condition
of relative air density and humidity as well as in terms of the actual assembly.
2. Resistivity Voltage 50 Hz
Abnormal voltage of 50 Hz maximum caused by conditions such as sudden load changes or cracks in
the transmission line. Therefore, the voltage - rise on the phase of noise in the case of a single
phase-to-soil cracks should be considered because it is very similar and important. The maximum
value for abnormal voltage is 1.2 x M x Um = 1.2 x 0.8 x 170 = 163 kV by putting leeway figure of 20%
on this line because of the effective grounding system.
3. Arcinghorns
Very strong insulator series even by lightning strike. However, insulator can be damaged because of
inrush current from lightning strikes. Therefore, a pair of arcinghorns should be installed in the series
of insulator to protect the insulator from the current. This Arcinghorn captures flashover voltages
caused by lightning strikes and blocking the jet to be able to touch the insulator.
Horn crack must withstand at least diversion-leap. Critical flashover voltage down from a horn crack
in the series of insulator would be better to be made as high as possible.
Proper care is needed thus voltage can be increased in phase of noise that occurs by one phase to
the damaged land where it will not cause problems to the entire system. The measurement is as
follows: 150 kV x 11. / √ = .4 kV.

PT Energi Bayu Jeneponto
Development of 150 kV Transmission Line for Wind Power Plant (PLTB) Tolo, Jeneponto 2-13
4. Cleaning
Normal cleaning for insulator on conductor line from fixed structure on suspension tower must be
secured of more than the value (L) based on the below calculation;
L = 1.115 Z + 0.021
where, Z = distance of horn gap ( m )
Minimum cleaning for insulator based on detained force to diversion – leap estimated.
Distance between arm and jumper cable on tension tower must be secured of more than L x 120 %
to consider devices to be used for isolator assemblies and construction working.
Based on the standard specification of PLN, cleaning insulaiton on transmission line can be
concluded as follows.
Ta le - Clea i g I sulatio
Insulation System Line 150 kV
Minimum length of horn gap (mm) 1,000
Normal insulation cleaning (mm) 1,800
Minimum insulation cleaning (mm) 1,300
Distance between arm of tower with jumper
cable (mm) 1,900
Source: Conceptual Design PLTB Tolo, PT EBJ, December 2016
The mechanical strength of each row of insulator must be amounted to three times of maximum
load applied under the toughest conditions. There are two types of row of insulator that will be used
namely single insulator row and a row of double insulator. Rows of single insulator will be widely
used as long as it is enough for the planned load.

PT Energi Bayu Jeneponto
Development of 150 kV Transmission Line for Wind Power Plant (PLTB) Tolo, Jeneponto 2-14
Figu e - T pe of Suspe sio I sulato a d Te sio

PT Energi Bayu Jeneponto
Development of 150 kV Transmission Line for Wind Power Plant (PLTB) Tolo, Jeneponto 2-15
Double insulator row either for suspension and tension namely in the line intersection on the rail,
high voltage line, the main road, a large river and buildings and on the tower which estimates the
presence of vertical load that is fairly large.
Rows of reverse tension will be used in the tower with a negative weight ranges for example to the
structure of substation.
Clamps suspension with the right size will be used to provide a flexible connection between the row
of conductors and insulators as well as with the underground cable and part of the tower that held
them. The shape of this clamp should be able to make the conductor wedged firmly in various angles
within quite fair distance so as to ensure a decent value for the arch, the tension and angle are in
row.
Clamp tension is the compression type with the right size for the conductor.
Standard mechanical characteristics for these clamps can be seen in Table 2-9 below.
Ta le - Cha a te isti s of Sta da d Me ha i al of Cla p
Conductor or
Underground
Cable
Maximum
Working
Tension (kg)
Clamp Suspension Clamp Tension / Pressure
Strength of
Ultimate
Breaking (kg)
Strength of
Slip (kg)
Strength of
Ultimate
Breaking (kg)
Strength of
Slip (kg)
ACSR Zebra 3,400 8,000 2,400 13,000 8,200
AS 56,5 mm2 1,400 2,400 1,100 4,000 3,000
OPGW 1,400
5. Conductor
Type of conductor used is ACSR Zebra. Feature of this conductor is as follows:
Ta le - Data of Co du to
Information ACSR Zebra
Spacious of section 436 mm2
Amount and diameter of the cable components 54 unit / 3.18 mm and 7 unit /3.18mm
Ultimate breaking strength of the conductors
intertwined 1139.72kN
Weight of conductor 11,578.2 kg/km
Electrical resistivity 0.0642 ohm/km
Transmission capacity at a temperature of 80ºC 196 MVA/Sirkuit
Sourcer : Conceptual Design PLTB Tolo
Furthermore, the conductor size 2 circuit 1 x Zebra is quite large to approximate the power to the
next few years without causing a voltage drop problem.

PT Energi Bayu Jeneponto
Development of 150 kV Transmission Line for Wind Power Plant (PLTB) Tolo, Jeneponto 2-16
6. Grounding
Ground Cable
It is very important to design accurately in terms of grounding cable because the level of isokeraunic
(I.K.L) in Jeneponto is quite large.
If one ground cable is assembled above every circuit in 150 kV transmission line, 100% coating to
ward off lightning should be installed given the height of 150 kV tower.
Therefore, considering the conductivity and anti-corrosion, the aluminium layer will be used.
Features of the ground cable are as follows:
Ta le - Data of Ground Cable
Information AS 56.5
Spacious of section 56.5 mm2
Amount and diameter of the cable components 7unit/3.5mm
Overall diameter 9.6 mm
Weight 426.5 kg/km
Ultimate Breaking Strength 5,930 kg
Maximum working pressure of ground cable T 1,400 kg
Standards of range 350 m
Source : Conceptual Design PLTB Tolo
Vertical cleansing between ground cable and conductors of electricity should be taken on a greater
range of the tower. Ground cables and electrical conductors should be installed at a sufficient
distance to provide a wider-angle layer for protecting electrical conductors from lightning.
Counterpoise
Two overhead ground cable makes the effect of the coating about 100%. So, the lightning will be
very difficult to cause cracks. But there are probable reserves of lightning because lightning from the
ground cable or at the top of the tower. Thus, special grounding is required to minimize the incident.
Tower-footing barriers can be reduced with the installation of a steel corner on the ground at the
foot of the tower to the foundation. Then to the tower which still has a high footing barriers,
counterpoise should be provided to avoid the line of cracks because of the lightning reserves. The
expected tower footing barrie s is less tha Ω. Gal a ized i o a le ith a size of 2 (7 /
3.5) is used to counterpoise. These cables should be buried along 10 m on the ground circular from
the foot of the tower at a depth of 0.5 mm from the surface of the ground.
Equipment on the conductor and ground cable
To connect strong conductor and to protect conductor from damages due to vibration and others
then several additional equipment must be used. The selection of additional equipment for
conductors and ground cable will be very influential on operations and maintenance thus the
selection of additional equipment must be done accurately viewed from electrical ability, mechanic
and chemistry.

PT Energi Bayu Jeneponto
Development of 150 kV Transmission Line for Wind Power Plant (PLTB) Tolo, Jeneponto 2-17
Joint
Straight joint for conductors and ground cable is made from the type of arm compression. The
tensile strength of these arms must be greater than 95% of the tensile strength of the conductor.
The electrical resistance of this arm cannot be more than the length of constraints on the same
conditions. Arm for ACSR / AS consists of short steel arm inside for the core of steel and aluminium
arm outside in accordance with the size of the conductor.
One – piece compression arm will be used for the joint jumper. The tensile strength of this arm
should be more than 30% of the tensile strength of the conductor.
Maintenance of arm is used to fix the damage during construction and operation of the circuit but
not to cut or connect conductors.
Armor Rod
Armor rod which has been formed previously will be used for the conductor at the side where it is
clamped. The Armor rods can protect conductors from damages caused by thunder and during the
condition of weary because of the vibrations.
Vibration Damper and Distance Damper
Vibration damper consists of a heavy piece which elastically supported from the line of conductors
or ground cable with clamps accordingly. The function of the damper is continuously relieving the
section of vibrational energy from conductor line and ground cable. For the combined conductors,
the combination of spacers and dampers are normally used.
2.3.8 Foundation
Design of Foundation
Design of foundation is determined by:
▪ Load of tower foundation is bounded by three types of objectives, namely compressive load,
lifting load and horizontal loads;
▪ Base of foundation design consideration is the stability of the lifting load as well as stability
against compressive load;
▪ Foundation type, to facilitate the design of a concrete foundation on the transmission line,
ground is classified appropriately to consider the weight of ground and the ultimate bearing
capacity;
▪ Different concrete foundation designed for a different tower types and ground types as
mentioned above.

PT Energi Bayu Jeneponto
Development of 150 kV Transmission Line for Wind Power Plant (PLTB) Tolo, Jeneponto 2-18
Foundation Application
▪ Selection of the proper foundation for each point of the tower must be made carefully by
checking ground data at each point so that the data of ground investigation becomes important
such as investigation data of ground at the site of the tower as well as the data of ground
investigation such as detail of drilling, collecting specimens of ground and other,
▪ Extension of pieces may be required on sloping position on mountainous land to reduce the
volume of soil excavation and ensure a strong foundation.
2.3.9 Route of Transmission Line
Transmission line is planned to be built by PLTB Tolo directed to substation of PLN Jeneponto. This
line has the length of approximately 3.4 km. The average height of tower is around 40 m. Width of
Right of Way (ROW) at least 20 m (10 m to the right and 10 m to the left) by taking into account the
height of tower and Government Regulation in force in Indonesia National Standard SNI 04-6908-
2002. Detail of information of each tower from transmission line can be viewed in Table 2-12 below.
Ta le - . Detail of I fo atio of T a s issio To e
No. of
Tower Type of Tower
Span Elevation
(m) Weight (m) Wind (m)
T.001A DDR6+0 - 165.000 27.78
T.002A AA6+12 371.848 350.650 24.25
T.003A AA6+9 393.014 370.650 31.33
T.004A AA6+12 366.819 370.000 26.67
T.005A/T8 EE6+6 405.340 353.940 31.82
T.006A AA6+3 331.454 343.940 22.05
T.007A AA6+3 326.215 350.000 11.86
T.008A/T8 CC6+3 322.217 362.722 7.40
T.009A BB6+9 410.216 375.222 7.16
T.010A DDR6+6 - 187.500 533.00
Source: Conceptual Design PLTB Tolo, PT EBJ, December 2016
2.3.10 Schedule of Activity Implementation
The plan to the development of 150 kV transmission line from GI PLTB Tolo which is directed to GI
PLN Jeneponto is planned to take nine months. As for the general sequence of activities to be
undertaken in the construction of the transmission line are as follows:
▪ Initial studies including feasibility studies, suitability principle, spatial and other licenses;
▪ Preliminary survey activities;
▪ Construction of access roads and cleaning RoW area;
▪ Tower foundation construction activities;
▪ Transmission tower installation activities;
▪ Transmission cable installation activities;

PT Energi Bayu Jeneponto
Development of 150 kV Transmission Line for Wind Power Plant (PLTB) Tolo, Jeneponto 2-19
▪ Commissioning activities.
The schedule in the development of 150 kV transmission line can be seen in Table 2.13 and the
details of activities can be seen in Appendix 3. In relation to the plan that the operational of
activities of transmission line will be done by PLN, then the activity schedule displayed is only the
schedule of construction. The schedule of operation and post-operation will be determined by PLN
as the management of transmission line.
Ta le - S hedule of kV T a s issio Li e Co st u tio
No Field of Work/ Construction Plan Duration of
Work (week) Start Finish
1 Technical Work Week-1 Week-14 14
Design of Control Week-1 Week -10 10
Design of Installation Week-4 Week -14 10
2 Search, Preparation and
Mobilization of Tools and
Materials
Week-3 Week -34 31
High Voltage Equipment Week-4 Week -34 30
Telecom Week -5 Week -29 24
SAS Week -6 Week -30 24
Bulk Material Week -10 Week -21 11
Disc Insulator Week -3 Week -23 20
Stringhardware Week -9 Week -28 19
High Voltage Connector Week -6 Week -26 20
Steel Structures Week -6 Week -21 15
3 Installation and Commissioning Week -21 Week -36 15
Installation of steel poles and high
voltage equipment, telecom and
SAS
Week -21 Week -31 10
Test and Commissioning Week-31 Week -36 5
Sourcer: Conceptual Design PLTB Tolo, PT EBJ, December 2017
2.3.11 Use of Clean Water
Clean water needs for domestic workers during the construction period is filled from the
surrounding residents, and used for sanitary needs of workers. As for drinking water, obtained from
bottled water. As for future operation, the need for clean water of workers are from water wells.
Refer to the literature, the domestic water needs of workers consisting of water needs to shower
and clean themselves, the need for water to wash clothes and equipment, and the need of water for
sanitation facilities, with a total estimated 60 litres / person / day. However, because at the location
of activity, barracks for workers are not to be built, then the use of clean water for domestic worker
needs is mainly only to facilitate sanitation of the workers amounting to 15 litres /person/day.
1 Sunjaya, 2010

PT Energi Bayu Jeneponto
Development of 150 kV Transmission Line for Wind Power Plant (PLTB) Tolo, Jeneponto 2-20
Ta le - Esti ated Use of Clea Wate
No Useage Equivalence of Clean
Water Needs Total(m3/day)
1 Stage of construction:
Domestic (40 workers) 15 (liters/person/day) 0.6
2 Stage of operation:
Domestic (10 workers) 15 (liters/person/day) 0.15
Source: Results of Analysis, 2017
2.3.12 Management of Liquid Waste
Wastewater during construction phase coming from domestic activities of the employees. The
occurrence of domestic waste during the construction period is estimated as follows.
▪ Grey water: Wastewater from washing = 10 litres /person/day
▪ Black water: Fecal wastewater = 5 litres /person/day
Ta le - Esti ated Li uid Waste
No Type of Waste Waste Generation
Equivalence Total (m3/day)
1 Stage of Construction
a Grey Water (40 Workers) 10 (liters/person/day) 0.4
b Black Water (40 Workers) 5 (liters/person/day) 0.2
2 Stage of Operation
a Grey Water (10 Workers) 10 (liters/person/day) 0.1
b Black Water (10 Workers) 5 (liters/person/day) 0.05
Source: Results of Analysis, 2017
2.3.13 Management of Solid Waste
At the construction stage, solid waste, among others, generated from domestic activities of workers
in the field. Referring to the Standard of Department of Public Works SK SNI S-04-1993-03, standard
domestic waste generated during the construction phase is 3 litres / person / day. With the number
of construction workers 40 people and the operating phase 10 people, the estimated domestic
waste generation in the stage of construction is 120 litres / day or 0.12 m3 / day, and the operation
phase is 30 litres / day or 0.03 m3 / day.
Garbage from domestic activities of workers may be garbage from leftovers (organic) and packaged
food (non-organic).

PT Energi Bayu Jeneponto
Development of 150 kV Transmission Line for Wind Power Plant (PLTB) Tolo, Jeneponto 2-21
Ta le - Esti ated Do esti Solid Waste
No Waste Generation Sources Magnitude of Equivalent Total of Waste
Generation
1 Workers in construction
stage (40 People) 3 liters/person/day 0.12 m3/day
2 Workers in operation stage
(10 orang) 3 liters/person/day 0.03 m3/day
Source Results of Analysis, 2017
The waste is collected in a temporary collecting station at the location of the activity then
transported to landfill in cooperation with the Department of Hygiene Jeneponto Regency.
2.4 Outline of Business/ Development Components
2.4.1 Suitability of Development area with Spatial
Referring to the guidelines for the preparation of environmental documents, it is required that the
project site must be in accordance with the Regional Spatial Plan (RTRW). Site suitability analysis
with spatial planning projects is carried out using two regulations namely RTRW Jeneponto Regency
contained in Local Regulations Jeneponto Regency No. 1 Year 2012 and Law No. 41 Year 2009 on the
Protection of Sustainable Food Land. Based on Recommendation Letter of Conformity of Spatial and
Region No. 145 / DTRK / TR.I / JP / XI / 2016 issued by the Department of Spatial Planning and
Hygiene Government of Jeneponto Regency, Wind Power Plant Development Activities (PLTB)
carried out by PT. Energi Bayu Jeneponto (EBJ) located in Binamu District, Arungkeke District,
Turatea District and Batang District has been in accordance with RTRW Jeneponto Regency and is
expected to maintain attention on sustainable regional food agriculture and agricultural reserve
lands under Law 41 Year 2009. Map overlay of development area to the Region spatial map (RTRW),
Structure of Space and Strategic Area can be seen in Map 2-5, Map 2-6 and Map 2-7. Details
regarding the suitability of the location of activity with spatial layout can be found in Appendix 1.
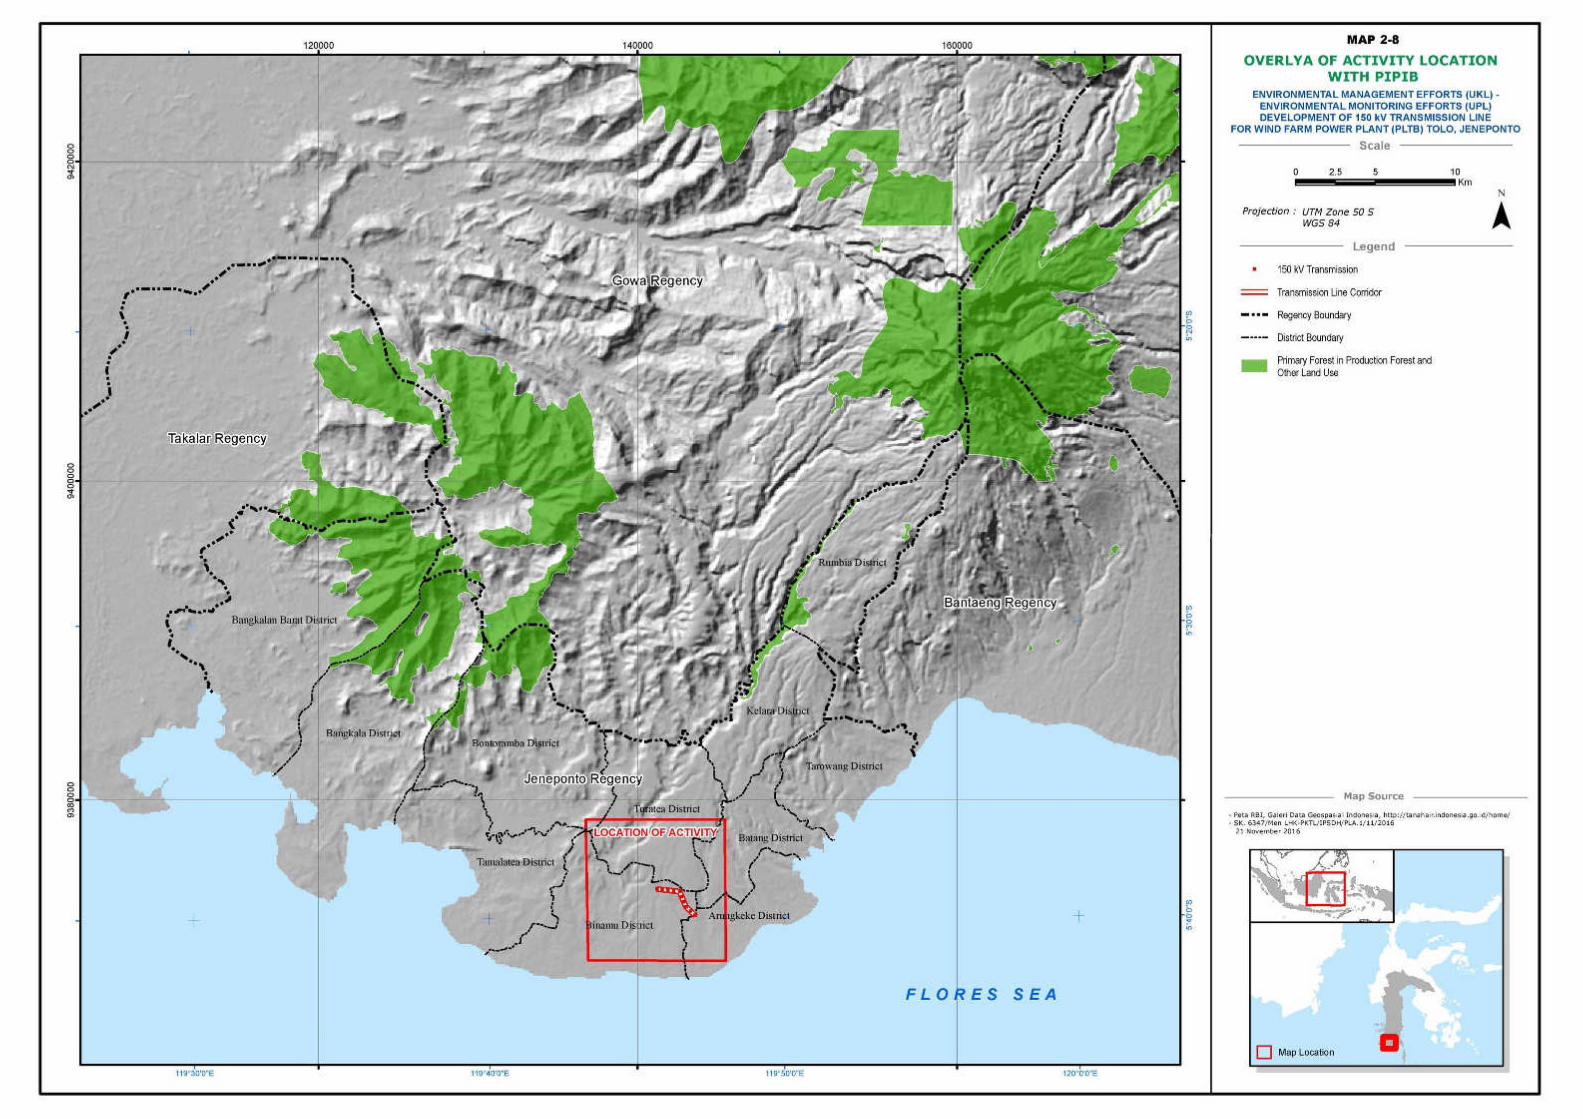
In connection with the Republic of Indonesia Presidential Instruction No. 8 Year 2015 on New Permit
Delays and Improving Governance of Primary Forest and Peatland, the Second Instruction, that New
Permit Delays apply to the use of natural forests of primary and peat land, with the exception
granted to: point (b), namely implementation of vital national development, namely geothermal, oil
and gas, electricity, as well as land for rice and sugar cane. Thus, these activities do not conflict with
PIPIB.

PT Energi Bayu Jeneponto
Development of 150 kV Transmission Line for Wind Power Plant (PLTB) Tolo, Jeneponto 2-22
Map - O e la of A ti it Lo atio ith Regio al Spatial pla Je epo to Rege

PT Energi Bayu Jeneponto
Development of 150 kV Transmission Line for Wind Power Plant (PLTB) Tolo, Jeneponto 2-23
Map - O e la of A ti it Lo atio ith Spa e St u tu e Je epo to Rege

PT Energi Bayu Jeneponto
Development of 150 kV Transmission Line for Wind Power Plant (PLTB) Tolo, Jeneponto 2-24
Map - O e la of A ti it Lo atio ith St ategi A ea Je epo to Rege
PT Energi Bayu Jeneponto
Development of 150 kV Transmission Line for Wind Power Plant (PLTB) Tolo, Jeneponto 2-25
Map - O e la of A ti it Lo atio ith PIPIB

PT Energi Bayu Jeneponto
Development of 150 kV Transmission Line for Wind Power Plant (PLTB) Tolo, Jeneponto 2-26
2.4.2 Principle Agreement on Development Plant
When the document of UKL-UPL is composed, plan of transmission line development activities PLTB
Tolo has obtained Principle Permit issued by the Office of Government Integrated Services
Jeneponto Regency No. 256 / IP / OPT / JP / X / 2016. In the presence of principle permission,
transmission line development activities from GI PLTB Tolo - GI PLN Jeneponto located in Empoang
village, Binamu District and Kalumpang Loe Village, Arungkeke District in principle could otherwise
be done. Detail information of authorities about the principle permit of development plan can be
found at Appendix 2.
2.4.3 Description of Development Plan Impacting Environmental Issue
Before PT Energi Bayu Jeneponto starts the activity, the identification of development plan that can
inflict environmental issue is necessary. This is intended to create a study about the source, type and
environmental impact as well as various efforts of environmental management and monitoring that
needs to be taken care off. Development plan that can inflict an environmental impact are as
follows.
2.4.3.1 Stage of Pre-Construction
During the stage of pre-construction, the development potentially inflict an environmental impact is
the land acquisitions that will be used as the development location of 150 kV Transmission Line for
PLTB Tolo, Jeneponto. Development plan in the construction of transmission line from PLTB Tolo
substation – PLN Jeneponto substation is located in field lands in the area of 80,000 m2 that belongs
to the public. This area is an irrigated fields with paddy as the main commodity.
Mechanism of land acquisition transfer from the public to PT EBJ will be done with the scheme of
willing to buy – willing to sell transaction. PT EBJ is committed to perform efforts of land acquisition
by applying regulations and avoid losses as well as other negative impacts on the socio-economic life
of society.
However, the potential impact may still occur in form of civil unrest and fears of losing job.
2.4.3.2 Stage of Construction
The activities at this stage include the recruitment for construction activities, mobilization of
equipment and materials, land preparation, preparation of access roads, and the construction of
transmission towers and line, as well as commissioning work.
a. Acceptance of Construction Workers
In the construction phase, workers will be tasked for the construction works including civil works,
instrumental works, as well as electrical work.
Generally, the recruitment mechanism will be managed openly either by PT EBJ or EPC Contractor.
For hiring, PT EBJ will prioritize local labour from the villages in the development area, considering
the expertise required.
The workers required during the stage of construction are those who fulfil the qualifications as
Expert, Engineer, Inspector, Skill Technician, Labour and supporting workers/ other administrative.
Expert, Engineer and Inspector workers can be fulfilled by those who met the requirement regardless
of their domicile either local, national or multinational. For supporting workers (labor), will be
PT Energi Bayu Jeneponto
Development of 150 kV Transmission Line for Wind Power Plant (PLTB) Tolo, Jeneponto 2-27
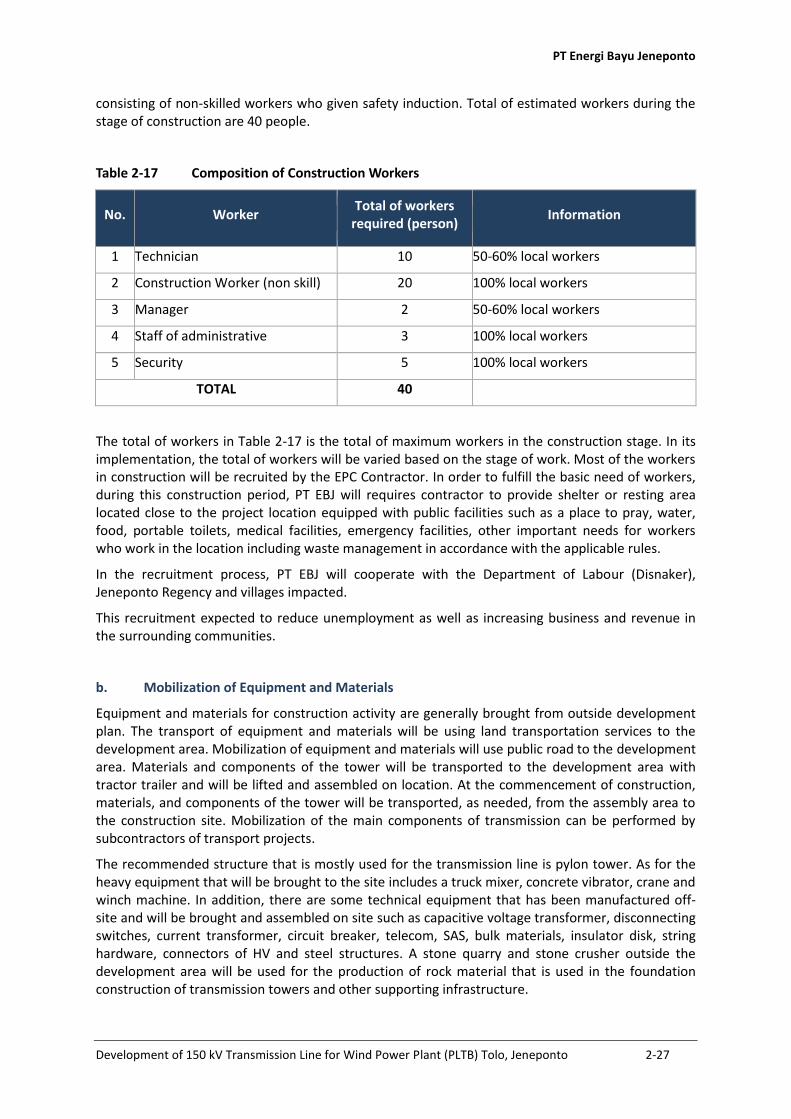
consisting of non-skilled workers who given safety induction. Total of estimated workers during the
stage of construction are 40 people.
Ta le - Co positio of Co st u tio Wo ke s
No. Worker Total of workers
required (person) Information
1 Technician 10 50-60% local workers
2 Construction Worker (non skill) 20 100% local workers
3 Manager 2 50-60% local workers
4 Staff of administrative 3 100% local workers
5 Security 5 100% local workers
TOTAL 40
The total of workers in Table 2-17 is the total of maximum workers in the construction stage. In its
implementation, the total of workers will be varied based on the stage of work. Most of the workers
in construction will be recruited by the EPC Contractor. In order to fulfill the basic need of workers,
during this construction period, PT EBJ will requires contractor to provide shelter or resting area
located close to the project location equipped with public facilities such as a place to pray, water,
food, portable toilets, medical facilities, emergency facilities, other important needs for workers
who work in the location including waste management in accordance with the applicable rules.
In the recruitment process, PT EBJ will cooperate with the Department of Labour (Disnaker),
Jeneponto Regency and villages impacted.
This recruitment expected to reduce unemployment as well as increasing business and revenue in
the surrounding communities.
b. Mobilization of Equipment and Materials
Equipment and materials for construction activity are generally brought from outside development
plan. The transport of equipment and materials will be using land transportation services to the
development area. Mobilization of equipment and materials will use public road to the development
area. Materials and components of the tower will be transported to the development area with
tractor trailer and will be lifted and assembled on location. At the commencement of construction,
materials, and components of the tower will be transported, as needed, from the assembly area to
the construction site. Mobilization of the main components of transmission can be performed by
subcontractors of transport projects.
The recommended structure that is mostly used for the transmission line is pylon tower. As for the
heavy equipment that will be brought to the site includes a truck mixer, concrete vibrator, crane and
winch machine. In addition, there are some technical equipment that has been manufactured off-
site and will be brought and assembled on site such as capacitive voltage transformer, disconnecting
switches, current transformer, circuit breaker, telecom, SAS, bulk materials, insulator disk, string
hardware, connectors of HV and steel structures. A stone quarry and stone crusher outside the
development area will be used for the production of rock material that is used in the foundation
construction of transmission towers and other supporting infrastructure.

PT Energi Bayu Jeneponto
Development of 150 kV Transmission Line for Wind Power Plant (PLTB) Tolo, Jeneponto 2-28
All activities including seeking, manufacturing all equipment and materials up to on-site mobilization
will take about 30 weeks starting from week three to week 34 in the stage of construction.
Ta le - Co st u tio E uip e t of the de elop e t kV T a s issio Li e fo PLTB Tolo, Je epo to
No Equipment, Materials,
Components of Tower Type Information
1 High Voltage Equipment Safety equipment (protection);
circuit breakers, surge protector,
insulators, transformers
2 Telecom Communication tools
3 Bulk Material Materials, such as sand, cement,
stone
6 String hardware
7 High Voltage Connector
8 Steel Structures
Mobilization of equipment, materials and the tower components by using of public transport is
expected to inflict a traffic disruption, decreased of ambient air quality, and noise.
c. Clearance and Land Preparation
Clearance and land preparation will be conducted along the transmission line and ROW and
construction of access roads. Clearance of waste, debris and shrubs at the project site will use a
bulldozer and a loader in the early stages of construction. Generally, the land flattening will be done
in uneven ground surface. Before construction is complete, all the waste and debris left will be
moved from the project site to the disposal facility that has been approved by the local government
or stacked near the working area and stored for re-burying activity.
Clearance and land preparation potentially cause environmental impacts through the increased rate
of flow of surface of water because of land use change, declining air quality, as well as changes in
biological components.
d. Preparation of Access Road
Transport route will be determined by the contractor of the project for the smooth mobilization of
construction equipment and workers to the development area based on standard criteria that set
out by the proponent. This route is determined with intention to minimize the disruption, avoid
sensitive areas and maximize the efficiency of transportation. In the transportation plan, it will
include the design criteria of road that already exists but requires modification of new roads and
other needs. The plan was made by also taking into account advice and direction of local
government and other relevant agencies staff who know the potential conflict area as a result of the
activity of road construction and / or roads maintenance. Length of the access road, both new roads
and repair of public roads, will be determined when the finalization of the plan route. Traffic plan is
also prepared and will cover all measures to reduce the impact of increased traffic.

PT Energi Bayu Jeneponto
Development of 150 kV Transmission Line for Wind Power Plant (PLTB) Tolo, Jeneponto 2-29
The construction of transmission line requires an access road for project transportation mobility
during construction and operation phases. In general, the stage of the access road construction
planned is coating road surface that is designed to withstand all seasons by using various sizes of
gravel and covering the road surface with 15-30 cm thickness.
With the completion of transmission line construction, the use of the access road will be consulted
with the local government. If necessary, the deconstruction of road will be done with the removal of
waste material out of the construction site and are separated from material required. Once the
waste material is transported, the surface of the ground will be compacted and restored to the
original condition. Road inside the project site which has decreased because of truck mobilization
will be filled with gravel and levelled so that it can be reused.
Access road construction activities have the potential to cause environmental impacts such as traffic
disruptions.
e. Tower Development and Transmission Line
In general, the construction of towers and transmission lines are divided into three main activities,
namely the construction of tower foundations, tower erection, and the withdrawal of conductors
and wires.
• Construction of Tower Foundation
The foundation that will be used according to the results of geotechnical studies. The depth of the
foundation pit was designed based on the results of soil investigation. The hole making is done
manually using manpower, considering the location of the tower foundation which impassable by
heavy equipment. Excavated material will be stockpiled for use as backfill material at a location close
to the tower bearing castings transmission until the concrete hardens.
The foundation for tower construction is accurately planned so that the foundation is able to bear
the load of the tower and its equipment able to withstand the arising moment due to the pull of the
conductors.
• Tower Erection
Construction of tower is a type of High Voltage Air Line construction (SUTT) mostly used in PLN
because it is easily assembled, especially for installation in mountainous areas and away from the
highway. However, intensive supervision is required because iron is prone to theft. The tower must
be strong against the load acting on it, that is:
• Gravity of tower and wires (compressive force);
• Tensile strength due to the range of wire;
• Wind force due to wind in the wire or body of tower.
Installation and setup of iron tower construction done by following the installation instructions of
tower starting from the bottom up to the top of the tower. Installation of tower is done carefully so
that parts of the tower does not blister, defect, bent thus iron tower is no longer fit to be mounted
or tower sections that are blister so that part are not protected by a layer of zinc (galvanized). After
the tower was completed, the dirt cleaning using a soft cotton cloth will be done. This process is
necessary in order to protect the galvanized layer.
• Conductor Withdrawal and Wire Conductor
Conductor and ground wire-drawing operation is performed from one session to the next session in
order, with the design and tension of tower to other towers tension. Once it has compiled the
conductive drum layout properly then end of the conductor is connected to York, which is then
connected to the wire inducement. Conductor withdrawal activities consist of work:
• Installation of insulators and equipment;

PT Energi Bayu Jeneponto
Development of 150 kV Transmission Line for Wind Power Plant (PLTB) Tolo, Jeneponto 2-30
• Withdrawal of conductor and ground wire;
• Setting of sag and tensile stress.
Splicing or installation between isolators set by fitting using ball and socket system. Adjustment of
grafting is done above ground isolator set then each new set is raised and mounted the tower arm.
Withdrawal of conductor and ground wire along the sag adjustment using Pulling Winches Machine
tools, Conductor Tension and Tension Winch Machine. Tensile stress is made such that the ground
wire, causing the size of sag 85% of the sag of the conductor, in order to avoid load stepping in the
mid span. All the activities will be carried out for 10 weeks starting from week 21 to week 31 in the
construction phase.
Development activities of tower and transmission lines potentially cause environmental impacts
such as noise from the use of heavy equipment.
f. Commissioning Work
Work of commissioning will be carried out after all construction activity is completed.
Commissioning or testing is done for the entire unit including the comprehensiveness of power
transmission equipment. This work includes work residues, inspection and commissioning of
transmission lines. Some of the tests will include individual test, system test, points to points test,
intertripping and energizing test. Testing (energizing) is done by giving the voltage on the side of the
sender as an experiment load. If this test does not generate problem, then SUTT 150 kV is ready for
operation.
This work will be carried out for 4 weeks from week 31 to week 36.
Work of commissioning potentially incur serious effect of an increased noise and the generation of
electromagnetic fields.
g. Worker Disengagement
At the time of the construction phase is done, the worker disengagement will be conducted. The
worker disengagement will be carried out following the applicable legislation. The worker
disengagement potentially inflicting impacts such as the loss of employment opportunities.
2.4.3.3 Stage of Operation
In the operation phase, PLTB will be operated to generate electricity that will be supplied to PLN grid
through a 150 kV transmission line. Figure 2-3 is a description of the operation of electricity
transmission lines from PLTB Tolo substation to PLN Jeneponto substation. Operation activities of
transmission lines will be managed by PLN.
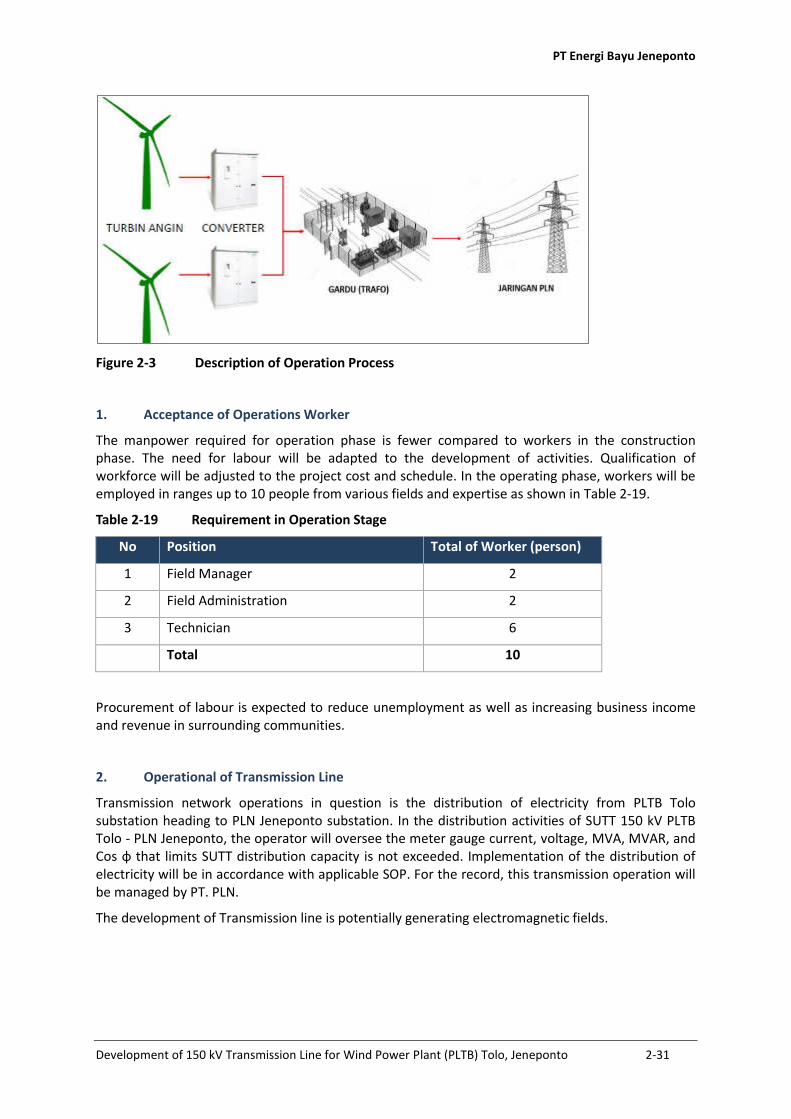
PT Energi Bayu Jeneponto
Development of 150 kV Transmission Line for Wind Power Plant (PLTB) Tolo, Jeneponto 2-31
Figu e - Des iptio of Ope atio P o ess
1. Acceptance of Operations Worker
The manpower required for operation phase is fewer compared to workers in the construction
phase. The need for labour will be adapted to the development of activities. Qualification of
workforce will be adjusted to the project cost and schedule. In the operating phase, workers will be
employed in ranges up to 10 people from various fields and expertise as shown in Table 2-19.
Ta le - Re ui e e t i Ope atio Stage
No Position Total of Worker (person)
1 Field Manager 2
2 Field Administration 2
3 Technician 6
Total 10
Procurement of labour is expected to reduce unemployment as well as increasing business income
and revenue in surrounding communities.
2. Operational of Transmission Line
Transmission network operations in question is the distribution of electricity from PLTB Tolo
substation heading to PLN Jeneponto substation. In the distribution activities of SUTT 150 kV PLTB
Tolo - PLN Jeneponto, the operator will oversee the meter gauge current, voltage, MVA, MVAR, and
Cos φ that li its SUTT dist i utio apa it is ot e eeded. I ple e tatio of the dist i utio of electricity will be in accordance with applicable SOP. For the record, this transmission operation will
be managed by PT. PLN.
The development of Transmission line is potentially generating electromagnetic fields.

PT Energi Bayu Jeneponto
Development of 150 kV Transmission Line for Wind Power Plant (PLTB) Tolo, Jeneponto 3-1
3 DESCRIPTION OF ENVIRONMENTAL COMPONENTS
3.1 Chemistry-Physical Components
3.1.1 Climate
The climate data used in this study is the data model of meso-scale which is available online and can
be accessed via website through http://indonesia.windprospecting.com/. Climate data includes
precipitation, air temperature, relative humidity, wind speed and wind direction surface. The
available climate data is based on hours, in this study the data will be made into a monthly average.
Data shown in this study is extracted with position coordinates which are the
coordinates of the development area of Wind Power Plant (PLTB) Tolo located in Turatea District,
Binamu District, Batang District and Arungkeke District, Jeneponto Regency, South Sulawesi
Province.
3.1.1.1 Rainfall
Based on the available data (Figure 3-1), the study area has two seasons as well as other areas in
Indonesia in general, namely the rainy season and dry season. Rainfall data at study sites showed
that the rainy season (CH> 50 mm) occurred in December to February and dry season (CH <50 mm)
occurs in March until November. The occurrence of a fairly long dry season shows that the location
of activities is included in a dry area. Average amount of monthly rainfall ranges between 3.1 to
130.6 mm, with the highest rainfall occurs in January and the lowest is in September. Based on an
average yearly rainfall, the development plan PLTB Tolo is classified in dry areas with rainfall of <600
mm / year (468.2 mm / year).
Figure 3-1 Monthly Average Rainfall at the Location of Jeneponto Regency
Source: http://indonesia.windprospecting.com
3.1.1.2 Temperature
Monthly average temperature for the last 10 years (2004-2014) in the study area is around 23.8 –
26.5oC. The highest average temperature recorded is on December amounting to 26.5oC, whereas
the lowest recorded is on August 23.8 oC. This monthly average temperature tends to increase form
September to November, as shown in Figure 3-2 below.
0
25
50
75
100
125
150
JAN FEB MAR APR MAY JUN JUL AUG SEP OCT NOV DEC
Cu
rah
Hu
jan
(mm
/bln
)
Bulan

PT Energi Bayu Jeneponto
Development of 150 kV Transmission Line for Wind Power Plant (PLTB) Tolo, Jeneponto 3-2
Figu e - Va iatio of Mo thl A e age Wi d Te pe atu e at the Lo atio of Je epo to Rege
Sour e: http://i do esia. i dp ospe ti g. o
3.1.1.3 Duration of Sunlight
Sun irradiation data in a span of four years (2011-2014) are presented in Table 3-1. The highest
monthly sunlight in September 2011 was 98.50% and the lowest was in February 2014 at 22%.
Table 3-1 Monthly Sunlight (2011-2014) in %
Month 2011 2012 2013 2014
January 30.80 39.00 23.00 34.30
February 46.60 57.00 44.00 22.00
March 44.80 55.00 61.00 44.60
April 70.30 60.00 55.00 55.90
May 51.70 67.00 34.00 42.60
June 50.80 50.00 28.00 27.50
July 70.00 51.00 29.00 29.10
August 98.20 81.00 79.00 79.20
September 98.50 61.00 77.00 91.10
October 70.50 61.00 69.00 77.10
November 61.20 45.00 49.00 56.40
December 37.70 35.00 33.00 37.00
Average 60.93 55.17 48.42 49.73
Source: Stations of Meteorological and Geophysics, Climatology Station Jeneponto
0
5
10
15
20
25
30
35
40
JAN FEB MAR APR MAY JUN JUL AUG SEP OCT NOV DEC
Su
hu
(oC
)
Bulan
Maximum
Minimum
Average

PT Energi Bayu Jeneponto
Development of 150 kV Transmission Line for Wind Power Plant (PLTB) Tolo, Jeneponto 3-3
3.1.1.4 Humidity
Average relative humidity at the study area is fairly high ranging from 79.7 to 87.1%, it is probably
because the development area located near the beach. The highest relative humidity occurs in June
amounted to 87.1% and the lowest in December by 79.7%. In Figure 3-3, it is seen that the relative
humidity tends to decrease from July to December then rise from January to June.
Figure 3-3 Variations of Monthly Average Relative Moisture at the Location of Jeneponto
Regency
Sour e: http://i do esia. i dprospe ti g. o
3.1.1.5 Wind Speed
Hourly wind data for 10 years (2004-2014) were used in this study, the wind data that can be
accessed online via website http://indonesia.windprospecting.com. For the purposes of analysis, the
data is made into a monthly average of data for 10 years (2004-2014). Monthly average data is
presented in the wind rose form such as in Figure 3-4. If the surface wind pattern in January is
associated with the movement of pseudo-sun, the sun's position in January is still in the southern
hemisphere. Thus, low pressure centre is formed in the south of the equator and dominant winds
blow from the north to the south of the earth, or rather in the site of development plan PLTB
dominant direction of the surface wind blowing from the northwest at a maximum speed of more
than 10 m / sec. Surface wind patterns in February and March is not much different from January,
where the pattern of the dominant wind still blowing from the northwest. It is also possible because
the central of heat of the earth's surface is still in the southern hemisphere.
75
77
79
81
83
85
87
89
91
93
95
JAN FEB MAR APR MAY JUN JUL AUG SEP OCT NOV DEC
Ke
lem
ba
ba
n (%
)
Bulan

PT Energi Bayu Jeneponto
Development of 150 kV Transmission Line for Wind Power Plant (PLTB) Tolo, Jeneponto 3-4
Figure 3-4 Profile of Monthly Average Wind Rose at the Location of Jeneponto Regency
Sour e: http://i do esia. i dprospe ti g. o
At the end of March, or rather starting on March 21, is the time when the sun is above the equator,
causing the Earth's surface heating centre is around the equator. In April, the wind is not only
blowing from the northwest, but also there are winds blowing from the East. This East wind began to
look dominant in April, this is possible because of the low-pressure centre which is located in the
northern part of the Earth that causes the wind blowing from the southern hemisphere and turned
toward the earth at the equator to the northern part. But the wind is also blowing from the North. In
April, the sun's position is not toward the end point of the earth movement to the South. This
dominant eastern wind blowing until October at speeds of more than 6 m / sec. This indicates that
the development plan of PLTB Tolo in May to October is entering dry season or dominant winds
blowing from the East or Australia often called monsoon wind. Percentage of wind blowing from the
East or from the southeast throughout the year is greater than from the West or Northwest. This
indicates that the site development plan PLTB Tolo is predominantly influenced by wind monsoon
from Australia or rather from the southeast. Profile of yearly average wind rose over 10 years (2004-
2014) showed that the study area has a dominant wind blowing from the East with an average speed
of > 8 m / sec and most of the wind blowing on study location have speeds of > 3 m / sec. At this
speed, it is possible to be used as an energy source driving the turbine PLTB.

PT Energi Bayu Jeneponto
Development of 150 kV Transmission Line for Wind Power Plant (PLTB) Tolo, Jeneponto 3-5
Figure 3-5 Profile of Yearly Average Wind Rose at the Location of Jeneponto Regency
Sour e: http://i do esia. i dp ospe ti g. o
3.1.2 Quality of Air and Noise
Ambient air within the development area of 150 kV Transmission Line is one component of the
environment which is expected to be affected. Changes in the ambient air environment can be
sourced from exhaust emissions and dust resuspension during a mobilization of equipment and
project materials, as well as other sources. The impact on air quality can be assessed from changes
in the concentration of some parameters of air quality tests on the initial hue, such as, SO2, NO2,
CO, Pb, NH3 and particulate (TSP), in both the process of evaluating the potential impact as well as
the predicted impacts.
The parameters and methods of air analysis refers to the appendix of national ambient air quality
standard Government Regulation No. 41 Year 1999, and South Sulawesi Governor Regulation No. 69
Year 2010. The location of the air quality and noise sampling is done in 2 (two) locations, as in the
following table:
Table 3-2 Sampling Location of Air Quality and Noise
No
Location
1 KU-1
2 KU-2
Location of sampling of air quality and noise can be seen in Map 3-1.

PT Energi Bayu Jeneponto
Development of 150 kV Transmission Line for Wind Power Plant (PLTB) Tolo, Jeneponto 3-6
Map - Sa pli g Lo atio of Ai Qualit a d Noise

PT Energi Bayu Jeneponto
Development of 150 kV Transmission Line for Wind Power Plant (PLTB) Tolo, Jeneponto 3-7
Table 3-3 indicates that the value of the test parameters of ambient air quality is quite varied, but it
is still far below the standards. The difference in concentration of test parameters in each
measurement location is highly dependent on environmental conditions and activities in the
surrounding community. In detail, the ambient air quality based on the value of some of the test
parameters are described as follows.
Table 3-3 Results of Air Quality Test
No. Parameter of
Test
Quality
Standard
s
Time of
Measureme
nt
Results of Test Unit Method
KU-1 KU-2
1 Sulphur Dioxide
(SO2)*) 900 1 Hour 28 30
µg/Nm3
SNI
19.7119.7-
2005
2 Carbon
Monoxide (CO) 30,000 1 Hour 2,520 2,979
µg/Nm3
SNI
19.7119.10-
2005
3 Nitrogen
Dioxide (NO2)*) 400 1 Hour 22 25
µg/Nm3
SNI
19.7119.2-
2005
4 Dust (TSP)*) 230 24 Hour 70 76 µg/Nm
3
SNI
19.7119.3-
2005
5 Lead (Pb)*) 2 24 Hour < 0.01 < 0.01 µg/Nm
3
SNI
19.7119.4-
2005
6 Ammonia
NH * ** 2.0 1 Jam < 0.03 < 0.03 ppm
SNI
19.7119.1200
5
Source: Results of Test at the Study Area, February 2017
Carbon Monoxide (CO)
CO gas sourced from the results of incomplete combustion of organic materials, such as gasoline or
diesel fuel combustion in motor vehicles, coal, or wood. At certain concentrations, this gas can cause
toxic effects on the human body with symptoms such as headaches, dizziness, and shortness of
breath. The gas content in the ambient air is the highest in the study area 2,979 g/Nm3 and the
lowest is 2,520 g/Nm3.
Nitrogen Dioxide (NO2)
NO2 gas may be sourced from the nature, the results of combustion of organic materials or vehicle
smokes. At certain concentrations, this gas can cause irritation to lung bleeding in humans and
disturbance to vegetation and damage to physical structures. Besides, NO2 contributes to lowering
the acidity of rainwater. The test results of air quality in the study area showed that the
concentration of the gas is still far below the quality standards established and the highest is only

PT Energi Bayu Jeneponto
Development of 150 kV Transmission Line for Wind Power Plant (PLTB) Tolo, Jeneponto 3-8
about 22-25 mg / Nm3. The main source of NO2 gas is estimated from transportation activities and
photochemical reactions in air.
Sulphur Dioxide (SO2)
Sulphur dioxide is one of the components of air pollutants originating from the burning of sulphur-
containing materials such as in motor vehicle engines, electric generators, or burning of organic
waste. At certain concentrations, this gas can cause disruption to the environment, such as irritation
of the human respiratory tract, disturbance to vegetation and can increase the acidity of rainwater.
Contents of SO2 gas in ambient air at the study area is ranging 28 – 30 µg/Nm3. The main source is
expected to exhaust from vehicles operating in the study area and its surroundings.
Total Suspended Particulate (TSP)
Particles or TSP in the air produced by mechanical or natural events such as dispersion of dust by the
i d a d so o . The pa ti le size a gi g f o . μ to μ . Dust can cause respiratory system
disorders, irritation of the eyes and visual disturbances. Road dust resuspension due to
transportation activities and natural events such as the dispersion of fine particles from the leaves of
plants (rice) due to wind alleged to be sources of TSP in ambient air in the study area. TSP gas
content in the ambient air in the study area ranged 70 – 76 µg/Nm3.
Black Tin (Lead/ Pb)
Lead is one of the heavy metals that are harmful to human health. The main source of lead in
ambient air is the result of combustion in motor vehicle engines that use gasoline containing the
additive tetraethyl lead. The existence of Pb in the air at certain concentrations can cause health
problems, such as the lack of appetite, headache, anaemia, paralysis of limbs, convulsions or
impaired vision. The content of Pb in ambient air in the study area is under 0.01 µg/Nm3.
Noise
Noise in the study area UKL-UPL construction of electricity transmission lines with a capacity of 150
kV measured at two locations. The first location is the location of the planned substation which has a
value of 58 dBA noise. While the second location noise measurement was in the hamlet of Parepa II,
Empoang Village where the transmission line will start with value noise 54 dBA. Noise
measurements carried out at the same location as the collection of air quality. Based on the Decree
of the Minister of Environment no. 48 of 1996, the value of LSM measured compared with the default
value of noise level specified for residential areas and settlements amounting to 55 dBA. The
observation of the noise at the location of the substation plan exceeds the quality standards of
noise. This is caused by the use of land around the site, the site of rice fields and the public road thus
it is passed by many motor vehicles and the use of tractors to ploughing the fields that the engine
will emit a loud noise, especially during the daytime. Noise measurement data contained in Table
3-4.

PT Energi Bayu Jeneponto
Development of 150 kV Transmission Line for Wind Power Plant (PLTB) Tolo, Jeneponto 3-9
Table 3-4 Results of Noise Test
Location of
Example
Time of
Measurement Leq Results Unit
Substation Plan
L1. 07.00 Daylight (Ls)
60
dB(A)
L2. 10.00
L3. 15.00
L4. 20.00
L5. 23.00 Night (Lm)
57
L6. 01.00
L7. 04.00
24 hours
Daylight-Night
(Lsm) 58
Parepa II Sub-
village, Empoang
Village
L1. 07.00 Daylight (Ls)
58
dB(A)
L2. 10.00
L3. 15.00
L4. 20.00
L5. 23.00 Night (Lm)
50
L6. 01.00
L7. 04.00
24 hours Daylight-Night
(Lsm) 54
Source: Results of Tes at the Study Area, February 2017
3.1.3 Electromagnetic Field
To understand the existing radiation of the electromagnetic field at the development area, the
measurements at five locations will be conducted. The first location is the central location of the
existing PLN substation measured with the value of electromagnetic fields 0.8 x 10⁻³ mT. The second
location of electromagnetic field measurements are in front of the fence of PLN Substation with a
value 0.03 x 10⁻³ mT, while the third location is under SUTT or about 100 meters from PLN substation
with the measured electromagnetic field values of 0.21 x 10⁻³ mT. Electromagnetic fields were also
measured at the central part of transmission lines development plan and Parepa II sub-village,
Empoang Village. The results of measurements in these two points do not indicate the presence of
an electromagnetic field of electricity. Results of testing the electromagnetic field radiation
compared with the health requirements of the electromagnetic fields in the workplace listed in
Health Ministerial Decree No. 261 of 1998, namely a maximum of 0.5 mT for all weekdays and 5 mT
in a short time span (up to 2 hours per day). The observation of the electromagnetic field at all the
five locations remain well below health requirements. The location of electrical testing of the
electromagnetic field can be seen in Map 3-2. Data from more electromagnetic field measurements
contained in Table 3-5.

PT Energi Bayu Jeneponto
Development of 150 kV Transmission Line for Wind Power Plant (PLTB) Tolo, Jeneponto 3-10
Map - Lo atio of Ele t o ag eti Field Tests

PT Energi Bayu Jeneponto
Development of 150 kV Transmission Line for Wind Power Plant (PLTB) Tolo, Jeneponto 3-11
Table 3-5 Electromagnetic Field Observation Results
No. Location of Observation Results of
Testing Unit
1
Central Substation
0.8 x 10⁻³ mT
2
Front of Substation Fence
0.03 x 10⁻³ mT
3
Below SUTT, 100 m of Substation
0.21 x 10⁻³ mT
4
Transmission Line Plan Midsection
0 mT
5
Parepa II Sub-village, Empoang Village
0 mT
Source: Results of Testing at the Study Area, February 2017
3.1.4 Water Quality
The development and operation of 150 kV transmission lines for PLTB Tolo is potentially inflict the
quality of ground water, river water and sea water. Several major test parameters that can be an
indicator of changes in the environmental components such as: turbidity, TSS and TDS, pH, BOD5,
COD, DO, parameters of oils and fats as well as several other parameters. Water quality baseline
data in the study area may be a basis for management and on-site monitoring activities and
compare them after the activity starts running.
a. Clean Water
Sampling of clean water at the study area is taken at the residential wells, Parepa II Sub-village,
Empoang Village, or precisely at the coordinate of location and

PT Energi Bayu Jeneponto
Development of 150 kV Transmission Line for Wind Power Plant (PLTB) Tolo, Jeneponto 3-12
The sample of water is tested at laboratory by determining the test parameters and clean water
quality refers to the Ministry of Health Regulation No. 416 year 1990. The location of clean water
sampling can be seen in Map 3-3. The complete results of clean water quality testing can be seen in
Table 3-6.

PT Energi Bayu Jeneponto
Development of 150 kV Transmission Line for Wind Power Plant (PLTB) Tolo, Jeneponto 3-13
Map 3-3 Location of Clean Water Sampling and Surface Water

PT Energi Bayu Jeneponto
Development of 150 kV Transmission Line for Wind Power Plant (PLTB) Tolo, Jeneponto 3-14
Table 3-6 Water Quality Testing Results
No. Testing Parameter Quality
Standards*
Testing
Results Unit Method
A. Physical
1 Smell (in situ) No smell No smell - Organoleptic
2 Dissolved solids (TDS) 1.500 316 mg/L SNI 06-6989.27-2005
3 Turbidity 25 2 NTU SNI 06-6989.25-2005
4 Flavor No flavor No flavor - Organoleptic
5 Temperature (in situ) *) Air ±3°C 27.5 °C SNI 06-6989.23-2005
6 Color 50 4 Pt-Co SNI 06-6989.80-2011
B. Chemical
1 pH (in situ)*) 6.5 – 9.0 7.30 - SNI 06-6989.11-2004
2 Mercury (Hg) 0.001 < 0.0005 mg/L SNI 19-6989.78-2011
3 Arsenic (As) 0.05 < 0.005 mg/L SNI 06-6989.54-2005
4 Iron (Fe) 1.0 0.03 mg/L SNI 06-6989.4-2009
5 Fluoride (F) *)
1.5 0.42 mg/L IKM.KHT - 23
(Spectrophotometry)
6 Cadmium (Cd) 0.005 < 0.003 mg/L SNI 06-6989.16-2009
7 Total hardness (CaCO3)*) 500 262 mg/L SNI 06-6989.12-2004
8 Chloride (Cl) *) 600 31 mg/L SNI 6989.19-2009
9 Ch o iu VI C ⁶ 0.05 < 0.01 mg/L SNI 06-6989.71-2009
10 Mangan (Mn) *) 0.5 0.05 mg/L SNI 06-6989.5-2009
11 Nitrate NO -N) *) 10 1.8 mg/L IKM.KHT - 22
(Spectrophotometry)
12 Nitrite NO -N)*) 1.0 0.01 mg/L SNI 06-6989.9-2004
13 Selenium (Se)
0.01 < 0.002 mg/L Std. Mtd (Ed.21) 3500-
Se
14 Zinc (Zn) 15 0.02 mg/L SNI 06-6989.7-2009
15 Cyanide (CN) 0.1 < 0.005 mg/L SNI 06-6989.77-2011
16 Sulfate SO * 400 18 mg/L SNI 6989.20-2009
17 Anionic surfactant
(MBAs) 0.5 0.05 mg/L SNI 06-6989.51-2005
18 Lead (Pb) 0.05 < 0.01 mg/L SNI 06-6989.8-2004
19 Permanganate Value *) 10 3.2 mg/L SNI 06-6989.22-2004
C. Microbiology
1 Total of Coliform 50 3.6 MPN/100ml
APHA Ed.22nd9221 B-
2012
*) Standard Quality refers to the Regulation of Health Minister No. 416 of 1990
Source: Results of Testing at tbxcfgz4he Study Area, February 2017
Physical Parameter. Physically water wells in the study area appears to be clear with soluble solids
content of 316 mg / L (standard quality: 1000 mg / L). The temperature of the water bodies around
27.5 °C.
Chemical Parameter. The acidity of the water samples ranged between 7.3 that still within the range
of the parameter quality standard, which is 6.5 to 9.0. Other test parameter value is still very low
even among them there were not detected by the measuring instrument.

PT Energi Bayu Jeneponto
Development of 150 kV Transmission Line for Wind Power Plant (PLTB) Tolo, Jeneponto 3-15
Microbiology Parameter. The test sample of the water wells in the study area contains coliform
bacteria, which is 3.6 MPN / 100 mL. Although there is coliform but the numbers are still far below
the quality standard set at 50 MPN / 100 mL.
b. Surface Water
Surface water sampling test in the study area is in the primary irrigation canal with precisely location
coordinates at and
Surface water samples were then tested in the laboratory with the determination of test parameters
and surface water quality standard refers to Government Regulation No. 82 of 2001 on Surface
Water Quality for water criteria Class (I). Surface water sampling sites can be seen in Map 3-3. The
complete test results of surface water quality in the study area are presented in Table 3-7.
Table 3-7 Results of Surface Water Quality Testing
No. Testing Parameter Standard
Quality
Testing
Results Unit Method
A. Physical
1 Temperature (in situ) *)
Air ±3°C 28.5 ⁰C SNI 06-6989.23-
2005
2 Dissolved solids (TDS)
1,000 116 mg/L SNI 06-6989.27-
2005
3 Suspended solids (TSS) 50 24 mg/L SNI 06-6989.3-2004
B. Chemical
1 pH (in situ)*) 6 - 9 7.76 - SNI 06-6989.11-
2004
2 Ammonia-free NH -N) 0.5 < 0.01 mg/L SNI 06-6964.30-
2005
3 Dissolved oxygen (DO) (in
situ) 6 4.2 mg/L
SNI 06-6969.14-
2004
4 Total posphate PO -P) 0.2 0.05 mg/L SNI 06-6989.31-
2004
5 Cadmium (Cd) 0.01 < 0.003 mg/L SNI 6989.16-2009
6 Chloride (Cl)*) 600 84 mg/L SNI 6989.19-2009
7 Ch o iu VI C ⁶⁺ 0.05 < 0.01 mg/L SNI 06-6989.53-
2010
8 Chlorine-free Cl 0.03 < 0.01 mg/L HACH
9 Mangan (Mn) 0.1 0.06 mg/L SNI 06-6989.5-2004
10 Oils & Fats 1 < 0.2 mg/L HACH
11 Zinc (Zn) 0.05 0.02 mg/L SNI 06-6989.7-2009
12 Sulfate SO * 400 15 mg/L SNI 06-6989.20-

PT Energi Bayu Jeneponto
Development of 150 kV Transmission Line for Wind Power Plant (PLTB) Tolo, Jeneponto 3-16
No. Testing Parameter Standard
Quality
Testing
Results Unit Method
2009
13 Copper (Cu) *) 0.2 < 0.013 mg/L SNI 06-6989.6-2009
14 Lead (Pb) 0.03 < 0.01 mg/L SNI 06-6989.8-2004
15 BOD5 2 2 mg/L SNI 6989.72-2009
16 COD*) 10
16 mg/L
SNI 06-6969.15-
2004
17 Total Chromium (Cr) **) -
< 0.02 mg/L
SNI 06-6989.17-
2009
18 Iron (Fe) **) - < 0.02 mg/L SNI 06-6989.4-2009
C. Microbiology
1 Total of coliform
1,000 430
MPN/100ml
APHA Ed.22nd9221
E-2012
Sourcer: Results of Testing at the Study Area, February 2017
Physical Parameter. Physically, water surface in the study area was clear with soluble solids content
of 116 mg / L (standard quality: 1000 mg / L) while TSS is only about 24 mg / L (the quality standard:
50 mg / L). The temperature of the water bodies is around 28.5 °C.
Chemical Parameter. pH of surface water samples ranging between 7.76, still within the range of
this parameter quality standard, which is 6.0 to 9.0. BOD5 and COD value of the test sample is still
low, BOD5 about 2.0 mg / L (the quality standard of 2 mg / L) while the COD of about 16 mg / L (the
quality standard: 10 mg / L). Dissolved oxygen is still quite high, which is about 4.2 mg / L (standard
quality: 6 mg / L). Other test parameter value is still very low even among them there were not
detected by the measuring instrument.
Microbiology Parameter. Test samples of surface water in the study areas contain coliform
bacteria, which is only 430 MPN / 100 mL. Although there is coliform but the numbers are still far
below the quality standard set about 1,000 MPN / 100 mL.
3.1.4.1 Topography
Physiographic location of 150 kV transmission line development for PLTB Tolo in Binamu District and
Arungkeke District, Jeneponto Regency and surrounding is an area with a height ranging from 15 to
25 meters above sea level. Shape of the topography is higher towards the North, where the bedrock
(bed-rock) is composed of volcanic rocks Lompobatang (Qlv), consisting of anglomerat, lavas,
breccias, and tuff lava sludge.
Based on the occurence and classification of landform (Marsoedi, et al, 1994), then the location of
the project site is included in Uplifted Landform and included in the Tilted Uplift Lompobatang
volcanic rocks. The details are presented in Figure 2.12.

PT Energi Bayu Jeneponto
Development of 150 kV Transmission Line for Wind Power Plant (PLTB) Tolo, Jeneponto 3-17
Source: Engineering Report, PT Ground Risk Management, September 2016
Figu e - Lo atio of p oje t footp i t
3.1.5 Ground Condition
Ground sampling was conducted to determine the quality of the existing ground at the moment.
Based on the results of laboratory analysis, ground sampling in both locations is included in kind of
low ground organic matter, which characterizes the land is not fertile. Results of testing the quality
of ground in the study area can be seen in Table 3-8.
Table 3-8 Results of Ground Quality Testing
No Testing Parameter Testing Results
Unit Method KT-1 KT-2
Ground Chemistry
1 pH
- H2O 6.46 7.03 - SNI 03-6787-2002
- KCl 6.14 6.85 - SNI 03-6787-2002
2 C. Organic 0.20 0.31 % SNI 13-4720-1998
3 N. Total 0.07 0.16 % SNI 13-4721-1998
4 P2O5 (HCl 25%) 3.83 5.11 mg/kg Spectrophotometry
5 K2O (HCl25%) 4.60 9.34 mg/kg Flame photometry
6 P2O5 bray 1.96 2.01 mg/kg Spectrophotometry

PT Energi Bayu Jeneponto
Development of 150 kV Transmission Line for Wind Power Plant (PLTB) Tolo, Jeneponto 3-18
No Testing Parameter Testing Results
Unit Method KT-1 KT-2
7 Cation composition (NH4-Act)
- Ca 17.40 5.83 me/100gr AAS
- Mg 25.31 14.05 me/100gr AAS
- K 11.74 30.16 me/100gr Flame photometry
- Na 2.95 6.92 me/100gr Flame photometry
8 Cation Exchange
Capacity
105.20 128.66 me/100gr Colorimetry
9 Packaging
- Al-exchange 0.80 0.40 me/100gr Titrimetric
- H-exchanger 0.40 0.30 me/100gr Titrimetric
10 Texture
- Sand 24.41 47.15 % Pipette method (Stoke's
Law
- Dust 42.36 29.62 % Pipette method (Stoke's
Law
- Soil 33.23 23.13 % Pipette method (Stoke's
Law
Source: Results of Testing at the Study Area, 2016
3.2 Biology Components
The development plant of 150 kV transmission line for PLTB potentially impacts the surrounding
environment, including the biological component. To determine the existing condition of biological
components in the study area, an observation was conducted including components of terrestrial
vegetation and land fauna. Biological component data in this study refers to the observation of
biological components for PLTB Tolo Development AMDAL Study. The locations of the biological
component observation can be seen in Map 3-4.

PT Energi Bayu Jeneponto
Development of 150 kV Transmission Line for Wind Power Plant (PLTB) Tolo, Jeneponto 3-19
Map - Lo atio of Biolog Co po e ts
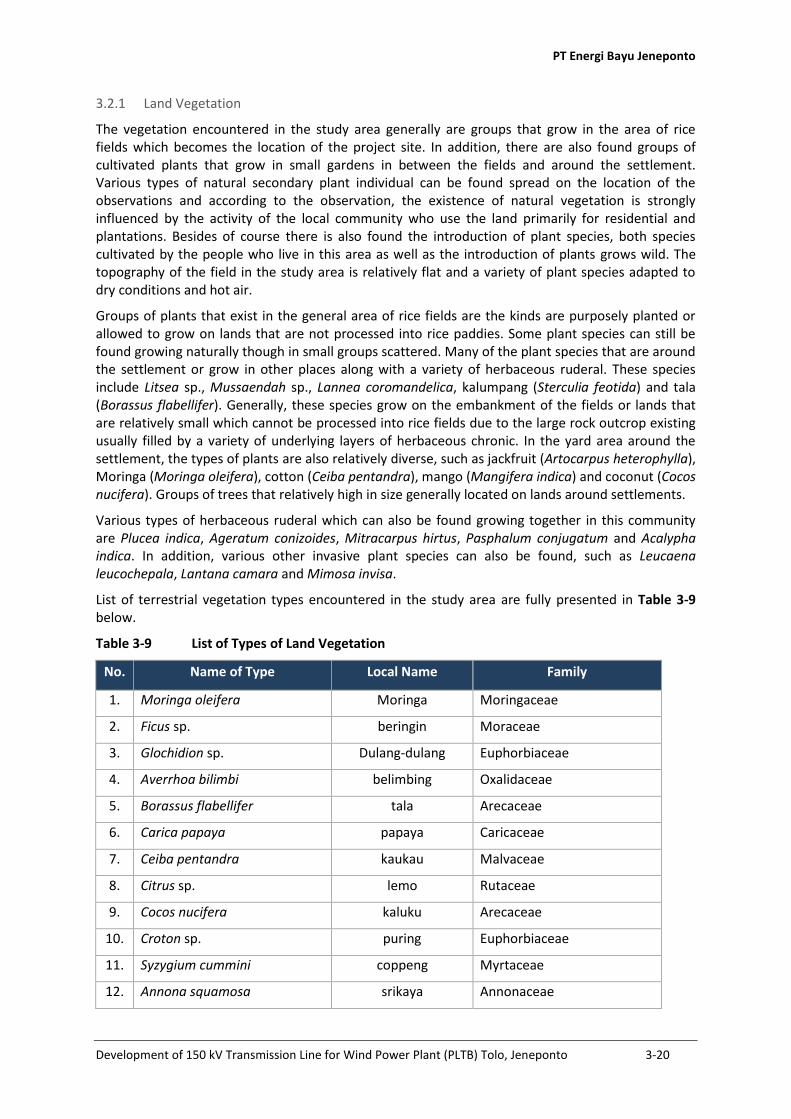
PT Energi Bayu Jeneponto
Development of 150 kV Transmission Line for Wind Power Plant (PLTB) Tolo, Jeneponto 3-20
3.2.1 Land Vegetation
The vegetation encountered in the study area generally are groups that grow in the area of rice
fields which becomes the location of the project site. In addition, there are also found groups of
cultivated plants that grow in small gardens in between the fields and around the settlement.
Various types of natural secondary plant individual can be found spread on the location of the
observations and according to the observation, the existence of natural vegetation is strongly
influenced by the activity of the local community who use the land primarily for residential and
plantations. Besides of course there is also found the introduction of plant species, both species
cultivated by the people who live in this area as well as the introduction of plants grows wild. The
topography of the field in the study area is relatively flat and a variety of plant species adapted to
dry conditions and hot air.
Groups of plants that exist in the general area of rice fields are the kinds are purposely planted or
allowed to grow on lands that are not processed into rice paddies. Some plant species can still be
found growing naturally though in small groups scattered. Many of the plant species that are around
the settlement or grow in other places along with a variety of herbaceous ruderal. These species
include Litsea sp., Mussaendah sp., Lannea coromandelica, kalumpang (Sterculia feotida) and tala
(Borassus flabellifer). Generally, these species grow on the embankment of the fields or lands that
are relatively small which cannot be processed into rice fields due to the large rock outcrop existing
usually filled by a variety of underlying layers of herbaceous chronic. In the yard area around the
settlement, the types of plants are also relatively diverse, such as jackfruit (Artocarpus heterophylla),
Moringa (Moringa oleifera), cotton (Ceiba pentandra), mango (Mangifera indica) and coconut (Cocos
nucifera). Groups of trees that relatively high in size generally located on lands around settlements.
Various types of herbaceous ruderal which can also be found growing together in this community
are Plucea indica, Ageratum conizoides, Mitracarpus hirtus, Pasphalum conjugatum and Acalypha
indica. In addition, various other invasive plant species can also be found, such as Leucaena
leucochepala, Lantana camara and Mimosa invisa.
List of terrestrial vegetation types encountered in the study area are fully presented in Table 3-9
below.
Table 3-9 List of Types of Land Vegetation
No. Name of Type Local Name Family
1. Moringa oleifera Moringa Moringaceae
2. Ficus sp. beringin Moraceae
3. Glochidion sp. Dulang-dulang Euphorbiaceae
4. Averrhoa bilimbi belimbing Oxalidaceae
5. Borassus flabellifer tala Arecaceae
6. Carica papaya papaya Caricaceae
7. Ceiba pentandra kaukau Malvaceae
8. Citrus sp. lemo Rutaceae
9. Cocos nucifera kaluku Arecaceae
10. Croton sp. puring Euphorbiaceae
11. Syzygium cummini coppeng Myrtaceae
12. Annona squamosa srikaya Annonaceae
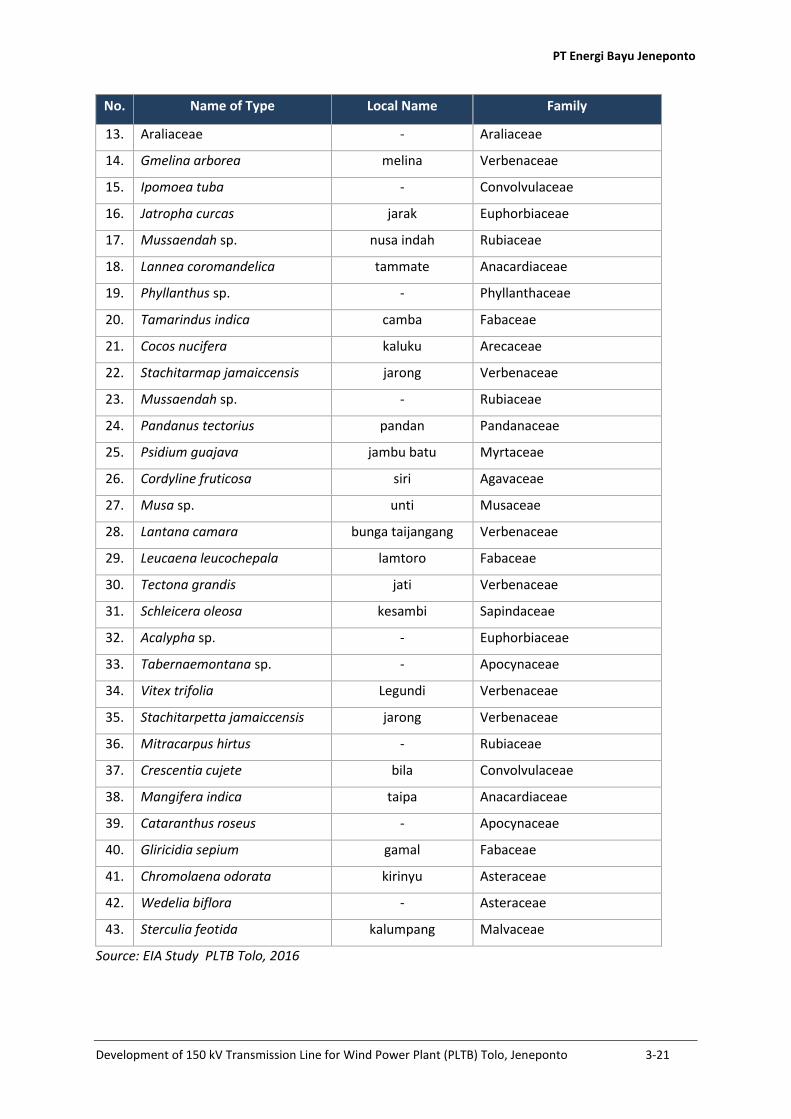
PT Energi Bayu Jeneponto
Development of 150 kV Transmission Line for Wind Power Plant (PLTB) Tolo, Jeneponto 3-21
No. Name of Type Local Name Family
13. Araliaceae - Araliaceae
14. Gmelina arborea melina Verbenaceae
15. Ipomoea tuba - Convolvulaceae
16. Jatropha curcas jarak Euphorbiaceae
17. Mussaendah sp. nusa indah Rubiaceae
18. Lannea coromandelica tammate Anacardiaceae
19. Phyllanthus sp. - Phyllanthaceae
20. Tamarindus indica camba Fabaceae
21. Cocos nucifera kaluku Arecaceae
22. Stachitarmap jamaiccensis jarong Verbenaceae
23. Mussaendah sp. - Rubiaceae
24. Pandanus tectorius pandan Pandanaceae
25. Psidium guajava jambu batu Myrtaceae
26. Cordyline fruticosa siri Agavaceae
27. Musa sp. unti Musaceae
28. Lantana camara bunga taijangang Verbenaceae
29. Leucaena leucochepala lamtoro Fabaceae
30. Tectona grandis jati Verbenaceae
31. Schleicera oleosa kesambi Sapindaceae
32. Acalypha sp. - Euphorbiaceae
33. Tabernaemontana sp. - Apocynaceae
34. Vitex trifolia Legundi Verbenaceae
35. Stachitarpetta jamaiccensis jarong Verbenaceae
36. Mitracarpus hirtus - Rubiaceae
37. Crescentia cujete bila Convolvulaceae
38. Mangifera indica taipa Anacardiaceae
39. Cataranthus roseus - Apocynaceae
40. Gliricidia sepium gamal Fabaceae
41. Chromolaena odorata kirinyu Asteraceae
42. Wedelia biflora - Asteraceae
43. Sterculia feotida kalumpang Malvaceae
Source: EIA Study PLTB Tolo, 2016
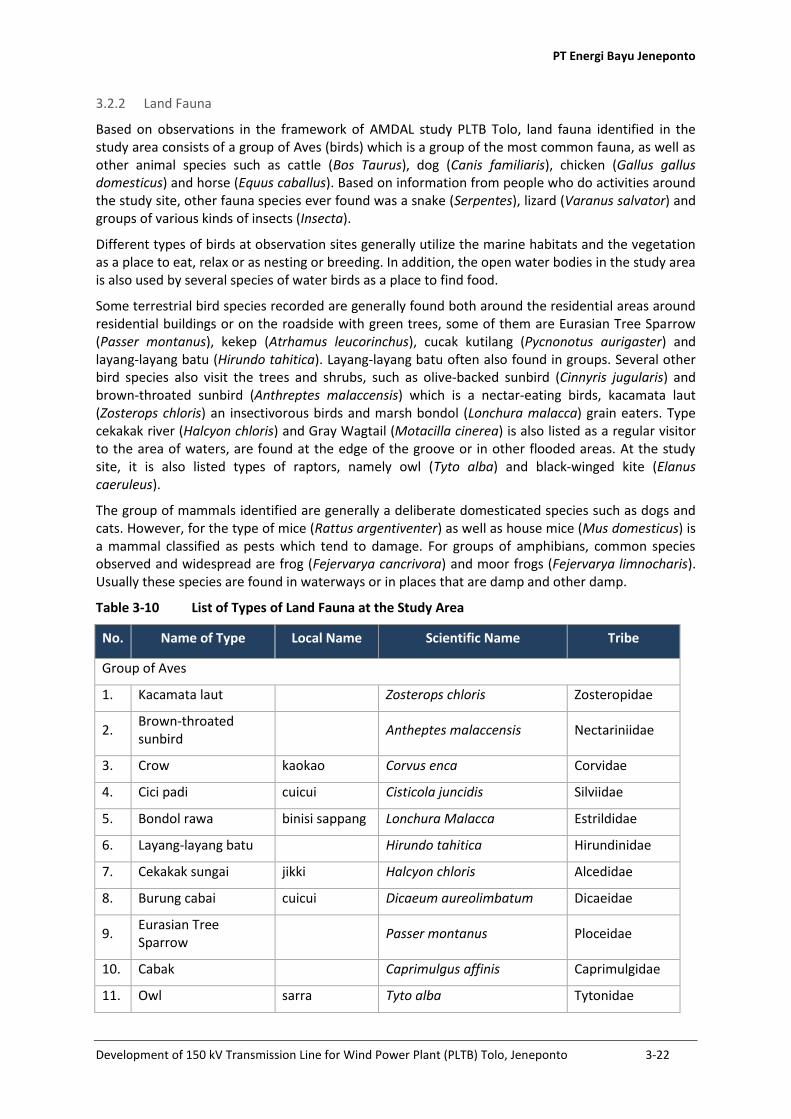
PT Energi Bayu Jeneponto
Development of 150 kV Transmission Line for Wind Power Plant (PLTB) Tolo, Jeneponto 3-22
3.2.2 Land Fauna
Based on observations in the framework of AMDAL study PLTB Tolo, land fauna identified in the
study area consists of a group of Aves (birds) which is a group of the most common fauna, as well as
other animal species such as cattle (Bos Taurus), dog (Canis familiaris), chicken (Gallus gallus
domesticus) and horse (Equus caballus). Based on information from people who do activities around
the study site, other fauna species ever found was a snake (Serpentes), lizard (Varanus salvator) and
groups of various kinds of insects (Insecta).
Different types of birds at observation sites generally utilize the marine habitats and the vegetation
as a place to eat, relax or as nesting or breeding. In addition, the open water bodies in the study area
is also used by several species of water birds as a place to find food.
Some terrestrial bird species recorded are generally found both around the residential areas around
residential buildings or on the roadside with green trees, some of them are Eurasian Tree Sparrow
(Passer montanus), kekep (Atrhamus leucorinchus), cucak kutilang (Pycnonotus aurigaster) and
layang-layang batu (Hirundo tahitica). Layang-layang batu often also found in groups. Several other
bird species also visit the trees and shrubs, such as olive-backed sunbird (Cinnyris jugularis) and
brown-throated sunbird (Anthreptes malaccensis) which is a nectar-eating birds, kacamata laut
(Zosterops chloris) an insectivorous birds and marsh bondol (Lonchura malacca) grain eaters. Type
cekakak river (Halcyon chloris) and Gray Wagtail (Motacilla cinerea) is also listed as a regular visitor
to the area of waters, are found at the edge of the groove or in other flooded areas. At the study
site, it is also listed types of raptors, namely owl (Tyto alba) and black-winged kite (Elanus
caeruleus).
The group of mammals identified are generally a deliberate domesticated species such as dogs and
cats. However, for the type of mice (Rattus argentiventer) as well as house mice (Mus domesticus) is
a mammal classified as pests which tend to damage. For groups of amphibians, common species
observed and widespread are frog (Fejervarya cancrivora) and moor frogs (Fejervarya limnocharis).
Usually these species are found in waterways or in places that are damp and other damp.
Table 3-10 List of Types of Land Fauna at the Study Area
No. Name of Type Local Name Scientific Name Tribe
Group of Aves
1. Kacamata laut Zosterops chloris Zosteropidae
2. Brown-throated
sunbird
Antheptes malaccensis Nectariniidae
3. Crow kaokao Corvus enca Corvidae
4. Cici padi cuicui Cisticola juncidis Silviidae
5. Bondol rawa binisi sappang Lonchura Malacca Estrildidae
6. Layang-layang batu Hirundo tahitica Hirundinidae
7. Cekakak sungai jikki Halcyon chloris Alcedidae
8. Burung cabai cuicui Dicaeum aureolimbatum Dicaeidae
9. Eurasian Tree
Sparrow
Passer montanus Ploceidae
10. Cabak Caprimulgus affinis Caprimulgidae
11. Owl sarra Tyto alba Tytonidae

PT Energi Bayu Jeneponto
Development of 150 kV Transmission Line for Wind Power Plant (PLTB) Tolo, Jeneponto 3-23
No. Name of Type Local Name Scientific Name Tribe
12. Kekep Arthamus leucorhincus Artamidae
13. Decu belang Saxicola caprata Muscicapidae
14. Chicken Phasianidae
15. Puyuh batu Catornix chinensis Megapodidae
16. Olve-backed sunbird cuicui Cinnyris jugularis Nectariniidae
17. Kepundang-sungu Coracina leucopygia Campephagidae
18. Black-winged kite Elanus caeruleus Acciptriidae
19. Tekukur bukkuru Streptopelia chinensis Columbidae
20. Kicuit batu Motacilla cinerea Motacillidae
Group of mammals
21. House mice balao Mus domesticus Muridae
22. Mouse balao Rattus argentiventer Muridae
23. Bat panyiki Chiroptera
24. Dog asu Canis familiaris Canidae
25. Goat bembe Capra hircus Bovidae
26. Squirrel Callosciurus notatus microtis Sciuridae
27. Horse jarang Equus caballus Equidae
28. Cow Bos indicus Bovidae
Group of Amphibians
29. Paddy frog tumpang Fejervarya cancrivora Ranidae
30. Moor frog tumpang Fejervarya limnocharis Ranidae
Group of Reptile
31. Small house lizard cicak Hemidactylus frenatus Geckonidae
32. Gecko tokke Gecko Geckonidae
33. Monitor lizard buncini Eutropis multifasciata Scinoidae
34. Lizard pararang Varanus salvator Varanidae
Source: AMDAL Study PLTB Tolo, 2016
Reptile groups identified in the study area is small house lizard (Hemidactylus frenatus) that is the
most common species of reptiles and found widespread, together with gecko (Gecko gecko) which is
usually found hiding in the house. Similarly, the lizard (Eutropis multifasciata) and monitor lizard
(Varanus salvator) are reptiles that are common and widespread, commonly found in drains or hide
in holes under rocks.
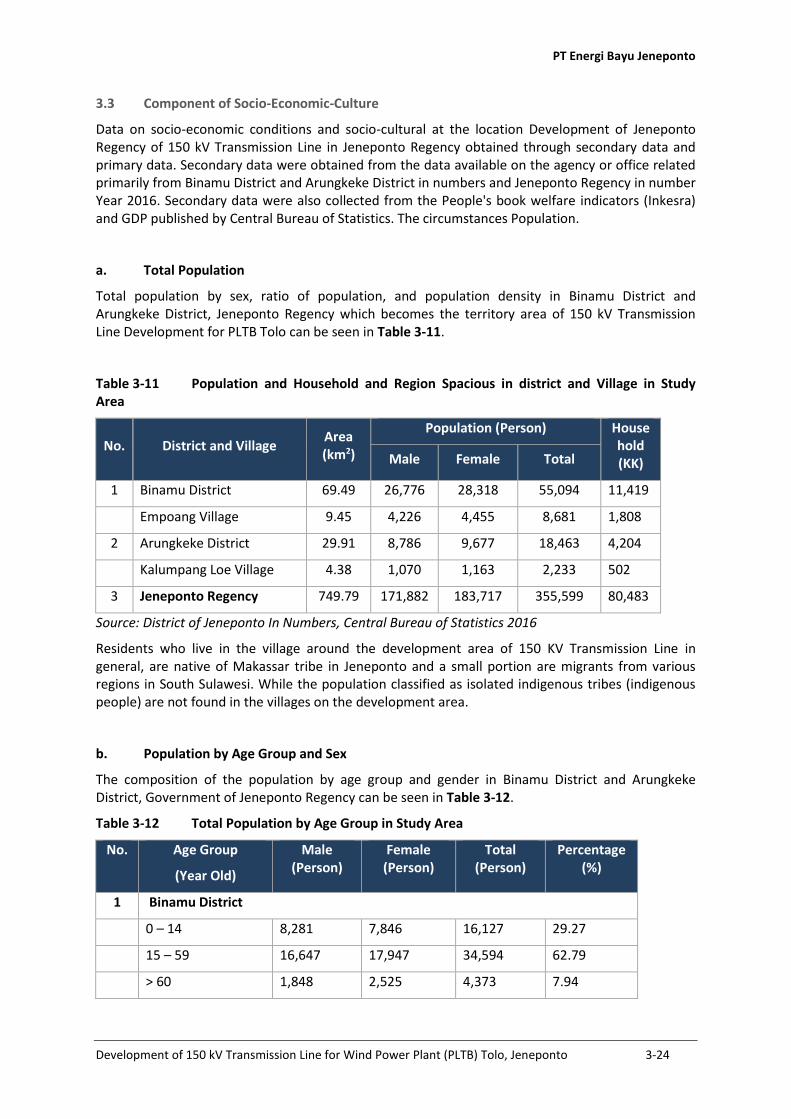
PT Energi Bayu Jeneponto
Development of 150 kV Transmission Line for Wind Power Plant (PLTB) Tolo, Jeneponto 3-24
3.3 Component of Socio-Economic-Culture
Data on socio-economic conditions and socio-cultural at the location Development of Jeneponto
Regency of 150 kV Transmission Line in Jeneponto Regency obtained through secondary data and
primary data. Secondary data were obtained from the data available on the agency or office related
primarily from Binamu District and Arungkeke District in numbers and Jeneponto Regency in number
Year 2016. Secondary data were also collected from the People's book welfare indicators (Inkesra)
and GDP published by Central Bureau of Statistics. The circumstances Population.
a. Total Population
Total population by sex, ratio of population, and population density in Binamu District and
Arungkeke District, Jeneponto Regency which becomes the territory area of 150 kV Transmission
Line Development for PLTB Tolo can be seen in Table 3-11.
Table 3-11 Population and Household and Region Spacious in district and Village in Study
Area
No. District and Village Area
(km2)
Population (Person) House
hold
(KK) Male Female Total
1 Binamu District 69.49 26,776 28,318 55,094 11,419
Empoang Village 9.45 4,226 4,455 8,681 1,808
2 Arungkeke District 29.91 8,786 9,677 18,463 4,204
Kalumpang Loe Village 4.38 1,070 1,163 2,233 502
3 Jeneponto Regency 749.79 171,882 183,717 355,599 80,483
Source: District of Jeneponto In Numbers, Central Bureau of Statistics 2016
Residents who live in the village around the development area of 150 KV Transmission Line in
general, are native of Makassar tribe in Jeneponto and a small portion are migrants from various
regions in South Sulawesi. While the population classified as isolated indigenous tribes (indigenous
people) are not found in the villages on the development area.
b. Population by Age Group and Sex
The composition of the population by age group and gender in Binamu District and Arungkeke
District, Government of Jeneponto Regency can be seen in Table 3-12.
Table 3-12 Total Population by Age Group in Study Area
No. Age Group
(Year Old)
Male
(Person)
Female
(Person)
Total
(Person)
Percentage
(%)
1 Binamu District
0 – 14 8,281 7,846 16,127 29.27
15 – 59 16,647 17,947 34,594 62.79
> 60 1,848 2,525 4,373 7.94
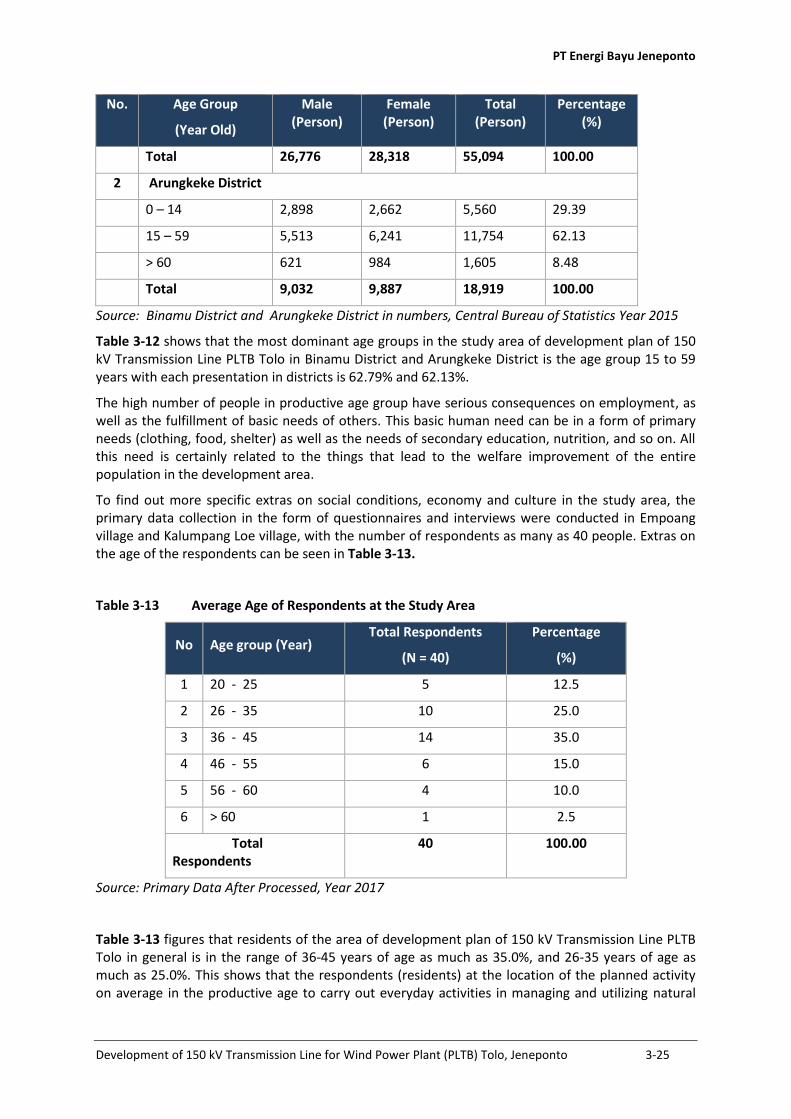
PT Energi Bayu Jeneponto
Development of 150 kV Transmission Line for Wind Power Plant (PLTB) Tolo, Jeneponto 3-25
No. Age Group
(Year Old)
Male
(Person)
Female
(Person)
Total
(Person)
Percentage
(%)
Total 26,776 28,318 55,094 100.00
2 Arungkeke District
0 – 14 2,898 2,662 5,560 29.39
15 – 59 5,513 6,241 11,754 62.13
> 60 621 984 1,605 8.48
Total 9,032 9,887 18,919 100.00
Source: Binamu District and Arungkeke District in numbers, Central Bureau of Statistics Year 2015
Table 3-12 shows that the most dominant age groups in the study area of development plan of 150
kV Transmission Line PLTB Tolo in Binamu District and Arungkeke District is the age group 15 to 59
years with each presentation in districts is 62.79% and 62.13%.
The high number of people in productive age group have serious consequences on employment, as
well as the fulfillment of basic needs of others. This basic human need can be in a form of primary
needs (clothing, food, shelter) as well as the needs of secondary education, nutrition, and so on. All
this need is certainly related to the things that lead to the welfare improvement of the entire
population in the development area.
To find out more specific extras on social conditions, economy and culture in the study area, the
primary data collection in the form of questionnaires and interviews were conducted in Empoang
village and Kalumpang Loe village, with the number of respondents as many as 40 people. Extras on
the age of the respondents can be seen in Table 3-13.
Table 3-13 Average Age of Respondents at the Study Area
No Age group (Year) Total Respondents
(N = 40)
Percentage
(%)
1 20 - 25 5 12.5
2 26 - 35 10 25.0
3 36 - 45 14 35.0
4 46 - 55 6 15.0
5 56 - 60 4 10.0
6 > 60 1 2.5
Total
Respondents
40 100.00
Source: Primary Data After Processed, Year 2017
Table 3-13 figures that residents of the area of development plan of 150 kV Transmission Line PLTB
Tolo in general is in the range of 36-45 years of age as much as 35.0%, and 26-35 years of age as
much as 25.0%. This shows that the respondents (residents) at the location of the planned activity
on average in the productive age to carry out everyday activities in managing and utilizing natural

PT Energi Bayu Jeneponto
Development of 150 kV Transmission Line for Wind Power Plant (PLTB) Tolo, Jeneponto 3-26
resources available, including agricultural resources utilized by citizens as the main livelihood of the
population in the region.
3.3.1 Condition of Socio-Economic
3.3.1.1 Education
According to Director General of Rural Development (1982), education level assessment criteria
based on the number of people who complete primary school and the above levels. Based on that
measure, the level of education can be divided into three categories, namely:
▪ Low education, if the number of people who complete primary school and the above levels
comprise less than or equal to 30% of the population;
▪ Medium education, if the number of people who complete primary school and the above levels
amounted to 30- 60% of the population;
▪ Higher education, where the number of people who complete primary school and the above
levels are more than 60% of the population.
Figu es o the le el of espo de ts’ edu atio i the pla ed a ea of a ti it of T a s issio Line Development for PLTB Tolo is shown in
Level of Respondents Education at the Study Area
No. Level of Education
Total Respondents
(N = 40)
Percentage
(%)
1 No School / Literacy 2 5.0
2 Not completing primary school 4 10.0
3 Elementary School 7 17.5
4 Junior High School 10 25.0
5 Senior High School 16 37.5
6 College / University 2 5.0
Total 40 100.00
Sourcer: Primary Data after Processed, Year 2017
, shows that the respondents education level in the area of 150 KV Transmission Line categorized as
medium education, where the number of respondents who have never attended school or illiteracy
are as many as 2 people or 5.00%, not completing primary school 4 people or 10.0%, completed
Elementary School 7 people, or 17.5%, graduated from Junior High School 10 people or 25.0%,
graduated from Senior High School 16 people or 37.5% academy or college or university 2 or 5.0%.

PT Energi Bayu Jeneponto
Development of 150 kV Transmission Line for Wind Power Plant (PLTB) Tolo, Jeneponto 3-27
Ta le - Total of S hools, Class, Stude ts, Tea he s i Ju io High S hool at the Stud A ea A ade i Yea -
Village and District
School Class Student Teacher
Ratio of
Student/
Teacher
(1) (2) (3) (4) (5) (6)
1. Arungkeke District 2 23 385 51 7.55
Kalumpang Loe Village - - - - -
2. Binamu District 11 102 2,614 251 10.41
Empoang Vilage - - - - -
Source: Binamu District and Arungkeke District in numbers, Central Bureau of Statistics Year 2016
Ta le - Total of S hools, Class, Stude ts, a d Tea he s i Se io High S hool at the Stud A ea A ade i Yea -
Village and District School Class Student Teacher
Ratio of
Student/
Teacher
(1) (2) (3) (4) (5) (6)
1. Arungkeke District 2 12 242 51 4.75
Kalumpang Loe Village - - - - -
2. Binamu District 13 123 3,991 346 11.53
Empoang Village - - - - -
Source: Binamu district and Arungkeke District in numbers, Central Bureau of Statistics Year 2016
Ta le - Total of Stude ts Taki g E a s a d G aduated f o P i a S hool at the Stud A ea A ade i Yea -
Village and District
Took Exam Took Exam
Ma
le
Fe
ma
le
To
tal M
ale
Fe
ma
le
Total
(1) (2) (3) (4) (5) (6) (7)
1. Arungkeke District 235 238 473 235 238 473
Kalumpang Loe Village 16 25 41 16 25 41
2. District Binamu 590 539 1,129 590 539 1,129
Empoang Village 94 108 202 94 08 202
Source: Binamu District and Arungkeke District in Numbers, Central Bureau of Statistics Year 2016
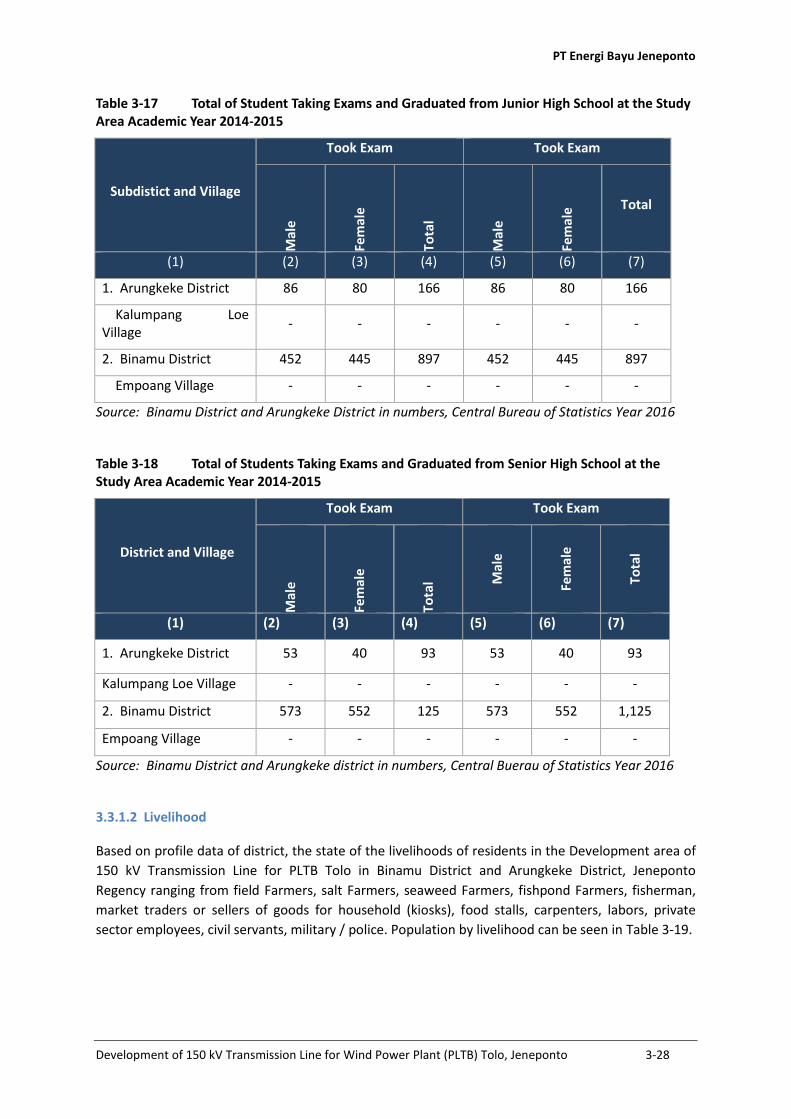
PT Energi Bayu Jeneponto
Development of 150 kV Transmission Line for Wind Power Plant (PLTB) Tolo, Jeneponto 3-28
Ta le - Total of Stude t Taki g E a s a d G aduated f o Ju io High S hool at the Stud A ea A ade i Yea -
Subdistict and Viilage
Took Exam Took Exam
Ma
le
Fe
ma
le
To
tal
Ma
le
Fe
ma
le Total
(1) (2) (3) (4) (5) (6) (7)
1. Arungkeke District 86 80 166 86 80 166
Kalumpang Loe
Village - - - - - -
2. Binamu District 452 445 897 452 445 897
Empoang Village - - - - - -
Source: Binamu District and Arungkeke District in numbers, Central Bureau of Statistics Year 2016
Ta le - Total of Stude ts Taki g E a s a d G aduated f o Se io High S hool at the Stud A ea A ade i Yea -
District and Village
Took Exam Took Exam
Ma
le
Fe
ma
le
To
tal M
ale
Fe
ma
le
To
tal
(1) (2) (3) (4) (5) (6) (7)
1. Arungkeke District 53 40 93 53 40 93
Kalumpang Loe Village - - - - - -
2. Binamu District 573 552 125 573 552 1,125
Empoang Village - - - - - -
Source: Binamu District and Arungkeke district in numbers, Central Buerau of Statistics Year 2016
3.3.1.2 Livelihood
Based on profile data of district, the state of the livelihoods of residents in the Development area of
150 kV Transmission Line for PLTB Tolo in Binamu District and Arungkeke District, Jeneponto
Regency ranging from field Farmers, salt Farmers, seaweed Farmers, fishpond Farmers, fisherman,
market traders or sellers of goods for household (kiosks), food stalls, carpenters, labors, private
sector employees, civil servants, military / police. Population by livelihood can be seen in Table 3-19.

PT Energi Bayu Jeneponto
Development of 150 kV Transmission Line for Wind Power Plant (PLTB) Tolo, Jeneponto 3-29
Ta le - Total of Reside ts Based o Li elihood at the Stud A ea
District Type of Job Person Percentage
(%)
Binamu Civil servants / Police /
Army 2,338 11.51
food farmers 8,057 39.66
Fishpond Farmers,
fisherman, seaweed
farmers.
1,690 8.32
Rancher 1,820 8.96
Traders (kiosks, shops,
restaurants) 3,963 19.51
Transport 596 2.93
Industry / craftsman 638 3.14
Service 1,213 5.97
Total 20,315 100.00
Arungkeke Civil servants / Police /
Army 213 2.43
food farmers 5,555 63.52
Fishpond Farmers,
fisherman, seaweed
farmers.
798 9.13
Rancher 122 1.40
Traders (kiosks, shops,
restaurants) 707 8.08
Transport 581 6.64
Industry / craftsman 377 4.31
Service 392 4.49
Total 8,745 100.00
Source: Binamu District and Arungkeke District in numbers, Central Bureau of Statistics Year 2016
Based on Table 3-19, it is known that the livelihoods of residents in Binamu District are mostly
fishpond farmers amounted to 39.66% and in Arungkeke District is amounting to 63.52%.
Employment as farmers are many hailed by inhabitants of the location of the planned activity of 150
kV Transmission Line Development to PLTB Tolo. This is in line with availability of agricultural land in
the region that is quite extensive, thus people use for food farming (rice and corn) and animal
husbandry (sheep, cattle, buffalo, horses).
To find a more specific figure in two villages, the primary data collection in the form of surveys and
interviews were also conducted to determine the types of livelihoods of residents in Empoang village
and Kalumpang Loe village. Types of livelihood of respondents in these two villages are presented in
Table 3-20.

PT Energi Bayu Jeneponto
Development of 150 kV Transmission Line for Wind Power Plant (PLTB) Tolo, Jeneponto 3-30
Table 3-20 Composition of Residents Based on Livelihood Based on the Results of Survey at
the Study Area
No. Type of Livelihood Total Respondents
(N = 40)
Percentage
(%)
1 Fields Farmers 31 77.5
2 Civil Servants 1 2.5
3 Military/ Police 1 2.5
4 Traders / selling at home 2 5.0
5 Handyman / Labors 2 5.0
6 Entrepreneur 3 7.5
Total Respondents 40 100.00
Source: Primary Data After Processed. February 2017
Table 3-20 shows that the type of livelihood of respondents in the study area in general is rice fields
farmers amounted to 31 people or 77.5%, followed by entrepreneur 3 people or 7.5%, traders /
seller at home 2 people or 5.0%, carpenters and labours 2 people or 5.0%, Civil servants 1 or 2.5%,
and Military / Police 1.0 or 2.5 %.
3.3.1.3 Employment
Residents who are looking for jobs in Jeneponto Regency by education level and sex according to
data from Central Bureau of Statistics (BPS) in 2015, can be seen at Table 3-21 as follows.
Table 3-21 Total of Residents Seeking for Jobs Based on Education and Sex in Jeneponto
District, Year 2016
No. Level of Education Male
(person)
Female
(Person)
Total
(person)
Percentage
(%)
1 Primary school 10 - 10 1.01
2 Junior High School /equal 82 19 101 10.13
3 Senior High School /equal 400 260 660 66.19
4 1-3 Diploma / Baccalaureate 25 40 65 6.52
5 Bachelor degree 90 70 160 16.05
6 Master 1 - 1 0.10
Total 608 389 997 100.00
Source: Jeneponto Regency in Numbers, Central Bureau of Statistics Year 2016
Based on Table 3-21, it shows that the number of people looking for work are still quite high at
around 997 people with a ratio of 608 men and 389 women. Of these, the highest job seeker
population group is with educational background of Senior High School amounted to 660 people or
66.19% of the total number of job seekers, following a Bachelor Degree 160 people or 16.05%,
Junior High School 101 people or 10.13%, Diploma I-3 (vocation school) as many as 65 people or
6.52% and segment of the population included in job seekers as the least is master degree
amounting to1 person or 0.10%.

PT Energi Bayu Jeneponto
Development of 150 kV Transmission Line for Wind Power Plant (PLTB) Tolo, Jeneponto 3-31
3.3.1.4 Economy
a. Gross Regional Domestic Product (PDRB)
Gross Regional Domestic Product (GDP) is one reflection of the economic progress of a region, which
is defined as the total value-added goods and services produced in a year in the area. The size of the
Gross Domestic Product (GDP) of a region is determined by the potential economic resources
owned. Based on the results of 2015 the GDP calculation, the value of GDP at current prices in
Jeneponto Regency is Rp. 6,999,486.3. Jeneponto Regency economic development can be seen from
the performance of the Gross Regional Domestic Product (GDP), which can give figures on the
development of economic fluctuations conjuncture from year to year. GDP in Jeneponto Regency is
as shown in Table 3-22 below.
Table 3-22 Gross Domestic Product (GDP) At Current Market Prices by Industrial in Jeneponto
Regency Year 2013-2015 (million Rupiah)
No Business Field 2013 2014 2015
1 Agriculture, Forestry and Fisheries 2,666,602.5 3,225,618.9 3,626,138.4
2 Mining & Quarrying 107,218.6 144,121.7 182,086.9
3 Processing industry 178,768.2 207,837.6 238,382.1
4 Procurement of Electricity and Gas 8,028.6 8,965.9 7,861.7
5 Water Supply, Waste Management,
Waste and Recycling 4,711.2 5,174.2 5,399.5
6 Construction 488,419.2 553,645.1 642,941.0
7 Wholesale and Retail: Repair Cars and
Motorcycles 622,866.4 682,016.3 796,673.5
8 Transportation and Warehousing 52,843.0 62,559.3 72,914.7
9 Provision of Accommodation and
Food drink 13,674.2 16,251.0 19,019.2
10 Information and Communication 217,758.4 238,477.4 251,192.9
11 Financial Services and Insurance 130,058.4 144,197.3 158,798.1
12 Real estate 132,705.7 144,606.9 170,490.8
13 Company services 1,024.6 1,036.7 1,185.7
14 Administration, Defense and
Compulsory Social Security 381,030.7 425,703.7 484,732.5
15 Educational services 121,051.6 131,513.3 146,812.8
16 Health Services and Social Activities 114,729.0 133,461.1 157,836.9
17 Other services 27,919.2 31,865.4 37,379.5
Total 5,269,409.7 6,157,052.3 6,999,486.3
Source: BPS – PDRB Jeneponto Regency, Year 2016

PT Energi Bayu Jeneponto
Development of 150 kV Transmission Line for Wind Power Plant (PLTB) Tolo, Jeneponto 3-32
b. Local Revenue (PAD)
Based on BPS data in Jeneponto Regency 2016, it is known that the Regional Revenue Budget in
Jeneponto Regency in 2015 is amounted to Rp. 1,044,672,896 - an increase from 2014 which only
reached Rp. 804,412,066 -. The increase comes from local revenue, fund balance and other revenue.
For details of revenue growth in Jeneponto Regency Year 2014 - 2015 are presented in Table 3-23 as
follows.
Table 3-23 Regional Admissions in Jeneponto Regency Year 2014-2015
No Desription Admission/year (000 Rp,-)
2014 2015
1 Regional Revenue Budget 804,412,066 1,044,672,896
2 Local Revenue 46,032,161 61,267,880
3 Balance fund 637,516,658 788,961,673
4 Other income 120,863,247 194,443,343
Source: BPS –Jeneponto Regency in Numbers, Year 2016
c. Population Income Level
The income level of the population in the study area is closely related to the livelihood as the source
of their livelihoods. To determine the level of earned income each month or each year by residents
in the study area, it can be seen from the reflection of respondents' income level. More details on
respondents' income level range can be seen in Table 3-24.
Table 3-24 A e age Esti atio of Respo de ts’ I o e Rate Per Month at the Study Area
No. Income Rate / Month
( Rp. )
Total Repondents Percentage
( N = 40 ) ( % )
1 < 500,000 6 15.0
2 599,000 – 1,000,000 5 12.5
3 1,099,000 – 1,500,000 22 55.0
4 1,599,000 – 2,000,000 5 12.5
5 2,099,000 – 2,500,000 1 2.5
6 2,599,000 – 3,000,000 1 2.5
Total 40 100.00
Source: Primary Data after Processed, February 2017
Table 3-24 shows that income levels of respondents in the study area is more dominant in the range
between Rp. 1,099,000 to Rp. 1,500,000 per month amounted to 22 people or 55.0%, followed by
respondents who earn below Rp 500,000, amounted to 6 people or 12.0% of respondents who earn
Rp. 599,000 to Rp. 1,000,000, 5 people or 12.5%, of respondents who earn Rp. 1,599,000 - Rp.
2,000,000 per month as many as 5 people or 12.5%, and who ear revenue of Rp. 2.099 million and

PT Energi Bayu Jeneponto
Development of 150 kV Transmission Line for Wind Power Plant (PLTB) Tolo, Jeneponto 3-33
Rp 2,500,000 as many as 1 or 2.5%, and who earn Rp. 2,599,0000 - Rp. 3,000,000, as many as 1 or
2.5%. Income earned by the residents at the location of the planned activity in general is earned
from farming activities, especially farming of paddy and maize farming. Based on the survey results
and analysis, farm income can be explained as follows:
▪ Business of rice farming (rainfed), in one harvest a year with a land area of 0.5 ha is able to
generate dry grain around 750-1,000 kg (0.75 tons to 1.00 tons) with a selling price of Rp. 4,000-
4,500 / kg, thus farmers can obtain gross income between Rp. 3,000,000 - Rp. 4,500,000, per
harvest (one harvest) and after deducting farm expenses (cost of land preparation, planting
costs, cost of fertilizer, pesticides, cost of harvesting, land tax = Rp. 1,000,000–Rp. 2,000,000),
thus the net income received by farmers around Rp. 2,000,000 - Rp. 2,500,000 for each one
harvest.
▪ Irrigated rice farming business, in one harvest a year with an area of 0.5 ha of land can produce
about 1,500-1,700 kg (1.5 tons to 1.7 tons) with a selling price of Rp. 4,000-4,500 / kg, thus
farmers can obtain gross income between Rp. 6,000,000 - Rp. 6,800,000, per harvest (one
harvest) and after deducting farm expenses (cost of land preparation, planting costs, cost of
fertilizer, pesticides, harvesting costs, land tax = Rp. 1,000,000 - Rp. 2,000,000), thus net income
earns by farmers around Rp. 4,500,000 - Rp. 5,000,000 for each one harvest.
Table 3-25 Land Area and Utilization in Binamu District and Arungkeke District, Jeneponto Regency
No. District Land Use Area Percentage
(Ha) (%)
1
Binamu District Fields 2.09 30.07
Courtyard - -
Moor 3,28 47.21
Pool / pond 215.7 3.11
Other 1,363.3 19.61
Total 6,949 100.00
2 Arungkeke District Fields 1,870.84 61.87
Courtyard 154.52 5.12
Moor 499.82 16.52
Pool / pond - -
Other 498.64 16.49
Total 3,023.82 100.00
Source: Binamu District, and Arungkeke District in Numbers, Year 2016
Table 3-24 shows that land area and its utilization in Binamu District and Arungkeke District which
became the study site in the development Jeneponto Regency of 150 kV Transmission Line to PLTB
Tolo in general is for agricultural land and fields. In Binamu District, moor area is 3,280 ha (47.21%)
and paddy fields area of 2.09 ha (30.07%), while in Arungkeke District the moor area is 499.82 ha
(16.52%) and field area 1,870.84 ha (61.87%).

PT Energi Bayu Jeneponto
Development of 150 kV Transmission Line for Wind Power Plant (PLTB) Tolo, Jeneponto 3-34
3.3.1.5 Culture
Customs of the people that has been handed down by citizens of Jeneponto and migrants around
the development area of 150 kV Transmission Line in Binamu District and Arungkeke District
includes customs, social processes, attitudes and perceptions. Based on field observations, people
who live permanently or work at the site of development activities, generally are native of
Jeneponto (Makassar tribe) as well as newcomers who work in Binamu District and Arungkeke
District. The language used as an everyday language in this region is the language of Makassar
(Jeneponto) and Indonesian. Therefore, there has been intense social and dynamic process between
locals and immigrants who work and permanently live in the development area of 150 kV
Transmission Line, Jeneponto Regency.
1. Customs
In Makassar tribe Jeneponto culture, there are a number of values and concepts that have a great
effect on the behavior and social interaction of the Makassar ethnic. These values are: Value of
"Tau" (people); value of "Siri" (self-esteem); value of "Pace" (pity); value of "Anginalike" (feeling of
respect) and value of "Pangngadakkang" (customs).
Some fragments of customs that grow in Makassar Tribe Jeneponto community in the past and the
present are still alive, although not carried out in accordance with customary. The fragment of
customary for example is associated with the house, dress code, procedures for communicating,
manners, and traditional ceremonies such as marriage ceremonies, funerals and so forth closely
related to the belief in social system. Customs prevailing in social system of Makassar tribe in
Jeneponto is "Panganga-dakkang", namely norms, standards to act in everyday life. Social
stratification is traditionally a cultural heritage of the ancestors of Makassar tribe of Jeneponto
community.
Social system of Makassar tribe in Jeneponto consists of 3 social strata, each of the "Karaeng"
belonged to the upper class or nobility, "Daeng" including the middle classes, and "To Samara"
belonged to the lower class. In the social structure of stratification mechanistically Makassar tribe
once again adjusted to the changing socio-economic conditions.
Some values of Makassar tribe in Jeneponto was created because it was honoured by the ancestors
in the past as the foundation stone of culture. These values are transferred from generation to
generation with the advice and messages. The advice contained in lontara called "Pasang". "Pasang"
means a testament preserved, which emphasized the necessity and abstinence. People who
maintain it will always be respected in society, whereas those who do not heed will bear the
enormous social sanction. Customs that have been handed down run by Makassar tribe Jeneponto
citizens and the immigrant population in the study area in Binamu District and Arungkeke District is a
culture that has been crystallized in social life. These habits are run in the form of community
activities such as traditional marriage ceremony, completion of Qur'an, Prophet Muhammad's
Birthday, circumcision and death ceremony, it is also customary to determine a good day for
wedding, as well as to start working such as starting to work in the plantation or fields, build house
and build a place of worship or starting a business.
Value of culture that becomes Makassar tribe Jeneponto life grip is "SIRI NAPACCE" (dignity).
Therefore, people of Jeneponto will always uphold character of independent, democratic, honest,
decisive, fighting for truth, justice and partnership in everyday social life. Very strong customary sets
of social lives are generally very close to the religious norms, although each region has a procedure
for the implementation of different customs, but remain united with the values upheld together.

PT Energi Bayu Jeneponto
Development of 150 kV Transmission Line for Wind Power Plant (PLTB) Tolo, Jeneponto 3-35
Table 3-26 The following shows the opinion or perception of society (respondents) regarding the
form of community activities and events that have been made and are common in the development
area of 150 kV Transmission Line to PLTB Tolo.
Ta le - Pe eptio of Co u it A out T aditio al A ti it a d E e ts at the De elop e t A ea De elop e t of kV T a s issio Li e, Je epo to
NO Description Respondents Percentage
( N = 40 People ) ( % )
1 Cooperation activities or mutual
cooperation are still
held:
a. Yes always.
b. Rarely implemented.
27 67,5
13 23,5
2 Community meetings :
a. Often implemented.
b. Rarely implemented.
29 72,5
11 27,5
3 Customs are still run by the
community:
a. Yes, it is still implemented.
b. Rarely implemented.
40 100,00
0 0,00
4 Crimes occur:
a. Yes, often.
b. Very rare.
7 17,5
33 82,5
Source: Primary Data after Processed, February 2017
Table 3-26 shows that social activities such as traditional customs are still conducted by the
community, of which approximately 100.0% of the respondents said that customs are still run by
citizens. Cooperation or gotong royong activities are also still routinely carried out by residents with
a percentage of 67.5 %. A total of 85.0% of respondents said that meetings between people
particularly farmers' groups are still performed in daily life in the development area of 150 kV
Transmission Line for PLTB Tolo, Jeneponto.
Approximately 95.0% of the respondents stated that the criminal acts in this region are very rare
such as a fight between residents, drunkenness and theft. It is described that in this region public life
are still safe and secure from a variety of disorders or problems, thus citizens in this region can carry
out their daily activities in peace. It is also displaying that lives of the people in the study area are
still in a state of peace from a wide variety of disorders or problems, thus it is not surprising that
security and public order are still very well maintained in this region. This is a result of the presence
and role of the police as well as customs rules which have been long agreed by the people in the
region. Customary rules that regulates the rules of life and social order citizens in everyday life, is

PT Energi Bayu Jeneponto
Development of 150 kV Transmission Line for Wind Power Plant (PLTB) Tolo, Jeneponto 3-36
also very helpful in maintaining the tranquility of citizens. The rules and sanctions for breaching of
customs in public life become learning for every citizen not to break the rules that have been
established.
2. Social Process
Social interaction and communication that exists between people around the development area of
150 kV Transmission Line in Empoang village, Binamu District, and Kalumpang Loe Village, Arungkeke
District has manifested itself in the form of social integration. Social process that occurs has been in
place since the beginning until now that has caused the assimilation process (adjustment of attitude
and behaviour) among residents as well as acculturation and accommodation in society.
The creation of accommodation between residents in these villages through various activities
carried out by cooperation and various meetings conducted among residents. Various activities such
as cleaning up the environment, road repairs, culverts, means of religious (mosques, and other
places of worship), clean or beautify the village for the celebration of national days, security
guarding for environmental security patrol and religious activities such as recitation conducted by
community groups in every mosque in the village, implemented by the PKK, Ta'lim Assembly,
mosque youth groups and other youth groups. These activities are medium interaction and
communication between citizens.
In addition, the role of various social institutions that exist in the villages in the development area
such as BPD or LPMK, religious leaders, traditional leaders, and community leaders to encourage
community participation in various activities at the village level also encourage the interaction and
intensive communication between residents. Social integration of the citizens in the development
area was developed from the acculturation of participative cultural system among the local
population and migrants.
3. Attitudes and Perceptions of Community Towards Development of 150 kV Transmission Line
for PLTB Tolo, Jeneponto
a. Socialization of Jeneponto Regency
The socialization activity is an aspect that determines the internalization process and social
adaptation of an idea or ideas to the people. Society knowledge about the development plan of 150
kV Transmission Line can be seen in Table 3-28 below.
Ta le - So iet K o ledge Respo de t a ou d de elop e t a ea a d I fo atio sou e to a ds the De elop e t of kV T a s issio Li e fo PLTB Tolo, Je epo to
NO Description Respondents Percentage
( N = 40 people ) ( % )
1 Do people know about the
development of 150 kV
Transmission Line for PLTB
Tolo , in Jeneponto?
a. Yes, they know.
6 15.0

PT Energi Bayu Jeneponto
Development of 150 kV Transmission Line for Wind Power Plant (PLTB) Tolo, Jeneponto 3-37
b. They do not know. 34 85.0
2 Information Source of
Jeneponto Regency
a. Village Head / District
b. Proponent of PT. EBJ
c. Department and relevant
agencies. Jeneponto Regency
d. other residents
2 5.0
3 7.5
1 2.5
0 0
Source: Primary Data after Processed, February 2017
Table 3-27 shows that most respondents (85.0%) do not know the development plan of 150 kV
Transmission Line for PLTB Tolo, Jeneponto. Generally, respondents only know the development
plan of PLTB Tolo, while at the same times only few respondents know about the development plan
of 150 kV Transmission Line. Communities or respondents who were aware of 150 kV Transmission
Line Development obtain information from the Village Head and Head of Administration district is
about 5.0%, from Proponent of PT. Energi Bayu Jeneponto is 7.5%, and the local government
agencies Jeneponto Regency is 2.5%. Based on these survey results, it is considered necessary that
PT. EBJ as the Project Proponent explaining the development plan of 150 kV transmission line to the
people in the villages around the development area of 150 kV Transmission Line for PLTB Tolo,
Jeneponto.
b. Attitude and Perception of Public Towards Development of 150 kV Transmission Line Jeneponto
District
The development plan of 150 kV Transmission line for PLTB Tolo, Jeneponto incur various opinions
and perceptions form the community such as worried about the disruption of comfort and
tranquility amenitas caused by construction activities, as well as the land acquisition feared to be
detrimental to society. In addition, there are also concerns about the disruption of people's
livelihood as farmers, that may impact social unrest around the site and generate negative
perception towards the development plan.
Table 3-28 below shows a variety of public perceptions on the development plan of 150 kV
Transmission Line for PLTB Tolo, Jeneponto.
Ta le - Attitudes a d Pu li Pe eptio Respo de ts A ou d the de elop e t a ea of KV T a s issio Li e, Je epo to Rege
NO Description
Respondent Percentage
( N = 40
People ) ( % )
1 Attitudes and public perceptions towards Jeneponto
Regency of 150 kV Transmission Line Development for PLTB
Tolo, Jeneponto:
a. Support
b. Not supporting
36 90.0
0 0.0
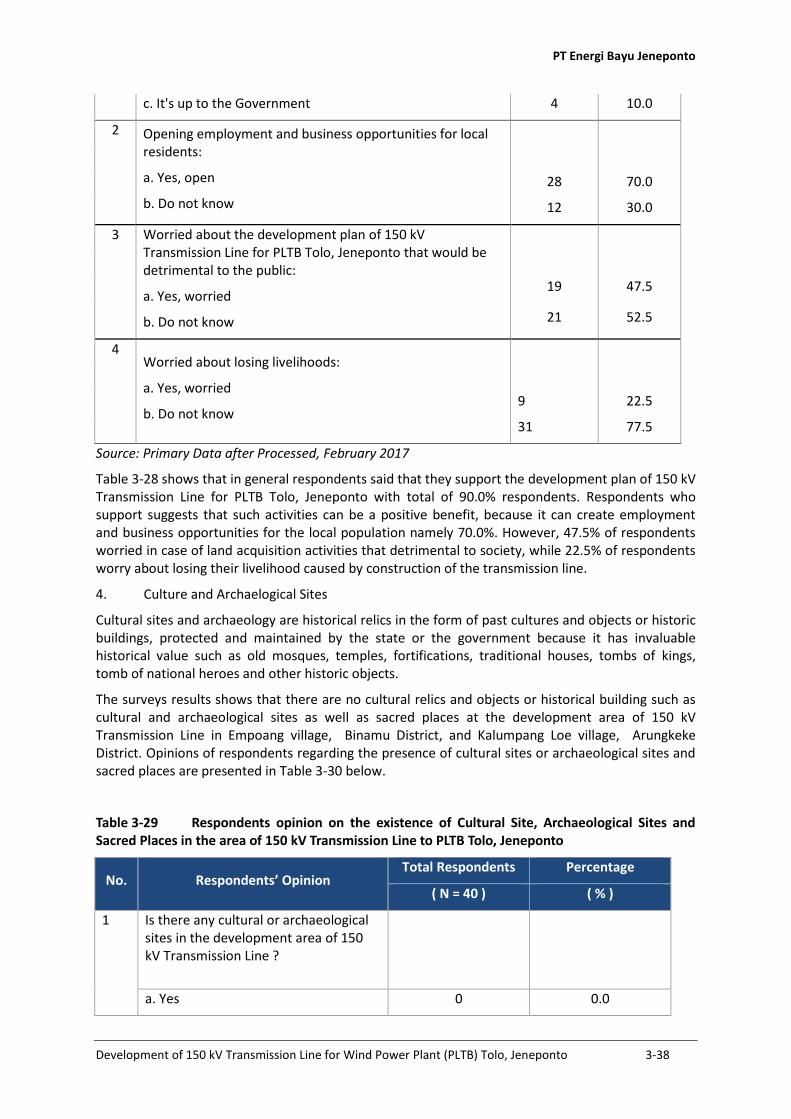
PT Energi Bayu Jeneponto
Development of 150 kV Transmission Line for Wind Power Plant (PLTB) Tolo, Jeneponto 3-38
c. It's up to the Government 4 10.0
2 Opening employment and business opportunities for local
residents:
a. Yes, open
b. Do not know
28 70.0
12 30.0
3 Worried about the development plan of 150 kV
Transmission Line for PLTB Tolo, Jeneponto that would be
detrimental to the public:
a. Yes, worried
b. Do not know
19 47.5
21 52.5
4 Worried about losing livelihoods:
a. Yes, worried
b. Do not know
9 22.5
31 77.5
Source: Primary Data after Processed, February 2017
Table 3-28 shows that in general respondents said that they support the development plan of 150 kV
Transmission Line for PLTB Tolo, Jeneponto with total of 90.0% respondents. Respondents who
support suggests that such activities can be a positive benefit, because it can create employment
and business opportunities for the local population namely 70.0%. However, 47.5% of respondents
worried in case of land acquisition activities that detrimental to society, while 22.5% of respondents
worry about losing their livelihood caused by construction of the transmission line.
4. Culture and Archaelogical Sites
Cultural sites and archaeology are historical relics in the form of past cultures and objects or historic
buildings, protected and maintained by the state or the government because it has invaluable
historical value such as old mosques, temples, fortifications, traditional houses, tombs of kings,
tomb of national heroes and other historic objects.
The surveys results shows that there are no cultural relics and objects or historical building such as
cultural and archaeological sites as well as sacred places at the development area of 150 kV
Transmission Line in Empoang village, Binamu District, and Kalumpang Loe village, Arungkeke
District. Opinions of respondents regarding the presence of cultural sites or archaeological sites and
sacred places are presented in Table 3-30 below.
Ta le - Respo de ts opi io o the e iste e of Cultu al Site, A haeologi al Sites a d Sa ed Pla es i the a ea of kV T a s issio Li e to PLTB Tolo, Je epo to
No. Respo de ts’ Opi io Total Respondents Percentage
( N = 40 ) ( % )
1 Is there any cultural or archaeological
sites in the development area of 150
kV Transmission Line ?
a. Yes 0 0.0

PT Energi Bayu Jeneponto
Development of 150 kV Transmission Line for Wind Power Plant (PLTB) Tolo, Jeneponto 3-39
b. No 40 100.0
2 Is there any sacred places along the
development area of 150 kV
Transmission Line ?
a. Yes 0 0
b. No 40 100.0
Source: Primary Data after Processed, February 2017
Table 3-29 shows that there are no cultural sites and archaeological sites as well as sacred places
around the development area of 150 kV Transmission Line.
3.3.1.6 Public Health
Public health is a physical endurance and mental condition of a community in a particular area for
which the implementation and the interaction between behaviours becomes a mirror of the habits
of life, with the quality of environmental health. While environmental health is a condition of the
various environmental media (air, water, ground, food, humans, and disease vectors) that are
reflected in the physical, biological and chemical, and environmental quality parameters affecting
public health.
For displaying the potential magnitude of the impact and relevance (associations) between
environmental parameters with the public exposed, then the approach of Impact Analysis of
Environmental Health, which display measurement conditions at the source, medium emission /
ambient, public exposure (biomarkers), and impact interactions (prevalence and incidence of the
disease, the incidence of food poisoning, and accidents) is used.
1. Estimated environmental parameters affected by the development plan and the effect on
public health
Identification of impact is done through an assessment of the impact to environmental parameters
(physical, biological, social) that are likely to be a variety of issues relating to public health issues.
Assessment to physical environmental parameters primarily aimed at matters relating to the
potential spread of contaminants in environmental media (air, water, and food vectors). This
assessment is used to perform measurement of environmental parameter of water quality and air
quality around the site in accordance with the results of the scoping process at any stage of the
development plan.
a. Process and Potential for Exposure
Assessment of the networks of exposure that may occur (in the future) is carried from the source,
transport media, the point of exposure, exposure means, and the population exposed / receptor.
Ratings are also important to the dynamics (transport mechanism) pollutants either gas, liquid, or
particles in a medium (environment) specific and spreading.
Sources include the impact of the whole plan of activities that have an impact either directly or
indirectly to public health. For example, the public health impact that may occur as a result of
environmental degradation in the form of rising levels / concentrations of dust (particulate matter)
in the air on construction activity or material mobilization.
Media of transport from pollutants dust (particulate matter) is air. The measurement of air quality,
one of which is a parameter of dust (particulate matter) at the points of exposure / contact with the

PT Energi Bayu Jeneponto
Development of 150 kV Transmission Line for Wind Power Plant (PLTB) Tolo, Jeneponto 3-40
residents, especially the affected communities. Therefore, the mechanism / means of dust exposure
to humans mainly through the respiratory tract (inhalation) and did not rule out also by means of
direct contact on food / drinks and go through the digestive tract (oral), then the next calculation is
Risk Analysis of Environmental Health (ARKL) to each type of intake (intake) either by breathing
(inhalation) or gastrointestinal (oral).
b. Potential impact of disease (morbidity and mortality)
As a description of baseline associated with morbidity, Table 3-31 below presents a list of ten major
diseases in Puskesmas Binamu 2015.
Ta le - Data of te ajo diseases i Bi a u Dist i t Puskes as Je epo to Rege
No. Code ICD X Type of Desease Total (Person) Percentage
(%)
1 J00 - J01 Upper respiratory tract
infections more acute 2,413 25.02 J05 - J06
2 J10 – J11 Influenza 1,579 16.37
3 L20 – L30 Dermatitis and eczema 1,231 12.77
4 M05 Rheumatism 769 7.97
5 K29.0 Gastritis 699 7.25
6 A09.1
Diarrhea and gastroenteritis
caused by certain infection
(colitis infection)
654 6.78
7 I10 Essential hypertension
(primary) 605 6.27
8 R51 Headache 568 5.89
9 M79 Other soft tissue disorders, 567 5.88
10 R50 Unexplained fever morbidly 558 5.79
Total 9,643 100,00
Source: SP2TP Puskesmas Binamu, 2016
Description regarding common diseases suffered by the respondent at the location of the planned
construction of 150 kV Transmission Line to PLTB Tolo, Jeneponto in the period of the last 6 months
are presented in Table 3-32 below.
Ta le - Co o Diseases Suffe ed Reside ts i the Last Mo ths i the de elop e t a ea of kV T a s issio Li e to PLTB Tolo, Je epo to
No. Disease Symtoms Respondents Percentage
(N = 40) ( % )
1 Fever 10 25.0

PT Energi Bayu Jeneponto
Development of 150 kV Transmission Line for Wind Power Plant (PLTB) Tolo, Jeneponto 3-41
2 Influenza 6 15.0
3 Itchy 3 7.5
4 Coughs 6 15.0
5 Diarrhea 3 7.5
6
Other (ambient,
hypertension,
rheumatism, etc.)
12 30.0
Total Respondents 40 100.0
Source: Primary Data after Processed, February 2017
Table 3-31 gives an indication that the pattern of disease that often affects people around
development area of 150 kV Transmission Line for PLTB Tolo, Jeneponto is fever (25.0%), influenza
(15.0%), itchy (7.5%), cough (15.0%), and diarrhea (7.5%), as well as other diseases 30.0%. The cause
of the disease that is often suffered by people around is due to weather conditions and poor
environmental influences that are not clean, nor because of the job as farmers / planters that are
usually prone to disease like itchy.
c. Specific characteristics of the population at risk
Residents in the development area of 150 kV Transmission Line to PLTB Tolo, Jeneponto were at risk
to be affected by various development activities undertaken. Residents who are at risk in this study
can be categorized into three groups, namely: (a) the total population in general, which is in the
development area, (b) risk population (at risk), the population potentially at risk affected by
development because they are around the development area on a specific radius, (c) high-risk
population (high-risk group), namely the right of the population to be or close to the development
area.
Specific characteristics of the population at risk for development impacts include: gender, age,
occupation, socioeconomic status, place of residence, length of residence, family size, etc.
Gender is associated with the physiological and biological individuals who become members of the
community / population in the development area of the planned project. This is important because
resistance (immunity) of the body between men and women differ in terms of interaction to a risk of
exposure such as air pollutants, etc.
Age is a common variable (universal) useful in which groups of individuals are exposed to risk factors
in the environment. Age groups that are usually very vulnerable to exposure to contaminants among
others are infants and toddlers, and elderly. Variable of age is very important in making a case report
and reporting of diseases (notifiable diseases).
Job is associated with the escalation of predictor on the individual. It is important to know the
possibility a person to get exposure of a certain risk in the workplace and that it will be exacerbated
in the environment around the project site which is home to the individuals concerned.
Socio-economic status is closely related to the fulfillment of the need for a balanced nutritional
intake. Low socioeconomic status tends to show vulnerability to shortages of nutrition fulfillment
needed by the body so as to be susceptible to health problems caused by lack of the body's defense
mechanism.
Residence, related to activities of daily routine, whether staying home or more working outside the
home. It is closely related to the mechanism of exposure by risk factors such as noise, pollutants in
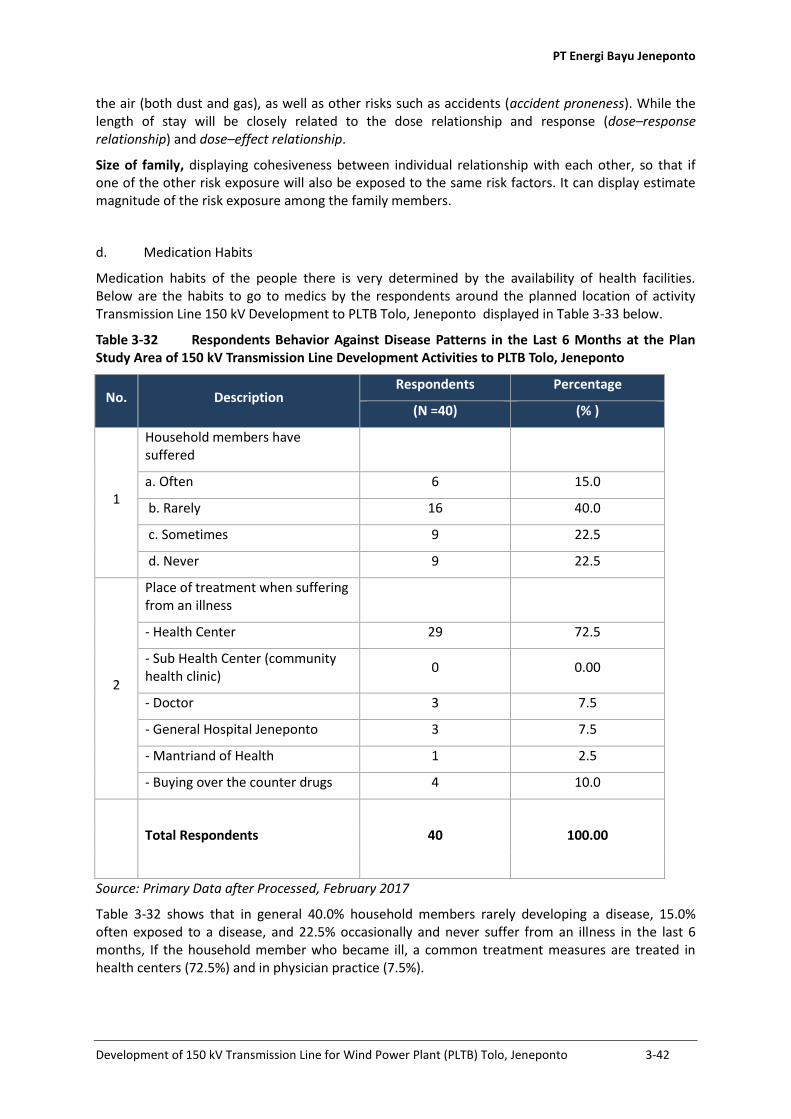
PT Energi Bayu Jeneponto
Development of 150 kV Transmission Line for Wind Power Plant (PLTB) Tolo, Jeneponto 3-42
the air (both dust and gas), as well as other risks such as accidents (accident proneness). While the
length of stay will be closely related to the dose relationship and response (dose–response
relationship) and dose–effect relationship.
Size of family, displaying cohesiveness between individual relationship with each other, so that if
one of the other risk exposure will also be exposed to the same risk factors. It can display estimate
magnitude of the risk exposure among the family members.
d. Medication Habits
Medication habits of the people there is very determined by the availability of health facilities.
Below are the habits to go to medics by the respondents around the planned location of activity
Transmission Line 150 kV Development to PLTB Tolo, Jeneponto displayed in Table 3-33 below.
Ta le - Respo de ts Beha io Agai st Disease Patte s i the Last Mo ths at the Pla Stud A ea of kV T a s issio Li e De elop e t A ti ities to PLTB Tolo, Je epo to
No. Description Respondents Percentage
(N =40) (% )
1
Household members have
suffered
a. Often 6 15.0
b. Rarely 16 40.0
c. Sometimes 9 22.5
d. Never 9 22.5
2
Place of treatment when suffering
from an illness
- Health Center 29 72.5
- Sub Health Center (community
health clinic) 0 0.00
- Doctor 3 7.5
- General Hospital Jeneponto 3 7.5
- Mantriand of Health 1 2.5
- Buying over the counter drugs 4 10.0
40 100.00 Total Respondents
Source: Primary Data after Processed, February 2017
Table 3-32 shows that in general 40.0% household members rarely developing a disease, 15.0%
often exposed to a disease, and 22.5% occasionally and never suffer from an illness in the last 6
months, If the household member who became ill, a common treatment measures are treated in
health centers (72.5%) and in physician practice (7.5%).

PT Energi Bayu Jeneponto
Development of 150 kV Transmission Line for Wind Power Plant (PLTB) Tolo, Jeneponto 3-43
e. Health Resource
Health facilities located in the development area of 150 kV Transmission Line for PLTB Tolo,
Jeneponto should be observed mainly related to the ratio of the number of facilities and the
adequacy of health workers to population. It is important to provide a description about aspects of
health care as one of the factors that contribute to the health status of the communities around the
project site. Description about the facilities and infrastructure of health and medical personnel at
the development area of 150 kV Transmission Line for PLTB Tolo, Jeneponto are presented in Table
3-34 below.
Ta le - Total of health hu a esou es i health e te s i Je epo to Rege
No. Type of Health Manpower Health Centers
Binamu Bontomate'ne Bululoe
1 General Practitioner 4 0 0
2 Dentist 1 1 1
3 Public health 0 2 1
4 Environmental Health 1 0 2
5 Nutrient 3 1 0
6 Midwife 3 5 3
7 Nurse 4 3 9
8 Dentist 2 1 1
9 Pharmacist Assistant 2 1 0
10 Non-Medical Human
Resources 6 4 0
Total 26 18 17
Source: DUK Health Human Resource Jeneponto Regency, Year 2016
3.3.1.7 Environmental Health
Environmental sanitation in the development area of 150 kV Transmission Line for PLTB Tolo,
Jeneponto includes the use of clean water for the needs of drinking water and management of
household waste. In general, respondents utilize clean water sourced from deep wells and dug wells
for drinking, bathing and washing, and partly to obtain clean water from taps (PDAM). Meanwhile,
waste management and household garbage has not been a concern of citizens. For more details
regarding the use of water resources, and the management of household waste can be seen in Table
3-35 and Table 3-36 below.
Ta le - Clea Wate Sou e of Household Respo de ts i the De elop e t A ea of kV T a s issio Li e fo PLTB Tolo, Je epo to
No. Description
Responden
ts Percentage
(N = 40) (%)
1 Clean water sources:

PT Energi Bayu Jeneponto
Development of 150 kV Transmission Line for Wind Power Plant (PLTB) Tolo, Jeneponto 3-44
No. Description
Responden
ts Percentage
(N = 40) (%)
PDAM 11 27.5
Deep well 25 62.5
2
Groundwater / wells 4 10.0
Drinking water is cooked before consumption:
a. Yes 39 97.5
b. No 1 2.5
Source: Primary Data after Processed, February 2017
Ta le - Respo de ts Household Waste Ma age e t i the Pla ed A ea of kV T a s issio Li e De elop e t fo PLTB Tolo, Je epo to
No. Description Respondents Percentage
(N = 40) (%)
1
Places to defecate
- River / farm
a. Yes 4 10.0
b. No 36 90.0
- Own toilet / Public toilet
a. Yes 36 90.0
b. No 4 10.0
2
Landfills (household waste)
a. Polling stations 18 45.0
b. To yards 8 20.0
c. burned 13 32.0
d. throw to the river 1 2.5
Source: Primary Data after Processed, February 2017
Table 3-35 shows that in general the surrounding communities in development area of 150 kV
Transmission Line PLTB Tolo, Jeneponto are still heavily dependent on the use of water from deep
well as much as 62.5% of respondents, and groundwater (shallow wells) (10.0%), Based on the
survey, note also that 27.5% of respondents are already using clean water that comes out of the
taps. Table 3- 36 also displays behavior of residents in disposing household waste and manage
household waste. From the survey, it is known that as much as 10% of respondents still defecate in
any place such as in a vacant lot and the river. However, as much as 90% of respondents already
defecate in private toilets and public toilets. In taking out the trash, some people still throw into
existing yards (20.0%), burning trash (32.0%), and discard into sewers or streams (2.5%).
Respondents who throw garbage into polling stations are approximately 45.0%. This behavior

PT Energi Bayu Jeneponto
Development of 150 kV Transmission Line for Wind Power Plant (PLTB) Tolo, Jeneponto 3-45
reflects the lack of public knowledge about the importance of keeping the environment clean and
healthy, as well as the influence of environmental conditions that allow people to do this activity.
a. Public Nutrition Status
Nutritional status, especially the nutritional status of children under five is very important to be
studied, because it is a very sensitive indicator for measuring the nutritional status of the local
community. Output indicator used to see people's nutritional status of an area is usually by looking
at the status of babies with low birth weight (LBW), malnutrition or undernourishment in the region.
b. Environmental conditions can exacerbate the spread of disease
At the planned project site of 150 kV Transmission Line Development to PLTB Tolo, Jeneponto it is
deemed necessary also to assess a number of environmental conditions that can exacerbate the
spread of disease among others:
1. Residential Conditions
Human settlements that still do not have sanitation facilities, such as clean water supply,
latrines, Waste Water Disposal System (SPAL), and waste management as well as
ventilation and the lighting which do not meet health requirements. Lack of sanitation
coverage can trigger the development of diseases such as diarrhea, dysentery,
abdominal typhoid, skin allergies, skin diseases and itching (pruritis dermatitis) and
others. Such diseases classified into the environment based diseases.
2. Residential Density
Residential density is a measure of the density of houses in a residential area. When the
construction of a house is carried out and made very dense in one unit of space, this is
called over-crowded / high density. With the extremely crowded conditions then when
there is an explosion of infectious diseases, in a relatively short time it will cause
widespread outbreaks (epidemics), as occurred in dengue and diarrheal diseases. The
spread of the disease will go faster by the vector in the region that nest and breed
around settlements especially in the slums.
3. House Density
Crowded condition of the house occupants (over-crowded) is very conducive to the
spread of communicable diseases, either directly or through an intermediary / vector-
borne. If there is one family member is sick, then in a short time it will be transmitted to
other family members such transmission is also referred to as transmission from person
to person (propagated infection).
4. Environmental Hygiene
Environmental hygiene assessment focused on aspects related to waste management,
sanitary excreta disposal and management of waste water which meant that these three
aspects are not nesting site and the growing range of disease vectors such as
mosquitoes, flies, cockroaches and rats.
The existence of vectors in addition to causing disruption can also serve as transmitting
some disease called vector-borne diseases (vector-borne diseases), such as diseases of
the system of the gastrointestinal tract (gastro enteritis) which is spread by flies and
cockroaches, Dengue Haemorrhagic Fever (DHF) are spread by the mosquito Aedes
aegypti and Aedes albopictus lodged in the former vessels containing water, such as
bottled water marks, cans, old tires, etc.
5. Accessibility to Health Facility

PT Energi Bayu Jeneponto
Development of 150 kV Transmission Line for Wind Power Plant (PLTB) Tolo, Jeneponto 3-46
The existence of health facilities near residential areas will determine the success of
efforts to control / prevention of disease and at the same time influence the spread of
the disease in an area. In locations around the development area there is one health
facility that is health centres providing health services to surrounding communities. In
the health care effort, in every village it is also served by health centres (pustu) or village
health post. Access to health services has been found adequate within road access and
public transport links can be utilized by the community. Description of the health
facilities in Jeneponto Regency are presented in Table 3-37.
Ta le - Total of Health Fa ilit i Je epo to Rege Yea
No. Type of Health Facility Total
1 Hospital 1
2 Public Health Center 18
3 Sub Health Center 56
4 Posyandu 469
Source: Regional Statistics Jeneponto Regency, Year 2016
6. Presence of Pollutant Materials in Ambient Air
The composition of ambient air has naturally containing some substances such as
Hydrogen, Oxygen, Nitrogen and some of the content of pollutants such as SOx, NOx,
CO, CO2, Pb, dust (particulate matter), and so on. The levels of these elements in the air
sometimes is high enough to be reckoned with the possibility of increasing
concentrations of these substances in the air with the presence of this project
development activities.

PT Energi Bayu Jeneponto
Development of 150 kV Transmission Line for Wind Power Plant (PLTB) Tolo, Jeneponto 3-47
Map - Lo atio of So io-E o o i Su e fo E i o e t Colo

PT Energi Bayu Jeneponto
Development of 150 kV Transmission Line for Wind Power Plant (PLTB) Tolo, Jeneponto 4-1
4 IMPACT ARISING AND ENVIRONMENTAL MANAGEMENT EFFORTS AND ENVIRONMENTAL
MONITORING EFFORTS
The development 150 kV Transmission Line to PLTB Tolo, Jeneponto in Empoang village and
Kalumpang Loe village is expected to provide some impact on the environment. The impact can be
either positive impact on the environment such as opening up more jobs, and improving the
economy of the community and the availability of energy sources of electricity; as well as the
negative impact of decrease in air quality and increase in the electromagnetic field around the
development area.
The impact identification of the 150 kV Transmission Line development for PLTB Tolo is conducted
on the components activities from the pre-construction, construction, operation and post-operation.
In the discussion of the environmental impact, it also considers the initial environmental setting
based on the collection of primary data and secondary data.
The identification results of the environmental impacts from the development of 150 kV
Transmission Line to PLTB Tolo, Jeneponto, is then compiled to come up with the environmental
management and environmental monitoring efforts to be performed when the activity has already
begun.
The purpose and objectives of the environmental management that will be carried out is to prevent
negative impacts, manage the negative impacts and optimize positive impact.
Purpose and objectives of environmental monitoring efforts that will be carried out is to formulate a
policy in monitoring the behaviour environmental impacts that occur in the context of evaluating the
effectiveness of management that has been done and observing the trend change in the
environmental impacts caused by the presence of the Development of 150 kV Transmission Line for
PLTB Tolo, Jeneponto. Monitoring efforts conducted in order to achieve the expected targets, every
effort of monitoring is necessary to be conducted and measured regularly. In addition to assess the
success of their environmental management, environment monitoring also serves as an early
warning sign for the company if there is something undesirable. Therefore, efforts should be done
precisely in terms of monitoring and systemic periodically.
As part of the UKL-UPL document, this guideline can be used as operational guidelines for
implementation of environmental management and environmental monitoring in accordance with
the legislation in order to maintain the capacity of the environment in the development area of 150
kV Transmission Line for PLTB Tolo, Jeneponto.
On the implementation of environmental management and monitoring efforts, the institution
responsible is as follows.
• Executive: PT Energi Bayu Jeneponto acting as the executor of environmental management
and monitoring efforts. In the operating phase, it is planned that the transmission line will be
managed and becomes the responsibility of PT PLN (Persero), when this is done, then the
implementation of environmental management and monitoring activities of the transmission
line is also the responsibility of PLN.
• Supervisor: Department of the Environment (DLH) Jeneponto Regency will act as a supervisor
in the implementation of environmental management and monitoring by the proponent.
• Reporting: The proponent is obligated to report the implementation of environmental
management and monitoring on a regular basis to the Department of Environment (DLH)
Jeneponto Regency.
Environmental management and monitoring efforts to be made can be seen in Table 4.1.

PT Energi Bayu Jeneponto
Development of 150 kV Transmission Line for Wind Power Plant (PLTB) Tolo, Jeneponto 4-2
Location of management and environmental monitoring can be viewed at Map 4-1.

PT Energi Bayu Jeneponto
Development of 150 kV Transmission Line for Wind Power Plant (PLTB) Tolo, Jeneponto 4-3
Ta le - Mat i of E i o e tal Mo ito i g Effo t a d E i o e tal Mo ito i g Effo t
No Source of
Impact Type of Impact Magnitude of Impact
Environmental Management Efforts Environmental Monitoring Efforts
Institutional
Management
and Monitoring
of Environment Forms of Environmental
Management Program
Location of
Environmental
Management
Period of
Environmental
Management
Forms of
Environmental
Monitoring Program
Environmental
Monitoring
Locations
Period of
Environmental
Monitoring
A. STAGE OG PRE-CONSTRUCTION
1 Land Acquisition Social impact in the
form of civil unrest,
the loss of jobs as
farmers due to
changes in the
function of the land
acquired for the
project area.
The area of land required is
estimated 80,000m2.
In land acquisition, which will
be used for PT Energi Bayu
Jeneponto by forming Land
Acquisition Team.
The acquisition of land by
persuasive approach and
corresponds to current prices
in the district of Jeneponto.
The acquisition of land
involving community leaders
such as traditional leaders,
village and district heads.
The land acquisition is done
by consensus with the
community.
In the
neighborhood
community
around the
development plan
of 150 kV
transmission in
Empoang village,
Binamu District
and Kalumpang
Loe village,
Arungkeke
District.
Management is
done during the
pre-construction
stage of 150 kV
transmission
development
activities.
Carried out interviews
with community
members in respect to
the land to be
released for the
planned 150 kV
transmission line
development
activities in the village
of Kalumpang Loe,
Arungkeke District
and Binamu District.
Direct field
observations
regarding the
presence or absence
of public complaints
against the right to
limit the process of
settlement land for
the development
activity of 150 kV
transmission.
Monitoring sites
located in the
village of
Empoang Binamu
District and
Kalumpang Loe
Arungkeke
District
Monitoring is
conducted 1 (one)
time during the
pre-construction.
Executive:
PT. Energi Bayu
Jeneponto
Supervisor:
DLH Kab
Jeneponto
BPN Jeneponto
Regency,
Binamu District
and Arungkeke
Report receiver:
Environmental
Office Jeneponto
Regency
B. STAGE OF CONSTRUCTION
1 Acceptance of
construction
work manpower
Availability of
employment
Total of workers needed
during construction stage
are 40 people
Prioritizing local workers if
qualified.
In cooperation with the
village chief to announce job
vacancies are transparently
communicated to the
surrounding community.
Collect all the complaints that
arise from the surrounding
communities associated with
the job opportunities.
Providing opportunities for
At the project site
and surrounding
residential namely
Empoang Village,
Binamu District
and Kalumpang
Loe, Arungkeke
District.
Early period of
construction.
Recording and
reporting the number
of people working in
the project.
Recording and
reporting complaints.
At the project
site and
surrounding
residential
namely Empoang
Village, Binamu
District and
Kalumpang Loe
village,
Arungkeke
District.
One time in the
construction
period.
Executive:
PT. Energi Bayu
Jeneponto
Supervisor:
DLH Jeneponto
Regency
Department of
Labor Jeneponto
Regency
Binamu District
and Arungkeke

PT Energi Bayu Jeneponto
Development of 150 kV Transmission Line for Wind Power Plant (PLTB) Tolo, Jeneponto 4-4
No Source of
Impact Type of Impact Magnitude of Impact
Environmental Management Efforts Environmental Monitoring Efforts
Institutional
Management
and Monitoring
of Environment Forms of Environmental
Management Program
Location of
Environmental
Management
Period of
Environmental
Management
Forms of
Environmental
Monitoring Program
Environmental
Monitoring
Locations
Period of
Environmental
Monitoring
local people to open
businesses in or around the
project site.
Report receiver:
Office of
Environment
Jeneponto
Regency
2 Mobilization of
equipment and
materials
Decrease in
ambient air quality.
Increased dust and
noise.
Ambient air quality
standards in accordance
with the South Sulawesi
Governor Regulation No. 69
Year 2010 as follows:
- SO2 = μg/N 3
- CO = . μg/N 3
- NOx = μg/N 3
- TSP = μg /N 3
- P = μg /N 3
- NH3 = 2 ppm
Ambient air quality
standards according to PP
41 1999:
- SO2 = μg/N 3
- CO = . μg/N 3
- NOx = μg/N 3
- TSP = μg /N 3
- P = μg /N 3
- NH3 = 2 ppm
Quality standard of noise
according to Kepmen LH
No. 48 of 1996= 70 dB(A)
Mobilization of heavy
equipment and building
materials is done during the
day so as not to disturb the
residents at night.
Using a vehicle that already
passed the test exam.
Maximizing the number of
vehicles within a certain time
to reduce the decline in air
quality along the road
impassable.
Reducing the particles of dust
at the site by watering roads.
Carrier truck of transmission
equipment and materials
must use the standard
exhaust, so it does not emi
pollution.
Vehicles carrying transmission
equipment and materials
should reduce the speed
when crossing the road in the
neighborhood of residents
Transmission line
construction site.
During
construction
period.
Measurement of the
intensity of the noise
and the ambient air
quality on a regular
basis
Ambient air quality
using a volume
sampler and the
results are tested in
an accredited
laboratory.
Noise: direct
measurements by
Sound Level Meter
Settlement near
Jeneponto PLN
substation and
settlements near
the location of
the substation
PLTB.
One time in the
construction
period.
Executive:
PT. Energi Bayu
Jeneponto
Supervisor:
DLH Jeneponto
Regency
Department of
Transportation
Jeneponto
Regency,
Binamu District
and Arungkeke
Report receiver:
Office of
Environment
Jeneponto
Regency
Traffic disruptions Total transport vehicles per
day on average reached
four trips, with the
transport vehicle reaches a
capacity of 8 tons, for 8
Follow-up drivers who violate
traffic rules in the region and
accelerate the vehicle
exceeds a predetermined
speed limit.
On the road
around the
construction site
of transmission
line.
During the
construction
period
Visual observation On the road
around the
construction site
of transmission
line.
One time in the
construction
period.
Executive:
PT. Energi Bayu
Jeneponto
Supervisor:

PT Energi Bayu Jeneponto
Development of 150 kV Transmission Line for Wind Power Plant (PLTB) Tolo, Jeneponto 4-5
No Source of
Impact Type of Impact Magnitude of Impact
Environmental Management Efforts Environmental Monitoring Efforts
Institutional
Management
and Monitoring
of Environment Forms of Environmental
Management Program
Location of
Environmental
Management
Period of
Environmental
Management
Forms of
Environmental
Monitoring Program
Environmental
Monitoring
Locations
Period of
Environmental
Monitoring
weeks. Provides special officers to
regulate out of the vehicle to
the construction site.
Installing warning light near
the exit sign project site.
Especially the
location of Jalan
Poros Jeneponto-
Takalar and Jalan
Poros Jeneponto-
Malikaji.
Especially the
location of Jalan
Poros Jeneponto-
Takalar and Jalan
Poros Jeneponto-
Malikaji.
DLH Jeneponto
Regency
Department of
Transportation
Jeneponto
Regency,
Binamu District
and Arungkeke
Report receiver:
• Office of
Environment
Jeneponto
Regency
3
Cleaning and
preparing land
Surface water flow
rate increases due
to changes in land
use.
Size of the area exempted
is amounted to 80,000m2
Optimizing the function of the
drainage to prevent
waterlogging due to reduced
infiltration land.
Drainage around
the construction
site of
transmission line.
During the
construction
period.
Visual observation Drainage /
irrigation canals
around the
construction site
of transmission
line.
One time in the
construction
period.
Executive:
PT. Energi Bayu
Jeneponto
Supervisor:
DLH Jeneponto
Regency
Binamu District
and Arungkeke
Report receiver:
• Office of
Environment
Jeneponto
Regency
Changes in
biological
components
Size of the area acquired
for the benefit of the
project is 80,000m2
Carry out green land
replacement planting built.
Around the
construction site
of transmission
line.
During the
construction
period.
Visual observation. Around the
construction site
of transmission
line.
One time in the
construction
period.
Executive:
PT. Energi Bayu
Jeneponto
Supervisor:
DLH Jeneponto
Regency
Binamu District
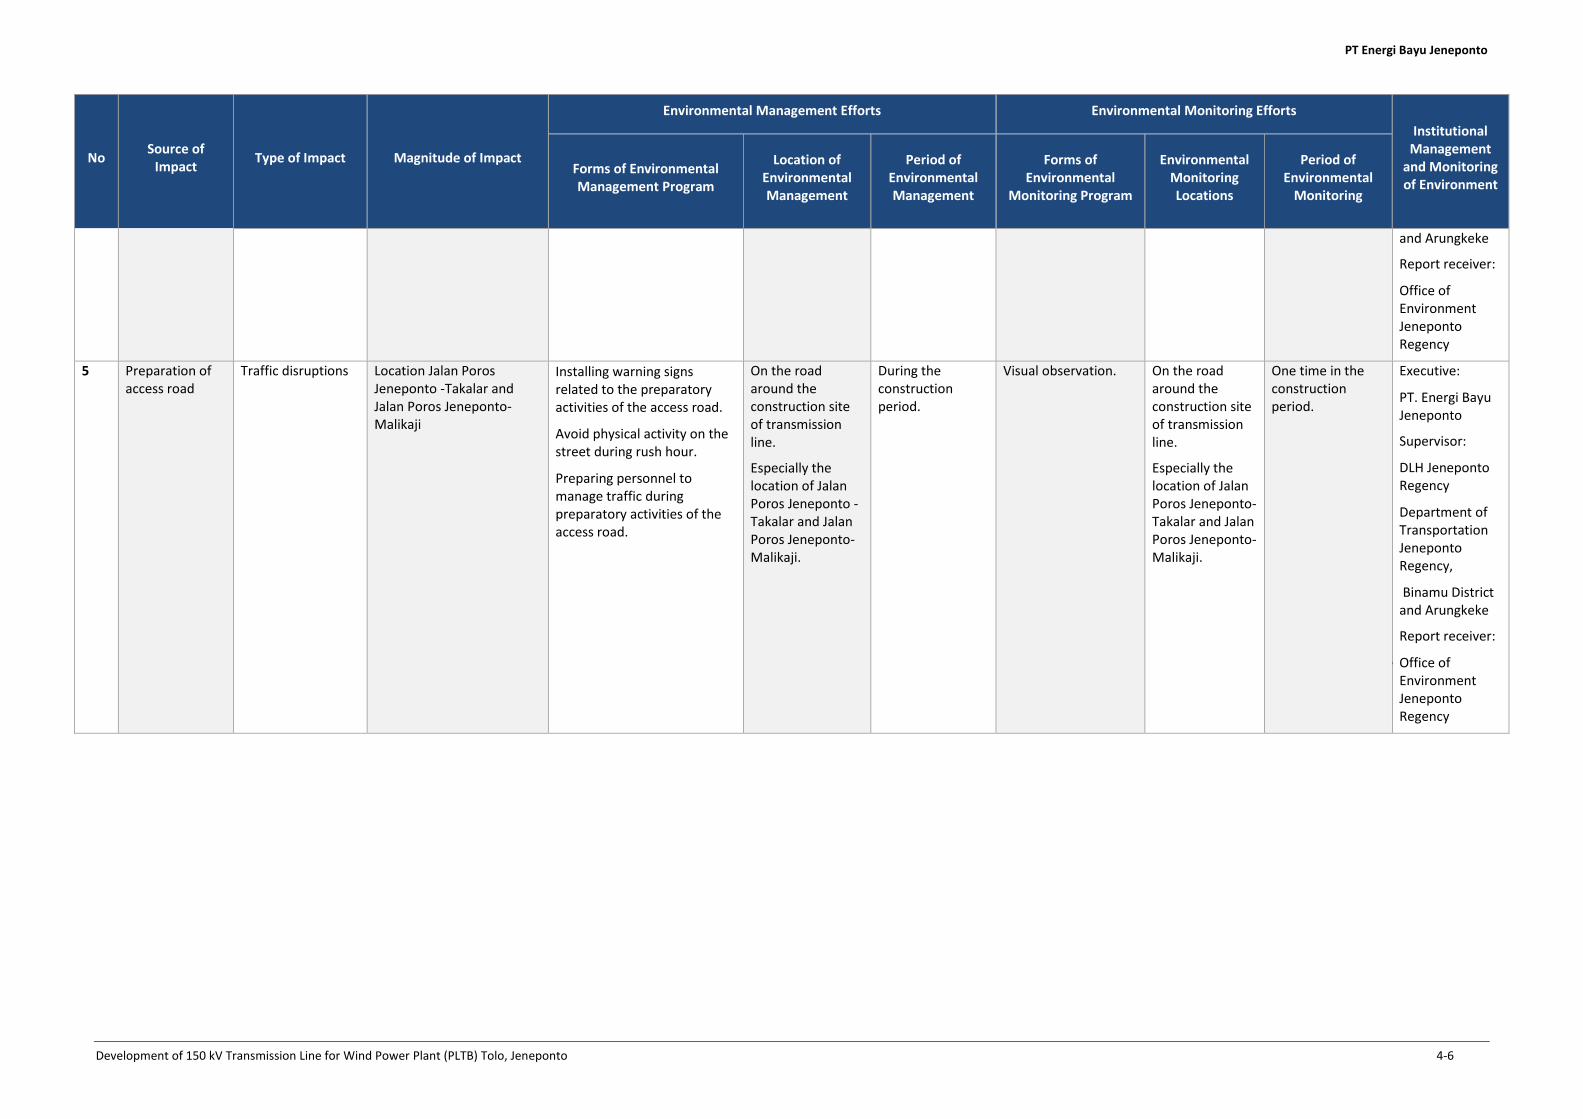
PT Energi Bayu Jeneponto
Development of 150 kV Transmission Line for Wind Power Plant (PLTB) Tolo, Jeneponto 4-6
No Source of
Impact Type of Impact Magnitude of Impact
Environmental Management Efforts Environmental Monitoring Efforts
Institutional
Management
and Monitoring
of Environment Forms of Environmental
Management Program
Location of
Environmental
Management
Period of
Environmental
Management
Forms of
Environmental
Monitoring Program
Environmental
Monitoring
Locations
Period of
Environmental
Monitoring
and Arungkeke
Report receiver:
• Office of
Environment
Jeneponto
Regency
5 Preparation of
access road
Traffic disruptions Location Jalan Poros
Jeneponto -Takalar and
Jalan Poros Jeneponto-
Malikaji
Installing warning signs
related to the preparatory
activities of the access road.
Avoid physical activity on the
street during rush hour.
Preparing personnel to
manage traffic during
preparatory activities of the
access road.
On the road
around the
construction site
of transmission
line.
Especially the
location of Jalan
Poros Jeneponto -
Takalar and Jalan
Poros Jeneponto-
Malikaji.
During the
construction
period.
Visual observation. On the road
around the
construction site
of transmission
line.
Especially the
location of Jalan
Poros Jeneponto-
Takalar and Jalan
Poros Jeneponto-
Malikaji.
One time in the
construction
period.
Executive:
PT. Energi Bayu
Jeneponto
Supervisor:
DLH Jeneponto
Regency
Department of
Transportation
Jeneponto
Regency,
Binamu District
and Arungkeke
Report receiver:
• Office of
Environment
Jeneponto
Regency

PT Energi Bayu Jeneponto
Development of 150 kV Transmission Line for Wind Power Plant (PLTB) Tolo, Jeneponto 4-7
No Source of
Impact Type of Impact Magnitude of Impact
Environmental Management Efforts Environmental Monitoring Efforts
Institutional
Management
and Monitoring
of Environment Forms of Environmental
Management Program
Location of
Environmental
Management
Period of
Environmental
Management
Forms of
Environmental
Monitoring Program
Environmental
Monitoring
Locations
Period of
Environmental
Monitoring
6 Construction of
towers and
transmission line
Increase of noise. Quality standard of noise
according to Kepmen LH
No. 48 1996 = 70 dB (A)
- Activities with a high-intensity
noise done in daylight so as
not to disturb the peace at
night.
- Requiring workers to use
earplugs, especially for jobs
with high noise intensity.
Transmission line
construction site.
During the
construction
period.
Direct measurements
with the Sound Level
Meter
Settlement near
PLN substation
Jeneponto and
settlements near
the location of
the substation
PLTB.
One time in the
construction
period.
Executive:
PT. Energi Bayu
Jeneponto
Supervisor:
DLH Jeneponto
Regency
Binamu District
and Arungkeke
Report receiver:
- Office of
Environment
Jeneponto
Regency
7 Work of
commissioning
Emergence of
electromagnetic
fields.
The quality standard of
electromagnetic field
according to the Ministry of
Health Decree No. 261 of
1998, which is a maximum
of 0.5 mT for all weekdays
and 5 mT in a short time
span (up to 2 hours per
day).
- Install warning signs of the
activities that generate
electromagnetic field of
electricity.
- Install signs of unauthorized
persons to enter the project
area.
Location of
transmission lines
and substation
construction.
At the end of the
construction
period.
Electromagnetic field
measurements.
- Front of
Substation fence
- Central location
of substation
- Below SUTT, 100
m from
substation
- Planned location
of transmission
line, in the
middle
- Sub-Village of
Parepa II,
Empoang Village.
One time at the
end of the
construction
period.
Executive:
PT. Energi Bayu
Jeneponto
Supervisor:
DLH Jeneponto
Regency
Binamu District
and Arungkeke
Report receiver:
- Office of
Environment
Jeneponto
Regency
8. Accidents and
Occupational
Health Problems
Accidents during
the construction
phase
The number of accidents
and safety during
construction activities
Perform K3 program in
accordance with:
- Regulation of the Minister of
Manpower No.Per.01 / MEN /
1980 on K3 in Construction
- Regulation of the Minister of
Manpower No. Per.03 / MEN
/ 1982 on Health Care in the
All transmission
construction work
location
During the
construction
phase
Documenting cases of
accidents and work-
related health
problems
Location of
Transmission line
planned, in the
middle
One time at the
end of the
construction
period.
Executive:
PT. Energi Bayu
Jeneponto
Supervisor:
DLH Jeneponto
Regency
Dinas Tenaga

PT Energi Bayu Jeneponto
Development of 150 kV Transmission Line for Wind Power Plant (PLTB) Tolo, Jeneponto 4-8
No Source of
Impact Type of Impact Magnitude of Impact
Environmental Management Efforts Environmental Monitoring Efforts
Institutional
Management
and Monitoring
of Environment Forms of Environmental
Management Program
Location of
Environmental
Management
Period of
Environmental
Management
Forms of
Environmental
Monitoring Program
Environmental
Monitoring
Locations
Period of
Environmental
Monitoring
Workplace.
- Regulation of the Minister of
Manpower No. Per.05 / MEN
/ 1996 on K3 Management
System in the Workplace.
- Joint Regulation of the
Minister of Manpower and
MenPU No.: Kep. 174 / MEN /
1986 104 / KPTS / 1986 on K3
on Construction Activity Area.
- Implement emergency
response procedures.
Kerja Kab
Jeneponto
Binamu District
and Arungkeke
Report receiver:
• Office of
Environment
Jeneponto
Regency
C. STAGE OF OPERATION
1 Acceptance of
operations
workforce
Opening up
employment
opportunities.
Total manpower needed
during the operation period
is 10 people.
- Prioritizing local workers if
qualified.
- In cooperation with the
village chief to announce job
vacancies transparently open
to the surrounding
community.
- Collect all the complaints that
arise from the surrounding
communities associated with
the open job opportunities.
- Providing opportunities for
local people to open a
business in or around the
project site.
At the project site
and surrounding
residential namely
Village of
Empoang, Binamu
District and village
of Kalumpang Loe,
Arungkeke
District.
Initial period of
operation period.
- Recording and
reporting the number
of workers.
- Recording and
reporting complaints.
At the project
site and
surrounding
residential
namely Village of
Empoang,
Binamu District
and Village of
Kalumpang Loe,
Arungkeke
District.
One time at the
beginning of the
operation period.
Executive:
PT. Energi Bayu
Jeneponto
Supervisor:
DLH Jeneponto
Regency
Department of
Labor Jeneponto
Regency
Binamu District
and Arungkeke
District
Report receiver:
• Office of
Environment
Jeneponto
Regency
2 Operations of
transmission
lines
Emergence of
electromagnetic
fields.
The quality standard of
electromagnetic field
according to the Ministry of
Health Decree No. 261 of
1998, namely a maximum
of 0.5 mT to all weekdays
and 5 mT in a short time
span (up to 2 hours per
- Installing warning signs
showing the activities of
generating electromagnetic
field.
- Install signs of unauthorized
persons to enter the project
area.
The location of
transmission lines
and substation.
During the
operational
phase.
Electromagnetic field
measurements.
- Front of PLN
substation fene
- Central Location
of PLN
Substation
- Under SUTT, 100
m from PLN
Every six months
during the period
of operation.
Executive:
PT. Energi Bayu
Jeneponto
Supervisor:
DLH Jeneponto
Regency

PT Energi Bayu Jeneponto
Development of 150 kV Transmission Line for Wind Power Plant (PLTB) Tolo, Jeneponto 4-9
No Source of
Impact Type of Impact Magnitude of Impact
Environmental Management Efforts Environmental Monitoring Efforts
Institutional
Management
and Monitoring
of Environment Forms of Environmental
Management Program
Location of
Environmental
Management
Period of
Environmental
Management
Forms of
Environmental
Monitoring Program
Environmental
Monitoring
Locations
Period of
Environmental
Monitoring
day). Substation
- Planned location
of transmission
line, in the
middle
- Sub-Village
Parepa of II,
Empoang Village.
Binamu District
and Arungkeke
Report receiver:
• Office of
Environment
Jeneponto
Regency
3. Accidents and
Occupational
Health Problems
Accidents during
operation phase
The number of accidents
and safety during operation
Perform K3 program in
accordance with:
- Regulation of the Minister of
Manpower No.Per.01 / MEN /
1980 on K3 in Construction
- Regulation of the Minister of
Manpower No. Per.03 / MEN
/ 1982 on Health Care in the
Workplace.
- Regulation of the Minister of
Manpower No. Per.05 / MEN
/ 1996 on K3 Management
System at Work.
- Regulation of the Minister of
Manpower and MenPU No.:
Kep. 174 / MEN / 1986 104 /
KPTS / 1986 on K3 on
Construction Activity in the
Area.
- Implement emergency
response procedures.
All transmission
operational work
sites
During the
operating phase
Documenting cases of
accidents and work-
related health
problems
The location of
planned
transmission
lines, in the
middle
Every six months
during the period
of operation.
Executive:
PT. Energi Bayu
Jeneponto
Supervisor:
DLH Jeneponto
Regency
Department of
Labor Jeneponto
Regency
Binamu District
and Arungkeke
Report receiver:
• Office of
Environment
Jeneponto
Regency

PT Energi Bayu Jeneponto
Development of 150 kV Transmission Line for Wind Power Plant (PLTB) Tolo, Jeneponto 4-10
Map - Lo atio of Ma age e t a d Mo ito i g of E i o e t i the Stage of P e-Co st u tio

PT Energi Bayu Jeneponto
Development of 150 kV Transmission Line for Wind Power Plant (PLTB) Tolo, Jeneponto 4-11
Map - Lo atio of Ma age e t a d Mo ito i g of E i o e t i the Stage of Co st u tio
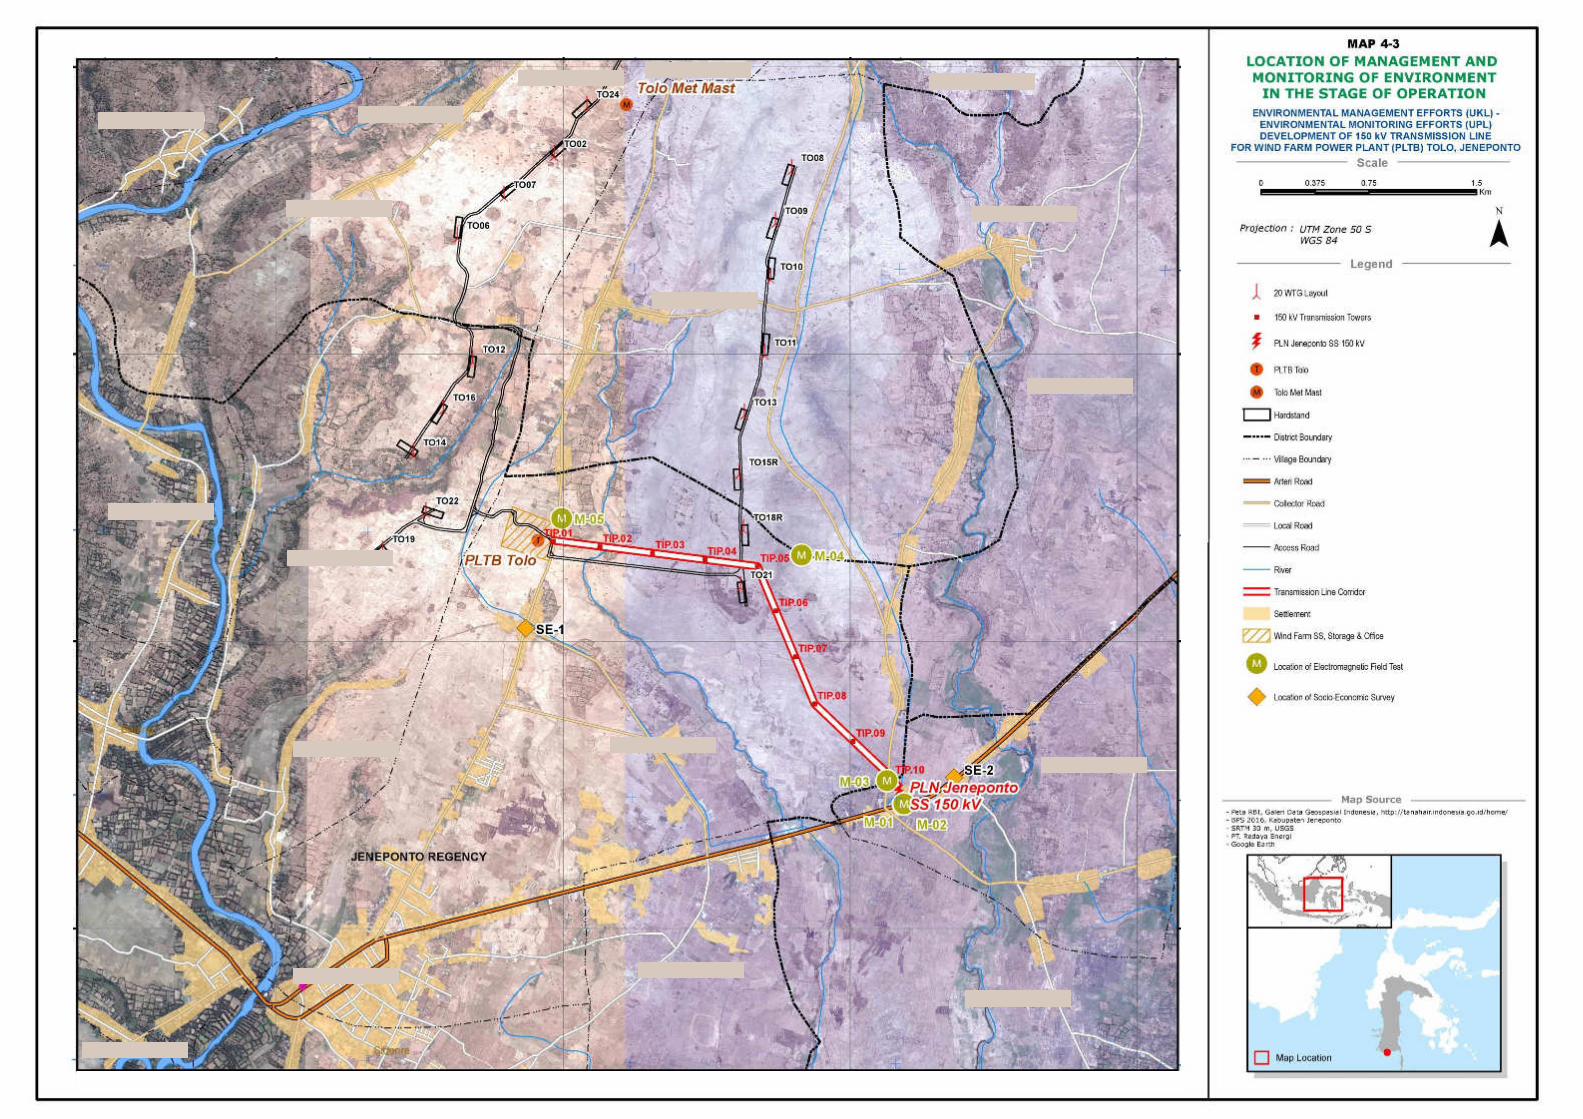
PT Energi Bayu Jeneponto
Development of 150 kV Transmission Line for Wind Power Plant (PLTB) Tolo, Jeneponto 4-12
Map - Lo atio of Ma age e t a d Mo ito i g of E i o e t i the Stage of Ope atio

PT Energi Bayu Jeneponto
Development of 150 kV Transmission Line for Wind Power Plant (PLTB) Tolo, Jeneponto 5-1
5 LICENSE FOR PROTECTION AND ENVIRONMENTAL MANAGEMENT
In regards to the planned activity of Constructing 150 kV Transmission Line for PLTB Tolo, Jeneponto,
until today there has not been a type of protection license and environmental management which
must be fulfilled in addition to environmental permit. However, the initiator will continue to
coordinate with the related party to know the presence of the needs in the future.

PT Energi Bayu Jeneponto
Development of 150 kV Transmission Line for Wind Power Plant (PLTB) Tolo, Jeneponto 6-1
6 STATEMENT LETTER
PT Energi Bayu Jeneponto
Development of 150 kV Transmission Line for Wind Power Plant (PLTB) Tolo, Jeneponto 7-1
7 REFERENCE
• laert. G dan Sri Sumestri Santika, Msc. 1984. Metoda Penelitian Air. Surabaya: Usaha Nasional.
• Bhinnety E., M. Sugiyanto, dan Pudjono M. 1994. Pengaruh Intensitas Kebisingan terhadap
Memori Jangka Pendek, Jurnal Psikologi, XXI, 1, Juni h. 28-38.
• Buku Putih Sanitasi Kabupaten Jeneponto Tahun 2015, Pokja AMPL.
• Deputi Bidang Tata Lingkungan. 2007. Kualitas Udara Memprakirakan Dampak Lingkungan.
Jakarta: Kementerian Negara Lingkungan Hidup.
• Kabupaten Jeneponto Dalam Angka 2016. Badan Pusat Statistik Kabupaten Jeneponto.
• Kecamatan Binamu Dalam Angka 2016. Badan Pusat Statistik Kabupaten Jeneponto.
• Kecamatan Arungkeke Dalam Angka 2016. Badan Pusat Statistik Kabupaten Jeneponto.
• Indikator Kesejahteraan Ekonomi Kabupaten Jeneponto, 2015. Badan Pusat Statistik Kabupaten
Jeneponto.
• Pedoman Mitigasi Dampak Kebisingan Akibat Lalu Lintas Jalan. 2000. Badan Litbang Departemen
Pekerjaan Umum.
• Sarwono, Edhie. 2002. Green Company Pedoman Pengelolaan Lingkungan, Keselamatan dan
Kesehatan Kerja (LK3). Jakarta: PT Astra International Tbk.
• Sasongko, Dwi P. 2000. Kebisingan Lingkungan. Semarang: Badan Penerbit Universitas
Diponegoro Semarang.
• Sawyer, Clair N. 2003. Chemistry for Environmental Engineering and Science 5th edition.
Singapore: Mc. Graw Hill Book Co.

Appendix 17
Terms of Reference for Extended
for Bird and Bat Survey

1
DATED November 2017
TERM OF REFERENCE (TOR) For
Extended Bird and Bats Study for the TOLO 1 Windfarm Project
Jeneponto, South Sulawesi Province - Indonesia
PT. ENERGI BAYU
JENEPONTO
An affiliate of

2
CONTENTS
Contents
1. INTRODUCTION ..................................................................................................................... 3
2. LOCATION AND PROJECT DESCRIPTION ......................................................................... 3
3. SCOPE OF WORKS.................................................................................................................. 4
4. LODGEMENT OF PROPOSALS AND CONTENT ................................................................ 8
5. CONTACT FOR TENDERS ..................................................................................................... 8

3
1. INTRODUCTION
1.1 PT. Energi Bayu Jeneponto (“PT EBJ”) is a Special Project Vehicle (SPV) incorporated and
existing under the laws of Indonesia, which is in turn owned by Equis, an independent
Singapore-based investment fund focussing on energy and infrastructure investments in Asia.
1.2 PT EBJ was established in 2016 with the intention to develop a wind farm in Jeneponto
Regency. The offtaker for the projects will be PLN, a state-owned enterprise.
2. LOCATION AND PROJECT DESCRIPTION
2.1 The project is located in 4 District at Jeneponto Regency, South Sulawesi Province, Indonesia.
All wind turbines and related infrastructure will be located within the boundaries of this regency.
2.2 The project is not located in a forest area, national park nor cultural heritage site.
2.3 The proposed site is located on simple to moderately complex terrain with suitable conditions
for wind farm development. The site’s altitude ranges from 10 to 60 m above sea level.
2.4 The proposed project infrastructure will have a limited physical impact on the site. The required
infrastructure can be divided into 2 main categories:
Electrical infrastructure:
• Wind turbines with estimated total installed capacity of 76 MW.
• Internal collector cabling from the turbines to the pooling substation (overhead,
underground or both) to be constructed along new and existing roads.
• O&M building and site office.
• 150 KV overhead transmission line from pooling substation to existing PLN Jeneponto
substation (overhead).
• Permanent wind monitoring met masts
Civil and other infrastructure (mainly roads and small buildings)
• Internal roads in the wind farm (partially upgrades of existing roads, partially new roads)
• Laydown and storage area
• Some buildngs and staff amenities

4
3. SCOPE OF WORKS
The two-season Bird and Bats Survey has been conducted as part of the ESHIA document completion.
However, these two season Bird and Bats survey need to be extended to capture the following aspect;
a. Survey area
It is understood that the survey location will need to be expanded into surrounding area and
habitat type such as mangrove - coastal area and transmission line located south eastern of the
project site. Please refer to the map on Figure 1 - Proposed Survey Location and Study
undertaken to date as below on Page 6.
b. Survey Duration
The proposed survey duration should be clearly stated in the proposal. The duration should be
determined by the diversity of birds detected at the site. The consultant must make reference to
an anticipated duration of survey effort having regard for appropriate and technically robust
methodology which described in the following section.
c. Survey Methodology (Bird)
line transect surveys should be undertaken to investigate the presence of resident birds in the
area. Line transect locations should be determined by the consultant to detect the presence of
resident birds that may be potentially displaced. Line transect locations should be selected to
achieve survey coverage of Project components within the Project footprint. The following
should aid the selection of location and design of the line transects:
A ground-truthing exercise should be undertaken to confirm landscape features that
have been identified during a desktop. This aids in assessing the suitability of the
pre-planned surveys that will be included in a proposal.
As per good international industry practice, a range of 400m-800m line transects are
allowed to achieve survey coverage of potential habitat that may host nesting,
roosting and feedings sites, such as, for example, linear vegetation features or big
fruiting trees
The locations of the line transects should covers the surrounding mangrove areas
and previously under-studied areas at WTG TO12, TO14, TO16 and the
transmission line alignment.
Concentration Count Sampling: Observations carried out concentrated at a point that is
suspected as a place with high chances of wildlife encounters, example location of availability
of food - water sources and shelter. Observations location was done in locations that predicted
as centre activity of bird.
Observation (Vantage Point) Rapid Assessment: Observation method is area searches that
designed to collect information such as habitat use, breeding activities, migration pathways,
and unusual or unique behavior or observations within the project area not identified during
point counts. These surveys are also useful in assessing areas within and near the project area
such as small riparian zones, wetland areas, and side canyons that may not normally be included
in the above count locations. Area searches provide a more complete species list for the
proposed project area, as rare and more secretive bird species may also be missed during bird
use and breeding songbird counts. Besides collecting bird data, an evaluation of small mammal
species presence, activity levels, and suitable habitat should be conducted and recorded. This
will provide a better understanding of the sites potential prey abundances that may attract and
concentrate raptors into the area. For example, high densities of small mammal burrows or
prairie dog colonies that may not have been recorded during bird counts may be observed during

5
area searches. If a high amount of bird activity is observed during each vantage point
/observation point an increased survey effort may be required.
Mistnet trap: Mist nets have main pockets with functions as bats traps when trapped in nets.
In the net there are 4-5 main pockets. The length of mist nets can be customized based on the
needs e.g. 6 m, 9 m, 12 m, or 18 m, while its width about 2.7 m with the mesh size range 30-32
mm. Mist net will be installed on location for three days with habitat representative approach,
they are paddy field, dry land agriculture and adjacent of paddy field and dry-land agriculture.
Traps has checked on afternoon (12.00 – 14.00) and evening (14.00 – 18.00). The location will
be determined to the location on which the bird flying path is bottlenecked such as area to the
water resource or feeding area that is narrowing.
d. Survey Methodology (Bats)
Bat echolocation surveys to survey for potential bat diversity at present within the WTG blade
sweep heights. It is expected around 2-3 sampling point that will cover the most northern, center
and south of the turbines group to be sufficiently covers this scope.
Observation Method: Field observations with rapid assessment method are aimed to
identifying the bat’s habitat characteristic and potential habitat. Habitat potential of bats is
identified by availability of food sources such as fruit and insects.
Mist net trap: Mist nets have main pockets with functions as bats traps when trapped in nets.
In the net there are 4-5 main pockets. The length of mist nets can be customized based on the
needs e.g. 6 m, 9 m, 12 m, or 18 m, while its width about 2.7 m with the mesh size range 30-32
mm. Sampling will be conducted using purposive method sampling that is installed mist net in
accordance based on habitat difference. Mist net will be installed on numbers of representative
location for three nights with habitat representative approach, i.e. paddy field, dry land
agriculture and adjacent of paddy field and dry-land agriculture. Traps will be checked on the
morning (05.30 – 07.00) and evening (18.00 – 19.00).
e. A total of two reports will be expected to cover the sampling during the construction and
operation phase.
f. The previous two-season Bird and Bats Report are available to be shared with the appointed
consultant under the signatory of the NDA and the distribution will be limited to the scope of
this work.
4. KEY DELIVERABLES
All requirements listed in previous sections shall be met. Where the consultant seeks to deviate they
shall provide a proposal for both the requested approach and the alternate recommended approach(s).
Key deliverables include, but are not limited to:
• A preliminary bird and bats site visit report comprises of the location of sampling, duration,
methodology, and preliminary findings. This report shall be submitted one week after
completion of sampling activities.
• A final report comprises of the complete set of information that gathered during the sampling
and also accurate opinion from the consultant related to the bird and bats information
appropriate to the scope of work and recommendation on the Bird and Bats Monitoring Plan

6
for the Wind Farm Operation. To be submitted one-month after submission of the preliminary
report.
• All report should be provided for both Construction and Operational Phase.
• Applications and supporting documents for necessary permitting from government to perform
the work (if required) and all other related approvals (including HSE approval from employer).
The Consultant shall indicate a review and quality control/assurance process that will be followed to
ensure the quality of the deliverables.
e
5. INDICATIVE TIME TABLE
Activity
2017
(Construction
– wet season)
2018
(construction – Dry sesason)
Nov Dec Jan Feb Mar Apr May Jun July
Contract
sign
Sampling
Preliminary
Report
Final
Report

7
Figure 1 – Proposed Survey Location and Study undertaken to date

8
6. LODGEMENT OF PROPOSALS AND CONTENT
6.1 The Consultant is expected to demonstrate expertise in the field of Bird and Bats Survey, and
have a clear understanding of:
• IFC's Performance Standards and/or ADB Safe Guard Statement and its implications for
this scope of work;
• A track record of Bird and Bats Survey/Assessments in Indonesia, in particular the survey
conducted in the Sulawesi Island will be an advantage.
6.2 The successful bidder is expected to have:
• The appropriate skills and experience to complete the required services in the expected
time period;
• The necessary equipment/tools to conduct the survey. All tools require calibration should
be proofed with the calibration record/certificate.
• The necessary quantity and quality of resources available to complete the services and
documentation to the standards expected;
• The appropriate approach and methodology to adequately and appropriately deal with
the nature of the project;
• Appropriate and sufficient knowledge of the local conditions to be able to effectively
provide the services required;
• A willingness to provide fixed price proposal based on clear milestones.
6.3 The proposal should clearly set out and include the following:
• A detailed understading of consultatn to conduct the work as outlined in the Scope of
Work section
• Details of the timeline to conduct the proposed work
• Proposed expert (including CVs and relevant work experience).
6.4 Proposed work schedule and fixed price schedule in IDR including:
• A proposed work program detailing the main tasks, key steps and time frames;
• Any other considerations relevant to the detailing and finalization of the program; and
• Payments to Consultants based on proposed milestones.
6.5 Any information that the Consultant deems to be relevant and not available yet as well as the
proposed method of obtaining such information.
7. CONTACT FOR INQUIRIES
7.1 The Contact Officer for this TOR is and all enquiries in relation to it must be in writing and
directed to: