environmental chapter outline history, politics ... - … · chapter outline conservation and ......
TRANSCRIPT
CHAPTER OUTLINE
■ Conservation and Preservation
of Resources p. 48
■ Environmental History p. 49
■ Environmental Legislation p. 57
■ Environmental Economics p. 60
■ Case Study: Environmental Problems
in Central and Eastern Europe p. 66
Environmental History, Politics, and Economics
3OLD-GROWTH FORESTS
OF THE PACIFIC NORTHWEST
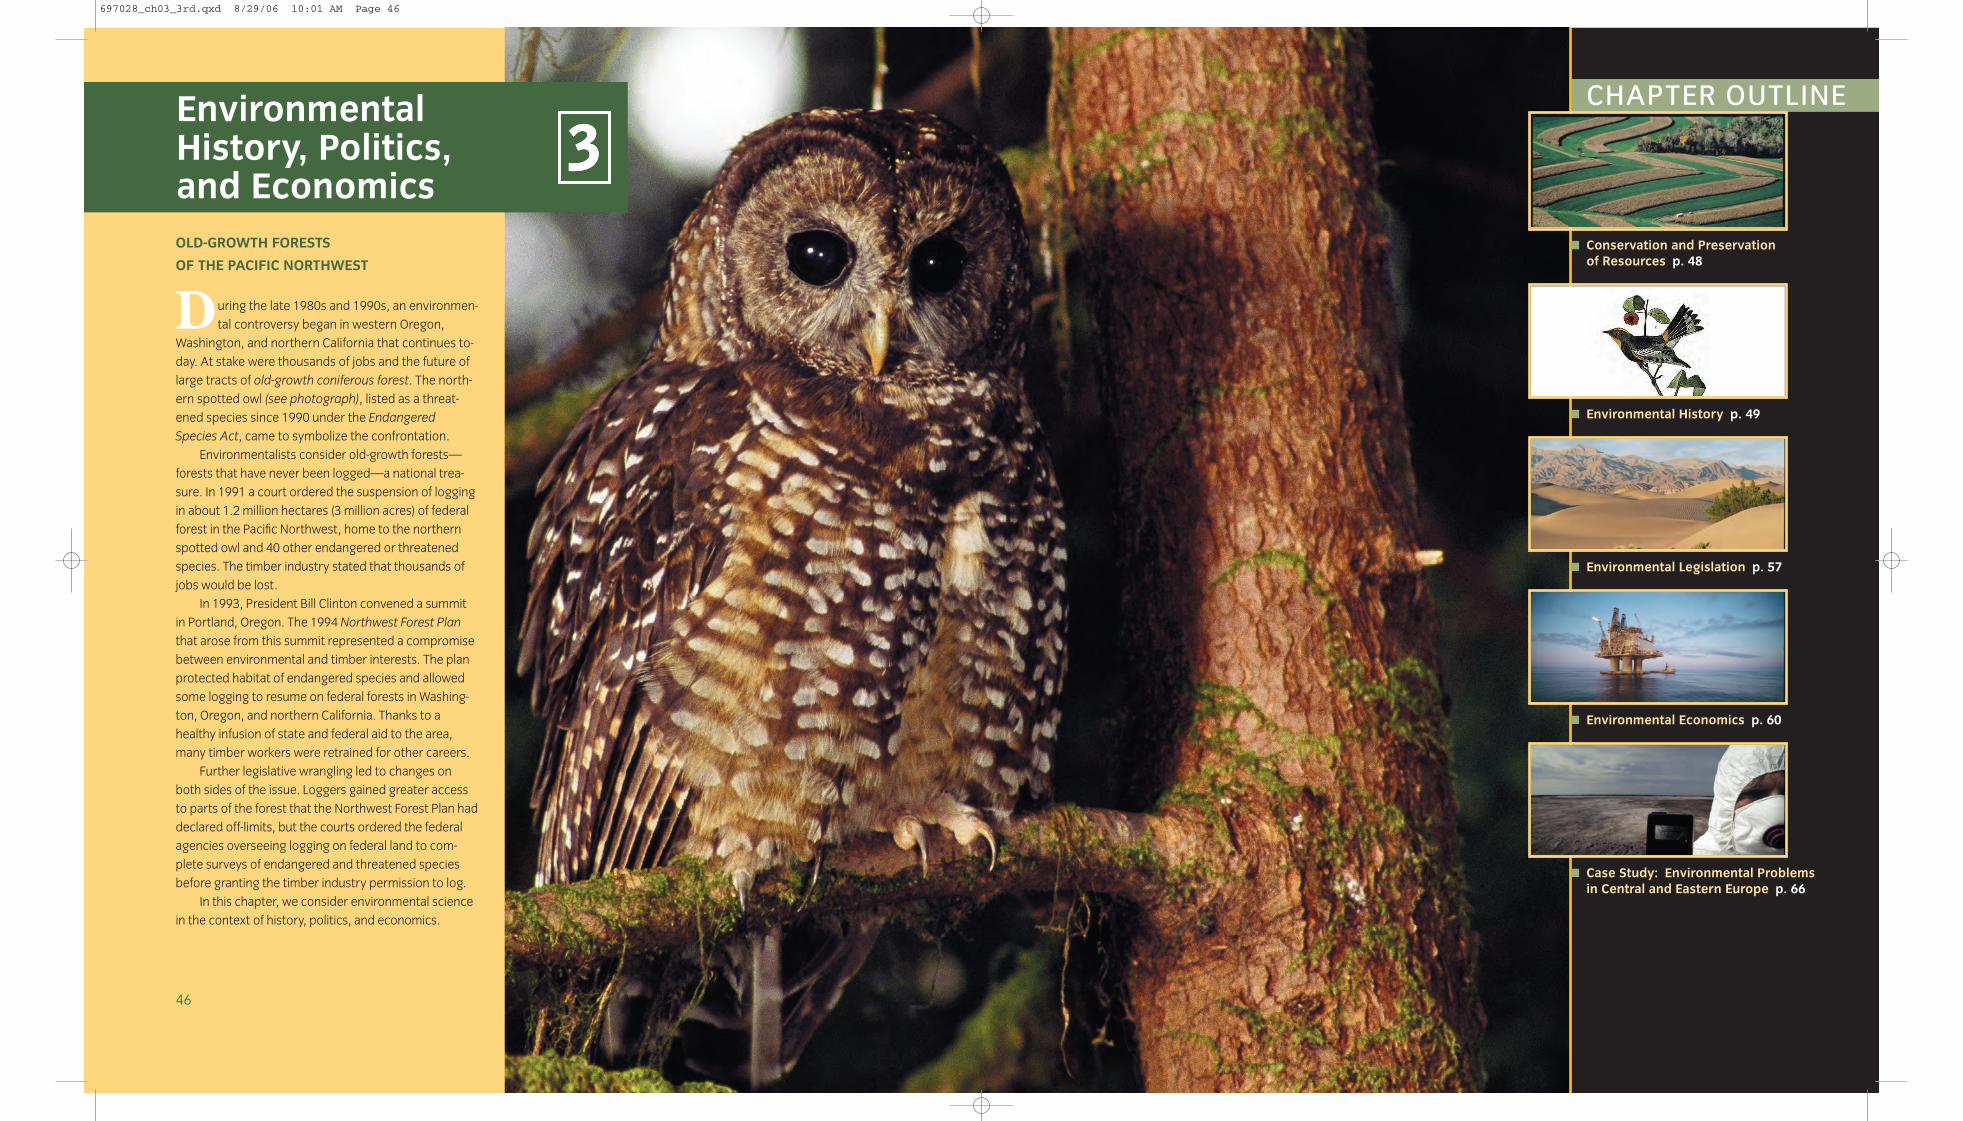
During the late 1980s and 1990s, an environmen-
tal controversy began in western Oregon,
Washington, and northern California that continues to-
day. At stake were thousands of jobs and the future of
large tracts of old-growth coniferous forest. The north-
ern spotted owl (see photograph), listed as a threat-
ened species since 1990 under the Endangered
Species Act, came to symbolize the confrontation.
Environmentalists consider old-growth forests—
forests that have never been logged—a national trea-
sure. In 1991 a court ordered the suspension of logging
in about 1.2 million hectares (3 million acres) of federal
forest in the Pacific Northwest, home to the northern
spotted owl and 40 other endangered or threatened
species. The timber industry stated that thousands of
jobs would be lost.
In 1993, President Bill Clinton convened a summit
in Portland, Oregon. The 1994 Northwest Forest Plan
that arose from this summit represented a compromise
between environmental and timber interests. The plan
protected habitat of endangered species and allowed
some logging to resume on federal forests in Washing-
ton, Oregon, and northern California. Thanks to a
healthy infusion of state and federal aid to the area,
many timber workers were retrained for other careers.
Further legislative wrangling led to changes on
both sides of the issue. Loggers gained greater access
to parts of the forest that the Northwest Forest Plan had
declared off-limits, but the courts ordered the federal
agencies overseeing logging on federal land to com-
plete surveys of endangered and threatened species
before granting the timber industry permission to log.
In this chapter, we consider environmental science
in the context of history, politics, and economics.
3
46
697028_ch03_3rd.qxd 8/29/06 10:01 AM Page 46

48 CHAPTER 3 Environmental History, Politics, and Economics Environmental History 49
esources are any part of the natural envi-ronment used to promote the welfare ofpeople or other species. Examples of re-sources include air, water, soil, forests,
minerals, and wildlife. Conservation is the sensible andcareful management of natural resources. Humanshave practiced conservation of natural resources forthousands of years. Three thousand years ago, thePhoenicians terraced hilly farmland to prevent soil ero-sion. More than two thousand years ago, the Greekspracticed crop rotation to maintain yields on farm-
lands, and the Romans practiced irrigation. Other Euro-peans gradually adopted and further refined these andother conservation techniques (Figure 3.1).
Conservation is different from preservation.Conservation involves sustainability—that is, use of re-sources without inflicting excessive environmental dam-age, so that the resources are available not only for cur-rent needs but also for the needs of future generations.Preservation is concerned with setting aside undis-turbed areas, maintaining them in a pristine state, andprotecting them from human activities that might altertheir “natural” state.
Conservation did not become a popular move-ment until the early 20th century. At that time, expand-ing industrialization, coupled with enormous growth inthe human population, began to increase pressure onthe world’s supply of natural resources.
Define conservation and preservation, and distinguish
between them.
LEARNING OBJECTIVE
Conservation and Preservation of Resources
Rrom the establishment of the first perma-nent English colony at Jamestown, Vir-ginia, in 1607, the first two centuries ofU.S. history were a time of widespread
environmental destruction. Land, timber, wildlife, richsoil, clean water, and other resources were cheap andseemingly inexhaustible. The European settlers did notdream that the bountiful natural resources of NorthAmerica would one day become scarce. During the1700s and most of the 1800s, many Americans had afrontier attitude, a desire to conquer nature and put itsresources to use in the most lucrative manner possible.
PROTECTING FORESTS
The great forests of the Northeast were cut down withina few generations, and, shortly after the Civil War in the1860s, loggers began deforesting the Midwest at analarming rate. Within 40 years, they had deforested anarea the size of Europe, stripping Minnesota, Michigan,and Wisconsin of virgin forest. By 1897 the sawmills ofMichigan had processed 160 billion board feet of whitepine, leaving less than 6 billion board feet standing inthe whole state.
During the 19th century, many U.S. naturalistsbegan to voice concerns about conserving natural re-sources. John James Audubon (1785–1851) painted life-like portraits of birds and other animals in their naturalsurroundings that aroused widespread public interestin the wildlife of North America (Figure 3.2).Henry David Thoreau (1817–1862), a prominent U.S.writer, lived for 2 years on the shore of Walden Pond
Briefly outline the environmental history of
the United States.
Describe the contributions of the
following people to our understanding
of the environment: John James Audubon,
Henry David Thoreau, George Perkins
Marsh, Theodore Roosevelt, Gifford Pinchot,
John Muir, Franklin Roosevelt, Aldo Leopold,
Wallace Stegner, Rachel Carson, and Paul
Ehrlich.
Distinguish between utilitarian
conservationists and biocentric
preservationists.
LEARNING OBJECTIVES
Environmental History
F
Soil conservation Figure 3.1
Plowing and planting fields in curves that conform to the
natural contours of the land reduce soil erosion.
CONCEPT CHECK
What is conservation?
What is preservation?
How does conservation
differ from preservation?
STOPSTOP
This portrayal is one of 500 engravings in Audubon’s
classic The Birds of America, which was completed in 1844.
Audubon’s warbler, found in the Pacific Northwest, was
named in honor of Audubon.
Audubon’s warblers Figure 3.2
697028_ch03_3rd.qxd 8/29/06 10:01 AM Page 48
In 1906 Congress passed the Antiquities Act, whichauthorized the president to set aside sites that had scien-tific, historic, or prehistoric importance. By 1916 therewere 13 national parks and 20 national monuments, un-der the loose management of the U.S. Army. Today thereare 58 national parks and 73 national monuments underthe management of the National Park Service.
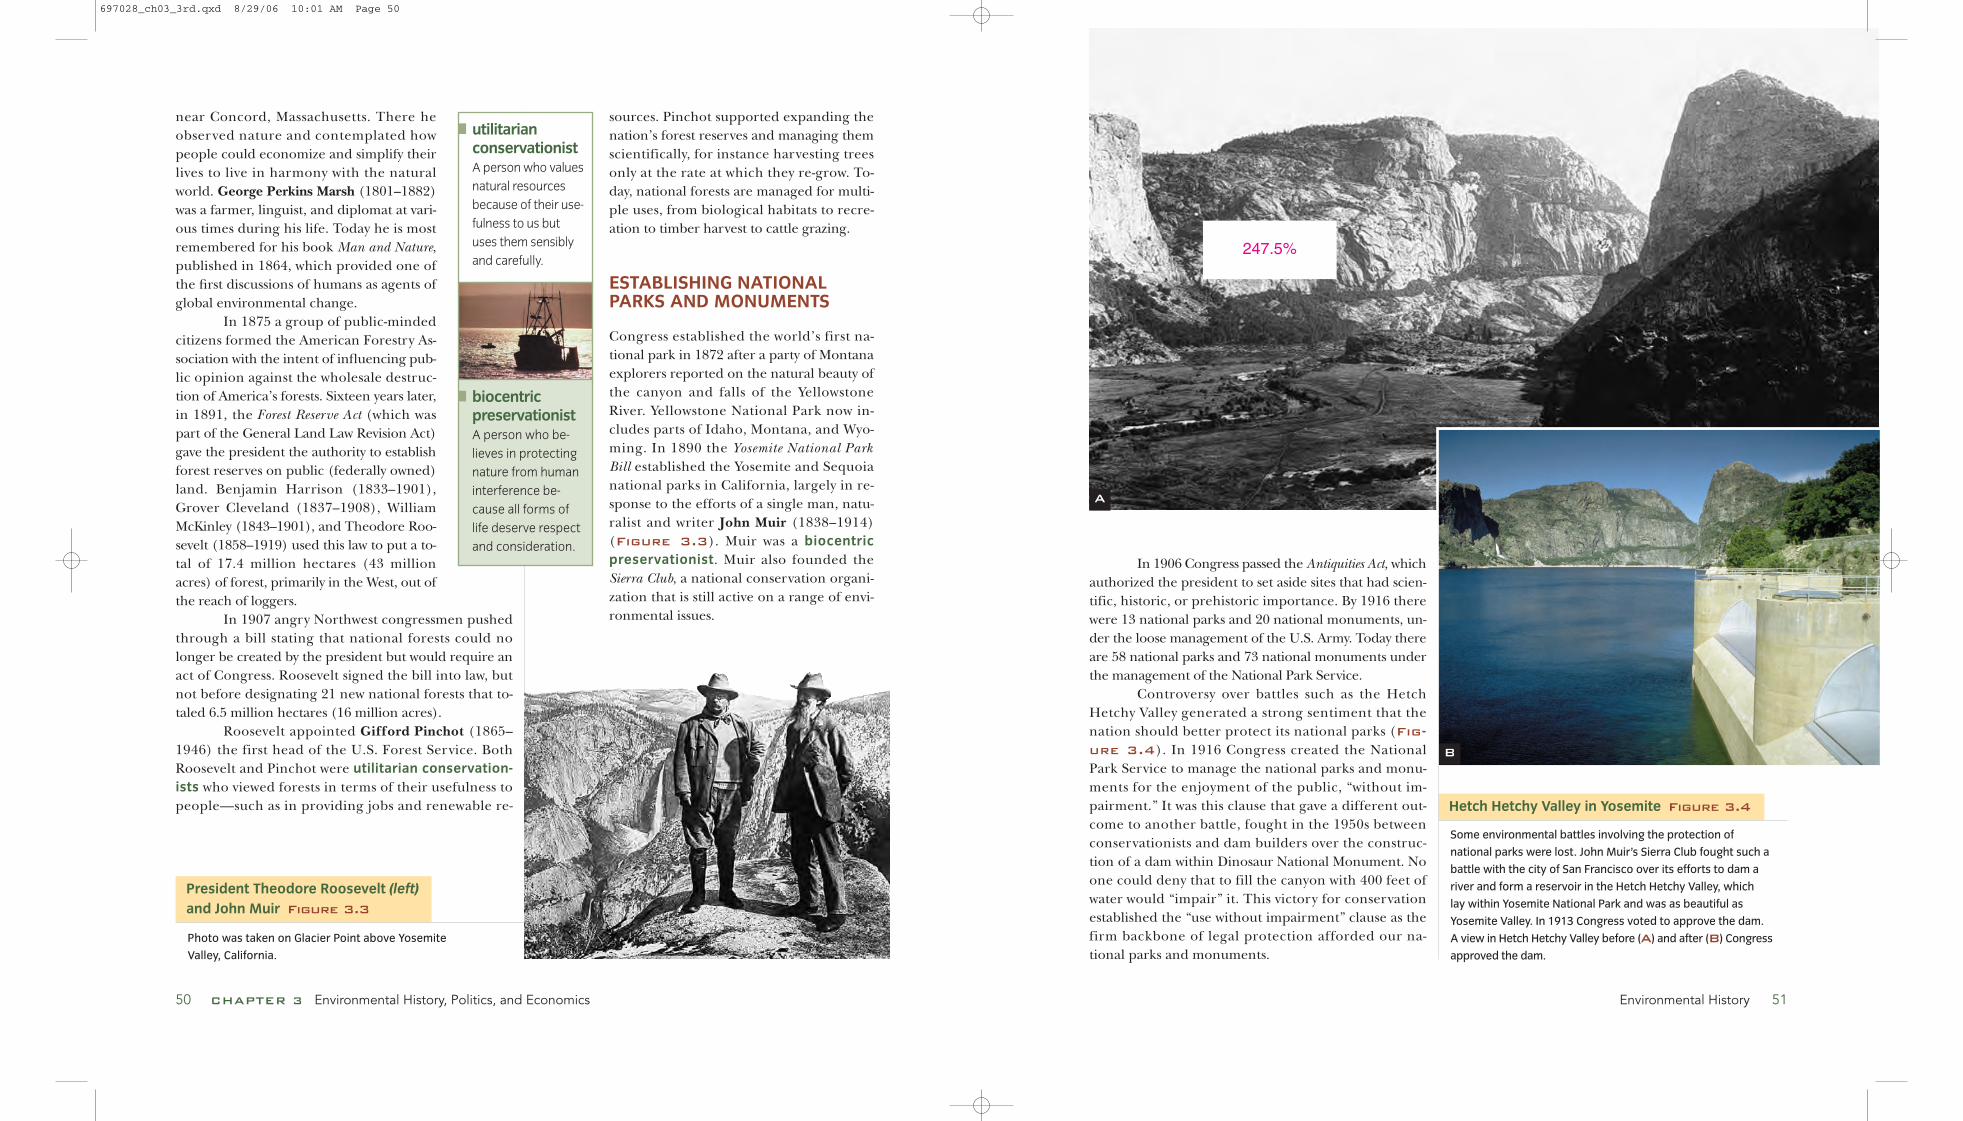
Controversy over battles such as the HetchHetchy Valley generated a strong sentiment that thenation should better protect its national parks (Fig-
ure 3.4). In 1916 Congress created the NationalPark Service to manage the national parks and monu-ments for the enjoyment of the public, “without im-pairment.” It was this clause that gave a different out-come to another battle, fought in the 1950s betweenconservationists and dam builders over the construc-tion of a dam within Dinosaur National Monument. Noone could deny that to fill the canyon with 400 feet ofwater would “impair” it. This victory for conservationestablished the “use without impairment” clause as thefirm backbone of legal protection afforded our na-tional parks and monuments.
near Concord, Massachusetts. There heobserved nature and contemplated howpeople could economize and simplify theirlives to live in harmony with the naturalworld. George Perkins Marsh (1801–1882)was a farmer, linguist, and diplomat at vari-ous times during his life. Today he is mostremembered for his book Man and Nature,published in 1864, which provided one ofthe first discussions of humans as agents ofglobal environmental change.
In 1875 a group of public-mindedcitizens formed the American Forestry As-sociation with the intent of influencing pub-lic opinion against the wholesale destruc-tion of America’s forests. Sixteen years later,in 1891, the Forest Reserve Act (which waspart of the General Land Law Revision Act)gave the president the authority to establishforest reserves on public (federally owned)land. Benjamin Harrison (1833–1901),Grover Cleveland (1837–1908), WilliamMcKinley (1843–1901), and Theodore Roo-sevelt (1858–1919) used this law to put a to-tal of 17.4 million hectares (43 millionacres) of forest, primarily in the West, out ofthe reach of loggers.
In 1907 angry Northwest congressmen pushedthrough a bill stating that national forests could nolonger be created by the president but would require anact of Congress. Roosevelt signed the bill into law, butnot before designating 21 new national forests that to-taled 6.5 million hectares (16 million acres).
Roosevelt appointed Gifford Pinchot (1865–1946) the first head of the U.S. Forest Service. BothRoosevelt and Pinchot were utilitarian conservation-
ists who viewed forests in terms of their usefulness topeople—such as in providing jobs and renewable re-
sources. Pinchot supported expanding thenation’s forest reserves and managing themscientifically, for instance harvesting treesonly at the rate at which they re-grow. To-day, national forests are managed for multi-ple uses, from biological habitats to recre-ation to timber harvest to cattle grazing.
ESTABLISHING NATIONALPARKS AND MONUMENTS
Congress established the world’s first na-tional park in 1872 after a party of Montanaexplorers reported on the natural beauty ofthe canyon and falls of the YellowstoneRiver. Yellowstone National Park now in-cludes parts of Idaho, Montana, and Wyo-ming. In 1890 the Yosemite National ParkBill established the Yosemite and Sequoianational parks in California, largely in re-sponse to the efforts of a single man, natu-ralist and writer John Muir (1838–1914)(Figure 3.3). Muir was a biocentric
preservationist. Muir also founded theSierra Club, a national conservation organi-zation that is still active on a range of envi-ronmental issues.
50 CHAPTER 3 Environmental History, Politics, and Economics
utilitarianconservationistA person who values
natural resources
because of their use-
fulness to us but
uses them sensibly
and carefully.
biocentricpreservationistA person who be-
lieves in protecting
nature from human
interference be-
cause all forms of
life deserve respect
and consideration.
Environmental History 51
Photo was taken on Glacier Point above Yosemite
Valley, California.
President Theodore Roosevelt (left)
and John Muir Figure 3.3
Some environmental battles involving the protection of
national parks were lost. John Muir’s Sierra Club fought such a
battle with the city of San Francisco over its efforts to dam a
river and form a reservoir in the Hetch Hetchy Valley, which
lay within Yosemite National Park and was as beautiful as
Yosemite Valley. In 1913 Congress voted to approve the dam.
A view in Hetch Hetchy Valley before (A) and after (B) Congress
approved the dam.
Hetch Hetchy Valley in Yosemite Figure 3.4
A
B
247.5%
697028_ch03_3rd.qxd 8/29/06 10:01 AM Page 50
organisms, including humans, and the natural environ-ment (Figure 3.6). Her most famous work, SilentSpring, was published in 1962. In it Carson wrote againstthe indiscriminate use of pesticides:
Pesticide sprays, dusts, and aerosols are now applied almost universally to farms, gardens,forests, and homes—nonselective chemicals thathave the power to kill every insect, the “good” andthe “bad,” to still the song of birds and the leapingof fish in the streams, to coat the leaves with a deadly film, and to linger on in soil—all thisthough the intended target may be only a few weeds or insects. Can anyone believe it is possible
Environmental History 53
CONSERVATION IN THE MID-20TH CENTURY
During the Great Depression, the federal governmentfinanced many conservation projects to provide jobsfor the unemployed. During his administration, FranklinRoosevelt (1882–1945) established the Civilian Conser-vation Corps, which employed more than 175,000 mento plant trees, make paths and roads in national parksand forests, build dams to control flooding, and per-form other activities that protected natural resources.
During the droughts of the 1930s, windstormscarried away much of the topsoil in parts of the GreatPlains, forcing many farmers to abandon their farmsand search for work elsewhere. The American Dust Bowlalerted the United States to the need for soil conserva-tion, and President Roosevelt formed the Soil Conser-vation Service in 1935.
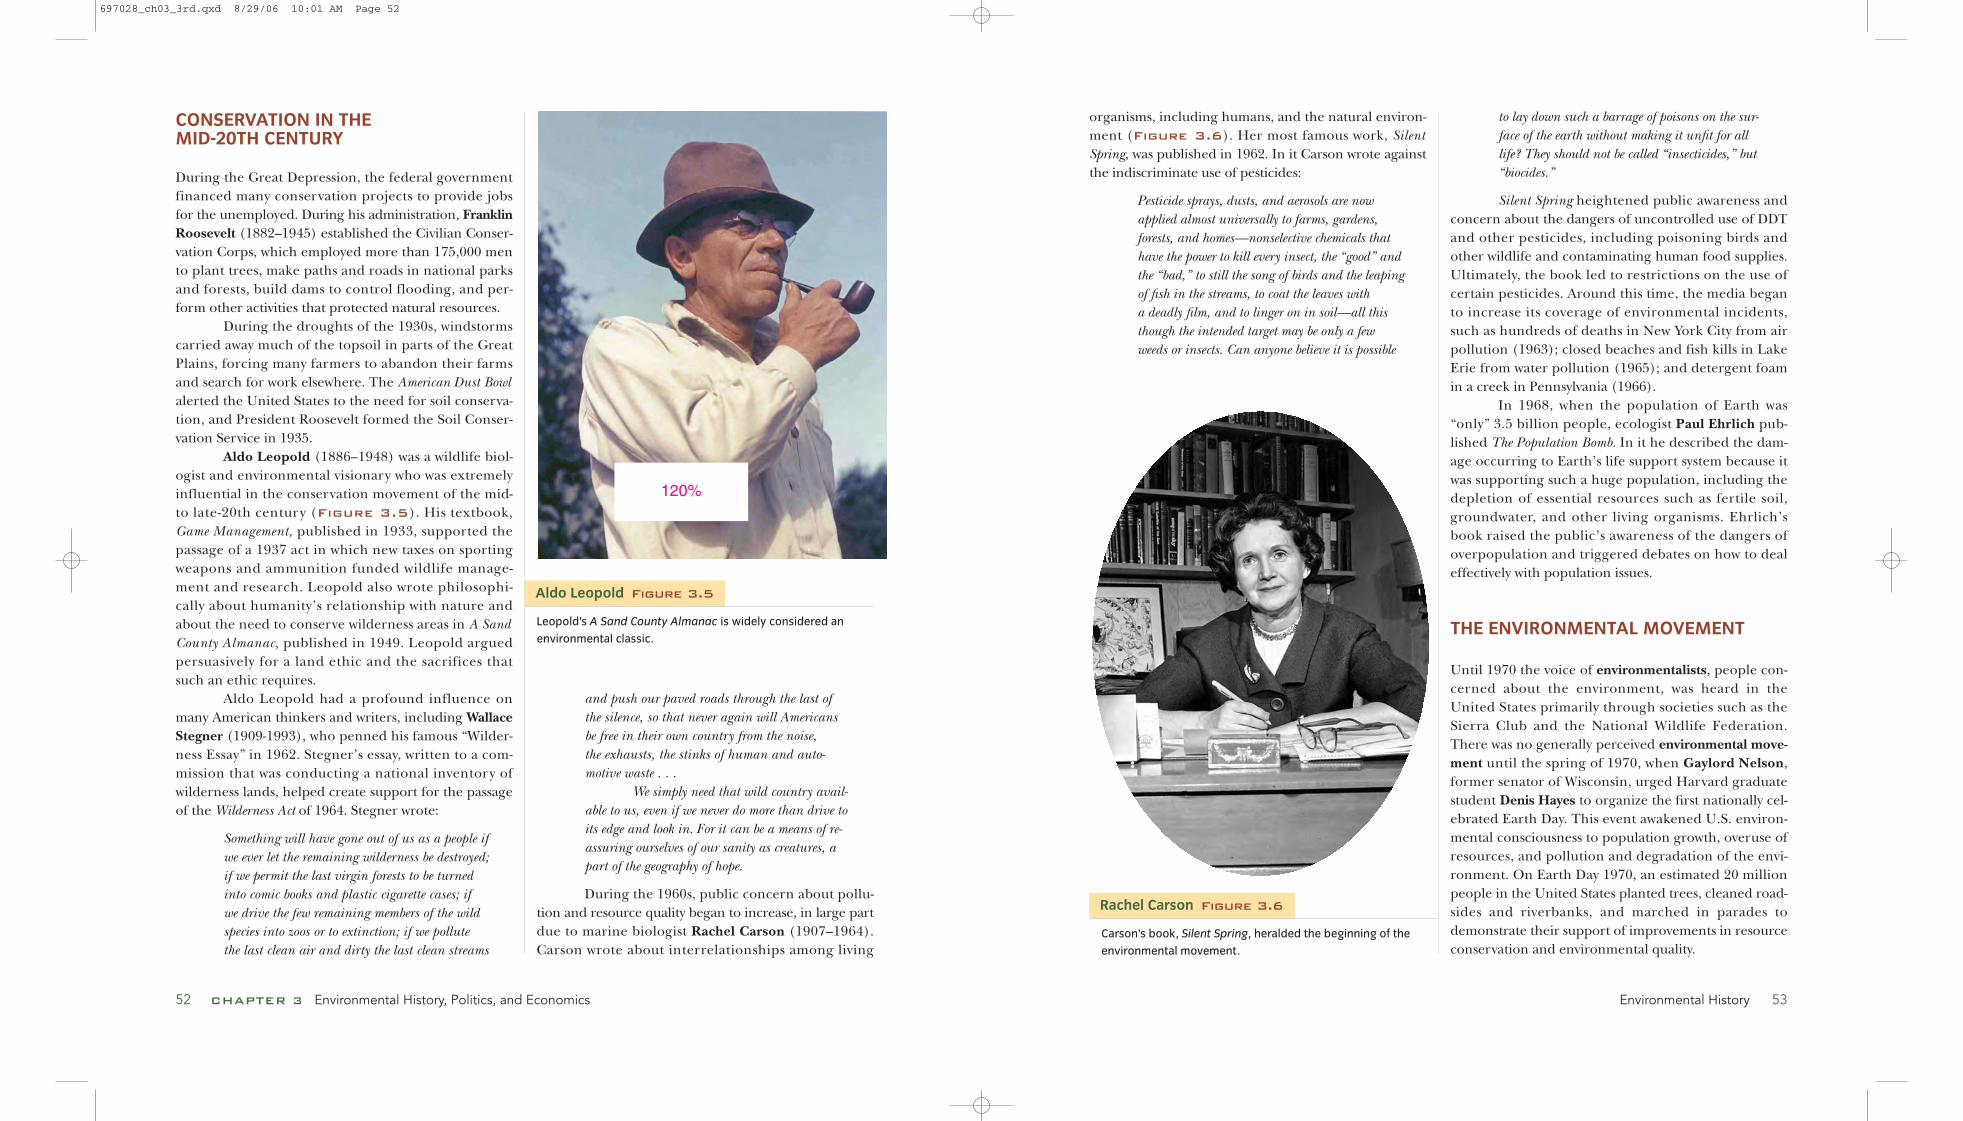
Aldo Leopold (1886–1948) was a wildlife biol-ogist and environmental visionary who was extremelyinfluential in the conservation movement of the mid-to late-20th century (Figure 3.5). His textbook,Game Management, published in 1933, supported thepassage of a 1937 act in which new taxes on sportingweapons and ammunition funded wildlife manage-ment and research. Leopold also wrote philosophi-cally about humanity’s relationship with nature andabout the need to conserve wilderness areas in A SandCounty Almanac, published in 1949. Leopold arguedpersuasively for a land ethic and the sacrifices thatsuch an ethic requires.
Aldo Leopold had a profound influence onmany American thinkers and writers, including WallaceStegner (1909-1993), who penned his famous “Wilder-ness Essay” in 1962. Stegner’s essay, written to a com-mission that was conducting a national inventory ofwilderness lands, helped create support for the passageof the Wilderness Act of 1964. Stegner wrote:
Something will have gone out of us as a people ifwe ever let the remaining wilderness be destroyed;if we permit the last virgin forests to be turnedinto comic books and plastic cigarette cases; if we drive the few remaining members of the wildspecies into zoos or to extinction; if we pollute the last clean air and dirty the last clean streams
and push our paved roads through the last of the silence, so that never again will Americans be free in their own country from the noise, the exhausts, the stinks of human and auto-motive waste . . .
We simply need that wild country avail-able to us, even if we never do more than drive toits edge and look in. For it can be a means of re-assuring ourselves of our sanity as creatures, apart of the geography of hope.
During the 1960s, public concern about pollu-tion and resource quality began to increase, in large partdue to marine biologist Rachel Carson (1907–1964).Carson wrote about interrelationships among living
52 CHAPTER 3 Environmental History, Politics, and Economics
to lay down such a barrage of poisons on the sur-face of the earth without making it unfit for alllife? They should not be called “insecticides,” but“biocides.”
Silent Spring heightened public awareness andconcern about the dangers of uncontrolled use of DDTand other pesticides, including poisoning birds andother wildlife and contaminating human food supplies.Ultimately, the book led to restrictions on the use ofcertain pesticides. Around this time, the media beganto increase its coverage of environmental incidents,such as hundreds of deaths in New York City from airpollution (1963); closed beaches and fish kills in LakeErie from water pollution (1965); and detergent foamin a creek in Pennsylvania (1966).
In 1968, when the population of Earth was“only” 3.5 billion people, ecologist Paul Ehrlich pub-lished The Population Bomb. In it he described the dam-age occurring to Earth’s life support system because itwas supporting such a huge population, including thedepletion of essential resources such as fertile soil,groundwater, and other living organisms. Ehrlich’sbook raised the public’s awareness of the dangers ofoverpopulation and triggered debates on how to dealeffectively with population issues.
THE ENVIRONMENTAL MOVEMENT
Until 1970 the voice of environmentalists, people con-cerned about the environment, was heard in theUnited States primarily through societies such as theSierra Club and the National Wildlife Federation.There was no generally perceived environmental move-ment until the spring of 1970, when Gaylord Nelson,former senator of Wisconsin, urged Harvard graduatestudent Denis Hayes to organize the first nationally cel-ebrated Earth Day. This event awakened U.S. environ-mental consciousness to population growth, overuse ofresources, and pollution and degradation of the envi-ronment. On Earth Day 1970, an estimated 20 millionpeople in the United States planted trees, cleaned road-sides and riverbanks, and marched in parades todemonstrate their support of improvements in resourceconservation and environmental quality.
Leopold’s A Sand County Almanac is widely considered an
environmental classic.
Aldo Leopold Figure 3.5
Carson’s book, Silent Spring, heralded the beginning of the
environmental movement.
Rachel Carson Figure 3.6
120%
697028_ch03_3rd.qxd 8/29/06 10:01 AM Page 52

54 CHAPTER 3 Environmental History, Politics, and Economics
In the years that followed the first Earth Day(Figure 3.7), environmental awareness and the be-lief that individual actions could repair the damage hu-mans were doing to Earth became a pervasive popularmovement. Musicians and other celebrities popularizedenvironmental concerns. Many of the world’s religions—such as Christianity, Judaism, Islam, Hinduism, Bud-dhism, Taoism, Shintoism, Confucianism, and Jainism—embraced environmental themes such as protectingendangered species and controlling global warming.
By Earth Day 1990, the movement had spreadaround the world, signaling the rapid growth in envi-ronmental consciousness. An estimated 200 million peo-ple in 141 nations demonstrated to increase publicawareness of the importance of individual efforts(“Think globally, act locally”). The theme of Earth Day2000, “Clean Energy Now,” reflected the dangers ofglobal climate change and what individuals and commu-nities could do: replace fossil fuel energy sources, whichproduce greenhouse gases, with solar electricity, windpower, and the like. However, by 2000 many environ-mental activists had begun to think that the individualactions Earth Day espouses, while collectively impor-tant, are not as important as pressuring governments
and large corporations to make environmentallyfriendly decisions. Figure 3.8 shows a timeline ofselected environmental events since Earth Day 1970.
CONCEPT CHECK
What role did each of
the following have in U.S.
environmental history:
protecting forests;
establishing and pro-
tecting national parks
and monuments; con-
servation in the mid-20th
century; the environ-
mental movement of
the late-20th century?
What was the
environmental
contribution of
Rachel Carson?
How did Aldo Leopold
influence the conser-
vation movement of the
mid- to late-20th century?
STOPSTOP
Earth Day 1970 in New York City
Figure 3.7
1970
First Earth Day held in United States
1974
Chlorofluorocarbons are first hypothesizedto cause ozone thinning
1979
Three Mile Island nuclear power plant inPennsylvania has partial meltdown (worstnuclear accident in U.S. history)
1973
1970 1972 1974 1976 1978 1980
International treaty (Convention onInternational Trade in EndangeredSpecies of Wild Fauna and Flora)protects endangered species
Arab countries in Organization of Petroleum ExportingCountries announce oil embargo against United States
1982
International treaty (Convention onthe Law of the Sea) developed toprotect ocean resources
1984
World’s worst industrial accident (UnionCarbide’s pesticide plant in Bhopal, India)kills and injures thousands
1980 1982 1984 1986 1988 1990
1986
World’s worst accident at nuclear powerplant occurs in Chernobyl, Soviet Union
1989
Exxon Valdez oil tanker createshuge oil spill in United States
1987
International treaty (MontrealProtocol) requires countries tophase out ozone-depletingchemicals
1991
World’s worst oil spill occurs inKuwait during its war with Iraq
1990 1992 1994 1996 1998 2000
1992
U.N. Conference on Environmentand Development (Earth Summit)occurs in Brazil
1994
International Conference onPopulation and Developmentheld in Egypt
1997
Forest fires destroy more tropicalforests than ever before; Indonesiais particularly hard hit
1999
Human population reaches 6 billion
2000
International treaty (Treaty on PersistentOrganic Pollutants) requires countries tophase out highly toxic chemicals
2002
Huge oil spill off Spain’scoast raises awarenessof ocean’s vulnerability
2001
Intergovernmental Panel on Climate Change releasesthird report; it cites evidence that human activities suchas CO2 emissions have caused most observed globalwarming of past 50 years
President Bush decides the United Stateswill not ratify Kyoto Protocol, which mandatesreductions in CO2 emissions
2000 2002 2004 2006 2008 2010
Timeline of selected environmental events, from 1970 to the present Figure 3.8
697028_ch03_3rd.qxd 8/29/06 10:01 AM Page 54
Because responses to environmental problems depend on
the public’s awareness and understanding of the issues and
the underlying scientific concepts involved, environmental
education is critical to appropriate decision making. The em-
phasis on environmental education has grown dramatically
over the years:
• Three international treaties supporting environmental
education went into effect between 1975 and 1990.
• In 1990, 22 university presidents from 13 nations issued
a declaration of their commitment to environmental edu-
cation and research at their institutions. More than 300
university presidents from at least 40 countries have
since followed suit.
• More than 30 states require some form of environmental
education in primary and secondary schools.
• The National Environmental Education Act of 1990
requires the Environmental Protection Agency to pro-
vide leadership in promoting environmental education
and increasing public awareness and knowledge of
environmental issues.
• The U.N. Decade of Education for Sustainable Devel-
opment (2005–2014) is dedicated to improving basic
education, including public understanding about
environmental sustainability.
The North American Association for Environmental Edu-
cation has issued guidelines for educators to help them select
materials such as textbooks and films that are based on sound
scientific evidence and that present a balanced perspective on
environmental problems.
However, a backlash against environmental education
occurred beginning in the late 1990s. Some conservative
research groups criticized what they perceived as a biased
presentation of environmental issues, particularly the promo-
tion of environmental activism, in schools.
Environmental education
Fourth graders in Marietta, Georgia, study a small stream.
Environmental LiteracyEnviroDiscovery
ell-publicized ecological disasters, suchas the 1969 oil spill off the coast of SantaBarbara, California, and overwhelmingpublic support for the Earth Day move-
ment, resulted in the January 1970 signing of the Na-tional Environmental Policy Act (NEPA). The Environmen-tal Protection Agency (EPA) was created in July of thesame year. A key provision of NEPA states that the fed-eral government must consider the environmental im-pact of a proposed federal action, such as financinghighway or dam construction, when making decisionsabout that action. NEPA provides the basis for develop-ing detailed environmental impact statements (EISs) to
accompany every federal recommendation or proposalfor legislation. An EIS is a document that describes thenature of the proposal, why it is needed, short- andlong-term environmental impacts of the proposal, andpossible alternatives to the proposed action that wouldcreate fewer adverse effects. NEPA also requires solicita-tion of public comments when preparing an EIS, whichgenerally provides a broader perspective on the pro-posal and its likely effects.
NEPA established the Council on Environmen-tal Quality to monitor the required EISs and report di-rectly to the president. Because this council had no en-forcement powers, NEPA was originally consideredinnocuous, more a statement of good intentions than aregulatory policy. During the next few years, however,environmental activists took people, corporations, andthe federal government to court to challenge their EISsor use them to block proposed development. The courtsdecreed that EISs thoroughly analyze the environmentalconsequences of anticipated projects on soil, water, and organisms and that EISs be made available to thepublic (Figure 3.9). These rulings put very sharpteeth into NEPA—particularly the provision for public
Explain why the National Environmental Policy Act is the
cornerstone of U.S. environmental law.
Relate how environmental impact statements provide such powerful
protection of the environment.
Define full cost accounting.
LEARNING OBJECTIVES
Environmental Legislation
W
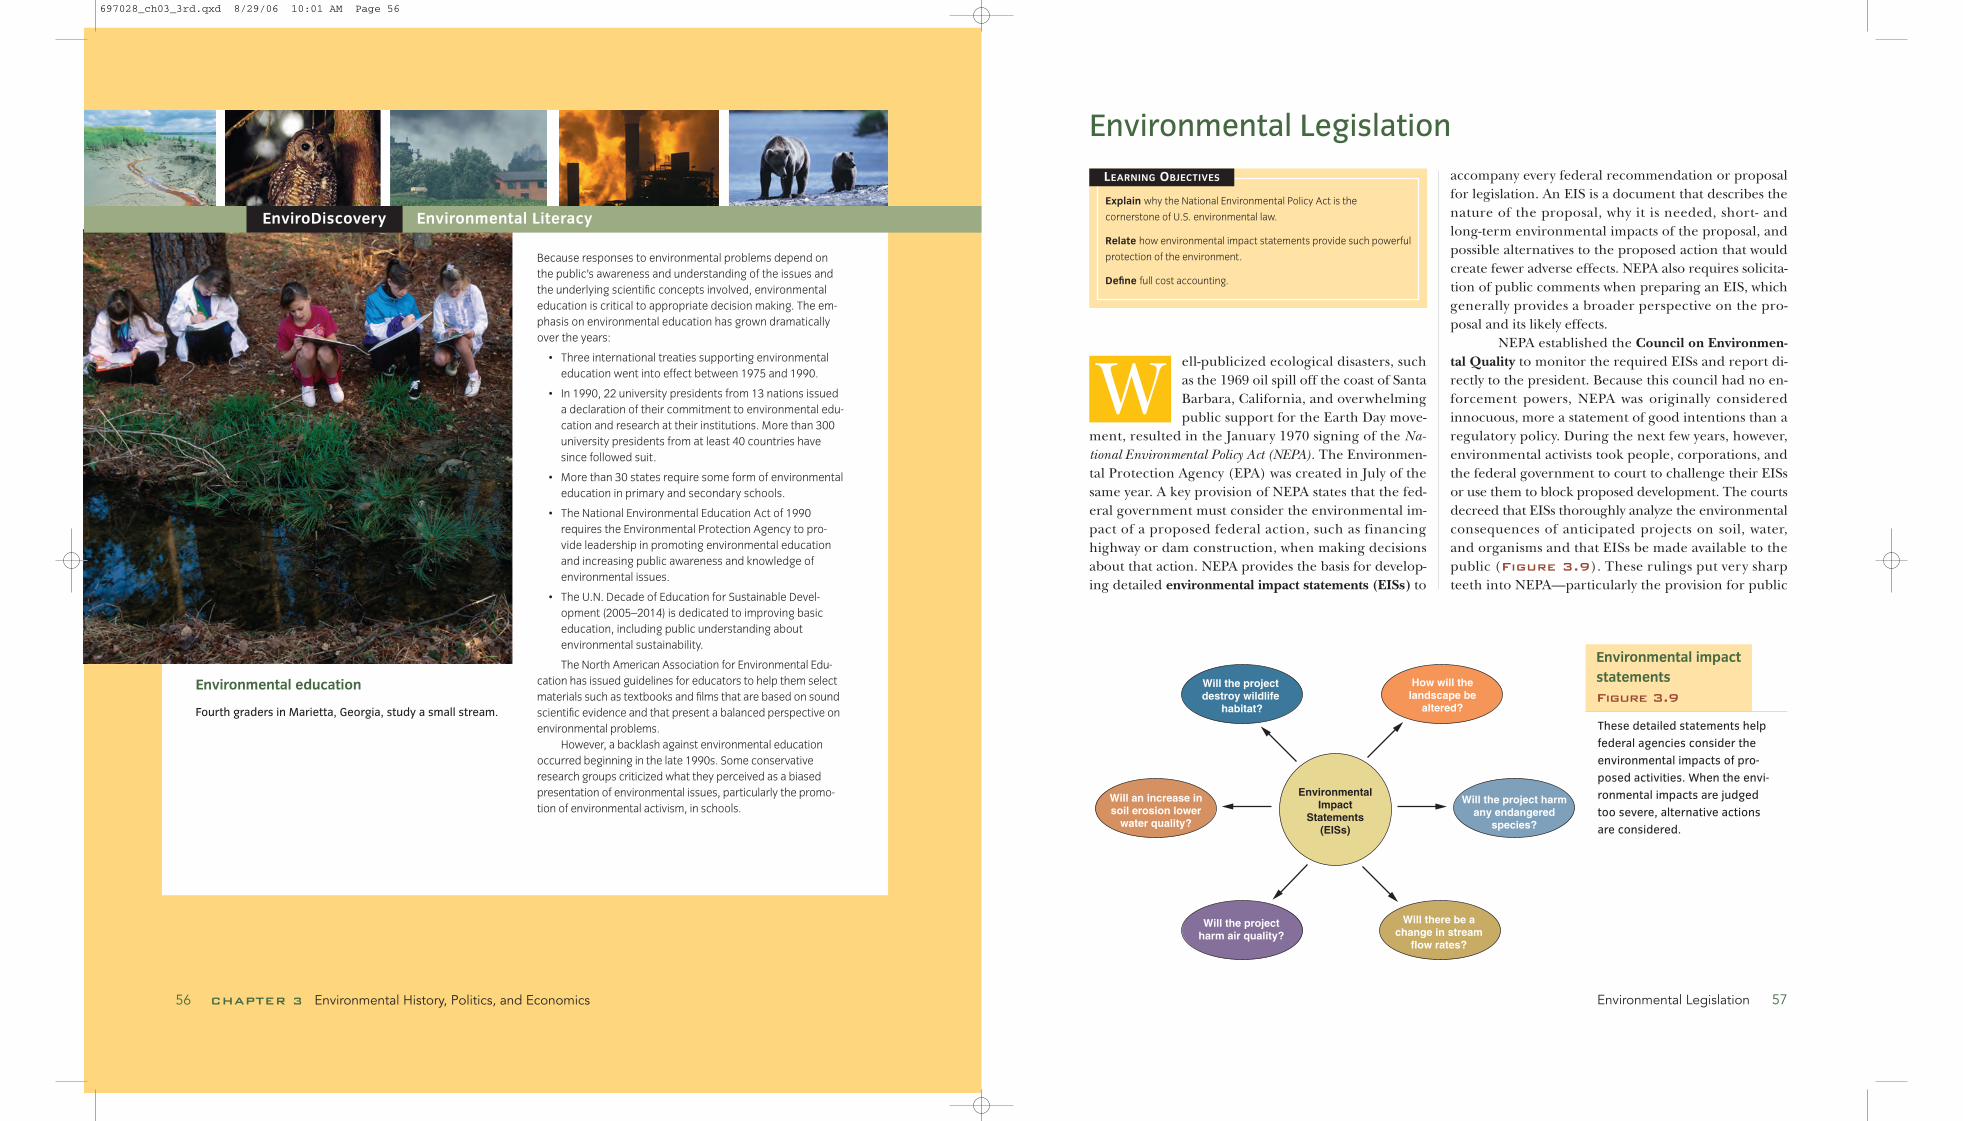
EnvironmentalImpact
Statements(EISs)
Will the project destroy wildlife
habitat?
How will the landscape be
altered?
Will the project harm any endangered
species?
Will there be a change in stream
flow rates?
Will the project harm air quality?
Will an increase in soil erosion lower
water quality?
Environmental Legislation 5756 CHAPTER 3 Environmental History, Politics, and Economics
These detailed statements help
federal agencies consider the
environmental impacts of pro-
posed activities. When the envi-
ronmental impacts are judged
too severe, alternative actions
are considered.
Environmental impact
statements
Figure 3.9
697028_ch03_3rd.qxd 8/29/06 10:01 AM Page 56
• Millions of hectares of farmland particularlyvulnerable to erosion have been withdrawnfrom production, reducing soil erosion bymore than 60 percent.
• Many endangered species are recovering, andthe American alligator, California gray whale,and bald eagle have recovered enough to be re-moved from the endangered species list. (How-ever, dozens of other species, such as the mana-tee and Kemp’s ridley sea turtle, have sufferedfurther declines or extinction since 1970.)
Although we still have a long way to go, pollu-tion control efforts through legislation have been par-ticularly successful. According to the EPA’s “Draft Re-port on the Environment 2003,”
• Emissions of 6 important air pollutants havedropped by more than 25 percent.
• Since 1990, levels of wet sulfate, a major com-ponent of acid rain, have dropped by 20 to 30 percent.
• Release of toxic chemicals into water and airfrom industrial sources declined by 48 percentsince 1988.
• Fewer rivers and streams are in violation of wa-ter quality standards. However, fish-consumptionadvisories relating to specific toxins such as mer-cury or polychlorinated biphenyls (PCBs) haveincreased, possibly because more consistentmonitoring has led to more accurate measure-ments of these pollutants.
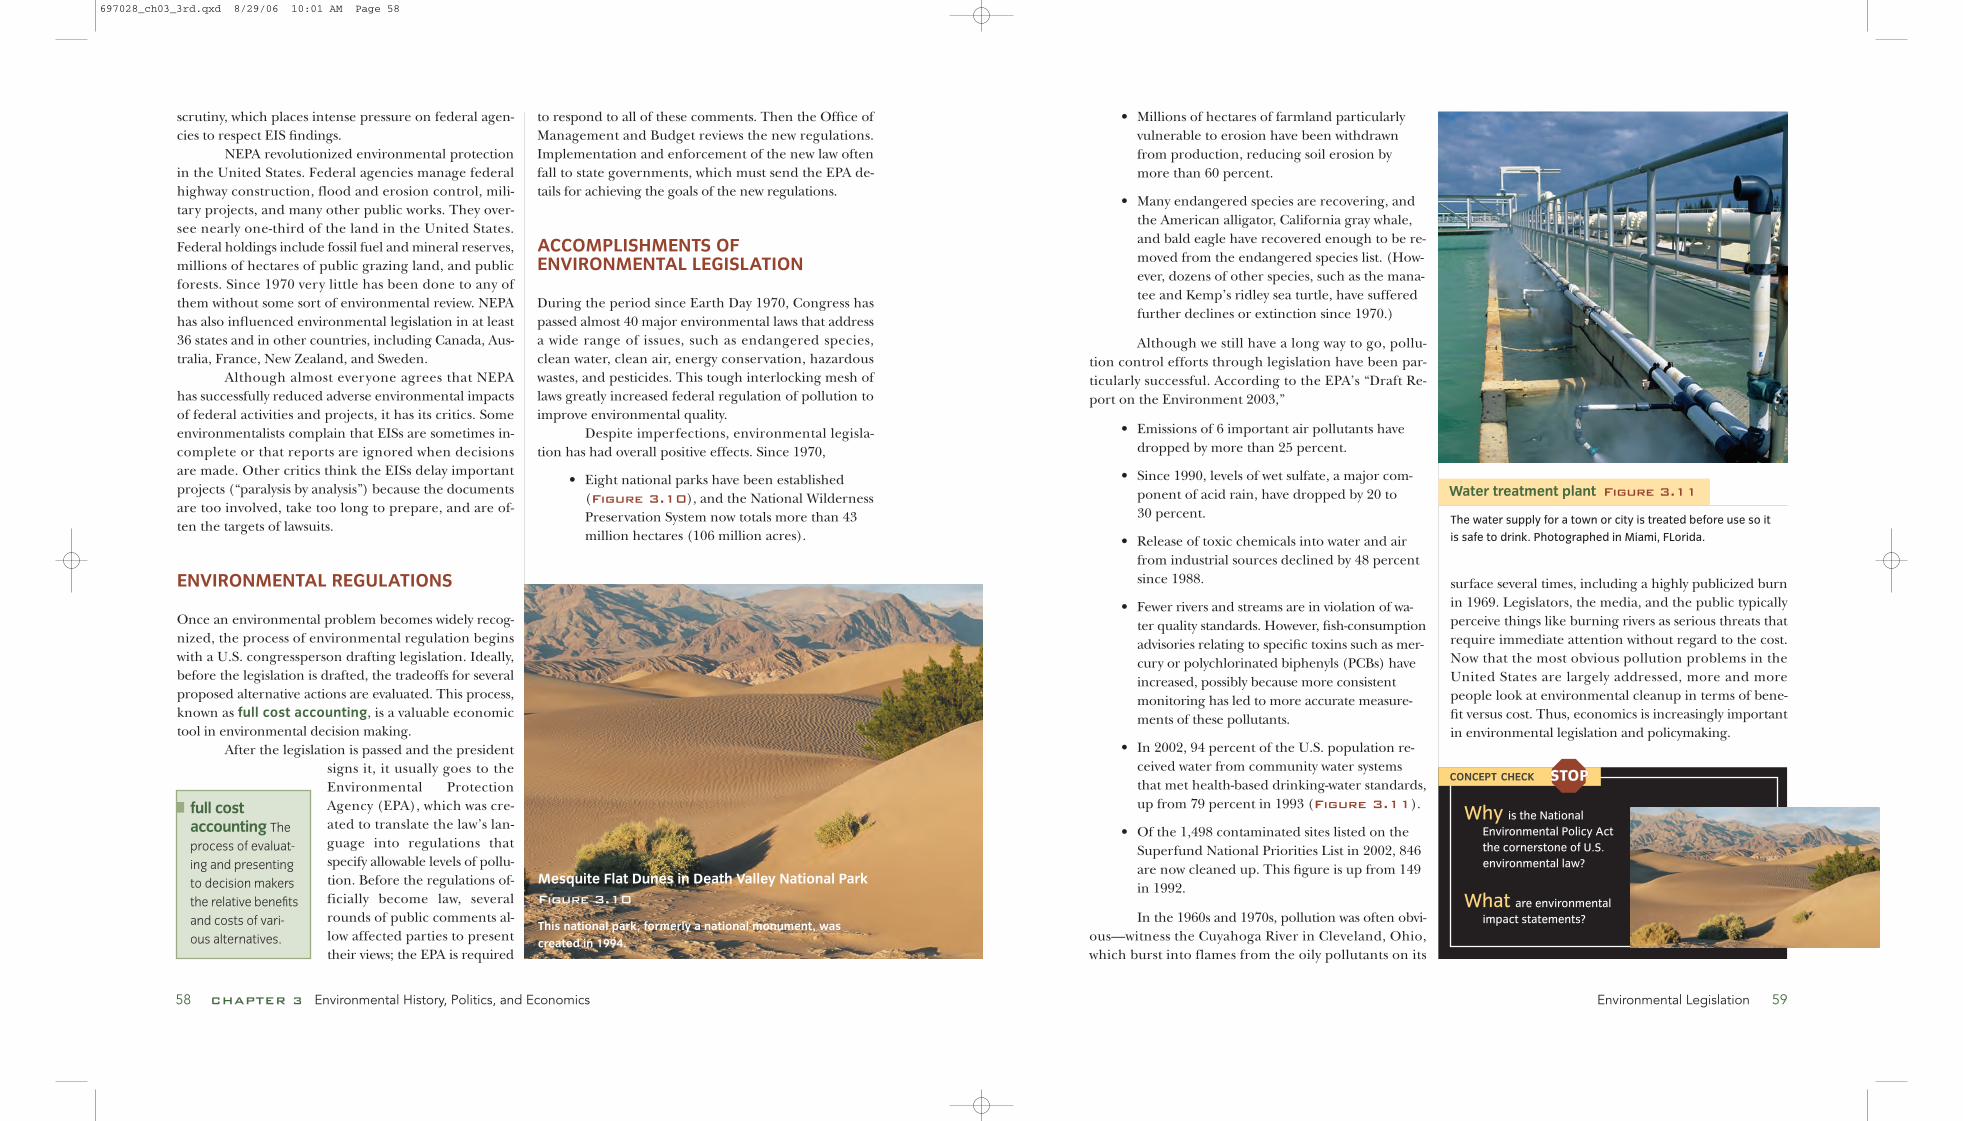
• In 2002, 94 percent of the U.S. population re-ceived water from community water systemsthat met health-based drinking-water standards,up from 79 percent in 1993 (Figure 3.11).
• Of the 1,498 contaminated sites listed on theSuperfund National Priorities List in 2002, 846are now cleaned up. This figure is up from 149in 1992.
In the 1960s and 1970s, pollution was often obvi-ous—witness the Cuyahoga River in Cleveland, Ohio,which burst into flames from the oily pollutants on its
surface several times, including a highly publicized burnin 1969. Legislators, the media, and the public typicallyperceive things like burning rivers as serious threats thatrequire immediate attention without regard to the cost.Now that the most obvious pollution problems in theUnited States are largely addressed, more and morepeople look at environmental cleanup in terms of bene-fit versus cost. Thus, economics is increasingly importantin environmental legislation and policymaking.
scrutiny, which places intense pressure on federal agen-cies to respect EIS findings.
NEPA revolutionized environmental protectionin the United States. Federal agencies manage federalhighway construction, flood and erosion control, mili-tary projects, and many other public works. They over-see nearly one-third of the land in the United States.Federal holdings include fossil fuel and mineral reserves,millions of hectares of public grazing land, and publicforests. Since 1970 very little has been done to any ofthem without some sort of environmental review. NEPAhas also influenced environmental legislation in at least36 states and in other countries, including Canada, Aus-tralia, France, New Zealand, and Sweden.
Although almost everyone agrees that NEPAhas successfully reduced adverse environmental impactsof federal activities and projects, it has its critics. Someenvironmentalists complain that EISs are sometimes in-complete or that reports are ignored when decisionsare made. Other critics think the EISs delay importantprojects (“paralysis by analysis”) because the documentsare too involved, take too long to prepare, and are of-ten the targets of lawsuits.
ENVIRONMENTAL REGULATIONS
Once an environmental problem becomes widely recog-nized, the process of environmental regulation beginswith a U.S. congressperson drafting legislation. Ideally,before the legislation is drafted, the tradeoffs for severalproposed alternative actions are evaluated. This process,known as full cost accounting, is a valuable economictool in environmental decision making.
After the legislation is passed and the presidentsigns it, it usually goes to theEnvironmental ProtectionAgency (EPA), which was cre-ated to translate the law’s lan-guage into regulations thatspecify allowable levels of pollu-tion. Before the regulations of-ficially become law, severalrounds of public comments al-low affected parties to presenttheir views; the EPA is required
CONCEPT CHECK
Why is the National
Environmental Policy Act
the cornerstone of U.S.
environmental law?
What are environmental
impact statements?
to respond to all of these comments. Then the Office ofManagement and Budget reviews the new regulations.Implementation and enforcement of the new law oftenfall to state governments, which must send the EPA de-tails for achieving the goals of the new regulations.
ACCOMPLISHMENTS OFENVIRONMENTAL LEGISLATION
During the period since Earth Day 1970, Congress haspassed almost 40 major environmental laws that addressa wide range of issues, such as endangered species,clean water, clean air, energy conservation, hazardouswastes, and pesticides. This tough interlocking mesh oflaws greatly increased federal regulation of pollution toimprove environmental quality.
Despite imperfections, environmental legisla-tion has had overall positive effects. Since 1970,
• Eight national parks have been established(Figure 3.10), and the National WildernessPreservation System now totals more than 43million hectares (106 million acres).
full cost accounting The
process of evaluat-
ing and presenting
to decision makers
the relative benefits
and costs of vari-
ous alternatives.
STOPSTOP
Mesquite Flat Dunes in Death Valley National Park
Figure 3.10
This national park, formerly a national monument, was
created in 1994.
58 CHAPTER 3 Environmental History, Politics, and Economics Environmental Legislation 59
The water supply for a town or city is treated before use so it
is safe to drink. Photographed in Miami, FLorida.
Water treatment plant Figure 3.11
697028_ch03_3rd.qxd 8/29/06 10:01 AM Page 58

Natural resource depletion If a manufacturingfirm produces some product (output) but in the processwears out a portion of its plant and equipment, thefirm’s output is counted as part of GDP, but the depreci-ation of capital is subtracted in the calculation of NDP.Thus NDP is a measure of the net production of theeconomy, after a deduction for used-up capital. In con-trast, when an oil company drains oil from an under-ground field, the value of the oil produced is counted aspart of the nation’s GDP, but no offsetting deduction toNDP is made to account for the fact that nonrenewableresources were used up (Figure 3.13).
In principle, the draining of the oil field is a type of depreciation, and the oil company’s net product should be accordingly reduced. The samepoint applies to any other natural resource that is de-pleted in the process of production. Natural capital is avery large part of a country’s economic wealth, and weshould treat it the same as human-made capital.
60 CHAPTER 3 Environmental History, Politics, and Economics
conomics is the study of how people usetheir limited resources to try to satisfytheir unlimited wants. Seen through aneconomist’s eyes, the world is one large
marketplace, where resources are allocated to a varietyof uses, and where goods—a car, a pair of shoes, a hog—and services—a haircut, a museum tour, aneducation—are consumed and paid for. Ina free market, supply and demand deter-mine the price of a good. If something ingreat demand is in short supply, its price willbe high. High prices encourage suppliers toproduce more of a good or service, as longas the selling price is higher than the cost ofproducing the good or service. This interac-tion of demand, supply, price, and cost un-derlies much of what happens in the U.S.economy, from the price of a hamburger tothe cycles of economic expansion (increasein economic activity) and recession (slow-down in economic activity).
Economies depend on the naturalenvironment as sources for raw materials andsinks for waste products (Figure 3.12).Both sources and sinks contribute to nat-
ural capital. According to economists, theenvironment provides natural capital forour production and consumption. Re-source degradation and pollution representthe overuse of natural capital. Resource degra-dation is the overuse of sources, and pollu-tion is the overuse of sinks; both threatenour long-term economic future.
NATIONAL INCOME ACCOUNTS AND THE ENVIRONMENT
Much of our economic well-being flows from natural,rather than human-made, assets like land, rivers, theocean, oil, timber, and the air we breathe.
Ideally, for the purposes of eco-nomic and environmental planning, thenational income accounts should mea-sure the use and misuse of natural re-sources and the environment. Two mea-sures used in national income accountingare gross domestic product (GDP) and net do-mestic product (NDP). Both GDP and NDPprovide estimates of national economicperformance that are used to make im-portant policy decisions.
Unfortunately, current nationalincome accounting practices do not in-corporate environmental factors. Two im-portant conceptual problems exist withthe way the national income accounts cur-rently handle the economic use of naturalresources and the environment: naturalresource depletion and the cost and ben-efits of pollution control. Better account-ing for environmental quality—both re-source depletion and pollution—wouldhelp address whether for any given activ-ity the benefits (both economic and envi-ronmental) exceed the costs.
Explain how economics is related to
natural capital. Make sure you include
sources and sinks.
Give two reasons why the national income
accounts are incomplete estimates of
national economic performance.
Distinguish among the following economic
terms: marginal cost of pollution, marginal
cost of pollution abatement, and optimum
amount of pollution.
Describe various approaches to pollution
control, including command and control
regulation and incentive-based regulation.
LEARNING OBJECTIVES
Environmental Economics
E
The Hibernia oil platform on the Grand Banks in the
Atlantic Ocean Figure 3.13
The oil field being drained under the seafloor is part of the U.S. GDP. The
fact that it will be drained dry someday is not taken into account.
natural capitalEarth’s resources
and processes that
sustain living or-
ganisms, including
humans; includes
minerals, forests,
soils, groundwater,
clean air, wildlife,
and fisheries.
nationalincomeaccounts A mea-
sure of the total in-
come of a nation’s
goods and services
for a given year.
VisualizingEconomics and the environment Figure 3.12
Sources are that partof environment fromwhich materials move
Natural Capital
Economies depend on natural capitol for raw materiels and sinks for waste products
Sinks are that part ofenvironment that receiversinput of materials
Rawmaterials
Wasteproducts
Economy
Products andmoney flowbetweenproduction andconsumption
Production Consumption
Products
Money
Global Locator
697028_ch03_3rd.qxd 8/29/06 10:01 AM Page 60

AN ECONOMIST’S VIEW OF POLLUTION
An important aspect of the operation of afree-market system is that the person con-suming a product should pay for all thecost of producing it. However, consump-tion or production of a product often hasan external cost.
A product’s market price does notusually reflect an external cost—that is,the buyer or seller doesn’t pay for it. As aresult, the market system generally doesnot operate in the most efficient way.
Consider the following example ofan external cost. If an industry makes aproduct and, in so doing, also releases apollutant into the environment, the prod-uct is bought at a price that reflects thecost of making it but not the cost of thepollutant’s damage to the environment.This damage is the external cost of theproduct. Because this damage is not in-cluded in the product’s price and becausethe consumer may not know that the pol-lution exists or that it harms the environ-ment, the cost of the pollution has no im-pact on the consumer’s decision to buy theproduct. As a result, consumers of theproduct may buy more of it than theywould if its true cost, including the cost ofpollution, were known or reflected in theselling price.
The failure to add the price of environmentaldamage to the cost of products generates a marketforce that increases pollution. From the perspective ofeconomics, then, one of the causes of the world’s pollu-tion problem is the failure to consider negative exter-nal costs in the pricing of goods. We now examine in-dustrial pollution from an economist’s viewpoint, as apolicy-making failure. Keep in mind, however, thatlessons about the economics of industrial pollution alsoapply to other environmental issues (such as resourcedegradation) where harm to the environment is a con-sequence of economic activity.
How much pollution is acceptable?To assign a proper price to pollution, econ-omists first try to answer the basic question“How much pollution should we allow inour environment?” Imagine two environ-mental extremes: a wilderness in which nopollution is produced but neither aregoods, and a “sewer” that is completely pol-luted from excess production of goods. Inour world, a move toward a better environ-ment almost always entails a cost in termsof goods.
How do we, as individuals, as acountry, and as part of the larger interna-tional community, decide where we wantto be between the two extremes of a wilder-ness and a sewer? Economists analyze themarginal costs of environmental qualityand of other goods to answer such ques-tions. A marginal cost is the additional costassociated with one more unit of some-thing. Two examples of marginal costs as-sociated with pollution are the effects ofpollution on human health and on organ-isms in the natural environment.
The trade-off between environmen-tal quality versus more goods involves bal-ancing marginal costs of two kinds: (1) thecost, in terms of environmental damage,of more pollution (the marginal cost ofpollution) and (2) the cost, in terms of giv-ing up goods, of eliminating pollution
(the marginal cost of pollution abatement).Determining the marginal cost of pollution
involves assessing the risks associated with the pollu-tion. Let’s consider a simple example involving the mar-ginal cost of sulfur dioxide, a type of air pollution pro-duced during the combustion of fuels containingsulfur. Sulfur dioxide is removed from the atmosphereas acid rain, which causes damage to the environment,particulary aquatic ecosystems. Economists add up theharm of each additional unit of pollution—in this ex-ample, each ton of sulfur dioxide added to the atmo-sphere. As the total amount of pollution increases, theharm of each additional unit usually also increases, and
Environmental Economics 63
The cost and benefits of pollution controlImagine that a company has the following choices: Itcan produce $100 million worth of output and, at thesame time, dump its wastes, polluting the local river.Alternatively, if the company uses 10 percent of itsworkers to properly dispose of its wastes, it avoids pol-luting but only gets $90 million of output. Under cur-rent national income accounting rules, if the firmchooses to pollute rather than not to pollute, it willmake a larger contribution to GDP ($100 millionrather than $90 million), because the national incomeaccounts attach no explicit value to a clean river. In anideal accounting system, the economic cost of envi-ronmental degradation is subtracted in the calcula-
tion of a firm’s contribution to GDP, and activities thatimprove the environment—because they provide realeconomic benefits—are added to GDP (Figure
3.14). To summarize, we should subtract estimatesof environmental damage from GDP.
Incorporating resource depletion and pollu-tion into the national income accounting is importantbecause GDP and related statistics are used continuallyin policy analyses. An increasing number of econo-mists, government planners, and scientists support re-placing GDP and NDP with a more comprehensivemeasure of national income accounting that includesestimates of both natural resource depletion and theenvironmental cost of economic activities.
62 CHAPTER 3 Environmental History, Politics, and Economics
external cost A harmful environ-
mental or social
cost that is borne
by people not
directly involved in
buying or selling
a product.
marginal costof pollution The
added cost for all
present and future
members of soci-
ety of an additional
unit of pollution.
Workers in yellow protective clothing
test toxic waste prior to safely dispos-
ing of it in a hazardous waste landfill.
These cleanup costs should be added
to the GDP accounts because the
cleanup improves the environment.
Pollution cleanup and GDP Figure 3.14
697028_ch03_3rd.qxd 8/29/06 10:01 AM Page 62
mand and control laws requireuse of a specific pollution con-trol method, such as the use ofcatalytic converters in cars todecrease polluting exhaustemissions. In other cases, aquantitative goal is set. TheClean Air Act Amendments of1990 established a goal of a 60percent reduction in nitrogenoxide emissions in passengercars by the year 2003. Usually,all polluters must comply withthe same rules and regulationsregardless of their particularcircumstances.
Some economists crit-icize command and controlregulation for being morecostly than necessary. Theythink command and controlregulation sets environmentalpollution levels much lowerthan the economically optimum level of pollution. Most economists, whether progressive or conservative, preferincentive-based regulation over command and con-trol regulation. Incentive-based regulation is a market-oriented strategy. It seeks to use the economic forces ofa free market to alleviate the pollution problem—thatis, it depends on market incentives to reduce pollutionand minimize the cost of control.
Economists use this diagram toidentify the point at which themarginal cost of pollutionequals the marginal cost ofabatement—that is, the pointwhere the two curves intersect.As far as economics is con-cerned, this point represents anoptimum amount of pollution.
There are two majorflaws in the economist’s concept of optimum pollution.First, it is difficult to determine the true cost of environ-mental damage caused by pollution. Second, wheneconomists add up pollution costs, they do not take intoaccount the possible disruption or destruction of theenvironment. The web of relationships within the envi-ronment is extremely intricate and may be more vulner-able to pollution damage than is initially obvious, some-times with disastrous results. This is truly a case wherethe whole is much greater than the sum of its parts, andit is inappropriate for economists to simply add up thecost of lost elements in a polluted environment.
Amount of pollution (in tons of waste discharge)Low High
Low
Hig
hC
ost p
er u
nit o
f was
te (
in d
olla
rs) Marginal
cost ofpollution
Marginal cost of pollution abatement
Economicallyoptimumamount ofpollution
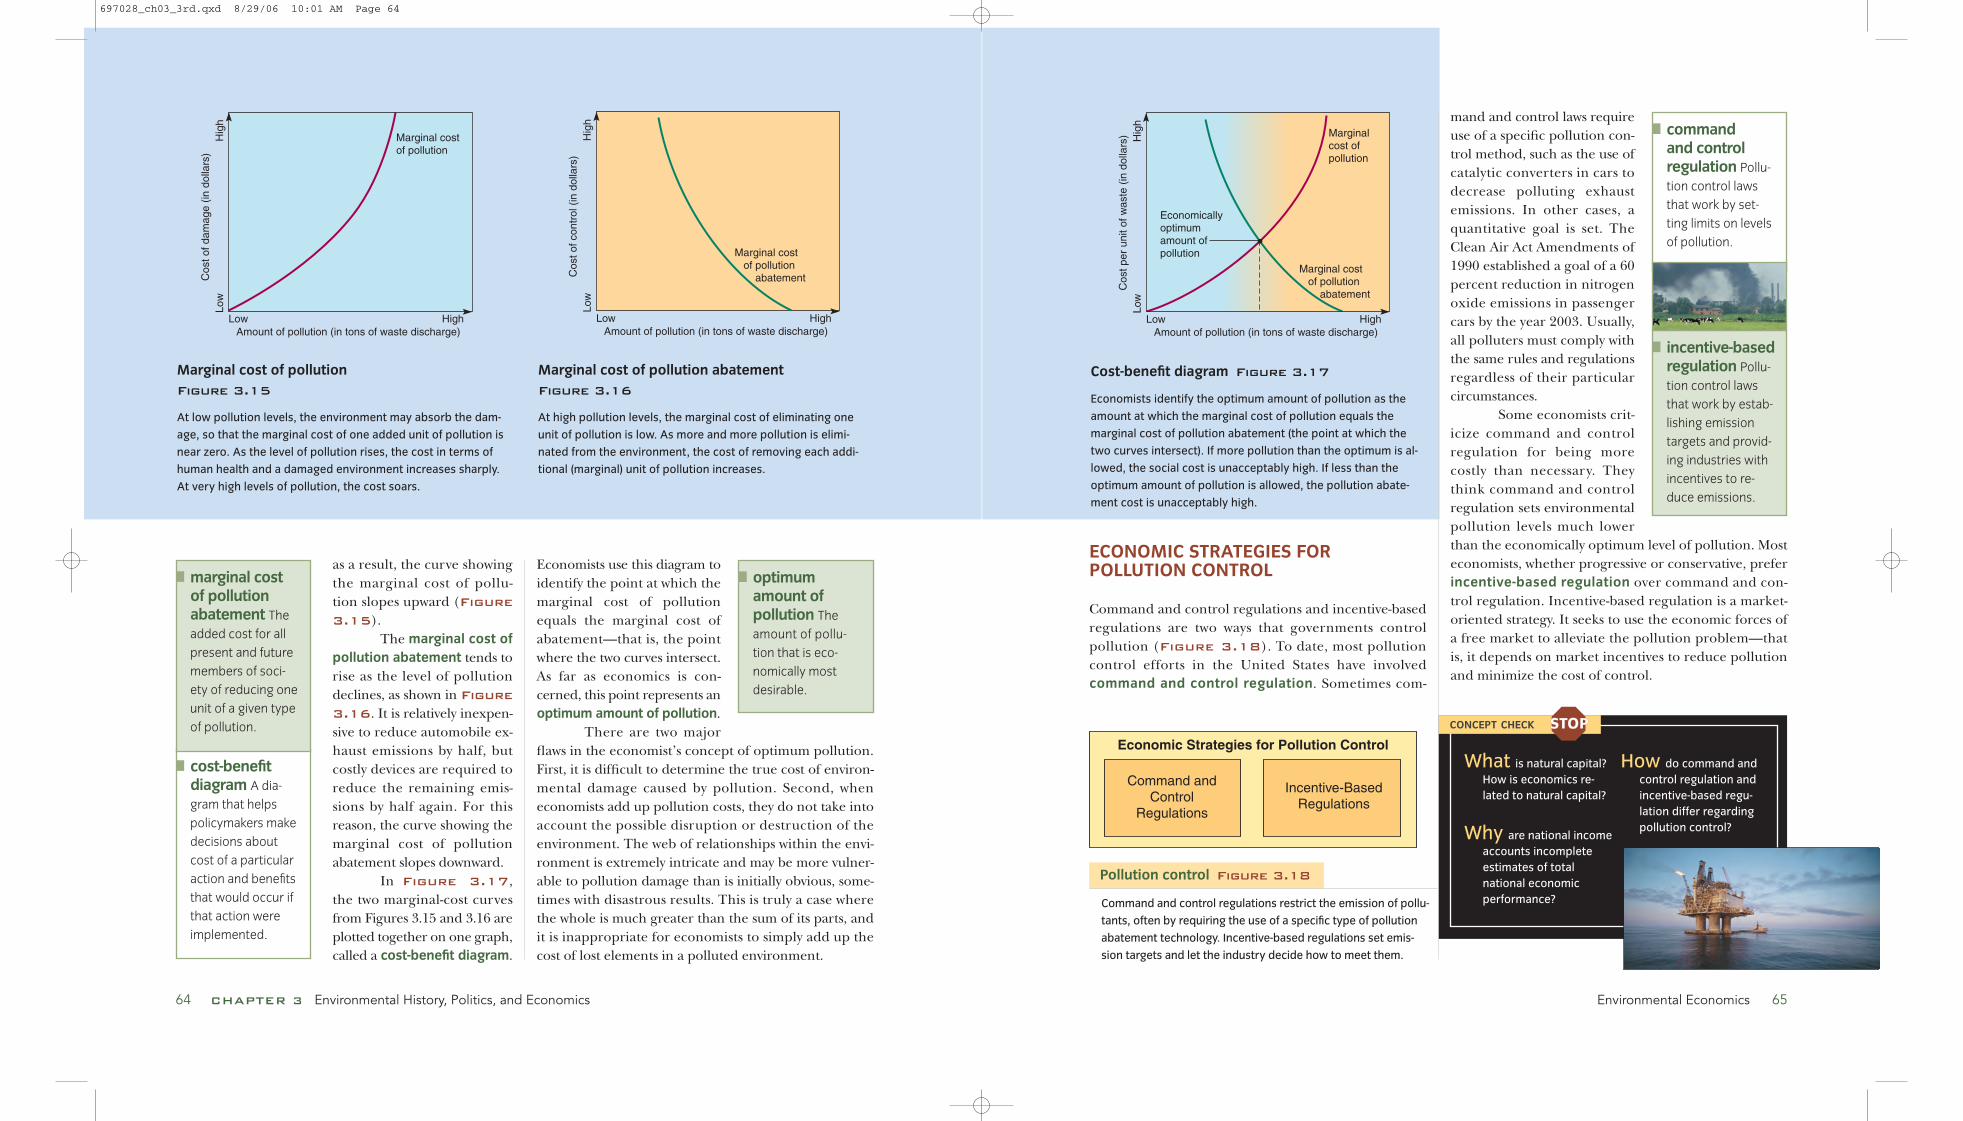
Cost-benefit diagram Figure 3.17
Economists identify the optimum amount of pollution as the
amount at which the marginal cost of pollution equals the
marginal cost of pollution abatement (the point at which the
two curves intersect). If more pollution than the optimum is al-
lowed, the social cost is unacceptably high. If less than the
optimum amount of pollution is allowed, the pollution abate-
ment cost is unacceptably high.
Economic Strategies for Pollution Control
Command and Control
Regulations
Incentive-Based Regulations
Amount of pollution (in tons of waste discharge)Low High
Low
Hig
hC
ost o
f con
trol
(in
dol
lars
)
Marginal cost of pollution abatement
Marginal cost of pollution abatement
Figure 3.16
At high pollution levels, the marginal cost of eliminating one
unit of pollution is low. As more and more pollution is elimi-
nated from the environment, the cost of removing each addi-
tional (marginal) unit of pollution increases.
64 CHAPTER 3 Environmental History, Politics, and Economics
CONCEPT CHECK
What is natural capital?
How is economics re-
lated to natural capital?
Why are national income
accounts incomplete
estimates of total
national economic
performance?
How do command and
control regulation and
incentive-based regu-
lation differ regarding
pollution control?
Marginal costof pollution
Amount of pollution (in tons of waste discharge)Low High
Low
Hig
hC
ost o
f dam
age
(in d
olla
rs)
Marginal cost of pollution
Figure 3.15
At low pollution levels, the environment may absorb the dam-
age, so that the marginal cost of one added unit of pollution is
near zero. As the level of pollution rises, the cost in terms of
human health and a damaged environment increases sharply.
At very high levels of pollution, the cost soars.
command and controlregulation Pollu-
tion control laws
that work by set-
ting limits on levels
of pollution.
incentive-basedregulation Pollu-
tion control laws
that work by estab-
lishing emission
targets and provid-
ing industries with
incentives to re-
duce emissions.
Environmental Economics 65
as a result, the curve showingthe marginal cost of pollu-tion slopes upward (Figure
3.15).The marginal cost of
pollution abatement tends torise as the level of pollutiondeclines, as shown in Figure
3.16. It is relatively inexpen-sive to reduce automobile ex-haust emissions by half, butcostly devices are required toreduce the remaining emis-sions by half again. For thisreason, the curve showing themarginal cost of pollutionabatement slopes downward.
In Figure 3.17,the two marginal-cost curvesfrom Figures 3.15 and 3.16 areplotted together on one graph,called a cost-benefit diagram.
cost-benefitdiagram A dia-
gram that helps
policymakers make
decisions about
cost of a particular
action and benefits
that would occur if
that action were
implemented.
optimumamount of pollution The
amount of pollu-
tion that is eco-
nomically most
desirable.
ECONOMIC STRATEGIES FORPOLLUTION CONTROL
Command and control regulations and incentive-basedregulations are two ways that governments controlpollution (Figure 3.18). To date, most pollutioncontrol efforts in the United States have involvedcommand and control regulation. Sometimes com-
STOPSTOP
marginal costof pollutionabatement The
added cost for all
present and future
members of soci-
ety of reducing one
unit of a given type
of pollution.
Command and control regulations restrict the emission of pollu-
tants, often by requiring the use of a specific type of pollution
abatement technology. Incentive-based regulations set emis-
sion targets and let the industry decide how to meet them.
Pollution control Figure 3.18
697028_ch03_3rd.qxd 8/29/06 10:01 AM Page 64
66 CHAPTER 3 Environmental History, Politics, and Economics Chapter Summary 67
The fall of the Soviet Unionand communist govern-ments in Central and East-
ern Europe during the late 1980srevealed a grim legacy of environ-mental destruction. Chemicals leak-ing out of dump sites contaminatedagricultural soil and water. Build-ings and statues eroded, and entireforests died because of air pollutionand acid rain. One of the most pol-luted areas in the world is the“Black Triangle,” which consists of the bordering regions of easternGermany, the northern Czech Republic, and southwest Poland.
Massive pollution affects human health in the region. Manypeople suffer from asthma, emphy-sema, chronic bronchitis, and otherrespiratory diseases. Levels of cancer,miscarriages, and birth defects areextremely high. Life expectanciesare still lower there than in other industrialized nations. In 2005, theaverage Eastern European lived toage 69—10 years less than the aver-age Western European.
The economic assumptionbehind communism was one ofhigh production and economic self-sufficiency. Governments supportedheavy industry—power plants,
chemicals, metallurgy,and large machinery—at the expense of moreenvironmentally benign service in-dustries. As a result, Central and Eastern Europe became over-industrialized, and mostof the region’s plants lacked the pollution abatementequipment now required in factories in most industrializedcountries.
Experts predict that elimi-nating the pollution legacy of com-munism will take decades. Howmuch will it cost? The numbers arestaggering. Improving the environ-ment in eastern Germany alone willcost up to an estimated $300 billion.
While switching from com-munism to democracy with a free-market economy, current Centraland Eastern European governmentsalso face the responsibility of im-proving the environment. Hungary,Poland, and the Czech Republichave been relatively successful inmoving toward a market economy,generating enough money to investin environmental cleanup. From
1990 to 2000, sulfur dioxide emis-sions in the Czech Republic de-clined 86 percent, nitrogen oxideemissions from industries declined69 percent, and particulate emis-sions declined 91 percent. Economicrecovery is slow in other countries,such as Bulgaria, Romania, and Russia, and severe budgetary prob-lems there have forced the environ-ment to take a back seat to politicaland economic reform.
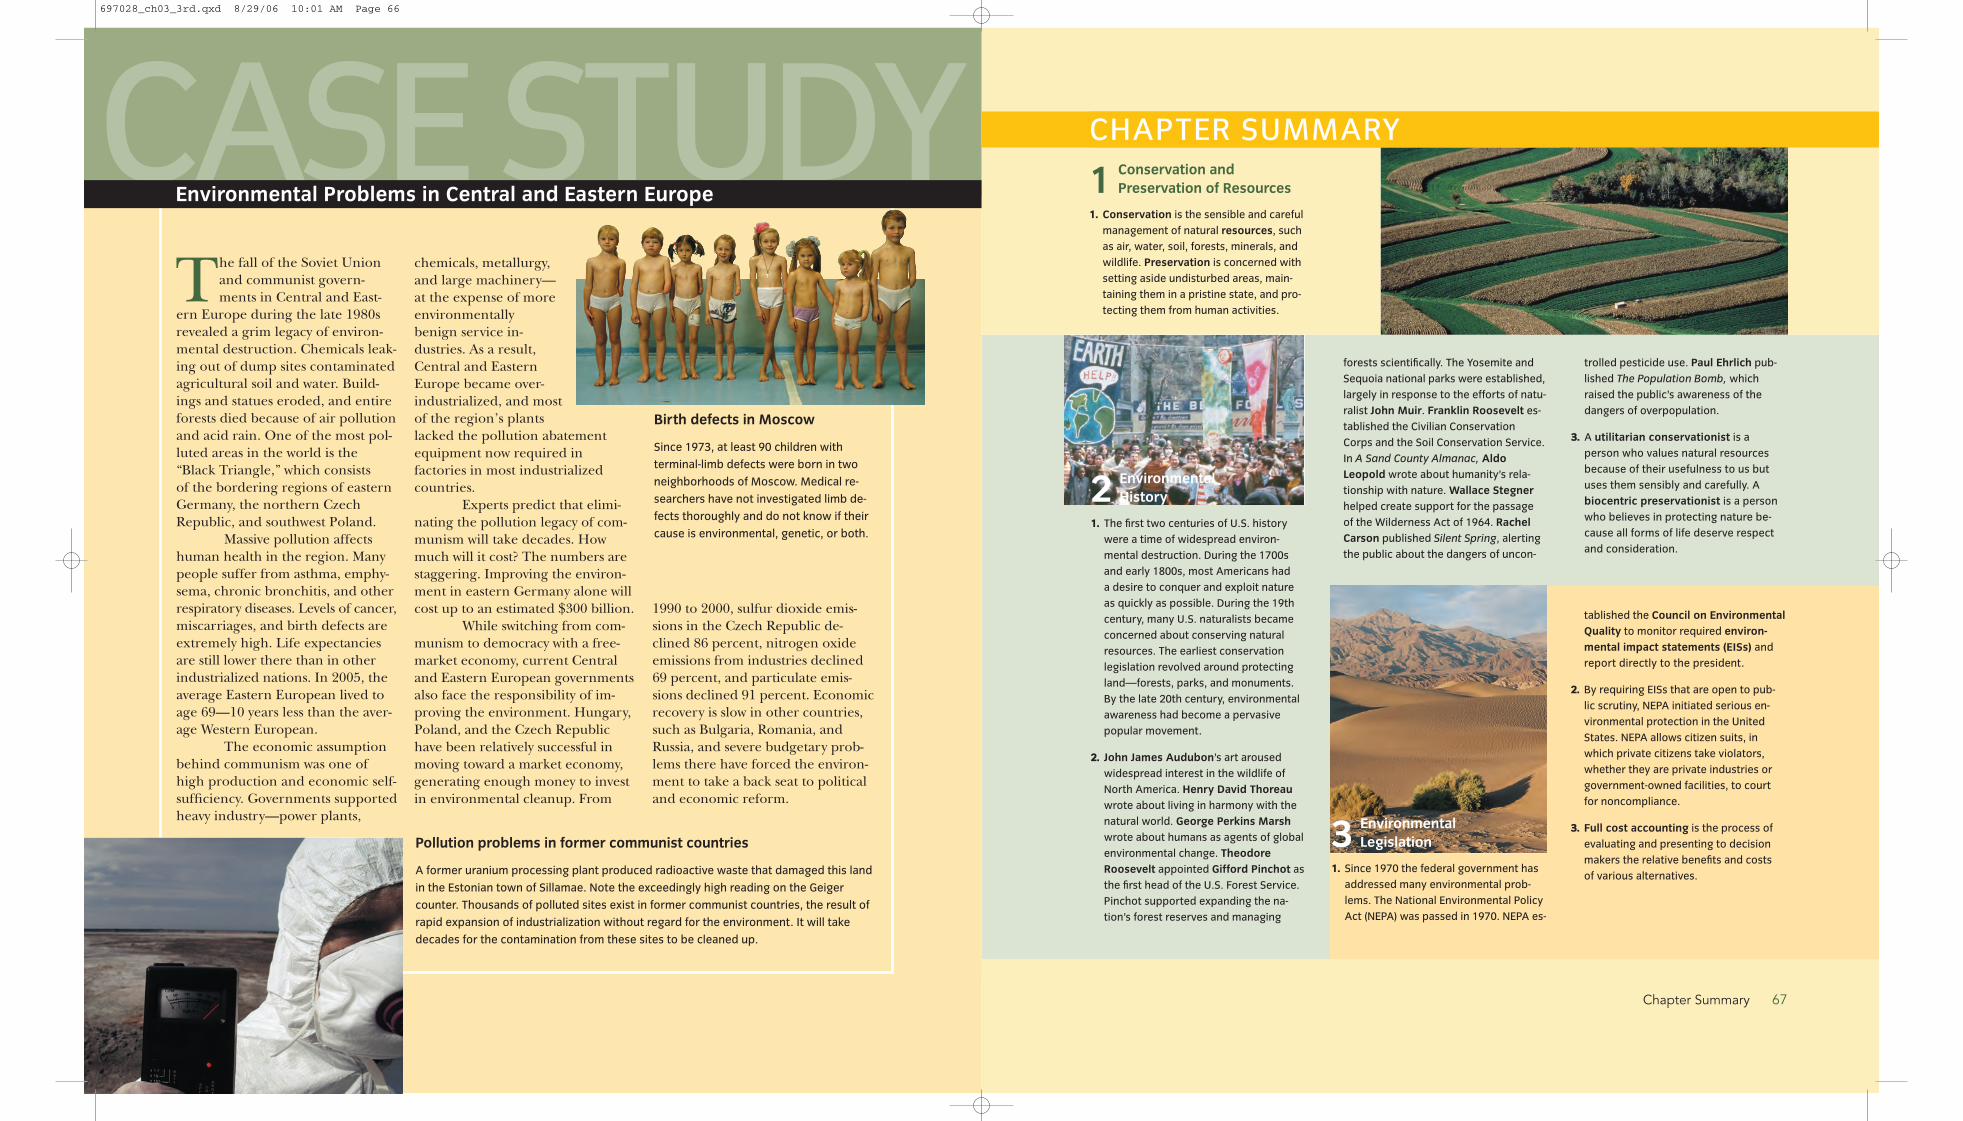
Pollution problems in former communist countries
A former uranium processing plant produced radioactive waste that damaged this land
in the Estonian town of Sillamae. Note the exceedingly high reading on the Geiger
counter. Thousands of polluted sites exist in former communist countries, the result of
rapid expansion of industrialization without regard for the environment. It will take
decades for the contamination from these sites to be cleaned up.
Birth defects in Moscow
Since 1973, at least 90 children with
terminal-limb defects were born in two
neighborhoods of Moscow. Medical re-
searchers have not investigated limb de-
fects thoroughly and do not know if their
cause is environmental, genetic, or both.
CASE STUDYEnvironmental Problems in Central and Eastern Europe
forests scientifically. The Yosemite and
Sequoia national parks were established,
largely in response to the efforts of natu-
ralist John Muir. Franklin Roosevelt es-
tablished the Civilian Conservation
Corps and the Soil Conservation Service.
In A Sand County Almanac, Aldo
Leopold wrote about humanity’s rela-
tionship with nature. Wallace Stegner
helped create support for the passage
of the Wilderness Act of 1964. Rachel
Carson published Silent Spring, alerting
the public about the dangers of uncon-
trolled pesticide use. Paul Ehrlich pub-
lished The Population Bomb, which
raised the public’s awareness of the
dangers of overpopulation.
3. A utilitarian conservationist is a
person who values natural resources
because of their usefulness to us but
uses them sensibly and carefully. A
biocentric preservationist is a person
who believes in protecting nature be-
cause all forms of life deserve respect
and consideration.
tablished the Council on Environmental
Quality to monitor required environ-
mental impact statements (EISs) and
report directly to the president.
2. By requiring EISs that are open to pub-
lic scrutiny, NEPA initiated serious en-
vironmental protection in the United
States. NEPA allows citizen suits, in
which private citizens take violators,
whether they are private industries or
government-owned facilities, to court
for noncompliance.
3. Full cost accounting is the process of
evaluating and presenting to decision
makers the relative benefits and costs
of various alternatives.
3Environmental
Legislation
1. Since 1970 the federal government has
addressed many environmental prob-
lems. The National Environmental Policy
Act (NEPA) was passed in 1970. NEPA es-
CHAPTER SUMMARY
1Conservation and
Preservation of Resources
1. Conservation is the sensible and careful
management of natural resources, such
as air, water, soil, forests, minerals, and
wildlife. Preservation is concerned with
setting aside undisturbed areas, main-
taining them in a pristine state, and pro-
tecting them from human activities.
2Environmental
History
1. The first two centuries of U.S. history
were a time of widespread environ-
mental destruction. During the 1700s
and early 1800s, most Americans had
a desire to conquer and exploit nature
as quickly as possible. During the 19th
century, many U.S. naturalists became
concerned about conserving natural
resources. The earliest conservation
legislation revolved around protecting
land—forests, parks, and monuments.
By the late 20th century, environmental
awareness had become a pervasive
popular movement.
2. John James Audubon’s art aroused
widespread interest in the wildlife of
North America. Henry David Thoreau
wrote about living in harmony with the
natural world. George Perkins Marsh
wrote about humans as agents of global
environmental change. Theodore
Roosevelt appointed Gifford Pinchot as
the first head of the U.S. Forest Service.
Pinchot supported expanding the na-
tion’s forest reserves and managing
697028_ch03_3rd.qxd 8/29/06 10:01 AM Page 66
What is happening in this picture? 69
4Environmental
Economics
1. Economics is the study of how people
use their limited resources to try to sat-
isfy their unlimited wants. Economies
depend on the natural environment as
sources for raw materials and sinks for
waste products. Both sources and sinks
contribute to natural capital, which is
Earth’s resources and processes that
sustain living organisms, including
humans. Natural capital includes min-
erals, forests, soils, groundwater,
clean air, wildlife, and fisheries.
2. National income accounts are a
measure of the total income of a nation’s
goods and services for a given year. An
external cost is a harmful environmen-
tal or social cost that is borne by people
not directly involved in buying or selling
a product. Many economists, govern-
ment planners, and scientists support
a comprehensive measure of national
income accounting that includes esti-
mates of both natural resource deple-
tion and the environmental cost of
economic activities.
3. From an economic point of view, the
appropriate amount of pollution is a
trade-off between harm to the environ-
ment and inhibition of development.
The marginal cost of pollution is the
added cost for all present and future
members of society of an additional unit
of pollution. The marginal cost of pollu-
tion abatement is the added cost for all
present and future members of society
of reducing one unit of a given type of
pollution. Economists think the use of re-
sources for pollution abatement should
increase only until the cost of abatement
equals the cost of the pollution damage.
This results in the optimum amount of
pollution—the amount of pollution that
is economically most desirable.
■ utilitarian conservationist p. 50
■ biocentric preservationist p. 50
■ full cost accounting p. 58
■ natural capital p. 60
■ national income accounts p. 60
■ external cost p. 63
■ marginal cost of pollution p. 63
■ marginal cost of pollution abatement
p. 64
■ cost-benefit diagram p. 64
■ optimum amount of pollution p. 64
■ command and control regulation p. 65
■ incentive-based regulation p. 65
KEY TERMS
CRITICAL AND CREATIVE THINKING QUESTIONS
4. To control pollution, government often
uses command and control regulations,
which are pollution control laws that work
by setting limits on levels of pollution.
Incentive-based regulations are pollu-
tion control laws that work by establish-
ing emission targets and providing indus-
tries with incentives to reduce emissions.
CHAPTER SUMMARY
68 CHAPTER 3 Environmental History, Politics, and Economy
1. The National Environmental Policy Act (NEPA) is sometimes
called the “Magna Carta of environmental law.” What is meant
by such a comparison?
2. If you were a member of Congress, what legislation would you
introduce to deal with each of the following problems?
• Poisons from a major sanitary landfill are polluting your
state’s groundwater.
• Acid rain from a coal-burning power plant in a nearby state is
harming the trees in your state. Loggers and foresters are
upset.
6. Discuss the events that led to the Northwest Forest Plan of
1994.
7. Describe the extent of environmental destruction in formerly
communist countries.
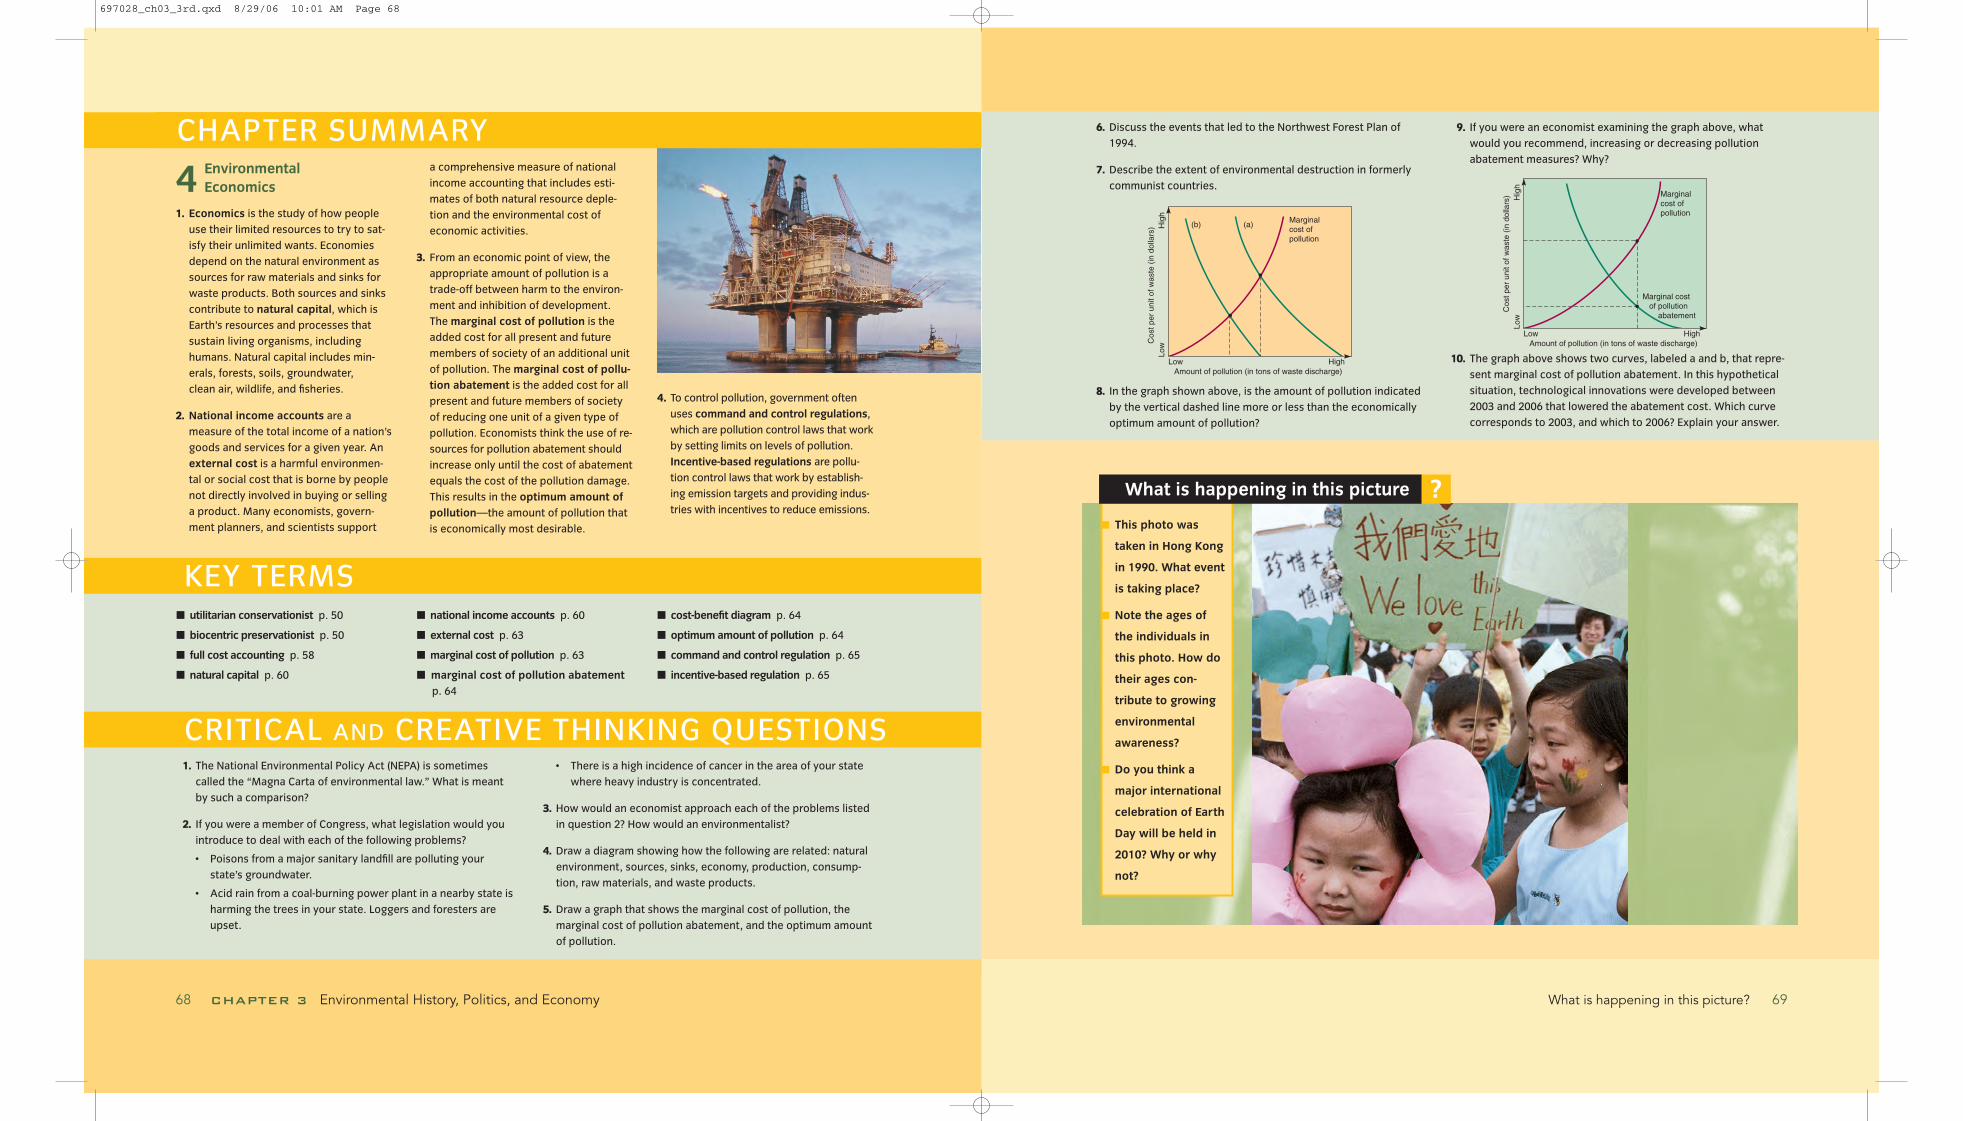
8. In the graph shown above, is the amount of pollution indicated
by the vertical dashed line more or less than the economically
optimum amount of pollution?
• There is a high incidence of cancer in the area of your state
where heavy industry is concentrated.
3. How would an economist approach each of the problems listed
in question 2? How would an environmentalist?
4. Draw a diagram showing how the following are related: natural
environment, sources, sinks, economy, production, consump-
tion, raw materials, and waste products.
5. Draw a graph that shows the marginal cost of pollution, the
marginal cost of pollution abatement, and the optimum amount
of pollution.
Amount of pollution (in tons of waste discharge)Low High
Low
Hig
hC
ost p
er u
nit o
f was
te (
in d
olla
rs)
Marginalcost ofpollution
(a)(b)
■ This photo was
taken in Hong Kong
in 1990. What event
is taking place?
■ Note the ages of
the individuals in
this photo. How do
their ages con-
tribute to growing
environmental
awareness?
■ Do you think a
major international
celebration of Earth
Day will be held in
2010? Why or why
not?
What is happening in this picture ?
9. If you were an economist examining the graph above, what
would you recommend, increasing or decreasing pollution
abatement measures? Why?
10. The graph above shows two curves, labeled a and b, that repre-
sent marginal cost of pollution abatement. In this hypothetical
situation, technological innovations were developed between
2003 and 2006 that lowered the abatement cost. Which curve
corresponds to 2003, and which to 2006? Explain your answer.
Amount of pollution (in tons of waste discharge)Low High
Low
Hig
hC
ost p
er u
nit o
f was
te (
in d
olla
rs) Marginal
cost ofpollution
Marginal cost of pollution abatement
697028_ch03_3rd.qxd 8/29/06 10:01 AM Page 68