environmental compliance and firm performance: evidence from china
TRANSCRIPT

397© Blackwell Publishing Ltd and the Department of Economics, University of Oxford, 2011. Published by Blackwell Publishing Ltd,9600 Garsington Road, Oxford OX4 2DQ, UK and 350 Main Street, Malden, MA 02148, USA.
OXFORD BULLETIN OF ECONOMICSAND STATISTICS, 74, 3 (2012) 0305-9049doi: 10.1111/j.1468-0084.2011.00649.x
Environmental Compliance and Firm Performance:Evidence from ChinaÅ
Xi Yang† and Yang Yao‡
†Department of Economics, Johns Hopkins University, Baltimore, MD, USA(e-mail: [email protected])‡China Center for Economic Research, National School of Development, Peking University,Beijing 100871, China (e-mail: [email protected])
AbstractThis article evaluates the impact of environmental compliance on firms’ innovation andfinancial performance using a panel dataset of Chinese firms for the period of 2000–5. Ourresults show certification of the ISO14000 has a significantly positive impact on firms’profitability. This finding is robust when we take into account possible endogeneity ofcertification, effects of export and types of customers, and possible precertification timetrends. In addition, we find that certified firms have larger per-worker sales volumes andmarket shares in the country, which suggests an alternative mechanism for the Porterhypothesis in the context of a developing economy.
I. IntroductionEnvironmental degradation poses a serious challenge to China’s fast economic growth.Despite well-conceived laws, enforcement varies tremendously on the ground (Wang et al.,2003;Wang andWheeler, 2005). Local governments’focus on economic growth and firms’resistance towards additional compliance have both contributed to weak implementation(SEPA, 2006). Even when local governments have the will to push for environmentallyfriendly policies, regulations often end up a game of ‘cats and mice’ in which firms findways to evade the regulatory agencies. In light of this dire situation, it is important to pro-vide firms a business case for greater environmental compliance. This article is an effortto find empirical evidence for positive links between environmental compliance and firmprofitability using a recent panel survey of 1,200 firms from 12 Chinese cities.The measure of environmental compliance is ISO14000 certification in our article.
The ISO14000 is comprised of a series of standards and is accepted by 111 countries. Its
ÅWe thank two anonymous referees, Robert Elliot, Hanming Fang, Yi Kang, Weicheng Lian, Yan Shen, LindaYueh, Yaohui Zhao, participants of the development economics workshops in CCER at Peking University, andparticipants of ‘The Microeconomic Drivers of Growth in China’ conference held in the University of Oxford on29–30 September 2008 for their helpful comments and suggestions. We are grateful for the efforts of the NationalDevelopment and Reform Commission and National Bureau of Statistics, the People’ s Republic of China in helpingcollecting the data and the International Finance Corporation for its permission to use the data. We also thank LindaYueh for providing part of the data. Of course, all errors remain ours.JEL Classification numbers: O31, Q52, Q55.

398 Bulletin
backbone is the ISO14001 Environmental Management System (EMS). Certification isvoluntary; firms can be certified by successfully passing an independent third-party audit.The standard was launched in China in September 1996.We focus on the ISO14000 for several reasons. First, it is an international standard
for environmental management that applies to all countries and all industries. Second,certified firms are subjected to audits by a third party for the duration of the certification.These two reasonsmake the standard a comparable and objectivemeasure of environmentalcompliance across industries and regions. Third, the standard puts comprehensive and spe-cific requirements on certified firms. Getting certified involves substantial preparation andre-engineering of the management structure and production process which taken togetheris likely to raise the level of environmental compliance within a firm. Lastly, althoughmostprevious studies (see some of the papers reviewed in section II) used pollution emissionsand expenditures on environmental protection to measure firms’ environmental perfor-mance, this kind of data is unreliable in developing countries; using an objective measurelike ISO14000 certification is a better alternative.We first study the link between ISO14000 certification and firm profitability to estab-
lish a business case for environmental compliance. Then we study the mechanisms bywhich the ISO14000 certification generates positive effects on firm profitability. The Porterhypothesis (Porter, 1991; Porter and van der Linde, 1995) suggests that the ‘innovationmechanism’ in the form of more stringent environmental regulation (or better compliancein our case) induces firms to innovate when benefits canmore than offset compliance costs.To test whether this mechanism exist, we use firms’R&D expenditure and number of pat-ents as the outcome variables. As an alternative, we also test the ‘marketing mechanism’through which ISO14000 certification help firms to gain larger market shares because itcould serve as a signal of their managerial and technical competence which is unobservedby customers but affects product quality as well as their ability to meet customer require-ments on environmental standards. This mechanism may be more important in developingcountries because the degree of environmental compliance is low in those countries.1We aim at making two contributions to the literature. The first is to provide a business
case for voluntary environmental compliance in a developing country. With the exceptionof a few (e.g. Murty and Kumar, 2003), most existing studies focus on developed coun-tries. But environmental compliance could be different in developing countries than indeveloped countries. On the one hand, it is relatively more expensive in developing coun-tries because firms there are usually smaller than their counterparts in developed countriesin terms of sales and profits. On the other hand, better compliance can easily single out afirm and enhance its market competitiveness in a developing country where environmentalcompliance is heterogeneous across the board.The second and perhaps more important contribution we want to make, is to take into
account the endogeneity of firms’ decisions on environmental compliance. As shown byWang and Wheeler (2005) on China, the degree of environmental compliance is a jointresult of government regulation and firm initiatives. The cost of abating technology isusually fixed, but pollution and thus government fines increase with output, so the relative1Our marketing mechanism is different from Porter’s assessment that more stringent environmental regulation
could enhance domestic companies’ competitiveness in the international market because this added competitivenessis caused by better technology in his argument.
© Blackwell Publishing Ltd and the Department of Economics, University of Oxford 2011

Environmental compliance and firm performance 399
cost of environmental compliance decreases with output. As a result, better environmen-tal compliance could be a result of better financial performance. Most of the studies to bereviewed in section II do not deal with the endogeneity issue of environmental compliance;our study on the other hand, better identifies the causal relationship between environmentalcompliance and firm performance.ISO14000 is a voluntary standard and clearly subject to the issue discussed above. We
address it by using the fixed-effect panel method and finding a proper instrumental variable(IV) for ISO14000 certification. This IV is the probability of a firm’s being required byits customers for environmental compliance in a specific industry (which we will referto as the ‘industry environmental requirement’ or IER). Factors leading to such customerrequirements are likely to be those imposed on the customers themselves, e.g. consumerand advocacy pressures in the destination countries in the case of exports, so they areexogenous to the suppliers. In addition, the IV is defined at the industrial level, furtherreducing the probability of its being endogenous to individual firms.The rest of the article is organized as follows. Section II below provides a (narrative)
signalling model for the marketing mechanism and reviews the existing literature. SectionIII describes the data, presents descriptive statistics, and defines the variables we will usein our econometric analysis. Section IV tests the causal relationship between ISO14000certification and firms’ profit rates. In addition to the baseline and instrumental variableregressions, we consider the effects of exports and the types of customers affecting ourbaseline results. Exploring the advantages offered by the panel structure of our data, wealso run robustness checks to deal with the time trends that may lead to spurious corre-lation between environmental compliance and financial performance. Section V tests theinnovation and marketing mechanisms that could explain the causal relationship found inthe previous section. Section VI concludes.
II. Motivations and relevant literatureMotivations
Our paper, like many works in the literature, is motivated by the Porter hypothesis whichstates that properly designed environmental regulations force firms to engage in moreactive innovation, which in turn brings benefits that offset the costs imposed by these reg-ulations and make firms more competitive in the market (Porter, 1991; Porter and van derLinde, 1995). In line with this logic, Porter emphasizes that more stringent environmen-tal regulation enhances the competitiveness of domestic companies in the internationalmarket. A corollary then is that more stringent environmental regulation can improve firmprofitability. While the initial reaction of economists tend to be that the Porter hypoth-esis rests on the unrealistic assumption that firms ignore profitable opportunities, recentendeavours have tried to provide it with theoretical rationale based on the assumption offull rationality but with the presence of multiple market imperfections (for a recent survey,see Ambec and Barla, 2006).Aside from the innovation mechanism embedded in the Porter hypothesis, we pro-
pose the marketing mechanism as a way of better environmental compliance to improvefirms’profitability.We contend that in the case of voluntary compliance such as ISO14000
© Blackwell Publishing Ltd and the Department of Economics, University of Oxford 2011

400 Bulletin
certification, this mechanism can be more important than the innovation mechanism.Theoretically, one can think about the marketing mechanism in the framework of a signal-ling game. Customers care about the quality of the products supplied by their suppliers. Butproduct quality is highly correlated with the suppliers’ managerial and technical compe-tence, which cannot be easily observed by a customer. For simplicity, let there be two kindsof firms, one with high competence, and the other with low competence. To single oneselfout from less competent firms, a more competent firm may want to send a signal to itscustomers to show its competence. This signal has to be costly and in the meantime highlycorrelated with its competence. ISO14000 certification is such a signal. It requires techno-logical reengineering and managerial streamlining in addition to on-spot payments.2 Onlyfirms that are ready to foot the costs will eventually apply for the certification, and theyare usually firms that are initially more competent than others. If the levels of competenceof the two groups of firms are sufficiently different, a separate equilibrium is possible.In addition, ISO14000 adds two more benefits to firms. One is that it improves a firm’s
technical andmanagerial competence, and the other is that it satisfies the demand from cus-tomers who care about environmental protection in addition to product quality. These cus-tomersaremorelikelytobeimporters inothercountriesormultinationalcompanies(MNCs).Because the production processes in different industries entail different levels of impact onthe environment, theusefulness of the ISO14000as a signalmayvary across industries.Like in the standard signalling model, ISO14000 brings gains to firms sending this
signal. The most significant gain is to get more profitable orders.While surviving suppliersall get orders, certified firms are more likely to be favoured by customers buying moresophisticated products which are more profitable but also require higher levels of technicaland managerial competence. For example, it is easy to find a family workshop producingT-shirts in a small Chinese town, but Polo shirts are only produced in well-equipped andmanaged factories. In summary, the marketing mechanism suggests that ISO14000 helpsimprove firms’ profitability by gaining market shares.The above narrative model treats ISO14000 as a voluntary choice based on the expec-
tation of better firm performance. This is most likely what happens in reality. It is thereforeimportant for us to control the simultaneity between ISO14000 certification and better firmperformance.
Related literature
There have been many empirical studies testing the relationship between environmentalmanagement and firms’ financial performance. These studies can be grouped into threelevels.On the first level, the relationship between more stringent environmental regulation
and innovation is tested. R&D expenditures and the number of patents are often used asthe indicators for the level of innovation. Several studies find significant positive results.2ISO14000 certification requires firms to plan and implement their own environmental management schemes.
General requirements include: to establish the documented management system; to develop environmental policyand environmental protection commitments; to identify pollution factors and set goals to prevent unnecessarypollutions; and to obey relevant laws and regulations. There is no mandatory requirement for firms to adoptmore environmentally friendly technologies, or buy new green capital equipment. Details can be found athttp://www.iso.org/iso/iso 14000 essentials.
© Blackwell Publishing Ltd and the Department of Economics, University of Oxford 2011

Environmental compliance and firm performance 401
For example, Jaffe and Palmer (1997) find in a panel study of US manufacturing indus-tries for the period of 1973–91 that R&D expenditures are significantly correlated withhigher pollution control costs. But they do not find significant results for the number ofpatents. The first result is confirmed by Brunnermeier and Cohen (2003) who studied theUS manufacturing industries for the period of 1983–92.On the second level, the relationship between environmental regulation andproductivity
is tested. The premise of this test is that firms’ technical efficiency should be improvedif regulation leads to technical progress. This kind of tests began even before the Porterhypothesis was proposed. Early studies tend to derive efficiency indexes from the costfunction and often find that more stringent environmental regulation reduces efficiency(e.g. Gollop and Roberts, 1983). To the extent that stricter rules does increase firms’ com-pliance costs (Berman and Bui, 2001), this result is not surprising. More recent studiesoften test whether more stringent environmental regulation increases firms’ total factorproductivity (TFP). In this regard, the results are mixed. The most significant negativeresult is provided by Gray (1987) who finds that US manufacturing industries lost 30% ofproductivity growth due to more stringent environmental regulation in the 1970s. How-ever, more recent studies find significant positive results. For example, Berman and Bui(2001) find that the TFP of the refineries in southern California increased substantially inthe period of 1979–92 when these firms were subjected to more stringent environmentalregulation. Murty and Kumar (2003) find that better environmental compliance increasesfirms’ technical efficiency in a panel of India firms in the sugar industry. Lanoie, Patry andLajeunesse (2008) further find that in Canada the positive effects are more pronounced inmore competitive industries.On the third level, the relationship between environmental regulation and firms’finan-
cial performance is tested. The core of the Porter hypothesis is concerned with firm profit-ability. If they do not lead to higher profitability, innovation and productivity growth causedbymore stringent environmental regulation are just a kind of distress response firms take toreduce the costs imposed by the regulation. The existing studies, however, have generallyestablished a positive correlation between better environmental management and firms’financial performance. Several studies show that better environmental management raisesthe values of listed firms. Klassen andMcLaughlin (1996), for example, use event analysisto study listed companies and show that (i) news of high levels of toxic emissions resultsin significantly negative abnormal returns; (ii) firms with strong environmental manage-ment practices have better stock price returns than firms with poor practices after a majorenvironmental disaster; and (iii) environmental performance awards result in significantlypositive abnormal returns. Konar and Cohen (2001) conduct a study that relates the marketvalues of the S&P 500 firms to objective measures of their environmental performance.After controlling for variables traditionally thought to explain firm-level financial perfor-mance, they find a 10% reduction in emissions of toxic chemicals results in a $ 34 millionincrease in the market value. Dowell, Hart and Yeung (2000) analyse a sample of US-based MNCs and find that firms adopting a single stringent global environmental standardhave much higher market values, as measured by Tobin’s q, than firms defaulting to lessstringent or poorly enforced host country standards.In addition to studies of stock performance, several other studies have directly exam-
ined the relationship between environmental compliance and firms’ profit performance.
© Blackwell Publishing Ltd and the Department of Economics, University of Oxford 2011

402 Bulletin
For example, Russo and Fouts (1997) analyse a 2-year sample of 243 US firms and finda positive relation between environmental ratings and firms’ returns on assets. Stanwickand Stanwick (2000) classify the US Forbes 500 firms into three categories by their levelsof environmental compliance and/or descriptions of their environmental commitments,and find significant differences of profits across the categories. King and Lenox (2002)test the direction and significance of the relationship between various means of pollutionabatement and profitability and find that waste prevention leads to financial gains.Our study combines the first and third level of tests from a slightly different angle.
While most studies deal with government regulation, we study voluntary compliance.The marketing mechanism has also been mentioned and studied in the literature with-
out being rigorously tested from an econometric standpoint. Several studies point out thesignalling function of ISO14000 certification. For instance, Miles and Covin (2000) arguethat environmental marketing performance is a significant component of a firm’s reputa-tion, and adopting an EMS helps create a reputational advantage that leads to enhancedmarketing and financial performance. In Jiang and Bansal (2003), the authors interviewedmembers of the Canadian pulp and paper industry who had ISO14000 certification tounderstand why they wanted to be certified. They find that market demand and institu-tional pressures were the main factors that pushed firms toward the implementations ofEMS. Jiang and Bansal also point out that in international trade, the credibility of theISO14000 standard may provide a signal that firms are concerned about their host-coun-try’s environment. This view is echoed by Mohamed (2001) who argues that ISO14000offers a unique avenue for export promotion by enhanced image and allows firms to tapin new export markets. From a different angle, Javorcik (2004) also provides evidenceto support the foreign market argument. She finds productivity spillover of foreign directinvestment (FDI) through backward linkages, that is, FDI brings foreign contracts to localfirms and improves their profitability.In terms of the factors determining ISO14000 certification, Bansal and Hunter (2003)
find that firms more concerned with environmental legitimacy and firms with wider inter-national scopes are more likely to certify for ISO14000. The second finding is reinforcedbyWu, Chu and Liu (2007) who find that export-oriented Taiwanese firms are more likelythan domestically focused firms to adopt ISO14000.In summary,most of the empirical studies on themarketingmechanism show the impor-
tance of foreign trade as a strong factor determining ISO14000 certification. Becauseexporters generally become more efficient than non-exporters through their exportingexperiences, there would be a simultaneity issue between ISO14000 and firms’ financialperformance in our sample if exporters were more likely to get ISO14000 certification.The same argument applies to firms selling to MNC customers. We will try to deal withthese issues in our econometric analysis.
III. Data and variablesThe survey
Our data came from two sources. One is a survey conducted by the authors in 2006 on1,200 firms in 12 Chinese cities. The purpose of the survey was to study the practice of
© Blackwell Publishing Ltd and the Department of Economics, University of Oxford 2011

Environmental compliance and firm performance 403
0
1
2
3
4
Mea
n of
pro
fit r
ate
(%)
2000 2001 2002 2003 2004 2005 2000 2001 2002 2003 2004 2005
2000 2001 2002 2003 2004 2005
0
0.1
0.2
0.3
0.4
0.5
Mea
n of
sal
es(m
illio
n Y
uan/
wor
ker)
0
2
4
6
Mea
n of
siz
e
2000 2001 2002 2003 2004 20050
0.05
0.1
0.15
Mea
n of
cap
ital p
erw
orke
r (m
illio
n Y
uan)
Figure 1. Firm size, capital/worker ratio, profit rates and per-worker sales by firm cohorts: 2000–2005
corporate social responsibility (CSR) in Chinese firms. It collected information on CSRawareness, labour standards, environmental standards, quality control, corporate gover-nance, market environment and firm finance. The other source is the National Bureauof Statistics (NBS) regular survey of above-scale industrial firms.3 It provides data forfirms’ financial performance for the period of 2000–5. The 12 cities, from north to south,are Changchun, Dandong, Chifeng, Beijing, Shijiazhuang, Xi’an, Zibo, Chongqing, Shi-yan,Wujiang, Hangzhou and Shunde. They include large provincial capitals, medium-sizecities, and small cities. The choice of these cities was made to capture economic and geo-graphic diversities across the country. Within each city, 100 firms were randomly chosenfrom the NBS 2005 sample of above-scale firms.Our panel is unbalanced. The reason is that some firms dropped from the NBS sample
because they went bankrupt or did not want to cooperate with the NBS anymore. The NBSreplenishes its sample every year. In our sample, we have 1,169 firms with complete datafor 2005. This number drops to 1,047, 716, 594, 512 and 400 for 2004, 2003, 2002, 2001and 2000, respectively. It is quite possible that better performing firms are more likely tosurvive and cooperate with the NBS. Therefore, systematic selective biases would existin our sample if the NBS did not add in new firms on a sufficiently random basis. To testwhether selective bias exists, we group the firms into six cohorts by the year they firstappeared in our sample. Then we compare the means of firm size, capital/worker ratio,profit rate and per-worker sales among these six cohorts. Here firm size is measured bythe number of workers, capital is the gross value of fixed capital, and the profit rate isdefined as a firm’s annual pretax profit divided by its annual sales. Figure 1 shows theresults for these four indicators. Over the years, firms have become slightly smaller, but3Above-scale firms are firms with annual sales volumes of 5 million Yuan or above.
© Blackwell Publishing Ltd and the Department of Economics, University of Oxford 2011

404 Bulletin
slightly more capital intensive. Also, older firms did less well than younger firms in termsof both profitability and per-worker sales, contrary to ‘survival of the fittest’.4 There isindeed some form of selection in our sample.
ISO14000 certification
Figure 2 shows that the rate of ISO14000 certification in our sample by year cohorts. Thereis a rising trend; the years 2004 and 2005 registered much higher rates of certification thanthe previous years. Comparing this with the data shown in Figure 1, we do need to worryabout the simultaneity between certification and performance. Our fixed-effect and instru-mental variable estimations will take care of this issue; our robustness test accounting fortime trends will address spurious correlation between certification and performance overtime.Like conclusions found in the literature, there was a clear linkage between export and
certification.Among exporters, 22.2% were certified by 2005 whereas only 13.4% of non-exporters did so. There was also a clear pattern by firm ownership.We distinguish betweenfour types of ownership: state-owned enterprises (SOEs), domestic private firms, HongKong, Macao and Taiwanese firms (HMT firms), and other FDI firms (FIEs thereafter).FIEs registered the highest rate of certification in our sample; 32.1% of themwere certifiedby 2005. The rate of the second player, the SOEs, however, dropped sharply to 20.7%.HMTfirms and domestic private firms have the lowest certification rates of only 17.5% and13.8%, respectively. The results on FDI firms are similar to the results of other studies onChina. For example, Wang and Jin (2007) find that FDI firms perform better than domes-tic firms on environmental compliance; Dean, Lovely and Wang (2009) find that amongFDI firms, HMT firms are much attracted by low environmental levies when they choose
0.0%
1.0%
2.0%
3.0%
4.0%
5.0%
6.0%
7.0%
2000 andbefore
2001 2002 2003 2004 2005
Figure 2. ISO14000 certification by year cohorts: 2000–2005Notes: The percentage is defined as the number of newly certified firms divided by the total number of firms
available in sample in a particular year.
4There are several possible causes for this finding. One is that new entries in our sample were newly establishedfirms which in general had benefited more from technological progresses. They might also have better human capital.Another possibility is that the NBS deliberately chose better performing firms to add to its sample.
© Blackwell Publishing Ltd and the Department of Economics, University of Oxford 2011

Environmental compliance and firm performance 405
TABLE 1
ISO14000 certification in cities: 2005
Percentage of firmswith ISO14000
City certification (%)Dandong 6.5Changchun 9.3Zibo 11.3Chongqing 13.1Chifeng 17.0Shijiazhuang 18.5Shunde 18.5Beijing 19.8Xi’an 20.6Hangzhou 21.7Wujiang 24.4Shiyan 27.8All sample 17.0
their locations, but firms from OECD countries are not. However, our result on SOEs issomewhat different from the result of Wang and Jin (2007) which states that SOEs are asbad as domestic private firms in controlling pollutants. One explanation for this differenceis that SOEs put more effort on formalities – so they may be more likely to obtain ISOcertifications – but lack the incentives to comply with environmental regulations, possiblybecause they enjoy better protection from the government.There are significant variations among cities although no particular regional pattern
is evident. Table 1 orders the 12 cities by percentage of certified firms in 2005. In thewhole sample, 17% of the sample firms had ISO14000 certification by 2005. Dandong,a slow-growing border city, performed the worst, having only 6.5% of its firms certified,but Shiyan, also a low-income and inland city, performed the best, having 27.8% of itsfirms certified. On the other hand, two coastal cities, Wujiang and Hangzhou, were amongthe top performers, but two other coastal cities, Beijing and Shunde, were only averageplayers. The performance of Shiyan, which topped the list, might be explained by the heavypresence of SOEs in the city, but Chongqing and Changchun, two other cities with manySOEs, were among the worst performers.Variations across industries were also substantial, as shown in Table 2. We recorded
12 industries for our sample based on the Industrial Classification for National EconomicActivities (GB/T4754-2002).5 Table 2 presents the profiles of those industries includingownership composition, share of exporters, and IER, a variable we will define later, inaddition to the rate of certification.Getting certificated by ISO14000 was highly correlated with the sample firms’ en-
vironmental compliance activities. Table 3 presents data for comparison for the year 2005.6
5This is the industrial classification system used by China’s NBS. Details can be found at http://www.stats.gov.cn/tjbz/.6We only have data for the information presented in Table 3 for the year 2005. Our measure of R&D expenditures
includes environment-related R&D, but does not include the direct costs of environmental compliance, such as thoseinvolved in abating technologies and ISO14000 certification.
© Blackwell Publishing Ltd and the Department of Economics, University of Oxford 2011

406 Bulletin
TABLE 2
Industrial profiles: 2005
DomesticNumber SOEs private HMT Foreign Exporters ISO14000 IER
Industry of firms (%) (%) (%) (%) (%) (%) (%)
Mining 15 20.00 80.00 0.00 0.00 26.67 33.33 45.5Food, beverage and 122 6.56 60.66 10.66 22.13 34.43 36.21 36.6cigarette processing
Textile and clothing 147 4.08 69.39 14.97 11.56 61.22 15.72 33.8Paper and furniture products 58 6.90 70.69 13.79 8.62 20.69 47.94 48.7Oil and nuclear fuel processing 19 10.53 84.21 5.26 0.00 15.79 2.11 7.04Chemicals and chemical products 189 4.23 74.07 10.05 11.64 40.21 20.02 31.4Metal processing 142 8.45 74.65 4.93 11.97 33.8 34.21 27.1Machinery 172 12.79 72.09 4.65 10.47 49.42 15.00 26.1Transportation equipment 146 12.24 74.83 5.44 7.48 27.89 10.37 18.6Electrical machinery 65 6.15 76.92 12.31 4.62 52.31 11.96 38.2manufacturingElectronic equipment 57 12.28 43.86 15.79 28.07 66.67 17.61 30.3manufacturingUtility 33 81.82 15.15 0.00 3.03 15.15 6.36 7.84Total 1,165 10.38 69.04 8.83 11.75 40.99 17.00 —Notes: SOEs, state-owned enterprises; HMT, Hong Kong, Macao and Taiwanese; IER, industry environment
requirement.
TABLE 3
ISO14000 and firm’s environmental management: 2005
Average Average Environmental Percentage ofPercentage number of number of investment in firms knowingof firms with workers environment last 3 years cleanerED* (%) in ED* trainings (mil. Yuan) production (%)
With ISO14000 88.27 22 6 3.44 27.93Without ISO14000 45.75 5 1 1.15 8.40Overall sample 51.54 8 3 1.58 11.44Note: *ED stands for the environment department.
Certified firms had about twice the probability than uncertified firms in setting up anenvironmental department, and on average employed three times as many workers thanuncertified firms. They also had significantly more environmental trainings and environ-ment-related investment in the last 3 years than uncertified firms.
ISO14000 certification and firm performance
To gauge the effects of ISO14000 certification, we divide the sample firms of each yearinto two groups, one with certificate, and the other without, and compare their profit ratesin each year in Figure 3. The definition of profit rate is the same as in Figure 1. It is clearfrom Figure 3 that certified firms had significantly higher profit rates than those uncertifiedin all the years; the average gap was 2.51 percentage points.
© Blackwell Publishing Ltd and the Department of Economics, University of Oxford 2011

Environmental compliance and firm performance 407
0
2
4
6
8
2000 2001 2002 2003 2004 2005
Prof
it ra
te (%
)
Year
With ISO14000 Without ISO14000
Figure 3. ISO14000 certification and profit rates
0
0.1
0.2
0.3
0.4
2001 2002 2003 2004 2005
R&
D e
xpen
ditu
res (
%)
Year
With ISO14000 Without ISO14000
Figure 4. ISO14000 certification and R&D expenditures
0
0.03
0.06
0.09
0.12
2001 2002 2003 2004 2005
Pate
nts
(num
ber/m
il. Y
uan)
Year
With ISO14000 Without ISO14000
Figure 5. ISO14000 certification and patents
Figures 4 and 5 make two more comparisons between the two groups of firms, onefor firms’ R&D expenditures and the other for patents, to explore the mechanisms ofISO14000’s positive effects on firm profitability. In the figures, we have divided R&Dexpenditures and the number of patents by sales to account for the impact of firm size.7For R&D expenditures, the unit is decimal; for patents, the unit is the number of patents inmillion of sales. Contrary to the Porter hypothesis, however, uncertified firms have greaterR&D expenditures and hold larger numbers of patents than certified firms. Figure 6 thencompares the two groups of firms in terms of per-worker sales (in million Yuan), andFigures 7 and 8 compare them in terms of market shares in the province and in the country,respectively. Our survey recorded market shares in a discrete fashion allowing firms tochoose among six categories: between 0% and 1%, 1–3%, 3–5%, 5–10%, 10–20% and
7Only Chinese patents are included. The number of firms that had international patents was small. Among the1,177 firms with valid data, only 29 (2.5%) firms reported that they had international patents by 2005.
© Blackwell Publishing Ltd and the Department of Economics, University of Oxford 2011

408 Bulletin
0
0.1
0.2
0.3
0.4
0.5
0.6
2000 2001 2002 2003 2004 2005
Per-
wor
ker s
ales
(mil.
Yua
n/w
orke
r)
Year
With ISO14000 Without ISO14000
Figure 6. ISO14000 certification and per-worker sales
0.0
10.0
20.0
30.0
40.0
50.0
0–1% 1–3% 3–5% 5–10% 10–20% >20%
Perc
enta
ge o
f firm
s
Market share
Without ISO14000
With ISO14000
Figure 7. ISO14000 certification and market shares in home provinces
0.0
10.0
20.0
30.0
40.0
50.0
Perc
enta
ge o
f firm
s
Without ISO14000With ISO14000
0–1% 1–3% 3–5% 5–10% 10–20% >20%Market share
Figure 8. ISO14000 certification and market shares in the country
above 20%. Figures 7 and 8 show the distribution of firms by their market shares in theirhome provinces and in China as a whole, respectively. It is clear from Figure 6 that certifiedfirms had higher per-worker sales. Figures 7 and 8 then show that certified firms were morelikely to have larger market shares in both their home provinces and in China as a whole.Therefore, ISO14000 certification might have boosted firm profitability by enabling thefirms to obtain larger shares in the market. In our regression analysis, we simply assignvalues 1–6 to the six categories of market shares. This is not a perfect measure, but isintended to provide an ordinal estimate for the effects of ISO14000 on market shares. Wewill call the market share in the home province Market Share 1, and the market share inthe country Market Share 2.
© Blackwell Publishing Ltd and the Department of Economics, University of Oxford 2011

Environmental compliance and firm performance 409
Variables
The dependent variables in our analysis are those described in Figures 3–8. Our key explan-atory variable is ISO14000 certification. For our econometric analysis, we define a dummyvariable ISOit to indicate whether a firm had obtained the ISO14000 certification. Specifi-cally, it is equal to 1 if firm i had the certificate by year t, and equal to 0 if it did not.In terms of the control variables, we begin with three time-variant variables that are
frequently used in the literature (e.g. Capon, Farley and Hoenig, 1990) including firm size,per-worker capital stock and the age of firm. Firm size is defined as the logarithm of thenumber of workers. Per-worker capital stock is defined the same as in Figure 1. Firm ageis measured by the number of years since the firm was established.In addition to these three time-variant controls, we will include in our ordinary least
squares (OLS) regressions three sets of time-invariant controls, industry, location andownership, describing inherent firm characteristics. Firms’ financial and environmentalperformance may systematically vary across industries. They may also differ in differentcities due to their different levels of economic development and different local regulationsand trade policies. We add industrial and city dummies in our OLS regressions to controlindustrial and regional factors. Lastly,firms’environmental andfinancial performancemayalso vary across firms of different types of ownership (e.g. Wang and Jin, 2007). In ourregressions, FIEs are used as the reference group.Table 4 presents descriptive statistics of the dependent variables, the ISO14000 dummy,
and the time-variant variables, including their means and standard deviations for the wholesample and by year. The three sets of time-invariant dummy variables are not listed to savespace.
IV. ISO14000 and profitability: empirical resultsBaseline results
The panel structure of our data enables us to use both the pooled ordinary least-squares(POLS) model and the fixed-effect (FE) model to estimate the impact of environmentalcompliance on financial performance. The POLS model is defined as:
Yit =�0+�ISOit + �Sit +�Cit +�Ait +�Xi+χIt + �it , (1)
whereYit is theprofit rateoffirm i inyear t (t=2,000,2,001, . . . , 2,005),ISOitis theISO14000dummy, Sit is the size of firm, Cit is the per-worker capital stock, Ait stands for the age offirm, Xi is a set of time-invariant control variables comprised of ownership, industrial andcity dummies, It is a set of year dummies to control for common time trends, and the Greeksymbols are parameters to be estimated. The coefficient of our interest is �, whichmeasuresthe mean difference in profitability between firms with and without ISO14000.The fixed-effect model we will estimate is
Yit =�0+�ISOit + �Sit +�Cit +�i+χIt + �it , (2)
where �i is the firm fixed effect for firmi. The firm fixed effects control the kind of time-invariant firm quality that is correlated with both profitability and environmental com-pliance but is unobserved in our survey. This kind of firm quality is found to affect the
© Blackwell Publishing Ltd and the Department of Economics, University of Oxford 2011

410 Bulletin
TABLE 4
Descriptive statistics of variables
Overall By year
Variables sample 2000 2001 2002 2003 2004 2005Dependent variablesprofit rate (%) 3.328 2.3958 2.284 3.584 3.554 3.979 3.246
(14.033) (18.813) (16.111) (16.182) (14.857) (12.111) (10.69)R&D expenditures (%) 0.166 — 0.056 0.079 0.131 0.172 0.32
(3.123) (0.398) (0.564) (1.669) (2.196) (5.405)Patents (number/mil. Yuan) 0.012 — 0.001 0.001 0.015 0.004 0.031
(0.321) (0.023) (0.019) (0.356) (0.067) (0.543)Per-worker sales (mil. Yuan) 0.369 0.246 0.279 0.31 0.353 0.40 0.46
(0.558) (0.407) (0.442) (0.476) (0.563) (0.557) (0.657)Market share 1 (1,2,3,4,5,6) — — — — — — 3.83
— — — — — — (1.954)Market share 2 (1,2,3,4,5,6) — — — — — — 2.82
— — — — — — (1.894)Explanatory variableISO14000 (0,1) 0.111 0.045 0.058 0.079 0.094 0.124 0.17
(0.313) (0.209) (0.233) (0.271) (0.292) (0.329) (0.376)Control variablesPer-worker capital 0.154 0.144 0.154 0.153 0.154 0.154 0.158stock (mil. Yuan) (0.230) (0.245) (0.253) (0.224) (0.228) (0.210) (0.237)
Firm size (logarithm 5.508 5.871 5.694 5.637 5.543 5.351 5.358of number of workers) (1.314) (1.352) (1.336) (1.299) (1.323) (1.277) (0.285)
Age of firm (years) 15.428 20.956 18.725 17.585 16.138 13.141 12.584(15.295) (17.168) (16.341) (15.834) (15.286) (14.048) (13.894)
Observations 4,447 400 512 594 716 1,047 1,169Notes: Profit rate is defined as pretax profit divided by sales. R&D expenditures is defined as R&D spend-
ing divided by sales. Patents is the number of patents divided by sales. Per-worker sales is sales divided bynumber of workers. Market share 1 and Market share 2 stand for, respectively, firms’ market shares in theirhome province and the whole country in 2005. Their values 1–6 stand for market shares of 0%–1%, 1%–3%,3–5%, 5–10%, 10–20% and above 20%, respectively. ISO14000 stands for the dummy indicating whether afirm had the certificate in a specific year. Per-worker capital stock is the original value of fixed capital dividedby the number of workers. Firm size is the logarithm of the number of workers. Age of firm is the number ofyears since a firm was established. Standard deviations are given in parentheses.
quality of estimates in the literature (e.g. Christmann, 2000). We have to drop the age offirm as well as the time-invariant variables in model (2) because it is collinear with thefirm and year specific effects.The first two columns of Table 5 present the results of models (1) and (2). The coeffi-
cient of ISO14000 is positive and significant at the 1% significance level in both the POLSmodel and the FE model. The two estimates indicate that being certified by ISO14000increases a firm’s profit rate by 2.5 (in the POLS model) or 3.5 (in the FE model) percent-age points. Both are substantial as the average profit rate in the sample period of 2000–5was 3.3%.As for the control variables, the POLSmodel finds that firms with higher levels of capi-
tal intensity have higher profit rates, and older firms have lower profit rates, while firm sizedoes not matter. In addition, SOEs performmuchworse than FIEs (the omitted ownership),
© Blackwell Publishing Ltd and the Department of Economics, University of Oxford 2011

Environmental compliance and firm performance 411
TABLE 5
ISO14000 and the profit rate: baseline results
Variables POLS FE POLS FEISO14000 dummy (0,1) 2.545*** 3.549*** 2.473*** 3.509*
(0.745) (1.021) (0.696) (2.182)Per-worker capital stock 3.241*** −0.224 0.401*** −0.044(mil. Yuan) (0.983) (1.703) (1.100) (0.172)
Firm size (log number of 0.053 −0.899** 0.17 −1.095**workers) (0.187) (0.489) (0.190) (0.499)
Age of firm (years) −0.133*** — −0.125*** —(0.017) (0.017)
SOEs (0,1) −4.113*** — −4.100*** —(0.871) (0.872)
Domestic private (0,1) −0.871 — −0.429 —(0.699) (0.700)
HMT (0,1) −0.45 — −0.45 —(0.931) (0.931)
IER — — 0.189 0.224(0.931) (0.897)
Constant 4.665** 8.348*** 7.770*** 9.278***(1.860) (2.760) (2.584) (2.806)
Observations 4,433 4,433 4,433 4,433Number of firms 1,165 1,165 1,165 1,165R-Squared 0.1694 0.6471 0.1697 0.5114Notes: The dependent variable is profit rate in percentage. Results for the indus-
try dummies, city dummies and year dummies are included in the POLS models,but are not presented to save space. Standard errors are given in parentheses. *, **and *** indicate, respectively, the significance level of 10%, 5% and 1%.POLS, pooled ordinary least-square; FE, fixed-effect; SOEs, State-owned enter-prise; HMT, Hong Kong, Macao and Taiwanese; IER, industry environmentalrequirement.
but domestic private and HMT firms are not different from FIEs. The FE model finds twodifferent results, though. Capital intensity loses its significance, but larger firms are foundto have smaller profit rates.The FE model provides an almost ideal control on the endogeneity of environmental
compliance that arises from time-invariant missing variables and common time trends, butit cannot control the simultaneity between ISO14000 and firm performance arising fromtime-variant missing variables. It is highly possible that firms began to have better environ-mental compliance at some point because they began to enjoy better financial performanceand therefore could afford to invest to improve their environmental management. Next,we will find a credible instrument for ISO14000 certification to solve this problem.
Instrumental variable estimations
To solve the endogeneity problem, we instrument firms’ environmental compliance withthe industry environment requirement (IER) index. We define IER in the following way.Our questionnaire provided information on whether a sample firm received environmental
© Blackwell Publishing Ltd and the Department of Economics, University of Oxford 2011

412 Bulletin
requirements from its customers, and if yes, when it began. Using this information, wefirst construct ERit (environment requirement), a dummy variable, to indicate whether afirm had received environmental requirements from its customers, that is,
ERit ={1, if firm i received customer requirements in year t0, otherwise.
We then define
IERnt =
i= In∑i=1ERit
In,
where In is the number of firms in industry n. The range of IERnt is [0, 1]. Intuitively, IERntmeasures the environmental protection pressures within one particular industry.Industry environment requirement had reasonable amount of variations among the 12
industries. The last column of Table 2 shows the situation for 2005 (the situation was simi-lar in other years). The standard deviation of IER was 13.1% while its average was 29.3%.Table 6 then gives a sense for the likelihood of environmental requirements imposed bydifferent types of customers based on the sample firms’ perceptions. Customers in devel-oped countries buyingChinese exports had the highest propensity to impose environmentalrequirements on their suppliers. They were followed byMNCs.8 SOEs, FDI firms, and cus-tomers in developing countries formed the third tier. Lastly, domestic private firms had thelowest propensity of requirements. This pattern makes sense as buyers in developed coun-tries face not only stringent environmental regulations imposed by their governments, butalso pressures from consumers and civil groups. MNCs are often headquartered in devel-oped countries and thus subject to the same pressures of buyers in those countries. The lowpropensity of domestic private firms is expected because they have low awareness of socialresponsibilities and government regulation is loosely implemented on them (Shen andYao,2008). It is a bit surprising that SOEs were among the second tier, but this could in partbe supported by Shen and Yao (2008)’s finding that SOEs perform better than domesticprivate firms and HMT firms in most aspects of CSR.With the data presented in Table 2, we now have a sense on how IER was linked
with industrial characteristics. First, it was negatively correlated with the share of SOEsin an industry (the correlation coefficient was −0.51), but positively correlated with theshare of domestic private firms (the correlation coefficient was 0.34). This contrast mightbe caused by SOEs’ stronger bargaining power in dealing with customers compared toprivate firms, or it might be a result of more exporters among private firms than amongSOEs. Second, IER was moderately correlated with the shares of HMT firms, FIEs, andexporters; the respective correlation coefficients were 0.46, 0.22 and 0.32. Lastly, IERwas highly correlated with the rate of ISO14000 certification; the correlation coefficientwas 0.78. That is, IER is a good predictor for a firm’s being certified by the ISO14000in a specific industry.
8MNCs, i.e. large corporations with multinational operations, may overlap with FDI firms in our sample. Wedistinguish them from FDI firms for two reasons. One is that they may not have factories in China but buy productsfrom China; the other is that they are bigger than many FDI firms in China and may behave differently.
© Blackwell Publishing Ltd and the Department of Economics, University of Oxford 2011

Environmental compliance and firm performance 413
TABLE 6
Different types of consumers and their ERs*
Number of Number of firms whofirms who thought most of this
Type of have this type type of consumers Percentconsumers of consumers have imposed ERs (%)
SOEs 686 375 54.7Domestic private 717 262 36.5FDI firms† 421 218 51.8MNCs‡ 349 226 64.8Consumers in 386 290 75.1developedcountries (export)
Consumers in 333 173 52.0developingcountries (export)Notes: *Figures are for the time of the survey (i.e. 2006).
†FDI firms include both FIEs and HMT firms.‡MNCs stands for Multinational Corporations and it may overlap with FDI firms.ER, environmental requirement.
For IER to qualify as a proper instrumental variable, however, we need to further showtwo things: (i) it is exogenous to firms’ financial performance; and (ii) it does not have adirect effect on firms’financial performance unless the effect is realized by way of improv-ing firms’ environmental compliance. For the first, we notice from the evidence presentedabove that customers require their suppliers to meet environmental standards because theythemselves face pressures from their own customers or governments. There is no a priorireason to believe that customers would link their environmental requirements with theirsuppliers’ levels of profitability. However, there could be an indirect reverse causality incertain cases. For example, exporters have a greater chance to be subjected to customerrequirements. But exporters may enjoy higher profit rates than non-exporters because ofthe efficiency gains through export, which creates an indirect reverse causality runningfrom profitability to customer requirements. Similar arguments can be applied to MNCs.It is found that access to suppliers is one of the significant determinants for FDI locationin China (Amiti and Javorcik, 2008; Dean et al., 2009). To the extent that they offer betterorders to suppliers than other kinds of customers (e.g. through the linkage effect shown byJavorcik, 2004), the role of MNCs is equivalent to foreign buyers’. Using IER, an indus-try-level variable, instead of the firm-level variable ER as the instrumental, helps mitigatethe issue because there are both exporters and domestic sellers and firms with and withoutMNC customers in one industry.9 In the next subsection, wewill test our baseline results bydividing the sample into subsamples by firms’ export status and their types of customers.It is harder to show that IER does not have a direct effect on firm profitability. To the
extent that ISO14000 serves as a signal for better firmmanagement and thus attracts orders,
9It remains a question as to where the firm-level variations of ISO14000 certification came from if we believe thatIER is a good instrument for the certification. This, however, can be understood in the framework of our signallingmodel. Facing the same level of pressure, firms in the same industry might not have the same level of incentive tosend the signal; a separate equilibrium is possible if firms’ abilities to foot the costs of certification differ sufficiently.
© Blackwell Publishing Ltd and the Department of Economics, University of Oxford 2011

414 Bulletin
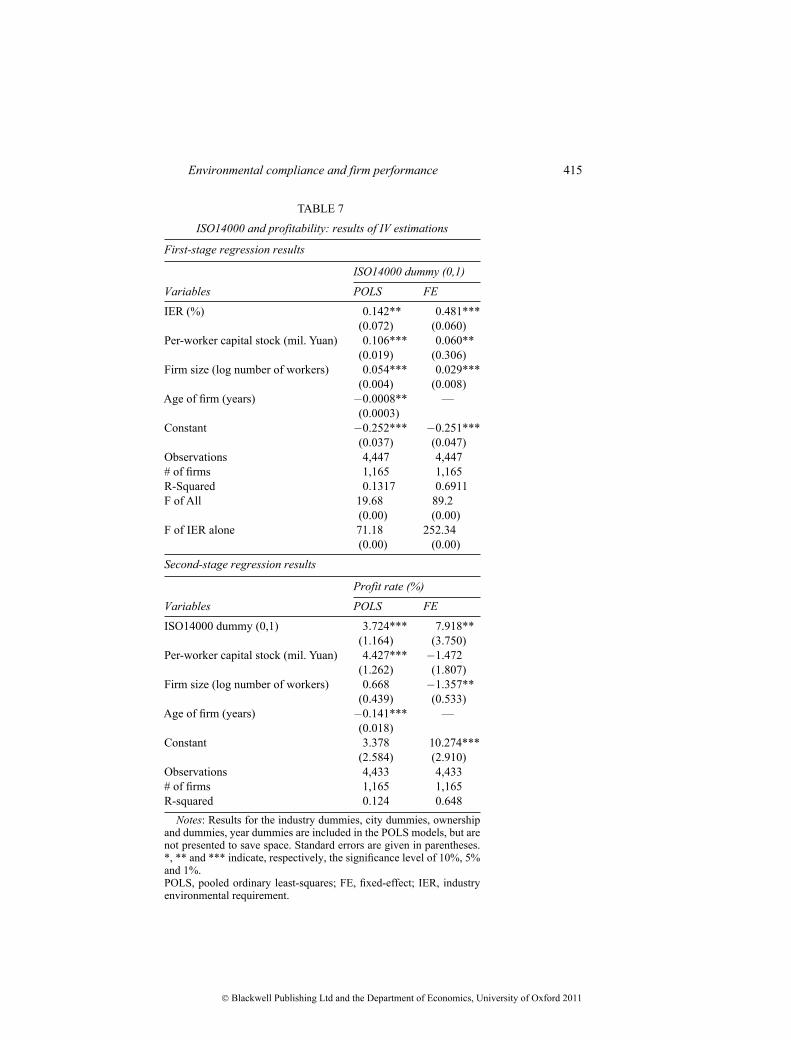
firms without ISO14000 may try to better their financial performance (or improve theirmanagement which ultimately leads to better financial performance) in order to attractmore orders when more customers of their industry begin to require adherence to higherenvironmental standards. To rule out this possibility, we add IER into the baseline regres-sions presented in the first two columns of Table 5 and give the new results in the lasttwo columns of the same table. As one can see, IER is not significant in either the POLSor the FE regression while the ISO14000 dummy is still significant in both regressions.Therefore, it is safe to conclude that IER does not have a direct effect on firm profitability.The upper panel of Table 7 reports the first-stage regression results for both the POLS
model and the FE model. Following the recent literature on the probit model with paneldata (Fernandez-Val, 2007), we estimate the linear probability model instead of the probitmodel in the first stage. The instrument in both models has highly significantly positivecoefficients. In addition, the F-statistics are 71.18 and 252.34, respectively, when only theinstrument (and the firm and year dummies in the case of the FE regression) is includedin the first-stage regressions. Therefore, IER does not have a weak instrument problem(Stock, Wright and Yogo, 2002).Before presenting the results of the instrumental variable regressions, we report the
Hausman test for the endogeneity of ISO14000 certification. The result shows that theP-value equals 0.1549, which implies that ISO14000 certification is endogenous to profit-ability. Therefore, the instrumental variable estimations will give us more reliable re-sults.The second-stage regression results are presented in the lower panel of Table 7.
ISO14000 certification still has highly significant and positive coefficients in both models.Indeed, their magnitudes are larger than those in the baseline results. This then concludesour first set of tests to establish a business case for environmental compliance.
Robustness checks
The last subsection left out one issue, namely, the impacts of export and MNC customers.To disentangle the true impacts of environmental compliance from the impacts of otherimprovements related to foreign or MNC customers, we decompose our sample by exportstatus and whether a firm had MNC customers. Unfortunately, the survey did not providea firm’s export status and customer types except for the year 2005. Here we assume thatexporters of 2005 (488 of them) exported in the whole period of 2000–5, and make similarassumptions for firms having MNC customers in 2005 (335 of them).10Table 8 provides the results for the two subsamples divided by the export status.We esti-
mate both a plain version and an instrumented version of the POLS and FEmodels for eachsubsample. In the exporter sample, the ISO14000 dummy remains significant in all fourregressions; in thenon-exporter sample, it is significant inall but the instrumentedFEregres-sion. The insignificant result of the instrumented FE for non-exportersmay have somethingto dowith smaller variations of IER in the subsample.While IERhad a standard deviation of0.41 in the exporter sample, the corresponding figure in the non-exporter sample was 0.33.
10To be exact, we are estimating the effects of certification conditional on firms’ export status and types of cus-tomers. Possible correlations between certification and the error term are taken care of by the firm fixed effect andthe instrument variable estimation.
© Blackwell Publishing Ltd and the Department of Economics, University of Oxford 2011
Environmental compliance and firm performance 415
TABLE 7
ISO14000 and profitability: results of IV estimations
First-stage regression results
ISO14000 dummy (0,1)
Variables POLS FEIER (%) 0.142** 0.481***
(0.072) (0.060)Per-worker capital stock (mil. Yuan) 0.106*** 0.060**
(0.019) (0.306)Firm size (log number of workers) 0.054*** 0.029***
(0.004) (0.008)Age of firm (years) −0.0008** —
(0.0003)Constant −0.252*** −0.251***
(0.037) (0.047)Observations 4,447 4,447# of firms 1,165 1,165R-Squared 0.1317 0.6911F of All 19.68 89.2
(0.00) (0.00)F of IER alone 71.18 252.34
(0.00) (0.00)
Second-stage regression results
Profit rate (%)
Variables POLS FEISO14000 dummy (0,1) 3.724*** 7.918**
(1.164) (3.750)Per-worker capital stock (mil. Yuan) 4.427*** −1.472
(1.262) (1.807)Firm size (log number of workers) 0.668 −1.357**
(0.439) (0.533)Age of firm (years) −0.141*** —
(0.018)Constant 3.378 10.274***
(2.584) (2.910)Observations 4,433 4,433# of firms 1,165 1,165R-squared 0.124 0.648Notes: Results for the industry dummies, city dummies, ownership
and dummies, year dummies are included in the POLS models, but arenot presented to save space. Standard errors are given in parentheses.*, ** and *** indicate, respectively, the significance level of 10%, 5%and 1%.POLS, pooled ordinary least-squares; FE, fixed-effect; IER, industryenvironmental requirement.
© Blackwell Publishing Ltd and the Department of Economics, University of Oxford 2011

416 Bulletin
TABLE8
Exportersversusnon-exporters
Exporters
Non-exporters
Instrumented
Instrumented
Instrumented
Instrumented
Variables
POLS
POLS
FEFE
POLS
POLS
FEFE
ISO14000dummy(0,1)
2.135**
2.204*
3.483**
4.120**
2.219**
1.196**
0.146**
0.782
(0.962)
(1.344)
(1.370)
(1.821)
(0.967)
(0.551)
(0.067)
(1.113)
Per-workercaptial
0.315**
0.347**
−3.153*
−3.612*
0.364***
0.401**
−0.3436*
−0.354*
stock(mil.Yuan)
(0.158)
(0.176)
(1.926)
(2.004)
(0.127)
(0.188)
(0.192)
(0.193)
Firmsize(lognumber
0.500*
0.729
−1.541**
−2.053
−0.0513
0.042
−1874**
−1.911**
ofworkers)
(0.273)
(0.597)
(0.640)
(0.703)
(0.271)
(0.440)
(0.654)
(0.656)
Ageoffirm(years)
−0.148***
−0.155***
——
−0.090***
0.092***
——
(0.025)
(0.03)
(0.022)
(0.023)
SOEs(0,1)
−3.212**
−3.590**
——
−5.859***
−6.005***
——
(1.285)
(1.559)
(1.251)
(1.364)
Domesticprivate(0,1)
1.473
1.2
——
−2.381**
−2.553**
——
(0.912)
(1.114)
(1.095)
(1.266)
HMT(0,1)
0.118
−0.236
——
−0.141
−0.393
——
(1.196)
(1.454)
(1.465)
(1.737)
Constant
−24.27***
−25.225***
11.649***
13.282***
6.393**
6.076**
13.248***
13.213***
(3.313)
(3.994)
(3.523)
(3.708)
(2.530)
(2.791)
(3.557)
(3.556)
Observations
1.894
1.894
1.894
1.894
2.517
2.517
2.517
2.517
#offirms
488
488
488
488
677
677
677
677
R-squared
0.1574
0.1515
0.562
0.562
0.094
0.092
0.708
0.708
Notes:Resultsfortheindustrydummies,citydummies,ownershipdummies,yeardummiesareincludedinthePOLSmodels,butarenotpresentedtosavespace.
Standarderrorsaregiveninparentheses.*,**and***indicate,respectively,significancelevelof10%,5%and1%.
POLS,pooledordinaryleast-squares;FE,fixed-effect;SOEs,state-ownedenterprises;HMT,HongKong,MacaoandTaiwanese.
© Blackwell Publishing Ltd and the Department of Economics, University of Oxford 2011

Environmental compliance and firm performance 417
Table 9 then presents the results for the two subsamples by customer type. Again, weestimate the same four models for each subsample. The results are broadly similar to thosepresented in Table 8. Firms with MNC customers behave very much like exporters, andfirms without MNC customers behave very much like non-exporters. The instrumentedFE regression for firms without MNC customers does not produce a significant result forISO14000 possibly also because IER had smaller variations in this group of firms (the stan-dard deviation of IER was 0.34) than firms with MNC customers (the standard deviationof IER was 0.42).Another potential problem of our estimates is that the positive effects of ISO14000may
only capture firm-specific time trends. It is possible that firms began to consider ISO14000certification after their profitability began to improve because it was at this point thatthey began to have enough money to pay for the certification. ISO14000 certificationthus was only a nominal event signalling the existing trend of improving profitabilityrather than a trigger for better performance. To show which was the case, we replacethe ISO14000 dummy in model (2) by a set of pre-ISO14000 year dummies PreISOkit ,k=−1, −2, . . ., −5 and a set of post-ISO14000 year dummiesPostISOkit , k=0, 1, 2, . . ., 5.Then we estimate the following FE model:
Yit =�0+−1∑
k=−5�kPreISOkit +
5∑k=0
�kPostISOkit + �Sit +�Cit +�i+ It + �it. (3)
If there were a pre-existing time trend for improving profitability, we would expect themagnitudes of �k to increase or to turn from negative to positive when k moves from −5to 0.Table 10 presents the results of model (3). Except PostISO 0 and PostISO 1, no other
trend variable is significant. In particular, there is no pre-certification trend. The year of cer-tification is clearly a structural break at which profit rate increases significantly. However,the positive effect of certification is concentrated in the first 2 years after certification.Related to the time trend is a possibility that certified firms made more investment
before they were certified but the effects of investment did not show up immediately. Ifthis had been true, the positive effects of ISO14000 would have picked up the effects ofinvestment before certification. To check if it was the case, we estimate model (3) againchanging the dependent variable to investment.11 In the interest of space, we do not presentdetailed results, but just note that none of the trend variables, except PreISO 1, is signifi-cant. That is, in most years certified firms did not invest more than uncertified firms. Infact, the coefficient of PreISO 1 shows that in the year immediately before certification,certified firms invested even less than uncertified firms. Therefore, we conclude that ourestimates for ISO14000 do not pick up the effects of pre-certification investment.
V. The mechanismsThe proceeding section found robust results showing a positive causal relationship betweenbetter environmental compliance and firm profitability. In this section, we first examine the
11Investment is calculated as the annual increase of capital stock.
© Blackwell Publishing Ltd and the Department of Economics, University of Oxford 2011

418 Bulletin
TABLE9
Subsamplesbycustomerstypes
WithMNCsconsumers
WithoutMNCsconsumers
Instrumented
Instrumented
Instrumented
Instrumented
Variables
POLS
POLS
FEFE
POLS
POLS
FEFE
ISO14000dummy(0,1)
2.026**
3.316**
2.284*
1.071
2.325**
3.002**
0.918**
1.377
(0.837)
(1.625)
(1.245)
(1.256)
(1.002)
(1.475)
(0.468)
(2.120)
Per-workercaptialstock(mil.Yuan)
−0.181
−0.187
0.6749
−0.132
0.599***
0.696***
−0.094
−0.025
(0.152)
(0.155)
(0.291)
(0.415)
(0.126)
(0.181)
(0.209)
(0.222)
Firmsize(lognumberofworkers)
−0.064
0.176
−0.467
−0.585
0.21
0.473
−1.250**
−1.302**
(0.282)
(0.634)
(0.981)
(1.672)
(0.242)
(0.427)
(0.579)
(0.632)
Ageoffirm(years)
−0.038
−0.034
——
−0.165***
−0.170***
——
(0.025)
(0.031)
(0.021)
(0.022)
SOEs(0,1)
−3.718***
−3.544**
——
−4.268***
−4.795***
——
(1.281)
(1.561)
(1.133)
(1.338)
Domesticprivate(0,1)
−2.019**
−1.803
——
−0.259
−0.69
——
(0.963)
(1.462)
(0.939)
(1.105)
HMT(0,1)
−2.751**
−2.503
——
0.311
−0.242
——
(1.243)
(1.778)
(1.260)
(1.474)
Constant
6.41
6.57
7.462
8.003
0.025
−0.931
9.451***
9.627***
(7.792)
(7.842)
(5.730)
(8.425)
(2.360)
(2.695)
(3.226)
(3.337)
Observations
1287
1287
1287
1287
3075
3075
3075
3075
#offirms
335
335
335
335
831
831
831
831
R-squared
0.055
0.054
0.487
0.471
0.100
0.088
0.675
0.674
Notes:Resultsfortheindustrydummies,citydummies,ownershipdummies,yeardummiesareincludedinthePOLSmodels,butarenotpresentedtosavespace.
Standarderrorsaregiveninparentheses.*,**and***indicate,respectively,thesignificancelevelof10%,5%and1%.
POLS,pooledordinaryleast-squares;FE,fixed-effect;SOEs,state-ownedenterprises;HMT,HongKong,MacaoandTaiwanese.
© Blackwell Publishing Ltd and the Department of Economics, University of Oxford 2011

Environmental compliance and firm performance 419
TABLE 10
Time trendsVariables Profit rate (%)PreISO 5 3.871
(3.374)PreISO 4 1.992
(3.435)PreISO 3 1.1
(3.278)PreISO 2 2.181
(3.185)PreISO 1 1.182
(3.129)PostISO 0 2.748**
(1.361)PostISO 1 2.405*
(1.434)PostISO 2 2.45
(3.045)PostISO 3 −0.943
(3.067)PostISO 4 1.711
(3.252)PostISO 5 −1.525
(3.223)Per-worker capital stock (mil. Yuan) −0.025
(0.171)Firm size (log number of workers) −1.014**
(0.498)Constant 8.652***
(2.879)Observations 4,433# of firms 1,165R-squared 0.6444Notes: The regression is estimated with the plain FE
model. Standard errors are given in parentheses. *, ** and*** indicate, respectively, significance level of 10%, 5%and 1%.
‘innovationmechanism’proposed by the Porter hypothesis and then explore the ‘marketingmechanism’which we believe could be more relevant to a developing country like China.
The innovation mechanism
By the innovation mechanism, firms would engage in more innovation to improve theirprofitability after more stringent environmental standards are applied to them. Here westudy the two indicators for innovation introduced in section II, i.e. R&D expenditures aspercentage of total sales, and the number of patents per million Yuan of sales.Table 11 presents the results for both indicators, each with two regressions, one plain
FE and the other instrumented FE, both estimated with the whole sample of firms. The
© Blackwell Publishing Ltd and the Department of Economics, University of Oxford 2011

420 Bulletin
TABLE 11
Tests of the innovation mechanism
Number of patentsR&D expenditures (% in sales) (per-mil. Yuan of sales)
Variables FE Instrumented FE FE Instrumented FEISO14000 dummy (0,1) −0.013 0.408 0.122 0.189
(0.267) (1.060) (0.149) (0.198)Per-worker capital stock −0.037 −0.096 0.066 0.057(mil. Yuan) (0.478) (0.499) (0.089) (0.093)
Firm size (log number of workers) 0.0835*** 0.063*** −0.119*** −0.122***(0.029) (0.142) (0.024) (0.026)
Constant −0.412 −0.329 0.647*** 0.661***(0.748) (0.775) (0.139) (0.144)
Observations 4,426 4,426 4,426 4,426Number of firms 1,159 1,159 1,159 1,159R-squared 0.2104 0.2106 0.6964 0.697Notes: Standard errors are given in parentheses. *, ** and *** indicate, respectively, significance level of 10%,
5% and 1%.FE, fixed-effect.
ISO14000 dummy is not significant in any of the four regressions. Except for firm size,other variables are not significant either. Larger firms tend to spend more on R&D. If firmsize increased by 1%, R&D expenditures in total sales would increase by 0.06 percentagepoints in the instrumented FE model and 0.08 percentage points in the plain FE model.However, larger firms tend to have a slower pace of getting patents. If firm size increasedby 1%, the number of patents would decrease by 0.12 per million Yuan of sales. The firstresult is consistent with expectations, but the second result needs some rationalization. Acloser look of the data finds that larger firms did have more patents, so the second resultcan be read as the consequence that the number of patents did not increase as fast as thesales volume.The inability of ISO14000 to promote innovation should not come as a surprise when
one realizes how sparse R&D activities were in our sample. Less than ten percent of oursample firms have invested in R&D in the past five years prior to 2005. Most Chinese firmsare still operating at the lower ends of the technological ladders where pressure for innova-tion is low. ISO14000 certification may increase pressure, but may not be enough the pres-sure is lower in the general environment. However, it should be mentioned that ISO14000certification itself may improve a firm’s technological capabilities because to pass the certi-fication the firm has to streamline its management and in some cases makes improvementsto its technology. Our rejection of the innovation mechanism is only a rejection of Porter’scompensation hypothesis, but not of the possible direct effects of the certification.
The marketing mechanism
In this subsection, we propose and test another mechanism, the marketing mechanism,through which ISO14000 has a positive effect on firm profitability. Under this mechanism,firms with better environmental management increase their sales and gain larger marketshares, which in turn improve their financial performance.
© Blackwell Publishing Ltd and the Department of Economics, University of Oxford 2011

Environmental compliance and firm performance 421
TABLE 12
Tests of the marketing mechanism
Per-worker sales Market share 1 Market share 2(mil. Yuan) (1,2,3,4,5,6) (1,2,3,4,5,6)
Instrumented Instrumented InstrumentedVariables FE FE OLS FE OLS FEISO14000 dummy (0,1) 0.731*** 1.428*** 0.176 0.192 0.332** 0.314
(5.110) (0.139) (0.169) (0.686) (0.169) (0.729)Per-worker capital stock 0.847*** 0.659*** 0.645** 0.700*** 0.222 0.317(mil. Yuan)
(0.046) (0.065) (0.254) (0.272) (0.255) (0.278)Firm size (log number −0.079*** −0.146*** 0.276*** 0.310*** 0.287*** 0.345***of workers)
(0.013) (0.019) (0.051) (0.079) (0.051) (0.082)Age of firm (years) 0.0165*** 0.016*** 0.0058 0.0051
(0.005) (0.0049) (0.0047) (0.0048)Constant 0.672*** 0.937*** 0.667 0.569 0.934 0.773
(0.071) (0.101) (0.661) (0.686) (0.662) (0.690)Observations 4,433 4,433 1,040 1,040 1,040 1,040Number of firms 1,165 1,165 1,040 1,040 1,040 1,040R-squared 0.8287 0.8385 0.239 0.236 0.196 0.184Notes: The regressions for per-worker sales use the whole sample of 2000–5. The regressions for market shares
use the subsample of 2005. The instrument for the FE regression is the same as defined in previous tables, andthe instrument for the OLS regression is the IER of the year when a firm was certified. Industry dummies, citydummies, ownership dummies and year dummies indicating for the year of ISO14000 certification included inboth OLS regressions but their results are not presented. Standard errors are given in parentheses. *, ** and ***indicate, respectively, significance level of 10%, 5% and 1%.FE, fixed effect; OLS, ordinary least-squares.
As we showed in our narrative signalling model, compared with firms with poor en-vironmental management, firms passing the ISO14000 certification have the advantageof signalling their managerial and technical competence to produce products with betterquality. In addition, ISO14000 makes it easier for certified firms get orders from en-vironmentally demanding customers.We study three indicators to test the marketing mechanism: per-worker sales, market
share in home province (market share 1), and market share in the country (market share 2).Their definitions were provided in section 2. For per-worker sales, we have data for eachyear in the period 2000–5 so we can estimate the FE model. For the two market shares,we only have data for 2005 so we can only estimate the OLS model. In addition to thetime variant variables, though, we add in the OLS model the time-invariant variables thatwe used before, age of firms, and a set of dummy variables indicating the year when afirm passed the ISO14000 certification. The ISO14000 dummy is defined as whether afirm obtained the certification by 2005. We also estimate the three indicators instrumen-ting the ISO14000 dummy. The instrument for per-worker sales is the same as before. Theinstrument for the two market shares is the IER of the year in which a firm was certified.Table 12 presents the results for all the three indicators. ISO14000 certification is shown
to have significantly positive impacts on per-worker sales in both the plain FE and instru-mented FE regressions. Not surprisingly, higher capital intensity increases and a largerfirm size reduces per-worker sales. The second result may be due to the definition of the
© Blackwell Publishing Ltd and the Department of Economics, University of Oxford 2011

422 Bulletin
dependent variable though. For the market share in the home province, ISO14000 cer-tification is not shown to have a significant effect in either the plain OLS regression orthe instrumented OLS regression although its coefficients are both positive. Higher capi-tal intensity, a larger firm size and a higher firm age all increase the market share. Formarket share in the country, the plain OLS shows that ISO14000 certification significantlyincreases the share, but the instrumented OLS does not show such a significant effectalthough the coefficient has a comparable magnitude. Firm size still enjoys a significantand positive effect, but capital intensity and firm age are no longer significant. The Haus-man test shows that the ISO14000 dummy is not endogenous in the 2005 data,12 though,so the plain OLS regressions provide more efficient estimates than the instrumented OLSregressions. Therefore, we can at least say that ISO14000 certification increases a firm’smarket share in the country. Of course, our analysis may be constrained by our discretedefinition of the market shares, but this should not affect the direction of our estimates.
VI. ConclusionsIn this article we have empirically studied the impact of environmental compliance onfirm profitability with a dataset of Chinese firms. Our baseline panel estimation shows thatbeing certified by ISO14000 increases a firm’s profit rate by 3.5 percentage points. Thispositive effect remains significant after we take into account the endogeneity of ISO14000certification, the effects of export and types of customers, and possible pre-certificationtime trends. We also explored the mechanisms for this positive effect. However, we do notfind supporting evidence for the innovation mechanism, the core of the Porter hypothesis;instead, we find strong evidence for the marketing mechanism that we hypothesized wouldbe more pronounced in a developing country.With regard to our contribution to literature, we provide evidence for the ‘pays to
be green’ argument while mindful of endogeneity problem of environmental compliance.In particular, we show that environmental compliance pays more readily in developingcountries because firms do not need to invest more in their R&D activities, but insteadenjoy the benefits of higher sales and larger market shares. On the policy side, our re-sults provide a strong business case for environmental compliance for Chinese firms. Mostfirms still regard environmental compliance as a pure burden to which government poli-cies implicitly admit. Our results show that the confrontation between firms and thegovernment is unnecessary. For better environmental compliance, it is more important toraise thefirms’awareness of the profitable opportunities in better environmental compliancethan to force them to measure up to higher bars or to simply fine them.
Final Manuscript Received: March 2011
ReferencesAmbec, S. and Barla, P. (2006). Can Environmental Regulations be Good for Business? An Assessment of thePorter Hypothesis, Mimeo, Department of Economics, Universite Laval, Quebec.
12The ISO14000 dummy is not endogenous in the 2005 data perhaps because most of the certifications happenedbefore 2005 and thus are pre-determined events relative to firms’market performance in 2005.
© Blackwell Publishing Ltd and the Department of Economics, University of Oxford 2011

Environmental compliance and firm performance 423
Amiti, M. and Javorcik, B. (2008). ‘Trade costs and location of foreign firms in China’, Journal of DevelopmentEconomics, Vol. 85, pp. 129–149.
Bansal, P. and Hunter, T. (2003). ‘Strategic explanations for the early adoption of ISO14001’, Journal ofBusiness Ethics, Vol. 46, pp. 289–299.
Berman, E. and Bui, L. (2001). ‘Environmental regulation and productivity: evidence from oil refineries’, TheReview of Economics and Statistics, Vol. 83, pp. 498–510.
Brunnermeier, S. and Cohen, M. (2003). ‘Determinants of environmental innovation in US manufacturingindustries’, Journal of Environmental Economics and Management, Vol. 45, pp. 278–293.
Capon, N., Farley, J. and Hoenig, S. (1990). ‘Determinants of financial performance: a meta-analysis’,Management Science, Vol. 36, pp. 1143–1159.
Christmann, P. (2000). ‘Effects of “best practices” of environmental management on cost advantage: the roleof complementary assets’, The Academic of Management Journal, Vol. 43, pp. 663–680.
Dean, J., Lovely, M. and Wang, H. (2009). ‘Are foreign investors attracted to weak environmental reg-ulations? evaluating the evidence from China’, Journal of Development Economics, Vol. 90, pp. 1–13.
Dowell, G., Hart, S. and Yeung, B. (2000). ‘Do corporate global environmental standards create or destroymarket value?’Management Science, Vol. 46, pp. 1059–1074.
Fernandez-Val, I. (2007). Fixed Effects Estimation of Structural Parameters and Marginal Effects in PanelProbit Models, Working Paper, Department of Economics, Boston University.
Gollop, F. and Roberts, M. (1983). ‘Environmental regulations and productivity growth: the case of fossil-fuelled electric power generation’, Journal of Political Economy, Vol. 91, pp. 654–674.
Gray,W. (1987). ‘The cost of regulation:OSHA,EPAand the productivity slowdown’,TheAmericanEconomicReview, Vol. 77, pp. 998–1006.
Jaffe, A. and Palmer, K. (1997). ‘Environmental regulation and innovation: a panel data study’, The Review ofEconomics and Statistics, Vol. 79, pp. 610–619.
Javorcik, B. (2004). ‘Does foreign direct investment increase the productivity of domestic firms? In search ofspillovers through backward linkages’, American Economic Review, Vol. 94, pp. 605–627.
Jiang, R. and Bansal, P. (2003). ‘Seeing the need for ISO14001’, Journal of Management Studies, Vol. 40,pp. 1047–1067.
King, A. and Lenox, M. (2002). ‘Exploring the locus of profitable pollution reduction’,Management Science,Vol. 48, pp. 289–299.
Klassen, R. and McLaughlin, C. (1996). ‘The impact of environmental management on firm performance’,Management Science, Vol. 42, pp. 1199–1214.
Konar, S. and Cohen, M. (2001). ‘Does the market value environmental performance?’ The Review of Eco-nomics and Statistics, Vol. 83, pp. 281–289.
Lanoie, P., Patry, M. and Lajeunesse, R. (2008). ‘Environmental regulation and productivity: testing the Porterhypothesis’, Journal of Productivity Analysis, Vol. 30, pp. 121–128.
Miles, M. and Covin, J. (2000). ‘Environmental marketing: a source of reputational, competitive, and financialadvantage’, Journal of Business Ethics, Vol. 23, pp. 299–311.
Mohamed, T. (2001). ‘The impact of ISO14000 on developing world businesses’, Renewable Energy,Vol. 23, pp. 579–584.
Murty, N. and Kumar, S. (2003). ‘Win-win opportunities and environmental regulation: testing of Porterhypothesis for Indian manufacturing industries’, Journal of Environmental Management, Vol. 67, pp. 139–144.
Porter, M. (1991). ‘American’s Green Strategy’, Scientific American, Vol. 264, p. 168.Porter, M. and van der Linde, C. (1995). ‘Toward a new conception of the environment-competitivenessrelationship’, Journal of Economic Perspectives, Vol. 9, pp. 119–132.
Russo, M. and Fouts, P. (1997). ‘A resource-based perspective on corporate environmental performance andprofitability’, The Academy of Management Journal, Vol. 40, pp. 534–559.
SEPA (State Environmental ProtectionAdministration) (2006). The Environmental Protection in China: 1996– 2005 (White Book), SEPA, Beijing.
Shen,Y. andYao,Y. (2008).CSR and Firm Competitiveness: The Sustainability of Private Sector Developmentin China, Foreign Language Press, Beijing.
© Blackwell Publishing Ltd and the Department of Economics, University of Oxford 2011

424 Bulletin
Stanwick, S. and Stanwick, P. (2000). ‘The relationship between environmental disclosures and financialperformance: an empirical study of US firms’, Eco-Management and Auditing, Vol. 7, pp. 155–164.
Stock, J.,Wright, J. andYogo,M. (2002). ‘Asurvey of weak instruments and weak identification in generalizedmethod of moments’, Journal of Business and Economics Statistics, Vol. 20, pp. 518–529.
Wang, H. and Jin, Y. (2007). ‘Industrial ownership and environmental performance: evidence from China’,Environmental and Resource Economics, Vol. 36, pp. 255–273.
Wang, H. and Wheeler, D. (2005). ‘Financial incentives and endogenous enforcement in China’s pollutionlevy system’, Journal of Environmental Economics and Management, Vol. 49, pp. 174–196.
Wang,H.,Mamingi,N., Laplante, B. andDasgupta, S. (2003). ‘Incomplete enforcement of pollution regulation:bargaining power in Chinese factories’, Environmental and Resource Economics, Vol. 24, pp. 245–262.
Wu, S., Chu, P. and Liu, T. (2007). ‘Determinants of a firm’s ISO14001 certification: an empirical study ofTaiwan’, Pacific Economic Review, Vol. 12, pp. 467–487.
© Blackwell Publishing Ltd and the Department of Economics, University of Oxford 2011