environmental consequences - fws
TRANSCRIPT

Chapter 5
Environmental Consequences

This page intentionally left blank.

Final Environmental Impact Statement Buckeye Wind Project April 2013
Chapter 5 - Environmental Consequences 5-1
5 Environmental Consequences This chapter describes the environmental effects of the Proposed Action and Alternatives A-C, which are defined in Chapter 3 and summarized in Table 5-1 below. The Proposed Action and Alternatives A and B each involve a full build-out of the Project (i.e., the same number and location of turbines and other Project-related facilities). Alternatives A and B differ from the Proposed Action only with respect to operational adjustments. As such, many resources that are not affected by operational adjustments (e.g., resources such as soils, water resources, vegetation, cultural resources, etc. that are only affected by Project construction or the physical Project footprint) would be affected in a similar manner under the Proposed Action and Alternatives A and B. The full build-out of the Project would include up to 100 turbines. At the time of this EIS, siting has only been completed for 52 turbine locations. The additional 48 turbines would be sited primarily in agricultural fields, and all regulations, requirements, and minimization and avoidance measures for the 52 turbines described herein would be implemented for these additional turbines. The effects analysis in this chapter pertains to the worst-case scenario for all 100 turbines unless otherwise specified in the text.
Table 5-1 Summary of Alternatives Alternative Facility Operations HCP
Implemented
Proposed Action Up to 100 Turbines and associated facilities/ infrastructure
Operational restrictions: modified cut-in speeds and feathering based on turbine location in relationship to identified season and suitable Indiana bat habitat.
Yes
Alternative A - Maximally Restricted Alternative
Same as Proposed Action
All 100 turbines would be non-operational during the period when Indiana bats could be present in the Action Area (sunset to sunrise from April 1 through October 31).
No
Alternative B - Minimally Restricted Alternative
Same as Proposed Action
Turbines feathered until cut-in speed of 5.0 m/s (11 mph) for all 100 turbines during the first one to six hours after sunset from August 1 through October 31.
Yes
Alternative C – No Action None None No

Final Environmental Impact Statement Buckeye Wind Project April 2013
5-2 Chapter 5 - Environmental Consequences
5.1 Soils and Geology
5.1.1 Impact Criteria There are no specific federal regulations pertaining to soils that are pertinent to this analysis; however, impacts on soils can have indirect effects on other resources, and NEPA and CEQ guidelines state that protection of unique geological features, minimization of soil erosion, and the siting of facilities in relation to potential geologic hazards must be considered when evaluating impacts of the Project.
5.1.2 Proposed Action
5.1.2.1 Avoidance and Minimization Measures The Proposed Action contains the following avoidance and minimization measures that would avoid or minimize impacts to geology and soils. These measures would be applied during both construction and decommissioning of the Project.
• A SWPPP including an Erosion and Sediment Control Plan would be implemented, consisting of stabilization of steep slopes with geotextiles or other similar devices (particularly during rain events), silt fences, hay bale dikes or other suitable methods of slowing sheetflow and retaining sediment onsite, as well as identifying designated crossings over streams to minimize erosion and sedimentation in riparian areas, wetlands, and streams.
• The NPDES General Construction Storm Water permit would also include restoration measures that would ensure that disturbed ground is stabilized, preventing ongoing erosion and sedimentation of storm water run-off. These restoration measures consist of revegetation (preferably using native species, but exceptions may be made based on land use), regrading, and permanent swales or catch basins as needed.
• Topsoil removed from disturbed areas would be stockpiled and retained for reapplication once site disturbance is complete.
• Compacted soils would be restored through manual or mechanical cultivation to re-aerate the soil and promote seed germination.
• Areas subject to temporary disturbance (outside the permanent Project footprint but disturbed during construction or decommissioning) would be revegetated in accordance with the Erosion and Sediment Control Plan. Temporary crossings and areas of temporary construction impact will be restored and re-vegetated per the Erosion and Sediment Control Plan, consisting of planting native plant species (see HCP Appendix D for a typical native plant mix) to provide ground stabilization. Where forest fragmentation results from construction activities, the areas will be restored using trees suitable for Indiana bat habitat, if practicable. A list of native trees suitable for planting to restore Indiana bat habitat is included in HCP Appendix D. If existing land-use precludes the use of native species (e.g. agricultural use), restoration and stabilization will be established consistent with that land-use. The construction footprint would be minimized by delineating and minimizing impacts to sensitive resources such as streams,

Final Environmental Impact Statement Buckeye Wind Project April 2013
Chapter 5 - Environmental Consequences 5-3
wetlands, cultural resources, etc. in the field prior to construction and adhering to work area limits during construction.
This effects analysis considers these measures in determining the effects of the Proposed Action.
Construction-related Effects Construction activities for all 100 turbines would take place in one or two phases that would last for a period of 12 to 18 months each with possible overlap. The effects of the Project during the construction phase would be largely limited to surface soil disturbance. The Project would not impact karst formations or caves. To construct 100 turbines, no more than 220.9 ha (545.8 ac) of soil would be disturbed during construction. Much of this disturbance would be temporary and subject to restoration activities at the end of Project construction. Following restoration, the permanent operating footprint of the Project would be no more than 52.2 ha (128.9 ac) of built facilities. The specific locations of the impacts of 52 of the planned turbines and associated interconnects and roads are currently known, and most of these impacts would occur on land that is currently used for agricultural purposes, and is regularly disturbed through cultivation. The Project would cover the permanently disturbed soil in these areas with impervious surfaces and/or gravel which would remain in place for at least the life of the Project. As the Applicant has provided the maximum impacts expected for soil and vegetation for the 100-turbine Project (see also Section 5.3 – Vegetation), the USFWS is able to fully assess the impacts of the Project.
The soils within the Action Area would be suitable for grading, compaction, and drainage, when each construction site is prepared as discussed in the General Earthwork Recommendations for the Project (Hull, 2009a, Appendix A). In addition, the Applicant has developed Agricultural Mitigation Provisions (Stantec 2010b, Appendix I) for construction activities occurring on privately owned agricultural land. These provisions would help ensure that construction activities and mitigation measures are compatible with future agricultural land use. The Applicant would also utilize and improve existing entrances and field driveways for Project access roads when practicable, which would minimize erosion and new impacts to soils.
Six turbines northeast of the City of Urbana, four turbines west of the Village of Mutual, and two turbines southwest of the Village of Mechanicsburg would be located where surface and subgrade soils are susceptible to being soft and loose and typically contain a higher content of vegetation and organics due to the frequent presence of water (Hull 2009b). If these soils are determined to be unsuitable to support the turbines, they may need to be undercut and replaced with suitable soil material during sub-grade preparation for roadways and staging areas. Geotechnical investigations and test borings would be conducted on-site prior to construction to provide relevant engineering properties of the soils, which would be used to refine structural designs.
Due to the anticipated depth of bedrock in the Action Area, bedrock blasting is not anticipated to be necessary (Hull 2009a). Geotechnical investigation and test borings would be conducted prior to construction to confirm/refine information about the site geology and substrate suitability and to facilitate final foundation design and engineering. The locations of test borings would be at appropriate turbine sites, as determined necessary by the geotechnical engineer. In addition, road borings together with Ground Penetrating Radar Survey (GPRS) would be conducted approximately every 0.8 km (0.5 mi) along county and township roads that would be used for

Final Environmental Impact Statement Buckeye Wind Project April 2013
5-4 Chapter 5 - Environmental Consequences
transport of Project components. These road borings and GPRS would allow the Applicant and the County Engineer to determine the suitability of the roads and the appropriate steps to ensure that the roads are returned to pre-construction quality following the construction phase of the Project.
Operation and Maintenance-related Effects Under the Proposed Action, no impacts to site soils or geological resources are anticipated from the operation of the Project.
Decommissioning-related Effects Impacts on soils and geology associated with decommissioning activities would be related to removal of the turbines, footers, and roads. Existing concrete pads or structures would be removed to a depth of 0.9 to 1.2 m (3 to 4 ft) below ground surface. Some roads would not be removed per landowner request. Where facilities would be removed, the impacts of decommissioning would be generally equivalent to construction-related impacts. Although the volume of concrete removed would not include the volume of concrete installed below 0.9 to 1.2 m (3 to 4 ft), the physical impacts of concrete removal would be generally equivalent to the impacts incurred during the construction phase, but could be significantly less if, as is expected, spread footing turbine foundations are used. The physical impacts of road removal (equipment footprints, ground disturbance, etc.) would be generally equivalent to the impacts incurred during the construction phase. Decommissioning activities could occur as early as 2037 and would last approximately one year.
Mitigation Measures for Unavoidable Impacts No adverse impacts on soils and geologic resources would occur during the Project’s operations phase. During the Project’s construction and decommissioning phases, impacts would be temporary and localized. Therefore the Proposed Action contains no specific mitigation measures for geology and soils in addition to the avoidance and minimization measures listed above.
In summary, the Proposed Action would be expected to have minor negative impacts on soils and geologic resources. Most soil disturbances would occur during construction and decommissioning, but these impacts would be temporary and areas disturbed during these phases would be stabilized. Soils within the footprints of built structures would be impacted over a longer time period but would be rehabilitated during decommissioning. Construction activities would not exacerbate geological hazards, and the foundations required to support the Project facilities would not be large enough or deep enough to constitute a significant negative impact.
5.1.2.2 Redesign Option The Redesign Option is an optional measure under the Proposed Action that includes a primarily buried collection system. The different collection system would affect soil and geologic resources in a similar manner to the Proposed Action, but the increased length of buried interconnects would also increase the area of new soils impacted by the Project as compared to the Proposed Action. Under the Redesign Option, no more than 9.0 km (5.6 mi) of the 34.5-kV interconnects would be above ground (on rebuilt distribution poles in existing public road right-of-ways) and 86.4 km (53.7 mi) would be buried underground. No more than 219.9 ha (543.6

Final Environmental Impact Statement Buckeye Wind Project April 2013
Chapter 5 - Environmental Consequences 5-5
ac) of soil would be disturbed during construction. The avoidance, minimization, and mitigation measures would be the same as described above for the Proposed Action.
5.1.3 Alternative A – Maximally Restricted Operations Alternative Alternative A differs from the Proposed Action only with respect to operations. The operational differences would not affect soil and geologic resources. As such, the construction, operation, and decommissioning-related effects of Alternative A and the avoidance and minimization measures would be the same as under the Proposed Action. No mitigation measures would be warranted.
5.1.4 Alternative B – Minimally Restricted Operation Alternative Alternative B differs from the Proposed Action only with respect to operations. The operational differences would not affect soil and geologic resources. As such, the construction, operation, and decommissioning-related effects of Alternative B and the avoidance and minimization measures would be the same as under the Proposed Action. No mitigation measures would be warranted.
5.1.5 Alternative C - No Action Alternative Under Alternative C, the Project would not be built, and no Project-related activities (construction, operation, or decommissioning) would occur. Alternative C would have no effect on soil or geologic resources. As such, no mitigation measures would be warranted.
5.2 Water Resources
5.2.1 Impact Criteria The extent of predicted deviation from existing conditions is the prime factor in the determination of whether impacts on water resources would be significant. The analysis of impacts on water resources considers the potential for the Proposed Action to alter existing resources such as surface water bodies, subsurface aquifers, SWPAs, or floodplains. This analysis also considers potential impacts on existing uses or standards, such as potability, general public health, and flood attenuation. Major changes in the current condition of these resources or their capacity to support established uses would be considered significant. In cases where otherwise minor impacts on water resources would cause major changes in other resources (e.g.; flora or fauna that are highly intolerant of habitat disturbance), impacts on water resources could be considered significant.
Impacts on water resources may be regulated at the federal level by the Federal Water Pollution Control Act (Clean Water Act) of 1972, Executive Order 11988: Floodplain Management (1977), the National Coastal Zone Management Act of 1972, the Wild and Scenic Rivers Acts of 1968, and/or the Safe Drinking Water Act of 1974. Inundation dangers associated with floodplains have also prompted federal, state, and local legislation that limit development in these areas largely for recreation and preservation activities.

Final Environmental Impact Statement Buckeye Wind Project April 2013
5-6 Chapter 5 - Environmental Consequences
5.2.2 Proposed Action
5.2.2.1 Avoidance and Minimization Measures The Proposed Action contains the following avoidance and minimization measures that would avoid or minimize impacts to water resources during construction, operation and maintenance, and decommissioning.
• No discharges of contaminated effluent would occur directly to a receiving water body. Spill Prevention, Containment, and Countermeasure (SPCC) procedures would be implemented to prevent the release of hazardous substances into the environment. These procedures would not allow refueling of construction equipment within 30.5 m (100 ft) of any stream or wetland, and all contractors would be required to keep materials on hand to control and contain a petroleum spill, including a shovel, tank patch kit, and oil-absorbent materials. Any spills would be reported in accordance with Ohio EPA Division of Emergency and Remedial Response regulations.
• No blasting is currently planned. Should blasting be required, the exact location of private water supply wells within the Action Area would be determined and clearly marked to avoid potential damage. No blasting would occur within a 30.5-m (100-ft) buffer around private wells and would likely be located no closer than 274 m (900 ft) from a well due to setbacks from habitable residences of at least 279 m (914 ft) and the fact that private wells are typically located within 30.5 m (100 ft) of residences.
• Large built components of the Project, including wind turbines, staging areas, the operations and maintenance building, and the substation, would be sited to avoid wetlands.
• Large built components of the Project, including wind turbines, staging areas, the operations and maintenance building, and the substation, would be sited to avoid stream impacts, although streams will be impacted for construction of access roads and collection lines. Existing or narrow crossing locations over surface waters would be used whenever practicable to minimize potential impacts to streams. The Applicant would obtain USACE authorization for any discharge of fill material into jurisdictional streams. No more than 32 stream crossings totaling not more than 380.3 linear m (1,248 linear ft) of impact will result for the 100-turbine Project (see Table 5.2-1).
• The construction footprint would be minimized by delineating and avoiding sensitive areas in the field prior to construction and adhering to work area limits during construction. These measures would limit potential impacts of soil compression on normal infiltration rates.
• The Applicant and its contractors would follow strict guidelines dictating the use and handling of hazardous materials and other contaminants, which would minimize the potential for impacts to water quality and/or aquatic life.
o A plan note would be incorporated into the construction contract requiring contractors to develop and comply with a project-specific emergency spill response protocol.

Final Environmental Impact Statement Buckeye Wind Project April 2013
Chapter 5 - Environmental Consequences 5-7
o A plan note would be incorporated into the construction contract requiring contractors to adhere to a project plan for removal of regulated wastes from the work area or properties associated with the project.
o Herbicide application guidelines that follow manufacturers’ recommendations for protection of the environment would be developed for use at turbine pads, staging areas, maintenance facilities, and access roads.
• Contractors would develop and implement a comprehensive Erosion and Sediment Control Plan to minimize impacts to waterways.
o A plan note would be incorporated into the construction contract requiring that contractors adhere to all provisions of NPDES permits and the SWPPP. The SWPPP plan must specify best management practices for construction activities that would minimize degradation of water quality resulting from runoff of storm water and sediment from construction areas into adjacent water bodies.
o A plan note would specify that sedimentation and erosion control features be placed as soon as practicable during the construction process. Provisions for placement of primary sedimentation and erosion control features, necessary during advanced tree-cutting operations and access road construction, would be included.
o Contractors would develop and incorporate provisions to protect surface and groundwater quality by using erosion control practices appropriate for the terrain and consistent with approved best management practices.
o Contractors would develop and incorporate provisions for implementation of a post-construction revegetation plan for all temporary work spaces, staging areas, and access roads to control erosion and maintain water quality. Site revegetation would use seed mixtures and plants in accordance with the NPDES permit and Erosion and Sediment Control Plan (i.e., reseeding with native plants in non-cultivated areas).
• Low-impact crossing techniques, equipment restrictions, herbicide use restrictions, and erosion and sediment control measures would be implemented as required by the NPDES permit and Erosion and Sediment Control Plan.
• In those cases when only buried electrical interconnects cross a perennial stream, the Applicant would directionally drill underneath the stream regardless of its beneficial use classification. In cases where only buried electrical interconnects cross an intermittent or ephemeral stream, the Applicant would open trench through the stream and conduct the trenching during periods of no water flow, or horizontally directionally drill underneath that stream if the crossing is completed when water is present. Additionally, in order to continue to avoid any impacts to high quality potential Indiana bat foraging habitat, the Applicant would use horizontal directional boring for electrical interconnect crossings of any stream Ohio designated as exceptional warm water habitat or cold water habitat as well as any streams thought to have the characteristics necessary to support federally threatened or endangered species of freshwater mussels or freshwater mussel species proposed for listing (discussed in detail in Section 4.2).

Final Environmental Impact Statement Buckeye Wind Project April 2013
5-8 Chapter 5 - Environmental Consequences
• The minimum possible area along stream banks would be cleared of vegetation (55 ft for access roads or crane paths; 25 ft for buried electrical interconnects), and areas cleared during construction would be stabilized following construction by revegetation with native plants (outside of agricultural areas). Temporary crossings and areas of temporary construction impact will be restored and re-vegetated per the Erosion and Sediment Control Plan, consisting of planting native plant species (see HCP Appendix D for a typical native plant mix) to provide ground stabilization. Where forest fragmentation results from construction activities, the areas will be restored using trees suitable for Indiana bat habitat, if practicable. A list of native trees suitable for planting to restore Indiana bat habitat is included in HCP Appendix D. If existing land-use precludes the use of native species (e.g. agricultural use), restoration and stabilization will be established consistent with that land-use.
• Should groundwater be encountered during excavation, water removal would be conducted as follows:
o A sump pit would be used to trap and filter water for pumping to a suitable discharge point.
o Areas of cleared vegetation along streams would be stabilized.
o Clean pumped water would be discharged to a vegetated and stabilized area (or to an appropriately sized level spreader or riprap energy dissipater) to minimize scouring of the receiving area.
o Sediment-laden water would be pumped through a filter bag or into a sediment trapping device prior to discharge.
• Topsoil removal and decompaction would be conducted in agricultural areas where soil restoration is necessary to accommodate future agricultural uses. These practices would also minimize any potential impacts that soil compaction could have on infiltration of rain and snowmelt, thereby further reducing any potential impact to groundwater recharge.
• No project structures within any groundwater SWPA. This effects analysis considers these measures in determining the effects of the Proposed Action.
Construction-related Effects
Groundwater
Construction of the Project could result in certain localized impacts to groundwater, but these impacts would not be significant. Installation of turbine foundations has the greatest potential for impacts on groundwater. Based on the preliminary turbine design information, the footing excavations would extend approximately 3 m (10 ft) below existing ground surface. Due to the anticipated depth of bedrock in the area, blasting is not anticipated for construction. When required, blasting can generate seismic vibrations, fracture bedrock, cause groundwater to migrate, and potentially impact groundwater levels. However, the site layout incorporates turbine setbacks from habitable residences of at least 279 m (914 ft). Since private wells are typically located within 30.5 m (100 ft) of residences, the turbine setbacks would minimize risks to private wells and well yields.

Final Environmental Impact Statement Buckeye Wind Project April 2013
Chapter 5 - Environmental Consequences 5-9
In addition, responses to well surveys mailed to Action Area residents indicated that local wells encountered water at a depth of 4.6 to 61 m (15 to 200 ft), most commonly in the range of 9 to 18 m (30 to 60 ft). This suggests that even if blasting should be required within 3 m (10 feet) of the surface, it would not likely encounter groundwater. Therefore, construction is not anticipated to physically damage private wells or affect well yields (Hull 2009b), cause groundwater migration, or otherwise alter the hydrological characteristics of the Action Area.
Buried electrical interconnect lines can also facilitate near-surface groundwater migration along trench backfill in areas of shallow groundwater. The impact would originate within the Project Area but groundwater could migrate across the boundary between the Project Area and the Action Area. However, as previously indicated, depth to groundwater is most commonly in the range of 9 to 18 m (30 to 60 ft). Therefore, near surface groundwater migration is anticipated to be minimal and would not affect groundwater levels or availability in the Action Area.
In addition to the potential impacts of installing turbine bases on wells, groundwater migration, and hydrogeology, other minor impacts to groundwater could result from construction activities. Soil compaction from the use of construction equipment could limit the efficiency of surface water infiltration to groundwater. When soils are compressed, the pore spaces within the soil are decreased, which reduces water percolation and aquifer recharge, and increases runoff. To the extent that soil compaction would occur, re-aeration as described in Section 5.1.2 would minimize the long-term influences on groundwater recharge.
Construction of access roads would result in minor increases in storm water runoff that otherwise would have infiltrated into the ground at the road locations, but this impact would be very minor. Assuming that infiltration would be completely eliminated and runoff increased across the entire 52.2 ha (129.8 ac) occupied by the permanent Project footprint, infiltration potential would be eliminated over less than 0.1 percent of the Action Area. The Project would not have a significant impact on infiltration, recharge of aquifers, or runoff.
Construction of the Project could introduce pollutants to groundwater through accidental discharges of petroleum or other chemicals during construction. Such discharges could occur in the form of minor leaks from fuel and hydraulic systems, as well as more substantial spills that could occur during refueling or due to mechanical failures and other accidents. If these impacts were to occur, contaminants could migrate through the Action Area via groundwater. As part of the Project, the Applicant would implement the appropriate spill response procedures, as outlined in the SPCC plan, to address spills and to mitigate the associated environmental impacts.
No Project structures for the 100-turbine array would be located within any designated Ground Water SWPAs (Figure 4.4-1).
Surface Water Construction of the Project would have minor impacts on surface water, but most of these impacts would be widely dispersed and temporary in nature. Table 5.2-1 summarizes the locations and nature of these impacts. Construction activities would be dispersed over a large area resulting in a relatively low level of soil disturbance and minor amounts of additional impervious surfaces across the Action Area as a whole, although disturbance would be somewhat greater in some localized areas where a large number of individual stream crossings or other

Final Environmental Impact Statement Buckeye Wind Project April 2013
5-10 Chapter 5 - Environmental Consequences
individual impacts would occur in a comparatively small area. One example of such an area is located between Route 814 and Urbana, where access roads and buried interconnects would intersect or parallel more than 1.6 linear km (1 linear mi) of stream channel in Streams J, K, V, and W within an approximately 2.6 square km (1 square mi) area of the Dugan Run and East Fork Buck Creek stream systems.
Access roads, collection lines, and crane paths for the 100-turbine Project would cross no more than 32 streams and cause no more than 380.3 linear m (1,248 linear ft) of impact (see Table 5.2-1). The Applicant would implement several methods to avoid impacts to surface waters and minimize unavoidable impacts. For example, in some cases the Project would utilize existing stream crossings constructed for farm equipment, although some improvements such as road widening could be necessary to accommodate turbine component delivery. In addition, impacts to perennial streams from electrical interconnect crossings would be avoided by direct boring beneath the bed of the stream or by aerial crossing on poles. In some instances, the discharge of fill material into jurisdictional streams would be unavoidable and USACE authorization would be required. It is expected that all collection line and crane path stream impacts will be temporary in nature. These impact areas will be restored per the conditions of the USACE and NPDES permits and Erosion and Sediment Control Plan (see section 5.2.1.2.1 of the HCP for additional details). Access road impacts are expected to be permanent and will be appropriately permitted through USACE permits. Any permanent or temporary activities occurring alongside or parallel to a wetland or water body that is associated with the construction and operation of the Project would follow best management practices to ensure that no degradation to water quality occurs. No mitigation for any stream impacts is expected to be required under the USACE permits.
Indirect impacts to wetlands and water bodies from the Project could result from sedimentation and erosion caused by construction activities (e.g., removal of vegetation and soil disturbance could result in runoff into wetland and stream areas). This indirect impact could occur at wetlands and water bodies adjacent to work areas where no direct wetland impacts are anticipated. To minimize the potential for erosion during construction, erosion and sediment control measures such as hay bales and silt fences would be placed as appropriate around disturbed areas and any stockpiled soils. Prior to commencing construction activities, erosion control devices would be installed between the work areas and downslope water bodies and wetlands to reduce the risk of soil erosion and siltation. Erosion control measures would also be installed downslope of any temporarily stockpiled soils in the vicinity of water bodies and wetlands. These minimization measures would be fully described in the SWPPP, which would incorporate applicable BMPs for erosion control and storm water management during construction.

Final Environmental Impact Statement Buckeye Wind Project April 2013
Chapter 5 - Environmental Consequences 5-11
Table 5.2-1 Activities for the 100-Turbine Project Relative to Potentially Jurisdictional Streams within the Action Area
Stream ID/Name
Flow Regime Project Activity Surface Water Impacts
(Temporary or Permanent)
Estimated Stream Width
(linear feet)
Maximum Impact length
(linear feet)
B/ Unnamed tributary to Dugan Run
Intermittent Access road and buried interconnect to Turbines 9 and 13 cross streams; Turbine 13 is located 194 m (636 ft) from stream. Disturbance within legally-defined buffer would trigger permit and appropriate storm water mitigation.
Use existing crossing; widening of crossing would result in some minor impacts
Permanent
10.0 58
D/ Unnamed tributary to
Treacle Creek
Ephemeral Buried interconnect to Turbine 16 crosses stream; access road and buried interconnect between Turbines 11 and 16 must cross stream. Disturbance within legally-defined buffer would trigger permit and appropriate storm water mitigation.
If trenched, crossing would result in some minor impacts. If bored or carried on poles, no surface water impact. Road crossing would result in some minor impacts.
Permanent
7.5 58
E/ Dugan Run Intermittent Turbine 17 located 220 m (722 ft) from stream. Buried interconnect and crane path must cross stream. Crane crossing would result in minor, temporary surface water impact only.
If trenched, crossing would result in some minor, temporary impacts
Temporary
13 60
I/ Unnamed tributary to
Dugan Ditch
Perennial Access road for multiple turbines from SR 36 crosses stream. Disturbance within legally-defined buffer would trigger permit and appropriate storm water mitigation.
Culverted crossing would result in some minor impacts.
Permanent
16.3 34
J/ Unnamed tributary to Dugan Run
Intermittent Access road and interconnect for multiple turbines from SR 814 crosses stream. Disturbance within legally-defined buffer would trigger permit and appropriate storm water mitigation.
Use existing crossing; widening crossing would result in some minor impacts.
Permanent
12.5 60
K/ Unnamed tributary Stream
J
Ephemeral Eleven turbines are located more than 488 m (1,600 ft) from stream. Crane path must cross stream
Minor, temporary surface water impact only.
Temporary
4.0 0
R/ Unnamed tributary Dugan
Ditch
Intermittent Access road to Turbines 37 and 41 crosses stream. Disturbance within legally-defined buffer would trigger permit and appropriate storm water mitigation.
Crossing would result in some minor impacts.
Permanent
13.0 90

Final Environmental Impact Statement Buckeye Wind Project April 2013
5-12 Chapter 5 - Environmental Consequences
Stream ID/Name
Flow Regime Project Activity Surface Water Impacts
(Temporary or Permanent)
Estimated Stream Width
(linear feet)
Maximum Impact length
(linear feet)
S/ Unnamed tributary to Stream D
Ephemeral Buried interconnect and access road must cross stream S to access Turbine 18; disturbance within legally-defined buffer would trigger permit and appropriate storm water mitigation.
Crossing would result in some minor impacts.
Permanent
8.5 60
V/ Unnamed tributary to
Dugan Ditch
Intermittent Must cross stream V with access road and buried interconnect to access Turbine 35.
Crossing would result in some minor impacts.
Permanent
16.0 60
W/ Unnamed tributary to
Dugan Ditch
Intermittent Access road and buried interconnect leading to Turbines 43 crosses stream. Disturbance within legally-defined buffer would trigger permit and appropriate storm water mitigation.
Crossing would result in some minor impacts.
Permanent
16.0 48
Y/ Buck Creek Intermittent Buried interconnect and crane path must cross stream. Crane crossing would result in minor, temporary surface water impact only.
If trenched, crossing would result in some minor, temporary impacts
Temporary
12.9 0
AA/Buck Creek Intermittent Must cross stream with access road and buried interconnect to access Turbines 28 and 33. To avoid impacts, bore under stream and cross with elliptical culvert.
No surface water impacts if elliptical culvert and directional bore is used, otherwise crossing would result in some minor impacts
Permanent
12.0 0
BB/Treacle Creek
Intermittent Buried interconnect between Turbine 25 and 28 must cross stream. To avoid impact, bore under stream or carry on poles
No surface water impact if directionally bored
Temporary
11.9 0
CC/Unnamed tributary
Ephemeral Must cross stream with access road and buried interconnect to access Turbines 52 and 55. No existing crossing.
Crossing would result in some minor impacts.
Permanent
2.5 60
DD/Unnamed tributary
Ephemeral Must cross stream with access road and buried interconnect to access Turbines 51and 53. No existing crossing
Crossing would result in some minor impacts.
Permanent
20 60
Maximum of 16 Phase II
crossings for additional 48
turbines
Various Construction of crane paths, access roads, and collection lines.
Various
Permanent
8-10 600

Final Environmental Impact Statement Buckeye Wind Project April 2013
Chapter 5 - Environmental Consequences 5-13
Stream ID/Name
Flow Regime Project Activity Surface Water Impacts
(Temporary or Permanent)
Estimated Stream Width
(linear feet)
Maximum Impact length
(linear feet)
Maximum of 17 additional buried
interconnect crossings (Redesign
Option only)
Various Buried interconnects. Various
Temporary
8-10 350
Total (without Redesign Option)
1,248
Total (with Redesign Option)
1,598
Source: Hull 2009d; 2009e and Hull 2010
Wetlands
According to the Ducks Unlimited update of the NWI (2009), the Action Area contains 668 ha (1,651 ac) of wetlands (Table 4.2-3). Temporary and permanent impacts to wetlands would be avoided during construction. However, some wetlands are close enough to Project components that specific avoidance steps would be taken during construction to ensure their protection. These steps may include flagging a buffer zone (15 m [50 ft] for jurisdictional wetlands) and erecting protective fencing prior to construction and proper implementation of a SWPPP. No turbines would be sited within 15 m (50 ft) of a federal or state jurisdictional wetland. Access roads and buried electrical interconnections would be designed and sited to avoid wetlands and adhere to above stated setbacks.
Permit Requirements for Surface Water and Wetland Impacts
Under Section 404 of the CWA, USACE authorization is required prior to the placement of any dredged or fill material into jurisdictional waters of the United States. Isolated waters may be regulated by the OEPA. Any activity that occurs alongside or abutting a wetland or water body would use best management practices in order to minimize any indirect effects to these areas. The Applicant intends to apply for approval for up to 32 streams crossings for a total of not more than 380.3 linear m (1,248 linear ft) of impact. The discharge of dredged or fill material into jurisdictional streams may meet the criteria for authorization under a USACE Nationwide Permit. By definition, Nationwide Permits only authorize activities that have minimal individual and cumulative adverse effects on the aquatic environment (77 Fed. Reg. 10184-10290). Nationwide Permits that have been utilized on other wind power projects include Nationwide Permit No. 12 (Utility Line Activities), Nationwide Permit No. 14 (Linear Transportation Projects), and Nationwide Permit No. 51 (Land-Based Renewable Energy Generation Facilities). The Applicant would implement compensatory mitigation for stream impacts if required through the USACE Permit process for specific crossings.
Impacts on surface water quality are typically permitted as part of the NPDES General Construction Storm Water Permit, which may be issued in conjunction with the necessary federal

Final Environmental Impact Statement Buckeye Wind Project April 2013
5-14 Chapter 5 - Environmental Consequences
and state permits for dredge, fill, or crossings of jurisdictional surface waters. A SWPPP would be developed as part of the NPDES permit which would specify the best management practices for construction activities that would minimize degradation of water quality resulting from runoff of storm water and sediment from construction areas into adjacent wetlands and water bodies.
The Applicant would implement techniques to avoid stream impacts where practicable and minimize the impacts of unavoidable stream crossings such that no more than 32 streams will be crossed, totaling no more than 380.3 linear m (1,248 linear ft) of impact. In many cases, it would be possible to utilize existing stream crossings constructed for farm equipment, although some temporary improvements may be necessary to accommodate turbine component delivery. In addition, impacts to most high quality streams and perennial streams by electrical interconnect crossings would be avoided by direct boring beneath the bed of the stream or by aerial crossing on poles. Where access roads would cross perennial streams, culverted crossings will be used, which would cause some minor impacts to the stream and related buffer.
Non-permitted impacts
In cases where Project activities would occur near streams or wetlands permits may not be required, but indirect impacts could still occur to surface water features if uncontrolled discharges of sediment or contaminated water were to occur through runoff. The Applicant would implement appropriate measures to avoid unnecessary disturbance and minimize the extent of required soil disturbances. These measures would further reduce potential impacts to receiving water bodies from storm water runoff. For the 100-turbine array, impervious surface would increase less than 0.1 percent, equivalent to 52.2 ha (129 ac), over the entire Action Area. Consequently, no significant changes to the rate or volume of storm water runoff or the overall surface hydrology of the Action Area are anticipated.
Floodplains The only activities that would potentially affect mapped 100-year floodplains would be construction of wind turbines, other structures, or impervious surfaces. The 100-turbine array and associated access roads and buried interconnections would require not more than 11.8 ha (29.2 ac) of 100-year floodplain disturbance during the construction phase of the Project. No more than 2.4 ha (5.9 ac) of this area would be permanently impacted and 9.4 ha (23.3 ac) would be temporarily impacted.
Impacts on floodplains as a result of the Project would include interference with the passage, storage, and infiltration of floodwaters. Construction of turbines and other structures within the floodplain would affect all three of these functions: turbines and other structures within the floodplain would cause a direct loss of flood storage capacity equivalent to the volume of the structure below the flood elevation, the surface area on the upstream side of the structures would impede the flow of floodwater, and capacity for infiltration would be lost within the structures’ footprints. Access roads and buried electrical interconnection lines would have the capacity to interfere with infiltration as well, although not to the same extent as structures because the roads would consist of gravel so some infiltration would likely still be possible within the road beds and through the soil covering the interconnects. The effects of the Proposed Action on floodplains would likely be observed in the form of small localized increases in flood elevation and duration, although these effects would likely be minor and difficult to measure directly. Access roads and buried electrical interconnection lines would have no measurable effect on
Final Environmental Impact Statement Buckeye Wind Project April 2013
Chapter 5 - Environmental Consequences 5-15
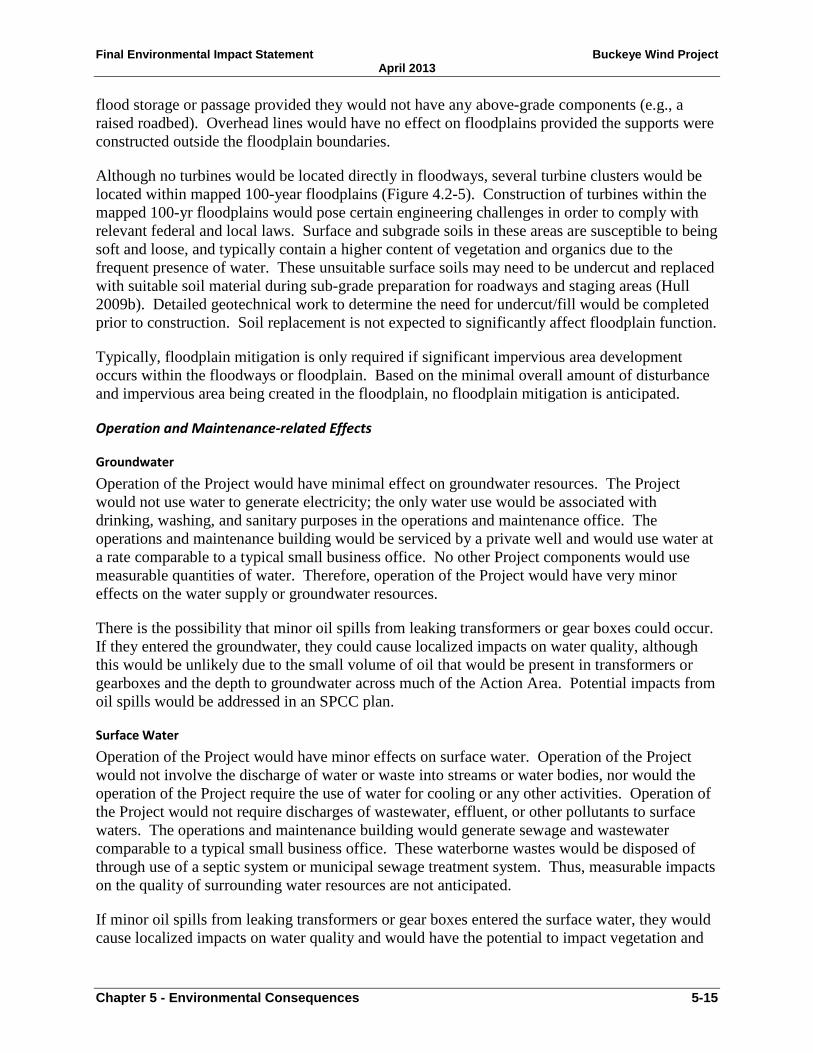
flood storage or passage provided they would not have any above-grade components (e.g., a raised roadbed). Overhead lines would have no effect on floodplains provided the supports were constructed outside the floodplain boundaries.
Although no turbines would be located directly in floodways, several turbine clusters would be located within mapped 100-year floodplains (Figure 4.2-5). Construction of turbines within the mapped 100-yr floodplains would pose certain engineering challenges in order to comply with relevant federal and local laws. Surface and subgrade soils in these areas are susceptible to being soft and loose, and typically contain a higher content of vegetation and organics due to the frequent presence of water. These unsuitable surface soils may need to be undercut and replaced with suitable soil material during sub-grade preparation for roadways and staging areas (Hull 2009b). Detailed geotechnical work to determine the need for undercut/fill would be completed prior to construction. Soil replacement is not expected to significantly affect floodplain function.
Typically, floodplain mitigation is only required if significant impervious area development occurs within the floodways or floodplain. Based on the minimal overall amount of disturbance and impervious area being created in the floodplain, no floodplain mitigation is anticipated.
Operation and Maintenance-related Effects
Groundwater
Operation of the Project would have minimal effect on groundwater resources. The Project would not use water to generate electricity; the only water use would be associated with drinking, washing, and sanitary purposes in the operations and maintenance office. The operations and maintenance building would be serviced by a private well and would use water at a rate comparable to a typical small business office. No other Project components would use measurable quantities of water. Therefore, operation of the Project would have very minor effects on the water supply or groundwater resources.
There is the possibility that minor oil spills from leaking transformers or gear boxes could occur. If they entered the groundwater, they could cause localized impacts on water quality, although this would be unlikely due to the small volume of oil that would be present in transformers or gearboxes and the depth to groundwater across much of the Action Area. Potential impacts from oil spills would be addressed in an SPCC plan.
Surface Water Operation of the Project would have minor effects on surface water. Operation of the Project would not involve the discharge of water or waste into streams or water bodies, nor would the operation of the Project require the use of water for cooling or any other activities. Operation of the Project would not require discharges of wastewater, effluent, or other pollutants to surface waters. The operations and maintenance building would generate sewage and wastewater comparable to a typical small business office. These waterborne wastes would be disposed of through use of a septic system or municipal sewage treatment system. Thus, measurable impacts on the quality of surrounding water resources are not anticipated.
If minor oil spills from leaking transformers or gear boxes entered the surface water, they would cause localized impacts on water quality and would have the potential to impact vegetation and

Final Environmental Impact Statement Buckeye Wind Project April 2013
5-16 Chapter 5 - Environmental Consequences
wildlife as well. These impacts are not likely to be significant due to the small volume of oil that would be present and the fact that the Project facilities would be sited as far away from surface water features as practicable. No turbines would be sited within 15 m (50 ft) of a federal or state jurisdictional wetland. Potential impacts from oil spills would be addressed in an SPCC plan.
Floodplains
Although no turbines would be located directly in floodways, seven of the currently sited turbines are located within mapped 100-year floodplains, including those northeast of the City of Urbana, west of the Village of Mutual, and southwest of the Village of Mechanicsburg (Figure 4.2-5). As such, implementation of the Proposed Action would have minor effects on floodplains. The Champaign County Engineer acts as the Champaign County Flood Coordinator and oversees all floodplain development permits. The Applicant would obtain all required floodplain permits prior to construction of Project components in designated 100-year floodplains.
Decommissioning-related Effects Decommissioning the Project would have similar impacts on water resources as construction, but the magnitude of the impacts associated with decommissioning would be smaller than construction. The primary impact of decommissioning on water resources would be localized, temporary impacts on water quality associated with runoff from disturbed areas, although runoff would be contained within the disturbed areas to the extent possible through erosion and sediment control features installed at the work sites. There would be minimal stream crossings and demolition work near surface water features because the Project’s road network would provide access to all work sites necessary for demolition, and some may be left in place following decommissioning as per landowner requests.
Mitigation Measures for Unavoidable Impacts The Proposed Action would be expected to have minor negative impacts on water. Most impacts on water would occur during construction and decommissioning, but these impacts would be temporary. Some impacts (e.g., roads) would be permanent. The Applicant would minimize direct impacts to surface water features by adhering to the requirements of applicable permitting processes described above and using appropriate construction techniques (including setbacks from wells if blasting is required to construct the Project). The Applicant would implement compensatory mitigation for stream impacts if required through the USACE Permit process for specific crossings.
5.2.2.2 Redesign Option The Redesign Option is an optional measure under the Proposed Action that includes a primarily buried collection system. The different collection system would affect water resources similarly to the Proposed Action, but has the potential to impact a total of 49 streams. As under the Proposed Action, wetlands would not be impacted by construction activities. A maximum of 17 additional stream crossings totaling an additional 106.7 m (350 lf) of impact would be required under the Redesign Option, for a total stream impact of not more than 49 crossings and 487.1 m (1,598 lf). In many cases buried electrical interconnects would be co-located with planned access roads and crane paths, so the number of new stream crossings would be minimized. In some cases, buried electrical interconnects would be the only Project component crossing a

Final Environmental Impact Statement Buckeye Wind Project April 2013
Chapter 5 - Environmental Consequences 5-17
stream and these stream crossings would result in only temporary impacts to the water resource. Under the Redesign Option, for each stream crossing that is not Ohio designated exceptional warm water or cold water habitat and that would be temporarily impacted by open trenching to install buried interconnects, the Applicant would also secure any necessary permit for these impacts from the USACE. Streams that are open trenched would be restored to their pre-existing grade and revegetated with appropriate native riparian species. Temporary crossings and areas of temporary construction impact will be restored and re-vegetated per the Erosion and Sediment Control Plan, consisting of planting native plant species (see HCP Appendix D for a typical native plant mix) to provide ground stabilization. Where forest fragmentation results from construction activities, the areas will be restored using trees suitable for Indiana bat habitat, if practicable. A list of native trees suitable for planting to restore Indiana bat habitat is included in HCP Appendix D. If existing land-use precludes the use of native species (e.g. agricultural use), restoration and stabilization will be established consistent with that land-use. Thus, there would be no permanent impacts to any streams that are crossed with buried interconnects only. Potential impacts to wetlands due to changes to a buried interconnect system would be avoided.
5.2.3 Alternative A – Maximally Restricted Operations Alternative Alternative A differs from the Proposed Action only with respect to operations. The operational differences would not affect water resources. As such, the construction, operation, and decommissioning-related effects of Alternative A on water resources and the avoidance and minimization measures would be the same as under the Proposed Action. The mitigation measures listed for the Proposed Action would also be applicable to this alternative.
5.2.4 Alternative B – Minimally Restricted Operations Alternative Alternative B differs from the Proposed Action only with respect to operations. The operational differences would not affect water resources. As such, the construction, operation, and decommissioning-related effects of Alternative B on water resources and the avoidance and minimization measures would be the same as under the Proposed Action. The mitigation measures listed for the Proposed Action would also be applicable to this alternative.
5.2.5 Alternative C - No Action Alternative Under Alternative C, the Project would not be built and no Project-related activities (construction, operation, or decommissioning) would occur. Alternative C would have no effect on water resources. As such, no mitigation measures would be warranted.
5.3 Vegetation
5.3.1 Impact Criteria Vegetation could be impacted at the individual, population, or community scale. Potentially adverse effects on vegetation resulting from Project would include the following:
• Removal, crushing, or other events resulting in the death of individual plants;
• Sub-lethal effects from loss of leaves or other parts, stress from being covered in dust or other foreign material, altered sun/shade patterns or water flow, or other disturbances;

Final Environmental Impact Statement Buckeye Wind Project April 2013
5-18 Chapter 5 - Environmental Consequences
• Introduction of invasive species that outcompete native species;
• Reduction of the natural population below viable levels; and
• Fragmentation of natural vegetation communities.
Vegetation provides certain ecological functions that would be indirectly affected if it were impacted by the Project. Indirect effects on these functions could include the following:
• Loss of habitat for wildlife dependent on these areas for food, water, or shelter;
• Soil loss, erosion, or compaction impacting stream bank stability; and
• Disruption of surface hydrology and normal nutrient cycling. The extent of predicted deviation from existing conditions is the prime factor in the determination of whether direct impacts on vegetation or indirect impacts on ecological functions would be significant. In cases where otherwise minor impacts on vegetation would cause major indirect impacts on the ecological functions it provides, impacts on vegetation could be considered significant.
5.3.2 Proposed Action
5.3.2.1 Avoidance and Minimization Measures The Proposed Action contains the following avoidance and minimization measures that would avoid or minimize impacts to vegetation.
• Project components would be sited in previously disturbed areas (e.g., existing farmland) to the extent possible, and areas of vegetation and soil disturbance would be limited to the smallest size practicable (e.g., the permanent footprint for each turbine would be limited to 0.08 ha (0.2 ac) and a maximum road width of 6 m (20 ft) used for permanent access lanes), such that not more than 168.8 ha (416.9 ac) of temporary impacts and 52.2 ha (128.9 ac) of permanent impacts to vegetation would occur;
• Restoring pre-construction contours and soil/substrate conditions in temporarily disturbed areas, to the extent possible;
• Stabilizing disturbed stream banks per the conditions of any formal state/Federal-issued permit;
• Restoration of disturbed agricultural fields by decompacting soil, re-spreading stockpiled topsoil, and removing any large rocks or debris that would impact future cultivation; and
• Reseeding disturbed soils throughout the Project Area, as per the NPDES permit and Erosion and Sediment Control Plan, with appropriate vegetation (crops in agricultural areas, native species in uncultivated areas) to stabilize exposed soils and control sedimentation and erosion and prevent/discourage invasive plant colonization. To the extent allowable under the applicable permits, landowner preferences would be considered when planning vegetative re-stabilization.
This effects analysis considers these measures in determining the effects of the Proposed Action.

Final Environmental Impact Statement Buckeye Wind Project April 2013
Chapter 5 - Environmental Consequences 5-19
Construction-related Effects Construction of the 100-turbine layout would result in a total initial disturbance of no more than 220.9 ha (545.8 ac), of which 52.2 ha (128.9 ac), or 23.5 percent, would be permanent. Table 5.3-1 provides a detailed breakdown of permanent and temporary vegetation impacts associated with construction of the Project.
The roads would initially be up to 17 m (55 ft) wide during construction, but after construction is complete they would be narrowed to 5 to 6 m (16 to 20 ft) wide. It is anticipated that the operations and maintenance facility would be an existing structure that would be leased and refurbished. If a new building is needed, it would not exceed 557 m2 (6,000 ft²) or permanently disturb more than 1.2 ha (3 ac). The substation would be located in the Town of Union and would occupy a maximum area of 2.0 ha (5.0 ac) of previously disturbed land.

Final Environmental Impact Statement Buckeye Wind Project April 2013
5-20 Chapter 5 - Environmental Consequences
Table 5.3-1 Vegetation Impacts Associated with the 100-Turbine Layout for the Project
Land cover typeb
Area of disturbance
Total Temporary Permanent
Hectares Acres Percent of total Hectares Acres Hectares Acres
Cultivated crops 199.1 492.0 90.1% 157.1 388.2 42.0 103.8 Hay/pasture and herbaceous grassland (not including CRP land)
0.6 1.5 0.3% 0.2 0.5 0.4 1.0
CRP land 11.3 27.9 5.1% 9.0 22.2 2.3 5.7
Developed, open space 3.2 7.9 1.4% 2.3 5.7 0.9 2.2
Deciduous forestc 6.4 15.8 2.9% 0.0 0.0 6.4 15.8
Emergent herbaceous wetlands 0.0 0.0 0.0% 0.0 0.0 0.0 0.0
Developed, low intensity 0.2 0.4 0.1% 0.1 0.2 0.1 0.2
Evergreen forest 0.1 0.3 0.1% 0.1 0.1 0.1 0.2
Open water 0 0.0 0% 0 0.0 0 0.0
Barren land 0 0.0 0% 0 0.0 0 0.0
Developed, medium intensity 0 0.0 0% 0 0.0 0 0.0
Mixed forest 0 0.0 0% 0 0.0 0 0.0
Developed, high intensity 0 0.0 0% 0 0.0 0 0.0
Total 220.9 545.8 100% 168.8 416.9 52.2 128.9
Source: Homer et al. 2004 a Impacts are estimated from actual impacts calculations of the known 52 turbines and associated facilities and a reasonable maximum impact from the additional 48 turbines based on characteristics of the Action Area and the avoidance and minimization measures described in Sections 6.1 – Avoidance Measures and 6.2 – Minimization Measures of the HCP. b Numbers based on the NLCD and adjusted for impacts to wooded areas as determined with the 2010 NAIP and specific avoidance measures such as avoidance of wetlands. c Included in the mitigation acres calculation as an offset for cleared wooded areas
Agricultural land comprises 82 percent of the Action Area; therefore, most of the vegetation loss associated with construction would be in cultivated cropland. The 100-turbine Project would also be expected to result in permanent impacts to no more than 6.4 ha (15.8 ac) of deciduous forest habitat. The forested area that would be impacted occurs at the edges of relatively small forest blocks, hedgerows, or woodlots spread throughout the Action Area. As such, it is not anticipated that existing forested habitat would be significantly fragmented by the Project construction. It is not anticipated that any plant species occurring in the Action Area would be extirpated, or that populations would be significantly reduced as a result of construction activities. For the 100-turbine Project, no more than 11.3 ha (27.9 ac), or 12.4 ha (30.7 ac) of CRP land would be disturbed, which represents 0.9 percent of the 1,253 ha (3,096 ac) of CRP lands within the six townships included in the Action Area (USDA, 2010).
Construction activities that bring in vehicles and materials from outside locations have the potential to transplant invasive species into the Action Area, which could permanently colonize disturbed areas.

Final Environmental Impact Statement Buckeye Wind Project April 2013
Chapter 5 - Environmental Consequences 5-21
Temporary effects on vegetation would occur within the four staging areas, gravel access, and maintenance areas surrounding the turbine towers; the temporarily widened portions of the roads; and areas disturbed to install buried electrical interconnects. Construction of the 100-turbine Project would temporarily disturb not more than 168.8 ha (417.0 ac) of land.
The four temporary construction staging areas would accommodate material storage, parking for construction workers, and construction trailers (for one staging area only). The four staging areas would account for a cumulative total of not more than 9.27 ha (22.9 ac) of temporary impacts.
The 64.4 km (40.0 miles) of new service roads required to connect wind turbines to existing access roads would have a temporary width of up to 17 m (55 ft) during construction and a permanent width of 4.9 to 6.1 m (16 to 20 ft). The remaining portion of the roadway would be temporarily impacted and revegetated in accordance with the NPDES permit and Erosion and Sediment Control Plan.
The buried electrical interconnects would require the removal of 7.3 m (25 ft) wide corridors of vegetation per linear foot of cable, except in areas where the interconnects are located parallel to access roads. These lines would be completely below ground surface and the corridors would not be maintained following installation of the interconnects. Vegetation along the buried interconnects would gradually revert to pre-construction conditions; therefore vegetative impacts associated with the buried electrical interconnects would be expected to be temporary. Not more than 43.2 ha (106.7 ac) of land would be temporarily disturbed for the buried electrical interconnects required for the 100-turbine Project.
Approximately 1.2 ha (3 ac) around the operations and maintenance facility and 2.0 ha (5 ac) around the substation would be permanently impacted.
Operation and Maintenance-related Effects Operation of the Project would have minor effects on vegetation. During Project operations, vegetative control would be implemented for general Project operation and as part of the HCP. Periodic tree trimming would occur for safety and accessibility of the Project facilities. For example, overhead collection lines would be cleared of all overhanging limbs, and trees around access roads may have to be trimmed to maintain open access. No additional clearing of wooded areas would be required during Project operations. Cleared areas required for permanent access would be maintained. Under the Proposed Action 56.7 km (35.2 mi) of the interconnects will be buried. There would be no impacts associated with maintenance along buried electrical interconnects.
Impacts on Vegetation Communities at the Population and Landscape Scale Most of the Project’s impacts would occur on agricultural land, where vegetation is monotypic and dependent on active cultivation to persist. The Project would fragment the agricultural monocultures across the Action Area and somewhat reduce the populations of crops within the Project footprint; however, fragmentation of these communities would have no impact on the viability of natural vegetation communities. Project-related impacts on natural vegetation communities would be minor and would occur almost exclusively at the edges of relatively small forest blocks (maximum clearing size of 1.1 ha [2.7 ac]), hedgerows, or woodlots. There would

Final Environmental Impact Statement Buckeye Wind Project April 2013
5-22 Chapter 5 - Environmental Consequences
be no more than 11.3 ha (27.9 ac), or 12.4 ha (30.7 ac) of impacts to CRP lands. There would be no more than 6.5 ha (16.1 ac) of permanent impacts to forested habitat. Therefore, the Project would not significantly impact the viability of extant natural vegetation populations or communities.
Impacts on Vegetation’s Function as Wildlife Habitat
Grassland habitat comprises just 1.4 percent of the Action Area, and few grassland species (e.g., loggerhead shrike, Northern harrier) are present in the proposed Action Area. These species may avoid the areas immediately surrounding the wind turbines, thus reducing the overall number of grassland species in the immediate area. In addition, increased human presence due to Project-related maintenance activities could decrease the reproductive success of birds nesting near Project facilities. Most permanent effects on native vegetation in the Action Area occur in deciduous forests (6.4 ha [15.8 ac]). However, most of the vegetation that would be impacted by the Project is in active agriculture, and therefore has limited value as wildlife habitat except for generalist species. Generalist species are, by definition, resilient to habitat perturbation and able to persist in impacted habitats; therefore, the Project would not be expected to have significant impacts on the value of the Action Area’s vegetation as general wildlife habitat. See Section 5.4 for evaluation of impacts on wildlife habitat and see Section 5.5 for evaluation of impacts on Indiana bat habitat.
Decommissioning-related Effects Impacts on vegetation associated with decommissioning activities would be related to removal of the turbines, footers, and roads. Some roads would not be removed, per landowner request, and concrete structures would be removed to a depth of 0.9 to 1.2 m (3 to 4 ft). Although some concrete and roads would remain in place, where facilities would be removed the impacts of decommissioning would be generally equivalent to construction-related impacts. Although the volume of concrete removed would not include the volume of concrete installed below 0.9 to 1.2 m (3 to 4 ft), the physical impacts of concrete removal would be generally equivalent to the impacts incurred during the construction phase, but could be significantly less if, as is expected, spread footing turbine foundations are used. The physical impacts of road widening and removal on vegetation (equipment footprints, ground disturbance, etc.) would be generally equivalent to the impacts incurred during the construction phase. It is anticipated that roads would need to be widened to a maximum of 55 ft to accommodate the necessary decommissioning equipment and impacts would be similar to those described for construction. Pre-construction contours and soil/substrate conditions would be restored in disturbed areas, and these areas would be revegetated. Decommissioning activities could occur as early as 2037.
Mitigation Measures for Unavoidable Impacts Most impacts on vegetation would be associated with the construction phase of the Project. There would be no unique impacts on vegetation that would occur solely as a result of Project operation, although operation of the Project would perpetuate some impacts that originated during construction. Therefore, the Proposed Action contains no specific mitigation measures for impacts to vegetation in addition to the avoidance and minimization measures listed above.

Final Environmental Impact Statement Buckeye Wind Project April 2013
Chapter 5 - Environmental Consequences 5-23
5.3.2.2 Redesign Option The Redesign Option is an optional measure under the Proposed Action that includes a primarily buried collection system. The different collection system would affect vegetation resources similarly to the Proposed Action, although an additional 0.3 ha (0.7 ac) of wooded areas would be disturbed in the Redesign Option. Implementation of the Redesign Option would result in a total initial disturbance of no more than 219.9 ha (543.6 ac) of which 52.5 ha (129.8 ac) or 21.4 percent would be permanent. Table 5.3-2 provides a detailed breakdown of permanent and temporary vegetation impacts associated with the 100-turbine Redesign Option. Cultivated crop and hay/pasture land cover types collectively comprise approximately 95% of the area that would be disturbed for the 100-turbine Project in the Redesign Option (Table 5.3-2). No more than 6.8 ha (16.7 ac) of wooded areas are expected to be permanently impacted by the 100-turbine Project with the Redesign Option.
Table 5.3-2 Vegetation Impacts Associated with the 100-Turbine Redesign Option for the Project
Land cover type
Area of disturbance
Total Temporary Permanent
Hectares Acres Percent of total Hectares Acres Hectares Acres
Cultivated crops 196.8 486.4 89.5% 154.8 382.6 42.0 103.8 Hay/pasture and herbaceous grassland (excluding CRP land) 0.7 1.8 0.3% 0.3 0.8 0.4 1.0
CRP land 12.4 30.7 5.6% 10.1 25.0 2.3 5.7
Developed, open space 3.0 7.5 1.4% 2.1 5.2 0.9 2.3
Deciduous forestc 6.7 16.5 3.0% 0.0 0.0 6.7 16.5
Emergent herbaceous wetlands 0.0 0.0 0.0% 0.0 0.0 0.0 0.0
Developed, low intensity 0.2 0.4 0.1% 0.1 0.2 0.1 0.2
Evergreen forest 0.1 0.3 0.1% 0 0.1 0.1 0.2
Open water 0 0.0 0% 0 0.0 0 0.0
Barren land 0 0.0 0% 0 0.0 0 0.0
Developed, medium intensity 0 0.0 0% 0 0.0 0 0.0
Mixed forest 0 0.0 0% 0 0.0 0 0.0
Developed, high intensity 0 0.0 0% 0 0.0 0 0.0
Total* 219.9 543.6 100% 167.4 413.9 52.5 129.8
Source: Homer et al. 2004 a Impacts are estimated from actual impacts calculations of the known 52 turbines and associated facilities and a reasonable maximum impact from the additional 48 turbines based on characteristics of the Action Area and the avoidance and minimization measures described in Sections 6.1 – Avoidance Measures and 6.2 – Minimization Measures of the HCP. b Numbers based on the NLCD and adjusted for impacts to wooded areas as determined with the NAIP and specific avoidance measures such as avoidance of wetlands. c Include in the mitigation acres calculation as an offset for cleared wooded areas *Totals may not appear to accurate reflect the sum of the figures in the column due to rounding
Final Environmental Impact Statement Buckeye Wind Project April 2013
5-24 Chapter 5 - Environmental Consequences
Temporary effects on vegetation would occur within the staging areas, gravel access, and maintenance areas surrounding the turbine towers; the temporarily widened portions of the roads; and areas disturbed to install buried electrical interconnects. Construction of the 100-turbine Project under the Redesign Option would temporarily disturb no more than 167.4 ha (413.9 ac) of land. Similar to the Proposed Action, there would be no ongoing impacts associated with maintenance along buried electrical interconnects under the Redesign Option. Under the Redesign Option 86.5 km (53.7 km) of the interconnects will be buried. There would be no impacts associated with maintenance along buried electrical interconnects.
The avoidance and minimization measures would be the same as described above for the Proposed Action. No mitigation measures would be warranted.
5.3.3 Alternative A- Maximally Restricted Operations Alternative Alternative A differs from the Proposed Action only with respect to operations. The operational differences would not affect vegetation. As such, the construction, operation, and decommissioning-related effects of Alternative A on vegetation and the avoidance and minimization measures would be the same as under the Proposed Action. No mitigation measures would be warranted.
5.3.4 Alternative B – Minimally Restricted Operations Alternative Alternative B differs from the Proposed Action only with respect to operations. The operational differences would not affect vegetation. As such, the construction, operation, and decommissioning-related effects of Alternative B on vegetation and the avoidance and minimization measures would be the same as under the Proposed Action. No mitigation measures would be warranted.
5.3.5 Alternative C - No Action Alternative Under Alternative C, the Project would not be built and no Project-related activities (construction, operation, or decommissioning) would occur. Alternative C would have no effect on vegetation. As such, habitat would remain in its existing condition and no mitigation measures would be warranted.
5.4 Wildlife and Fisheries
5.4.1 Impact Criteria Several federal regulations pertaining to fish and wildlife are relevant to this analysis; however, most of those regulations pertain to impacts on rare, threatened, or endangered species and are discussed in Section 5.5. Non-listed migratory birds are also protected under the MBTA. This section is related primarily to non-listed species.
Assessment of effects on wildlife and fisheries resources are based on four major elements, as follows:
• The importance of the resource, in legal, commercial, recreational, ecological or scientific terms;
Final Environmental Impact Statement Buckeye Wind Project April 2013
Chapter 5 - Environmental Consequences 5-25
• The proportion of the resource that would be affected, relative to its abundance in the region;
• The sensitivity of the resource to proposed activities; and
• The duration of the ecological consequences. Specifically, effects on wildlife and fisheries resources would be significant if important species or habitats (i.e., species or habitats considered significant by state or federal natural resource agencies) were adversely affected over relatively large areas; a large proportion of an important species or habitat within a region is adversely affected; or if disturbances related to the Proposed Action or alternatives cause substantial reductions in population size or distribution of an important species. The duration of an effect also affects its significance level, as do regulatory triggers and protocols such as those established by ODNR for bird and bat mortality that prompt adaptive management.
5.4.2 Proposed Action
5.4.2.1 Avoidance and Minimization Measures The Proposed Action contains the following avoidance and minimization measures that would avoid or minimize impacts to wildlife and fisheries.
• Tree removal during construction would occur between November 1 and March 31, to reduce the potential for impacts on roosting bats and nesting/breeding birds.
• CRP land would be cleared only during the non-breeding season for grassland birds (before March 1 and after July 15).
• Although juvenile bald eagles were observed by local residents in 2011, no bald eagle nests or nests of other State-listed raptor species have been identified in the Action Area. Should any protected species of raptor nest be identified, impact minimization measures would be established in cooperation with the ODNR DOW.
• The Applicant would implement feathering at various cut-in speeds from one half-hour before sunset to one half-hour after sunrise from April 1 to October 31 as part of the minimization measures incorporated in the HCP for Indiana bat impact. A number of studies have now shown that use of feathering and cut-in speeds similar to those proposed for the Project have been demonstrated to reduce all bat mortality by 38 to 93 percent (Arnett et al. 2010, Baerwald et al. 2009, Good et al. 2011, and Good et al. 2012), therefore this action will substantially minimize all bat mortality. Cut-in speeds and feathering have not been shown to reduce bird deaths, but with greater curtailment1 there could possibly be less bird mortality, especially for those bird species that migrate at night (see discussion in Section 5.5).
• Access roads built for the Project would be posted with a 25 mph speed limit to minimize risk of collision with Indiana bats and other wildlife.
1 Curtailment or curtailing refers to turbines whose cut-in speed is increased above the manufacturing cut-in speed, but turbine blades may still rotate to some degree below the increased cut-in speed.

Final Environmental Impact Statement Buckeye Wind Project April 2013
5-26 Chapter 5 - Environmental Consequences
• Project siting was informed by FAC recommendations, ODNR’s Protocol (ODNR 2009), agency input from the USFWS and ODNR, and general best management practices informed by research and experience.
• In addition to the aforementioned guidelines, the Project’s design also incorporates aspects of the Service Interim Guidance on Avoiding and Minimizing Wildlife Impacts from Wind Turbines (USFWS 2003)2. This guidance preceded the current USFWS Guidelines (USFWS 2012c), but included similar site development, project design, turbine design, and operation recommendations, aimed to reduce potential wind farm impacts on wildlife such as birds and bats. Specifically, the following USFWS recommendations were incorporated into the Project design, and are followed by an explanation of how these recommendations were incorporated:
• Implementation of a post-construction monitoring plan based on the ODNR recommendations and coordination with the USFWS, to determine the rates and species-specific patterns of avian and bat collision fatalities at turbines.
• An annual estimate of bird and bat mortality would be calculated on a total project, per turbine, per MW, and per rotor-swept area basis.
• The distribution of bird and bat carcasses would be investigated to determine any patterns related to Project design features. Potential features to be considered include FAA lighting; position of turbines in turbine strings (i.e. middle or end); influence of landscape features including proximity to wetlands and streams, proximity to forest edge, and proximity to open areas; location in Project Area (i.e. north or south edge); elevation; or season and weather patterns. If necessary, additional minimization measures would be made through adaptive management, to keep non-listed bird and bat mortality below levels in the ODNR Protocol (ODNR 2009). The Avian and Bat Protection Plan (ABPP) for this Project is provided in Appendix C.
Site Development and Maintenance Recommendations and Corresponding Project Elements
• Avoid locating turbines in known bird migration pathways or in areas where birds are highly concentrated, unless mortality risk is low (e.g., birds present rarely enter the rotor-swept area). Examples of areas that could potentially support high concentration of birds are wetlands, State or Federal refuges, private duck clubs, staging areas, rookeries, leks, roosts, riparian areas along streams, and landfills. Avoid known daily movement flyways (e.g., between roosting and feeding areas) and areas with a high incidence of fog, mist, low cloud ceilings, and low visibility. The Applicant incorporated avoidance and minimization of direct physical impacts to bat and migratory bird habitats (e.g., ground disturbance or habitat removal) as much as possible for the Project. None of the turbines are sited in wetlands, riparian areas along streams, in landfills, or near known rookeries or leks. Pre-siting assessments indicated that the area did not, at the time of survey, have high concentrations of sensitive birds or bats. Additionally, in order to continue to avoid any impacts to stream habitat, the Applicant would avoid direct impacts to designated exceptional
2 The 2012 US Fish and Wildlife Service Land-Based Wind Energy Guidelines are now available; however, the Interim Guidance is cited here as it was the operative guidance document during project planning, and served as the basis for the 2012 document.

Final Environmental Impact Statement Buckeye Wind Project April 2013
Chapter 5 - Environmental Consequences 5-27
warm or cold water habitat streams, as well as any streams thought to have the characteristics necessary to support federally threatened, endangered, or candidate species of freshwater mussels.
• Avoid placing turbines near known bat hibernation, breeding, and maternity/nursery colonies, in migration corridors, or in flight paths between colonies and feeding areas. Stantec conducted several bat studies (i.e., mist netting, acoustic detection, radio telemetry, radar, and swarming studies) to determine the location of any bat hibernacula, maternity colonies, migration corridors, and flight paths in the Action Area. The Applicant considered these survey results to the maximum extent possible when designing the placement of the currently sited turbines. For example, the Applicant revised their initial turbine layout to avoid a documented hibernaculum for non-listed bat species. The Applicant would follow a similar process for the additional turbines and would fully consider the results of prior surveys when siting the additional turbines.
• Configure turbine locations to avoid areas or features of the landscape known to attract raptors (hawks, falcons, eagles, owls). For example, golden eagles, hawks, and falcons use cliff/rim edges extensively; setbacks from these edges may reduce mortality. Other examples include not locating turbines in a dip or pass in a ridge, or in or near prairie dog colonies. The Action Area was surveyed in 2007 and 2008 for raptors to determine if there were any areas with high raptor activity so that these areas could be avoided. However, no such area was identified during these surveys.
• Configure turbine arrays to avoid potential avian mortality where feasible. For example, group turbines rather than spreading them widely, and orient rows of turbines parallel to known bird movements, thereby decreasing the potential for bird strikes. Implement appropriate storm water management practices that do not create attractions for birds (such as basins or ponds), and maintain contiguous habitat for area-sensitive species (e.g., sage grouse) to the extent practicable. The Applicant could not identify any distinct avian use patterns within the Action Area, making it infeasible to define particular turbine array patterns that would reduce potential bird strikes. Ground and habitat disturbance would be minimized to the extent practicable (greater than 90 percent of total disturbed area is composed of cultivated crops), resulting in minimal habitat fragmentation for area-sensitive species. Temporary ponds would not likely be created given the lack of slope in the Action Area. Contiguous habitat would be maintained to the extent practicable.
• Avoid fragmenting large, contiguous tracts of wildlife habitat. Where practical, place turbines on lands already altered or cultivated, and away from areas of intact and healthy native habitats. If not practical, select fragmented or degraded habitats over relatively intact areas. For this Project, most (over 90%) of the turbines and associated facilities would be placed in agricultural fields and along the edge of small forest patches, and would avoid areas of native, intact habitat that have greater wildlife habitat value. Further, the limited removal of forest habitat and other vegetation areas would help maintain connectivity between forest areas, foraging corridors for bats, and movement corridors.

Final Environmental Impact Statement Buckeye Wind Project April 2013
5-28 Chapter 5 - Environmental Consequences
• Avoid placing turbines in habitat known to be occupied by prairie grouse or other species that exhibit extreme avoidance of vertical features and/or structural habitat fragmentation. In known prairie grouse habitat, avoid placing turbines within 8 km (5 mi) of known leks (communal pair formation grounds). No prairie grouse habitat was identified in the Action Area during Stantec’s 2007 and 2008 avian surveys, and they are not expected to occur in the Action Area.
• Minimize roads, fences, and other infrastructure. All infrastructure should be capable of withstanding periodic burning of vegetation, as natural fires or controlled burns are necessary for maintaining most prairie habitats. The Project has minimized infrastructure to the extent possible and therefore minimized potential impacts to vegetation and wildlife habitat in the Action Area. Project buildings and infrastructure would be built according to applicable fire codes. Controlled burns are not anticipated to occur within the Action Area.
• Develop a habitat restoration plan for the proposed site that avoids or minimizes negative impacts on vulnerable wildlife while maintaining or enhancing habitat values for other species. For example, avoid attracting high densities of prey animals (rodents, rabbits, etc.) used by raptors. The Project Applicant would reseed all temporarily disturbed areas (outside of active agricultural fields) after construction and decommissioning with a native seed mix in accordance with the NPDES permit and Erosion and Sediment Control Plan. Temporary crossings and areas of temporary construction impact will be restored and re-vegetated per the Erosion and Sediment Control Plan, consisting of planting native plant species (see HCP Appendix D for a typical native plant mix) to provide ground stabilization. Where forest fragmentation results from construction activities, the areas will be restored using trees suitable for Indiana bat habitat, if practicable. A list of native trees suitable for planting to restore Indiana bat habitat is included in HCP Appendix D. If existing land-use precludes the use of native species (e.g. agricultural use), restoration and stabilization will be established consistent with that land-use.
• Reduce availability of carrion by practicing responsible animal husbandry (removing carcasses, fencing out cattle, etc.) to avoid attracting golden eagles and other raptors. Any observed road-kill or other dead animals that may attract scavenging raptors such as vultures or eagles would be cleared from within turbine areas, and access roads.
Project Design and Operation Recommendations
• Use tubular supports with pointed tops rather than lattice supports to minimize bird perching and nesting opportunities. Avoid placing external ladders and platforms on tubular towers to minimize perching and nesting. Avoid use of guy wires for turbine or meteorological tower supports. This Project would use tubular towers and internal ladders for the wind turbines. Permanent meteorological towers would be free-standing and guy wires would not be used.
• High seasonal concentrations of birds may cause problems in some areas. If, however, power generation is critical in these areas, an average of three years monitoring data (e.g., acoustic, radar, infrared, or observational) should be collected and used to determine peak use dates for specific sites. Where feasible, turbines should be shut down

Final Environmental Impact Statement Buckeye Wind Project April 2013
Chapter 5 - Environmental Consequences 5-29
during periods when birds are highly concentrated at those sites. The Applicant would implement an ABPP for the life of the Project, which includes avoidance and minimization measures, post-construction monitoring, and adaptive management focused on reducing impacts to migratory birds and bat species other than the Indiana bat.
• When upgrading or retrofitting turbines, follow the above guidelines as closely as possible. If studies indicate high mortality at specific older turbines, retrofitting or relocating is highly recommended. As addressed above, the Project Applicant would implement an ABPP for the life of the project, which includes avoidance and minimization measures and adaptive management to reduce impacts to wildlife that are identified during post-construction monitoring.
In addition to the measures listed above, the following design measures from the USFWS Interim Guidance on Avoiding and Minimizing Wildlife Impacts from Wind Turbines (2003) have been incorporated in the Proposed Action, and are specifically aimed to reduce potential impacts to birds and bats in flight.
• The minimum amount of pilot warning and obstruction avoidance lighting specified by the FAA would be used (FAA 2000).
o Attached to the top of some of the nacelles would be a single, medium intensity aviation warning light.
o Approximately one in every five turbines would be lit, and all lights within the facility would illuminate synchronously.
o FAA lights are anticipated to be flashing red strobes (L-864) that operate only at night. Buckeye Wind would use the lowest intensity lighting as allowed by FAA.
o To the extent possible, USFWS recommended lighting schemes would be used on the nacelles, including reduced intensity lighting and lights with short flash durations that emit no light during the “off phase”.
o MET towers would also utilize the minimum lighting as required by the FAA.
o No steady burning lights would be left on at Project buildings. Where lights are necessary for safety or security, motion detector lighting or infrared light sensors would be used to avoid continuous lighting.
• Where feasible, electric power lines would be placed underground or on the surface as insulated, shielded wire to avoid electrocution of birds. Avian Power Line Interaction Committee (APLIC) “Suggested Practices for Avian Protection on Power Lines” would be utilized to the extent the Applicant is able to dictate their use (in almost all cases, the overhead lines would be co-located on utility-owned poles. The ability to implement full APLIC compliance may be hindered as a result).
Final Environmental Impact Statement Buckeye Wind Project April 2013
5-30 Chapter 5 - Environmental Consequences
Construction-related Effects
Terrestrial Wildlife
Incidental Injury & Mortality
Incidental injury and mortality from the Project construction would be limited to sedentary/slow-moving species, such as small mammals, reptiles, and amphibians that are unable to move away from the active construction area. Clearing activities would not be conducted during the breeding season, as certain construction activities could destroy nests and kill or harm young birds and immature mammalian species that are not yet fully mobile. More mobile species and mature individuals should be able to vacate the areas being disturbed. Over ninety percent of Project components are sited in active agricultural land that has limited wildlife habitat value. For these reasons, impacts on terrestrial wildlife associated with the Project are anticipated to be minor.
Habitat Loss/Degradation As discussed in Section 5.3 above, construction of the proposed 100 turbines would result in temporary and permanent impacts to no more than 220.9 ha (545.8 ac) of vegetation, most of which is agricultural land. Specifically, there would be no more than 157.3 ha (388.6 ac) of temporary disturbance and 42.4 ha (104.9 ac) of permanent disturbance to cultivated crop and hay/pasture vegetation (this excludes CRP land), which is approximately 90 percent of the total area of disturbance. This agricultural land is already disturbed by mowing, plowing, harvesting, etc., and it provides habitat for a limited number of animal species. Nevertheless, these hayfields and pasturelands may provide habitat for open country/grassland avian species (e.g., Northern harrier, bobolink, red-winged blackbird, and savannah sparrow), and temporary and permanent disturbance could adversely affect these species.
The 100-turbine array would result in no more than 6.5 ha (16.1 ac) of permanent disturbance (3.0 percent of total permanent impacts) to deciduous and evergreen forests. While forested habitat provides habitat for a variety of terrestrial wildlife species, most of the affected forest would occur along the edges of small forest blocks or woodlots (i.e., less than 12 ha [30 ac]), which is generally less valuable for forest wildlife species than larger tracts of forest. Grassland and CRP lands provide suitable habitat for many species of birds. A maximum of 2.3 ha (5.7 ac) of CRP land would be permanently impacted by the Project. This could have the potential to displace some species, but the area of impact is relatively small, and significant impacts to grassland species are not expected.
Earth-moving activities associated with Project construction have the potential to cause siltation and sedimentation impacts down slope of the area of disturbance and, in turn, affect surface water habitats used by foraging wildlife, such as bats, swallows, and muskrats. No turbines would be sited within 15 m (50 ft) of a federal or state jurisdictional wetland. Impacts to waterbodies may occur in localized areas where the Project intersects surface waters. To prevent adverse effects to water quality and aquatic habitat during construction, runoff would be managed under an NPDES construction storm water permit and associated SWPPP. Prior to construction, an Erosion and Sediment Control Plan would be developed and would use appropriate runoff diversion and collection devices. Also, because the majority of Project components would be sited in active agricultural land, soil disturbance/exposure due to Project

Final Environmental Impact Statement Buckeye Wind Project April 2013
Chapter 5 - Environmental Consequences 5-31
construction would generally occur in areas already subject to regular plowing, tilling, harvesting, and other agricultural practices. Clearing activities would be conducted outside of the breeding season in order to avoid negative impacts to birds and terrestrial wildlife.
Project construction would affect no more than 32 jurisdictional streams, totaling 380.4 m (1,248 lf) for the 100-turbine Project, which, in turn, could affect wildlife species that are dependent on these. However, the Applicant would implement techniques to avoid impacts to streams to the extent practicable. Existing stream crossings would be used whenever possible. Existing crossings may need to be temporarily strengthened with steel plates to support heavy equipment (e.g., cranes) and turbine components. In situations where there is no existing crossing, low-impact crossing techniques would be utilized wherever practicable. Such techniques could include permanent bridge span above the ordinary high water mark for access roads and directional boring for buried electrical collection lines. Given the limited area of impacted riparian habitat relative to the available habitat in the area, tree removal in the vicinity of stream crossings would result in minor fragmentation of riparian wooded habitat potentially utilized terrestrial wildlife.
Disturbance/Displacement
Increased noise and human activity associated with construction would result in some short-term displacement of wildlife that use cropland, hayfield, and forest edges (e.g., deer, raccoon, skunk, grassland birds, and forest edge birds). However, due to the existing disturbance resulting from tractors, plows, and other agricultural equipment, most wildlife in the Action Area are likely accustomed to a certain amount of disturbance, so Project-related disturbance impacts would be minor.
Aquatic Wildlife Impacts on aquatic wildlife would be limited to areas where water quality and/or habitat would be impacted by construction activities. Increased turbidity from excess sediment loads in runoff from disturbed area would decrease water quality and could lead to decreases in primary production, reduced foraging opportunities, decreased habitat value, and possibly displacement, injury, or death of organisms, such as mollusks, that are unable to tolerate degraded conditions. Most of these impacts would be associated with road crossings and interconnects. The avoidance and minimization measures including implementation of an Erosion and Sediment Control Plan, minimization of vegetation clearing and subsequent revegetation, horizontal directional boring, and other measures discussed in Section 5.2 would result in minor impacts to aquatic wildlife.
Operation and Maintenance-related Effects
Terrestrial Wildlife
Operational impacts to wildlife are expected to include displacement due to the presence of the wind turbines and avian and bat mortality and/or injury as a result of collisions (and barotrauma – damage to or rupture of the lungs due to sudden air pressure changes – for bats) with the wind turbines.
Final Environmental Impact Statement Buckeye Wind Project April 2013
5-32 Chapter 5 - Environmental Consequences
Disturbance/Displacement
The presence of turbines can result in direct effects to wildlife species associated with habitat loss or displacement. These types of impacts are potentially complex, involving shifts in species abundance, turbine avoidance, habitat use, and behavioral disruption. There are limited data available addressing impacts to birds associated with habitat loss due to wind farm developments in the U.S.; the majority of studies have focused on collision mortality. Additionally, the effects of wind turbines on those animal species found in agricultural landscapes are not fully understood. Wind facilities in agricultural landscapes create a less noticeable disruption of habitat associated with turbine pad clearings, new roads, and transmission lines as compared to wind facilities constructed in forested or grassland landscapes. Increased noise and human activity associated with maintenance and monitoring activity is expected; however, due to the existing disturbance resulting from tractors, plows, and other agricultural equipment, most wildlife in the Action Area are likely accustomed to a certain amount of disturbance, and therefore Project-related disturbance impacts would be minor.
There is evidence that certain grassland species do not respond favorably to the construction and operation of wind turbines within their habitat. Studies conducted at the Buffalo Ridge Wind Power Plant (Buffalo Ridge) in southwestern Minnesota found reduced numbers of grassland nesting birds in proximity to wind turbines (although other bird group numbers were not affected, such as waterfowl, shorebirds, doves, flycatchers, corvids, blackbirds, and thrushes) (Johnson et al. 2000). At Buffalo Ridge, Osborn et al. (1998) reported fewer birds and fewer species in survey plots with turbines as compared to reference survey plots. Osborn et al. (1998) also concluded that birds avoided flying in areas with turbines. Also at Buffalo Ridge, Leddy et al. (1999) observed that male songbird densities were four times greater in reference CRP grasslands as compared to CRP grasslands located within 180.0 m (590.6 ft) of turbines. At the Maple Ridge Wind Power Project in northeastern New York, Kerlinger and Dowdell (2008) found lower densities of bobolinks within 75.01 m (246.1 ft) of turbines in hayfields as compared to densities in hayfields without turbines. In a study at the Stateline Wind Project in Oregon and Washington, grasshopper sparrows and western meadowlarks showed a significant decrease in use within the first 50.0 m (164.0 ft) of the turbines (WEST and Northwest 2004).
For the 100-turbine Project, a maximum of 11.3 ha (27.9 ac) of CRP land in the Action Area would be impacted. The proposed 100-turbine Project would result in no more than 9.0 ha (22.2 ac) of temporary impacts and 2.3 ha (5.7 ac) of permanent impacts to grasslands (including both the hay/pasture and CRP land cover categories). A small number of grassland species (including bobolinks, grasshopper sparrows, and several warbler species among others) are present in the proposed Action Area, and these species may avoid the areas immediately surrounding the wind turbines, thus reducing the overall number of grassland individuals, species, or both in the immediate area. In addition, increased human presence due to Project-related maintenance activities could decrease the reproductive success of birds nesting near Project facilities.
Although waterfowl are likely to use hayfields and cropland in the Action Area for foraging and roosting, there are no important waterfowl breeding or migratory stopover habitats (lakes or large ponds, large perennial streams) in the Action Area (Section 4.4). The largest perennial streams in the Action Area that could be frequented by waterfowl include Kings Creek, Buck Creek, Dugan Run, and Little Darby Creek. The average distance to the closest turbine from these streams ranges from approximately 25 m (82 ft) to 503 m (1,650 ft). As such, Project impacts to

Final Environmental Impact Statement Buckeye Wind Project April 2013
Chapter 5 - Environmental Consequences 5-33
waterfowl are not expected to be significant. A two-year study conducted on the Top of Iowa Wind Farm in Worth County, Iowa, Koford et al. (2005) documented no effects on the use of fields by geese or other waterfowl species as a result of wind turbines. In a separate study, although the majority of grassland nesting birds decreased their use adjacent to the turbines at the Buffalo Ridge Facility, waterfowl were observed to continue using the area (Osborn et al. 1998). Based on these study results and observations at other wind power projects (Erickson 2002 and Jain 2005), the Project is not anticipated to have a significant short-term or long-term effect on resident or migrating waterfowl. Low densities of raptor species were observed in the Action Area, likely due to the lack of prominent landscape features such as ridges, and it is therefore anticipated that impacts to raptors from the Project would be minor. Some forest-breeding songbird species may be displaced due to forest clearing or avoidance of newly created edge habitat. Some species have been observed to have decreased nesting success as fragmented habitat may attract competitive generalist species, such as the nest-parasitic brown-headed cowbird (IDNR, 2007).
Some species have a greater tolerance than others for human activity and habitat modification in the vicinity of breeding and feeding areas. While habituation may not be immediate, species such as deer and wild turkey generally adapt quickly to the presence of man-made features in their habitat, as evidenced by the abundance of these species in suburban settings. Specific to wind turbines, deer and wild turkey have been observed foraging at the base of recently erected wind turbines (EDR 2009a), although at least one wild turkey fatality was documented at the Altamont Pass wind facility in California (Smallwood & Thelander 2008).
A study by Stewart et al. (2005), found that bird abundance declines after the construction of a wind facility. The same study also found that this decline in abundance becomes more pronounced over time, and may affect different group of species differently. Data suggested that Anseriformes (ducks) and Charadriiformes (sandpipers, plovers, auks, and gulls) suffer greater declines in abundance than other groups of species due to disturbance, displacement, and the creation of a barrier to movement, in contrast to raptors and songbirds that are more likely to be impacted by mortality as a result of collision.
Kunz et al. (2007) suggested that bats may become acoustically disoriented upon encountering turbines during migration or feeding. However, observations of bat flight activity using TIR cameras at wind energy facilities suggest that bats are able to normally fly and forage in close proximity to wind turbines (Ahlen 2003 as cited in Kunz et al. 2007, Horn et al. 2008). While these studies indicate that bats may not be affected by sound from operating turbines, there are no data that specifically addresses the impacts of sound from wind turbine operation on migrating or foraging Indiana bats. Bats could potentially be displaced or disturbed by the removal of trees used for foraging or roosting. However, given the small portion of the total wooded area that would be cleared for the Project, it is expected that Project-related clearing would not significantly decrease the availability of suitable habitat.
Overall, a literature review on the likelihood for disturbance/displacement of terrestrial wildlife suggests that some effects would likely occur as the result of the Project, and that grassland birds are the most likely group to be affected. The magnitude of these impacts would be minimal as the Project would result in a relatively small amount of habitat loss and disruption, relative to the size of the surrounding landscape. These impacts are expected to consist primarily of shifts in

Final Environmental Impact Statement Buckeye Wind Project April 2013
5-34 Chapter 5 - Environmental Consequences
distribution of species within the Action Area that could also occur as the result of other types of impacts, such as agriculture and housing developments.
Avian Collision and Mortality
Collision with various man-made structures, including wind turbines, is a significant source of bird mortality (Trapp 1998, Kerlinger 2000, Shire et al. 2000). An estimated 20,000 to 37,000 birds were killed by approximately 17,500 wind turbines in the United States in 2003 (Erickson et al. 2003). After correcting for searcher efficiency and scavenger rates, fatalities ranged from zero to about nine birds/turbine/year (b/t/y), yielding an average of 2.1 b/t/y (Erickson et al. 2005).
General literature exists on behavior of migrating birds with respect to topography, seasonal timing, and general migration routes. Also, an increasing amount of information from radar surveys conducted at proposed wind projects is becoming publicly available and provides information on flight heights and passage rates. Several entities have conducted numerous radar surveys at proposed wind projects throughout the east between 1998 and 2007 (see Appendix F, Table F-4). Results of these surveys were compared to those from the Action Area to provide context and to characterize overall anticipated migration patterns in the vicinity of the Project.
Also available are the results of 24 publicly available post-construction mortality studies conducted at 19 different locations in the eastern and midwestern United States (Osborn et al. 2000; Johnson et al. 2000, 2002; Howe et al. 2002; Kerns and Kerlinger 2004; Koford et al. 2004, 2005; Arnett 2005; Piorkowski 2006; Derby et al. 2007; Fiedler et al. 2007; Jain et al. 2007, 2008, 2009a, 2009b, 2009c, 2009d; Miller 2008; Stantec 2009b, 2009c, 2010a; Vlietstra 2008; Arnett et al. 2009; Gruver et al. 2009; NJ Audubon Society 2009; Tidhar 2009; Young et al. 2009; Drake et al. 2010). These studies provide information regarding the numbers of individuals and species of birds that have been involved with collisions at wind farms.
Based on these 24 post-construction monitoring studies in the east and midwest, a total of 868 individual avian fatalities were documented either during standard searches or incidentally (Table 5.4-1). These mortality studies were conducted in a variety of habitats including agricultural upland, forested ridgeline, coastal, and grassland. Of the total fatalities, passerines represented the majority (n=628, 72.4 percent). Among passerine species, nocturnally migrating species such as warblers and vireos were most commonly found as fatalities.

Final Environmental Impact Statement Buckeye Wind Project April 2013
Chapter 5 - Environmental Consequences 5-35
Table 5.4-1 Documented Avian Fatalities at Wind Farms between 1994 and 2009 in the Eastern and Midwestern United States
Bird group Number of individuals Percent of total fatalities Passerine 628 72.4 Unknown species 108 12.4 Raptor 46 5.3 Waterfowl 21 2.4 Game bird 41 4.7 Shorebird 14 1.6 Seabird 6 0.7 Owl 4 0.5
Total 868 100.0 Note: Not all fatality data were corrected for searcher efficiency or scavenger removal biases. Sources: Osborn et al. 2000; Johnson et al. 2000, 2002; Howe et al. 2002; Kerns and Kerlinger 2004; Koford et al. 2004, 2005; Arnett 2005; Piorkowski 2006; Derby et al. 2007; Fiedler et al. 2007; Jain et al. 2007, 2008, 2009a, 2009b, 2009c, 2009d, Miller (2008; Stantec 2009b, 2009c, 2010a; Vlietstra 2008; Arnett et al. 2009; Gruver et al. 2009; NJ Audubon Society 2009; Tidhar 2009; Young et al. 2009;and Drake et al. 2010.
Rates of avian collision mortality at existing wind facilities in the east and upper Midwest of the United States have been documented to range from zero to approximately 10 bird fatalities per turbine per year (Erickson et al. 2001; Erickson et al. 2005). Although avian collision mortality can occur at any time of year, patterns in avian collision mortality at tall towers, buildings, wind turbines, and other structures suggest that the majority of fatalities occur during the spring and fall migration period (NRC 2007). Limited data from existing wind facilities suggest that migrant species represent roughly half the fatalities, while resident species represent the other half (NRC 2007).
The factors that influence increased risk of bird collision with wind turbines appear to be a combination of overall abundance, weather, and species-specific flight behaviors.
In addition, some researchers have described the concept of motion smear, defined as the “degradation of the visibility of rapidly moving objects” (Hodos et al. 2001). This concept applies primarily to the blade tips of wind turbines, and means that when they are moving at high speeds they may appear transparent, causing birds to be unable to avoid collision since they do not perceive the blade tip as a solid object. Experiments in developing anti-motion smear patterns to be placed on turbine blades have had some success in increasing blade visibility at distances of 23 m or greater in brightly lit conditions.
Passerines. In the midwestern and eastern United States, nocturnally migrating passerines have accounted for the majority of fatalities at wind projects (Table 5.4-1). In general, the documented levels of fatalities are small relative to the source populations of these species. When data are corrected for scavenging and observer efficiency biases, mortality studies estimate that each wind turbine accounts for 2.19 avian fatalities per year, of which approximately 72.4 percent are passerines (Erickson et al. 2001). Passerine activity levels within the Action Area during preconstruction avian surveys were low when compared to other sites in the U.S. with publicly available data (Appendix G). Additionally, the mean flight altitude of night migrating passerines was well above the maximum height of the wind turbines (Table 4.4-

Final Environmental Impact Statement Buckeye Wind Project April 2013
5-36 Chapter 5 - Environmental Consequences
1). These data suggest that passerine mortality at the Project is expected to be similar to or lower than rates observed at other wind facilities in similar settings.
Waterfowl. Because there are small wetlands in the vicinity of the Action Area, some waterbirds may be present, which could be at risk of colliding with turbines. Also, Canada geese that forage on nearby agricultural fields may be exposed to a slightly higher level of risk. However, research has demonstrated that waterfowl and other waterbirds rarely collide with wind turbines (Table 5.4-1). Of 868 avian fatalities documented in Table 5.4-1, waterfowl, shorebirds, and seabirds represented 2.4 percent (n=21), 1.6 percent (n=14), and 0.7 percent (n=6) of fatalities, respectively. A study at the Top of Iowa Wind Power Project site revealed no fatalities of waterfowl (Koford et al. 2005). Risk of collision to migrant waterfowl is likely to be minimal due to their tendency to migrate at high altitudes (Kerlinger and Moore 1989 and Bellrose 1976). Suitable waterbird habitat is sparsely distributed within the Action Area, and there are very few large perennial bodies of open water. Few waterbird species were observed during breeding bird surveys conducted in spring and summer 2008 (May 3 to July 29, 2008) (Stantec 2009; Hull 2009d). The potential for collision risk to resident waterbirds (waterfowl, long-legged waders, shorebirds, rails, etc.) in the Action Area is not likely to be significant.
Raptors. Raptors tend to migrate or travel locally along prominent landscape features, and wind turbines are typically built on prominent landscape features. Thus, wind farms on prominent ridges and within migration pathways can result in high raptor mortality (e.g., at the Altamont Pass in California). In addition, following development of this facility, there was an increase in mammal prey for raptors, increasing collision risk (Thelander et al. 2003). However, evidence suggests that the risk of raptor collision with turbines in the eastern and midwestern U.S. is generally relatively low, estimated at approximately 0.033 mortalities per turbine per year (Erickson 2001). Raptors represented only 5.3 percent (n=46) of the 868 avian fatalities shown in Table 5.4-1.
Impacts to migrating raptors as a result of Project operations would be low, because: (1) as described in Section 4.4.2, the number of migrating raptors detected in the Project site during the 2007 and 2008 surveys was low; (2) there are no prominent ridges or other landscape features in the Action Area; and (3) studies at other wind energy facilities found that the raptors most likely to be impacted are resident birds that forage in open country, such as red-tailed hawks, as opposed to migrating raptors that pass through the area (Table 5.4-2).
Table 5.4-2 Species Composition of Documented Raptor Fatalities at Wind Farms in the Eastern and Midwestern United States
Species Number of individuals American kestrel 4 Broad-winged hawk 2 Cooper’s hawk 1 Osprey 2 Red-tailed hawk 16 Sharp-shinned hawk 5 Turkey vulture 16
Sources: Osborn et al. 2000; Johnson et al. 2000, 2002; Howe et al. 2002; Kerns and Kerlinger 2004; Koford et al. 2004, 2005; Arnett 2005; Piorkowski 2006; Derby et al. 2007; Fiedler et al. 2007; Jain et al. 2007, 2008, 2009a, 2009b, 2009c, 2009d; Miller 2008; Stantec 2009b, 2009c, 2010a; Vlietstra 2008; Arnett et al. 2009; Gruver et al. 2009; NJ Audubon Society 2009; Tidhar 2009; Young et al. 2009; and Drake et al. 2010.

Final Environmental Impact Statement Buckeye Wind Project April 2013
Chapter 5 - Environmental Consequences 5-37
Flight behavior. Flight behavior is also believed to be associated with rates of avian collision mortality. Species that migrate at higher altitudes or avoid migrating during inclement weather would be at decreased risk of collision. Conversely, birds taking off at dusk or landing at dawn, birds traveling in low cloud or fog conditions, or birds that migrate at altitudes that intersect with the rotor swept zone are likely at the greatest risk of collision.
Although nocturnally migrating passerines are expected to pass through the Action Area during spring and fall migration periods, most of these individuals are flying at consistently high altitudes above the height of the turbines, as has been documented in the vast majority of recent radar surveys conducted at proposed wind facilities in the northeast. The percentage of targets documented during the fall 2007 radar study (Appendix G) flying below 150 m (492 ft) above ground level (maximum turbine height) varied by night from 2 percent to 38 percent. However, only on four out of the 30 nights of sampling did targets flying below 150 m (492 ft) exceed 10 percent. The overall average for targets flying below 150 m (492 ft) during the entire survey period was 5 percent.
Lighting. Artificial lighting is known to influence rates of bird collision at guyed communication towers, buildings, and other tall structures, particularly during foggy conditions (C. Johnson-Hughes, USFWS, personal communication), but the blinking FAA lights typically installed on wind turbines do not appear to influence rates of collision (NRC 2007). Jain et al. (2008) found no significant correlation between mortality rates of nocturnally migrating birds at lit versus unlit turbines at Maple Ridge, NY, and this lack of correlation has been documented at other operational wind facilities (Kerns and Kerlinger 2004, NRC 2007). In addition, Joelle Gehring found that while pulsing lights have fewer impacts on night-migrating birds than steady-burning lights, there is no difference in impact between red and white pulsing lights (Gehring and Kerlinger 2007). Other lit structures with steady-burning lights at wind facilities have been documented as causing bird fatalities due. For example, it was reported at the Laurel Mountain wind facility in the Allegheny Mountains that 500 birds were killed after the lights at an electrical substation were left on overnight (Johns 2012). While no studies to date indicate increased collision risk at lit turbines, controlled studies comparing fatalities at red and white FAA lights have not been conducted and response to white lights is unknown (Arnett et al. 2008).
Quantification of avian collision mortality. There currently is no predictive model available to quantify expected avian collision mortality as a result of wind power project operation. Therefore, risk assessments must be based on pre-construction indices and indicators of risk (e.g., breeding bird and raptor migration surveys), along with empirical data (e.g., avian mortality surveys) from nearby operating facilities in similar habitat. Pre-construction surveys within and near the Action Area revealed no indicators of elevated risk (e.g., unusually high numbers, unusually low flight altitude, habitat that would act as an attractant, and/or abundance of rare species).
Two studies conducted in 2010 at the Fowler Ridge facility, which has total turbine heights ranging from 389 to 420 feet, documented 60 total carcasses (not corrected for scavenger removal or searcher efficiency), including four raptors (Good et al. 2011). None of the identified species were state or federally listed as endangered or threatened. The turbines proposed for the Project could be as tall as 150 m (492 ft), which is more than 20 percent taller than many of

Final Environmental Impact Statement Buckeye Wind Project April 2013
5-38 Chapter 5 - Environmental Consequences
those studied at Fowler Ridge, which has some of the tallest turbines documented in these types of mortality studies. Increased turbine height increases the minimum flight altitude at which birds could be impacted by collision.
Erickson et al. (2005) calculated a national average of 2.1 birds killed per turbine per year (corrected for searcher efficiency and scavenging). Many new post-construction mortality studies have become available since that document was published. Table 5.15-3 presents the results of bird mortality estimates from 43 studies at 30 different wind power facilities in the Eastern Flyway, and calculates an average of 3.02 birds per MW per year. Because turbines under the Proposed Alternative would be spinning fewer hours of the night compared to other turbines in the eastern flyway due to the proposed feathering and cut-in speeds, we would expect this project to result in mortality rates of less than 3.02 birds per MW per year. By assuming that collision risk to birds is proportional to annual energy production (which is closely related to the time that turbines are spinning), we can generate a simplistic estimate of the reduction in risk from the proposed curtailment. Buckeye Wind calculated a 2.5 percent reduction in energy generated between the Proposed Alternative and the project operated without feathering (see HCP Section 6.6.2 – Practical Implementation by Buckeye Wind). If the project operating without feathering results in a collision risk similar to estimates from 43 studies at 30 different wind power facilities in the Eastern Flyway, and averages 3.02 birds per MW per year (Table 5.15-3), then the 2.5 percent reduction in risk from feathering and cut-in speeds would result in 2.94 birds/MW/year or 735 birds/year for the 100-turbine (250 MW) project.
This is a small fraction of individual populations that currently migrate through the area, as radar data indicate: passage rates averaged 74 t/km/hr (targets per kilometer per hour) during the fall 2007 radar surveys, with a maximum of 404 t/km/hr. Impacts to migratory birds would be addressed by the Project through implementation of the ABPP (Appendix C), the avoidance and minimization measures discussed earlier in this section, monitoring that would be conducted for life of the Project, and adaptive management triggers to maintain mortality at low levels. Significant take is a level of take that would impair the ability of a local or regional population to sustain itself. Therefore, the level of take that would be considered significant varies by species. Though some migratory bird mortality is still likely to occur, these measures would result in migratory bird mortality being not significant.
Though MBTA is a strict liability statute and indicates that actions resulting in a taking or possession of a protected species in the absence of a Service permit is a violation, the USFWS Office of Law Enforcement focuses its resources on investigating and prosecuting those who take migratory birds without identifying and implementing reasonable and effective measures to avoid the take (USFWS 2012). The USFWS will regard a developer’s adherence to the USFWS Guidelines as appropriate means of identifying and implementing reasonable and effective measures to avoid the take of species protected under the MBTA and BGEPA (USFWS 2012). Buckeye has worked cooperatively with USFWS and ODNR throughout the planning process, and has used USFWS Interim Guidance (2003), ODNR recommendations, and FAC Guidance throughout project planning and would implement the ABPP and all associated avoidance, minimization, mitigation, monitoring, and adaptive management measures during operation.
Final Environmental Impact Statement Buckeye Wind Project April 2013
Chapter 5 - Environmental Consequences 5-39
Bald Eagles and Golden Eagles
Low numbers of migrating eagles were observed in and near the Action Area during pre-construction surveys conducted in 2007 and 2008. Surveys unrelated to the Project documented an additional 11 bald eagles and one golden eagle within the Action Area. The USFWS conducted an on-site visual field inspection of portions of the Action Area in 2011 and no bald eagle nests or activity were observed (M. Cota, USFWS, personal communication). Based on the best available information, bald and golden eagles use the Action Area infrequently and there is low potential for harm to breeding or nesting eagles as a result of the Project. Buckeye Wind has taken steps to proactively avoid or minimize impacts to eagles. These measures, along with measures targeted at other bird species, are summarized in the section below and are described in more detail in Chapter 5.0 of Appendix C.
The USFWS used the pre-construction survey results in a predictive bald eagle take model that it is developing in collaboration with modeling experts from outside and within the USFWS. The model predicts the following risks to eagles (USFWS 2011):
• A fatality estimate of 0.059 bald eagles per year, with a 95% confidence interval between 0 eagles and 0.127 eagles per year.
• A fatality estimate of 0.019 golden eagles per year, with a 95% confidence interval between 0 eagles and 0.059 eagles per year.
The risk summary concludes that, “there are no ‘important eagle use areas’ (including ‘eagle nests, foraging areas, or communal roost site that eagles rely on for breeding, sheltering, or feeding, and the landscape features surrounding such nest, foraging area, or roost site that are essential for the continued viability of the site for breeding, feeding, or sheltering eagles’) (Service 2009b) or migration corridors within the Action Area. We have determined that there is low risk to eagles during the breeding and winter seasons” (USFWS 2011).
While the USFWS concludes that the risk to eagles is low, there is uncertainty in the predicted model results, and the assessment includes the following recommendations (USFWS 2011):
1. A commitment to monitor for and report eagle mortality for the life of the Project.
2. An operational plan to minimize, where appropriate, the likelihood that eagles will use the project site (e.g., carcass management, maintain vegetation heights around turbines to reduce prey availability and raptor foraging).
3. A plan to periodically update the predicted risk of the project to eagles utilizing the best available sources of information such as updated nest location information, post-construction fatality monitoring data, migration data, incidental observations, and other sources of information. This may also include new research, monitoring, and surveys if the above information is not available.
4. Adaptive management plans that initiate action (i.e., minimization or mitigation) if risk to eagles is found to increase to moderate or high levels in the future. Specifically, the management plan should identify methodologies and quantitative risk assessment methods that will be used to identify changing risk and describe criteria that will trigger adaptive management. Thresholds for applying for a take permit under the Eagle Act in

Final Environmental Impact Statement Buckeye Wind Project April 2013
5-40 Chapter 5 - Environmental Consequences
the future should also be outlined, along with any “advanced conservation practices” (see ECP Guidance) that may be employed to avoid take should risk to eagles increase.
5. A commitment to consider and incorporate, where appropriate, the latest research findings and minimization measures concerning eagle mortality at wind power projects.
6. Ground wires and any guy wires (e.g., on met towers) used in the project should be marked with deflectors.
7. Follow APLIC guidelines for overhead utilities.
Buckeye Wind intends to follow the USFWS recommendations. Buckeye Wind will work with USFWS and ODNR to develop a plan to periodically update the predicted risk of the Project to bald eagles. In order to have an appropriate basis for the plan, it will be developed once the USFWS’s Eagle Conservation Plan (ECP) Guidance is finalized and will incorporate portions of the ECP Guidance as appropriate for the level of risk and for a project that is in the advanced stages of development or has completed the development process. Buckeye Wind is committed to implementing any practicable advanced conservation practices. Buckeye will consider adaptive management plans and advanced conservation practices once the ECP Guidance is final. Any application of the final ECP Guidance will consider Project risk and Project economics and any specific treatment for already operating wind projects contained in the final ECP Guidance. If take of a bald or golden eagle occurs, Buckeye Wind will work with the USFWS to take the appropriate action. Based on the best available information, bald and golden eagles use the Action Area infrequently and there is low potential for harm to breeding or nesting eagles as a result of the Project. Buckeye Wind has taken steps to proactively avoid or minimize impacts to eagles. These measures, along with measures targeted at other bird species, are described in more detail in Chapter 5.0 of Appendix C.
Bat Collision and Mortality
Bat collisions and mortality at wind facilities are well documented in the United States (Johnson and Strickland 2003, Kunz et al. 2007, Arnett et al. 2008, and Horn et al. 2008), mostly involving tree-roosting long-distance migratory bat species (hereafter referred to as migratory tree bats) such as silver-haired, hoary, and eastern red bats. Hoary bats have constituted the highest proportions of fatalities at most facilities, ranging from 9 to 88 percent of all bat fatalities (Arnett et al. 2008). Bat mortality at 15 existing wind facilities within the range of the Indiana bat is presented in Table 5.15-8. Based on the studies summarized in this table, approximately 75 percent of total bat mortalities are migratory tree bats, 19 percent are Myotis bats, and six percent are other species (big brown, tricolor, etc.). Most known fatalities occur in late summer and early fall during migration (Johnson 2004). Using 10 studies within the range of the Indiana bat that conducted post-construction mortality monitoring for the spring through fall period, five percent, 24 percent, and 71 percent of all bat fatalities occurred in the spring, summer, and fall, respectively, with seasons defined as spring: April 1 to May 30; summer: June 1 to July 31; fall: August 1 to November 30 (M. Seymour and J. Szymanski, USFWS, personal communication). Some studies have indicated that migratory tree bats may be attracted to both moving and non-moving wind turbine blades and that many bat kills occur during low-wind nights (Arnett 2005). Fatality rates vary by facility, and studies have documented fatality rates as high as 41.6 bats per MW per year at a facility in Tennessee (Kunz 2007). However, the national average has been estimated to be closer to approximately 12.5 bats per MW per year (Arnett et al. 2008). Bat
Final Environmental Impact Statement Buckeye Wind Project April 2013
Chapter 5 - Environmental Consequences 5-41
mortality at 15 existing wind facilities within the range of the Indiana bat is presented in Table 5.15-8, and the average adjusted bat mortality for all species ranges from 9.6 to 16.1 bats per MW per study period. Other factors that may influence mortality rates at wind power developments include:
• Species distribution
• Behavioral risk factors
• Weather (temperature, humidity, wind speed)
• Turbine height
• Turbine siting
• Habitat degradation and displacement
• Proximity to landscape features that may “funnel” bats in a certain direction, such as forested habitat, and proximity to streams and wetlands
All of these factors have the potential to influence bat mortality rates at wind power facilities; however the mechanisms of influence and relative importance of each factor can vary at each facility.
During Stantec’s 2008 mist netting surveys, seven species of bats were captured: little brown (6%), northern myotis (12.8%), big brown (66.1%), tri-colored (1%), hoary (1%), eastern red (12.1%), and Indiana bats (1%). During acoustic surveys conducted from fall 2007 through spring 2008, Stantec identified a large number of recorded bat passes as big brown/silver-haired/hoary bat calls (the Anabat acoustic software did not differentiate between these three bat species) compared to the number of calls detected from other species. As mentioned above, migratory tree bats (e.g., eastern red, silver-haired, and hoary bats) have suffered high collision mortality rates at several wind facilities in the US. Thus, it is reasonable to assume that mortality of bat species, particularly of migratory tree bats, may occur within the Action Area as a result of the Project. Mortality of Myotis species, big brown bats and tri-colored bats is also likely, though in smaller quantities than mortality of migratory tree bats. All bats have low reproductive rates typical of long-lived species, and significant impacts to their numbers would not be sustainable over time. As stated at the beginning of this section, mortality of migratory tree bats, or other bats would be considered significant if substantial reductions in population size or distribution of those species were caused.
A detailed discussion of factors that would influence the predicted mortality rate of Indiana bats associated with construction, operation, and decommissioning of this Project is included in Section 5.5, and would apply to non-listed bat species as well. Furthermore, avoidance and minimization measures, mitigation measures for unavoidable impacts, and conservation measures that would be incorporated into this Project for the Indiana bat (discussed at the beginning of Section 5.4, and thoroughly in Section 5.5 under the Indiana bat discussion) would reduce or offset the potential impacts on these non-listed bats. The Project would implement operational adjustments including feathering and cut-in speeds to reduce impacts on local bat populations. Studies of varying feathering and cut-in speeds conducted at facilities in Pennsylvania, Indiana, and Alberta, documented an average reduction in bat mortality of 68.3
Final Environmental Impact Statement Buckeye Wind Project April 2013
5-42 Chapter 5 - Environmental Consequences
percent (see Table 5.4-3). Although site-specific factors such as turbine model, local weather patterns, and bat populations may affect the relative effectiveness of operational adjustments at different wind facilities, the finding that similar reductions in bat mortality were achieved in geographically diverse areas holds promising support for broad application of operational adjustments including feathering and cut-in speeds as a take minimization technique.
Table 5.4-3. Observed Reductions in Bat Fatalities for Four Operational Effectiveness Studies in the Range of the Indiana Bat
Study Observed Fatality Reductiona
Source Min Max Average
Casselman 2008b 52.0% 93.0% 82.0% Arnett et al. 2010
Casselman 2009b 44.0% 86.0% 72.0% Arnett et al. 2010
Fowler Ridge 2010c 38.0% 85.0% 64.5%d Good et al. 2011
Southwest Albertae NA NA 60.0% Baerwald et al. 2009
Median fatality reduction 44.0% 86.0% 68.3%
Note: Turbines were feathered at Casselman and Southwest Alberta, and curtailed at Fowler Ridge
a All studies used a combination of cut-in speeds of 5.0 m/s to 6.5 m/s except Baerwald et al. 2009, which used 5.5 m/s
b Based on a 95% confidence interval c Based on a 90% confidence interval d Based on the median of the reported average reductions from each treatment (5.0 m/s = 50%; 6.5 m/s = 79%) e Study did not provide confidence intervals for appropriate min and max comparison to other studies
Good et al 2012, published after completion of the Draft HCP, considered fatality reductions when using feathering and cut-in speeds of 3.5 m/s, 4.5 m/s and 5.5 m/s at Fowler Ridge in 2011 with a mean reduction of 36.3%, 56.7% and 73.3%, respectively. It is noted that the reductions in mortality by 73.3% using feathering and cut-in speeds of 5.5 m/s (the only tested cut-in speed included in the HCP) is similar to the median fatality reduction (68.3%) presented in Table 5.4-3. Further a reduction in mortality of 73.3% at a cut-in speed of 5.5 m/s is within the range of reductions seen at cut-in speeds between 5.0 m/s-6.5 m/s at the facilities presented in Table 5.4-3.
Assuming that use of the feathering and cut-in speed regime was implemented as described in the HCP and in the EIS Section 5.5, reductions in mortality of all bats of at least 68 percent could reasonably be expected. Using the maximum average adjusted bat mortality from 15 existing wind facilities within the range of the Indiana bat (Table 5.15-8) of 16.1 bats per MW per study period, and assuming a 68 percent reduction in bat mortality based on the proposed feathering and cut-in speed regime, the Proposed Action would result in 5.15 bats per MW per year, or 1,288 bats per year for the 100 turbine, 250 MW facility. This mortality would likely include roughly 966 (75%) migratory tree bats, 245 (19%) Myotis bats (of which approximately 5.2 are Indiana bats), and 77 (6%) other bats (big brown, tri-color, etc.) per year, if the species composition of mortality follows patterns observed at wind facilities throughout the range of the Indiana bat.
Impacts to non-listed bats would be addressed by the Project through implementation of the ABPP (Appendix C), the avoidance and minimization measures discussed earlier in this section,

Final Environmental Impact Statement Buckeye Wind Project April 2013
Chapter 5 - Environmental Consequences 5-43
monitoring that would be conducted for the life of the Project, and adaptive management triggers to maintain mortality at low levels. Though some non-listed bat mortality is still likely to occur, these measures would result in non-listed bat mortality being not significant.
Cleveland et al. (2006) described the economic value of the pest control services of Brazilian free-tailed bats in south-central Texas. They estimated an annual value of $741,000 per year for pest control services provided by colonies of 1.5 million bats. In a subsequent article Boyles et al. (2011) extrapolated this value to the entire U.S., per state, and by county, assuming a value of $74.10 per acre of harvested land. While bats are certainly of value to agriculture in the Midwest and Ohio, the specific bats studied do not occur in this region of the U.S. Therefore the applicability of the actual figures is questionable. Additionally, most bat mortality is likely to occur in fall, to individuals that migrate through the project area and are not resident species.
The resulting impact of the Project is not expected to appreciably reduce local and regional bat populations and would not appreciably reduce the pest control benefits of bats.
Aquatic Wildlife
There would be no substantive impacts on aquatic wildlife associated with operation of the Project.
Decommissioning-related Effects Impacts on wildlife associated with decommissioning activities would be the same as for construction. The impacts would be intermittent, short-term, and localized. Similar avoidance, minimization, and mitigation measures to those that would be employed for the construction phase would address impacts associated with decommissioning. Decommissioning activities could occur as early as 2037.
Mitigation Measures for Unavoidable Impacts The Proposed Action does not include any measures specifically to mitigate unavoidable impacts to non-listed wildlife and aquatic species. However, some mitigation measures identified to mitigate unavoidable impacts to Indiana bats (discussed in Section 5.5) may also benefit other wildlife species. For example, the Mitigation Measures for Unavoidable Impacts in Section 5.5 state that 217.0 ac of suitable habitat within seven miles of a Priority 2 hibernaculum in Ohio would be permanently protected and restored or enhanced to mitigate for the impact of taking Indiana bats. Conservation of these lands would benefit numerous non-protected wildlife species along with Indiana bats.
In addition, an ABPP (Appendix C) has been developed in coordination with USFWS and ODNR which would provide mitigative benefits to non-listed avian and bat species. The ABPP provides that, if avoidance and minimization measures are found to be ineffective at reducing impacts to non-listed bird and bat species, and mortality continues to exceed acceptable levels, the Applicant will consider mitigation options including, but not limited to, the following actions to offset impacts:
• Contribute to funding for protection, enhancement or restoration of habitat which is of particular importance to the impacted species.
Final Environmental Impact Statement Buckeye Wind Project April 2013
5-44 Chapter 5 - Environmental Consequences
• Contribute to funding of on-site or off-site research, such as bird displacement studies or acoustic bat studies to better understand the specific Project design, environmental, or behavioral factors contributing to mortality.
• Contribute to funding of off-site research that would contribute to knowledge of survival or breeding success of the impacted species.
• Contribute to funding for retrofitting of communication towers with bird flight diverters on guy lines, and/or retrofitting communication towers with lighting schemes that are less of an attraction to nocturnal migrants.
• Contribute to funding for the installation of off-site nesting platforms or nest boxes to increase breeding success of the impacted species.
• Other, unknown mitigation measures, determined in coordination with ODNR DOW and USFWS, which may satisfy a recently discovered (previously unforeseen) need in the area.
The specific measures to be taken would be developed in cooperation with ODNR DOW and the USFWS, would consider the best available science, and would occur in Ohio. The amount of funding available would be commensurate with the level of mortality relative to the thresholds and will not exceed $100,000 for the life of the Project. It should be recognized that there are adaptive management and mitigation measures outlined in the HCP that are geared toward mitigating impacts to Indiana bats, such as conservation and restoration of forested habitat and turbine feathering, that will coincidentally benefit other species of bats and birds. Any measures employed through the HCP will also be considered as mitigation measures to the extent that the Indiana bat mitigation also provided benefits to the affected species.
5.4.2.2 Redesign Option The Redesign Option is an optional measure under the Proposed Action that includes a primarily buried collection system. Impacts to wildlife are expected to be similar to those described for the Proposed Action, although an additional 0.3 ha (0.7 ac) of wooded area would be permanently impacted. The amount of wooded habitat (both deciduous and evergreen forests) that would be permanently impacted is 6.8 ha (16.8 ac). This would equate to about 0.2 percent of the 2,743 ha (6,779 ac) of total wooded areas in the Action Area to be cleared. Permanent grassland habitat loss would amount to 2.3 ha (5.7 ac) including CRP land. The Redesign Option would impact a maximum of 49 streams for a total impact of 487.1 m (1,598 lf). This is 17 more stream crossings and 106.7 m (350 lf) of greater stream impact than the Proposed Action. Limited additional impacts may occur to aquatic species from these additional impacts, but all impacts would still be minor. The Redesign Option is the Proposed Action but with significantly more buried collection lines, which would result in less potential for bird collisions with overhead lines. However, avoidance, minimization, and mitigation measures would remain the same.
5.4.3 Alternative A – Maximally Restricted Operations Alternative Under Alternative A, the Project would operate using a more restrictive operations scenario than under the Proposed Action. As such, the construction and decommissioning-related effects of Alternative A on wildlife would be the same as under the Proposed Action.

Final Environmental Impact Statement Buckeye Wind Project April 2013
Chapter 5 - Environmental Consequences 5-45
The operational adjustment under Alternative A would involve all 100 turbines being non-operational from sunset to sunrise from April 1 through October 31, which is the period when most bats are active. This Alternative would result in extremely low bat mortality of all species, if not zero.
This alternative would also result in a reduced collision risk to night-flying birds from April 1 through October 31. Birds would still experience collision risks associated with early spring and late-fall migration. Diurnally active migratory and resident birds, and winter resident birds would also be exposed to collision risk during their regular commutes within the Action Area. It can be assumed that mortality impacts to bird species would be similar to the Proposed Action during the period from November 1 through March 31, but somewhat lower from April 1 through October 31.
By assuming that collision risk to birds is proportional to annual energy production (which is closely related to the time that turbines are spinning), we can generate a simplistic estimate of reduction in risk from not operating the turbines during night-time hours from spring through fall. Buckeye Wind calculated a 24.6 percent reduction in energy generated between the maximally restricted operations alternative versus the project operated without feathering (see HCP Section 6.6.2 – Practical Implementation by Buckeye Wind).
Similarly, the number of hours that turbines would be shut down from April 1 through October 31 was calculated using the U.S. Naval Observatory’s “Duration of Daylight/Darkness Table” (available at: http://aa.usno.navy.mil/data/docs/Dur_OneYear.php). Darkness hours were requested for the year 2014, at a longitude of 83 degrees, 38 minutes West and latitude of 40 degrees, six minutes North, and for a time zone five hours west of Greenwich. The resulting table provided hours and minutes of darkness for each day of the year. There are a total of 2,237 hours of darkness from April 1 through October 31, during which time no turbines would be spinning. There are 8,760 hours in a year, and not operating turbines at night from April 1 through October 31, would eliminate 2,237 hours of potential risk, resulting in 6,523 hours of potential risk. This is a 25 percent reduction in hours of risk, roughly equal to the 24.6 percent reduction in risk predicted using the reduction in energy generated.
If the project operating without feathering results in a collision risk similar to estimates from 43 studies at 30 different wind power facilities in the Eastern Flyway, and averages 3.02 birds per MW per year (Table 5.15-3), then a 25 percent reduction in risk from not operating at night from spring through fall would result in 2.27 birds/MW/year or 568 birds/year for the 100-turbine (250 MW) project.
Avoidance and minimization measures other than the operational adjustments associated with Alternative A would be similar to those described for the Proposed Action, but would not require an HCP, so no mitigation measures or conservation measures would be in place. In addition, a modified post-construction avian mortality monitoring program would be implemented for Alternative A to address bird mortality that would follow ODNR’s standard protocol (ODNR 2009). Since under this Alternative all turbines would be non-operational from sunset to sunrise during the season when bats are active in the Action Area, a monitoring program for bat mortality would not be needed.

Final Environmental Impact Statement Buckeye Wind Project April 2013
5-46 Chapter 5 - Environmental Consequences
5.4.4 Alternative B – Minimally Restricted Operations Alternative The operational adjustment under Alternative B would involve feathering and a cut-in speed of 5.0 m/s (11 mph) for all turbines for the first six hours after sunset during the fall Indiana bat migration period from August 1 through October 31. This corresponds to the seasonal timeframe when the majority of bat mortality occurs. The turbines would be feathered for the first six hours of the night during this period when wind speeds are 5.0 m/s (11 mph) or less. Good et al. (2011) documented an approximately 50 percent decrease in bat mortality during the fall migration period between turbines with no cut-in speeds and turbines with cut-in speeds of 5.0 m/s when cut-in speeds were applied during the entire night. Young et al. (2011) found that turbines that were feathered prior to reaching the manufacturer-set cut-in speed during the first five hours of the night from July 15 through October 13 resulted in significantly less (47 to 72% less) bat mortalities than turbines that were not feathered during this period. Turbines would also be feathered until the manufacturer’s set cut-in speed is reached from one half hour before sunset to one half hour after sunrise from April 1 to July 31. This alternative would include the HCP.
Assuming that use of a fall feathering and cut-in speed regime of 5.0 m/s was implemented, and that turbines would be feathered until the manufacturer’s cut-in speed is reached at night during spring and summer, reductions in all bat mortality during the fall of approximately 50 percent could reasonably be expected. Using 10 studies within the range of the Indiana bat that conducted post-construction mortality monitoring for the spring through fall period, five percent, 24 percent, and 71 percent of all bat fatalities occurred in the spring, summer, and fall, respectively, with seasons defined as spring: April 1 to May 30; summer: June 1 to July 31; fall: August 1 to November 30 (M. Seymour and J. Szymanski, USFWS, personal communication).
Using the maximum average adjusted bat mortality from 15 existing wind facilities within the range of the Indiana bat (Table 5.15-8) of 16.1 bats per MW per study period, assuming mortalities are distributed by season as follows: spring five percent; summer 24 percent; and fall 71 percent, and assuming a 50 percent reduction in fall bat mortality based on the proposed feathering and cut-in speed regime, Alternative B would result in the mortality of 10.4 bats per MW per year, or 2,600 bats per year for the 100 turbine facility. This mortality would likely include roughly 1,950 (75%) migratory tree bats, 494 (19%) Myotis bats (of which approximately 12 are Indiana bats), and 156 (6%) other bats (big brown, tri-color, etc.) per year, if the species composition of mortality follows patterns observed at wind facilities throughout the range of the Indiana bat.
Of all the bat mortality, approximately 76 percent would occur during spring and fall migration. Mortality during spring and fall would predominantly be comprised of migratory tree bats that are crossing through the project area, not local bats that reside in the project area during the summer. The impacts of the loss of these bats would be spread across a large area (eastern U.S., see Section 5.15.5). The resulting impact of the Project is not expected to appreciably reduce local and regional bat populations and would not appreciably reduce the pest control benefits of bats.
While the effects of feathering and cut in speeds on migratory birds are not as well understood as they are for bats, it is expected that Alternative B would pose a greater risk to migratory birds than would either the Proposed Action or Alternative A because the turbines would be spinning more often in this alternative than in either of the other alternatives. Birds would still experience

Final Environmental Impact Statement Buckeye Wind Project April 2013
Chapter 5 - Environmental Consequences 5-47
collision risks associated with spring migration, summer residency periods, and late-fall migration. Diurnally active migratory and resident birds, and summer and winter resident birds would also be exposed to collision risk during their regular commutes within the Action Area. It can be assumed that mortality impacts to bird species would be similar to the Proposed Action during the period from November 1 through March 31, but somewhat higher from April 1 through October 31.
Attempting to quantify the impact to birds from this alternative is difficult for multiple reasons. Unlike Alternative A when all of the turbines would not be spinning at night, turbines under Alternative B would be spinning during some portion of every night when winds were above the manufacturer’s set cut-in speed. Use of cut-in speeds to reduce bird mortality has not been studied to date, so it is uncertain how much use of cut-in speeds during only a portion of the night and only during the fall would influence bird mortality. Similar to the other alternatives, turbines under Alternative B would not have steady burning lights, so collision risk would not be substantially higher.
By assuming that collision risk to birds is proportional to annual energy production (which is closely related to the time that turbines are spinning), we can generate a simplistic estimate of reduction in risk from not operating the turbines during night-time hours from spring-fall. Buckeye Wind calculated a 0.07 percent reduction in energy generated between the minimally restricted operations alternative versus the project operated without feathering (submitted as Confidential Business Information; CBI Report).
If the project operating without feathering results in a collision risk similar to estimates from 43 studies at 30 different wind power facilities in the Eastern Flyway, and averages 3.02 birds per MW per year (Table 5.15-3), then a 0.07 percent reduction in risk from operating with the Minimally Restricted Operations Alternative would result in 3.018 birds/MW/year or 754 birds/year for the 100-turbine (250 MW) project, essentially the same as the average in the Eastern Flyway.
The same minimization and avoidance measures would be implemented for Alternative B as the Proposed Action, with the exception of the operational adjustment regime, and potentially more mitigation efforts required due to increased take of Indiana bats. Using the “Acres of Mitigation Calculation” method described in Section 6.3.1 of the HCP, 194.0 ha (479.4 ac) of mitigation land would be needed to mitigate for the take of 300 Indiana bats.
In addition, the same post-construction avian and bat fatality monitoring program would be implemented for Alternative B as for the Proposed Action.
The construction and decommissioning-related effects of Alternative B on wildlife would be the same as under the Proposed Action.
5.4.5 Alternative C - No Action Alternative Under Alternative C, the Project would not be built and no Project-related activities (construction, operation, or decommissioning) would occur. Alternative C would have no effect on wildlife. As such, no avoidance, minimization, or mitigation measures would be warranted.

Final Environmental Impact Statement Buckeye Wind Project April 2013
5-48 Chapter 5 - Environmental Consequences
5.5 Rare, Threatened, and Endangered Species
5.5.1 Impact Criteria Plant and animal species that are federally- and/or state-listed as threatened, endangered, or other listing status pursuant to the ESA and/or the ORC Chapter 1518.01–99, 1531.25, and 1531.99 are protected from unauthorized take, which includes actions such as to harass, harm, pursue, hunt, shoot, wound, kill, trap, capture, or collect (see Section 1). The ESA requires that federal agencies ensure that any action they authorize, fund, or carry out is not likely to jeopardize the continued existence of listed species or result in destruction or adverse modification of designated critical habitat. The following types of direct and indirect3 effects were considered in evaluating the impact of the Proposed Action and alternatives on threatened and endangered species:
• Direct effects to federally- or state-listed species including the taking (removal or loss) of an individual or population due to Project construction and operation; or a change in an individual or population’s habitat use due to noise and vibration, visual disturbance, and transportation activity;
• Indirect effects to federally or state-listed species such as increased competition for resources or habitat due to displacement of individuals from the affected area into the territory of other animals, habitat destruction, or other indirect effects which cause mortality, decreased fitness, or reduced breeding and recruitment in the future population; and
• Direct or indirect effects on habitat types that affect population size and long-term viability for federally and state-listed species.
Specifically, impacts to threatened and endangered species were considered significant if federally- or state-listed species or their habitats could be adversely affected over relatively large areas; a large proportion of a listed species’ population within a region could be adversely affected; or if disturbances related to the Proposed Action or alternatives could cause significant reductions in population size or distribution of a listed species. The duration of an impact also affected its significance level: temporary impacts (e.g., noise associated with construction) were considered less significant than permanent impacts (e.g., land conversion).
5.5.2 Proposed Action
5.5.2.1 Avoidance and Minimization Measures The Proposed Action contains the following measures that would avoid or minimize potential impacts to threatened and endangered species, particularly the Indiana bat.
3 Per the definitions in the ESA, the discussion on threatened and endangered species uses the following terms: “direct effects” are those caused by the project and occur at the same time and place, and “indirect effects” are those caused by the Proposed Action and that are later in time, but are still reasonably certain to occur (50 CFR §402.02).

Final Environmental Impact Statement Buckeye Wind Project April 2013
Chapter 5 - Environmental Consequences 5-49
Project Design
• The Applicant would implement turbine feathering and cut in speeds during spring, summer, and fall, to reduce bat mortality during low wind-speeds (increasing cut-in speeds up to 6.0 m/s [13 mph]).
• The spring feathering and cut-in speed plan would be applied over a period of approximately 8.5 weeks from April 1 to May 31 during the nighttime period, one half-hour before sunset to one half-hour after sunrise. The feathering plan during the spring would be the least restrictive of all seasons in the Indiana bat active period. Feathering would not be applied to all turbines equally during the spring because risk is expected to be lower overall in this season. Feathering and cut-in speeds during the spring would be applied to turbines in the three highest habitat risk categories at wind speeds of 5.0 m/s (11 mph) to protect Indiana bats returning to the area for the maternity period. Feathering of turbines in Category 4 habitat (the lowest risk habitat) would occur up until the manufacturer-set cut-in speed is reached (Table 5.5-1). This accounts for the fact that the spring migratory period has been demonstrated to be the lowest risk to Myotis species, and that Category 4 represents the least suitable habitat so it is unlikely Indiana bats would use this habitat for maternity colonies should they arrive to summer maternity habitat early. All turbines in all habitat categories would be feathered at night (one half-hour before sunset to one half-hour after sunrise) until the specified cut-in speed is reached. The summer feathering and cut-in speed plan would be applied over a period of approximately 8.5 weeks from June 1 to July 31 during the nighttime period, one-half hour before sunset to one half-hour after sunrise. Feathering would be applied to all turbines during the summer because risk to Indiana bats in the Action Area during this time is uncertain and higher mortality during late summer has been demonstrated. Using a tiered approach, the highest cut-in speeds (6.0 m/s [13 mph]) would be applied to turbines located within habitat category 1, which was predicted to have the highest suitability for Indiana bat roosting and foraging activities, and cut-in speeds would be stepped down in equal increments for the decreasing habitat categories (Table 5.5-1).
• The fall feathering and cut-in speed plan would be applied to all turbines from August 1 to October 31, from one half-hour before sunset to one half-hour after sunrise. Cut-in speeds would range from 5.75 to 6.0 m/s (11 to 13 mph), depending on which habitat category the turbine was located in (see discussion in Section 3.1; Table 5.5-1). There is a minor difference in operational feathering (0.25 m/s) between Category 1 and Categories 2-4. This difference accounts for the possibility that some summer foraging and roosting Indiana bats may be present after August 1 due to annual weather and behavioral pattern changes. Therefore a slightly higher initial operational cut-in speed is warranted to maintain at least the same level of protection provided during the summer maternity period.

Final Environmental Impact Statement Buckeye Wind Project April 2013
5-50 Chapter 5 - Environmental Consequences
Table 5.5-1 Summary of Nighttime Operational Feathering that Would be Applied to Turbines During Evaluation Phase Year 1*
Habitat risk category
Estimate for 52 Turbine
Layout
Maximum for 100-Turbine Layout**
Cut-in speed - m/s****
Spring Summer Fall (1 Apr - 31 May) (1 Jun - 31 Jul) (1 Aug - 31 Oct)
Category 1 - Highest Risk 4 10 5.0 6.0 6.0
Category 2 - Moderate Risk 9 15 5.0 5.75 5.75
Category 3 - Low Risk 6 15 5.0 5.5 5.75
Category 4 - Lowest Risk 33 85 None*** 5.25 5.75
Totals 52 125
* Any turbines installed after the first year of operation would be feathered using the cut-in speeds for the respective risk Category as adjusted through adaptive management, if those cut-in speeds differ from those in this table. ** The breakdown for the known 52 turbine locations is given for reference. The table shows the maximum number of turbines in each category, resulting in a sum > 100. No more than 100 turbines would be built. *** Turbines would be cut-in at the manufacturer’s specified cut in speed. The turbine would be feathered below the cut-in speed. **** During all seasons, turbines may be operated normally when temperatures are below 10 °C (50°F).
Site Development and Maintenance
A series of Project design features would be used to avoid or minimize the potential for adverse effects to the Indiana bat and suitable roosting and foraging habitat from construction and maintenance activities:
• The Applicant would site the Project to minimize tree clearing to the maximum extent practicable. No more than 6.5 ha (16.1 ac) of tree clearing would occur for the 100-turbine Project;
• The Applicant would not remove the three known Indiana bat roost trees in the Action Area. None of the 100 turbines would be located closer than 2.9 km (1.8 mi) to known maternity roost trees documented in 2009. The primary benefit from siting turbines at some distance from maternity roost trees is that it would tend to reduce risk of impact or barotrauma. While there is no evidence to suggest that shadow flicker or sound from operating turbines would impact Indiana bats in roost trees, greater distances also reduce the potential for disturbance.
• Buckeye Wind would conduct habitat assessments jointly with the USFWS for the areas of planned tree clearing once Project plans are finalized and before any clearing is conducted, during which all potential roost trees would be identified and flagged. Any potential roost trees observed within the clearing zone would be flagged and impacts avoided to the maximum extent practicable. Prior to the finalization of the detailed design of Project components, all reasonable attempts would be made to offset the clearing radii around turbines or adjust roads/interconnects to preserve any potential roosts and avoid any unnecessary clearing.

Final Environmental Impact Statement Buckeye Wind Project April 2013
Chapter 5 - Environmental Consequences 5-51
• Prior to tree removal, the limits of proposed clearing would be clearly demarcated on the site with orange construction fencing (or similar) to prevent inadvertent over-clearing of the site or clearing of previously unidentified roost trees.
• The Applicant would conduct tree clearing during the period between November 1 and March 31, when Indiana bats would not be using the area, to avoid potential mortality of Indiana bats that could result from removal of previously unidentified roost trees.
• A USFWS-approved natural resource specialist knowledgeable of Indiana bats and their habitat requirements would flag roost trees and be present at the time of tree clearing.
• A plan note would be incorporated into the construction contract requiring that contractors adhere to all provisions of NPDES permits and the SWPPP. The SWPPP would specify Best Management Practices for construction activities that would minimize degradation of water quality resulting from runoff of stormwater and sediment from construction areas into adjacent water bodies.
• Wetlands would not be impacted by construction activities for the 100-turbine Project. Stream impacts would be limited to 380.4 m (1,248 lf) for the 100-turbine Project. When only underground collection lines cross perennial streams (i.e., no co-location of road crossings), all perennial stream crossings would utilize directional boring to avoid impacts. For intermittent or ephemeral streams, trenching would be done when the stream is dry, or directional boring would be used if there was water present. For road crossings, open bottomed culverts, elliptical culverts, or arched bridges would be used to avoid impacts to any high quality streams, specifically Ohio exceptional warm water habitat and cold water habitat streams. Crossing widths and clearing of wooded riparian areas for stream crossings would be limited to the minimum required for the crossing methods.
• Decommissioning measures would be identical to the commitments made for Project construction.
• The Applicant would adaptively manage the feathering speeds to maintain take of Indiana bats within the permitted level during Project operation. Adaptive management includes increased feathering of wind turbines if there are greater than 5.2 Indiana bat mortalities per year, or the option to decrease feathering if there are less than 5.2 Indiana bat mortalities per year. Cut-in speeds would increase incrementally as various mortality thresholds are met. Increased cut-in speeds would range from 5.0 (11 mph) to full curtailment, depending on the results of post construction monitoring during the summer, spring, and fall seasons (April 1 through October 31). Cut-in speeds could be incrementally reduced to the manufacturer specified cut-in speeds, depending on the results of post-construction monitoring, during the spring, summer, and fall months. The cut-in speeds and seasons are detailed in Chapter 6 of the HCP (Appendix B).
Additionally, the Project was developed consistent with the Service Interim Guidance on Avoiding and Minimizing Wildlife Impacts from Wind Turbines (USFWS 2003). Specifically, the following USFWS guideline recommendations were incorporated into the Proposed Action:
• Avoid placing turbines near known bat hibernation, breeding, and maternity/nursery colonies, in migration corridors, or in flight paths between colonies and feeding areas.

Final Environmental Impact Statement Buckeye Wind Project April 2013
5-52 Chapter 5 - Environmental Consequences
The Applicant commissioned several bat studies (i.e., mist netting, acoustic detection, radar, and swarming studies) to determine the location of any bat hibernacula, maternity colonies, migration corridors, and flight paths in the Action Area (Stantec 2008a and 2009). A Habitat Suitability Model and collision risk model (Appendices B and A of the HCP, respectively) for the Indiana bat was developed based on the Indiana bat survey results for the Action Area, other Indiana bat studies conducted in the Action Area vicinity, and the habitat in the Action Area in order to determine areas where impacts to this species would mostly likely occur.
• Avoid fragmenting large, contiguous tracts of wildlife habitat. Where practical, place turbines on lands already altered or cultivated, and away from areas of intact and healthy native habitats. If not practical, select fragmented or degraded habitats over relatively intact areas. Minimize roads, fences, and other infrastructure. For this Project, most (over 90%) turbines and associated facilities would be placed in agricultural fields and along the edge of small forest patches, and would avoid areas of native, intact habitat that have greater wildlife habitat value. Further, any state-required buffers around streams and wetlands would be followed in order to protect these resources, maintain connectivity to forest areas, provide foraging corridors for bats, and maintain Indiana bat movement corridors.
• Develop a habitat restoration plan for the Project that avoids or minimizes negative impacts on wildlife while maintaining or enhancing habitat values for other species. The Applicant would reseed all temporarily disturbed areas outside of active agricultural with a native seed mix in accordance with the Erosion and Sediment Control Plan and NPDES. Streams that are open-trenched will be restored to their pre-existing grade and revegetated with appropriate native riparian species. Temporary crossings and areas of temporary construction impact will be restored and re-vegetated per the Erosion and Sediment Control Plan, consisting of planting native plant species (see HCP Appendix D for a typical native plant mix) to provide ground stabilization. Where forest fragmentation results from construction activities, the areas will be restored using trees suitable for Indiana bat habitat, if practicable. A list of native trees suitable for planting to restore Indiana bat habitat is included in HCP Appendix D. If existing land-use precludes the use of native species (e.g. agricultural use), restoration and stabilization will be established consistent with that land-use.
• Conduct post-construction monitoring during operation. The Proposed Action includes a post-construction monitoring plan that would measure the effectiveness of the avoidance and minimization measures outlined above, and ensure that the Project does not exceed the allowable take of Indiana bats. Mortality searches would be conducted from April 1 to November 15 for a minimum of two consecutive years. The results of post-construction monitoring would be evaluated on an annual basis to determine whether adaptive management needs to be implemented to reduce impacts to Indiana bats. After the initial two consecutive years of mortality monitoring, post-construction monitoring would continue to occur at some level for the Project duration, never of a frequency of less than once every three years, with frequency and scope detailed in Section 6.5 of the HCP (Appendix B).

Final Environmental Impact Statement Buckeye Wind Project April 2013
Chapter 5 - Environmental Consequences 5-53
Indiana Bat
Construction-related Effects Construction of the Project could affect Indiana bats through habitat loss and degradation and construction-related disturbance.
Habitat Loss and Degradation
A maximum 6.5 ha (16.1 ac) of forest would be removed for the construction of the full 100 turbines, and associated access roads, utility lines, and 61-m (200-ft) radius around the turbines that would need to be cleared. The loss of 6.5 ha (16.1 ac) of forest habitat comprises only 0.2 percent of available forest (2,744 ha or 6,779 ac) in the Action Area, and of that, about 3.2 ha (8.0 ac) of the forest that would be cleared is considered Category 1, 2, and 3 habitat for Indiana bat roosting or foraging activities (Figure 4.5-4).
The USFWS conducted a field visit on November 17, 2010 to assess Indiana bat habitat in eleven areas of proposed tree clearings for the 52-turbine Project. Six of the evaluated sites did not contain potential roost trees or maternity roost trees within the area proposed to be cleared.
The remaining five sites contained trees that may potentially be used for roosting by Indiana bats. The utility line crossing between Turbines 3 and 2 at the southern crossing of tree line (Site 2) contains one medium-sized potential roost tree next to the stream. Proposed clearing around Turbine 8 (Site 5) would impact the edge of a forested area with two potential roost trees located near the edge of the clearing area. Proposed clearing around Turbine 7 (Site 6) would impact a number of mature shagbark hickory trees that may serve as roosting trees and that would likely be removed. Proposed clearing for the access road between Turbines 37 and 41 and the radius around the two turbines (Site 9) would impact one large potential maternity roost tree. The tree is located in a forested area, and there may be additional potential roost trees found within the wooded area that may also be impacted by tree clearing. At Site 10, an access road between Turbines 11 and 16, multiple small potential roost trees and branches with peeling bark were observed along the edge of woods and in the forest. Some of these trees may be impacted by tree clearing.
For Site 2, the USFWS recommends avoiding impacts to the tree if relocation of the utility line is possible. Similarly, the USFWS recommends offsetting the clearing radius at Site 5 to avoid impacts to the wooded area and avoiding impacts to the woods containing shagbark hickory on the north side of Site 6 to the extent possible. A similar site visit and habitat evaluation will occur when the 48 additional turbine locations are determined, to recommend micrositing to avoid and minimize potential habitat impacts. Despite any micrositing that may be completed to minimize impacts to individual potential roost trees within the construction areas, the analysis in this EIS assumes that all 6.5 ha (16.1 ac) of forested habitat to be cleared, including any potential roost trees in those areas, will be permanently removed, and Indiana bats will no longer be able to use those areas.
The habitat suitability model for the HCP (Appendix B) classified all of the habitat in the Action Area into four categories, with Category 1 representing the most suitable foraging and roosting habitat for Indiana bats, and Category 4 representing the least suitable foraging and roosting

Final Environmental Impact Statement Buckeye Wind Project April 2013
5-54 Chapter 5 - Environmental Consequences
habitat4 (Table 5.5-2). No more than 3.2 ha (8.0 ac) of Category 1, 2, and 3 habitat for Indiana bat roosting or foraging activities would be removed for construction of the 100-turbine Project, representing 0.1 percent of the total 2,744 ha (6,779 ac) of total wooded areas in the Action Area.
Table 5.5-2. Areas Classified as Most to Least Suitable in the Habitat Suitability Model for Indiana Bats in the Action Area
Suitability Category Total in Action Area ha (ac)
Percent of Action Area
Total Removed from Action Are
Ha (ac)
Percent of Action Area Removed
1 (Most suitable) 4,016.1 (9,923.9) 12% 1.0 (2.5) < 1% 2 2,973.9 (7,348.6) 9% 1.3 (3.3) < 1% 3 2,856.6 (7,058.8) 9% 0.9 (2.2) < 1% 4 (Least suitable) 22,505.4 (55,612.1) 69% 3.3 (8.2) < 1% Source: HCP Appendix B
Forest removal would be spread throughout the Project Area and is not expected to be extensive in any single area. Forest patches cleared would be small, with an average size of 0.2 ha ± 0.4 ha (0.4 ac ± 0.9 ac) and a maximum size of 1.1 ha (2.7 ac). The average size of tree clearing areas would be less than 0.2 ha (0.4 ac). The 1.1 ha (2.7 ac) forest patch is composed of ash, cottonwood, maple, and hawthorn trees of moderate age, with an understory of honeysuckle and hawthorn. This forest patch likely contains a number of potential Indiana bat roost trees.
The smaller forest patches range in age from young to mature, and include honey locust, cherry, cottonwood, willows, ash, maple, hawthorn, as well as some shagbark hickory and oak trees in certain forest patches. The forested stands generally include an understory layer that includes shrub species such as hawthorn, Osage orange, and honey locust.
Direct and indirect effects of removing roosting habitat
Although Indiana bats are known to exhibit site fidelity to individual roost trees (Callahan et al. 1997, Cope et al. 1974, Gardner et al. 1991, Humphrey et al. 1977, Murray and Kurta 2004, Sparks et al. 2005), they are also known to frequently shift from one roost tree to another in their home range. On average, Indiana bats switch roosts every two to three days, depending on female reproductive condition, roost type, and time of year (Kurta et al. 2002, Kurta 2005). Several studies have documented shifts in Indiana bat roosting activity of between 1.6 and 4.8 km (1.0 and 3.0 mi) (Kurta and Murray 2002, Tim Carter pers. comm.). In addition to roost switching, Indiana bat colonies can also shift their centers of activity across the landscape as resources change.
During their November 17, 2010 site visit, the USFWS identified five of the eleven forest patches that are proposed for removal for the construction of the 52 turbines as containing suitable roost trees for Indiana bats. The Applicant and the USFWS will conduct an additional site visit at the locations of the additional 48 turbines to identify and mark suitable roost trees as detailed Project planning progresses. Removal of an occupied roost tree while Indiana bats are 4 Characteristics that best determined suitable foraging habitat were forest fragmentation, forest patch connectedness, and total core area of forested habitat, while characteristics that best determined suitable roosting habitat were distance to forested streams, distance to streams, and distance to forest edge.

Final Environmental Impact Statement Buckeye Wind Project April 2013
Chapter 5 - Environmental Consequences 5-55
present would likely result in the killing, injuring, or harassing of individual bats or potentially of multiple bats roosting together in a maternity roost tree. If an occupied primary roost tree is removed in the summer, nonvolant members of the colony would likely die, volant members of the colony could be killed if they did not escape in time, or would distribute themselves among several previously-used alternate roost trees, and the colony would become more dispersed (Service 2002; Kurta et al. 2002; Indianapolis Airport Authority 2003). The individuals from this displaced colony would experience increased stress from: (1) searching for a replacement primary roost tree(s) and depleting much-needed fat reserves; (2) roosting in alternate trees that are less effective in meeting thermoregulatory needs; and (3) roosting singly, rather than together, which decreases the likelihood of meeting thermoregulatory needs, thereby reducing reproductive success.
Roost tree removal could result in indirect impacts by depleting much-needed fat reserves while finding alternate roosts where Indiana bats can successfully rear young. However, roost trees are an ephemeral resource, as weathering, decay, and insect activity eventually makes roost trees less suitable over time (e.g., exfoliating bark eventually falls off or the snag falls over). It is likely that due to the ephemeral nature of roost trees, the Indiana bat has evolved to be able to locate replacement roosts when their previously-used roost trees become unsuitable. This may explain why, as mentioned above, Indiana bats have several roost trees, and they switch between these trees every few days.
The Applicant proposed to minimize tree clearing as much as possible, avoid tree clearing where there is high quality roosting habitat, delineate the areas where tree removal is necessary so that extra trees are not accidentally removed, flag potential roost trees and micro-site to preserve as many as possible, and retain the three known Indiana bat roost trees in the Action Area (described in Avoidance and Minimization Measures above). However, it is possible that the 6.5 ha (16.1 ac) of forest proposed for removal contains undocumented Indiana bat maternity roost trees or foraging areas that would be removed as a result of the Proposed Action. To avoid any direct impacts to Indiana bats resulting from the felling of roost trees, the Applicant would remove trees between November 1 and March 31, when Indiana bats are hibernating and so not present in the Action Area. Buckeye Wind will implement these measures to minimize or avoid impacts to Indiana bat roosts, resulting in negligible direct impacts on Indiana bats from removal of roosting habitat.
Indirect effects of removing foraging habitat and degradation of aquatic resources that serve as potential Indiana bat foraging habitat and movement corridors
Forest removal could negatively impact Indiana bats by reducing the amount of available foraging habitat, and increasing energetic costs for finding alternative foraging habitat. Individual Indiana bats would have to adjust to foraging habitat loss by adjusting the size or configuration of their foraging areas. Indiana bats using the affected forest areas for foraging would likely have to shift or expand their foraging ranges into areas previously unused by them to make up for the loss of foraging habitat.
However as noted above, the Project would result in a loss of a maximum of 6.5 ha (16.1 ac), or only 0.4 percent of the total 2,744 ha (6,779 ac) of total wooded areas in the Project Area. Impacts to foraging habitat in any one area would be minor, because forest would be removed in

Final Environmental Impact Statement Buckeye Wind Project April 2013
5-56 Chapter 5 - Environmental Consequences
small patches as opposed to large blocks, and because clearing activities would be conducted when bats are not present. Considering the relatively small amount of habitat that would be lost with respect to the forest habitat that is available, and the small size of patches that would be removed, the adjustments in Indiana bat foraging ranges are not expected to result in physiological responses sufficient to cause death or injury, or to impair reproduction.
Aquatic resources are valuable foraging habitats for Indiana bats because there is high insect abundance associated with these resources, as well as drinking water. In addition, riparian corridors associated with aquatic resources are valuable movement corridors for Indiana bats, particularly when they are forested and when they provide connectivity to other forest areas.
Construction of the 100 turbines would impact no more than 380.4 linear m (1,248 linear ft) of streams, and could result in temporarily increased siltation and sedimentation to aquatic resources down-gradient of the area of disturbance. This would result in short-term declines in aquatic insect populations in adjacent wetlands and waterways, and corresponding localized prey reduction and water quality reduction. However, potential impacts from sedimentation are expected to remain near the source of sedimentation (e.g., roadway), and foraging Indiana bats would likely temporarily relocate upstream or downstream to forage. Implementation of construction best management practices would also minimize sedimentation. Furthermore, the diet of Indiana bats is not restricted to aquatic insects, since they also forage on terrestrial insects, and the surrounding landscape would continue to provide an abundant prey base of both terrestrial and aquatic insects during project construction. Therefore, any potential effects on Indiana bats from localized reductions in water quality are anticipated to be insignificant.
In addition, minor fragmentation of riparian wooded habitat potentially utilized by Indiana bat would occur at some stream crossings. For example, the utility line crossing between Turbines 2 and 3 would impact the narrow, two-tree wide riparian zone by creating a 7.6 m (25 ft) wide clearing. The riparian habitat contains large, mature trees and one potential roost tree in the clearing zone. In addition, the access road crossing between Turbines 37 and 41 would create a 16.8 m (55 ft) wide clearing in the riparian habitat of ash, cottonwood, maple, and hawthorn trees of moderate age. This riparian corridor leads to a larger forested area, over 80 ha (200 ac) in size, with fairly mature woods, good species diversity, and potential Indiana bat roost trees. Some studies indicate that Indiana bats will go out of their way to fly within a forested travel corridor instead of open area, but they can and will also cross wide open areas. Gaps of 7.6 – 27.4 m (25 – 90 ft) would not inhibit Indiana bat use of remaining tree lines as travel corridors since the remaining corridor would exceed 15 m (50 ft) in width (see Section 5.1.3.1 of the HCP for recommended minimum Indiana bat travel corridor width).
The Applicant would implement several measures to reduce or avoid impacts to aquatic resources: (1) Project components would not impact wetlands and stream impacts would be limited to a maximum of 32 stream crossings totaling 380.4 m (1,248 ft) for the 100-turbine Project; (2) construction activities would adhere to conditions set forth in the USACE permit, Ohio EPA WQC, NPDES permit, SWPPP, and any additional State or OPSB setback requirements; (3) an Erosion and Sediment Control Plan that includes use of appropriate runoff diversion and collection devices would be implemented; and (4) required collection line-only perennial stream crossings as well as exceptional warm and cold water habitat would be horizontally directional drilled to avoid unnecessary clearing of forested riparian areas. With

Final Environmental Impact Statement Buckeye Wind Project April 2013
Chapter 5 - Environmental Consequences 5-57
implementation of these measures, and the limited area of impacted riparian habitat relative to the available habitat in the area, indirect impacts to Indiana bat aquatic foraging habitat and fragmentation of forested habitat would be minor.
Disturbance or Mortality Associated with Construction Activities
Project construction activities would occur during daylight hours throughout the year, although timing would favor non-inclement weather and activity would therefore likely be heaviest during the spring, summer, and fall. Construction activities for all 100 turbines would take place in one or two phases that would last for a period of 12 to 18 months each with possible overlap.
Direct impacts
Direct impacts to Indiana bats could occur if they collide with trucks or other moving equipment that is delivering material (e.g., turbine components and concrete) or constructing the turbines and electric interconnects. However, Indiana bat collision with construction vehicles would be unlikely because: (1) there would be a limited amount of additional traffic above existing conditions; (2) construction vehicles would be large, slow-moving, and easily avoidable by Indiana bats; and (3) construction activity and truck operations would be largely limited to daylight hours when Indiana bats are generally inactive. While there is evidence of Indiana bats being killed along highways, this is a very rare occurrence, and circumstances of these collisions were very different than those expected for the Project (Russell et al. 2008). Thus, Indiana bat mortality as a result of construction-related vehicle collision is considered unlikely.
Direct impacts to Indiana bats could occur as a result of Project construction activities, if the bats are disturbed by temporary increases in noise, human activity, and vibrations from construction equipment. Noise associated with Project construction would include sounds associated with diesel-powered earthmoving equipment such as irregular engine revs, back up alarms, gravel dumping, and the clanking of metal tracks (Hessler 2009). Construction would occur predominantly in agricultural areas where the sounds of tractors, trucks, and other agricultural machinery are commonplace. Indiana bats that currently inhabit the Action Area are likely already accustomed to roosting in proximity to loud noises and farming-related human activity.
Noise and vibration associated with construction activities could adversely affect nearby Indiana bat roosts. Individual bat disturbance levels would depend on several factors, such as noise level, vibration level, reproductive status, and nearby noise buffers. Noise levels from the construction activities would be intermittent, as equipment would be operated on an as-needed basis, mostly during daylight hours during the one or two phases of Project construction.
Some studies suggest that Indiana bats are tolerant of loud noises. For example, Indiana bats used roosts near Interstate 70 (I-70) and in close proximity to the Indianapolis Airport, including a primary maternity roost tree that was located 600 m (1,970 ft) south of I-70. In contrast, Callahan (1993) noted that a roost tree was abandoned after a bulldozer cleared brush in the area, and female bats in Illinois used roosts at least 500 m (1,640 ft) from paved roadways (Garner and Gardner 1992). Therefore, it is currently unknown but possible that noise and vibrations related to construction activities could result in short-term displacement to Indiana bats that roost near construction activities.

Final Environmental Impact Statement Buckeye Wind Project April 2013
5-58 Chapter 5 - Environmental Consequences
If roosting Indiana bats are disturbed by construction activities, previous studies suggest that they may be able to shift their activities to avoid the disturbance. As discussed above, Indiana bats frequently shift roosts, and have been known to shift their centers of activity in response to changing resources. Indiana bats have been documented shifting their centers of activity by up to 4.8 km (3.0 mi; Dr. Tim Carter, Ball State University, personal communication) and have been documented traveling up to 6.0 km (3.7 mi) between roosts (Carter 2003). Thus, Indiana bats can shift their activity centers relatively large distances when needed. Since construction activities at any one location are short term, Indiana bats may be able to resume use at these sites within the same season, and any disturbance would only be temporary in nature. Based on these data, it is reasonable to anticipate that Indiana bat colonies can shift to other suitable roost trees or foraging areas if they are disturbed during construction activities, and potentially return when activities have ceased.
In summary, construction-related disturbance would occur in one or two phases, each lasting 12 to 18 months (with possible overlap); the disturbance would occur predominantly in agricultural areas where noisy agricultural machinery currently operates; disturbance would not occur within 2.9 km (1.8 mi) of any known maternity colonies; and some Indiana bats have shown high tolerance levels to loud noise and vibration. Direct impacts resulting from Project-related construction activities could occur, but these impacts would be short-term and minor.
Operation and Maintenance-related Effects Operation of the Project under the Proposed Action could affect Indiana bats during the summer maternity season as well as spring and fall migration season through direct collision-related mortality, barotrauma, disturbance, and displacement of Indiana bats from current roosting and/or foraging areas.
Collision Related Mortality
Direct Impacts Impacts to bats from wind turbines are well documented (Johnson and Strickland 2003; Johnson et al. 2003; Kunz et al. 2007; Arnett et al. 2008; Horn et al. 2008), with migratory tree bats (primarily hoary, silver-haired, and eastern red bats) being the most affected, particularly during the late-summer through fall migratory period. Hoary bats have constituted the highest proportions of fatalities at most facilities, ranging from nine to 88 percent of all bat fatalities (Arnett et al., 2008). Some studies indicate that migratory tree bats may be attracted to both moving and non-moving wind turbine blades and that many bat kills occur during low-wind nights (less than 6.0 m/s [13 mph]) (Arnett et al. 2008). Numbers of Myotis species killed or injured at wind turbines are generally much lower than the migratory tree bats, although they made up nearly 25 percent of the fatalities at one facility in Canada and one in Iowa (Arnett et al. 2008). The Blue Sky Green Field wind facility in Wisconsin had 30 percent Myotis fatalities (Gruver et. al. 2009); 33 to 59 percent of fatalities were Myotis species at four different wind facilities in New York (Stantec 2010a); and about 14 percent of the fatalities at the Mountaineer Wind Farm in West Virginia were Myotis species (Johnson & Strickland 2004). Five instances of Indiana bat mortality at wind farms have been detected. The first Indiana bat (a Myotis species) mortality documented at a wind turbine occurred in fall 2009 at the Fowler Ridge Wind Facility in Benton County, Indiana. This likely was not the first time an Indiana bat had been killed at a wind facility – other Indiana bat mortalities probably went undetected due to lack of

Final Environmental Impact Statement Buckeye Wind Project April 2013
Chapter 5 - Environmental Consequences 5-59
post-construction monitoring at many wind projects, inaccurate identification of the species, lack of detection due to small size of the species, decomposition of carcasses, or removal by scavengers. The first Indiana bat killed at Fowler Ridge was presumably a migratory bat and was not found near any known hibernacula or maternity colonies (USFWS Press Release at http://www.fws.gov/midwest/News/release.cfm?rid=177). The second Indiana bat fatality at Fowler Ridge occurred one year later around the same time in September and was also assumed to be a fall migrant (WEST 2011). A third Indiana bat fatality occurred at the North Allegheny Wind Facility in Pennsylvania, and like the Fowler Ridge incidents, happened in late September and was assumed to be a fall migrant (USFWS 2011b). The fourth Indiana bat fatality occurred on July 26, 2012 at the Laurel Mountain Wind Power facility near Elkins, WV. The fifth Indiana bat fatality occurred on the night of October 2, 2012 at the Blue Creek Wind Farm in Paulding County, Ohio.
Indiana bats could be injured or killed if individuals come in close proximity to wind turbines and suffer injury or mortality from collision or barotrauma. A collision risk model (Appendix A of the HCP) was developed to estimate mortality of Indiana bats as a result of Project operation. The collision risk model was based on best available scientific information and included site-specific, empirical data, as well as expert opinion and historical and current literature on Indiana bats. The collision risk model incorporated information on Indiana bat use of the Action Area, Indiana bat behavioral characteristics, weather conditions (i.e., wind speed and temperature), and wind turbine design and layout.
The collision risk model estimated Indiana bat mortality for three general periods in which Indiana bats display distinct behavioral characteristics that could influence their exposure to wind turbines: spring emergence and migration, or “spring” (defined as April 1 to May 31), summer habitat use, or “summer” (defined as June 1 to July 31), and fall migration and swarming, or “fall” (August 1 to October 31). Variation in weather conditions and other stochastic factors could affect the exact timing of this annual chronology. However, these periods are expected to adequately encapsulate seasonal behaviors that could differentially affect collision risk.
Collision Risk Model Results
Stantec estimated annual Indiana bat mortality (female, male, and unborn/non-volant juveniles) as a result of this project, by creating a collision risk model with three scenarios of Indiana bat flight height through the Action Area – low, moderate, and high. These three heights are described in detail in Appendix A of the HCP, but can be summarized as:
• Low flight height - 90 to 99 percent of Indiana bat flight activity in the Action Area occurs at less than 47.0 m (154.2 ft), and 1 to 10 percent occurs above 47.0 m (154.2 ft).
• Moderate flight height - 80 to 90 percent of Indiana bat flight activity in the Action Area occurs at less than 47.0 m (154.2 ft), and 10 to 20 percent of flight activity occurs above 47.0 m (154.2 ft).
• High flight height - 70 to 80 percent of Indiana bat flight activity occurs at less than 47.0 m (154.2 ft), and 20 to 30 percent of flight activity occurs above 47.0 m (154.2 ft).

Final Environmental Impact Statement Buckeye Wind Project April 2013
5-60 Chapter 5 - Environmental Consequences
The three flight height scenarios were developed to model the existing uncertainty regarding Indiana bat flight height above 50 m. Acoustic studies indicated that 99.9 percent of Myotis activity was recorded below 47 m (154 ft) (see HCP Appendix B, Section 2.4). This height was used to develop a baseline flight distribution of the proportion of activity expected below the rotor-swept zone (< 47 m), within the rotor-swept zone (> 47 m and < 153 m), and above the rotor-swept zone (> 153 m). This baseline flight distribution was used for the “low flight height.” Moderate flight height and high flight height scenarios were derived by adjusting the proportion of the bats assumed to be flying within the rotor-swept zone upwards of the low flight height distribution indicated by acoustic studies conducted by Stantec (Appendix G).
As the highest blade tip position (i.e., rotor apex) of the wind turbines would be at 150.0 m (492.1 ft), and the lowest blade tip position would be at 50.0 m (164 ft), most of the Indiana bat activity would fly below the moving turbine blades in all three scenarios. This is based on the assumption that that non-linear flight occurs primarily during foraging, and foraging occurs primarily at or below tree canopy height. Median estimates of annual Indiana bat fatality for low, moderate, and high flight height scenarios ranged from 6.9 bats per year to 25.4 bats per year (Table 5.5-3). These estimates represent collision probabilities under operating conditions that do not include feathering and cut in speeds of turbines at low wind speeds. However, as discussed above in the Avoidance and Minimization Measures, feathering and cut in speeds would be applied to turbine operations with varying operational constraints as a condition of the HCP and associated Incidental Take Permit (ITP) (see Chapter 3 or HCP Section 6.2.3.1 for further discussion of the feathering plan).
Table 5.5-3 Estimated Indiana Bat Fatalities (Median Values) Under High, Moderate, and Low Flight Height Scenarios within the Rotor Swept Zone with No Operation Adjustment Applied to the 100-Turbine Project
Flight height scenarios Mean Fatalities of Three Survival Scenarios
Spring Summer Fall Annual
Low 2.4 0.1 4.4 6.9
Moderate 6.9 0.7 8.7 16.3
High 10.9 1.5 13.0 25.4
Use of feathering and cut-in speeds that would be implemented under the Proposed Action is expected to reduce fatality by 44 to 86 percent (see Table 5.4-3) based on reductions in mortality observed at three recent studies on the effectiveness of increasing cut-in speeds during periods of low wind (Baerwald et al. 2008, Arnett et al. 2010, Good et al. 2011).
Reductions in Indiana bat fatalities as a result of feathering have not been well documented, because only one Indiana bat fatality was reported in these operational adjustment studies. However, it is expected that similar reductions in mortality observed for migratory tree bats would be realized for Indiana bats. Under the most conservative assumptions (i.e., high flight height model and with the lowest expected reduction in fatality [44%]), the maximum potential annual take would be 14.2 Indiana bats per year (Table 5.5-4). Under the least conservative assumptions (i.e., low flight height model and with the highest expected reduction in fatality [86%]), the maximum potential annual take would be 1.0 Indiana bats per year. Using the moderate flight height scenario and the median reductions in mortality observed in feathering
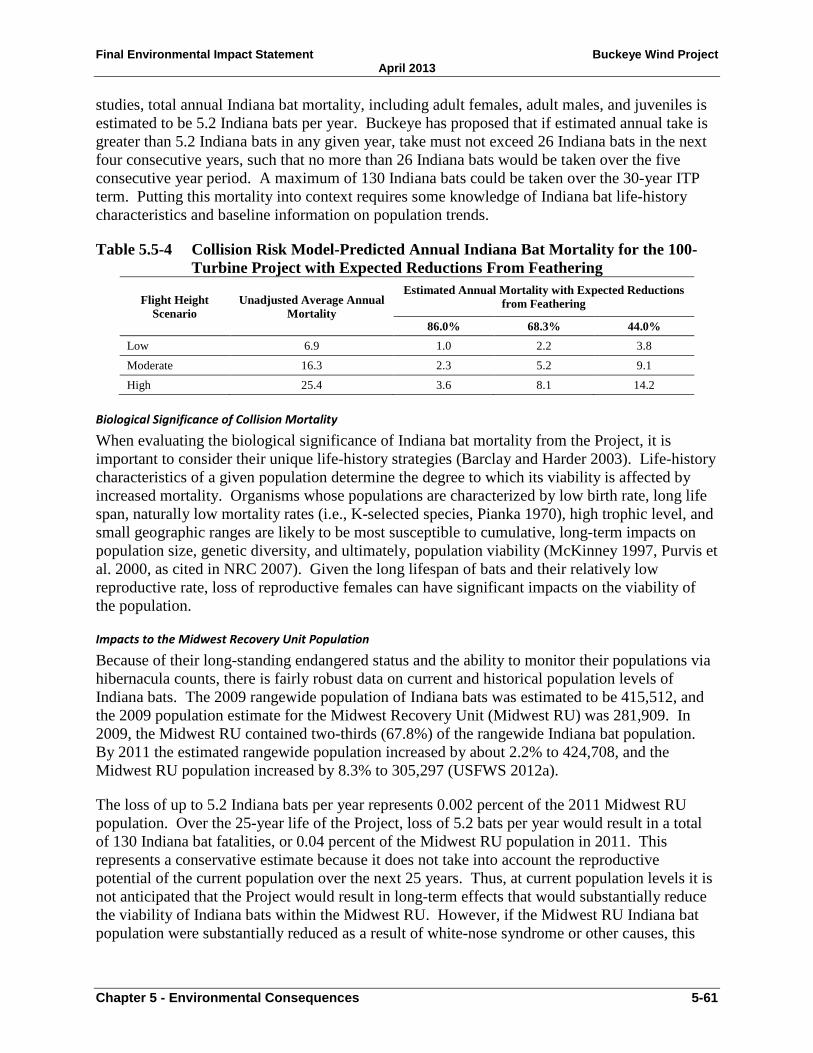
Final Environmental Impact Statement Buckeye Wind Project April 2013
Chapter 5 - Environmental Consequences 5-61
studies, total annual Indiana bat mortality, including adult females, adult males, and juveniles is estimated to be 5.2 Indiana bats per year. Buckeye has proposed that if estimated annual take is greater than 5.2 Indiana bats in any given year, take must not exceed 26 Indiana bats in the next four consecutive years, such that no more than 26 Indiana bats would be taken over the five consecutive year period. A maximum of 130 Indiana bats could be taken over the 30-year ITP term. Putting this mortality into context requires some knowledge of Indiana bat life-history characteristics and baseline information on population trends.
Table 5.5-4 Collision Risk Model-Predicted Annual Indiana Bat Mortality for the 100-Turbine Project with Expected Reductions From Feathering
Flight Height Scenario
Unadjusted Average Annual Mortality
Estimated Annual Mortality with Expected Reductions from Feathering
86.0% 68.3% 44.0% Low 6.9 1.0 2.2 3.8 Moderate 16.3 2.3 5.2 9.1 High 25.4 3.6 8.1 14.2
Biological Significance of Collision Mortality
When evaluating the biological significance of Indiana bat mortality from the Project, it is important to consider their unique life-history strategies (Barclay and Harder 2003). Life-history characteristics of a given population determine the degree to which its viability is affected by increased mortality. Organisms whose populations are characterized by low birth rate, long life span, naturally low mortality rates (i.e., K-selected species, Pianka 1970), high trophic level, and small geographic ranges are likely to be most susceptible to cumulative, long-term impacts on population size, genetic diversity, and ultimately, population viability (McKinney 1997, Purvis et al. 2000, as cited in NRC 2007). Given the long lifespan of bats and their relatively low reproductive rate, loss of reproductive females can have significant impacts on the viability of the population.
Impacts to the Midwest Recovery Unit Population
Because of their long-standing endangered status and the ability to monitor their populations via hibernacula counts, there is fairly robust data on current and historical population levels of Indiana bats. The 2009 rangewide population of Indiana bats was estimated to be 415,512, and the 2009 population estimate for the Midwest Recovery Unit (Midwest RU) was 281,909. In 2009, the Midwest RU contained two-thirds (67.8%) of the rangewide Indiana bat population. By 2011 the estimated rangewide population increased by about 2.2% to 424,708, and the Midwest RU population increased by 8.3% to 305,297 (USFWS 2012a).
The loss of up to 5.2 Indiana bats per year represents 0.002 percent of the 2011 Midwest RU population. Over the 25-year life of the Project, loss of 5.2 bats per year would result in a total of 130 Indiana bat fatalities, or 0.04 percent of the Midwest RU population in 2011. This represents a conservative estimate because it does not take into account the reproductive potential of the current population over the next 25 years. Thus, at current population levels it is not anticipated that the Project would result in long-term effects that would substantially reduce the viability of Indiana bats within the Midwest RU. However, if the Midwest RU Indiana bat population were substantially reduced as a result of white-nose syndrome or other causes, this
Final Environmental Impact Statement Buckeye Wind Project April 2013
5-62 Chapter 5 - Environmental Consequences
level of mortality could have greater implications for the viability of the population. Therefore, the Applicant has committed to reducing requested five-year take limits by 50 percent (i.e., 2.6 Indiana bats per year, 13.0 over five years) if the population of Indiana bats in the Midwest RU is reduced by 50 percent or more from 2011 pre-WNS mortality levels. The reduction in take should the population decline due to WNS would proportionately reduce the impact on overall population numbers, and therefore impacts of Project-related take are highly unlikely to significantly impact the Midwest RU population under predicted WNS scenarios.
Impacts to Summer Maternity Colonies
If multiple adult female bats were lost from a single maternity colony, there could be negative impacts that could lead to harm or mortality of other individuals, such as reduction in thermoregulatory benefits or loss of colony cohesiveness. Female bats in late pregnancy and their pups are poor thermoregulators (Speakman and Thomas 2003, as cited in USFWS 2007). Clustering within maternity colonies helps to maintain roost temperatures favorable for prenatal and postnatal development (USFWS 2007). Therefore, if colony size was appreciably reduced, there is a potential for roost temperatures to be reduced and for prenatal and postnatal growth to be slowed (Racey and Swift 1985). What constitutes an appreciable reduction depends on the size of a given maternity colony, which has been found to vary greatly. As such, the available literature does not cite a specific threshold at which viability of a colony would be compromised.
The summer population in the Action Area is estimated to be 435.5 bats, and there are two known maternity colonies. All Category 1, 2, and 3 habitat was assumed suitable for Indiana bats, and Indiana bats were assumed to be distributed throughout the Action Area wherever suitable habitat occurs. It is important to understand the long-term biological significance of sustained annual take of Indiana bats during Project operation. Impacts to local maternity colonies, assuming losses to the population under the one-year take estimate and five-year take limits projected over the operational life of the Project (i.e., 25 years), were modeled using expected and worst-case scenarios (Table 5.5-4).
The expected scenario is one in which take of 5.2 Indiana bats occurs in each year (based on collision risk model results for the moderate flight height scenario and the median reductions in mortality observed in feathering studies—see Table 5.5-4), and take of 26.0 Indiana bats occurs over a consecutive five-year period. The worst-case scenario is one in which the maximum allowable take occurs as quickly as possible during a consecutive five-year period. In the worst-case scenario take of 14.2 Indiana bats occurs in the first year (based on collision risk model results for high flight height and lowest (44%) observed reduction in mortality from feathering; see Table 5.5-4), and take of 11.8 Indiana bats occurs in the second year, and no take occurs in years 3, 4, or 5. This also results in take of 26.0 Indiana bats over a consecutive five-year period. In either scenario, take of Indiana bats would include adult males, adult females, and juveniles, and would likely be distributed throughout spring, summer, and fall. A portion of the Indiana bats taken during the spring and fall migration periods would likely be from areas outside of the Action Area, while a portion of the Indiana bats taken during the spring and fall migratory periods and all Indiana bats taken during the summer would likely be from local maternity colonies within the Action Area.
Based on the number and sex of Indiana bats expected within the Action Area during various seasons (see HCP Section 5.1.2.7.1 and Table 5-9a), 44 percent of total Indiana bat take was

Final Environmental Impact Statement Buckeye Wind Project April 2013
Chapter 5 - Environmental Consequences 5-63
attributed to bats that summer within the Action Area (“local Indiana bats”). This equates to take of 2.3 local Indiana bats each year in the expected scenario, or 3.1 local Indiana bats in year 1 and 2.4 taken in year 2 in the worst-case scenario (Table 5.5-4). Only a portion of the local Indiana bats taken are females (see HCP Section 5.1.2.7.1 and Table 5-9a). Approximately 48 percent of the mortality that occurs to local Indiana bats is composed of adult females (the remainder are adult males or juveniles). Annual mortality of local adult female Indiana bats is expected to range from 1.1 bats per year (expected scenario) to 3.1 bats per year (worst-case scenario) (Table 5.5-4). This mortality equates to an estimate that up to 27.5 local adult female Indiana bats from maternity colonies within the Action Area would be taken over the 25-year operational life of the Project. A detailed description of modeling conducted to determine potential impacts to maternity colonies can be found in Section 5.7.2.7 of the HCP.
Table 5.5-4 Expected and Worst-case Scenarios of Total Local Indiana Bat and Local Adult Female Indiana Bat Mortality Over a 5-year Period for the 100-Turbine Project
Year
Expected Scenario* Worst-case Scenario** Total Local Indiana bat Mortality
Local Female Indiana bat Mortality
Total Local Indiana bat Mortality
Local Female Indiana bat Mortality
1 2.3 1.1 6.2 3.1
2 2.3 1.1 5.3 2.4
3 2.3 1.1 0 0
4 2.3 1.1 0 0
5 2.3 1.1 0 0
Total 11.5 5.5 11.5 5.5 *Assumes take of 5.2 Indiana bats per year based on Collision Risk Model results for moderate flight height and median (68%) reduction in mortality from feathering. **Assumes maximum take allowable occurs as early in project operation as possible. Assumes take of 14.2 Indiana bats in the first year based on Collision Risk Model results for high flight height and lowest (44%)_observed reduction in mortality from feathering, and take of 11.8 Indiana bas occurs in year 2, with no take in years 3-5.
Indiana bat maternity colony size in the Action Area, based on the average of two cumulative emergence counts in or in proximity to the Action Area is estimated to be about 70 Indiana bats (Stantec 2010). The Buckeye Wind HCP evaluated the impact of take of local adult females on the local maternity colonies using the Leslie Model (Leslie 1945, see Section 5.1.2.7.1 of the HCP). Given assumptions about the starting population size, proportion of annual take attributed to local adult females each season, (see Section 5.1.2.6.1 of the HCP), and parameters provided by the USFWS, estimated Project-related mortality of local adult females is not expected to reduce the long-term viability of a single local maternity colony, even if all take of local females occurred within that single maternity colony. This was true for both the “expected scenario” and “worst-case scenario.” No turbines would be sited closer than 2.9 km (1.8 mi) from the known roosts.
Based on the habitat suitability model, there are 6,989.93 ha (17,272.5 ac) of Category 1 and 2 habitat (i.e., the top two highest habitat suitability classes for Indiana bat roosting and foraging activities) in the Action Area. This high suitability habitat occurs throughout the Action Area, but is concentrated in the northern, southern, and eastern portions (Figure 4.5-4). While some
Final Environmental Impact Statement Buckeye Wind Project April 2013
5-64 Chapter 5 - Environmental Consequences
turbines are located in closer proximity than others to high suitability habitat, the tiered feathering plan (discussed in Section 3.1.2) based on the results of the habitat suitability model is expected to account for any potential differences in risk exposure. Additionally, avoidance and minimization measures that are part of the HCP and discussed in Section 5.5.2 include adaptive management based on post-construction monitoring results. Monitoring data would provide sufficient information to detect disproportionately high mortality at individual turbines, and if necessary the Applicant would employ adaptive management, such as increased turbine feathering, to bring mortality within the limits of take allowed by USFWS.
When considering the potential effects of total annual mortality on maternity colonies in the Action Area or in other areas in the Midwest RU, it is important to consider that 58 percent of the estimated adult female mortality (i.e., 1.1 adult female Indiana bats under the Proposed Action) is expected to occur during the fall migratory period (see Appendix B, Section 5.1.2.7.1). Given that up to 5,800 Indiana bats are estimated to travel through the Action Area during migration from up to 575 km (357 mi) away, there is a high probability that Indiana bats killed during migration would be from multiple maternity colonies in different geographic areas. While it’s possible that some summer resident bats migrating from the Action Area to their winter hibernacula would be killed en route, it is highly unlikely that all migrating individuals would be those belonging to maternity colonies in the Action Area. Thus, while the Project would result in some take of Indiana bats, it would not result in substantial adverse effects on Indiana bat summer populations in the Action Area. However, given the rate of spread of WNS and the impact it is having on bats in general and Indiana bats in particular, the impact to the maternity colony could become proportionally greater should the total population numbers decrease as a result of WNS. Therefore Buckeye has committed to reducing take by 50 percent should WNS result in population declines within the Midwest RU of 50 percent from the 2011 pre-WNS mortality population level.
The USFWS will be fully evaluating the impact of the taking in a Biological Opinion, which would be finalized prior to the issuance of the ROD, to document whether or not the Project would jeopardize the species, meaning it would not “reduce appreciably the likelihood of both the survival and recovery of a listed species in the wild by reducing the reproduction, numbers, or distribution of the species” (50 C.F.R. § 402.02).
Disturbance and Displacement
Direct impacts from noise, from operating turbines Indiana bats could be directly impacted by noise emitted from operating turbines. Kunz et al. (2007) suggested that bats may become acoustically disoriented upon encountering turbines during migration or feeding, although observations of bat flight activity using thermal infrared (TIR) cameras at wind energy facilities suggest that bats are able to fly and forage normally in close proximity to wind turbines (Ahlén 2003 as cited in Kunz et al. 2007, Horn et al. 2008).
Indiana bats could also be attracted to and thus directly impacted by turbine noise. Some bat species are known to orient toward distant audible sounds (Buchler and Childs 1981 as cited in Kunz et al. 2007). Few empirical data exist regarding the potential attraction of bats to turbine noise. Szewczak and Arnett (2006) studied ultrasound emissions from a variety of wind turbines as a potential attractant to bats and concluded that ultrasound emissions, as measured from the

Final Environmental Impact Statement Buckeye Wind Project April 2013
Chapter 5 - Environmental Consequences 5-65
ground-level, do not likely play a significant role in attracting bats toward wind turbines with consequential fatalities from rotor strikes. However, the authors cautioned that ultrasound could be emitted from turbines not tested during their investigation or from turbine nacelles. The results of the Szewczak and Arnett (2006) study are consistent with the common sense logic that if bats were attracted to sounds produced by turbines, it is likely that summer resident bats would be killed as frequently as bats during the fall migratory period, which is not the case.
Along similar lines, Indiana bats could be directly impacted if they are deterred from turbine noise. If this is true, then the noise would further reduce bat mortality at wind turbines, which would be beneficial for the overall species survival. However, as every well-studied operating wind facility has documented bat mortality during the fall migratory period, it is clear that turbine noise does not completely deter bats from the area, at least not during the fall migratory season. Furthermore, studies such as Ahlén’s 2003 TIR study (mentioned above) have not shown any noticeable bat deterrence around turbines. Therefore, noise from the turbines is not expected to directly impact Indiana bats through either attraction or deterrence.
Indiana bats could be indirectly impacted if turbine operating noise results in decreased foraging success in proximity to the wind turbines, as a result of turbine noise muddling their echolocation calls. This is unlikely, given the fact that bats successfully echolocate when amongst millions of other echolocating bats. Furthermore, if turbine noise does decrease Indiana bat foraging success, then it is assumed that the bats would quickly leave the area of turbine noise disturbance. Thus, turbine noise is not expected to result in decreased foraging success of Indiana bats.
Direct impacts of lighting, from operating turbines
FAA lights that would be installed on some of the turbines are not expected to increase collision/barotrauma mortality or have any direct or indirect effects on Indiana bats. Arnett et al. (2008) synthesized available information on bat fatalities from 21 studies conducted at 19 wind energy facilities in five regions of the United States and one province in Canada. None of the studies reviewed demonstrated statistically significant differences in fatality between turbines equipped with FAA lights and those that were unlit. Further, Arnett (2005) studied bat activity and fatalities at the Mountaineer facility in West Virginia and at the Meyersdale facility in Pennsylvania and found that turbines with FAA lights did not appear to affect the incidence of foraging bats around turbines and there was no difference between numbers of bat passes recorded with acoustic detectors at lit and unlit turbines. Additionally, bat fatalities documented at the Mountaineer and Meyersdale facilities were not different between turbines equipped with FAA lights and those that were unlit. Finally, Horn et al. (2008) used TIR cameras to study behavioral responses of bats to operating wind turbines and concluded that aviation lighting did not appear to affect the incidence of foraging bats around turbines. However, controlled studies comparing fatalities at red and white FAA lights have not been conducted and response to white lights is unknown (Arnett 2008).
In addition to FAA lights, there may be a limited number of security lights required at the substation and O&M facilities. However, the Applicant would take steps to minimize any potential impacts associated with these lights by minimizing the amount of time these are lit, using motion-activated sensors, and shielding the light from being projected upward into the night sky. Direct impacts from lighting would be minor.

Final Environmental Impact Statement Buckeye Wind Project April 2013
5-66 Chapter 5 - Environmental Consequences
Direct impacts from displacement, from operating turbines
Indirect effects to Indiana bats could result if they are displaced by Project operation and suffer energetic losses associated with finding alternate roosts, foraging areas, or migratory routes. It is not known whether Indiana bats would be displaced by operating wind turbines, but limited data suggest that bats in general may become habituated to their presence. Observations of bat flight activity using TIR cameras at wind energy facilities have documented bats flying and foraging in close proximity to wind turbines and even investigating spinning turbine blades (Ahlén 2003, Horn et al. 2008). Also, the continuous bat fatality records for many wind facilities indicate that displacement is not occurring.
Migrating Indiana bats could be displaced if their regular migratory routes pass through the Action Area and they are forced to take an alternate route to avoid the Project. However, there is currently no empirical data to support this assumption. Further, if migrating bats fly low enough to the ground, they would not have to circumvent wind facilities to avoid turbines (there is relatively little information regarding the migratory height for Indiana bats). Even if Indiana bats do not typically fly below the rotor swept zone during migration, any energetic costs associated with having to circumvent the Project, which is approximately 16 km by 19 km (10 mi by 12 mi) at its widest points, would not be a substantial barrier to migrating Indiana bats that typically travel hundreds of miles during the course of their migrations. However, the possibility that Indiana bats would be forced to circumvent the Action Area is unlikely, because turbines are spread widely and occur somewhat randomly across the Action Area, rather than being arranged in a grid pattern. Thus, it is probable that a bat could readily fly across the Action Area without encountering a turbine. For these reasons, Indiana bats are not expected to avoid the Action Area and associated energetic costs or other indirect effects would have less than significant effects on this species.
Decommissioning-related Effects Impacts on Indiana bats associated with decommissioning activities would be the same as for construction, which is minor or unlikely to occur. The impacts would be intermittent, short-term, and localized. Avoidance, minimization, and mitigation measures would be employed for the decommissioning activities, including reestablishing plant communities in accordance with the NPDES permit and Erosion and Sediment Control Plan in order to minimize habitat-related impacts. Decommissioning activities could occur as early as 2037.
Conservation Measures In cooperation with the USFWS and ODNR Division of Wildlife, the Applicant would implement one or a combination of the following conservation measures to advance the knowledge base of the Indiana bat and wind energy interactions:
• Providing funding to a qualified research program to conduct research on Indiana bat behavior relative to operating wind turbines.
• Providing funding to a qualified research program to conduct fall migration telemetry studies at Indiana bat hibernacula in Ohio, where landowner permission allows. Results of the research would be incorporated into the adaptive management of the Project, where appropriate.

Final Environmental Impact Statement Buckeye Wind Project April 2013
Chapter 5 - Environmental Consequences 5-67
• Wing and Hair tissue samples from each dead bat found during post-construction mortality monitoring may be collected to support USFWS-requested research projects by entities other than Buckeye Wind. Wing tissue and hair samples would be collected and stored following USFWS recommended protocol at the time of collection. Specimens would be stored such that details on the individual bat from which samples were collected are known (either store data sheet with sample, or cross reference sample to database of mortality records). Specimens would be provided to USFWS on a periodic basis, to be determined at the start of each post-construction monitoring period. Collection of specimens will not affect the subsequent use of the carcasses for searcher efficiency or carcass persistence trials.
Other Listed Species As summarized in Section 4.5 and Table 4.5-1, other federal and state-listed threatened and endangered species with the potential to occur in or migrate through the Action Area were considered in this EIS in addition to the Indiana bat including two aquatic species, one reptile, and six birds.
Aquatic species
The rayed bean mussel (Villosa fabalis) is a federal and Ohio endangered species, and the western tonguetied minnow (Exoglossum laurae) is an Ohio threatened species that may occur within the Action Area.
The Action Area lies within the range of the rayed bean, a freshwater mussel species currently listed as endangered both federally and by the State of Ohio. Suitable habitat for the rayed bean is still thought to be present in Champaign County. The rayed bean is generally known from smaller, headwater creeks, near shoal or riffle areas of rivers, and in the shallow, wave-washed areas of lakes. The rayed bean is known to occur in the Big Darby Creek watershed, of which Little Darby Creek is a tributary. Portions of the Little Darby Creek that could be impacted by road and utility line crossings associated with the Project are ephemeral and do not contain features necessary to support mussel populations (Hull 2010). A field assessment in November 2008 found the stream reach for this part of Little Darby Creek did not have the required perennial base flow or preferred substrates of the rayed bean. Additionally, the rayed bean is often associated with the root masses of aquatic plants, which are not present in this reach (Hull 2009e).
The rayed bean has the potential to occur in other perennial streams with suitable habitat within the Action Area. For perennial stream corridors where suitable habitat exists, mussel surveys may be done to determine the presence or probable absence of the species. If rayed bean are determined to be present, in-water work would be avoided either through directional drilling, access road re-routing, arched bridge structures or temporary crossings (see Section 5.2.1.2 of the HCP). Additionally, the Applicant would directionally drill beneath or otherwise avoid in-water work for any designated exceptional warm water or cold water habitat streams in the Action Area. If no mussel survey is performed, presence of rayed bean would be assumed and in-water work would be avoided as if rayed bean was determined to be present. No impacts to the rayed bean are anticipated.

Final Environmental Impact Statement Buckeye Wind Project April 2013
5-68 Chapter 5 - Environmental Consequences
The Action Area lies within the range of the western tonguetied minnow, a freshwater fish currently listed as threatened by the State of Ohio. The western tonguetied minnow may be found in the Mad River and tributaries of it in the Great Miami River system. This species is very intolerant of turbid (murky) waters and needs a clean gravel and pebble stream bottom. They also rely on forested and undercut stream banks, and alternating riffle pool sequences. Lastly they may need somewhat cooler water temperatures than the average Ohio stream has in summer.
As described in Section 5.2.2, impacts to streams will be avoided and minimized such that not more than 32 stream crossings totaling not more than 380.3 linear m (1,248 linear ft) of impact would result for the 100-turbine Project. Further, direct impacts to designated exceptional warm water habitat and cold water habitat streams would be avoided. Ephemeral or intermittent streams would be unlikely to support this species. Proposed impacts to perennial streams would generally consist of culverts for roads or trenching for collection lines, and would be temporary and localized. Best management practices associated with NPDES permits and USACE Permits would further minimize impacts from sedimentation and runoff in perennial streams. Based on the limited proposed impacts to suitable habitat for this species and the fact that this species may not even occur in the waterbodies potentially affected by the Project, impacts on this species from the project would be minor or nonexistent.
Reptiles
The Action Area also lies within the range of the eastern massasauga rattlesnake (Sistrurus catenatus), a federal candidate species and state-listed endangered species. The eastern massasauga uses both upland and wetland habitat at different times during the year, and therefore requires wetland areas immediately adjacent to upland grassland. Early successional herbaceous or scrub-shrub wetlands are used primarily during the fall, winter, and spring. During the winter, massasaugas hibernate in low wet areas, primarily in crayfish burrows, but may also use other structures. The presence of a water table at or near the surface is an important component of a suitable hibernation area. During the summer, male and non-gravid female massasaugas use open, upland grassland or prairie habitat that may be intermixed with scattered trees or shrubs. Adjacent lowland and upland habitat, with variable elevations between, are critical as the snakes travel back and forth seasonally between habitats.
There are no known occurrences of eastern massasauga rattlesnakes in the Action Area (M. Seymour, USFWS, personal communication). However, the species is known to occur outside of the Action Area at sites in Champaign and Clark counties (M. Cota, USFWS, personal communication). A desktop assessment revealed that the majority of the wetlands present in the portion of the Action Area do not have any adjacent grassland, and at those sites that do, the grassland present is very limited. The only potential suitable habitat in the Action Area was a 20 ac wetland, and a habitat evaluation was conducted by USFWS and eastern massasauga experts on 10 January 2012. It was determined that this 20 ac wetland contains suitable habitat for the eastern massasauga. A proposed access road near the wetland was subsequently relocated, and as a result, no proposed Project activities or infrastructure would impact this wetland, nor would loss of potential habitat occur as a result of the Project. A 50-foot setback of the access road from the wetland was deemed appropriate because none of the wetland or adjacent natural vegetation would be impacted, and the road would be entirely within active agricultural fields which would not provide suitable massasauga habitat. Furthermore, once the project is

Final Environmental Impact Statement Buckeye Wind Project April 2013
Chapter 5 - Environmental Consequences 5-69
operational there will only be minimal traffic on the road associated with maintenance of the wind facility, the road will be gated to prevent unauthorized access, and signage will be posted to keep maintenance vehicles alert to speed limits and wildlife crossings. Collectively, these actions make roadkill mortality unlikely to occur during operation.
In order to avoid potential impacts to the eastern massasauga, a presence/absence survey approved by the USFWS and ODNR DOW may be conducted at the wetland. If no eastern massasaugas are detected during the survey, no further avoidance and minimization measures would be necessary. If presence is detected, or if a survey is not conducted before Project construction, presence of eastern massasaugas would be assumed. The Applicant would minimize the potential for construction, operation, and decommissioning-related impacts to eastern massasaugas near this specific wetland by implementing the following measures:
• To the extent practicable, all construction and decommissioning activities would be conducted between November 15 and March 1. If earth-moving activities occur after March 1 and before November 15 a USFWS and ODNR DOW approved and state-permitted herpetologist would be present to survey for snakes during earth-moving activities. If earth-moving activities occur between November 15 and March 1, the ODNR DOW permitted herpetologist would not be present.
• Any temporary ground disturbance for construction activities, as well as any construction of crane paths or buried or overhead interconnect would occur at least 15 m (50 ft) from the delineated wetland.
• Buried silt fences would be installed during construction and decommissioning between the planned Project facilities and the eastern massasauga habitat. These silt fences would be located at least 12 m (40 ft) from the wetland.
• A USFWS and ODNR DOW approved and state-permitted herpetologist would survey for snakes during installation of the silt fencing to ensure there are no eastern massasauga present that could be impact. If installation of the fencing occurs between November 15 and March 1, the ODNR DOW permitted herpetologist would not be present.
• Within one half-mile around the wetland, speed limits would be maintained at 10 mph and signs alerting drivers of a wildlife crossing would be posted.
• Gates would be installed at the access point from public roads onto the access roads in proximity to the wetland.
• Construction and O&M personnel would be trained on the appearance, protected status, and proper avoidance of the massasauga. Any snake that cannot be positively identified as not being an eastern massasauga would be immediately reported to the site manager.
• If an eastern massasauga is encountered or suspected in the Action Area during construction, operations and maintenance, or decommissioning, all work in or near the location of the eastern massasauga encounter would stop, ODNR DOW and USFWS would be contacted immediately for further direction, and a permitted and approved herpetologist would be immediately notified to ensure no potential risk to the snake or Project personnel occurs

Final Environmental Impact Statement Buckeye Wind Project April 2013
5-70 Chapter 5 - Environmental Consequences
With implementation of all of the avoidance and minimization measures outlined above, construction, operation and maintenance, and decommissioning of the Project is not likely to adversely affect the eastern massasauga. Any potential impacts to this species would likely be insignificant and discountable.
Birds
Chapter 4 identifies several state-listed threatened and endangered species with potential to occur in the Action Area: black-crowned night heron (Ohio threatened species), loggerhead shrike (Ohio endangered species), northern harrier (Ohio endangered species), peregrine falcon (Ohio threatened species), upland sandpiper (Ohio endangered species), and sandhill crane (Ohio endangered species).
Four sandhill cranes were documented in the aforementioned surveys by Stantec. Sandhill cranes are diurnal migrants, so their collision risk may be less, as collision risk has been found to be greatest for nocturnal migrants traveling in inclement weather (NRC 2007). The loggerheaded shrike has not been documented by any Breeding Bird Surveys, although there is one breeding record in the past 30 years within a five county radius of the Project. There is very marginal habitat for this species in the Action Area and it is not expected to regularly occur. Two black-crowned night heron were observed during the Breeding Bird Survey, although no nesting was observed.
Stantec observed the northern harrier (five in spring, four in fall) during their 2008 surveys, but did not identify any nests for this species, and the Ohio Breeding Bird Atlas does not have records for this species breeding in the proposed Action Area. Tree removal would occur November 1 through March 31, and thus would avoid most of the forest nesting bird season (nesting season is generally considered to be February 1 through August 31). Further, CRP land will be cleared only during the non-breeding season for grassland birds (before March 1 and after July 15). Therefore, Project construction is not expected to have significant impacts on Ohio threatened and endangered bird species.
Birds could be impacted during the proposed Project operation, and state-listed species have been observed within the Action Area. Thus, it is possible that state-listed species that infrequently migrate through the Action Area could be injured or killed by operational turbines. However, none of the state-listed species are species most commonly found as collisions at wind turbines or found in large numbers during episodic collisions (see discussion in Section 5.15.4), and individual state-listed species are only rarely observed within the Action Area (see Table 4.5-1), therefore overall collision risk to state-listed birds is low in this Alternative. The likelihood of substantial adverse impacts to state-listed species is also low. In the event that mortality of a state endangered or threatened species is documented, ODNR DOW would be immediately notified and appropriate next steps would be discussed. Results of post-construction monitoring for all bird and bat species will be provided to USFWS and ODNR DOW on a seasonal and annual basis. The Applicant would avoid and minimize the potential of operation-related impacts with the following measures:
• Using a design that doesn’t support roosting or perching (e.g., tubular supports with pointed tops rather than lattice supports).

Final Environmental Impact Statement Buckeye Wind Project April 2013
Chapter 5 - Environmental Consequences 5-71
• Burying collector lines wherever feasible to minimize the potential risk of electrocution to raptors and other birds. Half of the 113.5 km (70.5 mi) of 34.5-kV interconnects for the 100-turbine Project would be buried underground.
• Equipping above-ground collector lines and distribution poles with insulated and shielded wire to avoid electrocution of raptors and other birds. All above ground electrical facilities would be designed in accordance with the APLIC guidelines developed jointly with the USFWS (APLIC 2006) where possible, and as dictated by Dayton Power and Light (DPL) construction guidelines5.
• New distribution poles, where possible and as dictated by DPL construction guidelines, would be designed and maintained so that they are insulated in order to protect raptors from electrocution for, at least, the duration of the ITP.
• Permanent MET towers would be non-guyed, free-standing structures.
• Should insulating of lines associated with new poles not be possible, perch deterrents would be installed to prevent raptor (including eagle) perching activity.
• Implementing measures to avoid and reduce scavenging opportunities for raptors around the turbine locations by removing carcasses from access roads and turbine pads.
• Minimizing operational and FAA lighting to the maximum extent practicable to reduce attraction of birds. Any ground-based lighting at the turbines or substation necessary for safety or security would be controlled by motion detectors or infrared sensors.
o Approximately one in every five turbines would be lit, and all lights within the Project would illuminate simultaneously.
o Lights are anticipated to be flashing strobes that only operate at night.
o To the extent possible, USFWS recommended lighting schemes would be used on the nacelles, including reduced intensity lighting and lights with shorter flash durations that emit no light during the “off phase”.
o MET towers would use the minimum lighting as required by the FAA.
o No steady burning lights would be left on at Project buildings. Where lights are needed for safety or security, motion detector lighting or infrared sensors would be used.
With implementation of these measures, operation-related impacts on Ohio threatened and endangered birds would be minor.
Mitigation Measures for Unavoidable Impacts In cooperation with the USFWS and ODNR Division of Wildlife, the Applicant would implement the following mitigation actions to further the recovery of the Indiana bat:
5 While the Applicant would own the wires that carry electricity from the turbines, the above ground collection lines and distribution poles would be owned and maintained by DPL, and subject to DPL construction guidelines. While it is likely that DPL would utilize APLIC guidelines or similar, and the Applicant would encourage the use of APLIC guidelines, it is not possible to guarantee such measures.

Final Environmental Impact Statement Buckeye Wind Project April 2013
5-72 Chapter 5 - Environmental Consequences
1. Acquiring or otherwise providing protection to 87.8 ha (217.0 ac) of suitable Indiana bat swarming habitat within 11.2 km (7 mi) of a P2 Indiana bat hibernaculum in Ohio, either through acquisition of conservation easements into perpetuity or purchase of the property and then assigning conservation easements in perpetuity.
A. Within the easement areas, restoring travel corridors between woodlots and/or along stream corridors to increase availability of suitable Indiana bat habitat through enhanced connectivity.
B. Within easement areas, enhancing and restoring suitable habitat through ensuring an adequate number of suitable roost trees and through managing woody invasive species.
OR
2. Buying credits from an USFWS-approved Indiana bat mitigation bank whose geographical range service area includes the Project (see Section 7.3.4 – Change in Mitigation Acres).
If avoidance and minimization measures are found to be ineffective at reducing impacts to other state-listed bird and bat species, and mortality continues to exceed acceptable levels, the Applicant will consider mitigation options including, but not limited to, the following actions to offset impacts:
1. Contribute to funding for protection, enhancement or restoration of habitat which is of particular importance to the impacted species.
2. Contribute to funding of on-site or off-site research, such as bird displacement studies or acoustic bat studies to better understand the specific Project design, environmental, or behavioral factors contributing to mortality.
3. Contribute to funding of off-site research that would contribute to knowledge of survival or breeding success of the impacted species.
4. Contribute to funding for retrofitting of communication towers with bird flight diverters on guy lines, and/or retrofitting communication towers with lighting schemes that are less of an attraction to nocturnal migrants.
5. Contribute to funding for the installation of off-site nesting platforms or nest boxes to increase breeding success of the impacted species.
6. Other, unknown mitigation measures, determined in coordination with ODNR DOW and USFWS, which may satisfy a recently discovered (previously unforeseen) need in the area.
The specific measures to be taken would be developed in cooperation with ODNR DOW and the USFWS, would consider the best available science, and would occur in Ohio. The amount of funding available would be commensurate with the level of mortality relative to the thresholds and will not exceed $100,000 for the life of the Project. It should be recognized that there are adaptive management and mitigation measures outlined in the HCP that are geared toward mitigating impacts to Indiana bats, such as conservation and restoration of forested habitat and turbine feathering, that will coincidentally benefit other species of bats and birds. Any measures

Final Environmental Impact Statement Buckeye Wind Project April 2013
Chapter 5 - Environmental Consequences 5-73
employed through the HCP will also be considered as mitigation measures to the extent that the Indiana bat mitigation also provided benefits to the affected species.
5.5.2.1 Redesign Option The Redesign Option is an optional measure under the Proposed Action that includes a primarily buried collection system. The different collection system would affect threatened and endangered species similarly to the Proposed Action. In the Redesign Option, no more than 6.8 ha (16.8 ac) of wooded habitat would be removed for the 100-turbine Project. Of this, 3.3 ha (8.2 ac) is considered Category 1, 2, and 3 habitat for Indiana bat roosting or foraging activities, which is only 0.1 ha (0.25 ac) more than the Proposed Action. Only 1.1 ha (2.6 ac) of Category 1 habitat would be removed. This represents 0.1 percent of the total 2,744 ha (6,779 ac) of total wooded areas in the Action Area and 0.5 percent of the average home range of Indiana bats in the area. Because Indiana bats regularly shift roosts and their centers of activity, and members of a maternity colony are known to have multiple roost sites, it is likely that removal of 6.8 ha (16.8 ac) of the 2,744 ha (6,779 ac) of wooded habitat available in the Action Area including a small number of potential roost trees would not result in indirect effects on Indiana bats resulting from increased energy expenditure or lost reproductive fitness. The Redesign Option would impact a maximum of an additional 106.7 m (350 ft) of streams. The difference in impact is small in comparison with the total linear feet of streams in the Action Area, and is not expected to have greater impact on Indiana bats than the Proposed Action. For these reasons, indirect effects from the additional tree clearing and stream crossings associated with the Redesign Option would not result in substantially different impacts to the Indiana bat than the Proposed Action.
Impacts to listed species of aquatic species, reptiles, and birds are expected to be similar to those described for the Proposed Action. Construction of the 100 turbines under the Redesign Option would impact no more than 487.1 linear m (1,598 linear ft) of streams (an additional 106.7 linear m [350 linear ft] over the Proposed Action without the Redesign Option), and could result in increased siltation and sedimentation to aquatic resources down-gradient of the area of disturbance.
5.5.3 Alternative A- Maximally Restricted Operations Alternative Alternative A differs from the Proposed Action in that it would employ operational restrictions that would eliminate take of Indiana bats, such that all 100 turbines would be non-operational from sunset to sunrise during the entire period over which Indiana bats are active (April 1 through October 31) (see Section 3.2). No HCP for Indiana bats would be implemented.
Construction-related Impacts Construction-related Impacts associated with the Maximally Restricted Operations Alternative are expected to be similar to those described for the Proposed Action.
Operational Impacts Operational Impacts associated with the Maximally Restricted Operations Alternative would eliminate the potential take of Indiana bats, by prohibiting nighttime wind turbine operations when the bats are active (April 1 through October 31). Thus, there would be negligible effects on Indiana bats under this alternative, and no mitigation would occur, including any research conducted on bat-turbine interactions.

Final Environmental Impact Statement Buckeye Wind Project April 2013
5-74 Chapter 5 - Environmental Consequences
Cut-in speeds have not been shown to reduce bird deaths, but if the turbines are not operating at night there is likely to be less chance that endangered birds would collide with stationary turbine blades, especially for those species that migrate at night. These include: loggerhead shrike (Ohio endangered species), black-crowned night heron (Ohio threatened species), and sandhill crane (Ohio endangered species). State-listed bird species that migrate during the day, including northern harrier (Ohio endangered species) would have the same level of risk in Alternative A as they would for the Proposed Action. None of the state-listed species are species most commonly found as collisions at wind turbines or found in large numbers during episodic collisions (see discussion in Section 5.15.4), and individual state-listed species are only rarely observed within the Action Area (see Table 4.5-1), therefore overall collision risk to state-listed birds is not significant in this Alternative. A modified post-construction avian mortality monitoring program that follows ODNR’s standard post-construction monitoring protocol (ODNR 2009) would be implemented for Alternative A to address bird mortality. Since under this Alternative all turbine activity would be curtailed from sunset to sunrise, a monitoring program for bat mortality would not be needed. Impacts to other state-listed species would likely be similar to the Proposed Action.
Impacts of Decommissioning Due to similarities in construction and operation activities, impacts of decommissioning associated with the Maximally Restricted Operations Alternative are expected to be similar to those described for the Proposed Action.
5.5.4 Alternative B – Minimally Restricted Operations Alternative The operational adjustment under Alternative B would involve feathering and a cut-in speed of 5.0 m/s (11 mph) for all turbines for the first six hours after sunset during the fall Indiana bat migration period from August 1 through October 31. This corresponds to the seasonal timeframe when the majority of bat mortality occurs. The turbines would be feathered for the first six hours of the night during this period when wind speeds are 5.0 m/s (11 mph) or less. Good et al. (2011) documented an approximately 50 percent decrease in bat mortality during the fall migration period between turbines with no cut-in speeds and turbines with cut-in speeds of 5.0 m/s when cut-in speeds were applied during the entire night. Young et al. (2011) found that turbines that were feathered prior to reaching the manufacturer-set cut-in speed during the first five hours of the night from July 15 to October 13 resulted in significantly less (47 to 72% less) bat mortalities than turbines that were not feathered during this period. Turbines would also be feathered until the manufacturer’s set cut-in speed is reached from one half hour before sunset to one half hour after sunrise from April 1 to July 31.
This alternative would include the HCP.
When considering the projected take by season presented in Table 5.5-3, and using the “Moderate” flight height scenario, the take of Indiana bats is expected to be 6.9 in spring, 0.7 in summer, and 8.7 in fall. Assuming that use of a fall feathering and cut-in speed regime of 5.0 m/s was implemented for the first 6 hours of the night, and that turbines would be feathered until the manufacturer’s cut-in speed is reached at night during spring and summer, reductions in Indiana bat mortality during the fall of approximately 50 percnet could reasonably be expected (as observed by Young et al. 2011, by feathering during the first five hours of the night). This

Final Environmental Impact Statement Buckeye Wind Project April 2013
Chapter 5 - Environmental Consequences 5-75
alternative would result in take of 4.4 Indiana bats during fall, and take of a total of 12 Indiana bats per year in this Alternative.
Using the method described in the HCP Section 5.1.2.7.1, take of 12 Indiana bats per year would equate to take of 2.6 local adult females per year. Take of 2.6 local adult females per year was assessed in the Leslie matrix model (Leslie 1945), using all other inputs as described in the HCP Section 5.1.2.7.1 to determine the effect of this level of take on the maternity colony. Take of 2.6 local adult females per year resulted in a maternity colony population of 53 adult females after 25 years of operation. This demonstrates a declining maternity colony population compared to the starting size of 70 adult females. Whereas in the Proposed Action, the maternity colony continues to increase, albeit more slowly, when factoring in project related take, in Alternative B, the maternity colony declines with the project related take. This declining maternity colony projection is significant because it indicates that the mortality from the project cannot be compensated for by typical reproduction of the colony, resulting in lost reproductive capacity.
When considering effect of the take concurrent with effects from WNS, the Leslie model was used with the inputs described in Section 5.1.2.7.4 of the HCP, but assuming take of 2.6 local adult females from the maternity colony each year. With only WNS mortality and no project related take, the maternity colony population reached zero in year 8. With WNS mortality and project related take, the maternity colony reached zero in year 7. Similar to the take levels under the proposed action, in the WNS scenario, project-related take is masked by the drastic declines due to WNS. The difference in time between when the maternity colony reaches zero in the scenarios with and without project take is approximately one year, and is not considered to be appreciable (see discussion in EIS Section 5.4.2).
While the effects of feathering and cut in speeds on birds are not as well understood as they are for bats, it is expected that Alternative B would pose a slightly greater risk to state-listed birds than would either the Proposed Action or Alternative A because the turbines would be spinning more often in this alternative than in either of the other alternatives. State-listed birds would still experience collision risks associated with spring migration, summer residency periods, and fall migration. Diurnally active migrants including bald eagle (Ohio threatened species), osprey (Ohio threatened species), and northern harrier (Ohio endangered species) and resident state-listed birds would be exposed to collision risk during their regular commutes within the Action Area. State-listed birds that migrate through the area in spring would be at risk, and those that migrate through the area in fall would also be at risk, especially during the later part of the night. It can be assumed that mortality impacts to bird species would be similar to the Proposed Action during the period from November 1 through March 31, but slightly higher from April 1 through October 31.
Attempting to quantify the impact to state-listed birds from this alternative is difficult for multiple reasons. Unlike Alternative A when all of the turbines would not be spinning at night, turbines under Alternative B would be spinning during some portion of every night when winds were above the manufacturer’s set cut-in speed. Use of cut-in speeds to reduce state-listed bird mortality has not been studied to date, so it is uncertain how much use of cut-in speeds during only a portion of the night and only during the fall would influence state-listed bird mortality. Similar to the other alternatives, turbines under Alternative B would not have steady burning

Final Environmental Impact Statement Buckeye Wind Project April 2013
5-76 Chapter 5 - Environmental Consequences
lights, so collision risk would not be substantially higher. None of the state-listed species are species most commonly found as collisions at wind turbines or found in large numbers during episodic collisions (see discussion in Section 5.15.4), and individual state-listed species are only rarely observed within the Action Area (see Table 4.5-1), therefore overall collision risk to state-listed birds is not significant in this Alternative.
The same minimization and avoidance measures would be implemented for Alternative B as the Proposed Action, with the exception of the operational adjustment regime, and potentially more mitigation efforts required due to increased take of Indiana bats. Using the “Acres of Mitigation Calculation” method described in Section 6.3.1 of the HCP, 488.3 acres of mitigation land would be needed to mitigate for the take of 297.5 Indiana bats.
In addition, the same post-construction avian and bat fatality monitoring program would be implemented for Alternative B as for the Proposed Action.
Construction-related Impacts Construction-related Impacts associated with the Minimally Restricted Operations Alternative are expected to be similar to those described for the Proposed Action.
Operational Impacts Operational Impacts associated with the Minimally Restricted Operations Alternative are expected to be similar to those described for the Proposed Action, but with potentially greater impacts to the Indiana bat during the spring and summer, due to no curtailment restrictions on the turbine speeds during these seasons. Thus, operations under this Alternative would have greater adverse effects on spring/summer populations of Indiana bats than the Proposed Action. Additional mitigation for take of additional Indiana bats would likely be necessary to offset the impacts. Cut-in speeds have not been shown to reduce bird deaths, but with less curtailment there could possibly be more state-listed bird mortality, especially for those that migrate at night. Impacts to other state-listed species would likely be similar to proposed action.
Impacts of Decommissioning Impacts of decommissioning associated with the Minimally Restricted Operations Alternative are expected to be similar to those described for the Proposed Action.
5.5.5 Alternative C - No Action Alternative Under Alternative C, the Project would not be built and no Project-related activities (construction, operation, or decommissioning) would occur. Implementation of this alternative would avoid direct and indirect impacts to Indiana bats from operation of the Project, including take of 130 Indiana bats and 16.1 acres of Indiana bat habitat, but would not result in benefits derived from implementation of the mitigation and conservation measures proposed under the HCP.

Final Environmental Impact Statement Buckeye Wind Project April 2013
Chapter 5 - Environmental Consequences 5-77
5.6 Cultural and Historic Resources
5.6.1 Impact Criteria For cultural resources qualifying as historic properties, protection is afforded under the National Historic Preservation Act (NHPA). NHPA defines a historic property as follows:
…any Pre-European contact or historic district, site, building, structure, or object included in, or eligible for listing on the National Register, including artifacts, records, and material remains related to such a property or resource (46 CFR 800, as amended 2006 Public Law 89-665; 16 U.S.C. 470, TITLE III, Section 301 (5)).
In general, in order for a property to be eligible for listing in the National Register of Historic Places (NRHP), it must be at least 50 years old and possess both historic significance and integrity. Significance may be found in four aspects of American history recognized by the National Register Criteria:
A. That are associated with events that have made a significant contribution to the broad patterns of our history; or
B. That are associated with the lives of persons significant in our past; or
C. That embody distinctive characteristics of a type, period, or method of construction, or that represent the work of a master, or that possess high artistic values, or that represent a significant and distinguishable entity whose components may lack individual distinction; or
D. That have yielded, or may be likely to yield, information important in prehistory or history.
A property must meet at least one of these criteria to be eligible for listing in the NRHP. Integrity must also be evident through historic qualities including location, design, setting, materials, workmanship, feeling, and association.
Impacts to cultural resources, including historic structures, archaeological sites, and traditional cultural properties, would be considered significant if they would result in adverse effects to historic properties. Once a cultural resource is identified, the historic significance of the property must be evaluated in terms of its ability to meet the National Register criteria (36 CFR 800.4 (c)(1)). A cultural resource that meets the criteria is considered a historic property entitled to the consideration afforded by Section 106 of the NHPA, as outlined in the Advisory Council on Historic Preservation’s implementing regulations (36 CFR 800). Cultural resources are analyzed by direct and indirect APE, referring to the actual footprint of the Project and the area from which Project infrastructure would be visible, respectively. APE is the standard terminology used by cultural resources agencies and professionals to describe impacts on archaeological and architectural resources.
Archaeological and architectural surveys have been conducted in order to identify significant cultural resources and to evaluate the potential effects the Project may have on their continued
Final Environmental Impact Statement Buckeye Wind Project April 2013
5-78 Chapter 5 - Environmental Consequences
significance. Additional archaeological surveys may be conducted, as discussed in the Archaeology section below. The surveys were conducted by CRA according to Work Plans submitted to and approved by the OHPO. Section 106 consultation was initiated with the OHPO on June 17, 2010 in a letter from David W. Kluth, Regional Historic Preservation Officer of USFWS, to Mark J. Epstein of the Ohio Historic Preservation Office.
Archaeology
The archaeological survey identified 14 archaeological sites within the direct APE, including one (33CH0415) potentially eligible for NRHP listing (CRA 2011a). Recommendations of NRHP eligibility were submitted to OHPO in May 2011. OHPO agreed in an October 2011 letter that additional field work is needed at 33CH0415 only to avoid ground disturbance in or immediately adjacent to the site, and recommended further consultation to consider what treatment measures would be used at the site. Site 33CH0415 is a historic site represented by a variety of artifacts including brick, nails, and window glass, and an excavated area representing a root cellar or storage pit. Buckeye Wind intends to avoid this site. CRA will develop a Work Plan for the follow up surveys of the alternate route and submit the plan for approval prior to commencing work. EIS-related archaeological surveys were conducted solely for the 52-turbine Project footprint. Therefore, additional effort would be required to identify archaeological sites and historic properties that may be adversely affected within the 100-turbine Project footprint. Following siting of the additional 48 turbines, additional archaeological identification efforts will be conducted as necessary, with plans and reports submitted to OHPO for review. A Programmatic Agreement (Appendix L) between USFWS, Buckeye Wind, and SHPO will be signed prior to issuance of the ROD and ITP, and will delineate all archaeological surveys that must be completed before the Section 106 process is complete.
Architecture
Architectural surveys identified 1,475 historic properties within 8 km (5 mi) of Project facilities, referred to as the indirect APE (CRA 2011b). In accordance with the agreed-upon work plan, these properties were not individually evaluated for eligibility for listing in the NRHP. Rather, the goal of the survey was to gain a general understanding of the character of the survey area’s historic landscape and to identify the character-defining property types that contribute to the qualities that make this historic landscape unique. Based on the archival research, field survey, and public involvement, it was determined that the agricultural heritage of the survey area is what makes the historic landscape unique.
Historic farmsteads and farmhouses, one-room schoolhouses, churches, cemeteries, and crossroads communities are character-defining property types that contribute to appreciation of the area’s historic landscape. Effects to these resources were evaluated on the landscape level, resulting in a finding that construction of the proposed project may adversely affect the perception of the traditional rural historic landscape, changing important qualities of the setting in which many of the character-defining historic property types are located. In the October 27, 2011 letter from OHPO, it was confirmed that the studies conducted sufficiently encompassed the Action Area of the 100-turbine project, and additional architectural surveys would not be required for the surveyed area. In 2013, the supplemental study of previously undocumented areas within the APE for the 100-turbine project confirmed that the conclusions of the 2011 survey report are appropriate for the complete 100-turbine project.

Final Environmental Impact Statement Buckeye Wind Project April 2013
Chapter 5 - Environmental Consequences 5-79
Pursuant to the NHPA and AIRFA, and in an effort to identify other cultural resources that may be affected by the Project, USFWS initiated consultation with the following tribes, inviting them to comment on whether they attach any religious or cultural significance to the Project location:
• Absentee-Shawnee Tribe of Oklahoma;
• Eastern Shawnee Tribe of Oklahoma;
• Miami Tribe of Oklahoma;
• Ottawa Tribe of Oklahoma;
• Piqua Shawnee Tribe;
• Hannahville Indian Community;
• Citizen Potawatomi Nation;
• Prairie Band of Potawatomi Nation;
• Forest County Potawatomi Community; and
• Shawnee Tribe.
The USFWS has made multiple attempts to reach out to the tribes during the EIS process. During initial outreach, only the Eastern Shawnee Tribe of Oklahoma and Piqua Shawnee Tribe indicated an interest in this Project. In February 2013, the USFWS sent certified letters to all tribes inviting input. The Eastern Shawnee did not respond to the February letter. Only the Piqua Shawnee Tribe responded to the USFWS’s February 2013 invitation for input.
Discussions were also initiated with the state-recognized Piqua Shawnee Tribe in regards to “Indian Mound” (see Section 4.6.3.1). In a press release dated September 7, 2010, an elder of the Piqua Shawnee Tribe expressed support for the 52-turbine Project described in the OPSB application, and stated that the Project poses no threat to the mound (Park 2010). Further, in a December 4, 2012 letter to the Ohio Power Siting Board a local agent for the Piqua Shawnee Tribe stated, “The Buckeye Wind Farms pose no threat to the local artifacts, sites and culture of the tribe in the area. EverPower and the Shawnee Tribe have also agreed to work together during construction to ensure there is no impact.”
In response to USFWS’s February 2013 letter requesting input, the Piqua Shawnee Tribe provided a letter dated February 8, 2013. This letter stated that they have worked closely with Dr. Kenneth B. Tankersley, the Native American Graves Protection Act representative for the Piqua Shawnee, to determine if construction of the turbines would endanger Native burial sites, ancient mounds, and earthworks over the entire construction site. They concluded that “A few turbine sites are located close to mounds, but should be out of danger during construction. Our Tribe has permission to monitor these sites and will do so, when construction gets underway…This will conclude our comments on the proposed undertaking” (Park 2013). Based on the response from the Piqua Shawnee Tribe and the lack of responses from other Tribes, the Service has determined that there will be no effect on Tribal resources and that consultation with Tribes has been concluded.

Final Environmental Impact Statement Buckeye Wind Project April 2013
5-80 Chapter 5 - Environmental Consequences
5.6.2 Proposed Action
5.6.2.1 Avoidance and Minimization Measures Archaeological and architectural surveys were conducted in the direct and indirect APE, respectively, to identify the location and character of significant cultural resources. The surveys were conducted according to Work Plans approved by the OHPO. The surveys included field documentation, archival research, and consultation with local groups and citizens.
Archaeology
The Proposed Action would implement the following measures that would avoid or minimize impacts to archaeological resources. Field methods were modified to extend the survey outside of the Project boundaries to delineate the full extent of the site 33CH0415. This was intended to aid in establishing a viable alternate route for the buried interconnect, since avoidance of any potentially important site is a major goal of the established Work Plan. This site has been recommended as potentially eligible for the NRHP under Criterion D, with recommendations for avoidance, or if avoidance is not possible, Phase II investigations to obtain information sufficient to determine the NRHP eligibility of the site. The Applicant has committed to avoiding this potential NRHP site, and any other NRHP site(s) identified in future field studies.
Architecture Findings suggest that there are significant historic architectural resources in the indirect APE and that the proposed Project would likely affect their continued significance. Considering the nature of the Project, it is unlikely that these effects would be avoidable or that minimization efforts would substantially reduce the impacts. As a result, recommended mitigation measures were included in the final report to OHPO (Section VIII of CRA 2011b) proposing specific ways the Applicant can support local preservation efforts in a proportionate response to the project’s effects. These measures are described below in the Mitigation Measures section.
Construction-related Effects
Archaeology
Results from the archeological survey identified 14 archaeological sites within the direct APE, one of which is potentially eligible for NRHP listing (33CH0415). These findings were submitted to OHPO for review, and in October 2011 OHPO agreed that further study and consultation is warranted at site 33CH0415. No further studies on the other 13 sites were deemed necessary. A final NRHP eligibility determination from OHPO has not yet been issued. Buckeye Wind has committed to avoiding this and all potentially eligible NRHP sites. Therefore, there would be no adverse impacts from construction activities.
A mound was identified within the Action Area, but it would not be affected by the Project, and the Piqua Shawnee Tribe confirmed that the construction of the turbines should not affect the mound (Park 2013). All 100 turbines would be sited to avoid the mound and the Piqua Shawnee would be consulted about the locations of all 100 turbines. OHPO concurred in the October 2011 letter that the mound would not be impacted due to conditions requiring that turbines be sited a “sufficient” distance from any mounds, and that no earth be removed from the area immediately surrounding a mound. An unanticipated discovery plan to address any unexpected artifacts uncovered during construction activities would be developed and followed during

Final Environmental Impact Statement Buckeye Wind Project April 2013
Chapter 5 - Environmental Consequences 5-81
construction in the unlikely event that significant cultural resources not detected during the archeological survey are encountered during construction.
Archaeological surveys were conducted solely for the 52-turbine Project footprint. Therefore, additional effort would be required to identify archaeological sites and historic properties that may be adversely affected within the 100-turbine Project footprint. Following siting of the additional 48 turbines, additional archaeological identification efforts will be conducted as necessary, with plans and reports submitted to OHPO for review. A Programmatic Agreement (Appendix L) between USFWS, Buckeye Wind, and SHPO will be signed prior to issuance of the ROD and ITP, and will delineate all archaeological surveys that must be completed before the Section 106 process is complete.
Architecture
The draft architectural survey report states that 1,475 historic properties were identified within the indirect APE. These findings were submitted to OHPO, and in a letter dated 27 October 2011, OHPO stated that several buildings, structures, and main street districts warrant further evaluation to determine their eligibility for the NRHP. However, OHPO also stated that the additional eligibility surveys fall outside of the agreed-upon scope of this effort, and no further surveys are required at this time unless the project expands beyond the footprint of the potential 100-turbine array. Any impacts on historic structures during the construction phase are considered temporary.
Operation and Maintenance-related Effects
Archaeology After the construction phase, the potential for effects to buried cultural resources such as archaeological sites diminishes significantly. As long as any ground-disturbing activities associated with operation are confined to previously surveyed areas and avoid buried cultural resources, there would be minimal potential for effects during operation. Even though the potential for impacts on buried cultural resources would be minimal during the operational phase, the unanticipated discovery plan would remain in effect during this phase.
Architecture
Effects on historic architectural resources would continue for the operational life of the Project. OHPO stated in the October 2011 letter that, “the undertaking will have effects, and cumulatively across the area within two miles of turbines the effects will alter the cultural landscape…” Along with the impacts findings, a draft mitigation plan addressing these impacts was developed and submitted to OHPO. The components of the mitigation plan are discussed in the Mitigation Measures for Unavoidable Impacts section below. The mitigation measures, if agreed upon by OHPO, USFWS, OPSB, and the Applicant, will be included in the Programmatic Agreement (Appendix L).
Decommissioning-related Effects
Archaeology
Decommissioning has the potential to impact buried cultural resources within the footprint of all turbines, facilities, and other components of the Projects that would be removed. If any

Final Environmental Impact Statement Buckeye Wind Project April 2013
5-82 Chapter 5 - Environmental Consequences
previously unsurveyed areas would be directly affected by decommissioning, archaeological survey would be required to determine the presence of archaeological sites, and the potential effects. An unanticipated discovery plan would be followed during decommissioning activities within areas previously surveyed and known not to contain significant archaeological sites, in the unlikely event that previously unknown significant cultural resources are encountered during decommissioning.
Architecture
If the viewshed is restored to the pre-Project state, decommissioning would not affect historic structures. In fact, removal of the Project and restoration of the original view would return any historic structures that may be present to their pre-project setting. Therefore, decommissioning could potentially positively affect historic structures.
Mitigation Measures for Unavoidable Impacts
Archaeology
Buckeye Wind has committed to avoiding all impacts to all potentially NRHP eligible sites, therefore no mitigation measures would be warranted. The Programmatic Agreement (Appendix L) will specify the process for identifying and avoiding all potentially NRHP eligible sites found during the remaining archeological surveys, and mitigation that would be necessary if sites could not be avoided.
Architecture
Surveys documented that there are significant historic architectural resources in the indirect APE. Effects to these resources were evaluated on the landscape level, resulting in a finding that construction of the proposed project may adversely affect the perception of the traditional rural historic landscape, changing important qualities of the setting in which many of the character-defining historic property types are located. As a result, the Champaign County Historical Society and Champaign County Preservation Alliance were consulted in order to develop a mitigation plan to help minimize the effects. The Applicant received input from the USFWS Historic Preservation Officer, as well as from OHPO in a letter dated October 27, 2011, and is working to finalize the mitigation plans as proposed in the report. Mitigation measures presented in the plan include:
• A Multiple Property Listing (MPL) to the NRHP for historic one-room schoolhouses throughout the Action Area to promote awareness and preservation of these structures.
• Documentation and interpretation of the A.P. Howard house and the Obed Horr house, and development of a Teaching with Historic Places lesson plan presenting Champaign County’s role in the Underground Railroad.
The mitigation measures, if agreed upon by OHPO, USFWS, OPSB, and the Applicant, will be included in the Programmatic Agreement (Appendix L).
5.6.2.2 Redesign Option The Redesign Option is an optional measure under the Proposed Action that includes a primarily buried collection system. There is more ground disturbance under the Redesign Option, which could cause more impacts to unknown buried cultural resources. Surveys would be conducted in

Final Environmental Impact Statement Buckeye Wind Project April 2013
Chapter 5 - Environmental Consequences 5-83
all additional areas where ground disturbance is planned, using a methodology consistent with the surveys conducted for the Proposed Action. There would be fewer overhead lines in the Redesign Option, but the primary source of impact on historic structures is the turbines, so any reduction of impacts would be minor and applicable only to those structures where overhead lines but not turbines would be seen. The avoidance, minimization, and mitigation measures would be the same as described above for the Proposed Action.
5.6.3 Alternative A - Maximally Restricted Operations Alternative Alternative A differs from the Proposed Action only with respect to operations. The operational differences would not affect archaeological or historic resources. As such, the construction, operation, and decommissioning-related effects of Alternative A on cultural resources and the recommended avoidance, minimization, and mitigation measures would be the same as under the Proposed Action.
5.6.4 Alternative B - Minimally Restricted Operations Alternative Alternative B differs from the Proposed Action only with respect to operations. The operational differences would not affect archaeological or historic resources. As such, the construction, operation, and decommissioning-related effects of Alternative B on cultural resources and the recommended avoidance, minimization, and mitigation measures would be the same as under the Proposed Action.
5.6.5 Alternative C - No Action Alternative Under Alternative C, the Project would not be built and no Project-related activities (construction, operation, or decommissioning) would occur. Alternative C would have no effect on archaeological or historic resources.
5.7 Land Use and Recreation
5.7.1 Impact Criteria Consideration of the effects of the Proposed Action and alternatives on the human environment, which includes land use and recreation, must be included as part of an overall NEPA analysis. In addition, the Farmland Protection Policy Act (FPPA) stipulates that federal programs and actions be compatible with state, local and private efforts to protect farmland. The following section addresses the key issues related to land use and recreation associated with the Project including: compatibility with local land use, zoning and comprehensive planning; compatibility with planned development; loss of use to landowners; and effects to recreational resources.
5.7.2 Proposed Action
5.7.2.1 Avoidance and Minimization Measures The Proposed Action contains the following avoidance and minimization measures that would avoid or minimize impacts to land use and recreation.
The 100 turbines will be sited in locations consistent with OPSB-required setbacks from property lines and residential structures. Advanced engineering and micro-siting was used to ensure that

Final Environmental Impact Statement Buckeye Wind Project April 2013
5-84 Chapter 5 - Environmental Consequences
turbines would not be constructed unless the setback requirement would be met or an appropriate waiver would be executed (EDR 2009a). In addition, significant impacts to agricultural land have been avoided through coordination with landowners and Project design, which sited Project components along field edges/hedgerows to the extent practicable. Each wind turbine location (along with the locations for associated infrastructure) was individually inspected during field efforts by the Applicant and/or their consultants (EDR 2009a), and the remaining turbines will be evaluated similarly.
Additional mitigation measures to lessen impacts to agricultural land include the following:
• Limiting permanent road widths to a maximum of 6 m (20 ft) or less, and where possible, following existing farm lanes, hedgerows and field edges to minimize loss and fragmentation of agricultural land.
• Avoiding disturbance of surface and subsurface drainage features.
• Repairing all inadvertently damaged tile lines.
• Minimizing vehicular access to turbine sites until topsoil has been stripped and permanent access roads have been constructed.
• Limiting vehicular access to construction roads only.
• Avoiding stripping of topsoil or passage of cranes across agricultural fields during saturated conditions (when soils capacity to assimilate water is exceeded, and standing water forms on the soils surface) when such actions would damage agricultural soils when practicable.
• Subsoil decompaction and rock picking prior to re-spreading of topsoil in temporarily disturbed areas.
• Avoiding blocking of surface water drainage due to road installation or stockpiled topsoil.
• Coordination with landowner to assure that interference with irrigation and subsurface drainage is appropriately minimized during construction and avoided during operation and maintenance (EDR 2009a, Stantec 2010b).
• Maintaining access roads throughout construction so as to allow continued use/crossing by farmers and farm machinery to the extent practicable.
• Temporarily fencing/securing open excavation areas in active pastureland to protect livestock.
• Removing and disposing of all construction debris offsite at the completion of restoration.
• Washing of concrete trucks into foundation holes, or outside of active agricultural areas in locations approved by the landowner and in appropriate locations where additional impacts to natural resources would not occur.

Final Environmental Impact Statement Buckeye Wind Project April 2013
Chapter 5 - Environmental Consequences 5-85
• Restricting crane set-up, erection, and breakdown activities to designated access roads and immediately adjacent areas and work pads at the turbine sites, and restoration of buried interconnect and crane paths.
• Restoration of temporarily disturbed areas.
• Stabilizing restored agricultural areas with seed and/or mulch.
• Compensation for damaged/lost crops.
Furthermore, landowners who participate in the lease program for the wind turbines would receive a payment for the use of the property.
Other measures would be intended to address the indirect effects associated with visual impacts to the surroundings areas, as well as noise. Section 5.8 provides more detailed measures to address visual impacts, while Section 5.10 provides additional measures to address construction and operational noise concerns.
Construction-related Effects Construction of the Project would take place over one to two construction phases, each phase expected to continue for 12 to 18 months. The exact timing of the two construction periods is not known and may overlap. In general, the effects associated with the construction of the Project are anticipated to be temporary. The effects from construction are discussed as they relate to local land use planning, planned development, loss of use, and recreation.
Local Land Use, Zoning, and Comprehensive/Land Use Plans Due to the small amount of land required for the construction of the Project relative to the overall Action Area, the Project would not directly impact the predominantly agricultural land use pattern of the Action Area and surrounding vicinity. However, construction activities would be inconsistent, albeit largely temporary, with “the preservation of the rural character,” a common goal of the comprehensive plans for communities within 8 km (5 mi) of the Action Area.
The presence of heavy construction equipment, workers, and increased traffic are not typically associated with rural-agricultural or rural residential areas (although dust, noise, and the occasional presence of large construction equipment, large farm machinery on public roads are byproducts of agricultural operations). These impacts are not anticipated to occur in areas used for recreation, such as golf courses or parks. Any such effects would be short-term and would last only until construction activities were completed.
Planned Development
The construction of the Project would not directly affect the overall planned development within the Action Area or for the geographic locations included within the five counties overlapping the Action Area. Construction would not impact future land use categorizations due to the temporary nature of the activities. These activities would not interfere with other potential developments; therefore no effects to planned development would occur from the proposed action.

Final Environmental Impact Statement Buckeye Wind Project April 2013
5-86 Chapter 5 - Environmental Consequences
Loss of Use
Landowners may experience a temporary loss of use in areas during the construction. During this time, machinery would be present to allow for the placement of the turbines, access roads, and other appurtenances.
For example, access road construction through agricultural fields would include stripping a 12.2 m (40.0 ft) width of topsoil and placing it in wind-rows along the access road to prevent construction vehicles from driving over undisturbed soil and adjacent fields. Following turbine construction, these road widths would be reduced to 6 m (20 ft) or less (EDR 2009a).
In locations where buried cable crosses agricultural fields, construction equipment may disturb a width of up to 7.3 m (25 ft) of soil (EDR 2009a). However, this would represent a temporary disturbance. The cable would be buried in agricultural fields at a depth of 1.2 m (48 in), and agricultural practices would be able to resume (Stantec 2010b).
In areas where wind turbines are sited on agricultural land, topsoil within a 61 m (200 ft) radius of each tower would first be stripped and stockpiled. A backhoe then would be used to excavate a foundation hole. Excavated subsoil and rock would be segregated from topsoil during this process (Stantec 2010b).
As part of the HCP (Table 2-1) impacts to agricultural land were quantified based on the typical area of vegetative clearing including 61 m (200 ft) radius per turbine, 16.8 m (55 ft) wide per 0.3 linear m (1 linear ft) of road for access roads, 7.3 m (25 ft) per 0.3 linear m (1 linear ft) of cable, 1.2 ha (3 ac) for operations and maintenance facilities, and 9.2 ha (22.9 ac) total for the four staging areas (EDR 2009a). Table 5.7-1 provides the acreage of total disturbance, temporary disturbance, and permanent loss of acreage for the 100-turbine project. Construction of the Project would collectively disturb not more than of 199.1 ha (492 ac) of agricultural lands. As previously indicated, only 42.0 ha (103.9 ac) of impact would be permanent.
The Project would not require removal or relocation of any existing structures. Construction impacts primarily would be temporary in nature and confined to the properties of participating landowners. The Applicant has developed standards and policies for construction activities occurring partially or wholly on privately owned agricultural land, which would minimize adverse effects on these lands (see avoidance and minimization section above for further details) (Stantec 2010b).

Final Environmental Impact Statement Buckeye Wind Project April 2013
Chapter 5 - Environmental Consequences 5-87
Table 5.7-1 Impacts to Agricultural Land Associated with the Project Agricultural Land Total Disturbance
ha (ac) Temporary Disturbance
ha (ac)
Loss for the Life of the Project ha (ac)
Confined Feeding Operations 0.0 (0.0) 0.0 (0.0) 0.0 (0.0)
Croplands 199.1 (492.0) 157.1 (388.1) 42.0 (103.9)
Nurseries and Ornamental Horticulture
0.0 (0.0) 0.0 (0.0) 0.0 (0.0)
Orchards and Groves 0.0 (0.0) 0.0 (0.0) 0.0 (0.0)
Pasture 11.9 (29.4) 9.2 (22.7) 2.7 (6.7)
TOTAL 211 (521.4) 166.3 (410.8) 44.7 (110.6)
Recreation During construction, Project visibility, construction noise, and access restrictions may all affect the quality of the recreational experience. For instance, visual impacts would be experienced due to the presence of heavy construction equipment, workers, and the potential for increased traffic. These types of views would not be typical to the recreational users within the Action Area.
In addition, increased noise levels from construction activities may affect the rural nature of the agricultural setting, negatively impacting recreational users in the vicinity of the turbines and access road construction. Construction noise may negatively affect the presence of wildlife, and may thus temporarily limit hunting opportunities in the vicinity of construction areas. Noise from construction activities is likely to constitute a moderate unavoidable impact at recreational areas within 1.6 km (1 mi) of the Project. However, construction noise impacts would be temporary in nature.
Although no recreational facilities would be closed during the construction of the Project, access restrictions may result during movement of oversized machinery and turbine parts. Recreational users may be required to use alternate roads or spend more time reaching their destination.
Operation and Maintenance-related Effects During the operation of the Project, some effects would occur. These are discussed as they relate to local land use planning, planned development, loss of use, and recreation.
Local Land Use, Zoning, and Comprehensive/Land Use Plans
Due to the small amount of land required for the Project relative to the overall communities located within the Action Area of the Project, the Project would not directly impact local land use categorizations, which primarily consist of agricultural land. These current designations would not be altered by the operation of the Project.
However, positive and negative indirect impacts would result from the operation of the build alternatives. For the purpose of this analysis, the discussion of the indirect impacts associated with land use is provided in the context of consistency and compatibility with local comprehensive and land use plans.

Final Environmental Impact Statement Buckeye Wind Project April 2013
5-88 Chapter 5 - Environmental Consequences
With regard to local comprehensive and land use plans, the following provides a summary of the land use goals recommended within the various plans for communities within the Action Area:
• Ensure the conservation of agricultural land;
• Preserve the rural character of the County;
• Improve the overall quality of life for residents; and
• Respect the integrity of the natural environment.
Based on the local plans analyzed, the Project would be consistent with the goals set forth by the various communities (Clark County 1999; Union County 1999; Champaign County 2004; Madison County Commissioners 2005). The Project would provide income to local farmers, providing incentive to conserve agricultural land. In turn, the rural character of the communities also would be retained.
The Project also has the potential to improve the existing quality of life through the generation of a renewable energy source. For example, public services can be improved in part through the construction of new infrastructure such as roads to improve the overall well-being of the residents and visitors. While the infrastructure associated with the wind turbines would not change the current or future land use patterns recommended in the individual community plans, this Project would supply a renewable source of electrical services to the grid, which would in part support existing users. The Project would also make economic contributions to the local communities through service payments and taxes (addressed in Section 5.9, Socioeconomics and Environmental Justice).
The Project also seeks to respect the integrity of the natural environment. This would be accomplished through minimizing disturbance of natural vegetation and avoidance of sensitive natural resources where necessary.
Setback requirements would be met in accordance with local and state regulations in order to ensure consistency and compatibility with local land use decisions. The OPSB requires that the distance from the base of the turbine to the nearest property line be at least 1.1 times the total height of the turbine (i.e., distance from base to blade) and at least 750 ft from the “tip of the turbine’s nearest blade at ninety degrees to the exterior of the nearest habitable residential structure” (OAC 4906-17-8 (3) (C) (1)).
More permanent indirect impacts would be associated with the visual presence of the wind turbines in agricultural areas as compared to the existing conditions. These impacts may be considered positive, negative, or neutral depending on the observer. Visual impacts are discussed in greater detail in Section 5.8, Visual Resources.
Maintenance activities associated with the operation of the wind turbines would not create significant impacts to the overall land use within the Action Area.
Planned Development
The Project would not directly affect the overall planned development for the geographic locations included within the Action Area. For the most part, the wind turbines would be located

Final Environmental Impact Statement Buckeye Wind Project April 2013
Chapter 5 - Environmental Consequences 5-89
within agricultural properties. The introduction of the Project would not alter the future land use. In general, the parcels on which the Project would be located could be redeveloped in accordance with the goals and objectives outlined by the various comprehensive plans for locations within the Action Area.
Indirect impacts may affect planned development include concerns for future property values and the public’s perception of the Project. As indicated in several professional and academic studies, no conclusive evidence is available to suggest that property values decrease when a wind farm is placed in proximity to a residential structure. However, the studies also indicated that perception can play a role in determining the value of a property. A more detailed discussion of property values is included in Section 4.9, Socioeconomics and Environmental Justice.
Loss of Use
Landowners may experience a permanent loss of use in areas during the operation of the Project. Following construction, the footprint of each turbine would be reduced to 0.08 ha (0.2 ac), which includes the turbine pedestal and a gravel crane pad. The remaining disturbed work area would be restored to agricultural use (Stantec 2010b). The 100-turbine array would cause no more than 52.2 ha (128.9 ac) to be converted to built structures. As shown in Table 5.9-1, most of this area (42.0 ha [103.9 ac]) is currently cropland. Given the predominant land use patterns in the Action Area, loss of agricultural land would similarly dominate the land use impacts associated with the 100-turbine array.
In addition, private land leases with more than 100 property owners are needed for the construction of the Project. For the 100-turbine Project, no more than 11.3 ha (27.9 ac) of CRP land would be disturbed, which represents 0.9 percent of the 1,253 ha (3,096 ac) in the six townships included in the Action Area. No more than 2.3 ha (5.7 ac) would be disturbed permanently. Based on consultation between the Applicant, the FSA, and the landowners, it is anticipated that the permanently affected lands would be withdrawn from the CRP. If the land is removed, landowners would no longer receive payments and may need to direct payments back to the FSA, but the Project would compensate landowners for these losses.
The Applicant does not anticipate the removal or relocation of any existing structures as a result of the operation of the Project. However, some loss of existing crops would occur, likely along with some damage to fences, gates, and subsurface tile drains. As previously indicated, the Applicant has developed standards and policies for construction activities occurring partially or wholly on privately owned agricultural land (Stantec 2010b).
During Project operation, additional impacts over the years on land use should be infrequent and minimal. Future impacts to land use would be similar in character to activities that already occur in the overall Action Area (i.e., residential and small manufacturing development). Aside from occasional maintenance and repair activities, Project operation should not interfere with on-going current land uses (Stantec 2010b).
Recreation
Project visibility, operation noise, and access restrictions may all affect the quality of the recreational experience. Recreational users are primarily concentrated in the 16 recreational facilities within the Action Area and include golfers, hikers, bicyclists, recreational boaters,

Final Environmental Impact Statement Buckeye Wind Project April 2013
5-90 Chapter 5 - Environmental Consequences
hunters, fishermen, and those involved in more passive recreational activities such as picnicking, sightseeing, or walking. For some, visual quality of the scenery may be an important part of the recreational experience. Recreational users often have continuous views of landscape features over relatively long periods of time and the presence of large structural features, such as wind turbines, may affect the experience in a negative way. Shadow flicker from the operating wind turbines may also be considered an annoyance that diminishes the recreational experience. These impacts would be most significant within 1.6 km (1 mi) of the Project. There are three recreational facilities within this area: Goshen Memorial Park, Urbana Country Club, and Woodland Gold Club. At each of these recreational areas, depending on the location of the viewer within the area, turbines would be visible. The number of turbines that would be visible at once would vary depending on the location of the viewer but is generally expected to be below 25. Sound levels at these recreational areas would not exceed nominal impact thresholds (i.e., the point at which the turbines are expected to be audible under certain conditions) during the day (Hessler 2009) but slight nighttime exceedances are expected in very limited portions of the golf courses at Urbana Country Club and Woodland Gold Club. Nighttime exceedances at these clubs are not expected to reduce the quality of the recreational experience because the affected areas would not be used at night. Based on the low level of visual effects and noise that could be experienced at these recreational facilities, significant impacts to recreation are not expected. Noise and visual impacts resulting from the Project are described in detail in Sections 5.10 and 5.8 of this EIS, respectively.
Decommissioning-related Effects Decommissioning-related effects of the Project would involve temporary land disturbance during dismantling of the turbines and other Project structures similar to construction activities, followed by return of the landscape to its pre-Project (i.e., largely agricultural) state. If the viewshed is restored to the pre-Project state, decommissioning would not affect land use in the Action Area; in fact, removal of the facility would return any land use practices to their pre-project status; therefore, decommissioning could potentially positively affect land use.
In summary, the Proposed Action would have minor impacts on land use and recreation. Some loss of use would occur within the footprints and immediate vicinities of the Project infrastructure, but these impacts would affect a small percentage of the overall area within the Action Area. Loss of use would be partially offset through lease payments.
Mitigation Measures for Unavoidable Impacts The Project would not have significant impacts on land use or recreation; therefore, the Proposed Action contains no specific mitigation measures in addition to the avoidance and minimization measures listed above.
5.7.2.2 Redesign Option The Redesign Option is an optional measure under the Proposed Action that includes a primarily buried collection system, which would cause more land disturbance than the overhead lines of the Proposed Action. Impacts to land use and recreation are expected to be largely the same as those described for the Proposed Action. The Redesign Option would permanently impact no more than 42.0 ha (103.8 ac) of cultivated crops, which is identical to the Proposed Action impact area, and would temporarily impact 154.8 ha (382.6 ac) in comparison to 157.1 ha (388.1
Final Environmental Impact Statement Buckeye Wind Project April 2013
Chapter 5 - Environmental Consequences 5-91
ac) for the Proposed Action. The avoidance and minimization measures would be the same as described above for the Proposed Action. No mitigation measures would be warranted.
5.7.3 Alternative A – Maximally Restricted Operations Alternative Alternative A differs from the Proposed Action only with respect to operations. The operational differences would not affect land use or recreation in a manner largely different from the Proposed Action. Minor differences between Alternative A and the Proposed Action may alter the amount of operational noise experienced by residents and recreational users. This Alternative is anticipated to generate less operational noise than the Proposed Action (see Section 5.10, Noise), as turbines would be non-operational from sunrise to sunset April 1 through October 31. The remaining construction, operation, and decommissioning-related effects of Alternative A on land use and recreation and the recommended avoidance and minimization measures would be the same as under the Proposed Action.
5.7.4 Alternative B – Minimally Restricted Operations Alternative Alternative B differs from the Proposed Action only with respect to operations. The operational differences would not affect land use or recreation in a manner different than the Proposed Action. Minor differences between Alternative B and the Proposed Action may alter the amount of operational noise experienced by residents and recreational users. Alternative B would generate more operational noise than the Proposed Action and Alternative A (see Section 5.10, Noise). The remaining construction, operation, and decommissioning-related effects of Alternative B on land use and recreation and the recommended avoidance and minimization measures would be the same as under the Proposed Action
5.7.5 Alternative C - No Action Alternative Under Alternative C, the Project would not be built and no Project-related activities (construction, operation, or decommissioning) would occur. Alternative C would have no effect on land use or recreation.
5.8 Visual Resources
This section describes the extent and magnitude of the Project’s effects on visual resources in the Action Area and surrounding visual study area (VSA) (5-mile radius around the proposed turbines), as defined by the Applicant. The regulatory framework for evaluating these impacts is described in Section 4.8.
5.8.1 Impact Criteria While USFWS regulations do not establish guidelines for evaluating visual impacts, several other federal agencies do provide guidance. The Applicant’s evaluation of the affected environment for visual resources was based on methodologies developed by the DOI Bureau of Land Management (BLM 1980), USDA National Forest Service (FS 1995), and the USDOT Federal Highway Administration (1981, as cited in EDR 2009b), as well as the New York State Department of Environmental Conservation (n.d., as cited in EDR 2009b). Based on review of these guidelines and other EIS documents (notably Mangi 2000), the following criteria are used to evaluate visual impacts from the Project:

Final Environmental Impact Statement Buckeye Wind Project April 2013
5-92 Chapter 5 - Environmental Consequences
A significant impact occurs when modifications to the visual setting dominate or begin to dominate the viewshed, attracts attention, and represents a marked departure in form, size, and/or color, compared to existing or reasonably expected aspects of the visual setting.
The OPSB rules (Chapter 4906-17 of the Ohio Administrative Code) governing applications for the construction of wind power facilities include the following requirement for minimizing impacts to visual resources:
4906-17-8 (D) (6). The applicant shall describe measures that will be taken to minimize any adverse visual impacts created by the facility, including, but not limited to, project area location, lighting, and facility coloration. In no event shall these measures conflict with relevant safety requirements.
5.8.2 Proposed Action
5.8.2.1 Avoidance and Minimization Measures The Proposed Action contains the following measures that would avoid or minimize impacts to visual resources.
Project Design
• Turbines would be painted white or off-white using non-reflective paints. This color “minimizes contrast with the sky under most conditions, especially when viewed at distance against the horizon” (EDR 2009b). It is also mandated by the FAA to eliminate the need for daytime lighting.
• The electrical collection system would be installed below ground wherever feasible. For above-ground segments of the collection system, existing utility rights-of-way and existing utility poles would be used to the maximum extent possible. Above ground components of the collection system would not exceed 56.8 km (35.3 mi.) of interconnect lines.
• FAA lighting would be minimized to the maximum extent practicable: o A single, medium intensity aviation warning light would be attached to the top of
some of the nacelles, per specifications of the FAA.
o The minimum amount of pilot warning and obstruction avoidance lighting would be used, approximately one in every five turbines would be lit, and all lights within the Project would illuminate synchronously.
o FAA lights are anticipated to be flashing red strobes (L-864) that operate only at night. The Applicant would use the lowest intensity allowed by the FAA.
o To the extent possible, USFWS-recommended lighting schemes would be used on the nacelles, including reduced intensity lighting and lights with short flash durations that emit no light during the “off phase”.

Final Environmental Impact Statement Buckeye Wind Project April 2013
Chapter 5 - Environmental Consequences 5-93
Site Development and Maintenance
• Turbines and turbine sites would be maintained to ensure that they are clean and attractive. In particular, rust spots or other flaws in exterior finishes would be corrected as quickly as possible.
Construction-related Effects Construction of the Project, including all 100 turbines, would occur within one or two construction phases, each phase expected to continue for 12 to 18 months. The exact timing of the two construction periods is not known and may overlap. Timing is dependent upon several factors such as turbine availability, OPSB certification, and economic considerations. Construction of the turbines would include the presence of partially-completed turbines, large cranes, frequent trips by very large trucks, visible areas of disturbed earth, and fugitive dust. Areas of disturbed earth and dust could also be visible around other Project facilities, including the operations and maintenance building, construction staging areas, and electrical substation. However, these impacts would be minimized through the implementation of various construction management practices including sediment and erosion control and dust control plans. All areas temporarily disturbed during construction would be restored to natural vegetation or agricultural production following the conclusion of construction activities.
The visual disturbances associated with construction would be short-term in nature at any given turbine site (or the sites of other Project facilities). Given the pace of construction, most individual turbines could be erected in a matter of one to two days, although some may take longer depending on weather and other factors. The general pace of construction could be increased with the addition of multiple crews. The VSA is predominantly agricultural in nature, which means that the presence of working heavy machinery, stockpiles of materials, dust, and disturbed earth (i.e., plowed fields) are common. Although different in purpose, the construction-related visual effects are in many ways comparable to those associated with farming.
Due to this similarity, combined with the short-term duration of construction in any single location, construction activity would not create significant direct or indirect impacts on visual resources.
Operation and Maintenance-related Effects This section describes the studies and analyses conducted by the Applicant to characterize the future conditions of the VSA during Project operations, as well as the effects of those future conditions. It is important to note that the Applicant has only identified locations for 52 of the proposed 100 turbines associated with the Project. By contrast, the Visual Impact Assessment (VIA) conducted by the Applicant evaluated a 70-turbine array (EDR 2009b). In evaluating potential effects on visual resources, it is important to consider the differences between these turbine arrays.
The visual analyses conducted for the 70-turbine Project included VSA analysis, cross section analysis, field evaluation, preparation of visual simulations, and evaluation of visual impact based on those simulations. Although each of these analyses was based on the specific turbine locations and specifications/dimensions proposed in the 70-turbine Project, the

Final Environmental Impact Statement Buckeye Wind Project April 2013
5-94 Chapter 5 - Environmental Consequences
results/conclusions of these analyses are generally applicable to an incrementally larger (e.g., 100-turbine) or smaller (e.g., 52 turbine) wind power project. As will be discussed in the following section, the greatest impact typically occurs when numerous turbines are visible and/or where the turbines are close to the viewer. These conclusions remain accurate whether addressing the effect of adding 100 turbines or 70 turbines into the landscape.
The VIA was consistent with methodologies developed by the DOI Bureau of Land Management (1980, as cited in EDR 2009b), USDA National Forest Service (1974, as cited in EDR 2009b), USDOT Federal Highway Administration (1981, as cited in EDR 2009b), and New York State Department of Environmental Conservation (n.d., as cited in EDR 2009b). The following sections summarize the structure and findings of the VIA, as described in EDR 2009b. A detailed description of the VIA, reprinted from the Application (EDR 2009b), is included in Appendix H.
Visibility Analysis
As part of the VIA, the Applicant completed various analyses to estimate the extent of potential Project visibility. Digital viewshed maps were prepared based on topography, assumed turbine design (maximum blade tip height of 150 m [492 ft] above ground), and FAA-compliant turbine lighting (assumed nacelle height of 100 m [328 ft] above ground). The initial analysis included a “worst case” scenario, in which screening provided by vegetation and structures was not considered. A subsequent viewshed analysis also was prepared (based on USGS land cover data delineating forests with an assumed vegetation height of 12 m [40 ft]), as shown in Figure 5.8-1. A turbine count analysis was also included to indicate the number of turbines potentially visible within the viewshed.
The Visibility Analysis also included the following components:
• A cross section analysis, documenting “representative line-of-sight cross sections (ranging from 9.8 to 15.8 km [6.1 to 9.8 mi] long)….Cross section locations were chosen so as to include visually sensitive areas…and cover the various landscape similarity zones” in the VSA (Stantec 2010b).
• Field verification to photo-document potential views of turbines from various viewpoints that represented “the most open, unobstructed available views of the Project…photos were taken from 116 representative viewpoints within the study area” (EDR 2009b). Photographs were used for visual simulations of future conditions (see below).
Viewshed Analysis
The viewshed analysis included in the Applicant’s VIA includes several measures of potential turbine visibility within the VSA (EDR 2009b):
• Blade Tip Visibility: Topography-Only Analysis (excludes screening from vegetation and buildings).
• Nacelle/Lighting: Topography-Only Analysis (excludes screening from vegetation and buildings); nighttime conditions.

Final Environmental Impact Statement Buckeye Wind Project April 2013
Chapter 5 - Environmental Consequences 5-95
• Blade Tip Visibility: Topography and Screening Analysis (includes screening from vegetation and buildings).
• Nacelle/Lighting: Topography and Screening Analysis (includes screening from vegetation and buildings).
Table 5.8-1 shows the percentage of the VSA that could view at least one turbine under each scenario, using the 70-turbine array modeled in EDR 2009b. These areas of potential visibility include anywhere from approximately 81 to 96 percent of the visual study area. This reflects the general lack of topographic and forest screening within this area, and suggests that viewshed analysis of the 52 turbine sites identified by the Applicant would likely be only slightly lower than shown in Table 5.8-1, while a similar analysis of the full 100-turbine array proposed by the Applicant would likely be only slightly higher than shown in Table 5.8-1. Regardless of the specific number of turbines, or whether forest vegetation is factored into the analysis, the overall conclusion of the viewshed analysis is that the Project has the potential to be visible throughout the majority of the VSA.
As indicated in the VIA, “Areas where there is no possibility of seeing the Project are generally limited to the backside of hills and some stream valleys…and some slopes along the far western edge of the study area,” as well as within or near blocks of contiguous forest (EDR 2009b, p. 32). The majority of potentially sensitive sites would have views of turbines. This conclusion is accurate regardless of the specific number of turbines included in the Project.
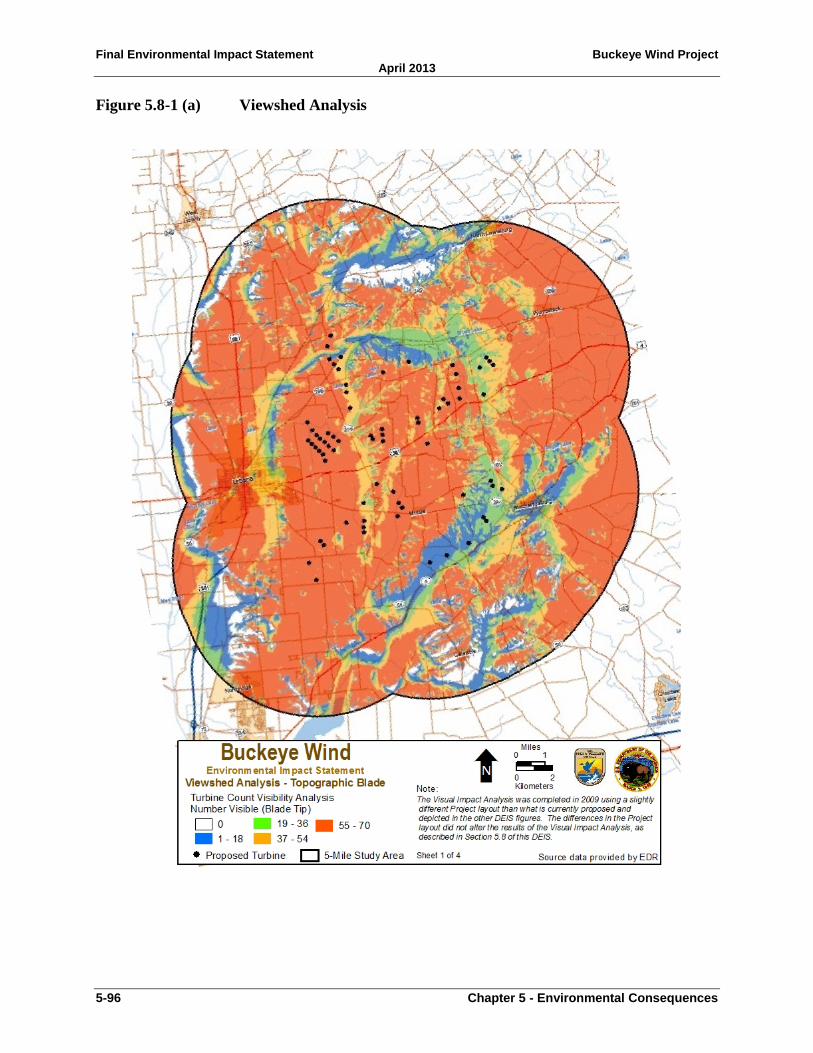
Final Environmental Impact Statement Buckeye Wind Project April 2013
5-96 Chapter 5 - Environmental Consequences
Figure 5.8-1 (a) Viewshed Analysis
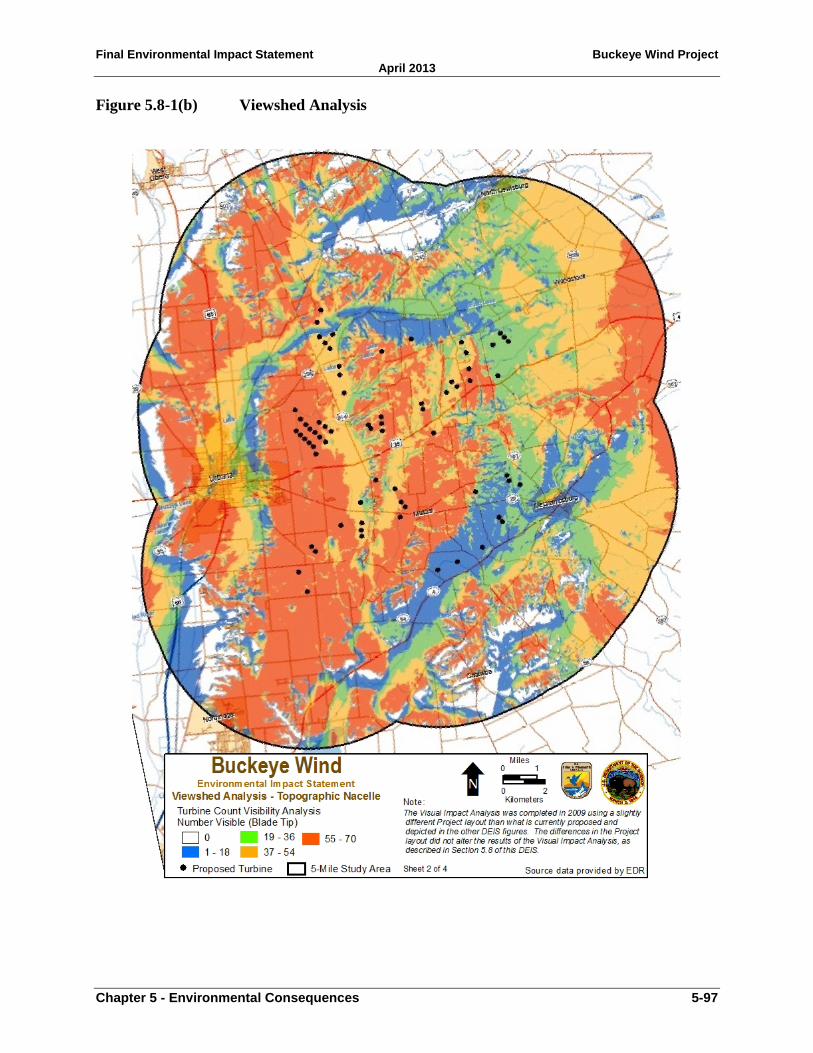
Final Environmental Impact Statement Buckeye Wind Project April 2013
Chapter 5 - Environmental Consequences 5-97
Figure 5.8-1(b) Viewshed Analysis
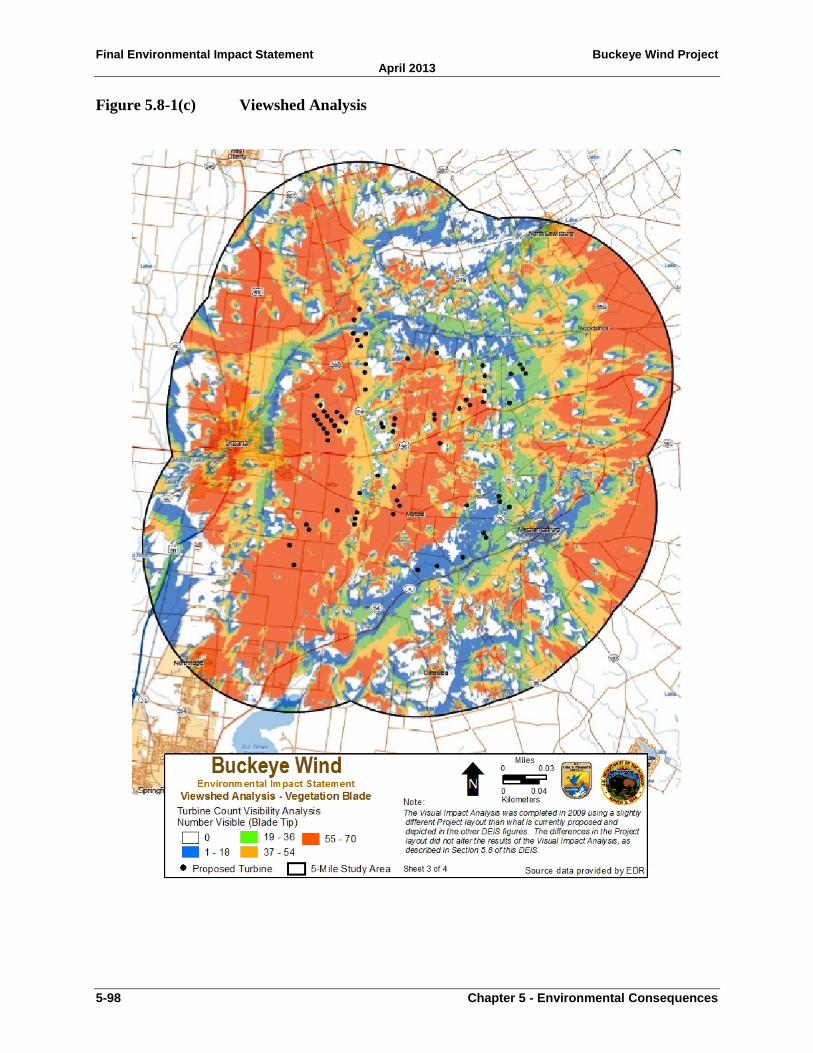
Final Environmental Impact Statement Buckeye Wind Project April 2013
5-98 Chapter 5 - Environmental Consequences
Figure 5.8-1(c) Viewshed Analysis

Final Environmental Impact Statement Buckeye Wind Project April 2013
Chapter 5 - Environmental Consequences 5-99
Figure 5.8-1(d) Viewshed Analysis

Final Environmental Impact Statement Buckeye Wind Project April 2013
5-100 Chapter 5 - Environmental Consequences
Table 5.8-1. Summary of Project Visibility Results Turbine Visibility Analysis Share of VSA Affected
ha (ac) Percent of VSA
Blade Tip - Topography Only Analysis 66,173.8 (163,519) 95.5
Nacelle/Lighting - Topography Only Analysis 64,270.2 (158,815) 92.7
Blade Tip - Topography & Vegetation Analysis 58,619.9 (144,853) 84.6
Nacelle/Lighting – Topography & Vegetation Analysis 56,262.6 (139,028) 81.2
Source: EDR 2009b, as summarized in Stantec 2010b
It is worth noting that the Applicant’s VIA weights all visibility equally – that is, the ability to see the tip of a turbine blade (e.g., the top 3 m [10 ft]) from several miles away is not specifically distinguished from the ability to see an entire turbine from one-half mile away. In reality, many distant/partial views of Project components might be barely perceptible to viewers, or even imperceptible in certain weather conditions. The Applicant’s field verification also suggests that screening provided by vegetation and buildings may be more extensive than indicated by the mapping that served as the basis for the Viewshed Analysis (EDR 2009b). This is particularly true in more developed areas (e.g., the City of Urbana and the various villages in the VSA).
Cross-Section Analysis
“To…illustrate the screening effect of vegetation and structures within the [Action Area and surrounding viewshed], four representative line-of-sight cross sections” were defined in the Action Area and surrounding viewshed. “Cross section locations were chosen so as to include visually sensitive areas…and cover the various landscape similarity zones” (EDR 2009b). Although illustrating representative lines of sight from specific viewpoints/receptors to specific turbines, in effect, the cross-sections act as a representative sampling of all potential viewpoints and sources of screening throughout the VSA.
The cross-section analysis “suggests that views of the Project from many of the visually sensitive sites within the study area are likely to be at least partially screened by buildings and trees” (EDR 2009b, p. 38). In particular, views of turbines would be partially or fully screened from the City of Urbana, the Villages of Mutual and Woodstock, and most historic sites in the Action Area and surrounding viewshed. Because the cross sections are based on representative lines of sight, these conclusions are accurate for a 100-turbine Project as well as a 70-turbine Project. The overall conclusion of the cross section analysis is that screening provided by vegetation and structures not considered in the viewshed analysis are likely to reduce areas of actual Project visibility in comparison the areas of “maximum” potential visibility presented in Table 5.8-1.
Field Verification
Field review conducted as part of the Project VIA essentially confirmed the results of the cross section analysis, and indicated that actual Project visibility was likely to be more limited than suggested by the results of the viewshed analysis. This is due to the fact that screening provided by buildings and trees within the visual study area is more extensive and effective than assumed in these analyses (e.g., vegetation is more extensive than indicated on the USGS maps, and often
Final Environmental Impact Statement Buckeye Wind Project April 2013
Chapter 5 - Environmental Consequences 5-101
taller than 40 feet in height). The result is that certain sites/areas where "potential" visibility was indicated by viewshed mapping were actually well screened from views of the proposed Project. Field review confirmed a lack of visibility from areas that were screened by structures and street/yard trees, particularly developed areas such as the City Urbana and the various villages (including Mechanicsburg, Woodstock, and Catawba) within the visual study area. Consequently, views of the Project from the majority of residences and historic sites within these areas are anticipated to be fully or partially screened. In general, only on the outskirts of these developed areas, where open fields adjoined residential areas, were open views available in the direction of the Project site. Even in the more rural/agricultural portions of the study area, hedgerows and trees not indicated on the USGS maps often blocked/interrupted views toward the Project site in many areas. However, open views that include at least some of the proposed turbines would be available from a broad range of distances/locations within the Rural Residential/Agricultural LSZ (EDR 2009b).
Visual Impact Evaluation
Evaluation of potential Project visibility was supplemented with visual simulations to illustrate the appearance of the Project and the potential change in views available within the VSA. These computer-based simulations inserted images of wind turbines into existing-condition field verification photos at selected locations, taking into account the screening provided by vegetation and buildings. “High-resolution computer-enhanced image processing was used to create realistic photographic simulations of the completed turbines from each of [these] viewpoints” (EDR 2009b, p. 30). Sample pairings of photos showing existing conditions and simulated future conditions are provided in Appendix H.
From the photo documentation conducted during field verification, 13 viewpoints were selected for visual simulations. The purpose of the study was to give a representative perspective of the visual impacts of the project, rather than to simulate the view from all potentially sensitive areas, or all areas in general. Viewpoints were selected based upon the following criteria:
• Provides clear, unobstructed views of the Project (as determined through field verification);
• Illustrates Project visibility from sensitive sites/resources within the Action Area and surrounding viewshed;
• Illustrates typical views from LSZs, where views of the Project would be available;
• Illustrates typical views of the Project that would be available to Potential Viewers (as described above); and
• Illustrates typical views of different numbers of turbines, from a variety of viewer distances, and under different lighting conditions, to illustrate the range of visual change that would occur with the Project in place (EDR 2009b).
The viewpoints selected for simulation are listed in Table 5.8-2. A summary of the evaluation of the visual simulations by a registered landscape architect are described in Table 5.8-3. As with Table 5.8-1, these tables reflect the findings for the 70-turbine array modeled in EDR 2009b. However, it is worth noting that none of the simulations include more than around 30 turbines. This is essentially the maximum number that can be included in a panoramic (60 degree field of
Final Environmental Impact Statement Buckeye Wind Project April 2013
5-102 Chapter 5 - Environmental Consequences
view) photo. The simulations are meant to illustrate representative views of the Project from different distances, directions and landscape settings within the VSA. As such, they represent the appearance of a medium-sized wind power project(50 to 100 turbines), and conclusions regarding visual contrast or compatibility with the existing viewer groups and LSZs within the VSA are valid, regardless of the specific number or location of turbines proposed.
Table 5.8-2. Viewpoints Selected for Visual Impact Simulations
Viewpoint/Visual Resource1 LSZ2 Viewer Group
View Characteristics Distance to
nearest turbine km
(mi)
Azimuth
14 SR 29 RRA Residents, commuters, travelers 0.8 (0.5) NNE 29 SR 296 RRA Residents, commuters, travelers 1.6 (1.0) NE 41 US 36 RRA Residents, commuters, travelers 1.6 (1.0) NE 45 Mutual-Union Rd RRA Residents 1.6 (1.0) NW 48 Stringtown Rd RRA/SR Residents 2.9 (1.8) NNE 52 US 36 RRA/SR Residents, commuters, travelers 2.6 (1.6) WSW 54 Union Cemetery RRA Residents 1.4 (0.9) W 61 SR 814 RRA Residents 1.4 (0.9) NNE 95 Bump Road RRA Residents 7.6 (4.7) SSE 119 SR 54 RRA Residents 1.0 (0.6) NE 123 SR 4 at SR 56 RRA Residents, commuters, travelers 0.8 (0.5) NNE 128 Little Darby Creek Wetlands
Preserve RRA Residents 1.1 (0.7) WSW
131 State Route 559 RRA Residents 5.6 (3.5) WSW 1 Corresponds to the viewpoint number in EDR 2009b. 2 Landscape Suitability Zones: RRA = Rural Residential/Agriculture; SR = Suburban Residential Source: EDR 2009b
Table 5.8-3. Summary of Results of the Photographic Simulations Viewpoint Existing View Description Distance to
Nearest Turbine km (mi)
No. of Visible Turbines
Summary1
14 – SR 29 Foreground: flat, agriculture; Background: structures, forests
0.8 (0.5) 3 Turbines create appreciable contrast
29 – SR 296 Foreground: flat, agriculture, farmhouse; Background: Forests
0.8 (0.5) 2 Turbines contrast moderated by existing man-made elements
41 – US 36 Foreground – roadway, agriculture, power poles; Background: hedgerows, farm buildings, ridgeline
1.6 (1.0) >30 Turbines create visual clutter and dominate view
45 – Mutual Union Rd
Foreground: agriculture; Background: hedgerows, farm buildings
1.6 (1.0) 4 Turbines’ contrast with horizontal lines of landscape is mitigated by vertical elements (trees, buildings)
48 – Stringtown Rd
Foreground: agriculture, house; Background: agriculture, farmhouses, farm buildings, suburban houses, forest patches, hedgerows
2.9 (1.8) 8 Turbines create moderate level of contrast

Final Environmental Impact Statement Buckeye Wind Project April 2013
Chapter 5 - Environmental Consequences 5-103
Viewpoint Existing View Description Distance to Nearest Turbine
km (mi)
No. of Visible Turbines
Summary1
52 – US 36 Foreground: agriculture, Background: agriculture, farmhouses, farm buildings, suburban houses, forest patches
2.6 (1.6) 8 Turbines create minimal to moderate contrast
54 – Mutual Union Rd
Foreground: cemetery, agriculture; Background: agriculture, farm house, farm buildings, forest patches
1.4 (0.9) 5 Turbines’ moderate contrast is mitigated by visual buffers (cemetery, farm, field)
61 – SR 814/County Rd 223
Foreground: agriculture; Background: farmhouse, farm buildings, hedgerows; power poles
1.4 (0.9) 6 Turbines dominate view; significant contrast associated with nearer turbines
95 – Bump Road
Foreground: agriculture, hedgerow, farmhouse, farm buildings; Background: valley, agriculture, ridge with forests, farms, radio towers
7.6 (4.7) >10 Turbines create minor contrast
119- SR 54 Foreground: agriculture; Background: farmhouse, farm buildings, hedgerow, power poles, forest
1.0 (0.6) >10 2 near turbines create moderate contrast and dominate view; far turbines are less distinct
123 – Intersection of SR 4 and SR 56
Foreground: power poles, roadway, grass; Background: hedgerow, forest
0.8 (0.5) 7 1 near turbine creates notable contrast; far turbines are screened
128 – Allison Road
Foreground: old fields, pasture, hedgerow; Background: old fields, pasture, hedgerows, agriculture, ridge with forest
1.1 (0.7) 2 Turbines create moderate contrast
131 – SR 559 Foreground: agriculture; Background: farm buildings, hedgerow, forest patches
5.6 (3.5) >10 Turbines create some degree of clutter but are partially screened
1 Based on interpretations in EDR 2009b. Source: Stantec 2010b
As indicated in the Project VIA (EDR 2009b), the simulations, as a group, indicate that the Project would result in moderate to appreciable visual contrast from open viewpoints within 1.0 mile of the nearest turbine. At greater distances and with more screening, the contrast/impact of the Project should be significantly reduced. However, the contrast and visual impact of the wind turbines is likely to be highly variable based on the number of turbines visible, viewer sensitivity/acceptance, and/or existing land use characteristics. The greatest impact typically occurs when numerous turbines are visible and/or where the turbines are close to the viewer (i.e., less than 1.0 mile). These conditions tend to heighten the Project’s contrast with existing elements of the landscape in terms of, line, form, and especially scale. Visual impact can also be significant where the turbines appear incongruous or out of place in a certain landscape setting, or where aesthetic quality and/or viewer sensitivity are high. However, it is worth noting that the lack of topographic and vegetative visibility in the Rural Residential/Agricultural LSZ, which dominates the study area, generally results in only average aesthetic quality in much of the area surrounding the proposed Project. The VIA also concluded that the Project did not appear inappropriate in a working agricultural landscape. In such settings, the proposed Project, although at times offering appreciable contrast with the landscape, would not necessarily be perceived by most viewers as having an adverse visual impact.

Final Environmental Impact Statement Buckeye Wind Project April 2013
5-104 Chapter 5 - Environmental Consequences
As indicated previously, these conclusions are based on simulations showing portions of the Project (from one to 30+ turbines) from a range of representative distances, directions and landscape settings. Consequently, the VIA’s conclusions regarding a 70-turbine project would also apply to a somewhat smaller (e.g., 52-turbine) or somewhat larger (e.g., 100-turbine) project in the same area.
Other Project Components
In addition to the wind turbines, the Project would include an electrical collection system (i.e., overhead wires and buried cables), an operations and maintenance facility and storage yard, an electrical substation, and turbine access roads. Construction staging areas would not be present during operations. These facilities are shown in Figure 4.8-2.
Buried cables would result in minimal clearing of vegetation and would have no long-term impact on visual resources. A total of no more than 56.7 km (35.2 mi) of interconnection lines would be buried underground.
The overhead portion of the electrical collection system would follow existing public roads, where possible, likely using existing utility corridors. Where overhead transmission lines would be co-located with other lines, the existing poles would be replaced. However, the general size, location, and appearance of these lines would be similar to existing roadside utility lines, which are a common and generally accepted component of the landscape. A total of no more than 56.8 km (35.3 mi) of interconnection lines will be installed overhead in public road right-of-ways. The operations and maintenance facility would likely be an existing structure, or a moderately-sized new structure designed to reflect local building designs. The substation would occupy 2.0 ha (5.0 ac), and would be adjacent to an existing transmission line on agricultural property. Location of this facility adjacent to existing transmission infrastructure would minimize its visual contrast with the existing landscape. Access roads would be 6.1 m (20 ft) wide, paved with gravel, and would follow existing farm roads wherever possible. No more than 64.4 km (40.0 mi) of new access roads will be installed for the 100-turbine project. Following completion of construction these roads would take on the appearance of farm roads which are a common feature of the rural landscape that dominates the VSA.
Summary of Effects from Operations
Factors Influencing Effects from Wind Turbines
Upon completion, the Project’s turbines would be visible from the vast majority of the Action Area and VSA. As evidenced by the potential visibility of a 70-turbine array, potential views of the proposed 100-turbine array would be available in the majority of the VSA – including most visually sensitive resources (particularly residences, schools and churches). However, this finding comes with some caveats. First, the visibility of some turbines might only consist of blade tips viewed above the tree line or between buildings – nuances that could not be modeled by the Applicant. Second, visibility alone does not necessarily determine significance. Rather, significance depends on a comparison of changes to the visual setting (due to the Project) against what might reasonably be expected to be visible. Thus, factors such as the distance from the nearest turbine(s) and the nature of the observer’s LSZ are important.

Final Environmental Impact Statement Buckeye Wind Project April 2013
Chapter 5 - Environmental Consequences 5-105
Individual preference is also a crucial (if not overarching) factor in determining visual impact. Each person may react to the Project differently; while some may see a turbine as an eyesore, others may view the exact same turbine as a sign of economic and social progress. Views toward wind power and the alternative energy industry as a whole may also color an individual’s reaction to alterations in the scenery. For an observer who considers views of turbines to be undesirable, the difference between 12 and 14 visible turbines is substantially less than the difference between zero and one visible turbine. Similarly, two additional turbines in the distance (e.g., beyond 1.6 km [1 mi] from the observer) would be substantially less intrusive than two turbines placed in the foreground (e.g., 0.5 km [0.25 mi] away from the observer). Viewers who favor wind power, or like the appearance of wind turbines, are likely to react positively to the project, regardless of the number of visible turbines or their distance from the viewer.
Effects from Wind Turbines
Based on the considerations described above, the Project would not result in significant adverse impacts for some portions of the VSA. These geographic areas include the following:
• The City – Village LSZ (where only limited portions of the Project would generally be visible among other significant human-made objects).
• Areas more than approximately 6 km (3.5 mi) from the closest turbine.6 Beyond this point, turbines would likely blend into the background, or may have a similar impact within the visual setting as existing utility poles and lines.
• Working agricultural landscapes where the turbines generally appear compatible with existing land use.
Vehicle-based observers (e.g., travelers and commuters) also are unlikely to experience significant adverse impacts regardless of distance. While the agricultural land that makes up the majority of the VSA can be considered scenic, there are no scenic byways or other official indications of scenic quality along roads in the VSA. The length of a driver’s (or passenger’s) exposure to any single close-range view of a turbine would also be limited as compared to the permanent view from a residence.
Those exceptions notwithstanding, the Project would have a significant direct adverse impact on visual resources for some residents within 1.6 km (1 mi) of the nearest turbine and in sensitive locations, such as cemeteries, churches, schools, and sites of historic or cultural significance. A visual impacts analysis for historic structures has been completed, and proposed mitigations submitted to OHPO for review as discussed in Section 5.6, Cultural Resources. Effects on these resources were evaluated on the landscape level, resulting in a finding that construction of the proposed project may adversely affect the perception of the traditional rural historic landscape, changing important qualities of the setting in which many of the character-defining historic property types are located. Significant impacts would specifically occur in such locations whose views of nearby turbines are not screened by vegetation or buildings.
6 This distance is cited in the Applicant’s VIA (EDR 2009b) as distance within which significant effects of wind power projects are generally concentrated (Eyre 1995).

Final Environmental Impact Statement Buckeye Wind Project April 2013
5-106 Chapter 5 - Environmental Consequences
Effects from Other Facilities
Facilities other than turbines – the operations and maintenance facility, substation, access roads, and the electrical collection system – would have no significant direct or indirect impacts on visual resources. The access roads and electrical wires would be in the same general location as existing roads and wires (respectively) and would be similar in character to those existing features. The substation would be within 305 m (1,000 ft) of a few residences (for whom the Project might be more of a visual disturbance). The operations and maintenance facility would have no impact if an existing building were purchased and refurbished. If a new operations and maintenance building were built, it would presumably be located in an area that permits industrial buildings (i.e., through zoning) and would be designed to resemble agricultural buildings (Stantec 2010b).
Decommissioning-related Effects Visual effects associated with decommissioning activities (the dismantling of the turbines and other Project facilities, and the restoration of the natural landscape) would be similar to those caused by construction of the Project except that the total area of disturbed earth would likely be smaller than during construction. These activities could occur as early as 2037. If the Action Area is restored to the pre-Project state, decommissioning would not affect visual resources in the Action Area and surrounding landscape; in fact, removal of the Project would return visual resources to their pre-project state; therefore, decommissioning could potentially positively affect visual resources.
Mitigation Measures for Unavoidable Impacts In addition to the avoidance and minimization measures listed above (relating to turbine color/finish and FAA lighting), the Project would incorporate the following design and operational features to reduce visual impacts:
• All turbines would have uniform design, speed, color, height, and rotor diameter;
• Towers would include no exterior ladders or cat walks;
• Non-specular (i.e., non-reflective) conductor would be used on all overhead electrical lines;
• No advertising devices would be allowed on the turbines;
• The turbines and turbine sites would be maintained to ensure that they are clean, attractive, and operating efficiently;
• Lighting at the proposed substation would be turned on only as needed by switch or motion detector; and
• If the Project goes out of service, and is not repowered/redeveloped, all visible above-ground turbine components would be removed.
In summary, the Proposed Action would have a significant direct adverse visual impact on some residents and visually sensitive resources such as cemeteries, churches, schools, and sites of historic or cultural significance. Viewshed analysis and field verification indicate that the Project has the potential to be visible from the majority of the VSA. In most locations where any turbines would be visible, significant portions of the overall Project are also likely to be visible.

Final Environmental Impact Statement Buckeye Wind Project April 2013
Chapter 5 - Environmental Consequences 5-107
However, field review also indicates that in many areas a significant number of the turbines would be at least partially screened by trees and structures. Viewshed analysis indicates that views of the Project are likely to be available from the majority of the visually sensitive resources and areas of intensive land use that occur within the VSA. However, for many of these sites, including National Register-listed historic sites and others that occur in the City of Urbana and the various villages, field review suggests that the Project would either not be visible or would be significantly screened by foreground vegetation and structures.
Simulations of the proposed Project, indicate that the visibility and visual impact of the wind turbines would be highly variable, based on landscape setting, the extent of natural screening, the presence of other man-made features in the view, and distance of the viewer from the Project. Evaluation of the simulations by a licensed landscape architect indicates that the Project’s overall contrast with the visual/aesthetic character of the area would generally be moderate. Minimal contrast was noted for viewpoints over 3.5 miles from the Project, while more appreciable contrast was noted where foreground and near mid-ground views of turbines (i.e., under 1.0 mile) are available, where substantial numbers of turbines span the field view, and/or where the turbines appear out of context/character with the landscape (i.e., in more suburban residential areas). However, in most cases the reviewing landscape architect felt the Project was compatible with the working agricultural landscape that makes up the majority of the visual study area (EDR 2009b). These conclusions are applicable to a 70-turbine Project as well as incrementally smaller or larger projects (e.g., 59 or 100 turbines). Based on experience with currently operating wind power projects elsewhere, public reaction to the Project is likely to be generally positive, but highly variable based on proximity to the turbines, the affected landscape, and personal attitude of the viewer regarding wind power.
5.8.2.2 Redesign Option The Redesign Option is an optional measure under the Proposed Action that includes a primarily buried collection system. Impacts to visual resources are expected to be similar to those described for the Proposed Action. As under the Redesign Option more of the 34.5-kV interconnects would be buried underground (86.4 km [53.7 mi] with Redesign Option versus 56.6 km [35.2 mi] for the Proposed Action), their direct adverse impact on visual resources may be slightly higher during construction since the total area of disturbed earth would likely be larger than as for the Proposed Action. However, during operation the areas where the underground interconnects were buried would be revegetated, potentially reducing the impact on visual resources for some residents. However, as mentioned previously, overhead lines associated with the Project would look like typical roadside utility lines, which are a common and generally accepted component of the landscape. Thus, additional burial of the electrical lines would have limited mitigation value. All other avoidance and minimization measures would be the same as described above for the Proposed Action.
5.8.3 Alternative A - Maximally Restricted Operations Alternative Alternative A differs from the Proposed Action only with respect to operations. The operational differences would not directly affect visual resources. However, research and anecdotal reports indicate that viewers find wind turbines more appealing when the rotors are turning (Stanton 1996). In general, the construction, operation, and decommissioning-related effects of

Final Environmental Impact Statement Buckeye Wind Project April 2013
5-108 Chapter 5 - Environmental Consequences
Alternative A on visual resources and the recommended minimization measures would be more-or-less the same as under the Proposed Action.
5.8.4 Alternative B - Minimally Restricted Operations Alternative Alternative B differs from the Proposed Action only with respect to operations. The operational differences would not affect visual resources. As such, the construction, operation, and decommissioning-related effects of Alternative B on visual resources and the recommended minimization measures would be the same as under the Proposed Action.
5.8.5 Alternative C - No Action Alternative Under Alternative C, the Project would not be built and no Project-related activities (construction, operation, or decommissioning) would occur. Alternative C would have no effect on visual resources, as land use and visual character in the area would remain largely agricultural. As such, no mitigation measures would be warranted.
5.9 Socioeconomics and Environmental Justice
5.9.1 Impact Criteria Consideration of the effects of the Proposed Action and alternatives on socioeconomic conditions must be considered as part of an overall NEPA analysis. Section 4906-13-07 of the Ohio Administrative Code (OAC) also requires consideration of socioeconomic conditions. In addition, per the requirements of Executive Order 12898 (Federal Actions to Address Environmental Justice in Minority Populations and Low-Income Populations) and Executive Order 13045 (Protection of Children from Environmental Health Risks and Safety Risks), socioeconomic impacts must be assessed for potential disproportionate effects on minority and low-income communities and children, respectively. Socioeconomic impacts are evaluated in the context of the Five-County Analysis Area, which includes the five counties that overlap the Action Area. The Five-County Analysis Area is used in the context of socioeconomics due to Project interaction with and potential impact on broader regional systems spread beyond the boundaries of the Action Area.
5.9.2 Proposed Action This analysis provides a discussion of the Proposed Action’s potential impacts on socioeconomic resources. As part of their OPSB Application, the Applicant commissioned a socioeconomic study for the Project, focusing on three possible scenarios for the Proposed Action, including a Project with a 131.4 MW capacity, a 146 MW capacity, and a 182.5 MW capacity (Saratoga Associates 2009). Because the Proposed Action would have a capacity of up to 250 MW, the analyses in this section extrapolate the impacts described for lower-wattage scenarios as necessary and appropriate to account for the impacts of a 250 MW Project.
As part of its socioeconomic study, the Applicant applied a Regional Input-Output Modeling System (RIMS II) to determine the economic impacts of the Project. RIMS II was developed by the United States Department of Commerce, Bureau of Economic Analysis (USBEA). The RIMS and RIMS II models have been employed by federal and other agencies since the 1970s to

Final Environmental Impact Statement Buckeye Wind Project April 2013
Chapter 5 - Environmental Consequences 5-109
estimate regional multipliers for impact analysis in output, earnings, and employment associated with a program or project under study.
The following terms are used for this economic impact analysis:
• Output: This refers to the sales receipts for the Project. During each phase of construction, output refers to the total cost for the construction of the Project. For the operations phase, output refers to the annual gross revenues derived from the operation of the Project.
• Earnings: During the construction phase, earnings refer to wages paid to construction workers. During the operations phase, wages come from two sources: from wages paid to wind farm employees and from leases paid to landowners.
• Employment: This refers to the number of short-term jobs created during the construction phase, as well as the number of permanent employees at the Project during operation.
• Multipliers: The use of regional economic multipliers is a standard method for identifying the potential effects of a major change in a region’s economy, such as the Project. These measures estimate the changes in output, income, and employment resulting from an initial change in spending, specific to the region under study (Coughlin and Mandelbaum 1991 as cited in Saratoga 2009).
RIMS II multipliers were used to determine economic impacts during both the construction phase and the operations phase of the Project as a whole. Construction generally creates a one-time surge in economic activity, while the operation and maintenance phase provides an on-going economic contribution by creating long-term jobs, continuing income streams for landowners, and revenues for municipalities.
5.9.2.1 Avoidance and Minimization Measures The Proposed Action contains the following measures that would avoid or minimize adverse impacts to socioeconomics.
• Land Use: Restore site per NPDES which would make permanent land use impacts minimal
• Property Values: Make land lease payments to participating landowners to offset any possible downward pressure on property values.
• Jobs and Income. The Applicant would commit to use local/regional labor, goods, and services when practicable. The Project would comply with Ohio Senate Bill (SB) 232, which reduces tax rates for renewable and advanced energy generators utilizing technologies such as wind, solar, co-generation and clean coal.
• Health and Safety. Implement construction and operation best management practices to minimize health or safety risks.
Indirect negative impacts to socioeconomic conditions are anticipated as a result of the construction and operation of the Project, such as visual impacts, noise, dust, and health and safety concerns. Avoidance and minimization measures for these impacts are addressed in their respective sections in this EIS.

Final Environmental Impact Statement Buckeye Wind Project April 2013
5-110 Chapter 5 - Environmental Consequences
Construction-related Effects It is not expected that the Project would have significant negative socioeconomic impacts during the construction phase. The Project seeks to avoid or minimize adverse socioeconomic impacts by having an overall positive effect on local economic development. The creation of temporary and permanent jobs in the local economy, net gains in revenue to local governments, and land lease payments to participating land owners would have a positive economic impact on both residents and local government agencies. It is possible that a decrease in property values would occur, but could be partially offset by properties receiving land lease payments and tax revenue generated by the project. Construction activities would create a temporary increase in traffic volume and require some traffic diversions, and may cause additional noise and dust. However, these occurrences would be minimized by best management practices, and would likely have little effect on the socioeconomic activities of residents and visitors. Overall, the positive impacts of the Project including creation of new jobs during the construction phase of the project, and projected increases in direct, indirect, and induced total local benefits, would offset the temporary negative impacts of the Project.
Socioeconomic Effects
The socioeconomic impacts associated with construction are typically felt in the short-term. During the construction phase, opportunities for employment would offer both direct and indirect benefits for local and regional residents.
The Project is not expected to have negative, direct economic impacts during construction. However, short-term indirect impacts would be felt by individual landowners who may not be able to access or use portions of their land during construction. A 200-ft radius per turbine would be cleared and graded in preparation for equipment delivery, foundation construction, and assembly of each turbine (see Appendix B, Section 2.2). Once constructed, much of this cleared land would be available for use by the landowner; the loss of use would consist of the footprint of the wind turbines or other associated facilities, but only for the life of the project. The loss of use would be compensated through the lease agreement and payments.
Other short term, negative, indirect impacts may include diversions of traffic (see Section 5.12) and added noise (Section 5.10) and dust (Section 5.11). These occurrences may be seen as temporary inconveniences to residences or visitors. Construction activity may discourage some consumers from purchasing goods and services in the communities, but the extent of this occurrence likely is negligible.
Construction of the Project would also have positive direct and indirect economic effects. Construction of the Project would generate a number of full time construction jobs over the one or two 12 to 18 month construction phases, as well as many more indirect full-time jobs. Table 5.9-1 summarizes the projected number of jobs created by construction of the Project. Construction crews would also likely patronize local businesses during construction, stimulating additional short-term economic activity.

Final Environmental Impact Statement Buckeye Wind Project April 2013
Chapter 5 - Environmental Consequences 5-111
Table 5.9-1 Direct and Indirect Construction Employment for the Proposed Action Category Jobs Created Full Time Direct Construction Jobs1 249
Jobs Multiplier 11.8647
Full Time Indirect Jobs 2,954
Total Jobs 3,203 1 Calculations made by Saratoga Associates (2009) based on 12 wind facilities throughout Colorado, Minnesota, New York, Ohio, Oklahoma, Oregon, and Texas indicated that each MW of wind energy demanded 0.9968 construction workers (“Full Time Direct Construction Jobs”). Source: Saratoga Associates 2009 US BEA (RIMS II multiplier)
The direct construction jobs would create a spin-off of additional employment in other sectors of the economy. These estimated calculations for the additional employment were based on a multiplier of 11.8647 jobs (per the RIMS II model) for every construction job in the Five-County Analysis Area, as for Champaign, Clark, Logan, Madison, and Union Counties (Saratoga Associates 2009). This multiplier is comparable to those used for other projects, including the Dutch Hill Wind Farm in Cohocton, NY (Saratoga Associates, 2006).
Estimating the portion of employment that would be drawn from the local labor markets may be difficult. Local construction employment would primarily include equipment operators, truck drivers, laborers, and electricians. The balance of construction employment would include workers with necessarily special skills (such as specialized turbine engineers or mechanics) imported from outside the region for the duration of construction (Saratoga Associates 2009).
In addition to employment, the Project would provide a direct investment into the communities in the Five-County Analysis Area (and potentially beyond) through expenditures for business services, labor, and materials. The original construction investment also would generate an indirect and induced output. The RIMS II model assigns a multiplier of 1.5331 for every dollar in construction investment in the Five-County Analysis Area (Saratoga Associates 2009). Table 5.9-2 summarizes the direct and indirect investments that would be accrued during construction of the Proposed Action.
Table 5.9-2 Direct and Indirect Impacts on Investment for Construction of the Proposed Action Investment Category Dollars invested (millions) Direct Construction Investment $592.500
Construction Investment Multiplier 1.5331
Indirect and Induced Output $908.362
Total Investment $1,500.862
Source: Saratoga Associates 2009 US BEA (RIMS II multiplier)
As expected, additional household earnings also would be generated due to the employment of construction workers over an 18-month period. These earnings also would generate an economic spin-off contributing to the total economic impact of Project construction. RIMS II assigns a multiplier of 0.4049 for every dollar of wages earned in the construction industry in the Five-County Analysis Area (Saratoga Associates 2009). Table 5.9-3 summarizes these earnings for construction of the Proposed Action.

Final Environmental Impact Statement Buckeye Wind Project April 2013
5-112 Chapter 5 - Environmental Consequences
Table 5.9-3 Direct and Indirect Impacts on Household Earnings for Construction of the Proposed Action
Category Household Earnings (millions) Direct Household Earnings from Construction Jobs $13.750
Earnings Multiplier 0.4049
Indirect Household Earnings $5.564
Total Economic Impact $19.317
Source: Saratoga Associates 2009 US BEA (RIMS II multiplier)
Alternative Tax Payments
The construction of the Project is anticipated to generate Alternative Tax revenues to all taxing jurisdictions that host the Project. These payments are addressed in the discussion of operations-related effects.
Property Values
The construction of the Project would not directly impact residential or commercial property values. However, these activities may indirectly affect the perceived value of these properties. Such indirect effects during construction are similar to those that might be experienced during Project operation, and are addressed in the discussion of operations-related effects.
Regional Effects
General population and housing trends in the vicinity of the Project are provided in Section 4.9 (affected environment for socioeconomics). As described above, approximately 249 short-term, full-time construction jobs would be created during Project construction. Local employees (e.g., those in the Five-County Analysis Area) would be hired to the extent possible, and hiring of non-resident workers would occur only when local residents with the required skills were not available or competitive (EDR 2009a). Most full-time construction employees likely would commute to the work site on a daily basis. Indirect employment (per Table 5.9-1) would likely be drawn from the existing labor pool in the Five-County Analysis Area, and could come in the form of jobs in construction supply, retail, food service, and related industries.
Such levels of employment are unlikely to affect the overall population of the host townships, and would not create an additional demand for housing. As shown in Table 4.9-3, housing vacancy rates in the host townships and the Five-County Analysis Area are comparable to statewide vacancy rates, albeit with some variation. Workers who do not already live within commuting distance could either buy or rent available residences, or in limited cases might choose to stay in regional transient housing or motels (EDR 2009a).
Since the Project is not expected to have significant growth-inducing effects on the surrounding locales, no significant impacts on local public services and facilities are expected. The construction of the Project would not likely bring families that might require family healthcare or additional school facilities. The principal impact on public services in the Action Area would be increases in traffic on routes leading to the site due to deliveries of equipment and materials during construction (see Section 5.12).
Final Environmental Impact Statement Buckeye Wind Project April 2013
Chapter 5 - Environmental Consequences 5-113
Environmental Justice
As previously discussed, Executive Order 12898 requires federal agencies to address potential environmental justice impacts to minority and low income populations. Because any construction impacts would be short-term in nature, the environmental justice analysis of the Proposed Action is included in the discussion of operation and maintenance-related effects.
Operation and Maintenance-related Effects
Socioeconomic effects
Socioeconomic effects of the Proposed Action would likely impact the long-term resources of the local and regional communities. For example, the long-term opportunities for increased income through the lease of land necessary to accommodate the Project would offer both direct and indirect benefits to participating landowners, as well as to the host townships.
This Project is not expected to have direct negative economic impacts during operation. Similar to the construction phase, some short-term indirect impacts may be felt by individual landowners who cannot access or fully use portions of their land during the initial years of operation, while the land is being re-vegetated and/or returned to its original conditions. These impacts would be temporary, and would involve only the 200-ft radius per turbine cleared for construction. Permanent loss of use would be limited to the footprint of each wind turbine or other associated facilities. Agricultural activities, for example, could continue up to the turbine footprint and the edge of access roads (EverPower n.d.). As previously discussed, the loss of use would be compensated through lease agreements and payments.
Once in operation, the Facility is expected to help meet the State of Ohio’s goal for creating renewable energy sources. Therefore, during operation, increasing electrical capacity and reliability would be an economic benefit to the surrounding communities. Furthermore, additional jobs and revenues (e.g., through leases and tax revenue) would be created by the Facility, benefitting the host townships and communities in the Five-County Analysis Area.
The Proposed Action is expected to create approximately 12 full-time jobs.7 These jobs include the following (Saratoga Associates 2009):
• One Operations Manager/Supervisor;
• Eight Operations and Maintenance technicians;
• One parts/logistics person; and
• Two customer service representatives.
7 The Applicant’s socioeconomic study (Saratoga Associates 2009) also calculated the creation of 12 permanent jobs for wind farms with three lower capacities. Given the economies of scale associated with operating large wind farm arrays, it is assumed that a 250 MW facility would not require more personnel than, say, a 131.4 MW facility (the lowest-capacity facility evaluated by the Applicant).
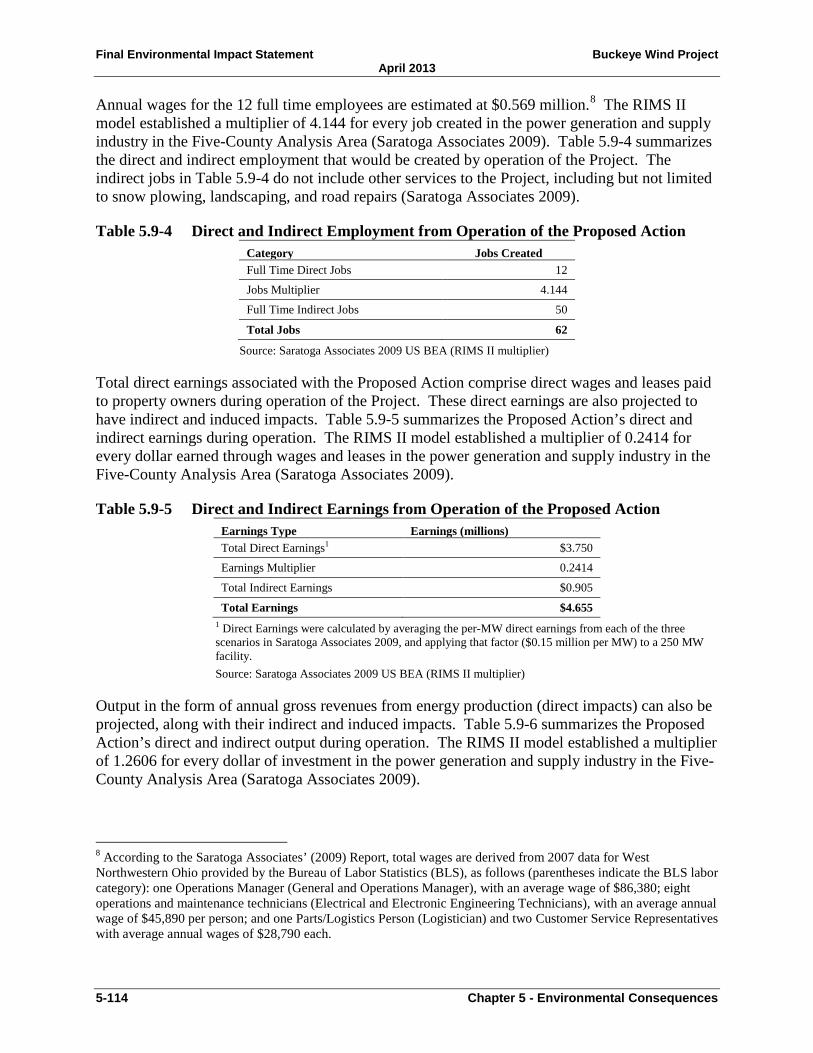
Final Environmental Impact Statement Buckeye Wind Project April 2013
5-114 Chapter 5 - Environmental Consequences
Annual wages for the 12 full time employees are estimated at $0.569 million.8 The RIMS II model established a multiplier of 4.144 for every job created in the power generation and supply industry in the Five-County Analysis Area (Saratoga Associates 2009). Table 5.9-4 summarizes the direct and indirect employment that would be created by operation of the Project. The indirect jobs in Table 5.9-4 do not include other services to the Project, including but not limited to snow plowing, landscaping, and road repairs (Saratoga Associates 2009).
Table 5.9-4 Direct and Indirect Employment from Operation of the Proposed Action Category Jobs Created Full Time Direct Jobs 12
Jobs Multiplier 4.144
Full Time Indirect Jobs 50
Total Jobs 62
Source: Saratoga Associates 2009 US BEA (RIMS II multiplier)
Total direct earnings associated with the Proposed Action comprise direct wages and leases paid to property owners during operation of the Project. These direct earnings are also projected to have indirect and induced impacts. Table 5.9-5 summarizes the Proposed Action’s direct and indirect earnings during operation. The RIMS II model established a multiplier of 0.2414 for every dollar earned through wages and leases in the power generation and supply industry in the Five-County Analysis Area (Saratoga Associates 2009).
Table 5.9-5 Direct and Indirect Earnings from Operation of the Proposed Action Earnings Type Earnings (millions) Total Direct Earnings1 $3.750
Earnings Multiplier 0.2414
Total Indirect Earnings $0.905
Total Earnings $4.655 1 Direct Earnings were calculated by averaging the per-MW direct earnings from each of the three scenarios in Saratoga Associates 2009, and applying that factor ($0.15 million per MW) to a 250 MW facility. Source: Saratoga Associates 2009 US BEA (RIMS II multiplier)
Output in the form of annual gross revenues from energy production (direct impacts) can also be projected, along with their indirect and induced impacts. Table 5.9-6 summarizes the Proposed Action’s direct and indirect output during operation. The RIMS II model established a multiplier of 1.2606 for every dollar of investment in the power generation and supply industry in the Five-County Analysis Area (Saratoga Associates 2009).
8 According to the Saratoga Associates’ (2009) Report, total wages are derived from 2007 data for West Northwestern Ohio provided by the Bureau of Labor Statistics (BLS), as follows (parentheses indicate the BLS labor category): one Operations Manager (General and Operations Manager), with an average wage of $86,380; eight operations and maintenance technicians (Electrical and Electronic Engineering Technicians), with an average annual wage of $45,890 per person; and one Parts/Logistics Person (Logistician) and two Customer Service Representatives with average annual wages of $28,790 each.

Final Environmental Impact Statement Buckeye Wind Project April 2013
Chapter 5 - Environmental Consequences 5-115
Table 5.9-6 Direct and Indirect Output from Operation of the Proposed Action Revenue Type Revenue (millions) Direct Gross Revenue1 $56.175
Indirect and Induced Impacts on Gross Revenue $70.814
Multiplier 1.2606
Total Economic Impact $126.989 1 Gross Revenues were calculated by averaging the per-MW gross revenue from each of the three scenarios in Saratoga Associates 2009, and applying that factor ($0.2247 million per MW) to a 250 MW facility. Source: Saratoga Associates 2009 US BEA (RIMS II multiplier)
Alternative Tax Revenues
The State of Ohio recently established a $7,000 flat tax rate per MW generated at wind power facilities in order to incentivize wind power development in the state and make Ohio’s tax structure more comparable with other nearby states.9 For a 250 MW facility, these tax revenues would total $1.75 million per year.10
These revenues would be distributed to all taxing jurisdictions that host the Project, including the townships of Goshen, Rush, Salem, Union, and Wayne in Champaign County, as well as the Urbana City School District, the Mechanicsburg Exempted Village School District, the Triad Local School District, and the West Liberty-Salem Local School District. These revenues would be distributed based on the prevailing composition of each township’s tax base (Saratoga Associates 2009).
In addition, purchases of goods and services associated with the construction and operation of the Proposed Action would generate direct sales taxes for Champaign County and other jurisdictions where such purchases are made. Expenditures by Project employees and landowners who receive payments related to the Project could also be an indirect source of sales tax revenue. As of March 2012, the Ohio statewide sales tax is 5.5 percent. Local sales tax in Champaign, Clark, and Logan counties is an additional 1.5 percent; local sales tax in Madison and Union counties is an additional 1.25 percent.
Property Values
The construction and operation of the Project would not directly impact residential or commercial property values. Based on the information summarized in Appendix I, the presence of wind turbines alone is not consistently associated with a reduction in residential property value. Other factors and considerations, such as property type and condition, existing amenities, and distance to and size of wind turbines also affect a buyer’s evaluation of property.
Those findings notwithstanding, the perceived and/or real market value of a property may decrease in response to one of the following indirect effects:
• The perceived potential health and safety impacts of the wind turbines;
9 The $7,000/MWh rate is the standard rate codified in state law, but actual rates could vary from $6,000-$9,000/MWh depending on the number of workers domiciled in the state and the rate the county is able to negotiate. 10 Source: Cartledge, 2010; Office of the State of Ohio Auditor and Buckeye Wind as cited in Saratoga Associates 2009; and Sub. S.B. 232, 2010.

Final Environmental Impact Statement Buckeye Wind Project April 2013
5-116 Chapter 5 - Environmental Consequences
• The perceived visual “unattractiveness” of the wind turbine; and
• Perceived reduction in quality of environment (i.e., changes to land use and/or character of the geographic settings).
Available studies show substantial variation in the rate of property value decrease in response to the above effects, making quantification of these impacts impossible. Moreover, amenities and factors must be considered when predicting changes in property values. Overall fluctuation in the housing market is one important consideration. Furthermore, predicting how people perceive property is difficult. For example, individuals who perceived wind energy as a clean source of power often perceived little or no decline in property value due to the presence of wind turbines compared to those who did not. Likewise, individuals who were more likely to participate in a “green” energy program were more willing to allow electrical generation windmills in their viewshed (Groothuis, Groothuis, and Whitehead 2007).
Conversely, the perceived and/or real market value of property could increase if:
• Potential lease payments increase the value of land used for the Project;
• Increased local electrical reliability enhances opportunities for development of residential or commercial interests; or
• The quality and quantity of public services (including education) was increased due to increased tax revenues generated by the Project.
The reliability of the power grid in Ohio is generally good, so the Project would not be expected to cause a significant increase in value based on power reliability. However, a general increase in property values may result from the lease payments. This increase would likely depend on the conditions of the lease, especially if a sale is made prior to the decommissioning of the Project.
Health and safety, visual, land use, and development factors can also affect residential property values, as discussed below.
Health and Safety
As discussed in Section 5.14, health and safety impacts associated with the Project are expected to be minimal. However, the perception of possible health effects can influence property buyers, potentially reducing the pool of potential buyers for properties near wind turbines (as compared to an equivalent property located elsewhere).
Visual
Aesthetic consideration is just one factor affecting the perceived and/or real market value of a property. As discussed in Section 5.8, the view of wind turbines can have a negative impact on the overall quality and feel of a community, although this point of view is highly dependent upon the feelings of the individual viewer. People who feel that wind turbines are incompatible with their desired viewshed may not be willing to purchase a property in the vicinity of a wind farm. Therefore, the pool of potential buyers could be smaller for a property with a view of wind turbines. Conclusions from studies cited in Appendix H and above suggest that impacts on property values from the Project could vary throughout the viewshed.

Final Environmental Impact Statement Buckeye Wind Project April 2013
Chapter 5 - Environmental Consequences 5-117
Land Use
As stated in Section 5.7, overall land use categorization would not be impacted by the construction or operation of the Project. A small percentage of agricultural land would be unavailable for use during the 25 year life of the project.
Development Opportunities
A reliable source of renewable energy could be an incentive to promote future development within the region and could therefore indirectly increase property values. As previously noted, electricity generated by the Project has the potential to displace electricity generated by fossil fuels, removing inefficient and environmentally harmful sources of power. However, also as noted, the reliability of the power grid in Ohio is generally good.
Regional Effects
General population and housing trends are discussed in Section 4.9. Only 12 permanent employees would be needed for the operation of the Project, with perhaps another 50 indirect jobs created by the Proposed Action. Even if all of these jobs were filled by employees not currently living or working in the Five-County Analysis Area, this additional employment would have negligible impacts on the population, housing supply, and demand for public services and facilities in the host townships and other jurisdictions in the Five-County Analysis Area.
Environmental Justice
This section describes the potential environmental justice effects of the Project, in accordance with Executive Order 12898. For this analysis, a disproportionately high and adverse effect on minority and low income populations means an adverse effect that “1.) is predominately borne by a minority population and/or a low income population, or 2.) would be suffered by the minority population and/or a low income population, and is appreciably more severe or greater in magnitude than the adverse effect that would be suffered by the non-minority population and/or a non-low income population” (USDOT 1997, p 18,377). In particular, disproportionate impacts typically occur when the following criteria are met:
• The minority or low-income population of the impacted geographic area exceeds 50 percent overall; and/or
• The minority or low-income population percentage of the environmental impact area is significantly greater (typically at least 20 percentage points) than the low-income or minority population percentage in the geographic area chosen for comparative analysis (in this case, the State of Ohio).
To determine if these criteria have been met, data from the host townships are compared to data for the state as a whole. Data for other geographic areas is provided only for additional information.
Table 5.9-7 shows the percentage of the population that is a minority (e.g., nonwhite), or that is categorized as being below the poverty level for each of the geographic areas evaluated in this EIS. None of the areas exceed 50 percent with regard to minority or poverty. Champaign County and the Counties in the Five-County Analysis Area have a smaller proportion of minority populations than the State of Ohio as a whole. The host townships’ share of population below

Final Environmental Impact Statement Buckeye Wind Project April 2013
5-118 Chapter 5 - Environmental Consequences
the poverty level is higher than the State of Ohio’s, but the difference is de-minimis (0.1 percent).
Based on the information provided in Table 5.9-7, no disproportionately minority or low income population is located within any of the relevant geographic areas. Therefore, the Project would not place an undue burden on these populations.
Table 5.9-7 Minority and Poverty Populations in the Geographic Area of the Project Minority
Population Percentage
Percentage of Population Below
Poverty Level Host Townships 6.6 14.3
Champaign County 5.3 11.5
Counties in the Five-County Analysis Area 9.7 13.7
State of Ohio 17.3 14.2
Source: US Census Bureau: Census 2010; American Community Survey 2010
Aesthetics and Quality of Life
Residents primarily would be affected by temporary and permanent aesthetic changes due to the Project. The introduction of wind turbines may be perceived by some people as an intrusion in the rural environment. While individuals would have different visual and aesthetic experiences, taken as a whole, all residents and visitors in the region would be affected by the Project in a similar manner. Thus the construction and operation of the wind turbines would not result in a disproportionate adverse impact to minority and low income populations.
Inconveniences related to access and mobility may occur along the properties where construction would take place. In addition, dust and noise would be present, along with visual intrusions as a result of construction activities and equipment. These impacts would be felt most by individual landowners who are participating in the lease program and adjacent landowners. Such effects would be temporary and would last only as long as construction of the components in question.
Economic and Employment Effects
The activities associated with the Project are not expected to result in an economic hardship—such as an increase in taxes—that would be disproportionate to minority or low income populations. If approved, the Project could instead increase the amount of tax revenue available to the host townships. As described above, the Proposed Action could also provide increased direct and indirect employment opportunities.
Health and Safety
Health and safety impacts associated with wind turbines are described in Section 5.14, and can include, but are not limited to, ice shedding, blade throw, and shadow flicker. The Project incorporates setbacks to ensure that safety standards are met. Shadow flicker would need to be addressed on a case-by-case basis. The Proposed Action is not expected to produce adverse health and safety impacts to the local population in general, nor to minority or low income populations or children in particular.

Final Environmental Impact Statement Buckeye Wind Project April 2013
Chapter 5 - Environmental Consequences 5-119
Decommissioning-related Effects During decommissioning, turbines and other Project structures would be dismantled, and the landscape would be returned to its pre-Project state. Any socioeconomic impacts from (and impacts due to) decommissioning (including employment-related positive impacts) would be short-term and comparable to the impacts that might be expected during the construction phase.
Additional negative impacts would include the loss of lease payments and tax revenue. These sources of revenues are anticipated for the life of the Project. Once removed, landowners would be able to continue agricultural activities or other appropriate uses while tax revenues would decrease. To the extent possible, conditions would return to a similar state as before construction of the Project, although some workers associated with decommissioning may choose to remain in local communities.
Mitigation Measures for Unavoidable Impacts The Proposed Action contains no specific mitigation measures in addition to the avoidance and minimization measures listed above.
In summary, the Proposed Action would have a combination of positive and negative socioeconomic effects. The Project would likely cause depreciation in some property values, particularly where turbines could be regarded as eyesores or are unwelcome by owners or prospective buyers. Possible downward pressure on some home prices would be at least partially offset by increases in values from properties receiving lease payments or increased desirability to prospective buyers that support wind power, although these two phenomena would not necessarily affect the same properties, and thus would not offset each other in all cases. Tax revenue generated by the project would increase services in the area and possibly increase property values. There would be short-term increases in the demand for workers during construction and decommissioning, but the long term effect on the job market is expected to be negligible (albeit positive). None of these impacts are expected to be significant because they would be at least partially offset or would affect a small part of the overall population in the Action Area.
The Project is not expected to have a disproportionate effect on disadvantaged populations. Accordingly, it would not have a significant impact on environmental justice.
5.9.2.2 Redesign Option The Redesign Option is an optional measure under the Proposed Action that includes a primarily buried collection system, which would cause more ground disturbance but decrease the number of overhead lines as compared with the Proposed Action. Impacts to socioeconomic conditions or environmental justice issues are expected to be the same as those described for the Proposed Action. The avoidance and minimization measures would be the same as described above for the Proposed Action.
5.9.3 Alternative A – Maximally Restricted Operations Alternative Alternative A differs from the Proposed Action only with respect to operations. Operations would be restricted from sunset to sunrise between April 1 and October 31, and would therefore produce less energy and generate less revenue than the Proposed Action. The lower energy

Final Environmental Impact Statement Buckeye Wind Project April 2013
5-120 Chapter 5 - Environmental Consequences
production and revenue generated under Alternative A would not significantly alter the effects on socioeconomic conditions and environmental justice described for the Proposed Action. As such the construction, operation, and decommissioning effects of Alternative A on socioeconomic conditions and environmental justice issues would be the same as the Proposed Action.
5.9.4 Alternative B – Minimally Restricted Operations Alternative Alternative B differs from the Proposed Action only with respect to operations. Operations would be restricted less than the Proposed Action, and therefore energy production would be slightly greater than the proposed action, increasing the amount of energy generated and therefore the amount of revenue produced. The slightly higher energy production and revenue generated under Alternative A would not significantly alter the effects on socioeconomic conditions and environmental justice described for the Proposed Action. As such the construction, operation, and decommissioning effects of Alternative A on socioeconomic conditions and environmental justice issues would be the same as the Proposed Action.
5.9.5 Alternative C – No Action Alternative Under Alternative C, the Project would not be built and no Project-related activities (construction, operation, or decommissioning) would occur. Therefore, no effects on socioeconomic resources and environmental justice concerns would occur and conditions would remain the same as described in Section 4.9. Alternative C would not achieve the socioeconomic benefits associated with the Proposed Action or Alternatives A and B, including generation of income from construction jobs, generation of tax revenues for municipalities and school districts, and generation of lease revenues for landowners.
5.10 Noise
5.10.1 Impact Criteria No existing national, state, or local laws specifically limit noise levels from wind power facilities. In the absence of any specific or absolute regulatory noise level limits, this EIS evaluates the potential effects of noise from the Project in terms of its likely audibility or perceptibility at residences (where people are most likely to spend most of their time) relative to the background sound level. This approach is commonly used in siting analyses for various types of new infrastructure projects.
A new broadband noise source without any distinctive character (such as tonality or impulsiveness) generally must have a sound level that is about 5 dBA higher than the background before it begins to be perceptible to most people. However, for wind turbines, the threshold of perception is somewhat lower. This is because the sound sometimes has a mildly periodic quality associated with blade “swish” that makes it more readily perceptible than a steady, bland sound of the same magnitude. Depending on the speed of the turbine rotation, the sound level rises and falls slightly in about one second intervals: the down-coming blade briefly generates aerodynamic noise, which is followed by a very short pause until the next blade comes around. This phenomenon, referred to as amplitude modulation, makes noise from wind turbines more readily perceptible than other sounds of comparable magnitude.

Final Environmental Impact Statement Buckeye Wind Project April 2013
Chapter 5 - Environmental Consequences 5-121
This assessment sets the nominal noise impact threshold at 5 dBA above the prevailing day and night background levels (Leq) for non-participating residences. The nominal impact threshold at 5 dBA above prevailing background also is considered appropriate for application to existing permanent residences where people are found most of the time. This threshold represents the minimum change in sound level discernable by the average person. On one hand, the allowable sound level must not be so low and restrictive that, for all practical purposes, no viable wind power projects can be built. On the other hand, the Project’s sound level must not be so loud that it leads to legitimate disturbance at a large number of homes. Setting a nominal threshold of 5 dBA above the prevailing background level for non-participating residences represents a reasonable design target that strikes a sensible balance between the interests of all parties and is consistent with other guidelines used for siting wind energy projects (NYSDEC 2001). OPSB does not have any specific thresholds for noise.
Since residences that would host a portion of the Project or have a lease, easement or other agreement with the Applicant are willing and voluntary participants in the Project, it is also appropriate to consider this threshold only at only at non-participating residences (residences that do not have a lease, easement, waiver or other agreement with the Applicant). Noise at participating residences may be higher than 5 dBA above background noise levels.
Some states in the U.S have absolute noise limits ranging from 50 to 55 dBA at residential property lines, which in the case of the Project is more than 5 dBA over background noise levels (described in detail in the Noise Modeling Methodology section below). For example, the States of New Jersey and Colorado have absolute nighttime maximum emission limits of 50 dBA at residential receptors regardless of the acoustic environment in those areas (i.e., whether quiet rural or noisy urban). Similarly, the State of Maryland, Washington D.C., and Delaware have absolute nighttime maximum emission limits of 55 dBA at residential receptors. Most of these states allow higher limits for daytime hours. The Applicant would adopt a 50 dBA limit as an additional design target for operational sound levels at the nearest boundaries between participating and non-participating properties (Hessler 2009), but there are a few places where sound levels may exceed 50 dBA for a short distance into a neighboring non-participating property (Stantec 2010b).
5.10.2 Proposed Action
5.10.2.1 Avoidance and Minimization Measures Over the last decade, the wind industry has invested heavily in reducing turbine noise through improvements in turbine technology, engineering, and insulation. According to a 2006 report prepared by the Renewable Energy Research Laboratory, sound levels emitted by wind turbines have decreased as technology has advanced. Improvements in blade airfoil efficiency have resulted in more wind energy being converted into rotational energy and less into acoustic energy. Vibration dampening and improved mechanical design have also significantly reduced noise from mechanical sources.
Furthermore, aerodynamic sound generation is very sensitive to speed at the blade tips. Modern variable speed wind turbines, like those proposed for the Project, rotate at slower speeds in low winds, and increase as wind speeds increase. This results in quieter operation in low winds when compared to older, constant speed wind turbines (Rogers et al. 2006). These findings are
Final Environmental Impact Statement Buckeye Wind Project April 2013
5-122 Chapter 5 - Environmental Consequences
consistent with a recent USDOE report (USDOE 2008), which concluded “advances in engineering and insulation ensure that modern turbines are relatively quiet; concerns about sound are primarily associated with older technology, such as the turbines built in the 1980s, which were considerably louder.”
In addition to general improvements in wind turbine technology, significant site-specific impact avoidance and minimization efforts have occurred during the design phase for the Project. To reduce the potential for adverse noise impacts, many turbines were moved further away from non-participating residences or completely removed from the Project.
The Proposed Action contains the following avoidance and minimization measures that would further avoid or minimize noise impacts.
• Siting turbines such that an operational noise impact threshold of 5 dBA above the prevailing day and night background levels (Leq) for non-participating residences is not exceeded;
• Implementing best management practices for sound abatement during construction, including use of appropriate mufflers, proper vehicle maintenance, and limiting hours of construction to normal daytime working hours, unless there is a compelling reason to work beyond those hours;
• Notifying landowners of certain construction sound impacts in advance, such as if blasting becomes necessary (however, blasting is unlikely to occur); and
• Implementing a reasonable complaint resolution procedure to assure that any complaints regarding construction or operational sound are adequately investigated and resolved.
Construction-related Effects Project construction would consist of the following principal activities:
• Access road construction and electrical interconnect line trenching;
• Site preparation and foundation installation at each turbine site;
• Material and subassembly delivery; and
• Turbine erection. Each of these principal activities would generate noise. Under the Proposed Action, noise from construction activities would likely be audible at some of the homes located within the Action Area. Assessing and quantifying these impacts is difficult, because construction activities would occur at various locations around the Action Area, leading to highly variable impacts at any given point.
Noise emissions would vary with each phase of construction depending on the construction activity, operating load, length of time the equipment is in use, and the amount of equipment used simultaneously for each phase. Noise levels from the construction activities would be intermittent, as equipment would be operated on an as-needed basis, mostly during daylight hours. In general, the maximum potential noise impact at any single residence might be
Final Environmental Impact Statement Buckeye Wind Project April 2013
Chapter 5 - Environmental Consequences 5-123
analogous to a few days to a few weeks of repair or repaving work occurring on a nearby road or to the sound of machinery operating on a nearby farm. Typically, at houses that are some distance away, the sounds from Project construction are likely to be faintly perceived. Such sounds include diesel-powered, earthmoving equipment characterized by irregular engine revs, back-up alarms, gravel dumping, and the clanking of metal tracks (Hessler 2009). It is not anticipated that any blasting would be required.
Table 5.10-1 summarizes the types of equipment likely to be used for each construction phase and the typical noise levels generated by the equipment. Typical noise levels are as reported in Bolt et al. (1977). It should be noted that conservative values from a somewhat antiquated 1977 reference have been deliberately used for the equipment to illustrate the worst-case scenario. More recent measurements of modern construction equipment generally indicate significantly lower sound levels.
Table 5.10-1 also shows the maximum total sound levels that might temporarily occur at a typical minimum setback distance of 305 m (1,000 ft; minimum distance between home and turbine), and the distance at which construction sound levels are likely to become inconsequential (at a level of about 35 dBA). A value of 35 dBA is used here because construction noise has no dependency on wind speed and is likely to occur during times of inactivity when background sound levels are minimal. A sound level of 35 dBA during the day (when construction activities would occur) is generally considered a negligible sound level, even in the near absence of any natural environmental background sound (Hessler 2009).
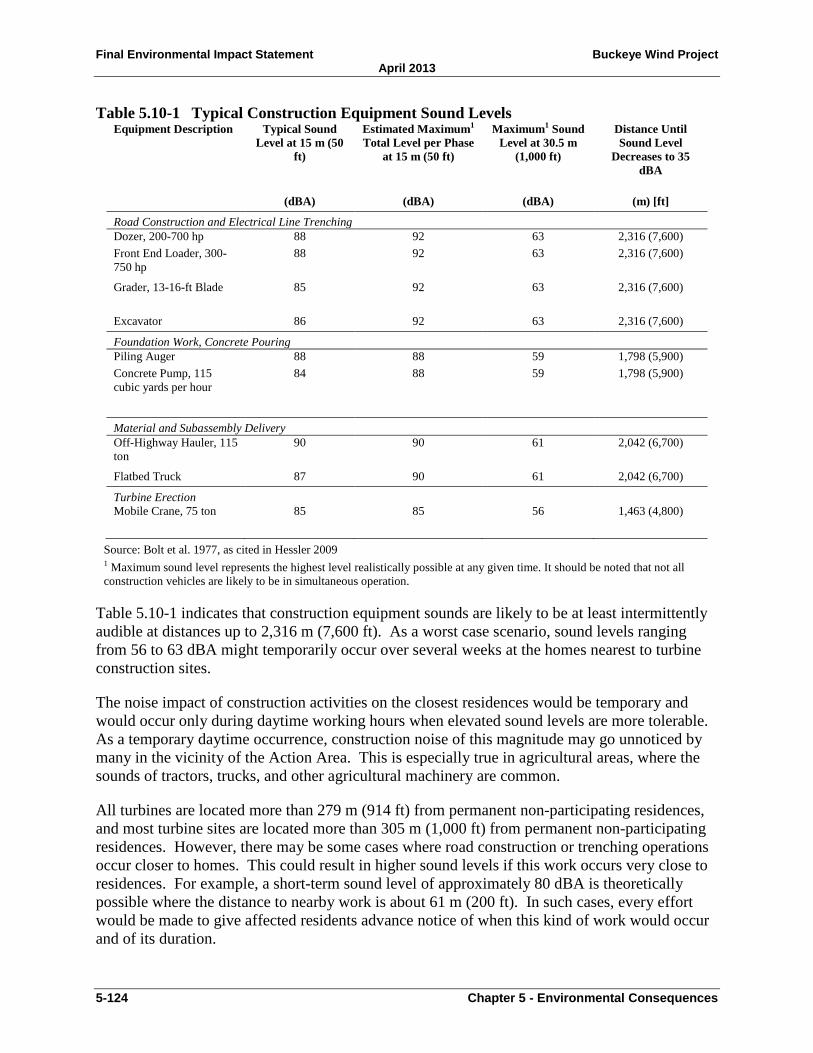
Final Environmental Impact Statement Buckeye Wind Project April 2013
5-124 Chapter 5 - Environmental Consequences
Table 5.10-1 Typical Construction Equipment Sound Levels Equipment Description Typical Sound
Level at 15 m (50 ft)
Estimated Maximum1 Total Level per Phase
at 15 m (50 ft)
Maximum1 Sound Level at 30.5 m
(1,000 ft)
Distance Until Sound Level
Decreases to 35 dBA
(dBA) (dBA) (dBA) (m) [ft]
Road Construction and Electrical Line Trenching Dozer, 200-700 hp 88 92 63 2,316 (7,600) Front End Loader, 300-750 hp
88 92 63 2,316 (7,600)
Grader, 13-16-ft Blade 85 92 63 2,316 (7,600)
Excavator 86 92 63 2,316 (7,600)
Foundation Work, Concrete Pouring Piling Auger 88 88 59 1,798 (5,900) Concrete Pump, 115 cubic yards per hour
84 88 59 1,798 (5,900)
Material and Subassembly Delivery Off-Highway Hauler, 115 ton
90 90 61 2,042 (6,700)
Flatbed Truck 87 90 61 2,042 (6,700)
Turbine Erection Mobile Crane, 75 ton 85 85 56 1,463 (4,800)
Source: Bolt et al. 1977, as cited in Hessler 2009 1 Maximum sound level represents the highest level realistically possible at any given time. It should be noted that not all construction vehicles are likely to be in simultaneous operation.
Table 5.10-1 indicates that construction equipment sounds are likely to be at least intermittently audible at distances up to 2,316 m (7,600 ft). As a worst case scenario, sound levels ranging from 56 to 63 dBA might temporarily occur over several weeks at the homes nearest to turbine construction sites.
The noise impact of construction activities on the closest residences would be temporary and would occur only during daytime working hours when elevated sound levels are more tolerable. As a temporary daytime occurrence, construction noise of this magnitude may go unnoticed by many in the vicinity of the Action Area. This is especially true in agricultural areas, where the sounds of tractors, trucks, and other agricultural machinery are common.
All turbines are located more than 279 m (914 ft) from permanent non-participating residences, and most turbine sites are located more than 305 m (1,000 ft) from permanent non-participating residences. However, there may be some cases where road construction or trenching operations occur closer to homes. This could result in higher sound levels if this work occurs very close to residences. For example, a short-term sound level of approximately 80 dBA is theoretically possible where the distance to nearby work is about 61 m (200 ft). In such cases, every effort would be made to give affected residents advance notice of when this kind of work would occur and of its duration.

Final Environmental Impact Statement Buckeye Wind Project April 2013
Chapter 5 - Environmental Consequences 5-125
Operation and Maintenance-related Effects Under the Proposed Action, nighttime (i.e., one-half hour before sunset to one-half hour after sunrise) varying operational constraints in the form of feathering would be applied based on a turbine’s assigned risk category and the season of Indiana bat activity (see Section 3). When operations are constrained, select turbines would not be operating at specific wind speeds and, therefore, would not generate noise.
Noise effects would be reduced at the sites of those turbines where operations would be feathered nightly during the period from April 1 through October 31. Nonetheless, the analytical noise model developed to predict the sound level contours associated with the Project still applies to the Proposed Action and all other action alternatives, and so represents a worst-case noise scenario without considering reductions in noise from feathering.
Potential Operational Noise Sources
The major noise sources associated with the Project are expected to include up to 100 wind turbine generators, each with a nameplate capacity rating of up to 2.5 MW. Wind turbine noise originates from mechanical sound (the gearbox and control mechanisms) and aerodynamic sound (produced by the rotation of the turbine blade through the air). Aerodynamic noise is the dominant source generally present in the mid-frequency ranges (approximately 500 Hz to 1 KHz). Noise within this range rises and falls as the turbine blade rotates and this change (amplitude modulation) can be perceived by a listener as a fluctuation in sound occurring approximately every second. Turbines can also produce tonal sounds (a hum or whine) caused by mechanical components although this phenomenon is less common with new turbine designs than with older models. Modern wind turbines such as the ones proposed for this Project do not generate tonal noise to any significant extent. Therefore, tonal noise from the turbines, if any, is not expected to be a concern for this Project. Concerns regarding low frequency noise and vibrations have also been raised regarding wind turbines; both concerns are discussed below.
Another source of operational noise is the substation, which would be located near the intersection of Pisgah Road and Route 56 in the Town of Union. The substation would step up voltage from 34.5 kV to 138 kV to allow connection with the existing transmission line. Operation of the substation is not expected to generate any significant noise. The main sources of noise at the substation include the transformers and air conditioning equipment. The substation would comply with specific design measures to ensure noise levels are kept to a minimum. Such design measures would include establishing buffer distances between the equipment and property boundaries and installing low-noise equipment, as necessary.
Once operational, the Project would not significantly contribute to traffic on local roads. Therefore, impacts from traffic noise are not anticipated during Project operations.
As previously indicated, the dominant operational noise sources for this Project are the wind turbine generators (primarily mid-frequency aerodynamic noise). The following subsections discuss the operational noise impact assessment conducted for the Project, including the results of a noise propagation model (Hessler 2009), as well as the effects of low frequency noise (infrasound) and vibration.

Final Environmental Impact Statement Buckeye Wind Project April 2013
5-126 Chapter 5 - Environmental Consequences
Noise Modeling Methodology
At the time the noise assessment was conducted, the specific make and model of turbine to be installed in the Project Area had not yet been determined. However, Hessler (2009) evaluated two of the models under consideration, which include the following:
• Nordex N90/2500 LS – 90-m (295-ft) rotor, 2.5 MW power output
• REpower MM92 – 92-m (302-ft) rotor, 2.0 MW power output Hessler’s evaluation was intended to present a worst case assessment in that it considered the turbine model with the highest overall sound power level. The Applicant may utilize models different from those presented in the Hessler evaluation. The overall sound power levels of several turbine types are provided in Table 5.10-2, as a function of wind speed. As shown in Table 5.10-2, sound power levels for the Nordex N100/2500 model are higher than that of the other two models evaluated. For example, sound power levels for the Nordex N100/2500 model are higher than levels for the REpower MM92 model by 0.6 to 1.9 dBA depending on the wind speed. This difference is minimal and is not expected to cause any significant additional effect on nearby receptors (i.e., after accounting for spherical losses and other attenuation effects). These levels are derived from field tests of operating units carried out by independent acoustical engineers, in accordance with International Electrotechnical Commission (IEC) 61400-11. However, the modeling studies relied on the REpower MM92 model’s higher sound power levels as inputs because at the time of the study the Nordex N100/2500 had not yet been added for consideration. However, a condition of the OPSB Certificate issued for the Project states that “Buckeye shall operate the facility within the noise parameters as set forth in its noise study and presented in its application.” Buckeye has committed to not exceeding 5 dBA above ambient (Leq)11 at any non-participating residence for all 100 turbines.
In general, sound power level is not the same as sound pressure level, which is the familiar quantity measured by instruments and perceived by the ear. A power level is a specialized calculated measure, expressed in Watts, which is primarily used for acoustical modeling and in design analyses. Sound power level is a logarithmic measure of the sound power in comparison to a reference level of 10-12 watts (1 picoWatt). It is a function of both the sound pressure level produced by a source at a particular distance and the effective radiating area, or physical size of the source. The ostensible magnitude of a sound power level is always considerably higher than the sound pressure level near a source (Hessler 2009)12.
11 Leq is the average sound level over each measurement interval. This is the “typical” sound level most likely to be observed at any given moment. 12 Sound pressure level accounts for attenuating characteristics of real-world environments such as atmospheric absorption and attenuation with distance.

Final Environmental Impact Statement Buckeye Wind Project April 2013
Chapter 5 - Environmental Consequences 5-127
Table 5.10-2 Sound Power Levels of Candidate Turbine Models Considered for the Buckeye Wind Project
Wind Speed at Height of 10 m
(m/s)
Nordex 90/2500 LS (dBA re 1 pW)1
REpower MM92 (dBA re 1 pW)
Nordex 100/2500 (dBA re 1 pW)
4 98.0 NA2 97.3 5 101.0 101.6 102.2 6 103.0 103.6 105.5 7 104.0 104.4 106.1 8 104.5 105.0 106.8 9 104.8 105.0 - 10 105.0 105.0 -
1 The units of power levels are denoted as decibels with reference to 1 picoWatt, or 10-12 Watts. 2Value not available
The field survey referenced in Section 4.10.2 indicated that background sound level varies with wind speed and time of day. Similarly, turbine sound levels also vary with wind speed (Table 5.10-2). The two values must be compared under the same wind conditions for the comparison to be meaningful. For example, it would be incorrect to compare the maximum turbine sound level, which occurs during high winds, to the background sound level on a calm night. In terms of potential noise impacts, the worst-case conditions would occur at the wind speed where the background level is lowest relative to the turbine sound level because the differential between the background sound level and turbine sound power level under these conditions would be greatest.
Table 5.10-3 compares the sound power levels of the REpower MM92 design turbine at different wind speeds to the daytime and nighttime L90 and Leq background levels measured during the survey. The table is used to determine the critical wind speed during the daytime and at nighttime. The critical wind speed is the wind speed at which the maximum differential of sound level occurs (i.e., when the Project is most likely to be audible above the background level). In the daytime, the maximum differential occurs during 6 m/s (13 mph) wind conditions for both typical (Leq) and residual (L90)13 background levels. For example, during the daytime at a wind speed of 6m/s, the turbine sound power level of 103.6 dBA minus the background Leq level of 40 dBA gives a differential of 59.6 dBA. This means the critical wind speed during the daytime is 6 m/s since it has the maximum sound differential. At nighttime, the maximum differential occurs during 5 m/s (11 mph) wind conditions for both Leq and L90 background levels. At lower and higher wind speeds, the differentials are lower, indicating that turbine noise is less perceptible relative to the background level14.
13 L90 is the consistently present background level that forms a conservative or “worst-case” basis for evaluating the audibility of a new source since it represents essentially the lowest amount of masking sound. 14 It should be noted that these differential levels do not represent increases from background levels that are noticeable by the human ear since the turbine levels are represented in terms of “sound power levels” rather than “sound pressure levels”. To determine actual increases above background levels at receptor locations (homes), both turbine and background levels need to be converted to “sound pressure levels” at receptor locations after accounting for attenuation factors such as distance, atmospheric absorption, ground effects, etc (as used in the noise model). With the critical wind speed determined, noise modeling at each wind speed is not necessary.

Final Environmental Impact Statement Buckeye Wind Project April 2013
5-128 Chapter 5 - Environmental Consequences
Table 5.10-3 Comparison of Background and REpower MM92 Turbine Sound Levels at Different Wind Speeds during Daytime and Nighttime
Daytime Wind Speed at Height of 10 m (33ft) (m/s) [mph]1
4 (9) 5 (11) 6 (13) 7 (16) 8 (18) 9 (20) 10 (22)
Turbine Sound Power Level (dBA re 1 pW)2
- 101.6 103.6 104.4 105 105 105
Typical Leq Background Sound Level (dBA)
42 43 44 45 46 47 48
Differential - 58.6 59.6 59.3 58.9 57.8 56.8 Worst-case L90 Background Sound Level (dBA)
32 34 35 37 39 40 42
Differential (dB) - 67.9 68.2 67.3 66.2 64.5 62.8 Nighttime Wind Speed at Height of 10 m (33ft) (m/s) [mph]1
4 (9) 5 (11) 6 (13) 7 (16) 8 (18) 9 (20) 10 (22)
Turbine Sound Power Level (dBA re 1 pW) 2
- 101.6 103.6 104.4 105 105 105
Typical Leq Background Sound Level (dBA)
35 38 40 42 44 46 48
Differential - 64.1 64 62.8 61.3 59.2 57.1 Worst-case L90 Background Sound Level (dBA)
26 29 32 35 38 41 43
Differential (dB) - 72.4³ 71.6 69.6 67.3 64.5 61.6
Source: Hessler 2009 *Critical wind speed in bold font. 1 This assessment accounts for wind speed as a function of elevation above ground level. Below about 100 m (328ft), wind speed varies with elevation above ground due to friction with surface and obstacles, such as trees. Because this roughness varies from place to place, measurements of wind turbine sound power levels carried out in accordance with IEC Standard 61400-11 are normalized to, and reported in terms of, the wind speed at a reference height of 10 m (33 ft). The conversion of wind speed at one elevation to the related speed at another elevation is calculated from a formula in the IEC standard (equation 7), which describes a logarithmic profile (See section 2.6 of the Hessler study, 2009). 2 The units of power levels are denoted as decibels with reference to 1 picoWatt, or 10-12 Watts. 3 During summer and fall all turbines would be cut in at speeds greater than 5.0; therefore, this may reduce noise impacts. In spring only some of the turbines would be feathered at 5.0, but this may still reduce noise impacts. This may change per adaptive management over time.
Final Environmental Impact Statement Buckeye Wind Project April 2013
Chapter 5 - Environmental Consequences 5-129
Operational Noise Impact Assessment for the Project
To determine the operational noise impact for the Project, a Noise Impact Assessment study (including background measurements and sound propagation modeling) was conducted by Hessler Associates in 2009 (Hessler 2009). The sound propagation modeling was based on a 70-turbine layout. The current Proposed Action and alternatives are based on a 100-turbine layout, so to maintain noise impacts relative to sensitive receptors to acceptable levels, the remaining turbines would also be sited using an approach and design goals that indicate the Project generated sound levels do not exceed 5 dBA above the prevailing background levels at non-participating residences.
Using the sound power level spectrum, sound level contour plots for the site were calculated using the CadnaA® version 3.7 sound modeling program (DataKustik undated). This software enables turbines and their surroundings, including terrain features, to be realistically modeled in three dimensions. The somewhat complex hill and valley topography of the selected location was digitized into the sound model from USGS topographic mapping. Each turbine is represented as a sound point source at a height of 80 m (262.5 ft) above the local ground surface. The model uses conservative assumptions regarding ground absorption of sound and wind speed, and predicts downwind sound levels from all directions simultaneously, to evaluate the "worst case" sound scenario (Hessler 2009). Sound contour plots based on Leq and L90 for both daytime and nighttime conditions are included in Appendix J (see Plots 1A-3B), and impacts are described below.
Plots 1A and 1B (Appendix J) show the typical daytime noise conditions in the northern and southern portions of the Action Area, respectively. They illustrate the sound emissions of the Project during a critical 6 m/s (13 mph) wind, when the Project is most likely to be audible above the background level, with a nominal impact threshold of 49 dBA (i.e., 5 dBA above ambient, based on the measured Leq background level of 44 dBA). These plots show that a sound level of 49 dBA occurs fairly close to each turbine and well short of any homes. Turbine sound levels would not be 5 dBA or more above the background sound level at any home. In fact, sound levels at homes may be comparable to the measured Leq environmental sound level of 44 dBA. Consequently, there is a very low probability of an adverse impact during daytime hours during typical conditions.
However, if the daytime background sound level is based on the L90, the potential area of impact is considerably larger, as shown in Plots 1C and 1D (Appendix J). They illustrate the sound emissions of the Project during a critical 6 m/s (13 mph) wind, when the Project is most likely to be audible above the background level, with a nominal impact threshold of 40 dBA (i.e., 5 dBA above ambient, based on the measured L90 background level of 35 dBA). In this instance, a few residences, most of which are project participants, fall inside the nominal 40 dBA. However, the vast majority of residences are outside of this nominal impact zone.
Plots 2A and 2B (Appendix J) show typical Project sound emissions during a critical 5 m/s (11 mph) wind, when the Project is most likely to be audible above the background level, with a nominal impact threshold of 43 dBA (i.e., 5 dBA above ambient, based on the measured Leq background level of 38 dBA). As with the daytime model based on typical Leq sound levels, all homes in the vicinity of the Project lie outside of the threshold. This suggests that there would

Final Environmental Impact Statement Buckeye Wind Project April 2013
5-130 Chapter 5 - Environmental Consequences
not be a legitimate disturbance at a significant number of homes during daytime or nighttime hours and during typical (Leq) conditions.
When the nighttime background sound level momentarily decreases to L90 levels, the Project may become distinctly audible, at least intermittently, over a fairly wide area (Plots 2C and 2D) (Appendix J). The nighttime residual L90 sound level was measured at 29 dBA during the critical 5 m/s wind conditions, when the Project is most likely to be audible above the background level, yielding a nominal impact threshold of 34 dBA (equal to the L90 of 29 dBA plus a 5 dBA increase). Since the predicted worst-case L90 sound levels exceed 34 dBA at a number of non-participating residences near the Project, some impact from nighttime Project noise appears to be possible during these particular conditions. However, because these impacts were calculated using L90 sound levels, it is important to note that, by definition, these potential impacts could only occur 10 percent of the time.
The mean predicted level for the Project would be less than 45 dBA at all non-participating houses even during wind speeds of 8 m/s (18 mph) or more, when the turbine sound power level is maximum (D. Hessler, in testimony).15 At critical wind speeds, where the differential between the turbine sound level and ambient background noise is greatest, Hessler predicted that only 5 non-participating residences are expected to experience nighttime sound levels slightly in excess of 40 dBA (in addition to the L90 plus 5 dBA metric) outside the house (D. Hessler, in testimony). These operational levels are well below the levels approved for other electricity generating projects in Ohio.
Although the nighttime model using residual L90 sound levels indicates the potential for a moderate noise impact at some homes in the vicinity of the Project Area, it is important to realize that this particular case combines a number of assumptions that together intentionally represent the worst possible impact during normal atmospheric conditions. These assumptions include the following:
• A 5 m/s (11 mph) Wind Speed – As shown above in Table 5.10-3, turbine audibility would be lower at all other wind speeds, both higher and lower.
• L90 Sound Levels – The background masking sound is based on the L90 level, which captures momentary lulls in the background level and excludes most noise-causing events, such as cars passing by on nearby roads.
• Winter Background Levels – The background sound level was measured during wintertime conditions, when environmental sound levels are normally the lowest. This ensures the greatest possible differential between background sound and turbine sound is used to determine nominal impact thresholds. During summer months, rustling leaves, bird, and insect sounds mask turbine noise.
• Observer Outside – The noise model predicts noise levels outside. Sound levels inside homes would be 10 to 20 dBA lower, particularly in wintertime when windows are closed.
15 D. Hessler, Licensed Professional Engineer, Hessler Associates, Inc.; testimony during hearings before the OPSB.

Final Environmental Impact Statement Buckeye Wind Project April 2013
Chapter 5 - Environmental Consequences 5-131
• Wind Direction – The wind would need to be blowing from all of the nearest turbines directly toward the point of observation.
These conservative assumptions and worst-case conditions have been consciously adopted for the analysis because the perceptibility of turbine noise varies with atmospheric conditions, such as during temperature inversions and periods of unusual wind stratification.
Analyses were completed to determine the relationship between the 50 dBA sound contour and the boundaries of participating land parcels (Appendix J). As discussed in Section 4.10, no local, state, or federal laws regulate sound levels from wind farms at property lines. For purposes of this analysis, a 50 dBA design target is assumed, since it represents a conservative nighttime absolute limit for property line sound levels for some states such as New Jersey and Colorado. As the results of these analyses show, sound levels of 50 dBA or more are almost entirely confined to participating properties. There are only a few places where sound levels may slightly exceed 50 dBA for a short distance into a neighboring property. The feathering regime would decrease noise at wind speeds of 5, 5.5, 6, and 6.5 m/s (11, 12, 13, and 15 mph), which are the wind speeds at which noise is expected to be greatest. However, it should be noted that at night during summer and fall all turbines would be operating at cut-in at speeds greater than 5.0 m/s, which would likely reduce the noise levels. In spring, only some of the turbines would be feathered at 5.0 m/s, but may still reduce noise impacts. Further, the feathering regime would occur at night, the time when noise impact is of most concern. Per adaptive management, cut-in speeds may change over time.
In summary, based on the typical Leq sound levels, all homes in the vicinity of the Project lie outside the nominal threshold. Therefore, there would not be a perceivable disturbance at a significant number of homes during daytime or nighttime hours during average or typical conditions. The predicted L90 sound levels exceed 34 dBA (the nominal nighttime impact threshold) at numerous non-participating residences near the Project and 40 dBA (the nominal daytime impact threshold) at a few non-participating residences. In absolute terms, sound levels in the 35 to 45 dBA range are often considered “faint” (RSG 2006) or “very quiet to quiet” (NYSDEC 2001). Therefore, while the turbines would be audible at some non-participating residences inside the nominal impact thresholds, these predicted noise levels would not necessarily constitute a nuisance. It is important to note that these nominal impact thresholds were calculated relative to the worst-case background noise level, and exceeding these relative thresholds does not necessarily mean that the Project would be perceived as “noisy.” It is also important to note that because these impacts were calculated using L90 sound levels, by definition, these potential impacts would occur a maximum of 10 percent of the time.
In addition to residential structures, the predicted sound contour plots in Appendix J depict recreational areas, such as golf courses and parks and possible noise-sensitive structures (including schools, libraries, churches, hospitals and nursing homes) in the Action Area. Recreational areas within 1.6 km (1 mi) of the Project include two golf courses and a local park. Possible noise-sensitive areas within 1.6 km (1 mi) of the Project consist of several churches and a school. Although libraries, hospitals, and nursing homes beyond 1.6 km (1 mi) are depicted on the plots, none are located within 1.6 km (1 mi) of the Project.
Final Environmental Impact Statement Buckeye Wind Project April 2013
5-132 Chapter 5 - Environmental Consequences
As shown on Plots 1A-1D (Appendix J), predicted daytime sound levels would not exceed nominal impact thresholds at any of the noise-sensitive sites. Plots 2A-2B portray predicted nighttime sound contours with a nominal impact threshold based on typical Leq sound levels, and as shown, sound levels would not exceed the impact thresholds at any noise sensitive sites. To further minimize potential sound impacts at non-participating residences, daytime Leq sound levels would not exceed the impact thresholds at any non-participating residence for the full 100-turbine array. When nighttime sound contours are predicted based on the worst-case L90 sound levels, sound levels at a few noise-sensitive sites exceed the nominal impact threshold, including the Chapel Hill Church of God on Ludlow Road and portions of both Urbana Country Club and Woodland Golf Club. Although churches often offer evening or nighttime services, the sound level of 37 dBA predicted would occur outside the structure, with indoor sound levels 10-20 dBA lower (well below any threshold of concern). Since golf is not typically played at night, and other activities such as weddings or receptions are likely to generate a significant amount of background noise, the sound levels should not affect recreational use of the clubs’ courses.
The noise profiles described above and the contour plots in Appendix J are based on a 70-turbine array, but the Project consists of 100 turbines. The impacts associated with the Project would be similar to the 70-turbine array in terms of magnitude, but sound contour plots for Leq and L90 for both daytime and nighttime conditions in Appendix J would be larger to accommodate the additional turbines in the 100-turbine array. The Applicant has committed that the design for the 100-turbine Project would ensure that the sound levels at any non-participating residence or possible noise-sensitive structures (including schools, libraries, churches, hospitals and nursing homes) would not exceed 5 dBA above the typical ambient background level as defined by the Leq sound level.
Therefore, adverse sound impacts to noise-sensitive areas from the Project are not anticipated.
Low Frequency Noise
Although concerns are often raised with respect to low frequency or infrasonic noise emissions from wind turbines, no adverse impact of any kind related to low frequency noise is expected from this Project. Early wind turbines were designed with the blades downwind of the support tower and were prone to producing a periodic thumping noise each time a blade passed the tower. The widespread belief that wind turbines generate excessive or even harmful amounts of low frequency noise likely originated with this phenomenon. Modern wind turbines have been reconfigured, with blades arranged upwind of the tower, and therefore no longer produce the thumping noises.
The concerns related to excessive low-frequency noise may have perpetuated due to confusion of the amplitude modulation typical of wind turbines (i.e., the periodic swishing sound with a frequency of about 1 Hz) with low frequency sound. Another possible explanation is that measurements taken during windy conditions can erroneously exhibit elevated levels of low frequency noise caused by wind flowing over the microphone tip, whether a wind turbine is present or not. This self-induced, false signal distortion is commonly mistaken for actual noise from wind turbines (Hessler 2009).
Recent studies have demonstrated that the low frequency content in the sound spectrum of a typical modern wind turbine, like those proposed for this Project, is no higher than that of the
Final Environmental Impact Statement Buckeye Wind Project April 2013
Chapter 5 - Environmental Consequences 5-133
natural background sound level in rural areas. Sondergaard and Hoffmeyer (2007, as cited in Hessler 2009) conducted a study with the specific objective of determining whether large wind turbines produce significant low frequency noise. Multiple elaborate microphone windscreens were used to preclude low frequency self-noise contamination during extremely careful measurements, based on the IEC 61400-11 procedure. The results of this testing show that for a typical turbine, sound levels steadily taper down in magnitude toward the low end of the frequency spectrum. As shown in Figure 3-1 in Appendix J (Hessler 2009), the measured sound energy below 40 Hz is comparable to or less than the sound energy in the natural rural environment, where the measurements were made.
Vibration
Operation of the Project would not result in significant vibration impacts. A comprehensive study of vibration measurements in the vicinity of a modern wind farm undertaken in 1997 found that vibration levels 100 m (328 ft) from the nearest turbine were a factor of 10 less than those recommended for human exposure in sensitive buildings, such as hospitals or laboratories (ETSU 1997).
Decommissioning-related Effects Noise impacts associated with decommissioning activities (the dismantling of the turbines and other Project facilities and the restoration of the natural landscape) would be similar to those associated with construction. The impacts would be intermittent, short-term, and localized. Decommissioning activities could occur as early as 2037. Removal of the Project and restoration of the original setting would return noise levels to their pre-project status; therefore, decommissioning could potentially positively affect noise levels.
Mitigation Measure for Unavoidable Impacts The Proposed Action contains no specific mitigation measures in addition to the avoidance and minimization measures listed above.
In summary, the Project would be expected to have minor negative noise-related impacts. Some non-participating residences, particularly those nearest the turbines, would be able to perceive turbine sound under certain conditions when the Project is operating. Noise from the turbines could be highest as compared to background noise at night; however, residents would likely be indoors during those periods where all sounds can be 10 to 20 dB lower. Some people who are highly sensitized to noise may be annoyed or otherwise negatively impacted by the Project, but the noise impacts would not have a significant adverse effect on most of the population. In addition, feathering proposed as part of the Proposed Action may reduce noise impacts at night during the spring, summer, and fall.
5.10.2.2 Redesign Option The Redesign Option is an optional measure under the Proposed Action that includes a primarily buried collection system. Impacts from noise under the Redesign Option are expected to be the same as those described for the Proposed Action. The avoidance and minimization measures would be the same as described above for the Proposed Action. No mitigation measures would be warranted.

Final Environmental Impact Statement Buckeye Wind Project April 2013
5-134 Chapter 5 - Environmental Consequences
5.10.3 Alternative A - Maximally Restricted Operations Alternative Construction and decommissioning-related effects associated with Alternative A would be similar to those described for the Proposed Action. Noise from construction and decommissioning activities associated with the Project would temporarily constitute a moderate, unavoidable impact at some of the homes located within the Action Area. Operation and maintenance-related effects associated with Alternative A would be similar to those described for the Proposed Action with the exception of nighttime operations from April 1 through October 31. During this period at night, all 100 turbines would be non-operational; therefore, generating no noise. Therefore, this alternative would result in lower overall noise impacts than the Proposed Action.
5.10.4 Alternative B - Minimally Restricted Operations Alternative Construction and decommissioning-related effects associated with Alternative A would be similar to those described for the Proposed Action. Noise from construction and decommissioning activities associated with the Project would temporarily constitute a moderate, unavoidable impact at some of the homes located within the Action Area. Operation and maintenance-related effects associated with Alternative B would be similar to those described for the Proposed Action except that feathering would occur less than with the Proposed Action, for the first one to six hours after sunset from August 1 through October 31 when wind speeds are 5.0 m/s (11 mph) or less. During these feathering periods, no operational noise would occur. Therefore, this alternative would result in greater overall noise impacts than the Proposed Action and greater noise impacts than Alternative A.
5.10.5 Alternative C - No Action Alternative Under Alternative C, the Project would not be built and no Project-related activities (construction, operation, or decommissioning) would occur. Alternative C would have no effect on noise. As such, no mitigation measures would be warranted.
5.11 Air Quality
5.11.1 Impact Criteria The Clean Air Act of 1970 (CAA) and the CAA Amendments of 1990 have established National Ambient Air Quality Standards (NAAQS) for selected pollutants (criteria pollutants) including ozone (O3), carbon monoxide (CO), nitrogen dioxide (NO2), sulfur dioxide (SO2), particulate matter less than 10 microns in diameter (PM10), particulate matter less than 2.5 microns in diameter (PM2.5), and lead (Pb). The NAAQS represent the maximum levels of background pollution that are considered safe, with an adequate margin of safety to protect public health and welfare. State and local agencies may set their own standards, as long as they are at least as stringent as the NAAQS. The OEPA’s Division of Air Pollution Control administers and enforces air quality regulations in Ohio. The state has adopted all the NAAQS.
In accordance with Section III of the CAA of 1970 and the CAA Amendments of 1990, the USEPA established New Source Performance Standards (NSPS) to regulate emissions of air pollutants from new stationary sources. The Ohio Administrative Code (OAC) regulations do not contain any NSPS regulations beyond those promulgated at the federal level. These

Final Environmental Impact Statement Buckeye Wind Project April 2013
Chapter 5 - Environmental Consequences 5-135
standards apply to a variety of facilities including landfills, boilers, cement plants, and electric generating units fired by fossil fuels. Because wind turbines generate electricity without releasing pollutants into the atmosphere, NSPSs do not apply to the Project.
All new sources of air emissions in Ohio are required to obtain a Permit to Install (PTI) for Title V facilities or a Permit to Install and Operate (PTIO) for non-Title V facilities.16 Because wind turbines generate electricity without releasing pollutants into the atmosphere, the Project would not require a PTI or PTIO.
Administered by the EPA, the Acid Rain Program was established by the Clean Air Act Amendments of 1990 to reduce emission of sulfur dioxide (SO2) and nitrogen oxides (NOx) through regulatory and market based approaches. Because wind turbines generate electricity without releasing pollutants into the atmosphere, the Project would not require an acid rain permit.
Prevention of Significant Deterioration (PSD) applies to new major sources of pollutants, or major modifications at existing sources for pollutants, where the area the source is located is in attainment or unclassifiable with the NAAQS. The Project would not be a major source of any pollutants. Therefore, PSD does not apply.
The General Conformity regulations, as described in 40 CFR 93, Subpart B, require federal agencies to conduct a conformity determination if a federal action would generate emissions (usually construction emissions and non-permitted operational emissions) exceeding the conformity threshold levels (de minimis) of the pollutant(s) for which an air basin is designated as a nonattainment area or a maintenance area. Since Champaign County is classified as in attainment for all criteria pollutants, a General Conformity Determination is not required.
Over the past decade, the United States climate change policy has focused on voluntary initiatives to reduce the growth in greenhouse gas (GHG) emissions. On February 18, 2010, the CEQ drafted a guidance memorandum for public consideration and comment on the ways in which Federal agencies can improve their consideration of the effects of GHG emissions and climate change in their evaluation of proposals for Federal actions under the NEPA. Specifically, the draft memorandum indicates that if a proposed action would be reasonably anticipated to cause direct emissions of 25,000 metric tons or more of carbon dioxide equivalents (CO2e) emissions on an annual basis, agencies should consider this an indicator that a qualitative assessment may be meaningful to decision makers and the public. The CEQ does not propose this as an indicator of a threshold of significant effects, but rather as an indicator of a minimum level of GHG emissions that may warrant some description in the appropriate NEPA analysis for agency actions involving direct emissions of GHGs.
Wind turbines generate electricity without releasing pollutants into the atmosphere. Therefore, air pollution operating permits would not be required for the Project.
16 A Title V facility is a facility or source that is subject to the Title V operating permit program either because of the type and amount of air pollutants it emits or because a standard such as New Source Performance Standards (NSPS) or National Emission Standards for Hazardous Air Pollutants (NESHAPS.) require the source to obtain an operating permit.

Final Environmental Impact Statement Buckeye Wind Project April 2013
5-136 Chapter 5 - Environmental Consequences
The impact criterion used for the evaluation of potential impacts on air quality from the Proposed Action or an alternative is whether it would cause any of the following conditions:
• Exceedance of NAAQS (because Ohio has accepted the NAAQS); or
• Result in consumption of PSD increments as defined by the CAA, Title I, PSD rule.
5.11.2 Proposed Action
5.11.2.1 Avoidance and Minimization Measures The Proposed Action contains the following avoidance and minimization measures that would avoid or minimize impacts on air quality (criteria pollutants and GHGs).
• Implementing best management practices to minimize the amount of dust generated during construction and decommissioning activities;
• Maintaining all construction vehicles in good working condition to minimize emissions from construction and decommissioning-related activities;
• Limiting idle times and practicing shutdowns of construction and decommissioning equipment when not in use;
• Minimizing the extent of exposed/disturbed areas on the site at any one time and restoring/stabilizing the affected area as stipulated in the NPDES permits;
• Applying water or calcium carbonate to suppress dust on unpaved roads (for both public roads and Project access roads), as needed throughout the duration of construction and decommissioning activities; and
• Identifying any unanticipated construction and decommissioning-related dust problems and ensuring immediate reporting to the construction manager and contractor.
Construction-related Effects Construction of the Project would take place over one or two construction phases, each phase expected to continue for 12 to 18 months. The exact timing of the two construction periods is not known and may overlap. Timing is dependent upon several factors such as turbine availability, OPSB certification and economic considerations. During the site preparation and construction phase, temporary impacts to air quality would result from the operation of construction equipment and vehicles. Impacts would occur as a result of emissions from engine exhaust (criteria pollutants and GHGs), fugitive dust generation during earth-moving and vegetation removal, and travel on unpaved roads. Dust could annoy existing residents and guests and potentially could be deposited on surfaces at certain locations or residences. These impacts would be expected to be intermittent, short-term, and localized. Fugitive dust associated with agricultural practices is a normal occurrence in the Action Area.
Operation and Maintenance-related Effects During Project operations, adverse impacts to air quality would not occur as the Project would not release pollutants to the atmosphere. Operation of the Project is expected to have a positive

Final Environmental Impact Statement Buckeye Wind Project April 2013
Chapter 5 - Environmental Consequences 5-137
impact to the overall air quality in the region17 due to its potential to offset/displace future emissions from existing power plants.
The operation of this Project is anticipated to have a positive impact on air quality (criteria pollutants and GHGs) by producing approximately 635,823 MWh of electricity annually with zero emissions (assuming a nameplate capacity of 250 MW and operating at 29 percent capacity). Power delivered to the grid from this Project would directly offset the generation of energy at existing conventional power plants (Jacobsen and High 2008). Table 5.11-1 summarizes anticipated emission displacements for the Project based on 100 turbines. The range of air quality benefits are based on the typical rated capacity of modern turbines and emissions rates for electricity used in Ohio.
Table 5.11-1 Estimated Annual Pollutant Emission Displacements from the Project Based on 100 Turbines
Estimated Annual displacement in tons1
Pollutant 2.5 MW Turbines (100 turbines; 250 MW total generation capacity) 635,823 MWh with a net capacity factor of 29%1
Carbon dioxide equivalents(CO2e)
486,010
Nitrogen oxides (NOx) 417
Sulfur dioxide (SO2) 1,877
Sources: Emission factors for each pollutant were taken from US EPA’s eGRID2012 version 1 data base (http://www.epa.gov/cleanenergy/energy-resources/egrid/index.html). 1 The annual energy production of 635,823 MWh/year accounts for feathering conditions (Buckeye Wind 2012).
Decommissioning-related Effects Air quality impacts associated with decommissioning activities would be similar to those from construction. The impacts would be intermittent, short-term, and localized. Beneficial impacts from emissions offsets would be lost if decommissioned. Decommissioning activities could occur as early as 2037.
In conclusion, the Project would not have any significant negative effects on air quality as defined by exceedance of the NAAQS or consumption of PSD increments. The Project’s long term-effect on air quality (criteria pollutants and GHGs) would be limited to the beneficial effect of displacing approximately 486,000 tons of CO2e and over 2,000 tons per year of nitrogen dioxides and sulfur dioxides.
Mitigation Measures for Unavoidable Impacts Adverse impacts to air quality would not occur during the Project’s operations phase, as the Project would not release pollutants to the atmosphere. Therefore, mitigation for air quality impacts is not warranted during the operations phase. During the Project’s construction and
17 Carbon emissions and air pollution associated with non-renewable electricity generation occurs at the point of generation, so the pollution offsets associated with this Project would occur at numerous points throughout the US wherever existing generation capacity would be offset by the Project’s generating capacity. This impact area could shift over time as generation capacity fluctuates to meet changing demand.

Final Environmental Impact Statement Buckeye Wind Project April 2013
5-138 Chapter 5 - Environmental Consequences
decommissioning phases, air quality impacts would be intermittent, short term, and localized. No mitigation measures would be implemented.
In summary, the Proposed Action would have short term negative impacts on air quality in the Action Area due to increased emissions from vehicles and equipment during construction and demolition as well as more long term emissions from other small equipment used at the Project during its operation lifetime. These impacts would not be significant.
The Project would have a long term beneficial impact on air quality by replacing polluting sources of energy with clean, renewable energy. The direct impact of this improvement would not likely rise to the level of significance in any one particular location because electrical generation occurs at multiple sites throughout the Midwest. The beneficial effects of the Project on air quality would be widely dispersed throughout the airsheds of all the generating stations that currently supply power to the customers that would ultimately receive power from the Project. Therefore the Proposed Action contains no specific mitigation measures for impacts to air quality in addition to the avoidance and minimization measures listed above.
5.11.2.2 Redesign Option The Redesign Option is an optional measure under the Proposed Action that includes a primarily buried collection system. Impacts to air quality are expected to be the same as those described for the Proposed Action. The avoidance and minimization measures would be the same as described above for the Proposed Action. No mitigation measures would be warranted.
5.11.3 Alternative A - Maximally Restricted Operations Alternative Construction and decommissioning-related effects associated with Alternative A would be similar to those described for the Proposed Action. Operational effects associated with Alternative A would be similar to those described for the Proposed Action except that this Alternative has more feathering than the Proposed Action; therefore, less energy (491,597 MWh/year with a net capacity factor of 22 percent) would be generated, which would ultimately result in less air emissions offset. Based on the reduced energy generation of this alternative, annual emissions displaced would be approximately 23 percent less than emissions shown in Table 5.11-1. The avoidance and minimization measures would be the same as under the Proposed Action. No mitigation measures would be warranted.
5.11.4 Alternative B - Minimally Restricted Operations Alternative Construction and decommissioning-related effects associated with Alternative B would be similar to those described for the Proposed Action. Operational effects associated with Alternative B would be similar to those described for the Proposed Action except that this Alternative would feather less of the time than the proposed action; therefore, more energy (647,726 MWh/year with a net capacity factor of 29.6 percent) would be generated and more air emissions would be offset. Based on the increased energy generation of this alternative, annual emissions displaced would be approximately two percent more than emissions shown in Table 5.11-1. The avoidance and minimization measures would be the same as under the Proposed Action. No mitigation measures would be warranted.
Final Environmental Impact Statement Buckeye Wind Project April 2013
Chapter 5 - Environmental Consequences 5-139
5.11.5 Alternative C - No Action Alternative Under Alternative C, the Project would not be built and no Project-related activities (construction, operation, or decommissioning) would occur. Implementation of this alternative would indirectly affect air quality because if the Project were not built, approximately 250 MW of electrical power from a source that produces no air pollution or greenhouse gases would not be generated. This clean source energy would not be available to offset electrical power produced by sources that adversely affect air quality, such as coal and other fossil fuel-burning power plants.
5.12 Transportation
This section evaluates the potential effects that implementing the Project would have on transportation facilities within 8 km (5 mi) of the Action Area for each of the alternatives. Three distinct phases of Project activity would impact transportation infrastructure in the region. Construction of the Project would occur in one or two construction phases, each phase expected to continue for 12 to 18 months. The exact timing of the two construction periods is not known and may overlap. Operations would occur during a 25-year project life. Decommissioning could occur as early as 2037.
5.12.1 Impact Criteria As stated in Chapter 1 of this EIS, the OPSB has regulatory authority over all proposed wind power projects in Ohio capable of generating five or more MW of electricity. Chapter 4906-17 of the Ohio Administrative Code contains the requirements for applications for the construction of wind power facilities, including the evaluation of any impacts to transportation facilities:
4906-17-8 (E) (5). Evaluate and describe the anticipated impact to roads and bridges associated with construction vehicles and equipment delivery. Describe measures that will be taken to repair roads and bridges to at least the condition present prior to the project.
In order to evaluate the impact of Project activities on the transportation network, it is necessary to project the future-year traffic volumes on affected roads, which represent the overall road network in and around the Action Area. One simplified method for estimating future traffic volumes is to tie increases in average annual daily traffic (AADT) to increases in local population. Table 5.12-1 shows the projected population change in each of the counties that have affected roads.

Final Environmental Impact Statement Buckeye Wind Project April 2013
5-140 Chapter 5 - Environmental Consequences
Table 5.12-1. Population Growth Rates for Future Traffic Estimates
County
Projected Population
Annual Increase 2010 2030
Champaign 41,270 47,020 0.7%
Clark 142,300 143,960 0.1%
Madison 43,130 46,520 0.4%
Union 50,740 85,190 2.6%
Source: Ohio Department of Development. Accessed 29 July 2010 at http://www.development.ohio.gov/research/files/p200.htm
Based on these projected rates of annual population increase, Table 5.12-2 shows the projected AADT for affected roads in 2011 (during construction) and 2037 (the potential start of decommissioning). These projected volumes are “baseline” volumes, representing what is likely to occur in the No Action Alternative (e.g., if the Project were never built).
Table 5.12-2. Projected Baseline AADT on Affected Roads
Road, Location County Projected AADT
2011 2037 I-70, West of SR 56 Clark 49,366 49,942 US 33, at US 36/SR 245 Madison 33,731 36,382 US 36 at Milford Center Union 5,307 8,910 US 36 at SR 559 Champaign 2,009 2,289 US 36 at SR 814 Champaign 2,896 3,299 SR 56 at SR 4 Champaign 1,081 1,232 SR 56 at SR 29 Champaign 989 1,127 SR 4 at SR 56 Champaign 4,140 4,717 SR 29 in Mutual Champaign 4,222 4,810 SR 814 at US 36 Champaign 2,937 3,346
It will also be important to consider the size and types of vehicles needed to deliver the turbine equipment. This will depend on the model and manufacturer of the turbine being hauled. Turbine components and associated vehicles can be classified as follows:
• Blade Sections: Blades are transported on trailers with one to three blades per vehicle. Blades typically control the length of the design vehicle, and the radii of the curves that can be navigated along the travel route to the site. Specialized transport vehicles are designed with articulating (manual or self-steering) rear axles to allow maneuverability through curves.
• Tower Sections: Towers are typically transported in four to six sections depending on the supplier. Although towers do not generally control design vehicle length, they often determine vertical clearance.
• Nacelle and Hub: The turbine nacelle, hub, and related elements are typically the heaviest components transported.

Final Environmental Impact Statement Buckeye Wind Project April 2013
Chapter 5 - Environmental Consequences 5-141
• Escort Vehicles: Light trucks with signs and banners that travel immediately in front or behind oversized loads to provide warning to motorists of the oversized vehicle.
5.12.2 Proposed Action
5.12.2.1 Avoidance and Minimization Measures The Proposed Action contains the following avoidance and minimization measures that would avoid or minimize impacts to transportation resources.
Special hauling permits are required when loads exceed legal dimensions or weights. Table 5.12-3 summarizes these maximum legal dimensions for State of Ohio highways, along with the approximate dimensions for Project delivery vehicles. Transportation of the blades, nacelles, and tower sections would require Special Hauling Permits for criteria that exceed state highway limits. Each individual vehicle must receive a separate Special Hauling Permit from the ODOT Central Office. The specifications of the Special Hauling Permit depend on the characteristics of the vehicle, its cargo, and the duration of the delivery schedule. Nacelles can weigh up to 200,000 pounds, and when combined with the transport vehicle, the total weight can exceed 380,000 pounds. If any vehicle exceeds 120,000 pounds, 14 feet wide, or 14.5 feet in height, a permit via the “super load” process is required (Hull, 2009c).
Table 5.12-3. State Highway Limits and Dimension of Project Components1
Vehicle Characteristic State Highway
Limit2
Assumed Dimension of Component to be Transported, Inclusive of Vehicle
Blade Nacelle Tower Sections
Vehicle width, inclusive of load 2.6 m (8.5 ft)
2.7 m (9.0 ft)
3.51 m (11.5 ft)
4.30 m (14.1 ft)
Vehicle height, inclusive of load 4.11 m (13.5 ft)
4.11 m (13.5 ft)
4.63 m (15.2 ft)
4.63 m (15.2 ft)
Vehicle length, inclusive of load 25.9 m (85.0 ft)
64.01 m (210.0 ft)
35.05 m (115.0 ft)
41.15 m (135.0 ft)
Total vehicle weight 80,000 lbs 78,000 lbs 380,000 lbs 255,000 lbs 1 Reprinted from Table 5-12 in Stantec 2010b. Original Source: Hull 2009c. 2 Values above any of these thresholds require a special permit from state and/or county authorities.
The township and county roads to be used for delivering Project equipment and materials would be video-documented prior to the commencement of construction to establish existing conditions. Upon completion of the Project, the Applicant would return all roadways to their pre-construction conditions. Pavement or structures damaged during construction would be replaced. The process of documenting roadway conditions and restoring impacted roads would be performed in conjunction with state and local permitting.
As required by state law (SB 232) and OPSB conditions, to the extent that township and county roads would be utilized and potentially damaged from construction-related traffic, the Applicant would work with the Champaign County Engineer to ensure that roads and bridges are adequate to support the construction of the Project. Any road, bridge, or culvert that the Champaign County Engineer determined to be inadequate would be rebuilt or reinforced to the specifications established by the Champaign County Engineer. Furthermore, a road bond, or other similar surety, would be established through the Engineer’s Office or the Champaign County Board of Commissioners to provide adequate funds to repair any damage to public roads.

Final Environmental Impact Statement Buckeye Wind Project April 2013
5-142 Chapter 5 - Environmental Consequences
As described throughout this analysis, turbine components delivered to the Action Area by truck would all qualify as oversize and/or overweight loads. Movement of such loads along or across county and township roads in Champaign County would be subject to a permit issued by the County Engineer. The County permit application states that applicants are responsible for all damage to public roads due to oversize/overweight loads (even with an approved permit).
The permit application also states that special measures may be required prior to oversize/overweight movements. These include, but are not limited to, prior engineering analysis, route detours, special traffic controls, and temporary bridge shoring. Planning and management of traffic and the movement of oversize/overweight vehicles (e.g., delivery of turbine and crane components) would include the following measures:
• Where practicable, aggregate deliveries of turbine components in truck caravans to reduce frequency and uncertainty in road closures. Less frequent, slightly longer closures would have less impact to non-Project traffic than more frequent closures.
• Buckeye Wind would communicate with county engineers and local police officials as necessary to accommodate the deliveries, and the vast majority of deliveries would not require scheduled road closures. Delivery timing restrictions should be confirmed through route evaluation studies. Very early morning, mid-day, late evening, or even nighttime deliveries (only if these can be accomplished safely and without undue disruption to residents due to excessive noise or light) would likely impact fewer motorists.
• Coordinate deliveries with state and local police, using chase vehicles and/or police vehicles, as necessary to ensure that non-Project traffic does not mix with oversize/overweight loads.
Construction-related Effects Construction of the Project would take place over one or two construction phases, each phase expected to continue for 12 to 18 months with possible overlap, and would involve frequent trips by very large trucks carrying turbine components, as well as “light trucks” (e.g., escort trucks), and “normal” heavy trucks (e.g., tractor-trailers, dump trucks, concrete trucks, and trucks carrying sections of the large cranes used to erect the turbines) carrying construction equipment, building materials, and other items (Stantec 2010b).
Construction Vehicle Traffic Volumes
Table 5.12-4 summarizes the anticipated traffic generated by Project Construction activities. The remainder of this section discusses the information presented in this table.
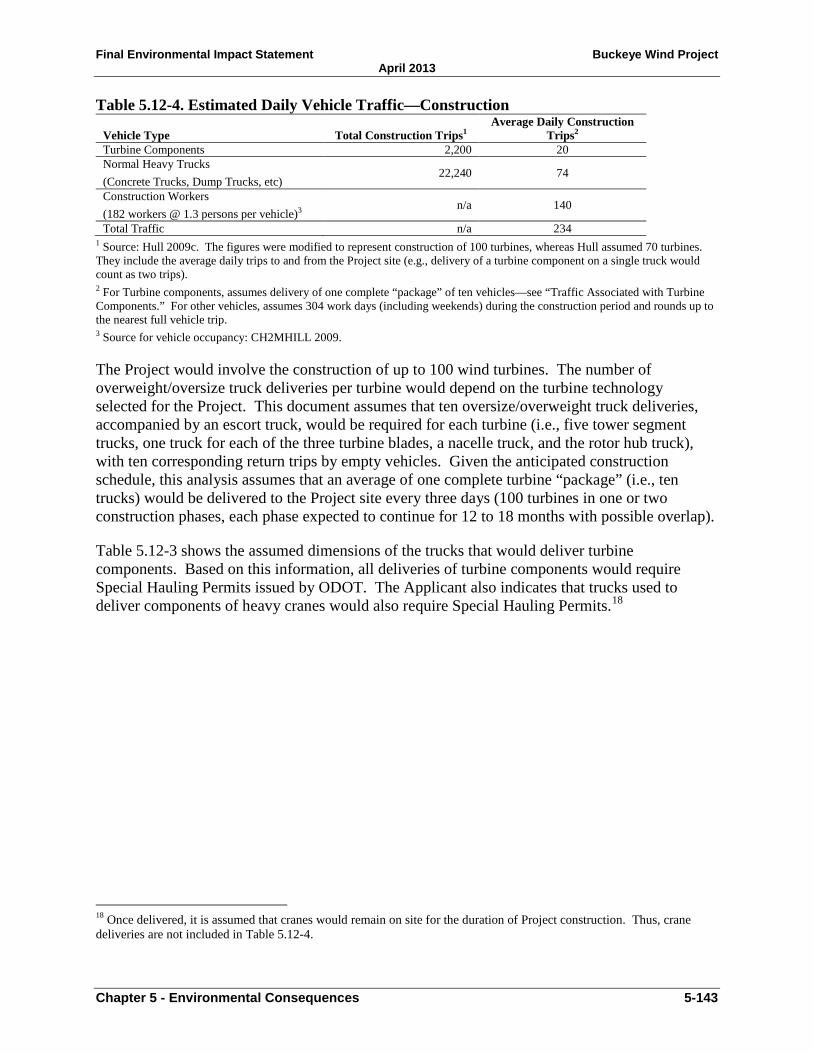
Final Environmental Impact Statement Buckeye Wind Project April 2013
Chapter 5 - Environmental Consequences 5-143
Table 5.12-4. Estimated Daily Vehicle Traffic—Construction
Vehicle Type Total Construction Trips1 Average Daily Construction
Trips2 Turbine Components 2,200 20 Normal Heavy Trucks (Concrete Trucks, Dump Trucks, etc)
22,240 74
Construction Workers (182 workers @ 1.3 persons per vehicle)3
n/a 140
Total Traffic n/a 234 1 Source: Hull 2009c. The figures were modified to represent construction of 100 turbines, whereas Hull assumed 70 turbines. They include the average daily trips to and from the Project site (e.g., delivery of a turbine component on a single truck would count as two trips). 2 For Turbine components, assumes delivery of one complete “package” of ten vehicles—see “Traffic Associated with Turbine Components.” For other vehicles, assumes 304 work days (including weekends) during the construction period and rounds up to the nearest full vehicle trip. 3 Source for vehicle occupancy: CH2MHILL 2009.
The Project would involve the construction of up to 100 wind turbines. The number of overweight/oversize truck deliveries per turbine would depend on the turbine technology selected for the Project. This document assumes that ten oversize/overweight truck deliveries, accompanied by an escort truck, would be required for each turbine (i.e., five tower segment trucks, one truck for each of the three turbine blades, a nacelle truck, and the rotor hub truck), with ten corresponding return trips by empty vehicles. Given the anticipated construction schedule, this analysis assumes that an average of one complete turbine “package” (i.e., ten trucks) would be delivered to the Project site every three days (100 turbines in one or two construction phases, each phase expected to continue for 12 to 18 months with possible overlap).
Table 5.12-3 shows the assumed dimensions of the trucks that would deliver turbine components. Based on this information, all deliveries of turbine components would require Special Hauling Permits issued by ODOT. The Applicant also indicates that trucks used to deliver components of heavy cranes would also require Special Hauling Permits.18
18 Once delivered, it is assumed that cranes would remain on site for the duration of Project construction. Thus, crane deliveries are not included in Table 5.12-4.

Final Environmental Impact Statement Buckeye Wind Project April 2013
5-144 Chapter 5 - Environmental Consequences
Large cranes used for turbine assembly (Source: EDR 2009b).
Anticipated Haul Routes
Most Project-related construction traffic would be likely to originate in the Columbus or Dayton metropolitan areas and would reach the Project site via either I-70/SR 56 or US 33/US 36. It is assumed that construction-related traffic would use the shortest route available to reach the locations of turbines and other Project facilities. The analysis of transportation impacts, therefore, evaluates each affected road individually, assuming that the total Average Daily Construction Trips shown in Table 5.12-4 would be added to that road segment.
Internal Road Network
Project construction activities would include upgrades to existing public roads and the creation of other roads to allow construction vehicle access to the turbine sites, laydown yards, operations and maintenance facilities, and other Project facilities. These roads would be developed to a standard sufficient to safely support the volume and type of construction vehicles anticipated for Project construction activities. Upgraded public roads would remain available for public use; temporary access roads would not be available for public use.

Final Environmental Impact Statement Buckeye Wind Project April 2013
Chapter 5 - Environmental Consequences 5-145
Typical upgrades to public roads during construction of wind turbine facilities (Source: EDR 2009a).
Other Transportation Facilities
There are no known plans to substantially alter the railroad infrastructure in or around the Action Area. As described in Section 4.12.5, there are no planned bikeways or major trails in the Action Area.
Traffic Volumes on Road Facilities
One common basis for evaluating transportation impacts is the degree to which a given project would increase traffic volumes and cause unacceptable levels of congestion on affected roads. In the case of the Project, background traffic volumes on most affected roads are very low. Volumes on I-70 and US 33 in the vicinity of the Action Area are somewhat higher relative to facility capacity, but are far lower than traffic volumes on the more urban portions of these roads – such as the 120,000 to 140,000 vehicles per day on I-70 in central Columbus in 2006 (ODOT (a)).
Given the low background traffic volumes likely to be present during construction, the addition of 240 vehicle trips per day to the affected roads would not create any direct or indirect adverse impacts on transportation.
Traffic Operations While traffic volume would not create impacts, the nature of the vehicles associated with Project construction could create temporary impacts on traffic operations and safety. Normal heavy trucks – those delivering gravel, concrete, and other materials – would likely be absorbed into the existing traffic stream. These vehicles are common on public roads in general (although they

Final Environmental Impact Statement Buckeye Wind Project April 2013
5-146 Chapter 5 - Environmental Consequences
may not be especially common on the affected roads in the Action Area). Assuming normal safe operating procedures, normal heavy trucks would not create impacts to traffic operations and safety.
However, oversize/overweight vehicles delivering turbine and crane components would cause direct, temporary impacts to traffic operations and safety. It should be noted that all overweight/oversize loads would require permits and must meet highway axle load and dimension restrictions within the permit requirements as determined by ODOT. Vehicle width is a particular concern. With widths up to 4.3 m (14 ft) – on roads whose paved surfaces are 6.1 to 6.7 m (20 to 22 ft) wide – it may not be possible to safely operate oversize/overweight vehicles in a normal traffic stream; there would not be adequate pavement to allow oncoming vehicles to safely pass.
Without minimization measures, such as widening of Project Area roads, direct impacts would take the form of temporary road and intersection closures. Background traffic would need to find alternative routes, or to wait until oversize/overweight vehicles pass. Indirect impacts would include temporarily increased traffic on alternative routes.
Physical/Engineering Considerations
Delivery and eventual removal of turbine and crane components during construction and decommissioning phases could create the following direct and indirect impacts on transportation infrastructure:
• At intersections and along relatively sharp curves, existing pavement width may not be wide enough to accommodate the turning movements of overweight/oversize vehicles.
• There are no permanent structures (e.g., bridges) that cross the affected roads, but some utility cables (particularly at intersections) may need to be temporarily raised in order to allow oversize trucks to pass underneath.
• Road surfaces may be damaged by overweight vehicles, even if procedures outlined in Special Hauling Permits are followed.
• Bridges along the anticipated haul routes may not be strong enough to support overweight trucks (Stantec 2010b).
Railroads
Freight rail is not expected to be used to transport Project-related materials to or from the Action Area, but could be used to deliver to a point outside of the Action Area and then transported by truck as described herein. Project-related traffic (including turbine and crane components) would only cross a railroad at-grade along SR 56 and possibly along SR 4, both southwest of Mechanicsburg. This rail line is a short-line spur (i.e., not part of the CSX system) extending eastward from Springfield, Ohio to Mechanicsburg. Although rail traffic data are not available for the railway in the Action Area, activity is presumed to be relatively low. Thus, construction would have no direct or indirect adverse impacts on railroad facilities.

Final Environmental Impact Statement Buckeye Wind Project April 2013
Chapter 5 - Environmental Consequences 5-147
Air Travel
The FAA reviews turbine locations as it relates to air travel and has found that the 52 known locations “would have no substantial adverse impact on the safe and efficient utilization of the navigable airspace by aircraft or in the operation of air navigation facilities” (FAA, 2009). The FAA letters to this effect are included in Appendix A. The Applicant would not site additional turbines where the FAA determines that a turbine would be a hazard to air navigation.
Non-Motorized Transportation Facilities
There are no designated bikeways or major non-motorized pathway systems in the Action Area. While bicyclists, hikers, and pedestrians may use the affected roads for travel, there is no evidence that the Action Area is a hub for such activities; in particular, none of the affected roads appear to include dedicated bicycle lanes or adequate shoulders to comfortably allow bicycling. Bicyclists and pedestrians would experience some of the same effects as drivers (i.e., travel delays or the need to alter travel routes in order to safely travel). The “Potential” NOCO route alternative through Urbana would not cross any of the affected roads. Accordingly, during Project Construction, the Project would have no significant direct or indirect adverse impact on non-motorized transportation facilities.
Operation and Maintenance-related Effects The Project would have an operational lifespan of approximately 25 years. During this period, vehicle trips associated with the Project would typically be limited to commuting to and driving around the Project site by permanent employees. This EIS assumes that during the operations period, approximately 12 permanent employees would work on the site during an average day, which would generate 24 vehicle trips per day (Stantec 2010b). This analysis assumes that these trips would be evenly distributed along the road network, with employees commuting to and from the site from various locations, such as Columbus, Dayton, and Urbana.
Traffic Volumes on Road Facilities
Operation of the Project would have no direct or indirect adverse impacts on transportation, since only a small number of employees would commute to and/or travel around the Project site each day.
Traffic Operations
Operation of the Project would have no direct or indirect adverse impacts on traffic operations, since only a small number of employees would commute to and/or travel around the Project site each day.
Physical/Engineering Considerations
Operation of the Project would have no direct or indirect adverse impacts on transportation infrastructure, since permanent employees would use standard vehicles to commute to and/or travel around the Project site for routine maintenance activity. Major repairs requiring the use of oversize vehicles for repair or replacement of major components are expected to be very rare.

Final Environmental Impact Statement Buckeye Wind Project April 2013
5-148 Chapter 5 - Environmental Consequences
Railroads
Operation of the Project would have no direct or indirect adverse impacts on railroads, since only a small number of employees would commute to and from the Project site (crossing over local rail lines) each day.
Air Travel
As described in Section 5.12.2.1.1, the Project would have no impacts to air travel.
Non-Motorized Transportation Facilities Operation of the Project would have no direct or indirect adverse impacts on non-motorized travel, since traffic volumes due to permanent employees would be very low.
Decommissioning-related Effects Traffic volumes and other transportation characteristics associated with decommissioning activities would be similar to those for construction. These activities could occur as early as 2037.
Mitigation Measures for Unavoidable Impacts The Proposed Action contains no specific mitigation measures in addition to the avoidance and minimization measures listed above.
In summary, the Proposed Action would not have significant impacts on transportation. Use of the existing road network is very low, and the Applicant would work with county engineers to establish a road use agreement and bond the roads (if necessary) to cover any potential damage that would occurs as a result of construction and decommissioning traffic. There would be very little traffic during the operational phase. Therefore the Proposed Action contains no specific mitigation measures for impacts to transportation in addition to the avoidance and minimization measures listed above.
5.12.2.2 Redesign Option The Redesign Option is an optional measure under the Proposed Action that includes a primarily buried collection system. Impacts to transportation resources are expected to be the same as those described for the Proposed Action. The avoidance and minimization measures would be the same as described above for the Proposed Action. No mitigation measures would be warranted.
5.12.3 Alternative A - Maximally Restricted Operations Alternative Alternative A differs from the Proposed Action only with respect to operations. The operational differences would not affect transportation resources. As such, the construction, operation, and decommissioning-related effects of Alternative A on transportation and the recommended avoidance and minimization measures would be the same as under the Proposed Action.
5.12.4 Alternative B - Minimally Restricted Operations Alternative Alternative B differs from the Proposed Action only with respect to operations. The operational differences would not affect transportation resources. As such, the construction, operation, and

Final Environmental Impact Statement Buckeye Wind Project April 2013
Chapter 5 - Environmental Consequences 5-149
decommissioning-related effects of Alternative B on transportation and the recommended avoidance and minimization measures would be the same as under the Proposed Action.
5.12.5 Alternative C - No Action Alternative Under Alternative C, the Project would not be built and no Project-related activities (construction, operation, or decommissioning) would occur. Alternative C would have no effect on transportation facilities. As such, no mitigation measures would be warranted.
5.13 Communications
This section evaluates the potential effects that implementing the Project would have on communications facilities in the Action Area and vicinity. No significant issues specifically relating to telecommunications were identified during the public scoping process. Indicators for potential effects included: interference to microwave, TV, radio, cellular/PCS telephone, and land mobile radio reception; inconvenience to local businesses and residents; and compliance with federal telecommunication standards.
5.13.1 Impact Criteria The OPSB rules (Chapter 4906-17 of the Ohio Administrative Code) governing applications for the construction of wind power facilities include the following requirements related to communications facilities and operations:
4906-17-8 (E) (3). The applicant shall…evaluate and describe the potential for the facility to interfere with radio and TV reception and, if warranted, describe measures that will be taken to minimize interference.
In addition, the National Telecommunications and Information Administration (NTIA) of the U.S. Department of Commerce reviews applications to determine whether proposed projects (including, but not limited to wind power projects) would interfere with military or civilian radio or other communications, such as those used for air traffic control.
5.13.2 Proposed Action
5.13.2.1 Avoidance and Minimization Measures While the Project would not result in significant communications impacts, some measures would be considered to minimize potential minor adverse impacts, specifically related to television and microwave paths.
• All 100 turbines would be sited greater than 3 km (2 mi) from AM transmitters, such that degradation of AM broadcast would not occur.
• Prior to final Project design, updated telecommunication assessments would be performed to ensure that any changes to communication pathways are accounted for in the final 100-turbine array. The Applicant commits to having no impact on Fresnel Zones for the entire 100-turbine array.
Final Environmental Impact Statement Buckeye Wind Project April 2013
5-150 Chapter 5 - Environmental Consequences
Construction-related Effects Construction of the Project would take place over one or two construction phases, each phase expected to continue for 12 to 18 months. The exact timing of the two construction periods is not known and may overlap. Construction of the turbines would include the presence of partially-completed turbines and associated construction vehicles and activities. Any interference from (and impacts due to) the partially or fully completed turbines during the construction phase would be comparable to, but less intense than, the interference that might be expected during the operations phase, when all 100 turbines are constructed and operating.
Operation and Maintenance-related Effects The findings in this section are based on reports generated by Comsearch (2008a, 2008b, 2009). This section provides a discussion of over-the-air television, AM/FM broadcasts, microwave paths, and military and other communication systems. As shown, the Project could have some minor effects on over-the-air television stations, specifically for any remaining low-power analog stations, very low-power FM radio stations (to the degree that they are located near turbines), and, in one case, microwave paths. Such effects are likely to be sporadic and would impact only a few residents or businesses. Accordingly, operation of the Project would have no significant negative direct or indirect impacts on communications.
Over-the-Air Television
All full-power and some low-power television stations serving the Action Area and vicinity have transitioned from analog to digital signals, thus reducing the likelihood that the Project would adversely impact television reception. Digital television would not have shimmering, ghosting, or poor picture quality (Polisky 2009) due to the Project.
The remaining analog low-power over-the-air television channels may suffer some degradation of over-the-air television signal reception during Project operations. This degradation would be the result of television signal attenuation or reflection caused by one or more of the Project wind turbines. The strength of this effect depends on the relative location of the over-the-air television broadcast antenna, the wind turbines, and the point of reception.
Some communities may not be affected at all, while others may have multiple channels affected (Comsearch 2008a). Specific impacts to television reception could include noise generation at low VHF channels within 0.8 km (0.5 mi) of turbines, reduced picture quality (e.g., ghosting, shimmering, or contrast variation), and signal interruption (NWCC, 2005).
AM/FM Broadcast No degradation of AM broadcast coverage due to the presence of the wind turbines is anticipated because the distance between the nearest wind turbine in the Action Area and an AM transmitter is greater than 3 km (2 mi) (Comsearch 2008b). All turbines would be sited such that degradation of AM broadcast would not occur.
Very-low-power FM stations are designed for limited coverage, typically less than 0.8 km (0.5 mi), and would likely be unaffected as long as turbines are installed at distances greater than the coverage of the stations. For full- and medium-power FM stations, a separation distance of 4.0 km (2.5 mi) would allow a station to maintain normal operation and coverage. Because the

Final Environmental Impact Statement Buckeye Wind Project April 2013
Chapter 5 - Environmental Consequences 5-151
nearest FM station antennas are more than 16 km (10 mi) from the center of the Action Area, no degradation of FM radio broadcast coverage is anticipated (Comsearch 2008b).
Microwave Paths
To assure an uninterrupted line of communications, a microwave link should be clear, not only along the axis between the center point of each antenna, but also within a mathematical distance around the center axis known as the Fresnel Zone. Comsearch (2009) calculated a Worst Case Fresnel Zone (WCFZ) for each of the microwave paths identified in Section 4.13. Based on the calculated WCFZ and subsequent Comsearch analysis, only one turbine19 has the potential to interfere with an identified Fresnel Zone. Buckeye Wind will shift that turbine (incorporating all other siting considerations defined herein for other resources) to avoid potential impacts to microwave paths. All WCFZ interference would be avoided for the remaining turbines.
Military and Other Communication Systems
As described in Section 4.13, the NTIA provided plans for the Project to the federal agencies represented in the IRAC, which include the Department of Defense, Department of Education, Department of Justice, and Federal Aviation Administration. NTIA’s response states that IRAC agencies “have not identified any concerns regarding blockage of their radio frequency transmission” (NTIA 2008).
Decommissioning-related Effects During decommissioning, turbines and other Project structures would be dismantled and the landscape would be returned to its pre-Project state. Any interference from (and impacts due to) the partially or fully dismantled turbines during the decommissioning phase would be comparable to the interference that might be expected during the construction phase.
Mitigation Measures for Unavoidable Impacts In addition to the avoidance and minimization measures listed above, if Project operations result in any impacts to existing over-the-air television coverage, the Applicant would address and resolve each individual problem as commercially practicable. Such resolutions could include the provision of stronger digital antennas, or cable or satellite television service in lieu of non-functional over-the-air television.
5.13.2.2 Redesign Option The Redesign Option is an optional measure under the Proposed Action that includes a primarily buried collection system. Impacts to communications are expected to be the same as those described for the Proposed Action. The avoidance and minimization measures would be the same as described above for the Proposed Action. No mitigation measures would be warranted.
5.13.3 Alternative A - Maximally Restricted Operations Alternative Alternative A differs from the Proposed Action only with respect to operations. In this alternative, turbines would operate less frequently than under the Proposed Action. The construction and decommissioning-related effects of Alternative A on communication systems
19 Identified in Stantec 2010b as Turbine 37.

Final Environmental Impact Statement Buckeye Wind Project April 2013
5-152 Chapter 5 - Environmental Consequences
and the recommended avoidance and minimization measures would be the same as under the Proposed Action. Operational turbines may be slightly more likely to interfere with communications signals than non-operational turbines. Thus, if interference does occur, transmissions during hours when turbines are not operational may experience slightly less interference. As a result, Alternative A would have slightly lower effects on Communications than the Proposed Action.
5.13.4 Alternative B - Minimally Restricted Operations Alternative Alternative B differs from the Proposed Action only with respect to operations. The operational differences would not affect communication systems. As such, the construction and decommissioning-related effects of Alternative B on communication systems and the recommended avoidance and minimization measures would be the same as under the Proposed Action. Operational turbines may be slightly more likely to interfere with communications signals than non-operational turbines. To the extent that interference is expected, Alternative B would have slightly larger effects on communications than the Proposed Action because Alternative B proposes more operational hours than the Proposed Action.
5.13.5 Alternative C - No Action Alternative Under Alternative C, the Project would not be built and no Project-related activities (construction, operation, or decommissioning) would occur. Alternative C would have no effect on existing communication systems. As such, no mitigation measures would be warranted.
5.14 Health and Safety
This section evaluates the potential effects that implementing the Project would have on health and safety in the Action Area.
5.14.1 Impact Criteria The OPSB rules (Chapter 4906-17 of the Ohio Administrative Code) governing applications for the construction of wind power facilities include the following requirements related to analysis of health and safety concerns:
4906-17-8 (A)
(4) Ice throw. The applicant shall evaluate and describe the potential impact from ice throw at the nearest property boundary, including its plans to minimize potential impacts if warranted.
(5) Blade shear. The applicant shall evaluate and describe the potential impact from blade shear at the nearest property boundary, including its plans to minimize potential impacts if warranted.
(6) Shadow flicker. The applicant shall evaluate and describe the potential impact from shadow flicker at adjacent residential structures and primary roads, including its plans to minimize potential impacts if warranted.
Final Environmental Impact Statement Buckeye Wind Project April 2013
Chapter 5 - Environmental Consequences 5-153
5.14.2 Proposed Action
5.14.2.1 Avoidance and Minimization Measures The Proposed Action contains the following avoidance and minimization measures that would avoid or minimize impacts to health and safety.
Project Design and Operation
• Proper grounding techniques incorporated within and around project components would eliminate the occurrence of stray voltage.
• The Project would implement minimum setbacks of 279 m (914 ft) between turbines and permanent non-participating residences and 180 m (590 ft) from adjacent property lines.
Site Development and Maintenance
• Operations and maintenance staff would be trained and, in virtually all cases, would be the first level of response to in-tower emergencies. Local fire and emergency service personnel would also receive training in providing response services that are appropriate for activities, materials, and risks associated with the Project. This could include, for example, hazardous materials training related to the fuels and other potentially hazardous materials stored at the operations and maintenance facility.
• Local emergency service personnel would be given material safety data sheets for potentially hazardous construction materials.
• Construction managers would coordinate with local emergency service personnel to ensure that they are aware of the location and nature of various construction activities.
• As described in Section 5.12 (Transportation), construction managers would coordinate with police and ODOT to ensure that deliveries of Project materials (specifically overweight and oversize turbine and crane components) are achieved safely.
• The 100 turbines would be sited such that non-participating residences and other sensitive receptors (including schools, libraries, churches, hospitals and nursing homes) would not be subject to Shadow Flicker exceeding 30 hours per year. For residences (or businesses, if applicable) where initial modeling indicates that they may receive more than 30 hours per year of Shadow Flicker, site-specific evaluations would be conducted to determine whether adequate trees or buildings exist to provide screening (EAPC 2009). If necessary, trees would be planted in appropriate locations on these properties to minimize shadow flicker or other appropriate mitigation measures would be employed.
Construction-related Effects Most of the safety concerns associated with construction of the Project are similar to those associated with construction of other tall structures, such as the potential for injuries to workers and the general public from the movement of construction vehicles, equipment, and materials; falls from structures or into open excavations; and electrocution.
The Applicant states that “the risk of construction-related injury will be minimized through regular safety training and use of appropriate safety equipment” (EDR 2009a). A Health and Safety (H&S) Plan would also be developed for the Project to address health and safety risks to

Final Environmental Impact Statement Buckeye Wind Project April 2013
5-154 Chapter 5 - Environmental Consequences
Project-related workers and to the general public and to address applicable regulatory requirements during construction. Such a plan should address issues such as personal protective equipment, housekeeping, maintaining a safe workplace, fire prevention, and safe work practices. Coordination with emergency responders in the region is also assumed, specifically to address risks related to fire, collapse, transportation of Project materials, and other risks to members of the general public.
Beyond the general construction issues described above, the Project would have no adverse impacts on health and safety. Ice shedding, blade shear, shadow flicker, and other concerns described in Section 4.14 are associated with operational turbines, and thus are not applicable to the construction phase.
Assuming proper planning and monitoring of typical construction-related health and safety risks, construction of the Project would have no substantial adverse impact on health and safety.
Operation and Maintenance-related Effects Operation-related effects include ice shedding, tower collapse and blade shear, stray voltage, fire and fuels, lightning strikes, shadow flicker, and wind turbine syndrome, each of which is discussed below.
Ice Shedding
Ice accumulations on turbine rotor blades either cause an imbalance or otherwise alert turbine sensors, which are designed to shut down the turbine until the ice has melted or has been shed from the stationary blades (Garrad Hassan 2007, as cited in Stantec 2010b). Most ice shedding prior to blade rotation drops to the ground in the vicinity of the turbine (Morgan et al. 1998). In some cases, residual ice can potentially be shed from the blades as they begin to rotate again. In such cases, ice thrown from turbine blades usually breaks down into small fragments and falls near the tower base (Global Energy Concepts 2005, as cited in Stantec 2010b). As the ice fragments into smaller pieces, the potential for injury or damage is reduced. In general, the operational characteristics of the turbines, together with incorporated setbacks and the behavior of ice as it melts, combine to make injury from ice throw highly unlikely.
In rare cases, aerodynamic and centripetal forces can cause ice fragments to be thrown far enough from the tower and in large enough sizes to potentially cause injury or damage. Data gathered at existing wind farms have documented ice fragments on the ground from 15 to 100 m (50 to 328 ft) from the base of the tower (i.e., from turbines with rotor diameters less than 10 to 60.0 m [33 ft to 197 ft]). These fragments were in the range of 0.1 to 1.0 kg (0.2 to 2.2 lbs) in mass (Morgan et al. 1998). The risk of ice landing at a specific location is found to drop dramatically as the distance from the turbine increases. One study (Garrad Hassan 2007, as cited in EDR 2009a) indicates a negligible risk at distances beyond approximately 220 m (722 ft) from a wind turbine. Moreover, “there has been no reported injury caused by ice being ‘thrown’ from an operating wind turbine” (Global Energy Concepts 2005, as cited in EDR 2009a).
Public access to the turbine sites would not typically be authorized, further reducing health and safety risks. Based on these siting constraints, the Project would not have any significant adverse impacts on health and safety due to ice shedding.

Final Environmental Impact Statement Buckeye Wind Project April 2013
Chapter 5 - Environmental Consequences 5-155
Tower Collapse and Blade Shear
Occurrences of tower collapse and blade shear are potentially very dangerous, but are also fairly rare. Since 2009, three instances of tower collapse and/or blade sheer have occurred in the state of Ohio. Such incidents have been largely eliminated due to technological improvements and mandatory safety standards during turbine design, manufacturing, and installation. Modern utility-scale turbines are certified according to international engineering standards, which include ratings thresholds for withstanding different levels of hurricane-strength winds and other criteria (AWEA 2008c, as cited in EDR 2009a). “The engineering standards of the wind turbines proposed for this Project are required to meet all applicable federal, state, and local codes” (EDR 2009a, p. 107). Beyond these standards, additional controls would be in place, which are described as follows:
State-of-the-art braking systems, pitch controls, sensors, and speed controls on wind turbines have greatly reduced the risk of tower collapse and blade throw. The wind turbines proposed for the Facility will be equipped with two fully independent braking systems that allow the rotor to be brought to a halt under all foreseeable conditions. In addition, the turbines will automatically shut down at wind speeds over the manufacturer’s threshold...the turbines will also cease operation if significant vibrations or rotor blade stress is sensed by the monitoring systems (EDR 2009a).
A study by the University of California evaluated the risk from tower collapse and blade shear (University of California, Berkeley 2005). The study concluded that the annual risk of a person situated 50.3 m (165 ft) from a wind turbine (far closer than any non-Project employee would be allowed under the Applicant’s proposed operating regulations) being struck by a collapsing tower or a detached blade is very low, approximately one in 667,000. By comparison, the risk of being struck by lightning in a given year is approximately one in 500,000 (NWS 2010).
Studies have found that the farthest a blade is likely to be thrown is 152 m (500 ft) from the tower (KPFF 2006, as cited in EDR 2009a). This is within the Project’s 180-m (590-ft) setback from property lines (and therefore from any non-Project structure), and well within the 279-m (914-ft) setback from permanent non-participating residences. Based on these siting constraints and the extreme rarity of collapse and blade shear events, the Project would not have significant adverse impacts on health and safety due to tower collapse or blade shear.
Given the known incidence rate of blade shear, tower collapse, ice throw, and the setbacks that would be enforced surrounding the Project, the risks from these phenomena are remote. In order for injury or property damage to occur from any of these phenomena, a person or their property would have to penetrate the setback zones at the same time as one of these very rare events take place. In the case of ice throw and blade shear, these events would also have to coincide with windy conditions in order for injury or damage to occur.
Stray Voltage
Stray voltage can be prevented using proper electrical installation and grounding practices. To the degree that the Project’s electrical collection system meets applicable design and safety regulations, it would be properly grounded, would have adequate spacing from other electrical cables, and would not be connected to the local electrical distribution lines that provide service to

Final Environmental Impact Statement Buckeye Wind Project April 2013
5-156 Chapter 5 - Environmental Consequences
homes and farm buildings. As a result, the Project would not have any adverse impacts on health and safety due to stray voltage.
Fire and Fuels
The most significant fire risks for turbines are due to lightning strike, short circuit, or mechanical failure/malfunction. In the event that a wind turbine catches fire, standard industry practice is to allow the fire to burn itself out while maintenance and fire personnel maintain a safety area around the turbine and protect against the potential for spot ground fires that might start due to sparks or falling material. Power to the section of the Project with the turbine fire would also be disconnected. Risk to public safety during a fire event would be minimal, due to the distance between the turbines and private property and residences.
The Project operator would be responsible for any emergency/fire situations at a wind turbine site or substation that are beyond the capabilities of the emergency service providers. Maintenance personnel would be trained and have equipment to deal with emergency situations that may occur at a wind turbine site (e.g., tower rescue, confined spaces, high voltage, etc.). Consequently, such an incident would generally not expose local emergency service providers or the general public to any public health or safety risk.
The storage and use of various oils including diesel fuels, lubricating oils, and hydraulic fluids in electrical transmission structures and the operations and maintenance building can also create the potential for fire or a medical emergency. Response to an emergency would not pose a difficulty to local fire and emergency personnel due to the accessibility of the storage and use areas from public or access roads. However, the presence of potentially hazardous materials as well as high-voltage electrical equipment at the substation could present potential safety risks to local emergency service responders.
With appropriate training in place for emergency response personnel, and given the industry standard of minimizing exposure of local emergency responders to unusual situations, the Project would have no significant adverse impact on health and safety due to fire and fuels.
Lightning Strikes Lightning strikes have occurred at wind facilities, including in 2011 at a facility in Conneaut, Ohio. However, the turbines would have lightning protection systems, which typically include automatic shutdown procedures in the case of damage to the blades or turbine. Most impacts due to lightning strikes would be in the form of localized structural damage to the turbines. Fire risks due to lightning strike are described above. Accordingly, the Project would have no substantial adverse impact on health and safety due to lightning strikes.
Shadow Flicker
As described in Section 4.14.7, there are no uniform health and safety thresholds for shadow flicker. However, based on available research (NWCC 2005, Stantec 2010b), studies and guidelines from Europe and Australia have suggested 30 hours of shadow flicker per year as the threshold of significant impact, or the point at which shadow flicker is commonly perceived as an annoyance. Therefore, this EIS uses 30 hours of shadow flicker per year as the threshold for significant impacts.

Final Environmental Impact Statement Buckeye Wind Project April 2013
Chapter 5 - Environmental Consequences 5-157
Based on the computerized simulations prepared by the Applicant (EAPC 2009) for a 70-turbine array, seven permanent non-participating residences could be exposed to shadow flicker exceeding this 30-hour threshold, with some homes receiving as much as 57 hours of annual shadow flicker. The OPSB conditions require that turbine 70, which contributes to these violations at each of the seven non-participating residences of the 30-hour limit, be moved to comply with the 30-hour standard, or not be built at all. Therefore, no non-participating residence would experience a level of shadow flicker exceeding the 30-hour threshold. The full 100-turbine array has not been evaluated in a similar manner. If modeling indicates more than 30 hours per year, a site visit will be conducted to evaluate site specific conditions. If the model results are confirmed valid based on site specific conditions, then measures such as planting trees or moving the turbine would be implemented to reduce flicker to less than 30 hours per year. The Applicant has committed that the 100-turbine array would not result in any non-participating residence experiencing more than 30 hours of shadow flicker.
Actual exposure would depend on weather and the presence of screening, such as trees or buildings. In addition, the Applicant’s study did not model the position of each home’s windows. Thus, while the residence itself may be exposed, the residents inside may not experience the shadow flicker.
Travelers along nearby roads could also experience shadow flicker from turbines. However, overall exposure to Project-related flicker would be comparatively minimal and would not be substantially different in nature from shadow flicker experienced during the course of normal driving (e.g., the sun shining through trees, utility poles, and other obstructions).
Based on the Applicant’s commitment to not exceed 30 hours of shadow flicker per year, the Project’s shadow flicker is not likely to have an adverse impact on permanent non-participating residences.
Wind Turbine Syndrome
Although wind turbine syndrome is not a recognized medical diagnosis, the topic has led to health concerns over wind power projects. Pierpont (2009, pre-publication draft) hypothesized that wind turbine syndrome is caused by the combined effect of: (1) airborne infrasound from wind turbines at frequencies of 1 to 2 Hz affecting the body’s vestibular system; and (2) airborne infrasound from wind turbines at frequencies 4 to 8 Hz entering the lungs and transmitting vibrations throughout internal organs. The combined effect of these frequencies is hypothesized to send confusing information to the position and motion detectors of the body, causing the symptoms (Pierpont 2009, pre-publication draft; Colby et al. 2009). Several literature reviews that have been conducted on the health effects of wind turbine sound have examined Pierpont’s hypotheses, none of which have been found to be supported by sufficient verifiable scientific evidence (Colby et al. 2009, Knopper and Ollson 2011, Ellenbogen et al. 2012). One study surveyed the published measurements of infrasound from wind turbines and determined that turbines with the rotor positioned upwind produced levels of infrasound that were below the limit of perception, and are so low that they are not useful for evaluating the environmental effects of wind turbines. However, turbines with downwind rotors produce 10 to 30 dB higher infrasound levels, which may exceed relevant assessment criteria in distances up to several hundred meters. It was also stated that due to the differences in individual hearing thresholds, infrasound that is inaudible to one person may be loud and bothersome to another (Jakobsen 2005).
Final Environmental Impact Statement Buckeye Wind Project April 2013
5-158 Chapter 5 - Environmental Consequences
A 2007 perception survey conducted in the Netherlands with 725 respondents concluded that wind turbine sound is easily distinguished and, compared with sound from community transportation or industry sources, considered an annoyance (Pedersen et al. 2009). The results were found to be similar to a study conducted in Sweden (Pedersen and Halmstad 2003). Another study compared data from three field studies in which levels of wind turbine noise were compared to self-reported health status of people living near wind power facilities. It was found that many of the self-reported health effects can be associated with noise annoyance. In fact, annoyance was the only response to wind turbine noise that was directly associated with A-weighted20 sound pressure levels in the three studies. The author concluded that the health effects could be explained by cognitive stress theory, in which an individual assesses an environmental stressor as either beneficial or not and behaves accordingly (Pedersen 2011). This finding is supported by evidence that health effects from noise annoyance can be addressed through behavioral and cognitive behavioral therapies (Leventhall et al. 2008).
The research shows that people have complained of annoyance resulting from wind turbine sound, and there is reason to be prudent in turbine siting, but there is no evidence of any direct relationship between wind turbine sound and adverse physiological health impacts. impacts.
As discussed in Section 5.4 and 5.5, mortality of bats is not expected to be significant, and the impact on bats’ ability to control insect populations within the Action Area is not expected to rise to the level of significance. Therefore no changes in the rate of insect-bourne diseases would result and no changes in the current use of pesticides to control insects would be expected.
Decommissioning-related Effects Effects on health and safety from the decommissioning phase of the Project would be similar to those from the construction phase. Assuming that health and safety plans are established and followed, and that proper coordination exists with local emergency service responders, decommissioning of the Project would have no significant adverse impacts on health and safety.
Mitigation Measures for Unavoidable Impacts The Proposed Action contains no specific mitigation measures for health and safety in addition to the avoidance and minimization measures listed above. The Project is not expected to have significant adverse impacts on health and safety.
5.14.2.2 Redesign Option The Redesign Option is an optional measure under the Proposed Action that includes a primarily buried collection system. Impacts to health and safety are expected to be the same as those described for the Proposed Action. The avoidance and minimization measures would be the same as described above for the Proposed Action. No mitigation measures would be warranted.
5.14.3 Alternative A - Maximally Restricted Operations Alternative Alternative A differs from the Proposed Action only with respect to operations. Construction- and decommissioning-related effects associated with Alternative A would be similar to those described for the Proposed Action. The operational differences would have minor effects on health and safety in that there would be a slightly reduced risk of ice shedding due to time-of- 20 A-weighting is a commonly arithmetic curve used for low-frequency noise.

Final Environmental Impact Statement Buckeye Wind Project April 2013
Chapter 5 - Environmental Consequences 5-159
year restrictions and reduced hours of operation and slightly reduced risk of blade shear due to reduced hours of operation. These risks would be lower under Alternative A than under the Proposed Action. The avoidance and minimization measures would be the same as under the Proposed Action. No mitigation measures would be warranted.
5.14.4 Alternative B - Minimally Restricted Operations Alternative Alternative B differs from the Proposed Action only with respect to operations. Construction- and decommissioning-related effects associated with Alternative B would be similar to those described for the Proposed Action. The operational differences would have minor effect on health and safety in that there would be a slightly increased risk of ice shedding due to time-of-year restrictions and increased hours of operation and slightly increased risk of blade shear due to increased hours of operation. These risks would be slightly higher under Alternative B than under the Proposed Action. The avoidance and minimization measures would be the same as under the Proposed Action. No mitigation measures would be warranted. .
5.14.5 Alternative C - No Action Alternative Under Alternative C, the Project would not be built and no Project-related activities (construction, operation, or decommissioning) would occur. Alternative C would have no effect on health and safety. As such, no mitigation measures would be warranted.
In summary, the full 100-turbine array is not likely to have an adverse flicker impact on non-participating permanent residences. There are several types of rare events that present remote safety risks associated with the Project, but these events are sufficiently rare that they are not considered significant.
5.15 Cumulative Effects
The CEQ defines cumulative effects as “the impact on the environment which results from the incremental impact of the action when added to other past, present, and reasonably foreseeable future actions regardless of what agency (federal or non-federal) or person undertakes such other actions” (40 CFR 1508.7). In 1997, the CEQ published Considering Cumulative Effects under the National Environmental Policy Act as a comprehensive guidance document for cumulative analyses. The CEQ guidelines acknowledge that while “in a broad sense all the impacts on affected resources are probably cumulative,” it is important to “count what counts” and narrow the focus of the analysis to important national, regional, and local issues. While the CEQ recommends this be done through scoping, they also caution that “not all potential cumulative effects issues identified during scoping need to be included” in an EIS, but only those effects with direct influence on the Project and Project decision-making.
This section analyzes the cumulative effects on each of the specific resources discussed in Sections 5.1 to 5.14, and provides an overall, synergistic analysis of the cumulative effects of the Proposed Action and action alternatives and other past, current, and reasonably foreseeable actions in the region surrounding the Project. Reasonably foreseeable actions are future actions that have been proposed. The geographic scope of this cumulative effects analysis varies for each resource depending on the spatial extent of potential cumulative impacts. The temporal
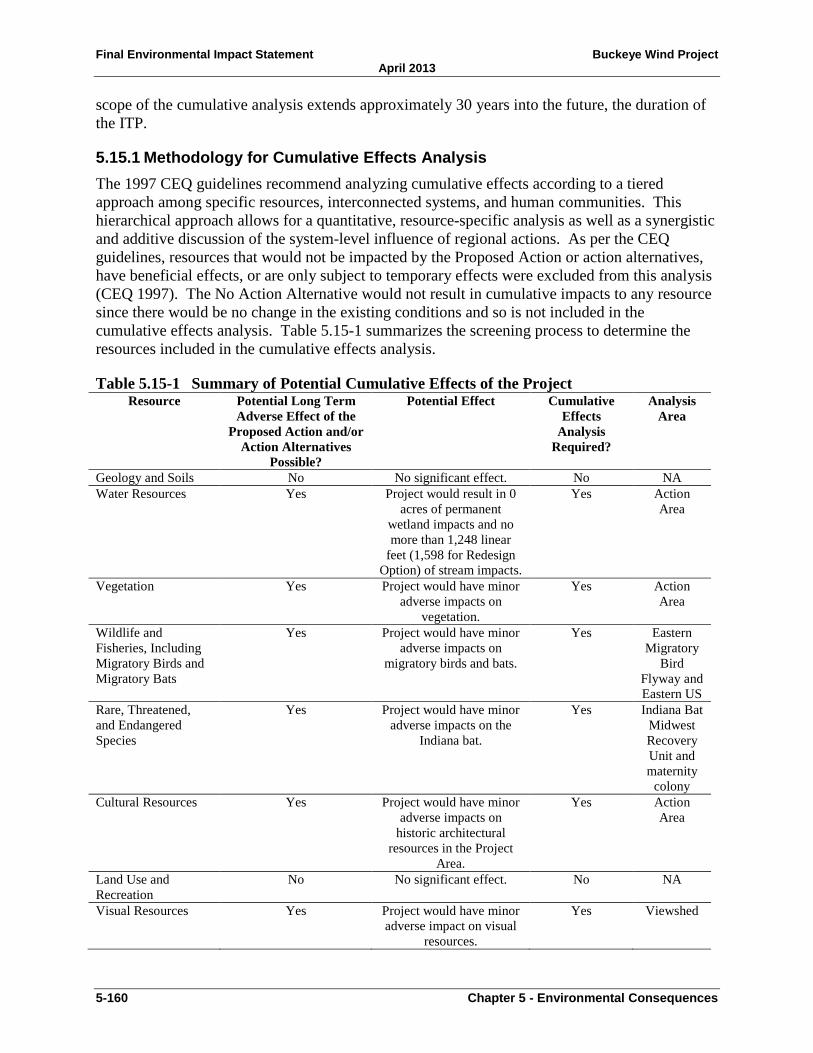
Final Environmental Impact Statement Buckeye Wind Project April 2013
5-160 Chapter 5 - Environmental Consequences
scope of the cumulative analysis extends approximately 30 years into the future, the duration of the ITP.
5.15.1 Methodology for Cumulative Effects Analysis The 1997 CEQ guidelines recommend analyzing cumulative effects according to a tiered approach among specific resources, interconnected systems, and human communities. This hierarchical approach allows for a quantitative, resource-specific analysis as well as a synergistic and additive discussion of the system-level influence of regional actions. As per the CEQ guidelines, resources that would not be impacted by the Proposed Action or action alternatives, have beneficial effects, or are only subject to temporary effects were excluded from this analysis (CEQ 1997). The No Action Alternative would not result in cumulative impacts to any resource since there would be no change in the existing conditions and so is not included in the cumulative effects analysis. Table 5.15-1 summarizes the screening process to determine the resources included in the cumulative effects analysis.
Table 5.15-1 Summary of Potential Cumulative Effects of the Project Resource Potential Long Term
Adverse Effect of the Proposed Action and/or
Action Alternatives Possible?
Potential Effect Cumulative Effects
Analysis Required?
Analysis Area
Geology and Soils No No significant effect. No NA Water Resources Yes Project would result in 0
acres of permanent wetland impacts and no more than 1,248 linear
feet (1,598 for Redesign Option) of stream impacts.
Yes Action Area
Vegetation Yes Project would have minor adverse impacts on
vegetation.
Yes Action Area
Wildlife and Fisheries, Including Migratory Birds and Migratory Bats
Yes Project would have minor adverse impacts on
migratory birds and bats.
Yes Eastern Migratory
Bird Flyway and Eastern US
Rare, Threatened, and Endangered Species
Yes Project would have minor adverse impacts on the
Indiana bat.
Yes Indiana Bat Midwest Recovery Unit and maternity
colony Cultural Resources Yes Project would have minor
adverse impacts on historic architectural
resources in the Project Area.
Yes Action Area
Land Use and Recreation
No No significant effect. No NA
Visual Resources Yes Project would have minor adverse impact on visual
resources.
Yes Viewshed

Final Environmental Impact Statement Buckeye Wind Project April 2013
Chapter 5 - Environmental Consequences 5-161
Resource Potential Long Term Adverse Effect of the
Proposed Action and/or Action Alternatives
Possible?
Potential Effect Cumulative Effects
Analysis Required?
Analysis Area
Socioeconomic Resources
No Project would have minor beneficial effect on
socioeconomic resources.
No NA
Noise No No significant effect. No NA Air Quality No Project would have minor
beneficial effect on air quality.
No NA
Transportation No Project would have only temporary minor adverse
impact during construction.
No NA
Communications No No significant effect. No NA Health and Safety No No significant effect. No NA
Reasonably Foreseeable Actions That Could Contribute to Cumulative Effects
Much of the Action Area and surrounding vicinity is zoned agricultural, and the Champaign, Union, Madison, Clark, and Logan County Comprehensive Plans and other local land use planning documents (see Section 4.7) reflect the intent of the Counties to remain largely agricultural in the foreseeable future. According to information provided by the Logan-Union-Champaign Regional Planning Commission and Champaign County, no residential subdivisions or large scale retail or commercial developments have been approved or are currently proposed for the Action Area and immediate vicinity (LUC Regional Planning Commission 2006; W. Dodds, LUC Regional Planning Commission, personal communication). For the reasonably foreseeable future, development in the Action Area is expected to be limited to residential and small scale retail commercial development. County building permits have been issued for several new residences (individual homes), pole barns, and an Ohio DOT equipment storage yard. Lot splits21 are a common practice but do not indicate plans for development (P. Rittenhouse, Champaign Co Building Regulations, personal communication; W. Dodds, LUC Regional Planning Commission, personal communication).
Within the larger five-county area (Champaign, Union, Madison, Clark, Logan Counties), numerous existing residential subdivisions (particularly in Clark, Champaign, and Union Counties) have continuing phases already approved, but these have been on hold for some time and it is unknown if and when they would resume development. The only major industrial/commercial development is associated with expansion of the existing Honda facilities near SR 33 and Northwest Highway in Union County (Allen Township) (P. Rittenhouse, Champaign Co Building Regulations, personal communication; W. Dodds, LUC Regional Planning Commission, personal communication).
21 A lot split is defined as the division of parcels less than five acres in size which do not involve the opening, widening or extension of any street or road, or easement of access, and does not involve more than five lots, including the remainder of the original tract (ORC, Section 711.131).

Final Environmental Impact Statement Buckeye Wind Project April 2013
5-162 Chapter 5 - Environmental Consequences
Accordingly, reasonably foreseeable actions that could contribute to cumulative effects include:
• Road maintenance and building projects within Champaign County;
• Small scale residential and business developments22 within the Action Area and immediately adjacent lands;
• Agricultural practices23 within the Action Area;
• Operational, under construction, or proposed wind projects, communications towers and buildings within the Eastern Flyway zone (Atlantic and Mississippi Flyways) and Indiana Bat Midwest Recovery Unit); and
• Habitat loss within the Bird Conservation Region and Midwest Recovery Unit.
5.15.2 Water Resources The cumulative effects analysis of water resources focuses on source water protection areas, floodplains, drainages, and wetlands within the Action Area. Neither the Proposed Action nor any of the action alternatives would affect any major waterbodies. Past human activities that have impacted water resources include agricultural practices, road maintenance practices, and residential and commercial development. Agricultural practices, such as clearing, draining, and filling, have had significant impacts on water resources since the days of early settlement in Ohio. During the early settlement period, common agricultural practice included draining swamps, and since 1850 approximately 90 percent of Ohio’s wetlands have been converted to other uses (Brown and Ward not dated). Impacts to water resources from these activities may have included erosion and sedimentation, similar to what is expected from the Project. The greatest source of past water quality impacts in the Project vicinity is from agricultural practices.
Reasonably foreseeable future actions in the Action Area that may impact water resources include road maintenance projects, continued agricultural use, and development of residences and small businesses. No major land developments are currently proposed in the Action Area. If a major development were to be proposed it would be subject to local, state, and possibly federal review, and would be required to comply with the USACE regulations pertaining to impacts to wetlands and streams and Ohio’s EPA rules for minimizing impacts to water resources.
Any cumulative effects to water resources from the combination of the Proposed Action with past, present, and reasonably foreseeable future actions would be minor because the state and/or federal permitting process(es) would require avoidance, minimization, and mitigation (in some cases) of impacts.
Alternative A – Maximally Restricted Operations Alternative Alternative A differs from the Proposed Action only with respect to operations. The operational differences would not affect water resources. As such, the cumulative effects of Alternative A would not differ from those of the Proposed Action.
22 In this case, small scale residential development was defined as developments of up to four residential units per residential lot (i.e., excludes larger multifamily housing, such as condominiums, apartments and other complexes). 23 In this case, agriculture includes individual and commercial farming and animal husbandry and related land clearing, tilling, water management, etc.

Final Environmental Impact Statement Buckeye Wind Project April 2013
Chapter 5 - Environmental Consequences 5-163
Alternative B – Minimally Restricted Operations Alternative Alternative B differs from the Proposed Action only with respect to operations. The operational differences would not affect water resources. As such, the cumulative effects of Alternative B would not differ from those of the Proposed Action.
Alternative C - No Action Alternative Under Alternative C, the Project would not be built and no Project-related activities (construction, operation, or decommissioning) would occur. Alternative C would have no effect on water resources. As such, there would be no cumulative effects on water resources from Alternative C.
5.15.3 Vegetation The cumulative effects analysis of vegetation focuses on the loss or alteration of natural vegetation within the Action Area. According to the ODNR Division of Wildlife (DOW) prior to settlement, the state of Ohio had 95% forest cover. However, as settlements and agriculture spread throughout Ohio, forested cover declined to a low of 12% in 1940 (ODNR DOW 2012). The spread of settlements also introduced many exotic diseases such as Dutch Elm disease and the chestnut blight, which altered the remaining composition of the Ohio’s forested areas. The year of 1940 was, however, the turning point for forest decline, as since 1940 there has been an increase of forest cover (ODNR DOW 2012).
Past actions that have impacted vegetation within the Action Area include timber harvesting, draining of wetlands, conversion of natural land to agriculture, and the expansion of development of single family residences, small subdivisions, and small businesses. As structures and associated road accesses were built, these activities cleared existing vegetation and altered the structure and composition of the natural communities. Expansion of agricultural activities in the Project Area required the clearing of natural vegetation and planting and maintaining of row crops or pasture. The majority (69%) of vegetation in the Action Area is cultivated crop, 13% is hay/pasture land cover, 9% is deciduous forest, and 6% is comprised of developed open space (i.e., recreational parks) (Figure 4.3-1). The remaining land cover types include grassland/herbaceous and low intensity development comprise 1% of the Action Area, while evergreen forest, barren land, mixed forest, and high intensity development each comprise less than 0.1% of the Action Area (Table 5.15-2, Figure 4.3.1).

Final Environmental Impact Statement Buckeye Wind Project April 2013
5-164 Chapter 5 - Environmental Consequences
Table 5.15-2 Historic Land Cover in the Action Area
Land Cover Type Hectares Acres Percent of
Action Area Cultivated crop 22,372 55,284 69.5% Hay/pasture 4,131 10,208 12.8% Deciduous forest 2,723 6,729 8.5% Developed, open space 1,901 4,699 5.9% Grassland/Herbaceous 406 1,004 1.3% Developed, low intensity 401 993 1.2% Open water 83 206 0.3% Developed, medium intensity 51 127 0.2% Emergent herbaceous wetland 34 84 0.1% Evergreen forest 29 73 0.1% Developed, high intensity 25 64 0.1% Barren land 13 32 0.0% Mixed forest 2 5 0.0% Total 32,171 79,508 100%
Source: Homer et al. 2004.
Reasonably foreseeable future actions in the Action Area that may impact vegetative communities over the next 30 years include conversion of natural land to agriculture and the development of single family residences and small businesses. No major road projects or developments involving a large amount of vegetation and habitat conversion have been proposed. The Project is estimated to result in a permanent loss of approximately 6.5 ha (16.1 ac) of forested land, 2.3 ha (5.7 ac) of CRP land, and 0.4 ha (1.0 ac) of hay/pasture/grassland (see Section 5.3 of this EIS for further details).
Any cumulative effects to vegetation from the combination of the Proposed Action with past, present, and reasonably foreseeable future actions would be minor because most of the impacts from the Project (over 90%) would impact cropland as opposed to natural vegetation communities and only small amounts of vegetation loss or habitat conversion are anticipated in the Action Area as a result of reasonable foreseeable future actions. Cumulatively, these actions would affect a very small proportion of the Action Area.
Alternative A – Maximally Restricted Operations Alternative Alternative A differs from the Proposed Action only with respect to operations. The operational differences would not affect vegetation. As such, the cumulative effects of Alternative A would not differ from those of the Proposed Action.
Alternative B – Minimally Restricted Operations Alternative Alternative B differs from the Proposed Action only with respect to operations. The operational differences would not affect vegetation. As such, the cumulative effects of Alternative B would not differ from those of the Proposed Action.

Final Environmental Impact Statement Buckeye Wind Project April 2013
Chapter 5 - Environmental Consequences 5-165
Alternative C - No Action Alternative Under Alternative C, the Project would not be built and no Project-related activities (construction, operation, or decommissioning) would occur. Alternative C would have no effect on vegetation. As such, there would be no cumulative effects on vegetation from Alternative C.
5.15.4 Wildlife and Fisheries: Migratory Birds The analysis of cumulative effects on wildlife focuses on mortality of migratory birds from collisions with man-made structures including communication towers, windows, and wind turbines including the Project and other existing, planned, or potential structures within the Eastern (Atlantic and Mississippi) flyway (Figure 4.4-2). The analysis for migratory birds also includes an evaluation of potential habitat impacts within the designated Bird Conservation Region(s) that incorporates the Action Area.
Cumulative effects to non-listed bats and the Indiana bat and other rare, threatened, and endangered wildlife species are addressed in Section 5.15.5.
Bird Mortality from Collisions with Human-made Structures
Fatalities as a result of collision with communication towers and the associated guy wires has been under increasing study and scrutiny as the number of towers increases exponentially. In 2002, there were 138,000 listed FCC towers, of which approximately 106,000 were lighted (Erickson et al. 2005). The FAA Digital Obstacle File for 2010 shows 3,060 communication towers in the state of Ohio, including 72 towers over 152.4 m (500 ft) and 44 over 243.8 m (800 ft).24 As of February 1, 2012, there were 96,039 communications towers nationwide, including in the five US territories, identified in the FCC database (FCC 2012). Approximately 2,800 new registered communications towers are conservatively projected to be constructed annually in the US over the next 10 years (FCC 2012). This represents an approximate 30 percent increase over the 96,039 communications towers in the existing environment as of February 1, 2012 (FCC 2012).
Bird collisions with communication towers have been documented and studied since the 1940s and collision estimates range from the USFWS’s conservative estimate of 4 or 5 million fatalities a year to as many as 40 or 50 million per year by some researchers (Manville 2005; Longcore et al 2011). Episodic bird fatality events have been documented at numbers ranging from less than 10 to more than 12,000 at a single tower in Wisconsin in 1963 (Kemper 1996). Studies have shown that the highest number of fatalities occur at lit towers in inclement weather, when birds become disoriented and circle the tower until they collide with the tower, guy wires, or simply collapse of exhaustion (Erickson et al. 2005). Taller towers, which tend to have more lights and guy wires, have higher collision rates. Towers with solid and pulsating red lights have higher collision rates than towers with white lights. Studies conducted by Gehring et al. (2009) found that by extinguishing solid burning red lights, the number of fatalities could be reduced by 50 to 71 percent. In March 2012, the Wireless Telecommunications Bureau (WTB) issued a Final Programmatic Environmental Assessment (PEA) that assesses the effects of its communication tower/antennae registration program on migratory birds (FCC 2012). The PEA concluded that the existing tower registration program has no significant effect on the environment (including 24 This figure is not comprehensive but indicates all towers that the FAA is aware of.

Final Environmental Impact Statement Buckeye Wind Project April 2013
5-166 Chapter 5 - Environmental Consequences
migratory birds) at the national level but that individual towers may have unaddressed significant effects on local populations of migratory birds and bald and golden eagles (FCC 2012). The PEA also concluded that tower siting restrictions and lighting requirements aimed at minimizing bird collisions would lessen the potential local population level effects of telecommunication towers on birds.
The USFWS developed a set of voluntary guidelines in 2000 for siting, constructing, operating, and decommissioning communication towers in a manner that minimizes potential impacts. In addition, the Federal Aviation Administration (FAA) released a report in May 2012 making a number of recommendations on changes to how communications towers are lighted in an effort to curb bird deaths. Among its recommendations is a proposal to omit or flash steady-burning red lights from several obstruction lighting configurations (FAA 2012). Adoption of these guidelines and recommendations would reduce bird deaths from telecommunications towers in the future.
Bird fatalities associated with buildings are typically the result of collision with windows (Erickson et al. 2005). Klem (1990) conducted research at residential homes and found that about 55 percent of bird-window collisions result in a fatality. Due to a paucity of long-term systematic research conducted across multiple regions, and the large and ever-changing number of structures in the US, fatality estimates vary widely, but the generally accepted figure is between one and 10 bird fatalities per structure per year, or between 97.6 to 976 million total bird deaths per year (Klem 1990; USFWS 2002; Erickson et al. 2005). Studies have shown that height or size of the window or building is not a significant contributing factor in these collisions, nor the age and sex of the bird, but rather the fact that the birds do not perceive transparent glass or reflective glass that mirrors the surrounding environment as a barrier (Klem 1989).
Current Wind Developments and Bird Mortality
In order to quantify bird mortality attributed to existing and near future wind power projects within the eastern flyways zone, Table 5.15-3 presents a summary of publically available data for avian mortality at wind power facilities that are located within the eastern flyways, relating annual avian mortality with the number of MW installed. Table 5.15-4 presents a summary of the total estimated number of turbines that were currently operating, under construction, or proposed as of 2011. This inventory did not include residential or small-scale industrial turbines as comprehensive data on the location and number of these turbines is unavailable.

Final Environmental Impact Statement Buckeye Wind Project April 2013
Chapter 5 - Environmental Consequences 5-167
Table 5.15-3. Results and Estimates of Annual Avian Mortality Based on Publicly Available Data from 43 Studies at 30 Different Wind Power Facilities that Fall within the Eastern Flyways
Site Habitat type
Total # turbines / Total MW Study Periods
Corrected for
SESR? 4
Estimated total bird
fatalities per year (min –
max) 1
Estimated bird fatalities per MW per year (min –
max) 1 Reference
Mars Hill, ME forested ridgeline 28 / 42
April 23 – June 3, 2007; July 15 - Sept
23 2007 Yes 12.32 - 69.2 0.29 - 1.65 Stantec 2008
Mars Hill, ME forested ridgeline 28 / 42
April 19 - June 6, 2008; July 15 - Oct
8, 2008 Unknown 67.2 - 74.2 1.36 - 1.76 Stantec 2009a
Stetson I, ME forested ridgeline 38 / 57 April 20 – Oct 21,
2009 Yes 153 2.68 Stantec 2009b
Massachusetts Maritime Academy, MA
coastal 1 / 0.66 April 24 – Nov 30, 2006 Unknown 1 2.1 Vlietstra 2008
Massachusetts Maritime Academy, MA
coastal 1 / 0.66 April 15 – Nov 30, 2007 Unknown 3 4.15 Vlietstra 2008
Jersey Atlantic, NJ
wetland wastewater treatment
5 / 7.5 Jan 1 - August 31, 2009 No 150 3 20 3 NJ Audubon
Society 2009
Maple Ridge, NY
woodland, grassland, agriculture
120 / 198 June 17 - Nov 15, 2006 Yes 372 -1138 1.88 - 5.75 Jain et al. 2007
Maple Ridge, NY
woodland, grassland, agriculture
195 / 321.75 April 30 - Nov 14, 2007 Yes 1106 - 1230 3.44 - 3.82 Jain et al. 2008
Maple Ridge, NY
woodland, grassland, agriculture
195 / 321.75 April 15 - Nov 9, 2008 Yes 667 - 733 2.07 - 2.28 Jain et al. 2009b
Munnsville, NY agriculture, forested uplands 23 / 34.5 April 15-Nov 15,
2008 Unknown 39 - 51 1.13 - 1.48 Stantec 2009c
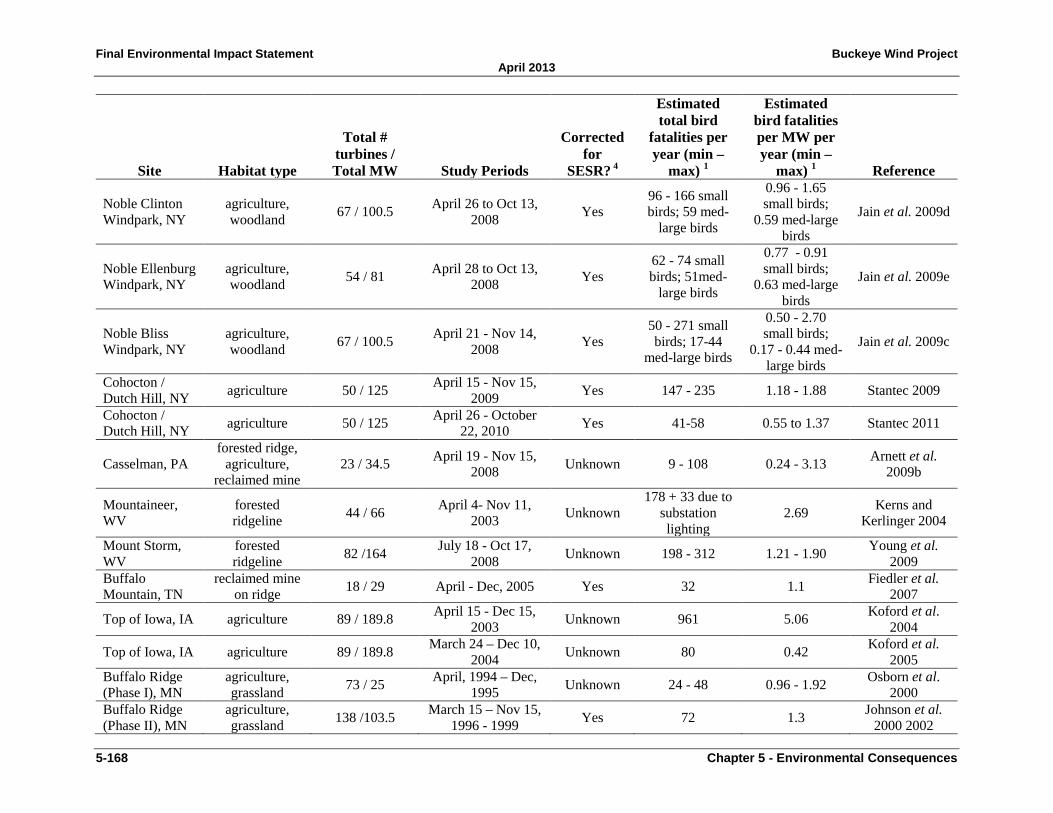
Final Environmental Impact Statement Buckeye Wind Project April 2013
5-168 Chapter 5 - Environmental Consequences
Site Habitat type
Total # turbines / Total MW Study Periods
Corrected for
SESR? 4
Estimated total bird
fatalities per year (min –
max) 1
Estimated bird fatalities per MW per year (min –
max) 1 Reference
Noble Clinton Windpark, NY
agriculture, woodland 67 / 100.5 April 26 to Oct 13,
2008 Yes 96 - 166 small birds; 59 med-
large birds
0.96 - 1.65 small birds;
0.59 med-large birds
Jain et al. 2009d
Noble Ellenburg Windpark, NY
agriculture, woodland 54 / 81 April 28 to Oct 13,
2008 Yes 62 - 74 small birds; 51med-
large birds
0.77 - 0.91 small birds;
0.63 med-large birds
Jain et al. 2009e
Noble Bliss Windpark, NY
agriculture, woodland 67 / 100.5 April 21 - Nov 14,
2008 Yes 50 - 271 small birds; 17-44
med-large birds
0.50 - 2.70 small birds;
0.17 - 0.44 med-large birds
Jain et al. 2009c
Cohocton / Dutch Hill, NY agriculture 50 / 125 April 15 - Nov 15,
2009 Yes 147 - 235 1.18 - 1.88 Stantec 2009
Cohocton / Dutch Hill, NY agriculture 50 / 125 April 26 - October
22, 2010 Yes 41-58 0.55 to 1.37 Stantec 2011
Casselman, PA forested ridge,
agriculture, reclaimed mine
23 / 34.5 April 19 - Nov 15, 2008 Unknown 9 - 108 0.24 - 3.13 Arnett et al.
2009b
Mountaineer, WV
forested ridgeline 44 / 66 April 4- Nov 11,
2003 Unknown 178 + 33 due to
substation lighting
2.69 Kerns and Kerlinger 2004
Mount Storm, WV
forested ridgeline 82 /164 July 18 - Oct 17,
2008 Unknown 198 - 312 1.21 - 1.90 Young et al. 2009
Buffalo Mountain, TN
reclaimed mine on ridge 18 / 29 April - Dec, 2005 Yes 32 1.1 Fiedler et al.
2007
Top of Iowa, IA agriculture 89 / 189.8 April 15 - Dec 15, 2003 Unknown 961 5.06 Koford et al.
2004
Top of Iowa, IA agriculture 89 / 189.8 March 24 – Dec 10, 2004 Unknown 80 0.42 Koford et al.
2005 Buffalo Ridge (Phase I), MN
agriculture, grassland 73 / 25 April, 1994 – Dec,
1995 Unknown 24 - 48 0.96 - 1.92 Osborn et al. 2000
Buffalo Ridge (Phase II), MN
agriculture, grassland 138 /103.5 March 15 – Nov 15,
1996 - 1999 Yes 72 1.3 Johnson et al. 2000 2002

Final Environmental Impact Statement Buckeye Wind Project April 2013
Chapter 5 - Environmental Consequences 5-169
Site Habitat type
Total # turbines / Total MW Study Periods
Corrected for
SESR? 4
Estimated total bird
fatalities per year (min –
max) 1
Estimated bird fatalities per MW per year (min –
max) 1 Reference Buffalo Ridge (Phase II), MN
agriculture, grassland 138 /103.5 March 15 – Nov 15,
1999 Yes 614 5.93 Johnson et al. 2000 2002
Buffalo Ridge (Phase III), MN agriculture 143 / 107.25 March 15 - Nov 15,
1998-1999 Yes 325 3.03 Johnson et al. 2000 2002
Blue Sky Green Field, WI agricultural 88 / 145 July 21 - Oct 3,
2008 Yes 1041 7.18 Gruver et al. 2009
Blue Sky Green Field, WI agriculture 88 / 145 March 17 - June 4,
2009 Yes 631 4.35 Gruver et al. 2009
Kewaunee County, WI agriculture 31 / 20.4 1999 - 2001 Yes 40 1.96 Howe 2002
Oklahoma Wind Energy Center, OK
agriculture, wooded riparian 68 / 102 May - July, 2004 -
2005 Yes 3 - 8 0.03 - 0.08 Piorkowski 2006
NPPD Ainsworth Wind Farm, NE
sandhills, grassland pastoral
36 / 59.4 March 13 - November 4, 2007 Unknown 97 1.62 Derby et al.
2007
Forward Energy Center, WI
agriculture, deciduous woodlands
86 / 129
July 15 - November 15, 2008; April 15 - May 31, 2009 and 2010; July 15 - Oct
15, 2009
Yes N/A 1.17 Drake et al.
2010; Grodsky and Drake 2011
Fowler Ridge Wind Farm, IN
agriculture, pastoral,
grassland, wooded
355 / 600 April 13 - May 15, 2010 and July 30 – October 15, 2010
No 60 0.1 Good et al. 2011
6-3, PA N/A N/A May 1 – November 15, 2007 Yes N/A 0.9 Mumma and
Capouillez 2011
6-3, PA N/A N/A April 1 – November 15, 2008 Yes N/A 1.2 Mumma and
Capouillez 2011
2-2, PA N/A N/A April 1 – November 15, 2008 Yes N/A 1.5 Mumma and
Capouillez 2011
2-2, PA N/A N/A April 1 – November 15, 2009 Yes N/A 3.0 Mumma and
Capouillez 2011 2-14, PA 7 N/A N/A April 1 – November Yes, but did N/A 3.1 Mumma and

Final Environmental Impact Statement Buckeye Wind Project April 2013
5-170 Chapter 5 - Environmental Consequences
Site Habitat type
Total # turbines / Total MW Study Periods
Corrected for
SESR? 4
Estimated total bird
fatalities per year (min –
max) 1
Estimated bird fatalities per MW per year (min –
max) 1 Reference 15, 2008 not follow
PGC protocol 5
Capouillez 2011
2-14, PA N/A N/A April 1 – November 15, 2009 Yes N/A 2.4 Mumma and
Capouillez 2011
2-10, PA 7 N/A N/A April 1 – November 15, 2008
Yes, but did not follow
PGC protocol 5
N/A 1.3
Mumma and Capouillez 2011
2-4, PA N/A N/A April 1 – November 15, 2009 Yes N/A 9.8 Mumma and
Capouillez 2011
5-5, PA 7 N/A N/A April 1 – November 15
Yes, but did not follow
PGC protocol 5
N/A 1.0 Mumma and Capouillez 2011
24-3, PA 7 N/A N/A April 1 – November 15
Yes, but did not follow
PGC protocol 5
N/A 2.7 Mumma and Capouillez 2011
6-1, PA N/A N/A April 1 – November 15, 2009 Yes N/A 1.7 Mumma and
Capouillez 2011 Average 6 N/A N/A N/A N/A N/A 3.02 N/A
1 Unless otherwise indicated, for reported fatality estimates, 'year' represents 'study year' or the study period. 2 Author corrected number to estimate fatality on a year round basis. 4 Searcher efficiency and scavenger removal. 5 The site has an approved monitoring plan with the Pennsylvania Game Commission (PGC) that was not adhered to, resulting in inaccurate mortality estimates (Mumma and Capouillez 2011). 6 Average calculated using maximum number if a range given. The studies that did not follow PGC protocol (Mumma and Capouillez 2011) were not included in the calculations to estimate average fatalities of birds. 7 Studies colored in gray did not follow PGC protocol (Mumma and Capouillez 2011), so were not included in average mortality estimates.
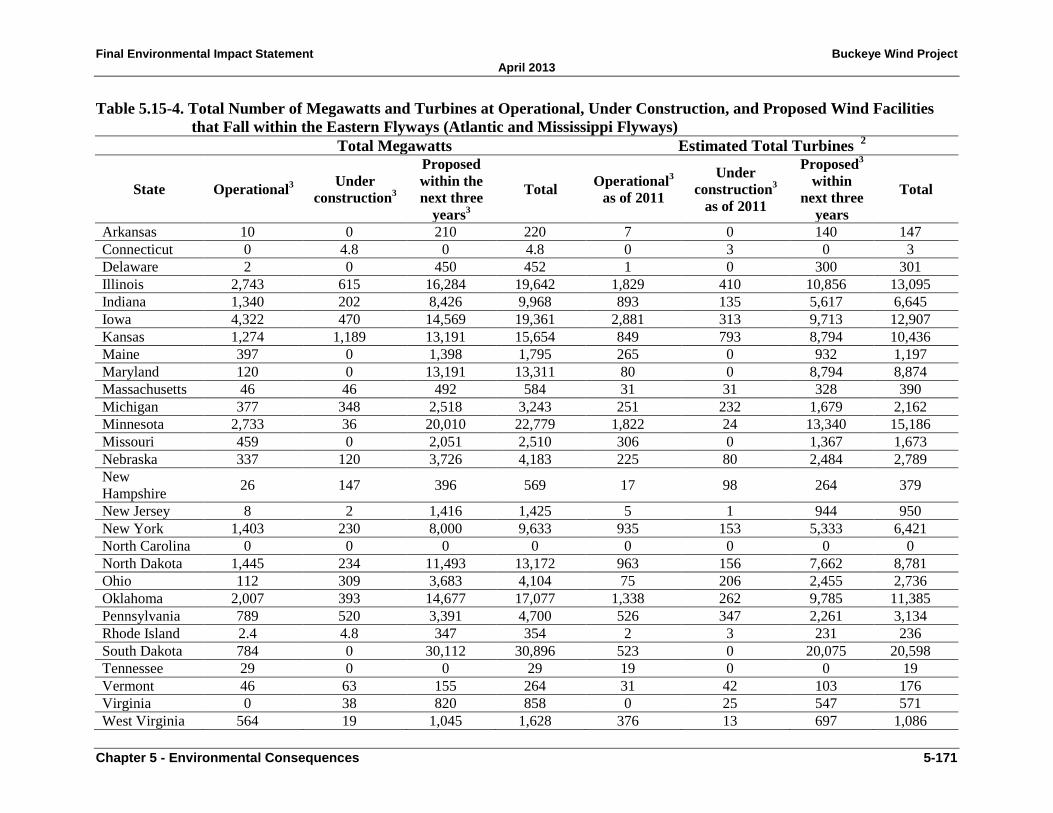
Final Environmental Impact Statement Buckeye Wind Project April 2013
Chapter 5 - Environmental Consequences 5-171
Table 5.15-4. Total Number of Megawatts and Turbines at Operational, Under Construction, and Proposed Wind Facilities that Fall within the Eastern Flyways (Atlantic and Mississippi Flyways)
Total Megawatts Estimated Total Turbines 2
State Operational3 Under construction3
Proposed within the next three
years3
Total Operational3
as of 2011
Under construction3
as of 2011
Proposed3
within next three
years
Total
Arkansas 10 0 210 220 7 0 140 147 Connecticut 0 4.8 0 4.8 0 3 0 3 Delaware 2 0 450 452 1 0 300 301 Illinois 2,743 615 16,284 19,642 1,829 410 10,856 13,095 Indiana 1,340 202 8,426 9,968 893 135 5,617 6,645 Iowa 4,322 470 14,569 19,361 2,881 313 9,713 12,907 Kansas 1,274 1,189 13,191 15,654 849 793 8,794 10,436 Maine 397 0 1,398 1,795 265 0 932 1,197 Maryland 120 0 13,191 13,311 80 0 8,794 8,874 Massachusetts 46 46 492 584 31 31 328 390 Michigan 377 348 2,518 3,243 251 232 1,679 2,162 Minnesota 2,733 36 20,010 22,779 1,822 24 13,340 15,186 Missouri 459 0 2,051 2,510 306 0 1,367 1,673 Nebraska 337 120 3,726 4,183 225 80 2,484 2,789 New Hampshire 26 147 396 569 17 98 264 379
New Jersey 8 2 1,416 1,425 5 1 944 950 New York 1,403 230 8,000 9,633 935 153 5,333 6,421 North Carolina 0 0 0 0 0 0 0 0 North Dakota 1,445 234 11,493 13,172 963 156 7,662 8,781 Ohio 112 309 3,683 4,104 75 206 2,455 2,736 Oklahoma 2,007 393 14,677 17,077 1,338 262 9,785 11,385 Pennsylvania 789 520 3,391 4,700 526 347 2,261 3,134 Rhode Island 2.4 4.8 347 354 2 3 231 236 South Dakota 784 0 30,112 30,896 523 0 20,075 20,598 Tennessee 29 0 0 29 19 0 0 19 Vermont 46 63 155 264 31 42 103 176 Virginia 0 38 820 858 0 25 547 571 West Virginia 564 19 1,045 1,628 376 13 697 1,086

Final Environmental Impact Statement Buckeye Wind Project April 2013
5-172 Chapter 5 - Environmental Consequences
Total Megawatts Estimated Total Turbines 2
State Operational3 Under construction3
Proposed within the next three
years3
Total Operational3
as of 2011
Under construction3
as of 2011
Proposed3
within next three
years
Total
Wisconsin 631 5 908 1,544 421 3 605 1,029 Total 22,006 4,996 172,959 199,961 14,671 3,330 115,306 133,307
Adjusted Total1 22,006 4,996 34,592 61,594 14,671 3,330 23,061 41,062
Source: AWEA (2012) 1 Based on the assumption that of the proposed projects a maximum of 20 percent would ultimately be constructed within the near future (i.e., next 3 years). Twenty percent represents an aggressive assumption of the number of proposed projects that will be built in the next 3 years, based on the history of the PJM interconnect queue (NREL 2009), and actual build out is likely to be far less based on industry experience and market factors. The U.S. Energy Information Administration (EIA) projection for long term (2035) installed capacity provides the best estimate for wind power capacity during the ITP Term (EIA 2012, see Table 5.15-6). 2 Extrapolated using an average wind turbine rated capacity of 1.5 MW (Table 5.15-2). 3 Operational refers to online capacity or turbines. Under construction refers to wind facilities that have been approved and are currently being built. Proposed refers to wind facilities that have been proposed to be built.

Final Environmental Impact Statement Buckeye Wind Project April 2013
Chapter 5 - Environmental Consequences 5-173
At the end of 2011, there were approximately 14,671 wind turbines, producing an estimated 22,006 MW of total electricity, in operation in the eastern flyways zone (AWEA 2012). Within the next 3 years, assuming only 20 percent of the proposed projects would be constructed (NREL 2009), approximately 41,062 wind turbines could be operational in the eastern flyways zone, producing an estimated 61,594 MW of electricity. Two percent of the total operational, under construction, and proposed wind facilities are located in Ohio (Table 5.15-4).
Based on data available from 43 studies at 30 wind power facilities (Table 5.15-3), it was determined that an average of 3.02 bird fatalities occur per MW per year (Table 5.15-3). Because turbines under the Proposed Action would be spinning fewer hours of the night compared to other turbines in the eastern flyway due to the proposed feathering and cut-in speeds, we would expect this project to result in mortality rates of less than 3.02 birds per MW per year. In Section 5.4 we calculated that the Proposed Project would result in mortality of 2.94 birds/MW/year or 735 birds/year for the 100-turbine (250 MW) project. Other wind projects in the reasonably foreseeable future (projects currently operational, under construction, and proposed) in the eastern flyways zone are estimated to cause 186,014 birds mortalities per year (Table 5.15-5). As such, projected bird mortality related to the Project would comprise 0.4% of the total projected near term wind power-related bird mortality in the eastern flyways zone.
Table 5.15-5. Projected Avian Mortality for the Buckeye Wind Power Project in Relationship to Estimated Wind Power Production in the Eastern Flyways Zone
Installation MW Annual
Mortality (birds/year) 1
Mortality Over the Operational Life of
Buckeye Wind Project
Buckeye Wind Project2 250 735² 18,375 Operational, Under Construction, and Proposed Wind Projects3
61,594 186,014 4,650,347
¹ Based on calculated average of 3.02 birds per MW per year derived from results of 43 mortality studies conducted at wind energy facilities in the eastern and Midwestern US. ² Based on maximum build out scenario of 100 2.5 MW turbines and a 25-year operational life of the facility, and then reduced by 2.5% to account for feathering and cut-in speeds, as described in Section 5.4. 3 Assumes all operational and under construction projects are built and operating. Assumes only 20% of proposed projects are built and operating (see footnote 1 Table 5.15-4). Assumes all of these facilities operate over the same 25-year life as Buckeye.
Future Wind Developments and Bird Mortality
In order to consider potential bird mortality at wind projects over the life of the Project, it was necessary to examine the projected growth of wind power construction and operation over the next 30 years. The US Department of Energy (US DOE) has set goals for wind energy to comprise 20 percent of America’s electricity supply by 2030. It was estimated based on data from AWEA (2012) and Annual Energy Outlooks commissioned by the US DOE EIA (2010, 2011, 2012), that wind energy production in the eastern flyways zone in the year 2035 would be approximately 81,441 MW of installed capacity (Table 5.15-6).

Final Environmental Impact Statement Buckeye Wind Project April 2013
5-174 Chapter 5 - Environmental Consequences
Table 5.15-6. Year 2035 Wind Energy Production for 29 States in the Eastern Flyways Zone
State 2011 Operating Wind Capacity (MW)
Projected Wind Power Capacity in 2035 (MW) 1
Arkansas 10 37.0 Connecticut 4.8 17.8 Delaware 2 7.4 Illinois 2,743 10,149.1 Indiana 1,340 4,958.0 Iowa 4,322 15,991.4 Kansas 1,274 4,713.8 Maine 397 1,468.9 Maryland 120 444.0 Massachusetts 46 170.2 Michigan 377 1,394.9 Minnesota 2,733 10,112.1 Missouri 459 1,698.3 Nebraska 337 1,246.9 New Hampshire 26 96.2 New Jersey 8 29.6 New York 1,403 5,191.1 North Carolina 0 0.0 North Dakota 1,445 5,346.5 Ohio 112 414.4 Oklahoma 2,007 7,425.9 Pennsylvania 789 2,919.3 Rhode Island 2.4 8.9 South Dakota 784 2,900.8 Tennessee 29 107.3 Vermont 46 170.2 Virginia 0 0.0 West Virginia 564 2,086.8 Wisconsin 631 2,334.7
Total 22,011 81,441.41
1 Total represents projected capacity in 2035 based on operating capacity in 2011.
Assuming the Project is built in 2013 and becomes operational in 2014, and is operational for 25 years, it would be operational until 2039. This is four years beyond the DOE analysis. However, applying the annual take estimate (3.02 birds/MW/year) to the 2035 DOE projected estimate of 81,441 MW assuming the same 25-year operational timeframe as the Project still generates a reasonable worst-case estimate of bird mortality throughout the life of the Project--by assuming that the full 2035 build-out is occurring at the same time as the Project (which is not likely) and resulting in take of 3.02 bird/MW/year. In reality, wind projects will be built gradually over the years, old projects will be decommissioned over the years, and total bird mortality will increase gradually as installed MW increases. Therefore, although it is possible that more MW may be

Final Environmental Impact Statement Buckeye Wind Project April 2013
Chapter 5 - Environmental Consequences 5-175
installed between 2035 and 2039, mortality resulting from those additional MW in those years is already captured in the estimate by attributing it in the early years.
Using the fatality rate of 3.02 bird fatalities per MW per year, total bird mortality in the eastern flyways zone due to the projected capacity by 2035 is estimated to be 6,148,796 (Table 5.15-7). Of this number, the Project would result in approximately 18,375 bird mortalities by 2035.
Table 5.15-7. Projected Avian Mortality for the Buckeye Wind Power Project in Relationship to Estimated Wind Power Production Projected for Year 2035 in the Eastern Flyways Zone
Installation MW Annual mortality (birds/year) 1
Mortality over the Operational Life of
Buckeye Wind Project
Buckeye Wind Power Project2 250 735² 18,375
Operational, under construction, and proposed wind projects3
61,594 186,014 4,650,347
Projected total wind capacity in 2035 81,441 245,952 6,148,796
¹ Based on calculated average of 3.02 birds per MW per year derived from results of 43 mortality studies conducted at wind energy facilities in the eastern and Midwestern US. ² Based on maximum build out scenario of 100 2.5 MW turbines and a 25-year operational life of the facility, and then reduced by 2.5% to account for feathering and cut-in speeds, as described in Section 5.4. 3 Assumes all operational and under construction projects are built and operating. Assumes only 20% of proposed projects are built and operating (see footnote 1 Table 5.15-4). Assumes all of these facilities operate over the same 25-year life as Buckeye.
If each proposed wind facility implemented an ABPP similar to that developed for the Project and included lighting that is designed to minimize bird collisions such as that recommended by FAA (FAA 2012), mortality could be reduced. Episodic mortality events of single or multiple species related to lighting during migration could be minimized or avoided all together (see discussion below). If each wind facility implemented an adaptive management procedure similar to that outlined in the Project ABPP, bird mortality could be further reduced. While the projected mortality as a result of the Project (18,375 birds by 2035) still appears high, it is a substantial reduction compared to what is currently occurring at wind facilities across the nation and would reduce cumulative impacts to birds from collisions with structures.
Episodic Collision Events
Of particular concern relative to bird collisions with all types of structures are episodic events involving large numbers of one or a few bird species during migration. These have been recorded at multiple locations, and are associated with lighting that attracts or disorients birds. Two episodic mortality events were observed in West Virginia during 2011. In October 2011 a total of 484 bird carcasses were found at the Laurel Mountain Substation, near a wind facility, after several days of fog, cold weather, and winds. Eight 250-watt high pressure sodium lamps

Final Environmental Impact Statement Buckeye Wind Project April 2013
5-176 Chapter 5 - Environmental Consequences
were on at night during the event and were assumed to have attracted birds during adverse weather conditions. Of the 484 birds found, Blackpoll warblers were the most common species (308 carcasses), comprising 64 percent of mortalities, followed by Ovenbird (37, 7.6%), Connecticut warbler (24, 5%), Common yellowthroat (22, 4.5%), Cape May warbler (18, 3.7%) and Red-eyed vireo (12, 2.5%) (Stantec 2011). The remaining species comprised one percent or less each of the total mortality.
Similarly in September 2011 at the Mount Storm Wind Energy Facility in West Virginia, 59 bird carcasses were found on one day, 31 of which were found at one turbine whose internal nacelle light had been inadvertently left on overnight. The previous night’s weather had been foggy, and the nacelle light was thought to have attracted the birds to the turbine. Species composition of mortalities was dominated by Red-eyed vireo (13), Blackpoll warblers (5), Yellow-billed cuckoo (4), Black-throated blue warbler (4), Magnolia warbler (4), Gray-cheeked thrush (3), Common yellowthroat (3), and Chestnut-sided warbler (3) (WEST, Inc. 2011).
One episodic mortality event at a wind facility occurred in heavy fog during spring migration at Mountaineer Wind Energy Center in West Virginia and consisted of 33 passerine fatalities. After the event was recorded in the vicinity of a substation and three turbines which were brightly lit, the lights were extinguished and no other episodic events have been recorded since (Kerns and Kerlinger as cited in NRC 2007).
As described above, episodic bird fatality events have been documented at communications towers at numbers ranging from less than 10 to more than 12,000 at a single tower in Wisconsin in 1963 (Kemper 1996). Studies have shown that the highest number of fatalities occur at lit towers in inclement weather, when birds become disoriented and circle the tower until they collide with the tower, guy wires, or simply collapse of exhaustion (Erickson et al. 2005). Taller towers, which tend to have more lights and guy wires, have higher collision rates. Towers with solid and pulsating red lights have higher collision rates than towers with white lights.
Episodic events are of concern because they often result in large numbers of individual mortalities, and only a few species. As wind turbines, communication towers, and other tall lit structures continue to increase in number throughout the eastern flyways, episodic events may become more common, and could result in significant impacts to those species most frequently killed. All research on this phenomenon suggests that by altering the lighting protocol at tall structures, episodic mortality events can be substantially reduced, if not eliminated.
Species Composition of Bird Collisions
Species composition of bird fatalities at wind facilities varies. Passerines (e.g., perching birds or songbirds) represent approximately 70 percent of all observed wind turbine related fatalities. Species that could not be identified comprise approximately 12 percent of the total fatalities, followed by raptors (5.3 %), game birds (4.7 %), waterfowl (2.4 %), shorebirds (1.6 %), seabirds (0.7 %), and owls (0.5 %) (see Appendix C Table 4-1). Many of the species that suffer from high fatality rates in the western and mid-western US include horned larks, versper sparrows, bobolink, and western meadowlark. The first three aforementioned species are high-flying aerial displayers and are commonly observed at heights within the rotor-swept area of wind turbines. Meadowlarks, on the other hand, are not known for being high flyers, but have a high fatality
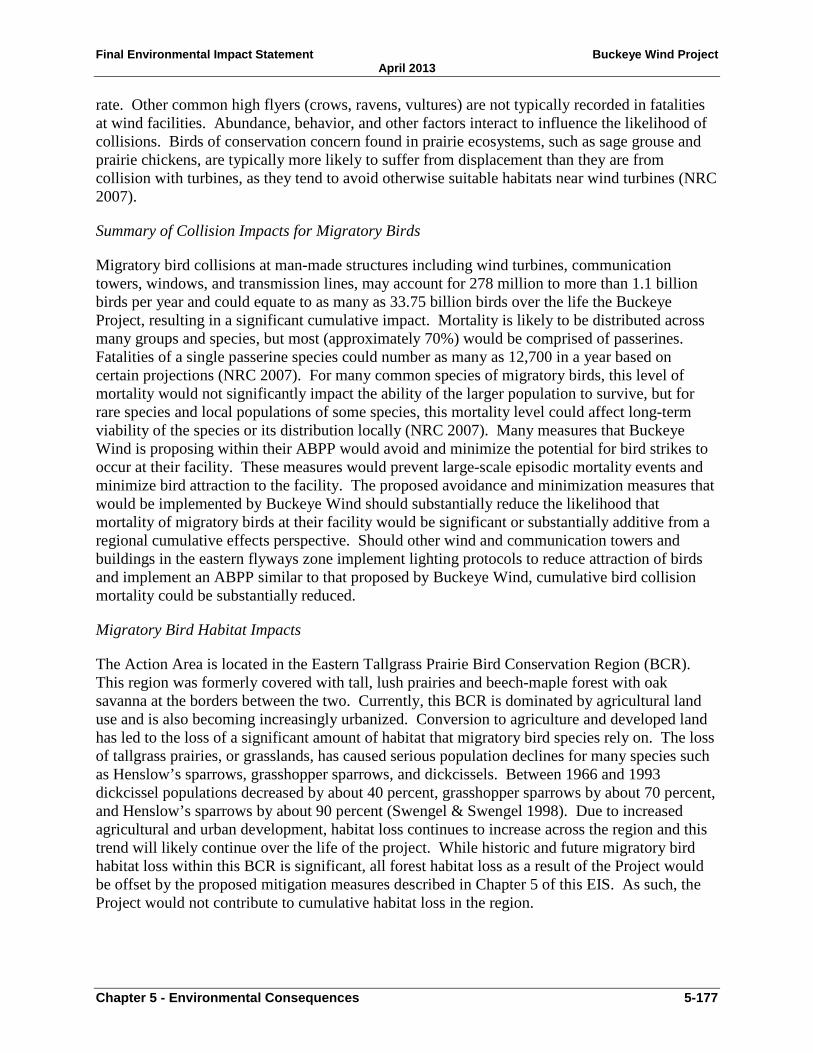
Final Environmental Impact Statement Buckeye Wind Project April 2013
Chapter 5 - Environmental Consequences 5-177
rate. Other common high flyers (crows, ravens, vultures) are not typically recorded in fatalities at wind facilities. Abundance, behavior, and other factors interact to influence the likelihood of collisions. Birds of conservation concern found in prairie ecosystems, such as sage grouse and prairie chickens, are typically more likely to suffer from displacement than they are from collision with turbines, as they tend to avoid otherwise suitable habitats near wind turbines (NRC 2007).
Summary of Collision Impacts for Migratory Birds
Migratory bird collisions at man-made structures including wind turbines, communication towers, windows, and transmission lines, may account for 278 million to more than 1.1 billion birds per year and could equate to as many as 33.75 billion birds over the life the Buckeye Project, resulting in a significant cumulative impact. Mortality is likely to be distributed across many groups and species, but most (approximately 70%) would be comprised of passerines. Fatalities of a single passerine species could number as many as 12,700 in a year based on certain projections (NRC 2007). For many common species of migratory birds, this level of mortality would not significantly impact the ability of the larger population to survive, but for rare species and local populations of some species, this mortality level could affect long-term viability of the species or its distribution locally (NRC 2007). Many measures that Buckeye Wind is proposing within their ABPP would avoid and minimize the potential for bird strikes to occur at their facility. These measures would prevent large-scale episodic mortality events and minimize bird attraction to the facility. The proposed avoidance and minimization measures that would be implemented by Buckeye Wind should substantially reduce the likelihood that mortality of migratory birds at their facility would be significant or substantially additive from a regional cumulative effects perspective. Should other wind and communication towers and buildings in the eastern flyways zone implement lighting protocols to reduce attraction of birds and implement an ABPP similar to that proposed by Buckeye Wind, cumulative bird collision mortality could be substantially reduced.
Migratory Bird Habitat Impacts
The Action Area is located in the Eastern Tallgrass Prairie Bird Conservation Region (BCR). This region was formerly covered with tall, lush prairies and beech-maple forest with oak savanna at the borders between the two. Currently, this BCR is dominated by agricultural land use and is also becoming increasingly urbanized. Conversion to agriculture and developed land has led to the loss of a significant amount of habitat that migratory bird species rely on. The loss of tallgrass prairies, or grasslands, has caused serious population declines for many species such as Henslow’s sparrows, grasshopper sparrows, and dickcissels. Between 1966 and 1993 dickcissel populations decreased by about 40 percent, grasshopper sparrows by about 70 percent, and Henslow’s sparrows by about 90 percent (Swengel & Swengel 1998). Due to increased agricultural and urban development, habitat loss continues to increase across the region and this trend will likely continue over the life of the project. While historic and future migratory bird habitat loss within this BCR is significant, all forest habitat loss as a result of the Project would be offset by the proposed mitigation measures described in Chapter 5 of this EIS. As such, the Project would not contribute to cumulative habitat loss in the region.

Final Environmental Impact Statement Buckeye Wind Project April 2013
5-178 Chapter 5 - Environmental Consequences
Alternative A – Maximally Restricted Operations Alternative The operational adjustment under Alternative A would involve all 100 turbines being non-operational from sunset to sunrise from April 1 through October 31, which would reduce the collision risk to night-flying birds during this period. Birds would still experience collision risks associated with early spring and late-fall migration, as described above for the Proposed Action. Diurnally active migratory and resident birds and winter resident birds would also be exposed to collision risk during their regular activities within the Action Area. Since operation would be similar, it can be assumed that mortality impacts to bird species would be similar to the Proposed Action during the period from November 1 through March 31, but somewhat lower from April 1 through October 31.
Section 5.4.3 describes that Alternative A would result in take of approximately 2.27 birds/MW/year or 568 birds per year for the 100-turbine (250 MW) project. If take of 2.27 birds/MW/year were applied to the projected total wind capacity in Eastern Flyway zone in 2035 of 81,441 MW (Table 5.15-7), take of migratory birds from wind facilities in this zone would be approximately 184,871 birds per year.
Mortality is likely to be distributed across many groups and species, but most (approximately 70%) would be comprised of passerines. Fatalities of a single passerine species could number as many as 12,700 in a year based on certain projections (NRC 2007). For many common species of migratory birds, this level of mortality would not significantly impact the ability of the larger population to survive, but for rare species and local populations of some species, this mortality level could affect long-term viability of the species or its distribution locally (NRC 2007). The operational regime proposed in this Alternative would avoid and minimize the potential for night-migrating bird strikes during the peak migratory period. Further the ABPP would be implemented and the measures described within it would prevent large-scale episodic mortality events and minimize bird attraction to the facility. The proposed avoidance and minimization measures that would be implemented under this Alternative should substantially reduce the likelihood that mortality of migratory birds would be significant or substantially additive from a regional cumulative effects perspective. Should other wind and communication towers and buildings in the eastern flyways zone implement lighting protocols to reduce attraction of birds, cease operation at night during peak migration periods, and implement an ABPP similar to that proposed by Buckeye Wind, cumulative bird collision mortality could be substantially reduced.
Alternative B – Minimally Restricted Operations Alternative The operational adjustment under Alternative B would involve feathering turbines until cut-in speeds of 5.0 m/s (11 mph) for all 100 turbines during the first one to six hours after sunset from August 1 through October 31. Section 5.4.4 describes that it would be appropriate to assume that Alternative B may result in mortality of 3.018 birds/MW/year or 754 birds/year for the 100-turbine (250 MW) project, essentially the same as the average in the Eastern Flyway. If take of 3.018 birds/MW/year were applied to the projected total wind capacity in Eastern Flyway zone in 2035 of 81,441 MW (Table 5.15-7), take of migratory birds from wind facilities in this zone would be approximately 245,788 birds per year.
Mortality is likely to be distributed across many groups and species, but most (approximately 70%) would be comprised of passerines. Fatalities of a single passerine species could number as many as 12,700 in a year based on certain projections (NRC 2007). For many common species
Final Environmental Impact Statement Buckeye Wind Project April 2013
Chapter 5 - Environmental Consequences 5-179
of migratory birds, this level of mortality would not significantly impact the ability of the larger population to survive, but for rare species and local populations of some species, this mortality level could affect long-term viability of the species or its distribution locally (NRC 2007). The operational regime proposed in this Alternative would minimize the potential for some night-migrating bird strikes during the fall migratory period. Further the ABPP would be implemented and the measures described within it would prevent large-scale episodic mortality events and minimize bird attraction to the facility. The proposed avoidance and minimization measures that would be implemented under this Alternative may reduce bird mortality somewhat compared to a facility operating without any cut-in speeds or ABPP, and would reduce the likelihood of episodic collisions. Should other wind and communication towers and buildings in the eastern flyways zone implement lighting protocols to reduce attraction of birds, reduce operation at night during the fall migration periods, and implement an ABPP similar to that proposed by Buckeye Wind, cumulative bird collision mortality could be reduced. At this time it is unknown whether or not the take of 245,788 migratory birds per year would rise to the level of significance from a regional cumulative effects perspective.
Alternative C - No Action Alternative Under Alternative C, the Project would not be built and no Project-related activities (construction, operation, or decommissioning) would occur. Alternative C would have no effect on wildlife and fisheries. As such, there would be no cumulative effects on wildlife and fisheries from Alternative C.
5.15.5 Indiana Bat and Non-Listed Bat Species The impact analysis for threatened and endangered species (Section 5.5 of this EIS) predicted the Project would not result in significant impacts to species other than the Indiana bat. Therefore, this cumulative effects analysis focuses primarily on cumulative impacts to the Indiana bat from the Project and other existing, planned, or potential wind facilities in the USFWS-defined Midwest Recovery Unit (RU) (Figure 4.5-1). Indiana bat populations that may be impacted by the Project over the 30-year timeframe include both summer resident populations and migratory bats. Mortality of Indiana bats would be considered significant if substantial reductions in population size or distribution of this species was caused.
Because the impacts on Indiana bats are similar to impacts on other non-listed bat species, impacts to all bats are also discussed collectively in this section. In general, the 11 species of bats found in Ohio are divided into those that hibernate in caves or abandoned mines in the winter (cave bats) and bats that migrate long distances to overwinter (migratory tree bats). Similar to the Indiana bat analysis area, impacts to non-listed cave and migratory tree bats are evaluated within the Midwest RU. While the range of the various species extends outside of the Midwest RU, there is little available population data available for non-listed bat species. Assessing the cumulative impacts to non-listed bats in the Midwest RU would evaluate impacts to portions of the populations that breed in this area and migrate through this area. Mortality of migratory tree bats or cave bats would be considered significant if substantial reductions in population size or distribution of those species within the Midwest RU were caused.

Final Environmental Impact Statement Buckeye Wind Project April 2013
5-180 Chapter 5 - Environmental Consequences
Current Wind Developments and Bat Mortality
Bat mortality at wind facilities is well documented in the United States (Johnson and Strickland 2003, Kunz et al. 2007, Arnett et al. 2008, Horn et al. 2008). About 75 percent of all observed bat mortality is comprised of three migratory tree bats: red, hoary, and silver-haired bats (Kunz et al. 2007). Some studies have indicated that migratory tree bats may be attracted to both moving and non-moving wind turbine blades (Arnett 2005). Most known fatalities occur in late summer and early fall during migration (Johnson 2004). Although these species are not listed as threatened or endangered, they have low reproductive rates typical of long-lived species, and significant impacts to their numbers would not be sustainable over time. Based on post-construction monitoring at wind facilities throughout the eastern U.S., it is reasonable to assume that mortality of bat species, particularly of migratory tree-roosting bats, may occur at the proposed facility.
To date, five Indiana bat fatalities have been documented in post-construction monitoring studies at wind energy facilities. Two fatalities occurred at the Fowler Ridge facility in Indiana, during the fall migration period in September 2009 and 2010 (Good et al. 2011). The third fatality occurred at the North Allegheny Wind facility in Pennsylvania during the fall migration period in September 2011 (USFWS 2012b). The fourth Indiana bat fatality occurred on July 26, 2012 at the Laurel Mountain Wind Power facility near Elkins, WV. The fifth Indiana bat fatality occurred on the night of October 2, 2012 at the Blue Creek Wind Farm in Paulding County, OH. While it is assumed that other Indiana bat mortalities at wind facilities have occurred, these fatalities represent the only documented takes of Indiana bats at a wind facility, and there is a lack of direct data specific to the Indiana bat.
In order to quantify bat mortality attributed to existing and near-future wind power projects within the Midwest RU, data were obtained from post-construction monitoring studies at operational wind power facilities. A review of 21 studies from 19 different wind facilities in the United States and Canada, found that estimates of bat fatalities were highest at facilities located on forested ridges in the eastern U.S., and lowest in the Rocky Mountain and Pacific Northwest regions (Arnett et al. 2008). Bat fatalities were lower and more variable among sites in the upper Midwest, with estimates ranging from 0.2 to 8.7 bats per MW (Table 4-4 of Appendix C). However, a 2009 post-construction study at Blue Sky Green Field in Wisconsin documented an unprecedented, high mortality rate for the Midwest, with total estimated mortality of 24.6 bat fatalities per MW (21.6 bats per MW when incidental finds were removed) for the 88-turbine facility (Gruver et al. 2009). Likewise, the Cedar Ridge wind facility in Wisconsin also documented high bat mortality rates, estimated at 50.5 bats per turbine per study period (BHE 2010).
It is clear from analysis of existing data that bats are being killed by wind turbines. Out of the 45 bat species in the United States, 13 have been documented as fatalities at wind power facilities, and 75 percent of all bat fatalities are migratory bat species (Kunz et al 2007). Data indicate that risk for Myotis species, like the Indiana bat, is significantly less than migratory species, although risk may vary by site (Arnett et al 2008). Indiana bats are at risk, as evidenced by five confirmed fatalities, and the likely occurrence of undocumented fatalities due to a lack of post-construction monitoring or difficulty of detecting the species. However, the five aforementioned fatalities

Final Environmental Impact Statement Buckeye Wind Project April 2013
Chapter 5 - Environmental Consequences 5-181
represent the only Indiana bat fatalities documented to date, and therefore the degree to which Indiana bats are at risk is highly uncertain.
Given the relative lack of data in the Midwest RU, data from studies of 15 existing wind facilities in other RUs within the range of the Indiana bat were used to estimate bat mortality rates (Table 5.15-8). Seven of the studies, from five existing wind facilities, are also located within agricultural landscapes: Fowler Ridge Wind Farm (Indiana), Casselman Wind Project (Pennsylvania), and eight wind facility sites in Pennsylvania (Table 5.15-8). In 2007, the Pennsylvania Game Commission (PGC) collaborated with members of the wind industry to develop a Voluntary Wind Energy Cooperative Agreement. This Agreement requires at least one year of standardized pre-construction surveys and two years of standardized post-construction mortality monitoring at proposed or active wind facilities in the state. Currently, post-construction monitoring data for bat mortality is available for surveys conducted from 2007 to 2009. However, only five of the eight surveys followed PGC protocol, so only data from these facilities were used in the calculations to estimate bat mortality (Librandi-Mumma and Capouillez 2011).
For comparing impacts of wind turbines on bird and bat mortality, investigators estimate fatalities per MW per year based on periodic carcass searches, and data correction from scavenger removal and searcher error trials (Smallwood 2010). The data for all fifteen sites was corrected for searcher efficiency and scavenger removal (SESR) biases to obtain mortality estimates for bats.
According to the data from the 15 sites (only including Pennsylvania studies that followed PGC protocol), bat fatalities per MW per year ranged from 0.5 to 49.3, and averaged 9.6 to 16.1 (see Table 5.15-8). The combined total of estimated bat fatalities for the seventeen studies (only including Pennsylvania studies that followed PGC protocol) is between 14,704 and 43,766 bats per year. Of these, Myotis species represent an average of 19.1 percent (between 1,653 and 3,462 bats per year) of reported fatalities (see Table 5.15-8 data and references).

Final Environmental Impact Statement Buckeye Wind Project April 2013
5-182 Chapter 5 - Environmental Consequences
Table 5.15-8. Average Bat Mortality at 15 Existing Wind Facilities within the Range of the Indiana Bat
Project Name No.
Turbines MW Dates
surveyed
Myotis fatalities
documented Corrected for SESR?
Adjusted bat
fatalities/MW/period
(min – max)
Extrapolated total bat mortality based on MW/year
fatality estimates (min
– max)
Myotis percent of
total
Extrapolated Myotis
mortality /MW/yr1 Reference
Maple Ridge Wind Power Project Phase
I, NY
120 198 17 Jun to 15 Nov 2006
little brown bat: 25;
unidentified Myotis: 8
Yes 9.2 to 14.8 1,822 to 2,930 9.60% 175.5 to
282.4
Jain et al. 2007,
Arnett et al. 2008
Maple Ridge Wind Power Project Phase
II, NY
195 321.8 30 Apr to 14 Nov 2007
little brown bat: 31;
unidentified Myotis: 1
Yes 6.5 to 8.4 2,092 to 2,703 14.80% 310.4 to
401.1 Jain et al.
2008
Maple Ridge Wind Power Project Phase
III, NY
195 321.8 15 Apr to
9 Nov 2008
little brown bat: 24;
unidentified Myotis: 2
Yes 5.0 to 5.4 1,609 to 1,738 17.10% 275.6 to
297.6 Jain et al.
2009a
Munnsville Wind Farm,
NY 23 34.5
15 Apr to 15 Nov 2008
little brown bat: 2 Yes 0.5 to 1.9 17 to 66 20.00% 3.5 to 13.1 Stantec
2009b
Noble Ellenburg Windpark,
NY
54 81 28 Apr to
13 Oct 2008
little brown bat: 19 Yes 2.8 to 5.5 227 to 446 49.20% 115.5 to
219.0 Jain et al.
2009c
Noble Bliss Windpark,
NY 67 100.5
21 Apr to 14 Nov 2008
little brown bat: 29 Yes 5.1 to 9.8 513 to 985 38.20% 195.8 to
376.3 Jain et al.
2009d
Cohocton/Dutch Hill, NY 50 125
15 Apr to 15 Nov 2009
little brown bat: 41 Yes 5.5 to 16.0 688 to 2,000 59.40% 408.5 to
1,188.4 Stantec 2010a
Cohocton/Dutch Hill, NY 50 125
26 Apr and 22
Oct
little brown bat:11;
northern Yes 3.36 to
17.08 420 to 2,135 20.69% 86.9 to 4411.7
Stantec 2011

Final Environmental Impact Statement Buckeye Wind Project April 2013
Chapter 5 - Environmental Consequences 5-183
Project Name No.
Turbines MW Dates
surveyed
Myotis fatalities
documented Corrected for SESR?
Adjusted bat
fatalities/MW/period
(min – max)
Extrapolated total bat mortality based on MW/year
fatality estimates (min
– max)
Myotis percent of
total
Extrapolated Myotis
mortality /MW/yr1 Reference
2010 long-eared bat: 1
Fowler Ridge Wind Farm,
IN 355 600
13 Apr to 15 May 2010;
1 Aug to 15 Oct 2010
little brown bat: 2;
Indiana bat: 1;
Yes 11.4 to 49.3
6,840 to 29,580 0.40% 27.4 to
118.2 Good et al.
2011
Casselman Wind Project,
PA 23 34.5
19 Apr and 15
Nov 2008
little brown bat: 14 Yes 13.8 to
34.3 476 to 1,183 9.50% 45.2 to 112.4
Arnett et al. 2009b
6-3, PA NA NA 2007
Yes & followed
PGC protocol
21.4 NA ~13% (8
sites combined)
2.8
Librandi-Mumm and Capouillez
2011
6-3, PA NA NA 2008 Across all 8
PGC studies
Yes & followed
PGC protocol
17.1 NA ~13% (8
sites combined)
2.2
Librandi-Mumma
and Capouillez
2011
2-2, PA NA NA 2008 (2007 – 2009):
Yes & followed
PGC protocol
21.5 NA ~13% (8
sites combined)
2.8
Librandi-Mumma
and Capouillez
2011
2-2, PA NA NA 2009
12%; Northern
long-eared: <1%
Yes & followed
PGC protocol
21.5 NA ~13% (8
sites combined)
2.8
Librandi-Mumma
and Capouillez
2011

Final Environmental Impact Statement Buckeye Wind Project April 2013
5-184 Chapter 5 - Environmental Consequences
Project Name No.
Turbines MW Dates
surveyed
Myotis fatalities
documented Corrected for SESR?
Adjusted bat
fatalities/MW/period
(min – max)
Extrapolated total bat mortality based on MW/year
fatality estimates (min
– max)
Myotis percent of
total
Extrapolated Myotis
mortality /MW/yr1 Reference
2-14, PA 3 NA NA 2008
Yes. Did not
follow PGC
protocol
3.4 NA ~13% (8
sites combined)
0.4
Librandi-Mumma
and Capouillez
2011
2-14, PA NA NA 2009
Yes & followed
PGC protocol
3.2 NA ~13% (8
sites combined)
0.4
Librandi-Mumma
and Capouillez
2011
2-10, PA 3 NA NA 2008 Across all 8
PGC studies
Yes. Did not
follow PGC
protocol
8.3 NA ~13% (8
sites combined)
1.1
Librandi-Mumma
and Capouillez
2011
2-4, PA NA NA 2009 (2007 – 2009):
Yes & followed
PGC protocol
11.8 NA ~13% (8
sites combined)
1.5
Librandi-Mumma
and Capouillez
2011
5-5, PA 3 NA NA 2009
12%; Northern
long-eared: <1%
Yes. Did not
follow PGC
protocol
6.7 NA ~13% (8
sites combined)
0.9
Librandi-Mumma
and Capouillez
2011
24-3, PA 3 NA NA 2009
Yes. Did not
follow PGC
protocol
6.2 NA ~13% (8
sites combined)
0.8
Librandi-Mumma
and Capouillez
2011

Final Environmental Impact Statement Buckeye Wind Project April 2013
Chapter 5 - Environmental Consequences 5-185
Project Name No.
Turbines MW Dates
surveyed
Myotis fatalities
documented Corrected for SESR?
Adjusted bat
fatalities/MW/period
(min – max)
Extrapolated total bat mortality based on MW/year
fatality estimates (min
– max)
Myotis percent of
total
Extrapolated Myotis
mortality /MW/yr1 Reference
6-1, PA NA NA 2009
Yes & followed
PGC protocol
15.2 NA ~13% (8
sites combined)
2
Librandi-Mumma
and Capouillez
2011
Average NA NA NA NA 9.6 to 16.1 1,470 to
4,377 19.1% 97.3 to 203.7 NA
Total 1,132 1,817
.1 NA 212 2 NA 14,704 to
43,766 NA 1,653.4 to
3,462.4 NA 1 Mortality rate based on the total number of bats identified to species or genus (includes bats documented in standardized surveys and incidentals). 2 Does not include fatalities from the PGC studies as these were only given as a percent. 3Studies colored in gray did not follow PGC protocol, so were not included in average or total mortality estimates.

Final Environmental Impact Statement Buckeye Wind Project April 2013
5-186 Chapter 5 - Environmental Consequences
The minimum and maximum bat fatality estimates of 9.6 to 16.1 per MW per year were applied to 5,226 MW of operational, under construction, and proposed wind facilities located within the Midwest RU to quantify bat mortality rates (Table 5.15-9). This results in mortality of between 50,166 and 84,132 bats per year within the Midwest RU (Table 5.15-10). Based on the studies summarized in Table 5.15-8, it is assumed that approximately 75 percent of total mortalities are migratory tree bats, 19 percent are Myotis bats, and 6 percent are other species such as big brown and tricolor bats. As such, the current estimate (2011) within the Midwest RU, is between 9,532 and 15,985 Myotis bats and between 37,624 and 63,099 migratory tree bats are killed each year as a result of interactions with wind turbines (Table 5.15-10).
Data from the Fowler Ridge Wind Farm in Indiana was used to estimate Indiana bat mortality rates. Only one year of data has been made available (2010) although monitoring is ongoing. During the spring and fall survey periods (April 13 to May 15, 2010 and August 1 to October 15, 2010) one Indiana bat carcass was found. This represents an average of 0.1 percent (6.8 to 29.6) of the total bat mortalities per year at the facility (Good et al. 2011). Using this number, the Indiana bat fatalities at all operational, under construction, and proposed wind facilities within next three years within the Midwest RU is estimated to be between 50 and 84 Indiana bats each year (Table 5.15-10). The actual numbers of Indiana bat fatalities per wind facility are dependent on the proximity to known bat hibernacula, migration routes, and summer roosting habitat (USFWS 2007).
Table 5.15-9. Total Megawatts (MW) of Wind Generating Capacity at Operational, under Construction, and Proposed Wind Facilities as of 2011 in States within the Midwest Indiana Bat Recovery Unit
State
Total Megawatts (MW)
Operational as of 2011
Under construction
as of 2011
Proposed within the next three
years
Adjusted total1
operational, under
construction, and proposed
Indiana 1,340.0 201.8 8,426.0 3,227.0 Michigan 377.0 348.0 2,518.0 1,228.6 Ohio 112.0 309.0 1,600.1 741.0 Tennessee 29.0 0.0 0.0 29.0 Alabama 0.0 0.0 0.0 Kentucky 0.0 0.0 0.0
Total 1,858.0 858.8 12,544.1 5,225.6 Adjusted Total 1,858.0 858.8 2,508.8 5,225.6
Source: AWEA (2012) 1Assumes only 20% of proposed projects are built and operating (see footnote 1 Table 5.15-4).

Final Environmental Impact Statement Buckeye Wind Project April 2013
Chapter 5 - Environmental Consequences 5-187
Table 5.15-10. Potential Minimum and Maximum Bat Fatalities at all Operational, Under Construction, and Proposed Wind Facilities in the Midwest Indiana Bat Recovery Unit (Data Corrected for SESR)
State Annual estimated fatalities - all bats Annual estimated
fatalities – migratory tree bats1
Annual estimated fatalities - Myotis species2
Annual estimated fatalities - Indiana bats3
Minimum Maximum Minimum Maximum Minimum Maximum Minimum Maximum Indiana 30,979.2 51,954.7 23,234.4 38,966.0 5,886.0 9,871.4 31.0 52.0 Michigan 11,794.6 19,780.5 8,846.0 14,835.4 2,241.0 3,758.3 11.8 19.8 Ohio 7,113.6 11,930.1 5,335.2 8,947.6 1,351.6 2,266.7 7.1 11.9 Tennessee 278.4 466.9 208.8 350.2 52.9 88.7 0.3 0.5 Alabama 0.0 0.0 0.0 0.0 0.0 0.0 0.0 0.0 Kentucky 0.0 0.0 0.0 0.0 0.0 0.0 0.0 0.0
Total 50,165.8 84,132.2 37,624.4 63,099.2 9,531.5 15,985.1 50.2 84.1 1 Based on the studies summarized in Table 5.15-8, we assume that approximately 75% of total mortalities are migratory tree bats. 2 Based on the studies summarized in Table 5.15-8, we assume that approximately 19 % of total mortalities are Myotis bats. 3 Based on Indiana bat fatality rates at the Fowler Ridge Wind Farm (Good et al. 2011), we assume that 0.1 % of total mortalities are Indiana bats.
Final Environmental Impact Statement Buckeye Wind Project April 2013
5-188 Chapter 5 - Environmental Consequences
Future Wind Developments and Bat Mortality
The US DOE predicts that renewable energy capacity will increase over the next 25 years, and the installed capacity in the entire United States will increase 48 percent (US DOE EIA 2011). Assuming that installed wind capacity increases at the same rate in all states, wind energy production in the Midwest RU would increase to 6,875 MW by 2035 (Table 5.5-11). Under these conditions, it is estimated that bat fatalities from wind developments in the Midwest RU in 2035 would range from 65,996 to 110,681 bats per year. Of these, it is estimated between 49,497 and 83,011 migratory tree bats, 12,539 and 21,029 Myotis species, and approximately 66 to 111 Indiana bats would be killed each year in the RU (Table 5.15-11).

Final Environmental Impact Statement Buckeye Wind Project April 2013
Chapter 5 - Environmental Consequences 5-189
Table 5.15-11. Projected Wind Power Production in 2035 and Estimated Annual Minimum and Maximum Numbers of Annual Bat Fatalities in the Indiana Bat Midwest Recovery Unit
State
2035 projected
wind power production
(MW)
Annual estimated fatalities - all bats1
Annual estimated fatalities – migratory tree
bats2
Annual estimated fatalities - Myotis species3
Annual estimated Indiana bat fatalities 4
Minimum Maximum Minimum Maximum Minimum Maximum Minimum Maximum
Indiana 4,958.0 47,596.8 79,823.8 35,697.6 59,867.9 9,043.4 15,166.5 47.6 79.8 Michigan 1,394.9 13,391.0 22,457.9 10,043.3 16,843.4 2,544.3 4,267.0 13.4 22.5 Ohio 414.4 3,978.2 6,671.8 2,983.7 5,003.9 755.9 1,267.6 4.0 6.7 Tennessee 107.3 1,030.1 1,727.5 772.6 1,295.6 195.7 328.2 1.0 1.7 Alabama5 NA NA NA NA NA NA NA NA NA Kentucky5 NA NA NA NA NA NA NA NA NA
Total 6,874.6 65,996.2 110,681.1 49,497.2 83,010.8 12,539.3 21,029.4 66.0 110.7 1Based on average bat fatalities in Table 5.15-8. 2 Based on the studies summarized in Table 5.15-8, we assume that approximately 75% of total mortalities are migratory tree bats. 3 Based on the studies summarized in Table 5.15-8, we assume that approximately 19 % of total mortalities are Myotis bats. 4 Based on Indiana bat fatality rates at the Fowler Ridge Wind Farm (Good et al. 2011), we assume that 0.1 % of total mortalities are Indiana bats. 5 Currently there are no operating, under construction, or proposed wind facilities in either Alabama or Kentucky, so projected wind power capacity for these states was not extrapolated.
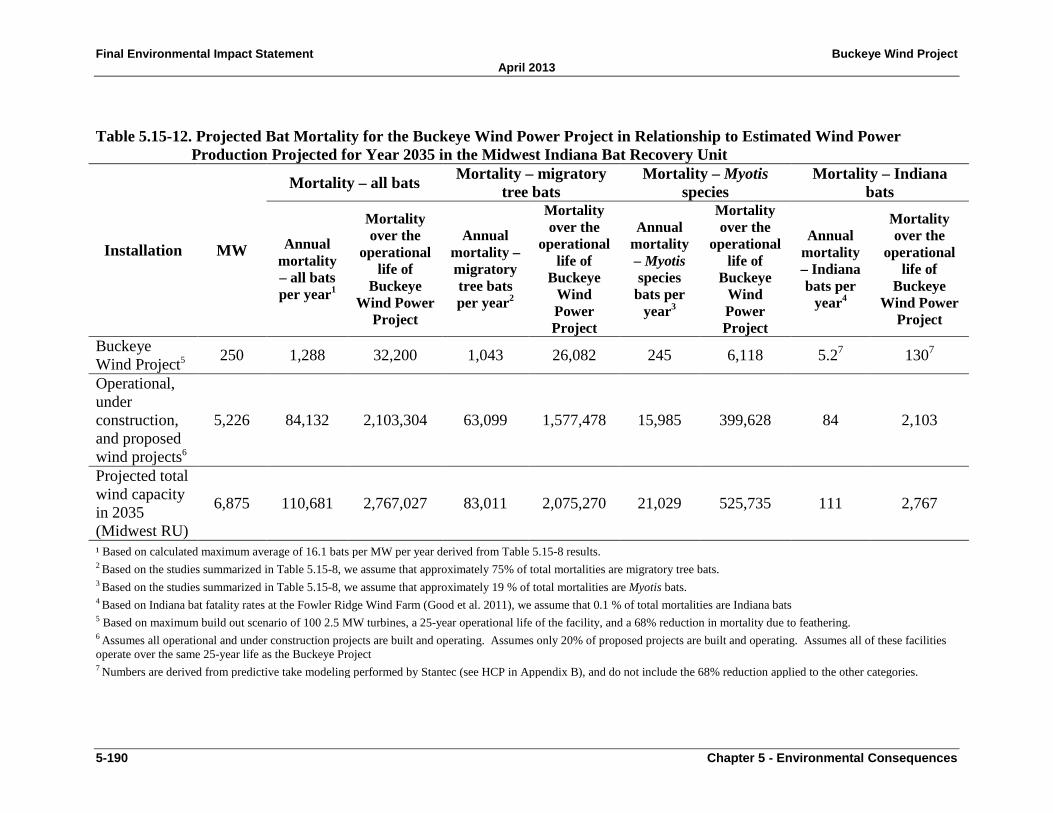
Final Environmental Impact Statement Buckeye Wind Project April 2013
5-190 Chapter 5 - Environmental Consequences
Table 5.15-12. Projected Bat Mortality for the Buckeye Wind Power Project in Relationship to Estimated Wind Power Production Projected for Year 2035 in the Midwest Indiana Bat Recovery Unit
Installation MW
Mortality – all bats Mortality – migratory tree bats
Mortality – Myotis species
Mortality – Indiana bats
Annual mortality – all bats per year1
Mortality over the
operational life of
Buckeye Wind Power
Project
Annual mortality – migratory tree bats per year2
Mortality over the
operational life of
Buckeye Wind Power Project
Annual mortality – Myotis species
bats per year3
Mortality over the
operational life of
Buckeye Wind Power Project
Annual mortality – Indiana bats per
year4
Mortality over the
operational life of
Buckeye Wind Power
Project
Buckeye Wind Project5 250 1,288 32,200 1,043 26,082 245 6,118 5.27 1307
Operational, under construction, and proposed wind projects6
5,226 84,132 2,103,304 63,099 1,577,478 15,985 399,628 84 2,103
Projected total wind capacity in 2035 (Midwest RU)
6,875 110,681 2,767,027 83,011 2,075,270 21,029 525,735 111 2,767
¹ Based on calculated maximum average of 16.1 bats per MW per year derived from Table 5.15-8 results. 2 Based on the studies summarized in Table 5.15-8, we assume that approximately 75% of total mortalities are migratory tree bats. 3 Based on the studies summarized in Table 5.15-8, we assume that approximately 19 % of total mortalities are Myotis bats. 4 Based on Indiana bat fatality rates at the Fowler Ridge Wind Farm (Good et al. 2011), we assume that 0.1 % of total mortalities are Indiana bats 5 Based on maximum build out scenario of 100 2.5 MW turbines, a 25-year operational life of the facility, and a 68% reduction in mortality due to feathering. 6 Assumes all operational and under construction projects are built and operating. Assumes only 20% of proposed projects are built and operating. Assumes all of these facilities operate over the same 25-year life as the Buckeye Project 7 Numbers are derived from predictive take modeling performed by Stantec (see HCP in Appendix B), and do not include the 68% reduction applied to the other categories.

Final Environmental Impact Statement Buckeye Wind Project April 2013
Chapter 5 - Environmental Consequences 5-191
Table 5.15-12 shows the estimated mortality as a result of Project activity over the life of the Project (25 years) as compared to totals for the Midwest RU. The Project includes feathering, which should reduce all bat mortalities by an average of 68 percent; therefore, it is estimated that 6,118 Myotis mortalities will occur as the result of the Project.
Annual mortality of 2,075,270 migratory tree bats is expected to occur from all wind projects in the Midwest RU over the life of the project. It is currently unknown whether mortality at this level represents a significant cumulative effect. Migratory tree bats are long-lived and have fairly low annual reproductive capacity. In species with this type of life history, high mortality rates of adults over long time frames may result in population declines. Unfortunately, little information is available on the population size of migratory tree bats within the Midwest RU, or across their range, so the magnitude of the population impacts from the projected mortality related to wind power cannot be quantified. Further, the summering locations and migratory patterns of these bat species are unknown, so it is difficult to predict which summering populations could be affected, and to what extent. Population size data for each of the effected species is needed to determine if continued and cumulative loss of migratory tree bats may represent a significant cumulative effect and if that could significantly impair the ability of the bat population to effectively control the insect population at local and/or regional levels.
Annual mortality of Myotis bats totaling 525,735 is expected to occur from all wind projects in the Midwest RU over the life of the project. It is currently unknown whether mortality at this level represents a significant cumulative effect. Similar to migratory tree bats, Myotis bats are long-lived and have low annual reproductive capacity (typically one offspring per female per year), and high adult mortality rates may result in population declines. Further, Myotis bats are colonial, and declining colony size has been linked to decreased survivorship due to decreased ability to thermoregulate (Appendix C). Unfortunately, population estimates for Myotis bats as a group are not as well studied as population estimates for Indiana bats specifically. Little information is available on the population size of Myotis bats within the Midwest RU or across their range, so the magnitude of the population impacts from the projected mortality related to wind power cannot be quantified. Population size data for each of the effected species is needed to determine if continued and cumulative loss of Myotis bats may represent a significant cumulative effect if that and could significantly impair the ability of the bat population to effectively control the insect population at local and/or regional levels.
Historically, Indiana bats have experienced long-term declines from a number of causes including habitat loss and degradation and human vandalism of hibernacula, but an increasing population trend has been documented over the past decade. The 2005 winter census estimate of the Indiana bat population was 457,000, with 281 hibernacula in 19 states and 269 maternity colonies in 16 states. By 2011 the estimated rangewide population increased by about 2.2 percent to 424,708, and the Midwest RU population increased by 8.3 percent to 305,297 (USFWS 2012a). Range-wide population increases over the past decade have recently been tempered by regional declines, primarily due to WNS.
WNS is a condition of cave bats characterized by the conspicuous white fungal growth on noses, faces, ears, and/or wing membranes of the majority of affected bats. As of winter 2011, the Northeast RU has experienced a 70 percent reduction in Indiana bat populations (King 2012), a 73 percent reduction of little brown bats (Barlow 2010), and has killed in excess of 90 percent of

Final Environmental Impact Statement Buckeye Wind Project April 2013
5-192 Chapter 5 - Environmental Consequences
the bats in many caves and mines (NPS 2010) since the onset of WNS in 2007. Since 2010, WNS has been confirmed in five states within the Midwest RU, including in six counties in Ohio. The closest documented case to the Project Area occurred at the Preble County Mine in 2011 (personal communication with Megan Seymour, USFWS, March 3, 2012).
Thogmartin et al. (2012) used a modeling approach to examine Indiana bat population trends before and after the occurrence of WNS (from 1983 to 2009). They found that while the range-wide population of Indiana bats has been in a stationary state for at least 2 decades before the onset of WNS, WNS has caused regional decline of Indiana bats in the northeast US and has halted population increase in the Appalachians. The authors detected a 10.3 percent decrease in Indiana bat population size range-wide from 2006 to 2009 during the onset of WNS (Thogmartin et al. 2012). The authors conclude that WNS is having an appreciable influence on the status and trends of Indiana bat populations.
Although population numbers in the Midwest RU are still seemingly high, given the extremely rapid rate at which WNS has spread over just five years, and the high mortality rates observed in the Northeast RU, population reductions of all cave bat species as a result of WNS in the Midwest RU are expected to increase (A. Kurta, personal communication), which makes additional mortality from other sources (e.g., wind power) even more significant.
Turner et al. (2011) summarized cave bat population declines due to WNS from 42 sites in five states (NY, PA, VT, VA, and WV) that had confirmed WNS mortality for at least two years. They found that overall bat populations at these sites combined had declines by 88 percent from pre-WNS levels. They also noted species-specific decline rates for the sites combined. Declines were as follows: Northern long-eared bats, 98 percent; little brown bats, 91 percent; tricolored bats, 75 percent; Indiana bats, 72 percent; big brown bats, 41 percent; and eastern small-footed bats, 12 percent (Turner et al. 2011). The assumption in the HCP and in this EIS is that WNS spread within the Midwest RU will track declines seen in the Northeast. Population estimates for cave bats as a group are not as well studied as population estimates for Indiana bats specifically. Little information is available on the population size of cave bats within the Midwest RU or across their range. Certainly though, population declines due to WNS anticipated for species such as northern long-eared bats, little brown bats, and tricolored bats are significant, so additional mortality from wind power projects or other sources could be significant as well.
However, it is unclear if and how WNS population declines could influence mortality resulting from wind projects. As the population of these bats decline, their exposure to wind projects could likewise decline, as could mortality rates. Siting of wind power projects relative to large concentrations of cave bats could also potentially influence mortality rates, for example a wind project in Wisconsin near a large cave bat hibernaculum has resulted in greater than average cave bat mortality (30% Myotis fatalities) (Gruver et. al. 2009). Research has not yet documented the factors that influence cave bat mortality at wind facilities, so our ability to predict how population size and wind facility distribution relative to cave bat populations may influence mortality risk is limited.
If the Midwest RU Indiana bat population or other cave bat populations were substantially reduced as a result of WNS or other causes, the projected level of mortality resulting from wind turbines could have greater implications for the viability of the population and the cumulative

Final Environmental Impact Statement Buckeye Wind Project April 2013
Chapter 5 - Environmental Consequences 5-193
effects of this Project and past, present, and reasonably foreseeable actions considered in this analysis could result in significant effects to the Indiana bat or other cave bat population size or distribution.
To qualify for an ITP, Buckeye Wind is required to minimize and mitigate the impacts of the take to the maximum extent practicable. Therefore, the Applicant has committed to reducing requested Indiana bat five-year take limits by 50 percent (i.e., 2.6 Indiana bats per year, 13.0 over five years) if the population of Indiana bats in the Midwest RU is reduced by 50 percent or more from the 2009 pre-WNS level. Project operations under reduced take would continue to be subject to adaptive management decisions. The measures implemented to reduce Indiana bat take would likely result in reduced take of other bat species as well. This would help to minimize the impact of the taking on other bats species that may also be suffering population declines due to WNS.
Minimization and Mitigation Measures
As a result of past and anticipated continued declines, the Indiana bat is increasingly endangered. Further, due to WNS the long-term survival of some cave bat species is in question. As such, recovery of the Indiana bat and the survival of cave bats in general are dependent upon slowing down and offsetting current rates of decline. Mitigation and conservation measures proposed for the Buckeye Project, identified in Section 3 and discussed below, have been developed to offset mortality of Indiana bats through protection and enhancement of habitat that would promote and protect reproductive success of local populations into the future.
Turbine feathering and curtailment are effective methods used to avoid and minimize bat fatalities. Feathering and curtailment studies at the Fowler Ridge Wind Farm (Good et al. 2011), Casselman Wind Facility (two studies conducted at Casselman in 2008 and 2009: Arnett et al. 2010), and Summerview Wind Farm (Baerwald et al. 2009) have documented substantial, but variable, rates of bat fatality reduction using cut-in speeds ranging from 5.0 m/s to 6.5 m/s (11.1 mph to 14.5 mph) (Table 5.4-3). The median average reductions in bat fatalities in these studies was 68.3% (range 44.0-86.0%). As different turbine models were used in each study, turbine blade rotation below the cut-in speed may be variable among studies (Good et al. 2011, Arnett et al. 2010). However, the studies provide evidence that use of increased cut-in speeds is an effective method to reduce bat mortality. Use of both feathering and cut-in speeds may reduce mortality more than just cut-in speeds alone. During a subsequent study at the Fowler Ridge Wind Farm in 2011, use of feathering and cut-in speeds of 3.5 m/s, 4.5 m/s and 5.5 m/s resulted in mean bat fatality reductions of 36.3 percent, 56.7 percent and 73.3 percent, respectively (Good et al. 2012).
The Buckeye Wind HCP proposes to implement a feathering and cut-in speed strategy to minimize mortality of Indiana bats and other non-listed bats (Table 5.5-1). Because the proposed cut-in speeds are similar to those used in the feathering and curtailment studies discussed above, Buckeye Wind anticipates a similar 68 percent reduction in overall bat fatalities below observed values at other wind facilities that did not implement feathering or curtailment. This means that as opposed to more than 100,000 total bat mortalities over the life of the Project, feathering will reduce that number to 32,200 (Table 5.15-12). The HCP also includes a post-construction monitoring program that will measure the effectiveness of operational curtailment by monitoring

Final Environmental Impact Statement Buckeye Wind Project April 2013
5-194 Chapter 5 - Environmental Consequences
the mortality of all bats and birds, and an adaptive management strategy to maintain take of Indiana bats at authorized levels. The Indiana bat hibernaculum where mitigation for the Buckeye Project would occur also supports approximately 15,000 other cave bats, resulting in a benefit to these species as well.
If all wind facilities within the Indiana bat Midwest RU implemented similar feathering strategies as Buckeye Wind, mortality of Indiana bats and other non-listed bats, could be reduced by an average of 68 percent, based on reductions seen at other wind facilities (Good et al. 2011, Arnett et al. 2010, Baerwald et al. 2009). This is a substantial reduction over what is currently occurring. The Buckeye Wind HCP used the Leslie matrix model (Leslie 1954) to demonstrate that the proposed take of Indiana bats from the project would not cause an appreciable decline in the likelihood of survival of each maternity colony potentially impacted. Because maternity colonies are the reproductive units of the species, preserving them on the landscape ensures that the species will be able to reproduce throughout the life of the project and beyond, and continue to contribute to recovery of the species. If all wind facilities within the Indiana bat Midwest RU ensured that the take caused by their project did not cause the appreciable decline of individual maternity colonies, reproductive capacity of the species would not be hindered by wind projects and this would ensure that the survival and recovery of the species as a whole is not appreciably diminished by wind projects.
Further, if post-construction monitoring and adaptive management were implemented at all wind facilities to document levels of bat mortality at various feathering levels, the wind industry and the USFWS would gain a much more thorough understanding of bat and wind turbine interactions. This information could be used to further avoid and minimize bat mortality, such that it could be reduced to levels that would not result in population-level impacts. Finally, if all wind facilities within the Indiana bat Midwest RU implemented mitigation actions that would help to increase reproductive capacity of bat species, such as protecting, enhancing, and restoring forested habitat and hibernacula, the impact of any residual take may be effectively reduced, resulting in negligible cumulative effects. A reduction in the current rate of bat mortality from wind projects and minimization of future mortality coupled with mitigation for impacts would help insure that bat populations maintain their current capacity to control insect populations at local and regional levels.
Habitat Loss and Bat Impacts
The Action Area is composed of active agricultural areas, low density residential areas, and fragmented woodlots, which may provide spring, summer, and fall habitat for all bat species. The Action Area does not provide winter habitat for any bat species. Other than ongoing agricultural and small-scale and periodic timber harvesting activities, which are occurring or may occur in the Action Area over the ITP Term, the USFWS is not aware of future federal, state, or private activities in the Action Area that would directly or indirectly affect habitat for Indiana bats or other bats. According to the Logan-Union- Champaign Regional Planning Commission and Champaign County Building Regulations office, no known residential subdivisions or retail/commercial developments have been approved or are currently proposed in the general vicinity of the Action Area. However, several new private homes, pole barns, and an equipment storage yard have been approved (received building permits) and lot splits are common (personal

Final Environmental Impact Statement Buckeye Wind Project April 2013
Chapter 5 - Environmental Consequences 5-195
communication between Joan Huston [ERM] and Phyllis Rittenhouse [Champaign Co Building Regulations] and Weston Dodds [LUC Regional Planning Commission], June 6, 2012).
Agriculture has been the predominant land use in the Action Area for the past several decades and wooded habitat suitable habitat for Indiana bats and other bats is already substantially fragmented. However, wooded habitat in the Action Area is likely to increase in the future, based on patterns of changing land use, such as the conversion of agricultural areas back to wooded areas. Wooded land has been increasing in Ohio since 1940, and in 2001 it comprised approximately 33 percent of the state's land area (ODNR DOW 2012). A similar trend has occurred throughout the Midwest RU (USGS, 2001).
Currently, the Midwest RU is dominated by agricultural land use in the northern areas (MI, OH, and IN), and is dominated by forested habitat in the southern areas (KY, TN, and portions of AL, GA and MS). Each state in the Midwest RU supports a mix of habitats and land use types, including forest, agriculture, and urban/suburban development. In all States in the Midwest RU land cover trends between 1982 and 2007 indicate increasing developed areas, and in all states but Tennessee, modestly increasing trends in forest cover (USDA 2009). While developed areas in the Midwest RU states increased by between 38 and 86 percent between 1982 and 2007, forest cover increases were generally much smaller, between 0.8 and 6 percent (Tennessee lost 2 percent forest cover) during the same period (USDA 2009).
Historically, conversion to agriculture and developed land within the Midwest RU led to the loss of a significant amount of habitat that bat species rely on. Current forest cover trends show a modestly increasing trend in the region over the past 25 years. All forest habitat loss as a result of the Project would be offset by the proposed mitigation measures described in Chapter 5 of this EIS. As such, the Project would not contribute to cumulative habitat loss in the region.
Alternative A – Maximally Restricted Operations Alternative The operational adjustment under Alternative A would involve all 100 turbines being non-operational from sunset to sunrise from April 1 through October 31, which is the period during which most bats are active. This Alternative would have extremely low mortality of all bat species, if not zero. This action would also result in no Indiana bat mortality. Therefore, the cumulative effects of Alternative A on bat species would be negligible. Further, if this operational regime was applied to all existing and future wind projects across the Midwest RU, total bat mortality could be substantially reduced from current estimates and future projections. Mortality of approximately 2,767,027 bats by the year 2035 could be avoided (see Table 5.15-12). Further, the ability of bats to control insect populations could improve locally (for example in areas with existing wind farms that have high bat mortality rates), or at a minimum could be maintained at the current level.
Alternative B – Minimally Restricted Operations Alternative Alternative B would employ operational restrictions during the fall migratory period (July 15 through October 31), when the highest bat mortality at wind turbines has been documented. That is, the cut-in speed for wind turbines would be set at 5.0 meters per second (11.2 mph) for all 100 turbines during the fall migration period (August 1 to October 31) during the first one to six hours after sunset. Due to no curtailment restrictions on the turbine speeds during spring and summer, operations under this Alternative would have greater adverse effects on spring/summer

Final Environmental Impact Statement Buckeye Wind Project April 2013
5-196 Chapter 5 - Environmental Consequences
populations of Indiana bats than the Proposed Action or Alternative A. Therefore, the cumulative effects of Alternative B on bat species would be greatest of the action alternatives.
Section 5.5.4 describes that take of Indiana bats under this Alternative would be approximately12.0 per year, which includes take of 2.6 local adult females per year. This alternative would result in declining populations at local Indiana bat maternity colonies, which may result in lost reproductive capacity of the colonies and the population within the Midwest RU. If all wind projects in the Midwest RU were to implement an operational regime similar to this that resulted in declining maternity colonies, substantial declines in the Midwest RU’s reproductive capacity could result.
Take of all bats under Alternative B was described in Section 5.4.4. Using the maximum average adjusted bat mortality from 15 existing wind facilities within the range of the Indiana bat (Table 5.15-8) of 16.1 bats per MW per study period, assuming mortalities are distributed by season as follows: spring, five percent; summer, 24 percent; and fall, 71 percent, and assuming a 50 percent reduction in fall bat mortality based on the proposed feathering and cut-in speed regime, Alternative B would result in the mortality of 10.4 bats per MW per year, or 2,600 bats per year for the 100 turbine facility. This mortality would likely include roughly 1,950 (75%) migratory tree bats, 494 (19%) Myotis bats (of which approximately 12 are Indiana bats), and 156 (6%) other bats (big brown, tri-color, etc.) per year, if the species composition of mortality follows patterns observed at wind facilities throughout the range of the Indiana bat. If all projected wind projects in the Midwest RU (totaling 6,875 MW) were to implement an operational regime similar to this that resulted in a reduction in fall take of 50 percent, take of approximately 71,568 bats per year would result.
Mortality at these levels may represent a significant cumulative effect. Bats are long-lived and have low annual reproductive capacity. In species with this type of life history, high mortality rates of adults over long time frames may result in population declines. Unfortunately, little information is available on the population size of bat species (except for Indiana bats) within the Midwest RU, or across their range, so the magnitude of the population impacts from the projected mortality related to wind power cannot be quantified. Further, the summering locations and migratory patterns of these bat species are unknown, so it is difficult to predict which summering populations could be affected, and to what extent. Regardless, continued and cumulative loss of bats may represent a significant cumulative effect and could significantly impair the ability of the bat population to effectively control the insect population at local and/or regional levels.
Alternative C - No Action Alternative Under Alternative C, the Project would not be built and no Project-related activities (construction, operation, or decommissioning) would occur. Alternative C would have no effect on threatened and endangered species or non-listed bats. As such, there would be no cumulative effects on threatened and endangered species or non-listed bats from Alternative C.
5.15.6 Visual Resources The cumulative effects analysis of visual resources focused on the regional impacts of the Project and action alternatives, specifically within the viewshed of the Project turbines (Figure 4.8.1).
Final Environmental Impact Statement Buckeye Wind Project April 2013
Chapter 5 - Environmental Consequences 5-197
The Project’s 100 turbines would directly impact the visual resources for some residents within approximately one mile of the nearest turbine and in sensitive locations.
Past projects such as highway/road construction, commercial development, communication towers, or transmission lines may have had visual effects on the regional character of the landscape, as the Project area is predominantly agricultural in nature. Aside from the Proposed Action there are no reasonably foreseeable projects within the viewshed that would have additional adverse effects on visual resources, so cumulative effects are expected to be minor.
Alternative A – Maximally Restricted Operations Alternative Alternative A differs from the Proposed Action only with respect to operations. The operational differences would not affect visual resources. As such, the cumulative effects of Alternative A would not differ from those of the Proposed Action.
Alternative B – Minimally Restricted Operations Alternative Alternative B differs from the Proposed Action only with respect to operations. The operational differences would not affect visual resources. As such, the cumulative effects of Alternative B would not differ from those of the Proposed Action.
Alternative C - No Action Alternative Under Alternative C, the Project would not be built and no Project-related activities (construction, operation, or decommissioning) would occur. Alternative C would have no effect on visual resources. As such, there would be no cumulative effects on visual resources from Alternative C.
5.15.7 Cultural Resources The cumulative effects analysis of cultural resources focuses on regional impacts of the Project and action alternatives, specifically the areas of ground disturbance caused by Project related activities (direct area of potential effect or APE) and the five-mile indirect APE for viewshed analysis, as defined in Section 5.6. Past actions that have impacted cultural resources include agricultural activities, highway/road construction, residential development, commercial development, communication towers, and transmission lines, all of which have had a minor cumulative impact on both historic archaeological and historic architectural resources.
As indicated in Sections 5.6 and 5.8 of this EIS, the Project would have no direct or physical impacts to historic architectural resources; however, the Project’s potential visual effects to historic architectural resources were determined to be significant and potential mitigation measures were presented that would minimize these impacts to the extent practicable. Other reasonably foreseeable projects that could affect the viewshed of historic architectural resources could include small-scale residential or commercial development, additional overhead utility lines, telecommunications towers, single residential or industrial wind turbines, and road construction and maintenance. These actions could visually impact historic architectural properties but these impacts are expected to be minimal. As such, the relatively minimal visual impacts of past and reasonably foreseeable future actions, when combined with the effects disclosed for the Project, would produce minor visual cumulative impacts to aboveground historic resources.

Final Environmental Impact Statement Buckeye Wind Project April 2013
5-198 Chapter 5 - Environmental Consequences
Sections 5.6 of this EIS also addresses the Project’s potential direct effects to archaeological resources. Only one NRHP eligible site and has been identified in the APE. This site, and any other NRHP potentially-eligible sites that are identified as a result of the Project, would be avoided. Additionally, a mound located within the Action Area would also be avoided. An unanticipated discovery plan will be developed to address any unexpected artifacts uncovered during construction and decommissioning activities as stated in Section 5.6 of this EIS. Other reasonably foreseeable projects proposed could include expansion of agricultural activities, small-scale residential or commercial development, additional overhead utility lines, telecommunications towers, single residential or industrial wind turbines, and road construction and maintenance. While all the foreseeable future projects have potential to physically impact archaeological resources, the Action Area and surrounding areas will remain predominantly agricultural over the life of the project, and any ground disturbing activities that may impact archeological resources is likely to be localized and minor. The relatively minimal impacts of past and reasonably foreseeable future actions, when combined with the effects disclosed for the Project, would produce minor cumulative impacts to historic archaeological resources.
Alternative A – Maximally Restricted Operations Alternative Alternative A differs from the Proposed Action only with respect to operations. The operational differences would not affect cultural resources. As such, the cumulative effects of Alternative A would not differ from those of the Proposed Action.
Alternative B – Minimally Restricted Operations Alternative Alternative B differs from the Proposed Action only with respect to operations. The operational differences would not affect cultural resources. As such, the cumulative effects of Alternative B would not differ from those of the Proposed Action.
Alternative C - No Action Alternative Under Alternative C, the Project would not be built and no Project-related activities (construction, operation, or decommissioning) would occur. Alternative C would have no effect on cultural resources. As such, there would be no cumulative effects on cultural resources from Alternative.