environmental disclosure: study on efficiency and
TRANSCRIPT

ENVIRONMENTAL DISCLOSURE: STUDY ON EFFICIENCY AND ALIGNMENT WITH
ENVIRONMENTAL PRIORITIES OF SPANISH PORTS
Emma Castelló-Taliani , SILVIA Giralt Escobar , FABRICIA ROSA
Abstract
The purpose of this article is to analyze, in a three-stage research, the relationships between
environmental expenses, the improvements achieved in 5 environmental variables analyzed and
efficiency, from an economic and operational perspective. The stages of this research are analyzing
the sustainability reports to determine the level of information, analyzing the economic and
operational efficiency, and analyzing the alignment with the environmental priorities of the Eco Ports-
ESPO (European Sea Ports Organization). The results reveal that (1) the type of traffic does not
condition environmental actions; (2) environmental performance (improvements) depends on
environmental expenditures; (3) environmental spending and efficiency in port operations are
correlated; and (4) environmental spending and port economic efficiency are correlated.
Keywords: Environmental disclosure; Green port; Environmental indicators; Port efficiency; DEA
1. Introduction
Maritime transport is an important type of transport for globalized trade, as it takes
approximately 90% of the global trade volume (Lun, 2013). However, its negative impacts on the
environment are significant, hence the reason why ports should be taken into account in this scenario
because there are large ecological interventions to enable this type of transport (Wang et al., 2020),
such as air pollution, water quality, ballast water, dredging and disposal of dredge materials and
storage, transport, and management of hazardous substances (Hiranandani, 2014). These impacts
raise the need for an environmental management of ports, whose advantages may be related to
customer satisfaction, corporate image, cost savings and environmental protection (Teerawattana &
Yang, 2019).
Nonetheless, there is an important paradox, because even though the relevance of
environmental management of ports is recognized (Bermúdez et al., 2019; Taliani et al., 2017) , the
pressure to ensure competitiveness and globalization (Hervás-Peralta et al., 2020) represents a
managerial stress. That is to say, there is the need to prioritize the environment as opposed to
maintaining economic efficiency (Castellano et al., 2020; Dong et al., 2019) .
Given this scenario, the European Sea Ports Organization (ESPO) emphasizes the importance
of controlling and monitoring green practices (Castellano et al., 2020). In particular, it identifies
annually, through the EcoPort (EP) initiative, environmental priorities for European ports with the
intention of encouraging environmental management practices. In 2019 EcoPort listed as priorities
the following areas: Air quality, Energy consumption, Climate change, Noise, Relationship with the
local community, Ship waste, Garbage/Port waste, Port development (long related), Dredging
operations and Water quality.
What is known so far is that the sustainable port environment becomes viable with the active
involvement of stakeholders and port operators through the implementation of key sustainable
indicators (Eswari & Yogeswari, 2019). Studies have shown that economic efficiency achieves the
ideal target when ports have a high pro-environmental attitude, implementing proactive green policies
(Castellano et al., 2020). It is also recognized the importance of knowing about external pressures on
issues related to environmental management (Bermúdez et al., 2019ª; Kuznetsov et al., 2015) and
economic efficiency (Dong et al., 2019; Castellano et al., 2020; Taliani et al., 2017).
However, the environmental priorities of ports can change annually (EcoPorts, 2020), since
the environmental impact and social pressure on the adopted environmental posture may vary. This
variation may occur both by normative aspects and by the pressure of interest groups (Bermúdez et
al., 2019b) and by the profile of each port (size, type of cargo, and logistics, among others). This is
due to the development of the port, as it can be greatly influenced by government policies and
regulations, central planning, impact control and market uncertainty (Dong et al., 2019). This allows
to identify environmental management priorities; identify the areas of high priority of common
Preprints (www.preprints.org) | NOT PEER-REVIEWED | Posted: 31 December 2020 doi:10.20944/preprints202012.0787.v1
© 2020 by the author(s). Distributed under a Creative Commons CC BY license.

concern in which ports they are working, and define the guidance framework and initiatives that the
PAs should take. (Puig et al., 2017).
The environmental sustainability of ports is at the same time relevant and complex. It is
relevant because the environmental management of ports is recognized (Bermúdez et al., 2019;
Taliani et al., 2017) , but there is still pressure to ensure competitiveness and globalization (Hervás-
Peralta et al., 2020). In this context, this article proposes, in a three-stage research and from an
economic and operational perspective, to analyze the relationships between environmental expenses,
the improvements achieved in 5 environmental variables analyzed and the efficiency.
The study is justified by two perspectives, firstly by the alignment of ports with global
environmental priorities (EcoPorts), and secondly by the economic and operational efficiency of the
ports. In the first place the literature reveals that sustainable port development encompasses social,
economic and environmental factors (Eswari & Yogeswari, 2019; Kuznetsov et al., 2015) . This
sustainable development, including port operations and projects, means having a long-term vision,
transparency, legal commitment, information exchange and innovation (Eswari & Yogeswari, 2019).
However, we still have a challenging scenario that demonstrates the need to have a strategic and
holistic vision, since the volume of cargo transported through ports is increasing, which increases
environmental impacts. In addition, maritime trade has changed with more and modern ports, which
also increases aspects of competitiveness (Taliani et al., 2017). Sustainability in port systems can be
challenging and complex (Eswari & Yogeswari, 2019), as it integrates organizational aspects and the
zone of influence of the port related to the environment, such as the preservation of the coast,
morphology and marine biodiversity (Castellano et al., 2020), in addition to economic aspects that
allow maintaining competitiveness at the global level (Taliani et al., 2017).
To support managers and society achieve sustainable development, aspects of environmental
management and environmental indicators have helped identify, control and monitor environmental
aspects and impacts (Rosa et al., 2019). The reason is that environmental management is used to
identify, measure and manage environmental information (Rosa et al., 2012). Studies have revealed
that to assist environmental management, indicators and metrics can be considered to control, monitor
and verify information. Environmental indicators and port evaluation systems are important for
measuring and monitoring issues related to policy, personnel, training, communication, monitoring
and environmental auditing (Puig et al., 2017). They can reveal the various environmental
dimensions, including, but not limited to, water consumption, water quality, carbon footprint, energy
consumption, and auditing, in addition to enabling the setting for priorities and specific information
for port development (Teerawattana & Yang, 2019; Kegalj et al., 2018; Roos & Kliemann Neto, 2017;
Taliani et al., 2017; Lonsdale et al., 2015; Macková et al., 2019; Lonsdale et al., 2015). It can be
useful mainly to define an overview of the position of the port sector and establish a performance that
allows us to outline future trends (Puig et al., 2017), assisting in risk mitigation and environmental
protection (Lonsdale et al., 2015), to make the business legitimate for stakeholders (Rosa, Bartolli
and Lunkes, 2021). In this sense, our study is justified when it allows analyzing the alignment of
environmental sustainability of Spanish ports with the priorities established by EcoPort.
The second justification of the study is the analysis of the economic and operational
efficiency of the ports. Recent studies have investigated this complex factor through efficiency
analysis instruments, such as Data Envelopment Analysis (DEA). The results of these studies are that
the integration between economic efficiency and environmental performance of ports is important to
improve economic value and to sustain the competitiveness of Port, having the environmental
performance as the central point (Castellano et al., 2020; Gobbi et al., 2019; Dong et al., 2019; Taliani
et al., 2017). The empirical results of these studies reveal that the DEA was used to analyze the
efficiency of the ports and verify a positive relationship between environmental sustainability and
economic performance.
Taliani et al (2017) analyzed the efficiency and environmental information of Spanish ports
identifying which efficient and marginally efficient ports provided the best environmental
disclosures. Gobbi et al., (2019) analyzed the environmental efficiency of Brazilian ports in relation
to plastic waste management using the DEA technique, and discovered that efficiency is not
Preprints (www.preprints.org) | NOT PEER-REVIEWED | Posted: 31 December 2020 doi:10.20944/preprints202012.0787.v1

consistent from one year to the next, which can occur due to flawed control practices and procedures,
as well as inaccurate information about waste generated and discarded by each port. Castellano et al.,
(2020) identified that the developed critical activities, such as energy-saving programs, actions to
reduce air and water pollution, and waste management contribute to improving environmental
performance and economic efficiency at the same time. Wang et al., (2020) verified in the study on
port efficiency using the DEA that the aspects of port cooperation can improve the expected overall
production but will lose its advantage with the improvement of the standards of emissions.
Considering the proposed objective and the justifications presented, this article is thus
organized in a presentation of the background and research hypotheses, materials and method, results,
and discussion. Finally, we included the references used.
2. Materials and Method
2.1. Data Collection and Analysis
The purpose of this article is to analyze, in a three-stage research, the relationships between
environmental expenses, the improvements achieved in 5 environmental variables analyzed and
efficiency, from an economic and operational perspective. The objective is to characterize the
following 24 out of the 28 Spanish Ports Authorities (PAs), based on the result of the analysis of the
relationships aforementioned: A Coruña, Almería, Avilés, Bahía De Algeciras, Bahia De Cádiz,
Baleares, Barcelona, Bilbao, Cartagena, Castellón, Ceuta, Ferrol-San Cibrao, Gijón, Huelva, Las
Palmas, Málaga, Marín Y Ría De Pontev., Melilla, Motril, S. Cruz De Tenerife, Tarragona, Valencia,
Vigo, Vilagarcía. The reference data for the study is 2018.
The purpose is to identify correlations among environmental improvements, and operational
and economic efficiency of port management, with consideration of environmental expenses, traffic,
and overheads structure. In the first stage of the research we analyzed the environmental memories
of the 24 PAs, which were part of our sample, to quantitatively determine the improvements they had
achieved in the 5 variables selected for the study: air quality, waste, fuel consumption, water
consumption and electricity consumption. We also analyzed the type of information they provided of
these variables in their environmental memories. Due to the existence of specific environmental
regulations, the main traffic in the PAs was considered.
Definition Scale/items
Air quality - Type of information
Waste - Type of information
Fuel consumption - Type of information
Water consumption - Type of information
Electricity consumption - Type of information
Noise - Type of information
• No information
• Descriptive (D)
• Monetary (M)
• Quantitative (Q)
• Descriptive & Monetary (D&M)
• Descriptive & Quantitative (D&Q)
• Monetary & Quantitative (M&Q)
• Descriptive, Monetary & Quantitative (D, M & Q)
Environmental expenses/operating expenses
Air quality improvement
Water consumption improvement
Waste improvement
Electricity consumption improvement
Fuels consumption improvement
ROI
%
Main Traffic
• Liquid bulks
• Dry bulks
• General cargo
• Liquid bulks/general cargo
• Dry bulks/general cargo
• General cargo/passengers
Table 1: Variables included in the first stage analysis and scales applied
Preprints (www.preprints.org) | NOT PEER-REVIEWED | Posted: 31 December 2020 doi:10.20944/preprints202012.0787.v1

In the second stage of the study, an Economic and Operational Efficiency analysis was
performed. A review of the literature on the efficiency of maritime ports shows that DEA is one of
the most frequently used quantitative techniques (Wang et al., 2020; Dong et al., 2019; Gobbi et al.,
2019; Taliani et al., 2017). Table 2 shows the variables applied in two analyses.
Variables applied in the DEA economic analysis
Inputs Depreciation and amortization of non-current assets
Personnel Expenses
Other operating expenses
Output Operating Revenue
Variables applied in the DEA operational analysis
Inputs Tangible Fixed Assets
Number of Employees
Total Operating Expenses
Outputs Percentage of Concessional Occupation
Thousands of GT
TM of goods (Freight traffic)
Table 2, Variables DEA
The third stage of the study involved a correlational analysis of the PAs environmental
reporting found in the first stage, and an analysis of the results found in the second stage of the
economic and operational efficiency. The purpose was to define and characterize environmental
groups, based on the information related to environmental improvements and environmental
expenditure obtained in the first stage, and compare it with the efficiencies reported by PAs. The data
used in this analysis were obtained from the official periodical reports issued by each PA. The
environmental evaluation, as well as the DEA economic and operational efficiency analysis, was
administered to 24 PAs, which represent the 85.7% of Spanish ports of general interest. Therefore,
this evaluation maintains its relevance. The Frontier Analyst software was used for the DEA analysis.
2.2. Research hypothesis
To assist the management of European ports the EcoPorts proposes methodologies for
controlling and monitoring green practices (Castellano et al., 2020). The fundamental principle of
EcoPorts is to create a level playing field regarding the environment through cooperation and
knowledge shared between ports. EcoPorts provides two well-established tools to its members: Self-
Diagnosis Method (SDM), and Port Environmental Review System (PERS), in addition to publicizing
all year round, a list of environmental priorities of the Top 10. The update of Top l0's environmental
issues is an important exercise, because it identifies the areas of high-priority common concern on
which ports are working, and defines the framework for guidance and initiatives to be taken by
representative bodies (Puig et al., 2017). However, the level of environmental expenditures, as well
as the port’s profile in terms of load, can influence performance (Taliani, Giralt and Rosa, 2017). We
understand that the level of evidence on environmental priorities can facilitate implementing
measures to manage environmental aspects; the first and second research hypothesis emerges:
h1= the type of traffic conditions environmental actions
h2 = environmental performance (improvements) depends on environmental expenditures
Previous studies have shown that port sustainability is complex, as it involves environmental
and economic interests that go beyond the organizational setting. The studies also revealed that
environmental aspects have become extremely important for the competitiveness of ports, and,
consequently, integrating environmental performance and economic efficiency is more and more
important, in order to improve economic value and to sustain the competitiveness of Port, considering
environmental performance as the central point (Castellano et al., 2020; Gobbi et al., 2019; Dong et
al., 2019; Taliani et al., 2017). From the context of this research, we understand that environmental
performance leads to greater economic efficiency, thus emerges the third and fourth hypothesis of
research:
h3= environmental spending and efficiency in port operations are correlated
h4= environmental spending and port economic efficiency are correlated
Preprints (www.preprints.org) | NOT PEER-REVIEWED | Posted: 31 December 2020 doi:10.20944/preprints202012.0787.v1

3. Results
In the first stage of the investigation, a database was developed including the improvements
(+ or -), as a percentage, analized by the 24 PAs in 2018. This type of information was collected
through the environmental memories (according to the scale set out in Table 1).
In the second stage, we opted for a DEA efficiency analysis with variable returns to scale
(Banker, Charnes y Cooper (BCC) model) using the variables previously defined. The model
calculates the relative efficiency of each PA, including changes in operational scale to reflect the
current reality of the PA comprising the Spanish Ports System. The study performed was designed
based on maximum outputs, an essential efficiency factor. The potential actions on the expense
structure and non-current assets of PAs is constrained, due to the nature of activity, as most PAs’
overhead expenses are fixed. As noted above, the data used in this analysis were obtained from the
official periodical reports issued by each PA. Table 3 shows the summary of the basic statistics of
DEA variables for the period analyzed.
Table 3: Basics statistics – Inputs/Outputs
Operating Revenue Personnel Amortization Other operating
expenses
Average 9,415,979.29 € 13,505,957.75 € 16,899,231.25 € 47,991,864.04 €
Max. 32,341,000.00 € 45,588,000.00 € 57,706,000.00 € 180,326,000.00 €
Min. 2,779,290.00 € 1,539,858.00 € 2,895,221.00 € 5,056,759.00 €
S.D. 6,690,252.93 € 11,845,564.87 € 13,895,955.70 € 42,149,184.68 €
Tangible Fixed
Assets
Number of
Employees
Total Operating
Expenses
Percentage of
Concessional
Occupation
Thousands of
GT
TM of goods
(Freight traffic)
Average
350,422,371.79
204.29
37,285,811.83
57.23
93,704,388.31
22,243,226.54
max
1,435,932,000.0
0
535.00
135,635,000.00
98.28
410,703,181.00
102,543,929.32
min
53,409,264.00
62.00
7,085,000.00
11.65
2,698,826.00
868,060.50
S.D.
319,124,662.11
115.94
30,217,728.81
20.38
116,675,483.17
25,076,961.18
The use of DEA analysis with variable returns to scale to maximize the outputs considered,
gives as a result the classification of the efficiency assigned to the different units analysed, to which
a value of 0% - 100% is assigned, and, thus the score assigned to efficient and inefficient PAs. (see
Table 4). The assumptions applied in DEA analysis, were: scores below 100% indicate relative level
of inefficiency.
Preprints (www.preprints.org) | NOT PEER-REVIEWED | Posted: 31 December 2020 doi:10.20944/preprints202012.0787.v1

Unit name Economic DEA Operational DEA
Score (%) RTS Score (%) RTS
A CORUÑA 92.76 1 100.00 1
ALMERÍA 71.4 -1 100.00 -1
AVILÉS 90.46 -1 50.10 1
BAHÍA DE ALGECIRAS 82.81 1 100.00 0
BAHIA DE CADIZ 64.61 1 66.50 1
BALEARES 100 1 87.30 1
BARCELONA 100 1 100.00 1
BILBAO 84.28 1 100.00 1
CARTAGENA 100 1 98.70 -1
CASTELLÓN 100 1 100.00 -1
CEUTA 100 -1 100.00 0
FERROL-SAN CIBRAO 88.15 -1 84.80 -1
GIJÓN 100 1 64.67 -1
HUELVA 91.81 -1 90.10 1
LAS PALMAS 98.66 1 100.00 0
MÁLAGA 74.41 -1 59.10 -1
MARÍN Y RÍA DE PONTEV. 100 -1 74.10 1
MELILLA 78.32 -1 83.60 -1
MOTRIL 100 -1 100.00 -1
S. CRUZ DE TENERIFE 82.57 1 100.00 0
TARRAGONA 88.97 -1 100.00 0
VALENCIA 100 1 100.00 1
VIGO 82.55 1 58.20 1
VILAGARCÍA 100 -1 100.00 0
Table 4: DEA Scores (2018)
The absolute score was divided among four categories: efficient PAs (score 100%),
marginally efficient PAs ( ≥ 90%), marginally inefficient PAs ( ≥ 80%) and inefficient PAs (< 80%)
as showed in Table 5.
ECONOMIC DEA
Code Meaning Frequency %
------ ----------------------------------- ---------- -------
1 Efficient 10 41.66
2 Marginally Efficient 3 12.50
3 Marginally Inefficient 7 29.16
4 Inefficient 4 16.66
---------- -------
Total 24 100.00
OPERATIONAL DEA
Code Meaning Frequency %
------ ----------------------------------- ---------- -------
1 Efficient 13 54.16
2 Marginally Efficient 1 4.16
3 Marginally Inefficient 4 16.66
4 Inefficient 6 25.00
---------- -------
Total 24 100.00
Table 5: PA classification by DEA Scores
Preprints (www.preprints.org) | NOT PEER-REVIEWED | Posted: 31 December 2020 doi:10.20944/preprints202012.0787.v1

In the third stage of the study, a cluster analysis was performed. Group or cluster analysis
techniques are statistical techniques serving to identify groups that, while otherwise different, are
internally homogenous. We used the Johnson algorithm, full chain build-up, for all cluster analyses,
in which the distance between two clusters (groups) is taken as the greatest between the elements
integrating those groups. (Santesmases, 2005 pp.388).
The variables considered in the cluster analysis, used to classify PAs based on environmental
improvements and expenses information, were the following: environmental expenses/operating
expenses; air quality improvement; water consumption improvement; waste improvement; electricity
consumption improvement; fuels consumption improvement. Table 6 contains the dendrogram
obtained from this analysis, which shows the classification obtained of the PAs.
1 A CORUÑA --------------------|
|
14 HUELVA --------------------------|
|
7 BARCELONA ----------------| |
| |
11 CEUTA ----------| | |
| | |
23 VIGO ----------------------------------|
|
9 CARTAGENA ---------------| |
| |
18 MELILLA ----------------------| |
| |
21 TARRAGONA -------------------------------------|
|
2 ALMERÍA -----------| |
| |
8 BILBAO --------------| |
| |
4 BAHÍA DE ALGECIR ----| | |
| | |
10 CASTELLÓN ----------| | |
| | |
17 MARÍN Y RÍA DE P ------| | | |
| | | |
24 VILAGARCÍA ---------------------| |
| |
20 S.CRUZ DE TENERI -------------------------| |
| |
19 MOTRIL ------------------------------------||
||
3 AVILÉS ---| ||
| ||
16 MÁLAGA -----| ||
| ||
22 VALENCIA ---------| ||
| ||
15 LAS PALMAS --------------| ||
| ||
12 FERROL-SAN CIBRA -----------------------------| ||
| ||
5 BAHIA DE CADIZ -------------| | ||
| | ||
13 GIJÓN -------------------------------------------------|
|
6 BALEARES -------------------------------------------------|
| | | | | | | |
Distance: ----------------------------------------------------------
0 1 2 3 4 5 6 7
Group Nº Code
----- ----- --------------------------------------------------------
1 5 1 14 7 11 23
2 3 9 18 21
3 8 2 8 4 10 17 24 20 19
4 5 3 16 22 15 12
5 2 5 13
6 1 6
Total sum of squares explained by clustering: 67,80%
TOTAL GROUP 1 GROUP 2 GROUP 3 GROUP 4 GROUP 5 GROUP 6
¯¯¯¯¯¯¯¯¯¯¯ ¯¯¯¯¯¯¯¯¯¯¯ ¯¯¯¯¯¯¯¯¯¯¯ ¯¯¯¯¯¯¯¯¯¯¯ ¯¯¯¯¯¯¯¯¯¯¯ ¯¯¯¯¯¯¯¯¯¯¯ ¯¯¯¯¯¯¯¯¯¯¯
NUMBER: 24 5 3 8 5 2 1
Sum of squared: 10.08 0.74 0.75 1.45 0.16 0.15 0.00
¯¯¯¯¯¯¯¯¯¯¯ ¯¯¯¯¯¯¯¯¯¯¯ ¯¯¯¯¯¯¯¯¯¯¯ ¯¯¯¯¯¯¯¯¯¯¯ ¯¯¯¯¯¯¯¯¯¯¯ ¯¯¯¯¯¯¯¯¯¯¯ ¯¯¯¯¯¯¯¯¯¯¯
Variables: ANOVA / F de Snedecor
¯¯¯¯¯¯¯¯¯¯ ¯¯¯¯¯¯¯¯¯¯¯¯¯¯¯¯¯¯¯¯¯¯¯¯
% enviro Average: 0.04 0.09 + 0.01 - 0.03 0.03 0.01 0.06 F(5.18) = 4.2624
S.D.: 0.04 0.04 0.00 0.02 0.02 0.01 0.00 (p = 0.0099)
air impr Average: 0.11 0.15 -0.03 -0.06 - -0.02 0.92 + 0.76 F(5.18) = 12.5028
S.D.: 0.34 0.17 0.13 0.21 0.08 0.08 0.00 (p = 0.0000)
water co Average: -0.03 -0.33 0.11 0.09 0.05 0.17 + -0.72 - F(5.18) = 7.0843
S.D.: 0.27 0.21 0.20 0.16 0.07 0.17 0.00 (p = 0.0008)
waste i Average: 0.26 0.16 0.12 0.07 - 0.72 + 0.30 0.24 F(5.18) = 16.3307
S.D.: 0.27 0.10 0.23 0.09 0.04 0.17 0.00 (p = 0.0000)
electric Average: 0.01 -0.06 -0.18 - 0.08 0.03 0.01 0.13 + F(5.18) = 2.4536
S.D.: 0.14 0.13 0.10 0.13 0.03 0.05 0.00 (p = 0.0731)
fuels im Average: 0.06 0.03 0.51 -0.12 - -0.02 -0.11 1.00 + F(5.18) = 4.6785
S.D.: 0.37 0.22 0.36 0.29 0.14 0.08 0.00 (p = 0.0065)
Table 6: Dendrogram - PAs classification based on type of environmental information disclosed
Preprints (www.preprints.org) | NOT PEER-REVIEWED | Posted: 31 December 2020 doi:10.20944/preprints202012.0787.v1

4. Discussion
4.1. Descriptive analysis
The variables analyzed to evaluate the environmental actions that have been put in place by
the various Spanish Ports Authorities are presented in the Table 7.
% Environmental expenses / Operating expenses
-Air quality
Waste
Fuels consumption
Water consumption
Electricity consumption
Table 7. Variables used in the analysis
The variation experienced between 2017 and 2018 has been analyzed for each of these
variables. The individual values obtained by the different PAs are not detailed in this article; instead
the data has been analyzed using a Cluster analysis, which has allowed for the identification of 6
groups. Table 8 shows the variation rates achieved by each group in each of the variables mentioned
above.
Table 8. Variation percentages for environmental variables
If these rates are analyzed, a well-defined behavior can be observed in the six groups. Group
6 stands out, as it shows an above-average environmental expenditure, which has translated into
important above-average improvements in Air Quality, Fuels Consumption and Electricity
Consumption. Despite achieving a major improvement in Waste, it is below average. On the contrary,
Group 1 assembles the Ports Authorities that dedicates an above-average environmental expenditure
and managed to improve both Air Quality and Waste. Group 5 only allocates 1% of its operation
expenditure to environmental expenditure, although it achieves improvement ratios that are above the
corresponding averages in Air Quality, Waste and Water Consumption. Group 3 and 4 allocate 3%
of their operational expenditure to the environment achieving an above-average improvement in
Water Consumption and Electricity Consumption. With regards to Group 2, its 1% environmental
expenditure has allowed it to improve more than the average in Fuels Consumption and Electricity
Consumption.
It is worth noting that the groups that have allocated a higher percentage of their expenditure
to the environment have not managed to improve in Water Consumption. In the case of Group 6,
which is an insular Port Authority, this can be caused by its high needs for this element and its reduced
capacity to economize.
If the variation rates presented in Table 8 are compared to the variations shown by the Port
Authorities (between 2017 and 2018) regarding the size of the ships that have circulated (measured
in G.T. thousands) and good tonnes, a more discernible behavior can be observed. Figure 1 represents
the variations observed in the activity levels of the six groups identified in the Ports Authorities
between 2017 and 2018.
GROUP 1 GROUP 2 GROUP 3 GROUP 4 GROUP 5 GROUP 6 Average
% environmental expenses 9% 1% 3% 3% 1% 6% 4%
Air quality 15% -3% -6% -2% 92% 76% 11%
Waste 16% 12% 7% 72% 30% 24% 26%
Fuels consumption 3% 51% -12% -2% -11% 100% 6%
Water consumption -33% 11% 9% 5% 17% -72% -3%
Electricity consumption -6% -18% 8% 3% 1% 13% 1%
Preprints (www.preprints.org) | NOT PEER-REVIEWED | Posted: 31 December 2020 doi:10.20944/preprints202012.0787.v1

Figure 1. Variations in the activity levels of the Cluster Groups
Group 6 is the one that displays an increase in the port activity compared to the others, both
in absolute numbers, regarding the average variations experienced by the G.T. and the Goods Tonnes.
As for this, we can assert that despite the increase in the port activity, the improvements in the
environmental variables are above the average, except for Water Consumption, which experiences
the worst variation rate, as it did not achieve savings in the use of this resource.
Group 4 also experiences an economic activity variation rate above the corresponding
averages, categorizing its environmental actions as very positive, except for the deterioration
experienced in Air Quality, caused by a bigger number of ship movements, and Fuel Consumption.
It is worth noting that in this Group are included two of the biggest Ports Authorities in containerized
general cargo and one of the biggest ports in solid bulk, which results in more air pollution.
In Group 1 it is noted an increase in G.T. and Goods tonnes also above the corresponding
averages. This group shows deterioration in Water Consumption and Electricity Consumption. In this
group there can be found some of the Port Authorities that manage liquid bulk cargo which can be
the cause preventing a savings increase in Water Consumption. However, the increase in Electricity
Consumption is caused by the absence of measures to improve the efficiency when consuming this
resource.
Group 3 shows a bigger movement of ships and a lower number of Goods tonnes. This can be
the origin of deterioration in the Air Quality, although the lack of energy efficiency is obvious with
regards to Fuels Consumption, as it has deteriorated over 2018. Groups 2 and 5 show a negative
economic activity variation rate and display an uneven behavior in Air Quality and Electricity
Consumption, which worsen in Group 2, even though Fuels Consumption worsens in Group 5.
Considering the information on the variables used in the group definition listed in Table 5
(previously analyzed) and the characterization of groups by traffic, reflected in Figure 2, data could
be obtained that allowed contrasting the hypotheses 1 (the type of traffic conditions environmental
actions) and 2 (environmental performance -improvements- depends on environmental expenditures).
Preprints (www.preprints.org) | NOT PEER-REVIEWED | Posted: 31 December 2020 doi:10.20944/preprints202012.0787.v1

Figure 2. Traffic by group
What was verified in the port sector is that the type of cargo can be determinant for the type
and level of environmental impact, that is, cargo considered dangerous (such as liquid cargo) is more
likely to have environmental impacts. However, the results regarding the disclosure of environmental
performance do not allow confirming the first hypothesis, because the groups with this load profile
were not the ones that obtained the highest level of evidence. Based on the information presented, h1
hypothesis cannot be confirmed, whereas h2 can.
The characterization of the groups obtained, based on the two DEA analyses done and
considering environmental variables (see table 9, 10 y 11) shows that group 1 which is the highest
environmental expenditure is also the one that gets the best efficiency results calculated from the
economic and operational variables. The behavior of groups 3 and 4, with an environmental
expenditure of around 3%, is similar in terms of economic efficiency, but not in terms of operational
efficiency. The lowest environmental expenditure groups, 2 and 5, are groups that show a higher level
of operational and economic inefficiency, although both have members who are efficient from an
economic perspective. Group 6, with a single PA, is an efficient group from an economic perspective,
and marginally inefficient from an operational perspective (DEA score = 87.30%).
Based on the information presented, h3 hypotheses (environmental spending and efficiency in
port operations are correlated) and h4 hypotheses (environmental spending and port economic
efficiency are correlated) can be confirmed.
cluster
-----------------------------------------------------------------------
GROUP 1 GROUP 2 GROUP 3 GROUP 4 GROUP 5 GROUP 6
TOTAL
----------- ----------- ----------- ----------- ----------- ----------- -----------
DEAOP_C Frec % Frec % Frec % Frec % Frec % Frec % Frec %
----------------- ---- ------ ---- ------ ---- ------ ---- ------ ---- ------ ---- ------ ---- ------
1 Efficient 13 54.17 3 60.00 1 33.33 7 87.50 2 40.00 0 0.00 0 0.00
2 Marginally Eff 2 8.33 1 20.00 1 33.33 0 0.00 0 0.00 0 0.00 0 0.00
icient
3 Marginally Ine 3 12.50 0 0.00 1 33.33 0 0.00 1 20.00 0 0.00 1 100.00
fficient
4 Inefficient 6 25.00 1 20.00 0 0.00 1 12.50 2 40.00 2 100.00 0 0.00
---- ------ ---- ------ ---- ------ ---- ------ ---- ------ ---- ------ ---- ------
TOTAL 24 (24) 5 (5) 3 (3) 8 (8) 5 (5) 2 (2) 1 (1)
Ji squared 15 degree of freedom = 23.8897 (p = 0.0670)
Table 9. Group by Operational variables DEA
Preprints (www.preprints.org) | NOT PEER-REVIEWED | Posted: 31 December 2020 doi:10.20944/preprints202012.0787.v1

cluster
-----------------------------------------------------------------------
GROUP 1 GROUP 2 GROUP 3 GROUP 4 GROUP 5 GROUP 6
TOTAL
----------- ----------- ----------- ----------- ----------- ----------- -----------
DEAECO_C Frec % Frec % Frec % Frec % Frec % Frec % Frec %
----------------- ---- ------ ---- ------ ---- ------ ---- ------ ---- ------ ---- ------ ---- ------
1 Efficient 10 41.67 2 40.00 1 33.33 4 50.00 1 20.00 1 50.00 1 100.00
2 Marginally Eff 4 16.67 2 40.00 0 0.00 0 0.00 2 40.00 0 0.00 0 0.00
icient
3 Marginally Ine 6 25.00 1 20.00 1 33.33 3 37.50 1 20.00 0 0.00 0 0.00
fficient
4 Inefficient 4 16.67 0 0.00 1 33.33 1 12.50 1 20.00 1 50.00 0 0.00
---- ------ ---- ------ ---- ------ ---- ------ ---- ------ ---- ------ ---- ------
TOTAL 24 (24) 5 (5) 3 (3) 8 (8) 5 (5) 2 (2) 1 (1)
Ji squared 15 degree of freedom= 11.5833 (p = 0.7103)
Table 10. Group by Economic variables DEA
% environmental
expenses (group
average)
GROUP 1 GROUP 2 GROUP 3 GROUP 4 GROUP 5 GROUP 6
higher average
(9%) lowest average (1%) 3% 3% 1% 6%
DEA
OPERATIONAL
60% efficient 33.33% efficient 87.5% efficient 40% efficient 100% inefficient
100%
marginally
inefficient
20 %
marginally
efficient
33.33% marginally
inefficient
20% marginally
inefficient
20% inefficient 33.333% inefficient 12.5% efficient 40% inefficient
DEA
ECONOMIC
40% efficient 33.33% efficient 50% efficient 20% efficient 50% efficient 100% efficient
40 %
marginally
efficient
33.33% marginally
inefficient
37.5% marginally
inefficient
40 % marginally
efficient 50% inefficient
20% marginally
inefficient 33.333% efficient 12.5% inefficient
20% marginally
inefficient
20% inefficient
Table 11. Group by efficiencies and environmental expenses
4.2.Environmental Disclosure and alignment with environmental priorities
The analysis of environmental disclosure is made from the elements considered a priority in
EcoPorts2018. Although the EcoPorts system is complex in terms of environmental management, the
individual data of the analyzed ports are not for public access. The information is consolidated and
presented in the annual report without detailed information by port and performance of each element.
Even with this limitation, the report allows the priorities established by European ports to be followed
annually, as shown in Figure 3.
Figure 3. Top 10 EcoPorts2018
Source: EcoPorts (2020)
Preprints (www.preprints.org) | NOT PEER-REVIEWED | Posted: 31 December 2020 doi:10.20944/preprints202012.0787.v1
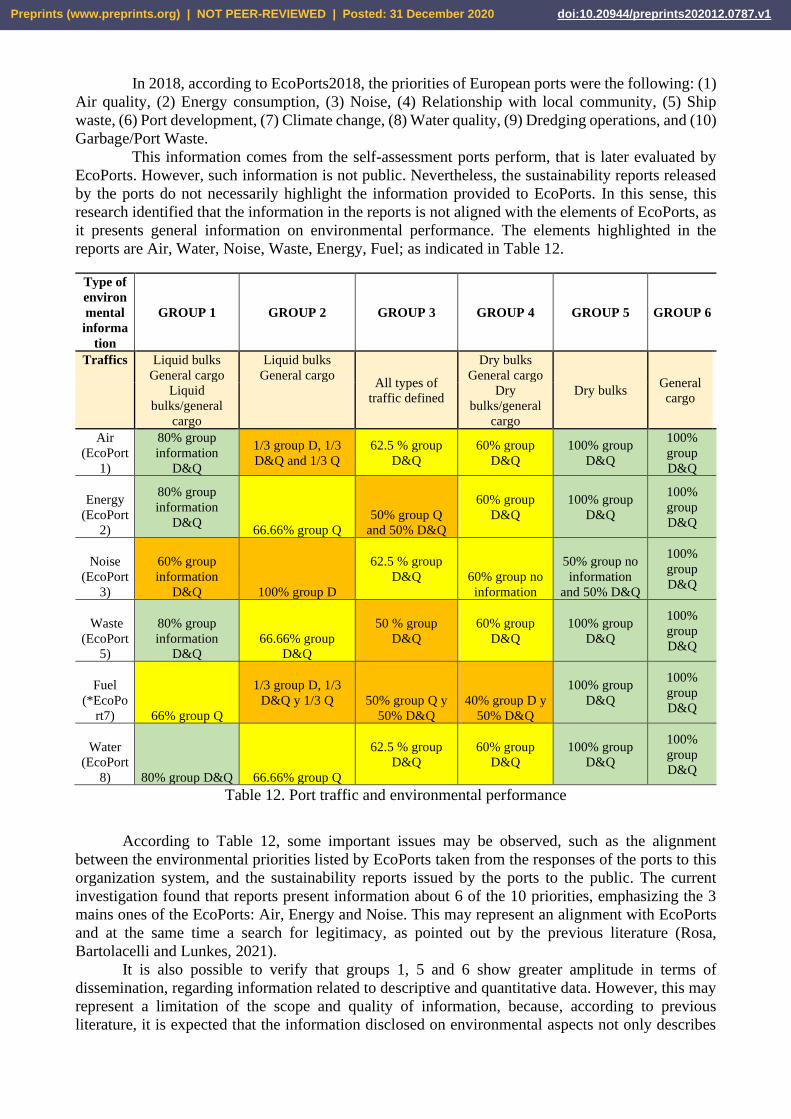
In 2018, according to EcoPorts2018, the priorities of European ports were the following: (1)
Air quality, (2) Energy consumption, (3) Noise, (4) Relationship with local community, (5) Ship
waste, (6) Port development, (7) Climate change, (8) Water quality, (9) Dredging operations, and (10)
Garbage/Port Waste.
This information comes from the self-assessment ports perform, that is later evaluated by
EcoPorts. However, such information is not public. Nevertheless, the sustainability reports released
by the ports do not necessarily highlight the information provided to EcoPorts. In this sense, this
research identified that the information in the reports is not aligned with the elements of EcoPorts, as
it presents general information on environmental performance. The elements highlighted in the
reports are Air, Water, Noise, Waste, Energy, Fuel; as indicated in Table 12.
Type of
environ
mental
informa
tion
GROUP 1 GROUP 2 GROUP 3 GROUP 4 GROUP 5 GROUP 6
Traffics Liquid bulks Liquid bulks
All types of
traffic defined
Dry bulks
Dry bulks General
cargo
General cargo General cargo General cargo
Liquid
bulks/general
cargo
Dry
bulks/general
cargo
Air
(EcoPort
1)
80% group
information
D&Q
1/3 group D, 1/3
D&Q and 1/3 Q
62.5 % group
D&Q
60% group
D&Q
100% group
D&Q
100%
group
D&Q
Energy
(EcoPort
2)
80% group
information
D&Q 66.66% group Q
50% group Q
and 50% D&Q
60% group
D&Q
100% group
D&Q
100%
group
D&Q
Noise
(EcoPort
3)
60% group
information
D&Q 100% group D
62.5 % group
D&Q 60% group no
information
50% group no
information
and 50% D&Q
100%
group
D&Q
Waste
(EcoPort
5)
80% group
information
D&Q
66.66% group
D&Q
50 % group
D&Q
60% group
D&Q
100% group
D&Q
100%
group
D&Q
Fuel
(*EcoPo
rt7) 66% group Q
1/3 group D, 1/3
D&Q y 1/3 Q 50% group Q y
50% D&Q
40% group D y
50% D&Q
100% group
D&Q
100%
group
D&Q
Water
(EcoPort
8) 80% group D&Q 66.66% group Q
62.5 % group
D&Q
60% group
D&Q
100% group
D&Q
100%
group
D&Q
Table 12. Port traffic and environmental performance
According to Table 12, some important issues may be observed, such as the alignment
between the environmental priorities listed by EcoPorts taken from the responses of the ports to this
organization system, and the sustainability reports issued by the ports to the public. The current
investigation found that reports present information about 6 of the 10 priorities, emphasizing the 3
mains ones of the EcoPorts: Air, Energy and Noise. This may represent an alignment with EcoPorts
and at the same time a search for legitimacy, as pointed out by the previous literature (Rosa,
Bartolacelli and Lunkes, 2021).
It is also possible to verify that groups 1, 5 and 6 show greater amplitude in terms of
dissemination, regarding information related to descriptive and quantitative data. However, this may
represent a limitation of the scope and quality of information, because, according to previous
literature, it is expected that the information disclosed on environmental aspects not only describes
Preprints (www.preprints.org) | NOT PEER-REVIEWED | Posted: 31 December 2020 doi:10.20944/preprints202012.0787.v1

the situation of each element (Air, Energy, Noise, Waste, Ful and Water), but also is able to provide
quantitative and monetary information. This demonstrates that the ports analyzed have not linked
environmental issues to economic ones. This may limit information, which may also hinder that the
different stakeholders understand the financial effort made to address the environmental issues of
ports, as pointed out by the previous literature (Taliani, Giralt and Rosa 2017).
Some organizational aspects may lead to a higher or lower level of evidence (Bermúdez et al.,
2019; Taliani et al., 2017), because the sustainability in port systems can be challenging and complex
(Eswari & Yogeswari, 2019), as it integrates organizational aspects and the zone of influence of the
port related to the environment, such as the preservation of the coast, morphology and marine
biodiversity (Castellano et al., 2020), in addition to economic aspects that allow maintaining
competitiveness at the global level (Taliani et al., 2017).
Additionally, it was verified that group 1, where all ports manage dangerous net cargo,
included ports with the highest environmental expenditure. What may demonstrate that there is no
disclosure, there are expenses necessary to manage performance or environmental impacts. However,
the information about the expenditure is limited (without detailing the type of expenditure) which
does not allow confirming the first hypothesis of this research. As shown in Table 4.
Environmental
expenditures
(E.S) Group 1 Group 2 Group 3 Group 4 Group 5 Group 6
% E.S. 9% 1% 3% 3% 1% 6%
Air quality
(EcoPort1) 15% -3% -6% -2% 92% 76%
Electricity
(EcoPort2) -6% -18% 8% 3% 1% 13%
Fuel (EcoPort7) 3% 51% -12% -2% -11% 100%
Water (EcoPort8) -33% 11% 9% 5% 17% -72%
Waste (Ecoport10) 16% 12% 7% 72% 30% 24%
Table 4. Evolution of the 2018 information in relation to the previous year and environmental
performance
5. Conclusion
The purpose of this article is to analyze, in a three-stage research, the relationships between
environmental expenses, the improvements achieved in 5 environmental variables analyzed and
efficiency from an economic and operational perspective.
The objective is to characterize, the following 24 out of the 28 Spanish Ports Authorities
(PAs), based on the result of the analysis of the relationships aforementioned: A Coruña, Almería,
Avilés, Bahía De Algeciras, Bahia De Cádiz, Baleares, Barcelona, Bilbao, Cartagena, Castellón,
Ceuta, Ferrol-San Cibrao, Gijón, Huelva, Las Palmas, Málaga, Marín Y Ría De Pontev., Melilla,
Motril, S. Cruz De Tenerife, Tarragona, Valencia, Vigo, Vilagarcía. The reference data for the study
is 2018. The purpose is to identify correlations among environmental improvements, operational and
economic efficiency of port management, with consideration of environmental expenses, traffic, and
overheads structure.
What was verified in the port sector is that the type of cargo can be determinant for the type
and level of environmental impact, and that the results regarding the disclosure of environmental
performance do not allow confirming the first hypothesis, because the groups with this load profile
were not the ones that obtained the highest level of evidence. The characterization, based on the two
DEA analyses completed, of the groups obtained considering environmental variables (see tables 9,
10 y 11) shows that environmental expenditures can influence the environmental performance in
groups 3, 4 and 6, but the same cannot be affirmed for the other groups, which demonstrates that it is
not conclusive that more expenses result in better performance, because other issues such as type of
load can influence this performance.
Preprints (www.preprints.org) | NOT PEER-REVIEWED | Posted: 31 December 2020 doi:10.20944/preprints202012.0787.v1
The study reveals an alignment of the information provided by ports as relevant and
environmental priorities listed by EcoPorts, taken from the responses of the ports to the EP system,
and the sustainability reports issued by the ports to the public. The current research found that the
reports present information about 6 of the 10 priorities, emphasizing the 3 main priorities of the EP:
Air, Energy and Noise.
Even though an alignment was found with the priorities listed by EcoPorts and, although the
ports studied showed economic and operational efficiency, as well as a relationship between
environmental expenditures and environmental performance, we were also able to find limitations
within the study. Firstly, it was not possible to identify the extension of the elements of environmental
performance, since most of the information is descriptive and quantitative. Secondly, although we
expected the type of cargo transported to be related to the environmental actions developed in the
ports, it was not possible to verify this hypothesis in the ports analyzed.
For future research, it is considered relevant to analyze the role of coercive and voluntary
elements regarding environmental dissemination and alignment with environmental priorities of
international organizations.
References
Bermúdez, F. M., Laxe, F. G., & Aguayo-Lorenzo, E. (2019a). Assessment of the tools to monitor
air pollution in the Spanish ports system. Air Quality, Atmosphere and Health, 12(6), 651–659.
https://doi.org/10.1007/s11869-019-00684-x
Bermúdez, F. M., Laxe, F. G., & Aguayo-Lorenzo, E. (2019b). Port sustainability in Spain: the case
of noise. Environment, Development and Sustainability. https://doi.org/10.1007/s10668-019-
00560-9
Castellano, R., Ferretti, M., Musella, G., & Risitano, M. (2020). Evaluating the economic and
environmental efficiency of ports: Evidence from Italy. Journal of Cleaner Production, 271.
https://doi.org/10.1016/j.jclepro.2020.122560
da Rosa, F. S., Ensslin, S. R., Ensslin, L., & Lunkes, R. J. (2012). Environmental disclosure
management: A constructivist case. Management Decision, 50(6).
https://doi.org/10.1108/00251741211238364
Dong, G., Zhu, J., Li, J., Wang, H., & Gajpal, Y. (2019). Evaluating the environmental performance
and operational efficiency of container ports: An application to the maritime silk road.
International Journal of Environmental Research and Public Health, 16(12).
https://doi.org/10.3390/ijerph16122226
EcoPorts (2020). environmental initiative of the European port sector of the European Sea Ports
Organisation (ESPO) Available em http://ecoports.com, Consulted no período de 01/06/2020 a
16/12/2020.
Eswari, K., & Yogeswari, K. (2019). Study of sustainable indicators for port environment in indian
context. Journal of Green Engineering, 9(2), 224–244.
Gobbi, C. N., Sanches, V. M. L., Guimarães, M. J. D. O. C., Freitas, M. A. V. D., & Pacheco, E. B.
A. V. (2019). Efficiency in the environmental management of plastic wastes at Brazilian ports
based on data envelopment analysis. Marine Pollution Bulletin, 142, 377–383.
https://doi.org/10.1016/j.marpolbul.2019.03.061
Hervás-Peralta, M., Rožić, T., Poveda-Reyes, S., Santarremigia, F. E., Pastor-Ferrando, J.-P., &
Molero, G. D. (2020). Modelling the performance of port terminals using microsimulation.
European Transport - Trasporti Europei, 76.
Hiranandani, V. (2014). Sustainable development in seaports: A multi-case study. WMU Journal of
Maritime Affairs, 13(1), 127–172. https://doi.org/10.1007/s13437-013-0040-y
Kegalj, I., Traven, L., & Bukša, J. (2018). Model of calculating a composite environmental index
for assessing the impact of port processes on environment: a case study of container terminal.
Environmental Monitoring and Assessment, 190(10). https://doi.org/10.1007/s10661-018-
6965-z
Preprints (www.preprints.org) | NOT PEER-REVIEWED | Posted: 31 December 2020 doi:10.20944/preprints202012.0787.v1
Kuznetsov, A., Dinwoodie, J., Gibbs, D., Sansom, M., & Knowles, H. (2015). Towards a
sustainability management system for smaller ports. Marine Policy, 54, 59–68.
https://doi.org/10.1016/j.marpol.2014.12.016
Lawer, E. T. (2019). Transnational networks for the ‘greening’ of ports: learning from best
practice? GeoJournal. https://doi.org/10.1007/s10708-019-10096-0
Lonsdale, J.-A., Weston, K., Barnard, S., Boyes, S. J., & Elliott, M. (2015). Integrating
management tools and concepts to develop an estuarine planning support system: A case study
of the Humber Estuary, Eastern England. Marine Pollution Bulletin, 100(1), 393–405.
https://doi.org/10.1016/j.marpolbul.2015.08.017
Lun, Y. H. V. (2013). Development of green shipping network to enhance environmental and
economic performance. Polish Maritime Research, 20(Special Is), 13–19.
https://doi.org/10.2478/pomr-2013-0023
Macková, M., Hazuchová, N., & Stávková, J. (2019). Czech consumers’ attitudes to food waste.
Agricultural Economics (Czech Republic), 65(7), 314–321. https://doi.org/10.17221/364/2018-
AGRICECON
Puig, M., Michail, A., Wooldridge, C., & Darbra, R. M. (2017). Benchmark dynamics in the
environmental performance of ports. Marine Pollution Bulletin, 121(1–2), 111–119.
https://doi.org/10.1016/j.marpolbul.2017.05.021
Roos, E. C., & Kliemann Neto, F. J. (2017). Tools for evaluating environmental performance at
Brazilian public ports: Analysis and proposal. Marine Pollution Bulletin, 115(1–2), 211–216.
https://doi.org/10.1016/j.marpolbul.2016.12.015
Rosa, F. S., Lunkes, R. J., & Brizzola, M. M. B. (2019). Exploring the relationship between internal
pressures, greenhouse gas management and performance of Brazilian companies. Journal of
Cleaner Production, 212. https://doi.org/10.1016/j.jclepro.2018.12.042.
Rosa, F.S., Bartolacelli, A, Lunkes, RJ. (2021). Post-regulation effects on factors driving (no)
environmental disclosures about greenhouse gas emissions in listed Italian companies.
Financial Reporting and Accounting Journal. In press.
Santesmases Mestre, M. (2005). Diseño y análisis de encuestas en investigación social. Madrid: Ed.
Pirámide
Taliani, E. C., Escobar, S. G., & Silva Da Rosa, F. (2017). Environmental disclosure and economic
efficiency: A correlational evaluation of Spanish ports authorities. Intangible Capital, 13(4).
https://doi.org/10.3926/ic.937
Teerawattana, R., & Yang, Y.-C. (2019). Environmental Performance Indicators for Green Port
Policy Evaluation: Case Study of Laem Chabang Port. Asian Journal of Shipping and
Logistics, 35(1), 63–69. https://doi.org/10.1016/j.ajsl.2019.03.009
Vogt, M., Degenhart, L., Da Rosa, F. S., & Hein, N. (2016). Social and environmental
responsibility: Analysis of transport environmental impacts on sustainability and yearly reports
of Brazilian companies. Revista Em Agronegocio e Meio Ambiente, 9(4).
https://doi.org/10.17765/2176-9168.2016v9n4p889-915
Wang, Z., Wu, X., Guo, J., Wei, G., & Dooling, T. A. (2020). Efficiency evaluation and PM
emission reallocation of China ports based on improved DEA models. Transportation
Research Part D: Transport and Environment, 82. https://doi.org/10.1016/j.trd.2020.102317
Preprints (www.preprints.org) | NOT PEER-REVIEWED | Posted: 31 December 2020 doi:10.20944/preprints202012.0787.v1