environmental-economic accounts for act state of
TRANSCRIPT

ENVIRONMENTAL-ECONOMIC ACCOUNTS FOR ACT STATE OF ENVIRONMENT REPORTING
PROOF OF CONCEPT SEPTEMBER 2017

i
© Office of the Commissioner for Sustainability and the Environment 2017
With the exception of the Commonwealth Coat of Arms and where otherwise noted, all
material presented in this document is provided under a Creative Commons Attribution 3.0
Australia license (http://creativecommons.org/licenses/by/3.0/au/). The details of the relevant
license conditions are available on the Creative Commons website (accessible using the
links provided), as is the full legal code for the CC BY 3.0 AU license
(http://creativecommons.org/licenses/by/3.0/au/legalcode).
Recommended citation: Smith, B., Summers, D., Vardon, M. 2017, Environmental-economic
accounts for ACT State of the Environment Reporting: Proof of Concept, ACT Office of the
Commissioner for Sustainability and the Environment, Canberra, Australia.
Published by the Office of the Commissioner for Sustainability and the Environment,
Canberra, 2017.
This document is available online at www.environmentcommissioner.act.gov.au
For further information, contact:
Office of the Commissioner for Sustainability and the Environment
GPO Box 158, Canberra ACT 2601
Telephone: (02) 6207 2626
Email: [email protected]
Website: www.environmentcommissioner.act.gov.au

ii
Authors
Becky Smith, David M. Summers and Michael Vardon
Acknowledgements
Information and Assistance
Environment Planning and Sustainable Development Directorate
Transport Canberra and City Services Directorate
Land Development Agency
Access Canberra
ICON Water
ACT Emergency Services Agency
Collaborations
Australian National University
Australian Bureau of Statistics
Special thanks:
To Peter Meadows, Peter Comisari, Sarah Coleman and Steve May for their always informed and
very pragmatic advice. To Peter Burnett for his encouragement, enthusiasm and advice around
matters of policy. To Annabelle Doolan and Danswell Starrs for assistance with the water accounts.
And to Gayan Ratwatte for providing data and explanations for the waste account.
Expert Advice and Review
Carl Obst
Mark Eigenraam

iii
Table of Contents
Authors ...........................................................................................................................ii
Acknowledgements ........................................................................................................ii
Acronyms .............................................................................................................................. v
1. Introduction.................................................................................................................... 1
Rationale for a new approach ........................................................................................ 1
Introducing Environmental-Economic Accounting .......................................................... 2
Summary of accounts produced .................................................................................... 5
Results and Conclusion ................................................................................................. 7
2. Land account ................................................................................................................. 9
Outline ........................................................................................................................... 9
ACT State of the Environment Reporting and the Land Account.................................... 9
Potential Uses of the Land Account ............................................................................. 10
Scope of these accounts ............................................................................................. 10
Findings ....................................................................................................................... 10
3. Environmental condition accounts ............................................................................... 14
Outline ......................................................................................................................... 14
ACT State of the Environment Reporting and the Environmental Condition Accounts . 14
Potential Uses of the Environmental Condition Accounts............................................. 15
Scope of this account .................................................................................................. 15
Findings ....................................................................................................................... 15
4. Biodiversity accounts ................................................................................................... 24
Outline ......................................................................................................................... 24
ACT State of the Environment Reporting and Biodiversity Accounts ........................... 24
Potential Uses of Biodiversity Accounts ....................................................................... 24
Scope of this account .................................................................................................. 25
Findings ....................................................................................................................... 25
5. Water accounts ........................................................................................................... 27

iv
Outline ......................................................................................................................... 27
ACT State of the Environment Reporting and the Water Accounts .............................. 27
Potential Uses of the Water Accounts.......................................................................... 27
Scope of this account .................................................................................................. 27
Findings ....................................................................................................................... 28
6. Air Emissions Account ................................................................................................. 31
Outline ......................................................................................................................... 31
ACT State of the Environment Reporting and the Air Emissions Account .................... 31
Potential Use of the Air Emissions Account ................................................................. 31
Scope of this account .................................................................................................. 32
Findings ....................................................................................................................... 32
7. Solid waste account ..................................................................................................... 43
Outline ......................................................................................................................... 43
ACT State of the Environment Reporting and the Waste Account ............................... 43
Potential Uses of the Waste Account ........................................................................... 44
Scope of these accounts ............................................................................................. 44
Findings ....................................................................................................................... 44
8. Environmental expenditure account ............................................................................. 49
Outline ......................................................................................................................... 49
ACT State of the Environment Reporting and the Expenditure account ....................... 49
Potential Uses of the Environmental Expenditure Account .......................................... 49
Scope of this account .................................................................................................. 50
Findings ....................................................................................................................... 50

v
Acronyms
AAQ NEPM ‒ National Environment Protection (Ambient Air Quality) Measure
ABS ‒ Australian Bureau of Statistics
ANZSIC ‒ Australian and New Zealand Standard Industrial Classification
ACT ‒ Australian Capital Territory
BOM – Bureau of Meteorology
CEA ‒ Classification of Environmental Activities
CHIP ‒ Catchment Health Indicator Program
DPSIR ‒ Drivers, Pressures, State, Impacts and Responses
DLDC ‒ Dynamic Land Cover Dataset
ECS ‒ Environmental Condition Score
EEA ‒ Environmental-economic accounting
IDEEA Group ‒ Institute for Development of Environmental-Economic Accounting
GDP ‒ Gross Domestic Product
GSP ‒ Gross State Product
NPI – National Pollutant Inventory
NEPM – National Environment Protection Measure
OCSE ‒ Office of the Commissioner for Sustainability and the Environment
SEEA ‒ System of Environmental-Economic Accounting
SOE – State of the Environment SNA ‒ System of National Accounts
TVOC – Total Volatile Organic Compound
UNFCCC ‒ United Nations Framework Convention on Climate Change WAVES
‒ Wealth Accounting and the Valuation of Ecosystem Services
1
PROOF OF CONCEPT
ENVIRONMENTAL ECONOMIC ACCOUNTING FOR ACT STATE OF THE ENVIRONMENT REPORTING
1. Introduction
Rationale for a new approach
The Commissioner for Sustainability and the Environment ACT 1993 prescribes the content of the ACT’s State of the Environment Report. The report must include an:
Assessment of the condition of the environment including, and as considered necessary by the Commissioner an assessment of the social, aesthetic, cultural and environmental conditions that affect or are affected by the biophysical and social environments plus an evaluation of the adequacy and effectiveness of the ACT government’s environmental management.
In addition, the Commissioner is required to:
Encourage decision making that facilitates ecologically sustainable development and encourage the Territory to adopt sound environmental practices and procedures as a basis for ecologically sustainable development.
To carry out these functions the Commissioner must produce a state of the environment report which not only facilitates ecologically sustainable development but also provides the basis for the Territory government to make measurable, transparent and rigorous triple bottom line decisions.1 State of the Environment reports are produced by most jurisdictions across Australia and have the potential to provide a valuable tool to understand many aspects of environmental health and condition.
However, a widespread criticism of these reports, including those for the ACT, is that they are constrained by a reliance on ad hoc studies that are often spatially and temporarily inconsistent. Furthermore, there are concerns relating to the limitations of the DPSIR (Drivers, Pressures, State, Impacts and Responses) model that is often used to frame the selection of relevant themes and indicators, especially since the selection of themes and indicators can change over time.2 For both of these reasons, SOE reports are often poorly suited to understanding the relative importance of different aspects of the environment and cannot provide coherent information to understand long term trends and trade-offs in the use of the environment.
1 As required by the ACT’s People, Place, Prosperity Sustainability Policy 2009
http://www.cmd.act.gov.au/ data/assets/pdf_file/0003/119730/people_place_prosperity.pdf accessed
18 August 2017
2 Better Policy through Natural Capital Accounting: Stocktaking and Ways Forward 7th WAVES Annual Partnership Meeting Edition
2017 International Bank for Reconstruction and Development/The World Bank
2
Ideally state of the environment reports and the underlying information set would guide environmental and broader policy development. For example, these reports could provide a resource that allows government policy and decision makers to:
Determine the optimal amount of money needed to restore and/or maintain environmental condition
Consider explicitly the trade-offs inherent in triple bottom line decision making; including the quantification of desired environmental outcomes
Determine, in spatial terms, where financial resources should be allocated
Monitor and evaluate progress towards specific policy objectives and broader environmental, social and economic outcomes.
With the aim of developing an SOE Report that can provide these benefits, the ACT Commissioner for the Environment has embarked on research, and this resulting proof of concept release, to apply accounting based measures of the environment to underpin its SOE reporting. This direction takes advantage of significant progress globally and within Australia on the implementation of environmental-economic accounting and the emerging use of accounting approaches for SOE reporting frameworks in other jurisdictions, including Victoria.
This paper presents the first iteration of a set of environmental-economic accounts for the ACT. It provides a brief description of the results and an analysis of how each account can support improved State of the Environment Reporting and environmental policy development. Broadly, the accounts have been produced with the aims of:
assessing how environmental-economic accounts could be used to meet the statutory obligations under the Commissioner for Sustainability and the Environment ACT 1993,
testing the practical issues related to producing environmental-economic accounts with available data,
determining what processes are required for repeated production and improvement of environmental-economic accounts,
providing a suite of accounts to demonstrate what they look like, what indicators might be provided and exploring how they might be used in broader government, business and community decision-making, and
assessing the advantages and disadvantages that environmental-economic accounts offer over previous approaches to state of the environment reporting.
This first iteration of the ACT environmental-economic accounts has been developed over the past 12 months through collaborations with a wide variety of experts. This current release of a “proof of concept” version is intended to broaden awareness of the potential of accounting approaches and to increase the discussion on the potential methods, applications and areas for development.
Introducing Environmental-Economic Accounting
It is well understood that the standard approaches to accounting for the economy via the System of National Accounts (SNA) does not adequately reveal the relationship between economic activity, as measured by Gross Domestic Product (GDP), nor the capacity of the environment to continue supporting these economic activities. To assess this capacity requires an understanding of the various uses of the environment by people and the resultant changes in underlying stocks of environmental assets or natural capital. In this context, the international statistical community
3
developed the System of Environmental-Economic Accounting (SEEA) (see Box 1) to support the standardised integration of environmental data into the measurement of the economy.
Environmental-economic accounting (EEA) has deep roots in traditional business and national accounting, and consideration of the environment in traditional accounting has grown steadily over the past 25 years. Within government in Australia, SEEA-based accounts have been undertaken for more than 20 years by the Australian Bureau of Statistics. In addition, similar types of accounting have been undertaken by the Bureau of Meteorology which produces annual water accounts, and the Commonwealth Department of Environment and Energy which produces greenhouse gas emissions as part of international reporting obligations. State governments, catchment management authorities, the Wentworth Group of Concerned Scientists and the Australian National University have also produced accounts using the concepts described in the SEEA framework.
Building on all of these developments, in November 2016, Australia's environment ministers "agreed to work together to develop a common national approach to environmental accounts".3 An inter-jurisdictional steering committee, represented at Executive level by all the States and the ACT, has begun work on a strategy to progress this work. In addition, an inter-jurisdictional technical working group is progressing the development of a national land account. The Commissioner’s Office was asked to join, and is represented on, both of these forums.
Examples of accounts produced in Australia are:
Australian Environmental-Economic Accounts.4
Experimental environmental-economic account for the Great Barrier Reef.5
Victorian Experimental-Ecosystem Accounts.6
Marine and Coastal Ecosystem Accounting: Port Phillip Bay.7
Experimental Ecosystem Accounts for the Central Highlands of Victoria.8
Valuing Victoria’s Parks.9
At the corporate level, there is also interest in extended accounting for natural capital. A substantive step forward was the release of the Natural Capital Protocol10 in July 2016. The Protocol aims to support better corporate decisions by providing a standardised process to identify, measure and value impacts and dependencies on environmental assets.
3 AGREED STATEMENT 25 November 2016 Meeting of Environment Ministers Record No. 001481842
4 ABS Publication No. 4655.0 - Australian Environmental-Economic Accounts, 2017
5 ABS Publication No. 4680.0 - Experimental Environmental-Economic Accounts for the Great Barrier Reef, 2017
6 Eigenraam, M., Chua, J. & Hasker, J. (2013). Environmental-Economic Accounting: Victorian Experimental Ecosystem Accounts, Version 1.0. Department of Sustainability and Environment, State of Victoria. 7
Marine and Coastal Ecosystem Accounting: Port Phillip Bay. Report to the Commissioner for Environmental Sustainability Mark Eigenraam, Freya McCormick and Zaida Contreras, 2016 8
Experimental Ecosystem Accounts for the Central Highlands of Victoria; Heather Keith, Michael Vardon, John Stein, Janet Stein and David Lindenmayer; Fenner School of Environment and Society ANU College of Medicine, Biology and Environment, 2016 9
Valuing Victoria’s Parks Accounting for ecosystems and valuing their benefits: Report of first phase findings. Report prepared by: Tony Varcoe, Helen Betts O’Shea, Zaida Contreras. Victorian Government. 2013 10
Natural Capital Protocol http://naturalcapitalcoalition.org/protocol/ accessed 24 August 2017

4
Through the production of accounts using the SEEA, the Office of the Commissioner for Sustainability and the Environment (OCSE) seeks to integrate measures of environmental assets, including biodiversity, environmental flows such as water and solid waste, and ecosystem services into an accounting framework for ACT Government decision makers. Making this link will be an important step towards understanding the sustainability of economic growth and social wellbeing in the ACT. It will also be of assistance to other jurisdictions or agencies who are also undertaking assessments of the sustainability of economic activity.
Overall, the work to develop EEA in the ACT builds directly on, and contributes to, a substantial body of work and a range of initiatives around the world and across sectors. This is not a stand-alone initiative but one based on substantive technical contributions and international standards.
Box 1: The System of Environmental-Economic Accounting (SEEA)
The SEEA Central Framework 201211 contains the internationally agreed standard concepts, definitions, classifications, accounting rules and tables for producing internationally comparable statistics on the environment and its relationship with the economy. The SEEA framework follows a similar accounting structure as the System of National Accounts (SNA) and uses concepts, definitions and classifications consistent with the SNA in order to facilitate the integration of environmental and economic statistics.
The SEEA Experimental Ecosystem Accounting12 (SEEA EEA) is an extension of the SEEA Central Framework, consolidating the international experience in this rapidly evolving area. The SEEA EEA provides the framework which melds human production and consumption with the benefits provided by ecosystems. These include the provision of timber, fish and water, the filtration of air and water, carbon sequestration and cultural and amenity services.
By enabling the integration of environmental information into standard economic measurement and accounting, SEEA aims to mainstream consideration of natural capital such that it occupies the same policy and decision-making domain as the economy.
At least 70 countries have, or are planning to produce, SEEA-based accounts. These countries include almost all OECD countries, including the United States, many countries in Latin and Central America, China and India, a number of countries in southern Africa (including South Africa, Botswana, Rwanda and Uganda), and some countries through South-East Asia (including Indonesia, Malaysia, Vietnam and the Philippines) and the Pacific (including Fiji and Samoa). Indeed, legislation has been passed for EU countries that must now produce SEEA-based accounts annually for six themes.
The World Bank Wealth Accounting and the Valuation of Ecosystem Services (WAVES)13 global partnership uses SEEA as the technical standard to drive forward the use of accounting for better management of the environment and economy. The Office of the Commissioner for Sustainability and the Environment has contributed to this work.14
11
United Nations, et. al. (2014) System of Environmental Economic Accounting 2012 Central Framework, New York. 12
United Nations, et. al. (2014) System of Environmental Economic Accounting 2012 Experimental Ecosystem Accounting, New York. 13
Wealth Accounting and Valuation of Ecosystems Services http://www.wavespartnership.org/en/natural-capital- accounting accessed 24 August 2017 14
Natural Capital Accounting for State of the Environment Reporting in the Australian Capital Territory (ACT) Paper prepared for the Forum on Natural Capital Accounting for Better Decision Making - The Hague, The Netherlands 22-23 November 2016. Smith, B., Auty, K., Burnett, P. & Vardon, M. https://www.wavespartnership.org/sites/waves/files/kc/Policy%20forum%20papers%20%281%29.pdf accessed 24 August 2017

5
SEEA is also considered the appropriate tool to implement the United Nations Sustainable Development Goal 15.9, and CBD Aichi Target 2, which requires countries, including Australia, to “by 2020 integrate ecosystem and biodiversity values into national and local planning, development processes, poverty reduction strategies and accounts.”15
Summary of accounts produced
In this initial proof of concept set of environmental-economic accounts, seven themes have been the focus of measurement as introduced below. These seven themes are considered the most significant in the monitoring of the ACT environment. In all cases, the SEEA framework has been used to provide the basis for definition and organisation of data. This supports comparison of results with other jurisdictions and countries producing accounts on these themes and, in due course, will support integration and analysis across themes and with economic data.
Land
The ACT land account produced for this proof of concept records changes to land use and the Territory Plan over time.
The SEEA Land account considers both land use and land cover. Land use is defined as (i) the activities undertaken and (ii) the institutional arrangements put in place for a given area for the purposes of economic production, or the maintenance and restoration of environmental functions. Land cover refers to the observed physical and biological cover of the ACT’s surfaces and includes natural vegetation and abiotic (non-living).16
Environmental Condition
The Environmental Condition Accounts present a summary of experimental information by providing indicators and indices of condition for land, water and atmosphere in the ACT. The land and water condition accounts are based on the SEEA-EEA. The account for atmospheric condition is put forward in this proof of concept as a possible pilot adjunct to the SEEA-EEA.
Biodiversity
The CBD defines biodiversity as “the variability among living organisms from all sources including, inter alia terrestrial, marine and other aquatic ecosystems and the ecological complexes of which they are part, this includes diversity within species, between species and ecosystems”.17 There are number of indicators designed to measure biodiversity. This proof of concept presents one: trend in status of threatened species.
Water
The Water Accounts describe the extraction of water from dams, the physical supply and use of water within the ACT economy and exchanges of water with NSW. The water asset account shows the stocks of water resources and the inflows from rainfall and upstream. A water quality account is presented as part of the Environmental Condition Accounts.
Air emissions
The Air Emission Account records the physical flow of gaseous and particulate materials from the ACT’s economic system (as a result of production or consumption processes), to
15 WAVES Policy Briefing May 2016 Natural capital accounting and the Sustainable Development Goals
16 United Nations et. al., (2014) System of Environmental-Economic Accounting 2012 Central Framework pp174 -178
17 United Nations et. al., (2014) System of Environmental-Economic Accounting 2012 - Experimental Ecosystem Accounting.
6
the atmosphere which is part of the environmental system. Air emissions comprise emissions of greenhouse gases as well as emission of air pollutants, primarily those included in the National Environment Protection (Ambient Air Quality) Measure (AAQ NEPM).
Solid waste
Solid waste is defined as “discarded materials no longer required by the owner or user.”18
This account records the generation of solid waste from production and consumption processes within the ACT economy. The account records flows of solid waste by type of substance and in relation to both the origin and destination of the waste flows.
Environmental Expenditure
The Environmental Expenditure account is based on the Classification of Environmental Activities (CEA), which was developed as part of the SEEA.19 It includes CEA natural resource management activities only. The account also includes measures of the financial contribution of environmental volunteering to the ACT economy.
Data management and account compilation
The accounts produced for this release integrate data from different sources into a consolidated information set. The following data management principles applied:
Account development was guided by the ABS Data Quality Framework.20
Where possible the accounts were compiled on financial year time frames. Where source data was only available per calendar year appropriate conversions were made.
The time series for each account was a function of data availability.
The individual data sets collected were not produced for the express purpose of populating SEEA accounts. These data sets therefore had to be analysed and standardised to produce accounts which can be maintained consistently over-time.
Every attempt was made to collect and use data that was produced or at least collected and used by ACT Government. Where this was not possible, nationally available data was used. The ABS Guideline for the Quality Management of Statistical Outputs Produced from Administrative Data21 was used in the interpretation and analysis of this data.
The accounts and provisional analysis produced for this proof of concept have been developed in collaboration with the Australian National University and the Australian Bureau of Statistics. The IDEEA Group (Institute for Development of Environmental-Economic Accounting) provided expert review.
18 United Nations et. al., (2014) System of Environmental-Economic Accounting 2012 Central Framework
19 ABS publication 4603.0.55.001 - Discussion paper: Towards an Environmental Expenditure Account, Australia, August 2014
20 1520.0 - ABS Data Quality Framework, May 2009
21 1522.0 - Quality Management of Statistical Outputs Produced From Administrative Data, March 2011

7
Supplementary Information
The data, modelling and explanatory notes underpinning the findings in this proof of concept can be found on the Commissioner for Sustainability and the Environment’s website: http://www.environmentcommissioner.act.gov.au/
Future Work
Several other accounts are being developed but are not yet ready for release. These include accounts for energy, additional components of ecosystem condition accounts and some ecosystem services as well as monetary accounts for land and water. OCSE is also in the process of scoping work to account more extensively for ecosystems, ecosystem services and biodiversity. These various accounts and accompanying descriptions and analysis will be explored and results released in the next 6 to 12 months.
Results and Conclusion
This Proof of Concept has the following aims:
1. Assessing how environmental-economic accounts could be used to meet the statutory obligations under the Commissioner for Sustainability and the Environment ACT 1993,
2. Testing the practical issues related to producing environmental-economic accounts with available data,
3. Determining what processes are required for repeated production and improvement of environmental-economic accounts,
4. Providing a suite of accounts to demonstrate what these environmental-economic accounts look like, what indicators might be provided, and exploring how they might be used in broader government, business, and community decision-making, and
5. Assessing the advantages and disadvantages that environmental-economic accounts offer over previous approaches to state of the environment reporting.
These aims were met: some with more clarity than others. Individual sections of the report give specific examples of this.
In particular, the Proof of Concept met Aim 1, showing that environmental-economic accounting can meet the statutory obligations of the Commissioner.
Aim 2 has been clearly met. Several different types of accounts have been produced and some general issues have emerged. In particular, obtaining access to primary data has been critical. Access to data has been secured but this has sometimes been a time-consuming process. Once access had been gained, additional time was needed to understand the data obtained, and, for example, the concepts and classifications used and how they related to the SEEA. Again this took time and revealed differences between the primary data source and the SEEA, and some gaps in data coverage emerged. Overtime these issues can be resolved through regular communication between account producers and the primary data holders and will lead to development of protocols for data exchange.
This learning feeds into Aim 3 and should expedite account production and improve data quality. Such improved processes could also lead to a more integrated information system, covering primary data, accounts and analysis. A task over the next 12 months will be to clearly articulate a process for the regular production of accounts in the ACT, including the resources likely to be needed for annual production.

8
Aim 4 has been met. The suite of accounts produced, together with the indicators and interpretive text presented, have clearly indicated where accounts could be used in broader government decision making. This report provides a basis for ongoing consultation with ACT Government as well as business and community groups. While the indicators and graphics produced so far have been useful, additional work on the presentation of complex information is required.
Aim 5 has been partially fulfilled. While the Proof of Concept provides an indication of the advantages and disadvantages of an accounting approach for state of the environment reporting, this requires further work. Previous state of the environment reports contained significant analysis and expert opinion. This information should not be overlooked in the development of environmental-economic accounts.
A preliminary assessment indicates that the accounting approach has a key advantage in integrating economic and environmental information. In addition, if the accounts were produced annually, more frequent state of the environment reporting could lead to more opportunities for SEEA and SEEA-EEA accounts to be used in the process of government, business or community decision making.
This Proof of Concept also revealed potential challenges in applying accounting formats to accommodate certain information included in previous state of the environment reporting. This issue will need to be addressed to ensure that state of the environment reporting remains comprehensive and complete. The production of this Proof of Concept has been a learning experience for all involved. This work has required cooperation between many people and agencies. The experiences gained, and the collaborations formed as a result of this process will be used to inform the development of further environmental-economic accounting work for state of the environment reporting in the ACT.
9
2. Land account
Outline
Land is a unique environmental asset that delineates the space in which economic activities and environmental processes take place. It is within areas of land that economic activity is undertaken and ecosystem assets are located. For instance, in a farming system land is used for the production of food and fibre, however the farm may also contain important ecosystems such as wetlands and rivers. Accounting for changes in land use and cover is fundamental to environmental-economic accounting.
Having an understanding of changes in land ownership and how it is being used for economic production is key to informing policy and management issues around the impacts of urbanisation, the sustainability of agriculture and forestry, the use of inland freshwater resources, and biodiversity conservation. Land accounts provide an understanding of the economic drivers and land use change and can be linked to changes in biodiversity and species conservation policy. There are numerous approaches to the development of land accounts including ownership, value, use, cover etc. This Proof of Concept presents land accounts based on:
Land cover
Land use
These accounts describe the physical area of land cover and land use (i.e. hectares of land).
The accounts were developed from publicly available information from Geoscience Australia22 (e.g. land cover) and the ACT Territory Government23 (e.g. land use).
ACT State of the Environment Reporting and the Land Account
A SEEA land account has the potential to contribute significantly to state of the environment reporting in the ACT. Under the land “theme” previous reports presented information on the area of land used for rural, residential, commercial, and conservation purposes. In effect, land was reported on in the context of changes to the ACT’s Territory Plan – the key statutory planning document in the ACT, which provides the policy framework for the administration of planning and the management of land use change and development.
The Land chapter in the 2015 State of the Environment Report also included indicators of changes to soil condition, the number of contaminated sites and compliance with National Environment Protection (Contaminated sites) Measure. In relation to soil condition the report stated that “there has been no systematic assessment of soil condition in the ACT” and therefore this indicator could not be addressed. The report noted, however, that soil landscape mapping and the development of a hydrogeological framework had commenced. Further work is required to integrate the outcomes of this work into the current land accounts.
Land accounts, included as part of an ACT state of the environment report, would support the development of experimental ecosystem accounts which address:
Land cover in relation to ecological functions, and
22 Lymburner, L., et al. 2017. Dynamic land cover dataset version 2.1, Geoscience Australia, Canberra, Australia.
http://www.ga.gov.au/metadata-gateway/metadata/record/83868/. 23
ACT Territory Government, Land use zones, ACTMapI, http://actmapi- actgov.opendata.arcgis.com/datasets?q=Development%20and%20Planning

10
Land use in relation to economic functions.
Potential Uses of the Land Account
Land accounts are a fundamental building block of SEEA and SEEA-EEA accounts. One of the key roles of land accounts for the ACT is to map the physical location of economic activities and environmental processes. These accounts provide the key information needed for natural resource management. Land accounts show where the urban or conservation areas are located, and how much land area they cover. Importantly, the accounts can show how this cover is changing through time and what the impact is of this change on the economy and ecosystems. Through land accounts it is also possible to explore issues such as ownership and wealth, urbanization, and intensity development.
Scope of these accounts
Land cover, defined as the physical material at the surface of the earth has been quantified using the Dynamic Land Cover Dataset (DLDC) from 2013 to 2015. Land use is defined as different types of activities that are undertaken on the land. Land use is classified using the ACT Territory Plan Land Use Zoning dataset using data sets from 2013-15 to 2015-16.
Findings
Land cover
Land cover over the ACT is dominated by tree cover, rainfed pasture and urban areas. Tree based land cover classes (Trees – Closed, Trees - Open, Trees - Scattered and Trees – Sparse) made up 71% (167 221 ha) of the land area in 2015 which is consistent with the extensive national parks and conservation areas across the Territory. Tree cover has been stable since 2012 but is down on the peak of 76% in 2009. Rainfed pasture made up 20% (47 675 ha) of the land cover in 2015, an increase from 16% in 2003.
Urban areas made up 7% of the total area in 2015 and according to the dataset this has not changed since 2003. This is not an accurate representation of the changes that have occurred in the ACT over this period. The absence of change of urban areas within the DLCD highlights potential limitations for this application in land cover accounting. Both the broad national scale of the dataset and a reliance on temporal greenness patterns to detect land use change do not lend themselves to accurate urban mapping in a small jurisdiction such as the ACT. Nonetheless, mapping and understanding urban change is an important part of modern natural resource management and urban planning, and the availability of a more reliable dataset would be a valuable resource for environmental accounts, amongst other applications.

11
Figure 1 Dynamic land cover data in the ACT 2016

12
Land use
Land use zone data for the ACT shows that 84% (197 949 ha) of the land area is allocated to non-urban zones (Figure 2). These include mountains and bushlands (137 762 ha), rural areas (21 953 ha), hills, ridges and buffer areas (15 501 ha), river corridors (11 920 ha) and broadacre agriculture (10 812 ha). Residential zones made up 6% in 2016, while the remaining 10% of land was allocated to uses including designated parks and recreation, industrial, commercial, and transport and service zones.
Over the course of the time series available 2013-14 to 20115-16, there is very little change in the areas of land across all zoning classifications. The largest increase was seen in hills, ridges and buffers which increased by 676 ha (5% change) while the largest area decrease was in suburban zones which decreased by 478 ha (4% change). The only other substantial area change was in broadacre which declined by 123 ha (1% change). The largest percentage changes were seen in high density residential (11% decrease, 22 ha), medium density residential (9% decrease, 35 ha), general industry (7% decrease, 35 ha), services zones (6% decrease, 11 ha) and business zones (5% increase,
12 ha).
Table 1 Changes in land use zoning in the ACT 2013-14 to 2015-16
Land area (ha)
Land use zones 2013-14 2015-16 % change 2015 Share
Commercial
Business zone 239 251 5% 0.1%
Core zone 226 225 0% 0.1%
Leisure and accommodation 298 289 -3% 0.1%
Local centre 79 78 -1% 0.0%
Mixed use 202 202 0% 0.1% Services zone 176 165 -6% 0.1%
Industrial General industry 531 497 -6% 0.2% Industrial mixed use 364 378 4% 0.2%
Non-urban
Broadacre 10,935 10,812 -1% 4.6%
Hills, ridges and buffer areas 14,825 15,501 5% 6.6%
Mountains and bushlands 137,762 137,762 0% 58.5%
River corridor 11,920 11,920 0% 5.1% Rural 21,953 21,953 0% 9.3%
Parks and recreation Restricted access recreation zone 640 644 1% 0.3% Urban open space 4,000 3,992 0% 1.7%
Residential
High density residential 199 222 12% 0.1%
Medium density residential 395 360 -9% 0.2%
Suburban 12,760 12,282 -4% 5.2%
Suburban core 1,725 1,716 -1% 0.7% Urban residential 551 556 1% 0.2%
Transport and services
Services 181 180 -1% 0.1% Transport 2,914 2,902 0% 1.2%
Community facility Community facilities 1,404 1,393 -1% 0.6%
Designated Designated 11,373 11,373 0% 4.8%

13
Figure 2 Land use zoning in the ACT 2015-16
Land use and land cover intersection
The land use land cover matrix from the most common year available for both datasets, demonstrates the complementary nature of the land cover and land use and also the limitations of the datasets. There are numerous classes where the two datasets correspond, for example 101 875 ha (85%) of the Trees – Open land cover classification are zoned to mountains and bushlands land use. Similarly, 70% of the rainfed pasture land cover classification is divided between appropriate land use zones: broadacre, rural, hills, ridges and buffer areas and mountains and bushlands.

14
2. Environmental condition accounts
Outline
The environmental condition accounts are outlined in the SEEA-Experimental Ecosystem Accounting. The aim of the condition accounts is to describe how the condition of environmental and ecosystem assets are changing over time. The integrated nature of the environmental-economic accounts allows for observed changes in condition to be linked to social and economic activities for policy and decision-making purposes.
ACT State of the Environment Reporting and the Environmental Condition Accounts
The previous ACT State of the Environment Report includes aspects of environmental condition in separate thematic chapters. Similar information on water and air quality was included and, for land, there was information on salinity, the number of contaminated sites and compliance with National Environment Protection Measure (NEPM). The metrics and accounts for land condition presented are new and the previously presented metrics have not yet been worked into an accounting format.
Information of concentrations of carbon dioxide in the atmosphere was not presented in the previous SoE Report. The target of staying within 450 PPM was mentioned but the notion of the atmosphere as an asset in declining condition was not.
The compilation of these environment condition accounts was based on available data. Local, national and international sources were used. A general issue was that the reference periods for the data was calendar years, whereas for other accounts financial years were used. Working more closely with data providers should, over time, enable the reference periods to be matched and for data to be aggregated into more consistent spatial configurations.
The accounts presented are not comprehensive in terms of coverage of condition. In particular, the condition of biodiversity is not fully considered. The “bug data” in the water quality accounts and the separate species accounts means that it is considered within the suit of accounts presented here, but additional information on the distribution and abundance of species could provide additional condition metrics for the accounts.
For the land condition accounts, the deficiencies noted in the data sources and methods noted in the land cover and land use accounts also apply here. The key advantage of using the metric presented is that they can be produced annually from existing data sources. In addition, the measures presented in the land condition accounts are mostly relevant for non-urban areas. Urban areas are likely to require additional measures and these are likely to be related more to human needs, like air quality and its effect on human health, rather than natural processes (e.g. water inflows, carbon uptake).
The water condition accounts are of significant policy relevance and can inform several key target outcomes and strategies within the ACT Water Strategy 2014-44.24 These include policy goals of providing healthy catchments and waterbodies through integrated catchment management and protecting and restoring aquatic ecosystems in urban and non-urban areas.
For the atmosphere, the number of times air quality exceeds standards set, based on human health, is a crude measure of condition and probably insensitive to change. For example, by this measure there has been no change in carbon monoxide or nitrogen dioxide levels in the ACT between 2006 and 2015. This may be the case, but access to the primary data may reveal some variation in air
24 ACT Water Strategy 2014-44, https://www.environment.act.gov.au/water/water-strategies-and- plans/act_water_strategy

15
quality over time. The spatial aspect of air quality may also be better accommodated (poor air quality in a heavily populated area is more of an issue than poor air quality in an area with few people).
Climate change is an issue of global importance with local economic and environmental implications. Adding the sources of emissions and reductions to the carbon dioxide asset account, which currently just has an opening and closing balance, would enhance the usefulness of the condition accounts and link them directly to the greenhouse gas emissions accounts.
Potential Uses of the Environmental Condition Accounts
The environmental condition accounts can be used to help to, identify problems, implement existing policies and review the effectiveness of existing policies and management. For example, the Environmental Protection Expenditure Accounts can be compared with the Environmental Condition Accounts to test the efficiency of expenditures and, with additional analysis, the amount of resources needed to achieve target levels.
Similarly, spatially enabled condition accounts with smaller time-steps can be used to better analyse the options or consequences of intervention in particular places and times. For example, PM2.5 levels, winter wood smoke levels, vehicle exhausts and the impact of light rail.
A particular benefit of the current compilation of accounts was understanding the data available and how any gaps or deficiencies could be overcome.
Scope of this account
Three environmental domains are covered by the condition accounts: terrestrial (land), water and the atmosphere. Quality metrics are used to assess the condition of water and atmosphere. For the atmosphere, the concentration of carbon dioxide is also presented as a proxy measure of atmospheric condition. For terrestrial areas, a range of measures are used, some related to vegetation and some to hydrological function. These are all presented as measures of land condition although a case could be made for presenting the hydrological measures with the water accounts.
Findings
Terrestrial (Land)
The land condition was determined using the experimental Environmental Condition Score (ECS). This was calculated by ranking indicator values for each year among those for the dataset covering 2000-2016. The ECS was calculated as the average of six indicators: tree cover, soil exposure, leaf area, river inflow, inundation and carbon uptake. These indicators were developed using satellite remote sensing and landscape modelling and provide systematic and comprehensive national scale assessments of changes in land surface materials.25 These biophysical measures are closely related to water availability and therefore correlated and strongly affected by changes in rainfall. However, the impact of other natural events (e.g. bushfire) and human activity (e.g. development) should also be apparent in the results.
Figure 3. shows the changing ECS over the period 2000 to 2016. The effects of the drought from 2001 to 2010 and the Canberra bushfires in 2003 can be seen in changes in the individual indicators and in the combined indicator score. The environmental indicators, which had been declining in 2001 and 2002 were impacted further following the bushfire in 2003. These indicators remain consistently low for the duration of the drought before several years of above average rain from
25
Van Dijk, Albert. I.J.M., Summers, David (2016) Australia’s Environment Explorer, The Australian National University (http://www.ausenv.online) DOI: 10.4225/41/5934faf27397b

16
2010 to 2012 saw them return to higher levels. Following 2012, rainfall returned to near average levels and the indicators remained largely stable.
The ECS mirrors these changing fortunes as it declines from a high of 7.5 in 2000, before the drought or bushfire, to 1.6 in 2007 when the full impact of the drought was felt. The indicator then increases steadily until 2012 returned to 7.5. Following years of above average rainfall the indicator declined slightly to 5.8 in 2013 before responding again to 6.9 in 2015 and 7.1 in 2016.
Figure 3 Environmental Condition Score for the ACT
Water
The water condition account quantifies the health and condition of waterways (creeks, rivers, lakes and wetlands) across the ACT. The accounts record changes in a range of water condition indicators, including chemical composition, macro-invertebrate diversity and riparian condition of natural and managed waterways.
The water condition account is based on the data from the Catchment Health Indicator Program (CHIP) developed by the Upper Murrumbidgee Waterwatch Program.26
Reporting locations for the CHIP are lengths of waterways (including rivers, creeks, ponds, and lakes) that are called reaches. Reaches are defined by hydrological, environmental, land use and social attributes that contribute to ecosystem health. Reaches are regularly added to the CHIP analysis and reporting. The accounts present information at the reach scale and aggregates to larger water bodies to provide summary information.
The CHIP scores and the individual indicators are scored from one to five. A score of one signifies an ‘excellent’ condition system, two a ‘good’ condition, three a ‘fair’ condition, four a ‘poor’ condition and 5 is ‘degraded’.
The water condition account presented here is restricted to the geographic boundaries of the ACT, with the exception of water reaches that cross the ACT boundary.
26 Upper Murrumbidgee Waterwatch Program, http://www.act.waterwatch.org.au/

17
Number of reaches
The base unit of reporting for CHIP scores is the ‘reach’. In 2015-16 CHIP reported on 53 individual reaches within the ACT divided across three large catchments: Ginninderra Catchment, Molonglo Catchment and the ACT Southern Catchment (Table 3).
Table 2 Number of Catchment Health Indicator Program reaches available in each year across
the different ACT catchments
2013-14 2014-15 2015-16
Ginninderra 8 12 15
Molonglo 6 9 10
Southern 18 27 28
Total 32 48 53
Condition Scores
In 2015-16 no reaches in the three catchments were in a degraded condition (Figure 4a). The Southern Catchment was the only reach found to have a reach in excellent condition with one in 2015-16. The Southern Catchment had the highest proportion (46%, 13) of reaches in a good condition and the same number of reaches in poor condition (46%, 13). All reaches in Ginninderra and Molonglo were found to be poor, fair or good condition. The Molonglo Catchment had two (20%) reaches in good condition, seven (70%) in fair condition and one (10%) in a poor condition. The Ginninderra Catchment had one (7%) reach in good condition, 11 (79%) reaches in fair condition and 2 (14%) reaches in poor condition.
There were declines in the CHIP Score of some reaches in all catchments. However, to some extent, this is the result of the changing methodology for the Water Bug Score. In 2015-16 the Water Bug Score was adjusted to include three key sensitive water bug taxa: Mayflies, Stoneflies and Caddisflies. The addition of this assessment resulted in the inclusion of a ‘degraded’ classification for the Water Bug Score not included in previous reports. This can be seen in Figure 4d, where degraded Water Bug scores do not appear until 2016, and is not necessarily the result of declining condition but rather the expanded assessment process. Further evidence for this can be seen in the RARC score (Figure 4a) and the Water Quality Score (Figure 4b), which saw mostly stable or improved results from 2014-15 to 2015-16.

18
Figure 4 The number of reaches and the scores for the different water condition metrics ( CHIP
(a), RARC (b), Water Quality (c), and Water Bug (d)) within the ACT from 2013-14 to 2015-16
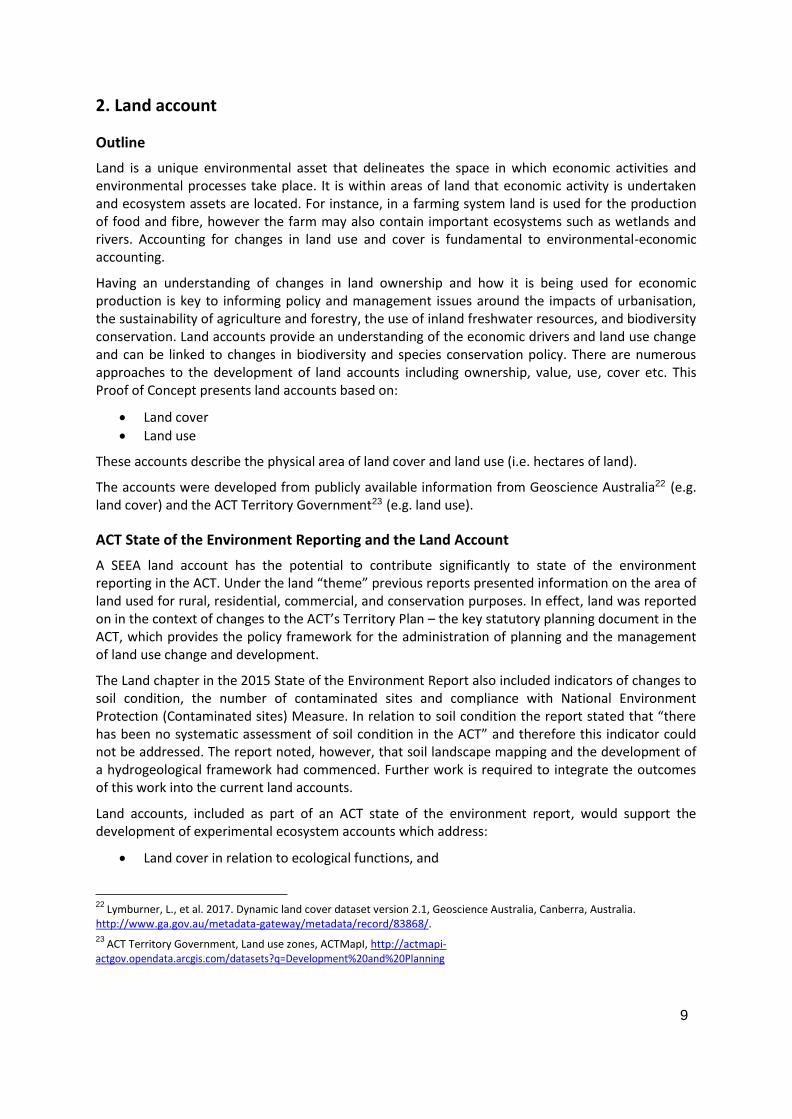
The geographic distribution of the reaches and their respective CHIP scores in 2015-16 can be seen in Figure 5. This geographical distribution also highlights the role that land cover and land use play in the health of waterways. The Southern Catchment, with generally higher CHIP scores, is dominated by wooded areas and national parks, particularly in its southern areas. Where land use in the catchment is dominated by urban development, the CHIP scores are lower. Similarly, the Molonglo Catchment, which contains the majority of urban areas in the ACT, has lower CHIP scores.
19
Figure 5 Map showing distribution of Waterwatch reaches across the ACT
Aggregating water condition
The water condition accounts also provide the aggregate CHIP scores that summarise individual reach scores into larger water bodies or rivers.
The Murrumbidgee and Cotter Rivers providing drinking water and important habitat. These rivers both received ‘good’ aggregate CHIP scores in 2015-16, however this was lower than in 2014 when they both received ‘excellent’ scores (Figure 6). The Molonglo River is the major source of water for Lake Burley Griffin. This river had a stable aggregate CHIP score over the last three years, moving just either side of the threshold between ‘Excellent’ condition and ‘Good’ condition. In 2015-16 it is

20
exactly on this threshold returning a score of ‘good’. The lake itself is not scored but is managed by the National Capital Authority and is not within the scope of ACT State of the Environment reporting.
Figure 6 Catchment Health Indicator Program Scores aggregated for select rivers across the
ACT
There are a number of lakes throughout Canberra and in many instances, they form the centrepiece of urban centres. Outside of the city of Canberra, two important lakes are Lake Tuggeranong and Lake Ginninderra. Each of these act as centrepieces for their relevant suburbs, north and south of the city, and provide considerable amenity and recreational value as well as habitat for birds and wildlife. Both lakes returned an aggregate CHIP score of ‘good’ in 2015-16 (Figure 7). However, Lake Tuggeranong has seen a decline in aggregate CHIP score since 2013-14 when it returned a score of ‘excellent’. There is no data available for 2013-14 for Lake Ginninderra. Not quite as large as other urban centre lakes is the Yerrabi Pond in the north Canberra suburb of Gungahlin. This area has been subject to substantial development over the last 5 years and Yerrabi Pond received a CHIP score of ‘Poor’ in 2015-16, from a score of ‘Fair’ in 2014-13.
Figure 7 Catchment Health Indicator Program Scores aggregated for select lakes across the
ACT

21
We can also aggregate the CHIP scores to larger geographic areas to get scores for individual catchments and the whole ACT (Figure 8). In 2015-16 the Ginninderra and Molonglo catchments received an aggregate CHIP score of ‘fair’, while the Southern Catchment received a score of ‘good’. The Molonglo catchment has seen an increasing aggregate CHIP score over the last three years and received a score of ‘fair’ in 2015-16, up from a score of ‘good’ in 2013-14. The Molonglo catchment has moved between ‘fair’ and ‘good’ over the data record but in 2015-16 it received an aggregate CHIP score of ‘fair’. The Southern Catchment has been relatively stable over the last three years, receiving aggregated CHIP scores of ‘good’ for the last three years.
The aggregate CHIP scores for the ACT show the water condition has declined slightly (since 5 is the worst and 1 is the best) having just crossed the threshold from ‘good’ in 2014-15 to ‘fair’ in 2015-16.
Figure 8 Catchment Health Indicator Program Scores aggregated for major catchments
Atmosphere
The condition of the atmosphere, as measured by metrics associated with air quality standards related to human health, has improved between 2006 and 2015 (Figure 9). The exceedance of standards for PM 2.5 reached a low in 2009 and 2010 with just two exceedances but in recent years (2013 to 2015) this has risen to 4-6 exceedances, primarily due to dust storms and smoke from controlled burns. Wood smoke from domestic fires and vehicle emissions contribute to PM2.5 levels and hence much of the management of this aspect of atmospheric condition is possible locally.

22
Figure 9 Number of exceedances of air quality standards in the ACT
This is not the case for the concentration of carbon dioxide, which has increased over a long period of time (Figure 10). Increases in levels of carbon dioxide represent a decline in the condition of the atmosphere. The condition of the atmosphere is presented as an index, with 1990 as the base year (Figure 11). In the index, the IPCC scenario level of 450 PPM would be 73.27 The increasing concentration of carbon dioxide in the atmosphere is due to human causes, and the degradation of the atmospheric assets is a global management challenge addressed via UNFCCC.
Figure 10 Atmospheric carbon dioxide – parts per million (PPM)
23
27 See Climate Change 2007: Working Group II: Impacts, Adaptation and Vulnerability:
https://www.ipcc.ch/publications_and_data/ar4/wg2/en/ch19s19-4-2-2.html

24
Figure 11 Index of CO2 atmospheric condition

25
3. Biodiversity accounts
Outline
Biodiversity (the diversity of ecosystems, species and genes) plays an essential role in supporting human well-being through maintaining functioning ecosystems that in turn deliver ecosystem services such as food, the regulation of our climate and aesthetic enjoyment.
The SEEA-EEA provides a framework to measure and link the flow of ecosystem services supported by biodiversity and other ecosystem characteristics (e.g. soil type, altitude) with the economy and other human activities. It also allows for the analysis and integration of data on ecosystem services with other economic and social data.
ACT State of the Environment Reporting and Biodiversity Accounts
Biodiversity reporting in the 2015 State of the Environment Report was assessed using the following indicators:
Number and condition of threatened flora and fauna species and ecological communities,
Number and condition of threatened ecological communities,
Connectivity of native vegetation,
Number and extent of protected areas,
Rare and insufficiently known species,
Pest species,
Altered fire regimes, and
Environmental offsets.
Reporting on biodiversity involved collecting current and appropriate ACT specific data and arranging it to accord with these indicators. Aside from significant spatial and temporal data gaps this approach was unable to provide a coherent or integrated assessment of the impacts of pressures, such as altered fire regimes, development pressure or pest and diseases on biodiversity. In addition, biodiversity reporting in previous state of the environment reports has not been used to assess the value of ecosystems services or to establish links or assess trade-offs between other environmental assets such as land or water.
Potential Uses of Biodiversity Accounts
Biodiversity accounts can provide an integrated presentation of data that is applicable to different landscapes and ecosystem types. As part of ecosystem accounting, biodiversity accounts can provide information to enable the assessment of the:
Impact of human activity on ecosystem asset extent and condition, and
Influence of asset condition on the production of ecosystem services.
Target 2 under the Convention on Biological Diversity28 is to place biodiversity into mainstream decision-making frameworks of policy-makers. The Target states that biodiversity values should be
28 Convention on Biological Diversity https://www.cbd.int/sp/targets/ accessed 18 September 2017

26
included as part of national accounting. By integrating biodiversity information into the ACT government’s decision-making frameworks, biodiversity can be considered in economic policy, resource allocation and planning tools.
Scope of this account
The SEEA-EEA notes that biodiversity measurement is a specialist field. Different methods for assessing biodiversity provide varying levels of accuracy and precision, and that because of complexities of biodiversity measurement, there is a focus on selected indicators of biodiversity rather than accounting for all aspects of biodiversity.
Biodiversity indicators measure part of the system or capture a range of aspects within a single measure. The SEEA-EEA submits four indicators concerning the state of biodiversity:
i. Trends in extent of selected ecosystems
ii. Trend in abundance and distribution of selected species
iii. Trend in status of threatened species
iv. Change in genetic diversity.
The land account addresses trends in the extent of ecosystems, while the biodiversity account developed for this Proof of Concept measures trends in the conservation status of threatened species and ecological communities listed under the Nature Conservation Act 2014.29
Species are periodically added and removed from these lists. They also move between categories on the lists as the species become more or less threatened. Legislative instruments are not necessarily updated annually, although there can be more than one update per year. For this report one account for each legislative instrument is provided.
These are seven classes of conservation status: extinct, extinct in the wild, critically endangered, endangered, vulnerable, conservation dependent, and species that are provisional.30
Findings
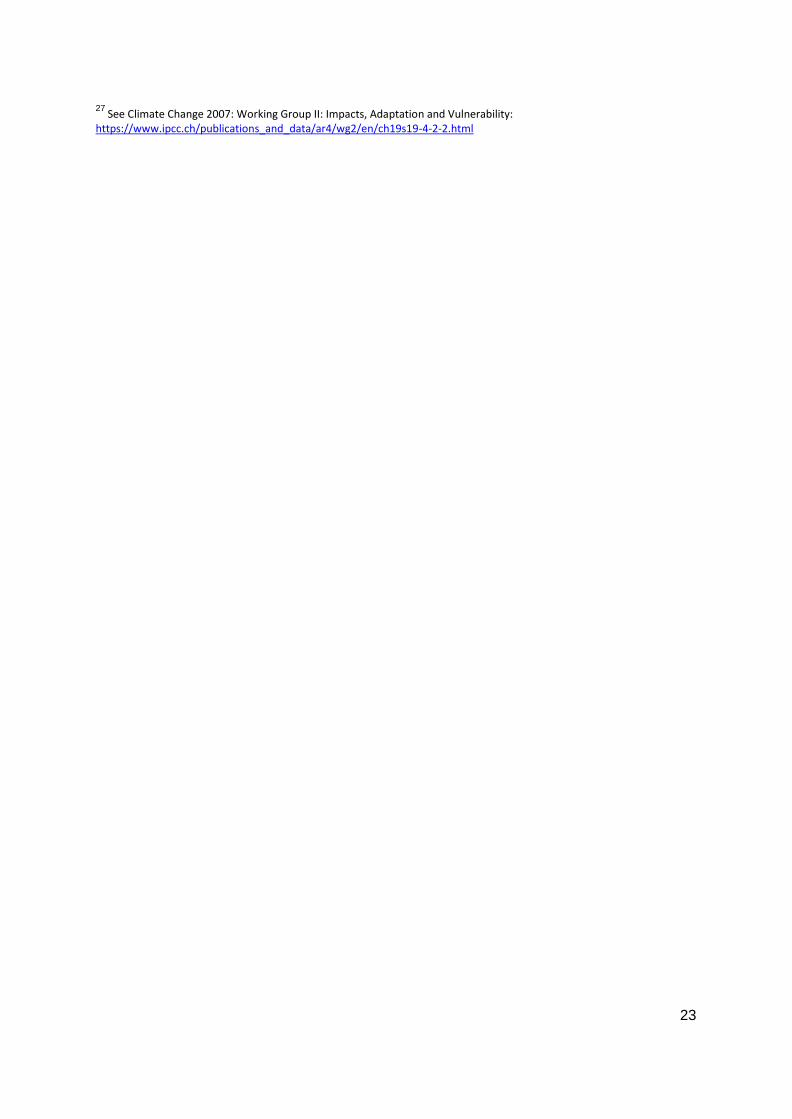
Numbers of endangered and vulnerable species have been increasing since statutory listing in the ACT began in 2001 (Figure 12).
29
This includes threatened species and ecological communities listed under Nature Conservation Act 1980 30
Section 64 Nature Conservation Act 2014 provides the eligibility criteria for a native species to be included in the provisional category.
27
Figure 12: Number of species in different listed categories according to ACT legislation
Endangered plants (grey bar) make up the majority of listed endangered species and their numbers have been increasing over time (Figure 12). Fish (purple bar) comprise the second largest group of endangered species although no new fish species have been added to the engendered list since 2001. Similarly, no reptiles, insects, amphibians, mammals or marsupials have been deemed as endangered since 2001.
Birds (orange bar) make up the majority of listed vulnerable species and their numbers have been increasing over time (Figure 13). Reptiles comprise the second largest group of vulnerable species, although no new reptile species have been added to the vulnerable list since 2001. Similarly, no new species of fish, crustacean, insect, or marsupial have been deemed vulnerable since 2001.
Figure 13: The number of vulnerable species by class

28
4. Water accounts
Outline
The water accounts are outlined in the SEEA Central Framework and SEEA Water. Their purpose is to make explicit the links between the use of water and economic activity. There are also important connections that can be made to land and ecosystem accounts.
ACT State of the Environment Reporting and the Water Accounts
Chapter 6 of the previous ACT State of the Environment Report examined water issues. The focus was on surface water quality, which is addressed in the environmental condition accounts in this report, and the impacts of land-use change, which are addressed via the land accounts. The water accounts developed as part of this report present a different focus on the amount of water available and the way the water is used. This focus enables a better assessment of the drivers of change and the analysis of past policy (e.g. assessing the impact of increased use of rainwater as a substitute for distributed water), and the effects of different management options (e.g. the impact of increasing water prices).
Potential Uses of the Water Accounts
The general uses of the water accounts have been reviewed recently.31 This includes examining the likely impacts of changes in water availability due to either natural factors, like drought, or economic factors like increased demand. For the ACT this has implications for price setting, planning for increases in ACT population and economic activity.
At present the growth in the use of distributed water is considerably outpacing the growth in population and GSP. While water use is linked to rainfall, with more water used in wet times than dry, through, for example, the use of water restrictions and education campaigns; in the long term distributed water use will need to be decoupled from population growth and economic activity. The increase in use of rainwater and reused water provides important substitutes for disturbed water, while the mandatory installation of water saving devices such as dual flush toilets and reduced flow shower head has reduced demand. These are important steps but it is likely that there will be increased reliance on water from NSW.
Scope of this account
Two types of water accounts were produced: the physical supply and use tables for water, and the water asset account.
The physical supply and use tables show the amount of water extracted from the environment, how this flows through the economy, and the volumes that are returned to the environment (e.g. the discharges of treated sewerage water).
The water asset account, shows the amount of water occurring in the environment, including artificial reservoirs, inflows from rainfall and upstream sources (e.g. NSW) and the amount extracted from the environment for use.
A water quality account is included in the environmental condition accounts.
31
Nagy et al. 2017.

29
Findings
Water supply and use
The use of water distributed for consumption has increased from 34,026 ML in 2010-11 to 42,141 ML in 2014-15 (Figure 14).
Households were the main users of distributed water, accounting for 70% in 2014-15. The growth in distributed water use has increased faster than the ACT population and economic activity (i.e. Gross State Product (GSP) Figure 15) between 2010-11 and 2014-15. The use of rainwater and reused (or recycled) water has also increased over the same time. For rainwater use, this has increased from 1,000 ML to 1,100 ML and for reused water there has been a substantial increase from 422 ML to 3,321 ML.
Figure 14: Use of Distributed water in the ACT, 2010-11 to 2014-15 (ML)
Figure 15: Index of ACT population, GSP and use of distributed water

30
Water assets
The total amount of water held in ACT reservoirs (Bendora, Corin and Cotter) has increased between 2009-10 and 2013-14, from 56,055 ML at 30 June 2010 to 98,364 ML at 30 June 2014 (Figure 16).
The ACT’s capacity to store water was greatly increased in 2013-14 with the completion of the Cotter Dam expansion.32
Figure 16: Closing stocks of water held in ACT reservoirs, 2009-10 to 2013-14
The ACT water supply system includes the Googong Dam, located in NSW. The volume stored in the dam has more than doubled the amount stored in the whole of the ACT (Figure 17). Water storage levels and extraction is shown in the Water Asset Account until the year 2013-14.33
Figure 17: Water stored in reservoirs in the ACT region 2009-10 to 2013-14 (ML)
32 WAA 2015,
http://www.bom.gov.au/water/nwa/2015/canberra/notes/supportinginformationforwateraccountingstatements.shtm l#surface_water_store 33
A change in the presentation of the source data meant that, without further investigation, asset accounts for the years 2014-15 and 2015-16 could not be prepared.

31
Data sources for water accounts
The compilation of the water accounts was based on available data, including the two existing water accounts produced annually by the ABS and BoM. The coverage and terminology used by each differs.
The ABS Water Account, Australia, includes a physical supply and use table and specific information for the ACT,34 which was the basis for the physical supply and use tables presented. The ABS follow the key concepts of the SEEA presentation of the water used but the ABS pre-dates both the SEEA Central Framework and SEEA Water and does not distinguish water imports or exports to or from Googong Dam in NSW.
The BoM National Water Account produces an account for the Canberra region, including parts of NSW (e.g. Googong Dam in NSW).35 BoM used the National Water Accounting Standard36 which is a different accounting system, but it can be mapped to the SEEA.37 This was the basis for the water asset account, with the geographic scope restricted to the ACT. A better understanding of the ABS and BoM accounts and geographic difference is important. Better alignment of these two accounts would simplify production and aid understanding of the economics of water supply and the dependence of the ACT on water supply from NSW.
The BoM accounts for the Canberra region include a large ‘balancing item’.38 No attempt has been made to re-allocate the balancing item but it is hoped that in the future it can be better understood. The balancing items represents uncertainty in the data and requires further investigation.
The water accounts could be expanded to include monetary accounts for water supply and use as well as accounts for the ecosystem services of water provisioning and water filtration. The development of these accounts would require collaboration with Icon Water as well as the ABS, BoM and others.
34 E.g. see Physical Water Supply and Use, by Water Type, Australian Capital Territory (Megalitres), 2014-15
http://www.abs.gov.au/AUSSTATS/subscriber.nsf/log?openagent&46100do015_201415.xls&4610.0&Data%20C ubes&76F5D4D4E83ABD53CA2580750012A507&0&2014-15&25.11.2016&Latest 35
See WAA 2016, http://www.bom.gov.au/water/nwa/2016/canberra/index.shtml 36
See http://www.bom.gov.au/water/standards/wasb/awas.shtml 37
Vardon et al. (2012). The System of Environmental-Economic Accounting for Water: development, implementation and use. https://www.researchgate.net/publication/262007240_The_System_of_Environmental- Economic_Accounting_for_Water_development_implementation_and_use 38
See Unaccounted-for difference http://www.bom.gov.au/water/nwa/2016/canberra/supportinginformation/statementdetails.shtml#Unaccounted_for _difference

32
5. Air Emissions Account
Outline
The ACT experimental air accounts define emissions to air as gaseous and particulate substances released into the atmosphere by establishments and households as a result of production, consumption and accumulation processes.
The accounts record the generation of air emissions by resident economic units, by type of substance.
Air emission accounts, particularly carbon dioxide and other greenhouse gas emissions, are of significant policy relevance to the ACT given the Territory has the most ambitious greenhouse gas emissions reduction targets in the country and these targets equal first of any region in the world.39
ACT State of the Environment Reporting and the Air Emissions Account
The 2015 State of the Environment Report presented greenhouse gas emissions data summarised from the ACT’s annual Greenhouse Gas Inventory.40 The report included indicators of total greenhouse gases produced, emissions per capita, and emissions by sector.
In relation to National Environment Protection (Ambient Air Quality) Measure (AAQ NEPM) compliance, the report presented a summary of the annual ACT Air Quality report and the number of days the AAQ NEPM was exceeded. The report also provided a summary of emissions to the airshed from the National Pollutant Inventory.
SEEA Air accounts, combined particularly with SEEA Energy, would allow the state of the environment report to provide relevant physical (e.g. emissions and energy input and output) and monetary (e.g. taxes and expenditure) information, per economic sector. This information has the potential to link directly with ACT Treasury’s financial framework. In addition, the sector-related information could provide information to design, measure and monitor policy instruments. For the ACT, this particularly relates to the Government’s ambitious greenhouse gas reduction and renewable energy targets.
Potential Use of the Air Emissions Account
A wide array of information can be extracted from an Air Emissions account. For example, this account can provide the ACT government with tools to answer questions such as:
Has the structure or composition of emissions changed over the time?
How does the ACT compare with other jurisdictions, nationally and internationally?
How much do single industries contribute to total air emissions and totals of socioeconomic parameters such as gross value-added and employment?
Are emissions changing relative to economic growth? Is there a decoupling of air emissions from economic growth?
39 Environment, Planning and Sustainable Development Directorate http://www.environment.act.gov.au/cc accessed
29 August 2017 40
Pitt&Sherry (2015). Interim ACT greenhouse gas inventories for 2012–13 and 2013–14, report prepared for ACT Government Environment and Planning Directorate, Canberra, 7, http://www.environment.act.gov.au/__data/assets/pdf_file/0005/711959/Attachment-A-Interim-ACT-Greenhouse-Gas-Inventory-2012-13-and-2013-14_web.pdf
33
Which industries are most (least) intensive in emitting air emissions per unit output (or gross value-added)?
What is the relationship between carbon dioxide and greenhouse gas emissions and energy production and consumption?
What is the relationship between emission rates and environmental expenditure?
Scope of this account
The air accounts present data relating to emissions of:
Greenhouse gases CH4 (methane), N2O (nitrous oxide), hydrofluorocarbons and SF6 (sulphur hexafluoride), reported in this Proof of Concept as CO2e, and
National Environment Protection (Ambient Air Quality) Measure (AAQ NEPM) substances reported in this Proof of Concept as oxides of nitrogen, carbon monoxide, PM2.5, PM10 and TVOC (total volatile organic compounds).
Findings
Greenhouse Gas Emissions (CO2e)
The bulk of the ACT's greenhouse gases were emitted in the consumption of goods and services for the purpose of household and government final consumption (Figure 18). In 2015 this sector made up about 61% of all greenhouse gases emitted. The majority of these emissions came from private households, with government contributing about 7%. Government in Canberra comprises both the Commonwealth and Australian Capital Territory public sectors.
The Commonwealth makes up the bulk of government emissions in the ACT, contributing over 91% to the government total.41
A further 7.23% of 2015 energy-related emissions was generated in the production of goods and services by the ACT’s wholesale, retail, accommodation, food service and hospitality sectors. Commercial freight, public transport (including buses), courier, postal, warehousing and storage activities generated 3.74% of 2015 emissions.
Total CO2e emissions have been increasing since 2012 - from 3 949 tonnes to 4 040 tonnes per annum in 2015. This increase is not evident in all sectors. For instance, the road transport sector has shown the largest increase in emissions - almost 4% from 2012 to 2015, while emissions from other sectors, including manufacturing and the construction industry, have decreased. Total government and household emissions have shown slight decreases.
41 Figures calculated from the Commonwealth State of the Service Report: 2012–13, p. 143 and the ACT Public Service State of the
Service Report 2014, pp. 29-31

34
Figure 18: Carbon dioxide emissions in the ACT by ANZIC division from 2012-13 to 2015-16
While Figure 18 described the direct generation of CO2e by sector and highlighted the fact that the bulk of the ACT’s greenhouse gases was emitted by its private residents Figure 19 breaks the proportion of ACT residents’ emissions into transport and non-transport activities.
In breaking these activities down, it can be shown that residents’ electricity use contributes to the majority of non-transport emissions while petrol is by far the largest contributor to residents’ transport emissions (Figure 20b).
Figure 19: Carbon dioxide emissions in the ACT for households and Government from
2012-13 to 2015-16
In 2016, Canberrans travelled an average 13,200km, slightly below the national average of 13,700km. This, and the increase in the number of vehicles on ACT roads, up by 1,908 vehicles from 2012 to a total of 28,535 vehicles in 2016, has been a significant contributor to the ACT’s total change in GHG emissions.

35
Passenger vehicles account for approximately 84% of all vehicles on ACT roads (including trucks, motorbikes and buses). Petrol dominates as the major fuel used in motor vehicles in the ACT and Australia. Nearly 90% of the ACT’s passenger fleet runs on petrol with only 1.3% in 2016 powered by LPG or hybrid systems; this is less than half the national average.42
Figure 20: Carbon dioxide emissions by transport sector (a) and by fuel type for Residential
(b), Commercial (c) and Bus (d) transport sectors for the ACT 2012-13 to 2015-16
In addition to showing the contribution made by ACT residents to CO2e emissions from transport (Figure 20a). Figures 20b to 20d show the proportion of fuel types used by households, buses and the commercial sector. Figures 20a and 20b show clearly that petrol use by residents is the largest contributor to CO2e fuel emissions and that this contribution is rising, although very slowly, at a little over 1% between 2012-13 and 2015-16.
Figures 20b to 20d highlight the emergence of a number of trends in transport fuel emissions. In both the residential and commercial sectors the use of LPG vehicles has declined. This is primarily due to the winding back of the government’s exemption of the LPG excise.43 However, the positive effect of this reduction in CO2e emissions from LPG has been negated by increases in emissions from petrol and diesel vehicles. Diesel emissions from residents’ vehicles has increased from 11.5% to over 14% over 4 years to 2016; while diesel emissions from the commercial sector has increased by over 17%. Buses, making up no more than 7% of all ACT vehicles, show a similar trend with LPG emissions declining by 23% and emissions from diesel rising by over 20%.
42 Australian Bureau of Statistics Catalogue No 9208.0 - Survey of Motor Vehicle Use, Australia, 12 months ended 30 June 2016
43 Complementary or contradictory? An analysis of the design of climate policies in Australia Policy Brief No. 22 February 2011 ISSN
1836-9014 Richard Denniss and Andrew Macintosh. The Australia Institute

35
Integrated socioeconomic and environmental indicators for GHG emissions
Economic growth (as measured in the ACT by Gross State Product)44 historically includes increased demand for resources such as energy and water, as well as increased waste generation, greenhouse gas emissions and pollution. Alternatively, economic growth may be largely decoupled from increased consumption of resources and increased waste and pollution. The term ‘relative decoupling’ is used to describe the situation when the growth rate of an environmental parameter is lower than the growth rate of the economic indicator.
Figure 21 finds that greenhouse gas emissions from all economic activity in the ACT are increasing at a relatively lower rate than the economic indicator of Gross State Product (GSP). The figure shows an increase in emissions by households between 2012-13 and 2013-14. This is largely due to:
A decline in the proportion of renewable electricity used in the ACT to 18.5% because of the repeal of the carbon price; and
A slight rise in the demand for electricity in the ACT.45
Notwithstanding this fact, households overall are emitting less CO2e despite a continuous rising trend in population.
Figure 21: Select socio-economic and emission measures by ANZIC sectors, households
and government for the ACT 2011-12 to 2015-16
Indicators of environmental pressure for selected industries
Environmental pressure refers to human activities that place pressure on the environment. For example, manufacturing activity gives rise to greenhouse gas emissions. The measures contained in this section provide an indication of environmental pressure for selected industries.
44 5220.0 Australian National Accounts: State Accounts Table 1. Gross State Product, Chain volume measures and current prices
45 https://www.environment.act.gov.au/cc/acts-greenhouse-gas-emissions accessed 8 September 2017

36
Figure 22 shows that while construction and manufacturing are decoupled from GSP and population growth emissions from both these sectors has risen, by 6 000 tonnes CO2e and 70 tonnes respectively since 2014-15.
Emissions from agriculture were also decreasing at a lower rate than economic growth until 2013-14, however, from 2013-14 to 2015-16 emissions from agriculture have risen and now exceed the rate of economic growth.
The trajectory for mining sector emissions, which in the ACT come primarily from quarrying, showed an increase of 3 000 tonnes CO2e between 2012-13 to 2014-15 to 16 000 tonnes between 2014-15 and 2015-16.
Emissions from the electricity, gas and water supply sectors were decoupled from economic growth until 2013-14. Emissions from this sector rose to a peak of 107 000 tonnes in 2014-15. These emissions have since declined by 8 000 tonnes between 2014-15 and 2015-16 due to renewable electricity in the grid increasing from 18.8% to 21%.46
Figure 22: Select socio-economic and emission indicators by ANZIC divisions from for the ACT from 2012-13 to 2015-16
Although petrol vehicles driven by ACT residents are the major contributor to transport sector greenhouse gas emissions, this sector remains decoupled from economic growth (Figure 23).
This is not the case for emissions from the commercial sector or from buses, both of which are trending upwards. Total emissions from buses have risen from 4 543 tonnes CO2e in 2012-13 to 7 198 CO2e in 2015-16. Emissions from the commercial sector were decoupled from economic growth until 2013- 14, at which time a slow increase of about 1% a year began.
46 https://www.environment.act.gov.au/cc/acts-greenhouse-gas-emissions accessed 8 September 2017

37
Figure 23: Select socio-economic and transport emission indicators for the ACT from 2012-13
to 2015-16
Air Pollution
Ambient air quality in the ACT is measured in accordance with the requirements of the National Environment Protection (Ambient Air Quality) Measure (AAQ NEPM). AAQ NEPM sets the standards and goals for the maximum allowable number of exceedances of each of the 6 NEPM pollutants monitored in the ACT.47 The ACT State of the Environment Report must include an assessment about the degree of compliance with NEPM standards.48
The Air Pollution account presents information about NEPM substance emissions and transfers from industrial facilities and diffuse sources. This includes vehicle emissions and wood heaters in the ACT.
If facilities trip one of the National Pollutant Inventory (NPI) reporting thresholds, facilities must calculate their emissions and provide this data annually for the NPI.
Diffuse data shows the contribution of non-industrial sources and selected sub-threshold industry to Australia's emissions.
The Air Pollution account presents data reported to the Commonwealth Department of Environment and Energy49 by facilities that exceed the defined thresholds of a range of substances. These substances are determined by the National Pollutant Inventory Technical Advisory Panel. Substances are assessed as reportable by the panel based on potential environmental and human health effects. Ozone depletion and climate change are not included as criteria for assessment as a ‘reportable substance’.
Since 2006-07 there has been relative consistency and stability in emissions levels from all ACT industries (Figure 24).
Some exceptions occurred. In 2011-12 when carbon monoxide from the electricity sector rose more than 17% (2010-11 and 2011-12) but then declined by nearly 35% by 2012-13. Oxides of nitrogen for the electricity sector followed the same pattern.
47 ACT AIR QUALITY REPORT 2015 Environment Protection Authority | June 2016
48 Commissioner for Sustainability and the Environment Act 1993 s19(2)(b)
49 http://www.npi.gov.au/ accessed 12 September 2017

38
Figure 24: Pollution emission levels (millions of kg) for carbon monoxide (a), oxides of
nitrogen (b), 10 μm particulate matter (c), 2.5 μm particulate matter (d), and total volatile
organic compounds (e) across ANZIC divisions in the ACT from 2006-07 to 2015-16
Figure 24 shows the real levels of emissions in millions of kg. Figure 25 presents an indexed version of emissions.
Figure 24 shows that the electricity, gas, water and waste services sector is the largest contributor of oxides of nitrogen and PM2.5. This sector contributed, on average, 33% of all oxides of nitrogen emissions to the atmosphere, and up to 61% at its highest in 2011-12. More than 80% of these emissions came from the Mugga Lane LFG Power Station at Symonston. Similarly, this sector emits on average 46% of all PM2.5 with a low of 27% in 2011-12 and up to 65% in 2014-15.
Most carbon monoxide is emitted by the transport sector (which includes postal and warehousing services). Vehicles contribute over 3 times more carbon monoxide than any other economic activity. In a number of years this contribution has exceeded 70% of total carbon monoxide emissions.

39
Figure 25: Pollution emissions index for carbon monoxide (a), oxides of nitrogen (b), 10 μm
particulate matter (c), 2.5 μm particulate matter (d), and total volatile organic
compounds (e) across ANZIC divisions in the ACT from 2006-07 to 2015-16
Figure 26: Select socio-economic and pollution emission indicators for different transport
sectors in the ACT from 2006-07 to 2015-16

40
ACT population numbers, GSP, and emissions from the residential and commercial transport sectors have risen on a consistent and stable trajectory since 2006-17 (Figure 26).
Buses show a rise in emissions to 2011-12. At that time bus emission levels decoupled from economic growth. This trend has continued to 2015-16. Passenger vehicles, over 90% of which are fuelled by petrol, continue to follow the same trajectory as gross state product and population. Commercial vehicles have shown the largest increase in emissions and remain uncoupled from economic growth.
Figure 27: Carbon monoxide emissions from diffuse sources in the ACT from 2006-07 to
2015-16
Figure 28: Total volatile organic compound emissions from diffuse sources in the ACT from
2006-07 to 2015-16

41
Figure 29: Oxides of nitrogen emissions from diffuse sources in the ACT from 2006-07 to 2015-16
Summary of tables presented above
Figures 24 & 25 present information from individual facilities. If facilities trip one of the NPI reporting thresholds, facilities must calculate their emissions and provide this data annually for the NPI. Diffuse data shows the contribution of non-industrial sources and selected sub-threshold industry to the ACT’s emissions. The major sources of these diffuse pollutants are motor vehicles and wood heaters.
Figures 27 to 29 show that motor vehicles produce the majority of carbon monoxide and Total Volatile Organic Compound (TVOC) and oxides of nitrogen emissions. These levels have been increasing over time. Wood heaters in the ACT are the second largest source of carbon monoxide emissions although the amount emitted has not changed since 2007.

42
In the ACT, the quantity of all National Environment Protection Measure (NEPM) emissions is largely commensurate with population and GSP growth (Figure 30). The exceptions are PM10 and 2.5. PM10 which decoupled from economic growth in 2006-07. This remains the case in 2015-16. Emissions of PM2.5 have fluctuated since exceeding the rate of economic growth in 2007-08. The 2010-12 spike in PM2.5 emissions may be attributable to the significant increase in construction and traffic movements associated with major water security projects.50
Figure 30: Select socio-economic and air pollution measures for the ACT from 2006-07 to 2015-
16
50 Enlarged Cotter Dam, Environmental Impact Statement 2009
43
6. Solid waste account
Outline
This experimental solid waste account covers discarded materials that are no longer required by the owner or user.
Solid waste includes materials that are in a solid or liquid state but excludes wastewater and small particulate matter released into the atmosphere.
Waste management is a complex issue and poses several measurement challenges.
The production and use of materials, goods and services have a range of environmental and economic consequences.
Waste management is a broader area than provision of waste services and involves the recovery of materials, recycling, and disposal to landfill. These services are provided primarily by the Waste Management Industry. Government, businesses and households are all involved in waste generation and waste management - either by actively reducing, reusing, recovering, recycling materials, or paying others to recover or to dispose of unwanted materials
ACT State of the Environment Reporting and the Waste Account
The 2015 State of the Environment Report provided comprehensive coverage of solid waste generation and management. The report included the following indicators:
Waste generated per person,
Waste sent to landfill,
Sectoral waste generation,
Greenhouse gas emissions from landfill,
Rates of resource recovery,
Material composition of waste recycling and resource recovery,
Compliance with the National Environment Protection (Movement of Controlled Waste) Measure, and
Impacts of waste on land, air and water.
The experimental waste account produced for this Proof of Concept has demonstrated that a SEEA-based waste account can be derived using these same indicators.
The value-add of producing SEEA-based solid waste accounts for the ACT is the ability to integrate economic and physical data to support improved understanding of:
The waste 'market' and, in particular, which sectors (i.e. private or government) and industries are providing these services,
What services are being provided and the value of these services,
Which industries have the greatest demand for waste services, and
Whether waste recovery is becoming more profitable.
.

44
Potential Uses of the Waste Account
Waste accounts highlight and measure the inputs, generation and management (use) of waste by industries, as waste flows either directly to the environment, is taken for treatment, or stored or used within the economy.
Waste accounting for the ACT would assist in analysing the effectiveness and impact of policy. Accounts can potentially show where policy can be improved to reduce waste generation and minimise waste to landfill. The accounts would facilitate this analysis by:
Breaking down waste generation according to sources in such a way that waste statistics can be combined with economic statistics,
Presenting data on waste generation in a manner which is consistent with the concepts and definitions of the System of National Accounts (SNA),
Monitoring of coupling or decoupling trends,
Allowing the measurement of the impacts of political measures or technical innovations,
Integrating data from other accounts such as the air emissions, energy, land, and environmental expenditure accounts.
Scope of these accounts
The waste account produced for this Proof of Concept extends, by two financial years, the comparable data used for the production of the 2015 State of the Environment Report.
The key difference with the waste account prepared for this Proof of Concept is the concordance of the ACT’s waste reporting categories51 & 52 with the Australian and New Zealand Standard Industrial Classification (ANZSIC) categories that are used for the production of SEEA accounts in Australia.
Findings
Waste generated
The total amount of waste generated in the ACT has been increasing over the course of the data record. The second highest level of waste since 1994-94 was generated in 2015-16 with an increase from 1,012,089 tonnes in 2014-15 to 1,025,884 tonnes 2015-16. However, this increase included 79,000 tonnes of asbestos from demolition of Mr Fluffy houses that occurred during 2016. Excluding the asbestos, total waste generated declined slightly to 946,884 tonnes. This was still the fourth highest level on record.
Levels of waste generated in 2010-11 came from a 50% increase in recycled garden waste due to higher rainfall.53
51 Department of Sustainability, Environment, Water, Population and Communities, Australian waste classifications
https://www.environment.gov.au/system/files/resources/a6a7c513-4a98-44bf-ade0-01c7c84d31ba/files/waste- classifications.pdf accessed 17 September 2017 52
Australian Waste Definitions Defining waste related terms by jurisdiction in Australia Department of Sustainability, Environment, Water, Population and Communities Report No: R01-02-A11306 53
ACT State of the Environment Report 2011, vol. 3, pp 523-526. http://reports.envcomm.act.gov.au/actsoe2011/

45
The rise in 2011–12 came mainly from the site clean-up of a failed resource recovery company, and from additional deliveries of contaminated soil from the West Molonglo pond clean-up.
Waste generated in the ACT is also transported to NSW disposal facilities. Data about this transportation was not available to the Office of the Commissioner for Sustainability and the Environment (OCSE) prior to the 2014-15 financial year. Exports for the available years (2014-15 and 2015-16) make up less than 3 % of total waste generated.
Figure 31: ACT population, waste sent to landfill and resource recovery 1993-94 to 2015-16
Waste to landfill and resource recovery
Despite a relative constant increase in the total amount of waste generated over the course of the data record, the amount of waste sent to landfill has declined substantially from 1993-94 (415,798t) to 2015-16 (255,991t). The increased volumes of waste generated have been subsumed entirely through resource recovery.
The majority of waste in the ACT has been recycled through resource recovery centres rather than sent to landfill since 1998-99. The relative proportion of recycled waste has been growing constantly.
In 2015-16, 67% of waste generated in the ACT was recycled through resource recovery centres and 33% was sent to landfill. A slightly lower proportion was recycled than was the case in 2014-15, which saw 72% recycled and 28% delivered to landfill. The majority of waste generated in the ACT is recycled at waste recovery and recycling operations at Mugga Lane and Mitchell. Some proportion of the waste that is exported from the ACT may also go to recycling although, speculatively, the majority likely goes to landfill.

46
23% of the material going to landfill in 2015-16 is related to the buyback and demolition of houses containing loose fill asbestos insulation known as Mr Fluffy insulation.54 The process of buying houses affected by Mr Fluffy insulation began in 2016 and involves the purchase and demolition of more than 1000 houses and the disposal of the asbestos insulation. As of July 2016, 270 properties had been demolished by government, with a further 11 properties demolished by private contractors.55
Reliable capital city comparisons of the amount of waste to landfill and recovery are not available. Canberra’s recycling rate appears to be high compared with cities such as Perth, Brisbane, Melbourne and Sydney. In those capitals recycling rates are between 35% and 67%.56
Figure 32: Waste to landfill in the ACT from 1993-94 to 2015-16
54 http://www.asbestostaskforce.act.gov.au/About-Us/communications-and-engagement/newsletter/edition-56- 29-july-2016
accessed 17 September 2017 55
ACT Asbestos Taskforce. http://www.asbestostaskforce.act.gov.au/About-Us/communications-and- engagement/newsletter/edition-56-29-july-2016
56 Australian Government Department of Infrastructure and Transport (2013). State of Australian cities 2013, Department of
Infrastructure and Transport, Canberra, 243-244, https://infrastructure.gov.au/infrastructure/pab/soac/2013.aspx.

47
Figure 33: Waste materials sent to resource recovery in the ACT 1993-94 to 2015-16
While the proportionality of materials recovered has remained relatively consistent over time (Figure 33) there have been a number of notable changes. Between 2014-15 and 2015-16 the recovery of metals decreased by almost 93% from 82 774 tonnes to 5979 tonnes. Recovery of hazardous waste for the same period also declined by 60% from 24 997 tonnes to 9 998 tonnes. Recovery of masonry in 2014-15 was at its highest level since 2010-11 and the second highest level since state of the environment reporting began in 1993-94.
The quantity of waste sent to landfill has grown at a similar rate to ACT population and economic activity (Figure 34). This trend has been present since 1993-94. In contrast, the rate of resource recovery has grown at a much faster rate, increasing by almost 95% between 2000-01 and 2015-16.
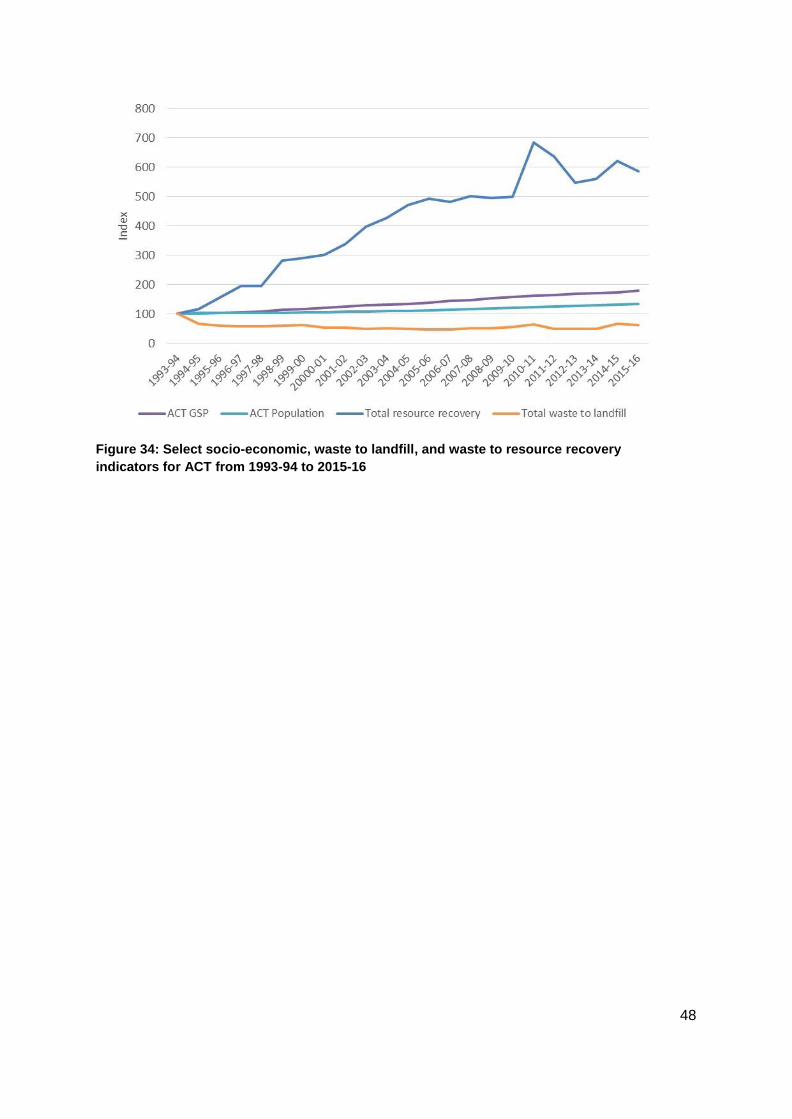
48
Figure 34: Select socio-economic, waste to landfill, and waste to resource recovery
indicators for ACT from 1993-94 to 2015-16

49
7. Environmental expenditure account
Outline
The environmental expenditure account provides the framework for identification and measurement of the ACT Government’s response to environmental concerns, through the supply of environmental protection and natural resource management services.
The purpose of the environmental-expenditure account is to provide a framework and structure to identify these environmental components within the key economic aggregates of the SNA, such as GDP.
ACT State of the Environment Reporting and the Expenditure account
The Commissioner for Sustainability and the Environment ACT 1993 mandates an evaluation of the adequacy and effectiveness of environmental management.57 This evaluation must be considered within the context of the ACT’s public expenditure policies. These policies include the Government’s adoption of a triple bottom line approach to sustainability, and its recognition of the interdependence of social, economic and environmental wellbeing.58 In addition, building a strong economy that is growing and creating jobs, is one of the ACT Government’s highest priorities – with the 2016-17 Budget continuing to support economic growth in the Territory.59
Previous ACT State of the Environment Reports have not provided information on environmental expenditure. However, this information is critical to assessing whether environmental management policies are delivering prescribed environmental outcomes, cost efficiency, and effective resource allocation.
Potential Uses of the Environmental Expenditure Account
Establishing accounts for environmental expenditure would allow the ACT government to identify and measure the supply and production of environmental protection and natural resource operational and management services. In addition, this account, in conjunction with other SEEA accounts, would allow the ACT government to conduct analysis about the outcomes of financial resourcing and allocation on the:
ecological condition of defined spatial areas such as nature reserves
water condition of defined spatial areas
ecological condition, restoration and maintenance of defined spatial areas cared for by environmental volunteers.
Additional analysis may find support from SEEA accounting by linking expenditure on environmental protection to physical data, such as the amount of waste treated or the quantity of air emissions. Models may be developed that link potential changes in environmental pressures, such as air emissions, to future economic activity, given particular amounts of expenditure on environmental protection.
57 Commissioner for Sustainability and the Environment ACT 1993 s19(2)(b)
58 https://apps.treasury.act.gov.au/budget/budget-2015-2016/a-sustainable-territory/a-sustainable- territory#framework accessed
17September 2017 59
https://apps.treasury.act.gov.au/ data/assets/pdf_file/0006/870405/MR05-Growing-economy-CMTEDD.pdf accessed 17 September 2017

50
Scope of this account
The scope of the SEEA Environmental Expenditure account is:
‘...those economic activities whose primary purpose is to reduce or eliminate pressures on the environment or to make more efficient use of natural resources.’60
The ACT Environmental Expenditure Account is structured based on the Classification of Environmental Activities (CEA) outlined in the SEEA and includes ACT government expenditure on the activities of resource management and environmental protection. Estimates have been compiled for three financial years commencing from 2013-14.
In addition, the account provides estimates of the contribution of volunteers to environmental protection and resource management in the ACT. This extension beyond the SEEA is consistent with general national accounting principles. It gives important insights into the ways in which environmental policy objectives are being supported.
Findings
ACT Government expenditure on the natural environment increased by 5.1% between 2013-14 and 2014-15 and by 3.1% between 2014-15 and 2015-16 (Figure 35) taking total Government expenditure on the environment to over $228m last financial year.
Figure 35: Total environmental expenditure in the ACT from 2013-14 to 2015-16
The ACT Government’s expenditure on the environment was consistent, across these years, in terms of the annual increase of total dollars spent, and apportionment between the two key components: environment protection and resource management (Figure 36).
60 United Nations et al., (2014) SEEA 2012 - Central Framework, Chapter IV, para. 4.11

51
Figure 36: Environmental protection and natural resource management spending in the ACT
2013-14 to 2015-16
Environmental protection expenditure includes activities such as:
Protection of riparian areas,
Solid waste management, and Protection and remediation of ground and surface water.
Expenditure on resource management includes activities such as:
Catchment management and policy,
Nature conservation research and education,
Nature Conservation Policy,
Sustainability and Climate Change Policy, and
Urban Reserve and Treescape management.
In 2013-14 the ACT Government spent $75.8m on environmental protection and $130.1m on resource management. The following year (2014-15) environmental protection expenditure increased to $78.5m.
For both these years expenditure on environmental protection was higher than on resource management.
In 2015-16 this trend reversed. Expenditure on resource management rose by 12% compared to 2013-14, while environmental protection expenditure was reduced by 3% in 2015-16. The increase in resource management compared with environment protection expenditure was largely due to more funds being spent on operational activities and on-ground works within the ACT’s reserved areas.
ACT volunteers working in the environment sector participate in activities including tree planting and bush regeneration, caring for injured wildlife, administration and management of environmental group activities, education, and control of invasive species.
Each year since 2013-14 the contribution of environmental volunteers has been a significant contributor to overall activity within the ACT.
In all three years, the estimated value of volunteer activity was in excess of 22% of total ACT Government expenditure on the environment (Figure 37).

52
Replacement costs for these volunteers across the years 2013-2016 in terms of wages is represented below:
2013-14 would require expenditure of $49.2m,
2014-15 would require expenditure of $49.8m, and
2015-16 would require expenditure of $50.5m.
Figure 37: Environmental protection and natural resource management spending and the
value of volunteering in the ACT from 2013-14 to 2015-16
There are a range of approaches that can be used to place monetary values on volunteering. Consistent with the SEEA, the value of volunteering in this experimental environmental-expenditure account was calculated using a replacement cost approach. The replacement cost approach has the following characteristics:
It does not capture all volunteer time that is unpaid. Most community groups and non-profit organisations use and rely on other non-monetary inputs in the form of in-kind contributions to run organisations.
It uses the same valuation approach to estimate values of outputs, which are:
o free or provided at below market price (for example, providing free veterinary products to treat injured wildlife or planting trees),
o not able to be assessed using a market price model (for example building a sense of community or protecting the environment – and often both).
It focuses on the direct impacts that arise from the volunteering activity, such as the expenditure and income of volunteering groups and does not capture the indirect economic impacts of volunteering activities such as the increase in local business turnover.

53
It does not capture the contingent or hidden values such as the value volunteers place on the ‘intangible’ personal benefits they receive from their participation including improvements to psychological and physical well-being.
The ACT Government’s expenditure on environmental protection and resource management rose at a faster rate than both population and economic activity (Gross State Product (GSP) (Figure 38)).
There was a 9% increase in environmental expenditure between 2013-14 and 2015-16 while population rose by 4% and GSP rose by 5% over the same period.
In 2015-16, 0.77% of total ACT GSP was spent on managing and protecting the environment. This is an increase of 4.8% since 2013-14. The ACT’s expenditure on the environment is comparable to the Commonwealth’s both as a portion of GDP and in terms of percentage increases over time.61
Australia overall is ranked 36th in a list of the 40 countries assessed as underfunding biodiversity conservation.62
Figure 38: Select socio-economic and environmental expenditure indicators for the ACT from
2013-14 to 2015-16
In terms of the composition of environmental expenditure, the purchase of supplies and services, which includes payments to consultants and contractors, made up over 49% of total environmental expenditure in 2013-14 (Figure 39). This increased to 51% in 2015-16.
In 2015-16 payments to ACT Government employees working in environment protection or resource management was $52.9m. In the same year the ACT Government paid $143.1m for supplies and services for these same activities. Figure 40 shows that over 94% of expenditure on supplies and services was spent on operational activities and on-ground works.
61 http://www.budget.gov.au/2016-17/content/bp1/html/bp1_bs5-01.htm accessed 14 September 2017
62 Targeting global conservation funding to limit immediate biodiversity declines. Waldrona,A,. O. Mooers,. Millerd, D,.Nibbelinka,
N,.Redding, D,.Kuhnc, T. Proceedings of the National Academy of Sciences of the United States of America, 2013.
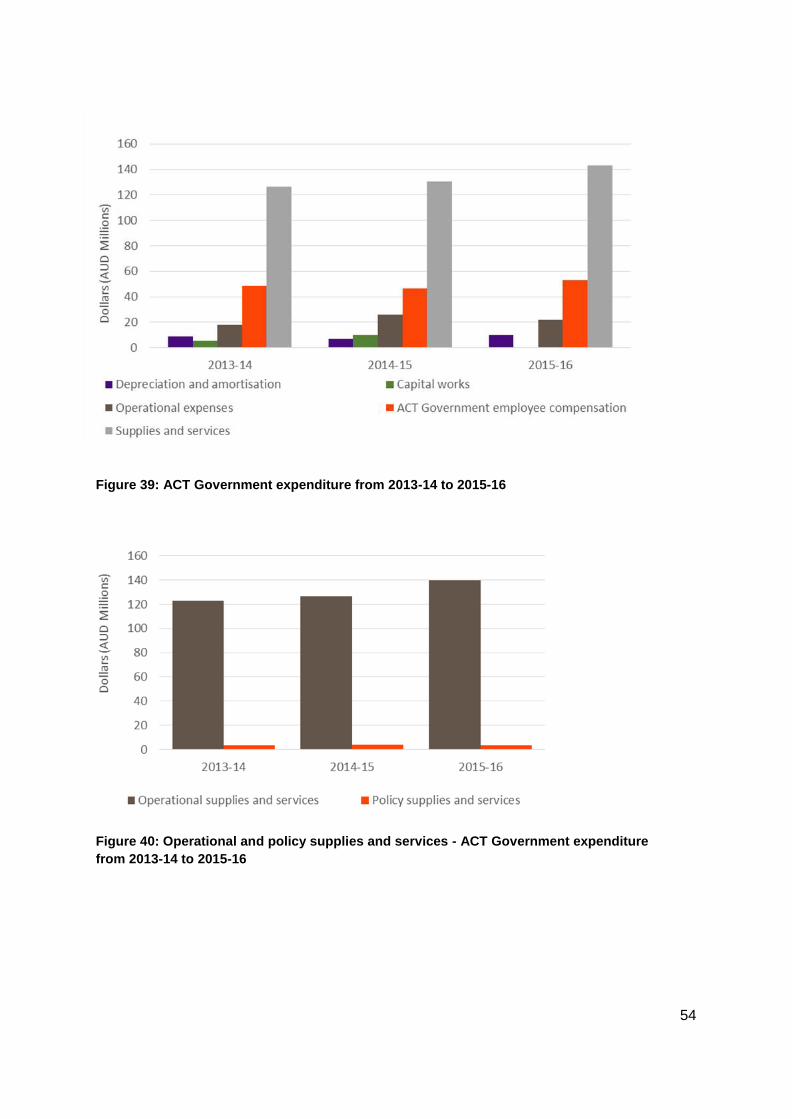
54
Figure 39: ACT Government expenditure from 2013-14 to 2015-16
Figure 40: Operational and policy supplies and services - ACT Government expenditure
from 2013-14 to 2015-16