environmental factors affecting the occurrence of different
TRANSCRIPT

Journal of Plankton Research Vol.19 no.10 pp.1385-1403, 1997
Environmental factors affecting the occurrence of differentmorphological forms of cyanoprokaryotes in the northern BalticSea
Maria Joanna LaamanenDepartment of Ecology and Systematics, Division of Hydrobiology, PO Box 17,00014 University of Helsinki, Finland
Abstract Cyanoprokaryotes (blue-green algae, cyanobacteria) and environmental factors werestudied in the Baltic Sea, off the SW coast of Finland, from April to December 1993. The aim was tooutline the seasonal development of cyanoprokaryote populations and the occurrence of species andspecies groups in relation to prevailing hydrographic conditions and general features of the plank-tonic community. Altogether, 27 taxa of cyanoprokaryotes were encountered, representing the ordersChroococcales, Nostocales and Oscillatoriales. Different morphological forms of cyanoprokaryotespredominated during certain periods of the yean the spherical, gomphosphaerioid colonies of thegenera Coelomoron, Coclosphaerium, Snowella and Woronichinia were rather abundant in earlyspring and the most abundant group in late autumn; minute-celled colonies with mucilaginous struc-tures, e.g. the genera Aphanothece, Cyanonephron, Lemmermanniella and Merismopedia, were abun-dant during early summer; and filamentous, nitrogen-fixing species in late summer and early autumn.Each of the periods represents a distinct successional phase of the planktonic community with inher-ent environmental conditions, and it was obvious that the cyanoprokaryotic assemblage was modifiedby the general development of the planktonic community. According to canonical correspondenceanalysis (CCA), temperature and the weight ratio of inorganic nitrogen to inorganic phosphorus werethe most important factors explaining variation in the cyanoprokaryote assemblage.
Introduction
Compositional periodicity in phytoplankton communities is driven by seasonallychanging physical conditions and, to a lesser extent, by biological interactions(Reynolds, 1980). Day length, light intensity, temperature, thermal stratification,destabilization of the water column and nutrient availability are importantenvironmental factors contributing to the specific periodicity. The physicochem-ical environment sets physiological limits for the survival of organisms (e.g.Tilman et al, 1982; Falkowski, 1984; Andersson et al, 1994), and biological inter-actions, such as competition and grazing, further modify the community (Vanniand Tempte, 1990). In addition, loss processes such as parasitism (Bruning et al.,1992) and sedimentation (Heiskanen and Kononen, 1994) account for the sea-sonal development of the planktonic community. The suitability of a species toexploit the given environment, e.g. its ability to remain in suspension or its capa-bility of efficient nutrient uptake, depends on its morphological and physiologi-cal adaptability (Margalef, 1978).
Planktonic cyanoprokaryotes (blue-green algae, cyanobacteria) exhibit largevariation in morphological forms, ranging from pico-size single cells to largeaggregates of filaments. The variation in morphological forms and physiologicalproperties enables adaptation to a wide range of environments (Komdrek, 1994).In the northern aquatic habitats, the planktonic environment undergoes pro-nounced seasonal changes and the planktonic communities experience seasonal
© Oxford University Press 1385Downloaded from https://academic.oup.com/plankt/article-abstract/19/10/1385/1488683by gueston 16 February 2018

MJ.Laamanen
succession. The cyanoprokaryotic assemblages are altered along with the rest ofthe planktonic community.
The Baltic Sea is a non-tidal, brackish water sea with pronounced horizontaland vertical salinity variation. Cyanoprokaryotes are a prominent component ofthe planktonic communities of the Baltic Sea, and the Baltic is one of the fewbrackish water areas where cyanoprokaryotes form extensive blooms (e.g.Kononen et al, 1996). The blooms usually occur in late summer, and they havetriggered most of the research interest in the cyanoprokaryotes of the Baltic (e.g.Kononen and Ndmmann, 1992; Kahru et al., 1993; Kononen et al., 1996). Thecyanoprokaryote species that usually do not form blooms have been little studiedand detailed investigations on their ecology and spatio-temporal distributionhave not been undertaken in the open-sea areas. Despite the little interest in thespecies presently not known to form blooms in the Baltic, this group includesspecies capable of bloom formation and toxin production. Moreover, the numberof recently described cyanoprokaryote taxa is high and a survey of thecyanoprokaryotes occurring in the open northern Baltic following the recentliterature is appropriate.
The phytoplankton communities in the sea areas off SW Finland have beenstudied since the beginning of this century (e.g. Levander, 1915; Halme andMolder, 1958). In the open-sea areas, the seasonal patterns of phytoplanktondynamics exhibit pronounced dependency on hydrographic and chemical con-ditions (Niemi, 1973, 1975; Niemi and Astrom, 1987), and the phytoplanktoncommunities seem to be principally bottom-up regulated (Kivi etal., 1993). Nitro-gen has been claimed as the main limiting nutrient for phytoplankton through-out the productive season, except for the summer minimum period, whenlimitation is attributable to both nitrogen and phosphorus (Kivi et al., 1993).
The succession of the planktonic communities of the open-sea areas off theSW coast of Finland is characterized by several distinct developmental phases:winter period of low production, spring bloom, summer minimum period, latesummer cyanoprokaryote dominance or cyanoprokaryote blooms and anoccasional diatom bloom in late autumn. Commencement of the spring bloom istriggered by vertical stability, which in the open-sea areas is often created by asalinity-related density gradient resulting from the melted ice (Kahru andNdmmann, 1990), and in the coastal areas by the oligohaline surface outflow andthermal stratification (Niemi, 1973, 1975). The spring bloom usually reaches itspeak in late April or early May and is dominated by an assemblage of cold-waterdiatoms and dinoflagellates Peridiniella catenate (Levander) Balech (Niemi,1975) and Scrippsiella hangoei (Schiller) Larsen (Larsen et al, 1995). The deple-tion of inorganic nutrients, along with increased sedimentation and grazing(Lignell et al, 1993), result in a transition to a summer phase of low production,low concentrations of inorganic nutrients, and increased amounts of small flagel-lates and picoplankton (Huttunen and Kuparinen, 1986; Kuosa, 1991). Thebiomass of mesozooplankton also peaks during summer (Viitasilo, 1992). Thehighest surface water temperatures are usually recorded in late July or earlyAugust, the mean maximum temperature reaching +16°C (Haapala and Alenius,1994).
1386Downloaded from https://academic.oup.com/plankt/article-abstract/19/10/1385/1488683by gueston 16 February 2018

Cyanoprokaryotes in the nortfaem Bahk Sea
In late summer, the biomass of filamentous cyanoprokaryotes increases andthey often form mass occurrences (e.g. Kononen and Ndmmann, 1992). Theseblooms are a well-documented and natural phenomenon in the northern BalticSea. However, during the last few decades, they have shown a tendency towardincreased frequency and intensity (Kahru et al, 1994). The late summercyanoprokaryotic assemblages usually consist of species of the genera Aphani-zomenon Morren and Anabaena Bory, and of Nodularia spumigena Mertens.High surface water temperatures and low ratios of inorganic nitrogen to phos-phorus in the upper mixed layer promote the blooms (Niemi, 1979; Kononen etal, 1996).
The study area off the SW coast of Finland is characterized by frequentupwelling, which causes shifts in the nutrient levels and biological activity (Niemi,1973,1975). The nutrient shifts are often difficult to detect because during nutri-ent limitation the nutrients are rapidly taken up by the planktonic community.However, in the absence of a high biomass of diatoms, surface layer SiO4 will notbe consumed rapidly and its concentration can be used as an indicator of up-welling (e.g. Kononen et al, 19%).
This paper presents the dynamics of the environmental conditions and occur-rence of different morphological forms and species groups of cyanoprokaryotesin the pelagial off the SW coast of Finland during the open-water period in 1993.The relationships between the environmental conditions and the cyanoprokary-otes were examined by canonical correspondence analysis (CCA) and a succes-sional sequence of different morphological forms of cyanoprokaryotes wasrevealed. Possible causes for this sequence and effects of the environmentalfactors on the variability of the Baltic cyanoprokaryote assemblages are dis-cussed.
Method
The study site (59°47'N, 23°16'E, depth 78 m) is located at the border of the outerarchipelago and sea zone near the entrance to the Gulf of Finland (Figure 1). Itlies at the northern end of the Ajax basin (82 m), which is separated from theBaltic proper by a sill at a depth of 50-55 m. Permanent halocline with verticalstratification prevails in the southern parts of the basin, but not in the study area(Niemi, 1973). The area is characterized by west-flowing surface circulation whichis modified by local winds (Hela, 1952). A detailed description of the hydro-graphic conditions in the area has been given by Niemi (1973, 1975) and Niemiand AstrOm (1987).
The duration of the study was from 2 February to 14 December 1993.Cyanoprokaryotes were studied from 4 April to 14 December, 1-4 times permonth. Samples were taken at depths of 0,2,6 and 10 m. At each sampling, tem-perature was measured from 0 to 60 m, using a CTDplus 100 (SIS, Germany)sonde, and samples for inorganic nutrients and chlorophyll a were obtained at 2,6,10,20,40 and 60 m. Dissolved inorganic nutrients DIP (PO4-P) and DIN (NO2-N, NO3-N and NH4-N), and total phosphorus (TP) and nitrogen (TN), weremeasured according to Koroleff (1979). Chlorophyll a determinations were made
1387Downloaded from https://academic.oup.com/plankt/article-abstract/19/10/1385/1488683by gueston 16 February 2018

MJ.Iaamanen
FTg. L The study area. The broken line indicates a 50 m contour line.
spectrophotometrically using GF/F glass fiber filters, ethanol extraction and aShimadzu UV-VIS Scanning Spectrophotometer UV-2101PC following theguidelines of the Baltic Marine Environment Protection Commission (1988).Salinity measurements were made in the laboratory by an Autosal 8400A (Guide-line Instruments Ltd, Canada) autosalinometer which was calibrated with IAPSOstandard seawater.
Cyanoprokaryote samples were preserved with acid Lugol's solution. Analiquot of 50 or 100 ml was allowed to settle in Uterm5hl chambers for 24 or 48 h,respectively, and samples were examined under an inverted microscope. Thenomenclature follows Geitler (1932), modified by Anagnostidis and Komarek(1985,1988) and Komarek and Anagnostidis (1986,1989), and subsequent publi-cations on cyanoprokaryote taxonomy. Chroococcal taxa were enumerated ascolonies (except for the genus Merismopedia, members of which were counted asgroups of four cells) and the filamentous species were enumerated in 100 um longunits of filament. The most minute species, i.e. colonies composed of cells of~1 um in diameter (e.g. small Coelosphaerium or Chroococcus species and speciesof the genus Cyanodictyon), were not enumerated. Their reliable counting wouldhave required epifluorescence microscopy and filtration techniques (e.g. Cron-berg, 1984). In addition, the enumerations within Aphanothece, Aphanizomenonand Woronichinia have been combined. The enumerations of Snowella litoralisand S.septentrionalis, as well as of S.fennica and S.lacustris, respectively, have alsobeen combined (see Table I).
CCA was used to display the variation in the data; it was chosen because of itsability to reveal ecological trends in community data and to relate environmentalfactors to them (Ter Braak, 1986,1987). The analysis was based on a full data set,except for lacking nutrient data from 0 m. These have been replaced by data from
1388Downloaded from https://academic.oup.com/plankt/article-abstract/19/10/1385/1488683by gueston 16 February 2018

Cyanoprokaiyotes in the northern Baltic Sea
Temperature (C*)
Fab Mar Apr May Jun Juj Aug Sep Oct Nov Dec
Fab Mar Apr May Jun Jut Aug Sep Oct Nov D K
Fig. 2. (A) Seasonal temperature pattern (°C). Months are shown on the horizontal and the depth onthe vertical axis. (B) Salinity (p.s.u.) structure of the water column during the study.
2 m, as they were regarded as likely to be most similar to 0 m data. The data onenvironmental factors have been used as such, but the data on cyanoprokaryoteabundances have been standardized. In the standardization, the abundance ofeach species or species group was scaled to correspond to variations between 0and 1, the minimum and the maximum abundances of the original data. Theanalysis was carried out with the CANOCO 3.12 program (Ter Braak, 1991).
Results
Physical and chemical environment
Development of the thermocline started at the beginning of May, when the tem-perature of the surface layer was +7°C and that of layers near the bottom was+2°C (Figure 2A). The maximum surface water temperature of +16°C wasrecorded at the end of July. Thermal stratification, which remained rather weakand deepened throughout the summer period, persisted until the end of Septem-ber. By the beginning of November, the water column was well mixed andhomothermal. Salinity showed variation in the form of intrusions of more salinewater in the bottom layers, and filaments of less saline water were in the surface
1389Downloaded from https://academic.oup.com/plankt/article-abstract/19/10/1385/1488683by gueston 16 February 2018
MJ.Laamauen
layer (Figure 2B). The first intrusions of more saline water occurred in late springand early summer, and the salinity of the bottom layers increased up to 7.0 p.s.u.The later intrusions occurred in October and November, and the highestrecorded salinity was 7.4 p.s.u. Filaments of less saline water in the surface layerwere recorded in June (5.2-5.4 p.s.u.) and October (5.4 p.s.u.). The salinitygradient accounted for the development of density stratification in April andearly May. The pycnocline was strongest in July and in September, when the tem-perature and salinity gradients coincided.
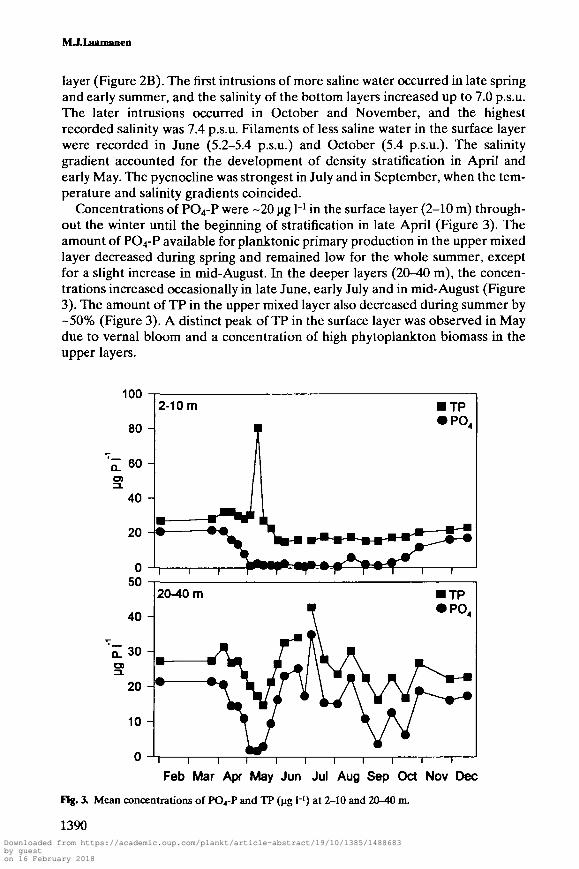
Concentrations of PO4-P were -20 ug H in the surface layer (2-10 m) through-out the winter until the beginning of stratification in late April (Figure 3). Theamount of PO4-P available for planktonic primary production in the upper mixedlayer decreased during spring and remained low for the whole summer, exceptfor a slight increase in mid-August. In the deeper layers (20-40 m), the concen-trations increased occasionally in late June, early July and in mid-August (Figure3). The amount of TP in the upper mixed layer also decreased during summer by-50% (Figure 3). A distinct peak of TP in the surface layer was observed in Maydue to vernal bloom and a concentration of high phytoplankton biomass in theupper layers.
100
80 -I
Q_CD
60 -
40 -
20
2-10 m TPPO4
0 J
50
40 -
30 -
20 -
10 -
20-40 m
w i i i i i i i i i i i
Feb Mar Apr May Jun Jul Aug Sep Oct Nov Dec
Fig. 3. Mean concentrations of PO4-P and TP (jig H) at 2-10 and 20-40 m.
1390Downloaded from https://academic.oup.com/plankt/article-abstract/19/10/1385/1488683by gueston 16 February 2018

Cyanoprokaryotes in the northern Baltic Sea
200 -
100 -
TNDIN
TNDIN
i i r i i i i i r i
Feb Mar Apr May Jun Jul Aug Sep Oct Nov Dec
Fig. 4. Mean concentrations of DIN and TN (ng H) at 2-10 and 20-40 ra.
Similar trends as for phosphorus were observed in the concentrations of DIN(NO3-N, NO2-N, NH4-N) and TN (Figure 4). In the 2-10 m surface layer, DINwas depleted by the beginning of May, and the concentrations remained low untilthe end of September. A similar peak for TN, as for TP, was observed in mid-May. Similarly, a slight increase in DIN was detected in mid-August. In thedeeper layers (20-40 m), the mean concentration of DIN varied between 6 and114 ug H, while the concentration of TN varied between 281 and 369 ug I"1
(Figure 4). Of the inorganic nitrogen fractions, the concentrations of NO3-Ndecreased strikingly at the end of April and remained low (<10 ug I"1) until theend of September (Figure 5 A). The concentrations of NH4-N, in turn, were <5 jigI"1 in the surface layer until the end of July, when a transient increase in concen-trations was detected (Figure 5B). In the layers near the bottom, the concen-tration of NH4-N increased both in June (>95 ug I"1) and in late August (>75 ugH). The DIN:DIP weight ratio of the upper mixed layer was at its highest (6:1)in April, decreased at the beginning of May and remained low (-2:1) with somefluctuation until mid-August (Figure 6). After the upwelling of mid-August, theratio decreased to -2:1, but reached -6:1 again by the end of September. Sea-sonally, the DIN:DIP ratio was at its lowest during stratification and at its highestduring deep mixing of the water column.
1391Downloaded from https://academic.oup.com/plankt/article-abstract/19/10/1385/1488683by gueston 16 February 2018

MJ.Laamanen
NO,-N (ug H)
Fab Mar Aug Sap Oct Nov Dw
NH4-N (pg H)
Fail Mar Apr Hay Jun Jul Aug Sop Oct Nov Doc
Fig. 5. (A) Seasonal pattern of NO3-N concentrations. (B) Seasonal pattern of NH4-N concentrations.
Feb Mar Apr May Jun Jul Aug Sep Oct Nov Dec
Fig. 6. Seasonal variation of DIN:DIP weight ratio at 2, 6 and 10 m.
Depletion of SiO4-Si in the upper mixed layer in early May was linked to thedecrease in phosphorus and nitrogen, and to the development of the vernal bloom(Figure 7). The SiO4-Si concentrations remained low throughout the earlysummer. At the beginning of July, the concentrations in the bottom layersincreased, and due to vertical mixing this increase was detectable in the uppermixed layer a little later at the end of July. The concentrations of nitrogen and
1392Downloaded from https://academic.oup.com/plankt/article-abstract/19/10/1385/1488683by gueston 16 February 2018

Cyanoprokaryotes in the northern Baltic Sea
3IO4-3I (pg M)
Fab Mar Apr Hay Jun Ju) Aug Sap Oct Nov Dec
Fig. 7. Variation of SiO4-Si concentrations (jig 1"').
phosphorus had increased in the bottom layers by the beginning of July, but noincrease in the concentrations of these nutrients was detectable in the uppermixed layer at the end of the month. The lack of DIN and DIP in the upper mixedlayer was most likely to be due to consumption by the planktonic community,while SiO4-Si was not consumed effectively (e.g. Kononen et al., 1996).
Seasonal dynamics of chlorophyll a and the cyanoprokaryotes
The chlorophyll a concentration of the surface layer ranged between <1 and 146ug I"1 (Figure 8). The highest values were measured during the spring bloom inmid-May. Later increases in chlorophyll a concentrations were detected at theend of July and early August (6.2 ug I"1), and in late September and early October(9.0 ug H).
The sum of counting units of cyanoprokaryotes at depths of 0,2,6 and 10 m wasstable and rather low until the end of June, and the first peak in abundance wasrecorded at the end of July (Figure 9). A transient decrease occurred from mid-August to early September, and a second peak was recorded in mid-September.
Chlorophyll a (pg M)
Fab Mar Apr May Jun Ju) Aug Sop Oct Nov Dae
Fig. 8. Seasonal variation of chlorophyll a concentration (|Jg I'1).
1393Downloaded from https://academic.oup.com/plankt/article-abstract/19/10/1385/1488683by gueston 16 February 2018

MJ.Laamanen
0800 000
600 000-
A Filamentous taxa• Picocolonial taxaO Gomphosphaeriokl taxa
May Jun Jul Aug Sep Oct Nov Dec
Fig. 9. Seasonal pattern of the numbers of cyanoprokaryotes and the different morphological formsof cyanoprokaryotes (counting units F) . Values are a sum of abundances at 0, 2, 6 and 10 m.
During the last 3 months of the year, the numbers were low, but not as low asthose counted in spring.
Altogether, 27 taxa of cyanoprokaryotes, representing the orders Chroococ-cales, Nostocales and Oscillatoriales, were recorded (Table I). The majority ofthe taxa were chxoococcoid, and only one species from the order Oscillatorialeswas encountered. The proportion of the minute-celled picocolonial taxa, e.g.species of the genera Aphanothece, Coelosphaerium, Cyanodictyon, Cyano-nephron, Lemmermanniclla, and the gomphosphaerioid taxa (Coelomoron,Snowella, Woronichinia), was high. Many of the taxa had a short period ofabundant occurrence and therefore demonstrated a unimodal distribution intime. Maximum abundances and their occurrences are shown in Table I. Duringearly spring, the three groups (picocolonial, gomphosphaerioid and filamentouscyanoprokaryotes) were nearly equally represented (Figure 9). The summerminimum phase after the spring bloom was dominated by the picocolonial taxa,and the filamentous species were the most abundant group after early July. Thegomphosphaerioids were rather abundant in early spring and most abundant atthe end of September. The filamentous Aphanizomenon spp., Nodularia spumi-gena and Pseudanabaena limnetica had the highest maximum abundances of all
1394Downloaded from https://academic.oup.com/plankt/article-abstract/19/10/1385/1488683by gueston 16 February 2018

Cyanoprofcaryotes in the northern Baltic Sea
Table I. The cyanoprokaryotic taxa found, the period of their maximum abundance, and the recordedmaximum abundance (counting units I"1) of the quantified taxa. Note the combined abundances of thegenera Aphanothece, Snowclla, Woronichinia and Aphanizomenon
Taxon Period ofmaximumabundance
Maximumabundance(units H)
Early July
Mid-MayLate October
NOSTOCALESAnabaena cylindrica Lemm.A.inaequalis (Kutz.) Born, et Flah.A.lemmcrmannti P. Richt.Aphanizomenon spp. (including A.gracile (Lemm.) Lemm.,A.klebahnii (Elenk.) Pechar et Kalina and Aphanizomenon sp.)Nodularia spumigena Mert.
OSCILLATORIALESPseudanabaena limnetica (Lemm.) Kom.
7510
11200760
CHROOCOCCALESAphanothece spp. (including Aphanothece bachmannii Kom.-Legn.
et Cronb. and A.clathrata W. et G.S West)Coelomoron pusillus (Van Goor) Kom.Coelosphaenum kuetzingianum N8g.Cminutissimum Lemm.C.subarcticum Kom. et Kom.-Legn.Chroococcus microscopicus Kom.-Legn. et Cronb.Cyanodictyon imperfectum Cronb. et Weib.Cplanctonicum MeyerC.reticulatum (Lemm.) Geitl. in PascherCyanonephron styloides HickelLemmermanniella parva Hind.Merismopedia tenuissima Lemm.S.lacustris Kom. & Hind, (including Snowella fennica Kom. et
Kom.-Legn. Chod.)S.litoralis (H3yr.) Kom. et Hind, (including Sseptentrionalis Kom.
etHind)Woronichinia spp. (including Woronichinia compacta (Lemm.) Kom
et Hind., W.elorantae Kom. et Kom.-Legn. and W.karelica Kom. etKom.-Legn.)
Mid-MayEarly JulyLate JulyLate September
Late September
Late September
Early JulyLate JulyLate JulyEarly August
Mid-September
Late June
90016 97058 73521460
12110
92 926
27058208860
144 820
250 000
339 900
species: Aphanizomenon spp. in early August, N.spumigena in mid-Septemberand P.limnetica in late June (Table I). The first maximum occurrence of thecyanoprokaryotes was mainly due to Aphanizomenon spp., Anabaena spp. andP.limnetica, and N.spumigena was mostly responsible for the September biomass
maximum.
Canonical correspondence analysis
The occurrence of the cyanoprokaryote taxa in relation to physicochemicalfactors was displayed by the CCA. Axes 1 and 2 of the CCA ordination explainedmost of the variation in the community (Figure 10A and B). Their eigenvalueswere relatively high: Xx = 0.53 and X2 = 043, respectively, compared to X3 = 0.21and X4 = 0.11. Total inertia of the data was 4.92. Temperature and the DIN:DIPratio, and secondarily the SiO4-Si concentration, were the environmental factorsexhibiting the most co-variation with the community. The importance of other
1395Downloaded from https://academic.oup.com/plankt/article-abstract/19/10/1385/1488683by gueston 16 February 2018

MJ.Laamaneo
SummerT°C
environmental factors included in the analyses was ranked as follows: NO3-N,NH4-N, PO4-P, TN, salinity and TP.
The sample scores were scattered in the ordination with a number of denserclusters spread out around the origin (Figure 10A). The samples in each clusteroriginate mostly from the same study period, and a successional sequence ofsamples became evident, starting from the spring samples on the top of the ordi-nation followed counterclockwise by spring and early summer samples, and aloose group of summer and late summer samples at the bottom of the ordinationand on the right side. At the upper right corner of the ordination, a cluster ofearly autumn samples and a more heterogeneous group of late autumn and earlywinter and a few spring samples are shown. The environmental factors, as exhib-ited by the vectors, are linked to the following sequence: the highest tempera-tures occurred in late summer and the lowest in early spring, the highestconcentrations of total phosphorus as well as of total nitrogen were recordedduring the spring bloom in early spring, and the highest concentrations of inor-ganic nutrients, in turn, occurred during the period from late autumn to earlyspring.
The different morphological forms of cyanoprokaryotes exhibited a distinctsuccessional sequence (Figure 10B). The spherical, colonial gomphosphaerioids,including the genera Snowella, Woronichinia, Coelomoron and Coelosphaerium,with cells in the size range 2.5-4 um, were most likely to occur during the cooler,well-mixed periods in spring and late autumn. In the early summer, the pico-colonial forms of the genera Merismopedia, Lemmermanniella and Aphanothece
1396Downloaded from https://academic.oup.com/plankt/article-abstract/19/10/1385/1488683by gueston 16 February 2018

Cyanoprokaryotes in the northern Baltic Sea
B
Spring/AutumnCMN:DIP
re
Fig. 10. (A) The CCA sample ordination with vectors indicating environmental variables. 2007(2) =July 20, 2 m depth, etc. (B) The CCA species ordination. Ana cyl, Anabaena cylindrica; Ana ina,A.inaequalis; Ana lem, A.Iemmermannii; Aph bal, Aphanizomenon spp.; Aph spp, Aphanothect bach-mannii + A.clathrata; Coc kue, Coelosphaerium kuetzingianum; Coe pus, Coelomoron pusillus; Cyasty, Cyanonephron styloides; Lem par, Lemmermanniella parva; Mer ten, Mcrismopedia tenuissima;Nod spu, Nodularia spumigena; Pse lim, Pseudanabaena limnetica; Sno lac, Snowella lacustns +S.fennica; Sno lit, S.litoralis + S.Septentrionabs; Wor spp, Woronichinia spp.
were most numerous, and a little later in summer the species of the genusAnabaena were abundant. The largest sized taxa, Aphanizomenon spp. andN.spumigena, exhibited their maximum abundance during the late summer andearly autumn.
Discussion
The different morphological forms of the cyanoprokaryotes were clustered in theanalysis, each form exhibiting dominance during a certain, distinct period of theyear, as displayed by the CCA species ordination (Figure 10B). The occurrenceof a morphological form during a certain period of the year suggests a relation-ship between the cyanoprokaryote morphological form and the dominatingenvironmental conditions.
The small-celled (cells 2.5-4 um in diameter), spherical, gomphosphaerioidcolonies occurred throughout the study period, but were most abundant in springand autumn, especially at the end of September (Table I). Some authors haverecorded high abundances of these forms during late summer: Alasaarela (1979)
1397Downloaded from https://academic.oup.com/plankt/article-abstract/19/10/1385/1488683by gueston 16 February 2018

M.J.I aamgnpn
in the Gulf of Bothnia, and Kononen and Ndmmann (1992) and Kononen et al.(1993) in the Gulf of Finland. In the present study, these taxa seemed to befavored by a deeply mixing water column and high nutrient concentrations. Thegomphosphaerioid colonies do not, in principle, possess features enhancing buoy-ancy, and thus sinking is a disadvantage in a stable water column. This is likelypartly to explain their abundant occurrence in spring and autumn, when the watercolumn is turbulently mixed. Taxa such as Snowella fennica, S.septentrionalis,Woronichinia karelica and Woronichinia spp. possess 1-2 cell inclusions whichresemble aerotopes, but it is not known whether the inclusions are capable of pro-viding sufficient buoyancy.
Gomphosphaerioid cyanoprokaryotes are common in the lakes of Fennoscan-dia (Komdrkova"-Legnerov& and Eloranta, 1992; Cronberg and Komdrek, 1994),and they seem to be favored by mesotrophy (Cronberg and Komdrek, 1994).Nutrient conditions in the northern Baltic proper during autumn and spring cor-respond to mesotrophy.
A distinct change in the phytoplankton biomass, primary production, stratifi-cation and nutrient conditions was detected from spring to summer, and thecyanoprokaryotic assemblage changed in dominance to the minute-celled,mucilaginous picocolonial taxa (Figure 9B). This group is comprised of taxa fromthe genera Aphanothece, Cyanonephron, Lemmermanniella and Merismopedia.Niemi and Astrbm (1987) reported a similar change to small-sized taxa at the startof the early summer stage in 1984. In their study, this period was characterizedby increasing proportions of Microcystis reinboldii, a picocolonial cyanoprokary-ote which is likely to have included several of the previously described minute-celled species.
Lemmermanniella parva exhibited high abundances in early July. The numberof colonies was nearly 17 0001"1, which is remarkable since there are no previousreports of L.parva in the Baltic Sea. In general, a rising trend in the abundanceof nano-sized (2-20 urn) phytoplankton (including M.reinboldii) from 1972 to1985 has been recorded (Kononen, 1988). This trend was in accordance withincreasing concentration of phosphorus and especially the species with thehighest surface-to-volume ratio correlated strongly with low DEN:DEP ratio.Accordingly, in the present study, the minute-celled colonies were most abundantduring the periods of the lowest DIN:DIP ratio (Figure 10B).
In general, the fraction of auto- and heterotrophic picoplankton is high duringthe summer minimum phase, and they compete efficiently for nutrients (Tammi-nen et at, 1985). The phytoplankton community is dominated by species resistantto grazing, efficient in nutrient uptake and not susceptible to sinking (Huttunenand Kuparinen, 1986). Of the cyanoprokaryotes, the single-cell pico-sized cyano-prokaryotes are abundant during the early summer (Kuosa, 1991). Also, theminute-celled, colonial forms are abundant and they correspond to the demandsset by the early summer environment: large mucilaginous sheaths are likely toreduce the colony density near to that of water, thus reducing sinking velocity(Walsby and Reynolds, 1980), the high surface-to-volume ratio of the cells prob-ably enhances nutrient uptake (Probyn et al, 1990), and the large, amorphous,mucilaginous colonies provide some physical resistance against the grazers
1398Downloaded from https://academic.oup.com/plankt/article-abstract/19/10/1385/1488683by gueston 16 February 2018
Cyanoprofcaryotes bi the northern Baltic Sea
(Paerl, 1988). Nevertheless, the mucilaginous colony structures may also reducethe nutrient uptake capacity of the cells to some extent (Margalef, 1978).
The highest surface water temperatures (+16°C) were recorded at the end ofJuly concomitantly with a very high relative abundance of filamentous, mostlynitrogen-fixing cyanoprokaryotes (Figure 9). High abundances of filamentousspecies in late summer were expected. Species of Anabaena were encounteredonly from July to early August, and they made up a large part of the biomass inlate July. According to the results of CCA, Anabaena inaequalis and A.lemmer-mannii together with N.spumigena had the strongest co-variation with tempera-ture (Figure 10B). A positive correlation between the growth of N.spumigena aswell as Aphanizomenon sp. (in earlier publications A.flos-aquae) and high tem-peratures has been demonstrated (WallstrSm, 1988; Lehtimaki et al, 1994;Kononen et al, 1996).
Particularly Aphanizomenon sp., but also N.spumigena, benefit from increasesin PO4-P concentrations (Kononen and N6mmann, 1992; Kononen et al, 1996).Both taxa have a high saturation constant for PO4-P and they can take up morenutrients than needed at the moment in high nutrient concentrations. This 'luxuryconsumption' provides the means for later growth. Aphanizomenon spp. withAnabaena spp. were responsible for the first cyanoprokaryote biomass peak atthe end of July. Aphanizomenon spp. also contributed considerably to the secondpeak. Both peaks in the abundance of cyanoprokaryotes lagged shortly behindnutrient additions in the bottom layers and the water column. In mid-August, thecyanoprokaryote abundance was low due to mixing of the water column and, con-sequently, distribution of the cyanoprokaryote biomass to the water column.During periods of low diatom biomass, SiO4-Si may be considered a tracer ofwater masses since it is independent of variations in oxygen conditions. Theincrease in SiO4-Si concentrations in the surface water at the end of July suggestsan increase in concentrations of PO4-P and inorganic nitrogen as well, the lattertwo having been directly consumed by the primary producers (e.g. Kononen etal, 1996). However, the nutrient additions had been sufficient to promote thegrowth of Aphanizomenon spp. and N.spumigena.
The stable water column of late summer promotes sedimentation of specieslacking buoyancy regulation or a means of reducing sinking velocities. However,the filamentous cyanoprokaryotes are capable of adjusting their position in thewater column by aero topes and ballast substances (reviewed by Oliver, 1994).
Nitrogen is the main limiting nutrient for phytoplankton production in summerin the northern Baltic Sea (Kivi et al, 1993). The filamentous cyanoprokaryotesof the order Nostocales can overcome this limitation by nitrogen fixation, whichenhances their competitive ability in relation to other cyanoprokaryotes. TheDIN:DIP weight ratio was low both at the end of July and in mid-September of1993 (Figure 6), the periods of maximum abundance of Aphanizomenon spp. andN.spumigena (Table I), indicating favorable nutrient conditions for the growth ofthese nitrogen-fixing species (e.g. Niemi, 1979).
According to CCA, temperature was the most important environmental factorexplaining variation in the cyanoprokaryote assemblage. The cyanoprokaryotesare generally favored by high temperatures, e.g. they have high temperature
1399Downloaded from https://academic.oup.com/plankt/article-abstract/19/10/1385/1488683by gueston 16 February 2018

MJ.Laamanen
optima (Wetzel, 1983), and their cell division rates are positively correlated withtemperature (e.g. Krempin and Sullivan, 1981; El-Hag and Fogg, 1986). Temper-ature is the major driving force of seasonal changes. However, the effects of tem-perature are to a large extent indirect: temperature affects the planktoniccommunity through the formation of a thermocline and subsequent nutrientdepletion, and later through the offset of the thermocline and consequentincrease in nutrient concentrations. Temperature has been claimed to be thedriving factor in the succession dynamics of nutrient-limited ecosystems (Kanetaerai,1985).
The DIN:DIP ratio was the second strongest factor explaining variation in thecommunity, according to CCA. The DIN:DIP ratio affects the occurrence ofnitrogen-fixing filamentous species (Niemi, 1979). As those species were the mostabundant group of cyanoprokaryotes in the present study, the emergence of theDIN:DIP ratio as an important factor was expected. The DIN:DIP ratio of the0-10 m surface layer varied between 6:1 and 1:1 (Figure 6), which is very low ifthe Redfield ratio of 7:1 is considered, and the values indicate limitation of theplanktonic community by inorganic nitrogen throughout the study. The lowestratios were measured during stratification, which is in accordance with the ideaof a mainly nitrogen-limited summer minimum period (Tamminen et ai, 1985;Kivi et ai, 1993). Nevertheless, the true nutrient supply of the primary producersmay be biased from the measured concentrations. Especially during periods ofvery low nutrient concentrations, the supply rate is coupled to remineralizationby micro-organisms (Furnas et ai, 1986) and competition between algae and bac-teria (Bratbak and Thingstad, 1985).
This interpretation of the CCA results assumes that the cyanoprokaryotes arenot grazed extensively and that grazing does not have strong direct effects on thecommunity. In general, the cyanoprokaryotes are poorly assimilated due to theirnutritional inadequacy (Lampert, 1977) and physical interference (e.g. Holm etai, 1983). In the Baltic, the impact of copepod grazers on the filamentous bloom-forming taxa has been claimed to be negligible (Sellner et ai, 1994). Neverthe-less, it cannot be completely ruled out that grazing has no effect on the seasonalityof the cyanoprokaryotes. In the present data, the occurrence of species withrestrictions as to grazing, i.e. mucilaginous colony structures or large size andknown potential toxicity, was most pronounced during periods when the zoo-plankton populations are normally most abundant (e.g. Viitasalo, 1992). Accord-ingly, the species most likely available for grazers, the small-celled, sphericalgomphosphaerioid colonies, reach their highest abundances during periods whenthe zooplankton populations are small.
Despite several potentially disturbing factors, CCA outlined the seasonalpattern of the different forms of cyanoprokaryotes well. Factors such as hori-zontal patchiness of the planktonic community and infrequent sampling couldhave attenuated the pattern now clearly visible in CCA (Figure 10A and B).Accordingly, some species, e.g. Cyanonephron sty hides and Sncwella litoralis,were slightly displaced in relation to other species of similar morpnology, but thisdid not dissipate the general pattern. These data present the events of 1 year only.The environmental conditions of each year account for the seasonal dynamics of
1400Downloaded from https://academic.oup.com/plankt/article-abstract/19/10/1385/1488683by gueston 16 February 2018

Cyanoprokaiyotes in the northern Baltic Sea
the cyanoprokaryotes and cause interannual variability. However, most of theinformation in the literature on the occurrence of different morphological formsof the cyanoprokaryotes refers to a somewhat similar distribution of thecyanoprokaryotes in time as the present study.
A purely exploratory approach does not set any expectations on the data. TheCCA has both explorative and confirmative features. The choice of the environ-mental factors for the analyses demands an underlying ecological theory anddirects the pure exploratory approach towards a confirmatory one (Oksanen,1988). In the present study, the importance of SiO4-Si for the cyanoprokaryoticcommunity, as depicted by the CCA analyses, emphasizes the importance ofknowing the ecological theory beyond the community changes. SiO4-Si does notdirectly affect the growth of the cyanoprokaryotes, but is effectively taken up bythe diatoms. The strong co-variation between the cyanoprokaryotes and SiO4-Siexhibited in these data does not represent a causal relationship, but rather anindependent correlation due to similar but independent variation of the SiO4-Siconcentrations and the cyanoprokaryote assemblage.
Acknowledgements
I am indebted to G.Cronberg and G.Hallfors who assisted in the species identifi-cation at the beginning of the study. I am also grateful to H.Kuosa and T.Tonteriwho gave valuable comments on the earlier drafts of the manuscript. The Tva'r-minne Zoological Station provided excellent working facilities, and the data onhydrography and nutrients were produced by M.Pokki and A.-M.Astrdm, fromthe station. They were, along with T.Sjdberg, also responsible for part of the sam-pling, and their help is greatly appreciated. Financial support was provided by theWater and Andr6e de Nottbeck Foundation and the Faculty of Science of the Uni-versity of Helsinki.
ReferencesAlasaarela,E. (1979) Phytoplankton and environmental conditions in central and coastal areas of the
Bothnian Bay. Ann. Bot. Fentu, 16, 241-274.Anagnostidis.K. and KomarekJ. (1985) Modern approach to the classification system of cyanophytes
1. Introduction. Arch. HydrobioL Algolog. Stud., 38/39, 291-302.AnagnostidisJC. and KomarekJ. (1988) Modern approach to the classification system of cyanophytes
3. Oscillatoriales. Arch. HydrobioL Algolog. Stud, 50/53, 327-472.Andersson^A., Haecky,P. and Hagstr6m,A. (1994) Effect of temperature and light on the growth of
micro-, nano and pico-plankton: impact on algal succession. Mar. BioL, 120, 511-520.Baltic Marine Environment Protection Commission (1988) Guidelines for the Baltic Monitoring Pro-
gramme for the Third Stage; Part D Biological Determinants. Baltic Sea Environment Proceedings,No. 27D, Helsinki.
Bratbak.G. and Thingstad.T.F. (1985) Phytoplankton-bacteria interactions: An apparent paradox?Analysis of a model system with both competition and commensalism. Mar. EcoL Prog. Ser., 25,23-30.
BruningJC, Lingeman,R. and RingelbergJ. (1992) Estimating the impact of fungal parasites onphytoplankton populations. LimnoL Oceanogr., 37,252-260.
Cronberg,G. (1984) Phytoplankton changes in Lake Trummen. Folia LimnoL Scand, 18,1-119.Cronberg.G. and Komaxek J. (1994) Planktic Cyanoprokaryotes found in South Swedish lakes during
the XDth international symposium on Cyanophyte research, 1992. Arch. HydrobioL Algolog. Stud,75,323-352.
1401Downloaded from https://academic.oup.com/plankt/article-abstract/19/10/1385/1488683by gueston 16 February 2018

MJ.Laamanen
El-Hag,A.G.D. and Fogg,G.E. (1986) The distribution of coccoid blue-green (Cyanobacteria) in theMenai Straits and the Irish Sea. Br. Phycol. J., 21,45-54.
Falkowski.P. (1984) Physiological responses of phytoplankton to natural light regimes. J. PlanktonRes., 6,295-307.
Furnas.M.J., Smayda,TJ. and Deason.E.A. (1986) Nitrogen dynamics in lower Narragansett Bay. 2.Phytoplankton uptake, depletion rates of nitrogenous pools, and estimates of ecosystem reminer-alisation. / Plankton Res., 8, 755-769.
Geitler.L. (1932) Cyanophyceae.—Rabenhorst's Kryptogamen-Flora von Deulschland, Osterrcichsund der Schwiez 12. Akademische Verlagsgesellschaft m. b. H., Leipzig, pp. 1-11%.
HaapalaJ. and Alenius,P. (1994) Temperature and salinity, statistics for the northern Baltic Sea1961-1990. Finn. Mar. Res., 262, 51-123.
Hahne.E. and MOlderJC. (1958) Planktologische Untersuchungen in der Pojo-Bucht und angrenzen-den GewSssern. III. Phytoplankton. Ann. ZooL Soc Fenn. Vanamo, 30,1-71.
Heiskanen,A.-S. and Kononen,K. (1994) Sedimentation of vernal and late summer phytoplanktoncommunities in the coastal Baltic Sea. Arch. HydrobioL, 131, 175-198.
Hela.I. (1952) Drift current and permanent flow. Comment. Phys. Math. Soc. Set Fenn,, 16,1-27.Holm,N.P., Ganf,G.G. and Shapiro^. (1983) Feeding and assimilation rates of Daphnia pulex fed on
Aphanizomenon flos-aquae. LimnoL Oceanogr., 28, 677-687.Huttunen,M. and KuparinenJ. (1986) Species succession and productivity of ultraphytoplankton in
the pelagic off TvSrminne, SW coast of Finland. Ophelia, (SnppL)4, 73- 83.Kahru,M. and N6mmann,S. (1990) The phytoplankton spring bloom in the Baltic Sea in 1985, 1986:
multitude of spatio-temporal scales. Com. Shelf Res., 10, 329-354.Kahru,M., LeppSnenJ.-M. and Rud,O. (1993) Cyanobacterial blooms cause heating of the sea
surface. Mar. Ecol. Prog. Ser., 101,1-7.Kahru,M., Horstmann.U. and Rud,O. (1994) Satellite detection of increased cyanobacterial blooms
in the Baltic Sea: Natural fluctuation or ecosystem change? Ambio, 23, 469-472.Kaneta.PJ., Levandowsky,M. and Esaias,W. (1985) Multivariate analysis of the phytoplankton com-
munity in the New York Bight. Mar. Ecol Prog. Ser., 23, 231-239.Kivi,K., Kaitala.S., Kuosaji., KuparinenJ., Leskinen,E., Lignell,R., Marcussen,B. and Tamminen,T.
(1993) Nutrient limitation and grazing control of the Baltic plankton community during annual suc-cession. Limnol. Oceanogr., 38, 893-905.
KomarekJ. (1994) Current trends and species limitation in the cyanoprokaryote taxonomy. Arch.Hydrobiol. Algolog. Stud., 75,11-29.
KomaiekJ. and Anagnostidis^C (1986) Modern approach to the classification system of cyanophytes2.—Chroococcales. Arch. HydrobioL Algolog. Stud, 43,157-226.
Koma>ek,J. and Anagnostidis.K. (1989) Modern approach to the classification system of cyanophytes4.—Nostocales. Arch. Hydrobiol. Algolog. Stud., 56, 247-345.
Komaikova'-Legnerova'.J. and Eloranta,P. (1992) Planktic blue-green algae (Cyanophyta) fromCentral Finland (JyvSskyla region) with special reference to the genus Anabaena. Arch. Hydrobiol.Algolog. Stud., 67,103-133.
Kononen.K. (1988) Phytoplankton summer assemblages in relation to environmental factors. KielerMeeresforsch. Sonderh., 6,281-294.
Kononen,K. and Nommann.S. (1992) Spatio-temporal dynamics of the cyanobacterial blooms in theGulf of Finland, Baltic Sea. In Carpenter,EJ., Capone,D. and RueterJ. (eds), Marine PelagicCyanobacteria: Tnchodesmium and Other Diazotrophs. Kluwer, Dordrecht, pp. 95-114.
Kononen.K., Lahdes,E. and GrSnlund.L. (1993) Physiological and community responses of summerplankton to nutrient manipulation in the Gulf of Finland (Baltic Sea) with special reference to phos-phorus. Sarsia, 78, 243-253.
KononenJC., KuparinenJ., MakelfiJC., LaanemetsJ. and PavelsonJ. (1996) Initiation of cyano-bacterial blooms in a frontal region at the entrance to the Gulf of Finland, Baltic Sea. LimnoLOceanogr., 41, 98-112.
Koroleff,F. (1979) The most common analysis methods for sea water. Meri, 7, 6-60 (in Finnish).KrerapinJD.W. and Sullivan,G.W. (1981) The seasonal abundance, vertical distribution and relative
microbial biomass of chroococcoid cyanobacteria at a station in Southern California coastal waters.Can. J. Microbiol, 87,1341-1344.
Kuosa,H. (1991) Picoplanktonic algae in the northern Baltic Sea: Seasonal dynamics and flagellategrazing. Mar. EcoL Prog. Ser, 73,269-276.
Lampert,W. (1977) Studies on the carbon balance of Daphnia pulex De Geer as related to environ-mental conditions. I. Methodological problems of the use of 14C for the measurement of carbonassimilation. Arch. HydrobioL, 48,310-335.
1402Downloaded from https://academic.oup.com/plankt/article-abstract/19/10/1385/1488683by gueston 16 February 2018

Cyanoprokaryotes in the northern Baltic Sea
LarsenJ., Kuosa,H., IkfivalkoJ., Kivi,K. and HSUfors,S. (1995) A redescription of Scrippsiella hangoei(Schiller) comb. nov.—a 'red tide' dinoflagellate from the northern Baltic. Phycologia, 34,135-144.
Lehtimaki j . , Sivonen.K., Luukkainen.R. and NiemelS.S.I. (1994) The effects of incubation time, tem-perature, light, salinity and phosphorus on growth and hepatotoxin production by Nodularia spumi-gena strains. Arch. Hydrobioi, 130,269-282.
Levander,K. (1915) Zur Kenntnis der Bodenfauna und des Planktons der Pojowiek. Fennia, 35,1-39.Lignell R., Heiskanen,A.-S., Kuosa^H., Gundersen.K., Kuuppo-Leinikki,P., Pajuniemi,R. and
Uitto,A. (1993) Fate of a phytoplankton spring bloom: sedimentation and carbon flow in the plank-tonic food web in the northern Baltic. Mar. EcoL Prog. Sen, 84, 121-131.
Margalef,R. (1978) Life-forms of phytoplankton as survival alternatives in an unstable environment.Oceanol. Acta, 1, 493-509.
Niemi,A. (1973) Ecology of phytoplankton in the TvSrminne area, SW coast of Finland. I. Dynamicsof hydrography, nutrients, chlorophyll a and phytoplankton. Acta Bot Fenn., 100,1-68.
Niemi,A. (1975) Ecology of phytoplankton in the TvSrminne area, SW coast of Finland. II. Primaryproduction and environmental conditions in the archipelago and the sea zone. Acta Bot. Fenn., 105,4-73.
Niemi,A. (1979) Blue-gTeen algal blooms and N:P ratio in the Baltic Sea. Acta Bot. Fenn., 110,57-61.Niemi A. and Astr6m,A.-M. (1987) Ecology of phytoplankton in the TvSrminne area, SW coast of
Finland. IV. Environmental conditions, chlorophyll a and phytoplankton in winter and spring 1984at Tvarminne Storfjard. Ann. Bot. Fenn., 24, 333-352.
OksanenJ. (1988) Impact of habitat, substrate and microsite classes on the epiphyte vegetation:Interpretation using exploratory and canonical correspondence analysis. Ann. Bot. Fenn., 25,59-71.
Oliver.R. (1994) Floating and sinking in gas-vacuolated Cyanobacteria. /. Phycol, 30, 161-173.Paerl,H. (1988) Nuisance phytoplankton blooms in coastal, estuarine, and inland waters. LitnnoL
Oceanogr., 33, 823-847.Probyn.T., Waldron,H. and JamesA- (1990) Size-fractionated measurements of nitrogen uptake in
aged upwelled waters: implications for pelagic food web structures. Limnol. Oceanogr., 35,202-210.Reynolds,C.S. (1980) Phytoplankton assemblages and their periodicity in stratifying systems. -
Holarct. EcoL, 3,141-159.Sellner,K.G., Olson,M.M. and Kononen.K. (1994) Copepod grazing in a summer cyanobacteria bloom
in the Gulf of Finland. Hydrobiologia, 292/293, 249-254.Tamminen.T., Kaitala.S., Kivi,K. and KuparinenJ. (1985) Response of a planktonic brackish water
community to single and combined additions of ammonium and phosphate in a factorial mesocosmexperiment. In GrayJ.S. and Christiansen,M.E. (eds), Marine Biology of Polar Regions and Effectsof Stress on Marine Organisms. John Wiley & Sons, Chichester, pp. 363-378.
Ter Braak.C.J.F. (1986) Canonical correspondence analysis: A new eigenvector technique for multi-variate analysis. Ecology, 67,1167-1179.
Ter Braak.CJ.F. (1987) The analysis of vegetation-environment relationships by canonical corre-spondence analysis. Vegetatio, 69, 69-77.
TilmanJD., Kilham.S.S and Kilham,P. (1982) Phytoplankton community ecology: The role of limitingnutrients. Annu. Rev. EcoL SysL, 13, 349—372.
Vanni^MJ. and TempteJ. (1990) Seasonal patterns of grazing limitation of phytoplankton in aeutrophic lake. LimnoL Oceanogr, 35, 698-709.
Viitasalo,M. (1992) Mesozooplankton of the Gulf of Finland and northern Baltic Proper—a reviewof monitoring data. Ophelia, 35,147-168.
Wallstrom.K. (1988) The occurrence of Aphanizomenon flos-aquae (Cyanophyceae) in a nutrientgradient in the Baltic. Kieler Meeresforsch. Sonderh., 6, 210-222.
WalsbyA-E. and Reynolds.C.S. (1980) Sinking and floating. In Morris,I. (ed.), The PhysiologicalEcology of Phytoplankton. Blackwell, Oxford, pp. 371-431.
Wetzel.R.G. (1983) Limnology. Saunders College Publishing, New York, p. 356.
Received on December 30,1996; accepted on May 16, 1997
1403Downloaded from https://academic.oup.com/plankt/article-abstract/19/10/1385/1488683by gueston 16 February 2018

Downloaded from https://academic.oup.com/plankt/article-abstract/19/10/1385/1488683by gueston 16 February 2018