environmental hazards: assessing risk and reducing...
TRANSCRIPT


The expanded fifth edition of Environmental Hazards provides a balanced overview of all the majorrapid-onset events that threaten people and what they value in the twenty-first century. It integratescutting-edge material from the physical and social sciences to demonstrate how natural and humansystems interact to place communities of all sizes, and at all stages of economic development, at risk.It also shows how the existing losses to life and property can be reduced. Part I of this establishedtextbook defines basic concepts of hazard, risk, vulnerability and disaster. Critical attention is givento the evolution of theory, to the scale of disaster impact and to the various strategies that have beendeveloped to minimise the impact of damaging events. Part II employs a consistent chapter structureto explain how individual hazards, such as earthquakes, severe storms, floods and droughts, plusbiophysical and technological processes, create distinctive patterns of loss throughout the world. Theways in which different societies make a positive response to these threats are placed in the contextof ongoing global change.
This extensively revised edition includes:
• An entirely new and innovative chapter explaining how modern-day complexity contributes tothe generation of hazard and risk
• Additional material supplies fresh perspectives on landslides, biophysical hazards and theincreasingly important role of global-scale processes
• The increased use of boxed sections allows a greater focus on significant generic issues and offersmore opportunity to examine a carefully selected range of up-to-date case studies
• Each chapter now concludes with an annotated list of key resources, including further reading andrelevant websites.
Environmental Hazards is a well-written and generously illustrated introduction to all the natural, socialand technological events that combine to cause death and destruction across the globe. It draws on thelatest research findings to guide the student from common problems, theories and policies to explorepractical, real-world situations. This authoritative – yet accessible – book captures both the complexityand dynamism of environmental hazards and has become essential reading for students of every kindseeking to understand the nature and consequences of a most important contemporary issue.
Keith Smith is Emeritus Professor of Environmental Science, University of Stirling, and a Fellow of theRoyal Society of Edinburgh.
Dave Petley is currently Wilson Professor of Hazard and Risk in the Department of Geography, andDeputy Dean, in the Faculty of Social Sciences and Health at Durham University.
ENVIRONMENTAL HAZARDS
FIFTH EDITION


ENVIRONMENTAL HAZARDS
Assessing risk and reducing disaster
F IFTH EDIT ION
Keith Smith and David N. Petley

First published 1991 by Routledge2 Park Square, Milton Park, Abingdon, Oxon, OX14 4RN
Simultaneously published in the USA and Canadaby Routledge
270 Madison Avenue, New York, NY 10016
Second edition 1996Third edition 2001
Fourth edition 2004, 2006, 2007 (twice)Transferred to digital printing 2008
Routledge is an imprint of the Taylor & Francis Group, an informa business
©1991, 1996, 2001, 2004 Keith Smith© 2009 Keith Smith and David N. Petley
All rights reserved. No part of this book may be reprinted or reproduced or utilised inany form or by any electronic, mechanical, or other means, now known or hereafterinvented, including photocopying and recording, or in any information storage or
retrieval system, without permission in writing from the publishers.
British Library Cataloguing in Publication DataA catalogue record for this book is available from the British Library
Library of Congress Cataloguing in Publication DataA catalog record for this book has been requested
ISBN 10: 0-415-42863-7 (hbk)ISBN 10: 0-415-42865-3 (pbk)ISBN 10: 0-203-88480-9 (ebk)
ISBN 13: 978-0-415-42863-7 (hbk)ISBN 13: 978-0-415-42865-1 (pbk)ISBN 13: 978-0-203-88480-5 (ebk)
This edition published in the Taylor & Francis e-Library, 2008.
“To purchase your own copy of this or any of Taylor & Francis or Routledge’scollection of thousands of eBooks please go to www.eBookstore.tandf.co.uk.”
ISBN 0-203-88480-9 Master e-book ISBN

CONTENTS
List of figures viiList of plates xiiiList of tables xvList of boxes xixPreface to the fifth edition xxiPreface to the first edition xxiiiAcknowledgements xxv
PART I THE NATURE OF HAZARD 1
1 HAZARD IN THE ENVIRONMENT 3
2 DIMENSIONS OF DISASTER 22
3 COMPLEXITY IN HAZARD AND DISASTER 38
4 RISK ASSESSMENT AND MANAGEMENT 50
5 REDUCING THE IMPACTS OF DISASTER 72
PART II THE EXPERIENCE AND REDUCTION OF HAZARD 103
6 TECTONIC HAZARDS: EARTHQUAKES 105
7 TECTONIC HAZARDS: VOLCANOES 133
8 MASS MOVEMENT HAZARDS 155
9 SEVERE STORM HAZARDS 181
10 BIOPHYSICAL HAZARDS 207
11 HYDROLOGICAL HAZARDS: FLOODS 232
12 HYDROLOGICAL HAZARDS: DROUGHTS 262
13 TECHNOLOGICAL HAZARDS 285
14 CONTEXT HAZARDS 313
15 POSTSCRIPT 336
Bibliography 340Index 378
CONTENTSv i

L IST OF F IGURES
1.1 Environmental hazards exist at the interface between the natural events system (extreme events) and the human use system (technology failures). 8
1.2 The relationship between environmental hazards and context hazards. 111.3 A spectrum of environmental hazards from geophysical events to human activities. 111.4 A simple matrix showing the theoretical relationships between physical exposure to
hazard (risk) and human vulnerability to disaster (insecurity). 111.5 Sensitivity to environmental hazard expressed as a function of the variability of annual
rainfall and the degree of socio-economic tolerance. 121.6 Theoretical relationships between the severity of environmental hazard, probability
and risk. 131.7 A schematic illustration of the chain of development of a drought disaster. 141.8 Some factors that divide the MDCs and the LDCs. 161.9 Socio-economic factors and fatality rates during flash floods in Nepal, July 1993. 192.1 The potential consequences of environmental hazards. 252.2 Annual total of global disasters 1900–2006. 272.3 The number of active volcanoes per year from 1790 to 1990. 272.4 Proportional variations in the disaster experience between countries of high, medium
and low human development 1992–2001. 302.5 The number of great natural catastrophes worldwide for the period 1950–2005. 302.6 World trend in economic losses from great natural disasters 1950–2005. 312.7 Property damage and loss of life in the continental United States due to tropical
cyclones during the twentieth century by decade. 322.8 Trends in the occurrence of natural disasters resulting in the deaths of more than
10,000 people from 1970 to 2004, grouped in five-year periods. 322.9 Overall trend in the occurrence of the number of fatalities and the number of people
affected by natural disasters through time. 332.10 A disaster impact pyramid. 37
3.1 The track of ‘Hurricane Mitch’ as it passed over Honduras, Nicaragua and Guatemala in October and November 1998. 39
3.2 The track of ‘Hurricane Felix’ as it passed over Honduras, Nicaragua and Guatemala in September 2007. 39
3.3 The DNA model of complexity in disaster causation. 433.4 A location map of the city of Bam, Iran. 443.5 The Swiss Cheese model of disaster causation. 484.1 Risk (Pf) plotted relative to benefit and grouped for various types of voluntary and
involuntary human activities involving exposure to hazard. 524.2 A probabilistic event tree for a hypothetical gas pipeline accident. 534.3 Generalised relationships between the magnitude and (A) the frequency and (B) the
return period for potentially damaging natural events. 554.4 The probability of occurrence of floods of various magnitudes during a period of
30 years. 564.5 Annual maximum wind gusts (knots) at Tiree, western Scotland, from 1927 to 1985. 574.6 The effects of a change to increased variability on the occurrence of extreme events. 584.7 The effects of a change to an increased mean value on the distribution of extreme
events. 594.8 Possible changes in human sensitivity to environmental hazard due to variations in
physical events and the extent of socio-economic tolerance. 594.9 The reduction of risk through pre-disaster protection and post-disaster recovery
activities. 654.10 The ALARP carrot diagram. 675.1 Energy release, in ergs on a logarithmic scale. 725.2 The percentage chance of survival against time for avalanche victims buried in the
snow. 745.3 The daily number of disaster victims attending hospitals in Guatamala City in relation
to the arrival of medical supplies and emergency hospitals. 745.4 A model of disaster recovery for urban areas. 755.5 The annual number of Presidential disaster declarations in the USA from 1953 to
2005. 765.6 The total humanitarian assistance released annually from DAC donors 1970–2003 at
2002 prices. 775.7 The slow accumulation of insured losses (US$ billion) following the Northridge
earthquake on 17 January 1994. 795.8 The effectiveness of deflecting dams in steering two snow avalanches, in 1999 and
2000, away from the small township of Flateyri, northwest Iceland. 865.9 A theoretical illustration of the resistance of an engineered building to wind stress
from various storm return intervals. 875.10 The involvement of various interest groups in hazard mitigation planning. 895.11 Evacuation map for Galle City, Sri Lanka. 905.12 A model of a well-developed hazard forecasting and warning system showing bypass
and feedback loops. 945.13 Debris flow hazard map of the alluvial fan at Llorts in the Pyrenean Principality of
Andorra. 98
L IST OF F IGURESv i i i

5.14 A portion of an Alquist–Priolo earthquake fault zone map in California showing part of the Concord fault. 100
6.1 World map showing the relationship between the major tectonic plates and the distribution of recent earthquakes and volcanoes. 107
6.2 Map showing the distribution of damage following the 1995 Kobe earthquake. 1096.3 Schematic illustrations of the four main types of earthquake waves. 1116.4 Map illustrating the Mt Huascarán rock avalanche disasters in the Peruvian Andes. 1166.5 The evolution of a typical tsunami wave. 1186.6 The relationship between earthquake intensity (Mercalli scale) and extent of damage
for different types of building construction. 1206.7 The effects of ground shaking on buildings and some construction methods adopted
for seismic resistance. 1226.8 Schematic depiction of tsunami engineering works. 1246.9 Examples of earthquake prediction in New Zealand. 1276.10 Earthquake hazard planning in the municipality of Ano Liossia, Athens, Greece. 1306.11 An example of coastal land-use planning for tsunami hazards. 1317.1 Section through a composite volcanic cone showing a wide range of possible hazards. 1357.2 The influence of distance on destructive volcanic phenomena. 1367.3 The distribution of extensive lahar deposits on the slopes of Merapi volcano, Java. 1417.4 Simplified map of the eastern edge of the fishing port of Vestmannaeyjar, Heimaey,
Iceland. 1447.5 Diagrammatic section of the tunnel system constructed at Kelut volvano, Java. 1457.6 A flow chart of a volcanic emergency plan. 1477.7 Schematic diagram of the stages of a generic volcanic-earthquake-swarm model. 1507.8 The island of Hawaii zoned according to the degree of hazard from lava flows. 1517.9 A map of volcanic hazards at Galeras volcano, Colombia. 1527.10 Volcanic hazards in the area around Mount St Helens, USA. 1538.1 Cumulative total number of fatalities from landslides in the period 2002 to 2007. 1568.2 The location of fatal landslides in 2005. 1568.3 The number of winter avalanche fatalities during the second half of the twentieth
century in the USA. 1578.4 Down-cutting by rivers, construction or in some cases even by glaciers can cause
landslides. 1618.5 The characteristic shape of a rotational landslide. 1628.6 A map showing the area of land that moved in the Vaiont landslide of 1963. 1658.7 Two highly characteristic types of snow-slope failure. 1678.8 Idealised slope section showing the methods available for avalanche hazard reduction. 1728.9 A map showing the form of the Tessina landslide in the Dolomites of Northern Italy. 1758.10 Avalanche hazard management as deployed on some mountain highways in the
western USA. 1768.11 The evolution of landslide risk in Hong Kong. 1789.1 The effects of ‘Hurricane Katrina’ in New Orleans during August 2005. 1859.2 The growth in the coastal population of Florida 1900–1990. 1879.3 Annual hurricane damage in the United States. 1879.4 World map showing the location and average annual frequency of tropical cyclones. 188
L IST OF F IGURES ix

9.5 A model of the areal (above) and vertical (below) structure of a tropical cyclone. 1899.6 The relationship between hurricane windspeeds and their destructive force compared
with a tropical storm. 1929.7 The insured losses (in Euros) from four severe European windstorms in 1990. 1959.8 Hurricane losses to residential structures in the south-east United States. 2009.9 The average annual accuracy of Atlantic hurricane forecasts. 203
10.1 The number of excess deaths recorded in France each day during the 2003 heatwave. 20910.2 Examples of spending on health provision by national governments as a percentage
of gross domestic product (GDP). 21110.3 The major modes of transmission for flaviviruses. 21510.4 Approximate worldwide distribution of dengue fever, yellow fever and West Nile
virus. 21710.5 The countries prone to malaria epidemics in Africa. 21810.6 The sources of wildfire ignition in two different regions. 22410.7 Pattern of seasonal wildfire occurrence in Australia. 22510.8 The Ash Wednesday bushfires of 16 February 1983 in south-eastern Australia. 22710.9 The relationship between length of residence in the North Warrendyte area, Victoria,
Australia. 22911.1 Approximate flood hazard thresholds as a function of depth and velocity of water flow. 23311.2 Types of flooding and their extent in Bangladesh. 23711.3 The physical causes of floods in relation to other environmental hazards. 23911.4 Direct annual flood damage (at 2006 US$ values) from rivers in the USA
1903–2006. 24311.5 The number of planning applications for residential and non-residential development
on floodplain land in England between the financial years 1996/97 and 2002/02. 24411.6 Schematic representation of river flow as a spatial hazard. 25011.7 Annual income from premiums and the expenditure in claims under the US National
Flood Insurance Program. 25111.8 Flood stages of the Mississippi river during July 1993. 25311.9 Idealised flood hydrographs inflowing and discharging from a reservoir. 25411.10 Simulated flood discharges on the upper Mississippi river during July 1993 in the
absence of reservoirs. 25511.11 Flood-proofed new residential buildings on an idealised floodplain. 25511.12 Adjustment to the flood hazard at Soldiers Grove, Wisconsin, USA. 25912.1 A classification of drought types based on defining components and hazard impacts. 26512.2 An idealised flow duration curve for a river. 26612.3 Examples of the areal extent and temporal duration of drought episodes in Australia. 26912.4 Annual corn yields in the United States 1960–89. 27012.5 The countries of the Sahel most affected by drought. 27312.6 Sahelian rainfall in the twentieth century. 27412.7 Reservoir storage and flow regulation alleviate the hydrological drought of 1976. 27912.8 Changes in water storage in reservoirs along the upper Tone river, Japan. 27913.1 The inverse relationship between the percentage failure rate of dams and the number
of newly constructed works. 291
L IST OF F IGURESx
13.2 Annual number of deaths from industrial accidents. 29213.3 The annual pattern of technological disasters across the world 1975–2005. 29513.4 Disaster preparedness in the lowest income quartile. 30613.5 Map of the detailed pre-incident layout of the Buncefield fuel site. 30913.6 Idealised risk contours establised through the land planning system around a typical
high-hazard chemical site in the UK. 31014.1 Idealised depiction of the two phases of the Walker circulation that make up the
Southern Oscillation pressure variation in the southern hemisphere. 31514.2 Relationships between strong El Niño events and epidemics of Ross River virus in
south-east Australia 1928–99. 31814.3 Variations in the North Atlantic Oscillation (NAO) index. 31914.4 Annual time series of the combined global land- and marine-surface temperature
record 1856–2002. 32114.5 Changes in flood frequency for the Richmond river, Lismore, Australia. 32214.6 The annual maximum flood series for the upper Mississippi river at St Paul 1893–2002. 32414.7 The potential spread of malaria (P. falciparum) risk areas. 32514.8 Growth in the annual number of people at risk from coastal flooding due to sea-level
rise 1990–2080s. 32714.9 Conceptual view of the oceanic ‘conveyor belt’. 328
L IST OF F IGURES x i


L IST OF PLATES
1.1 Slum shanty housing raised on stilts for flood protection from a polluted waterway in Jakarta, Indonesia. New office building behind emphasises the steep gradients in hazard vulnerability that exist in many cities in the LDCs. (Photo: Mark Henley, PANOS) 20
2.1 Extensive devastation at Aceh, northern Sumatra caused by the tsunami that affectedmuch of South Asia on 26 December 2004. Aceh was the closest landfall to the offshore earthquake and, in this area, only the mosque remained standing. (Photo: Dermot Tatlow,PANOS) 34
3.1 A young boy, with his siblings, cycles through a neighbourhood of Bam, Iran, severely damaged by the earthquake of December 2003. Thousands of adobe-built houses were destroyed and over 30,000 people were killed. (Photo: Shehzad Noorani/Majority World, STILL PICTURES) 45
4.1 Temporary shelters built on top of a house at Motihari, Bihar State, India during the 2007 South Asian floods. Many residents, with their livestock, took similar refuge following flash flooding caused by heavy monsoon rains that displaced over 12 million people from their homes in India alone. (Photo: Jacob Silberberg, PANOS) 60
5.1 The only house left standing in the Pascagoula neighbourhood of Mississippi, USA, after ‘Hurricane Katrina’. The owners had previously adopted hazard mitigation measures in 1999 aided by Increased Cost of Compliance Funds obtained through the National Flood Insurance Program. (Photo: Mark Wolfe, FEMA) 81
6.1 Widespread earthquake damage in Balakot, North West Frontier Province, Pakistan. The town was near the epicentre of the 7.6 magnitude earthquake that struck on 8 October, 2005, and killed over 70,000 people. (Photo: Chris Stowers, PANOS) 114
7.1 Lahar deposits of ash in a river valley following the volcanic eruption of Mount Pinatubo, Philippines, in 1991. Such accumulations of ash and silt can destroy buildings and can render agricultural land infertile for many years. (Photo: Mark Schlossman, PANOS) 140

8.1 A landslide on a road in central Taiwan caused by erosion exposing a plane of weakness in the rock mass. Note that the road has been protected using an avalanche shed, but the whole road has subsequently been destroyed by a debris flow induced by a typhoon. 161
8.2 The rolling landscape of North Island in New Zealand. The landscape here is a combination of old landslide scars, which form scoops in the hillside, and active shallow failures. The level of landslide activity in this environment has increased as a result of deforestation for sheep grazing. 163
9.1 Power company employees work to restore electricity supplies amid tornado damage in Lake County, Florida, USA. Several powerful tornadoes swept though this, and other areas, of central Florida in February 2007. (Photo: Mark Wolfe, FEMA) 193
10.1 An aerial view of suburban homes in Rancho Bernardo, California, USA, burned out by wildfires in October 2007. The urban–rural fringes of many cities with a Mediterranean type of climate are now threatened by these hazards. (Photo: Andrea Booher, FEMA) 222
11.1 A house floats in an irrigation ditch in Plaquemines County, Louisiana, USA, in October 2005. This was typical of the fate of homes ripped from their foundations, and then carried away, by the floods that followed ‘Hurricane Katrina’. (Photo: Andrea Booher, FEMA) 258
12.1 A goatherd climbs a tree in Rajasthan, India, during continuing drought conditionsin order to chop down fodder for her animals. When this photograph was taken in 2007, the drought had already lasted for eight years. (Photo: Robert Wallis, PANOS) 271
13.1 A government-funded helicopter drops water on a major warehouse fire in New Orleans, USA, during May 2006. Low water pressure and limited equipment available to the ground and fire boat crews already in attendance made this extra assistance necessary. (Photo: Marvin Nauman, FEMA) 303
14.1 Part of Southkhali village in the coastal Bagerhat District of Bangladesh. Suchlow-lying settlements face many hazards. These range from cyclones and land erosion to the longer-term threats posed by salinisation and rising sea levels. (Photo: Joerg Boethling, STILL PICTURES) 326
L IST OF PLATESx iv

L IST OF TABLES
1.1 The evolution of environmental hazard paradigms 41.2 Major categories of environmental hazard 101.3 Restoration of power supplies in Los Angeles following the Northridge earthquake
in 1994 151.4 Variations in vulnerability at the household level within less developed countries 172.1 Environmental disasters recorded since AD1000 responsible for at least 100,000 deaths 232.2 List of disaster types and sub-types recorded in EM-DAT 262.3 The number of natural disasters and the number of people killed in them between
1900 and 2006, according to the CRED database 282.4 The total number of disasters, people killed and economic damage in three different
disaster databases for four countries 294.1 Basic elements of quantitative risk analysis 544.2 Some major differences between risk assessment and risk perception 614.3 Twelve factors influencing public risk perception with some examples of relative safety
judgements 645.1 The world’s ten costliest natural disasters (values in million US$) 825.2 Global costs of great natural catastrophes by decade from 1950 to 2005 in relation to
the insured losses 835.3 The proportion of residents in the San Francisco Bay Area of California taking selected
loss-reducing actions within the home before and after newspaper publicity about increased earthquake risk 92
6.1 The proportion of agricultural assets destroyed by the 1993 Mahrashtra earthquake 1056.2 The ten largest earthquakes in the world since 1900 1076.3 Annual frequency of occurrence of earthquakes of different magnitudes based on
observations since 1900 1086.4 Worldwide recorded fatalities from tsunamis 1995–2007 1176.5 The number of people who survived after being rescued from collapsed buildings,
by day of rescue, following the Kobe earthquake on 17 January 1995 118

6.6 Earthquake safety self-evaluation checklist 1256.7 Loma Prieta earthquake losses by earthquake hazard 1307.1 Best estimates of the human impacts of volcanic hazards in the twentieth century 1347.2 Selected criteria for the Volcanic Explosivity Index (VEI) 1377.3 Precursory phenomena that may be observed before a volcanic eruption 1498.1 Classification of landslides 1598.2 Relationships between impact pressure and the potential damage from snow
avalanches 1688.3 Vegetation characteristics in avalanche tracks as a rough indicator of avalanche
frequency 1788.4 The Swiss avalanche zoning system 1799.1 Severe storms as compound hazards showing major characteristics and impacts 1829.2 The world’s ten deadliest tropical cyclones in the twentieth century 1839.3 The Saffir/Simpson hurricane scale 1869.4 The Fujita scale of tornado intensity 1929.5 Numbers of people killed and evacuated during tropical cyclone emergencies in
Bangladesh during the 1990s 19910.1 Flaviviruses important for human disease 21510.2 The twelve Californian fires most damaging to built structures 22311.1 The percentage of flood disasters recorded by continent showing the relative
incidence of flood-related deaths and other impacts over the period 1900–2006 23311.2 Preliminary estimates of the direct damage costs and the reconstruction costs
following major floods in Mozambique in 2000 24611.3 Funding allocated for reconstruction aid after flooding in the Sudan in 1988 24611.4 Estimate of the reduction in flood losses due to levees and dams on the Mississippi
and Missouri rivers during the 1993 floods 25411.5 Numbers of flood victims rescued by air and boat in the Mozambique floods of 2000 25611.6 Fact file on the post-1993 flood relocation of Valmeyer, Illinois 26012.1 Major droughts and their impact in Australia 26812.2 Adoption of non-agricultural adjustments to drought by households in Bangladesh 28012.3 Global monitoring and warning for drought and food shortages 28113.1 Some early examples of technological accidents 28613.2 Simplified minimum criteria for the mandatory notification by an EU Member
State of a ‘major accident’ to the European Commission 28713.3 The international nuclear event scale 28813.4 The ten deadliest transport, industry and miscellaneous accidents 29413.5 Accidents involving the transportation of hazardous materials in the USA,
1971–91 29713.6 Annual death toll, averaged over the 1970–85 period, due to natural (N) and
man-made (M) disasters for the world, North America and Europe 29813.7 Deaths per 109 kilometres travelled in the UK 29913.8 Technological disasters causing deaths in the UK during the last quarter of the
twentieth century 30814.1 The world regions most vulnerable to coastal flooding due to future sea level rise 32814.2 The effects of large explosive volcanic eruptions on weather and climate 331
L IST OF TABLESxv i

14.3 Some known impact craters ranked by age (millions of years before the present) 33314.4 The likely energy release, environmental effects and possible fatality rates for different
scales of extraterrestrial impacts on Earth 334
L IST OF TABLES xv i i


L IST OF BOXES
1.1 Paradigms of hazards 51.2 Variations in vulnerability to disaster 162.1 Types of disaster impact 252.2 Disaster fatalities 283.1 Complexity and chaos 423.2 Reason’s Swiss Cheeses model 484.1 Quantitative risk assessment 544.2 The ALARP principle 674.3 Information technology and disaster management 685.1 Advantages and disadvantages of commercial insurance 825.2 Avalanche deflecting dams in Iceland 855.3 Changing vulnerability into resilience 905.4 Debris flow hazard zoning in the Pyrenees 985.5 Earthquake hazard zoning in California 996.1 The modified Mercalli earthquake intensity scale 1106.2 Ground-shaking in earthquakes 1126.3 Problems of aid delivery in the aftermath of a major earthquake 1146.4 Earthquake safety and buildings 1217.1 Emergency response in Montserrat following the volcanic disater starting in 1995 1427.2 Crater-lake lahars in the wet tropics 1457.3 Some precursors of volcanic eruption 1498.1 The Vaiont landslide 1658.2 How snow avalanches start 1678.3 The Vargas landslides 1698.4 The Tessina landslide warning system 1749.1 ‘Hurricane Katrina’: lessons for levees and for lives 1849.2 How tropical cyclones form and develop 1909.3 The dream of severe storm suppression 198

9.4 Improving hurricane evacuation in the United States 20410.1 Diseases and disasters 21210.2 The emerging flaviviruses 21511.1 Flood management on the Yangtze River, China 23411.2 Flood-intensifying conditions 24011.3 The levee effect 24411.4 Floods in England: the summer of 2007 24711.5 The National Flood Insurance Program in the USA 25112.1 The relationships between drought and famine 26312.2 Drought in Australia 26912.3 Drought in the African Sahel 27313.1 The safety of dams 29013.2 The disaster at Bhopal, India 29213.3 The growth of industrial hazards 29613.4 The disaster at Chernobyl, Ukraine 30013.5 Technological risk regulation in the UK and the Buncefield explosions 30814.1 Climate change, climate variability and global warming 320
L IST OF BOXESxx

PREFACE TO THE F IFTH EDIT ION
It is now almost twenty years since the first edition of Environmental Hazards was published. During thatperiod, our understanding of the environment and its associated hazards has improved significantly.However, such advances have not always resulted in the direct application of useful knowledge and theeffective reduction of disaster impacts. The theoretical base may be stronger than ever before, andincreasingly sophisticated tools for hazard monitoring and risk communication are certainly available, butthe financial resources and the political determination that is needed for a successful confrontation of hazardsis all too often lacking.
The world still expresses surprise and dismay when events like the Indian Ocean tsunami (2004),‘Hurricane Katrina’ (2005) and the Myanmar cyclone (2008) inflict so much death and destruction on suchwidely separated places. As the Third Millennium unfolds, there is a growing awareness that environmentalhazards not only remain an important threat but that they are also rarely capable of simple solutions. Thepresent-day incidence and scale of hazards and disasters reflects complex ongoing processes of global change.Many of the trends observed today – climate change, population growth, resource depletion, globalisationand the spread of material wealth – contribute in some way to the toll of disaster on people and what theyvalue. This applies to all nations, irrespective of their state of human and economic development althoughit is the poorest nations, and the most disadvantaged people, who are most vulnerable.
Environmental Hazards continues to be an introductory textbook concerned with the physical and humanprocesses that either create or amplify certain hazards and disasters. The book explains the various actions– ranging from structural intervention to socio-economic policies – that are required to alleviate the mostserious consequences of such phenomena. It was realised from the outset that an account restricted to rapid-onset natural hazards was insufficient and technological hazards have always been included. Throughout,an attempt has been made to provide an up-to-date and balanced overview of the field by drawing on multi-disciplinary sources. As the study of hazards has developed, so new subject material has claimed its rightfulplace and the scope of the book has widened. Environmental hazards have emerged as more than site-specific, or community-specific, threats originating from a local source. They demand to be placed withina framework of much larger, sometimes global-scale, processes. Consequently, it has become progressivelymore difficult for a single author to survey the whole field. This new edition benefits greatly from agenuinely shared approach to the task. As co-authors we take joint responsibility for the content of this

book but it has been convenient to allocate the lead input for individual chapters as follows: Chapters 1,5, 7, 9, 10, 11, 12 and 13 – KS; Chapters 2, 3, 4, 6, 8, 14 and 15 – DNP. At the same time, both authorshave tried to resist the many temptations to broaden the scope of enquiry beyond the original underlying‘environmental’ remit and so create a truly unmanageable task for ourselves and for the reader.
The basic structure of the book will be familiar to existing users but the content has been substantiallyrewritten and extended for this edition in order to capture new insights and accommodate changingrequirements. The most obvious innovation is an entirely new chapter on ‘complexity’ that aims to addressthe many physical and human interactions that take place within the wider conceptual canvas mentionedabove and which also contribute to the difficulties of practical disaster reduction. There are more casestudies, often contained in text boxes, than in previous editions. These are supported by a greater numberof diagrams, tables and photographs in order to give a better illustration of real-world examples. We havealso sought to achieve better cross-referencing of material across the entire text. A selection of websites isprovided, together with an extensively revised bibliography, to guide students of every kind through theincreasingly daunting maze of information about hazards and disasters that lies beyond the confines of thisbook.
David Petley, DurhamKeith Smith, Braco, Perthshire
May 2008
PREFACE TO THE F IFTH EDIT IONxx i i

PREFACE TO THE F IRST ED IT ION
This book has been written primarily to provide an introductory text on environmental hazards foruniversity and college students of geography, environmental science and related disciplines. It springs frommy own experience in teaching such a course over several years and my specific inability to find a reviewof the field which matches my own priorities and prejudices. I hope, therefore, that this survey will proveuseful as a basic source for appropriate intermediate to advanced undergraduate classes in British, NorthAmerican and Antipodean institutions of higher education. If it encourages some students to pursue moreadvanced studies, or provides a means whereby other readers become more informed about hazardology,either as policy-makers or citizens, then I will be well satisfied. Without a wider appreciation of the factorsunderlying the designation by the United Nations of the 1990s as the International Decade for NaturalDisaster Reduction (IDNDR), the important practical aims of the Decade to improve human safety andwelfare are unlikely to be achieved.
The term ‘environmental hazards’ defies precise definition. Not everyone, therefore, will endorse eithermy choice of material or its treatment in terms of the balance between physical and social science concepts.In this book, the prime focus is on rapid-onset events, from either a natural or a technological origin, whichdirectly threaten human life on a community scale through acute physical or chemical trauma. Such eventsare often associated with economic losses and some damage to ecosystems. Most disaster impact arises from‘natural’ hazards and is mainly suffered by the poorest people in the world. Within this context, myintention, as expressed in the sub-title, has been to assess the threat posed by environmental hazards as awhole and to outline the actions which are needed to reduce the disaster potential.
The structure of the book reflects the need to distinguish between common principles and theirapplication to individual case studies. Part I – the nature of hazard – seeks to show that, despite theirdiverse origins and differential impacts, environmental hazards create similar sorts of risks and disaster-reducing choices for people everywhere. Here the emphasis is on the identification and recognition ofhazards, and their impact, together with the range of mitigating adjustments that humans can make. Theseloss-sharing and loss-reducing adjustments form a recurring theme throughout the book. In Part II – theexperience and reduction of hazard – individual environmental threats are considered under five maingenetic headings (seismic hazards, mass movement hazards, atmospheric hazards, hydrologic hazards and

technologic hazards). In this section the concern is for the assessment of specific hazards and the contributionwhich particular mitigation strategies either have made, or may make, to reducing the losses of life andproperty from that hazard.
Keith SmithBraco, Perthshire
July 1990
PREFACE TO THE F IRST ED IT IONxx iv

ACKNOWLEDGEMENTS
This book could not have been completed without generous assistance from many sources. Over the years,the universities of Stirling and Durham have supplied necessary research facilities to the authors and, onoccasion, have released us from other duties in order to further our understanding of environmental hazardsin many parts of the world.
A special debt is owed to Bill Jamieson, cartographer in the School of Biological and EnvironmentalSciences at Stirling, who prepared most of the diagrams for this edition, as well as for previous versions,with great skill. The remainder of the diagrams were skilfully crafted by the staff of the DurhamCartographic Unit. As always, Routledge’s London office has exercised a highly professional blend ofpractical advice and general encouragement; this time we wish to thank Andrew Mould and his team,including Jennifer Page and Michael P. Jones for keeping us on the straight and narrow. KS continues todedicate the book to his wife, Muriel, in sincere, if inadequate, recognition of her long-standing support.
The raw material has come from an ever-widening group of sources. Some have been especially fruitful;notably the disaster database maintained by the Centre for Research on the Epidemiology of Disasters(CRED) at the University of Louvain, the annual World Disasters Reports published by the InternationalFederation of Red Cross and Red Crescent Societies (IFRCRCS) in Geneva and various organisations inthe USA, such as the United States Geological Survey (USGS) and the Federal Emergency ManagementAgency (FEMA), that place a wealth of information in the public domain. The authors and the publisherwould like to thank the following learned societies, editors, publishers, organisations and individuals forpermission to reprint, or reproduce in modified form, copyright material in various figures and tables asindicated below. Every effort has been made to identify, and make an appropriate citation to, the originalsources. If there have been any accidental errors, or omissions, we apologise to those concerned.
LEARNED SOCIET IES
American Association for the Advancement of Science for Figure 4.1 from Science by C. Starr.
American Geophysical Union for Table 6.7 from EOS by T. L. Holzer, Table 7.2 from Journal of GeophysicalResearch by C. G. Newhall and S. Self and Table 14.2 from Reviews of Geophysics by A. Robock.

American Meteorological Society for Figs 9.2 and 9.3 from Weather and Forecasting by Pielke. R. A. Jr. andC. W. Landsea.
American Planning Association for Figure 11.12 from the Journal by E. David and J. Meyer.
Institute of Foresters of Australia for Figure 10.8 from Australian Forestry by A. Keeves and D. R. Douglas.
International Glaciological Society for Figure 5.8 from Annals of Glaciology by T. Jóhannesson.
Oceanography Society for Figure 14.9 from Oceanography by W. S. Broecker.
The Geographical Association for Figure 2.6 from Geography by M. Degg.
The Geological Society Publishing House for Table 14.3 from Meteorites: Flux with Time and Impact Effectsby R. A. F. Grieve.
The Royal Society of London for Table 13.6 from Risk: Analysis, Perception and Management by D. Cox et al.
PUBLISHERS
Academic Press, Orlando, for Figure 7.10A from Volcanic Activity and Human Ecology by P. D. Sheets andD. K. Grayson (eds).
Australian Government Publishing Company, Canberra, for Figure 10.7 from Bushfires in Australia by R. H. Luke and A. G. McArthur.
Blackwell Publishers for Figure 9.1 in Geology Today by T. Waltham, Figure 10.1 in Risk Analysis byPoumadère et al., Table 6.1 in Disasters by S. Parasuraman and Table 13.7 in Professional Geographer by S. L. Cutter and M. Ji.
Cambridge University Press for Figure 1.6 from The Business of Risk by P .G. Moore and Figure 14.2 fromHuman Frontiers, Environments and Disease; Past Patterns, Uncertain Futures by T. McMichael.
Centre for Research on the Epidemiology of Disasters, Louvain for Figures 2.2, 2.4, 2.8, 2.9 and 13.3.
Commonwealth of Australia, Canberra for Figure 12.3 from Bureau of Meteorology website.
Controller of Her Majesty’s Stationery Office, London for Figures 13.5 and 13.6.
Elsevier for Figures 6.2 from Journal of Hazardous Materials by S. Menoni, 6.10 from Engineering Geologyby P. Marinos et al., 5.13 from Geomorphology by Hürlimann et al., 7.2 from Environmental Hazards by Chester D. K. et al., 7.3 from Journal of Volcanology and Geothermal Research by F. Lavigne et al., 7.9 fromJournal of Volcanology and Geothermal Research by A. D. H. Artunduaga et al., 8.10 from Cold Regions Scienceand Technology by R. Rice Jr., 9.8 from Reliability Engineering and System Safety by Z. Huang et al., 10.4 fromJournal of Infection by T. Solomon and M. Mallewa and The Lancet Infectious Diseases by G. L. Campbell et al., 10.6A from Global Environmental Change B by A. Badia et al., 10.9 from Fire Safety Journal by J. Beringer, 11.5 from Applied Geography by Pottier et al. and Tables 7.1 from Journal of Volcanology andGeothermal Research by Witham, 14.1 from Global Environmental Change by R. J. Nicholls et al.
S. Karger AG, Basel, for Fig 5.3 from Epidemiology of Natural Disasters by J. Seaman, S. Leivesley and C. Hogg.
ACKNOWLEDGEMENTSxxv i
Kluwer Academic Publishers, Dordrecht, for Figure 6.11 from Tsunamis: their Science and Engineering by K. Iida and T. Iwasaki (eds).
MIT Press, Cambridge, Mass. for Figure 5.4 from Reconstruction following Disaster by J. E. Haas, R. W.Kates and M. J. Bowden.
Osservatorio Vesuviano in co-operation with the United Nations IDNDR Secretariat for Table 4.4 fromSTOP Disasters by G. Wadge.
Oxford University Press, New York, for Figure l.1 from The Environment as Hazard by I. Burton, R. W. Kates and G. F. White.
Plenum Publishing Company for Table 13.5 from Risk Analysis by A. F. Fritzsche.
Springer-Verlag, Berlin for Figures 5.10 and 7.7 from Monitoring and Mitigation of Volcanic Hazards by D. W. Peterson and S. R McNutt.
Thomas Telford Publishing for Figure 6.6 and Table 1.3 from Megacities: Reducing Vulnerability to NaturalDisasters by Institution of Civil Engineers.
J. Wiley and Sons, Chichester, for Figure 9.6 from Hurricanes: Their Nature and Impacts on Society by Pielke, R. A. Jr and Pielke, R. A. Sr.
ORGANISATIONS
Alexander Howden Group and the Institution of Civil Engineers for Figure 6.6.
California Seismic Safety Commission for Table 6.6 from California at Risk by W. Spangle and AssociatesInc.
Centre for Resource and Environmental Studies, Australian National University, Canberra, for Figure 14.5from Flood Damage in the Richmond River Valley NSW by D. I. Smith et al.
Colorado Avalanche Information Center for Figure 8.3.
Federal Emergency Management Agency for Figure 5.5.
Illinois State Water Survey for Figure 11.8 from The 1993 Flood on the Mississippi River in Illinois by N. G. Bhowmik.
Munich Re Insurance Company, Munich, for Figures 2.5, 2.6, 5.7 and 9.4.
United Nations for Table 4.4 from STOP Disasters by G. Wadge.
United Nations Environment Programme, Nairobi, for Figure 2.3 from Environmental Data Report.
United States Geological Survey, Denver, Colorado for Figure 11.10 from Effects of Reservoirs on FloodDischarges on the Kansas and Missouri River Basins (Circular No. 1120E) by C. A. Perry.
United States Geological Survey, Virginia, for Figure 7.10B from The 1980 Eruptions of Mount St. Helensby C. D. Miller, D. R. Mullineaux and D. R. Crandell.
United States Geological Survey for Figures 6.5 and 14.6.
ACKNOWLEDGEMENTS xxv i i

University of Toronto Department of Geography for Figure 1.5 from The Hazardousness of a Place by K. Hewitt and I. Burton.
University of Toronto, Institute of Environmental Studies, for Tables 4.1 and 4.3 from Living with Risk:Environmental Risk Management in Canada by I. Burton, C. D. Fowle and R. J. McCullough (eds).
The World Bank for Table 11.3 from Managing Natural Disasters and the Environment by J. Brown and M. Muhsin.
INDIVIDUALS
D. Atkins, Colorado Avalanche Information Center, for Figure 5.2.
Professor R. G. Barry, University of Colorado, for Figure 9.5.
Professor A. Bernard, Free University of Brussels, for Figure 7.5.
D K. R. Berryman, DSIR, Wellington for Figure 6.9.
H. Brammer, Hove, for Figure 11.2.
Dr W. S. Broecker, Columbia University, Palisades, New York, for Figure 14.9.
Dr W. Bryant, California Geological Survey, Sacramento, CA., for Figure 5.14.
Professor R. J. Chorley, formerly of Cambridge University, for Figure 9.5.
Dr D. R. Crandell, US Geological Survey, Denver, for Figure 7.10A.
Dr J. de Vries, University of California, Berkeley, for Figure 4.8.
Dr D. R. Donald, US Department of Agriculture, for Figure 12.4.
Dr D. J. Gilvear, Stirling University, for Figure 12.7.
Professor G. W. Housner, California Institute of Technology, for Figure 6.1.
Professor M. Hulme, University of East Anglia, for Figure 12.6.
Professor P. D. Jones, University of East Anglia, for Figure 14.4.
Professor R. W. Kates, Clark University, for Figure l.7.
Dr A. Malone, University of Hong Kong, for Figure 8.11.
Professor P. G. Moore, London Graduate School of Business Studies, for Figure l.6.
Dr R. J. Nicholls, Middlesex University, for Figure 14.8.
T. Omachi, Infrastructure Development Institute, Japan, for Figure 12.8.
Dr T. Osborn, University of East Anglia, for Figure 14.3.
Dr R. A. Pielke Jr, National Center for Atmospheric Research, Boulder, Co., for Figure 2.7 from Stormsby R. A. Pielke Jr and R. A. Pielke Sr.
ACKNOWLEDGEMENTSxxv i i i

Dr A. Rietveld, World Health Organisation, Geneva, for Figure 10.5.
Dr D. Ruatti, International Atomic Energy Authority, Geneva, for Table 13.2.
Marjory Roy, formerly Meteorological Office, Edinburgh, for Figure 4.5.
Dr D. I. Smith, Australian National University, for Figure 14.5.
Dr W. D. Smith, DSIR, Wellington, for Figure 6.9.
Dr J. C Villagrán de León, United Nations University for Figure 5.11.
Dr J. Whittow, Reading University, for Figure 6.4.
ACKNOWLEDGEMENTS xx ix

Part I
THE NATURE OF HAZARD
‘We have met the enemy and it is us’Attributed to Walter Kelly


INTRODUCTION
In the early twenty-first century, the earth supportsa human population that is more numerous and –generally – healthier and wealthier than ever before.At the same time, there is an unprecedented aware-ness of the risks that face people and what theyvalue. Some of this concern is associated with thedeath and destruction caused by ‘natural’ hazardslike earthquakes and floods. Other anxieties focuson threats that originate in the built environmentlike industrial accidents and other failures of tech-nology that are seen as ‘man-made’. In addition,there are concerns about individual ‘lifestyle’ risks,like smoking cigarettes and food safety, togetherwith global-scale dangers, like climate change andterrorism.
An apparent paradox exists between relentlesshuman progress and these increased feelings ofinsecurity. This is because economic developmentand environmental hazards are rooted in the sameongoing processes of change. As the world popu-lation grows, so more people are exposed to hazard.As people become more prosperous, particularly inthe ‘developed’ countries, so greater personal andcorporate wealth is at risk. As agriculture intensifiesand urbanisation spreads, so more complex andexpensive infrastructure is exposed to potentially
damaging events and the threat of large-scale losses.These trends, underpinned by high per capita levelsof human consumption, impose heavy burdens onprecious natural assets, such as land, forests andwater, and also raise fears about environmentalquality. The risks of modernisation are oftendifferent in the ‘less developed countries’. Here, thevast majority of the world’s population alreadyexperiences an insecure existence because of povertyand a dependence on a resource base so degradedthat lives and livelihoods are highly vulnerable to‘natural’ hazards and other damaging forces.
The power of modern communications, especiallynon-stop news coverage, means that the results ofhazardous processes feature regularly on radios, innewspapers and on television screens throughout theworld as the latest disaster is reported. Despite – orperhaps because of – this constant flow of infor-mation, it is difficult to make objective assessments.Is the world really becoming a more dangerousplace? If so, what is the cause? Why are evenadvanced nations still vulnerable to some naturalprocesses? What is a disaster? Why do disasters killmore people in poor countries? What are the bestmeans of reducing the impact of hazards anddisasters in the future?
It is impossible to live in a totally risk-freeenvironment. We all face some degree of risk each
1
HAZARD IN THE ENVIRONMENT

day, whether it is to life and limb in a road accident,to our possessions from theft or to our personal spacefrom noise or other types of pollution. Some of thesethreats are ‘chronic’ or routine. They are rarely thedirect and immediate cause of large-scale deaths anddamages. This book is about the more ‘extreme’threats and the resulting global ‘disasters’ that haveclear ‘environmental’ links. These terms and con-cepts are explained and defined in this chapter.
CHANGING PERSPECT IVES
Our understanding of hazards and disasters haschanged markedly through history. A concern forearthquake and famine began in the earliest times(Covello and Mumpower, 1985). In the past, greatcatastrophes were seen as ‘Acts of God’. Thisperspective viewed damaging events as a divinepunishment for moral misbehaviour, rather than aconsequence of human use of the earth. It generallyencouraged an acceptance of disasters as external,
inevitable events although, in some cases – like thatof frequently flooded land – communities began toavoid such sites. Eventually, more organisedattempts were made to limit the damaging effectsof natural hazards, an approach that led to theearliest of the four hazard paradigms recognised inTable 1.1.
The engineering paradigm originated with the firstriver dams constructed in the Middle East over4,000 years ago whilst attempts to defend buildingsagainst earthquakes date back at least 2,000 years.The growth of the earth sciences and civilengineering during the following centuries led toincreasingly effective structural responses designedto control the damaging effects of certain physicalprocesses. By the end of the nineteenth century newmeasures, like weather forecasting and severe stormwarnings, could also be deployed. This approach isbased on making all built structures sufficientlystrong to withstand a direct hazard confrontation.It is largely undertaken with the aid of science-basedgovernment agencies and remains important today.
THE NATURE OF HAZARD4
Table 1.1 The evolution of environmental hazard paradigms
Period Paradigm name Main issues Main responses
Pre-1950 Engineering What are the physical causes for Scientific weather forecasting and the magnitude and frequency of large structures designed and built natural hazards at certain sites to defend against natural and how can protection be hazards, especially those of provided against the most hydro-meteorological origindamaging consequences?
1950–70 Behavioural Why do natural hazards create Improved short-term warning and deaths and economic damage in better longer-term land planning so the MDCs and how can changes that humans can avoid the sites in human behaviour minimise risk? most prone to natural hazards
1970–90 Development Why do people in the LDCs suffer Greater awareness of human so severely in natural disasters and vulnerability to disaster and an what are the historical and current understanding of how low socio-economic causes of this situation? economic development and
political dependency contribute tovulnerability
1990– Complexity How can disaster impacts be More emphasis on the complicated reduced in a sustainable way in the interactions between nature and future, especially for the poorest society leading to the improved people in a rapidly changing world? long-term management of hazards
according to local needs

Before the mid-twentieth century, there waslimited understanding of the interactions betweenenvironmental hazards and people. The behaviouralparadigm originated with Gilbert White (1936,1945), an American geographer who saw thatnatural hazards are not purely physical phenomenaoutside of society but are linked to countlessindividual decisions to settle and develop hazard-prone land. He introduced a social perspective(human ecology) and started to question whethertruly ‘natural’ hazards really exist. This approachlater embraced ‘man-made’ or technological hazardsand retained an emphasis on the more developed
countries (MDCs). It eventually produced a blendedapproach whereby earth scientists continued toinvestigate extreme natural events, and engineersbuilt structures designed to control the mostdamaging forces, whilst social scientists explored awider agenda of disaster reduction through humanadjustments, such as disaster aid and better landplanning (Box 1.1). This hazards-based viewpointbecame widely accepted and was summarised inseveral books from the North American researchschool (White, 1974; White and Haas, 1975;Burton et al., 1978 – updated 1993).
HAZARD IN THE ENVIRONMENT 5
The dominant (behavioural) paradigm
Environmental hazards are open to many inter-pretations. The greatest divisions in the past havearisen between the more practical behaviouralparadigm, favoured by many government bodiesand operated through technical agencies, and themore theoretical development paradigm adoptedby some social scientists.
The behavioural paradigm
Modern environmental engineering began in theUSA to serve a generation newly aware of theperils of soil erosion and floods. Following the1936 Flood Control Act, the US Army Corps ofEngineers began to construct an ambitious set offlood control works on the premise that geo-physical extremes were the cause of disaster andthat the physical control of floods, together withother natural events, would provide an effectivecure. Such goals appeared to be attainable duringthe 1930s and 1940s based on growing confidence
in the relevant scientific fields (meteorology,hydrology), demands for greater development ofnatural resources and the availability of capital formajor public works.
Around the same time, Gilbert White arguedthat flood control works should be integrated withnon-structural methods to produce more compre-hensive floodplain management. This view recog-nised the role played by human actions andsettlement in exacerbating hazards. For example,in the industrialised countries the existing urbandevelopment at risk on flood-prone land wasblamed on ‘behavioural’ faults, including a mis-perception of risks, by flood control authoritiesand homeowners alike. Within the developingcountries, other forms of seemingly irrationalbehaviour, such as deforestation or the over-grazing of land, by ‘folk’ societies, were thoughtto contribute to disaster. The universal conse-quence of disaster was believed to be a temporarydisruption of ‘normal’ life.
Based on this diagnosis, a solution was soughtin applied science and technology through the‘technical fix’ methodology. It was believed that,in the fullness of time, the transfer of technology
Box 1.1
PARADIGMS OF HAZARD

THE NATURE OF HAZARD6
from the developed to the developing world, aspart of an overall modernisation process, wouldsolve their problems too. This emphasis producedcentralised organisations because only government-backed bodies possessed the financial resources andtechnical expertise needed to apply science on thescale deemed necessary. The United Nations, inparticular, sprouted a number of agencies respon-sible for international disaster mitigation.
According to Hewitt (1983), the behaviouralparadigm has three thrusts:
• Despite some acknowledgement of the role ofhuman perception and behaviour, the main aimwas to contain the extremes of nature throughenvironmental engineering works, such as flood embankments and earthquake-proofedbuildings.
• Other measures included field monitoring andthe scientific explanation of geophysical pro-cesses. The modelling and prediction of damag-ing events was aided by the use of advancedtechnical tools, e.g. remote sensing and tele-metry.
• Priority was given to disaster plans and emer-gency responses, mostly operated by the armedforces. The notion that only a military-styleorganisation could function in a disaster areawas attractive to governments because itemphasised the authority of the state when re-imposing order on a devastated community.
This paradigm covers many methods of practicalloss reduction. It remains dominant in somecountries but has been described as an essentiallyWestern interpretation. Critics of this approachsee it as a materialistic and deterministic approachthat reflects undue faith in technology andcapitalism and leads to ‘quick fix’ remedies. It hasalso been faulted for over-emphasizing the role ofindividual choice in hazard-related decisions, forneglecting environmental quality and for beingslow to recognise the role of human vulnerabilityin disaster impacts.
The development paradigm
This philosophy emerged largely because of theslow progress achieved in reducing disaster losses,especially in poor countries. It originated withsocial scientists with first-hand experience in theThird World who believed that disasters in theLDCs arise more from the workings of the globaleconomy and the marginalisation of poor peoplethan from the effects of extreme geophysical events.Such events were seen as mere ‘triggers’ of moredeeply-rooted and long-standing problems. It is aradical interpretation of disaster that, contrary tothe behavioural paradigm, is rarely hazard-specific,dwells more on the long-term common features ofdisaster and stresses the limits to individual actionimposed by powerful global forces.
The development paradigm is closely associatedwith Wisner et al. (2004) who envisage disastersas resulting from the clash of two opposing forces:the socio-economic processes that create humanvulnerability and the natural processes that creategeophysical hazards. There are several key points:
• Disasters are caused largely by human exploita-tion rather than natural or technological pro-cesses. Macro-scale root causes of vulnerabilitylie in the economic and political systems thatexercise power and influence, both nationallyand globally, and result in marginalising poor people. Human vulnerability is treatedseparately in a later section (p. 15).
• Ongoing dynamic pressures, such as chronicmalnutrition, disease and armed conflict, thenchannel the most vulnerable people into unsafeenvironments, such as flimsy housing, steepslopes or flood-prone areas, either as a ruralproletariat (dispossessed of land) or as an urbanproletariat (forced into shanty towns). Effectivelocal responses to hazards are limited by a lackof resources at all levels.
• ‘Normality’ in the Western sense is an illusion.Given that disasters are characteristic, rather

The development paradigm emerged during the 1970sas a more theoretical and radical alternative (Box1.1). It drew directly on experience in the lessindustrialised parts of the world where naturaldisasters were found to create unusually severeimpacts, including large losses of life. Answers weresought in the longer-term, root causes of theseeffects and the research focus shifted from hazardsto a disasters-based viewpoint and from the moredeveloped countries (MDCs) to the less developedcountries (LDCs). The link between under-development and disasters was studied and it wasconcluded that economic dependency increased boththe frequency and the impact of natural hazards.Human vulnerability – a feature of the poorest andthe most disadvantaged people in the world –became an important concept for understanding thescale of disasters (Blaikie et al., 1994: Wisner et al.,2004). From 1990–99 the United Nations super-vised the International Decade for Natural DisasterReduction (IDNDR), a programme driven by con-cerns that disaster losses threatened the sustain-ability of future population growth and wealthcreation, especially in the LDCs.
In the late twentieth century, these two opposingcamps were still identifiable (Mileti et al,. 1995).Most physical scientists, including civil engineersand meteorologists, were associated with the agent-specific, hazard-based behavioural paradigm using avariety of technical solutions plus the responses ofsocial adaptation derived from human ecology. Incontrast, social scientists, such as sociologists andanthropologists, drew on the development paradigmand adopted a cross-hazard, disaster-based view thatstressed failings within political and social systemstogether with the need to improve the efficiency ofhuman responses to all types of mass emergency(Quarantelli, 1998). A new generation of bookscovered both the traditional natural hazards field(Bryant, 1991; Alexander, 1993; Chapman, 1999;McGuire et al., 2002) and the cross-hazards field(Hewitt, 1983; Hewitt, 1997; Tobin and Montz,1997a; Alexander, 2000).
HAZARD IN THE ENVIRONMENT 7
than accidental, disaster reduction depends onfundamental political, social and economicchanges involving a re-distribution of wealthand power. Modernisation theory, relying onimported technology and ‘quick fix’ measuresis not appropriate. Instead, self-help usingtraditional knowledge and locally-negotiatedresponses is seen as a better way forward.
In summary, the development view is based on thetheory that disasters spring from under-develop-ment arising from political dependency andunequal trading arrangements between rich andpoor nations. The poorest sections of society are pressured to over-use the land. Rural over-population, landlessness and migration to un-planned hazard-prone cities are then the inevitableoutcomes of capitalism, which can be seen as the
root cause of environmental disaster. Frequentdisaster strikes simply reinforce the inequalities.
The political economy of the world is unlikelyto be responsive in the immediate future to themost radical demands made by the developmentlobby. However, the paradigm has been helpful inrefining some key concepts, such as poverty andvulnerability, that help to focus attention on theneeds of the most disadvantaged members ofsociety, most recently in the MDCs as well as inthe LDCs. As a result, human vulnerabilityanalysis and mapping is now routinely undertakenalongside more quantitative risk surveys andgeophysical assessments. Humanitarian aid is nota permanent solution to deep-seated socio-eco-nomic problems but any means whereby scarceresources can be delivered more effectively to thosemost in need are to be welcomed.

THE COMPLEXITY PARADIGM
As noted by Dynes (2004), there is a need to expandour vision of hazards and disasters even furtherbeyond the original Western focus on the rapid-onset hazards that threaten prosperous communitiesin urbanised areas. That scenario is largely irrelevantto the prolonged ‘complex emergencies’ now foundin Africa and other less privileged parts of the world.Any new paradigm has a difficult task to perform.First, it must capture best practice from the earlierperspectives. This is because disaster reduction willalways require – where necessary – the applicationof well-tried responses such as well-designedengineering works, effective land planning and thedistribution of humanitarian aid. Second, it mustaddress all the modern environmental threats,ranging from the multi-layered emergencies thatafflict the rural poor in the LDCs to the majordisasters that still occur – to the evident surprise ofsome observers – in the richest megacities of theMDCs. Specifically, a credible paradigm for todaymust embrace the widespread devastation arisingfrom drought combined with other factors – such asarmed conflict and insecurity of food supplies – incountries like Somalia and Eritrea (Horn of Africa)as well as the economic and political shocks createdby the 1995 earthquake in Kobe (Japan) and‘Hurricane Katrina’ in New Orleans (USA) during2005.
Hazards and disasters are two sides of the samecoin; neither can be fully understood or explainedfrom the standpoint of either physical science orsocial science alone. Hazards and disasters are alsoinextricably linked to ongoing global environ-mental change, including the many factors thatinteract to determine the prospects for sustainabledevelopment in the future (Fig. 1.1). Therefore, this more holistic paradigm is variously calledsustainable hazard mitigation by Mileti and Myers(1997) and the complexity paradigm by Warner et al.(2002). It looks beyond local, short-term loss reduc-tion, based on ‘quick-fix’ solutions, and attempts tomesh disaster reduction strategies with a realisticdevelopment agenda for a rapidly changing world.
This approach re-emphasises the mutual inter-actions between nature and society (see Chapter 3).Humans are not simply the victims of environ-mental hazards because, in many instances, humanactions contribute to hazardous processes and todisaster outcomes. Since nature and society areinterconnected at all scales of distance, and at alltimes, any change in one has the potential to affectthe other. Such relationships are increasinglyimportant for those human actions that over-exploitand degrade natural resources through processes likedeforestation and global warming that, in turn,amplify the risk from natural hazards like riverfloods and sea-level rise. A complicated mix ofhuman and natural causes exists to increase humanvulnerability (see the section on hazard, risk anddisaster, p. 13) and, in some cases, ‘natural disasters’simply highlight a deeper crisis. The exact rela-tionships between ‘traditional disasters’ and‘complex emergencies’ with the underlying forces ofglobal environmental change, and also with the goalof sustainable economic progress, are presently un-clear. This is partly because we are only just startingto understand the extent of human domination ofthe Earth’s ecosystems and the extent to whichhuman-dominated environments influence thevulnerability of societies and economies to extremeevents (Messerli et al., 2000).
THE NATURE OF HAZARD8
EnvironmentalResources
EnvironmentalHazardsSustainable
Development
Natural EventsSystem
Human UseSystem
HumanResponseto Hazards
Global Change
ExtremeEvents
NormalEvents
TechnologySuccesses
TechnologyFailures
Figure 1.1 Environmental hazards exist at the interfacebetween the natural events system (extreme events) andthe human use system (technology failures). Hazards, andhuman responses to them, can influence global changeand the chances for sustainable development. Adaptedfrom Burton et al. (1993).
The complexity paradigm is in its infancy andthere is little doubt that the hazards and disastersfield will continue to diversify and change (Rubin,1998). Over recent decades, the reseach activity hasbecome more genuinely multi-disciplinary and haspartly shifted focus away from emergency pre-paredness and response towards strategies formitigation and recovery (Wenger, 2006). Someuncertainties about the future help to fuel thegrowth of a new ‘catastrophe’ paradigm based onthreats of global significance. For example, theterrorist attack of 11 September 2001 in New YorkCity was then the most costly disaster in US historyand released at least US$20 billion in aid. It not onlybrought hazards of mass violence centre-stage, andled to a concentration on ‘homeland security’, butalso alerted the insurance industry and others to thethreat from ‘super’ hazards.
Future disasters are likely to be larger in scale thanin the past due to the greater complexity of humansociety and concentration of people in urban areas.Mega-scale events, capable of cutting across regionalgeographical units and existing socio-economicsystems, have to be considered. These includehazards such as global epidemics and the collision ofmeteorites with settled parts of planet Earth. Somethreats – like climate change – are already global inscope and, for the policy-maker there is everythingto be gained from a wider viewpoint. For example,it is recognised that environmental hazards have the capability to undermine the MillenniumDevelopment Goals, an ambitious agenda forreducing poverty and improving lives set out byworld leaders in September 2000. Consequently, thecurrent International Strategy for Disaster Reduction(ISDR), promoted by the United Nations, seeks tointensify political activity aimed at reducing naturaland manmade disasters (UN/ISDR, 2004).
WHAT ARE ENVIRONMENTAL HAZARDS?
No introductory survey can cover the entire hazardsand disasters field. But, if the defining test is the
ability of processes acting through either the naturalor the built environment to create a large numberof unexpected premature deaths and major eco-nomic damages, a consistent theme can be identi-fied. This book concentrates on the more extreme,rapid-onset events that directly threaten human lifeand property by means of acute physical or chemicaltrauma on a scale sufficient to cause a ‘disaster’.Acute bodily trauma, plus any related damage toproperty or the environment usually follows thesudden release of energy or materials in concentra-tions greatly in excess of normal background levels.In summary, the term environmental hazard refers toall the potential threats facing human society byevents that originate in, and are transmittedthrough, the environment.
Specific categorisation is difficult and con-tentious. Extreme natural processes have alwaysbeen associated with disasters but many of thesethreats are now so heavily influenced by humanactions, including technology and its failures, thatthey are really ‘environmental’ in scope. In factmany disasters have a hybrid, or ‘na-tech’ originwhen, for example, a river dam fails and creates aflood or when an earthquake damages an industrialfacility and dangerous chemicals are released. Thesehazards are shown in the first two sections of Table1.2. Some of these hazards are related to larger-scaleprocesses than may at first appear, especially whenthe threats are influenced by global environmentalchange (GEC) and also contribute to it. In otherwords, the slope failure that produces a landslide, orthe rain storm that produces a river flood, canoriginate respectively through tectonic and ocean-atmosphere mechanisms operating over much widerareas than a local mountain range or river valley.‘Super hazards’ are driven by forces operating onhemispheric, or even planetary, scales and are ableto deploy vast amounts of energy and materials toproduce sudden, as well as long-term, environ-mental change. Because these threats are embeddedwithin global-scale processes, they are termed contexthazards. Not all the processes involved are directlylife-threatening but the context hazards included inthis book are selected because they either amplify
HAZARD IN THE ENVIRONMENT 9

existing risks – as global warming drives sea-levelrise and an increased threat from coastal floods – orhave the potential for worldwide catastrophes notyet experienced in human history – like asteroidcollisions with populated areas of the Earth (seeTable 1.2 and Figure 1.2).
As shown in Figure1.3, the degree of humaninvolvement in environmental hazards tends toincrease from involuntary exposure to the rare,uncontrolled natural events (asteroid impact,earthquake) towards a more voluntary exposure todanger through common failures of technology inthe built environment (transport accidents, airpollution). Entirely voluntary social hazards, suchas cigarette smoking or mountaineering, areexcluded from this book because they are whollyman-made, self-inflicted risks. Similarly, hazards ofviolence are excluded because crime, warfare andterrorism are intentional harmful acts originated byhumans. On the other hand, certain socio-economiccharacteristics do have a great influence on hazardimpacts, either directly or indirectly. For example,epidemics of infectious disease are treated as directhazards because they are often rooted in changedenvironmental conditions and are a major cause ofpremature deaths worldwide. Other, more long-term, human characteristics such as poverty, gender
or ill-health, while not environmental hazards inthemselves, have indirect effects by raising the levelof human vulnerability to hazardous events. In thisbook, therefore, the range of socio-economic factorsthat amplify risk will be taken into account in orderto explain the full significance of environmentalhazards (see the section on hazard, risk and disaster,p. 13).
Hazardous geophysical events represent theextremes of a statistical distribution that, in adifferent context, would be regarded as a resource(Kates, 1971). For example, normal river flows area benefit, providing waterpower, amenity, etc.,whilst very high flows bring a flood hazard. Manybeneficial uses of water depend on river controltechnology, in the form of embankments, bridgesand dams. Water under human control in a reservoiris perceived as a resource but, if technology fails andthe dam collapses, then a flood disaster may result.It is important to realise that environmental hazardsspring neither from a vengeful God nor a hostileenvironment. Rather the environment is ‘neutral’and it is the human use of the environment, bothnatural and man-made, which identifies resourcesand hazards through human perception.
Human sensitivity to environmental hazards is acombination of physical exposure, or the range of
THE NATURE OF HAZARD10
Table 1.2 Major categories of environmental hazard
NATURAL HAZARDS (extreme geophysical and biological events)Geologic – earthquakes, volcanic eruptions, landslides, avalanchesAtmospheric – tropical cyclones, tornadoes, hail, ice and snowHydrologic – river floods, coastal floods, droughtBiologic – epidemic diseases, wildfires
TECHNOLOGICAL HAZARDS (major accidents)Transport accidents – air accidents, train crashes, ship wrecksIndustrial failures – explosions and fires, release of toxic or radioactive materialsUnsafe public buildings and facilities – structural collapse, fireHazardous materials – storage, transport, mis-use of materials
CONTEXT HAZARDS (global environmental change)International air pollution – climate change, sea level riseEnvironmental degradation – deforestation, desertification, loss of natural resourcesLand pressure – intensive urbanisation, concentration of basic facilitiesSuper hazards – catastrophic earth changes, impact from near-earth objects
Notes: Drought is a slow-onset environmental hazard. Key context hazards are reviewed in Chapter 13.

potentially damaging events and their variability ata particular location, and human vulnerability, whichreflects the breadth of social and economic toleranceto such hazardous events at the same site. Thisrelationship is shown in a simple matrix (Fig. 1.4).Most industrialised nations have relatively highsecurity so that even in a country like Japan, exposedto many environmental hazards, sophisticatedcoping strategies are in place to limit any losses. Onthe other hand, many African countries are vulner-able through a high risk/low security mix.
In Figure 1.5 the unshaded zone represents anacceptable range of fluctuation for any naturalelement vital for human survival, such as rainfall, orany technological process involving risk, such as theproduction of chemicals. Most socio-economicactivities are geared to an expectation of ‘average’conditions. As long as the temporal variationremains close to this expected state, the element orprocess will be perceived as beneficial. However,when the fluctuations exceed some critical thresholdbeyond the ‘normal’ band of tolerance, the variable
becomes a hazard. Thus, very high or very lowrainfall will be deemed to create a flood or a droughtrespectively; abnormally high releases of gases froma factory will be perceived as air pollution. Thehazard magnitude can be determined by the peakdeviation beyond the threshold on the vertical scaleand the hazard duration from the length of time thethreshold is exceeded on the horizontal scale.
HAZARD IN THE ENVIRONMENT 11
ExtremeGeophysical
Events
NaturalProcesses
SevereSystemFailures
TechnologicalAccidents
Large - AreaHazards
ClimateChange
RareSuper
Hazards
EarthChange
Na - TechDisasters
GlobalEnvironmental
Change
CONTEXT HAZARDS
ENVIRONMENTAL HAZARDSAsteroid impact
Earthquake
Tsunami
Volcanic eruption
Cyclone
Tornado
Landslide
Flood
Drought
Bushfire
Industrial accident
Air pollution
Transport accident
Natural Manmade
Involuntary
Voluntary
Intense
Diffuse
Figure 1.2 The relationship between environmentalhazards and context hazards. Context hazards are large-scale threats – both chronic and rare – arising from globalenvironmental change.
Figure 1.3 A spectrum of environmental hazards fromgeophysical events to human activities. Hazards with ahigh level of human causation are more voluntary interms of their acceptance and more diffuse in terms oftheir disaster impact.
HUMAN VULNERABILITY
PH
YS
ICA
LE
XP
OS
UR
E
High Risk
High Security
High Risk
Low Security
Low Risk
High Security
Low Risk
Low Security
Figure 1.4 A simple matrix showing the theoreticalrelationships between physical exposure to hazard (risk)and human vulnerability to disaster (insecurity).
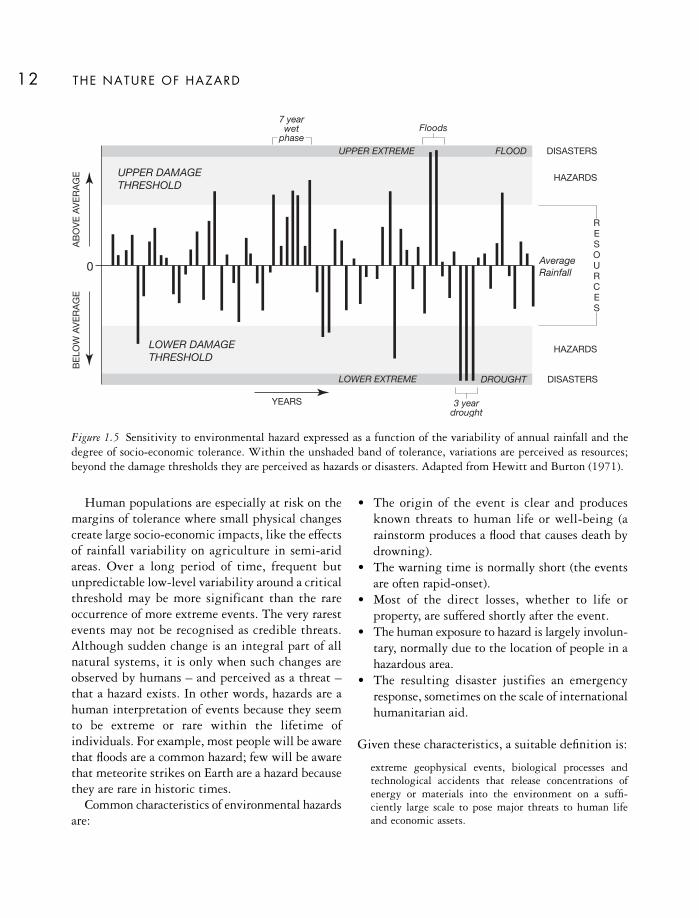
Human populations are especially at risk on themargins of tolerance where small physical changescreate large socio-economic impacts, like the effectsof rainfall variability on agriculture in semi-aridareas. Over a long period of time, frequent butunpredictable low-level variability around a criticalthreshold may be more significant than the rareoccurrence of more extreme events. The very rarestevents may not be recognised as credible threats.Although sudden change is an integral part of allnatural systems, it is only when such changes areobserved by humans – and perceived as a threat –that a hazard exists. In other words, hazards are ahuman interpretation of events because they seemto be extreme or rare within the lifetime ofindividuals. For example, most people will be awarethat floods are a common hazard; few will be awarethat meteorite strikes on Earth are a hazard becausethey are rare in historic times.
Common characteristics of environmental hazardsare:
• The origin of the event is clear and producesknown threats to human life or well-being (arainstorm produces a flood that causes death bydrowning).
• The warning time is normally short (the eventsare often rapid-onset).
• Most of the direct losses, whether to life orproperty, are suffered shortly after the event.
• The human exposure to hazard is largely involun-tary, normally due to the location of people in ahazardous area.
• The resulting disaster justifies an emergencyresponse, sometimes on the scale of internationalhumanitarian aid.
Given these characteristics, a suitable definition is:
extreme geophysical events, biological processes andtechnological accidents that release concentrations ofenergy or materials into the environment on a suffi-ciently large scale to pose major threats to human lifeand economic assets.
THE NATURE OF HAZARD12
0
AB
OV
EA
VE
RA
GE
BE
LOW
AV
ER
AG
E
YEARS
UPPER DAMAGETHRESHOLD
LOWER DAMAGETHRESHOLD
UPPER EXTREME
LOWER EXTREME
FLOOD DISASTERS
HAZARDS
HAZARDS
DROUGHT DISASTERS
7 yearwet
phaseFloods
3 yeardrought
AverageRainfall
RESOURCES
Figure 1.5 Sensitivity to environmental hazard expressed as a function of the variability of annual rainfall and thedegree of socio-economic tolerance. Within the unshaded band of tolerance, variations are perceived as resources;beyond the damage thresholds they are perceived as hazards or disasters. Adapted from Hewitt and Burton (1971).

HAZARD, R ISK AND DISASTER
In order of decreasing severity, the following threatsfrom environmental hazards can be recognised:
• Hazards to people – death, injury, disease, mentalstress
• Hazards to goods – property damage, economicloss
• Hazards to environment – loss of flora and fauna,pollution, loss of amenity.
Although the environment is something thathumans value, it is prioritised less by people thanimmediate threats to their own life or possessions.Just as hazard severity can be ranked, so the proba-bility of an event can be placed on a theoretical scalefrom zero to certainty (0 to 1). The relationshipbetween a hazard and its probability can then beused to determine the overall degree of risk, asshown in Figure 1.6. Whilst damage to goods andthe environment can be costly in economic and
social terms, a direct threat to life is the most seriousrisk.
Risk is sometimes taken as synonymous withhazard but risk has the additional implication of thestatistical chance of a particular hazard actuallyoccurring. Hazard is best viewed as a naturallyoccurring or human-induced process, or event, withthe potential to create loss, i.e. a general source offuture danger. Risk is the actual exposure ofsomething of human value to a hazard and is oftenmeasured as the product of probability and loss.Thus, we may define:
1 hazard (cause) – a potential threat to humans andtheir welfare
2 risk (likely consequence) – the probability of ahazard occurring and creating loss.
The difference between hazard and risk can beillustrated through two people crossing an ocean,one in a large ship and the other in a rowing boat(Okrent, 1980). The hazard (deep water and largewaves) is the same in both cases but the risk(probability of capsize and drowning) is very muchgreater for the person in the rowing boat. Thisanalogy shows that, whilst the type of danger posedby earthquakes – for example – may be similarthroughout the world, people in the poorer, lessdeveloped countries are often more vulnerable andat greater risk than those in the richer, moredeveloped countries. When large numbers of peopleare killed, injured or affected in some way, the eventis termed a disaster. Unlike hazard and risk, adisaster is an actual happening, rather than apotential threat, so we may define:
disaster (actual consequence) – the realisation ofhazard.
Disasters are social phenomena that occur when acommunity suffers exceptional levels of disruptionand loss due to natural processes or technologicalaccidents. In the Third World they are all-too-oftena part of everyday living. Such crises may lie at theend of a sequence of events leading from human
HAZARD IN THE ENVIRONMENT 13
Environment
Low High
Low
Hig
h
Cer
tain
tyZ
ero
Goods Life
Hazard
Pro
bab
ility
Low Risk
Medium Risk
High Risk
Figure 1.6 Theoretical relationships between the severityof environmental hazard, probability and risk. Hazardsto human life are rated more highly than damage toeconomic goods or the environment. After Moore (1983).

resource needs through to the selection of a tech-nology with harmful consequences (Hohenemser etal., 1983). Figure 1.7 illustrates a sequence fordrought with linked causal stages at the top line andpossible control stages below. If the preventivecontrols fail, famine-related deaths are a possibleconsequence. In practice, direct cause and effectchains rarely exist and complex emergencies exist.For example, if we consider the fire and explosioncaused by gas pipes ruptured by the lateral spreadof soil in the San Francisco earthquake of 1906, theprimary hazard was strong ground shaking, thesecondary hazard was soil liquefaction and thetertiary hazard was fire and explosion. Although ahazardous event can occur in an uninhabited region,a risk and a disaster can exist only where people andtheir possessions exist. There is no agreed definitionof the scale of loss that has to occur in order toproduce a disaster but a suitable qualitative defini-tion is:
an event, concentrated in time and space, that causessufficient human deaths and material damage to disruptthe essential functions of a community and to threatenthe ability of the community to cope without externalassistance.
Given this framework, what is the risk of disasterfrom environmental hazards? In general, the profileof disasters portrayed in the media is not matchedby the actual incidence of deaths or damages.Headline disaster reports are, by definition, non-routine and arise infrequently. For example, between1975 and 1994 natural hazards in the United Stateskilled nearly 25,000 people and injured 100,000more but only about one-quarter of the deaths, andhalf the injuries, resulted from major disasters(Mileti et al., 1999). The majority of deathsstemmed from small, frequent events (lightningstrikes, car crashes in fog and local landslides). Asnoted by Sagan (1984), the premature deaths andinjuries from disasters often involve acute bodilytrauma and are reported as safety issues. They areperceived differently from chronic human illnesses,which are viewed as ongoing health issues. Thus,although the cumulative losses in ‘headline dis-asters’ are relatively low, safety-related, accidentallosses are highly newsworthy because the deaths andinjuries are concentrated in space and time.
In the more developed countries (MDCs), averagemortality from all causes is strongly dependent onage. Although the death-rate tends to be high
THE NATURE OF HAZARD14
HAZARDCAUSAL
SEQUENCE
CONTROLSTAGES
HUMANNEEDS
FOOD
HUMANWANTS
GRAIN
CHOICEOF TECH-NOLOGY
RAINFED
AGRIC.
INITIATINGEVENT
DROUGHT
OUTCOME
CROPFAILURE
CONSE-QUENCES
STARV-ATION
MODIFY
CHANGELIFE
STYLE
MODIFY
INSTALLIRRIG-ATION
BLOCK
BUILDUP
RESERVES
BLOCK
GOVERN-MENT
ACTION
BLOCK
FOREIGNFOOD
AID
BLOCK
EMERG-ENCY
MEDICALAID
HIGHERORDERCONSE-
QUENCES
DEATH
TIME
Figure 1.7 A schematic illustration of the chain of development of a drought disaster. The stages are expressedgenerically at the top of each box and in terms of a drought disaster in the lower segment. Six potential control stages,designed to reduce disaster, are linked to pathways between the hazard steps by vertical arrows. Adapted fromHohenemser et al. (1983).
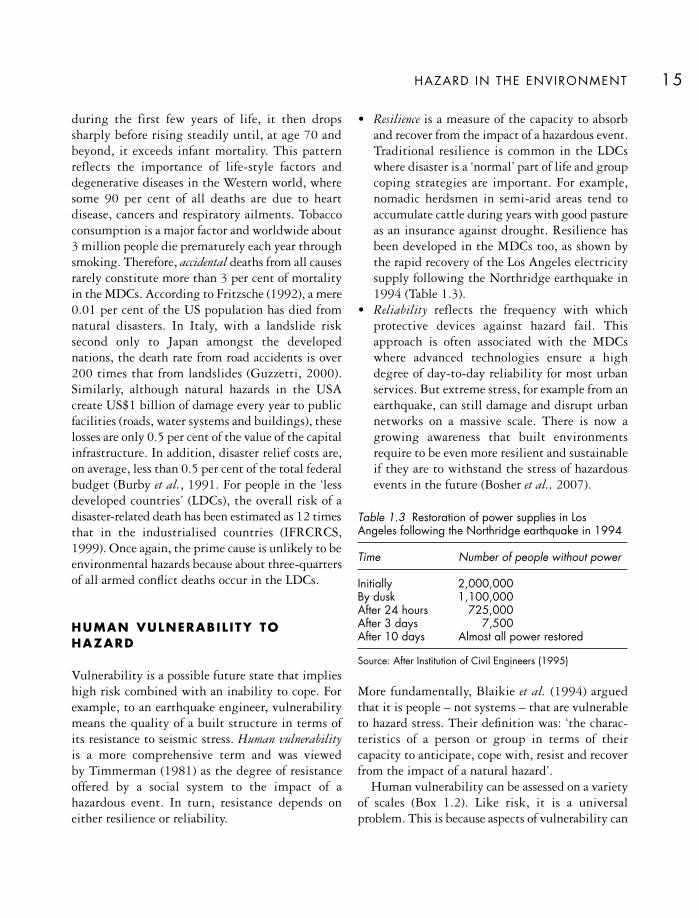
during the first few years of life, it then dropssharply before rising steadily until, at age 70 andbeyond, it exceeds infant mortality. This patternreflects the importance of life-style factors anddegenerative diseases in the Western world, wheresome 90 per cent of all deaths are due to heartdisease, cancers and respiratory ailments. Tobaccoconsumption is a major factor and worldwide about3 million people die prematurely each year throughsmoking. Therefore, accidental deaths from all causesrarely constitute more than 3 per cent of mortalityin the MDCs. According to Fritzsche (1992), a mere0.01 per cent of the US population has died fromnatural disasters. In Italy, with a landslide risksecond only to Japan amongst the developednations, the death rate from road accidents is over200 times that from landslides (Guzzetti, 2000).Similarly, although natural hazards in the USAcreate US$1 billion of damage every year to publicfacilities (roads, water systems and buildings), theselosses are only 0.5 per cent of the value of the capitalinfrastructure. In addition, disaster relief costs are,on average, less than 0.5 per cent of the total federalbudget (Burby et al., 1991. For people in the ‘lessdeveloped countries’ (LDCs), the overall risk of adisaster-related death has been estimated as 12 timesthat in the industrialised countries (IFRCRCS,1999). Once again, the prime cause is unlikely to beenvironmental hazards because about three-quartersof all armed conflict deaths occur in the LDCs.
HUMAN VULNERABIL ITY TO HAZARD
Vulnerability is a possible future state that implieshigh risk combined with an inability to cope. Forexample, to an earthquake engineer, vulnerabilitymeans the quality of a built structure in terms of its resistance to seismic stress. Human vulnerabilityis a more comprehensive term and was viewed by Timmerman (1981) as the degree of resistanceoffered by a social system to the impact of ahazardous event. In turn, resistance depends oneither resilience or reliability.
• Resilience is a measure of the capacity to absorband recover from the impact of a hazardous event.Traditional resilience is common in the LDCswhere disaster is a ‘normal’ part of life and groupcoping strategies are important. For example,nomadic herdsmen in semi-arid areas tend toaccumulate cattle during years with good pastureas an insurance against drought. Resilience hasbeen developed in the MDCs too, as shown bythe rapid recovery of the Los Angeles electricitysupply following the Northridge earthquake in1994 (Table 1.3).
• Reliability reflects the frequency with whichprotective devices against hazard fail. Thisapproach is often associated with the MDCswhere advanced technologies ensure a highdegree of day-to-day reliability for most urbanservices. But extreme stress, for example from anearthquake, can still damage and disrupt urbannetworks on a massive scale. There is now agrowing awareness that built environmentsrequire to be even more resilient and sustainableif they are to withstand the stress of hazardousevents in the future (Bosher et al., 2007).
More fundamentally, Blaikie et al. (1994) arguedthat it is people – not systems – that are vulnerableto hazard stress. Their definition was: ‘the charac-teristics of a person or group in terms of theircapacity to anticipate, cope with, resist and recoverfrom the impact of a natural hazard’.
Human vulnerability can be assessed on a varietyof scales (Box 1.2). Like risk, it is a universalproblem. This is because aspects of vulnerability can
HAZARD IN THE ENVIRONMENT 15
Table 1.3 Restoration of power supplies in LosAngeles following the Northridge earthquake in 1994
Time Number of people without power
Initially 2,000,000By dusk 1,100,000After 24 hours 725,000After 3 days 7,500After 10 days Almost all power restored
Source: After Institution of Civil Engineers (1995)

THE NATURE OF HAZARD16
The international scale
Wide differences exist in disaster vulnerability.Researchers with the United Nations DevelopmentProgramme (UNDP) are working to produce acomprehensive Disaster Risk Index (DRI) designedto measure the relative levels of disaster vulner-ability between nations (UNDP, 2004). The DRIseeks to combine physical exposure to all namedhazards, such as floods, with human vulnerability.Physical exposure is expressed by the number ofpeople located in each country where particularhazards occur combined with the frequency of suchevents. The relative risk of death from these hazardscan then be measured by dividing the number ofpeople killed by the number exposed during arepresentative time period.
Expressing overall human vulnerability is morecomplicated. A complete national Index wouldnot only incorporate the risk from all the relevantphysical hazards but would also capture all otherpossible indicators of vulnerability. No less than26 socio-economic and environmental variables,drawn from available global data-sets, have beenidentified as possible elements for inclusion in theDRI statistical model. These include specificfactors, such as population density, level ofunemployment and the number of hospital beds,together with more composite indicators ofdevelopment, notably the Human DevelopmentIndex (HDI) which measures the quality of humanlife through life expectancy, educational attain-ment and income.
There are several obstacles to the succesfuldevelopment of the DRI. For example, it hasproved over-sensitive to the effect of individuallarge events during sampling periods of limitedlength and cannot yet show vulnerability to non-fatal disaster impacts, such as loss of livelihood orhomelessness. Certain disaster types, like volcaniceruptions, drought and famine, have so far proveddifficult to capture within the formula. Achievinga composite, multi-hazard Index for each countryis also complicated because vulnerability tends tobe highly hazard-specific. For example, earlyresults revealed that the main cause of disaster-related deaths, as expressed by the DRI statisticalmodel, were:
• earthquake – physical exposure and rapid urbangrowth
• tropical cyclone – physical exposure, highpercentage of arable land and low HumanDevelopment Index
• flood – physical exposure, low GDP per capitaand low density of population.
The household scale
Especially within the LDCs, there are also markedinternal variations in wealth and vulnerability tohazard at the family scale. Table 1.4 illustratessome of these variations for hypothetical rural andurban households in poorer countries.
Box 1.2
VARIATIONS IN VULNERABIL ITY TO DISASTER

HAZARD IN THE ENVIRONMENT 17
Table 1.4 Variations in vulnerability at the household level within less developed countries
Household Rural Rural Urban office Urban squattercharacteristics land-owner labourers worker, teacher
Family size 7 members 5 members 5 members 6 members
Workers 4 men, 1 woman 1 man, 1 woman, 1 man, 1 woman 2 women2 children
School-level 3 men 0 5 (2 parents and 0education 3 children)
Occupation Farming, land renting, Seasonal labouring, Office worker, Taking in grain trading share-cropping teacher washing
Income Regular No work, no pay Regular, fixed income No work, plus small pension no pay
Productive assets Land, cattle, old tractor Hand tools Small savings None
Credit source Bank Moneylender Bank Moneylender
Local contacts/ Other farmers and None Local politicians Nonesupport network traders, local officials
House Brick walls and tile Mud walls, thatch Brick walls and tile Scrap metal, construction roof roof, mud floor roof cardboard,
plastic sheets
House ownership Own house Rented Mortgaged Illegal squat
Domestic Artesian well, Communal well, pit Electricity, piped Buy drinking facilities electricity generator latrines, oil lamps water and sewage water,
communal bathsand toilet, nodrainage,illegal powerconnection
Location Elevated flat site Site near river, Paved street, regular Low-lying site or sometimes flooded garbage collection steep slope, no
garbagecollection
Access to Village school, Village school and Shops, school and Local doctor in facilities clinic and shop shop health centre emergency

affect anyone. For example, 20 per cent of the USpopulation suffers from some disability and is likelyto experience more problems than other membersof society during an emergency evacuation. Bydefinition, all vulnerable people are located in areaswith some physical exposure to natural or tech-nological hazards. But the highest vulnerability is acharacteristic of the poorest people of the LDCs andFigure 1.8 illustrates some key factors that dividethe MDCs and the LDCs.
Globally, the most vulnerable people tend to beconcentrated in two population groups:
• urban dwellers from the informal settlements andinner-city slums of the most rapidly expandingcities, often living in unsafe structures on steepslopes or near dangerous industrial sites, andprone to hazards like earthquakes, landslides andfires
• rural dwellers, who account for almost three-quarters of the world’s poorest people, and whosuffer ongoing food insecurity from increasingenvironmental degradation and climate change,and are prone to hazards like floods, droughts andfamines.
Key causes of vulnerability are: Economic factors Those people lacking capital and
other resources, such as land, tools and equipment,and which also have few able-bodied relatives withearning skills, are most vulnerable. Access to infor-mation, and the availability of a social network ableto mobilise support from outside the household, canbe significant too.
The poorest people may appear to have little tolose when disaster strikes. But, when ‘HurricaneMitch’ struck rural Honduras in 1998, the house-holds in the lowest wealth quintile had their meagreassets reduced by 18 per cent compared with averagelosses of 3 per cent recorded for those in the upperquintile (Morris et al., 2002). Most of the poorestpeople in the world experience fragile existences inrural areas and have few earning skills or oppor-tunities.
Social factors Age and gender are importantpointers to vulnerability. The very young and thevery old are often at risk. In the Bangladesh cyclonedisaster of 1970, over half of all the deaths weresuffered by children below 10 years of age, whocomprised only one-third of the population(Sommer and Mosely, 1972). Work on earthquakedisasters has shown that survivors over 60 years ofage and females are most likely to have severephysical injuries and that females also suffer mostfrom psychiatric stress disorders (Peek-Asa et al.,2002; Chen et al., 2001. Older people, especiallywidows in the LDCs, face difficulties in maintainingtheir livelihood after disaster. Even in the MDCsolder people with disabilities face problems inemergency evacuation and survival in public sheltersafter the event (McGuire et al., 2007). Ethnicity canbe a factor when linguistic and religious dividesthreaten the security of minority groups.
Social and economic factors combine to amplifyrisk from environmental hazards. For example,widespread ill-health, especially from communic-able diseases, can prevent people from earning aliving and contribute to ineffective government.During July 1993 flash floods generated bymonsoon rains struck a densely-populated rice-growing area in southern Nepal and killed over
THE NATURE OF HAZARD18
POPULATION MILLIONSLOW BIRTH RATE
RICH PEOPLERESOURCE SURPLUS
LARGE CITIESHIGH TECHNOLOGY
SAFE ENVIRONMENTSSECURE LIVELIHOODS
GLOBAL ECONOMYAID SOURCE
INDEPENDENCEMANY CHOICES
POPULATION BILLIONSHIGH BIRTH RATE
POOR PEOPLERESOURCE DEFICIT
MEGACITIESLOW TECHNOLOGY
UNSAFE ENVIRONMENTSFRAGILE LIVELIHOODS
LOCAL ECONOMYAID SINK
DEPENDENCEFEW CHOICES
DEG
RA
DIN
GEN
VIR
ON
MEN
TS
MDCs LDCs
InfrequentDisasters
FrequentDisasters
LowVulnerability
HighVulnerability
Figure 1.8 Some factors that divide the MDCs and theLDCs. Degrading environmental conditions are a featureof all levels of development but frequent disaster strikesand high vulnerability in the LDCs ensure the greatestdisaster impacts. Adapted from Kates et al. (2001).
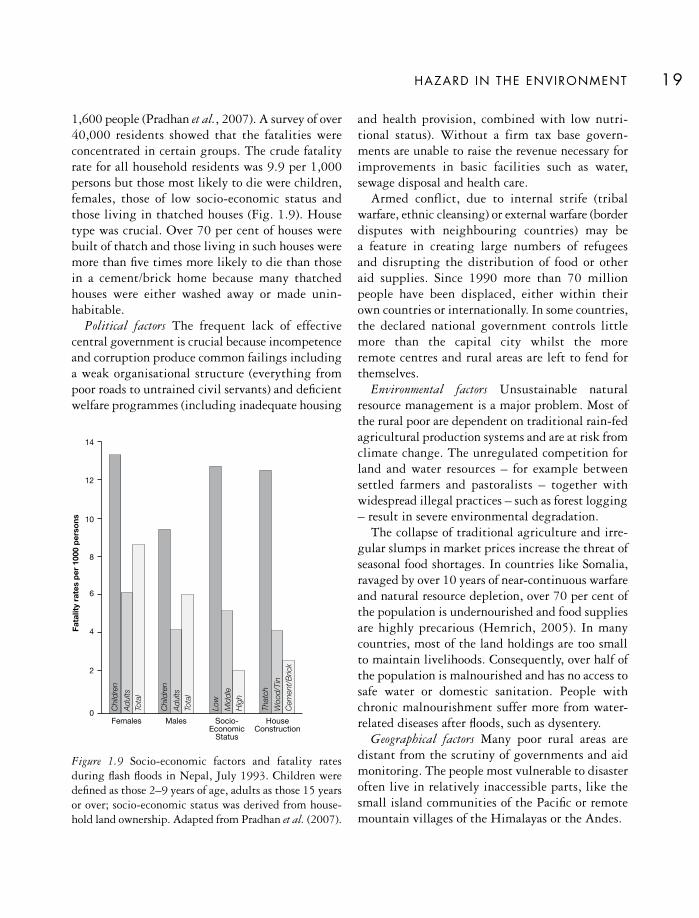
1,600 people (Pradhan et al., 2007). A survey of over40,000 residents showed that the fatalities wereconcentrated in certain groups. The crude fatalityrate for all household residents was 9.9 per 1,000persons but those most likely to die were children,females, those of low socio-economic status andthose living in thatched houses (Fig. 1.9). Housetype was crucial. Over 70 per cent of houses werebuilt of thatch and those living in such houses weremore than five times more likely to die than thosein a cement/brick home because many thatchedhouses were either washed away or made unin-habitable.
Political factors The frequent lack of effectivecentral government is crucial because incompetenceand corruption produce common failings includinga weak organisational structure (everything frompoor roads to untrained civil servants) and deficientwelfare programmes (including inadequate housing
and health provision, combined with low nutri-tional status). Without a firm tax base govern-ments are unable to raise the revenue necessary forimprovements in basic facilities such as water,sewage disposal and health care.
Armed conflict, due to internal strife (tribalwarfare, ethnic cleansing) or external warfare (borderdisputes with neighbouring countries) may be a feature in creating large numbers of refugees and disrupting the distribution of food or other aid supplies. Since 1990 more than 70 millionpeople have been displaced, either within their own countries or internationally. In some countries,the declared national government controls littlemore than the capital city whilst the more remote centres and rural areas are left to fend forthemselves.
Environmental factors Unsustainable naturalresource management is a major problem. Most ofthe rural poor are dependent on traditional rain-fedagricultural production systems and are at risk fromclimate change. The unregulated competition forland and water resources – for example betweensettled farmers and pastoralists – together withwidespread illegal practices – such as forest logging– result in severe environmental degradation.
The collapse of traditional agriculture and irre-gular slumps in market prices increase the threat ofseasonal food shortages. In countries like Somalia,ravaged by over 10 years of near-continuous warfareand natural resource depletion, over 70 per cent ofthe population is undernourished and food suppliesare highly precarious (Hemrich, 2005). In manycountries, most of the land holdings are too smallto maintain livelihoods. Consequently, over half ofthe population is malnourished and has no access tosafe water or domestic sanitation. People withchronic malnourishment suffer more from water-related diseases after floods, such as dysentery.
Geographical factors Many poor rural areas aredistant from the scrutiny of governments and aidmonitoring. The people most vulnerable to disasteroften live in relatively inaccessible parts, like thesmall island communities of the Pacific or remotemountain villages of the Himalayas or the Andes.
HAZARD IN THE ENVIRONMENT 19
14
12
10
8
6
4
2
0Females House
ConstructionSocio-
EconomicStatus
Males
Fata
lity
rate
sp
er10
00p
erso
ns
Chi
ldre
n
Adu
ltsTo
tal
Chi
ldre
n
Adu
ltsTo
tal
Low
Mid
dle
Hig
h
That
ch
Woo
d/Ti
nC
emen
t/B
rick
Figure 1.9 Socio-economic factors and fatality ratesduring flash floods in Nepal, July 1993. Children weredefined as those 2–9 years of age, adults as those 15 yearsor over; socio-economic status was derived from house-hold land ownership. Adapted from Pradhan et al. (2007).

Whilst it is true that some form of environmentalhazard has to be present in order to create the typeof disasters reviewed in this book, it is possible tosee that the severity of the hazard impact is often a function of human vulnerability rather than thephysical magnitude of the event. However, theconcept of vulnerability remains difficult to assessin practical terms. Several methodologies are avail-able to the humanitarian agencies responsible fordetermining vulnerability in the field but there islittle agreement on their use. In some cases, conflict-ing results are obtained at different scales – forexample, for macro-scale (regional) assessments asopposed to micro-scale (household) assessments.According to Darcy and Hofman (2003), idealjudgements about people at risk would be based on
relatively objective ‘outcome’ indicators for keyfactors, such as mortality, morbidity or malnutrition– or longer-term outcomes such as mental disorders(Salcioglu et al., 2007). But most of this informationis is unlikely to be at hand when priorities have tobe agreed quickly for the distribution of humani-tarian aid after a disaster strike.
KEY READING
Degg, M. R. and Chester, D. K. (2005) Seismic andvolcanic hazards in Peru: changing attitudes todisaster mitigation. The Geographical Journal 171:125–45. A specific example of how hazard paradigmshifts can be applied to disaster reduction.
THE NATURE OF HAZARD20
Plate 1.1 Slum shanty housing, raised on stilts for flood protection from a polluted waterway in Jakarta,Indonesia. New office building behind emphasises the steep gradients in hazard vulnerability that exist in manycities in the LDCs. (Photo: Mark Henley, PANOS)

Comfort, L. et al. (1999) Reframing disaster policy:the global evolution of vulnerable communities.Environmental Hazards 1:39–44. A useful focus onthe practical aspects of vulnerability.
UN/ISDR Secretariat (2004) Living with Risk: AGlobal Review of Disaster Reduction Initiatives UnitedNations, Geneva. Sets out the general direction forinternational action.
Wisner, B. et al. (2004) At Risk: Natural Hazards,People’s Vulnerability and Disasters. London and NewYork: Routledge. An overview of natural hazardswith the focus firmly on human vulnerability.
Wenger, D. (2006) Hazards and disasters research:how would the past 40 years rate? Natural HazardsObserver 31: 1–3. A snapshot assessment of progressfrom an American social scientist.
WEB L INKS
Benfield UCL Hazard Research Centre, Londonwww.benfieldhrc.org
Natural Hazards Center, Colorado www.colorado.edu/hazards/
Centre for Research on the Epidemiology ofDisasters, Belgium www.cred.be
Overseas Development Institute, London www.odi.org.uk
UN International Strategy for Disaster Reductionwww.unisdr.org
HAZARD IN THE ENVIRONMENT 21

AUDIT ING DISASTER
In the 30 years between 1974 and 2003, more thantwo million people were killed in over 6,350‘natural’ disasters (Guha-Sapir et al., 2004). Inaddition, a cumulative total of 5.1 billion indivi-duals were directly affected by these events, includ-ing 182 million people who were left homeless.These disasters also caused a total of about US$1.4trillion worth of damage. The vast majority of therecorded fatalities were caused by just four hazardtypes – earthquakes, tropical cyclones, floods anddroughts (Table 2.1). This list is notable in thefrequency with which countries in Asia appear.Indeed, 24 of the 35 disasters on the list occurred inAsia, with 15 recorded in China alone. This out-come reflects the large geographical area of Asia, thehigh proportion of the world’s population livingthere, the long written record available for China,in particular, and – not least – the hazardous natureof the physical environment. Famine is excludedfrom Table 2.1 although it is often linked withdrought. Both drought and famine can last forseveral years. For example, in 1932–33, 7 millionpeople died from famine in the Soviet Union and,during the period 1959–62, 29 million people diedfrom famine in China.
Disaster reporting
There is no agreed definition of ‘disaster’. Con-sequently, the term is applied to a wide range ofevents. The crush of spectators at the Hillsboroughfootball stadium in England in 1989, when 96people were killed, is usually described as a disasterby the media although the number of fatalities is small compared with those in Table 2.1. Anotherproblem surrounds the variation in the nature and quality of disaster records. Many bodies world-wide – such as government agencies and insurancecompanies – issue ‘official’ disaster reports but the media often represent a primary source of infor-mation. The result is that the reported impacts of disasters are generally neither comprehensive norcompatible and many are little more than educatedestimates.
The reporting of disasters in the Western mediais necessary to stimulate public awareness and aiddonations but the active interest of all parties islikely to be short-lived and there is often a problemof bias. The news media tend to over-emphasiserapid-onset events and the coverage of disasters on television news is determined largely by thevisual impact of film reports (Greenberg et al.,1989; Wrathall, 1988). According to Garner andHuff (1997), media reporting shows an excessive
2
DIMENSIONS OF D ISASTER

concentration on the emergency phase of disaster,especially if images of helpless victims are available.Unbalanced reporting of natural disasters is a featureof newspapers in the USA (Ploughman, 1995) andMcKay (1983) demonstrated how the victims of the
‘Ash Wednesday’ bushfires in Australia were por-trayed as helpless with little mention of the morepositive aspects of warning and emergency response.Another media bias is created by an emphasis onevents close to home. For example, Adams (1986)studied the reporting by American television of 35 natural disasters (each causing at least 300 fatali-ties) in various parts of the world and found that the world was prioritised by geographical locationso that the death of one Western European equalledthree Eastern Europeans or nine Latin Americans or 11 Middle Easterners or 12 Asians. When thereis a dependence on advertising revenue, there is amedia focus on the prosperous target markets of the commercial sponsors that can lead to an under-reporting of disaster impacts on poorer social groupsin disadvantaged areas (Rodrigue and Rovai, 1995).In some cases, the detailed study of news reports hasrevealed a bias towards a pre-determined narrative.After ‘Hurricane Katrina’ struck New Orleans in2005, stories of looting, lawlessness and criminaldamage were prominent, even though this type of activity was relatively uncommon (Tierney et al.,2006). Social groups tended to be portrayed differ-ently. When African-Americans broke into shops to obtain food, it was described as looting, whereasthe same behaviour by white people was seen as anecessary act of survival.
Many disasters are compound, complex eventsand create problems of classification. To avoid anydouble-counting of disaster impacts, each losscategory (deaths, damages etc.) should be recordedonce only. However, direct cause and effect can bedifficult to determine. For example, when an earth-quake triggers a landslide that kills people, shouldthe fatalities be recorded as having been caused byan earthquake (the trigger) or a landslide (thecause)? In general, due to the complexities of deter-mining the cause of death in complex, mass-fatalityevents, it is the trigger that is usually described.Unfortunately, this means that the impacts of some‘secondary’ hazards, such as landslides are under-estimated (see Chapter 8). A further problem ariseswhen changes are made to national boundaries (e.g.the former Soviet Union) and the geographical
DIMENSIONS OF D ISASTER 23
Table 2.1 Environmental disasters recorded sinceAD1000 responsible for at least 100,000 deaths*
Year Country Type of disaster Fatalities
1931 China Flood 3,700,0001928 China Drought 3,000,0001971 Soviet Union Epidemic 2,500,0001920 India Epidemic 2,000,0001909 China Epidemic 1,500,0001942 India Drought 1,500,0001921 Soviet Union Drought 1,200,0001887 China Flood 900,0001556 China Earthquake 830,0001918 Bangladesh Epidemic 393,0001737 India Tropical cyclone 300,0001850 China Earthquake 300,0001881 Vietnam Tropical cyclone 300,0001970 Bangladesh Tropical cyclone 300,0001984 Ethiopia Drought 300,0001976 China Earthquake 290,0001920 China Earthquake 235,0001876 Bangladesh Tropical cyclone 215,0001303 China Earthquake 200,0001901 Uganda Epidemic 200,0001622 China Earthquake 150,0001984 Sudan Drought 150,0001923 Japan Earthquake 143,0001991 Bangladesh Tropical cyclone 139,0001948 Soviet Union Earthquake 110,0001290 China Earthquake 100,0001786 China Landslide 100,0001362 Germany Flood 100,0001421 Netherlands Flood 100,0001731 China Earthquake 100,0001852 China Flood 100,0001882 India Tropical cyclone 100,0001922 China Tropical cyclone 100,0001923 Niger Epidemic 100,0001985 Mozambique Drought 100,000
Note: *These figures are approximations and biased towardsthe recent past because of the unavailability of earlier records.
Source: Adapted from Munich Re (1999) and CRED database

attribution of disaster becomes inconsistent overtime.
Disaster impact assessment
Although damaging events are classified accordingto natural and technological causes, they have tobreach certain human effects thresholds, such as death,injury and economic loss, before they are identifiedas disasters. This creates difficulties. To date therehas been no general agreement on exactly how thesethresholds should be defined. It is also likely thatthere is widespread under-reporting of the impact ofdisasters, especially in the LDCs. This is because thelack of social statistics in many LDCs precludes aprecise record of loss. For example, which totalshould be used when, as commonly happens, a widerange of deaths is given or is simply reported as ‘inthe thousands’? How can the data reliably includethose persons reported missing, those who die laterfrom their injuries or from secondary effects, such asfamines and epidemics? In fact, there is a worryinglack of clarity in this area; for example a commondefinition of a disaster ‘injury’ has never been agreed.Despite this, data on the number of fatalitiesassociated with a disaster may well be the mostreliable impact information available.
By comparison, estimates of the financial costs ofdisasters are much less unreliable. This is due toinconsistencies in the way that economic data arecollected, especially for indirect losses. For example,if a flood damages a bridge and farmers cannottransport their goods to the local market, should thelosses in produce sales be included in the calcu-lation? Many people would argue that they should,but determining such costs is likely to be challeng-ing. Similarly, there is little accounting of theongoing financial cost of disaster preparedness, even though this is an important cost since theseresources are not available for other communityneeds. Thus, most disaster audits are limited toestimates of direct deaths, injuries and immediatedamage and capture only part of the impact picture(Box 2.1). Quite apart from financial loss, disastersurvivors frequently suffer indirect impacts includ-
ing the loss of a relative, destruction of property,malnutrition, ill-health, loss of employment, debtand forced migration. Of all these losses, homeless-ness is the only one for which reasonably consistentstatistics exist.
The most comprehensive global record of dis-asters is that maintained by the Centre for Researchon the Epidemiology of Disasters (CRED) at theUniversity of Louvain, Belgium. The EmergencyEvents Database (EM-DAT) covers natural andtechnological disasters, as described in Table 2.2,from 1900 onwards (Sapir and Misson, 1992; Guha-Sapir et al., 2004). Information prior to 1988 wasabsorbed from the records of the US Office ofForeign Disaster Assistance (OFDA) but is lesscomplete than more recent information. CREDinformation is updated daily whilst various checksand revisions occur at three-monthly and annualintervals. Such quality control is essential to ensurethat losses can be properly verified after the emer-gency phase. For inclusion in EM-DAT, a disastermust have killed 10 or more persons, or affected atleast 100 people, although an appeal for inter-national assistance or a government disaster declara-tion will take precedence over the first two criteria.For displaced persons, drought and famine toregister, at least 2,000 people have to be affected.
Database interpretation
Even with high quality data, it can be difficult todraw valid analytical conclusions. For example, theimpact threshold structure disguises differences inthe relative disaster losses between – and even within– the LDCs and the MDCs. A US$10 million losswould be caused by a much smaller and higherfrequency event in – say – California compared toBangladesh. Generally, datasets based on financiallosses, such as those produced by the reinsuranceindustry, tend to give an effective bias towards theMDCs, where the amount of vulnerable assets ishigh. On the other hand, datasets that rely primarilyon disaster fatalities tend to be biased towards theLDCs where large numbers of vulnerable peoplelive. Global datasets are invariably presented for
THE NATURE OF HAZARD24

DIMENSIONS OF D ISASTER 25
Few disaster reports include any losses beyond thedirect and tangible impacts (Fig. 2.1). Direct effectsare the first order consequences that occur imme-diately after an event, such as the deaths andeconomic loss caused by the throwing down ofbuildings in an earthquake. Indirect effects emergelater and may be more difficult to attribute to the event. These include factors such as mentalillness resulting from shock, bereavement and re-location from the area. Tangible effects are those forwhich it is possible to assign monetary values,such as the replacement of damaged property.Intangible effects, although real, cannot be properlyassessed in monetary terms. For example, manyimportant archaeological sites in Italy are at riskfrom landslides, floods and soil erosion (Canuti et al., 2000).
• Direct losses are the most visible consequence ofdisasters due to the immediate damage, such asbuilding collapse. They are comparatively easyto measure, although accounting methodo-logies are not standardised and surveys arealways incomplete. For example, loss estimatesfor insurance purposes are probably more accu-rate than some field-based surveys. However,insurance claims can be deliberately inflatedand there is a lack of insurance cover in poorcountries. Direct losses are not always the mostsignificant outcome of disaster.
• Direct gains represent benefits flowing tosurvivors after a disaster, including the variousforms of aid. Those with skills in the construc-tion trade may obtain well-paid employmentin the restoration phase following the eventand, occasionally, some longer-term enhance-ment of the environment may occur. On theIcelandic island of Heimaey, volcanic ashresulting from the 1973 eruption was used as
foundation material to extend the airportrunway and geothermal heat has been extractedfrom the volcanic core.
• Indirect losses are the second-order consequencesof disaster, like the disruption of economic andsocial activities. Typically, as property valuesfall, consumers save rather than spend, businessbecomes less profitable and unemploymentrises. Again, the data are incomplete. Forexample, no financial losses are reported forepidemics although the premature death ofactive workers inevitably results in a loss ofmanpower and productivity. Ill-health effectsoften outlast other losses. Psychological stressaffects the victims of disaster directly and hasan indirect influence on family members andrescue workers. The symptoms include shock,anxiety, stress or apathy and are expressedthrough sleep disturbance, belligerence andalcohol abuse. Attitudes of blame, resentmentand hostility may also occur.
Box 2.1
TYPES OF DISASTER IMPACT
Physicaldamage toproperty
Donated aidReconstruction
grants
Deposits offertile
ash/siltfor agriculture
Tangible
Intangible
Scenicbuilding
land (e.g.water frontage)
Tourismpotential
(e.g. volcanicsites)
Loss ofbusiness orindustrial
production
StressInconveniencePost-recovery
illness
Loss ofnational
heritage (e.g.art treasures)
LOSSES
GAINS
DIRECT INDIRECT
Figure 2.1 The potential consequences ofenvironmental hazards. Possible losses and gains,both direct and indirect, are shown with specimentangible and intangible effects.
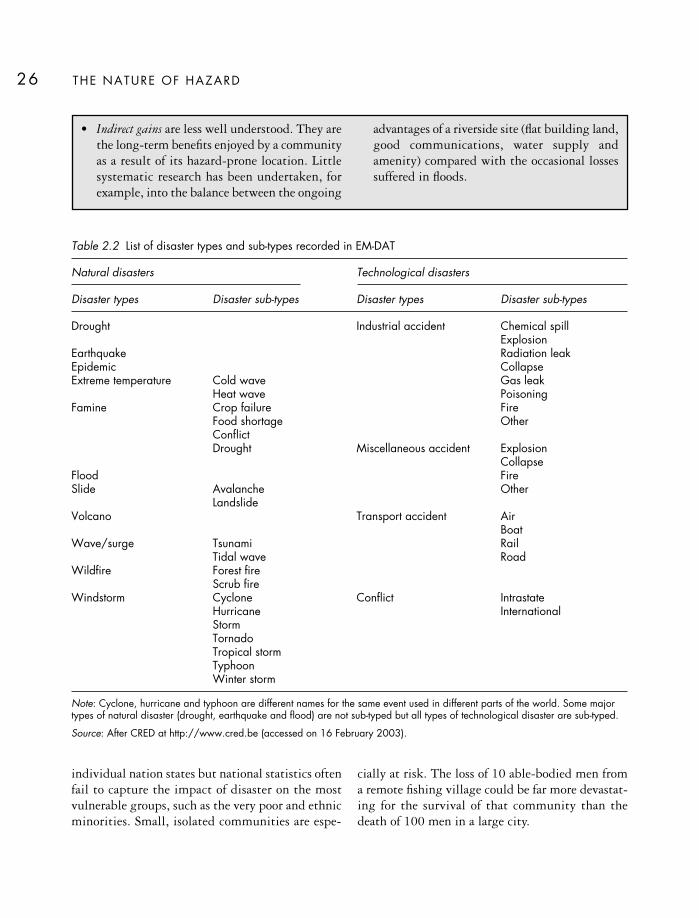
individual nation states but national statistics oftenfail to capture the impact of disaster on the mostvulnerable groups, such as the very poor and ethnicminorities. Small, isolated communities are espe-
cially at risk. The loss of 10 able-bodied men froma remote fishing village could be far more devastat-ing for the survival of that community than thedeath of 100 men in a large city.
THE NATURE OF HAZARD26
• Indirect gains are less well understood. They arethe long-term benefits enjoyed by a communityas a result of its hazard-prone location. Littlesystematic research has been undertaken, forexample, into the balance between the ongoing
advantages of a riverside site (flat building land,good communications, water supply andamenity) compared with the occasional lossessuffered in floods.
Table 2.2 List of disaster types and sub-types recorded in EM-DAT
Natural disasters Technological disasters
Disaster types Disaster sub-types Disaster types Disaster sub-types
Drought Industrial accident Chemical spillExplosion
Earthquake Radiation leakEpidemic CollapseExtreme temperature Cold wave Gas leak
Heat wave PoisoningFamine Crop failure Fire
Food shortage OtherConflictDrought Miscellaneous accident Explosion
CollapseFlood FireSlide Avalanche Other
LandslideVolcano Transport accident Air
BoatWave/surge Tsunami Rail
Tidal wave RoadWildfire Forest fire
Scrub fireWindstorm Cyclone Conflict Intrastate
Hurricane InternationalStormTornadoTropical stormTyphoonWinter storm
Note: Cyclone, hurricane and typhoon are different names for the same event used in different parts of the world. Some majortypes of natural disaster (drought, earthquake and flood) are not sub-typed but all types of technological disaster are sub-typed.
Source: After CRED at http://www.cred.be (accessed on 16 February 2003).

Ideally, the impact of a disaster should be placedin the context of local population numbers, thenature of economic functions and the financialresources available in both the public and privatesector. This rarely happens although CRED hasattempted to identify so-called ‘significant’ naturaldisasters where the number of deaths per event is100 or more, damage amounts to 1 per cent or moreof the annual national Gross Domestic Product(GDP) and the number of affected people is 1 percent or more of the total population. The relativemeasures adopted for damage and affected peopleindicate more accurately than absolute nationaltotals the effect of disasters on LDCs with weakeconomies and small populations.
The CRED archive goes back to 1900 but thesystematic recording of disasters did not really beginuntil 1964, and became fully reliable in about 1970.Since then there has been a steep rise in the recordednumber of natural disasters from an annual averageof less than 50 before 1965 to around 250 in the1990s, although the number of fatalities has re-mained essentially unchanged (Fig. 2.2). Althoughthere are fewer technological disasters, the increasein annual totals has been similar, but again with no real trend in terms of fatalities (Fig. 2.2).Considerable debate exists about the extent to whichthese trends represent a real increase in the numberof disasters, as opposed to ongoing improvementsin the efficiency of disaster reporting. Interestingly,
step increases in yearly total numbers of reporteddisasters occur in the CRED data after 1964 (whenOFDA was created) and after 1973 (when CREDwas created). Such ‘artificial’ increases in disasterreporting are due largely to greater awareness andhave occurred periodically over many years.
For example, the top graph in Figure 2.3 showsan apparent long-term upward trend in the numberof volcanic eruptions reported each year, although itis unlikely that global volcanic activity has increasednoticeably over this period. In fact, as shown by the lower graph, the number of large eruptions,which are those most likely to be reported, hasremained fairly constant at 50 to 70 per year duringrecent decades. Therefore, the apparent upwardtrend is really a measure of improved volcanichazard awareness and monitoring. It can also beenseen that when the world was preoccupied withalternative large-scale news events, like war oreconomic depression, there was a reduced reporting
DIMENSIONS OF D ISASTER 27
20
40
60
80
04
2
01790 1850 1900
Year
Numb
erof
activ
evolc
anoe
s
1950 1990
All eruptions
Eruptions 0.1 km3
WWI WWII
Figure 2.2 Annual total of deaths in global disasters1970–2006. Adapted from CRED database.
Figure 2.3 The number of active volcanoes per yearfrom 1790 to 1990. The upper graph, which showsrecords for all eruptions, appears to show a dramaticincrease, but the lower graph, representing just thelargest eruptions, shows no overall trend. After T. Simkin and L. Siebert (1994) Volcanoes of the World,2nd edn. Tucson AZ: Geoscience Press. Reproducedwith permission.
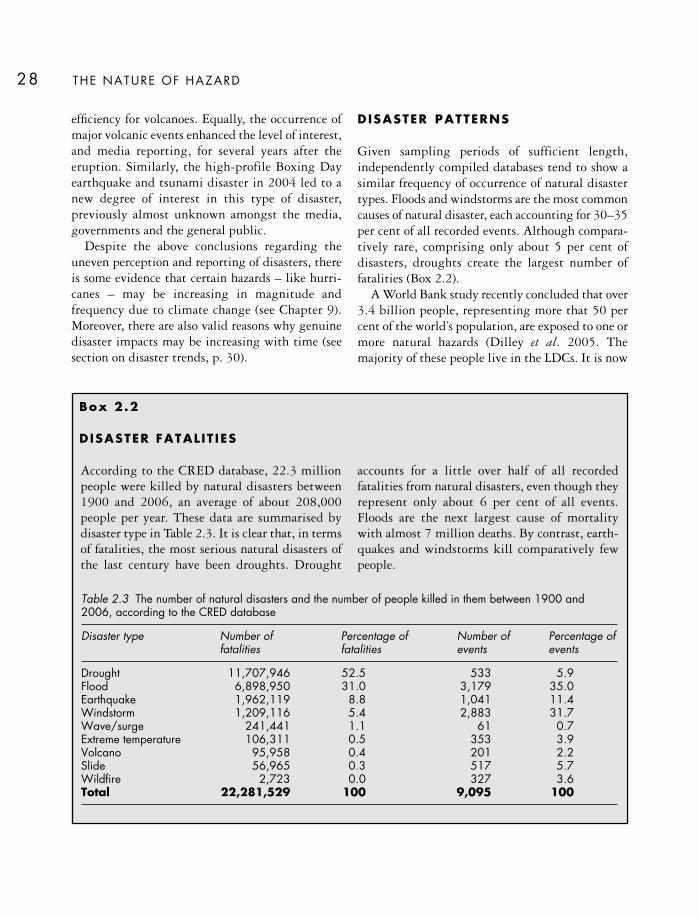
efficiency for volcanoes. Equally, the occurrence ofmajor volcanic events enhanced the level of interest,and media reporting, for several years after theeruption. Similarly, the high-profile Boxing Dayearthquake and tsunami disaster in 2004 led to anew degree of interest in this type of disaster,previously almost unknown amongst the media,governments and the general public.
Despite the above conclusions regarding theuneven perception and reporting of disasters, thereis some evidence that certain hazards – like hurri-canes – may be increasing in magnitude andfrequency due to climate change (see Chapter 9).Moreover, there are also valid reasons why genuinedisaster impacts may be increasing with time (seesection on disaster trends, p. 30).
DISASTER PATTERNS
Given sampling periods of sufficient length,independently compiled databases tend to show asimilar frequency of occurrence of natural disastertypes. Floods and windstorms are the most commoncauses of natural disaster, each accounting for 30–35per cent of all recorded events. Although compara-tively rare, comprising only about 5 per cent ofdisasters, droughts create the largest number offatalities (Box 2.2).
A World Bank study recently concluded that over3.4 billion people, representing more that 50 percent of the world’s population, are exposed to one ormore natural hazards (Dilley et al. 2005. Themajority of these people live in the LDCs. It is now
THE NATURE OF HAZARD28
According to the CRED database, 22.3 millionpeople were killed by natural disasters between1900 and 2006, an average of about 208,000people per year. These data are summarised bydisaster type in Table 2.3. It is clear that, in termsof fatalities, the most serious natural disasters ofthe last century have been droughts. Drought
accounts for a little over half of all recordedfatalities from natural disasters, even though theyrepresent only about 6 per cent of all events.Floods are the next largest cause of mortality with almost 7 million deaths. By contrast, earth-quakes and windstorms kill comparatively fewpeople.
Box 2.2
DISASTER FATALIT IES
Table 2.3 The number of natural disasters and the number of people killed in them between 1900 and2006, according to the CRED database
Disaster type Number of Percentage of Number of Percentage of fatalities fatalities events events
Drought 11,707,946 52.5 533 5.9Flood 6,898,950 31.0 3,179 35.0Earthquake 1,962,119 8.8 1,041 11.4Windstorm 1,209,116 5.4 2,883 31.7Wave/surge 241,441 1.1 61 0.7Extreme temperature 106,311 0.5 353 3.9Volcano 95,958 0.4 201 2.2Slide 56,965 0.3 517 5.7Wildfire 2,723 0.0 327 3.6Total 22,281,529 100 9,095 100
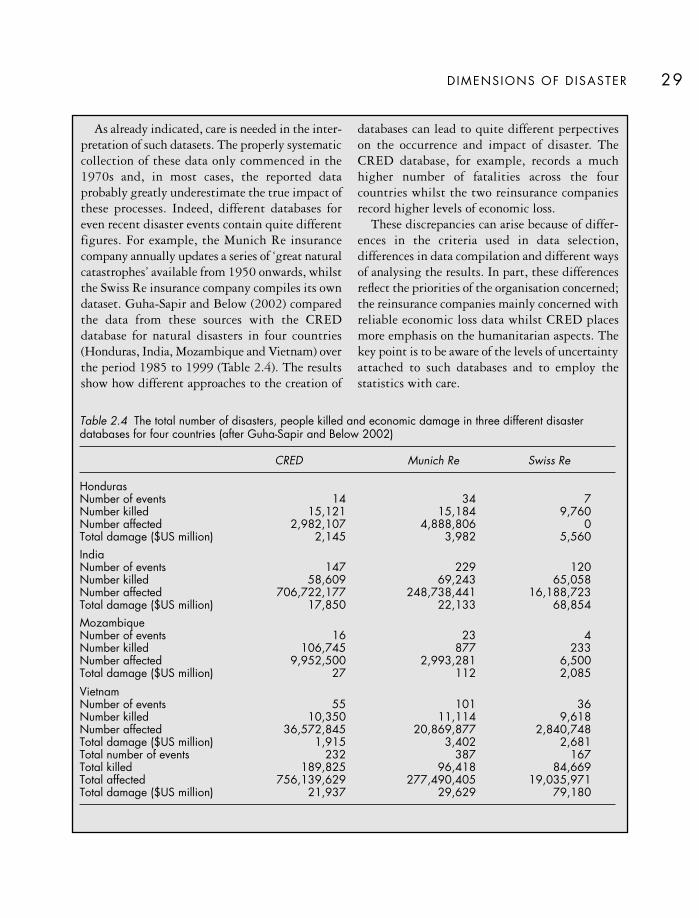
DIMENSIONS OF D ISASTER 29
As already indicated, care is needed in the inter-pretation of such datasets. The properly systematiccollection of these data only commenced in the1970s and, in most cases, the reported dataprobably greatly underestimate the true impact ofthese processes. Indeed, different databases foreven recent disaster events contain quite differentfigures. For example, the Munich Re insurancecompany annually updates a series of ‘great naturalcatastrophes’ available from 1950 onwards, whilstthe Swiss Re insurance company compiles its owndataset. Guha-Sapir and Below (2002) comparedthe data from these sources with the CREDdatabase for natural disasters in four countries(Honduras, India, Mozambique and Vietnam) overthe period 1985 to 1999 (Table 2.4). The resultsshow how different approaches to the creation of
databases can lead to quite different perpectiveson the occurrence and impact of disaster. TheCRED database, for example, records a muchhigher number of fatalities across the fourcountries whilst the two reinsurance companiesrecord higher levels of economic loss.
These discrepancies can arise because of differ-ences in the criteria used in data selection, differences in data compilation and different waysof analysing the results. In part, these differencesreflect the priorities of the organisation concerned;the reinsurance companies mainly concerned withreliable economic loss data whilst CRED placesmore emphasis on the humanitarian aspects. Thekey point is to be aware of the levels of uncertaintyattached to such databases and to employ thestatistics with care.
Table 2.4 The total number of disasters, people killed and economic damage in three different disasterdatabases for four countries (after Guha-Sapir and Below 2002)
CRED Munich Re Swiss Re
HondurasNumber of events 14 34 7Number killed 15,121 15,184 9,760Number affected 2,982,107 4,888,806 0Total damage ($US million) 2,145 3,982 5,560IndiaNumber of events 147 229 120Number killed 58,609 69,243 65,058Number affected 706,722,177 248,738,441 16,188,723Total damage ($US million) 17,850 22,133 68,854MozambiqueNumber of events 16 23 4Number killed 106,745 877 233Number affected 9,952,500 2,993,281 6,500Total damage ($US million) 27 112 2,085VietnamNumber of events 55 101 36Number killed 10,350 11,114 9,618Number affected 36,572,845 20,869,877 2,840,748Total damage ($US million) 1,915 3,402 2,681Total number of events 232 387 167Total killed 189,825 96,418 84,669Total affected 756,139,629 277,490,405 19,035,971Total damage ($US million) 21,937 29,629 79,180
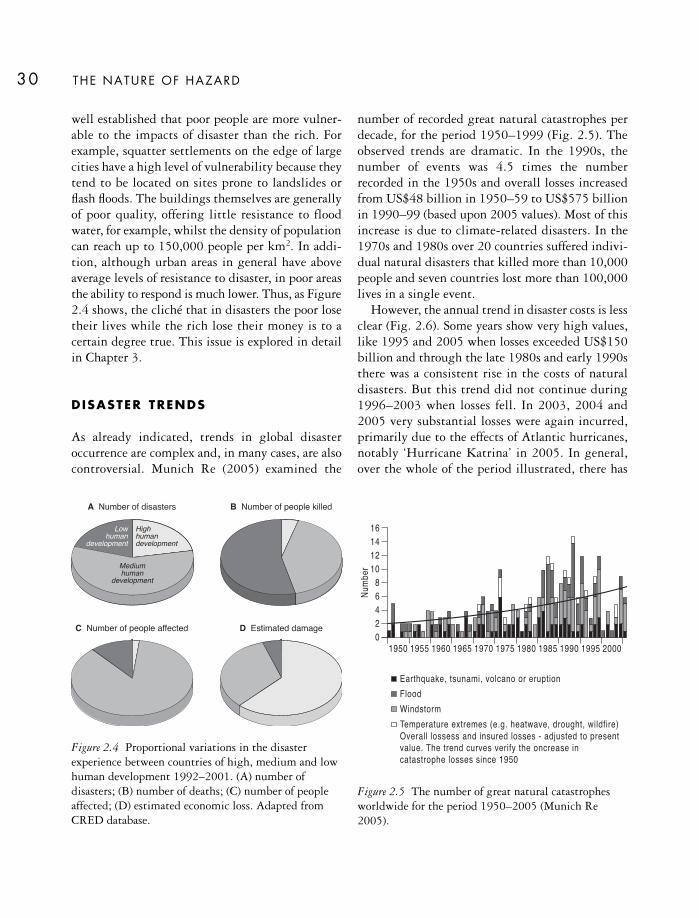
well established that poor people are more vulner-able to the impacts of disaster than the rich. Forexample, squatter settlements on the edge of largecities have a high level of vulnerability because theytend to be located on sites prone to landslides orflash floods. The buildings themselves are generallyof poor quality, offering little resistance to floodwater, for example, whilst the density of populationcan reach up to 150,000 people per km2. In addi-tion, although urban areas in general have aboveaverage levels of resistance to disaster, in poor areasthe ability to respond is much lower. Thus, as Figure2.4 shows, the cliché that in disasters the poor losetheir lives while the rich lose their money is to acertain degree true. This issue is explored in detailin Chapter 3.
DISASTER TRENDS
As already indicated, trends in global disasteroccurrence are complex and, in many cases, are alsocontroversial. Munich Re (2005) examined the
number of recorded great natural catastrophes perdecade, for the period 1950–1999 (Fig. 2.5). Theobserved trends are dramatic. In the 1990s, thenumber of events was 4.5 times the numberrecorded in the 1950s and overall losses increasedfrom US$48 billion in 1950–59 to US$575 billionin 1990–99 (based upon 2005 values). Most of thisincrease is due to climate-related disasters. In the1970s and 1980s over 20 countries suffered indivi-dual natural disasters that killed more than 10,000people and seven countries lost more than 100,000lives in a single event.
However, the annual trend in disaster costs is lessclear (Fig. 2.6). Some years show very high values,like 1995 and 2005 when losses exceeded US$150billion and through the late 1980s and early 1990sthere was a consistent rise in the costs of naturaldisasters. But this trend did not continue during1996–2003 when losses fell. In 2003, 2004 and2005 very substantial losses were again incurred,primarily due to the effects of Atlantic hurricanes,notably ‘Hurricane Katrina’ in 2005. In general,over the whole of the period illustrated, there has
THE NATURE OF HAZARD30
A Number of disasters B Number of people killed
C Number of people affected D Estimated damage
Highhumandevelopment
Lowhuman
development
Mediumhuman
development
Figure 2.4 Proportional variations in the disasterexperience between countries of high, medium and lowhuman development 1992–2001. (A) number ofdisasters; (B) number of deaths; (C) number of peopleaffected; (D) estimated economic loss. Adapted fromCRED database.
16141210
86420
1950 1955 1960 1965 1970 1975
Numb
er
1980 1985 1990 1995 2000
Earthquake, tsunami, volcano or eruptionFloodWindstormTemperature extremes (e.g. heatwave, drought, wildfire)Overall lossess and insured losses - adjusted to presentvalue. The trend curves verify the oncrease incatastrophe losses since 1950
Figure 2.5 The number of great natural catastrophesworldwide for the period 1950–2005 (Munich Re2005).
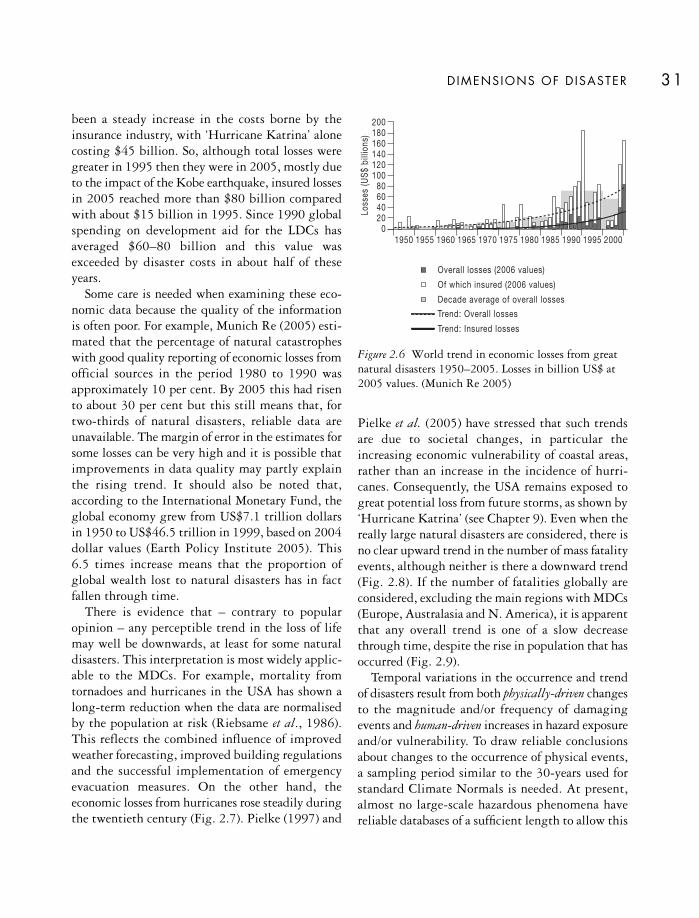
been a steady increase in the costs borne by theinsurance industry, with ‘Hurricane Katrina’ alonecosting $45 billion. So, although total losses weregreater in 1995 then they were in 2005, mostly dueto the impact of the Kobe earthquake, insured lossesin 2005 reached more than $80 billion comparedwith about $15 billion in 1995. Since 1990 globalspending on development aid for the LDCs hasaveraged $60–80 billion and this value wasexceeded by disaster costs in about half of theseyears.
Some care is needed when examining these eco-nomic data because the quality of the informationis often poor. For example, Munich Re (2005) esti-mated that the percentage of natural catastropheswith good quality reporting of economic losses fromofficial sources in the period 1980 to 1990 wasapproximately 10 per cent. By 2005 this had risento about 30 per cent but this still means that, fortwo-thirds of natural disasters, reliable data areunavailable. The margin of error in the estimates forsome losses can be very high and it is possible thatimprovements in data quality may partly explainthe rising trend. It should also be noted that,according to the International Monetary Fund, theglobal economy grew from US$7.1 trillion dollarsin 1950 to US$46.5 trillion in 1999, based on 2004dollar values (Earth Policy Institute 2005). This 6.5 times increase means that the proportion ofglobal wealth lost to natural disasters has in factfallen through time.
There is evidence that – contrary to popularopinion – any perceptible trend in the loss of lifemay well be downwards, at least for some naturaldisasters. This interpretation is most widely applic-able to the MDCs. For example, mortality fromtornadoes and hurricanes in the USA has shown along-term reduction when the data are normalisedby the population at risk (Riebsame et al., 1986).This reflects the combined influence of improvedweather forecasting, improved building regulationsand the successful implementation of emergencyevacuation measures. On the other hand, theeconomic losses from hurricanes rose steadily duringthe twentieth century (Fig. 2.7). Pielke (1997) and
Pielke et al. (2005) have stressed that such trendsare due to societal changes, in particular theincreasing economic vulnerability of coastal areas,rather than an increase in the incidence of hurri-canes. Consequently, the USA remains exposed togreat potential loss from future storms, as shown by‘Hurricane Katrina’ (see Chapter 9). Even when thereally large natural disasters are considered, there isno clear upward trend in the number of mass fatalityevents, although neither is there a downward trend(Fig. 2.8). If the number of fatalities globally areconsidered, excluding the main regions with MDCs(Europe, Australasia and N. America), it is apparentthat any overall trend is one of a slow decreasethrough time, despite the rise in population that hasoccurred (Fig. 2.9).
Temporal variations in the occurrence and trendof disasters result from both physically-driven changesto the magnitude and/or frequency of damagingevents and human-driven increases in hazard exposureand/or vulnerability. To draw reliable conclusionsabout changes to the occurrence of physical events,a sampling period similar to the 30-years used forstandard Climate Normals is needed. At present,almost no large-scale hazardous phenomena havereliable databases of a sufficient length to allow this
DIMENSIONS OF D ISASTER 31
160180200
140120100
80604020
01950 1955 1960
Loss
es(U
S$bi
llion
s)
1965 1970 1975 1980 1985 1990 1995 2000
Overall losses (2006 values)
Of which insured (2006 values)
Decade average of overall losses
Trend: Overall losses
Trend: Insured losses
Figure 2.6 World trend in economic losses from greatnatural disasters 1950–2005. Losses in billion US$ at2005 values. (Munich Re 2005)

type of analysis, although the construction ofmedium-term catalogues of earthquakes usinghistorical records is an important current activity.Short sampling periods can produce misleadingpatterns – notably on disaster impacts – because ofthe concentration in time of a few unrepresentativedisasters, such as the occurrence of some high-magnitude events during the 1970s. It is inevitablethat decadal-scale variations will occur in the hydro-meteorological processes responsible for manydisasters, such as tropical cyclones, the strength ofthe Asian monsoon and El Niño/La Niña. Evidenceis starting to emerge about these variations, andtheir links with longer-term climate change, but thepicture remains far from clear. Tectonic processesshould not display any noticeable variations onhuman timescales, and any coincidental clusteringof disparate events in time should not be over-interpreted. However, it has now been proposed bysome scientists that the transfer of stress from asection of fault that ruptures to an as yet unrupturedsection can be a mechanism that allows earthquakesto cluster in time.
Because the rate of change in socio-economicconditions is greater than that of large-scale naturalprocesses, there is general agreement that somehuman populations have become more vulnerableto hazards in recent years, despite the many positivesteps taken to reduce disasters (Changnon et al.,2000). Once again, some caution is necessary. Toproduce fully comparable data, it would be necessaryto standardise death totals according to the numberof people at risk (to compensate for populationgrowth) and to standardise the economic totals forprice inflation (to compensate for changes inmonetary value), and this is rarely done. However,while the numbers of fatalities from environmentalhazards as a whole – and from natural hazards inparticular – are probably declining slightly, thenumber of people affected by these events is rising(Guha-Sapir et al., 2004). As shown in Figure 2.9,there has been a clear increase in the number ofpeople affected by natural disasters since the mid-1980s. This increase matches the increasingrecording of natural disasters during this time.
There are various reasons why disaster impactmay increase, even if the frequency of extremegeophysical events remains unchanged:
THE NATURE OF HAZARD32
1900
1910
1920
1930
1940
1950
1960
1970
1980
1990–1995
1900
1910
1920
1930
1940
1950
1960
1970
1980
1990–1995
0
01,
000
2,00
03,
000
4,00
05,
000
6,00
07,
000
8,00
0
5,00
010
,000
15,0
00
20,0
00
25,0
00
30,0
00
35,0
00
Dec
ade D
ecade
Damage (billions 1990 US $)
Deaths
1970–1974
1975–1979
1980–1984
1985–1989
Num
ber
ofev
ents
1990–1994
1995–1999
2000–2004
876543210
Figure 2.7 Property damage and loss of life in thecontinental United States due to tropical cyclonesduring the twentieth century by decade. There is abroadly inverse relationship between damages anddeaths. After Pielke and Pielke (2000).
Figure 2.8 Trends in the occurrence of natural disastersresulting in the deaths of more than 10,000 peoplefrom 1970 to 2004, grouped in five-year periods.Adapted from CRED database.

Population growth
The overall number of people exposed to hazard isincreasing, largely because about 90 per cent of thegrowth is taking place in the LDCs. In thesecountries, human vulnerability is already highthrough dense concentrations of population inunsafe physical settings. Continued populationgrowth outstrips the ability of governments toinvest in education and other social services andcreates more competition for land resources. In thevery poorest countries, the human use of naturalresources has created a problem of food security andfragile livelihoods. Only a quarter of the people inAfrica have access to safe drinking water anddrought can lead to widespread famine. Yet, in allcountries where families survive by supplyinglabour and the oldest members depend on supportfrom the young, the pressure for large familiespersists. Conversely, the demographic trend in theMDCs is creating a rise in the elderly populationwho need specialist support in disaster. For example,in the UK about 70 per cent of the adults cate-gorised as disabled are aged 60 years or over.
Land pressure
It is estimated that about 850 million people live inareas suffering severe environmental degradation. Inmany LDCs more than 80 per cent of the populationis dependent on agriculture but many are denied anequal access to land resources. Poverty forces theadoption of unsustainable land-use practices, often
promoting deforestation, soil erosion and over-cultivation. Land subject to such problems is oftenmore vulnerable to hazards such as floods, landslidesand droughts. In many cases, governments try toovercome pressures on land resources throughincreases in the efficiency of farming practices. Such‘modernisation’ of agriculture often leads toenhanced problems. In the tropics, capital-intensiveplantation agriculture displaces farmers from theirland whilst the construction of reservoirs for irri-gation water reduces the seasonal flooding necessaryfor flood-retreat agriculture. Low-lying coasts havebeen made more vulnerable to storm surge by theclearance of mangrove forests for fish farming, saltproduction and tourist development. Inland, thedrainage of wetlands leads to a loss of commonproperty resources such as fisheries and forests. Asdietary habits change, traditional crops are likely tobe replaced with a consequent potential loss ofbiodiversity and genetic resources. These changes tothe agricultural base often result in populationmovements to urban centres.
UrbanisationRural-urban migration, driven by local land pres-sure and global economic forces, is concentratingpeople into badly built and overcrowded cities. Inparticular, the rise of the mega-city has created a new and daunting scale of hazard exposure(Mitchell, 1999). Some 20–30 million of the world’s poorest people move each year from rural tourban areas, driven by a perception of economic
DIMENSIONS OF D ISASTER 33
700 500450400
300250200150100500
600
500
400
300
Num
ber
ofm
illio
nsaf
fect
ed(x
1m
illio
n)
Num
berofdisasters
andnum
berofdeaths
(x1
thousand)
200
100
19741976
19781980
19821984
19861988
19901992
19941996
19982000
20020
Number of affected
Number of deaths
350
Figure 2.9 Overall trend in theoccurrence of the number of fatalitiesand the number of people affected bynatural disasters through time.Adapted from CRED database.

opportunity and, in many case, a desire to escaperural conflicts. Already some of these cities, exposedto destructive earthquakes and other hazards, havebetween one-third and two-thirds of their popu-lation in squatter settlements. According to Davis(1978) rural-urban migration can cause squattersettlements to double in size every 5–7 years, abouttwice as fast as the overall growth rate for cities inLDCs. The rural migrants generally represent thepoorest urban dwellers. In much of the Indiansubcontinent, for example, much of the rural-urbanmigration has been to cities with high seismicand/or windstorm risk. Apart from a location onunsafe sites, urban slums generally have poor watersupplies and sanitation. Coupled with poor diets,this results in inadequate nutrition and endemicdisease.
The problem is not restricted to the LDCshowever. In the MDCs coastal cities exposed tohurricanes have grown rapidly, often with littleconsideration of the threats posed by storm surgesand other perils. Others are located in seismicallyactive areas, like the west coast of the USA andJapan, where loosely compacted sediments orlandfill sites will perform poorly in earthquakes. Areal concern in many MDCs is the potential formassively destructive fires to break out in theaftermath of large earthquakes. Such fires proved tobe disastrous in the aftermath of the Kobe earth-quake but many earthquake-prone cities have littleor no preparedness for this threat.
THE NATURE OF HAZARD34
Plate 2.1 Extensive devastation at Aceh, northern Sumatra caused by the tsunami that affected much of South Asiaon 26 December 2004. Aceh was the closest landfall to the offshore earthquake and, in this area, only the mosqueremained standing. (Photo: Dermot Tatlow, PANOS)

Inequality
Disaster vulnerability is closely associated with theeconomic gap between rich and poor. Friis (2007)demonstrated that each year over 5 million childrenworldwide die because of an inadequate diet, whilstFAO (1999) estimated that about 800 millionpeople, which is one-sixth of the population ofLDCs, do not have access to sufficient food to leadhealthy, productive lives. In Asia and the MiddleEast, about one-third of the population lives inpoverty, a proportion that rises to nearly 50 per centin sub-Saharan Africa, where the number of food-insecure people has doubled since 1970. The UNhas reported that some 20 per cent of the globalpopulation controls 86 per cent of the global wealth(UNDP 1998). Indeed, the richest 225 people inthe world have combined assets that exceed $1trillion, more than the combined wealth of theworld’s 2.5 billion poorest people.
National disparities continue to increase, therebyexacerbating vulnerability. For example, in Chile thewealthiest 20 per cent of the population expandedtheir control of national income from around 50 percent to 60 per cent between 1978 and 1985. Overthe same period, the income share of the poorest 40per cent of the population fell from 15 per cent to10 per cent. (IFRCRCS, 1994). Whilst it is simpleto note that inequality is a key factor in vulner-ability, the reasons for this is less obvious. Relevantfactors include the actual levels of poverty, thefailure of effective insurance systems in poorcountries and the difficulties of implementingbuilding design codes. Some of these factors arereviewed in Chapter 4.
Climate changeGlobal warming will bring significant changes inthe world’s climate. Over the coming decades, theexpected temperature change will be greater andfaster than at any time in the past 10,000 years. Thelikely physical consequences range from morefrequent inundations of some low-lying coasts,especially where natural ecosystems such as saltmarsh or mangroves have been removed, to
increased river flow from snowmelt in alpine areas.It is probable that the most significant effects willbe experienced in countries highly dependent onnatural resource use and that they will influenceactivities such as agricultural development, forestry,wetland reclamation and river management. Futureshifts in disease patterns may threaten animal andhuman populations. The overall result is likely towiden the gap between LDCs and MDCs becausethe impacts will be most severe on ecosystemsalready under stress and for countries which havefew spare resources for adapting to, or mitigating,climate change.
Political change
The richest countries are reducing their commit-ments to internal welfare and to the internationalcommunity. For example, in many western count-ries, health spending per person has declined since1980 in real terms and the role of the welfare statehas been deliberately reduced. Over Eastern Europeand the former Soviet Union, the collapse of com-munism has removed the influence of the state withrespect to health care, education and social pro-vision. State paternalism has been replaced by anunregulated scramble towards free-market ideals inwhich the weakest members of society are ill-equipped to compete. For a number of years thevolume of development aid declined, resulting ingreater vulnerability as aid agencies were left to fillthe welfare role vacated by governments. Morerecently, this trend has been partially reversed andinternational commitments have been made toreducing global poverty through, for example, debtrelief. However, such pledges for the future aresubject to the vagaries of political realities at thetime and there is no guarantee that increases in aidwill be continued in the longer-term.
Economic growth
Economic growth, especially in the wealthycountries, has increased the exposure of property andinfrastructure to catastrophic damage. Along with
DIMENSIONS OF D ISASTER 35
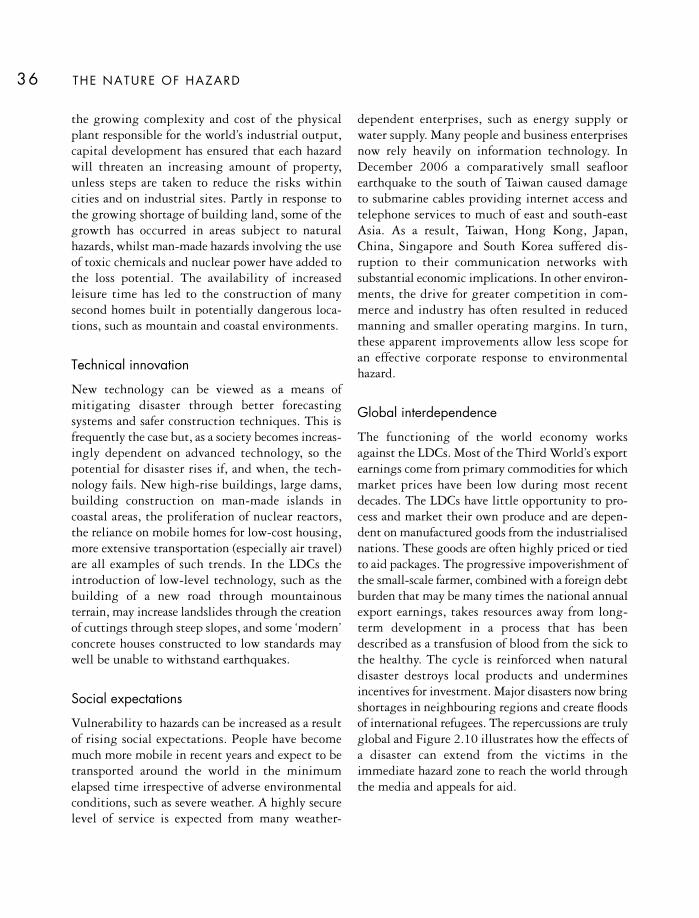
the growing complexity and cost of the physicalplant responsible for the world’s industrial output,capital development has ensured that each hazardwill threaten an increasing amount of property,unless steps are taken to reduce the risks withincities and on industrial sites. Partly in response tothe growing shortage of building land, some of thegrowth has occurred in areas subject to naturalhazards, whilst man-made hazards involving the useof toxic chemicals and nuclear power have added tothe loss potential. The availability of increasedleisure time has led to the construction of manysecond homes built in potentially dangerous loca-tions, such as mountain and coastal environments.
Technical innovation
New technology can be viewed as a means ofmitigating disaster through better forecastingsystems and safer construction techniques. This isfrequently the case but, as a society becomes increas-ingly dependent on advanced technology, so thepotential for disaster rises if, and when, the tech-nology fails. New high-rise buildings, large dams,building construction on man-made islands incoastal areas, the proliferation of nuclear reactors,the reliance on mobile homes for low-cost housing,more extensive transportation (especially air travel)are all examples of such trends. In the LDCs theintroduction of low-level technology, such as thebuilding of a new road through mountainousterrain, may increase landslides through the creationof cuttings through steep slopes, and some ‘modern’concrete houses constructed to low standards maywell be unable to withstand earthquakes.
Social expectations
Vulnerability to hazards can be increased as a resultof rising social expectations. People have becomemuch more mobile in recent years and expect to betransported around the world in the minimumelapsed time irrespective of adverse environmentalconditions, such as severe weather. A highly securelevel of service is expected from many weather-
dependent enterprises, such as energy supply orwater supply. Many people and business enterprisesnow rely heavily on information technology. InDecember 2006 a comparatively small seafloorearthquake to the south of Taiwan caused damageto submarine cables providing internet access andtelephone services to much of east and south-eastAsia. As a result, Taiwan, Hong Kong, Japan,China, Singapore and South Korea suffered dis-ruption to their communication networks withsubstantial economic implications. In other environ-ments, the drive for greater competition in com-merce and industry has often resulted in reducedmanning and smaller operating margins. In turn,these apparent improvements allow less scope for an effective corporate response to environmentalhazard.
Global interdependence
The functioning of the world economy worksagainst the LDCs. Most of the Third World’s exportearnings come from primary commodities for whichmarket prices have been low during most recentdecades. The LDCs have little opportunity to pro-cess and market their own produce and are depen-dent on manufactured goods from the industrialisednations. These goods are often highly priced or tiedto aid packages. The progressive impoverishment ofthe small-scale farmer, combined with a foreign debtburden that may be many times the national annualexport earnings, takes resources away from long-term development in a process that has beendescribed as a transfusion of blood from the sick tothe healthy. The cycle is reinforced when naturaldisaster destroys local products and underminesincentives for investment. Major disasters now bringshortages in neighbouring regions and create floodsof international refugees. The repercussions are trulyglobal and Figure 2.10 illustrates how the effects ofa disaster can extend from the victims in theimmediate hazard zone to reach the world throughthe media and appeals for aid.
THE NATURE OF HAZARD36

KEY READING
Barredo, J. I. (2007) Major flood disasters in Europe:1950–2005. Natural Hazards 42 (1): 125–48.Explores the difficulties associated with theconstruction of a database of flood disasters in a 56-year period in Europe.
Bull-Kamanga, L., Diagne, K., Lavell, A., Leon, E.,Lerise, F., MacGregor, H., Maskrey, A., Meshack,M., Pelling, M., Reid, H., Satterthwaite, D.,Songsore, J., Westgate, K. and Yitambe, A. (2003)From everyday hazards to disasters: the accumu-lation of risk in urban areas. Environment andUrbanization 15 (1): 193–203. This paper examinesthe links between disasters and urban development,highlighting the need for an understanding of riskthat encompasses events ranging from disasters toeveryday hazards.
Dilley, M., Chen, R. S., Deichmann, U., Lerner-Lam, A. and Arnold, M. (2005) Natural DisasterHotspots: A Global Risk Analysis. Washington, DC:World Bank Publications. Presents the findings ofthe Global Natural Disaster Risk Hotspots project,which sought to generate a global disaster riskassessment.
Guha-Sapir, D., Hargitt, D. and Hoyois, P. (2004)Thirty Years of Natural Disasters 1974–2003: TheNumbers. France: Presses Universitaires de Louvain,Louvain-la-Neuve. Provides a review of the scope ofnatural disasters on a global scale.
WEBSITES
Benfield Hazard Research Centre, London www.benfieldhrc.org
Centre for Research on the Epidemiology ofDisasters, Belgium www.cred.be
Dr Ilan Kelman’s databases on disaster impacts
http://www.ilankelman.org/disasterdeaths.html
UGSG Natural Hazards pages http://www.usgs.gov/hazards/
World Bank Natural Disaster Hotspots pageshttp://geohotspots.worldbank.org/hotspot/hotspots/disaster.jsp
DIMENSIONS OF D ISASTER 37
INCONVENIENCED
DEAD
INJURED
HOMELESS
DISRUPTED
TAX PAYERS
AID DONORS
MEDIA AWARE
HAZARDZONE
NATION
REGION
WORLD
Figure 2.10 A disaster impact pyramid.Awareness of the disaster spreads from thesmall number of people most directlyaffected in the hazard zone to the globalpopulation via the mass media.
INTRODUCTION
On 28 October 1998, ‘Hurricane Mitch’ madelandfall on the coast of Honduras as a Category 5hurricane – the strongest category of tropicalcyclone. Over the next three days it slowly crossedHonduras, Nicaragua and Guatemala leaving a trailof destruction caused by the strong winds and theexceptional rainfall (Fig. 3.1). The results weredevastating. By 2 November at least 11,000 peoplehad been killed and a similar number were reportedmissing. Most of the deaths occurred as a result ofmudslides and flash floods which also causedeconomic damage estimated at over US$5 billion inareas that were already poor. The storm left a legacyof destruction in Central America that is stillapparent today. Nine years later, on 4 September2007, ‘Hurricane Felix’, another Category 5 storm,made landfall on the border between Honduras andNicaragua at almost the same location as ‘Mitch’(Fig. 3.2). It also slowly tracked across Honduras,Nicaragua and Guatemala over the next few daysbringing strong winds and intense rainfall. But thistime, the losses were far less. For example, theestimated number of fatalities was about 135, lessthan 1 per cent of the number caused by ‘HurricaneMitch’. The economic damage represented just afraction of that caused by the previous storm.
Although the two hurricanes were of a similar sizeand intensity, and also followed similar tracks, thedisaster impact was vastly different. Why shouldthis be so? The response given by an observer to thisquestion will probably be influenced by the disasterparadigm to which he or she subscribes (see Chapter1). Those following the behavioural paradigm, inwhich the forces of nature are considered to be thedominant factor in disaster causation, wouldprobably argue that the actual strength of theprocesses experienced on the ground was different.For example, they might argue that the key factordetermining loss was the intensity and duration of rainfall and that this was much greater for‘Hurricane Mitch’ than for ‘Felix’. Consequently,more destructive floods and landslides occurred. On the other hand, a follower of the developmentparadigm would most likely believe that, althoughthe precipitation characteristics are important in storm impacts, the main cause of loss was thevulnerability of the local population and their assets. In this context, they might well claim that post-event disaster reduction measures, put inplace after ‘Hurricane Mitch’ had been successful in mitigating the impact of the second hurricane.Such measures might have included improvedbuildings located away from hazardous locations,better emergency responses and perhaps even a
3
COMPLEX ITY IN HAZARD AND DISASTER

COMPLEX ITY IN HAZARD AND DISASTER 39
BELIZE
NICARAGUA
COSTA RICA
EL SALVAD OR
GUATEMALA
04/11
03/11
30/10
28/10
27/10 26/1025/10
24/10
23/1022/10
HONDURASHONDURAS
U.S.A.
CUBA
05/11
04/11
03/11
02/11
01/1131/10 30/10
29/1028/10
27/10 26/1025/10
24/10
23/1022/10
MEXICO BELIZE
NICARAGUA
COSTA RICA
EL SALVADOR
HONDURAS
GUATEMALA
5000 km
Figure 3.1 The track of‘Hurricane Mitch’ as it passedover Honduras, Nicaragua andGuatemala in October andNovember 1998.
BELIZE
NICARAGUA
COSTA RICA
EL SALVAD OR
GUATEMALA01/0902/09HONDURASHONDURAS
5000 km
U.S.A.
CUBA
MEXICO BELIZE
NICARAGUA
COSTA RICA
EL SALVADOR
HONDURASGUATEMALA
01/0902/09
03/09
04/09
Figure 3.2 The track of‘Hurricane Felix’ as it passed overHonduras, Nicaragua andGuatemala in September 2007.

reduction in the number of people living in extremepoverty.
Such arguments are clearly over-simplistic butthey do illustrate the polarity of views offered by thetwo key paradigms of hazard and risk that havedominated the disaster scene over recent decades. Inthe last five years or so, researchers and disastermanagers have grown increasingly dissatisfied withthe limitations imposed by these two perspectives.As a result, the complexity paradigm, briefly intro-duced in Chapter 1, has started to emerge. Thisparadigm is based upon a much wider movement inthe natural and social sciences to embrace a conceptseen as increasingly important in disciplines asdiverse as physics, linguistics, oceanography, evolu-tionary biology, economics, political science andmathematics. It is presently a young and immaturefield but seems likely to have a major influence inthe future.
THE COMPLEXITY PARADIGM
Complexity theory originated in theoretical areas ofmathematics and physics in the late 1970s. Throughtime, it has evolved from an equation-based theoryinto a social science model and become increasinglyimportant in understanding the ways that humansystems operate. As the development of these ideasis not yet complete, this is a dynamic and excitingfield. The theory has, at its core, the idea of a systemconsisting of a group of components that, together,combine to produce some result. For example, asystem might be a river, a human society or even theglobal atmosphere. Although people have studiedthe ways in which systems operate for many years,the general approach taken was to simplify themodel as much as possible by using basic equationsto simulate the inputs, outputs and internal flowsassociated with the system. In this sense, theoristshave tended to look at natural or social systemsalmost as a machine that has been designed toproduce an observed output.
For example, a river can be seen as a mechanismfor delivering water from the interior of a landmass
to the coast. Of course, this is not really the case asthe river has not been designed; it has formednaturally and its various components have evolvedas the river system itself has developed. Once thesystems model has been created, it is quite easy tomodel the way it operates. Since different compo-nents interact to produce a ‘designed result’, themodel can be used to simulate the effects of changesin the components or in the materials entering orleaving the system. For example, a river systemmodel can simulate the effects of increased rainfall(a change in the input) or a straightening of thechannel (a change in the components) on the riverflow. Unfortunately, such models offer only rela-tively crude representations of natural and humansystems working in the real world.
Complexity theory is a possible means ofreducing this over-simplification. The approachstarts from the premise that real-world systemsconsist of large numbers of individual elements,each of which interacts with many other elementsin a variety of ways. It is recognised that theseelements cannot be simplified by grouping themtogether – as is done in traditional systems theory– and that the individual interactions between thecomponents are often important and complex. Thismight suggest that many natural and social systemsare too complicated to understand but this is not thecase. Although a system consists of many com-ponents, very few, if any, of the individual compo-nents can change the overall system in a substantialmanner. What is important is that each element canaffect those elements with which it interacts andthat these interactions determine the state of theoverall system. In complexity theory, any modellingof the system requires that the interactions betweenthe components are understood. It is the interactionsbetween components – rather than the componentsthemselves – which create what is termed emergentbehaviour and the final model output.
Complexity theory can be applied to environ-mental hazards on the basis that disasters result fromthe interactions that occur between, and within, thenatural and social worlds. This is a more holistic wayof viewing risk than the more established paradigms
THE NATURE OF HAZARD40

COMPLEX ITY IN HAZARD AND DISASTER 41
because complexity encourages consideration of theinteractions within the social system (complexitywithin a population affected by a hurricane), inter-actions within the hurricane itself (complexitywithin the atmosphere) and the interactionsbetween the atmosphere and the human population.To some extent, complexity theory builds on thefoundations of the two more-established paradigmsand, arguably, incorporates the best elements ofboth.
Hurricane ‘Mitch’ was one of the first disasters tobe interpreted within the framework of complexity.Comfort et al. (1999) examined the underlyingreasons why this event caused such devastation,although the focus was almost solely on the socialcomponents of the disaster. It was argued thatindividuals, organisations and governments inter-acted in highly complex – but essentially unin-formed ways – that sometimes led to failures ofenvironmental, technical and organisational systemsunder the stresses imposed by the hurricane. To befully relevant, the complexity paradigm has to betaken beyond the social sciences. In reality, the‘Hurricane Mitch’ disaster – like most others – wascaused by highly complex interactions within, andbetween, the natural and social systems of thevarious countries involved. Each of the interactingfactors might have operated within a range that wasnot, in itself, exceptional but particular coincidencesled to a disastrous outcome. If any of the contri-buting factors had been different, the outcome couldwell have been different. In some future Category 5hurricane, the factors will almost certainly interactdifferently and a larger (or a smaller) disaster islikely to occur.
COMPLEXITY AND EMERGENTBEHAVIOUR
Emergent behaviour describes how the output froma system evolves from the interactions between thecomponents. An example is a football league table.The positions of the teams, at the end of each season,are determined by all the interactions (matches)
during the season. It is impossible to predict theresults of the individual matches with certaintybecause each depends on a range of complex factors,such as the weather, the health of the players, thejudgement of the referee, etc. Some results are easierto predict than others. It is easier to predict theresult for a good team matched against a poor teamthan it is to predict the outcome of a game betweentwo poor teams. The form of the final table is alsopredictable within limits. The league champions areusually drawn from perhaps two or three top teamsand the team that comes bottom is rarely a majorsurprise. Thus, although the interaction of thecomponents is difficult to understand, the emergentbehaviour of the system is easier to forecast.
Just occasionally a football league table throws upa major surprise. For example, a team that wasconsidered to be very good may suddenly collapseand finish bottom. A weak team may have a late-season winning streak and finish in the top four. Theexperience of the good team finishing bottom mightoccur because of an unforeseeable combination of events, perhaps several key players becominginjured at the same time. The team starts to lose.The players then lose confidence at the same time astheir opponents begin to believe that they can bebeaten. The effect is a spiral of decline that is hardto stop, resulting in a disastrous outcome, at leastfor that team.
In summary, complexity is the individual inter-actions between the elements in a system whilstemergence is the behaviour that results and is oftenforecastable. From time to time, a ‘surprise’ emerges(i.e. an unforseen event occurs) as a result of theseinteractions. This can be termed ‘chaos’ (see Box3.1). Of course, in comparison with most humanand natural systems, a football league table is a verysimple system. The global climate, rainforest bio-diversity, river floods, political systems and eco-nomic indicators, are all highly complex systems butwith some forecastable outcomes. For example, inthe case of a national economy, countless financialdecisions are made by individual commercial organ-isations, government agencies and people but thecumulative outcome that results is often quite

stable. Just occasionally, the system goes through ashock that was not foreseen – like a stock marketcrash – as a result of these interactions within thesystem.
Most natural and human systems undergo spec-tacular upheavals from time to time. These largeshifts are sometimes foreseen but they may alsooccur as a surprise to everyone. For example, thereis considerable evidence that the Earth’s climate hasundergone sudden, radical changes in the past andAdams et al. (1999) described how conditionschanged during the end of the Younger Dryasperiod, a phase of intensely cold temperatures about12,000 years ago. At that time, temperatures in theUK were as much as 5°C colder than at present fora period of about 600 years. However, this coldperiod ended abruptly and, over a period of just 40years, the climate warmed by as much as 7°C (Tayloret al., 1997). Political and economic systems havealso undergone rapid change in historic times.Examples include the collapse of communism across
most of Eastern Europe and the Soviet Union around1989 and the global economic crisis, known as theWall Street Crash, in 1929.
Traditional attempts to explain such rapidchanges have relied on relatively simple cause-and-effect relationships. For example, the Younger Dryaswarming has been attributed to a sudden reduc-tion in the amount of solar energy reaching theEarth. Complexity theory suggests that we should examine these events in a different way. Thus, theglobal climate can be seen as the result of complexinteractions between the many elements in theearth-atmosphere system. If the system starts tochange, the interactions will also change. The resultmight be an amplification of a change that is alreadyunderway. In this situation, a minor change in oneelement may cause changes in other componentssufficient to trigger a cascade throughout the systemthat produces a major overall change. In the case ofthe Younger Dryas warming, the initial warmingmay have been triggered by an increase in solar
THE NATURE OF HAZARD42
Complexity and theory are overlapping scientificways in which to look at complex processes. Chaostheory developed in response to a need to under-stand how apparently simple systems coulddevelop very complex styles of behaviour. The keypioneer was an American meteorologist called EdLorenz who, in the 1960s, was trying to use whatwas – by today’s standards – a very simple com-puter to run a simulation of the weather. He foundthat minute changes in the input parameters ledto big changes in the outcomes of the model as theeffects became magnified through the model. Thisis now often called the butterfly effect. Thisenvisages that a butterfly flapping its wings inEurope might eventually create a cascade effect inthe atmosphere sufficient to change the trajectoryof a typhoon in Asia.
Complexity theory looks at the same problem butfrom a different perspective. Complexity theoryrecognises that although there are billions ofbutterflies in the world, each flapping its wingsthousands of times, typhoons occur every year inAsia at times that are fairly predictable and inwell-known locations. Therefore, complexity isconcerned with how highly complicated systemscan generate simple outcomes. It looks at how thebehaviour of the system emerges from the complexinteraction of the components through a processthat is called self-organisation. The way in whichmillions of individual people interact to create acity that usually functions with clearly definedstructures is an example of self-organisation.
Box 3.1
COMPLEXITY AND CHAOS

COMPLEX ITY IN HAZARD AND DISASTER 43
activity. The increased energy output then causedpositive feedback loops to operate and accelerate thewarming process, leading to an abrupt shift in themean global temperature.
In the vast majority of cases, minor changes donot propagate through the system and amplifychange in this manner. It is much more usual for aninitial change in one component to be damped-outby other elements within the system. This leads torelatively predictable emergent behaviour. On theother hand, it is known that sudden large-scaleshifts can take place and it is important to under-stand the processes involved. All too often, suchshifts are regarded as aberrations indicating that, in some way, the system has broken down. In fact,such events are better viewed as evidence that thesystem is operating, perhaps temporarily, in a new way.
COMPLEXITY AND DISASTERS
How can the complexity paradigm be applied to aidthe understanding of environmental hazards, riskand disasters? The concept is already used todescribe the workings of some natural and socio-economic systems. For example, an earthquakemight be considered as the result of a minor ruptureon a fault plane that then triggers other ruptures,setting off a cascade of seismic stress along the faultthat we recognise as the damaging event. Similarly,a thunderstorm may originate as a small pocket ofair that is forced to rise by convection but thencreates wider instability that develops into a storm.Socio-economic systems are also characterised bycomplexity as exemplified in the fluctuating valueof shares on the stock market and the way obscurewebsites sometimes become global phenomenaalmost over-night.
Disasters occur at the interface between natural,or quasi-natural, systems and human systems.Therefore, it is logical to suggest that the inter-actions between human and natural systems can alsobe characterised by complexity. This feature can beillustrated using a model of DNA. In Figure 3.3,
the social and physical systems are shown as twostrands that are twisted together to form the well-known double helix. Linking the strands togetherare numerous interactions which serve to shape thestructure. The strands and the interactions betweenthem together form the physical-human structurethat emerges, in much the same way that the DNAstructure forms the building blocks for life.Although previous paradigms have emphasisedeither one strand or the other, the complexityparadigm accords them equal weight and clearlyemphasises the links between them.
Human system
Physical system
Interconnectivity
Figure 3.3 The DNA model ofcomplexity in disastercausation. The model viewsdisaster causation in the sameway as DNA underpins life. ForDNA, two strands of DNA arejoined and intertwined. In thedisaster model, one strandrepresents the social system andthe other the natural system.The two strands are twistedtogether to form the doublehelix, representing the fact thatthe two elements are inherentlyinterwoven and interlinked.Disasters arise not from onestrand or the other, but fromthe complex interactionsbetween them.
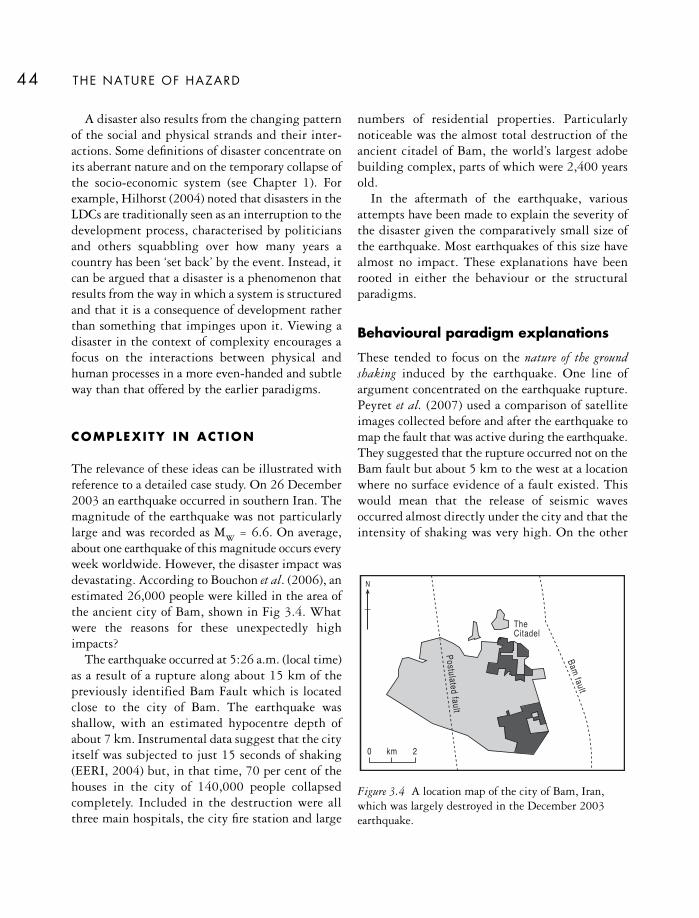
THE NATURE OF HAZARD44
A disaster also results from the changing patternof the social and physical strands and their inter-actions. Some definitions of disaster concentrate onits aberrant nature and on the temporary collapse ofthe socio-economic system (see Chapter 1). Forexample, Hilhorst (2004) noted that disasters in theLDCs are traditionally seen as an interruption to thedevelopment process, characterised by politiciansand others squabbling over how many years acountry has been ‘set back’ by the event. Instead, itcan be argued that a disaster is a phenomenon thatresults from the way in which a system is structuredand that it is a consequence of development ratherthan something that impinges upon it. Viewing adisaster in the context of complexity encourages afocus on the interactions between physical andhuman processes in a more even-handed and subtleway than that offered by the earlier paradigms.
COMPLEXITY IN ACTION
The relevance of these ideas can be illustrated withreference to a detailed case study. On 26 December2003 an earthquake occurred in southern Iran. Themagnitude of the earthquake was not particularlylarge and was recorded as MW = 6.6. On average,about one earthquake of this magnitude occurs everyweek worldwide. However, the disaster impact wasdevastating. According to Bouchon et al. (2006), anestimated 26,000 people were killed in the area ofthe ancient city of Bam, shown in Fig 3.4. Whatwere the reasons for these unexpectedly highimpacts?
The earthquake occurred at 5:26 a.m. (local time)as a result of a rupture along about 15 km of thepreviously identified Bam Fault which is locatedclose to the city of Bam. The earthquake wasshallow, with an estimated hypocentre depth ofabout 7 km. Instrumental data suggest that the cityitself was subjected to just 15 seconds of shaking(EERI, 2004) but, in that time, 70 per cent of thehouses in the city of 140,000 people collapsedcompletely. Included in the destruction were allthree main hospitals, the city fire station and large
numbers of residential properties. Particularlynoticeable was the almost total destruction of theancient citadel of Bam, the world’s largest adobebuilding complex, parts of which were 2,400 yearsold.
In the aftermath of the earthquake, variousattempts have been made to explain the severity ofthe disaster given the comparatively small size ofthe earthquake. Most earthquakes of this size havealmost no impact. These explanations have beenrooted in either the behaviour or the structuralparadigms.
Behavioural paradigm explanations
These tended to focus on the nature of the groundshaking induced by the earthquake. One line ofargument concentrated on the earthquake rupture.Peyret et al. (2007) used a comparison of satelliteimages collected before and after the earthquake tomap the fault that was active during the earthquake.They suggested that the rupture occurred not on theBam fault but about 5 km to the west at a locationwhere no surface evidence of a fault existed. Thiswould mean that the release of seismic wavesoccurred almost directly under the city and that theintensity of shaking was very high. On the other
N
20 km
Postulated fault
TheCitadel
Bamfault
Figure 3.4 A location map of the city of Bam, Iran,which was largely destroyed in the December 2003earthquake.

COMPLEX ITY IN HAZARD AND DISASTER 45
hand, Bouchon et al. (2006) argued that the ruptureinitiated on a fault to the south of the city and thenpropagated northwards. This directed the earth-quake straight at the urban area and this wasresponsible for the high level of ground shaking.
Whichever of these mechanisms is correct – andnote that they are not mutually exclusive – the netresult was the unusually high intensity of groundshaking at Bam. A strong motion seismometerlocated within the city recorded peak ground acceler-ations of about 0.8 g in an east-west direction, 0.7 gnorth-south and 0.98 g vertically (Ahmadizadeh andShakib, 2004). These are high values, notably in thevertical direction. The earthquake damage zone was only about 16 km2, a fact supporting the viewthat the disaster was caused by localised shakingintensities that coincided with the city. The United
Nations damage assessment team estimated thatsome 90 per cent of the building stock of the citysuffered damage in the range 60–100 per cent whilstthe remaining 10 per cent of buildings weredamaged by 40–60 per cent (EERI, 2004). Amongstother things, this suggests that the intensity ofshaking was sufficiently high to ensure that mostbuildings would have been destroyed, even if theyhad been seismically reinforced.
Development paradigm explanations
These emphasised the exceptional vulnerability of thebuildings to the earthquake stress. As in mostearthquakes, the vast majority of the fatalities weredue to collapsed buildings. Particular attention hasbeen drawn to the loss of life under the adobe
Plate 3.1 A young boy, with his siblings, cycles through a neighbourhood of Bam, Iran, severely damaged by theearthquake of December 2003. Thousands of adobe-built houses were destroyed and over 30,000 people werekilled. (Photo: Shehzad Noorani/Majority World, STILL PICTURES)

buildings in the Bam citadel (EERI, 2004).However, Langenbach (2005) noted that, althoughthe vast majority of adobe buildings did collapse,the loss of life was not confined to these structures.In the citadel itself, only three people were trappedin the rubble, one of whom was successfully rescued.Some domestic residences were also constructed inthis way. When collapse occurred almost no voidswere left in the structure, so that few people sur-vived burial. Perhaps surprisingly, the vast majorityof fatalities occurred in buildings that were less than30 years old. One substantial and well-constructed,fired-brick structure within the citadel and erectedpost-1974 survived without any evidence ofcracking.
The adobe structures collapsed for two chiefreasons. First, recent reconstruction of older,traditionally built, adobe structures was of poorquality. Indeed, older, unrepaired buildings faredmuch better than did sections that had beenreconstructed in the late twentieth century. Kiyonoand Kalantari (2004) and Ahmadizadeh and Shakib(2004) examined the causes of collapse in adoberesidential buildings and found that the cementused in their construction contained too much sand.Adobe buildings typically have very heavy roofs andno reinforcement of the walls. When even a singlewall collapsed, the roof fell in and led to the destruc-tion of the entire building. Second, many structureshad experienced extensive damage from termiteactivity that also weakened them. During theshaking, these weakened walls effectively burst openand collapsed.
The poor performance of most buildings in theBam earthquake highlights the inadequate appli-cation of the Iranian seismic building code. The Bamarea had suffered no previous large earthquake inhistoric times and, although the Bam fault had beenidentified, the area was not considered to be at highseismic risk. The lack of code enforcement interactedwith the vulnerability of the buildings and with themechanics of the earthquake to create disaster.
Apart from the poor quality of the building stock,certain factors associated with the lack of preparednessof the authorities also contributed to the disaster.
Akbari et al. (2004) noted that, during theearthquake, all three main hospitals, 100 per centof urban health centres and 95 per cent of ruralhealth centres were destroyed. One-fifth of healthprofessionals in the area were killed and most of theremainder were incapable of providing support dueto injuries and post-traumatic stress disorder.Although rescue teams were quickly mobilised, theystruggled to reach the stricken area for the first two nights. Many of those injured did not receiveurgently needed medical attention and died.Interviews with nurses engaged in primary care afterthe earthquake suggest that the medical provisionwas also hindered by the lack of prior training of thehealth professionals and a lack of coordination,especially where overseas health teams were involved(Nasrabadi et al., 2007).
The initial search and rescue operations werehindered by the destruction of facilities belongingto the emergency services. EERI (2004) noted thatthe main fire station in Bam collapsed, crushing thefire engines and killing some firefighters. Mosttrapped people were rescued by other survivors, withmuch of the work conducted manually. The firstorganised rescue teams did not arrive until nightfallon the first day, twelve hours after the earthquakeand their operations did not really start until thenext morning. Night-time in Bam during Januaryis very cold, with temperatures dropping sub-stantially below freezing, and it is likely that asubstantial number of trapped victims died ofhypothermia during this first night (Moszynski2004). Although they generated a great deal ofpublicity, the impact of the international rescueteams was limited. A total of 34 international teamsarrived in Bam from 27 countries, but in total theysaved just 22 people. In contrast, it is estimated thatlocal people recovered over 2,000 people fromdamaged buildings in the first few hours after theevent (EERI 2004).
There was also a notable lack of coordinationbetween the international agencies and the Iranianarmy. Under legislation passed in 2003, the IranianRed Crescent Society was mandated to play the leadrole in the disaster response. In practice, this led to
THE NATURE OF HAZARD46

COMPLEX ITY IN HAZARD AND DISASTER 47
serious tensions with the Iranian army, especiallyover the use of aircraft, which further hindered therescue and recovery effort (IFRCRCS, 2004).
The Bam Earthquake from a complexity perspective
A re-examination of the Bam earthquake from acomplexity perspective avoids some simplisticinterpretations of the disaster. Complexity theorycan be used to understand the occurrence of theearthquake itself. For example, some authors haveconsidered earthquakes to result from complexinteractions between structures and stresses in afault zone (Shaw, 1995). But the Bam earthquake isinteresting mainly because the impact of the eventwas so severe relative to the physical magnitude. Itis in understanding the disaster impacts thatcomplexity theory offers most insights.
It is possible to visualise this disaster using theSwiss Cheese model (see Box 3.2). In order for theearthquake to become a disaster, a series of inter-acting and cumulative events had to occur. If any ofthese events had occurred in a different way, theoutcome at Bam would also have been different. Thefollowing events were required for the earthquaketo become a major disaster:
1 The rupture dynamics The Bam earthquakerupture occurred not on the known fault but5km to the west and closer to the city. Thismeant that the intensity of the shaking at Bamwas more intense. If the rupture had occurred onthe main fault, the nature of the shaking at Bammight have been different and the disasterpossibly averted.
2 The direction of rupture The rupture started fromthe south and progressed northwards towardsBam. This directed the earthquake waves at thecity. If the rupture had started in the north, andpropagated southwards, the magnitude of shak-ing would have been lower.
3 The timing of the rupture The earthquake occurredat about 5:30 a.m., when most people were asleepin their houses. The collapse of the buildings
appears to have occurred over a period of about15 seconds, giving the population very littlechance to escape. If the earthquake had struckduring the day, fewer people would have beenindoors and been able to move to safer locations.Most importantly, because most of the industrialbuildings performed well in the earthquake,more people would have survived if they hadbeen at work (EERI, 2004).
4 Structural integrity of buildings There is evidencethat many of the adobe buildings collapsed as aresult of damage caused by termite infestations.Comparatively simple measures to protect againstthis threat would have reduced the number ofbuilding failures. More modern constructionpractices appear to have fared even worse. Aproper application of the appropriate buildingcode could have prevented the destruction ofsome of these structures.
5 The cold nights The sub-zero night-time tempera-tures in mid-winter probably killed peopletrapped within the rubble. If the earthquake hadoccurred during a different season, especiallyspring or autumn, the warmer temperatureswould have prevented some deaths.
6 The loss of medical facilities The almost completedestruction of the local medical facilities meantthat emergency assistance was not available tovictims in the crucial hours immediately after theearthquake. This inevitably had a large impacton survival rates.
7 The response of the authorities The longer-termemergency response by both national and inter-national agencies was sub-optimal and this alsocontributed to the low survival rate after theearthquake.
The occurrence of each of the first five of the abovefactors was crucial for the earthquake to cause thegreat level of destruction. If any of these factors hadoperated in a different way – for example, if theearthquake had occurred at a different time of day,if the rupture had propagated from the north, if thebuildings had been stronger, or if the night-timetemperatures had been less cold, then the outcome
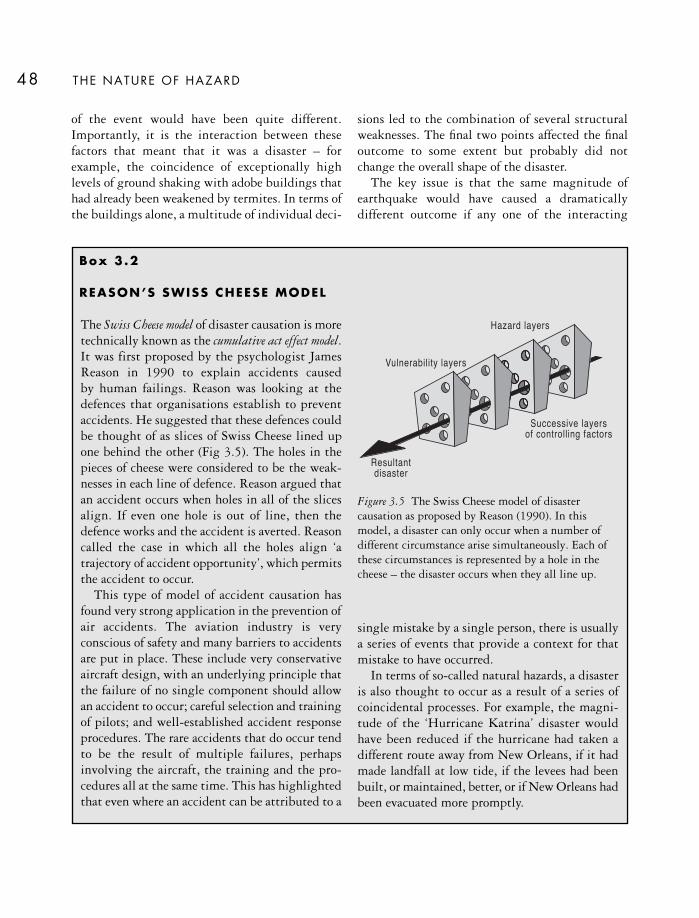
of the event would have been quite different.Importantly, it is the interaction between thesefactors that meant that it was a disaster – forexample, the coincidence of exceptionally highlevels of ground shaking with adobe buildings thathad already been weakened by termites. In terms ofthe buildings alone, a multitude of individual deci-
sions led to the combination of several structuralweaknesses. The final two points affected the finaloutcome to some extent but probably did notchange the overall shape of the disaster.
The key issue is that the same magnitude ofearthquake would have caused a dramaticallydifferent outcome if any one of the interacting
THE NATURE OF HAZARD48
The Swiss Cheese model of disaster causation is moretechnically known as the cumulative act effect model.It was first proposed by the psychologist JamesReason in 1990 to explain accidents caused by human failings. Reason was looking at thedefences that organisations establish to preventaccidents. He suggested that these defences couldbe thought of as slices of Swiss Cheese lined upone behind the other (Fig 3.5). The holes in thepieces of cheese were considered to be the weak-nesses in each line of defence. Reason argued thatan accident occurs when holes in all of the slicesalign. If even one hole is out of line, then thedefence works and the accident is averted. Reasoncalled the case in which all the holes align ‘atrajectory of accident opportunity’, which permitsthe accident to occur.
This type of model of accident causation hasfound very strong application in the prevention ofair accidents. The aviation industry is veryconscious of safety and many barriers to accidentsare put in place. These include very conservativeaircraft design, with an underlying principle thatthe failure of no single component should allowan accident to occur; careful selection and trainingof pilots; and well-established accident responseprocedures. The rare accidents that do occur tendto be the result of multiple failures, perhapsinvolving the aircraft, the training and the pro-cedures all at the same time. This has highlightedthat even where an accident can be attributed to a
single mistake by a single person, there is usuallya series of events that provide a context for thatmistake to have occurred.
In terms of so-called natural hazards, a disasteris also thought to occur as a result of a series ofcoincidental processes. For example, the magni-tude of the ‘Hurricane Katrina’ disaster wouldhave been reduced if the hurricane had taken adifferent route away from New Orleans, if it hadmade landfall at low tide, if the levees had beenbuilt, or maintained, better, or if New Orleans hadbeen evacuated more promptly.
Box 3.2
REASON’S SWISS CHEESE MODEL
Hazard layers
Vulnerability layers
Resultantdisaster
Successive layersof controlling factors
Figure 3.5 The Swiss Cheese model of disastercausation as proposed by Reason (1990). In thismodel, a disaster can only occur when a number ofdifferent circumstance arise simultaneously. Each ofthese circumstances is represented by a hole in thecheese – the disaster occurs when they all line up.

factors listed above had been different. The recog-nition that disasters emerge as a consequence of theinteraction of a series of factors is now commonlyused in some areas of risk planning. In particular,the aviation industry, which has a strong interest inunderstanding the processes of accident causation,has adopted this approach. It is also used by emer-gency planning agencies and within the medicalprofession when considering patient safety.
COMPLEXITY AND DISASTERREDUCTION
It is sometimes argued that this approach rendersthe understanding of disaster impacts a hopelesstask because the complexity of the interactions thatcause the disaster are essentially unknowable and,therefore, disasters are unpreventable. However,those adopting the complexity paradigm believethat knowledge of the inherent complexity withinsystems provides an insight into their operation andtheir management. For example, the complexitymodel suggests that disasters often occur as a resultof a catastrophic chain of events. Breaking this chainwould prevent, or at least reduce, the scale of thedeveloping disaster. In the case of Bam, some of theelements in the chain could not be altered (e.g. thetiming of the earthquake) but others could (e.g. thetermite infestation of the buildings). These methodshave been used to examine the likely impact of otherlarge hazard events. For example, Comfort (1999)examined the management of seismic crises from acomplexity perspective, arguing that, because theinteractions between individuals and agencies definethe effectiveness of disaster response, so the designof management structures should reflect this. Forexample, it is important to ensure that communi-cation links are well-established, resilient anddynamic before the event.
Above all, the application of the complexityparadigm provides a framework for environ-mental hazard mitigation that is genuinely inter-disciplinary, encouraging natural and social scient-ists to work together. It encourages breaking the
constraints of the traditional paradigms. Forexample, it requires natural scientists to recognisethe importance of socially-based approaches to riskreduction and to help to formulate them. Itencourages social scientists to recognise that, insome cases, a better understanding of the hazarditself will greatly assist in risk reduction, and thatmeasures to address the physical process might berequired. For too long a schism has existed betweenthese two groups. The possibility that they mightbecome more integrated is to be welcomed.
FURTHER READING
Byrne, D. (1998) Complexity Theory and the SocialSciences. London: Routledge.
Eve, R. A., Horsfall, S. and Lee, M. E. (1997) Chaos,Complexity and Sociology: Myths, Models and Theories.London: Sage Publications.
Hilhorst D. (2004) Unlocking domains of disasterresponse. In G. Bankoff, G. Frerks and D. Hilhorst(eds) Mapping Vulnerability: Disasters, Development andPeople, pp. 52–66. London: Earthscan Publications.
Vranes, K. and Czuchlewsk, K. R. (2003) Integratingcomplexity of social systems in natural hazardsplanning: an example from Caracas,Venezuela. Eos 84: 6.
WEB L INKS
A non-technical explanation of Chaos andComplexity http://complexity.orconhosting.net.nz/
Earthquake Engineering Research Instute report onthe Bam Earthquake http://www.eeri.org/lfe/iran_bam.html
USGS reports on ‘Hurricane Mitch’ http://landslides.usgs.gov/research/other/hurricanemitch/and http://vulcan.wr.usgs.gov/Projects/HurricaneMitch/framework.html
COMPLEX ITY IN HAZARD AND DISASTER 49
THE NATURE OF R ISK
It is often said that the Chinese word for risk, wei ji,combines the characters meaning ‘danger’ and‘opportunity’. Another interpretation is ‘precariousmoment’. What is important is that both trans-lations show that risk is not a purely negativeconcept and that uncertainty usually involves somebalance between profit and loss. Indeed, the globalfinancial and insurance markets, upon which theglobal economy depends and which are a source ofenormous fortunes for some, are essentially risk-driven. The reality is that there is some riskassociated with every aspect of life. Such risk cannotbe eliminated but it can be assessed and managed inorder to reduce the impacts of disaster.
Risk assessment is a key part of this process,involving the evaluation of the significance of a risk,either quantitatively or qualitatively. Quantitativerisk assessment is increasingly expressed as:
RISK = Hazard × Elements at Risk × Vulnerability.
Quantitative risk assessment is a process understoodby only a minority of the public and has not evenbeen attempted for all environmental hazards. Evenwhen risks have been quantified, the level ofuncertainty associated with the estimate is usuallyhigh. It is clear that all estimates of risk need to be
expressed in a way that is more accessible to laypeople because great care is needed to explain whatis meant by the uncertainties associated with anyestimate.
In terms of disaster reduction, the main practicalprocess is risk management which aims to lower thethreats from known hazards whilst maximising anyrelated benefits. Potentially, almost every person andorganisation has something to contribute to riskmanagement but achieving optimum safety involvescontroversial value judgements. There are majordifficulties in deciding what is an acceptable levelof risk, who benefits from risk assessment andmanagement, who pays and what constitutes successor failure in risk reduction policy.
As Keeney (1995) stated, a sound approach to riskrequires both good science and good judgement.Neither risk assessment nor risk management canbe divorced from choices that, in turn, are condi-tioned by both individual beliefs and circumstances,and by the complexity of the wider society. Mostpeople make decisions and take actions abouthazards based on their personal perception of theassociated risk. Therefore, risk perception has to beregarded as a valid component of risk managementalongside more scientific assessments. Distinctionsare often drawn between objective and perceived risks.This is because individuals perceive risks intuitively
4
R ISK ASSESSMENT AND MANAGEMENT
R ISK ASSESSMENT AND MANAGEMENT 51
and often quite differently from the results obtainedby more objective assessments that are based onfinancial cost–benefit models (Starr and Whipple,1980). Care must be taken to ensure that it is notassumed that an objective risk is necessarily corrector that it always leads to better outcomes than thosebased on perceived risk. The history of risk assess-ment is littered with examples in which technicalassessments have proven to be incorrect. Resolvingthe conflict between the outcome of technical riskanalysis and more subjective risk perception is amajor problem in hazard management.
The type and degree of perceived risk variesgreatly according to location, occupation and life-style, even between individuals of the same age andgender, and also between nations (Rohrmann,1994). Furthermore, perceived risk is highlydynamic on all time-scales. For example, theperception of the risk of terrorism increased greatlyin the aftermath of the 11 September 2001 attacksin the USA, even though, in reality, the risk fromterrorism to any particular citizen remains very lowwhen compared with more common threats.
When dealing with individuals, it is common toclassify risks into two main categories:
• Involuntary risks are those associated withactivities that happen to us without our priorknowledge or consent. As such they are oftenseen as external to the individual. So-called ‘Acts of God’, such as fires or being struck bylightning or a meteorite are considered to beinvoluntary risks, as is exposure to environmentalcontaminants. Sometimes these risks are per-ceived by the individual but they are often seenas inevitable or uncontrollable, as in the case of earthquakes. Most of the hazards considered in this book represent involuntary risks toindividuals as consequences of living in a hazard-prone environment.
• Voluntary risks are those associated with activitiesthat we decide to undertake, such as driving acar, riding a motorbike or smoking cigarettes.These risks, which are willingly accepted bya particular individual, are generally more
common and controllable. Also, since they areundertaken on an individual scale, they have lesscatastrophe-potential. The scope for control ofvoluntary risk is usually exercised either throughmodifications of individual behaviour (forexample, by stopping smoking or ceasing parti-cipation in a dangerous sport) or by governmentaction (for example, the introduction of safetylegislation such as a requirement to wear a crashhelmet when riding a motor cycle). Human-induced hazards, including risks from tech-nology, are usually placed in this group.
This division between risk categories is less clearthan it appears. For example, while cigarettesmoking and mountain climbing are obvious casesof voluntary lifestyle activities, the same cannot beso firmly stated for driving a car, which may be anessential form of transport for people in remoteareas. The alternative to working in a dangerouschemical factory may be unemployment. In otherwords, a risk is more voluntary than another risk ifits avoidance is connected with a greater personalsacrifice on the part of the risk-bearer. Somefloodplain dwellers may elect to buy a home that ischeaper than an equivalent property in a safer partof town. Such a decision can be both voluntary andeconomically rational. These issues are furthercomplicated by the poor levels of knowledge thatmost people have of the actual levels of voluntaryrisk. Poor understanding means that, in many cases,the decisions made are not rational in terms of thefacts.
Most people react differently to voluntary risks compared to risks imposed externally. In apioneering study of public attitudes towards varioustechnologies, Starr (1969) attempted a correlationbetween the risk of death to an individual, expressedas the probability of death per hour of exposure toa certain hazardous activity (Pf), and the assumedsocial benefit of that activity converted into a dollarequivalent. Figure 4.1 shows that there were majordifferences between voluntary and involuntary risks,with people being willing to accept voluntary riskswith a Pf value approximately 1,000 times greater

than that of involuntary risks. Voluntary risks suchas driving, flying and smoking were accepted eventhough they produced a risk of death of one in100,000 or more per person per year, while theinvoluntary risks exposed people to a risk of aboutone in 10 million or less per person per year. Fell(1994) found that the acceptable level for risksperceived as involuntary varied between a frequencyof 10–5 and 10–6 per year compared to between 10–3
and 10–4 per year for voluntary risks. Starr also foundthat the acceptability of risk from a given tech-nology was approximately equal to the third powerof the benefits, i.e. the technologies with the greaterdangers also have the greater assumed benefits. Laterworkers, such as Slovic et al. (1991) have suggestedthat these trade-offs between risks and benefits arenot always made because perceived dangersinfluence attitudes more strongly than perceivedbenefits. This interpretation is most likely for so-called ‘dread’ hazards like nuclear power.
Given that the provision of absolute safety isimpossible, there is great sense in trying todetermine the level of risk that is acceptable for anyactivity or situation. Acceptable risk is the degree ofloss that is perceived by the community or relevantauthorities to be tolerable when managing risk. Itis a much misunderstood term. For example, it doesnot describe either the level of risk with whichpeople are happy or even the lowest risk possible.Fischhoff et al. (1981) concluded that the term really
describes the ‘least unacceptable’ option and that theassociated risk is not ‘acceptable’ in any absolutesense. As a result, the term tolerable risk is often used, i.e. the level of risk that is tolerated rather thanaccepted. In reality, tolerable risk is a highly complexand dynamic concept because the the actual level oftolerable risk varies according to a wide range offactors. These include the severity of the risk itself,the nature of the potential impacts, the level ofgeneral understanding of the risk, the familiarity ofthe affected people with the risk, the benefitsassociated with the risk and the dangers and benefitsassociated with any alternative scenario.
It is important, when specifying the level ofacceptable or tolerable risk, to be clear about thepeople to whom it is acceptable. Actual behaviourdoes not necessarily reflect the optimum choice. Forexample, in the case of a consumer buying a car, themere act of purchase need not imply that theproduct is safe enough, just that the trade-off withother forms of transport is the best available. In thisinstance, the risk is tolerated, not accepted. Thereare many factors that influence the consumer’schoice of a car and, perhaps surprisingly, statisticson the safety of the vehicle are rarely high on the listof priorities. This is also true of other decisionswhere risk perception is just one element in thedecision-making process.
In summary, there is no fully objective approachto risk decisions and, since there is often uncertainty
THE NATURE OF HAZARD52
Average annual benefit / person involved (dollars)
P f(fa
talit
ies
/per
son-
hour
ofex
posu
re)
010-11
10-10
10-9
10-8
10-7
10-6
10-5
10-4
400 800 1200 1600 2000 2400
NaturalNaturalDisastersDisasters
ElectricElectricPowerPower
Rail-Rail-RoadsRoads
Hunting SkiingHunting SkiingSmokingSmoking
INVOLUNTARYINVOLUNTARY
VOLUNTARYVOLUNTARYGeneralGeneralAviationAviation
NaturalDisasters
ElectricPower
Rail-Roads
Hunting SkiingSmoking
R~B3
R~B3
CommercialAviation Motor
Vehicles
INVOLUNTARY
VOLUNTARYGeneralAviation
Average Pf due todisease for entireU.S. population
Figure 4.1 Risk (Pf) plotted relative tobenefit and grouped for various types ofvoluntary and involuntary human activitiesinvolving exposure to hazard. The diagramalso shows the approximate third-powerrelationship between risks and benefits. The average risk of death from disease isindicated for comparison. After Starr (1969).Reprinted with permission from Science 165:1232–8. Copyright 1969 AmericanAssociation for the Advancement of Science.

R ISK ASSESSMENT AND MANAGEMENT 53
about the best way to manage hazards and risks,quantitative analysis is best viewed as a partial,rather than as a complete, function.
RISK ASSESSMENT
Following the work of Kates and Kasperson (1983),it is now established that risk assessment has threedistinct steps:
• The identification of hazards likely to result in disasters – what hazardous events may occur?
• The estimation of the likelihood of such events– what is the probability that it will occur?
• The evaluation of the social consequences of thehazard – what is the likely loss created by eachevent?
In reality, the process is often more complex thanthis because there is an additional need to under-stand the magnitude of the event and how it mayaffect risk outcomes. For example, the probabilityof occurrence of an avalanche is related to its volume,with larger avalanches occurring less often (i.e.being less probable). But, in terms of risk to people,even the frequency – volume relationship may notbe the full story because the hazardous nature of theevent could well be influenced by the velocity of theflow as well as its volume.
Assuming that these problems can be overcome,the statistical analysis of risk is based on theories ofprobability. When analysis is undertaken, risk (R)is taken as a product of probability (p) and loss (L):
R = p * L
If every event resulted in the same consequences, itwould be necessary only to calculate the frequencyof occurrence. But, as already indicated, environ-mental hazards have variable impacts. Therefore, anassessment of damaging consequences is alsorequired (see Box 4.1). For many threats, especiallytechnological hazards, the available data of pastevents is rarely adequate for a reliable statisticalassessment of risk. In these cases event and fault treetechniques are used (Fig. 4.2). These use a processof inductive logic that can be applied whenever aknown chain of events must take place before adisaster can occur.
MAGNITUDE – FREQUENCY RELATIONSHIPS
Many natural hazards can be measured objectivelyon a scientific scale of magnitude or intensity, e.g. earthquakes (the Richter and Mercalli scales);tornadoes (the Fujita scale); hurricanes (the Saffir-Simpson scale). Unfortunately, these scales are imperfect and often measure just one processthat might cause damage. So, for hurricanes, the
OUTCOMEOUTCOMEPROBABILITYRelief valve fails? Pipe seal fails?
INITIATINGEVENT
Yes
No
Yes
No
Yes
Nop = 0.01
p = 0.99
p = 0.40
p = 0.60
p = 0.40
p = 0.60
Release of Gas
No Release
No Release
No Release
0.0016
0.0024
0.0060
0.9900
SYSTEM A SYSTEM B
Excess pressurein pipeline?
Figure 4.2 A probabilisticevent tree for ahypothetical gas pipelineaccident. The performanceof safety systems A and Bdetermines the outcomeprobability of theinitiating event. Diagram refined courtesyof Dr J. R. Keaton,personal communication.
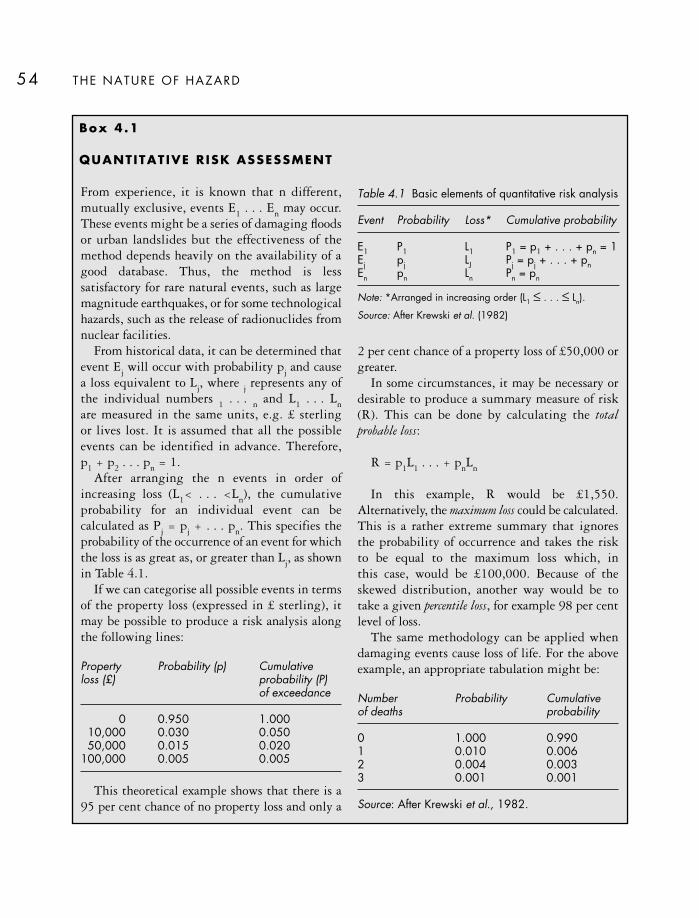
THE NATURE OF HAZARD54
From experience, it is known that n different,mutually exclusive, events E1 . . . En may occur.These events might be a series of damaging floodsor urban landslides but the effectiveness of themethod depends heavily on the availability of agood database. Thus, the method is lesssatisfactory for rare natural events, such as largemagnitude earthquakes, or for some technologicalhazards, such as the release of radionuclides fromnuclear facilities.
From historical data, it can be determined thatevent Ej will occur with probability pj and causea loss equivalent to Lj, where j represents any ofthe individual numbers 1 . . . n and L1 . . . Lnare measured in the same units, e.g. £ sterling or lives lost. It is assumed that all the possibleevents can be identified in advance. Therefore, p1 + p2 . . . pn = 1.
After arranging the n events in order ofincreasing loss (L1< . . . <Ln), the cumulativeprobability for an individual event can becalculated as Pj = pj + . . . pn. This specifies theprobability of the occurrence of an event for whichthe loss is as great as, or greater than Lj, as shownin Table 4.1.
If we can categorise all possible events in termsof the property loss (expressed in £ sterling), itmay be possible to produce a risk analysis alongthe following lines:
Property Probability (p) Cumulative loss (£) probability (P)
of exceedance
0 0.950 1.00010,000 0.030 0.05050,000 0.015 0.020
100,000 0.005 0.005
This theoretical example shows that there is a95 per cent chance of no property loss and only a
2 per cent chance of a property loss of £50,000 orgreater.
In some circumstances, it may be necessary ordesirable to produce a summary measure of risk(R). This can be done by calculating the totalprobable loss:
R = p1L1 . . . + pnLn
In this example, R would be £1,550.Alternatively, the maximum loss could be calculated.This is a rather extreme summary that ignores the probability of occurrence and takes the risk to be equal to the maximum loss which, in this case, would be £100,000. Because of theskewed distribution, another way would be to take a given percentile loss, for example 98 per centlevel of loss.
The same methodology can be applied whendamaging events cause loss of life. For the aboveexample, an appropriate tabulation might be:
Number Probability Cumulativeof deaths probability
0 1.000 0.9901 0.010 0.0062 0.004 0.0033 0.001 0.001
Source: After Krewski et al., 1982.
Box 4.1
QUANTITATIVE R ISK ASSESSMENT
Table 4.1 Basic elements of quantitative risk analysis
Event Probability Loss* Cumulative probability
E1 P1 L1 P1 = p1 + . . . + pn = 1Ej pj LJ Pj = pj + . . . + pnEn pn Ln Pn = pn
Note: *Arranged in increasing order (L1 ≤ . . . ≤ Ln).
Source: After Krewski et al. (1982)

Saffir-Simpson scale measures only the maximumsustained wind speed, whereas the actual damagemight be caused by wind gusts, storm surge or theintense precipitation associated with hurricanes(Chapter 9). Even where a scale can incorporate alldamaging phenomena, the event magnitude aloneis a poor guide to disaster impact. This is partlybecause the nature of the impact depends not justupon the event itself but also on the nature of theenvironment in which it is occurring. Thus, anearthquake on a submarine fault might generate atsunami, whilst one in a mountain chain cannot.Even more significantly, the impact depends uponthe degree of physical exposure and human vulner-ability of the communities that are threatened bythe event. This vulnerability is not static butchanges over time as both the human population,and the environment in which it is situated, evolve(Meehl et al., 2000).
As was mentioned in the previous section, themagnitude (size or intensity) of hazardous processesis often inversely related to the frequency of itsoccurrence. For example, large earthquakes occurmuch less often than small ones and major disastersusually result from the rare occurrence of a largeevent. The energy release from the 2004 Boxing Dayearthquake, which killed about 250,000 people, was about 100 times that of the 2005 Kashmirearthquake, which resulted in 74,500 deaths.Consequently, the five largest events in thetwentieth century were responsible for over half ofall the earthquake-related deaths.
When the magnitude of an event is plottedagainst the logarithm of its frequency, it oftenexhibits the type of relationship shown in Figure4.3A. The recurrence interval (or return period) is thetime that, on average, elapses between two eventsthat equal, or exceed, a given magnitude. A plot ofrecurrence intervals versus associated magnitudes(Fig 4.3B) produces a group of points that alsoapproximates a straight line on a semi-logarithmicgraph. The analysis of extreme events usingprobability methods relies on the assumption ofuniformitarianism – i.e. a belief that past processesand events are a good guide for the future. It is most
appropriate for hazards unaffected by human activity.For example, it is reasonable to assume that globaltectonic processes, driven by large-scale geologicalforces, have remained fairly constant through time.This probability approach is less suitable for thoseenvironmental processes that are known to havechanged, especially during recent human history.Thus, there may well be a marked change in themagnitude-frequency relationship for a flood in adrainage basin if extensive deforestation occurs.Setting such limitations aside, probability-basedapproaches are often used to show the size of thefloods that might be expected once every year, every10 years, every 100 years and so on. But, whilst a100-year flood has a probability of 1:100 of occurringin any one year, and an estimated average returnperiod of a century, in practice such a flood couldoccur next year, or not for 200 years, or it could beexceeded several times in the next 100 years.
Despite such uncertainties, probability-basedestimates help engineers to design and build manykey structures in hazard-prone areas. The listincludes dams and levees for flood control, nuclearpower plants to be protected against storm surgesand hospitals in earthquake zones which must be protected against collapse during shaking.Engineers usually plan on the basis of a design event,which is the magnitude of the hazardous event thata structure is built to withstand during its lifetime.
R ISK ASSESSMENT AND MANAGEMENT 55
MAGNITUDE
LOGA
RITH
MOF
FREQ
UENC
Y
A B
MAGNITUDE
LOGA
RITH
MOF
RECU
RREN
CEIN
TERV
AL
Figure 4.3 Generalised relationships between themagnitude and (A) the frequency and (B) the returnperiod for potentially damaging natural events. A fewvery high magnitude events are responsible for most ofthe recorded disasters.

The actual return period for the design event variesaccording to the nature of the hazard and thevulnerability of the elements at risk. As an example,large dams on major rivers are often built towithstand the 1:10,000 year flood because theconsequences of failure would be catastrophic fordownstream communities. On the other hand, inthe UK, railway bridges are generally designed towithstand the 1:100 year flood event as theconsequences of any failure are less catastrophic.
Magnitude-frequency relationships are widelyused in many other aspects of hazard management.For example, a mortgage lender might well wish toknow the magnitude-frequency relationship of floodrisk, during the average mortgage span of 30 years,for new houses built on a flood plain. Figure 4.4shows the risks of an event being equalled orexceeded during this period. A flood as high, orhigher, than the 50-year flood has a 45 per centprobability of occurrence but, if the 100-year returnperiod is chosen, the probability drops to 26 percent. This is valuable information for an insurancecompany. If the company can assess the probabilityof a claim being made, and the likely cost of thatclaim – which will be partly controlled by themagnitude of the event – then the insurancepremium can be determined appropriately. If theestimate of the probable losses is too high, then theinsurance premium will also be high and may proveto be uncompetitive. If the estimate is too low, thenthe insurance company stands to make a loss fromthe large number of claims.
THE ANALYSIS OF EXTREMEEVENTS
Most extreme event analysis is concerned with thedistribution of annual maximum or minimumvalues at a given site, such as the strongest windgust or the largest flood. This process can beexplained using an example of annual maximumwind gusts in order to assess the potential forwindstorm damage. In this case, data are availableon the annual maximum wind gusts recorded at
Tiree in western Scotland over the 59-year periodfrom 1927 to 1985. The first step is to give aranking (m) for these events, starting with m = 1for the highest recorded wind gust, m = 2 for thenext highest, and so on in descending order. Thereturn period or recurrence interval Tr (in years) canthen be computed from
Tr (years) = (n + 1)/m
where m = event ranking and n = number of eventsin the period of record. The percentage probabilityfor each event may then be obtained from
THE NATURE OF HAZARD56
100
80
60
40
20
010-year
25-year
50-year
100-year
Flood Magnitude
Prob
ablil
ityof
bein
geq
ualle
dor
exce
eded
durin
ga
30-y
earp
erio
d(%
)
Figure 4.4 The probability of occurrence of floods ofvarious magnitudes during a period of 30 years (thelength of a standard property mortgage).

P (per cent) = 100/Tr.
The annual frequency (AF) is given by
1/Tr (years) = AF.
Figure 4.5 shows the Tiree wind gusts plotted usingthe return period calculation described above. Thedata fall on a straight line, illustrating the linkbetween magnitude (gust speed) and frequency(probability). From this it is possible to estimate thereturn period corresponding to any desired gustspeed, or the speed that has a given return period.However, great care is needed in extrapolating togust speeds that are greater than the available data(in this case about 100 knots) as there is a high levelof uncertainty in the data – in fact there is almostcertainly a value of gust speed that represents atheoretical maximum. Equally, any extrapolationmuch beyond the time period for which the data areavailable also introduces uncertainty.
In practice, the use of a design event often extendsbeyond the dataset in terms of both time and theevent size and the errors can be substantial. It is forthis reason that much effort is currently beingexpended in earthquake engineering – for example– to extend the instrument records by analysis of
historic documents in order to determine the occur-rence and size of previously unrecorded events. Thesituation is worst for exceptionally rare, very largemagnitude hazards, such as tsunami, for which thereis no statistically valid dataset of previous events. Insuch cases, the only viable approach is to examinethe geological record to provide evidence formodelling scenarios of either previous, or future,events.
In all probability-based approaches, the reliabilityof the results depends on the quality of the database.Ideally, each event in the database should be drawnfrom the same statistical population, should beindependent and should follow a known distri-bution curve. For example, each of the maximumwind gusts in the Tiree dataset is independent –they are maximum annual gusts and each valuemust be from a different storm event – but they areall caused by cyclonic storms, and are drawn fromthe same population. Other environmental pheno-mena are not necessarily independent. Earthquakeoccurrence is not random in time as the magnitudeof the event depends in part upon the amount ofstrain energy that is stored up in the crust. When alarge earthquake occurs, at least part of this strainenergy is released. This reduces the immediatelikelihood of another large event on the same sectionof fault until the strain energy has built up again.On the other hand, the stress may have been trans-ferred onto other local faults, increasing the chanceof an earthquake on a fault nearby.
It should be noted that, whilst it is sometimesassumed that the statistics of the distribution ofevents is best described by a Normal distributionfunction, this is not always the case. Daily rainfalldata, for example, have a skewed, rather than aNormal, statistical distribution with resulting com-plications for probability analysis. Other problemsarise, as mentioned in the previous section, whenpast records are used to predict future conditions onthe assumption that there will be no change in thecausative factors. This assumption, known asstationarity, ignores the possibility of environmentalchange. Many changes can occur naturally over verylong periods but changes to environmental systems
R ISK ASSESSMENT AND MANAGEMENT 57
0.995
0.99
0.980.97
0.95
0.90
0.800.70
0.500.30
0.10
0
200
100
50
20
10
5
2
55 60 65 70 75 80 85 90 95 100 105 110 115Maximum Gust Speeds (KT)
Prob
abili
tyof
Non
Exce
edan
ce(P
V)
ReturnPeriod
(Years)
Figure 4.5 Annual maximum wind gusts (knots) atTiree, western Scotland, from 1927 to 1985 plotted interms of probability and return period.
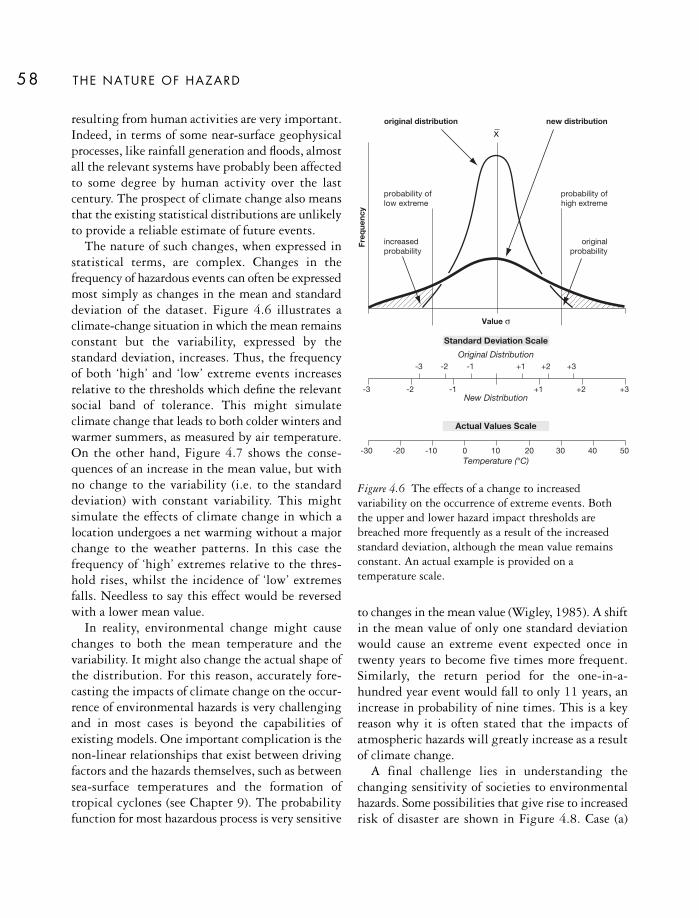
THE NATURE OF HAZARD58
resulting from human activities are very important.Indeed, in terms of some near-surface geophysicalprocesses, like rainfall generation and floods, almostall the relevant systems have probably been affectedto some degree by human activity over the lastcentury. The prospect of climate change also meansthat the existing statistical distributions are unlikelyto provide a reliable estimate of future events.
The nature of such changes, when expressed instatistical terms, are complex. Changes in thefrequency of hazardous events can often be expressedmost simply as changes in the mean and standarddeviation of the dataset. Figure 4.6 illustrates aclimate-change situation in which the mean remainsconstant but the variability, expressed by thestandard deviation, increases. Thus, the frequencyof both ‘high’ and ‘low’ extreme events increasesrelative to the thresholds which define the relevantsocial band of tolerance. This might simulateclimate change that leads to both colder winters andwarmer summers, as measured by air temperature.On the other hand, Figure 4.7 shows the conse-quences of an increase in the mean value, but withno change to the variability (i.e. to the standarddeviation) with constant variability. This mightsimulate the effects of climate change in which alocation undergoes a net warming without a majorchange to the weather patterns. In this case thefrequency of ‘high’ extremes relative to the thres-hold rises, whilst the incidence of ‘low’ extremesfalls. Needless to say this effect would be reversedwith a lower mean value.
In reality, environmental change might causechanges to both the mean temperature and thevariability. It might also change the actual shape ofthe distribution. For this reason, accurately fore-casting the impacts of climate change on the occur-rence of environmental hazards is very challengingand in most cases is beyond the capabilities ofexisting models. One important complication is thenon-linear relationships that exist between drivingfactors and the hazards themselves, such as betweensea-surface temperatures and the formation oftropical cyclones (see Chapter 9). The probabilityfunction for most hazardous process is very sensitive
to changes in the mean value (Wigley, 1985). A shiftin the mean value of only one standard deviationwould cause an extreme event expected once intwenty years to become five times more frequent.Similarly, the return period for the one-in-a-hundred year event would fall to only 11 years, anincrease in probability of nine times. This is a keyreason why it is often stated that the impacts ofatmospheric hazards will greatly increase as a resultof climate change.
A final challenge lies in understanding thechanging sensitivity of societies to environmentalhazards. Some possibilities that give rise to increasedrisk of disaster are shown in Figure 4.8. Case (a)
Freq
uenc
y
Value σ
original distribution new distribution
probability ofhigh extreme
originalprobability
probability oflow extreme
increasedprobability
-3 -2 -1 +1 +2 +3
-3 -2 -1 +1 +2 +3
x
Original Distribution
New Distribution
-30 -20 -10 0 10 20 30 40 50Temperature (°C)
Standard Deviation Scale
Actual Values Scale
Figure 4.6 The effects of a change to increasedvariability on the occurrence of extreme events. Boththe upper and lower hazard impact thresholds arebreached more frequently as a result of the increasedstandard deviation, although the mean value remainsconstant. An actual example is provided on atemperature scale.
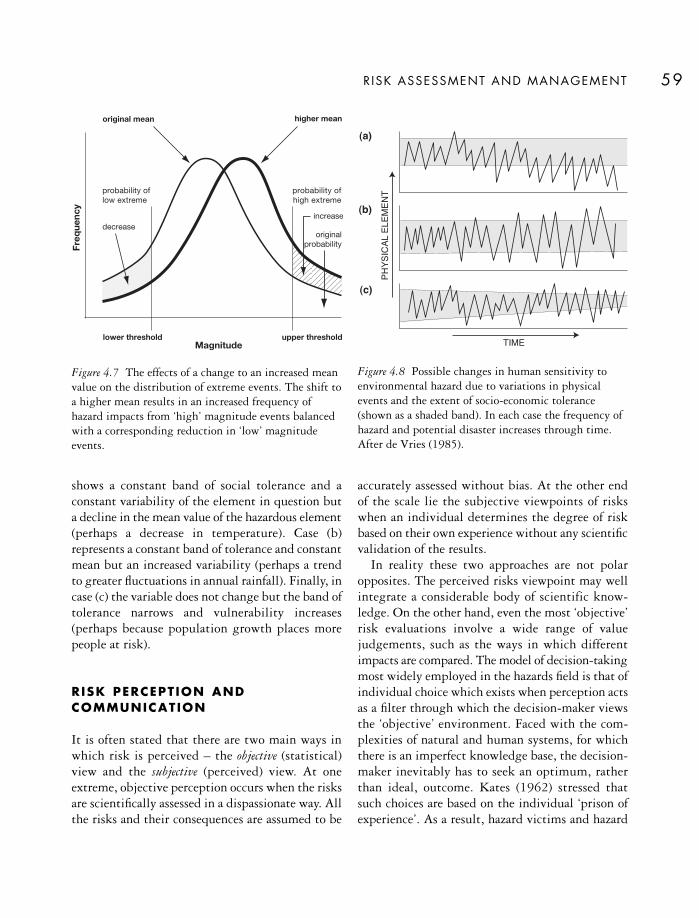
shows a constant band of social tolerance and aconstant variability of the element in question buta decline in the mean value of the hazardous element(perhaps a decrease in temperature). Case (b)represents a constant band of tolerance and constantmean but an increased variability (perhaps a trendto greater fluctuations in annual rainfall). Finally, incase (c) the variable does not change but the band oftolerance narrows and vulnerability increases(perhaps because population growth places morepeople at risk).
RISK PERCEPT ION AND COMMUNICATION
It is often stated that there are two main ways inwhich risk is perceived – the objective (statistical)view and the subjective (perceived) view. At oneextreme, objective perception occurs when the risksare scientifically assessed in a dispassionate way. Allthe risks and their consequences are assumed to be
accurately assessed without bias. At the other endof the scale lie the subjective viewpoints of riskswhen an individual determines the degree of riskbased on their own experience without any scientificvalidation of the results.
In reality these two approaches are not polaropposites. The perceived risks viewpoint may wellintegrate a considerable body of scientific know-ledge. On the other hand, even the most ‘objective’risk evaluations involve a wide range of valuejudgements, such as the ways in which differentimpacts are compared. The model of decision-takingmost widely employed in the hazards field is that ofindividual choice which exists when perception actsas a filter through which the decision-maker viewsthe ‘objective’ environment. Faced with the com-plexities of natural and human systems, for whichthere is an imperfect knowledge base, the decision-maker inevitably has to seek an optimum, ratherthan ideal, outcome. Kates (1962) stressed that such choices are based on the individual ‘prison ofexperience’. As a result, hazard victims and hazard
R ISK ASSESSMENT AND MANAGEMENT 59Fr
eque
ncy
Magnitude
original mean higher mean
probability ofhigh extreme
increase
originalprobability
probability oflow extreme
decrease
lower threshold upper threshold
(a)
(b)
(c)
TIME
PHYS
ICAL
ELEM
ENT
Figure 4.8 Possible changes in human sensitivity toenvironmental hazard due to variations in physicalevents and the extent of socio-economic tolerance(shown as a shaded band). In each case the frequency ofhazard and potential disaster increases through time.After de Vries (1985).
Figure 4.7 The effects of a change to an increased meanvalue on the distribution of extreme events. The shift toa higher mean results in an increased frequency ofhazard impacts from ‘high’ magnitude events balancedwith a corresponding reduction in ‘low’ magnitudeevents.
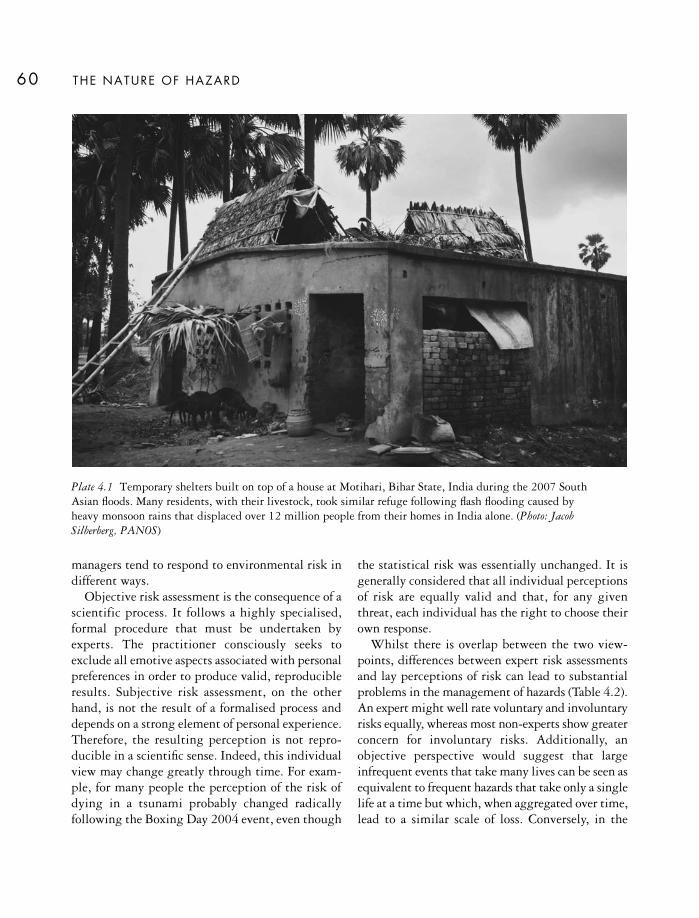
managers tend to respond to environmental risk indifferent ways.
Objective risk assessment is the consequence of ascientific process. It follows a highly specialised,formal procedure that must be undertaken byexperts. The practitioner consciously seeks toexclude all emotive aspects associated with personalpreferences in order to produce valid, reproducibleresults. Subjective risk assessment, on the otherhand, is not the result of a formalised process anddepends on a strong element of personal experience.Therefore, the resulting perception is not repro-ducible in a scientific sense. Indeed, this individualview may change greatly through time. For exam-ple, for many people the perception of the risk ofdying in a tsunami probably changed radicallyfollowing the Boxing Day 2004 event, even though
the statistical risk was essentially unchanged. It isgenerally considered that all individual perceptionsof risk are equally valid and that, for any giventhreat, each individual has the right to choose theirown response.
Whilst there is overlap between the two view-points, differences between expert risk assessmentsand lay perceptions of risk can lead to substantialproblems in the management of hazards (Table 4.2).An expert might well rate voluntary and involuntaryrisks equally, whereas most non-experts show greaterconcern for involuntary risks. Additionally, anobjective perspective would suggest that largeinfrequent events that take many lives can be seen asequivalent to frequent hazards that take only a singlelife at a time but which, when aggregated over time,lead to a similar scale of loss. Conversely, in the
THE NATURE OF HAZARD60
Plate 4.1 Temporary shelters built on top of a house at Motihari, Bihar State, India during the 2007 South Asian floods. Many residents, with their livestock, took similar refuge following flash flooding caused by heavy monsoon rains that displaced over 12 million people from their homes in India alone. (Photo: Jacob Silberberg, PANOS)

perception of most lay people, the dramatic hazardsthat take many lives at a time are seen as more sig-nificant. For example, in the UK on average morepeople die each day in road accidents than die eachyear in rail crashes but railway accidents retainhigher public profile. This is partly because railaccidents are considered to be the result of involun-tary risk and the events tend to produce strikingimages for the media. Car accidents are perceived as the result of voluntary risk, the consequences aremore routine and the number of deaths per event islow.
Amongst academics controversy exists as towhether objective or subjective hazard perceptionsshould be given prominence in risk managementdecisions. On one hand, it is argued that theoutcomes of objective analyses allow risks to becompared and balanced appropriately. In this way,rational economic decisions about expenditure onrisk reduction can be made. Indeed, some analystsconsider that non-scientific perceptions of risk areinvalid simply because they arise from subjectiveinfluences. On the other hand, there is an argumentthat risk is highly complex, going far beyond simpleprobabilistic estimates of mortality, morbidity orloss. Some incorporation of perceived risk into deci-sion making is thought to capture public percep-tions which can be considered to be important forpolicy-making within a democratic society.
The latter view accords with the beliefs of manylay people who often consider that their perceptionsare highly relevant because they do blend someexpert analysis with individual judgement based onpersonal experience, social context and other factors.The public also suspects that limits exist to what
experts know, a suspicion that is justified in certaincases (Sjöberg, 2001). High-profile cases do existwhere it has become apparent that experts havegiven misleading or incorrect information aboutrisks. In the UK, key examples include fears aboutthe risks to children of autism associated with thetriple vaccine for measles, mumps and rubella(MMR), the link between eating infected beef andcontracting the illness CJD, and incorrect analysisof the statistical chance of a parent having more thanone of their children suffer from a ‘cot death’.Members of the public appear to be increasinglywary of scientific views of risk. This is a recurrentissue in debates about global warming in which the– largely incorrect – argument has been made thatscientists over-emphasise the threat of increasedhazard occurrence due to anthropogenic climatechange in order to protect their sources of researchfunding.
The reality is that science alone is never likely toprovide definitive answers to risk issues. There willbe ongoing problems in hazard management whenrisk analysts expect their conclusions to be acceptedbecause they are ‘objective’ whilst lay people rejectsuch interpretations precisely because they ignoreindividual concerns and fears. During the mostcontentious decision-making, serious breakdownsin trust between risk managers and the public willoccur. In practice a balance must be achieved.Whilst community views must be taken into con-sideration, an over-emphasis upon lay perceptionsof hazard and risk well beyond the results ofobjective analyses can lead to the wasting of largeamounts of public resources with only limitedimprovements in safety. Furthermore, perceptions
R ISK ASSESSMENT AND MANAGEMENT 61
Table 4.2 Some major differences between risk assessment and risk perception
Phase of analysis Risk assessment processes Risk perception processes
Risk Event monitoring Individual intuitionidentification Statistical inference Personal awarenessRisk Magnitude/frequency Personal experienceestimation Economic costs Intangible lossesRisk Cost/benefit analysis Personality factorsevaluation Community policy Individual action

of risk can sometimes be driven by unjustifiableprejudices, which are often amplified through themedia and by politicians. In particular, where riskperception is used to drive hazard management,great care is needed to ensure that the results do notdisadvantage minorities in society.
If nothing else, the conflict between technicalassessors of hazard and risk and the public demon-strates a real need for improved communicationsbetween the two groups. This is especially impor-tant in the context of the possible increased risksresulting from global warming. From a practicalstandpoint, improved communication should seekto enable lay people to better understand the resultsof objective analyses of risk and also to informscientists about the risks that cause greatest con-cern to the public. However, there are many keyproblems associated with communicating complextechnical assessments of hazard and risk to thepublic. Slovic (1986) identified the following keyissues that risk communicators face:
• People’s initial perceptions of risk are ofteninaccurate.
• Risk information often frightens and frustratesthe public.
• Strongly-held beliefs are hard to modify, evenwhen the justification for those beliefs is incorrect.Strongly held pre-conceived views are hard tochange.
• Naive or simplistic views are easily manipulatedby presentation format. When it is stated thatthere is a 10 per cent chance of an event occur-ring, rather than a 90 per cent chance that it willnot, opinions change.
The growth of online sources of information hascomplicated matters further. People now have easyaccess to a vast range of information and people inthe MDCs can undertake their own independentbackground research using the internet. Whilst thisis a valid and empowering trend, the quality of theinformation accessed is often very poor and mayreinforce misconceptions.
THE ORIGINS OF R ISK PERCEPT ION
An individual’s perception of risk is the result of acomplex interaction of factors and is culturally-determined. The view taken by the community inwhich the person lives, and the experience that theindividual has of the hazard itself, are critical(Garvin, 2001). The cultural environment is impor-tant because it provides the overall setting withinwhich the risk is interpreted. For example, a personliving in a very strong religious community may bemore likely to view the hazard as an ‘Act of God’,and thus be unmanageable. Past experience isimportant because people with personal knowledgeof previous hazard events tend to have more accurateviews regarding the probability of future occur-rences. So, for example, people moving from ruralareas to live on urban slums on the margins of large cities may be more vulnerable to landslidesbecause they are not aware of the threats that suchslopes pose.
Direct experience can also be a powerful incentivein terms of hazard mitigation, as illustrated by thehazard-reducing measures taken after the 1971earthquake at San Fernando, California. Forty-sixper cent of residents in San Fernando and nearbySylmar took steps to reduce future seismic hazards,but this dropped to 24 per cent for the rest of theSan Fernando valley and fell to only 11 per cent forthe Los Angeles basin as a whole (Meltsner, 1978).On the other hand, some may take the view thatonce any disaster such as an earthquake has occurredthe probability of a recurrence is reduced, and thusthere is no need to take further mitigating action.
When direct experience of disaster is lacking, asit is for most people, individuals learn about hazardsindirectly. The media in general, and televisionspecifically, is a powerful source of information forshaping hazard perception. It has already beenshown in Chapter 2 that television reporting issubject to high levels of in-built bias. Over the last decade there has also been a marked increase inthe number of television programmes aboutenvironmental hazards and disasters. The internetis also a significant source of information and
THE NATURE OF HAZARD62

misinformation. Through such influences, hazardperception is likely to be moulded differently frommore objective risk analysis outcomes. On the otherhand, these information outlets also provide anopportunity for scientists to modify the communityperceptions of risk. As a result, most science fundingbodies are placing an increasing emphasis on publicunderstanding of science in general, and of risk inparticular.
Other reasons why lay people perceive hazardsdifferently from technical experts include geo-graphical location and aspects of personality. Earlywork on floods revealed that rural dwellers oftenhave hazard perceptions closer to statisticallyderived estimates than those of urban dwellers dueto their greater levels of connection with, andreliance upon, the natural environment. The influ-ence of personality is often classified according tothe degree to which an individual believes that theimpact of a hazardous event is dependent upon fate(it is externally controlled) or their own actions (itis internal control). Clearly a range of views existssurrounding what is usually described as the ‘locusof control’. Within this spectrum, three distinct typesof perception can usually be identified. These are:
• Determinism This pattern of behaviour, which issometimes called the gambler’s fallacy, occurswhen lay people find it difficult to accept therandom element of hazardous events. Thisperception type recognises that hazards exist butseeks to place extreme events in some orderedpattern, perhaps associated with regular intervalsor a repeating cycle. In the UK, for example,there is a common perception that a cold spell onthe eastern seaboard of the USA precedes asimilar cold spell in the British Isles, eventhough there is little evidence to support thisview. For certain events, like some earthquakesequences, this need not be an inaccurateperspective, but it does not fit the temporallyrandom pattern associated with most threats.
• Dissonance Although it takes many forms,dissonant perception of risk represents a denialor minimisation of risk. Often a past event is
viewed as a freak occurrence unlikely to berepeated. In extreme cases the existence of a pastevent may be denied completely. Dissonance is a highly negative form of perception oftenassociated with people having much materialwealth at risk from a major disaster. For example,Jackson and Burton (1978) examined the under-standing of the risks amongst people living inareas subject to high levels of seismic hazard.Their study suggested that the populations ofthese areas did not consider the hazard to betroublesome, partly because of the difficulties ofbeing able to cope with the potential conse-quences of a large earthquake and partly becauseof the difficulties that people have with comingto terms with continuing vague threats. Thisform of threat denial may be an attempt toconceptualise reality in a way that makes theextended risk from earthquakes bearable on aday-to-day basis.
• Probabilism Probabilistic perception is the mostsophisticated type because it accepts that dis-asters will occur and that many events arerandom. It generally accords best with the viewsof officials charged with making decisions aboutrisks. But, in some cases, the acceptance of riskis combined with a need to transfer the respon-sibility for dealing with the hazard to a higherauthority, which may range from the governmentto God. Indeed, the probabilistic view hassometimes led to a fatalistic, ‘Acts of God’ syn-drome, whereby individuals feel no responsibilityfor hazard response and wish to avoid anyexpenditure on risk reduction.
A key concept in understanding public riskperception is that of social amplification. This occurswhen social factors and dynamics shape riskperceptions and exaggerate the threat. As examples,the perception of risk is often exaggerated when therisk is new to the individual, when there is a viewthat the magnitude of the risk is being hidden insome way, when there is a belief that the hazardcannot be controlled, when the individuals exposedto the hazard are considered to be vulnerable
R ISK ASSESSMENT AND MANAGEMENT 63

(particularly if they are children) and when there isa belief that experts do not understand the risks.Alternatively, the perception of risk may well bereduced when either the individual or the group arenot able to relate directly to the hazard, when thelevel of reporting of the hazard in the media islimited or short-term, when there are perceivedbenefits associated with the hazard, when there is aperception that the hazard is well-understood, andwhen the responsible individuals are well-trusted.In the United Kingdom, for example, there has beena long-standing perception that rail travel is moredangerous than the statistics suggest, partly becauseof the intensity of media interest when accidents
do occur and partly because of a low level of public trust in the now-defunct track maintenancecompany.
Some of the factors that increase or reduce publicrisk perception are listed in Table 4.3. Risks aretaken more seriously if they are life-threatening,immediate and direct. This means that an earth-quake is normally rated more seriously than a drought. The type of potential victim can besignificant since risk perception is not restricted topurely personal concerns. Awareness is heightenedif children are at risk or if the victims are a readilyidentifiable group of people. Thus, any threats to aschool party would be amplified. Level of knowledge
THE NATURE OF HAZARD64
Table 4.3 Twelve factors influencing public risk perception with some examples of relative safety judgements
Factors tending to increase risk perception Factors tending to decrease risk perception
Involuntary hazard Voluntary hazard(radioactive fallout) (mountaineering)
Immediate impact Delayed impact(wildfire) (drought)
Direct impact Indirect impact(earthquake) (drought)
Dreaded hazard Common hazard(cancer) (road accident)
Many fatalities per event Few fatalities per event(air crash) (car crash)
Deaths grouped in space/time Deaths random in space/time(avalanche) (drought)
Identifiable victims Statistical victims(chemical plant workers) (cigarette smokers)
Processes not well understood Processes well understood(nuclear accident) (snowstorm)
Uncontrollable hazard Controllable hazard(tropical cyclone) (ice on highways)
Unfamiliar hazard Familiar hazard(tsunami) (river flood)
Lack of belief in authority Belief in authority(private industrialist) (university scientist)
Much media attention Little media attention(nuclear plant) (chemical plant)
Source: Adapted from Whyte and Burton (1982)

can be important, particularly when related to thelevel of belief in the sources of hazard information.This is a factor in the perception of complextechnological risks, especially if a lack of scientificunderstanding is combined with a disbelief ofopinions expressed by technical experts. Age is alsoa factor. Fischer et al. (1991) found that studentsemphasise risks to the environment whilst olderpeople emphasise health and safety issues. As tech-nological hazards become more prominent, thepublic will increasingly view these as events capableof some human control. More weight is alreadybeing given to the common hazards, like road safety. This is significant for countries, like NewZealand, where the death toll on the roads every sixmonths exceeds the loss of life due to earthquakesthroughout the recorded history of that nation.
RISK MANAGEMENT
Risk management is the process through which riskis evaluated before strategies are introduced tomanage and mitigate the threat. Traditionally, riskmanagement has been undertaken almost entirelyby national governments, primarily through theimplementation of health and safety legislation.Over the last few decades, however, governmentshave increasingly tried to pass this responsibility to other bodies, including attempts to requireindividuals to be more active in risk management.
As Crozier (2005) noted, the key drivers for thesuccessful management of risk must be an awarenessof a threat, a sense of responsibility plus a belief thatthe threat can be managed or at least reduced. In anideal world, the risk management procedure followsa clear set of priorities in which the highest levels ofrisk are addressed first. But, in order to develop sucha priority list, a detailed quantitative risk assessmentof all relevant factors and processes is required. Thisis a difficult, if not impossible, task not least becauseof the need to balance the relative significance oflosses from high and low frequency events. Carter(1991) showed that, in most cases, the activitiescontained in hazard management can be represented
as a cycle (Fig. 4.9). Risk management itself is oftenconsidered to be focused upon the prevention,mitigation and preparedness elements of this cycle,although the other elements are also important.Prevention, which forms part of this cycle, is onlyrarely achievable.
R ISK ASSESSMENT AND MANAGEMENT 65
Educate teachers andbuilders
Train volunteersInform politicians
LEARNING REVIEW
Hazard identificationDatabase assembly
Vulnerability mappingLoss estimation
RISK ASSESSMENT
Permanent rebuildingImproved design
Avoid hazard zones
RECONSTRUCTION
Protective structuresInsurance
Land planning
MITIGATION
Debris removalRestore public services
Temporary housing
REHABILITATION
Forecast systemsWarning schemes
Safe refugesStockpile aid
PREPAREDNESS
Search and rescueMedical aid
Food and shelter
RELIEF
Evacuation routesPractice drills
First aid supplies
EMERGENCY PLANS
POST-DISASTERRECOVERY
PRE-DISASTERPROTECTION
Figure 4.9 The reduction of risk through pre-disasterprotection and post-disaster recovery activities. Thetime-scales needed for the activities shown may rangefrom hours (emergency evacuation) to decades(rebuilding damaged infrastructure).

As already indicated, the framework for successfulrisk management is usually set by governmentregulation operating at local, regional, national andeven international levels. For example, in the UKmany everyday risks are managed through the lawsoriginating from both European and British parlia-ments which are then administered by agencies such as the Health and Safety Executive and theEnvironment Agency. Enforcement might beundertaken by those bodies, by the police (withrespect to the management of risk on the highways)or by local authorities. In addition, the BritishStandards Institute provides a set of codes of practicethat, although not legally binding, provide appro-priate guidance to enable organisations to complywith the legislative requirements. Finally, somespecialised industries may have their own legislativeframework and enforcement system. For example,the aviation industry is covered by its own set oflaws, agreements and frameworks which, in the UK,are enforced by the Civil Aviation Authority.
The legal framework for risk management issupported by a range of other measures, such as theuse of public information programmes that attemptto inform people of the nature of the hazard, thepurposes and nature the regulatory framework andthe actions that they can take to minimise their ownlevel of risk. This advice may be backed up byeconomic measures such as financial subsidies andtax credits for compliance together with fines fornon-compliance.
As an example, the authorities in an urban areawith a high level of seismic risk might try to reducerisk by:
• enforcing a building code that requires all newstructures to be designed to withstand the designearthquake. Ideally this building code will beenforced through legislation, with high penalties(including demolition in extreme cases) beingimposed in cases of non-compliance
• providing tax incentives and subsidies to ownersto encourage them to retrofit existing buildingsin order to meet the building code
• educating the public about the building code and
suitable measures of retrofitting buildings. Inaddition, programmes promoting a wider publicawareness about the earthquake risk may beundertaken. Emphasis is often placed on teachingchildren how to react because this helps toprotect some of the most vulnerable people insociety and assists in the transfer of informationto adults.
Risk management is only one of many social andeconomic goals in society and the resources requiredhave to be balanced against other demands. In manyLDCs, for example, the management of risk fromnatural and technological hazards must be weighedagainst reducing poverty, improving health pro-vision and low life expectancy and providing basiceducation. Generally, the amount of risk-relatedgovernment spending is small. In the UK directpublic spending on health and safety regulations isonly about 0.1 per cent of total central governmentexpenditure (Royal Society, 1992). Even then, someof the investment in increased safety is likely to betraded-off against other values, such as whenspending on flood defence works leads to greaterproperty values and economic risk on flood-plains, the so-called ‘levee effect’ (see Chapter 11).Consequently, the aim of risk management is not toeliminate hazard but to reduce threats to an accept-able level that is compatible with other socio-economic demands (Helm 1996). Increasingly, riskmanagement addresses these issues using theALARP principle (see Box 4.2).
In most cases, risk management adopts an essen-tially economic basis for decision making whilstaccepting that safeguarding of human life is a keypriority. This means that there is a need to attributean economic value to a human life despite the factthat many people are uncomfortable with thenotion. A number of approaches have been deve-loped of which the so-called human capital methodis perhaps the best established. This approach workson the basis of an individual’s lost future earningcapacity in the event of accident or death. It is arelatively simple principle, which values the life ofa child at the highest level, but it is clearly flawed
THE NATURE OF HAZARD66

R ISK ASSESSMENT AND MANAGEMENT 67
in that it places a zero value on those people who,for whatever reason, are unable to work. A betterapproach is willingness to pay, which seeks todetermine how much people would be willing topay in order to achieve a certain reduction in theirchance of a premature death (Jones-Lee et al., 1985).This is preferable because it measures risk aversion,i.e. the value people place directly on reducing therisk of death and injury, rather than on moreabstract, long-term concepts. Willingness to pay canbe assessed by questionnaires which ask the respon-dents to estimate, either the levels of compensationrequired for assuming an increased risk, or the
premium they would pay for a specified reductionin risk. These studies have found that the valuationof risk should include some allowance for the painfrom, and aversion to, the potential form of death(e.g. high values for death by cancer) and thatwillingness-to-pay tends to decline after middle ageas the risk of mortality from natural causes increases.
As the cycle of disaster management shown inFigure 4.9 shows, effective risk resolution dependson the implementation of a sequential series ofactions. The individual stages often overlap but itis crucial that they operate as a closed loop in orderto draw benefits from experience and feedback.
ALARP stands for ‘as low as reasonably practic-able’. The principle is applied to risk managementon the assumption that society is faced with ahierarchy of risks from acceptable throughtolerable to intolerable (Fig. 4.10). Risks in theintolerable range (at the top of the diagram) areconsidered to be too great to bear and must beaddressed more or less irrespective of the financialcosts. Risks in the tolerable range are then tackledusing the ALARP principle that states they shouldbe reduced as far as is feasible within the widereconomic and social framework. Finally, the lowestcategory of negligible risk, is specifically notaddressed through risk management because itwould represent a misuse of resource.
The ultimate aim of risk management is toreduce all risk to the acceptable level, although,in reality, this is not achievable. Therefore, acost–benefit calculation is required to enable theprioritisation of resource use. In the UK, theALARP approach is embedded in law as a resultof a legal ruling in the European Court of Justicein 2007.
Box 4.2
The ALARP PRINCIPLE
Unacceptable risk
Tolerable risk
Acceptablerisk
Incre
asing
indivi
dual
risks
ands
ociet
alco
ncer
ns
Figure 4.10 The ALARP carrot diagram, whichshows the high (intolerable) risks at the top and thelow (acceptable) risks at the bottom. The region inbetween is the ‘Tolerable Region’, in which riskshould be reduced by as much as is feasible.
Pre-disaster protection
• Risk assessment involves the identification of ahazard, the accumulation of data and the pre-paration of loss estimates.
• Mitigation measures are taken in advance of dis-aster strikes aimed at decreasing or eliminatingthe loss. Various long-term measures, such as theconstruction of engineering works, insurance andland-use planning are used.
• Preparedness reflects the extent to which acommunity is alert to disaster and covers shorter-term emergency planning, hazard warning andtemporary evacuation procedures plus the stock-piling of supplies.
Post-disaster recovery
• The relief period includes the first ‘golden’ hoursor days following the disaster impact. After theinitial rescue of survivors, the focus is on thedistribution of basic supplies (food, water, cloth-ing, shelter, medical care) to ensure no furtherloss of life.
• The rehabilitation phase involves the followingfew weeks or months during which the priorityis to enable the area to start to function again. A
common and expensive priority is the removal ofdisaster debris, such as building rubble blockingroads or food spoiled due to power failure.
• Reconstruction is a much longer-term activitythat attempts to return an area to ‘normality’after severe devastation. Ideally, improved dis-aster planning should occur at this stage, e.g. theconstruction of hazard resistant buildings.
Many phases of the risk management process havebeen improved by the application of informationtechnology (Box 4.3). But, without adequate feed-back and learning, risk management is unlikely tobe effective. A closure of the disaster mitigationcycle through the education of people, both victimsand managers at all levels, is essential. At the com-munity level, there is a need to understand the capa-bilities, and the limitations, of hazard mitigation.This can be done through the use of brochures,maps, videos and more formal seminars, workshopsand training exercises aimed at improving disasterresponse. At the world level, international organ-isations and relief agencies require greater technicalsupport in disaster management and need to pooltheir resources and experience in order to achieveglobal disaster reduction.
THE NATURE OF HAZARD68
New technology has led to a much greater empha-sis on more anticipatory forms of risk assessmentand has also improved the real-time managementof disasters. This has come about through develop-ments in both communications and informationtechnology, including applications of satelliteremote sensing, Global Positioning Systems (GPS)and Geographical Information Systems (GIS).
From the late 1970s, increased computing capa-city offered fresh opportunities in project planningand real-time decision-making in emergencies to
a range of organisations. By the early 1990s,relatively powerful and networked desk-topcomputer systems were an integral part of disastermanagement operations, especially in the MDCs(Stephenson and Anderson, 1997). For example,Drabek (1991) reported a fairly wide use of PC-based decision-support systems in the USA, espe-cially during the emergency phase when damageassessment, route designation for evacuation andthe availability of shelters are critical issues.Although networked computer systems are prone
Box 4.3
INFORMATION TECHNOLOGY AND DISASTER MANAGEMENT

R ISK ASSESSMENT AND MANAGEMENT 69
to power failure during disasters, the increasingreliability of portable radio-based transmissionsystems allow communication even when theground-based infrastructure is destroyed. Note-book computers and PDAs can be carried intoremote or devastated areas where GPS technologypermits instantaneous location-fixing and vehicletracking. Satellite-based telemetry can then bedeployed for imaging and field survey work.
Satellite remote sensing
Many forms of remote sensing have providedimportant advances in disaster reduction, espe-cially in the LDCs (Wadge, 1994). In general,Earth observation satellites have supported pre-disaster preparedness through monitoring activi-ties while communication satellites have con-tributed to disaster warning and the mobilisationof emergency aid (Jayaraman et al., 1997). Thespecific application depends on the task and thehazard. For example, during the routine moni-toring and land zoning of a volcanic cone, theimagery is unlikely to be time-dependent but,during emergency operations, the information isurgently required and must be available in allweather conditions. The type of sensor useddepends on the spatial or spectral resolutionrequired. Radar data is needed when cloudobscures disaster areas and a mixture of optical andinfra-red bands is best for wildfire detection.Integrated techniques are increasingly used – forexample Singhroy (1995) described the use ofsynthetic aperture radar (SAR) in assessinglandslide and coastal erosion hazards. Otherapplications include lahar monitoring on theflanks of volcanoes (Kerle and Oppenheimer,2002). Because of the high cost of developmentand launching, Earth observation satellites havenot been deployed as widely as communicationplatforms although this situation may changewith the recent emergence of small satellitetechnology (da Silva Curiel et al., 2002).
For many years, hurricanes have been trackedwith the aid of geostationary satellites (e.g.Meteosat) that provide global cover between 50°Nand 50°S at half-hourly intervals. Such repetitionenables the close monitoring of a storm as it movestowards landfall. As a result, no tropical cycloneis now likely to form without detection. However,forecasting the future track of such storms remainsimmensely problematic. A similar situation ariseswith tornadoes. These storms are tracked bygeostationary satellites, in combination withDoppler radar (Ray and Burgess, 1979), in orderto monitor the rotation and the speed of forwardmovement of tornadoes.
Satellites provide a cost-effective, global cover-age of volcanic activity through the detection ofthermal anomalies and plume tracking. Similarly,large-scale drought monitoring is possible throughchanges in surface albedo and the application of avegetation index (VI) that measures vegetationstress (Teng, 1990). This information can be usedfor a variety of purposes ranging from encouraginga change in cropping patterns and irrigationpractices early in a growing season to the lateseason estimation of crop yields and their possibleeffects on food supplies (Unganai and Kogan,1998). The mapping of flood-affected areas is alsohighly successful because of clear differences in thespectral signatures for different types of inundation– standing water, submerged crops, areas of flood-water retreat, etc. In addition, the topographicinformation necessary for hazard zone mapping canbe provided by instruments such as the SPOT andERS satellites, which have stereo-imaging for thispurpose. Over the last decade the availability ofvery high resolution instruments, such as Ikonosand Quickbird, have allowed the identification ofindividual structures and even earthquake-inducedcracks in the ground (Petley et al. 2006). This isnow permitting the assessment of damage to beundertaken remotely.
There are limitations. For example, remotelysensed imagery needs filtering and correction,
THE NATURE OF HAZARD70
a process that remains complex and time-consuming. The very high resolution satellitestypically image each area only every few days. Inaddition, the instruments are optical in character,meaning that they cannot penetrate cloud cover.Radar instruments can, but the data resolution is often too poor to allow useful analysis for short-term damage assessment. High resolutiondata is also very expensive to purchase.
A serious attempt to address some of theseissues was made by the establishment of theInternational Charter on Space and MajorDisasters in 1999. Almost all of the satellite dataproviders are signatories to this charter, whichallows member organisations (mostly governmentbodies, international agencies and the majorNGOs) to acquire satellite data for disaster areasfree of charge. For example, in the aftermath of the2005 Kashmir earthquake in Pakistan and Indiathe charter was used to allow the acquisition ofdata to assist with the relief operations. However,the effectiveness of such systems remains limitedby difficulties in analysing the remotely-senseddata in a timely fashion and the problems ofcommunicating the analyses to end-users, who areusually on the ground in an area which has poorcommunication networks.
GEOGRAPHICAL INFORMATION SYSTEMS
GIS technology provides a major resource fordisaster mitigation and emergency management.Many local government offices now routinely holdarchives of contours, rivers, geology, soils, high-ways, census data, phone listings and areas subjectto flooding, or other hazards, for their area. GIS is used on PCs at an affordable cost to aid allaspects of disaster management, including land
zoning decisions, warning of residents and therouting of emergency vehicles. GIS-based systemswork best for those hazards that can be mapped at a suitable scale. For example, Emmi and Horton (1993) presented a GIS-based method forestimating the earthquake risk for both propertyand casualties which can be applied to disasterplanning and land zoning in large communitieswhilst Mejía-Navarro and Garcia (1996) demon-strated a GIS suitable for assessing a range ofgeological hazards backed up with a decision-support system for planning purposes.
Most success has been achieved with themonitoring and forecasting of meteorological andflood hazards. In turn, this has led to improvedwarning and evacuation systems. Dymon (1999)described how GIS models were used to calculatethe height of the potential storm surge before‘Hurricane Fran’ reached the North Carolina coastin 1996. Emergency managers in the USA nowuse GIS information to identify the areas to beevacuated when a hurricane is forecast whilst, afterthe storm, detailed data on residential locationscan help to verify insurance claims. Potentialvulnerability to disaster, expressed by the locationof the poorest groups, the elderly and women-headed households, can also be captured in a GISin order to promote better emergency responses inthe future (Morrow, 1999). Similar GIS and GPStechnology is also starting to make a contributionto the alleviation of major humanitarian emer-gencies in the developing world (Kaiser et al.,2003). Early applications were in the control ofdisease outbreaks and other public health areas butmore recent advances in Africa involve large-scalevulnerability assessment, mortality surveys, therapid determination of basic disaster needs (suchas water, food and fuel) and the mapping ofpopulation movements.

A fully integrated approach to disaster reductionis rarely achieved. It is often difficult to quantify thecombined risks from multiple hazards, especiallythose created by low frequency/high magnitudeevents. The risks may also be spread very unevenlybetween different communities and social groups.Estimating the costs of mitigation is also proble-matic, not least for the purpose of saving lives, andthe money spent can vary greatly for the samestatistical degree of risk. When funds are allocated,institutional weakness, lack of technical expertiseand the poor enforcement of legislation weaken the effectiveness of disaster reduction strategies. These factors are a special problem in the poorestcountries. After major disasters in the LDCs, thecountry may be heavily dependent on external aidand the concept of a rapid return to ‘normality’ isinappropriate. Such disadvantage leads to lowaspirations about the level of risk reduction that canbe achieved (Sokolowska and Tyszka, 1995). Evenin advanced nations, the dominant culture is oftenbased on a reactive, emergency response to disasterstrikes rather than on a more pro-active strategy thatprevents disaster in the first place.
KEY READING
Fischoff, B., Lichtenstein, S., Slovic, P., Derby S. L.and Keeney, R. L. (1981) Acceptable Risk. Cambridge:Cambridge University Press. This remains a soundintroduction to risk analysis.
Keeney, R. L. (1995) Understanding life-threateningrisks. Risk Analysis 15: 627–37. An up-dated focuson disaster-type risk.
Kaiser, R., Spiegel, P. B., Henderson, A. K. andGerber, M. L. (2003) The application of GeographicInformation Systems and Global PositioningSystems in humanitarian emergencies: lessonslearned, programme implications and futureresearch. Disasters 27: 127–40. Some examples ofinnovative applications of information technologyin the Third World, mainly Africa.
Kerle, N. and Oppenheimer, C. (2002) Satelliteremote sensing as a tool in lahar disaster manage-ment. Disasters 26: 140–60. A useful demonstrationof a specific remote sensing application.
WEB L INKS
Asian Disaster Preparedness Centre: http://www.adpc.net/
International Charter on Disasters and Space:http://www.disasterscharter.org/main_e.html
Pacific Disaster Centre: http://www.pdc.org
PreventionWeb – the Global Platform for DisasterRisk Reduction: http://www.preventionweb.net/globalplatform/
Prevention Consortium: http://www.preventionconsortium.org/
UN International Strategy for Disaster Reduction:http://www.unisdr.org/
Volcanic Ash Advisory Centre: http://aawu.arh.noaa.gov/vaac.php
R ISK ASSESSMENT AND MANAGEMENT 71

5
REDUCING THE IMPACTS OF D ISASTER
THE RANGE OF OPTIONS
In theory, the best response to environmental hazardis to avoid all danger. In practice, this is impossibledue to development pressures on land. Even aftersevere disasters, political and economic inertiaencourage rebuilding on the same – or a nearby –site. Some small island communities overwhelmedby disaster have been moved long distances butrelocation may not be permanent. Within two yearsof evacuation to Britain following a volcaniceruption in 1961, most of the population of Tristanda Cunha, South Atlantic, had returned home.Similar decisions were faced by the residents of New Orleans displaced by ‘Hurricane Katrina’ in2005. Another – mainly theoretical – option is thesuppression of hazards at source. The problem hereis that humans can exert little influence on large-scale natural processes like solar energy that, in asingle day, delivers to the atmosphere enough powerto generate 10 thousand hurricanes, 100 millionthunderstorms or 100 billion tornadoes. Expressedrelative to this energy receipt (i.e. taking the dailyglobal solar energy receipt as 1 unit), a very strongearthquake would release 10–2 units; an averagecyclone 10–3 units (Fig. 5.1).
Faced with such difficulties, loss acceptance is acommon ‘negative option’, especially when limited
10-1
1
10-2
10-3
10-4
10-5
10-6
10-7
10-8
10-9
10-10
10-11
10-12
10-13
EARTH'S DAILY SOLAR ENERGY RECEIPT
MAXIMUM EARTHQUAKE POTENTIALWORLD ENERGY USE 1950
AVERAGE TROPICAL CYCLONE (10 DAY LIFE)CHILE EARTHQUAKE 1960
KRAKATOA VOLCANIC ERUPTION 1883EARTH'S AVERAGE ANNUAL RELEASE OF SEISMIC ENERGY
NEW MADRID EARTHQUAKE 1811MT. ST. HELENS VOLCANIC ERUPTION 1980
ELECTRICAL ENERGY OF AVERAGE THUNDERSTORMNAGASAKI ATOMIC BOMB 1945AVERAGE EARTHQUAKE
AVERAGE FOREST FIRE IN USA
KINETIC ENERGY OF AVERAGE TORNADO
AVERAGE LIGHTNING STROKE
Figure 5.1 Energy release, in ergs on a logarithmic scale,showing the relationship between certain potentiallyhazardous geophysical events, together with someselected human uses of energy and the earth’s daily solarreceipt of energy.

resources exist. Loss acceptance occurs in differentways. Some people are unaware that they live in ahazardous location and therefore do nothing toreduce their risk. Others attach an unduly lowpriority to natural hazards compared to day-to-daydomestic problems like inflation or unemployment.Another factor is limited scientific knowledge. Forexample, due to a relative lack of understanding ofthe physics of the Earth’s crust, reliable forecastingand warning schemes are unavailable for earth-quakes. Sometimes the view is expressed thatindividuals should be free to assume whateverenvironmental risk they wish as long as they acceptthe consequences of their decision. But lack ofinformation and capital, rather than a calculatedchoice, forces so many people to locate in hazardousareas that few governments can ignore their plightfollowing disaster.
Practical hazard-reducing adjustments fall intothree groups:
• Mitigation – modify the loss burden The mostlimited responses use a mix of humanitarian andeconomic principles to spread the financialburden beyond the immediate victims throughdisaster aid and insurance measures. These schemesare mainly loss-sharing devices but they can alsobe used to encourage loss-reducing responses inthe future.
• Protection – modify the event These responses relyon science and civil engineering to reduce thehazard by exerting limited control over thephysical processes through structural measures(adjusting damaging events to people). Thescales of intervention range from macro-protection(large-scale defences designed to protect wholecommunities) to micro-protection (strengtheningindividual buildings against hazardous stress).
• Adaptation – modify human vulnerability These‘non-structural’ responses promote changes inhuman behaviour towards hazards (adjustingpeople to damaging events). In contrast to eventmodification, they are rooted in applied socialscience. Adaptation covers community preparednessprogrammes, forecasting and warning schemes andland-use planning.
MITIGATION – DISASTER AID
Disaster aid is the outcome of humanitarian concernfollowing severe loss. According to Darcy andHofmann (2003), there are four priorities for disasteraid – the protection of life, health, subsistence andphysical security. Aid flows to disaster victims viagovernments, charitable non-governmental organ-isations (NGOs) and private donors. The role ofNGOs such as the Red Cross and Red CrescentSocieties, Oxfam and Médecins Sans Frontières isvital. But, according to Stoddard (2003), NGOsgenerally receive only one-quarter of their incomefrom government funds and are, therefore, depen-dent on public appeals for sudden emergencies.
Disaster donations are used for the recoveryprocesses of relief, rehabilitation and reconstruction.
Relief period
Most aid is triggered by appeals in the emergencyperiod. After the initial search and rescue phase, thepriority is for medical support. Some disasters, likefloods, create epidemics of diarrhoeal, respiratoryand infectious diseases whilst earthquakes areassociated with bone fractures and psychologicaltrauma. In all these cases, the use of local medicalteams is preferable because they can be mobilisedquickly and are culturally integrated with thepeople in need. This indicates the importance ofpreparedness.
In order to save lives, appropriate technicalsupport and medical supplies must be delivered todisaster victims within the first ‘golden hours’ afterthe event. This period can be extremely short. Themean burial time of survivors completely buried bysnow avalanches is only about 10 minutes and lessthan half the victims will live for longer than 30minutes (Fig. 5.2). For earthquakes, almost 90 percent of trapped victims brought out alive are rescuedin the first 24 hours after the event. Consequently,international donations of medical supplies mayarrive too late. A classic example followed theGuatemala City earthquake of 1976 where the peakdelivery of medical supplies came two weeks after
REDUCING THE IMPACTS OF D ISASTER 73
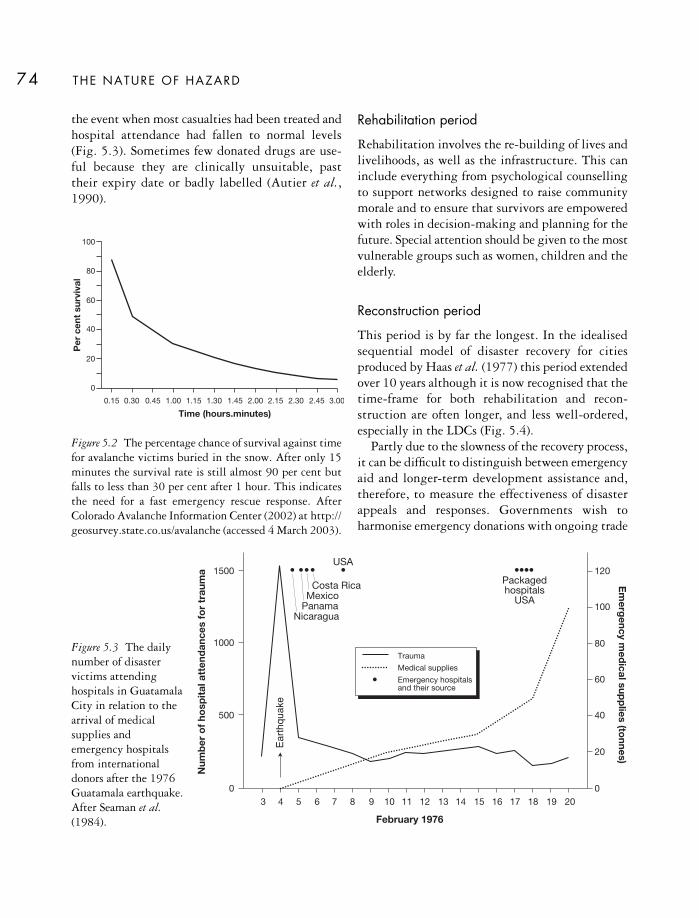
the event when most casualties had been treated andhospital attendance had fallen to normal levels (Fig. 5.3). Sometimes few donated drugs are use-ful because they are clinically unsuitable, past their expiry date or badly labelled (Autier et al.,1990).
Rehabilitation period
Rehabilitation involves the re-building of lives andlivelihoods, as well as the infrastructure. This caninclude everything from psychological counsellingto support networks designed to raise communitymorale and to ensure that survivors are empoweredwith roles in decision-making and planning for thefuture. Special attention should be given to the mostvulnerable groups such as women, children and theelderly.
Reconstruction period
This period is by far the longest. In the idealisedsequential model of disaster recovery for citiesproduced by Haas et al. (1977) this period extendedover 10 years although it is now recognised that thetime-frame for both rehabilitation and recon-struction are often longer, and less well-ordered,especially in the LDCs (Fig. 5.4).
Partly due to the slowness of the recovery process,it can be difficult to distinguish between emergencyaid and longer-term development assistance and,therefore, to measure the effectiveness of disasterappeals and responses. Governments wish toharmonise emergency donations with ongoing trade
THE NATURE OF HAZARD74
100
80
60
40
20
0
0.15 0.30 0.45 1.00 1.15 1.30 1.45 2.00 3.002.15 2.30 2.45
Time (hours.minutes)
Per
cent
surv
ival
Figure 5.2 The percentage chance of survival against timefor avalanche victims buried in the snow. After only 15minutes the survival rate is still almost 90 per cent butfalls to less than 30 per cent after 1 hour. This indicatesthe need for a fast emergency rescue response. AfterColorado Avalanche Information Center (2002) at http://geosurvey.state.co.us/avalanche (accessed 4 March 2003).
Nicaragua
Costa RicaMexico
Panama
USA
Packagedhospitals
USA
120
100
80
60
40
20
0
1000
1500
500
03 4 5 6 7 8 9 10 11 12 13 14 15 16 17 18 19 20
Trauma
Medical supplies
Emergency hospitalsand their source
February 1976
Num
ber
of
hosp
ital
atte
ndan
ces
for
trau
ma
Em
ergency
med
icalsupp
lies(to
nnes)
Earth
quak
e
Figure 5.3 The dailynumber of disastervictims attendinghospitals in GuatamalaCity in relation to thearrival of medicalsupplies andemergency hospitalsfrom internationaldonors after the 1976Guatamala earthquake.After Seaman et al.(1984).
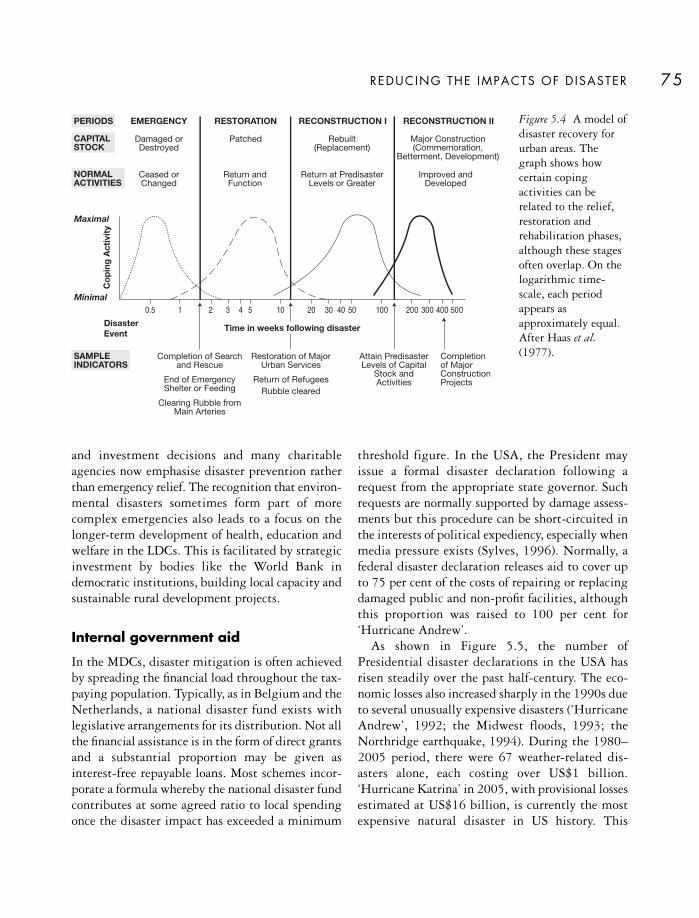
and investment decisions and many charitableagencies now emphasise disaster prevention ratherthan emergency relief. The recognition that environ-mental disasters sometimes form part of morecomplex emergencies also leads to a focus on thelonger-term development of health, education andwelfare in the LDCs. This is facilitated by strategicinvestment by bodies like the World Bank indemocratic institutions, building local capacity andsustainable rural development projects.
Internal government aid
In the MDCs, disaster mitigation is often achievedby spreading the financial load throughout the tax-paying population. Typically, as in Belgium and theNetherlands, a national disaster fund exists withlegislative arrangements for its distribution. Not allthe financial assistance is in the form of direct grantsand a substantial proportion may be given asinterest-free repayable loans. Most schemes incor-porate a formula whereby the national disaster fundcontributes at some agreed ratio to local spendingonce the disaster impact has exceeded a minimum
threshold figure. In the USA, the President mayissue a formal disaster declaration following arequest from the appropriate state governor. Suchrequests are normally supported by damage assess-ments but this procedure can be short-circuited inthe interests of political expediency, especially whenmedia pressure exists (Sylves, 1996). Normally, afederal disaster declaration releases aid to cover upto 75 per cent of the costs of repairing or replacingdamaged public and non-profit facilities, althoughthis proportion was raised to 100 per cent for‘Hurricane Andrew’.
As shown in Figure 5.5, the number ofPresidential disaster declarations in the USA hasrisen steadily over the past half-century. The eco-nomic losses also increased sharply in the 1990s dueto several unusually expensive disasters (‘HurricaneAndrew’, 1992; the Midwest floods, 1993; theNorthridge earthquake, 1994). During the 1980–2005 period, there were 67 weather-related dis-asters alone, each costing over US$1 billion.‘Hurricane Katrina’ in 2005, with provisional lossesestimated at US$16 billion, is currently the mostexpensive natural disaster in US history. This
REDUCING THE IMPACTS OF D ISASTER 75
0.5 1 2 3 4 5 10 20 30 40 50 100 200 300 400 500
DisasterEvent
Time in weeks following disaster
Co
pin
gA
ctiv
ity
Maximal
Minimal
EMERGENCYPERIODS
CAPITALSTOCK
NORMALACTIVITIES
SAMPLEINDICATORS
RESTORATION RECONSTRUCTION I RECONSTRUCTION II
Damaged orDestroyed
Ceased orChanged
Return andFunction
Improved andDeveloped
Return at PredisasterLevels or Greater
Patched Rebuilt(Replacement)
Major Construction(Commemoration,
Betterment, Development)
Completion of Searchand Rescue
End of EmergencyShelter or Feeding
Clearing Rubble fromMain Arteries
Restoration of MajorUrban Services
Return of RefugeesRubble cleared
Attain PredisasterLevels of Capital
Stock andActivities
Completionof MajorConstructionProjects
Figure 5.4 A model ofdisaster recovery forurban areas. Thegraph shows howcertain copingactivities can berelated to the relief,restoration andrehabilitation phases,although these stagesoften overlap. On thelogarithmic time-scale, each periodappears asapproximately equal.After Haas et al.(1977).

THE NATURE OF HAZARD76
upward trend has prompted an ongoing debate onthe extent to which federal funds should providedisaster assistance. According to Barnett (1999), thesystem is:
1 Expensive because of the rapid rise in payouts inrecent decades
2 Inefficient because it allows local governments toavoid a fair share of the costs, e.g. through afailure to enforce building codes or to insurepublic property
3 Inconsistent because equivalent losses are notalways treated in the same way, e.g. localiseddamage may not attain disaster area status andthereby deprive victims of assistance
4 Inequitable because it allows a misallocation ofnational resources, e.g. when wealthy disastervictims are compensated by the general taxpayer.
These concerns are echoed in other developedcountries and have led to tighter controls on theallocation of central funds together with a search foralternative strategies. Many governments now resistcompensating for privately insured losses andfurther reforms include refusing disaster paymentsto households over higher income thresholds, tyingassistance more closely to the local enforcement ofbuilding codes and other measures designed tocontain disaster costs as much as possible within thestricken community.
International aid
The LDCs rely heavily on external support afterdisaster. This assistance is provided by humanitarianaid supplied both bilaterally (donated directlygovernment to government or indirectly through
80
70
60
50
40
30
20
10
01953 1960 1970 1980 1990 2000
Num
ber
of
dis
aste
rs
Year
Figure 5.5 The annual number of Presidential disaster declarations in the USA from 1953 to 2005. After FEMA athttp://www.fema.gov/news/disaster-totals-annual.fema (accessed 13 September 2006).

REDUCING THE IMPACTS OF D ISASTER 77
NGOs, often arising from appeals for a specifiedemergency) and multilaterally (donations which arenot ear-marked and are channelled through inter-national bodies such as the EU, World Bank andvarious UN agencies).
Before the creation of the International League ofRed Cross and Red Crescent Societies (now theInternational Federation) in 1922, the transfer of aidwas largely bilateral. As charitable bodies began tointerest themselves in overseas work, more agencieswere set up – the UN Children’s Fund (UNICEF) in1946 and the FAO World Food Programme (WFP)in 1963. In 1972, the UN established the DisasterRelief Organisation (UNDRO), based in Geneva, tomobilise, direct and coordinate relief worldwide.This initiative has been reinvented several times
since because of consistent under-funding, internalrivalry with other UN agencies and criticisms fromsome member countries. In 1992 a new Departmentof Humanitarian Affairs (DHA) replaced UNDRO;in 1997 the DHA was replaced by the Office for theCoordination of Humanitarian Affairs (OCHA).OCHA was given a mainly coordinating and policydevelopment task and has a presence in about 35countries. Other relief coordination bodies exist. Forexample, the USA maintains an Office of ForeignDisaster Assistance (OFDA) and in 1992 the EUtook steps to coordinate its member states throughthe European Community Humanitarian Office(ECHO).
Overseas development assistance from the MDCsto the LDCs comes mainly from the Organisation
8000
7000
6000
5000
4000
3000
2000
1000
01970 1980 1990 2000
US
$m
illio
ns(2
002
pri
ces)
Year
Figure 5.6 The total humanitarian assistance released annually from DAC donors 1970–2003 at 2002 prices.
Source: OECD Development Assistance Committee (DAC). Published by Global Humanitarian Assistance (2005) athttp://www.globalhumanitarianassistance.org (accessed 24 September 2006).

for Economic Co-operation and Development(OECD) governments. Humanitarian assistance –used for emergencies and disaster relief – is part ofthe overall total. As shown in Figure 5.6, humani-tarian aid doubled in real terms between 1990 and2000 from US$2.1 billion to US$5.9 billion and, asa proportion of total development assistance, rosefrom 5.8 per cent to 10.5. per cent. Fewer than 10wealthy countries donate over 90 per cent of this aidand a growing proportion of the increase has beendonated bilaterally (Macrae et al., 2002). The rise indonations, and in bilateralism, is a response to somehigh-profile conflicts plus a desire of donor govern-ments to ear-mark and monitor their contributionsmore directly. The UN target for annual govern-ment spending on overseas aid is 0.7 per cent of thedonor GDP but the actual sums released arenormally only about half this target figure.
Although much humanitarian assistance goes towar zones, like Iraq and Afghanistan, 19 naturaldisasters during 2004 attracted donations of at leastUS$1 million each. The Indian Ocean tsunami ofDecember 2004 resulted in an unprecedentedresponse level of donations from all sources,especially voluntary organisations and privatedonors, with a total sum conservatively estimated atUS$ 13.5 billion (Telford and Cosgrave, 2007).With perhaps 2 million people adversely affected bythe event, assistance was not hampered by financialconstraints. A lot of the money did not go to reliefwork but was usefully pledged for reconstructionprojects extending over several years.
Although well-intentioned, the flow of disasteraid does not always reflect real need. According toOlsen et al. (2003), the scale of emergency donationsdepends on three key factors – the intensity of mediacoverage, the degree of political interest and thestrength of the international relief agencies in thecountry concerned. Sudden-onset disasters, likeearthquakes and tropical cyclones, tend to attractmore donations than slow-onset disasters, likedroughts and famine, irrespective of the number ofsurvivors who need assistance. The 2004 IndianOcean tsunami gained massive media interest,partly because the affected areas were familiar to
donors through holiday experiences in that part ofAsia. Conversely, journalists tend to ignore the more‘hidden’ crises that arise from poverty and diseaseand focus largely on events with large body countsand good photographic opportunities (Ross, 2004;IFRCRCS, 2006).
Disaster aid is highly political and also dependenton the priorities of the aid agencies. Drury et al.,(2005) showed that the most important long-terminfluence on the allocation of US aid for overseasdisasters was foreign policy, although domesticfactors, like media coverage, also played a part. InEuropean countries, disaster aid is raised mostreadily for former colonies. Food aid began as amechanism for off-loading surplus production inNorth America and Europe. Many examples existwhere food, which is unacceptable for religious ordietary reasons, has been despatched to Third Worldcountries along with death-dated drugs andexpensive equipment lacking technical support orspare parts. Over-generous donations of food aid canlower market prices and disrupt the local economyin some LDCs; in the longer-term they may deflectthe receiving government from developing the localagricultural economy. Logistical difficulties, such aspoor roads and lack of suitable transport, hinder thedistribution of food and medical supplies to remoteareas and delays may also occur through governmentbureaucracy and corruption. The historic, resource-driven emphasis on aid remains. A recurrentdilemma for aid workers is to decide whether todistribute more supplies to fewer victims or fewersupplies to more victims.
How can disaster relief become more efficient?According to Maxwell (2007), one of the greatestchallenges is to have better local information andanalysis that enables food aid to be delivered to thosewho need it most, in the right amount and at theright time. Most observers agree that aid needs tobe more carefully targeted. In order to achieve this,an improved identification of those most at risk isneeded plus the development of better early warningsystems, especially for disasters involving foodshortage. More training, and the longer-termretention of aid operatives would help, especially
THE NATURE OF HAZARD78

REDUCING THE IMPACTS OF D ISASTER 79
with better responses in the first ‘golden hours’.Above all, international donors and aid agenciesneed to change their attitudes away from percep-tions of ‘victims’ and ‘failed states’ and be pre-pared to give more ownership for disaster relief toregional bodies and local communities. This ispartly a matter of respect and responsibility but it is also highly practical because internationalbodies can pursue their own agendas, lack expertisein local skills and a knowledge of longer-term localneeds.
An example of the way forward may be found inrecent critiques of the traditional distribution of aidin the form of goods, such as food, blankets andshelter materials. So long as safeguards are in placeto limit corruption, there is growing support forcash-based aid responses that enable, where possible,people to buy the commodities they need locally forthemselves. According to Mattinen and Ogden(2006), cash-based interventions provide moredignity and flexibility in recovery for disastervictims and also liberate aid from donor-drivenpriorities that may distort distant rural economies.Specifically, cash-for-work programmes, whichutilise idle labour for infrastructure reconstructionimmediately after a disaster – as in post-tsunamiIndonesia – are seen as a significant pointer to thefuture (Doocy et al., 2006).
MITIGATION – INSURANCE
Insurance arises when a risk is perceived and theowner pays a fee (premium), usually on an annualbasis, to buy a contract (insurance policy) thattransfers the financial risk to a partner (insurer). Theinsurer – either a private company or the govern-ment – guarantees to meet specified costs in theevent of loss. By this means, the policyholder is ableto spread the cost of a potentially unaffordabledisaster over many years. A commercial insurer takesthe chance either that no loss will occur or that, overtime, the claims will total less than the premiumspaid. A government insurer will pay claims out oftax revenues.
Commercial disaster insurance This is important in the developed countries andabout 80 per cent of all premiums for privateproperty insurance worldwide are paid in Americaand Europe. Insurance companies cover (underwrite)property such as buildings against flood, storm orother specified environmental peril. Policy under-writers try to ensure that the type of property theyinsure is varied and is spread over diverse geo-graphical areas so that only a fraction of the total atrisk could be destroyed by a single event. By thismeans, the cost of payouts to claimants is distributedacross all policyholders and, if the premiums are setat an appropriate rate, the premiums will cover costs.The insurance company makes its profits largely byinvesting the money received from premiums.
Environmental hazards create special problemsbecause the insurance claims after events such asearthquakes or tropical cyclones tend to concentratewithin short time-scales and relatively small areas.The typical pattern of large claims following yearswith few losses also makes premium setting diffi-cult. For example, in 1994 the insurance industryin California collected about US$500 million inearthquake premiums but paid out over US$15billion over a period of more than four years fordamage caused by the Northridge disaster (Fig. 5.7).
16
14
12
10
8
6
4
2
0
Feb
.94
Ap
r.94
Aug
.94
Sep
t.94
Oct
.94
Jan.
95
Ap
r.98
Mar
ch95
May
95
July
95
June
94
US
$b
n
Figure 5.7 The slow accumulation of insured losses (US$billion) following the Northridge earthquake on 17January 1994. Six months after the event less than half ofthe final loss total was known. Upward adjustmentscontinued until April 1998, more than four years afterthe disaster. After Munich Re (2001).
THE NATURE OF HAZARD80
Unless a company has accumulated a large cata-strophe fund, it may not survive such demands.Adverse selection occurs when the policyholder base istoo narrow and dominated by bad risks. Forexample, only floodplain dwellers are likely to bewilling to pay for flood insurance and this leads toa geographical clustering of risk. Tropical stormlosses can be high in coastal areas and, after‘Hurricane Andrew’ in 1992, nine insurance com-panies became insolvent and others attempted toquit the market in Florida (Barnett, 1999).
The insurance industry can increase profitabilityand become more efficient by a variety of measures:
Raising the premiums
This is the most obvious method but the leastpopular with the public. It may have other benefitsif premiums become weighted to reflect the greaterclaims likely from the occupancy of high-risk areas.
Re-rating the premiums
An important step towards setting premiums in line with the local level of risk has become possiblewith the application of Geographical InformationSystems (GIS) to post-code districts containing asmall group of properties. This allows insurers toplace individual policyholders in different bands ofrisk and charge premiums appropriate to thelikelihood of a future claim.
Restricting the cover
Claims liability can be restricted either by the useof a policy deductible (excess) or by capping policiesto limit the maximum amount payable. In Japan therisk of huge losses from earthquakes in urban areashas led to payout limits on any one claim and, abovean agreed threshold, the government has agreed toshare the cost. As a last resort, the company canrefuse to sell any cover in high-risk areas, althoughthis is unpopular with both the public and withgovernments.
Widening the policyholder base
This is done by spreading liability through a mixedbasket of cover rather than by specialising in onetype of insurable peril. In the UK the industry offershomeowner policies that include environmentalhazards, such as storm, flood and frost damage, aswell as fire and theft. By this means, the uptake ofhousehold insurance – which is a requirement of allmortgage lenders – is relatively high and any lossesarising from floods, for example, are subsidised byall policyholders, including the majority with noflood risk.
Reinsurance
Companies can share the risk by joining together,or with government, to pass on part of the risk. Forexample, the primary company might agree to paythe first US$5 million of claims and, for losses inexcess of this sum, the company would be reim-bursed for 90–95 per cent of the cost from itspartners. The reinsurance market is internationaland high risks are spread through the worldmarkets, although the rising cost of claims, and fearsabout factors such as climate change, make itdifficult to obtain all the reinsurance that isrequired.
Reducing the vulnerability
Insurers will offer lower premiums to policyholderswho reduce their risks by, for example, bracing wallsagainst earthquakes or raising floor levels againstfloods. Cover for new properties can be restricted tothose with special construction techniques such asanchoring the structure to the foundation to preventslippage or using wind-resistant roofing and wallingmaterials. But these measures are expensive and arenot widely deployed without government legisla-tion and enforcement.
Some key advantages and disadvantages ofcommercial insurance are shown in Box 5.1 but the industry is changing due to the rising cost of disaster claims. Before ‘Hurricane Alicia’ in

1988, the insurance industry worldwide had neverfaced losses from a single disaster that exceeded US$1 billion (Clark, 1997). Times have changed.According to Munich Re (2006), the year 2005 –the costliest environmental disaster year ever –suffered six major disasters that alone contributedoverall losses of US$170 billion (out of a global totalof US$212 billion) and insured losses of US$82billion (out of a global total of US$94 billion).Previously, the costliest year was 1995 due mainlyto the Kobe earthquake in Japan. As in most years,windstorms were the cause of most insured losses.In 2005, ‘Hurricane Katrina’ – the sixth strongesthurricane recorded since records began in 1851 –alone created total economic losses estimated atUS$125 billion, with US$45 billion covered in the
private market and became the most expensivenatural disaster to date (see Table 5.1).
Although the year 2005 may appear exceptional,Table 5.1 demonstrates not only that global disasterlosses have been increasing for over 50 years but that the insured losses have been growing bothabsolutely and proportionally. According toMalmquist and Michaels (2000), future insuredlosses of US$100 billion arising from a hurricane oran earthquake in a large US city could exceed all there-insurance capital presently available and bank-rupt some companies. High risk problems withinthe US insurance market have been caused by thecoastward shift of population over the last 30 yearsand the failure of local governments to adopt andenforce stringent building codes. The availability of
REDUCING THE IMPACTS OF D ISASTER 81
Plate 5.1 The only house left standing in the Pascagoula neighbourhood of Mississippi, USA, after ‘HurricaneKatrina’. The owners had previously adopted hazard mitigation measures in 1999 aided by Increased Cost ofCompliance Funds obtained through the National Flood Insurance Program. (Photo: Mark Wolfe, FEMA)

THE NATURE OF HAZARD82
Table 5.1 The world’s ten costliest natural disasters (values in million US$)
Rank Year Event Region Economic loss Insured loss
1 2005 Hurricane Katrina USA 125,000 45,0002 1995 Kobe Earthquake Japan 100,000 3,0003 1994 Northridge Earthquake USA 44,000 15,3004 1992 Hurricane Andrew USA 30,000 17,0005 1998 Floods China 30,000 1,0006 2005 Hurricane Wilma USA 18,000 10,5007 2005 Hurricane Rita USA 16,000 11,0008 1993 Floods USA 16,000 1,0009 1999 Winter storm Lothar Europe 11,500 5,900
10 1991 Typhoon Mireille Japan 10,000 5,400
Notes: Values are original losses, not adjusted for price inflation. Insured losses are more accurate than total economic losses.
Source: Adapted from Munich Re (2005)
ADVANTAGES
It guarantees the disaster victim compensationafter loss. This is more reliable than disaster reliefand appeals to those opposed to governmentregulation because it depends on individual choiceand the private market.
It provides an equitable distribution of costsand benefits provided that property owners pay apremium that fully reflects the risk and insurancepayments fully compensate the insured loss.
Insurance can be used to reduce vulnerability.Provided that residents in hazardous areas pay thefull-cost premium, there should be a financialdisincentive to locate in such areas. The difficultyis that most residential development is by specu-lative builders and, until insurance premiumsbecome high enough to make new hazard-proneproperties impossible to sell, it is unlikely thatdevelopers would be deterred.
Existing homeowners can be encouraged toreduce their vulnerability, and enjoy lower insur-ance premiums, by strengthening their propertyand lowering the risk of loss.
DISADVANTAGES
Private insurance may be unobtainable in veryhigh-risk areas. In the USA the insurance industryhas been reluctant to offer flood cover withoutgovernment support and, even when available,landslide insurance normally covers the cost ofstructural repairs to property only and not that ofpermanent slope stabilisation because of thepotential high costs.
There is frequently a low voluntary uptake ofhazard insurance. Only 10 per cent of the build-ings damaged in the 1993 Midwest flood werecovered by flood insurance. Mileti et al. (1999)claimed that only 17 per cent of the US$500billion losses sustained in the USA between 1975and 1994 were insured. Such under-insurance maybenefit the industry when a major disaster strikesand Japanese insurers survived the Kobe earth-quake largely because only 3 per cent of affectedhome-owners had earthquake cover.
Even when insurance policies are taken out, asignificant proportion of policyholders will beunder-insured for the full value of property at risk
Box 5.1
ADVANTAGES AND DISADVANTAGES OF COMMERCIAL INSURANCE
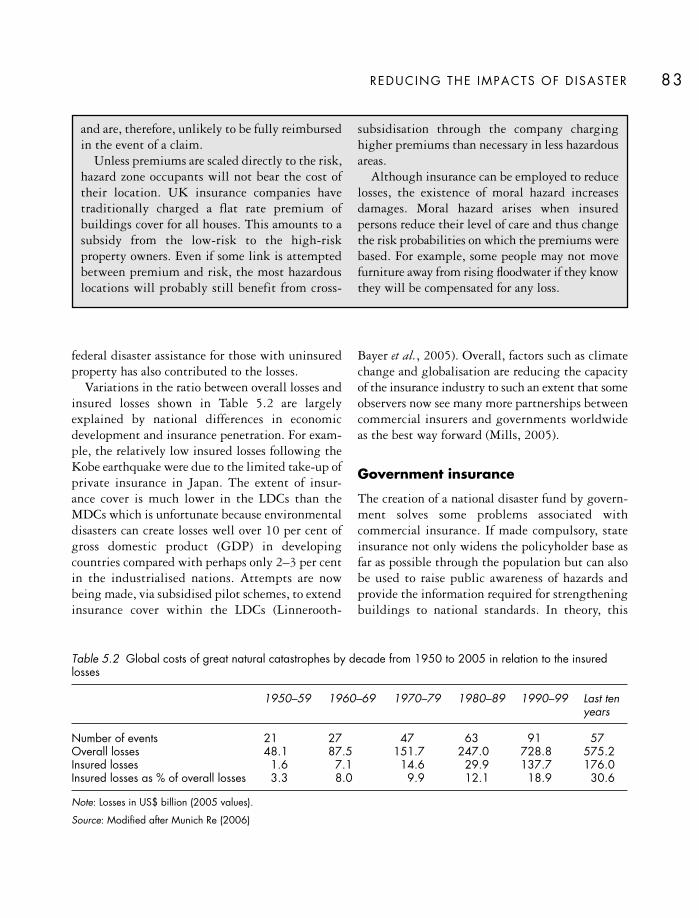
REDUCING THE IMPACTS OF D ISASTER 83
federal disaster assistance for those with uninsuredproperty has also contributed to the losses.
Variations in the ratio between overall losses andinsured losses shown in Table 5.2 are largelyexplained by national differences in economicdevelopment and insurance penetration. For exam-ple, the relatively low insured losses following theKobe earthquake were due to the limited take-up ofprivate insurance in Japan. The extent of insur-ance cover is much lower in the LDCs than theMDCs which is unfortunate because environmentaldisasters can create losses well over 10 per cent ofgross domestic product (GDP) in developingcountries compared with perhaps only 2–3 per centin the industrialised nations. Attempts are nowbeing made, via subsidised pilot schemes, to extendinsurance cover within the LDCs (Linnerooth-
Bayer et al., 2005). Overall, factors such as climatechange and globalisation are reducing the capacityof the insurance industry to such an extent that someobservers now see many more partnerships betweencommercial insurers and governments worldwide as the best way forward (Mills, 2005).
Government insurance
The creation of a national disaster fund by govern-ment solves some problems associated withcommercial insurance. If made compulsory, stateinsurance not only widens the policyholder base asfar as possible through the population but can alsobe used to raise public awareness of hazards andprovide the information required for strengtheningbuildings to national standards. In theory, this
and are, therefore, unlikely to be fully reimbursedin the event of a claim.
Unless premiums are scaled directly to the risk,hazard zone occupants will not bear the cost oftheir location. UK insurance companies havetraditionally charged a flat rate premium ofbuildings cover for all houses. This amounts to asubsidy from the low-risk to the high-riskproperty owners. Even if some link is attemptedbetween premium and risk, the most hazardouslocations will probably still benefit from cross-
subsidisation through the company charginghigher premiums than necessary in less hazardousareas.
Although insurance can be employed to reducelosses, the existence of moral hazard increasesdamages. Moral hazard arises when insuredpersons reduce their level of care and thus changethe risk probabilities on which the premiums werebased. For example, some people may not movefurniture away from rising floodwater if they knowthey will be compensated for any loss.
Table 5.2 Global costs of great natural catastrophes by decade from 1950 to 2005 in relation to the insuredlosses
1950–59 1960–69 1970–79 1980–89 1990–99 Last tenyears
Number of events 21 27 47 63 91 57Overall losses 48.1 87.5 151.7 247.0 728.8 575.2Insured losses 1.6 7.1 14.6 29.9 137.7 176.0Insured losses as % of overall losses 3.3 8.0 9.9 12.1 18.9 30.6
Note: Losses in US$ billion (2005 values).
Source: Modified after Munich Re (2006)

THE NATURE OF HAZARD84
would enable premiums to be related more sensi-tively to the risk. For example, government couldlegislate so that only new properties built toapproved standards were eligible for state insurance.The National Flood Insurance Act (1986) was anearly attempt by the US government to reducedisaster losses by such means and to shift somefederal costs to state governments and the privatesector. There is also a tradition in the USA ofsubsidised crop insurance to provide a safety net forfarmers after adverse weather conditions (Glauber,2004).
Some countries have obligatory insurance coverfor natural disasters through schemes involvingpartnerships between the government and theinsurance industry. Spain has had a scheme fornatural and technological disasters since 1954. InFrance property and motor insurance has includedmandatory cover for natural disasters since 1982financed by a surcharge on private premiums andstate reinsurance. New Zealand introduced govern-ment cover for earthquakes through the Earthquakeand War Damage Act (1944), which was subse-quently extended to cover damage from storms,floods, volcanic eruptions and landslips. The schemewas financed by a surcharge on all fire insurancepolicies of 5 cents per NZ$100 of insured value andcreated an Extraordinary Disaster Fund (Falck,1991). The Earthquake Commission (EQC) admini-stering the programme was empowered to ratepremiums according to risk and was able to refuseclaims on poorly maintained properties. In practice,political pressure ensured that virtually all claimswere met.
At the present time, most governments are trying to make individuals accept more responsi-bility for disaster costs. In Turkey, governmentcompensation for earthquake loss has been replacedby a mandatory insurance scheme but this onlybecomes operative when a property is sold and theresponsibility passes to the new owner. One of themost radical changes in attitude occurred in NewZealand where the existing state scheme wasreformed in 1993 as the government sought todecrease its liability (Hay, 1996). From 1996 the
EQC withdrew cover for non-residential propertyand, although disaster cover for residential propertyremains automatic for property owners who take outfire insurance, the extent of cover has been limited.The EQC retains a fund of some NZ$2.5 billion asa first call on disaster claims, and also has rein-surance arrangements, but the New Zealand govern-ment remains liable for any shortfall in disasterpayments.
PROTECT ION – HAZARD RESISTANCE
Hazard resistance occurs when either purpose-builtstructures are erected, or ordinary buildings arestrengthened, to reduce disaster impact. It relies onskills from civil engineering science and architecturebut has to operate through building codes and otherregulations that depend on political initiativetogether with community acceptance and com-pliance.
Macro-protection
Where the greatest risks occur, whole communitieshave to be defended. Purpose-built structures havebeen used to defend property against hazardousflows of damaging materials such as rock falls, lavaflows, lahars, mudslides and avalanches as well asfloodwaters (river and coastal, including tsunami).The structures act either by containing excessmaterial in reservoirs or by diverting the flow awayfrom vulnerable sites. They occur either at pointlocations (dams) or take a linear form (embankmentsand artificial channels).
The largest structures are flood defences.Embankment systems run alongside many of theworld’s major rivers, for example, over distances of1,400 km for the Red River in North Vietnam andover 4,500 km in the Mississippi valley. Huge damsstore floodwaters upstream; the new Three Gorgesdam on the Yangtze is 175m high and almost 2 kmin length. To resist coastal flooding from the NorthSea, the 1,400 km long coastline of the Netherlands

REDUCING THE IMPACTS OF D ISASTER 85
has been transformed by stabilised dunes, concreteembankments and tidal sea barriers to protectalmost one-third of the country that lies below sealevel. Smaller structures have been erected againstother hazards and Box 5.2 shows how deflectingdams in Iceland protect property against snowavalanches.
During the later twentieth century, engineeredapproaches were increasingly questioned on groundsof financial, social and environmental acceptability.Attitudes to macro-protection changed in ways thatreflect overall hazards paradigms (Chapter 1), asillustrated for river flood control:
The structural era 1930s–1950s
A period with almost exclusive reliance on ‘hard’structures (reservoirs, levees, sea-walls) designed tocontrol floods. These schemes were assessed on civil
engineering criteria and financial cost–benefitgrounds but little thought was given to communityinvolvement and environmental issues.
The floodplain management era 1960s–1980s
A period with a mix of mitigation measures butincreasingly using behavioural approaches (floodwarning, land-use planning, insurance) designed toreduce human vulnerability to floods. Questionsbegan to be raised about the financial and ecologicalsustainability of the largest projects.
The self-reliant mitigation era 1990s–?
A period when communities have been encouragedto take more direct responsibility for living safelywith floods in a sustainable way. ‘Softer’ defences
Avalanches threaten many communities inIceland. On 26 October 1995 an avalanche, con-taining about 430,000 m3 of snow, struck thevillage of Flateyri in north-western Iceland andkilled 20 people in an area previously thought tobe safe (Jóhannesson, 2001). The avalanche wascreated by strong northerly winds blowing largequantities of snow from the plateau into thestarting zones of the two avalanche paths ofSkollahvilt and Innra-Bæjargil above Flateyri.Following this event two large deflecting dams,connected by a short catching dam, were built todivert future flows away from the settlement andinto the sea (Fig. 5.8). Each earth dam is about600 m long and 15–20 m high and designed tointercept avalanche flows at angles of 20–25°. Thepurpose of the central catching dam, which isabout 10m high, is to retain snow and other debristhat might spill over from two deflectors in a large
event. The total holding capacity of the structureis around 700,000m3.
The dams were completed in 1998. Since thenthey have successfully deflected two separateavalanches (February 1999 and February 2000)each with snow volumes over 100,000 m3, impactvelocities of 30 ms–1 and estimated return periodsof 10–30 years. Estimated outlines of theavalanche run-out paths in the absence of the damsshow that the Skollahvilt flow would have causedlittle loss, largely because houses destroyed in1995 in this part of the village have not been re-built. But the 2000 avalanche from Innra-Bæjargilwould have destroyed several houses. Althoughthese two events are much smaller than the designcapacity of the deflecting dams, they provide agood example of the use of defence structuresagainst moderately sized hazards.
Box 5.2
AVALANCHE DEFLECT ING DAMS IN ICELAND
continued

have been adopted to minimise ecological damageand visual intrusion. For example, in the case ofcoastal flooding, sea-walls and groynes have beensupplanted by beach nourishment and dunestabilisation. Stricter land use controls and managedretreat from certain floodplains and shorelines havealso been adopted.
Micro-protection
In most countries, important public facilities likedams, bridges and pipelines are subject to regula-tions for hazard-resistant design and construction.The same is true for large industrial sites but suchprotection is rare for most buildings. After a disaster
THE NATURE OF HAZARD86
300 metres
SkollahvilftBæjargilInnra-
Avalanches
26.10.95
21.02.99
28.02.00Flateyri
DamsDamscompletedcompleted
in 1998in 1998
Damscompleted
in 1998
Figure 5.8 The effectiveness ofdeflecting dams in steering twosnow avalanches, in 1999 and2000, away from the smalltownship of Flateyri, northwestIceland. The extent of thedamaging 1995 avalanche thatled to the construction of thedams is also shown. AfterJóhannesson (2001). Reprintedfrom the Annals of Glaciologywith permission of theInternational GlaciologicalSociety.

REDUCING THE IMPACTS OF D ISASTER 87
strike, some buildings – even properly engineeredstructures – may fail. There are many possiblereasons for this but, even when building codes havebeen properly observed, they only provide standardsto guard against an event predicted to occur duringthe expected lifetime of the structure. Figure 5.9shows the hypothetical example of a buildingdesigned to cope with a wind stress that occurs onaverage once in 100 years (1 per cent probability).Windspeeds just beyond the design limits areunlikely to cause real damage but stresses welloutside this planned performance envelope result insome failure. The two hazards commonly covered byformal building codes are earthquakes and wind-storms, although they apply to other hazards too(Key, 1995).
Most building failures arise either because thequality of on-site construction is poor or because oflegitimate code exemptions (e.g. for governmentpremises). In the LDCs, a lack of technical expertiseand other problems, including corruption, oftenmakes it difficult to meet even basic design require-ments and many buildings remain vulnerable. Butproblems exist widely and, according to Valery(1995), the cost of the 1994 Northridge earth-quake in California could have been halved if all the damaged buildings had been built to the appro-priate code. Another problem is that buildingsfrequently function well beyond an expected life of, say, 50 years. It follows that detailed structuralinventories should be routinely updated but suchreports are rarely available because of the lack ofqualified surveyors and the costs involved.
In the past, most attention has been paid topublic buildings and the facilities expected toremain operative during emergencies (hospitals,police stations, pipelines). Schools, offices andfactories have often been strengthened in the beliefthat they will shelter people seeking refuge. Incontrast, little attention was given to private homes,as demonstrated by tropical ‘Cyclone Tracy’, whichstruck Darwin, northern Australia, in 1974. In thisevent 5,000 out of 8–9,000 un-engineered houseswere physically destroyed or damaged beyondrepair, and three-quarters of the population had to
be evacuated (Stark and Walker, 1979). The Darwindisaster prompted a new acceptance that residentialhousing is as important as public buildings in mostcommunities. When cyclone warnings are issued in the LDCs, public buildings close down and most of the population seek shelter in their ownhomes.
Private property owners are reluctant to pay forstrengthening their homes, especially if they believethat any losses will be compensated by insurance orgovernment assistance. Local authorities also resistthe introduction of building codes if they believethat the costs of compliance and inspection willhamper inward investment and economic develop-ment. But, as commercial insurance against naturaldisasters becomes harder to obtain and, as taxpayersincreasingly rebel against property owners who takeno hazard-resistant actions, better design and codeenforcement will become more important.
Total
Severe
Slight
Nil
10 100 200 500
Storm recurrence interval (year)A
mo
unt
of
bui
ldin
gd
amag
e
Figure 5.9 A theoretical illustration of the resistance ofan engineered building to wind stress from various stormreturn intervals. It is important that building codes areproperly enforced if the economic losses from naturalhazards are to be reduced.

THE NATURE OF HAZARD88
Retrofitting
Hazard-resistant measures have limited effect if theyare restricted to new properties. Therefore, retro-fitting – the act of modifying an existing buildingto protect it, or its contents, from a damaging event– is important. Earthquake engineers in the MDCsnow have the means to protect most existing build-ings from seismic stress and it has been estimatedthat a retrofit policy in Los Angeles, California,would produce a five-fold reduction in potentialcasualties from earthquakes. But relatively fewowners take action, even in such high-risk areas.One reason is that there has never been a large lossof life from earthquakes here and, where high-risebuildings are in multi-occupancy, all the propertyowners have to agree to the measures. Retrofitmeasures are often quicker to install than some other hazard responses but are expensive. Hundredsof Californian schools and hospitals have beenstrengthened against earthquakes, at a cost up of to50–80 per cent of that for new buildings, but forprivate homeowners the costs are seen as too high,even though such action will result in reducedinsurance premiums.
Many types of retrofit can be undertaken. In thecase of earthquakes, brick chimneys can be rein-forced and braced onto structural elements toprevent collapse. Un-reinforced masonry walls canbe strengthened and tied to adequate footings whileclosets and heavy furniture can be strapped to thewalls. To protect against floods, walls can be madewatertight and flood-resistant doors and windowscan be fitted. But technical information about themost appropriate measures is not always available.Without more information and financial help fromgovernment, property owners are unlikely to domore. Some local authorities require the identifica-tion and strengthening (or demolition) of existinghazardous buildings. Work is frequently needed onlow-value public housing and special provisions areoften necessary to ensure that unsafe buildings ofhistorical significance are preserved.
ADAPTATION – PREPAREDNESS
Community preparedness
Preparedness is essential to ensure an effectiveresponse to disaster. In theory, it involves the plan-ning – and testing – of hazard reduction measuresat all timescales ranging from seconds (response to earthquake or tsunami warnings) to decades(response through better land planning or to combatclimate change). Preparedness programmes helphazard zone occupants to recognise the threat andto take appropriate actions, although there willalways be some gap between what people are advisedto do, what they say they will do and what theyactually do in a stressful situation.
Various interest groups have a role to play inemergency preparedness (Fig. 5.10). Appropriateloss-reducing measures include the activation oftemporary evacuation plans, the provision of medi-cal aid, food supplies and shelter. It is important topre-designate a control centre for the relief operationin the knowledge that many basic services – roads,water supplies or telephones – are unlikely to befully available. Most importantly, training in self-help techniques – first aid, search and rescue andfire-fighting – should be given to communities atrisk. Most disaster victims are rescued in the first‘golden hours’ by other survivors, rather than aidworkers. Following the 1999 earthquakes in Turkey,about 50,000 people were rescued from damagedbuildings; local people saved 98 per cent of them(IFRCRCS, 2002).
Preparedness arrangements differ widely withinindividual countries. Sometimes the task may bedevolved to existing bodies, like the defence forcesor the police, whilst other countries have dedicatedagencies. For example, in the USA, the FederalEmergency Management Agency (FEMA) has thelead responsibility for all actions taken to protectthe civilian population. In Australia, EmergencyManagement Australia (EMA) develops andcoordinates national civil defence policy but publicsafety is managed at the regional level through theState Emergency Service units (Abrahams, 2001).In turn these organisations depend heavily on

volunteer bodies, like the local Bushfire Brigades,as well as the police, fire and ambulance services.
There is a move towards more pro-active plan-ning for disaster. In part, this reflects a wider changein emergency management towards maximising the knowledge and experience of hazard-prone communities through greater local resilience todisaster (see Box 5.3). Key elements in disaster pre-paredness and community resilience include earlywarning systems and emergency evacuation awayfrom hazard zones. Such measures have to be well organised and ‘people-centred’ if they are toempower the local population to respond effectively.For example, Chakraborty et al. (2005) have sug-gested that strategies for successful hurricaneevacuation along urbanised coasts in the MDCs
should combine geophysical risk with social vulner-ability to ensure that extra help – such as mobilityassistance by public transport – is available fordisadvantaged groups. Similarly, a tsunami warningplan for Galle in Sri Lanka identified five vulnerablepopulation groups (women, children, people withdisabilities, fishermen and workers in denslypopulated areas) when drawing up priority routesfor evacuation from this coastal city (ISDR, 2006).All these groups are included in the first priorityescape routes shown in Figure 5.11.
Preparedness planning tends to improve withtime, as in California where there is a relatively longhistory of raising earthquake hazard awareness. Some30 years ago residents were poorly prepared to handlethe consequences of a damaging event. Morerecently, following newspaper publicity about earth-quake hazards in the San Francisco Bay Area,residents responded positively (Table 5.3). Afteradvice was successfully disseminated, a clear majorityof those surveyed had stored emergency equipment,together with food and water supplies, whilst theproportion of those who took other steps, such asstrapping water heaters to walls or purchasingearthquake insurance are high given that manyresidents live in apartments that precluded some ofthe possible responses (Mileti and Darlington, 1995).On the other hand, the global growth of tourism hasplaced more people at risk on beaches and ski slopesand the tourist industry has made few preparationsto safeguard its customers (Drabek, 1995).
Although community preparedness may appearlittle more than applied commonsense, there areproblems. Disaster planning remains a long-term,costly exercise. It ties up facilities and people thatare apparently doing nothing, other than waitingfor an event that nobody wants and many believewill never happen. Excluding staffing costs, it wouldtake an etimated £100,000 to set up, plus £20,000per year, for the minimum instrumentation of aquiet volcano whilst the tsunmai monitoring systemproposed by the UN for the Indian Ocean wouldcost £15 million plus £1 million per year to run(Parliamentary Office of Science and Technology,2005). In earthquake-prone urban areas, it is not
REDUCING THE IMPACTS OF D ISASTER 89
Coordination and discussionsfor emergency preparedness
plans, policies, etc.
Civil officials,Law-enforcement
officials
Land managers,Involved agencies,Private companies
General public
News media
Emergencydrills
ScientistsHazard
Information
Policies,land use
Talks, lectures,open houses, etc.
Pre
par
edne
ssp
lans
,ac
cess
rest
rictio
ns,
evac
uatio
n,et
c.
Fact
uals
tate
men
ts,f
orec
asts
,pre
dic
tions
,ha
zard
asse
ssm
ents
,ris
km
aps,
etc.
Figure 5.10 The involvement of various interest groupsin hazard mitigation planning. Each group has a role toplay in assembling and disseminating information for astate of preparedness in advance of a hazard strike.Adapted from Peterson (1996).

THE NATURE OF HAZARD90
Hospital(1000 beds)
Schools
Police
Central bus/railstations
First priority:highly vulnerable groupsSecond priority:evacuation routes inland
Built-up area
SRILANKA
Areas affectedby tsunami
Figure 5.11 Evacuation map for Galle City, Sri Lanka, showing the first and second priority routes recommended for police enforcement during a tsunami emergency. After ISDR (2006). This project was conducted within the UNFlash Appeal Indian Ocean Earthquake – Tsunami 2005 programme co-ordinated by UN-OCHA-ISDR-PPEW.
Human resilience has long been recognised asrelated to human vulnerability (see Chapter 1), ifonly as a reverse image. Generally speaking, thefocus has remained firmly on the vulnerability ofpeople as disaster victims, especially in the LDCs.Whilst the benefits of gaining maximum publicacceptance of, and active involvement in, allhazard reduction measures has become clear overrecent decades, most disaster planning andemergency management organisations still followtraditional ‘top-down’ models. Aided by mediaimages, disaster-affected communities – especiallyin the LDCs – are seen as helpless and entirelydependent on external support brought by reliefworkers and military-style organisations. These
attitudes have been fostered by risk-basedapproaches to hazard, the urgent humanitarianpriorities faced immediately after a disaster and alack of understanding of how people cope best ina crisis. Now attention is changing from thenegatives to the positives, namely – what canaffected communities do for themselves and howcan this capability be strengthened?
The term ‘resilience’ reflects an ability to absorband recover from hazard impact. Debate existsabout whether the concept is relevant to bothnatural and human systems (Maneyena, 2006). Forexample, Klein et al., (2003) viewed resilience inthis wider sense as a key tool in the successfuladaptation to hazard stress for coastal megacities.
Box 5.3
CHANGING VULNERABIL ITY INTO RESIL IENCE

REDUCING THE IMPACTS OF D ISASTER 91
The potential synergy between ecological andsocial resilience in coastal areas was also exploredby Adger et al. (2005) in order to indicate thatmore diverse approaches can be taken to deal withthe processes of crisis and change, especially thoseassociated with climate change. For example, oneway of optimising local ecological resilience alongshorelines threatened by flooding would be thepreservation of coastal vegetation. Danielsen et al.(2005) report that between 1980 and 2000, over25 per cent of the mangrove forests in the fiveAsian countries most affected by the 2004 tsunamiwere removed, despite the evidence that coastaltree vegetation protects shorelines against suchhazards. Similar ‘living with hazards’ strategieshave been proposed for people exposed to riverfloods (see Chapter 11).
Resilience is encouraged by helping people todeal better with emergencies using their ownexperience and indigenous resource capacity(IFRCRCS, 2005). Studies of rural developmentand famine responses in the LDCs have alreadydemonstrated that local experience is crucial forhousehold survival during drought (de Waal,1989) and the associated concept of sustainablelivelihoods recognises the inbuilt strengths ofcommunities faced with ongoing poverty andinjustice, as well as environmental hazards. Thesestrengths depend greatly on social cohesion and the networks of mutual support availablethrough various links between families, friendsand neighbours. In turn, such links are oftendependent on gender, religion, caste or ethnicity.Spontaneous self-help groups regularly spring up in the immediate aftermath of disaster andMustafa (2003) described the importance ofgender roles in Rawalpindi, Pakistan, following aflood when women were particularly active inrelief work and urging more support from thegovernment.
Official aid agencies can promote local resiliencein many ways. The need for people to earn a livingafter disaster has been recognised by the advent ofcash-for-work schemes. Raising hazard awarenessand increasing local capacity is crucial. Forexample, after the 1990 Gilan earthquake in Iran,the International Red Cross organisation oversawthe establishment of student committees chargedwith disaster preparedness and first aid training in15,000 high schools across the country (IFRCRCS2005). It has been suggested that the use of small-scale solar technology in Bangladesh couldhelp to provide safer drinking water as well asmore durable, hazard-resistant building materials(McLean and Moore, 2005). The potential forgreater disaster resilience is not confined to theLDCs. McGee and Russell (2003) showed howfarmers and long-term residents in a rural com-munity in Victoria, Australia, are better preparedto withstand wildfire hazards than other localpeople due to a culture of self-reliance based on experience and preparedness. As a result of suchindigenous attitudes, emergency and disastermanagement in Australia is undergoing a pro-found shift from a vulnerability-based approachtowards working with local communities to build their resilience and achieve safer and moresustainable communities in the future (Ellemor,2005).
Resilience is not a complete solution and muchmore needs to be done. For example, there areorganisational problems in integrating householdand community-level coping mechanisms withthe workings of national governments and theinternational relief agencies. But it does, however,promise to provide a more independent, dignifiedand sustainable future for many people living indisaster-prone areas.

unreasonable to plan for the emergency shelteringof up to 25 per cent of the population. This requiresusable buildings and the massive stockpiling offood, medical supplies and sanitation equipment.Experience suggests that carefully prepared adviceneeds to be distributed, both widely and often, tothe public through the media from an authoritativegovernment agency. Once awareness increases,workshops, pamphlets, brochures, videos and othermaterials become important tools. Public bodiesand private sector companies have opportunities tobuild awareness of environmental hazard intoexisting health and safety programmes but it isdifficult to monitor progress within individualhouseholds.
International preparedness
One of the main challenges is to implement effectivepreparedness schemes in the developing nationsthrough an understanding of the prevailing socialand cultural conditions. Since 1998 the lead agencyhas been the UN Office for the Coordination ofHumanitarian Affairs (OCHA). Specialist rescueand relief groups can supply equipment and trans-port when disaster strikes, like the charity OXFAMwhich has an emergency store with cooking equip-ment and material for constructing temporary
shelters. The success of such arrangements dependson OCHA acting as a link between aid donors and recipients through a register of expertise thatcan be quickly matched to the type of assistancerequired.
Much international disaster planning followsmilitary lines with a stress on communications,logistics and security. These are clearly importantrequirements but the ‘command and control’ model,represented by a top-down, rigidly controlledorganisation, is not always appropriate, especiallyfor the LDCs. Some external aid may be deliveredby bodies perceived as enacting foreign policy onbehalf of distant ‘colonial’ powers, and militaryforces may not be completely sensitive in operatingrefugee camps or dealing with women and children.Sometimes specialised forms of military assistance– such as airlifted relief supplies – are essential butmilitary support tends to be short-lived because itis normally diverted from ongoing defence dutieselsewhere.
These issues highlight the potential for local pre-paredness. Despite past inertia in changing disastermanagement, some success has been achieved, notleast for cyclone preparedness in Asia. For example,a major Cyclone Preparedness Programme inBangladesh started in 1973, after the devastating1970 storm. About 32,000 trained volunteers are
THE NATURE OF HAZARD92
Table 5.3 The proportion of residents in the San Francisco Bay Area of California taking selected loss-reducingactions within the home before and after newspaper publicity about increased earthquake risk
Preparedness action Pre-publicity (per cent) Post-publicity (per cent) Increase
Stored emergency equipment 50 81 31Stockpiled food and water 44 75 31Strapped water heater 37 52 15Rearranged breakable items 28 46 18Bought earthquake insurance 27 40 13Learned first aid 24 32 8Installed flexible piping 24 30 6Developed earthquake plan 18 28 10Bolted house to foundation 19 24 5
Note: The postal sample in this survey consisted of 1,309 households and a total of 806 usable questionnaires were returned.Respondents could report multiple actions.
Source: Adapted from Mileti and Darlington (1995)

now organised into teams of 12 members respon-sible for raising public awareness of cyclone hazardsin some 3,500 villages. The teams have radios tomonitor weather bulletins and are also equippedwith megaphones and sirens in order to dissemi-nate warnings locally, usually by bicycle. Whilst300,000 people were killed in Bangladesh by the1970 cyclone, a similar event in 1991 claimed amuch reduced 140,000 victims. A similar involve-ment of local communities in the hazard awarenessand planning process in Orissa, India, began follow-ing the 1999 cyclone. Progress was tested by asmaller event in 2002. Overall preparedness at the community level had improved although theinteractions of government organisations and NGOs remained less than optimal (Thomalla andSchmuck, 2004). In other LDCs, the low-techsurveillance of river levels, aided by the growing useof radios and mobile phones for reporting changesback to a central organisation, plus the stock-pilingof items (sandbags, shovels, food, medicines) hasreduced the threat from flooding.
ADAPTATION – PREDICT IONS,FORECASTS AND WARNINGS
Sophisticated forecasting and warning systems(FWS) are available due to scientific advances infields such as weather forecasting and associatedimprovements in communications and informationtechnology. Most warnings of environmental hazardare based on forecasts but some threats (like earth-quakes and droughts) are insufficiently understoodand preparedness has to be based on predictionsinstead. It is important to understand the differencebetween predictions, forecasts and warnings.
Predictions
Predictions are based on statistical theory and thehistorical record of past events. Because the resultsare expressed in terms of average probability, hazardpredictions tend to be long-term with no preciseindication of when any particular event may occur.
For earthquakes they may extend several years aheadand it is not usually possible to specify either theprecise location or the magnitude of the event withmuch confidence.
Forecasts
Forecasts depend on the detection and evaluation of a potentially hazardous event as it evolves. Thismeans that, depending on the ease with which such events can be monitored, it is often possible tospecify the timing, location and likely magnitudeof an impending hazard strike. Strictly speaking,forecasts are scientific statements and offer no adviceas to how people should respond. They tend to beshort-term and the limited lead-time for issuingforecasts often restricts the effectiveness of warnings.
Warnings
Warnings are messages advising people at risk aboutan impending hazard and the steps that should betaken to minimise losses. All warnings are based oneither predictions or forecasts but for many agencies,such as those involved with national weatherservices, very few routine forecasts are followed bywarnings.
Combined FWS are most useful where short-termaction, often involving evacuation, can avertdisaster. The greatest success has been achieved withhurricane and flood warning procedures. Droughtand tectonic hazards remain difficult to forecast,although some success is possible. For example,based on early warning indicators, the PhilippineInstitute of Volcanology and Seismology advised thegovernment to evacuate residents within a 20-mileradius of Mount Pinatubo before the volcanic erup-tions in June 1991. Although hundreds of peoplewere killed, over 10,000 homes destroyed and some US$260 million worth of damage occurred, afurther 80,000 people were saved together with anestimated US$1 billion in US and Filipino assets(OFDA, 1994).
As shown in Figure 5.12, each FWS consists offour key stages:
REDUCING THE IMPACTS OF D ISASTER 93

THE NATURE OF HAZARD94
• Threat recognition covers the preliminary periodwhen a decision is taken to establish a relevantmonitoring programme leading to a FWS. To beeffective, schemes need to be widely publicisedamong the community at risk and then testedwith mock disaster exercises. Ideally, feedbackfrom this experience leads to design improve-ments in the system. Other revisions shouldoccur as a result of hindsight reviews afterdisaster.
• Hazard evaluation includes several sub-steps fromobservers first detecting an environmental changethat could cause a threat, through to estimatingthe scale of the risk and the final decision to issuea warning. This involves a specialised agency,such as a national meteorological service, becauseof the need for continuous monitoring by com-prehensive networks backed up with heavyinvestment in scientific equipment and personnel.The priority at this stage is to improve theaccuracy of the forecast and to increase the lead-time between issue of the warning and the onsetof the hazardous event. In order to complete theprocess, and retain public confidence, stand-down
messages should be issued when the emergency isover.
• Warning dissemination occurs when the message istransmitted from the forecasters to the hazardzone occupants. The message is likely to be for-mulated and conveyed by a third party throughdifferent communication methods, such as radio or television, and different personnel, suchas the police or neighbours. Once again, thisstage contains several components, like thecontent of the message or the way in which it isconveyed, which are known to affect the eventualoutcome.
• Public response is the key phase where the loss-reducing actions are taken, sometimes on a largescale. For example, over 2 million residents of theeast coast of the USA evacuated inland followingwarnings of ‘Hurricane Floyd’ in September1999. From Figure 5.12, it can be seen that theresponse may be influenced directly through an input based on the public’s knowledge of the evolving hazard and various feedback mech-anisms can help to improve later editions of the warning. However, the response is largely
DESIGN OF WARNINGSYSTEM
IMPLEMENTATIONTESTING
EDUCATION OFUSER GROUPS
APPEARANCEOF
HAZARD
DECISIONTO
WARN
HINDSIGHTREVIEW
DECISIONTO ISSUE
"ALL CLEAR"
THREAT RECOGNITION
MESSAGE CONTENTSCOPE OF WARNING
MODE OF TRANSMISSION
WARNING DISSEMINATION
MONITORINGINTERPRETINGFORECASTING
HAZARD EVALUATION
AGEGENDER
ETHNICITYEXPERIENCE
EVALUATIONDAMAGE
REDUCTION
PUBLIC RESPONSEFactors Actions
Feedback
Feedback
Figure 5.12 A modelof a well-developedhazard forecasting andwarning systemshowing bypass andfeedback loops. Thekey stages are threatrecognition, hazardevaluation, warningdissemination andpublic response to thewarning.

determined by the nature of the warning messageand the recipient’s behaviour.
All FWS should be ‘people-centred’ to be effective(Basher, 2006). In other words, an understanding ofthe social setting is as important as the accuracy ofthe scientific information because there is often agap between the technical capacity of the forecastand the ability of a community to respond to thewarning. The initial decision to warn is crucial. Inmarginal situations, forecasters have to makedifficult decisions quickly and can be caughtbetween the dangers of issuing a false warning orissuing no warning at all. Until recently, forecastagencies have assumed little direct responsibility fortheir products after they have been issued, anattitude sometimes reflecting a wish to avoid legalliability following either defective forecasts or pooradvice about damage-reducing actions. Publicconfidence is most likely to be eroded in situationswhere either no warning is issued or when a falsewarning is given. Such mistakes can be costly. Forexample, the erroneous prediction of the eruption ofthe Soufrière volcano in Guadeloupe in 1976 led tothe evacuation of 72,000 people for several months.In other circumstances, failure to issue an adequatewarning may have little practical effect.
The effectiveness of hazard response is influencedby a number of factors. Tiered warnings, incor-porating a ‘watch’ phase before the ‘warning’ phase,tend to avoid gross errors involving evacuation butnot all hazards (e.g. earthquakes) are suitable fortiered warnings. Pre-planning should ensure that allbasic procedures are understood, such as the advanceidentification of the people at risk and the organ-isations to be warned. There should also be somealternative means to distribute messages in adverseenvironmental conditions which may include theloss of electrical power.
Feedback within the system, including anaccuracy check on the forecasters, and a responsecheck on those being warned, is vital. This isbecause the onward transmission of the message maybe unnecessarily delayed, or even halted, at variouspoints by operators seeking confirmation on some
aspect. This is most likely to happen with ambigu-ous messages. It is believed that effective warningmessages should contain a moderate sense ofurgency, estimate the time before impact and thescale of the event, and provide specific instructionsfor action, including the need to stay clear of the hazard zone (Gruntfest, 1987). Advice onpresent environmental conditions, and notice ofwhen the next warning update will be issued, is also helpful.
The behaviour of those being warned can dependon the mode of warning and the content of themessage. For the general public, the news media actas the primary source of information. The bestwarning messages make the content personallyrelevant to those expected to act on the information(Fisher, 1996). In this context, warnings delivereddirectly by other people, such as neighbours, arerelevant. Although warnings via the mass media aremost likely to be believed if issued by governmentofficials or a known emergency organisation, theinitial message is likely to alert people to the factthat something is wrong rather than mobilise themto a specific response.
Some confirmation of the first warning receivedby an individual is almost always sought before anyaction is taken, hence the advantage of tieredwarnings. For example, confirmation may be soughtfrom members of the family or the police. Thismeans that the interpretation of the warningmessage normally takes place as a group response.For individuals, past experience of the same hazardraises the level of warning belief and there is someevidence that women are more likely to interpret amessage as valid than men. Old and infirm peopleliving alone are less likely to make an effectiveresponse to hazard warning, either through pro-tecting property or evacuation, and special supportshould be made available in such cases. Often there is a reluctance to evacuate. This may bebecause the message fails to specify this action, orpeople believe they can cope or because they fearlooting of an empty house. There is a considerablenatural attachment to the home environment butfamily groups are more likely to evacuate than
REDUCING THE IMPACTS OF D ISASTER 95

single-person households, often to the homes ofrelatives rather than to disaster shelters.
ADAPTATION – LAND USE PLANNING
The main purpose of hazard-related land planningis to zone land so that new development can besteered away from dangerous sites. This is achievedby an intervention in the market-driven processwhereby hazard-prone land, initially held in low-intensity uses such as forestry or agriculture, isconverted into higher intensity occupation. Suchconversion increases land values and therefore leadsto greater losses to life and property when disasterstrikes. The conversion process is driven by com-petition for land and a desire to achieve profits – allfunctions of population growth, urbanisation andwealth creation. Especially in the MDCs, greateraffluence and leisure time has led to second homesand recreational facilities in environments, such ascoasts and mountains, which can be hazardous. Sofar, land-use planning has been adopted mainly inthe wealthier countries but there is a strong case forits wider application and El-Masri and Tipple(2002) place better land planning, along withimproved shelter design and institutional reform, atthe heart of sustainable hazard mitigation fordeveloping countries.
Land use can be regulated at scales from theregional plan level through town zoning ordinancesdown to individual plot division byelaws. Theapproach works most visibly by prohibiting newbuilding in high-hazard areas, a policy that canconflict with other community objectives and withlocal vested interests. Typically these include theoriginal landowners, estate agents, developers andbuilders, who are all driven by a powerful profitmotive. In addition, the designation of hazard zoneswithin areas already developed for housing will beopposed by the residents who anticipate a loss inmarket value of their property. According to Burbyand Dalton (1994), hazard-based land planning ismost likely to be adopted by local councils if
sponsored by the national government. There arealso ways in which the policy can gain the widercommunity support it needs. For example, whilstlow-density zoning might be imposed in order tolimit the potential property losses in one area, thebuilder concerned might be compensated by thegranting of a permit for a high-density developmentin a safer area nearby. Land use planning can gainpublic support by guiding new development awayfrom environmentally sensitive areas, such aswetlands, and by zoning some hazard-prone areas,such as river corridors, for outdoor recreation. Lowlevels of building density can be maintained bypermitting large lots only to be developed or bydedicating areas to various open-space uses, such asparks or grazing.
The main limitations on land-use planning are:
• lack of knowledge about the hazard potential ofevents which might affect small areas, e.g.individual building plots
• the presence of existing development• the infrequency of many hazardous events
and the difficulty of raising community aware-ness
• high costs of hazard mapping, including detailedinventories of existing land use, structures andoccupancy rates
• local resistance to land controls on political andeconomic grounds.
Land use controls are most successful in communi-ties that are growing and still have undevelopedland available. To this extent, they work best in theareas that need them least. Conversely, in areaswhere the pressure for land development is high,zoning will be less effective. Hazard-prone landoften appears very desirable. Many landslide areasand floodplain sites have outstanding scenic viewsand can command high market prices if there is no awareness of a threat. Under the ancient legaldoctrine of caveat emptor (‘let the buyer beware’),there is no obligation for the owner of such land to disclose any risks but, in some countries, legi-
THE NATURE OF HAZARD96

REDUCING THE IMPACTS OF D ISASTER 97
slation now requires the vendor to disclose geo-logical and other environmental hazards at an earlystage so that the potential buyer can make aninformed decision (Binder, 1998). Such legalimpediments are unpopular with local commercialinterests and planning authorities may refuse toadopt land use regulations, believing that they willlose economic initiatives to more lenient com-munities nearby. To minimise this, controls are bestimposed – and policed – on the widest possiblespatial scale.
Effective land controls depend on the quality ofthe information available. An accurate delimita-tion of the hazard zone is crucial. Any regulationsadopted must be seen to be reasonable in terms of the development controls proposed and should be capable of defence in a court of law. Ideally,variations in risk should be identifiable down to thelevel of individual properties. For many hazards,such as cyclones and earthquakes, such precision isunattainable and the greatest accuracy is achievedwith topography-dependent hazards like floods,landslides and avalanches.
Macro-zonation
Macro-zonation (regional planning) can help to steerbroad policy decisions. For example, the regionalmap of seismic risk in New Zealand (Fig. 6.9) couldbe used to delineate national priority areas forretrofitting existing buildings with anti-seismicmeasures or for the introduction of anti-seismicbuilding codes for new development.
Micro-zonation
Zoning ordinances are used to implement theregional plan at the scale of communities and build-ing lots. They can be used to control developmentthrough the provision of reports on aspects such assoils, geological conditions, grading specifications,drainage requirements and landscape plans as wellas specific hazard threats. Relatively large-scalemaps (at least 1:10,000) are usually required for
zoning in high-risk urban areas. Other regulationsthen apply when applications are made for deve-lopment at the building plot level. For example,subdivision regulations ensure that the conditionsunder which land may be subdivided are in con-formity with the general plan.
Micro-zonation is most successful for thosehazards created by fluid flows of material that areguided across the Earth’s surface by topography.These can allow credible planning restrictions ondevelopment down to plot level and include floods,plus some lava flows and mass movement hazards.Box 5.4 demonstrates the process for the likely pathof a debris flow across an alluvial fan in the AndorranPyrenees. Earthquake micro-zonation is less precisebut is very important because of the high threatpotential. In this case the identification of activefault lines is crucial and building controls are thenusually imposed over a set-back corridor runningalongside the fault as illustrated in Box 5.5 for anarea in California.
For high-risk areas, a number of options areavailable. The public acquisition of hazard-proneland is the most direct measure available to localgovernments. Once acquired, the lands can bemanaged to protect public safety or to meet othercommunity objectives, such as open space orrecreational facilities. But land acquisition is expen-sive and local authorities rarely have the resourcesfor outright purchase. Another option is for anagency to acquire land through purchase and thencontrol development in the public interest, such as leasing it for low-intensity use. If public lands are available close to a hazard zone, and if theoccupants are willing to relocate, it may be possiblefor privately owned hazardous areas to be exchangedfor safer land. Any movement of structures oroccupants or the demolition of unsafe buildings isalmost always difficult, expensive and controversial.For example, relocation away from the area maydestroy any potential the land might have topromote growth and generate local tax revenues.The purchase and demolition of buildings withhistorical or architectural importance will alsogenerate opposition from pressure groups.
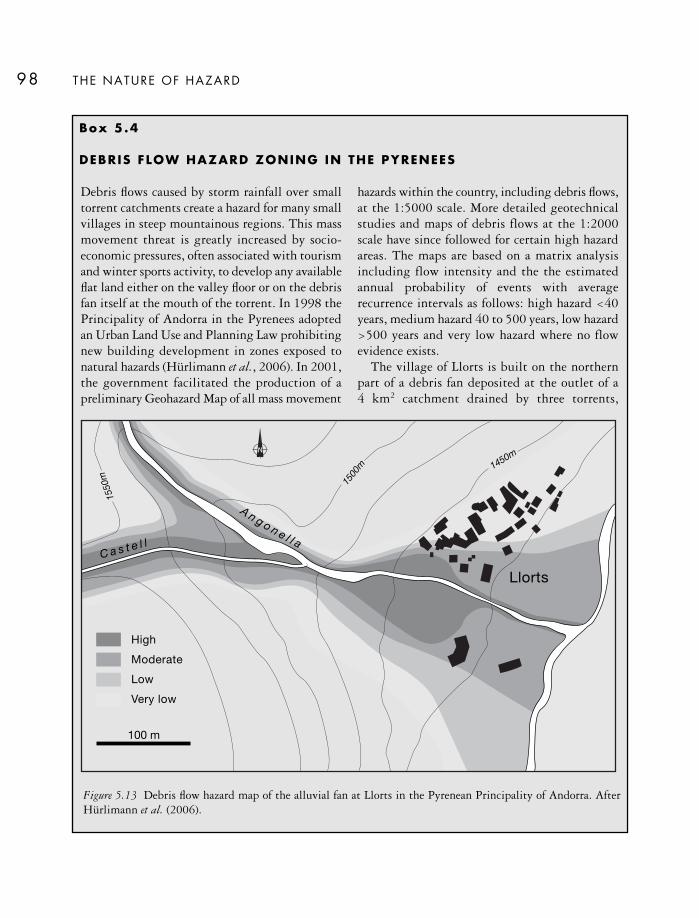
THE NATURE OF HAZARD98
Debris flows caused by storm rainfall over smalltorrent catchments create a hazard for many smallvillages in steep mountainous regions. This massmovement threat is greatly increased by socio-economic pressures, often associated with tourismand winter sports activity, to develop any availableflat land either on the valley floor or on the debrisfan itself at the mouth of the torrent. In 1998 thePrincipality of Andorra in the Pyrenees adoptedan Urban Land Use and Planning Law prohibitingnew building development in zones exposed tonatural hazards (Hürlimann et al., 2006). In 2001,the government facilitated the production of apreliminary Geohazard Map of all mass movement
hazards within the country, including debris flows,at the 1:5000 scale. More detailed geotechnicalstudies and maps of debris flows at the 1:2000scale have since followed for certain high hazardareas. The maps are based on a matrix analysisincluding flow intensity and the the estimatedannual probability of events with averagerecurrence intervals as follows: high hazard <40years, medium hazard 40 to 500 years, low hazard>500 years and very low hazard where no flowevidence exists.
The village of Llorts is built on the northernpart of a debris fan deposited at the outlet of a 4 km2 catchment drained by three torrents,
Box 5.4
DEBRIS FLOW HAZARD ZONING IN THE PYRENEES
1 4 5 0 m
1 50 0
m
1550
m
Llorts
A n g o n e l l aC a s t e l l
High
Moderate
Low
Very low
100 m
Figure 5.13 Debris flow hazard map of the alluvial fan at Llorts in the Pyrenean Principality of Andorra. AfterHürlimann et al. (2006).

Public education can help to discourage develop-ment in hazardous areas. Some of the simplestmethods – like the posting of warning notices –help to highlight the threat. Since any effectivehazard-reduction strategy depends on the under-standing and cooperation of the community as awhole, public information programmes are essentialaids. These programmes may operate through awide variety of dissemination means, includingconferences, workshops, press releases, and thepublication of hazard zone maps. Financial measurescan discourage development in hazardous areas.Unlike land acquisition and zoning, which directlycontrol development, the use of financial incentivesand disincentives work indirectly by altering therelative advantage of building in a hazard zone. For
example, the appropriate local government bodymay elect to locate any investment in publicfacilities, such as roads, water mains and sewers,only in those areas deemed hazard-free and zoned fordevelopment. Any national government schemethat provides grants, loans, tax credits, insurance orother type of financial assistance has a large potentialeffect on both public and private development. Asa positive incentive, government can offer tax creditson hazard-prone land that is left undeveloped ordeveloped at a low density only. Financial dis-incentives can also be used to deter land conversion.For example, in the USA federal grants and benefitsare withheld from flood-prone communities that donot participate in the National Flood InsuranceProgram.
REDUCING THE IMPACT OF D ISASTER 99
although it is the Angonella torrent that primarilyfeeds the fan (Fig. 5.13). The highest part of thecatchment reaches 2,600 m above sea level (asl)whilst the fan apex is at 1,475 m asl and 250 mlong with an average slope of some 12°. Futuredebris flows can freely enter the apex of the fan anda high-hazard zone was delimited in this presentlyundeveloped area. Although most of the village is
situated in the designated safe area, some existingbuildings are exposed to moderate and low levelhazard. Elsewhere in Andorra, similar fans havealready been identified as suitable for buildingdevelopment and it will be important for mapssuch as this to be absorbed into the officialbuilding codes so that land-use planning in themountains can be better regulated.
Seismic microzonation has been a goal in theUnited States for many years – especially inCalifornia – where the 1972 Alquist-PrioloEarthquake Fault Zoning Act was passed to reducethe effects of surface faulting on residentialproperty. This state law was enacted as a directresult of property damage arising in the 1971 SanFernando earthquake. It is concerned only withsurface fault rupture, the situation when deep-seated ground movement breaks through to the
land surface. The State Geologist is required toestablish and map regulatory zones (EarthquakeFault Zones) around the surface traces of knownactive faults, i.e. a fault that has ruptured in thelast 11,000 years. Local agencies must then controlmost types of proposed development within thesezones, including all land divisions and moststructures built for human occupancy. No newstructure for human occupancy can be placed overa fault trace and must be set back at least 50 feet.
Box 5.5
EARTHQUAKE HAZARD ZONING IN CAL IFORNIA
continued
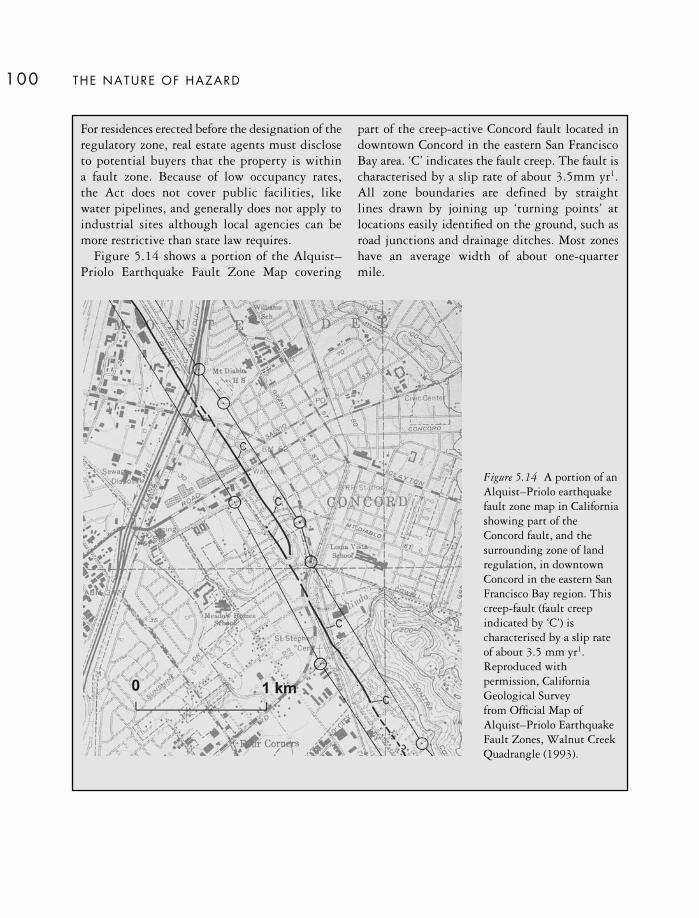
THE NATURE OF HAZARD100
For residences erected before the designation of theregulatory zone, real estate agents must discloseto potential buyers that the property is within a fault zone. Because of low occupancy rates, the Act does not cover public facilities, like water pipelines, and generally does not apply toindustrial sites although local agencies can bemore restrictive than state law requires.
Figure 5.14 shows a portion of the Alquist–Priolo Earthquake Fault Zone Map covering
part of the creep-active Concord fault located indowntown Concord in the eastern San FranciscoBay area. ‘C’ indicates the fault creep. The fault ischaracterised by a slip rate of about 3.5mm yr1.All zone boundaries are defined by straight lines drawn by joining up ‘turning points’ atlocations easily identified on the ground, such asroad junctions and drainage ditches. Most zoneshave an average width of about one-quarter mile.
Figure 5.14 A portion of anAlquist–Priolo earthquakefault zone map in Californiashowing part of theConcord fault, and thesurrounding zone of landregulation, in downtownConcord in the eastern SanFrancisco Bay region. Thiscreep-fault (fault creepindicated by ‘C’) ischaracterised by a slip rateof about 3.5 mm yr1.Reproduced withpermission, CaliforniaGeological Survey from Official Map ofAlquist–Priolo EarthquakeFault Zones, Walnut CreekQuadrangle (1993).

KEY READING
Basher, R. (2006) Global early warning systems fornatural hazards: systematic and people-centred.Philosophical Transactions of the Royal Society (A) 364:2167–82.
Key, D. (ed.) (1995) Structures to Withstand Disaster.London: Institution of Civil Engineers.
Mills, E. (2005) Insurance in a climate of change.Science 309: 1040–3.
Olsen, G. R., Carstensen, N. and Høyen, K. (2003)Humanitarian crises: what determines the level ofemergency assistance? Media coverage, donorinterests and the aid business. Disasters 27: 109–26.
WEB L INKS
European Commission Department of HumanitarianAid www.ec.europa.eu/echo/index
Emergency Management Australia www.ema.gov.au/
Federal Emergency Management Agency USAwww.fema.gov
International Committee of the Red Cross www.icrc.org/
Oxfam International www.oxfam.org/en/
United Nations Refugee Agency www.unhcr.org/
REDUCING THE IMPACTS OF D ISASTER 101


Part II
THE EXPERIENCE AND REDUCTION OF HAZARD
Naturae enim non imperatur, nisi parendo(Nature, to be commanded, must be obeyed)
Francis Bacon, 1561–1626


EARTHQUAKE HAZARDS
In the first six years of the twenty-first century, over200 fatal earthquakes were recorded with a total lossof life of over 360,000 people. This compares withless than 2 million recorded fatalities in the previouscentury. The greatest death toll from a recent singleevent occurred in the 2004 Sumatra earthquake andtsunami when about 230,000 people lost their lives.Impacts on a similar, or even larger scale, have beenpreviously recorded. The 1976 Tangshan earthquakein China had an official death toll of 255,000,although some estimates put it as high as 655,000or 750,000 people, whilst the 1920 Haiyuan(Gansu) earthquake, also in China, is thought tohave killed about 200,000.
The greatest losses of life and infrastructure arefound whenever there is a combination of intenseenergy release along the earthquake fault and highlevels of human vulnerability. This combinationexists where large earthquakes occur in close proxi-mity to people living in areas with high populationdensities and poorly constructed buildings. Thefatalities at Tangshan were so high because theearthquake occurred at a shallow depth directlyunderneath a city of one million people, most ofwhom were sleeping in structurally weak houses.Over 90 per cent of the residential buildings were
destroyed. Even when a large earthquake affects arural area, the relative cost can be high. In the 1993earthquake at Maharashtra (India), the extent ofdestruction to key agricultural assets exceeded 50per cent and created severe difficulties for thesurvivors seeking to regain their livelihoods (Table6.1). Earthquakes are a major threat worldwide tosome of the most advanced economies, as well as theLDCs. For example, the 1995 Kobe (Japan) earth-quake killed more than 5,300 people and made300,000 homeless. Serious concerns remain aboutthe likely future damage associated with a damagingearthquake in Tokyo.
6
TECTONIC HAZARDS
Ear thquakes
Table 6.1 The proportion of agricultural assetsdestroyed by the 1993 Mahrashtra earthquake
Livestock Per cent Implements Per cent
Cattle 18.3 Buffalo carts 36.6Buffalo 23.5 Tractors 48.9Goats/Sheep 47.5 Ploughs 50.2Donkeys 43.5 Pump Sets 47.8Bullocks 12.9 Cattle Sheds 67.2Poultry 65.3 Sprayers 62.3
Note: The survey covered 69 affected villages with apopulation of 170,954 persons.
Source: Adapted from Parasuraman (1995)

Generally speaking, large earthquakes pose thegreatest hazard because they shake the ground moreseverely, for a longer duration and over more exten-sive areas than smaller events. But event magni-tude may be over-ridden, and is often amplified, by local conditions. For example, geological factorscan increase losses especially when either steepslopes cause landslides, or alluvial soils liquefy and enhance the ground shaking. Most of theestimated 200,000 deaths in the 1920 Haiyuanearthquake arose from slope failure when loessdeposits collapsed and buried entire towns. In urbanareas, fire is an important secondary peril, often dueto the rupture of gas and water pipes. Over 80 percent of the property damage in the San Franciscoearthquake of l906, when about 3,000 people died, was due to fire. The worst natural disaster in Japan was the Great Kanto earthquake of 1923,which killed nearly 160,000 people in Tokyo andYokohama. The earthquake occurred at a time when over a million charcoal braziers were alight in wooden houses to cook the midday meal. Theresulting fires destroyed an estimated 380,000dwellings.
The time of day that an earthquake strikes isusually highly significant in determining the levelof human fatalities. The 1992 earthquake atErzincan (Turkey) claimed only 547 lives, largelybecause it happened in the early evening when manypeople were worshipping in local mosques that werecomparatively earthquake-resistant. In contrast, the 2005 Kashmir earthquake killed over 19,000children alone, mainly because the tremblor struckduring school hours and a majority of the poorlyconstructed schools collapsed in the shaking.
THE NATURE OF EARTHQUAKES
Earthquakes are caused by sudden movements,comparatively near to the earth’s surface, along azone of pre-existing geological weakness, called afault. These movements are preceded by the slowbuild-up of tectonic strain that progressivelydeforms the crustal rocks, producing stored elastic
energy. When the stress exceeds the strength of thefault, the rock fractures. This sudden release ofenergy produces seismic waves that radiate out-wards. It is the fracture of the brittle crust, followedby elastic rebound on either side of the fracture,which is the cause of ground shaking. The point ofrupture (hypocentre) can occur anywhere between theearth’s surface and a depth of 700 km. Typically, therupture of the fault then propagates along the fault,with earthquake waves being radiated from alongthe fault plane, not just from the hypocentre. Thesize of the earthquake depends upon the amount ofmovement on the fault – generally larger faultmovements mean bigger earthquakes – and howmuch of the fault ruptures – generally longer faultruptures lead to bigger earthquakes. Thus, the 2004Sumatra earthquake was very large (MW=9.3)because a very large displacement of the fault(approx. 15 m) occurred over a very long faultdistance (1,600 km). It is also true that the mostdamaging events, accounting for about threequarters of the global seismic energy release, areshallow-focus earthquakes (<40 km below thesurface). For example, the 1971 San Fernandoearthquake in California had only a moderatemagnitude (MW=6.6) but, because it occurred only13 km below the surface near a highly urbanisedarea, the level of damage was high.
The global distribution of earthquakes is far fromrandom. About two thirds of all large earthquakesare located in the so-called ‘Ring of Fire’ around thePacific ocean which, in turn, is closely related to thegeophysical activity associated with plate tectonics(Bolt, l993). The earth’s crust is divided into morethan 15 major lithospheric plates (Fig. 6.1). Theseplates move across the globe at speeds of up to 180mm yr–1, carried along by convection currents in themantle. Most earthquakes occur at locations inwhich the plates collide (Table 6.2), especially in theso-called subduction zones, where one plate is forcedunder another (Fig. 6.1). Sometimes earthquakesalso occur at weak points within plates. Althoughintra-plate earthquakes account for less than 0.5 percent of global seismicity, they are a significantthreat. For example, during a few months in the
THE EXPER IENCE AND REDUCT ION OF HAZARD106

winter of 1811–12, three large earthquakes deci-mated the town of New Madrid in Missouri, USA.The third of these earthquakes is thought to havebeen the largest seismic event ever to have struckthe contiguous states of the USA, even though thelocation was hundreds of kilometres distant from aplate boundary.
Earthquake magnitude
Earthquakes are measured at the epicentre, the pointon the Earth’s surface directly above the hypocentre.Earthquake magnitude is measured on one of thescales based on the work of Charles Richter. Thesescales describe the total energy released by theearthquake in the form of seismic waves that radiateoutwards from the fault plane. This energy can bedetermined using seismographs that measure theamplitude of the ground motion during theearthquake. The original system, which is often
TECTONIC HAZARDS: EARTHQUAKES 107
Table 6.2 The ten largest earthquakes in the worldsince 1900
Location Date Magnitude (MW)
Chile 1960 9.5Alaska 1964 9.2Sumatra 2004 9.1Kamchatka 1952 9.0Ecuador (off the coast) 1906 8.8Alaska 1965 8.7Sumatra 2005 8.6Assam-Tibet 1950 8.6Andreanof Islands, Alaska 1957 8.6Indonesia, Banda Sea 1938 8.5
Source: After US Geological Survey at http://neic.usgs.gov/neis/eqlists (accessed on 16 February 2008)
Volcanoes
Earthquake zone
Eurasian plate
Africanplate
Indo-Australianplate
Philippineplate
Nazcaplate
Cocosplate
Pacific plate
Fijiplate
Antarctic plate Antarctic plate
Subduction zone
Motion of plate
Spreading ridge offset by transform faults
Collision zone
S. Americanplate
North American plate
Mid-Atlanticridge
San Andreasfault
Caribbean plate
Figure 6.1 World map showing the relationship between the major tectonic plates and the distribution of recentearthquakes and volcanoes. After G. W. Housner and quoted in Bolt (1993).
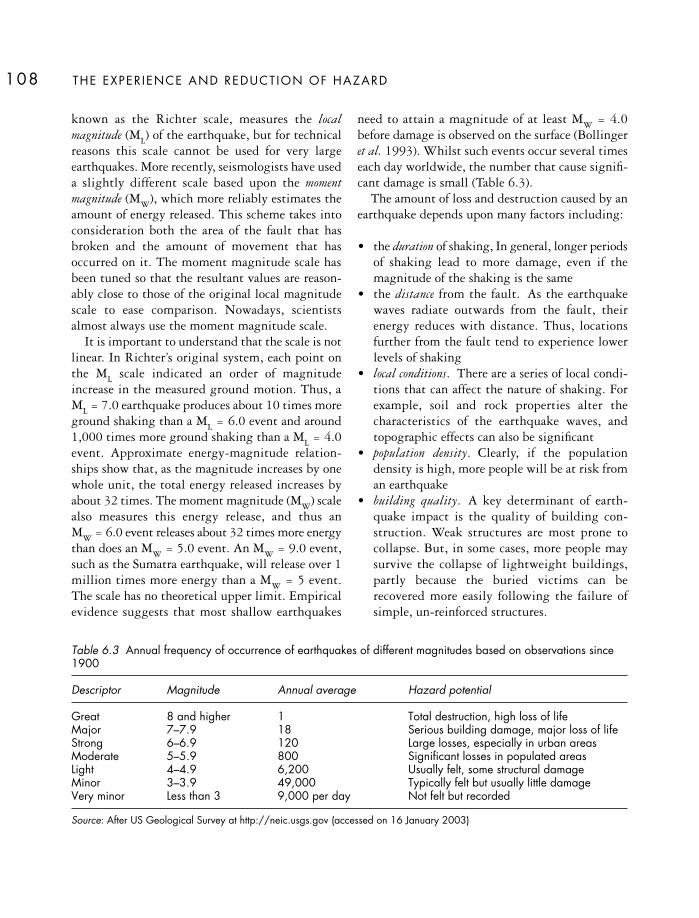
THE EXPER IENCE AND REDUCT ION OF HAZARD108
Table 6.3 Annual frequency of occurrence of earthquakes of different magnitudes based on observations since1900
Descriptor Magnitude Annual average Hazard potential
Great 8 and higher 1 Total destruction, high loss of lifeMajor 7–7.9 18 Serious building damage, major loss of lifeStrong 6–6.9 120 Large losses, especially in urban areasModerate 5–5.9 800 Significant losses in populated areasLight 4–4.9 6,200 Usually felt, some structural damageMinor 3–3.9 49,000 Typically felt but usually little damageVery minor Less than 3 9,000 per day Not felt but recorded
Source: After US Geological Survey at http://neic.usgs.gov (accessed on 16 January 2003)
known as the Richter scale, measures the localmagnitude (ML) of the earthquake, but for technicalreasons this scale cannot be used for very largeearthquakes. More recently, seismologists have useda slightly different scale based upon the momentmagnitude (MW), which more reliably estimates theamount of energy released. This scheme takes intoconsideration both the area of the fault that hasbroken and the amount of movement that hasoccurred on it. The moment magnitude scale hasbeen tuned so that the resultant values are reason-ably close to those of the original local magnitudescale to ease comparison. Nowadays, scientistsalmost always use the moment magnitude scale.
It is important to understand that the scale is notlinear. In Richter’s original system, each point onthe ML scale indicated an order of magnitudeincrease in the measured ground motion. Thus, a ML = 7.0 earthquake produces about 10 times moreground shaking than a ML = 6.0 event and around1,000 times more ground shaking than a ML = 4.0event. Approximate energy-magnitude relation-ships show that, as the magnitude increases by onewhole unit, the total energy released increases byabout 32 times. The moment magnitude (MW) scalealso measures this energy release, and thus an MW = 6.0 event releases about 32 times more energythan does an MW = 5.0 event. An MW = 9.0 event,such as the Sumatra earthquake, will release over 1million times more energy than a MW = 5 event.The scale has no theoretical upper limit. Empiricalevidence suggests that most shallow earthquakes
need to attain a magnitude of at least MW = 4.0before damage is observed on the surface (Bollingeret al. 1993). Whilst such events occur several timeseach day worldwide, the number that cause signifi-cant damage is small (Table 6.3).
The amount of loss and destruction caused by anearthquake depends upon many factors including:
• the duration of shaking, In general, longer periodsof shaking lead to more damage, even if themagnitude of the shaking is the same
• the distance from the fault. As the earthquakewaves radiate outwards from the fault, theirenergy reduces with distance. Thus, locationsfurther from the fault tend to experience lowerlevels of shaking
• local conditions. There are a series of local condi-tions that can affect the nature of shaking. Forexample, soil and rock properties alter thecharacteristics of the earthquake waves, andtopographic effects can also be significant
• population density. Clearly, if the populationdensity is high, more people will be at risk froman earthquake
• building quality. A key determinant of earth-quake impact is the quality of building con-struction. Weak structures are most prone tocollapse. But, in some cases, more people maysurvive the collapse of lightweight buildings,partly because the buried victims can berecovered more easily following the failure ofsimple, un-reinforced structures.

These complexities are not captured by the momentmagnitude concept which is a poor guide to theimpact of an earthquake. For example, the Kobe,Japan, earthquake was a moderate (MW = 6.8) event.The huge impact occurred because the shockaffected a densely populated industrial port wherebuildings near the shoreline were founded on softsoils and landfill (Fig. 6.2). Most of the woodenhousing had been built to withstand tropicalcyclones rather than earthquakes. The heavy clay-tile roofs, typically weighing two tonnes, collapsedand many fires were readily started in the woodstructures. Consequently over 90 per cent of the6,400 fatalities occurred in areas of suburbanhousing.
Earthquake intensity
Earthquake intensity is a measure of the level ofground shaking that correlates more directly withhazard impact than does magnitude. It is estimatedon the Modified Mercalli (MM) scale which allocatesa numerical value to observations of the temblor andthe extent of physical damage (see Box 6.1). Thescale ranges from MM = I (not felt at all) to MM =XII (widespread destruction). At first glance theMM scale appears to be less ‘scientific’ than themagnitude scales because it relies upon qualitativedescriptions rather than empirical measurements.However, it does capture the practical elements ofearthquake impact outlined above. Another advant-age is that, based on historical accounts, MM inten-sities can be assigned to earthquakes that occurredprior to the introduction of direct measurements.
TECTONIC HAZARDS: EARTHQUAKES 109
P A C I F I C O C E A N
Port Island
Rokko Island
Areas where more than 80%of buildings collapsed or wereseverely damaged
Areas where fires spreadLiquefaction areas
R O K K OM O U N T A I N S
Figure 6.2 Map showing the distribution of damage following the 1995 Kobe earthquake. Fires spread in the moredensely built-up areas of the city and liquefaction was widespread in the reclaimed industrial land along theshoreline. After Menoni (2001).
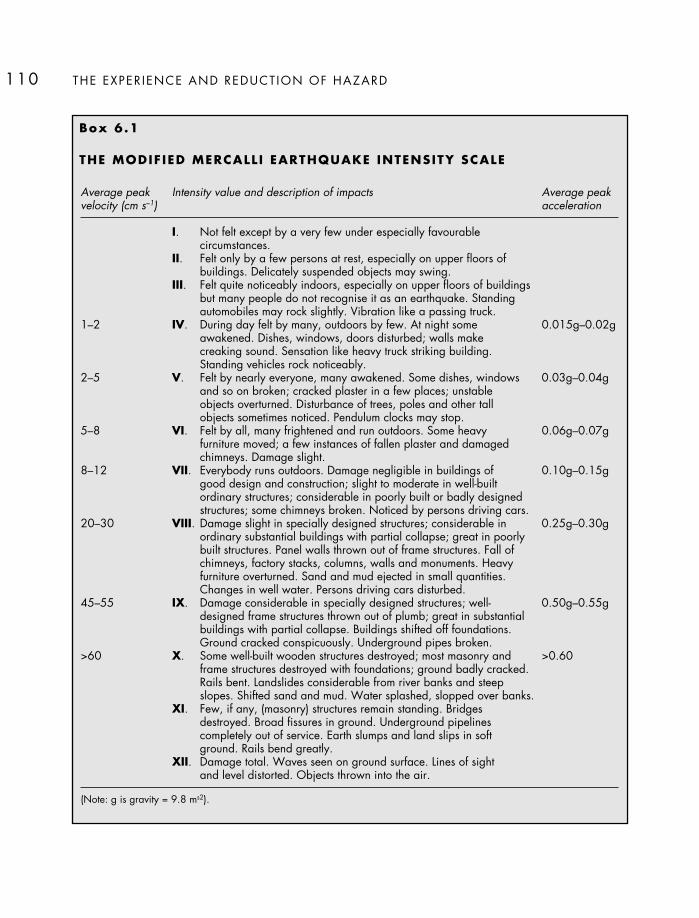
THE EXPER IENCE AND REDUCT ION OF HAZARD110
Average peak Intensity value and description of impacts Average peak velocity (cm s–1) acceleration
I. Not felt except by a very few under especially favourable circumstances.
II. Felt only by a few persons at rest, especially on upper floors of buildings. Delicately suspended objects may swing.
III. Felt quite noticeably indoors, especially on upper floors of buildings but many people do not recognise it as an earthquake. Standing automobiles may rock slightly. Vibration like a passing truck.
1–2 IV. During day felt by many, outdoors by few. At night some 0.015g–0.02gawakened. Dishes, windows, doors disturbed; walls make creaking sound. Sensation like heavy truck striking building. Standing vehicles rock noticeably.
2–5 V. Felt by nearly everyone, many awakened. Some dishes, windows 0.03g–0.04gand so on broken; cracked plaster in a few places; unstable objects overturned. Disturbance of trees, poles and other tall objects sometimes noticed. Pendulum clocks may stop.
5–8 VI. Felt by all, many frightened and run outdoors. Some heavy 0.06g–0.07gfurniture moved; a few instances of fallen plaster and damaged chimneys. Damage slight.
8–12 VII. Everybody runs outdoors. Damage negligible in buildings of 0.10g–0.15ggood design and construction; slight to moderate in well-built ordinary structures; considerable in poorly built or badly designed structures; some chimneys broken. Noticed by persons driving cars.
20–30 VIII. Damage slight in specially designed structures; considerable in 0.25g–0.30gordinary substantial buildings with partial collapse; great in poorly built structures. Panel walls thrown out of frame structures. Fall of chimneys, factory stacks, columns, walls and monuments. Heavy furniture overturned. Sand and mud ejected in small quantities. Changes in well water. Persons driving cars disturbed.
45–55 IX. Damage considerable in specially designed structures; well- 0.50g–0.55gdesigned frame structures thrown out of plumb; great in substantial buildings with partial collapse. Buildings shifted off foundations. Ground cracked conspicuously. Underground pipes broken.
>60 X. Some well-built wooden structures destroyed; most masonry and >0.60frame structures destroyed with foundations; ground badly cracked.Rails bent. Landslides considerable from river banks and steep slopes. Shifted sand and mud. Water splashed, slopped over banks.
XI. Few, if any, (masonry) structures remain standing. Bridges destroyed. Broad fissures in ground. Underground pipelines completely out of service. Earth slumps and land slips in soft ground. Rails bend greatly.
XII. Damage total. Waves seen on ground surface. Lines of sight and level distorted. Objects thrown into the air.
(Note: g is gravity = 9.8 ms2).
Box 6.1
THE MODIF IED MERCALL I EARTHQUAKE INTENSITY SCALE
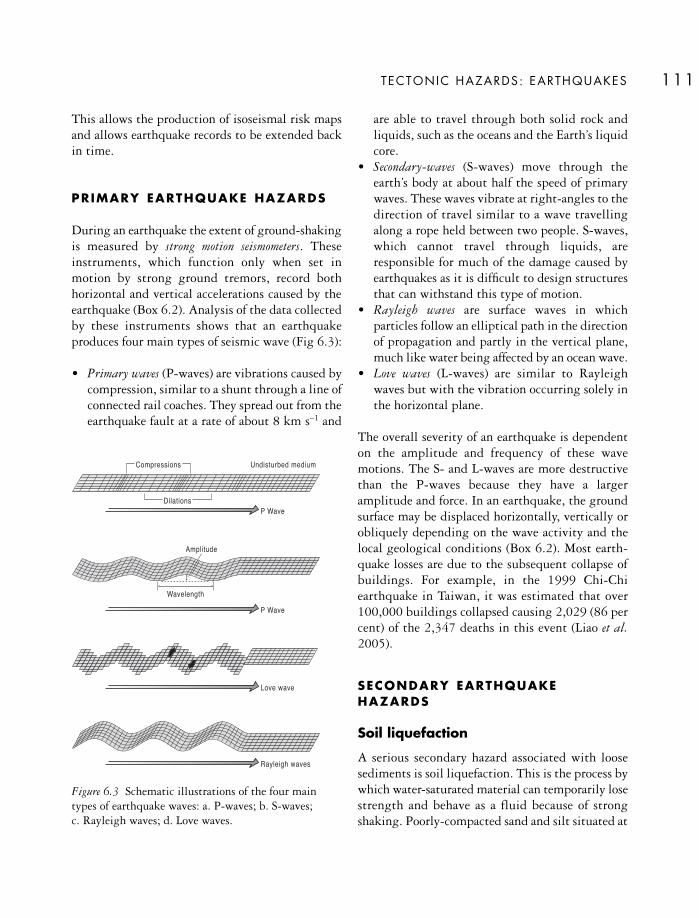
TECTONIC HAZARDS: EARTHQUAKES 111
This allows the production of isoseismal risk mapsand allows earthquake records to be extended backin time.
PRIMARY EARTHQUAKE HAZARDS
During an earthquake the extent of ground-shakingis measured by strong motion seismometers. Theseinstruments, which function only when set inmotion by strong ground tremors, record bothhorizontal and vertical accelerations caused by theearthquake (Box 6.2). Analysis of the data collectedby these instruments shows that an earthquakeproduces four main types of seismic wave (Fig 6.3):
• Primary waves (P-waves) are vibrations caused bycompression, similar to a shunt through a line ofconnected rail coaches. They spread out from theearthquake fault at a rate of about 8 km s–1 and
are able to travel through both solid rock andliquids, such as the oceans and the Earth’s liquidcore.
• Secondary-waves (S-waves) move through theearth’s body at about half the speed of primarywaves. These waves vibrate at right-angles to thedirection of travel similar to a wave travellingalong a rope held between two people. S-waves,which cannot travel through liquids, areresponsible for much of the damage caused byearthquakes as it is difficult to design structuresthat can withstand this type of motion.
• Rayleigh waves are surface waves in whichparticles follow an elliptical path in the directionof propagation and partly in the vertical plane,much like water being affected by an ocean wave.
• Love waves (L-waves) are similar to Rayleighwaves but with the vibration occurring solely inthe horizontal plane.
The overall severity of an earthquake is dependenton the amplitude and frequency of these wavemotions. The S- and L-waves are more destructivethan the P-waves because they have a largeramplitude and force. In an earthquake, the groundsurface may be displaced horizontally, vertically orobliquely depending on the wave activity and thelocal geological conditions (Box 6.2). Most earth-quake losses are due to the subsequent collapse ofbuildings. For example, in the 1999 Chi-Chiearthquake in Taiwan, it was estimated that over100,000 buildings collapsed causing 2,029 (86 percent) of the 2,347 deaths in this event (Liao et al.2005).
SECONDARY EARTHQUAKE HAZARDS
Soil liquefaction
A serious secondary hazard associated with loosesediments is soil liquefaction. This is the process bywhich water-saturated material can temporarily losestrength and behave as a fluid because of strongshaking. Poorly-compacted sand and silt situated at
Compressions
Dilations
Amplitude
Wavelength
P Wave
P Wave
Undisturbed medium
Love wave
Rayleigh waves
Figure 6.3 Schematic illustrations of the four maintypes of earthquake waves: a. P-waves; b. S-waves; c. Rayleigh waves; d. Love waves.

depths less than 10 m below the surface is theprincipal medium. In the 2001 Bhuj earthquake,many reservoir dams were damaged by soil liquefac-tion in the water-saturated alluvial foundations(Krinitzsky and Hynes, 2002). According to Tinsley
et al. (1985), four types of ground failure commonlyresult:
• Lateral spread involves the horizontal displace-ment of surface blocks as a result of liquefaction
THE EXPER IENCE AND REDUCT ION OF HAZARD112
Information on ground motion is necessary tounderstand the behaviour of buildings inearthquakes. Ground acceleration is usuallyexpressed as fractions of the acceleration due togravity (9.8 m s–2). Thus, 1.0g represents anacceleration of 9.8 m s–2, whilst 0.1 g=0.98 m s–2.If an unsecured object experienced an accelerationof 1.0g in the vertical plane it would in effectbecome weightless, and thus could leave theground. Values as large as 0.8 g have been recordedin firm ground from earthquakes with magnitudesas small as MW=4.5, whilst the 1994 Northridgeearthquake had localised peak ground motions ofnearly 2.0 g. Even very strong structures struggleto deal with such high vertical accelerations.However the greatest damage is often generatedby the Love waves, which cause horizontalshaking. Some unreinforced masonry buildings(URMs) may be unable to cope with horizontalaccelerations as small as 0.1 g.
Local site conditions influence ground motion.Significant wave amplifications occur in steeptopography, especially on ridge crests. Groundmotions in soil are enhanced in both amplitudeand duration, compared to those recorded in rock.As a result, structural damage is usually mostsevere for buildings founded on unconsolidatedmaterial. In the Michoacan earthquake of 1985 therecorded peak ground accelerations in Mexico Cityvaried by a factor of 5. Strong-motion recordsobtained on firm soil showed values of around0.04g. This compared with observations fromurban areas located on a dried lakebed where peakground accelerations reached 0.2g. Similar effects
were noted in the San Salvador earthquake of1986. This had a very modest size (MW=5.4) butdestroyed thousands of buildings as well ascausing 1,500 deaths. The reason was rooted inlayers of volcanic ash, up to 25 m thick, whichunderlie much of the city. As the three-secondlong earthquake tremor passed upwards throughthe ash, the amplitude of ground movement wasmagnified up to five times.
The scale of destruction also depends on thefrequency of the vibrations and the fundamentalperiod of the structures at risk. The frequency ofa wave is the number of vibrations (cycles) persecond measured in units called Hertz (Hz). Highfrequency waves tend to have high accelerationsbut relatively small amplitudes of displacement.Low frequency waves have small accelerations butlarge velocities and displacements. During earth-quakes, the ground may vibrate at all frequenciesfrom 0.1 to 30 Hz. If the natural period of abuilding’s vibration is close to that of seismicwaves, resonance can occur, which causes thebuilding to sway. Low-rise buildings have shortnatural wave periods (0.05–0.1 seconds) and high-rise buildings have long natural periods (1–2seconds). The P- and S-waves are mainly respon-sible for the high frequency vibrations (>1 Hz)that are most effective in shaking low buildings.Rayleigh and Love waves are lower frequency andmore effective in causing tall buildings to vibrate.The very lowest frequency waves may have lessthan one cycle per hour and have wavelengths of1,000 km or more.
Box 6.2
GROUND-SHAKING IN EARTHQUAKES

in a subsurface layer. Such spreads occur mostcommonly on slopes between 0.3 and 3o. Theycause damage to pipelines, bridge piers and otherstructures with shallow foundations, especiallythose located near river channels or canal bankson floodplains.
• Ground oscillation occurs if liquefaction occurs atdepth but the slopes are too gentle to permitlateral displacement. Oscillation is similar tolateral spread but the disrupted blocks come torest near their original position, while lateralspread blocks can move significant distances.Oscillation is often accompanied by the openingand closing of fissures – for example, in the 1964Alaskan earthquake, cracks up to 1 m wide and10 m deep were observed.
• Loss of bearing strength usually occurs when ashallow layer of soil liquefies under a building.Large deformations can result within the soilmass causing structures to settle and tip. In the Niigata, Japan, earthquake of 1964, fourapartment buildings tilted as much as 60° inunconsolidated alluvial ground. This loss ofbearing strength was a key reason for the highdeath toll in the 1985 Mexico City earthquake,in which about 9,000 people died, even thoughthe city was nearly 400 km from the faultrupture. Such failures also cause substantialdamage to port facilities which are built onreclaimed land by dredging sand and silt.Although few deaths occur as a result of thisprocess, both the short-term impact on thedelivery of aid and the longer-term economiceffects due to disruptions of trade can besubstantial.
• Flow failure is associated with the mostcatastrophic liquefaction. This type of slopefailure occurs when liquefaction occurs at thesurface as well as at depth. Flow failures can bevery large and rapid, displacing material by tensof kilometres at velocities of tens – or evenhundreds – of kilometres an hour. Such failurescan happen on land or under water. The devasta-tion of Seward and Valdez, Alaska, in 1964 waslargely caused by a submarine flow failure at the
marine end of the delta. This carried away theharbour area and created water waves whichswept back into the town causing furtherdamage.
Landslides, rock and snow avalanches
Severe ground shaking can cause natural slopes toweaken and fail. The resulting landslides, rock andsnow avalanches are major contributors to earth-quake disasters, largely because many destructiveearthquakes occur within mountainous areas. Forexample, more than half of all deaths recorded afterlarge magnitude (MW>6.9) earthquakes in Japan are attributed to landslides (Kobayashi, 1981).Correlations between magnitude and landslidedistribution show that landslides are unlikely to betriggered by earthquakes less than M=4.0 but thatthe maximum area likely to be affected by landslidesin a seismic event increases rapidly thereafter to reach500,000 km2 at M = 9.2 (Keefer, 1984). CentralAmerica is a region where landslides occur frequentlyafter earthquakes (Bommer and Rodríguez, 2002).There is considerable spatial variation in risk due todifferences in topography, rainfall, soils and land useconditions. Landslides also cause vary majorproblems for the delivery of aid in the aftermath ofearthquakes, especially in mountainous countries(Box 6.3).
The greatest landslide hazard exists when highmagnitude events (MW = 6.0 or greater) create rockavalanches. These are large (at least one million m3)volumes of rock fragments that can travel for tensof kilometres from their source at velocities ofhundreds of kilometres per hour. A particularlynotable mass movement occurred when an offshoreearthquake (MW = 7.7) triggered a massive rock and snow avalanche from the overhanging face of Huascarán mountain, Peru, in 1970 (Plafker and Ericksen, 1978). At an altitude of 6,654 m,Huascarán is the highest peak in the Peruvian Andesand its steep slopes have been the source of manycatastrophic slides. In 1970 the resulting turbulentflow of mud and boulders, estimated at 50–100 ×106 m3, passed down the Shacsha and Santa valleys,
TECTONIC HAZARDS: EARTHQUAKES 113

THE EXPER IENCE AND REDUCT ION OF HAZARD114
The MW=7.6 earthquake that struck on 8 October2005 had a devastating impact on a large area ofPakistani Kashmir (Plate 6.1). According to offi-cial government statistics, the earthquake killedover 73,000 people in Pakistan, of which 19,000were school age children. A further 1,360 persons died in India. It left over 100,000 people withinjuries. Over 780,000 buildings were damagedbeyond repair, the vast majority (97 per cent) of which were houses. As a result, approximately2.8 million people were left homeless.
In the immediate aftermath of the disaster, amassive relief operation was initiated both by the
Government of Pakistan and by internationalagencies, such as the International Committee ofthe Red Cross and the World Food Program.However, the provision of assistance was hugelyhindered by two key factors:
• the level of preparedness for the earthquake bothwithin Pakistan, and in Kashmir in particular,was very low. This meant that very little plan-ning had been undertaken as to how the logisticsof the operation would be undertaken;
• the Kashmir area is highly mountainous withlimited communication routes.
Box 6.3
PROBLEMS OF AID DEL IVERY IN THE AFTERMATH OF A MAJOREARTHQUAKE
Plate 6.1 Widespread earthquake damage in Balakot, North West Frontier Province, Pakistan. The town wasnear the epicentre of the 7.6 magnitude earthquake that struck on 8 October, 2005, and killed over 70,000people. (Photo: Chris Stowers, PANOS)

in a wave 30 m high travelling at an average speedof 70–100 m s–1 in the upper 9 km of its course (Fig.6.4). The wave buried the towns of Yungay andRanrahirca, plus several villages, under debris 10 mdeep and about 18,000 people were killed in lessthan four minutes after the original slope failurehigh on the mountain.
Tsunamis
The most distinctive secondary earthquake-relatedhazard is the seismic sea wave or tsunami. The word‘tsunami’ comes from two Japanese words, tsu (portor harbour) and nami (wave or sea), an appropriatederivation since these waves inundate low-lyingcoastal areas. Most tsunamis result from tectonic
displacement of the sea-bed by large, shallow-focusearthquakes. They can also be caused by the collapseof volcanic islands (e.g. Krakatoa in 1883), largerockfalls into confined bays and meteorite impacts(see Chapter 14). In the period 1995–2007, 15tsunamis causing fatalities were recorded world-wide, mostly in the Pacific region (Table 6.4). Oneexample was the event on the north-west coast of Papua New Guinea. Following an earthquake(MW = 7.1) a tsunami, with maximum wave heightsof 15 m, overwhelmed a sand bar where severalsmall villages were built some 1–3 m above sealevel. All wooden buildings within 500 m of theshore were swept away, resulting in almost 2,200fatalities, and the survivors were required to relocateinland (González, 1999).
TECTONIC HAZARDS: EARTHQUAKES 115
The latter factor caused many problems. One ofthe main areas affected by the earthquake was thevalley of the river Neelum. This area can beaccessed by a single road only which crosses thefault in a zone with a steep river gorge (Plate 6.1).Landslides due to the earthquake blocked this roadover a 20 km stretch and, in the after-shocks,landslides continued to occur on an hourly basis.Additionally, many of the most seriously damagedvillages were located on the high slopes of themountains, accessed only by small roads traversingvery steep hillsides. In almost all cases, these roadswere destroyed (Peiris et al., 2006).
Thus, the provision of assistance was extremelydifficult. Even an assessment of the needs of thepopulation was problematic as the evaluationteams could not travel through the earthquakeaffected areas without the use of helicopters, which were in short supply. Although the govern-ment mobilised 12 brigades of the engineer corps of the Pakistan Army, most of the majorhighways required a month to be reopened and thekey Neelum Valley road took six weeks. Some of the minor roads remained closed three yearslater, and nearly all are still damaged regularly bylandslides.
The problems presented to the authoritiesincluded restrictions on the supply of emergencymedical care, food and shelters. The latter prob-lem was of great concern as the winter in Kashmiris very cold. As a result, two unusual measureswere taken in Kashmir. First, there was a hugeeffort to move people into refugee camps close tothe main roads in the valley floors. In most casesthis meant moving people away from their homevillages. This is not generally desirable as itincreases the trauma of the event and limits therebuilding process but, given the limitations of the transport system and the intense cold in themountains, this was the only realistic solution.Second, there was a massive reliance on the use of helicopters to deliver assistance. Helicopterswere deployed from around the world – forexample, the UK sent three RAF heavy-liftChinook helicopters and the United States sent afurther 12 to assist the large numbers used by thePakistan Air Force. Additional assistance camefrom civilian agencies; the World Food Programalone deployed 14 helicopters. Fortunately, thisresponse, plus the unexpectedly benign winterconditions, was sufficient to allow the survival of most of the earthquake-affected population.

Tsunamis have claimed the lives of over 50,000coastal residents around the Pacific Ocean duringthe past 100 years, and until 2004, this was con-sidered to be the region most at risk. In easternHonshu (Japan), for example, a tsunami wave 10 m
high has a return period of about a decade. The 1933tsunami that hit the Sanriku coast, which wascaused by a submarine earthquake (MW=8.5) withan estimated return period of 70 years, produced awave up to 24 m above mean sea level (Horikawaand Shuto, 1983). The death toll was 3,008, with1,152 injured, together with 4,917 houses washedaway and 2,346 otherwise destroyed. Only about 10per cent of Japanese tsunamis now cause death ordamage because of hazard mitigation policies but330 people died in 1993 when tsunami run-upheights reached 15–30 m following an earthquakewest of the island of Hokkaido.
The 2004 Sumatra tsunami killed about 250,000people around the Indian Ocean and clearlydemonstrated the devastating impact of this hazard.The cause was an earthquake resulting from move-ment on the subduction zone fault to the west ofSumatra. The accumulation of stress prior to theearthquake had caused the earth’s crust to deformdownwards. When the fault ruptured, this crustrebounded upwards, probably by about 5 m. Thislifted a huge volume of water which then flowedoutwards to equilibrate sea level and thus generatedthe tsunami. The wave crossed the ocean veryquickly, arriving at the Indian and Sri Lankan coastsjust 90 minutes after the earthquake, and reachedthe coast of Somalia after about seven hours. Highvelocity travel occurs because tsunamis behave asshallow water waves due to their exceptionally long(l00–200 km) wave-lengths. The forward speed ofa shallow wave depends upon the water depthaccording to the following function:
Velocity=√gD
Where: g = gravitational constant (9.81) D = depth of the ocean
so, if the depth of the Indian Ocean averages 3900 m,
Velocity = √ 9.81 × 3900=196 m s–1=704 km per hour.
The actual recorded velocity of the 2004 wave wasabout 640 km h1, probably reflecting the slowingdown of the wave as it approached coastal regions.As it crossed the ocean the wave was only about 60 cm in height and posed no hazard. But, as it
THE EXPER IENCE AND REDUCT ION OF HAZARD116
2538
2470
27552789
2800280028002940
30953095
31333133
33243324
3095
3133
3324
3907
4562
5384
6654
4183
YungayYungayYungay
Matacoto
Ranrahirca
HUASCARÁN
Rio Santa
RRiioo
SShhaaccsshhaa
Rio
Shacsha
0 2km
1962 Avalanche
1970 Avalanche
Heights in metres
G L A C I E R
Figure 6.4 Map illustrating the Mt Huascarán rockavalanche disasters in the Peruvian Andes during 1962and 1970. The map shows the greater extent of thedebris deposited in the 1970 event. After Whittow(1980).

approached the shore, the wave slowed down andstarted to increase in height (Fig. 6.5) so that onBanda Aceh, for example, the wave reached amaximum height of over 30 m.
Once an earthquake has been detected, and itsepicentre located, it is possible to predict with someaccuracy the arrival time of a tsunami on a distantshoreline. In some cases the arrival of the wave ispreceded by a retreat of the sea, leaving exposedlarge areas of the seashore. In the case of the IndianOcean tsunami, some people recognised this as anindication of danger, and managed to escape.However it appears that many hundreds of otherpeople were attracted to view the strange pheno-menon and were then exposed to the full force of thewave.
MITIGATION
Disaster aid
Earthquake disasters readily attract emergencyfunds because of the sudden, dramatic loss of lifetogether with the high visual impact of televisionimagery. For example, in the aftermath of the 2004
Sumatra earthquake over US$7 billion was pledgedfor relief efforts by foreign governments. In addi-tion, huge sums were pledged by individuals; in theUK alone about US$600 million was donated. Onthe other hand, great problems were associated withthe effective distribution of this aid and some fundspledged by governments did not materialise.
After earthquakes, the initial ‘golden hours’ arecrucial for the location and rescue of victims trappedin fallen buildings. Unfortunately, and perhapssurprisingly, there is very little empirical data onhow many people are rescued from collapsedbuildings in the aftermath of earthquakes. Noji et al. (1993) observed that after the 1988 Armenianearthquake 67 per cent of rescues occurred in thefirst six hours. Only 2.5 per cent of these werecompleted by specialist Soviet rescue teams flown infrom outside the region and less than 1 per cent byoverseas teams. Similarly, Kobe was ill-prepared forthe 1995 disaster and the search and rescue activitywas hampered by several factors, including a legalruling that kept rescue dogs sent from overseas inquarantine until the fourth day after the earthquake(Comfort, 1996). Table 6.5 illustrates the reductionin people recovered from buildings over the first five
TECTONIC HAZARDS: EARTHQUAKES 117
Table 6.4 Worldwide recorded fatalities from tsunamis 1995–2007
Date Magnitude Location Number of deaths
14 May 1995 6.9 Indonesia 119 October 1995 8 Mexico 11 January 1996 7.9 Indonesia 917 February 1996 8.2 Indonesia 11021 February 1996 7.5 Peru 1217 July 1997 7 Papua New Guinea 2,18317 October 1998 7.6 Turkey 15026 November 1999 7.5 Vanuatu 523 June 2001 8.4 Peru 2626 December 2004 9 Indonesia 250,00028 March 2005 8.7 Indonesia 1014 March 2006 6.7 Indonesia 417 July 2006 7.7 Indonesia 6641 April 2007 8.1 Solomon Islands 5221 April 2007 6.2 Chile 3
Source: Data from the National Geophysical Data Centre Tsunami event database: http://www.ngdc.noaa.gov/seg/hazard/tsu.shtml accessed 16th February 2008

days and the decline in the survival rate. In thesecircumstances, local self-help is vital. After theMichoacan (Mexico City) earthquake of 1985, theofficial rescue service was so limited that residentsin the most badly damaged area set up their ownarrangements (Comfort, 1986).
Longer-term assistance is also required. The 1988Armenian earthquake killed at least 25,000 people,made 514,000 homeless and resulted in the evacua-tion of nearly 200,000 persons. Following the Soviet government’s decision to accept internationalaid, over 67 nations offered cash and servicesamounting to over US$200 million. A programmewas announced to rebuild the cities within a two-year period on sites in safer areas and with buildingheights restricted to four storeys. But during thefirst year only two of the 400 buildings due for construction in Leninakan were completed andmany people were still living as evacuees manymonths after the disaster. Continuing aid is alsorequired for less tangible purposes, such as thetreatment of post-traumatic stress (Karanci andRüstemli, 1995).
Insurance
Worldwide, the vast majority of the exposed riskfrom earthquakes is presently uninsured. A catas-trophic earthquake is one of the greatest naturalhazards faced by the USA where an estimated 70million people are exposed to severe risk, with anadditional 120 million at moderate risk. There is a
THE EXPER IENCE AND REDUCT ION OF HAZARD118
Table 6.5 The number of people who survived afterbeing rescued from collapsed buildings, by day ofrescue, following the Kobe earthquake on 17 January1995
Date Jan Jan Jan Jan Jan 17 18 19 20 21
Total rescued 604 452 408 238 121
Total who lived 486 129 89 14 7
Per cent rescued who survived 80.5 28.5 21.8 5.9 5.8
Source: Comfort (1996)
Fasterdistanttsunami
Smallwave
Deepocean
Largeamplitude
wave
Slowerlocal
tsunami
Drawdownwarning
Run-uphazardzone
Earthquake
Normal high tide levelTsunami
A
B
C
D
Figure 6.5 The evolution of a typical tsunami wave. (A) earthquake initiation; (B) wave split; (C) near-shore-wave amplification; (D) coastal run-up zone.Adapted from US Geological Survey (Western Coastaland Marine Geology) at www.walrus.wr.usgs.gov/tsunami (accessed 7 June 2003). Note that the verticalscale is greatly exaggerated in the diagram.
TECTONIC HAZARDS: EARTHQUAKES 119
potential for losses exceeding US$100 billion(Lecomte, 1989). Few private companies have thecapacity to cope with this level of risk and somecountries have responded by setting up nationalearthquake insurance schemes under governmentcontrol. Residential insurers pay a levy to the fund that then provides the householder with aguaranteed pay-out if their property is damaged inan earthquake. Typically, part of this central fund is invested to provide capital to cover claims andpart is used to purchase reinsurance. Any remain-ing shortfall is underwritten by the government. To be eligible under such a scheme, a householdermust have residential insurance and the take-up isoften low. For example, the Taiwan ResidentialEarthquake Insurance Fund was established by the government in 2002 in response to the 1999Chi-Chi earthquake, when less than 2 per cent ofhouseholds had earthquake insurance. By 2007, thescheme covered only 25 per cent of households andit was estimated that the maximum take-up, whenthe scheme is fully mature, would still be less than50 per cent.
Commercial insurers limit their liability byspreading the risk across the different hazard zonesand through reinsurance. But, given the limitedpremiums that many property owners appear will-ing to pay and the rising costs of earthquake-relateddamage, some observers believe that partnershipsbetween private and government interests is the way forward. Such schemes might well include amandatory tax on occupiers of very high-riskproperties but not all potentially active faults areknown and the insurance industry is rightlysuspicious of the degree of compliance with localbuilding codes in many areas.
Commercial and industrial property is not ofteninsured under government schemes and cover has tobe arranged through specialised private insurancecompanies. On the whole, large businesses have amuch higher take-up rate for earthquake insurancethan householders. A key component of commercialinsurance is the cover for the interruption ofbusiness that occurs when either the property itselfor the infrastructure that supports it – such as local
roads or the electricity supply – is damaged. Oftenthese indirect costs are greater than the directphysical losses to the premises.
PROTECT ION
Environmental control
There is little immediate prospect of suppressing orpreventing earthquakes at source. Thus, mitigationof the hazard must focus on vulnerability andsecondary hazards.
Hazard-resistant design
Most earthquake losses are due to the collapse ofbuildings. According to Key (1995), about 60 percent of all deaths are due to the failure of unre-inforced masonry structures (URMs) in rural areas.The most vulnerable buildings are constructed fromadobe or sunbaked clay bricks. For example, theMW=6.5 Bam earthquake caused the almost com-plete collapse of the adobe buildings from which thetown was constructed, causing over 26,000 deaths(see also Chapter 3). Adobe construction is commonin arid and semi-arid regions because it is cheap,easily worked and readily available. In Peru, anestimated two-thirds of rural dwellers live in adobehouses. Houses built of rubble masonry are alsovulnerable. In the Maharashtra earthquake of 1993it was the pucca houses – with thick granite walls androofs of heavy timber construction – where mostdeaths occurred rather than the thatched huts and buildings with reinforced concrete frames. By comparison, some traditional societies haveemployed ‘weak’ structures as a defence againstearthquakes. In much of tropical Asia the indigenoushouse is lightly built with plant matting walls andpalm-frond roofs (Leimena, 1980). Thus, in theMW=8.7 Nias earthquake in Indonesia in 2005,1,300 people were killed in building collapses butthe traditional wood framed longhouses survivedmostly undamaged. For this reason, many countriesfavour houses of wood-frame construction; such

THE EXPER IENCE AND REDUCT ION OF HAZARD120
buildings account for about 80 per cent of alldwellings in the USA. This building type tends toflex, rather than collapse, when subjected to groundshaking, but it has a high fire risk.
The earthquake risk is greatest in the world’slarge cities. Here there are many URMs, as in LosAngeles, California, where buildings erected beforethe 1933 building code can be identified ashazardous simply by date. These buildings havebeen supplemented by high-rise, reinforced concretestructures – such as apartment blocks – built toaccommodate the growing population. This meansthat most urban areas present a complex array ofrisk. Figure 6.6, based on the effects of the Kobeearthquake, shows the varied relationships betweenearthquake intensity and building damage fordifferent types of structures and also emphasises howthe threat of collapse rises with an ageing stock ofbuildings. In the urban areas of the LDCs thisproblem is particularly serious. For example, inKathmandu, Nepal, which was devastated by anearthquake in 1934, 70 per cent of buildings arepoorly designed and even reinforced concretestructures would perform badly in an earthquake. Afurther 40 per cent of structures are constructedfrom unreinforced masonry, which is also highlyvulnerable to collapse. Unsurprisingly, Kathmandu
is now considered to be a city at very high risk froma large earthquake.
The most important tool for achieving safebuildings in seismically-active areas is the appli-cation of a building code. Seismic building codes havebeen adopted in over 100 countries and stipulate theminimum construction standards for the buildingin order to minimise the risk of collapse. A goodseismic code starts by requiring an assessment of thesuitability of a site for construction, undertaken bya qualified geotechnical engineer. Other thingsbeing equal, buildings on solid rock are less likelyto suffer damage than those built on clays or softerfoundations. The assessment should include investi-gations to ensure that buildings are not located overfaults (see Figure 6.7) and an evaluation of thestrength of the foundation material. The design ofthe building and its foundations should ensure thatthe structure is sufficiently strong to withstand themaximum probable earthquake. Typically, the codewill mandate inspection to ensure compliance (Box 6.4).
The use of building codes can improve seismicsafety but great efforts are needed to maximisecompliance and to avoid problems associated withcorruption. Another problem is that, in most coun-tries, the vast majority of building stock pre-dates
6 7 8 9 10
Generally totalcollapse
No damage
Extensive cracking,storey collapses
common
Many buildingsshowing signs
of damage
Occasionalexamples
of damage
Most buildingsshowing extensive
cracking,occasional storey
collapse
Traditional h ouses
Small traditional co
mmercial
Older engineered b uildings
Modern
engineered b uildings
Modern h ouses
Intensity (mm)
Figure 6.6 The relationshipbetween earthquake intensity(Mercalli scale) and extent ofdamage for different types ofbuilding construction based on theeffects of the 1995 Kobeearthquake. After AlexanderHowden Group Ltd and Institutionof Civil Engineers (1995).

TECTONIC HAZARDS: EARTHQUAKES 121
The key to earthquake-resistance lies in theappropriate choice of modern building design andconstruction methods. In this context, strong,flexible and ductile materials are preferred to thosethat are weak, stiff and brittle. For example, steelframing is a ductile material that absorbs a lot ofenergy when it deforms. Indeed, the spread ofwell-designed, steel reinforced concrete buildingshas been the primary factor in increasing earth-quake safety for many decades. Glass, on the otherhand, is a very brittle material that shatters easily.In practice, both types of material have to beincorporated into structures. Some otherwise well-designed structures collapse because of the failureof a single element which lacks sufficient strengthor ductility. For example, buildings with flexibleframes will often fail if the frames are in-filled withstiff masonry brickwork.
The shape of a building will influence itsseismic resistance. A stiff single storey structure(Fig. 6.7a) will have a quick response to lateralforces while tall slender multi-storey buildings(Fig. 6.7b) respond slowly, dissipating the energyas the waves move upward to give amplifiedshaking at the top. If the buildings are too closetogether, pounding induced by resonance mayoccur between adjacent structures and add to thedestruction. The stepped profile of the verticalmass of the building in Figure 6.7c offers stabilityagainst lateral forces. Most buildings are notsymmetrical and form more complex masses(Figures 6.7d and e). These asymmetrical struc-tures will experience twisting, as well as the to andfro motion. Unless the elements are well joinedtogether, such differential movements may pullthem apart. High-rise structures will be vulner-able if they do not have uniform strength andstiffness throughout their height. The presence ofa soft storey, which is a discontinuity introducedinto the design for architectural or functional
requirements, may be the weak element thatbrings down the whole structure. Fig 6.7f showsa soft ground-floor storey, perhaps introduced toease pedestrian traffic or car parking.
The weakest links in most buildings are theconnections between the various structuralelements, such as walls and roofs. Connections are important in the case of pre-cast concretebuildings where failure often results from thetearing out of steel reinforcing bars or the break-ing of connecting welds. In the 1994 Northridgeearthquake a number of multi-storey car parksfailed when vertical concrete columns werecracked by lateral ground shaking to the pointwhere they became unable to support the hori-zontal concrete beams holding up the differentfloors. Exterior panels and parapets also needanchoring firmly to the main structure in order toresist collapse. Architectural style can contributeto disaster if features like chimneys, parapets,balconies and decorative stonework are inade-quately secured.
Difficult construction sites (Fig 6.7g and h)include localities near to geological faults and softsoils that amplify ground shaking. As far aspossible these should be avoided or built up at lowdensities so that, for example, buildings cannotcollide as a result of downward movement onslopes. Some slopes may have to be reformed bycut and fill to limit the threat from earthquake-related landslides (Fig. 6.7i). Methods of buildingreinforcement include the cross bracing of weakcomponents, placing the whole structure in a steelframe and the installation of special deepfoundations on soft soils (Fig. 6.7j–l). Adequatefootings are important. High-rise buildings onsoft soils should have foundations supported onpiles driven well into the ground. Wood-framedhouses should be internally braced with plywoodwalls tied to anchor bolts linked into foundations
Box 6.4
EARTHQUAKE SAFETY AND BUILDINGS

THE EXPER IENCE AND REDUCT ION OF HAZARD122
Faul
t
Original slope
CutFill
Single storey
a b c
d e f
g h i
j k l
Simple profiles
Complex masses
Difficult sites
Reinforcement
Multi storey Stepped profile
Varied height Angled wings Soft storey
Bracing soft storey Steel framed building Deep foundation
Soft soil
Pounding betweenadjacent buildings
Figure 6.7 The effectsof ground shaking onbuildings and someconstruction methodsadopted for seismicresistance. (a–c) simplebuilding profiles; (d–f) complex buildingmasses; (g–i) copingwith difficult sites;(j–l) methods ofbuildingreinforcement.

TECTONIC HAZARDS: EARTHQUAKES 123
the building code. Retrofitting old buildings to meetthe standards set in the building code is often expen-sive and, consequently, is difficult to implement.California alone has about 50,000 unreinforcedmasonry buildings constructed before 1933 and now deemed to be unsafe in an earthquake. TheUnreinforced Masonry Building law passed by thestate legislature in 1986 required all cities andcounties in areas of high seismic hazard, whichincludes most of the metropolitan areas in California,to have identified such buildings by 1 January 1990.This inventory includes information on building use and daily occupancy loads but it is taking a longtime to overcome the legacy of earlier construction.In 2003 only two thirds of all such buildings hadbeen retrofitted to improve their resistance toearthquake shaking (CSSC 2003).
Great importance is attached to the earthquake-resistance of buildings such as hospitals, dams,nuclear power stations and factories with explosiveor toxic substances. Urban lifelines for transport,electric power, water supply and sewerage also needsome priority. Many commercial organisations takespecial precautions, especially when it is impossibleto obtain insurance unless the standards laid downin the building code are met. For example, the IBMmanufacturing plant at San José, California, wassubjected to an early retrofit programme (Haskelland Christiansen, 1985). As a result, it was able toget all but one of its Santa Clara buildings back into full operation the day after the Loma Prietaearthquake in 1989.
To be effective, a building code needs full legalstatus, including facilities for up-dating the criteriaand regular inspection of projects during the con-struction phase. For example, the Uniform Building
Code, which is updated annually in the USA,contains a map of six seismic zones based on groundmotions and recorded damage from previousearthquakes. The higher the apparent risk, the morestringent the building regulations. However, seis-mic codes are often a low priority for enforcement(Burby and May, 1999). In the 1999 Marmaraearthquakes in north-west Turkey, 20,000 peoplewere killed and 50,000 injured despite the fact thatbuilding codes have existed there since the 1940s.Most of the deaths were blamed on non-compliancewith the building codes, in some cases the result offinancial corruption.
Even when properly applied, building codes donot fully overcome vulnerability. Codes may bebased on an incomplete knowledge of structural and foundation performance, especially where theprinciples for one code have been based on thosefrom somewhere else, as is often the case. Decision-makers are not always aware of the risk and oftenfail to see any financial advantage in the greaterinvestment for better earthquake security. At worst,building codes can sometimes lead to new devel-opment in hazardous areas if they create a false senseof security. Despite this, the wider adoption ofimproved design and construction methods is thekey way to increase earthquake safety (Box 6.4).
Engineering approaches are often used to miti-gate the impacts of secondary earthquake hazards.For example, slopes alongside transportation net-works may be designed to withstand the maximumearthquake expected during the lifetime of thestructure. In New Zealand, the design standard forroad bridges is an earthquake with a 450-year returnperiod. Similar criteria are applied to cut slopes andembankments. Specially engineered structures can
1–2 m deep. Some new buildings can be mountedon isolated shock absorbing pads made fromrubber and steel which prevent most of thehorizontal seismic energy being transmitted to thestructural components. The technique is expensivebut provides maximum protection for the loose
contents of buildings, thus making it attractivefor hospitals, laboratories and other publicfacilities. In addition, base-isolated buildings needless structural bracing to withstand lateral forcesso that the reduction in construction materialsoffsets the extra cost of the isolation system.

also offer some protection against tsunamis, asillustrated by the Sanriku coast of Japan. Follow-ing the Sanriku tsunami of 1933, the Japanesegovernment offered subsidies for the re-location ofsome fishing villages to higher ground (Fukuchi andMitsuhashi, 1983). This policy proved ineffectivedue to the limited availability of land for redevelop-ment and the desire of fishermen to remain close tothe shoreline. Thus, a policy of on-shore tsunamiwall construction was adopted, although it wasinsufficiently developed to prevent further tsunamilosses in 1960. After this event, the governmentpassed a special law to subsidise construction costsup to 80 per cent for walls erected to cope with waveheights equivalent to the 1960 event. Since thenengineers have sought to protect against largertsunamis and the highest walls stand up to 16 mabove tidal datum level. Breakwaters have been usedin addition to on-shore walls. Although breakwatersdo not take up land and can provide shelter forshipping, they are expensive and were found tointerfere with tidal circulations and damage thelocal fishing industry. More recently, the trend hasbeen towards the use of more elaborate on-shoretsunami walls designed to protect coastal propertyand communications, although these lead to someaesthetic degradation of natural seascapes. Figure6.8 shows an offshore breakwater, an onshoretsunami wall and coastal redevelopment used as acomprehensive tsunami defence.
ADAPTATION
Community preparedness
Community preparedness and disaster recoveryplanning is a key factor in mitigating earthquakeimpact. Some programmes are enacted in responseto previous failures. For example, following the1999 Marmara earthquakes in Turkey, the govern-ment established new emergency managementcentres in Istanbul and Ankara to prepare plans formitigating future disasters. In the USA earthquakepreparedness has become prominent because oflong-range forecasts of potential large-scale move-ments along the San Andreas fault and in 1981 the Seismic Safety Commission established twoPreparedness Projects to deal with the Los Angelesand San Francisco areas. More recently, considerableresource has been invested in community prepared-ness projects in the tsunami-affected areas aroundthe Indian Ocean.
Community preparedness is best developed at thelocal level within a framework provided by state ornational government. In some cases, it may bedifficult to identify the areas at greatest risk. Forexample, the unexpected devastation suffered in theKobe earthquake of 1995 was partly attributed tothe fact that the Tokyo area was previously thoughtto be more vulnerable, with the result that localstockpiles of emergency foods and medicines atKobe were inadequate. Similarly, the 2005 Kashmirearthquake in Pakistan was the first large earthquake
THE EXPER IENCE AND REDUCT ION OF HAZARD124
Proofed structures
Parking BeachRoad
Coastalevacuation
road
Inland limit of 100 year inundation
Crest height of 1:100 year Tsunami
Offshore breakwaterCoastal redevelopmentNormal development
StorageWorkingspace
Figure 6.8 Schematic depiction of tsunami engineering works, showing an offshorebreakwater and some raised coastal redevelopment, including an emergency evacuationroute, as employed in parts of Japan.
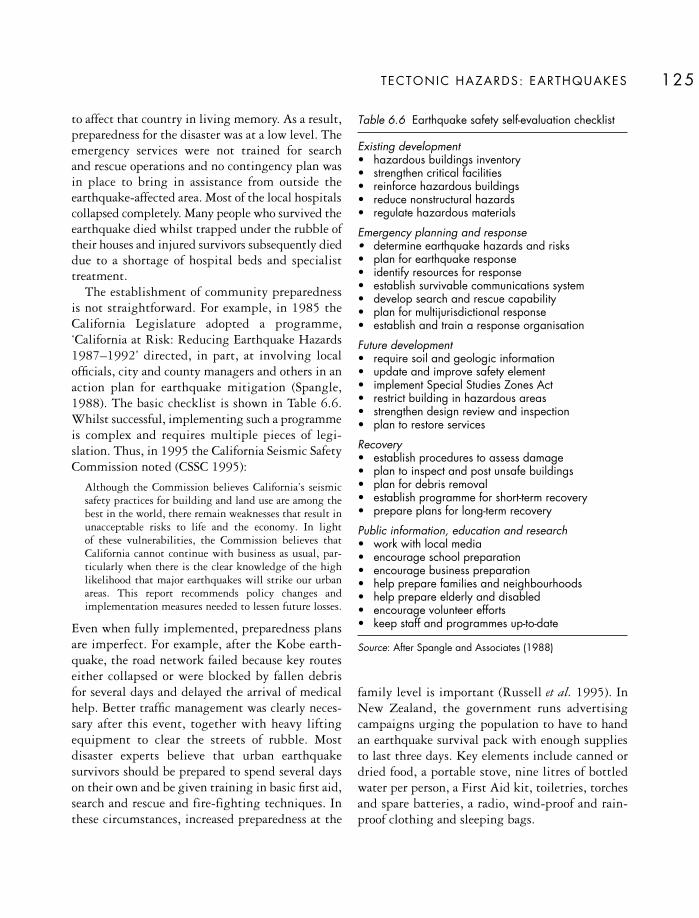
to affect that country in living memory. As a result,preparedness for the disaster was at a low level. Theemergency services were not trained for search and rescue operations and no contingency plan was in place to bring in assistance from outside theearthquake-affected area. Most of the local hospitalscollapsed completely. Many people who survived theearthquake died whilst trapped under the rubble oftheir houses and injured survivors subsequently dieddue to a shortage of hospital beds and specialisttreatment.
The establishment of community preparedness is not straightforward. For example, in 1985 theCalifornia Legislature adopted a programme,‘California at Risk: Reducing Earthquake Hazards1987–1992’ directed, in part, at involving localofficials, city and county managers and others in anaction plan for earthquake mitigation (Spangle,1988). The basic checklist is shown in Table 6.6.Whilst successful, implementing such a programmeis complex and requires multiple pieces of legi-slation. Thus, in 1995 the California Seismic SafetyCommission noted (CSSC 1995):
Although the Commission believes California’s seismicsafety practices for building and land use are among thebest in the world, there remain weaknesses that result inunacceptable risks to life and the economy. In light of these vulnerabilities, the Commission believes thatCalifornia cannot continue with business as usual, par-ticularly when there is the clear knowledge of the highlikelihood that major earthquakes will strike our urbanareas. This report recommends policy changes andimplementation measures needed to lessen future losses.
Even when fully implemented, preparedness plansare imperfect. For example, after the Kobe earth-quake, the road network failed because key routeseither collapsed or were blocked by fallen debris for several days and delayed the arrival of medicalhelp. Better traffic management was clearly neces-sary after this event, together with heavy liftingequipment to clear the streets of rubble. Mostdisaster experts believe that urban earthquakesurvivors should be prepared to spend several dayson their own and be given training in basic first aid,search and rescue and fire-fighting techniques. Inthese circumstances, increased preparedness at the
family level is important (Russell et al. 1995). InNew Zealand, the government runs advertisingcampaigns urging the population to have to handan earthquake survival pack with enough suppliesto last three days. Key elements include canned ordried food, a portable stove, nine litres of bottledwater per person, a First Aid kit, toiletries, torchesand spare batteries, a radio, wind-proof and rain-proof clothing and sleeping bags.
TECTONIC HAZARDS: EARTHQUAKES 125
Table 6.6 Earthquake safety self-evaluation checklist
Existing development• hazardous buildings inventory• strengthen critical facilities• reinforce hazardous buildings• reduce nonstructural hazards• regulate hazardous materials
Emergency planning and response• determine earthquake hazards and risks• plan for earthquake response• identify resources for response• establish survivable communications system• develop search and rescue capability• plan for multijurisdictional response• establish and train a response organisation
Future development• require soil and geologic information• update and improve safety element• implement Special Studies Zones Act• restrict building in hazardous areas• strengthen design review and inspection• plan to restore services
Recovery• establish procedures to assess damage• plan to inspect and post unsafe buildings• plan for debris removal• establish programme for short-term recovery• prepare plans for long-term recovery
Public information, education and research• work with local media• encourage school preparation• encourage business preparation• help prepare families and neighbourhoods• help prepare elderly and disabled• encourage volunteer efforts• keep staff and programmes up-to-date
Source: After Spangle and Associates (1988)
THE EXPER IENCE AND REDUCT ION OF HAZARD126
Public participation in training schemes, such asearthquake drills, is necessary for good preparedness.If properly undertaken, drills and simulations canprovide practical information on emergency first aidand household evacuation as well as raise generalhazard awareness. But such events are difficult toorganise and an attempt to hold one coordinateddrill throughout the San Francisco Bay area metwith limited success (Simpson, 2002). On the otherhand, earthquake drills in Japan are generallysuccessful, especially when focused upon schoolchildren. The degree of personal preparedness isprobably best measured by the various adjustmentsmade to improve safety at the household level(Lindell and Perry, 2000) but there is a need formore direct advice about the effectiveness ofdifferent anti-seismic adjustments in the home(Lindell and Whitney, 2000).
Forecasting and warning for earthquakesA short-term earthquake prediction indicates thatan earthquake in a specific magnitude range willoccur in a specified region within a stated time-window. Despite some which have proven to bemisplaced, we do not appear to be close to a reliableearthquake prediction technique and it is not evenclear that such precise predictions are desirable.However, hazard assessment for earthquakes isroutinely undertaken for planning and insurancepurposes using either probabilistic or deterministicmethods.
Probabilistic methodsA good understanding of the past frequency of largeearthquakes in any area can be used to estimate thefuture likelihood of similar events. In a country likeNew Zealand, where the pattern of earthquakeactivity does not correlate well with the surfacegeology, the historical record is useful in assessingthe short-term risk (Smith and Berryman, 1986).Figure 6.9A uses shallow focus earthquakes ofM≥6.5 from 1840 to 1975 to map the returnperiods for intensity MM VI and greater, which is
the level at which significant damage begins. Figure6.9B shows the intensities with a 5 per centprobability of occurrence within 50 years. Suchregional zonation has limitations because it is basedon comparatively short records and it does not takeinto account local ground conditions.
A major problem with statistical methods is the assumption that earthquakes occur randomlythrough time. This may not happen because faultlines move in many different ways and may alsointeract with each other. This was well-illustratedby the aftermath of the tsunamagenic 2004 Sumatraearthquake. This massive event led to increasedstress concentrations on the adjacent fault lines suchthat, by February 2008, there had been sevensubsequent earthquakes of MW≥7.0 in the samearea, including the March 2005 MW=8.7 Niasearthquake, which killed 1,300 people; the May2006 MW=6.2 Java earthquake, which killed 5,800people; and the July 2006 MW=7.6 Java earthquake,which killed 660 people. Further large events seemlikely on so-far unruptured sections of the fault, inparticular in the area of the island of Mentawi.
Problems also arise because of the difficultiesassociated with the different behaviours displayed bydifferent fault segments. For example, the SanAndreas fault in California consists of both locked andcreeping segments. Locked segments allow sufficientstrain to build up to cause major earthquakes whilstcreeping segments are characterised by continuoussliding. Such creep appears to result from thepresence of finely crushed rock and clay with a lowfrictional resistance which limits the build-up ofstress. However, more competent rocks at greaterdepth may accumulate stress. Dolan et al. (1995)claimed that, in the Los Angeles region, far too fewmoderate earthquakes had occurred during the last200 years to account for the observed accumulationof tectonic strain. It is possible that the historicrecord reflects a period of unusual quiescence butdamaging strain may be accumulating. The USGeological Survey has calculated that the probabilityof at least one earthquake (M=6.7 or more) strikingbetween 2000 and 2030 in the San Francisco Bayarea is 70 per cent (twice as likely as not).
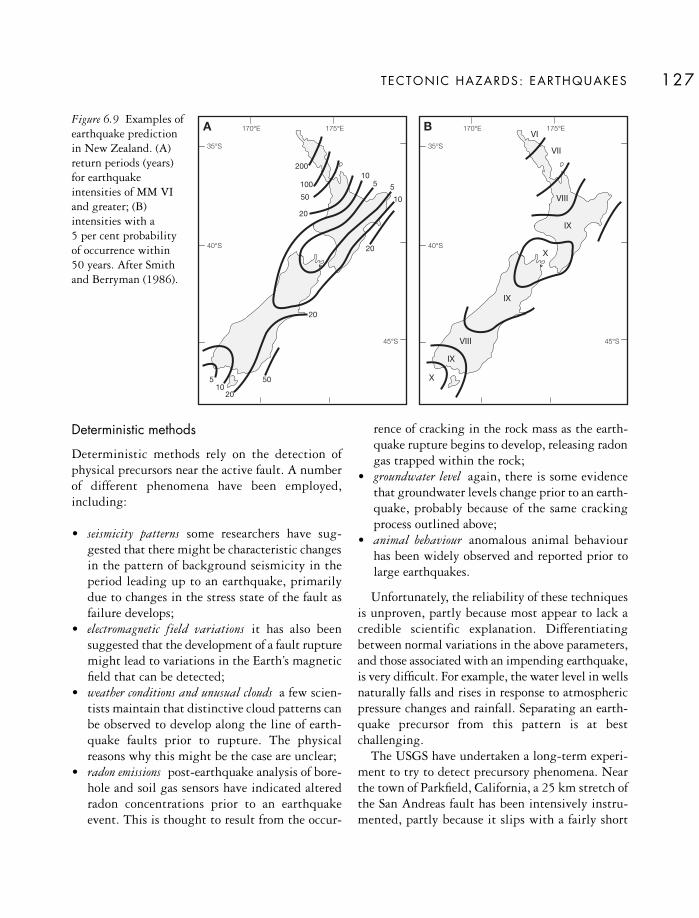
Deterministic methods
Deterministic methods rely on the detection ofphysical precursors near the active fault. A numberof different phenomena have been employed,including:
• seismicity patterns some researchers have sug-gested that there might be characteristic changesin the pattern of background seismicity in theperiod leading up to an earthquake, primarilydue to changes in the stress state of the fault asfailure develops;
• electromagnetic field variations it has also beensuggested that the development of a fault rupturemight lead to variations in the Earth’s magneticfield that can be detected;
• weather conditions and unusual clouds a few scien-tists maintain that distinctive cloud patterns canbe observed to develop along the line of earth-quake faults prior to rupture. The physicalreasons why this might be the case are unclear;
• radon emissions post-earthquake analysis of bore-hole and soil gas sensors have indicated alteredradon concentrations prior to an earthquakeevent. This is thought to result from the occur-
rence of cracking in the rock mass as the earth-quake rupture begins to develop, releasing radongas trapped within the rock;
• groundwater level again, there is some evidencethat groundwater levels change prior to an earth-quake, probably because of the same crackingprocess outlined above;
• animal behaviour anomalous animal behaviourhas been widely observed and reported prior tolarge earthquakes.
Unfortunately, the reliability of these techniquesis unproven, partly because most appear to lack acredible scientific explanation. Differentiatingbetween normal variations in the above parameters,and those associated with an impending earthquake,is very difficult. For example, the water level in wellsnaturally falls and rises in response to atmosphericpressure changes and rainfall. Separating an earth-quake precursor from this pattern is at bestchallenging.
The USGS have undertaken a long-term experi-ment to try to detect precursory phenomena. Nearthe town of Parkfield, California, a 25 km stretch ofthe San Andreas fault has been intensively instru-mented, partly because it slips with a fairly short
TECTONIC HAZARDS: EARTHQUAKES 127
170°E
35°S
40°S
45°S
175°E 170°E
35°S
40°S
45°S
175°E
200
100
50
20
20
10
10
5 5
20
20
5010
5
VI
VII
VIII
VIII
IX
IX
X
X
IX
A BFigure 6.9 Examples ofearthquake predictionin New Zealand. (A)return periods (years)for earthquakeintensities of MM VIand greater; (B)intensities with a 5 per cent probabilityof occurrence within 50 years. After Smithand Berryman (1986).

recurrence interval of about 22 years to givemoderate (MW=6.0) earthquakes and partly becauseover 120,000 households are at risk from seismicactivity in the area. The ongoing Parkfield predic-tion experiment involves monitoring the fault linethrough a dense network of sensitive seismographs,the use of tiltmeters to detect ground surfacechanges and geodetic lasers to measure any changesin distance across the fault. In September 2004 aMW=6.0 earthquake occurred on the fault and wasrecorded in detail by the instrument array. Analysisof the data suggests that no precursory indicationsof this earthquake could be determined (Park et al.,2007).
So far, usable long-term warning systems are notavailable. In Japan there are about 100 earthquakemonitoring stations but no public warning has yetbeen issued. Neither the 1994 Northridge nor the1995 Kobe earthquakes were adequately anti-cipated. Indeed, both occurred on fault systemsupon which the seismic potential was incompletelyunderstood. A better scientific understanding ofearthquake activity is vital because, althoughprediction and warning still remains a long-termgoal, it is not the only potential benefit from thisknowledge. For example, the 30-year prediction forthe San Francisco Bay area could be exploited as a‘wake-up call’ to reduce risks through preparednessalthough uncertainties about the reliability of suchpredictions suggest that this may not happen.
Some hope exists, however, for very short-termwarning systems. In Taiwan, the Central WeatherBureau, which is charged with the collection ofseismic datasets, operates a nationwide network ofstrong motion instruments, all of which deliver datato a central monitoring system in real-time. A mapof the location of an earthquake can typically beproduced within 22 seconds of the start of anearthquake (Wu et al., 2004). This information canthen be sent to vulnerable locations. At the currentrate of data transfer this would provide a city located100 km from the earthquake epicentre about 10seconds warning of the arrival of earthquake waves,based on a wave velocity of about 3 km s–1. Whilstthis is insufficient time to adequately warn the
population, it is enough to shut down and protecthighly vulnerable systems such as computer servers,gas pipelines and nuclear power plants. It is hopedthat, in the future, better instrument arrays and dataprocessing will allow such warning times to beincreased. Already, work is underway to enhance thesystem to allow automatic shutdown of the Taiwanhigh speed railway network before the earthquakewaves arrive. Similar systems are under developmentin Japan and elsewhere.
Forecasting and warning for secondary earthquake hazards
Most secondary hazards associated with earthquakesare as unpredictable as the earthquake itself. Manymay be less predictable because their occurrencedepends on a host of factors in addition to theearthquake itself. For example, the occurrence of aparticular earthquake-triggered landslide maydepend upon not only the magnitude of shaking,but also upon the groundwater conditions at thetime of the earthquake. On the other hand, tsunamiforecasting and warning systems are now well estab-lished. A tsunami warning system was establishedin l948 for the Pacific Ocean, using a network ofseismic stations that relay information to a warningcentre near Honolulu, Hawaii (Lockridge, 1985).This international monitoring network, managedby the US National Oceanic and AtmosphericAdministration, relies on about 30 seismic stationsand 70 tide stations throughout the Pacific basin.Following the disastrous tsunamigenic Alaskaearthquake of 1964, the West Coast/AlaskaTsunami Warning Centre was established in l967and now provides more localised warning forAlaska, British Columbia, Washington, Oregon andCalifornia. Such piecemeal development has beencriticised by those who argue for a fully compre-hensive approach to tsunami warning in the Pacificbasin (Dohler, 1988).
At present, tsunami warning is operated on twolevels. The first level provides warnings to all Pacificnations of large, destructive tsunamis that are ocean-wide. Following a high magnitude earthquake
THE EXPER IENCE AND REDUCT ION OF HAZARD128

(M=>7.0), tide stations near the epicentre arealerted to watch for unusual wave activity. If this isdetected, a tsunami warning is issued. The primaryaim is to alert all coastal populations at risk withina time period of 1 hour about the arrival time of thefirst wave with an accuracy of +/–10 minutes. Moredistant populations have longer to react. The secondlevel of cover is based on warning systems servingspecific tsunami-prone areas. Local tsunamis canpose a greater threat than Pacific-wide eventsbecause they strike very quickly. These regionalsystems rely on local data obtained in real-time.Typically, they aim to issue a warning withinminutes for areas between 100 and 750 km from theearthquake source. For example, the JapaneseMeteorological Agency has maintained its ownwarning service since 1952 but this system wasupdated in 1999 following loss of life in 1993.Previously, warnings were based on the traditionalmethod of tidal observations, calculation of earth-quake location and magnitude, empirical estimationof tsunami wave heights plus – if necessary – issuinga warning message for 18 coastal segments eachseveral hundred kilometres long. The new methoduses computer simulations of tsunamis generatedoffshore by various sizes and depths of earthquake.Once the location and magnitude of an earthquakeare established, tsunami heights and arrival timesare retrieved from a database containing about100,000 simulations relating to 600 points aroundthe Japanese coast. Wave heights and arrival timescan then be forecast for 66 separate coastal segments.The new system provides for:
• the issue of an initial tsunami advisory orwarning three minutes after an earthquake
• the issue of maximum wave heights and arrivaltimes within about five minutes after theearthquake
• the subsequent issue of the times of high tidesand updating information about the hazardsituation.
In the aftermath of the 2004 Indian Ocean tsunami,one of the major criticisms was the lack of a tsunami
warning system. The establishment of such a systemwas agreed at a United Nations conference held inJanuary 2005 at Kobe, Japan. The initial system,which was activated late June 2006 under theleadership of UNESCO, consists of 25 seismo-graphic stations and three deep-ocean sensors, eachof which relays information to 26 national tsunamiinformation centres. The ongoing occurrence ofearthquakes in the Sumatra area has tested thesystem on a number of occasions and appears to havebeen quite successful. However, a number of falsealarms have also been issued and there are reportsthat communities in Aceh disabled the localbroadcast system in June 2007 due to the excessivenumber of false alarms. This highlights the fact thatthe physical system is only half the story for aneffective warning system – the other half is localdisaster preparedness, which remains difficult toachieve for many vulnerable communities, especiallyin LDCs.
Land use planning
The microzonation of land on the basis of earth-quake risk is expensive, but necessary, in manyurban areas. The highest priority is to map built-upareas susceptible to enhanced ground shaking, as aresult of the presence of soft soils or landfill, becausethis process is often the major factor in propertydamage. As shown in Table 6.7, analysis followingthe 1989 Loma Prieta earthquake indicated that,whilst 98 per cent of the total property loss from theearthquake was attributed to ground shaking,enhanced ground shaking by amplified seismicwaves in soft-soil deposits was directly responsiblefor about two-thirds of the total (Holzer, 1994). Anattempt has been made to map seismic vulnerabilityin Athens, Greece, following a damaging earth-quake in 1999 (Marinos et al., 2001). Figure 6.10shows proposed land zones, based on four classgrades for both geology and building damage,relating to the municipality of Ano Liossia, less than3 km from the fault rupture. It can be seen that verysevere damage (including building collapse) wasmainly confined to the alluvial deposits in Zone 3
TECTONIC HAZARDS: EARTHQUAKES 129

THE EXPER IENCE AND REDUCT ION OF HAZARD130
while moderate-severe damage occurred in thesurrounding Zone 2. Little damage occurred abovethe rock formations of Zone 1, an indication thatthe proposed zoning is a guide to future seismic risk.
In many counties and cities of California, setbackordinances are a major tool in enhancing seismic
safety. Building setbacks can be recommendedwhere proposed development crosses known, orinferred, faults and slope stability setbacks can beestablished where un-repaired active landslides, or old landslide deposits, have been identified.Setbacks can also be used to separate buildings from
Insignificant damage
Medium damage
Severe damage
Very severe damage
Bedrock formations (zone 1)
Stiff or dense soils (zone 2)
Medium stiff or dense soils (zone 3)
Rivers and streams (zone 4)0 km 1
A B
Figure 6.10 Earthquake hazard planning in the municipality of Ano Liossia, Athens, Greece. (A) distribution ofbuilding damage after the earthquake (M = 5.9) of 1999; (B) four proposed seismic risk zones in relation to surfacegeology. Zone 1 is lowest risk and blank areas were not included in the study. After Marinos et al., (2001).Reprinted from Engineering Geology, 62, Marinos et al., Ground zoning against seismic hazard in Athens, Greece,copyright (2001), with permission from Elsevier.
Table 6.7 Loma Prieta earthquake losses by earthquake hazard
Earthquake hazard Total damages (US$ millions) Loss (per cent of total)
Ground shaking, normally attenuated 1,635 28.0Ground shaking, enhanced 4,170 70.0Liquefaction 97 1.5Landslides 30 0.5Ground rupture 4 0.0Tsunami 0 0.0Total 5,936 100.0
Source: After Holzer (1994), EOS 75 (26) Table 3, page 301, 1994, copyright by the American Geophysical Union

each other in order to reduce pounding effects wherestructures of different heights, resulting fromdifferent construction methods, are combined inclose proximity. Preuss (1983) emphasised the needfor tsunami mitigation to be explicitly integratedinto the planning of hazard-prone coastlines so thatevacuation routes, for example, can be prepared andprotected. Figure 6.11 illustrates the measures thatcould be incorporated into a comprehensive anti-tsunami scheme including physical structures andthe provision of a coastal evacuation route.
Land planning can guide communities in thefuture use of land prone to seismic activity. InCalifornia every local authority is required by lawto include a seismic safety element in such planningbut rather vague guidelines and limited oversightdo little to ensure high standards or consistency in the plans. There is also the potential for theauthorities to resist strict measures, especially underthe influence of local political forces with interestsin land development who believe that disaster costscan be passed on to the federal administration. Inthis situation, it is significant to note that, followingthe Northridge earthquake, the amount of damageto single-family homes was related to the quality of the plans (Nelson and French, 2002). Theavailability of hazard information is also necessarybut may not be crucial to individual decision-makers. In California, state law requires that estateagents (realtors) inform all potential purchasers ifresidential properties are located near mapped fault
lines. In practice, the hazard potential of property isoften not disclosed until sale negotiations were welladvanced. In any case, earthquake hazard infor-mation may not be a major factor in residentialdecision-making if other attributes – schools, shops,investment potential, view – are more important tobuyers, especially if the purchaser intends to relocatein a few years’ time.
KEY READING
Bilham, R. and Hough, S. E. (2006) Future earth-quakes on the Indian Continent: inevitable hazard,preventable risk. South Asia Journal, 12: 1–9.
Bilham, R. (2006) Dangerous tectonics, fragilebuildings, and tough decisions. Science 311: 1873–5.
Lindell, M. K. and Perry, R. W. (2000) Householdadjustment to earthquake hazard: a review ofresearch. Environment and Behavior 32: 461–501.
Petley, D. N. (2005) Tsunami – how an earthquakecan cause destruction thousands of kilometres away.Geography Review 18: 2–5.
WEB L INKS
USGS Earthquake programme http://earthquake.usgs.gov/faq/
TECTONIC HAZARDS: EARTHQUAKES 131
Crest height of1:100 year Tsunami
Inland limit of 1:100 year inundation
Tsunamicontrol forest
Proofedstructure
Normaldevelopment
Berm
Beach OceanCoastal
evacuationroad
Figure 6.11 An example of coastal land-use planning for tsunami hazards. The beach and forest are used to dissipate the energy of the onshore wave; building development and the coastal evacuation route are located above the predicted height of the 1:100 year event. After Preuss (1983).

IRIS Seismic monitor http://www.iris.edu/seismon/
Photographs of historic earthquakes http://nisee.berkeley.edu/elibrary/browse/kozak?eq=5234
International Seismological Centre http://www.isc.ac.uk/
Global tsunami database http://tsunami.name/
NOAA Center for Tsunami Research http://nctr.pmel.noaa.gov/
THE EXPER IENCE AND REDUCT ION OF HAZARD132

VOLCANIC HAZARDS
There are about 500 active volcanoes throughout theworld. In an average year around 50 erupt. Despitetheir dramatic appearance and high public profile,volcanic hazards create fewer disasters than earth-quakes or severe storms, although the infrequencyof eruptive events is one of their most dangerousfeatures. Traditionally, volcanoes have been classifiedas active, dormant or extinct but in 1951 MountLamington erupted in Papua New Guinea killing5,000 people despite being considered extinct(Chester, 1993). To be prudent, all volcanoes thathave erupted within the last 25,000 years should beregarded as at least potentially active. In the past,most volcano-related deaths have been due toindirect causes, such as famine due to the destruc-tion of crops by ashfall. Today, disaster deaths aredirectly associated with violent eruptions and lahars(volcanic mudflows) although volcanic areas areoften geologically unstable and prone to multiplethreats (Malheiro, 2006). Volcanic terrain alsoprovides resources; geothermal energy, buildingmaterials and opportunities for tourism, as at sitessuch as Mt Etna and Mt Fujiyama.
Volcanoes killed fewer than 1,000 people eachyear during the twentieth century. But a compre-hensive database of volcanic activity, compiled by
Witham (2005), indicated that deaths have beenunder-estimated in the past and drew attention toother hazard impacts, such as the large number of people evacuated in volcanic emergencies (Table 7.1). Catastrophic eruptions occur irregularlyin space and time. More than half the deathsrecorded in the last century occurred in just twoevents; the 1902 eruption of Mont Pelée, on theisland of Martinique in the West Indies, killed29,000 people in the port of Saint Pierre, leavingonly two known survivors, and the 1985 eruptionof Nevado del Ruiz in Colombia claimed a further23,000 lives. Overall, pyroclastic flows are the chiefcause of death, lahars are the chief cause of injuriesand ashfalls (tephra) account for most people madehomeless. Gentler eruptions create less hazard. Forexample, only one person was killed over the past100 years by a volcanic eruption in Hawaii despitethe fact that, over the same period, some 5 per centof the island was covered by fresh lava flows (Decker, 1986). On the other hand, there is concernabout the increasing exposure to volcanic hazards,especially for many growing cities of the LDCs(Chester et al., 2001). The volcanic complex west of Naples, Italy, is now one of the most denselypopulated areas of active volcanism in the world andand it has been estimated that 200,000 people arecurrently at risk (Barberi and Carapezza, 1996).
7
TECTONIC HAZARDS
Volcanoes

Volcanoes attract human settlement and it is theincrease in exposed risk, rather than the frequencyof eruptions, that explains the doubling of fataleruptions from the nineteenth to the twentiethcentury (Simkin et al., 2001). According to Smalland Naumann (2001), 10 per cent of the world’spopulation already live within 100 km of a volcanoactive in historic times. The highest populationdensities at risk are in south-east Asia and centralAmerica although, in Europe, the Etna regioncontains about 20 per cent of Sicily’s populationwith rural population densities between 500–800per km2. Countries like Indonesia, located at thejunction of three tectonic plates with a populationof over 150 million, face the greatest threat and thisnation has suffered two-thirds of all volcano-relateddeaths (Suryo and Clarke, 1985). In 1815 a massiveeruption of the Tambora volcano directly killed12,000 people and a further 80,000 persons laterperished through disease and famine.
THE NATURE OF VOLCANOES
The distribution of volcanoes is controlled by theglobal geometry of plate tectonics. Not surprisingly,seismic activity is often associated with volcaniceruptions although most volcanic earthquakes aresmall (Zobin, 2001). Volcanoes are found in threetectonic settings:
• Subduction volcanoes are located in the zones of theearth’s crust where one tectonic plate is thrust
and consumed beneath another. They compriseabout 80 per cent of the world’s active volcanoesand are the most explosive type characterised bya composite cone associated with multiplehazards (Fig. 7.1).
• Rift volcanoes occur where tectonic plates diverge.They are generally less explosive and moreeffusive, especially when they occur on the deepocean floor.
• Hot spot volcanoes exist in the middle of tectonicplates where a crustal weakness allows moltenmaterial to penetrate from the earth’s interior.The Hawaiian islands in the middle of the Pacificplate are an example.
All volcanoes are formed from the molten material(magma) within the earth’s crust. Magma is a com-plex mixture of silicates which contains dissolvedgases and, often, crystallised minerals in suspension.As the magma moves towards the surface, thepressure decreases and the dissolved gases come outof solution to form bubbles. As the bubbles expand,they drive the magma further into the volcanic ventuntil it breaks through weaknesses in the earth’scrust. For a moderately large eruption, the totalthermal energy released lies in the range 1015–1018
joules, which compares with the 4 × 10¹² joulesliberated by a one kilotonne atomic explosion. Thereis no agreed scale for measuring the size of eruptionsbut Newhall and Self (1982) drew up a semi-quantitative volcanic explosivity index (VEI) whichcombined the total volume of ejected products, theheight of the eruption cloud, the duration of themain eruptive phase and several other items into abasic 0–8 scale of increasing hazard (Table 7.2). Onaverage, an eruption with VEI=5 occurs every 10years and with VEI=7 every 100 years.
The disaster potential of eruptions depends on theeffervescence of the gases and the viscosity of themagma. High effervescence and low viscosity leadto the most explosive eruptions. Thus, subductionzone volcanoes draw on magmas that are a mixtureof upper-mantle material and melted continentalrocks rich in feldspar and silica. These felsic (acid)magmas produce thick, viscous lavas containing up
THE EXPER IENCE AND REDUCT ION OF HAZARD134
Table 7.1 Best estimates of the human impacts ofvolcanic hazards in the twentieth century (1900–99)
Human impacts Number of Number of events people
Killed 260 91,724Injured 133 16,013Homeless 81 291,457Evacuated/affected 248 5,281,906Any incident 491 5,595,500
Note: Each event may have had more than one consequence.
Source: Witham (2005)
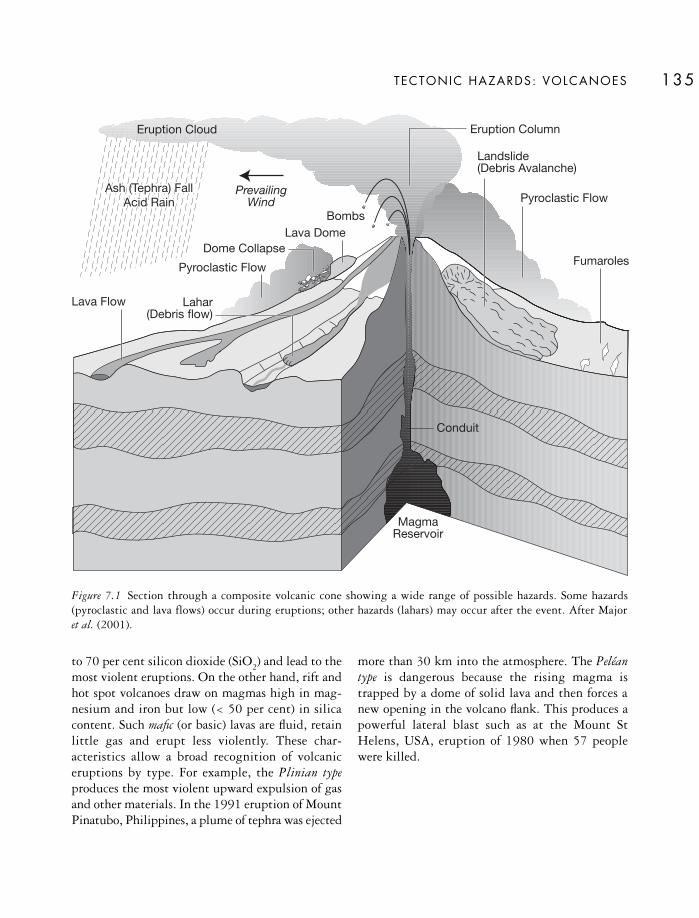
to 70 per cent silicon dioxide (SiO2) and lead to themost violent eruptions. On the other hand, rift andhot spot volcanoes draw on magmas high in mag-nesium and iron but low (< 50 per cent) in silicacontent. Such mafic (or basic) lavas are fluid, retainlittle gas and erupt less violently. These char-acteristics allow a broad recognition of volcaniceruptions by type. For example, the Plinian typeproduces the most violent upward expulsion of gasand other materials. In the 1991 eruption of MountPinatubo, Philippines, a plume of tephra was ejected
more than 30 km into the atmosphere. The Peléantype is dangerous because the rising magma istrapped by a dome of solid lava and then forces anew opening in the volcano flank. This produces apowerful lateral blast such as at the Mount StHelens, USA, eruption of 1980 when 57 peoplewere killed.
TECTONIC HAZARDS: VOLCANOES 135
Eruption Cloud
Ash (Tephra) FallAsh (Tephra) FallAcid RainAcid Rain
Ash (Tephra) FallAcid Rain
Bombs
Eruption Column
Landslide(Debris Avalanche)
Pyroclastic Flow
Pyroclastic Flow Fumaroles
Lava DomeDome Collapse
Lahar(Debris flow)
Lava Flow
MagmaReservoir
Conduit
PrevailingWind
Figure 7.1 Section through a composite volcanic cone showing a wide range of possible hazards. Some hazards(pyroclastic and lava flows) occur during eruptions; other hazards (lahars) may occur after the event. After Major et al. (2001).
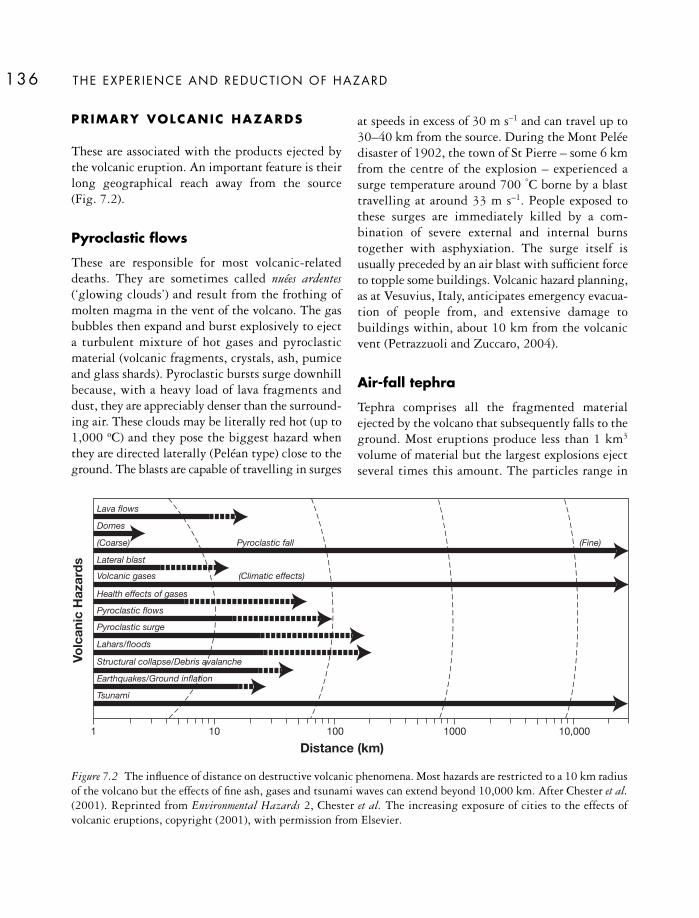
PRIMARY VOLCANIC HAZARDS
These are associated with the products ejected bythe volcanic eruption. An important feature is theirlong geographical reach away from the source (Fig. 7.2).
Pyroclastic flows
These are responsible for most volcanic-relateddeaths. They are sometimes called nuées ardentes(‘glowing clouds’) and result from the frothing ofmolten magma in the vent of the volcano. The gasbubbles then expand and burst explosively to ejecta turbulent mixture of hot gases and pyroclasticmaterial (volcanic fragments, crystals, ash, pumiceand glass shards). Pyroclastic bursts surge downhillbecause, with a heavy load of lava fragments anddust, they are appreciably denser than the surround-ing air. These clouds may be literally red hot (up to1,000 oC) and they pose the biggest hazard whenthey are directed laterally (Peléan type) close to theground. The blasts are capable of travelling in surges
at speeds in excess of 30 m s–1 and can travel up to30–40 km from the source. During the Mont Peléedisaster of 1902, the town of St Pierre – some 6 kmfrom the centre of the explosion – experienced asurge temperature around 700 °C borne by a blasttravelling at around 33 m s–1. People exposed tothese surges are immediately killed by a com-bination of severe external and internal burnstogether with asphyxiation. The surge itself isusually preceded by an air blast with sufficient forceto topple some buildings. Volcanic hazard planning,as at Vesuvius, Italy, anticipates emergency evacua-tion of people from, and extensive damage tobuildings within, about 10 km from the volcanicvent (Petrazzuoli and Zuccaro, 2004).
Air-fall tephra
Tephra comprises all the fragmented materialejected by the volcano that subsequently falls to theground. Most eruptions produce less than 1 km3
volume of material but the largest explosions ejectseveral times this amount. The particles range in
THE EXPER IENCE AND REDUCT ION OF HAZARD136
1 10 100 1000 10,000
Volc
anic
Haz
ard
s
Lava flows
Lateral blast
Health effects of gases
Pyroclastic flows
Pyroclastic surge
Lahars/floods
Structural collapse/Debris avalanche
Earthquakes/Ground inflation
Tsunami
Volcanic gases (Climatic effects)
Domes
(Coarse) Pyroclastic fall (Fine)
Distance (km)
Figure 7.2 The influence of distance on destructive volcanic phenomena. Most hazards are restricted to a 10 km radiusof the volcano but the effects of fine ash, gases and tsunami waves can extend beyond 10,000 km. After Chester et al.(2001). Reprinted from Environmental Hazards 2, Chester et al. The increasing exposure of cities to the effects ofvolcanic eruptions, copyright (2001), with permission from Elsevier.

size from so-called ‘bombs’ (>32 mm in diameter)down to fine ash and dust (<4 mm in diameter). Thecoarser, heavier particles fall out close to the volcanovent and flat roofed, un-reinforced buildings tendto collapse when ash accumulation approaches onemetre. In some cases the tephra will be sufficientlyhot to start fires on the ground. Depending on windconditions, the finer dust may be deposited far awayand, within six hours of the modest eruption(VEI=5) of Mount St Helens in 1980, ash cloudshad drifted 400 km downwind. Although ashfallsaccount for less than 5 per cent of the direct deathsassociated with volcanic eruptions, the dust reducesvisibility and can disrupt air traffic (Guffanti et al.,2005). Heavy falls of scoria (cinder) blanket thelandscape and even light falls of ash contaminatefarmland and create disruption and buildingdamage in urban areas. The eruption of MountPinatubo in 1991 disrupted the livelihood of500,000 farmers as agricultural land up to 30 kmdistant was covered in ash. If injected high into theatmosphere, volcanic dust can disturb weatherpatterns worldwide (see Chapter 14).
Lava flows
These pose the greatest threat to human life whenthey emerge rapidly from fissure, rather than fromcentral-vent, eruptions. The fluidity of lava is
determined by its chemical composition, especiallythe proportion of silicon dioxide (SiO2). If silicondioxide forms less than about half the total, the lavasare mafic and very fluid compared to the moreviscous acid lava flows. These characteristics haveled to the recognition of two types of lava flow:
• Pahoehoe lava These flows are the most liquid,with a relatively smooth but wrinkled surface.
• Aa lava This is blocky, spiny and slow movingwith a rough, irregular surface.
On steep slopes, low-viscosity lava streams flowdownhill at speeds approaching 15 m s–1. In the1977 eruption of Nyiragongo volcano, Zaire, fivefissures on the flanks of the volcano released a waveof such lava that killed 72 people and destroyed over400 houses. Around Mount Etna, Sicily, aa-type lavaflows have done much damage in historic times andthe city of Catania was partially destroyed in 1669.The greatest lava-related disaster in historic timesoccurred in 1783 when lava flowed out of the 24 kmlong Lakagigar fissure in Iceland for more than fivemonths (Thorarinsson, 1979). Whilst few directcasualties occurred, over 10,000 people – nearly 22 per cent of Iceland’s population at the time –died in the resulting famine.
TECTONIC HAZARDS: VOLCANOES 137
Table 7.2 Selected criteria for the Volcanic Explosivity Index (VEI)
VEI number Volume of Column Qualitative Tropospheric Stratosphericejecta (m3) height (km) description injection injection
0 <104 <0.1 non-explosive negligible none1 104–106 0.1–1.0 small minor none2 106–107 1–5 moderate moderate none3 107–108 3–15 mod-large substantial possible4 108–109 10–25 large substantial definite5 109–1010 >25 very large substantial significant6 1010–1011 >25 very large substantial significant7 1011–1012 >25 very large substantial significant8 >1012 >25 very large substantial significant
Note: Column height: for VEIs 0–2 based on km above crater; for VEIs 3–8 based on km above sea level.
Source: Adapted from Newhall and Self (1982)

Volcanic gases
Gases are released by explosive eruptions and lavaflows. The gaseous mixture commonly includeswater vapour, hydrogen, carbon monoxide, carbondioxide, hydrogen sulphide, sulphur dioxide,sulphur trioxide, chlorine and hydrogen chloride invariable proportions. Measurement of the exact gascomposition is difficult due to the high temperaturesnear an active vent and because the juvenile gasesinteract with the atmosphere and each other, thusconstantly altering their composition and pro-portions. Carbon monoxide has caused deathsbecause of its toxic effects at very low concentrationsbut most fatalities have been associated with carbondioxide releases. Carbon dioxide is dangerous becauseit is a colourless, odourless gas with a density about1.5 times greater than air. When it accumulates inlow-lying places disasters can occur; in 1979, over140 people evacuating a village in Java, Indonesia,walked into a dense pool of volcanically-releasedcarbon dioxide and were asphyxiated.
The release of carbon dioxide from previousvolcanic activity also poses a threat. In 1984 a cloudof gas, rich in carbon dioxide, burst out of thevolcanic crater of Lake Monoun, Cameroon, andkilled 37 people by asphyxiation (Sigurdsson,1988). Almost exactly two years later, in 1986, asimilar disaster occurred at the Lake Nyos crater,also in Cameroon. This time 1,746 lives were lost,together with over 8,300 livestock, and 3,460people were moved to temporary camps. The burstof gas created a fountain that reached over 100 mabove the lake surface before the dense cloud floweddown two valleys to cover an area over 60 km2.These hazards are very rare. They are a function ofhigh levels of carbon dioxide in the waters of theselakes, probably built up over a long period of timefrom CO2-rich groundwater springs flowing into thesubmerged crater. Under normal circumstances thedissolved CO2 would remain trapped below thewater surface. In the case of Lake Monoun, thesudden gas release could have been due todisturbance of the water by a landslide originatingon the crater’s rim but no evidence exists for such atrigger at Lake Nyos.
SECONDARY VOLCANIC HAZARDS
Ground deformation
Ground deformation occurs widely as volcanoesgrow from within by magma intrusion and as newlayers of lava and pyroclastic material accumulateon the surrounding slopes. Real-time measurementsof this process are made with GPS technology andsatellite imagery (Kervyn, 2001). The deformationmay lead to a catastrophic failure of the volcanicedifice and associated mass movement hazards. Forexample, the structural failure of the north flank ofMount St Helens in 1980 produced a massive debrisavalanche that advanced more than 20 km down theNorth Fork of the Toutle River. The almost totalcollapse in 2000 of a new lava dome at the SoufrièreHills volcano, Montserrat, generated many pyro-clastic flows and a number of lahars and debrisavalanches in the surrounding valleys (Carn et al.,2004). According to Siebert (1992) major structuralfailures have occurred worldwide, on average, fourtimes per century over the last 500 years, althoughfew deaths have resulted so far compared with those caused by lahars and smaller landslides. Suchinstability is found on large polygenetic volcanoes,like Mauna Loa and Kilauea, Hawaii. Volcanoes likeEtna are also prone to instability because of theircomplex construction of inter-bedded lavas andpyroclastic deposits lying on steep slopes.
Lahars
Lahars are often defined as volcanic mudflowscomposed of sediments of sand-silt grain sizealthough other volcanic material, such as pumice,can also be transported. They occur widely on steepvolcanic flanks in the wet tropics and the term is ofIndonesian (Javanese) origin. The degree of hazardvaries greatly but, generally, the destructive poten-tial tends to rise with flows containing larger-sizesediments, as shown at Popocatépetl volcano,Mexico, by Capra et al. (2004). Most events resultfrom excessive water at the volcano surface but hotmudflows can occur from sources below ground. InMay 2006 a ‘mud volcano’ in Indonesia caused
THE EXPER IENCE AND REDUCT ION OF HAZARD138

TECTONIC HAZARDS: VOLCANOES 139
several fatalities and the displacement of about25,000 people.
Apart from pyroclastic flows, lahars present thegreatest volcanic threat to human life. For example,over 5,000 people were killed in a mudflowfollowing the eruption of the Kelut volcano, Java,in 1919. Lahars can be classified as:
• primary when they occur during a volcaniceruption because freshly fallen tephra is imme-diately mobilised by large quantities of water –sometimes resulting from the collapse of a craterlake – into hot flows
• secondary when they are triggered by highintensity rainfall between eruptions and oldtephra deposits on the slopes are re-mobilisedinto mudflows.
Some of the most destructive primary events are dueto the rapid melting of snow and ice. This happenswhen pyroclastic flows cause hot lava fragments tofall on snow and ice at the summit of the highestvolcanoes. The water mixes with soft ash andvolcanic boulders to produce a debris-rich fluid,sometimes at high temperatures, which then poursdown the mountainside at speeds that commonlyattain 15 m s–1 and may reach >22 m s–1. This threatexists along the northern Andes where at least 20active volcanoes straddle the equator from centralColombia to southern Ecuador (Clapperton, 1986).The highest peaks are permanently snow-cappedand are structurally weak due to the action of hot gases over time. During an eruption in 1877, somuch ice and snow was melted that enormouslahars, 160 km long, discharged simultaneously tothe Pacific and Atlantic drainage basins. The seconddeadliest volcanic disaster ever recorded resultedfrom lahars following the 1985 eruption of theNevado del Ruiz volcano in Colombia. This is themost northerly active volcano in the Andes and ithas generated large lahars in the past, notably in1595 and 1845, when the surrounding populationwas relatively low. Volcanic activity began inNovember 1984 but the main eruption did not takeplace until one year later. This caused large-scale
glacier melting and a huge lahar rushed down theLagunillas valley sweeping up trees and buildingsin its path (Sigurdsson and Carey, 1986). Some 50 km downstream it overwhelmed the town ofArmero with a lahar deposit 3–8 m deep. Over5,000 buildings were destroyed and almost 22,000people lost their lives within a few minutes.
The accumulation of ash on volcanic flanks resultsin an increased threat of river flooding and sedimentre-deposition, especially in countries subject totropical cyclones or monsoon rains. For example,Tayag and Punongbayan (1994) reported that the1991 eruption of Mount Pinatubo produced 1.53 ×10⁶ m3 of new lahar material. Many depressions onthe slopes of volcanoes are filled by ash-fans andFigure 7.3 shows the lahar deposits that cover over280 km2 at Merapi volcano, Java. Most of thesedeposits lie in river channels and are 0.5–2.0 mthick, although some have a depth greater than 10 m (Lavigne et al., 2000). These sediments are re-mobilised by tropical rainfall and eventuallyreach lowland rivers where they reduce channelcapacity and increase the risk of rivers migratingacross floodplains.
Landslides
Landslides and debris avalanches are a commonfeature of volcano-related ground failure. They areparticularly associated with eruptions of siliceous(dacitic) magma with a relatively high viscosity anda large content of dissolved gas. This material canintrude into the volcano as happened in May 1980at Mount St Helens, USA. Swarms of small earth-quakes (Mw=3.0) and minor ash eruptions werefollowed by ground uplift on the north flank of thevolcanic cone. Before the main eruption the bulgewas nearly 2 km in diameter and large cracksappeared in the cover of snow and ice (Foxworthyand Hill, 1982). On 18 May, when the bulge was150 m high, an earthquake shook a huge slab of material from the over-steepened slopes andtriggered a debris avalanche containing 2.7 km3 ofmaterial.
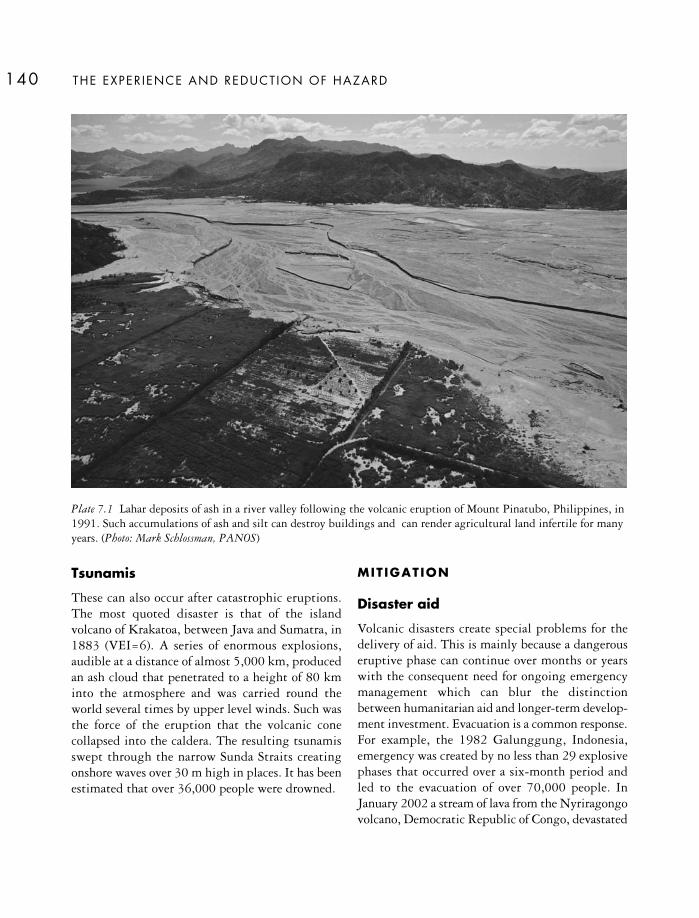
Tsunamis
These can also occur after catastrophic eruptions.The most quoted disaster is that of the islandvolcano of Krakatoa, between Java and Sumatra, in1883 (VEI=6). A series of enormous explosions,audible at a distance of almost 5,000 km, producedan ash cloud that penetrated to a height of 80 kminto the atmosphere and was carried round theworld several times by upper level winds. Such wasthe force of the eruption that the volcanic conecollapsed into the caldera. The resulting tsunamisswept through the narrow Sunda Straits creatingonshore waves over 30 m high in places. It has beenestimated that over 36,000 people were drowned.
MITIGATION
Disaster aid
Volcanic disasters create special problems for thedelivery of aid. This is mainly because a dangerouseruptive phase can continue over months or yearswith the consequent need for ongoing emergencymanagement which can blur the distinctionbetween humanitarian aid and longer-term develop-ment investment. Evacuation is a common response.For example, the 1982 Galunggung, Indonesia,emergency was created by no less than 29 explosivephases that occurred over a six-month period andled to the evacuation of over 70,000 people. InJanuary 2002 a stream of lava from the Nyriragongovolcano, Democratic Republic of Congo, devastated
THE EXPER IENCE AND REDUCT ION OF HAZARD140
Plate 7.1 Lahar deposits of ash in a river valley following the volcanic eruption of Mount Pinatubo, Philippines, in1991. Such accumulations of ash and silt can destroy buildings and can render agricultural land infertile for manyyears. (Photo: Mark Schlossman, PANOS)

about one-third of the city of Goma killing at least45 residents and forcing some 300,000 others to flee across the border to Rwanda. Many evacueessoon returned but had little to eat for several daysbecause the approach roads were blocked by lavaand, more than one month later, 30,000 peopleremained dependent on aid in temporary camps.Volcanic disasters on small islands tend to over-whelm local resources and pose extra difficulties for
local evacuation and other management issues(see Box 7.1).
Aid has not always been well coordinated. Afterthe Cameroon volcanic gas disaster of 1986, morethan 22,000 blankets (five for each displaced personand over 5,000 gas masks (without some necessarycomponents and cylinders) were supplied (Othman-Chande, 1987). Most of the unsolicited food aid wasunusable because it was unfamiliar in local diets and
TECTONIC HAZARDS: VOLCANOES 141
Bovolali
Klaten
Prambanan
Pakem
YOGYAKARTA
Salam
K . A p u
K . Wor o
Lahar deposits
5 km
MuntilanMuntilanMuntilan
MerapiJ A V A
Figure 7.3 The distribution of extensive lahar deposits on the slopes of Merapi volcano, Java. All 13 river coursesshown have produced active lahars during historic times. After Lavigne et al. (2000). Reprinted from Journal ofVolcanology and Geothermal Research 100, Lavigne et al., Lahars at Merapi volcano, central Java, copyright (2000), withpermission from Elsevier.

THE EXPER IENCE AND REDUCT ION OF HAZARD142
In July 1995, the Soufrière Hills volcano, locatedin the south of the small Caribbean island ofMontserrat, began a prolonged phase of unpre-dicted eruptive activity which continued for overa decade. It was characterised by several phases ofdome building and subsequent collapse accom-panied by multiple volcanic hazards, includingextensive ashfall and lahar deposits. Although only19 lives were lost, most of the island’s infra-structure was destroyed with economic lossesestimated at about £1 billion. By December 1997almost 90 per cent of the population of over10,000 people had been forced to relocate, morethan two-thirds had been evacuated from theisland and the GDP had declined by 44 per cent.
Montserrat is a self-governing Overseas Territoryof the UK and, after the disaster, became totallydependent on British support. In the absence of apre-existing emergency plan, the UK governmentand the Government of Montserrat had to learn towork together in all aspects of disaster responseduring a period plagued by uncertainties aboutboth the severity of the volcanic threat and thedivided organisational responsibilities for thedelivery of aid. An initial emergency plan wasprepared in the first few days. Following variousevacuations of people to temporary shelter inpublic buildings, such as schools and churches,relief rations were distributed to 4–5,000 refugees.But delays did occur.
The chronology of repeated evacuations fromPlymouth, the island’s capital, illustrates theuncertainty: first evacuation 21 August 1995, re-occupied 7 September; second evacuation 2December 1995, reoccupied 2 January 1996; finalevacuation 3 April 1996. Later that month, a stateof public emergency was declared and residentswere offered voluntary relocation off the island –
either to a neighbouring Caribbean island or tothe UK with full rights to state benefit andaccommodation for a two-year period. By August1997 about 1,600 refugees were still in temporaryshelter and, even in late 1998, 322 people werestill housed in these conditions.
In June 1997 pyroclastic flows resulted in theonly casualties of the event and the volcanic riskwas re-assessed with more than half the islandplaced in an exclusion zone. Around this time,more permanent arrangements began to appear,many aimed at reconstruction and securing thelonger-term future of the island. These includedthe construction of an emergency jetty to aidevacuation; new directly-built housing, aided bysubsidised soft mortgage schemes; strengtheningof the scientific capability of the MontserratVolcano Observatory and the publication of a draftSustainable Development Plan. Inevitably, therewere further delays and, by November 1998, only105 out of 255 planned houses had been built. In1999 the UK provided an assisted return passagescheme for those who had left the island. Up toMarch 1998, the UK government had spent £59min emergency-related aid with an estimated totalexpenditure of £160m over a six-year period.
This emergency highlighted a need forimproved pre-disaster planning and swifter emer-gency investment decisions in volcanic crises,especially where governance is shared between twoor more authorities. In addition, regional coopera-tion, in this case between the Caribbean countries,would help with the monitoring of volcanicactivity and the raising of levels of awareness andpreparation for future events.
Much of this material was taken from Clay et al.(1999).
Box 7.1
EMERGENCY RESPONSE IN MONTSERRAT FOLLOWING THE VOLCANICDISASTER STARTING IN 1995

TECTONIC HAZARDS: VOLCANOES 143
many items could not be stored adequately in atropical climate. Since then the performance of aidagencies has improved. For example, after the Gomadisaster, clean drinking water was made a priorityin order to prevent outbreaks of cholera at tworefugee camps housing about 13,000 people andhealthcare staff provided medicines and othersupport for local clinics.
PROTECT ION
Environmental control
There is no way of preventing volcanic eruptions butattempts have been made to control the movementof lava flows over the earth’s surface:
• Explosives can be used in two situations. First,aerial bombing of fluid lava high on the volcanomay cause the flow to spread and halt theadvancing lava front by depriving it of supply.This method was first tried in 1935 on Hawaiiwith limited success, although modern tech-nology may achieve better results Second, controlof aa flows has been attempted by breaching thewalls which form along the edges of the flow so that the lava will flood out and starve theadvancing front of material. This method wastried on the aa flow of Mauna Loa’s 1942 eruptionand in the 1983 eruption of Etna, when it provedpossible to divert some 20–30 per cent of theblocky flow (Abersten, 1984). These methods arenot without risk and some uncertainty of success.
• Artificial barriers can be used to divert lavastreams away from valuable property if thetopographic conditions are suitable and locallandowners agree. Barriers must be constructedfrom massive rocks, or other resistant material,with a broad base and gentle slopes. The methodworks best for thin and fluid lava flows exertinga relatively small amount of thrust. It is doubtfulif diversion would work with the powerfulblocky flows that attain heights of 30 m or more.In the Krafla area of northern Iceland, land hasbeen bulldozed to create barriers to protect a
village and a factory from flowing lava. Duringthe 1955 eruption of Kilauea, Hawaii, a tem-porary barrier initially diverted the flow fromtwo plantations but later flows took differentpaths and destroyed the property. Such uncer-tainty raises the possibility of legal action if lava is deliberately diverted onto property thatotherwise would have escaped. Several permanentdiversion barriers have been proposed to protectHilo, Hawaii. If constructed, the walls would be10 m high and the channels would accommodatea flow about 1 km wide.
• Water sprays were first employed to control lavaflows during the 1960 eruption of Kilauea,Hawaii, in an experiment by the local fire chief.They were used on a larger scale during the 1973 eruption of Eldfell to protect the town of Vestmannaeyjar on the Icelandic island ofHeimaey (Figure 7.4). Special pumps wereshipped to the island so that large quantities of seawater could be taken from the harbour. Atthe height of the operation, the pumping ratewas almost 1 m3 s–1, effectively chilling about60,000 m3 of advancing lava per day. Theexercise lasted for about 150 days but, soon afterspraying started, the lava front congealed into asolid wall 20 m in height. Measurements of lava temperature confirmed that where water had not been applied the lava temperature was500–700°C at a depth 5–8 m below the surface.In the sprayed areas an equivalent temperaturewas not attained until a depth of 12–16 m belowthe lava surface (UNDRO, 1985).
Physical protection against lahars depends on theconstruction of sediment traps and diversion barrierssimilar to those for fluid lavas. Such storages areexpensive and have a limited life span. They can belocated only where lahar paths are well defined anddo not work for major, destructive flows in deepvalleys. Proposals for the large-scale diversion oflahars into wetland areas used for seasonal flood-water storage and fishing in the Philippines haveproved controversial. The most ambitious attemptsto stop lahars at source have been undertaken on

Kelut volcano on the island of Java (see Box 7.2 andFigure 7.5).
A special hazard occurs when high concentrationsof dissolved carbon dioxide, originating in magmaat great depth, enter the bottom of deep, stratifiedlakes via underground springs. Sudden releases ofthe CO2 in a gas cloud from the lake may producedeaths by asphyxiation in the local population butthe threat can be minimised by piping the CO2-richwater to the lake surface where the gas can enter theatmosphere in safe amounts. Controlled degassingof lakes Nyos and Monoun, in Cameroon, began in2001 and 2003 respectively (Kling et al., 2005). Thesuccess of the process depends on the balance
between artificial gas removal and natural rechargerates and, without the installation of more pipes andan increased abstraction rate, hazardous amounts ofgas may remain within the lakes for some time.
Hazard-resistant design
If buildings remain intact during an explosivevolcanic event, they can provide some protection forpeople within. Even after a large eruption, somebuildings beyond 2–3 km of the volcanic vent haveresisted collapse under the pressure of pyroclasticflows (Petrazzuoli and Zuccaro, 2004). Accordingto Spence et al. (2004), the buildings most likely to
THE EXPER IENCE AND REDUCT ION OF HAZARD144
Figure 7.4 Simplified map of the eastern edge of the fishing port of Vestmannaeyjar, Heimaey, Iceland after theeruption of Eldfell volcano in 1973 showing the extent of the new lava field beyond the earlier coastline and the areascooled by the pumping of seawater between March and June 1973. Heat extraction zones are a reminder that gains,as well as losses, result from disasters. After Williams and Moore (1983).
OOrriiggiinnaall ccooaassttlliinneeO
riginal coastline
200m
New lavaand tephraArea cooledby water
Area in use orplanned for heatextraction

TECTONIC HAZARDS: VOLCANOES 145
Kelut volcano, eastern Java, is one of the mostdeadly volcanoes in Indonesia. This is due to laharsproduced by releases from the large crater lakethat, in 1875, was estimated to contain 78 ×106 m3 of water. In the year 1586 about 10,000people’s lives were lost and in 1919 an explosiveeruption threw some 38.5 × 10⁶ m3 of water outof the crater lake and lahars travelled 38 km in lessthan one hour to claim 5,160 lives. To avoid arepetition of this disaster, Dutch engineers made an immediate start on a tunnel nearly 1 kmlong designed to reduce the volume of storedwater from about 65 × 106 m3 to 3 × 10⁶ m3. In1923, with the existing crater already half full (22 × 106 m3) the plan was changed to sevenparallel tunnels that would progressively lower the water level (Fig. 7.5). This work was com-pleted in 1926 and the lake volume was reducedto < 2 × 10⁶ m3.
An eruption in 1951 created no large lahars butit did destroy the tunnel entrances and added tothe water storage capacity by deepening the craterby some 10 m. Even with repair of the originallowest tunnel, the lake soon accumulated a volumeof 40 × 106 m3 and became a serious threat oncemore. The Indonesian government started another
low tunnel but stopped it short of the crater wallin the hope that seepage would help to drain thelake. This did not happen because of the lowpermeability of the volcanic cone. At the time ofthe 1966 eruption, the lake volume was about 23 × 106 m3. Lahars killed hundreds of people anddamaged much agricultural land. After this eventa new tunnel, completed in 1967, was constructed45 m below the level of the lowest existing tunneland the lake volume was reduced to 2.5 × 10⁶ m3.Several sediment dams were also installed. Whenthe 1990 eruption occurred, no primary laharswere recorded, although at least 33 post-eruptionlahars were generated which travelled nearly 25 km from the crater. At the present time thelake is some 33 m deep and the 1.9 × 10⁶ m3
volume represents the lowest risk of primary lahargeneration for many years (see The Free Universityof Brussels website, www.ulb.ac.be/sciences,accessed on 22 July 2003).
A similar, but larger, problem emerged atMount Pinatubo after the 1991 eruption createda 2.5 km wide crater over 100 m deep and capableof holding over 200 × 106 m3 of water. As a result,about 46,000 residents in the town of Botolan, 40 km north-west of the volcano, are at risk from
Box 7.2
CRATER-LAKE LAHARS IN THE WET TROPICS
1923 lake level
1966lake level
lake level todayFloor before 1951
Floor after 1951 eruption
Floor after 1966 eruptionTunnel completed in 1967
Outlet
Figure 7.5 Diagrammaticsection of the tunnel systemconstructed at Kelut volcano,Java, to lower the water level inthe crater lake and reduce thethreat of lahars. After Kelud volcano athttp://www.ulb.ac.be/sciences(accessed 21 July 2003).

survive an eruption are those of recent masonryconstruction, or with reinforced concrete frames, solong as the door and window openings do not failand allow the entry of hot gas and ash. Therefore,where warning times are too short for evacuation,people should be advised to seek limited shelterindoors.
Ashfalls can cause the collapse of un-strengthenedbuildings, especially those with a flat roof. This ismost likely if the ash is wet because, whilst the bulkdensity of dry ash ranges from 0.5 to 0.7 t m–3, thatof wet ash may reach 1.0 t m–3. After the 1991eruption of Mount Pinatubo, ashfalls accumulatedto a depth of 8–10 cm in Angeles City, about 25 kmfrom the volcano, resulting in the collapse of 5–10per cent of the roofs. The only defence against ashfallis to make a detailed inventory of building designand type with a view to retrofitting existing struc-tures and building new ones to higher standardsbefore the next eruption (Pomonis et al., 1993).
ADAPTATION
Community preparedness
As with earthquakes, the cost of monitoringvolcanoes and pre-disaster planning is small com-pared to the potential losses. Given adequate moni-toring, some warning of eruptive phases can often begiven and this places great importance on adaptiveresponses such as public education, access controlsand emergency evacuation procedures (Perry andGodchaux, 2005). Unfortunately, the infrequency ofvolcanic activity induces poor hazard awareness andlow levels of community preparedness. Surveys of
residents on Hawaii (Gregg et al., 2004) andSantorini (Dominey-Howes and Minos-Minopoulos,2004) revealed a relatively poor understanding ofvolcanic hazards and risk and, in the case of the latterisland, no emergency plan existed. All too often,emergency planning for volcanic hazards occurs after,rather than before, a disaster. Before the Nevado delRuiz disaster in Colombia in 1985, there was nonational policy for volcanic hazards (Voight, 1996).Similar policy failures occurred at the Galerasvolcano, Colombia, where hazard mapping wasdelayed due to the unwillingness of the authoritiesto accept either the risk of disaster or the cost ofmitigation (Cardona, 1997).
The elements of volcanic preparedness are shownin Figure 7.6. The length of time available for thealert phase differs widely. In some cases volcanicactivity may start several months before an erup-tion; alternatively only a few hours may be avail-able. For effective evacuation, it is essential that thepopulation at risk is advised well in advance aboutthe evacuation routes and the location of refugepoints. These directions will have to be flexibledepending on the scale of the eruption (which willinfluence the pattern of lava flow) and the winddirection at the time (which will influence thepattern of ashfall). Some local roads may be destroyedby earthquake-induced ground failures and steepsections can become impassable with small depositsof fine ash that make asphalt very slippery.
The successful evacuation of densely populatedareas requires adequate transportation. During the1991 eruption of Mount Pinatubo, the total numberof evacuees extended to over 200,000, about threetimes more people than previously evacuated in a
THE EXPER IENCE AND REDUCT ION OF HAZARD146
a massive lahar together with the people who havereturned to the upper slopes since 1991. ByAugust 2001 the threat of a breach in the craterwall, as a result of increasing water levels in therainy season, persuaded the authorities to dig a‘notch’ in the crater rim to drain water away frompopulated areas. The outfall started operating
in September, accompanied by the short-termevacuation of Botolan as a safety measure. Despitethis attempt at drainage, the lake level continuedto rise. In July 2002, part of the western wall ofthe crater collapsed with the slow release of about160 × 106 m3 of water and sediment. A morepermanent solution will be required.
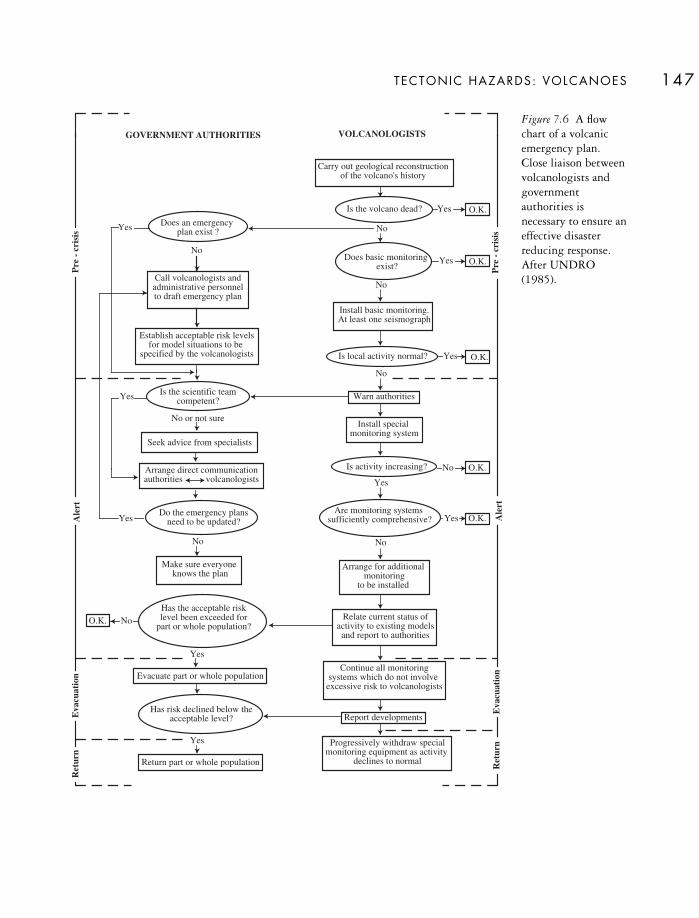
TECTONIC HAZARDS: VOLCANOES 147
No
No
Yes
No
No
No or not sure
No
Yes
Yes
VOLCANOLOGISTSGOVERNMENT AUTHORITIES
Is the volcano dead?
Does basic monitoring exist?
Is local activity normal?
Warn authorities
Install basic monitoring.At least one seismograph
Install special monitoring system
Is activity increasing?
Are monitoring systems sufficiently comprehensive?
Arrange for additional monitoring
to be installed
Relate current status ofactivity to existing models
and report to authorities
Continue all monitoringsystems which do not involve excessive risk to volcanologists
Report developments
Progressively withdraw specialmonitoring equipment as activity
declines to normal
Yes
Yes
No
Yes
O.K.
O.K.
O.K.
Yes
O.K.
O.K.
NoDoes an emergency
plan exist ?
Call volcanologists andadministrative personnelto draft emergency plan
Establish acceptable risk levelsfor model situations to be
specified by the volcanologists
Is the scientific teamcompetent?
Seek advice from specialists
Arrange direct communicationauthorities volcanologists
Do the emergency plansneed to be updated?
Make sure everyone knows the plan
Has the acceptable risklevel been exceeded for
part or whole population?
Evacuate part or whole population
Has risk declined below theacceptable level?
Return part or whole population
Yes
Yes
Yes
NoO.K.
Pre
-cr
isis
Ale
rtE
vacu
atio
nR
etur
n
Ret
urn
Eva
cuat
ion
Ale
rtP
re-
cris
is
Carry out geological reconstructionof the volcano's history
Figure 7.6 A flowchart of a volcanicemergency plan.Close liaison betweenvolcanologists andgovernmentauthorities isnecessary to ensure aneffective disasterreducing response.After UNDRO(1985).

volcanic emergency. For small volcanic islands, andfor coastal communities, off-shore evacuation maybe necessary, as in the case of Montserrat (Box 7.1).Evacuees need support services. These includemedical treatment (especially for dust-aggravatedrespiratory problems and burns), shelter, food andhygiene. Because volcanic emergencies can last formonths, the ‘temporary’ arrangements planned for refugees may have to function from one crop season to another. For example, a total of 26,000people were evacuated in 1999 from the slopes ofTungurahua (Ecuador) because of the possibility ofan eruption; some remained in special accom-modation for over one year (Tobin and Whiteford,2002). Such prolonged relocation is never popular.During the Tungurahua emergency, the evacuatedpopulation of Baños, a town heavily reliant ontourist revenue, organised a return to their homeswhile the town remained under an evacuation orderso that they could regain their livelihods (Lane et al.,2003). Another feature of volcanic eruptions is thatashfall has the potential to disrupt communitiesseveral hundreds of kilometres away. Hazard miti-gation specialists have a difficult task persuadingthese people that they face a risk.
Increasing efforts have been made to encouragelocal populations to prepare for volcanic disasters.Evidence from the western USA suggests that,whilst residents do respond to such threats, there islittle prioritisation of the adjustments (Perry andLindell, 1990). In the Philippines, people at risk areoffered training in the recognition of precursorysigns of possible volcanic activity, such as craterglow, steam releases, sulphurous odour and dryingvegetation (Reyes, 1992). In Ecuador about 3million people live within the two main volcanicmountain ranges and are at some degree of risk fromlahars. The principal threat is in the Chillos andLatacunga valleys where an ever-growing populationof some 30,000 has settled on lahar deposits fromthe 1877 eruption (Mothes, 1992). Again, publiceducation programmes, including field trips andevacuation exercises involving simulated eruptionscenarios, help to raise risk awareness.
Forecasting and warning
Most volcanic eruptions are preceded by a variety ofenvironmental changes that accompany the rise ofmagma towards the surface. UNDRO (1985) classi-fied some of the physical and chemical phenomenathat have been observed before eruptions (Table 7.3).Unfortunately, such phenomena are not alwayspresent and highly explosive volcanic eruptions aredifficult to forecast. The most useful monitoringtechniques are seismic and ground deformationmeasurements, although it is now recognised thatlocal rainfall measurements may also be useful(Barclay et al., 2006). Some of the main precursorsof eruption are indicated in Box 7.3. The monitoringof these changes provides the best hope of developingreliable forecasting and warning systems but onlyabout 20 volcanoes worldwide have well-equippedlocal observatories (Scarpa and Gasparini, 1996).This situation has been alleviated by recent advancesin remote sensing, notably the observations made by10 Earth Observing System (EOS) satellites thatmonitor changes in volcanic activity involvingfeatures such as thermal anomalies, plume chemistryand lava composition (Ramsey and Flynn, 2004).
Although there is no fully reliable forecastingscheme for volcanic eruptions, some success has been achieved. At Mt Pinatubo in 1991 about onemillion people, including 20,000 American mili-tary personnel and their dependents, were at riskwithin a 50 km radius of the volcano. Afterintensive on-site monitoring of early steam blastexplosions, a 10 km radius danger zone was declaredand followed by an urgent warning of a majoreruption. Thousands of people were evacuated froma 40 km radius before the eruption on 15 June. Lessthan 300 people died. It was estimated that theforecast and warning saved 5,000–20,000 lives andprevented at least US$250 million of propertydamage. An understanding of lava dome inflationled to the forecasting of a repetitive cycle of erup-tions during 1996–97 at the Soufrière Hills volcanoand most of the residents were safely evacuated (see Box 7.1).
Some Indonesian villages are provided withartificial mounds so that people can quickly climb
THE EXPER IENCE AND REDUCT ION OF HAZARD148

TECTONIC HAZARDS: VOLCANOES 149
Earthquake activity
This is commonplace near volcanoes and, forpredictive purposes, it is important to gauge anyincrease in activity in relation to backgroundlevels. This means that it is essential to have local seismograph records, preferably over manyyears. Immediately prior to an expected eruptionthese records will be supplemented by data fromportable seismometers. A precursive seismic sig-nature has been incorporated into a tentativeearthquake swarm model for the prediction ofvolcanic eruptions (McNutt, 1996). As shown inFigure 7.7, the onset and subsequent peak of a‘swarm’ of high-frequency earthquakes reflects thefracture of local rocks as the magmatic pressureincreases. This phase is followed by a relativelyquiet period, when some of the pressure is relievedby cracks in the earth’s crust, before a final tremorresults in an explosive eruption.
Ground deformation
This is sometimes a reliable sign of an explosiveeruption but the relationships are not easy to fitinto a forecasting model. The method is difficultto employ for explosive subduction volcanoesbecause they erupt so infrequently that it is diffi-cult to obtain sufficient comparative information.In rare cases, such as the 1980 event at Mount St Helens, the deformation was sufficiently largeto be easily visible but it is usually necessary todetect movements with standard survey equip-ment or the use of tiltmeters. These instrumentsare very sensitive but can only record changes in slopes over short distances. The use of electronicdistance measurement (EDM) techniques pro-vides a more accurate picture of relative grounddisplacement, although it is less usually avail-able and requires a series of visible targets on the volcano. Global positioning system (GPS)
Box 7.3
SOME PRECURSORS OF VOLCANIC ERUPTION
Table 7.3 Precursory phenomena that may be observed before a volcanic eruption
Seismic activity• increase in local earthquake activity• audible rumblings
Ground deformation• swelling or uplifting of the volcanic edifice• changes in ground slope near the volcano
Hydrothermal phenomena• increased discharge from hot springs• increased discharge of steam from fumaroles• rise in temperature of hot springs or fumarole steam emissions• rise in temperature of crater lakes• melting of snow or ice on the volcano• withering of vegetation on the slopes of the volcano
Chemical changes• changes in the chemical composition of gas discharges from• surface vents (e.g. increase in SO2 or H2S content)
Source: After UNDRO (1985)

to a safer level while a lahar passes. Over one millionpeople live on the slopes of the Merapi volcano,central Java, and secondary lahars are triggered byrainfall of about 40 mm in 2 h. Lahars are veryrapid-onset, short-duration events, lasting between30 min and 2 h 30 min, and have average velocities
of 5–7 m s1 at elevations of 1000 m (Lavigne et al.,2000). Reliable forecasting of lahars is impossiblebecause of the short lead-time and variations inrainfall intensity during the monsoon season butmonitoring is a necessary step to the better under-standing of these hazards.
THE EXPER IENCE AND REDUCT ION OF HAZARD150
measurements, obtained from satellites, are also able to reveal the surface displacement ofvolcanoes.
Thermal changes
As magma rises to the surface it might be expectedto produce an increase in temperature, althoughmany volcanoes have erupted without any detect-able thermal change and the interpretation of data can be difficult. Where a crater lake exists,thermal changes have proved meaningful.UNDRO (1985) cited the example of the craterlake on Taal volcano, Philippines, which increasedin temperature from a constant 33°C in June 1965to reach 45°C by the end of July. The water levelalso rose during this period and, in Septemberl965, a violent eruption occurred. Such obser-vations can be supplemented by thermal imagingfrom satellites.
Geochemical changes
The composition of the juvenile gases issuing fromvolcanic vents often shows considerable variationover short periods and distances. It is, therefore,difficult to judge how changes in localised gassamples might represent more general conditionsin the volcano. Larger-scale visual observations of steam emissions or ash clouds depend on meteo-rological conditions, as well as volcanic activity,but most plumes can be monitored with the aidof weather satellites (Malingreau and Kasawande,1986; Francis, 1989). Remote sensing has been an important tool for the surveillance of volcanicactivity for over 30 years and much has beenlearned about gas emissions in this way (Goff et al., 2001; Galle et al., 2003).
swarmonset
peakrate
relativequiescence
post-eruption
Eruption(s)
Background Highfrequency
swarm
Lowfrequency
swarm
Tremor Explosionearthquakes,
eruptiontremor
Deephigh
frequencyearthquakes
Types ofSeismicity
heat,regionalstresses
magmapressure,
transmittedstresses
magmaticheat,
fluid-filledcavities
Time
vesiculation,interaction
with groundwater
fragmentation,magma flow
magmawithdrawal,relaxation
DominantProcesses
SeismicRate
Figure 7.7 Schematicdiagram of the stagesof a generic volcanic-earthquake-swarmmodel. The precursorearthquake swarmreflects the fracturingof rocks in response togrowing magmaticpressure. AfterMcNutt (1996).
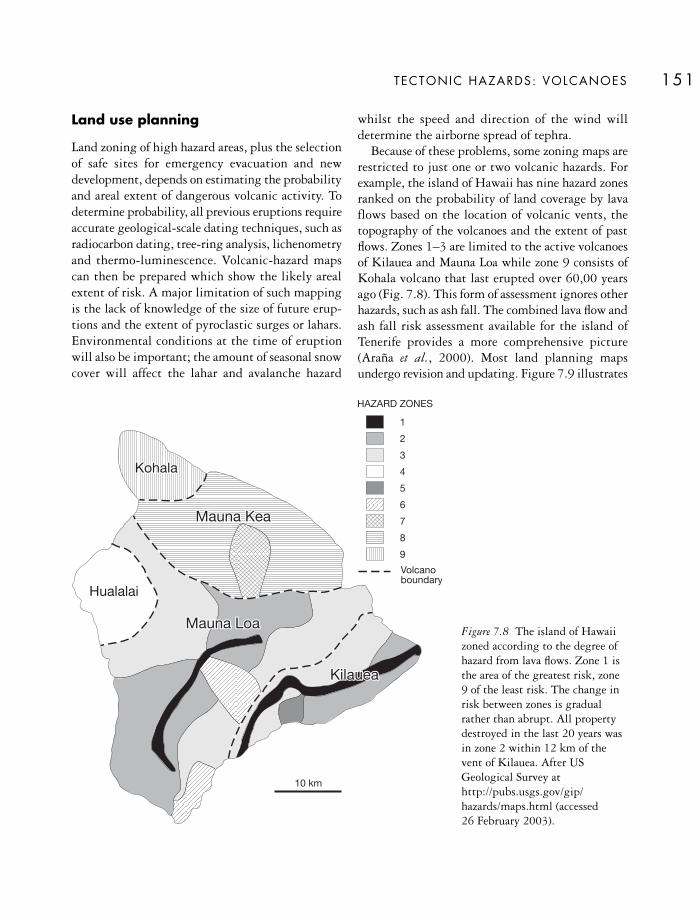
Land use planning
Land zoning of high hazard areas, plus the selectionof safe sites for emergency evacuation and newdevelopment, depends on estimating the probabilityand areal extent of dangerous volcanic activity. Todetermine probability, all previous eruptions requireaccurate geological-scale dating techniques, such asradiocarbon dating, tree-ring analysis, lichenometryand thermo-luminescence. Volcanic-hazard mapscan then be prepared which show the likely arealextent of risk. A major limitation of such mappingis the lack of knowledge of the size of future erup-tions and the extent of pyroclastic surges or lahars.Environmental conditions at the time of eruptionwill also be important; the amount of seasonal snowcover will affect the lahar and avalanche hazard
whilst the speed and direction of the wind willdetermine the airborne spread of tephra.
Because of these problems, some zoning maps arerestricted to just one or two volcanic hazards. Forexample, the island of Hawaii has nine hazard zonesranked on the probability of land coverage by lavaflows based on the location of volcanic vents, thetopography of the volcanoes and the extent of pastflows. Zones 1–3 are limited to the active volcanoesof Kilauea and Mauna Loa while zone 9 consists ofKohala volcano that last erupted over 60,00 yearsago (Fig. 7.8). This form of assessment ignores otherhazards, such as ash fall. The combined lava flow andash fall risk assessment available for the island ofTenerife provides a more comprehensive picture(Araña et al., 2000). Most land planning mapsundergo revision and updating. Figure 7.9 illustrates
TECTONIC HAZARDS: VOLCANOES 151
KohalaKohalaKohala
Mauna KeaMauna KeaMauna Kea
Mauna LoaMauna LoaMauna Loa
HualalaiHualalaiHualalai
KilaueaKilaueaKilauea
Volcanoboundary
1
2
3
4
5
6
7
8
9
10 km
HAZARD ZONES
Figure 7.8 The island of Hawaiizoned according to the degree ofhazard from lava flows. Zone 1 isthe area of the greatest risk, zone9 of the least risk. The change inrisk between zones is gradualrather than abrupt. All propertydestroyed in the last 20 years wasin zone 2 within 12 km of thevent of Kilauea. After USGeological Survey athttp://pubs.usgs.gov/gip/hazards/maps.html (accessed 26 February 2003).

THE EXPER IENCE AND REDUCT ION OF HAZARD152
High
Medium
Low El Tambo
Matituy
Chachagun
La Florida
Sandona
Consaca
Yacuanquer
Galerasvolcanovent
Panamerican
aRoa
d
PASTO
Airport
5 km
Figure 7.9 A map of volcanic hazards at Galeras volcano, Colombia. The high hazard zone is mainly subject topyroclastic flow deposits, the low hazard zone is subject to ash fall deposits. The medium hazard zone is transitionalbetween the two. After Artunduaga et al., (1997). Reprinted from Journal of Volcanology and Geothermal Research 77,A. D. H. Artunduaga et al., Third version of the hazard map of Galeras volcano, Colombia, copyright (1997), withpermission from Elsevier.

the third version of the hazard zones modelled forthe Galeras volcano, Colombia (Artunduaga andJiménez, 1997). The volcanic hazard extends forsome 12 km around the vent based on the assump-tion that future eruptions will come from the activecone; that the geological record of the last 5,000years is reliable and that the data collected from on-site monitoring (1989–1995) are representative.Three zones are identified:
• high hazard zone This is restricted to areas ofpyroclastic flows. Within 1 km of the activecone, there is a 78 per cent probability ofencountering a ballistic fragment between 0.4and 1 m in diameter
• intermediate hazard zone This area could experi-ence pyroclastic flows in the largest eruptionsand there is also a lahar threat
• low hazard zone This area is predicted to receivetephra falls.
It is clear that land planning should attempt torestrict future development of the area between thevolcano and the city of Pasto, with a populationaround 250,000 people, and that preparednessplanning should include the likely effects of ash fallat the airport some 21 km distant.
The value of comprehensive volcanic hazardmapping can be demonstrated with reference to theMount St Helens, USA, eruption of 1980 (Crandellet al., 1979). Figure 7.10A shows that pyroclasticflows were expected to flow down the upper valleysfor up to 15 km with mudflows and floods con-tinuing downstream for many tens of kilometres.Indeed, it was predicted that lahars up to 110 ×106 m3 in volume could reach the local reservoirsand create additional flooding if storage was notreduced in advance of the wave. Tephra depositswere predicted to occur over a 155° sector extendingaway from the volcano from north-northeast tosouth-southeast based on the wind directionexperienced for 80 per cent of the time. Some ashfallwas assumed to reach a distance of 200 km, withinthe range of the town of Yakima. This scenario wasgenerally accurate apart from the magnitude of thelandslides and the severity of the lateral blast (Fig
7.10B). Mudflows, laden with logs and forest debris,were channelled down the valleys and a flood surgeentered the upper Swift reservoir. Since the waterlevel had been lowered previously, the added volumedid not overtop the dam and flooding alongdownstream parts of the Lewis river was avoided. Onthe other hand, noticeable ashfalls occurred as faraway as Nebraska and the Dakotas, while at Yakimathe depth of tephra reached a disruptive 250 mm.
TECTONIC HAZARDS: VOLCANOES 153
DIRECTED BLAST
LongviewKelso
Silver Lake
Riffe Lake
YaleLake
SwiftReservoir
Kalama River
COLUMBIA
RIV
ER
N. Fork Toutle RiverS. ForkToutle River
Co
wl i
t z
R .
Mt StMt StHelensHelensMt StHelens
SSEECCTTOO
RRTTOO
WWAA
RRDD
SSWW
HHIICC
HHWW
IINNDD
BBLLOO
WWSS
MMOO
SSTT
FFRREEQQ
UUEENN
TTLLYYSEC
TOR
TOW
AR
DS
WH
ICH
WIN
DB
LOW
SM
OS
TFR
EQU
ENTLY
Crater of Mount St Helens
Lava and pyroclastic flows
Mudflows and floods
0 10km
LongviewKelso
Silver Lake
Riffe Lake
YaleLake
SwiftReservoir
Kalama River
COLUMBIA
RIV
ER
N. Fork Toutle RiverS. Fork
Toutle River
Co
wl i
t z
R .
Crater of Mount St Helens
Lava and pyroclastic flows
Mudflows and floods
0 10km
Mt StMt StHelensHelensMt StHelens
A
B
Figure 7.10 Volcanic hazards in the area around MountSt Helens, USA. (A) as mapped before the 1980eruption; (B) modifications after the 18 May eruptionsshowing, in particular, the area potentially at risk fromfuture directed (lateral) blasts. After Crandell et al.(1979) and Miller et al. (1981).

KEY READING
Chester, D. (1993) Volcanoes and Society. London:Edward Arnold. A good general account.
Dominey-Howes, D. and Minos-Minopoulos, D.(2004) Perceptions of hazard and risk on Santorini.Journal of Volcanology and Geothermal Research 137:285–310. An illustration of common problems.
Kling, G. W. et al. (2005) Degassing Lakes Nyosand Monoun: defusing certain disaster. Proceedings ofthe National Academy of Sciences of the USA 102:14185–90. An interesting example of a rare type ofvolcanic hazard.
Lane, L. R., Tobin, G. A. and Whiteford, L. M.(2003) Volcanic hazard or economic destitution:hard choices in Baños, Ecuador. EnvironmentalHazards 5: 23–34. Shows practical difficulties forcommunities facing volcanic hazards in the LDCs.
Witham, C. S. (2005) Volcanic disasters andincidents: a new database. Journal of Volcanology andGeothermal Research 148: 191–233. An up-to-dateand comprehensive survey of the hazard worldwide.
WEB L INKS
International Volcanic Health Hazard Networkwww.ivhhn.org
US Volcano Disaster Program and related activitieswww.volcanoes.usgs.gov/
US Disaster Center Volcano Page www.disastercenter.com/volcano
THE EXPER IENCE AND REDUCT ION OF HAZARD154

LANDSLIDE AND AVALANCHE HAZARDS
In many mountainous environments, the mostcommon hazard is that of mass movement. Massmovement is the displacement of surface materialsdown-slope under the force of gravity and it canoccur in almost any environment in which slopes arepresent. These movements vary greatly in size(ranging from a few cubic metres to over 100 cubickilometres) and in speed (ranging from millimetresper year to hundreds of metres per second). They areresponsible for large amounts of damage, with rapidmass movements generally causing the greatest lossof life but slower movements cause most of the long-term costs.
It is convenient to separate mass movementsbased upon the material that forms most of theirmass. Landslides consist mostly of rock and/or soiland snow avalanches are formed predominantly from snow and/or ice. Most mass movements aretriggered by natural processes, such as an earthquake(see Chapter 6); intense and/or prolonged rainfall;or rapid snowmelt. However, some of the mostdamaging landslides occur in materials formed byhumans, such as mining waste, fill or garbage andpeople often play a key role in the causation andtriggering of mass movements.
Until recently, the losses associated with massmovements have probably been greatly under-estimated. This is mainly because most mass move-ments occur in rural or mountainous environmentsand are poorly reported. For example, landslides areoften attributed to flooding. A substantial pro-portion of the losses occurs in numerous smallevents, rather than single big incidents and theprocess is often attributed to the trigger event, suchas an earthquake or a rainstorm, rather than to themass movement itself (Jones, 1992). It is generallyaccepted that the level of risk and the losses asso-ciated with mass movements are increasing withtime, although the reasons for this are somewhatcontroversial.
Global landslide fatality data collected as part ofthe Durham landslide fatality database indicatesthat, in the period between 2002 and 2007,approximately 44,000 people were killed bylandslides (Fig. 8.1). Most of the deaths occured ina small number of geographically distinct areas (Fig.8.2), notably Central America and the Caribbean;mainland China; SE. Asia; and along the southernedge of the Himalayan Arc. These areas are generallycharacterised by hilly or mountainous terrain; highrates of tectonic processes, including uplift and theoccurrence of earthquakes; intense rainfall events,often associated with tropical cyclones, El Niño/La
8
MASS MOVEMENT HAZARDS

Niña events or monsoon weather patterns; andcomparatively large populations of poor people.Other areas susceptible to landslides are typified byparticular socio-economic processes. For examplethe rapid growth of many cities in less developedcountries has forced people to live in unregulatedbarrio settlements located on steep slopes. HongKong demonstrates this process well as it suffered a
major increase in landslide-related fatalities duringthe 1970s, primarily due to the growth of illegalcommunities of immigrants on unstable slopes.Actions by the government to move these peoplefrom these dangerous slopes onto safer terrainquickly reduced the death toll (Malone 2005). Inother countries, the impacts continue to increase.For example, in 1999 landslides at Vargas onVenezuela’s northern coast, resulting from excep-tionally heavy rainfall triggered by La Niña condi-tions, killed up to 30,000 people and createdeconomic damage amounting to US$1.9 billion, 30 per cent of which was to infrastructure(IFRCRCS, 2002). Most of the deaths occurred insettlements that had developed over the previous 30years on debris fans deposited by earlier landslides.
In comparison with LDCs, the death toll frommass movements is low in most MDCs. In Italy –which has the highest fatality rate from slopefailures in Europe – deaths average 60 per year, ofwhich 48 occur in fast-moving events (Guzzetti,2000). In the MDCs the losses are mostly economic.In the USA, Canada and India the estimated costsof landslides exceed US$1 billion per year (Schuster
THE EXPER IENCE AND REDUCT ION OF HAZARD156
500004500040000350003000025000200001500010000
5000
Sept
2002
Dec2
002
Mar2
003
Jun2
003
Sept
2003
Dec2
003
Mar2
004
Jun2
004
Sept
2004
Dec2
004
Mar2
005
Jun2
005
Sept
2005
Dec2
005
Mar2
006
Jun2
006
Sept
2006
Dec2
006
Mar2
007
Jun2
007
Sep2
007
Dec2
007
Date
Cumu
lative
numb
erof
fatali
ties
0
Figure 8.1 Cumulative total number of fatalities fromlandslides in the period 2002 to 2007, based upon theDurham University landslide database.
Figure 8.2 The location of fatal landslides in 2005, based upon the Durham University landslide database. Notethe clustering in South Asia and around the Asian part of the Pacific Rim.
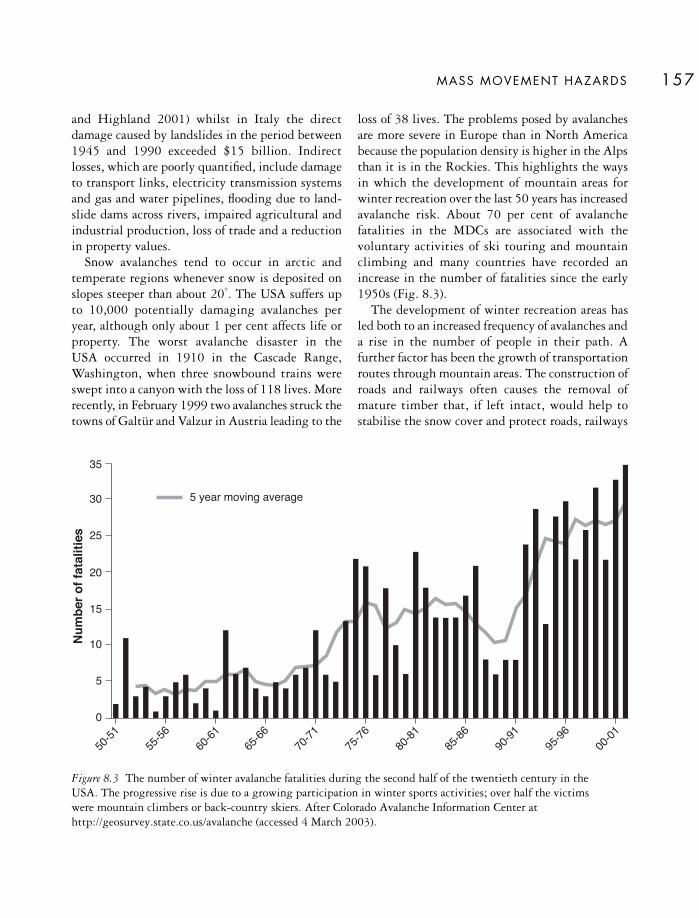
and Highland 2001) whilst in Italy the directdamage caused by landslides in the period between1945 and 1990 exceeded $15 billion. Indirectlosses, which are poorly quantified, include damageto transport links, electricity transmission systemsand gas and water pipelines, flooding due to land-slide dams across rivers, impaired agricultural andindustrial production, loss of trade and a reductionin property values.
Snow avalanches tend to occur in arctic andtemperate regions whenever snow is deposited onslopes steeper than about 20°. The USA suffers upto 10,000 potentially damaging avalanches per year, although only about 1 per cent affects life orproperty. The worst avalanche disaster in the USA occurred in 1910 in the Cascade Range,Washington, when three snowbound trains wereswept into a canyon with the loss of 118 lives. Morerecently, in February 1999 two avalanches struck thetowns of Galtür and Valzur in Austria leading to the
loss of 38 lives. The problems posed by avalanchesare more severe in Europe than in North Americabecause the population density is higher in the Alpsthan it is in the Rockies. This highlights the waysin which the development of mountain areas forwinter recreation over the last 50 years has increasedavalanche risk. About 70 per cent of avalanchefatalities in the MDCs are associated with thevoluntary activities of ski touring and mountainclimbing and many countries have recorded anincrease in the number of fatalities since the early1950s (Fig. 8.3).
The development of winter recreation areas hasled both to an increased frequency of avalanches anda rise in the number of people in their path. Afurther factor has been the growth of transportationroutes through mountain areas. The construction ofroads and railways often causes the removal ofmature timber that, if left intact, would help tostabilise the snow cover and protect roads, railways
MASS MOVEMENT HAZARDS 157
50-51
55-56
60-61
65-66
70-71
75-76
80-81
85-86
90-91
95-96
00-01
35
30
25
20
15
10
5
0
Num
bero
ffat
aliti
es
5 year moving average
Figure 8.3 The number of winter avalanche fatalities during the second half of the twentieth century in the USA. The progressive rise is due to a growing participation in winter sports activities; over half the victims were mountain climbers or back-country skiers. After Colorado Avalanche Information Center athttp://geosurvey.state.co.us/avalanche (accessed 4 March 2003).
and power lines in the valley bottom. For example,the Trans-Canada Highway runs under nearly 100avalanche tracks in a 145 km section near RogersPass and at least one vehicle is under an avalanchepath at any given time. Much less is known aboutavalanche hazards in the mountainous areas of theLDCs, such as the Himalaya, but there is littledoubt that the threats are serious. In the Kaghanvalley, Pakistan, avalanches pose a threat to localresidents over-wintering on the valley floor and 29people were killed in a single event in the winter of1991–92 (de Scally and Gardner, 1994), whilst inDecember 2005 24 people were killed by a singleavalanche in Northwest Frontier Province inPakistan.
LANDSLIDES
The term landslide describes down-slope movementsof soil and/or rock under the influence of gravity.Whilst many landslides do occur through the processof rock or soil sliding on a distinct surface, this is notnecessarily the case, and thus the term can besomething of a misnomer. In fact there is a widevariety of types of movement, including falling,sliding and flowing. The type of movement dependsupon the angle of the slope, the nature of thematerials and the various stresses that act upon them.
Landslides mostly occur in five major types ofterrain (after Jones 1995):
• Upland areas subject to seismic shaking Earthquakes in hilly or mountainous terrain oftentrigger large numbers of landslides. For example,in the 1999 Chi-Chi earthquake in Taiwan over9,200 large landslides were triggered in 35seconds (Hung 2000). In the few years after alarge earthquake further landslides often occur asslope materials have been destabilised by theshaking.
• Mountainous environments with high relative-relief Mountain areas in general are subject to highlevels of rockfalls and landslides due to the steepterrain, deformed rock masses and the occurrence
of orographic rainfall. Particularly notable arerock avalanches. These are enormous rockfalls,with volumes greater than 100 × 106 m3, able totravel very large distances. In New Zealand, forexample, some rock avalanches with volumes inexcess of 100 km3 have travelled more than 15 km. On average, about one massive rockavalanche occurs worldwide each year, generallyin high, tectonically-active mountains such asthe Himalayas, the Rockies or the Andes.
• Areas of moderate relief suffering severe landdegradation The actions of humans in the degradation of landis often the cause of extensive landsliding. Forexample, North Korea suffers a very high level oflandslides as the population has been forced toremove almost all of the forests on the hills toburn as firewood. South Korea, on the otherhand, has the same terrain type but a proactivepolicy of slope management through afforesta-tion has resulted in fewer landslides.
• Areas with high rainfallIntense or prolonged rainfall is the most commontrigger of slope instability and areas subject tovery high rainfall totals are inevitably susceptibleto landslides. This process is especially active inhumid tropical areas where rock weathering canpenetrate tens of metres below the groundsurface. For example, in Malaysia the weatheredmaterial can extend to a depth of 30 m or moreand landslides are common in the very intenserainfall during the passage of a tropical cyclone.Other areas affected by strong monsoonal rain-fall, such as the Indian subcontinent, are alsovulnerable to landslides.
• Areas covered with thick deposits of fine grainedmaterialsFine-grained deposits, such as loess and tephra,are weak and vulnerable to the effects of satura-tion. As a result, they are susceptible to land-sliding. Notable areas at risk include the loessplateaux of Gansu in northern China. In the 1920earthquake, flowslides in the loess triggered bythe earthquake shaking are estimated to havekilled over 100,000 people, the largest landslide
THE EXPER IENCE AND REDUCT ION OF HAZARD158

disaster in recorded history. The areas mantled intephra on and around volcanic sites are similarlyprone to landslides.
Landslides are generally classified according to thematerials involved and the mechanism of move-ment (Table 8.1). The major landslide types are asfollows:
Rockfalls
Rockfalls involve the movement of the materialthrough the air and generally occur on steep rock-faces. The blocks that fall usually detach from thecliff-face along an existing weakness, such as a joint,bedding or exfoliation surface. The rockfall oftenstarts as an initial slip along a joint or bedding planewhich then transitions into falling due to thesteepness of the cliff. The scale of rockfalls variesfrom individual blocks through to rock avalanchesthat are hundreds of millions of cubic metres in size.Whilst the largest rockfalls clearly have the greatestpotential for destruction, an individual block thesize of an egg-cup can kill a person if it hits themon the head.
The triggering of rockfalls is quite complex.Earthquakes can be an important factor because the
seismic waves literally shake blocks off a cliff. Forexample, in the 1999 Chi-Chi earthquake inTaiwan, the road system was severely damaged byrockfall activity in the epicentral zone and greatlyhindered the government response. Rockfalls arealso triggered by the presence of water in joints andfissures which can apply a pressure to loose material.During the winter, the process of freeze-thaw, inwhich water repeatedly freezes in cracks in therockface, is particularly important. Not surpris-ingly, rockfall activity often increases during heavyrain and in periods when the temperature fre-quently transitions through 0°C (e.g. during theSpring season in mountain areas). In some highmountain areas, permanent ice serves to holdfractured blocks on the slope, although recentatmospheric warming has led to some the thawingof the ice with a consequent increase in rockfallactivity (Sass 2005).
In some cases, no landslide trigger is apparent.For example, in May 1999 an unexpected rock falloccurred at Sacred Falls State Park in Oahu, Hawaii.A mass about 50 m3 detached from the walls of asteep gorge and fell some 160 m into the valleybelow, striking a group of hikers. Eight people werekilled but no immediate causal factor was identified(Jibson and Baum, 1999).
MASS MOVEMENT HAZARDS 159
Table 8.1 Classification of landslides
Type of movement Type of material
Bedrock Engineering soils
Mainly coarse Mainly fine
Falls Rock fall Debris fall Earth fallTopples Rock topple Debris topple Earth toppleSlidesRotational Rock slump Debris slump Earth slumpRotational (few units) Rock block slide Debris block slide Earth block slideTranslational Rock slide Debris slide Earth slideLateral spreads Rock spread Debris spread Earth spreadFlows Rock flow (deep creep) Debris flow (soil creep) Earth flow (soil creep)Complex Combination of two or more
principal types of movement
Source: After Varnes (1978)

THE EXPER IENCE AND REDUCT ION OF HAZARD160
Many landslides do, literally, involve the slidingof a mass of soil and or rock. This usually happensalong a slip surface which might form as the slidedevelops or which might result from the activationof an existing weakness, such as a bedding plane,joint or fault. Sometimes the sliding occurs becauseof the deformation of a weak layer within the rockor soil, in which case a shear zone is formed.
In a slope, the forces that try to cause movementof the landslide are called shear forces. They arederived from the force of gravity trying to pull the mass down the slope. There are two main forces that resist the movement of the landslide.These are:
• Cohesion This is the resistance that comes fromthe ‘stickiness’ of particles or from interlocking.So, for instance, sandstone gets some of itsstrength from the cement that glues the particlesof sand together. As a result of this cohesion,sandstone cliffs are often vertical to substantialheights. Beach sand, on the other hand, has nobonds between the particles and rests at a muchlower angle. In a sandcastle, the initial wetnessof the sand generates a suction force between theparticles that holds them together – this is alsoa form of cohesion.
• Friction This arises from the resistance ofparticles to slide across each other. So, in a pileof dry sand the gradient of the slope is sustainedby the friction between the sand grains. Themagnitude of the friction force depends upon theweight of the material above the surface, just asit is more difficult to move a chair with someonesitting in it than it is when it is empty.
Friction and cohesion together provide the resistiveforces that maintain stability in a slope. Movementof the landslide occurs when the shear forces exceedthe resistive forces. Therefore, it is this relationshipbetween the resistive forces and the shear forces thatdetermines whether a landslide will move. Thisrelationship varies continually in most slopes for thefollowing reasons:
1 Weathering Through time, weathering of therock or soil mass can reduce its strength. Inparticular, weathering can attack the bondsbetween the particles that provide cohesion andso weakens the rock or soil. As this occurs theslope becomes progressively less stable.
2 Water When the rock or soil forming the slopehas water in its pore space, the overall weight ofthe slope increases, which slightly increases theshear forces. More importantly, this waterprovides a buoyancy force to the landslide massthat acts to reduce the friction, in much the sameways as a car skids once it starts to aquaplane.Thus, as the slope gets wetter it usually becomesless stable.
3 Increased slope angle In some situations the slopeangle may increase, perhaps due to erosion of thetoe of the slope by a river or through cutting ofthe slope by humans. This serves to increase theshear forces.
4 Earthquake shaking During earthquakes, themagnitude of the forces varies as shaking of theslope occurs. This can both increase the shearforces and reduce the resistive forces, therebytriggering failure.
Quite often the surface upon which movementoccurs has a planar form. In this case the landslideis said to be translational. Usually this occurs becausethe landslide has activated an existing plane ofweakness, such as a bedding plane. Commonly,downcutting by a river causes an inclined beddingplane to ‘daylight’, i.e. to be exposed in the riverbank (Fig. 8.4). The block on the slope is then freeto move when the resisting forces become suffi-ciently weak. This is a significant hazard dur-ing road construction in mountain areas, whencutting of the slope to create a bench for the roadoften exposes inclined bedding surfaces or joints(Plate 8.1).
Translational landslides are often rapid. Oncesliding starts, the materials in the shear zone loseboth their cohesion as interparticle bonds are brokenand a proportion of their frictional strength as theshear surface becomes smooth and sometimes even

polished. This allows the landslide to acceleraterapidly, sometimes reaching very high speeds.
However, in many cases, the sliding occurs on asurface that has a curved form. This is called arotational landslide (Fig. 8.5). This type of landslideis most commonly seen in comparatively homo-genous materials, such as clays, and in horizontallybedded rock masses. The mobile block rotates asmovement occurs, leading to a characteristic set oflandforms (Fig. 8.5). These landslides tend to be lessrapid than translational slides, even though the sameprocesses of loss of cohesion and friction occur. Thisis because, so long as the block stays intact, thegeometry of the movement usually prevents rapid
MASS MOVEMENT HAZARDS 161
Line of weakness
Block will slidewhen the riverexposes the ofweakness
Downcutting
River
Block will slidewhen the river
exposes theline of
weakness
Figure 8.4 Down-cutting by rivers, construction or insome cases even by glaciers can cause landslides byexposing a weak layer that then allows sliding to occur.
Plate 8.1 A landslide on a road in central Taiwan caused by erosion exposing a plane of weakness in the rock mass.Note that the road has been protected using an avalanche shed, but the whole road has subsequently beendestroyed by a debris flow induced by a typhoon.

acceleration. In some cases, especially where thelandslide is formed of weak materials, such asstrongly weathered bedrock, the mobile blockbreaks up to form a flow. This commonly occursduring very intense rainfall as in New Zealandwhere it has left a landscape covered in a pattern ofscars and depositional features (Plate 8.2).
Generally speaking, intact rotational landslidestend to cause substantial amounts of propertydamage but few fatalities. About 400 houses in thetown of Ventnor on the Isle of Wight in SouthernEngland, are built on a huge, active rotationallandslide. Fortunately the rate of movement is low,meaning that the probability of loss of life isnegligible even though the estimated annual cost ofdamage caused by ground movement exceeds £2million.
Flows
Flows are movements of fluidised soil and rockfragments acting as a viscous mass. They occur whenloose materials become saturated and start to behaveas a fluid rather than a solid. Flows most commonlyoccur in very heavy rain but, in most cases, the flowactually starts as a different type of landslide. Forexample, in tropical environments, the heavy preci-
pitation associated with the passage of tropicalcyclones, when rainfall totals often exceed 600 mmday–1 and intensities can reach 100 mm h-1
(Thomas, 1994), can trigger large numbers of small,shallow translational landslides in the soil thatmantles the hillslopes. In some cases, the initialmovement of the landslide allows the saturated soilmass to break up, changing the movement into adebris flow. Debris flows often accelerate rapidlydown the slope, disrupting and entraining soil andregolith as they go. In this way, landslides of just afew cubic metres can turn into debris flows with avolume of tens of thousands of m3 and cause highlevels of loss.
Debris flows follow existing stream channels.Consequently, the areas that are likely to be affectedcan be quite predictable. However, steep rockgullies provide little resistance to the movement ofthe flow and allow the mass to reach high rates of movement. Problems can arise when the flowreaches the foot of the slope where the flow starts tospread out. When this occurs in inhabited areas, theamount of damage can be relatively large becausethe density of a debris flow is greater than that of aflood (typically 1.5 to 2.0 as high) and the rate ofmovement is very rapid. As a result, debris flowsclaim the majority of lives lost in landslides.
THE EXPER IENCE AND REDUCT ION OF HAZARD162
or ig inal surfacemainshear plane
crown cracks
main scarp
minor scarsslipped material
secondary shear planes
buried surface
Figure 8.5 Thecharacteristic shape of arotational landslide.Surface changes, such asthe prior opening ofcrown cracks, can oftenbe used as warning signsand permit evacuationto take place.

Many tropical cities, such as Rio de Janeiro andHong Kong, are at risk from both landslides anddebris flows. Jones (1973) documented the effects of exceptionally heavy rainfall, often linked tostationary cold fronts, around Rio de Janeiro, Brazil.In 1966, landslides produced over 300,000 m3 ofdebris in the streets of Rio and more than 1,000people died when many slopes, over-steepened forbuilding construction, failed. One year later, furtherstorms hit Brazil and mudflows caused a further1,700 deaths and some disruption of the powersupply for Rio. In February 1988 further debrisflows claimed at least 200 lives and made 20,000people homeless (Smith and de Sanchez, 1992).
Most of the victims in this area live in unplannedsquatter settlements on deforested hillsides (Smythand Royle, 2000). Rural environments are notimmune to the effects of debris flows. For example,most of the 30,000 fatalities in the 1999 Venezuelalandslides occurred as a result of debris flows thatflowed down the river valleys.
CAUSES OF LANDSLIDES
Landslide scientists frequently differentiate betweenthe causes of landslides, which are the factors thathave served to render a slope susceptible to
MASS MOVEMENT HAZARDS 163
Plate 8.2 The rolling landscape of North Island in New Zealand. The landscape here is a combination of oldlandslide scars, which form scoops in the hillside, and active shallow failures. The level of landslide activity in thisenvironment has increased as a result of deforestation for sheep grazing.

THE EXPER IENCE AND REDUCT ION OF HAZARD164
landsliding, and the triggers of a landslide, which isthe final event that initiated failure. Causes andtriggers both serve to either decrease the strength ofthe slope materials or to increase the shear forces.Common causes of landslides are as follows:
• Weathering of the slope materials may serve toreduce their strength through time until they areno longer strong enough to support the slopeduring periods of high pore water pressure.Weathering often occurs as a front that movesdown through the rock or soil from the surface,but it can also occur preferentially along jointsand fractures in the slope or even deep in the slopedue to the circulation of hydrothermal fluids.
• An increase in slope angle and removal of lateralsupport. Landslides in terrain that is unaffected byhumans are often caused by river erosion at theslope toe. This increases the angle of the slope anddecreases the level of support to the upper layers.Of course, humans can also have the same effectby cutting a slope or by causing increased toeerosion. For example, Jones et al. (1989) describedhow the cutting of a road into the base of a slope in Turkey left 25 m high faces in colluviumthat were standing at an angle of 55° but weresupported only by a 3 m high masonry wall.Eventual collapse of this slope led to the 1988Catak landslide disaster in which 66 people died.
• Head loading is a common cause of human-induced slope failures. This occurs when addi-tional weight is placed on a slope, often throughthe dumping of waste or the emplacement of fillfor house or road construction. This serves toincrease the forces driving the landslides, and insome cases can also increase the slope angle. Headloading can also occur naturally, for instancewhen a small slope failure flows onto materialfurther downslope, thereby increasing its weightand rendering it more likely to fail.
• Changes to the water table can serve to destablise aslope. Sometimes climate variability might serveto increase the level of the water table, renderinga slope more vulnerable to intense rainfall events.Human activity also serves this role. For exam-
ple, in the case of the Vaiont landslide (see Box8.1), the increasing water table as the lake wasfilled destabilised the slope and, eventually,induced failure. Leaking water pipes are aproblem, typically when small movements of aslope crack drains, water supply pipes or sewers.Leaking swimming pools may also channel waterinto a slope, destabilising it further.
• Removal of vegetation either from wildfires orthrough human activities like logging, over-grazing or construction. Trees are particularlygood at preventing landslides, partly because ofthe additional strength provided by the roots and partly because of the role that they play incontrolling water on the slope. Deforestationoften leads to a clear increase in landslide activity,although this is generally delayed for a few yearsafter logging when the roots continue to providestrength. But, as the roots rot, this strength islost and the slope becomes less stable.
In many instances, landslides can be attributed to arange of causes. For example, the 1979 Abbotsfordlandslide in New Zealand, which destroyed 69houses across an area of 18 ha, was attributed to acombination of weak bedrock geology, the removalof slope support at the toe by excavation forbuilding, the introduction of additional water to thesite and the extensive removal of natural vegetation(Smith and Salt 1988).
LANDSLIDE TR IGGERS
For the vast majority of landslides, a triggeringevent initiates the final failure. These key triggersare:
• An increase in pore water pressure in the slopematerials to the point at which shear stressexceeds shear resistance. In most cases, this occursbecause of intense and/or persistent rainfall.
• Earthquake shaking. The shaking associated withearthquakes can increase the shear forces andreduce the resisting forces. In some really intense

MASS MOVEMENT HAZARDS 165
The Vaiont disaster represents the worst landslidedisaster in recorded European history. It wastriggered in October 1963 by the filling of areservoir constructed for hydroelectric powergeneration. The landslide, which had a volume ofapproximately 270 million m3, slipped into thereservoir at a velocity of about 30 m sec–1 (approx.110 km h–1), displacing about 30 million m3 ofwater (Fig. 8.6). This swept over the dam andcrashed onto the village below, killing about2,500 people.
Ironically, the dam site managers were aware ofthe landslide and indeed had been monitoring themovement of the slope since 1960. During 1962
and 1963, they were deliberately inducingmovement of the landslide by raising andlowering the lake level with the intention ofcausing the mass to slide slowly into the lake. Ofcourse, this would lead to the blockage of thatsection of the reservoir by the landslide mass butit was believed that the volume of water in theunblocked section would be sufficient to allow thegeneration of electricity. A bypass tunnel wasconstructed on the opposite bank such that, when the reservoir was divided into two sections,the level of the lake could still be controlled.Unfortunately, the catastrophic nature of thelandslide was not anticipated.
Box 8.1
THE VAIONT LANDSLIDE
Pirago
1000m
Udine
Padova
N
10 km
MassalezzaRiver Mesazzo
River
Piave
River
Cas. Frascin
San Martino
DognaBelluno
ITALY
Padova
Codissago
Villanova
Casso
Pirago
Longarone
Roggia
Castello Lavazzo
Erto
Valont
Val diTuara
Ancient Slide
Dam
1000m
Udine
Trieste
Limit of 1960 landslideLimit of 1963 landslideLimit of flood
Figure 8.6 A map showing the area of land that moved in the Vaiont landslide of 1963, and the area inundatedby the flood wave.

earthquakes, such as the 2005 Kashmir event inPakistan and India, the vertical acceleration can exceed 1g. This means that the landslideinstantaneously becomes weightless, reducingfriction on the base to zero. Unsurprisingly, thistriggers slope failures. According to an analysisby Keefer (1984), earthquakes of magnitude 4.0 and greater are able to trigger slope failure,and earthquakes with a magnitude of greaterthan about ML=7.0 are able to generate thou-sands of slope failures in hilly areas.
• Human activity. In some cases, human activity isthe trigger. This is common in quarries whereexcavation and blasting can destabilise a slope tothe point of failure. Human-induced failures arecommon in mountain areas where road construc-tion using slope cutting has taken place. This isa cause of substantial loss of life amongst roadconstruction teams and road users in theHimalayas. For example, in December 2007 inHubei Province, China, a rockfall triggered bythe construction of a tunnel buried a bus, killing33 passengers and two construction workers.
In a small group of cases it is not possible todetermine the final trigger event for a landslide.Investigations of the 1991 Mount Cook landslide inNew Zealand, in which the country’s highestmountain lost some 10 metres from its peak, havefailed to reveal any trigger event (McSaveney 2002).The failure may have occurred as a result of a time-dependent process that we do not yet understand orof a triggering mechanism of which we are unaware.Fortunately such events are rare.
SNOW AVALANCHES
As with slope failures in rock and soil, a snowavalanche occurs when the shear stress exceeds theshear strength of the material, in this case a mass ofsnow located on a slope (Schaerer, 1981). Thestrength of the snowpack is related to its density andtemperature. Compared to other solids, snow layershave the ability to undergo large changes in density.
Thus, a layer deposited with an original density of100 kg m–3 may densify to 400 kg m–3 during thecourse of a winter, largely due to the weight of over-lying snow, pressure melting and the re-crystallisation of the ice. This densification increasesthe strength of the snow. On the other hand, the shear strength decreases as the temperaturewarms towards 0° C. As the temperature risesfurther, such that liquid melt-water is present in thepack, the risk of movement of the snow blanketincreases.
Most snow loading on slopes occurs slowly. Thisgives the snow pack an opportunity to adjust byinternal deformation, because of its plastic nature,without any damaging failure. The most importanttriggers of pack failure tend to be heavy snowfall,rain, thaw or some artificial increase in dynamicloading, such as skiers traversing the surface (Box 8.2). However, the commonly-held perceptionthat avalanches can be triggered by sound waves,such as the noise generated by an overflying aircraft,is a myth. For failure to occur in a hazardous snowpack, the slope must also be sufficiently steep toallow the snow to slide. Avalanche frequency is thusrelated to slope angle, with most events occurringon intermediate slope gradients of between 30–45°.Angles below 20° are generally too low for slidingto occur and most slopes above 60° rarely accumu-late sufficient snow to pose a major hazard. Mostavalanches start at fracture points in the snowblanket where there is high tensile stress, such as abreak of ground slope, at an overhanging cornice orwhere the snow fails to bond to another surface, suchas a rock outcrop.
Three distinct sections of an avalanche track canusually be identified. These are the starting zonewhere the snow initially breaks away, the track orpath followed and the run out zone where the snowdecelerates and stops. Because avalanches tend torecur at the same sites, the threat from future eventscan often be detected from the recognition ofprevious avalanche paths in the landscape. Clues inthe terrain include breaks of slope, eroded channelson the hillsides and damaged vegetation. In heavilyforested mountains avalanche paths can be identified
THE EXPER IENCE AND REDUCT ION OF HAZARD166

MASS MOVEMENT HAZARDS 167
Snow avalanches result from two different types ofsnow pack failure:
• Loose snow avalanches occur in cohesionless snow where inter-granular bonding is veryweak thus producing behaviour rather like drysand (Fig. 8.7A). Failure begins near the snowsurface when a small amount of snow, usuallyless than 1 m3, slips out of place and starts tomove down the slope. The sliding snow spreadsto produce an elongated, inverted V-shapedscar.
• Slab avalanches occur where a strongly cohesivelayer of snow breaks away from a weaker under-lying layer, to leave a sharp fracture line orcrown (Figure 8.7B). Rain or high temperatures,followed by re-freezing, create ice-crusts whichmay provide a source of instability when buriedby subsequent snowfalls. The fracture oftentakes place where the underlying topographyproduces some upward deformation of the snowsurface, leading to high tensile stress, and theassociated surface cracking of the slab layer. Theinitial slab which breaks away may be up to10,000 m2 in area and up to 10 m in thickness.Such large slabs are very dangerous because,when a slab breaks loose, it can bring down 100times the initial volume of snow.
Avalanche motion depends on the type of snowand the terrain. Most avalanches start with agliding motion but then rapidly accelerate onslopes greater than 30°. It is common to recognisethree types of avalanche motion:
• Powder avalanches are the most hazardous andare formed of an aerosol of fine, diffused snowbehaving like a body of dense gas. They flow indeep channels but are not influenced by
obstacles in their path. The speed of a powderavalanche is approximately equal to the pre-vailing wind speed but, being of much greaterdensity than air, the avalanche is more destruc-tive than windstorms. At the leading edge itstypical speed is 20–70 m s–1 and victims oftendie by inhaling snow particles.
Box 8.2
HOW SNOW AVALANCHES START
B
A
New SlabLayer
AvalancheDeposit
Flank TensionCracksin SlabBed Surface
Staunch Wall
WeakLayer
Surface Cracks
Crown
Cohesionless Snow
Starting Point
AvalancheDeposit
Figure 8.7 Two highly characteristic types of snow-slope failure. (A) the loose-snow avalanche; (B) theslab avalanche. Slab avalanches normally create thegreater hazard because of the larger volume of snowreleased.

THE EXPER IENCE AND REDUCT ION OF HAZARD168
by the age and species of trees and by sharp ‘trim-lines’ separating the mature, undisturbed forestfrom the cleared slope. Once the hazard is recog-nised, a wide range of potential adjustments isavailable, some of which are shared with landslidehazard mitigation.
Snow avalanches can exert high external loadingson structures. Using reasonable estimates for speedand density, it can be shown that maximum directimpact pressures should be in the range of 5–50 tm–2, although some pressures have exceeded 100 tm–2 (Perla and Martinelli, 1976). Table 8.2 providesa guide to avalanche impact pressures and theassociated damage to man-made structures. TheGaltür disaster in Austria, which occurred inFebruary 1999, was the worst in the European Alpsfor 30 years. In this event, 31 people were killed andseven modern buildings were demolished in a
winter sports village previously thought to belocated in a low hazard zone. A series of stormsearlier in the winter deposited nearly 4 m of snowin the starting zone, a previously un-recorded depth.By the time the highest level of avalanche warningswas issued, the snow mass in the starting zone hadgrown to approximately 170,000 tonnes. During itstrack down the mountain, at an estimated speed inexcess of 80 m s–1, the avalanche picked up sufficientadditional snow to double the original mass. By thetime it reached the village the leading powder wavewas over 100 m high with sufficient energy to crossthe valley floor and reach the village.
MITIGATION
Disaster aid
Individual mass movement disasters have rarelyattracted subtantial disaster aid due to the limitedscale of the losses. However, in recent years theoccurrence of multiple mass movement events hasbecome more common, with large-scale reliefoperations required in the aftermath of the 1997‘Hurricane Mitch’ disaster in Nicaragua andHonduras, the 1999 Vargas landslide disaster inVenezuela (see Box 8.3), the 2005 Kashmirearthquake (which induced thousands of landslides),the 2006 Leyte landslide disaster in the Philippinesand the 2007 landslide disaster in North Korea. In
• Dry flowing avalanches are formed of dry snowtravelling over steep or irregular terrain withparticles ranging in size from powder grains toblocks of up to 0.2 m diameter. These ava-lanches follow well-defined surface channels,such as gullies, but are not greatly influencedby terrain irregularities. Typical speeds at theleading edge range from l5–60 m s–1 but canreach speeds up to l20 m s–1 whilst descendingthrough free air.
• Wet-flowing avalanches occur mainly in thespring season and are composed of wet snowformed of rounded particles (0.l to severalmetres in diameter) or a mass of sludge. Wetsnow tends to flow in stream channels and iseasily deflected by small terrain irregularities.Flowing wet snow has a high mean density(300–400 kg m–3 compared to 50–l50 kg m–3
for dry flows) and can achieve considerableerosion of its track despite reaching speeds ofonly 5–30 m s–1.
Table 8.2 Relationships between impact pressure andthe potential damage from snow avalanches
Impact pressure Potential damage(tonnes m–2)
0.1 Break windows0.5 Push in doors3.0 Destroy wood-frame houses
10.0 Uproot mature trees100.0 Move reinforced concrete structures
Source: After Perla and Martinelli (1976)

the case of the Leyte landslide, a large rock slopecollapsed onto the town of St Bernard, burying atown of 1,400 people, including 268 pupils in aschool. Rescue teams were dispatched from thePhilippines, Taiwan, the UK and the USA althoughfew, if any, people were actually rescued by them.The government and international agencies havesince provided assistance to help the remainingpeople from the town rebuild in a safe location.
Insurance
The availability of landslide insurance is quitevariable. In many countries, including the UK,private insurance against mass movement hazards is not available because of the risk of high numbersof claims. Unavailability of insurance can discour-age development in hazardous areas but, becauseinformation about landslide hazards is not widelydisseminated, many people are unaware of the risk. In some countries, limited insurance cover isprovided through government schemes. For exam-
ple, in the USA some insurance is provided throughthe National Flood Insurance Program whichrequires areas subject to ‘mudslide’ hazards asso-ciated with river flooding to have insurance beforebeing eligible for federal aid. Unfortunately, tech-nical difficulties in mapping ‘mudslide’ hazard areashave led to limited use of this provision. A moresuccessful example exists in New Zealand where thegovernment-backed Earthquake Commission (EQC)provides limited coverage for houses and land incooperation with private insurers. The EQC paysout for landslide damage to residential property ona regular basis. Interestingly, in the period 2000–07,EQC paid out more to cover damage from landslidesthan it did for earthquakes due to a strong upwardtrend in landslide claims.
Generally speaking, legal liability forms a grow-ing basis for financial recompense after landslidelosses. American jurisprudence recognises civilliability for death, bodily injury and a wide range ofeconomic losses associated with landslides. In mostMDCs, the legal defence of ‘Act of God’ carries
MASS MOVEMENT HAZARDS 169
On 14–16 December 1999, a huge rainstormstruck Vargas state in Venezuela, depositingapproximately 900 mm of rainfall over a three-dayperiod. This triggered vast numbers of landslidesin the hills, which transitioned into a series ofdevastating debris and mud flows which struckurban areas that had developed on alluvial fansbeside the coast. Whilst the true death toll of theselandslides will never be known precisely, the bestestimate is that about 30,000 people lost theirlives and the economic losses were approximately$1.8 billion (Wieczorek et al. 2001). More than8,000 homes were destroyed, displacing up to75,000 people. Over 40 km of coastline wassignificantly changed, In the aftermath of thedisaster, the national government attempted to
evacuate about 130,000 people from the northerncoastal strip (IFRCRCS, 2002). The governmentused its own resources, and an unexpectedopportunity, to attempt a permanent re-locationof people from the coast, where living conditionswere poor and population densities exceeded 200km2, to less crowded parts of the country. ByAugust 2000, some 5,000 families were re-settledin new – if sometimes unfinished – houses, whilst33,000 remained in temporary accommodation.But many evacuees opposed the resettlementprogramme and drifted back to their originallocation. By 2006 the population of the area had reached the pre-disaster level, leaving the area exceptionally vulnerable to a repeat of thedisaster.
Box 8.3
THE VARGAS LANDSLIDES

decreasing credibility because of the comparativelyhigh levels of understanding of landslide processes,and the availability of reliable mitigation for mostlandslides. Recent court judgments have tended to identify developers, and their consultants, asresponsible for damage due to mass movements. Insome areas, local planning agencies have shared theliability because it has been successfully argued thatthe issue of a permit for residential developmentimplied the warranty of safe habitation. The level oflitigation can be very high. For example, legalclaims arising from the landslide-induced failure ofthe Ok Tedi tailings dam in Papua New Guinea in1984 included a law suit of over $1 billion for costsof the damage itself (Griffiths et al. 2004) and $4billion for the costs of the pollution released downthe Fly River. Both cases were settled out of court,showing that litigation is an inadequate substitutefor proper hazard-reduction strategies.
PROTECT ION
Landslides
The design and construction of measures to preventslope failure is a routine task within geotechnicalengineering. For example, within the 1,100 km2
area of Hong Kong, over 57,000 slopes have beenengineered to prevent failure. Similarly, the railwayagency in the UK, Network Rail, has to maintainover 16,000 km of earthworks designed to preventslope failures. Methods of slope protection are welldeveloped and include the following:
• Drainage As slope failures are generally linkedto the presence of high water pressures in a slope, drainage is a key technique for improvingstability. The aim is to either prevent water fromentering a critical area of slope by by installinggravel-filled trench drains around that area or toremove water from within a slope by installinghorizontal drains. In most cases, drainage iseffective but problems often arise through a lackof maintenance. Drains can easily become
blocked with fine particles or even by animalsusing them as burrows. In addition, smallamounts of movement in a slope can cause drainsto become cracked or broken and so leak waterinto a slope at critical locations.
• Regrading In many cases, the landslide threat canbe minimised by reducing the overall slopeangle. This can be achieved by excavating theupper parts of the slope or by placing material atthe toe, an approach often used during roadconstruction in upland areas. In some cases, goodresults can be achieved by removing the naturalslope soil or rock and replacing it with a lightermaterial. Whilst effective, such approaches areoften technically challenging and expensive.
• Supporting structures Piles, buttresses and retain-ing walls are widely used for slopes adjacent tobuildings and transportation routes. For exam-ple, Network Rail has over 7,000 slopes sup-ported by retaining walls. Although effective,this is an expensive and visually intrusive way tostabilise a slope. Increasingly there is a movetowards the use of measures that sit within thesoil or rock rather than on the surface. Examplesinclude soil nails and rock bolts, both of whichseek to increase stability by increasing theresistance to movement. In addition, structurescan be designed to deflect landslides aroundvulnerable facilities. For example, diversion wallsare often constructed around electricity pylons inmountain areas in order to deflect small debrisflows.
• Vegetation Vegetation of slopes performs severalfunctions. Plant roots help to bind soil particlestogether and provide resistance to movement, thevegetation canopy protects the soil surface fromrain splash impact whilst transpiration processesreduce the water content of the slope. In recentyears, a new breed of ‘bioengineers’ has emerged.It is critically important to ensure that the plantspecies used can both maximise the beneficialeffects and thrive in the environment in whichthey are planted. Thus, the preference is to uselocal species of trees and plants. Bioengineeringis also considered to be more environmentally-
THE EXPER IENCE AND REDUCT ION OF HAZARD170
conscious than traditional engineering approachesand to provid better visual aesthetics. In addition,the capital costs of bioengineering are often lowerthan for conventional engineering structures,although the short- and medium-term main-tenance costs are usually higher. Most studieshave found that this type of approach compareswell with traditional methods in terms ofperformance and cost but these techniques areonly applicable for shallow landslides in soil andthe prevention of soil erosion.
• Other methods include the chemical stabilisationof slopes and the use of grouting to reduce soilpermeability and increase its strength. On some construction sites, moving soil has beentemporarily frozen while soil-retaining structureswere completed but this is an expensive option.In many tropical countries, shallow localisedslope failures are covered in plastic sheets toreduce the impacts of rainfall until stabilisationcan be achieved. Such approaches are oftensurprisingly effective.
Whilst engineering approaches to landslide miti-gation remain predominant, a number of other tech-niques are used. Critical amongst these is the use ofplanning legislation to prevent, or to limit, newdevelopment on dangerous slopes. In the USA,planning is managed by the Uniform Building Code.This specifies a maximum slope angle for safedevelopment of 2:1, which approximates to a 27°
angle, as well as minimum standards for soil com-paction and surface drainage. Similarly, in NewZealand, there is a statutory requirement that allnew buildings must first achieve a resource consent,for which slope stability is a major component. Inpractice, this means that all development on slopesis subject to a geotechnical investigation in order toassess the threat from landslides.
The successful operation of such systems dependson the availability of technically trained inspectorsto enforce the regulations. Although this is a majorchallenge in many countries, especially when localcorruption also exists, these schemes can be highlyeffective. For example, the city of Los Angeles
introduced a grading ordinance as early as 1952.Before this date more than 10 per cent of allbuilding lots were damaged by slope failure. Thebenefits have been impressive and losses at newconstruction sites are now estimated at less than twoper cent.
Avalanches
Two main physical techniques are used to provideprotection against the hazard posed by snow packs:artificial release and defence structures.
Artificial release
In most cases, artificial release is accomplishedthrough the use of small explosive charges to triggercontrolled avalanches. This type of technique is used surprisingly often; in the USA about 10,000avalanches are triggered through artificial releaseeach year. The main advantages of artificial releaseare:
• the snow release occurs at pre-determined times,when the downslope areas affected are closed
• measures to allow snow clearance can be put inplace before the avalanche occurs, minimisinginconvenience
• the snow pack can be released safely in severalsmall avalanches rather than allowing the build-up of a major threat.
The use of charges is most effective when they areplaced in the initiation zone or near the centre of apotential slab avalanche when the relationshipbetween stress and strength within the snow packis delicately balanced. These requirements can onlybe met through close liaison with a snow stabilitymonitoring and avalanche forecasting service. Insome cases, dedicated teams are dropped by heli-copter into the initiation zone in order to place thecharges. Needless to say, this is a hazardous taskwith respect to both the handling of explosives andthe possibility of the team triggering the avalanche
MASS MOVEMENT HAZARDS 171

THE EXPER IENCE AND REDUCT ION OF HAZARD172
and then getting caught up in it. Alternatively, it ispossible to use military field guns to fire the explo-sives onto the slope from a safe zone. For example,near Rogers Pass – which funnels both the CanadianPacific rail route and the Trans-Canada highwaythrough the Selkirk Mountains of British Columbia– Parks Canada and the Canadian Armed Forceswork together to trigger avalanches with fieldartillery.
Defence structures
The use of defence structures has become the mostcommon adjustment to avalanches throughout theworld. In Switzerland alone, the total amount spenton avalanche defence structures in the period1950–2000 was approximately €1 billion (Fuchsand McAlpin, 2005). There are four key types ofavalanche defence structure:
• Retention structures are designed to trap and retainsnow on a slope and thus to prevent the initiationof an avalanche or to stop a small avalanche beforeit can develop fully. Above the starting zone, snowfences and snow nets are used to hold snow (Fig.
8.8). On ridges and gentle slopes, large volumesof snow can be intercepted and retained in thisway. In the starting zone snow rakes or arresters areused to provide external support for the snow-pack, thus reducing internal stresses. They mayalso stop small avalanches before they gainmomentum. The earliest structures were massivewalls and terraces made of rocks and earth. Todaythey are made of combinations of wood, steel,aluminium and/or pre-stressed concrete. Whilstsuch structures are effective, they do have anegative impact on the aesthetic beauty of thelandscape. Their use is also less effective in areaswith large seasonal accumulations of snow. In thenorth-west USA, the snowfall may bury thestructures and so limit their use.
• Redistribution structures are designed to preventsnow accumulation by drifting. In particular,they are used to prevent the build-up of cornicesthat often break off steep slopes and initiate anavalanche.
• Deflectors and retarding devices are placed in theavalanche track and run-out zone. They areusually built of earth, rock or concrete and aredesigned to divert flowing snow from its path.
Run outzone
Splittingwedges
Avalanchebreakers(mounds)
Deflectingwalls
Afforestation Winddirection
Snow fences
Trackzone
Snowaccumulation
zone
Startingzone
Snow rakes
Avalancheshed
Figure 8.8 Idealised slopesection showing themethods available foravalanche hazardreduction. Snow retentionis achieved by thestructures in the snowaccumulation and startingzones. Avalanchedeflection away fromvulnerable facilities is thepurpose of structures inthe track and run-outzones.

However, the scope for lateral diversion is limitedand changes of direction no greater than 15–20°
from the original avalanche path have beenproved to be most successful. In addition, wedgespointing upslope can be used to split an ava-lanche and divert the flow around isolatedfacilities like electricity transmission towers orisolated buildings. Towards the run-out zone, onground slopes less than 20°, other retainingstructures – earth mounds and small dams – areuseful to obstruct an avalanche as it loses energy.
• Direct-protection structures such as avalanche shedsand galleries provide the most complete ava-lanche defence. They are designed to allow theflow to pass over key built facilities and avalanchesheds typically act as protective roofs over roadsor railways. They are expensive to construct andneed careful design to ensure that they areproperly located and can bear the maximumsnow loading on the roof.
Some of these techniques for managing theavalanche hazard, mimic the natural protectionoffered by mature forests. Therefore, where possible,it is usually desirable to plant forests on avalanche-prone slopes and avoid the need for unsightly,maintenance-intensive structures. A major difficultyis that existing avalanche tracks offer poor prospectsfor successful tree planting and growth. Erosion byprevious events means that avalanche-prone slopesare often characterised by thin soils with limitedwater retention. Furthermore, young trees can beeasily destroyed by avalanches before they can pro-vide stability to the snow pack. Therefore, expensivesite preparation, coupled with soil fertilisation, isfrequently required and it may also be necessary tostabilise the snow in the starting zone while the treecover establishes itself. Sometimes it can take over75 years before slower growing species have grownto the point where they are strong enough to resistavalanche forces. In some cases, the natural forestmay already have been removed to allow the intro-duction of economic activities, such as skiing, andattempts to re-establish a tree cover may not bewholly welcome.
ADAPTATION
Community preparedness
The need for a local rapid-response search and rescuecapability is crucial for all mass movement hazardsbecause victims die quickly if buried beneath snow,soil or rock. Humans cannot breathe if more thanabout 30 cm of soil is piled on their chest and evenshallow burial is often fatal. In addition, victims ofmass movements are at risk from hypothermia inthe case of avalanches and from drowning in the case of water-rich landslides. Most survivors of mass movements are rescued quickly and oftenbenefited from some physical protection, perhaps bya building or a vehicle.
In many mountain communities, formal arrange-ments are in place for search and rescue in theaftermath of avalanches. For example, in Canada,local offices of Parks Canada regularly observe snowstability and avalanche risk in collaboration with theBritish Columbia Ministry of Highways. Theprovincial government coordinates most local searchand rescue in the Canadian Rockies and the RoyalCanadian Mounted Police have people and dogstrained for avalanche rescue work. Specialisedweather forecasts are available from the AtmosphericEnvironment Service and avalanche awareness ispromoted through bodies like the CanadianAvalanche Centre with technical courses, films andvideos. Although these methods may increase thegeneral knowledge of avalanche threats, Butler(1997) found that local residents were often unawareof the danger at a given time. A full avalanche searchis a complex operation but the increasing use ofavalanche airbags and digital transceivers by wintersports enthusiasts will reduce the chances of burial,and the chances of being found, respectively.
Similar arrangements are rare for landslides.In Hong Kong, the government’s GeotechnicalEngineering Office (GEO) provides a 24-hour perday, year-round service to provide advice on theactions to be taken when landslides occur. Activitiesare coordinated from a dedicated emergency controlstation that is manned when landslide warnings
MASS MOVEMENT HAZARDS 173
THE EXPER IENCE AND REDUCT ION OF HAZARD174
have been issued. Officers from GEO are then onpermanent stand-by to attend the site of landslidesin order to assist in rescue, recovery and manage-ment. This system has proven to be effective butthere are few examples elsewhere.
Forecasting and warning
In recent years, considerable effort has gone into thedevelopment of warning systems for both avalanchesand landslides using the following approaches.
Site specific warnings based upon movement
Most rainfall-induced landslides are preceded by aperiod of slow movement, called creep, and attempts
have been made to use creep in warning schemes. In some cases this has been successful. For example,Hungr et al. (2005) described a dozen occasions in which changes in landslide movement have been successfully used to predict the time of finalfailure. Movement of the slope is monitored withfield instruments such as inclinometers, tilt-meters,theodolites and electronic distance recorders, nowsupplemented by Global Positioning System (GPS)and radar satellite (InSAR) techniques (Box 8.4).Advances in technology now allow movement datato be sent in real-time to a computer, which canthen compare the movement against predeterminedtrigger factors, often based on rate of movement or on acceleration. This system can then issue awarning.
The Tessina landslide is a 3 km long earth flowlocated in the Dolomite mountains of northernItaly (Fig. 8.9). It has been active since 1960 butthe rate of movement, and the volume of materialinvolved, increased in 1992 leading to significantconcern. Given that the village of Funes waslocated on the margin of the landslide, there wasa risk that a substantial movement would causethe landslide to over-run the settlement, creatingcasualties and large economic losses. In response,the Italian government research agency CNT-IRPIdesigned and implemented a landslide warningsystem (Angeli et al., 1994).
The warning system consists of two keyelements:
• In the source area of the landslide, 13 surveyprisms were installed on the landslide. On themargin of the active movement, in stableground, a robotised theodolite was installed,powered by solar cells. Every 30 minutes thisinstrument measures the location of each of the
prisms. The data are then stored on a computer,which also determines the level of movement.Located alongside the prisms are two wireextenometers that also measure the displace-ment of the landslide, again feeding their datato the central computer unit.
• About 100 m above the village, two tiltmeterswere installed approximately 2 m above thelandslide. These consist of 2 m long steel barscontaining a device to measure the angle atwhich the bar is hanging. If a flow were to comedown the slope, the bars would tilt. Theinstruments are designed such that if the bar istilted at more than 20° for over 20 seconds, thecentral computer would be alerted. A back-upechometer located on one of the wires providesan indication of a rapid height change on thesurface of the flow, which might indicate amovement event.
All of the data are sent to a central computer inthe town. This computer analyses the data,
Box 8.4
THE TESSINA LANDSLIDE WARNING SYSTEM

MASS MOVEMENT HAZARDS 175
Site specific avalanche warning systems have beenused in the USA since the 1950s, primarily toprotect transportation corridors. Generally suchsystems detect the movement of an avalanche highon a slope, operating a set of barriers or traffic lightsthat close the road or railway. Movement is detectedusing trip-wires, radar, geophones or wire-mountedtilt meters. Although expensive, they have provento be effective in both North America and Europe(Rice et al., 2002). Figure 8.10 depicts an avalanchemanagement scheme operated along a 14 kmcorridor of Idaho State Highway 21 that crosses 56avalanche tracks. Automatic avalanche detectors,using tilt switches, are suspended from a cablewaynear to the road over the most active avalanchetrack. When these switches exceed a pre-setthreshold, the system can initiate a call by radiotelemetry to alert the highway authority of the
avalanche and can advise road users of the blockageimmediately, either by activating flashing warningsigns or by closing snow gates at each end of thecorridor.
General warnings based on weather conditions
An alternative approach to the provision of warningsfor mass movements is to use the weather conditionsthat might trigger the failure event. For landslides,this is usually based upon observations of the rainfallconditions at which landslide initiation occursacross the area in question. Rainfall and landsliderecords are used to identify the rainfall level atwhich landslides have started to occur in the past.For example, in 1986 the United States GeologicalSurvey developed a landslide warning system for the
comparing it with pre-set thresholds. If thesethresholds are exceeded, an alarm is sounded in thestation of the local fire department. The fire-fighters have access to three video cameras situatedat key locations, providing an opportunity toverify visually the indicated movements.
1100m
1200m
1000m
900m
800m
700m
Monitoring base-station
Echo-sounders
1100m
1200m
1000m
900m
800m
700mTarcogna
Lamosano
Funes
N
2500 km
Eroding zoneMonitoring points
Accumulation zone
Settlement
Figure 8.9 A map showing the form of the Tessinalandslide in the Dolomites of Northern Italy. Thewarning system has successfully protected the townof Funes for over a decade.
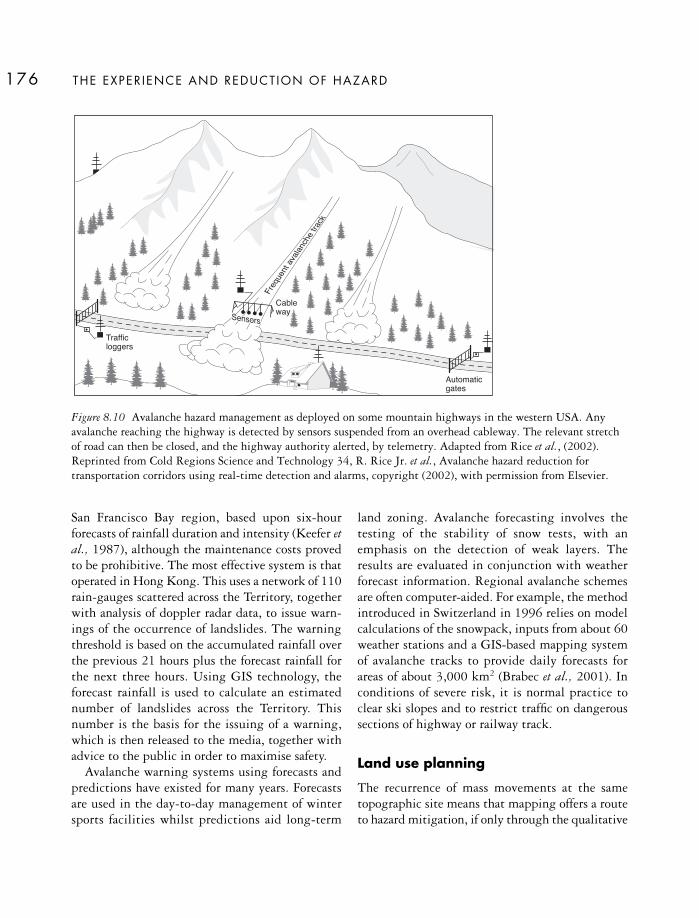
San Francisco Bay region, based upon six-hourforecasts of rainfall duration and intensity (Keefer etal., 1987), although the maintenance costs provedto be prohibitive. The most effective system is thatoperated in Hong Kong. This uses a network of 110rain-gauges scattered across the Territory, togetherwith analysis of doppler radar data, to issue warn-ings of the occurrence of landslides. The warningthreshold is based on the accumulated rainfall overthe previous 21 hours plus the forecast rainfall forthe next three hours. Using GIS technology, theforecast rainfall is used to calculate an estimatednumber of landslides across the Territory. Thisnumber is the basis for the issuing of a warning,which is then released to the media, together withadvice to the public in order to maximise safety.
Avalanche warning systems using forecasts andpredictions have existed for many years. Forecastsare used in the day-to-day management of wintersports facilities whilst predictions aid long-term
land zoning. Avalanche forecasting involves thetesting of the stability of snow tests, with anemphasis on the detection of weak layers. Theresults are evaluated in conjunction with weatherforecast information. Regional avalanche schemesare often computer-aided. For example, the methodintroduced in Switzerland in 1996 relies on modelcalculations of the snowpack, inputs from about 60weather stations and a GIS-based mapping systemof avalanche tracks to provide daily forecasts forareas of about 3,000 km2 (Brabec et al., 2001). Inconditions of severe risk, it is normal practice toclear ski slopes and to restrict traffic on dangeroussections of highway or railway track.
Land use planning
The recurrence of mass movements at the sametopographic site means that mapping offers a routeto hazard mitigation, if only through the qualitative
THE EXPER IENCE AND REDUCT ION OF HAZARD176
Trafficloggers
Automaticgates
Frequ
ent a
valan
che tra
ckSensorsSensorsSensors
Cableway
Figure 8.10 Avalanche hazard management as deployed on some mountain highways in the western USA. Anyavalanche reaching the highway is detected by sensors suspended from an overhead cableway. The relevant stretchof road can then be closed, and the highway authority alerted, by telemetry. Adapted from Rice et al., (2002).Reprinted from Cold Regions Science and Technology 34, R. Rice Jr. et al., Avalanche hazard reduction fortransportation corridors using real-time detection and alarms, copyright (2002), with permission from Elsevier.

MASS MOVEMENT HAZARDS 177
recognition, and avoidance, of susceptible sites(Parise, 2001). Remote sensing has been used formany years to produce preliminary maps of bothlandslide and avalanche tracks (Sauchyn and Trench,1978; Singhroy, 1995), although difficulties remainwith the use of several space-borne sensors for hazardmapping in steep mountain areas (Buchroithner,1995). Reconnaissance information can be followedup with low-level air photography. Vertical aerialphotographs at scales of 1:20,000 to 1:30,000 areoften suitable, especially if taken when tree foliageand other vegetation cover is at a minimum. Forexample, many avalanche tracks also function aslandslide gullies during the spring and summer.The recognition, and mapping, of less frequenthazards is not such a routine matter. One suchhazard is the break-off of large ice masses from over-hanging glaciers, which then fall onto the startingzones for snow avalanches, but surveys after theevent can be used to compile hazard maps and safetyplans (Margreth and Funk, 1999).
The pressure for building land on the edge ofmany cities has increasingly meant that the appli-cation of development restrictions based uponsimple criteria, such as slope angle alone, isunreasonable. There is pressure to develop moresophisticated land-use planning approaches basedupon the assessment of susceptibility and hazard.Over the last ten years, there have been manyattempts to develop such landslide hazard and riskschemes. Two basic approaches are employed:
1 Geological techniques In general, this approachinvolves creating a map of the past landslides ina study area. Information is also collected onfactors that might be important in the causationof landslides, such as rock types, slope angle, the presence or absence of vegetation, and therainfall distribution. Attempts are then made,often using GIS, to correlate the location of the landslides with the possible causal factors.However, such approaches have had mixedsuccess, often because they over-estimate the arealikely to be affected by slope failure (van Asch et al. 2007).
2 Geotechnical techniques This methodology attemptsto use mathematical slope stability equations todetermine the likelihood of slope failure. In recentyears, it has been increasingly common to attemptto do this using GIS (Petley et al. 2005). Thesetechniques require quantitative estimates ofparameters such as the strength of the soil, theangle of the slope and the depth of the watertable. Geological and topographic maps are thenused to determine the spatial distribution of thekey parameters. Unfortunately, general figuresfrom the literature have to be assigned to factorssuch as the soil strength and this is a majorweakness because, in reality, the values of theseparameters may vary considerably.
Despite their faults, such techniques are widely used to provide a framework of general guidancewhen planning new development on potentiallydangerous slopes. Ideally, when an area is identifiedas being medium- or high-hazard, a more detailedgeotechnical investigation should be undertaken toassess the risk and the measures that might beneeded to render the site safe. Some results havebeen impressive. For example, in 1958 the Japanesegovernment enacted the ‘Sabo’ legislation tomitigate landslides and debris flows triggered bytyphoon rainfall. In 1938 nearly 130,000 Japanesehomes were destroyed and more than 500 lives werelost in landslides. In 1976 – the worst year forlandslides in that country for two decades – only2,000 homes were lost and fewer than 125 peopledied. Similar results exist for Hong Kong wherehillside development was not properly regulateduntil the 1970s (Morton, 1998). A comprehensiveslope safety system was introduced in the 1990s andthe rolling average annual fatality rate, whichpeaked at about 20 during the 1970s, has sincedeclined (Fig. 8.11).
However, these systematic approaches to landslidehazard reduction remain the exception rather thanthe rule. A particular problem arises when potentialslope failures are identified in an area that has alreadybeen developed for housing. In such cases, there isoften a demand for mitigation to be undertaken at

the expense of national or local government,although governments tend to fund only emergencyworks. This is because the cost of permanentmitigation is considered to be the responsibility ofhouseholders, even though building insurance rarelycovers landslides. This can lead to substantialproblems for individuals and communities.
As with landslides, the most effective mitigationof avalanche hazards is through the application ofland-use planning based upon the identification ofsite-specific risk. In Switzerland, avalanche zoninglaws were mandated by the Government as early as1951. Typically, the zoning uses historical data onavalanche flows for the initial identification ofhazardous locations. This information is thensupplemented with terrain models and an under-standing of avalanche dynamics to determinedetailed degrees of risk. Where sites are nearexisting settlements, avalanche frequency will be amatter of local knowledge. At more remotelocations, other methods are necessary, for examplethe use of satellite imagery and a digital elevationmodel (Gruber and Haefner, 1995). Sometimes thelong-term pattern of avalanche activity can becompiled from trees that remain standing in thetrack but have been damaged by previous events.The resulting scarring of the tree rings can provide
an accurate means of dating avalanches andproducing reliable frequency estimates over the past200 years or so (Hupp et al., 1987). Where treeshave been destroyed, close inspection of the residualdamaged vegetation, including height and species,can be a useful guide. Table 8.3 shows how thisevidence can be used when initial mapping isundertaken at a scale of about 1:50,000.
THE EXPER IENCE AND REDUCT ION OF HAZARD178
0 0
5
10
15
20
25
20
40
6019
4819
5019
5219
5419
5619
5819
6019
6219
6419
6619
6819
7019
7219
7419
7619
7819
8019
8219
8419
8619
8819
9019
9219
9419
96
80
100
120
140
160
NUM
BER
OFLA
NDSL
IPFA
TALI
TIES
PER
YEAR
PAST
15-Y
EAR
ROLL
ING
AVER
AGE
NUM
BER
OFLA
NDSL
IPFA
TALI
TIES
PER
YEAR
Year
Figure 8.11 Theevolution of landsliderisk in Hong Kong.From Morton (1998).
Table 8.3 Vegetation characteristics in avalanchetracks as a rough indicator of avalanche frequency
Minimum Vegetation cluesfrequency (years)
1–2 Bare patches, willows and shrubs;no trees higher than 1–2 m; brokentimber
2–10 Few trees higher than 1–2 m;immature trees or pioneer species;broken timber
10–25 Mainly pioneer species; youngtrees of local climax species;increment core data
25–100 Mature trees of pioneer species;young trees of local climax species;increment core data
>100 Increment core data needed
Source: After Perla and Martinelli (1976)

In British Columbia snow avalanche atlases arepublished primarily as operational guides for high-way maintenance personnel. The maps are accom-panied with a detailed description of the terrain andvegetation for each avalanche site, together with an assessment of the hazard impact. Where ava-lanches threaten settlements, larger-scale maps(from 1:25,000 to 1:5,000) are needed. Two impor-tant parameters are always difficult to determine inavalanche hazard studies. These are the length of therun-out zone, which determines whether or not aparticular site will be reached by moving snow, andthe impact pressure at any given point, whichdetermines the likely level of damage. These issuesare being addressed using computer modelling ofthe dynamics of a potential avalanche. Whilst suchapproaches have become increasingly sophisticatedin recent years, the degree of precision required forthe model to be reliable is greater than that whichis currently available (Brabolini and Savi, 2001).However, as the scale resolution of terrain data andthe capabilities of modelling improve, such tech-niques will inevitably increase in importance,improving the reliability of hazard assessmentschemes.
The resulting avalanche hazard maps found inmost countries normally adopt a three-zone, colour-coded system (Table 8.4). Such schemes should beupdated when necessary. For example, following the1999 avalanche disaster at Galtür, Austria, theexclusion zone for buildings, previously drawn upfor a 1 in 150 year event, was extended and revisedregulations required all new buildings to be rein-forced against specified avalanche pressures. Inaddition, snow rakes were installed for the first timein the starting zone and an avalanche dam wasconstructed across part of the run-out zone on thevalley floor.
KEY READING
Smyth, C. G. (2000) Urban landslide hazards:incidence and causative factors in Niterói, Rio deJaneiro State, Brazil. Applied Geography 20: 95–117.
Hewitt, K. (1992) Mountain hazards. Geojournal 27:47–60.
Rice, R. Jr., Decker, R., Jensen, N., Patterson, R.,Singer, S., Sullivan, C. and Wells, L. (2002)
MASS MOVEMENT HAZARDS 179
Table 8.4 The Swiss avalanche zoning system
High-hazard (red) zone• Any avalanche with a return interval <30 years• Avalanches with impact pressures of 3 tm–2 or more and with a return interval up to 300 years• No buildings or winter parking lots allowed• Special bunkers needed for equipment
Moderate-hazard (blue) zone• Avalanches with impact pressures <3 tm–2 and with return intervals of 30–300 years• Public buildings that encourage gatherings of people should not be erected• Private houses may be erected if they are strengthened to withstand impact forces• The area may be closed during periods of hazard
Low-hazard (yellow) zone• Powder avalanches with impact pressures 0.3 tm–2 or less with return intervals >30 years• Extremely rare flowing avalanches with return periods >300 years
No-hazard (white) zone• Very rarely may be affected by small air blast pressures up to 0.1 tm–2
• No building restrictions
Source: After Perla and Martinelli (1976)

Avalanche hazard reduction for transportationcorridors using real-time detection and alarms. ColdRegions Science and Technology 34: 31–42.
WEB L INKS
Dave’s Landslide Blog http://daveslandslideblog.blogspot.com/
The International Consortium on Landslides http://www.iclhq.org/
The Durham University International LandslideCentre http://www.landslidecentre.org/
The United States Geological Survey landslideshazard programme http://landslides.usgs.gov/
Current avalanche information from around theworld, generated by the United States ForestryService http://www.avalanche.org/
A consortium of avalanche hazard managementorganisations in Canada http://www.avalanche.ca/
The Swiss Federal Institute for Snow and AvalancheResearch http://www.slf.ch/welcome-en.html
THE EXPER IENCE AND REDUCT ION OF HAZARD180

ATMOSPHERIC HAZARDS
Most environmental hazards are atmospheric inorigin. Only a portion of the world’s populationlives near active faults or on unstable slopes but allare exposed to weather-related extremes and severestorms account for six of the top ten most expensivedisasters recorded to date (see Table 5.1, p. 82).Some individual weather elements can constitute adirect hazard to human welfare, like physiologicalcold stress or heat stress. But it is usually whenextreme atmospheric conditions combine adversely,or interact with other environmental factors, thatdisasters occur:
• Severe storm disasters are the most common threat.Table 9.1 shows that, although all severe stormshave some features in common, each type has itsown mix of damaging conditions. Synergy isimportant. For example, a blizzard – defined bythe US National Weather Service as snow fallingor blowing in wind speeds over 16 m s1 andcausing visibility less than 44 m for at least 3 h– creates a much greater hazard than that of thesnowfall or wind speed element alone.
• Weather-related disasters occur when atmos-pheric hazards – especially those of a hydro-
meteorological nature – are amplified by otherenvironmental conditions, like topography orhuman vulnerability, to create additional hazards.For example, excessive rainfall can producelandslides and floods; insufficient rainfall canproduce droughts and famines. Approximatelyhalf of all environmental disasters, and over two-thirds of disaster deaths, are weather and climaterelated. The potential effects of climate change on storms and weather-related disasters, areconsidered in Chapter 14.
The complex nature of atmospheric hazards has notalways been appreciated. For example, work byPielke and Klein (2005) demonstrated that theimpacts of tropical cyclones, especially thoserelating to flooding, have been under-estimated inthe official records of US disasters maintained byFEMA. Also some models conventionally used by the insurance industry to estimate storm losseshave been limited to wind speed because mostinsurance claims involve wind damage to propertyand rainfall was viewed very much as a secondaryfactor (Munich Re, 2002b). But, following recenthigh rainfall-related losses, the industry has startedto distinguish between ‘dry’ storms and ‘wet’ stormsand also pay more attention to storm surge.
9
SEVERE STORM HAZARDS

TROPICAL CYCLONE HAZARDS
About 15 per cent of the world’s population is atrisk from tropical cyclones. Many are in the LDCswhere about 100 million people live in coastal zonesat elevations less than 10 m above mean sea level.Tropical cyclones are responsible for most of thedeaths attributed to ‘windstorms’, although most ofthe associated deaths are due to drowning in thestorm surge. One estimate of the global economicloss from such storms was US$10 billion annuallyat 1995 values (Pielke and Pielke, 1997). Like otherhazards, tropical cyclones bring benefits as well aslosses. For example, there is a tendency for tropicalcyclones to end drought in Australia and elsewhere.
The term ‘tropical cyclone’ is used in the IndianOcean, Bay of Bengal and Australian waters, whilstthe same storms are called ‘hurricanes’ in theCaribbean, Gulf of Mexico and the Atlantic Ocean.In the region of greatest frequency, which is thenorth-west Pacific near to the Philippines and Japan,they are known as ‘typhoons’. According to Landsea(2000), in an average year, about 86 tropical storms(winds of at least 18 m s–1), 47 hurricane-force tropicalcyclones (winds of at least 33 m s–1) and 20 intensehurricane-force tropical cyclones (winds of at least 50 ms–1) are recorded worldwide. The greatest hazardexists for three landscape settings.
• Densely populated deltas in the LDCs Bangladeshis the most vulnerable nation with some 20million people exposed to the cyclone hazard,mainly in rural communities along the fertiledelta at the head of the Bay of Bengal. About 10per cent of all tropical cyclones form in the Bay of Bengal and this area averages over fivestorms per year with about three reachinghurricane intensity. The two deadliest storms ofthe twentieth century were recorded here (Table9.2.), partly because there is little rising groundto provide a refuge from the storm surge. InNovember l970 up to 300,000 people died, anddamage of US$75 million occurred, when windspeeds reaching 65 m s–1 created a surge 3–9 min depth. In the absence of an effective warning,and no comprehensive evacuation plan, most ofthe survivors sought refuge in trees. On 29 April1991, in the early pre-monsoon part of the cyc-lone season, the south-east coast of Bangladeshwas again struck by a powerful tropical cyclone.At least 139,000 people were killed by the 6 mhigh storm surge and up to 10 million madehomeless as the poorest houses made of mud,bamboo and straw were washed away. Thegreatest devastation occurred on the many islandsof silt near the head of the Bay. On Sandwipisland, where 300,000 people lived, 80 per centof the houses were destroyed.
THE EXPER IENCE AND REDUCT ION OF HAZARD182
Table 9.1 Severe storms as compound hazards showing major characteristics and impacts
Tropical storms Mid-latitude storms
Tropical cyclones Tornadoes Hailstorms Winter cyclones Snowstorms
Wind Wind Hail Wind SnowRain Pressure drop Wind Rain IceStorm surge and waves Updraughts Lightning Flooding GlazeCoastal erosion Building damage Building damage Landslides WindFlooding Agricultural losses Agricultural losses Coastal erosion BlizzardsLandslides Building damage Transport disruptionSaline intrusion Agricultural losses Building damageBuilding damage Agricultural lossesAgricultural lossesTransport disruption
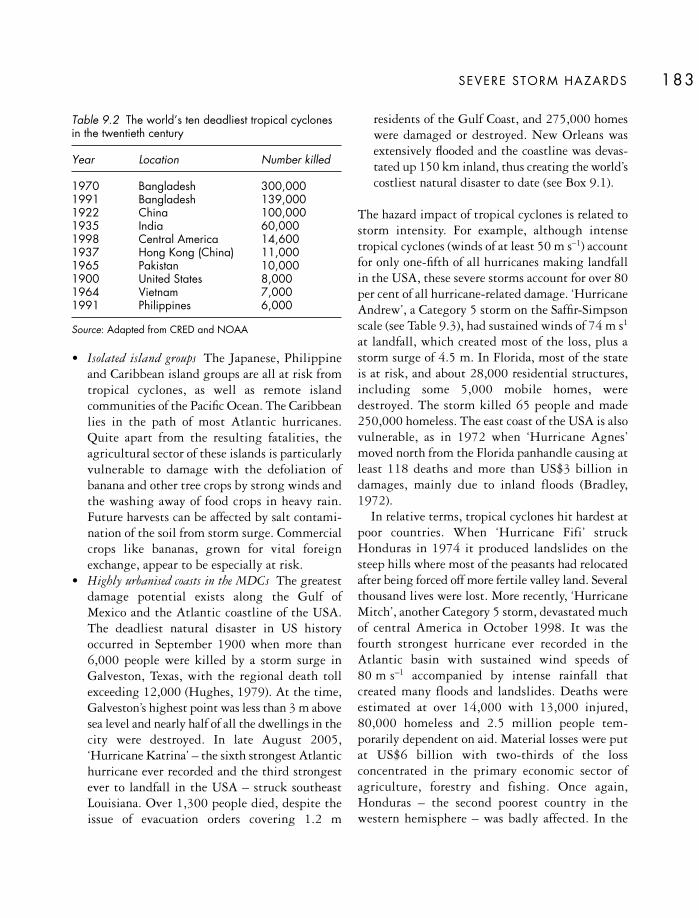
• Isolated island groups The Japanese, Philippineand Caribbean island groups are all at risk fromtropical cyclones, as well as remote islandcommunities of the Pacific Ocean. The Caribbeanlies in the path of most Atlantic hurricanes.Quite apart from the resulting fatalities, theagricultural sector of these islands is particularlyvulnerable to damage with the defoliation ofbanana and other tree crops by strong winds andthe washing away of food crops in heavy rain.Future harvests can be affected by salt contami-nation of the soil from storm surge. Commercialcrops like bananas, grown for vital foreignexchange, appear to be especially at risk.
• Highly urbanised coasts in the MDCs The greatestdamage potential exists along the Gulf of Mexico and the Atlantic coastline of the USA.The deadliest natural disaster in US historyoccurred in September 1900 when more than6,000 people were killed by a storm surge inGalveston, Texas, with the regional death tollexceeding 12,000 (Hughes, 1979). At the time,Galveston’s highest point was less than 3 m abovesea level and nearly half of all the dwellings in thecity were destroyed. In late August 2005,‘Hurricane Katrina’ – the sixth strongest Atlantichurricane ever recorded and the third strongestever to landfall in the USA – struck southeastLouisiana. Over 1,300 people died, despite theissue of evacuation orders covering 1.2 m
residents of the Gulf Coast, and 275,000 homeswere damaged or destroyed. New Orleans wasextensively flooded and the coastline was devas-tated up 150 km inland, thus creating the world’scostliest natural disaster to date (see Box 9.1).
The hazard impact of tropical cyclones is related tostorm intensity. For example, although intensetropical cyclones (winds of at least 50 m s–1) accountfor only one-fifth of all hurricanes making landfallin the USA, these severe storms account for over 80per cent of all hurricane-related damage. ‘HurricaneAndrew’, a Category 5 storm on the Saffir-Simpsonscale (see Table 9.3), had sustained winds of 74 m s1
at landfall, which created most of the loss, plus astorm surge of 4.5 m. In Florida, most of the stateis at risk, and about 28,000 residential structures,including some 5,000 mobile homes, weredestroyed. The storm killed 65 people and made250,000 homeless. The east coast of the USA is alsovulnerable, as in 1972 when ‘Hurricane Agnes’moved north from the Florida panhandle causing atleast 118 deaths and more than US$3 billion indamages, mainly due to inland floods (Bradley,1972).
In relative terms, tropical cyclones hit hardest atpoor countries. When ‘Hurricane Fifi’ struckHonduras in 1974 it produced landslides on thesteep hills where most of the peasants had relocatedafter being forced off more fertile valley land. Severalthousand lives were lost. More recently, ‘HurricaneMitch’, another Category 5 storm, devastated muchof central America in October 1998. It was thefourth strongest hurricane ever recorded in theAtlantic basin with sustained wind speeds of 80 m s–1 accompanied by intense rainfall thatcreated many floods and landslides. Deaths wereestimated at over 14,000 with 13,000 injured,80,000 homeless and 2.5 million people tem-porarily dependent on aid. Material losses were putat US$6 billion with two-thirds of the lossconcentrated in the primary economic sector ofagriculture, forestry and fishing. Once again,Honduras – the second poorest country in thewestern hemisphere – was badly affected. In the
SEVERE STORM HAZARDS 183
Table 9.2 The world’s ten deadliest tropical cyclonesin the twentieth century
Year Location Number killed
1970 Bangladesh 300,0001991 Bangladesh 139,0001922 China 100,0001935 India 60,0001998 Central America 14,6001937 Hong Kong (China) 11,0001965 Pakistan 10,0001900 United States 8,0001964 Vietnam 7,0001991 Philippines 6,000
Source: Adapted from CRED and NOAA

THE EXPER IENCE AND REDUCT ION OF HAZARD184
New Orleans is built on the Mississippi deltabetween Lake Pontchartrain to the north and themain distributary of the river to the south. Lessthan half of the city is above sea level; most of thearea lies on sinking alluvial and peat soils between0.3 and 3.0m below sea level (Waltham, 2005).Rainwater drainage is routinely pumped from low-lying areas into Lake Pontchartrain but thecity relies on the surrounding wetlands and barrierislands, plus a complex system of artificial flood-walls and levees, for protection against hurricanestorm surge. Over many years, these defences have been weakened. Levee construction anddredging have limited sediment supply for deltarenewal, leading to the loss of some 75 km2 ofwetlands each year, and the barrier islands alongthe Louisiana coast are eroding at rates up to 20mper annum. As a result, the entire delta is sub-siding, New Orleans is sinking further below sea level and the natural coastal buffer has beenlargely destroyed. Human vulnerability com-pounded this picture. Before ‘Katrina’ there was a lot of unemployment in the city due to theongoing closure of port functions in the city anda contraction of the local oil industry. About 25 per cent of all families were living in povertyand clear ethnic inequalities existed, making anefficient emergency response unlikely. A disasterwas waiting to happen (Reichhardt et al., 2005;Comfort, 2006).
At 6.10 a.m. local time on 29 August 2005,‘Hurricane Katrina’ made landfall in southeastLouisiana. The floodwalls and levees were designedto withstand a Category 3 hurricane but stand onunconsolidated deposits and, in some cases, dateback to the 1920s and 1930s. The coastal towns ofBiloxi and Gulfport suffered major damage, evento engineered structures, from a storm surge atleast 7.5 m above sea level before the storm swept
inland (Robertson et al., 2006). Driven by strongnortherly winds, the waters of Lake Pontchartrainwere pushed against the flood defences to a heightof 5.2 m above normal creating failures. Floodwater flowed into the northern areas of NewOrleans below sea level and reached depths of1.5–2.0 m over about 80 per cent of the city (Fig.9.1). Slightly higher areas, formed from fossilbeaches and fluvial deposits related to a previouscourse of the Mississippi (Metairie sediments)remained dry. The depth of flooding was directlylinked to land elevation, so the lowest parts of thecity, which were largely residential, suffered most;almost 80 per cent of all direct property damagewas in the residential sector.
About two-thirds of the flooding was due to breaks in the levee system and one-third toovertopping, with rainfall adding to the internalwater levels. Altogether 50 levees were damaged,46 of them due to breaching and overtoppingcaused by a mix of under-seepage, scour erosionbehind the structures and erosion along the top of levees. For example, the Industrial Canal leveewas undermined by seepage through the under-lying silt and sand whilst the 17th Street canalfailure was due to overtopping and collapse.Although the severity of ‘Hurricane Katrina’technically exceeded the design criteria for theNew Orleans flood defences, the system shouldhave performed better than it did (InteragencyPerformance Evaluation Taskforce, 2006).Engineering problems included:
• over-reliance on a series of hurricane designmodels dating back to 1965 and the piecemealdevelopment of the levees giving inconsistentlevels of protection
• failure to take into account varying rates ofground subsidence across the area and a failure
Box 9.1
‘HURRICANE KATRINA’ : LESSONS FOR LEVEES AND FOR L IVES
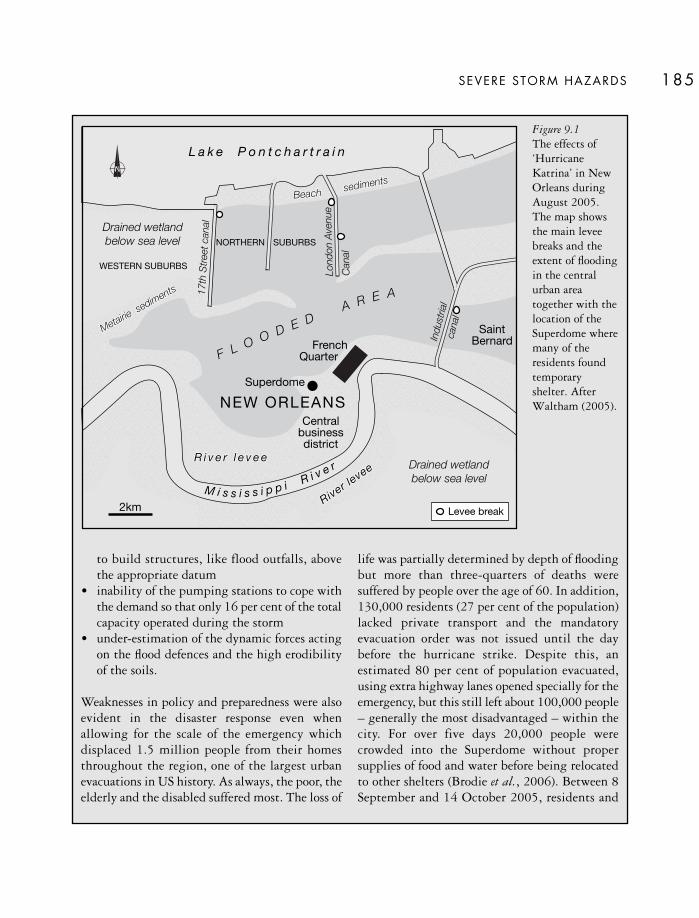
SEVERE STORM HAZARDS 185
to build structures, like flood outfalls, abovethe appropriate datum
• inability of the pumping stations to cope withthe demand so that only 16 per cent of the totalcapacity operated during the storm
• under-estimation of the dynamic forces actingon the flood defences and the high erodibilityof the soils.
Weaknesses in policy and preparedness were alsoevident in the disaster response even whenallowing for the scale of the emergency whichdisplaced 1.5 million people from their homesthroughout the region, one of the largest urbanevacuations in US history. As always, the poor, theelderly and the disabled suffered most. The loss of
life was partially determined by depth of floodingbut more than three-quarters of deaths weresuffered by people over the age of 60. In addition,130,000 residents (27 per cent of the population)lacked private transport and the mandatoryevacuation order was not issued until the daybefore the hurricane strike. Despite this, anestimated 80 per cent of population evacuated,using extra highway lanes opened specially for theemergency, but this still left about 100,000 people– generally the most disadvantaged – within thecity. For over five days 20,000 people werecrowded into the Superdome without propersupplies of food and water before being relocatedto other shelters (Brodie et al., 2006). Between 8September and 14 October 2005, residents and
M i s s i s s i p p i R i v e r
L a k e P o n t c h a r t r a i n
F L O O D E DA R E A
River levee
River levee
R i v e r l e v e eR i v e r l e v e e
River leveeR i v e r l e v e e
Drained wetlandbelow sea level
Drained wetlandbelow sea level
WESTERN SUBURBS
NORTHERN SUBURBS
BeachBeach sedimentssediments
Metairiesediments
Metairie sediments
Beach sediments
Metairiesediments
NEW ORLEANS
FrenchQuarter
Superdome
Centralbusinessdistrict
I ndu
stria
lca
nal
Lond
onA
venu
e
Can
al
1 7th
Str
eet c
anal
SaintBernard
2km Levee break
Figure 9.1The effects of‘HurricaneKatrina’ in NewOrleans duringAugust 2005.The map showsthe main leveebreaks and theextent of floodingin the centralurban areatogether with thelocation of theSuperdome wheremany of theresidents foundtemporaryshelter. AfterWaltham (2005).

mountains 100–150 cm of rain fell within 48 hoursand created over one million landslips andmudflows. About 5,500 Hondurans were killed,many in the capital, Tegucigalpa, which is built ona series of floodplains and hillsides. About 60 percent of all bridges, 25 per cent of schools and 50 percent of the agricultural base, mainly in the cash-cropsector of bananas and coffee, were destroyed. Theeconomic losses reached nearly 60 per cent of theannual GDP (IFRCRCS, 1999).
Human exposure to tropical cyclones is the keyfactor in creating disasters and the hazards ofbuilding near the coast of the USA were highlightedover 40 years ago (Burton and Kates, 1964b). Adecade later it was estimated that six million
Americans lived in areas exposed to hurricane floodsurges that occurred at least once per century. Sincethen the demand for homes located as close aspossible to the shore has led to further develop-ments. In the coastal counties of Florida alone, thepopulation has grown from less than 500,000 in1900 to over 10 million today (Fig. 9.2) and about75 per cent of the American population is con-centrated within 100 km of the coast. 40 per centof these people live in zones where hurricanes havea return interval of 1 in 25 years. Most of thepopulation increase in these ‘Sun Belt’ coasts hasbeen in the over 65 age group, located in mobilehomes or expensive apartments near the water’sedge. Improved forecasting and warning systems
THE EXPER IENCE AND REDUCT ION OF HAZARD186
relief workers sustained over 7,500 non-fatalinjuries (Sullivent et al., 2006), placing a generalstrain on medical services, and there was aparticular lack of preparedness for dealing with themedical needs of children (Dolan and Krug,2006). Emergency shelters were poorly equippedto deal with the needs of evacuees with disabilitiesand other special needs.
‘Hurricane Katrina’ caused severe floodingthroughout New Orleans but existing socio-economic inequalities created greater difficultiesfor some groups during the response and recoveryperiods. Low-income African American home-owners appeared especially vulnerable after thedisaster and were most likely to need new jobswith a living wage and assistance with housing(Elliott and Pais, 2006). The absence of anevacuation plan for people lacking a vehicle, and
for those without money or a place to go, attractedmuch criticism (Renne, 2006 and Litman, 2006).It is now clear that emergency planners must giveattention to the needs of non-drivers, who includemany people with other problems, and that busesshould be made available without charge toevacuate such residents. Whatever the errors anduncertainties associated with ‘Hurricane Katrina’,New Orleans faces even greater challenges as thecity seeks to re-establish itself. Controversy existsover issues ranging from the possible restorationof the Mississippi deltaic plain (Day et al. 2007)to the design standards for new levees and theextent of renewal for the urban system at anestimated cost of US$14 billion. But, perhapsabove all, the need is to create opportunities thatare more equal for all future residents of the city(Olshansky, 2006).
Table 9.3 The Saffir/Simpson hurricane scale
Scale Central pressure (mb) Windspeed (ms–1) Surge (m) Damage
1 >980 33–42 1.2–1.6 Minimal2 965–979 43–49 1.7–2.5 Moderate3 945–964 50–58 2.6–3.8 Extensive4 920–944 59–69 3.9–5.5 Extreme5 <920 >69 >5.5 Catastrophic

have saved many lives but socio-economic factors –population growth, demographic and regional shiftsin location and increasing property values – are themain reason for increased economic losses from mostatmospheric hazards, including tropical cyclones.Much has been made of the trend in the USAtowards rising hurricane-related losses in the latetwentieth century, as shown in Figure 9.3A. But, asshown by Pielke and Landsea (1998), if the data arenormalised for increases in coastal population andexposed wealth, the 1970s and 1980s show smallerdamages than some earlier decades (Fig. 9.3B).
SEVERE STORM HAZARDS 187
1900 1910 1920 1930 1940 1950 1960 1970 1980 1990
12
10
8
6
4
2
0
Year
Po
pul
atio
n(m
illio
ns)
Figure 9.2 The growth in the coastal population ofFlorida 1900–1990. After Pielke and Landsea (1998).
30,000
25,000
20,000
15,000
10,000
5,000
40,000
30,000
20,000
10,000
0
0
1900
1905
1910
1915
1920
1925
1930
1935
1940
1945
1950
1955
1960
1965
1970
1975
1980
1985
1990
1995
1900
1905
1910
1915
1920
1925
1930
1935
1940
1945
1950
1955
1960
1965
1970
1975
1980
1985
1990
1995
Year
Year
Mill
ions
of
1995
US
$M
Illio
nso
f19
95U
S$
$74.4 billion
A
B
Figure 9.3 Annual hurricane damagein the United States: (A) theunadjusted values 1900–95; (B) thenormalised values 1925–95. AfterPielke and Landsea (1998).
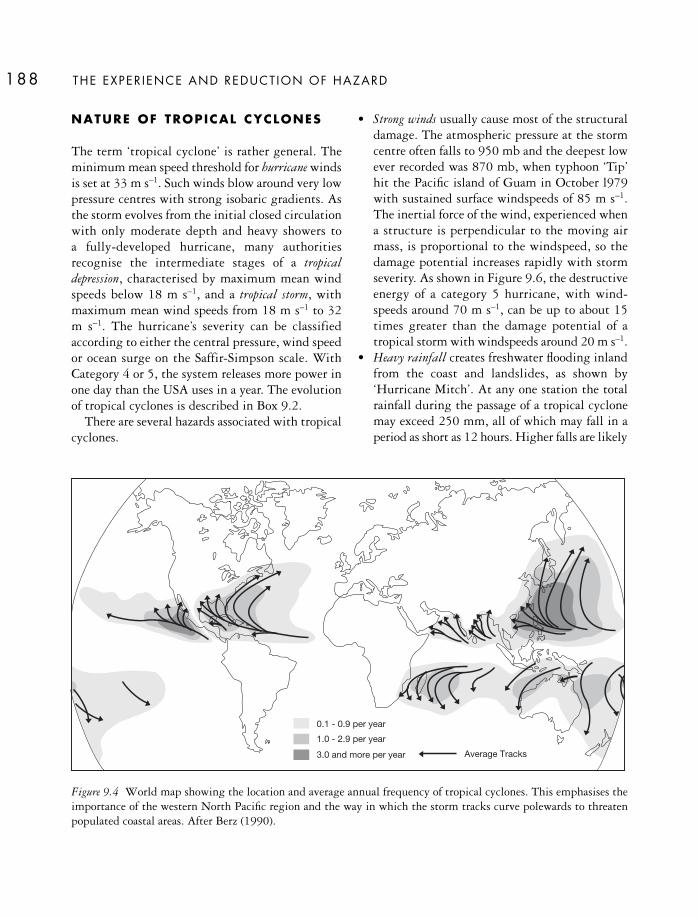
NATURE OF TROPICAL CYCLONES
The term ‘tropical cyclone’ is rather general. Theminimum mean speed threshold for hurricane windsis set at 33 m s–1. Such winds blow around very lowpressure centres with strong isobaric gradients. Asthe storm evolves from the initial closed circulationwith only moderate depth and heavy showers to a fully-developed hurricane, many authoritiesrecognise the intermediate stages of a tropicaldepression, characterised by maximum mean windspeeds below 18 m s–1, and a tropical storm, withmaximum mean wind speeds from 18 m s–1 to 32m s–1. The hurricane’s severity can be classifiedaccording to either the central pressure, wind speedor ocean surge on the Saffir-Simpson scale. WithCategory 4 or 5, the system releases more power inone day than the USA uses in a year. The evolutionof tropical cyclones is described in Box 9.2.
There are several hazards associated with tropicalcyclones.
• Strong winds usually cause most of the structuraldamage. The atmospheric pressure at the stormcentre often falls to 950 mb and the deepest lowever recorded was 870 mb, when typhoon ‘Tip’hit the Pacific island of Guam in October l979with sustained surface windspeeds of 85 m s–1.The inertial force of the wind, experienced whena structure is perpendicular to the moving airmass, is proportional to the windspeed, so thedamage potential increases rapidly with stormseverity. As shown in Figure 9.6, the destructiveenergy of a category 5 hurricane, with wind-speeds around 70 m s–1, can be up to about 15times greater than the damage potential of atropical storm with windspeeds around 20 m s–1.
• Heavy rainfall creates freshwater flooding inlandfrom the coast and landslides, as shown by‘Hurricane Mitch’. At any one station the totalrainfall during the passage of a tropical cyclonemay exceed 250 mm, all of which may fall in aperiod as short as 12 hours. Higher falls are likely
THE EXPER IENCE AND REDUCT ION OF HAZARD188
Figure 9.4 World map showing the location and average annual frequency of tropical cyclones. This emphasises theimportance of the western North Pacific region and the way in which the storm tracks curve polewards to threatenpopulated coastal areas. After Berz (1990).
0.1 - 0.9 per year
1.0 - 2.9 per year
Average Tracks3.0 and more per year

SEVERE STORM HAZARDS 189
if there are mountains near the coast. The mostintense rains have been recorded on La ReunionIsland with a 12-hr fall of 1,144mm and a 24-hrfall of 1,825mm in January 1966.
• Storm surge is often the feature that causes thegreatest loss in the LDCs through deaths bydrowning and salt contamination of agriculturalland. The maximum height of the storm surgedepends on the intensity of the tropical cyclone,its forward speed of movement, the angle ofapproach to the coast, the submarine contours ofthe coast and the phase of the tide. Swell waves
move outward from the storm, perhaps three tofour times faster than the storm itself, and canact as a warning of its approach to coastlinesl,000–l,500 km distant. Wind-driven waves pilewater up along shallow coasts. This happensmost in confined bays, such as the Gulf of Mexicoand the Bay of Bengal, where the total sea-levelrise may exceed 3 m. In addition, there will be afurther increase in sea-level due to the lowatmospheric pressure at a rate of 260 mm forevery 30 mb fall in air pressure. The highest eversurge was probably created by a cyclone in theBathhurst Bay area of Australia in 1899 with anestimated height of 13m.
SEVERE SUMMER STORMS
Tornadoes
A tornado is a narrow, violently rotating, column ofair averaging about 100 m in diameter that extendstowards the ground. Most tornadoes are associatedwith ‘parent’ cumulonimbus clouds and are recog-nised by a funnel-shaped cloud that appears to hangfrom the cloud base above. The greatest hazardexists when the funnel cloud touches the ground andcreates some of the strongest horizontal pressuregradients seen in nature. A scale of tornado inten-sity was devised by Fujita (1973) and is shown inTable 9.4. It is believed that about one-third of alltornadoes exceed F-2 and attain wind speeds greaterthan 50 m s–1. The forward speed of a tornado ismuch lower, perhaps only 5–15 m s–1. Mosttornadoes are of short duration and have a limiteddestructive path, rarely more than 0.5 km wide and25 km long. However, in May 1917 a tornadotravelled about 500 km across the Midwest of theUSA and existed for over seven hours. Tornadoes arehighly localised events, sometimes associated withhail. They form in warm, moist air ahead of a strongcold front when the contrast in air masses produceslatent heating and the creation of a low pressure areanear the surface. Over half of all tornadoes in theUSA develop in the April to July period with amarked decrease after the summer solstice.
X
YP A T H
H
L
EYE
TROPOPAUSE
Hei
ght
X Y0
5
10
15Km
300 100 0 100 300Km
SURFACE STREAMLINES
200mb STREAMLINES
Figure 9.5 A model of the areal (above) and vertical(below) structure of a tropical cyclone. The spiral bandsof cloud are shaded and areas of rainfall are indicated inthe vertical section X–Y across the system. The stream-line symbols refer to the upper diagram. After Barry andChorley (1987).

THE EXPER IENCE AND REDUCT ION OF HAZARD190
Since tropical cyclones depend for their existenceon heat and moisture, they form over warm oceanswith sea-surface temperatures (SSTs) of at least26°C. In fact, tropical cyclones originate mainlyover the western parts of the main ocean basins,where no cold currents exist. Figure 9.4 illustratesthe main areas of formation and the land areasmost affected by the storm tracks. Tropicalcyclones do not form in the eastern South PacificOcean nor do they occur in the South AtlanticOcean because of low temperatures and unfavour-able upper winds. Having said this, there is a highdegree of variability in the occurrence of thesestorms and their occurrence can also be linked toperturbations in the tropical ocean-atmospheresystem, such as El Niño–Southern Oscillationevents (see Chapter 14). Most storm systems decayrapidly over land areas, although some remaindangerous for thousands of kilometres withsufficient energy to cross mid-latitude oceans andthreaten higher-latitude coasts.
The meteorological development often beginswith a small, low pressure disturbance, perhaps avortex near the Inter-Tropical Convergence Zone.If surface pressure continues to fall, by 25–30 mb,this may create a circular area with a radius ofperhaps only 30 km with strong in-blowingwinds. This disturbance can develop into a self-sustaining hurricane if four environmentalconditions are satisfied:
• The rising air, convected over a wide area, mustbe warmer than the surrounding air masses upto l0–l2 km above sea level. This warmthcomes from latent heat taken up by evaporationfrom the ocean and liberated by condensationin bands of cloud spiralling around the lowpressure centre. There must also be highatmospheric humidity up to about 6 km. If the
rising air has insufficient moisture for therelease of latent heat, or if it is too cool in thefirst place, the chain reaction will never start.In practice, this means that cyclones form onlyover tropical oceans with surface temperaturesof 26°C or more.
• Hurricanes need vorticity to give the lowpressure system initial rotation. Therefore, theydo not develop within 5° latitude of the equatorwhere the Coriolis force is almost zero andinflowing air will quickly fill up even a strongsurface low. But, between 5–12° north andsouth of the equator, the airflow converging ona low is deflected to produce a favourable spiralstructure.
• The broad air current in which the cyclone isformed should have weak vertical wind shearbecause wind shear inhibits vortex develop-ment. Vertical shear of the horizontal wind ofless than 8 m s–1 allows the main area ofconvection to remain over the centre of lowestpressure in the cyclone. Although this is not adifficult condition to satisfy in the tropics, itexplains why no cyclones develop in the strong,vertically-sheared current of the Asian summermonsoon. Most cyclones occur after the mon-soon season, in late summer and autumn whensea-surface temperatures are at their highestlevel.
• In combination with the developing surfacelow, an area of relatively high pressure shouldexist above the growing storm. As this happensonly rarely, few tropical disturbances developinto cyclones. If high pressure exists aloft, it maintains a strong divergence or outflow ofair in the upper troposphere. Crudely stated,this acts like a suction pump, drawing awayrising air and strengthening the sea levelconvergence.
Box 9.2
HOW TROPICAL CYCLONES FORM AND DEVELOP

SEVERE STORM HAZARDS 191
Mature tropical cyclones can be regarded asthermodynamic heat engines where the energyderived from evaporation at the ocean surface islost partly by thermal radiation where the moistair rises and diverges and partly by surface fric-tion as it moves over the sea. As the wind speedincreases, and the storm intensifies, these energylosses grow relative to the energy gain and atheoretical upper limit is set to storm develop-ment. The wind velocity increases towards the eyeand the lowest central pressures produce thehighest velocity winds. Because the lowestrecorded central pressures exist in the NW Pacific,this upper storm limit is probably higher herethan elsewhere. A ring-like wall of toweringcumulus cloud rises to 10–12 km around the ‘eye’of the storm.
Most of the rising air flows outward near the topof the troposphere, as shown in Figure 9.5 (verticalsection), and acts as the main ‘exhaust area’ for thestorm. The release of rain and latent heatencourages even more air to rise and violentspiralling produces strong winds and heavy rain.A small proportion of the air sinks towards thecentre to be compressed and warmed in the ‘eye’of the storm. The warm core also maintains thesystem because it exerts less surface pressure, thusmaintaining the low-pressure heart of the storm.Recent evidence suggests that some hurricanesmay be intensified by ‘eyewall replacement’, aprocess by which the original eyewall clouds arereplaced by the formation of a new eyewall furtherout from the centre of the storm (Houze et al.2007). Although all storm systems movewestward at about 4–8 m s–1, driven by the upperair easterlies, they eventually re-curve erraticallytowards the pole.
A steep rise in the frequency of major (Category3,4 and 5) Atlantic hurricanes during the latetwentieth and early twenty-first centuries hasinitiated an ongoing debate about possible linksbetween tropical cyclones and global warming (seealso Chapter 14). For example, the 2005 Atlantic
hurricane season was the most active on recordproducing 26 named storms with five hurricanesand three tropical storms directly affecting theUSA. Theoretically, rising sea-surface tempera-tures, together with increased water vapour in thelower troposphere, are likely to fuel greater stormactivity but the existing evidence is controversial.Emanuel (2005) found that hurricane intensityand duration had increased markedly since themid-1970s in association with tropical oceantemperatures. This conclusion was generallyendorsed by Webster et al. (2005) who reported arise in category 4 and 5 storms in most of theworld’s oceans during the past 35 years and Hoyoset al. (2006) who claimed that these storms weredirectly linked to the upward trend in SSTs. Theresults are surprising, given the relatively smallincrease observed in SSTs so far, and they conflictwith some previously held views that, for example,have interpreted the occurrence of Atlantichurricanes in long-term cyclical patterns of activeand inactive spells that offer prospects for seasonalforecasting based on either statistical methods orphysical mechanisms such as wind anomalies(Saunders and Lea, 2005).
Everyone agrees that more research is requiredwith most researchers holding that, while human-induced climate change may ultimately have thepotential for raising hurricane activity, the case isnot yet proven (Shepherd and Knutson 2007).Some scientists, like Elsner (2003) and Trenberth(2005) emphasise the large variability of hurri-canes on multi-decadal timescales within thecontext of natural ocean-atmosphere drivers likethe El Niño–Southern Oscillation (ENSO) and theNorth Atlantic Oscillation (NAO). Given thisvariability, any trends are likely to be small.Landsea (2005) questioned the validity of the basicdata used and also claimed that analysis of sub-stantially longer time-series than those used so fardid not display any trend that could be related toglobal warming. This view is supported by thework of Nyberg et al. (2007) which uses proxy

The United States leads the world in tornadohazard. On average, over 1,000 tornadoes arerecorded over land each year. Most occur in ‘TornadoAlley’, the area running from Texas through Kansasand Oklahoma and on into Canada with themaximum frequency located in central Oklahoma(Bluestein, 1999). The greatest tornado disasterrecorded in the USA was the ‘Tri-State Tornado’ ofMarch 1925. Losses included 695 people dead, over2,000 injured and damages equal to US$40 millionat 1964 prices (Changnon and Semonin, 1966).These losses resulted from a combination of physicalfactors, such as the high ground speed plus the longtrack and wide path, and human failings including
a lack of warning and inadequate shelter provision.Only 3 per cent of the 900 or so tornadoes that occurin the US each year are responsible for humandeaths. Less frequent but more hazardous tornadoesexist in Bangladesh which has the highest reportednumber of fatalities for any country. A storm in May1989 killed between 800 and 1,300 people whilst,in 1996, a tornado in the Tangail area killed about700 people and destroyed approximately 17,000homes (Paul, 1997). These high death rates havebeen attributed to a mix of high population den-sities, weak building construction, an absence ofpreparedness and poor medical facilities.
THE EXPER IENCE AND REDUCT ION OF HAZARD192
records to show that the frequency of majorAtlantic hurricanes decreased progressively fromthe eighteenth century to reach anomalously lowvalues in the 1970s and 1980s. In the context of
this record, the increased activity observed since1995 can be seen simply as a return to normalhurricane patterns rather than as a direct productof climate change.
1 5 10 150
20
40
60
805
4
32
1
TropicalStorm
Destructive energy relative to the force of a tropical storm
Win
dsp
eed
(mS
-1)
Saffir-S
imp
son
scale
Figure 9.6 The relationship between hurricanewindspeeds and their destructive force compared with atropical storm. Because the damage potential isproportional to wind energy, winds of 65 ms–1, typicalof a Category 4 hurricane, have about 10 times thedestructive power of the airflow in a tropical storm.Adapted from Pielke and Pielke (1997). CopyrightJohn Wiley and Sons Limited. Reproduced withpermission.
Table 9.4 The Fujita scale of tornado intensity
Category Damage Wind speed Typical impact
F-1 Light 18–32 m sec1 Damage to trees, free-standing signs and some chimneysF-2 Moderate 33–50 m sec1 Roofs damaged, mobile homes dislodged, cars overturnedF-3 Severe 51–70 m sec1 Large trees uprooted, roofs removed, mobile homes
demolished, damage from flying debrisF-4 Devastating 71–92 m sec1 Masonry buildings damaged, cars become airborne,
extensive damage from large missilesF-5 Disastrous 93–142 m sec1 Wood-frame buildings lifted from foundations and
disintegrate, cars airborne for more than 100 mF-6 and over >142 m sec1 Currently thought not to exist

Most tornado losses result from debris becomingairborne and from building collapse. In the USA,occupants of mobile homes and road vehicles aremost likely to die (Hammer and Schmidlin, 2000).The large number of survivors, often with soft tissueinjuries and fractures, create problems for localhospitals (Bohonos and Hogan, 1999). Fatalitiescontinue to occur. Schmidlin et al. (1998) reported42 people killed in Florida in February 1998 – allin mobile homes or recreational vehicles – whilst acategory F-5 storm in May 1999 killed 45 peopleand created material losses of up to US$1 billion inOklahoma City. On the other hand, Simmons andSutter (2005) have shown that, after allowing forchanged demographic and other circumstances,recorded deaths from each F-5 tornado declinedsteadily during the twentieth century. By 1999,
fatalities were effectively 40 per cent lower than in1950 and 90 per cent lower than in 1900. Thistrend is attributable to a combination of betterforecasting and warning together with a greaterprovision of tornado shelters.
Hail storms and thunder storms
Hail consists of ice particles falling from clouds toreach the ground. The damage potential of haildepends on the number of particles and the surfacewind speed that drives them but is also related tothe size of the particles. The most destructivehailstones tend to exceed 20 mm in diameter. Largehail has been known to result in human deaths butthe main damage is to property, especially standingcrops.
SEVERE STORM HAZARDS 193
Plate 9.1 Power company employees work to restore electricity supplies amid tornado damage in Lake County,Florida, USA. Several powerful tornadoes swept though this, and other areas, of central Florida in February 2007.(Photo: Mark Wolfe, FEMA)

Most hail is produced by storms in which strongvertical motions are present giving rise to cumu-lonimbus clouds with thunder and lightning.Hailstorms result from strong surface heating andare warm season features. Isolated falls of hail, veryoften of the greatest intensity, occur in and near tomountain ranges. Few mid-latitude areas areimmune from hail but most of the damage isconcentrated in the continental interiors close tomountains; hail can also be a problem at highaltitude in the tropics. Most places in the UnitedStates experience only two or three hailstorms peryear. However, in the lee of the central RockyMountains between six and twelve hail days arerecorded each year. According to Changnon (2000),significant hail damage in the USA occurs duringthe most severe, 5–10 per cent of all storms. In anaverage year, hail causes US$1.3 billion in croplosses and a further US$1–1.5 billion in propertydamage (at 1996 dollar prices).
Lightning is associated with rain, hail and thepowerful up-currents of air within the clouds ofsummer storms. It occurs when a large positiveelectrical charge builds up in the upper, often frozen,layers of a cloud and a large negative charge –together with a smaller positive force – forms in thelower cloud. Since the cloud base is negativelycharged, there is attraction towards the normallypositive earth and the first (leader) stage of the flashbrings down negative charge towards the ground.The return stroke is a positive discharge from theground to the cloud and is seen as lightning. Theextreme heating and expansion of air immediatelyround the lightning path sets up the sound wavesheard as thunder. Despite its dramatic appearance,lightning causes comparatively few deaths – perhapsabout 25,000 per year worldwide – mainly tooutdoor workers.
SEVERE WINTER STORMS
Extra-tropical cyclones bring strong winds duringthe winter season when they may be accompaniedby snow and ice hazards. An attempt will be made
to distinguish between the windstorm threat andthe snowstorm threat, although many winter stormspresent a combined hazard.
Severe windstorms
Severe windstorms, often accompanied by heavyrain, are associated with deep mid-latitude depres-sions. Coastal areas are at risk because wind-drivenwaves erode sea defences and create dangerous stormsurges, such as that of 3l January 1953, producedby a deep depression in the North Sea. The resultingstrong northerly gale combined with a tidal surgeof 2.5–3.0 m to cause exceptional coastal flooding.In the Netherlands 1,835 people were killed, 3,000houses were destroyed, 72,000 people were eva-cuated and 9 per cent of agricultural land wasflooded. Some major world cities, such as Venice andLondon, are subject to increasing storm-surgehazard due to long-term subsidence and rising sealevels.
In the northern hemisphere, the majority ofintense winter cyclones are found near the Aleutianand Icelandic low pressure areas. These Atlanticstorms are more frequent, and cover larger areas,than equivalent events in the Pacific Ocean(Lambert, 1996). Some mid-latitude cyclonesdevelop very quickly and are called rapidly deepeningdepressions. The most favoured breeding grounds forthese depressions lie off the east coast of continentsand correspond to the areas of warm ocean currents.These tend to occur most frequently in the northAtlantic ocean and pose a hazard in western Europe,notably to Britain which lies directly in theireastward path. Rapidly deepening depressions aredifficult to forecast accurately because the standardmodels used by weather forecasters can under-predict the rate of deepening (Sanders and Gyakum,1980). In addition, local processes may be involved.The break-up of deep clouds can produce turbulenteddies that contribute to the strength of gusts atground level to such an extent that it results in thehighest gust speeds in windstorms.
In areas exposed to the frequent passage of winterdepressions the ongoing economic loss can be high.
THE EXPER IENCE AND REDUCT ION OF HAZARD194
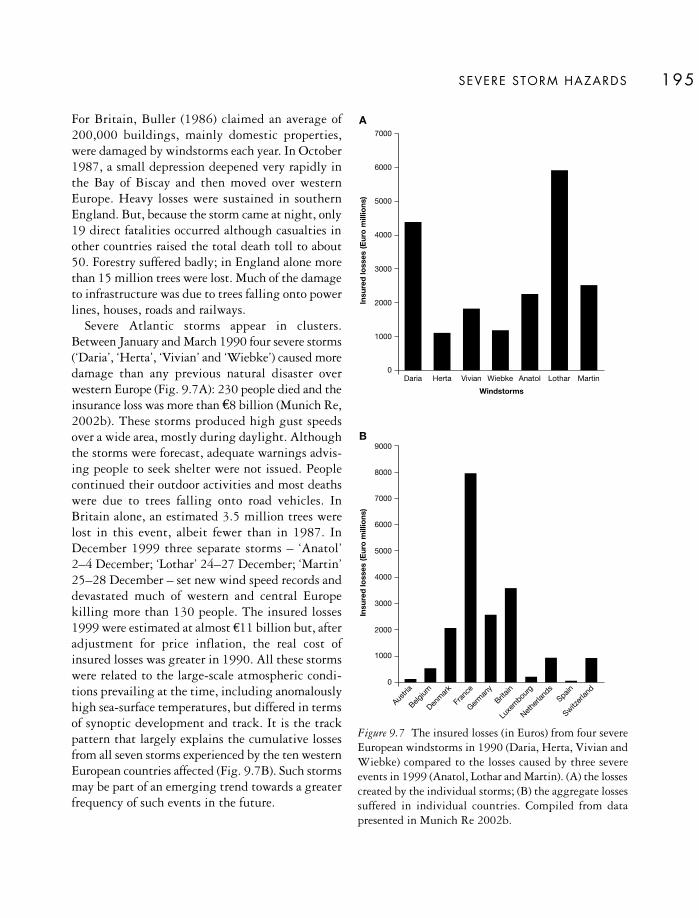
SEVERE STORM HAZARDS 195
For Britain, Buller (1986) claimed an average of200,000 buildings, mainly domestic properties,were damaged by windstorms each year. In October1987, a small depression deepened very rapidly inthe Bay of Biscay and then moved over westernEurope. Heavy losses were sustained in southernEngland. But, because the storm came at night, only19 direct fatalities occurred although casualties inother countries raised the total death toll to about50. Forestry suffered badly; in England alone morethan 15 million trees were lost. Much of the damageto infrastructure was due to trees falling onto powerlines, houses, roads and railways.
Severe Atlantic storms appear in clusters.Between January and March 1990 four severe storms(‘Daria’, ‘Herta’, ‘Vivian’ and ‘Wiebke’) caused moredamage than any previous natural disaster overwestern Europe (Fig. 9.7A): 230 people died and theinsurance loss was more than €8 billion (Munich Re,2002b). These storms produced high gust speedsover a wide area, mostly during daylight. Althoughthe storms were forecast, adequate warnings advis-ing people to seek shelter were not issued. Peoplecontinued their outdoor activities and most deathswere due to trees falling onto road vehicles. InBritain alone, an estimated 3.5 million trees werelost in this event, albeit fewer than in 1987. InDecember 1999 three separate storms – ‘Anatol’2–4 December; ‘Lothar’ 24–27 December; ‘Martin’25–28 December – set new wind speed records anddevastated much of western and central Europekilling more than 130 people. The insured losses1999 were estimated at almost €11 billion but, afteradjustment for price inflation, the real cost ofinsured losses was greater in 1990. All these stormswere related to the large-scale atmospheric condi-tions prevailing at the time, including anomalouslyhigh sea-surface temperatures, but differed in termsof synoptic development and track. It is the trackpattern that largely explains the cumulative lossesfrom all seven storms experienced by the ten westernEuropean countries affected (Fig. 9.7B). Such stormsmay be part of an emerging trend towards a greaterfrequency of such events in the future.
7000
6000
5000
4000
3000
2000
1000
0Daria MartinLotharAnatolHerta Vivian Wiebke
Insu
red
loss
es(E
uro
mill
ions
)
Windstorms
9000
8000
7000
6000
5000
4000
3000
2000
1000
0
Austri
a
Belgium
Denm
ark
Fran
ce
Germ
any
Britain
Luxe
mbou
rg
Nethe
rland
s
Spain
Switzer
land
Insu
red
loss
es(E
uro
mill
ions
)
A
B
Figure 9.7 The insured losses (in Euros) from four severeEuropean windstorms in 1990 (Daria, Herta, Vivian andWiebke) compared to the losses caused by three severeevents in 1999 (Anatol, Lothar and Martin). (A) the lossescreated by the individual storms; (B) the aggregate lossessuffered in individual countries. Compiled from datapresented in Munich Re 2002b.

Severe snow and ice storms
Approximately 60 million persons in the UnitedStates live in urban areas in the northern states witha high risk of snowstorms. According to Schwartzand Schmidlin (2002), the USA has about 10blizzards per year each affecting nearly 2.5 millionpeople. In March 1993 a severe snow storm occurredover the east coast of the USA and Canada. It killedover 240 people – including 48 missing at sea –around three times the combined death toll forhurricanes ‘Hugo’ and ‘Andrew’ (Brugge, 1994).The storm was initiated over the warm waters of the Gulf of Mexico and moved north along theAtlantic seaboard as a rapidly intensifying surfacelow. Between 1949–2001, there were 155 snow-storms in the USA each responsible for propertylosses in excess of US$ 1 million (Changnon andChangnon, 2005). An upward trend through theperiod suggested an interaction between a growingpopulation, rising property assets and greater stormintensity.
Ice (glaze) storms are an important winter hazardin North America, especially in the Great Lakesregion where they can extend to areas over 10,000km2. The problem arises from thick accretions ofclear ice on exposed surfaces. Ice accretes on struc-tures whenever there is liquid precipitation, or clouddroplets, and the temperature of both the air andthe object are below the freezing point. Electricpower transmission lines and forests are at thegreatest risk because the weight of ice may besufficient to bring such objects down and people areleft without electrical power for many days. InJanuary 1998 freezing rain produced ice accumu-lation between 40–100 mm on exposed surfaces ineastern Ontario with much damage to forests andtree-related industries, such as maple sugarproduction (Kidon et al., 2002). Most fatalitiesrelated to ice storms are indirect. For example, over500 lives are lost each year in the USA from carbonmonoxide (CO) poisoning, many resulting from theuse of domestic generators and space heaters afterthe loss of electrical power in an ice storm (Daley et al., 2000).
MITIGATION
Disaster aid
Tropical cyclones create comprehensive disasters indeveloping countries and emergency action alone israrely adequate. Despite a rapid injection of aidtotalling over US$123 million following ‘HurricaneMitch’ in 1998, the short-term relief compensatedfor less than 10 per cent of the losses. Longer-termsupport is needed to restore damaged infrastructure.For example, tropical islands often suffer failures ofelectricity supply following the destruction ofoverhead power lines and the lack of refrigerationposes a public health risk. After ‘Hurricane Gilbert’struck Jamaica in 1988 40 per cent of the electricitytransmission system, plus 60 per cent of thedistribution system, was made unserviceable and ittook several weeks to restore supplies (Chappelow,1989).
Aid is necessary in the MDCs after major events,especially in multi-ethnic communities where theeffective distribution of relief may be hampered byfactors such as poverty, illiteracy, gender andminority status. For example, after ‘HurricaneAndrew’ only about 20 per cent of the populationin Florida City (which is mainly black) applied foraid even though over 80 per cent of the homes hadbeen destroyed. In Homestead, a mainly white area,90 per cent of the population applied for aid and 80 per cent of such applications were successful(Peacock et al., 1997).
Insurance
At present, there is a limited market for disasterinsurance in the developing nations. Only about 2 per cent of the losses imposed on Central Americaby ‘Hurricane Mitch’ were covered by insurance.Conversely, residents of some developed countrieshave access to all risk policies for homes, housecontents and motor vehicles that cover a variety ofstorm-related losses. These package policies canmake it difficult to identify the economic impact ofindividual weather perils. Urban hailstorms cause
THE EXPER IENCE AND REDUCT ION OF HAZARD196

large losses in some countries, most of which areattributed to damage to motor vehicles (Hohl et al.,2002). More specialised policies are available for keyeconomic activities, such as agriculture and hailinsurance against crop damage, for example, iscommon in North America.
Major hurricanes in the USA can strain theinsurance industry and the costs of ‘HurricaneAndrew’ were well above the upper estimates madeonly a few years earlier. Most structural damage tobuildings is wind-related and insurers paid outUS$2.6 billion for wind-related damage resultingfrom ‘Hurricane Hugo’ in 1989, whilst only 10 percent of the total insured loss was flood-related. Fora few hurricanes, such as ‘Opal’ in Florida andAlabama in 1995, the major losses were due tostorm surge, which totally dominated the impact of‘Hurricane Katrina’. Bush et al. (1996) demon-strated how storm surge property damage can beincreased in the lowest-lying areas by the priorremoval of dunes compared to the losses suffered byhouses elevated on pilings or set back behind seawalls. ‘Hurricane Andrew’ acted as a ‘wake-up’ callto the insurance industry; some companies werereluctant to underwrite further cover in parts ofFlorida and elsewhere, whilst state catastrophe fundshelped residents unable to buy policies on theprivate market. Since then, companies have becomemore interested in hurricane climatology andpredictions of storm activity in the forthcomingseason are now being prepared for the insuranceindustry (Saunders and Lea, 2005).
Despite the advantages of storm-hazard insur-ance, there is a fear that its availability has increasedthe demand for coastal homes and even raisedproperty values in some hazard zones. This isbecause the presence of insurance may encourageeither the perception that storm events are very rareor the more cynical judgement that the certainty offinancial recompense more than balances out anyrisks to property. Since 1968, shoreline constructionin the USA has been endorsed by the federalgovernment through the selling of insurance towaterfront property owners through the NationalFlood Insurance Program (NFIP). Thirty years ago,
home-buyers and estate agents in the Lower FloridaKeys believed that the availability of flood insurancemade residents more willing to locate in flood-proneareas and also made it easier to sell property at risk(Cross, 1985). One result was a large number ofrepeat claims. About 40 per cent of all claims underthe NFIP have been for properties flooded at leastonce before. In this situation, commercial insurerswill either withdraw from the residential market orlobby government for the adoption and enforcementof more stringent planning and building codes.
PROTECT ION
Environmental control
Several countries conducted weather modificationexperiments during the 1950s and l960s but theresults failed to meet expectations (see Box 9.3) andno severe storm suppression technology is currentlyin routine use.
Hazard–resistant design
Hazard-resistant design can save lives in severestorms. In high-risk areas, special structures providea safe refuge for people fleeing either wind speedhazards or storm surge hazards. For example, in asample of Oklahoma City residents warned inadvance of the May 1999 tornado, it was found thatroughly half fled their homes – mostly for a tornadoshelter – whilst the others elected to stay. None ofthe evacuees was injured but 30 per cent whoremained in their homes were injured and 1 per centwas killed (Hammer and Schmidlin, 2002). InBangladesh, the low-lying topography offers littleescape from either high winds or storm surge. About1,600 cyclone shelters have been built along thecoast, some of which can accommodate 1,500people, and there are also large raised mounds, orescape platforms. Provision exists for the evacuationof up to 4 million people away from the mostdangerous areas and the success of this scheme inreducing deaths in Bangladesh during the 1990s canbe seen in Table 9.5.
SEVERE STORM HAZARDS 197

THE EXPER IENCE AND REDUCT ION OF HAZARD198
Hurricane modification is the most attractive ofall severe storm suppression goals. The destructivepower of a tropical cyclone increases rapidly withthe maximum wind speed and it has beenestimated that a 10 per cent reduction in windspeed would produce an approximate 30 per centreduction in damage. Attempts at weathermodification in the United States started in 1947and culminated with Project STORMFURYstarting in 1962 (Willoughby et al., 1985). Thetheory was that the introduction of silver iodideinto the ring of clouds around the storm centrewould cause existing supercooled water to freeze,thereby stimulating the release of latent heat offusion within the clouds. It was believed that thiswould lower the maximum horizontal tempera-ture and pressure gradients within the eyewall ofthe storm, reduce covergence and lessen the corewindspeeds. Unfortunately, the computer modelsover-estimated the amount of supercooled wateravailable. Project STORMFURY was discon-tinued in 1983. Other theories for hurricanecontrol have included spraying the ocean surfacewith a liquid evaporation suppressant and arti-ficially reducing the sea-surface temperatures,either by pumping up colder water from the oceandepths or by towing icebergs from the Arctic.
Since medieval times hail suppression has beenattempted in the alpine countries of Europe byfiring cannon and ringing church bells whenthunder clouds appear. There is no scientific basisfor such methods, other than a suggestion thatexplosions may propagate pressure waves in the airsufficient to crack and weaken the ice making upthe hailstone and thus prevent large hailstonesfrom forming. Most hail suppression technologyhas relied, like hurricane modification, on cloudseeding with ice nucleants. The theory is that theintroduction of artificial ice nuclei, like silver
iodide, will introduce competition for the super-cooled water droplets that hailstone embryos feedon. The expectation is that, although the totalnumber of ice particles will increase, individualhailstones will grow to a smaller size and do lessdamage when they reach the ground. Hail cloudshave been seeded with silver iodide by a variety ofmethods including ground-based generators, over-flying aircraft which drop pyrotechnic flare devicesand artillery shells.
In practice, weather modification fails to satisfythe following criteria:
• Scientific feasibility This requires a morecomplete understanding of the microphysicalprocesses within clouds. For example, it isthought that hurricane clouds contain too littlesuper-cooled water, and too much natural ice,for artificial nucleation to be effective even withhigh doses of seeding agents.
• Statistical feasibility Not enough sample stormsare available for treatment in any area in orderto provide the statistical proof that experi-mental results differ from naturally occurringchanges in factors such as hurricane wind speedor hail intensity.
• Environmental feasibility Quite apart from themoral issue of interfering with atmosphericprocesses with an incomplete state of know-ledge, most seeding agents or ocean tempera-ture reduction methods would create apollution threat.
• Legal feasibility Several hail suppression pro-grammes in the USA have attracted lawsuits.In some cases the complainants have allegedthat their right to natural precipitation hasbeen diminished by a reduction in rainfallwhilst in others it has been claimed that theseeding has increased storm damage.
Box 9.3
THE DREAM OF SEVERE STORM SUPPRESSION

Natural coastlines can also provide someprotection. Almost 25 per cent of the US coastaffected by hurricanes has some obstacle to stormsurge in the form of man-made breakwaters, seawalls or the use of dunes and beach stabilisationmeasures to limit coastal erosion. But, in manyareas, these defences have been removed to facilitateeconomic development. Mangrove forests are a goodexample, often destroyed in the MDCs because theyare unsightly and hinder resort construction, and inthe LDCs to foster more intensive coastal activities,such as aquaculture. Coastal defences cannot providetotal protection against severe storms and computer-based techniques such as Digital Elevation Models(DEM) and Geographical Information Systems(GIS) are increasingly employed to assess the extentof coastal inundation risk (Colby et al., 2000; Zergeret al., 2002). More routinely, large sea waves resultin the severe scouring of beaches with the inevitableundermining of adjacent roads and buildings. Thistype of marine flooding is reviewed in Chapter 11.
Hazard-resistant design is important for reducingproperty damage in windstorms. The causes ofwind-induced building failure are well known (Key,1995). Typically, shingles and other roofingmaterials are disturbed by wind pressures, a process
which then allows rain to penetrate the building andcause additional damage. Most of these losses couldbe avoided if a few hundred extra dollars were spentduring construction. Better water-proofing of theroof, the use of hurricane clips – rather than staples– for fastening roof cladding and roof sheathing andthe fitting of storm shutters to resist damage fromwind-borne debris would do a great deal to reducedamage (Ayscue, 1996). There is growing awarenessof the need for better design. For example, in March2002, Florida adopted a new building code impos-ing stricter standards against wind hazard but, as sooften happens, the legislation does not apply to theexisting building stock and some code exemptionswere agreed. In the LDCs the gradual switch fromwooden to masonry buildings has helped reducehurricane damage but a damage survey in AndhraPradesh state, south India, confirmed the need todesign more buildings with hipped, rather thangabled roofs, and to make all types of roof coveringmore secure (Shanmugasundaram et al., 2000).
More detailed knowledge is becoming availableabout the patterns of windstorm damage to resi-dential property, a process which may aid a betterdeployment of safer building techniques. Huang etal. (2001) collected almost 60,000 insurance claimsmade in South Carolina (after ‘Hurricane Hugo’)and in Florida (after ‘Hurricane Andrew’) andrelated the mean surface wind speed to the numberof claims and the degree of damage for each zip(post) code. Figure 9.8A shows the aggregated claimratio (total claims divided by total policies) andreveals that, whilst few policyholders claim withwinds less than 20 m s1, nearly all will file a claimwhen the speed reaches 30 m s1. Figure 9.8B graphsthe wind speed against the aggregated damage ratio(amount paid by the insurer divided by total insuredvalue) and shows that the degree of loss increasesmarkedly with speeds more than 35 m s1. Finally,
SEVERE STORM HAZARDS 199
Table 9.5 Numbers of people killed and evacuatedduring tropical cyclone emergencies in Bangladeshduring the 1990s
Year Number Number Deaths as % killed evacuated of evacuees
1991 140,000 350,000 40.001994 133 450,000 0.031997 (May) 193 1,000,000 0.021997 (Sept.) 70 600,000 0.011998 3 120,000 0.0025
Source: After IFRCRCS (2002)
• Economic feasibility Although highly favourableestimates of the cost:benefit ratio for successfulsevere storm modification have helped to
release funds for cloud seeding experiments inthe past, the promised savings have never beenrealised.

Figure 9.8C uses a long-term risk model to simulatethe decline of annual losses away from the coast. Thehighest risks are about 2 per cent. This means thathomes out on the barrier islands can, on average,expect to be damaged up to 100 per cent of theirtotal insured value every 50 years. In comparison,only 20 km inland the risk falls to 0.2–0.3 per cent– only about one-tenth of that on the coast. Suchinformation is useful to insurers setting policypremiums and to land planners concerned withhazard zoning.
The key to storm damage mitigation damage liesin adequate, and properly enforced, building codes.A comparative study of hurricanes in Texas andNorth Carolina, showed that nearly 70 per cent ofthe damage to residential property was due to poorenforcement of the building codes and it wasclaimed that 25–40 per cent of the insured lossesassociated with ‘Hurricane Andrew’ were avoidablethrough better construction (Mulady, 1994).Problems of uneven code enforcement arise due tolack of funds and poor training of site inspectors.However, there are signs of changing attitudes inthe United States. For example, following‘Hurricane Hugo’ in 1989, Surfside Beach becamethe first community in South Carolina to adopt thehigh-wind design standard in the Southern buildingcode. After ‘Hurricane Andrew’ the South Floridabuilding code was also strengthened. All newbuildings should be constructed with permanentstorm shutters and protected from wind-bornedebris. Exterior windows or shutters must pass amissile impact test with a 4 kg piece of timberstriking at a speed of 15 m s–1 and shingle and tiles
THE EXPER IENCE AND REDUCT ION OF HAZARD200
100
80
60
40
20
00 10 20 30 40 50
Effective Mean Wind Speed (m/s)
Wei
ght
edC
laim
Rat
io(%
)100
80
60
40
20
00 10 20 30 40 50
Effective Mean Wind Speed (m/s)
Wei
ght
edD
amag
eR
atio
(%)
2
0
0.5
1.5
1
0 15050 100Distance from the Coast (km)
Ann
ualD
amag
eR
atio
(%)
A
B
C
Figure 9.8 Hurricane losses to residential structures inthe south-east United States. (A) insurance claims ratiocompared to the effective mean surface wind speed; (B)building damage ratio compared to the effective meansurface wind speed; (C) expected annual damage ratiocompared to distance from the coast. After Huang et al.,(2001). Reprinted from Reliability Engineering and SystemSafety 74, Z. Huang et al., Long-term hurricane riskassessment and expected damage to residential structures,copyright (2001), with permission from Elsevier.
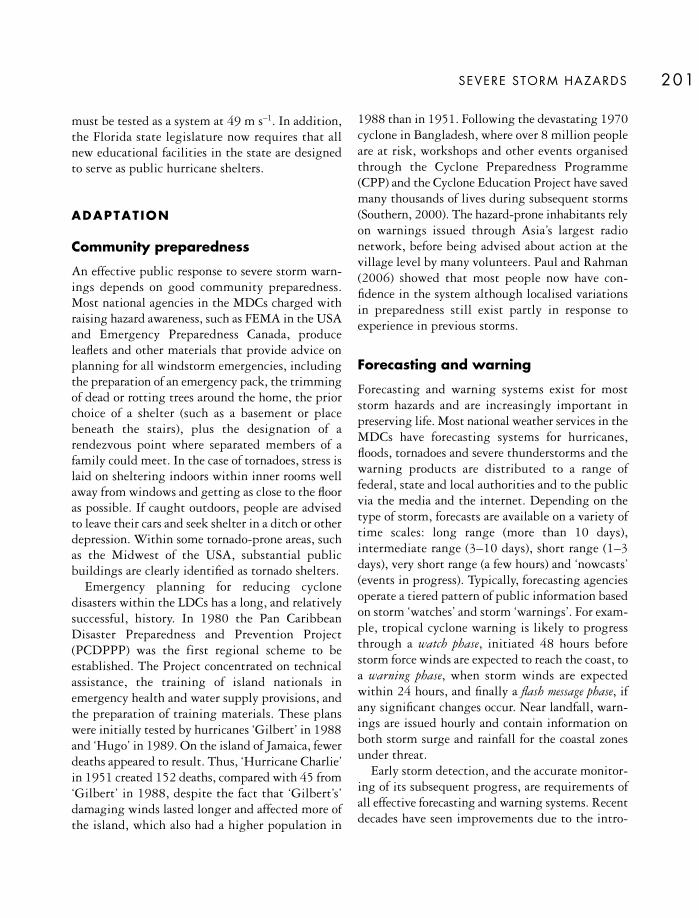
must be tested as a system at 49 m s–1. In addition,the Florida state legislature now requires that allnew educational facilities in the state are designedto serve as public hurricane shelters.
ADAPTATION
Community preparedness
An effective public response to severe storm warn-ings depends on good community preparedness.Most national agencies in the MDCs charged withraising hazard awareness, such as FEMA in the USAand Emergency Preparedness Canada, produceleaflets and other materials that provide advice onplanning for all windstorm emergencies, includingthe preparation of an emergency pack, the trimmingof dead or rotting trees around the home, the priorchoice of a shelter (such as a basement or placebeneath the stairs), plus the designation of arendezvous point where separated members of afamily could meet. In the case of tornadoes, stress islaid on sheltering indoors within inner rooms wellaway from windows and getting as close to the flooras possible. If caught outdoors, people are advisedto leave their cars and seek shelter in a ditch or otherdepression. Within some tornado-prone areas, suchas the Midwest of the USA, substantial publicbuildings are clearly identified as tornado shelters.
Emergency planning for reducing cyclonedisasters within the LDCs has a long, and relativelysuccessful, history. In 1980 the Pan CaribbeanDisaster Preparedness and Prevention Project(PCDPPP) was the first regional scheme to beestablished. The Project concentrated on technicalassistance, the training of island nationals inemergency health and water supply provisions, andthe preparation of training materials. These planswere initially tested by hurricanes ‘Gilbert’ in 1988and ‘Hugo’ in 1989. On the island of Jamaica, fewerdeaths appeared to result. Thus, ‘Hurricane Charlie’in 1951 created 152 deaths, compared with 45 from‘Gilbert’ in 1988, despite the fact that ‘Gilbert’s’damaging winds lasted longer and affected more ofthe island, which also had a higher population in
1988 than in 1951. Following the devastating 1970cyclone in Bangladesh, where over 8 million peopleare at risk, workshops and other events organisedthrough the Cyclone Preparedness Programme(CPP) and the Cyclone Education Project have savedmany thousands of lives during subsequent storms(Southern, 2000). The hazard-prone inhabitants relyon warnings issued through Asia’s largest radionetwork, before being advised about action at thevillage level by many volunteers. Paul and Rahman(2006) showed that most people now have con-fidence in the system although localised variationsin preparedness still exist partly in response toexperience in previous storms.
Forecasting and warning
Forecasting and warning systems exist for moststorm hazards and are increasingly important inpreserving life. Most national weather services in theMDCs have forecasting systems for hurricanes,floods, tornadoes and severe thunderstorms and thewarning products are distributed to a range offederal, state and local authorities and to the publicvia the media and the internet. Depending on thetype of storm, forecasts are available on a variety oftime scales: long range (more than 10 days),intermediate range (3–10 days), short range (1–3days), very short range (a few hours) and ‘nowcasts’(events in progress). Typically, forecasting agenciesoperate a tiered pattern of public information basedon storm ‘watches’ and storm ‘warnings’. For exam-ple, tropical cyclone warning is likely to progressthrough a watch phase, initiated 48 hours beforestorm force winds are expected to reach the coast, toa warning phase, when storm winds are expectedwithin 24 hours, and finally a flash message phase, ifany significant changes occur. Near landfall, warn-ings are issued hourly and contain information onboth storm surge and rainfall for the coastal zonesunder threat.
Early storm detection, and the accurate monitor-ing of its subsequent progress, are requirements ofall effective forecasting and warning systems. Recentdecades have seen improvements due to the intro-
SEVERE STORM HAZARDS 201
THE EXPER IENCE AND REDUCT ION OF HAZARD202
duction of remote observing systems such as geo-stationary and polar orbiting satellites, automatedland and sea surface observations and Doppler radar.The resulting data can be linked to computergraphics capable of supplying storm imagery (e.g.for wind speed and sea surge conditions) sometimesfor days in advance of a disaster strike. Dynamicalmodels of the atmosphere, using increasingly finegrid resolutions, are then combined with statisticalmodels of the historical behaviour of similar stormsto provide predictions of the track, forward speedand intensity of the developing storm with sufficientlead-times for emergency action.
The forecasting of tropical cyclones has improved.Satellite sensing allows developing systems withwell-formed ‘eyes’ to be located out at sea to within30–50 km. When a cyclone has moved about 250km offshore, weather radar permits a more accuratefix on the position, probably to within 10 km. Inthe USA, the National Hurricane Center (NHC) inMiami maintains continuous real-time monitoringof tropical cyclones and issues forecasts from 120 hahead down to 6 h predictions of the centralposition, the extent, intensity and track. A hurricanewatch is issued to advise a specified coastal sectorthat it has at least a 50 per cent chance ofexperiencing a tropical cyclone of hurricane forcewithin 36 hours. Improvements in storm forecastingand warning systems have been necessary to keeppace with the growth in coastal vulnerability. Ahurricane warning provides similar advice about astrike normally expected to make landfall within18–24 h. Figure 9.9 shows how the average accuracyof hurricane forecasts issued by the NHC hasimproved over recent decades for different forecastperiods. For example, track errors in the last fewyears have been reduced to about 160km (24 hr),260km (48 hr) and 370 km (72 hr) and wind speederrors have reduced to 9 kt (24 hr), 15 kt (48 hr) and19 kt (72 hr). Today a three-day track forecast is asaccurate as one issued for two days in the late 1980sand an intensity forecast has errors 20 per centsmaller than in the mid-1970s. Forecasting skill for‘Hurricane Katrina’ was generally very good. Thetrack forecasts were significantly better than the
most recent 10-year average (1995–2004), with leadtimes for watches and warnings eight hours longerthan average, but the intensity of the storm wasunder-forecast (National Weather Service, 2006).
It remains difficult to measure real-time stormintensity and forecasts of wind strength are ofvariable accuracy (Emanuel, 1999), with consequentimplications for forecasting storm surge height.Storm surge conditions are normally forecast usinga variant of the SLOSH computer model (Sea, Lakeand Overland Surges from Hurricanes) thatincorporates five meteorological factors: windspeed,central pressure, size (radius), forward speed andtrack direction of the hurricane. The calculationstake into account local features; shorelineconfiguration, near-shore water depth (includingtidal data) plus built features like roads and bridges.The SLOSH procedure is routinely accurate within+/– 20 per cent, so that a forecast peak of 3.0 mcould be expected to produce a maximum heightbetween 2.4 to 3.6 m. For individual storms, theSLOSH performance is very dependent on theaccuracy of the forecast storm track model. If thelandfall prediction is in error, the surge height isunlikely to be the same as forecast at a differentgeographical location.
Accurate forecasting of hurricane landfall iscrucial for efficient public warning and the initia-tion of evacuation procedures. Bulletins advisingpeople at risk about evacuation are issued along-side forecasts because medium-sized cities requireabout 12 h to evacuate whilst large cities, like NewOrleans, Miami and Houston, need a minimum 72 h of advanced notification time (Urbina andWolshon, 2003). At present, hurricane warningsare issued for sections of coast averaging 560 km
in length. This is partly because damaging windsextend beyond the centre of the storm but also because of doubts about the exact landfallposition. Since hurricane winds cause damage overa 190 km wide area, about two-thirds of the coastalsector is over-warned and therefore incurs unneces-sary preparation and evacuation costs (Powell,2000). Some problems associated with emergencyevacuation are indicated in Box 9.4.

Forecasting and warning for tornadoes operatesover much smaller scales of time and distance. Atbest, tornado watch programmes linked to Dopplerradar systems can allow communities up to two tothree hours to prepare for the event and seek shelter.In the case of the Midwest tornadoes in early May2003, warnings issued mainly via sirens providedlead-times of 10–20 minutes only, although almostall residents who received warnings were able totake immediate shelter (Paul et al., 2003). Warningswere generally less effectively disseminated in ruralareas. A more widespread use of NOAA weather
radios, that can warn people who are asleep – evenwhen the electricity supply fails – would help toremedy this situation and improve overall warningcapability. Given the continuing devastation fromtornadoes in Bangladesh, such as the 111 peoplekilled by a severe event in April 2004, there is a verygood case for the introduction of a tornado fore-casting and warning system in this country ((Pauland Bhuiyan, 2004).
SEVERE STORM HAZARDS 203
1200
1000
800
600
400
200
0
72 hour48 hour24 hour
Err
or
(kilo
met
res)
1955 1960 1965 1970 1975 1980 1985 1990 1995 2000
0
10
20
30
40
50
6072 hour48 hour24 hour
Err
or
(kilo
met
res
per
hour
)
1975 1980 1985 1990 1995 2000
Year
Year
A
B
Figure 9.9 The average annual accuracyof Atlantic hurricane forecasts, and theassociated trend lines, issued by theNational Hurricane Center in the USAover recent years. (A) the forecasts ofhurricane track 1954–2003; (B) theforecasts of wind intensity 1975–2003.Major improvements have occurred inthe accuracy of hurricane path forecastsbut the forecasts of hurricane intensityhave improved much more slowly. Fromwww.aoml.noaa.gov/hrd/tcfaq/F6.html(accessed 10 October 2006).
THE EXPER IENCE AND REDUCT ION OF HAZARD204
In the USA, hurricane warnings can be used totrigger coastal evacuation authorised by the stateGovernor. Evacuation orders can be Voluntary,Recommended or Mandatory but even Mandatoryorders can be difficult to enforce and the overalleffects are variable. Residents in hurricane riskareas are not unaware of the threat. Peacock et al.(2005) found a strong relationship between riskperception and wind hazard zones in Florida andmost coastal residents in Texas correctly identifiedtheir own risk zone when faced with ‘HurricaneBret’ in 1999 (Zhang et al., 2004). As a result,maximum evacuation rates of over 90 per centhave been achieved for communities living onbeaches and barrier islands. Although only 54 percent of households threatened by ‘HurricaneAndrew’ evacuated entirely, this proportion roseto over 70 per cent in the lowest-lying coastal zone(Peacock et al., 1997). Failures to evacuate arisebecause people take many factors into accountwhen considering action including: environmentalconditions, e.g. day or night timing; social cues,e.g. neighbour behaviour and perceived impedi-ments e.g. availability of refuges (Lindell et al.,2005). Many South Carolina residents who did notcomply with the 1999 mandatory evacuationorder during ‘Hurricane Floyd’ recognised thedanger but rated household circumstances andprevious experience as more important to theirdecision-making (Dow and Cutter, 2000). Non-evacuees are less likely to respond to futureevacuation orders, especially if problems existedfor those who did evacuate like the trafficcongestion that delayed the return of residents tothe Florida Keys after ‘Hurricane Georges’ in 1998(Dash and Morrow, 2000). In summary, people atrisk do not always act as emergency planners wish.
Improving the evacuation process is importantfor the USA given the increase in coastal popu-
lation density from 275 to 400 people per km2
between 1960 and 1990. One of the largest evacuations in US history occurred in 1999 whenthree million people fled from ‘Hurricane Floyd’.This created traffic gridlock, despite the first-timeuse of special contra-flow lanes on the main routes,and it is clear that more sophisticated trafficmanagement will be required in future (Urbinaand Wolshon, 2003; Wolshon et al., 2005). The‘shadow’ evacuation of up to 10–20 per cent ofadditional households, who are not under directthreat but leave anyway, increases pressure on theevacuation routes. In addition, the limitedavailability of public shelters, the long lead-times– relative to the length of hurricane warnings –necessary for communities to be evacuated and theexistence of groups without their own vehicles allcreate further problems for emergency managers.For example, tourists are likely to be a lowmobility group lacking experience of previousevacuations and emergency procedures.
A better understanding of evacuation behaviouris crucial. Not surprisingly, Mandatory, ratherthan Voluntary, Orders are needed to encouragemost people to evacuate, including those at highrisk, but storm intensity and the perceived risk of flooding – rather than the risk from high winds – are also factors (Whitehead et al., 2000).Discrepancies exist between the needs of thepublic and the priorities of emergency managers.Perhaps surprisingly, experience of ‘false’ hurricanewarnings and ‘unnecessary’ evacuation ordersseems to have little influence on the likely futurebehaviour of residents in South Carolina (Dow andCutter, 1997 and 2000). Special problems exist.For example, the Lower Florida Keys are over 100km from the closest mainland. As much as sixhours before hurricane landfall, a storm surge maystart to flood low points on the highways, whilstthe highway network would struggle with the
Box 9.4
IMPROVING HURRICANE EVACUATION IN THE UNITED STATES

SEVERE STORM HAZARDS 205
Land use planning
Much of the structural damage to property, eitherfrom hurricane winds or storm surge forces, occursalong the coast, often in the foreshore dunes area orin houses within 100 m of the shore. Restrictionson near-shore development are, therefore, an impor-tant tool in reducing losses. But, rapid changes incoastal land use, together with the perceiveddesirability of waterfront locations, continue toexpose more people and buildings to risk. The coastof the United States is subject to a variety of federal,state and local laws. Land use planning, operatedthrough zoning ordinances, has operated in thevulnerable Lower Florida Keys area for over 40 yearsbut has had comparatively little influence onresidential development. Since 1975 newly con-structed houses have floors built at least 2.4 m abovemean sea level (the 1:100-year flood level) in orderto comply with National Flood Insurance Program.Although 90 per cent of new residential construc-tion is elevated on stilts, the protection offered hasbeen eroded by the building of enclosed garages andrecreation rooms in the space below the property.Moreover, ground level houses remain an attractiveoption, especially for more elderly residents andmost residents would rebuild at the same locationif the property were ever destroyed.
However, where damaged property has been re-built, for example in North Carolina after‘Hurricane Fran’, there is evidence of the imple-mentation of stronger building codes although set-back compliance was still limited so that shore-linestructures remained vulnerable to beach erosion
(Platt et al., 2002). Subsidised physical shore-protection schemes, such as those undertaken by theUS Army Corps of Engineers, have been criticisedfor encouraging development near beach areas buta study in Florida showed no influence of theseschemes on either house prices or developmentactivity (Cordes et al., 2001). This may be becausestricter land-use regulations associated with shoreprotection offset the benefits expected from reducedstorm damage. In addition, some hurricane-pronecommunities have started to slow the populationgrowth. According to Baker (2000), the island ofSanibel, Florida, accepted restrictions on the annualnumber of new housing units as early as 1977,citing restrictions on emergency evacuation as theprime reason. Since then the state has regulatedresidential and commercial development morefirmly than in the past.
KEY READING
Elliott, J. R. and Pais, J. (2006) Race, class and‘Hurricane Katrina’: social differences in humanresponses to disaster. Social Science Research 35:295–321. A case study with wider implications.
Lindell, M. K., Lu, J-C. and Prater, C. S. (2005)Household decision-making and evacuation inresponse to Hurricane Lili. Natural Hazards Review6: 171–9. Practical problems associated withemergency management.
Pielke, R. A. Jr and Pielke, R. A. Sr (1997)Hurricanes: Their Nature and Impacts on Society.
traffic flows if large numbers of people had to beevacuated along US Highway 1.
‘Hurricane Katrina’ clearly highlighted theneed for more care provision for evacuees. Whenpeople are displaced they suffer physical andemotional stress. These problems are intensifiedfor the disadvantaged, such as low-income groupswithout health insurance cover. It is important to
appreciate the scale of the emergency communi-cations and support services required. During the2005 hurricane season, the American Red Crossopened 1,400 shelters and provided 3.8 millionovernight stays together with more than 68million meals and snacks. Eight months after thestorms more than 750,000 evacuees were stilldisplaced from their homes throughout the USA.

J. Wiley and Sons, Chichester. This remains aneffective introduction to tropical cyclones.
Olshansky, R. B. (2006) Planning after ‘HurricaneKatrina’. Journal of the American Planning Association72: 147–54. Raises questions not always askedfollowing a major disaster.
WEB L INKS
Hurricane Insurance Information Centre www.disasterinformation.org/
NOAA Katrina web portal www.katrina.nooa.gov/
US National Hurricane Center www.nhc.noaa.gov/
US National Oceanic and Atmospheric Admini-stration www.noaa.gov
Seasonal hurricane forecasts for the Atlantic basinwww.typhoon.atmos.colostate.edu
THE EXPER IENCE AND REDUCT ION OF HAZARD206

THERMAL EXTREMES, D ISEASE EP IDEMICS AND WILDFIRES
The term ‘biophysical hazards’ covers a widespectrum of environmental risk created byinteractions between the geophysical environmentand biological organisms, including humans. Insome cases, variations in the physical environmentcause the hazard directly, as when periods ofunusually hot or cold weather threaten human lifethrough physiological stress. In others, the hazardarises from the biological end of the spectrum.Human disease is the most common of allenvironmental hazards. Infectious diseases accountfor over 25 per cent of all deaths globally and fortwo-thirds of all deaths in children less than fiveyears old. Many fatal diseases are endemic in poorcountries and epidemics of infectious disease arecommon. For example, epidemics of diarrhoea occur regularly in tropical countries when floodscontaminate drinking water supplies or destroysewerage systems. Public health disasters also occurwhen a pathogen (virus, bacteria or parasite) createsa disease outbreak amongst a human populationlacking immunity. World-wide disease outbreaks,called pandemics, have occurred throughout history(McMichael, 2001). The Black Death pandemicduring the fourteenth century probably killed morethan 50 million people.
Other biophysical hazards, often initiated byatmospheric events, result when a rapid upsurge inpests and diseases destroys crops and threatens foodsecurity. An outbreak of potato blight disease(Phytophora infestans) in mid-nineteenth centuryIreland was triggered by unusually warm and wetweather in 1845. This led to at least 1.5 millionfamine-related deaths over the following three yearsand the emigration of about one million people. Likemost organisms, pests produce more offspring thanrequired for replacement of the adults when they dieand the stability of populations is usually maintainedthrough high juvenile mortality. If the environ-mental factors controlling juvenile mortality areeased, many species have the capacity to attainplague proportions. This is most likely to occur inarid and semi-arid areas that can be transformed by rains. The desert locust (Schistocerca gregaria)responds quickly to conditions that enable it toswitch from a solitary phase to a swarming phase.Rain encourages the female to lay her eggs in wetground and provides vegetative growth to feed theimmature, wingless locusts after they have hatched.Once they become adult, winged locusts migratebetween areas of recent rainfall, sometimes coveringthousands of kilometres in a matter of weeks, andconsume vast quantities of crops. In 2004, locustinvasions of the Sahel region were the worst for 15years following a very wet winter in the mountains
10
BIOPHYSICAL HAZARDS

of north-west Africa (IFRCRCS, 2005). An appealfor US$ 9 million to support early local control(achieved by burying the wingless locusts in theground) failed, and by June 2004 half of Mauretania’scereal crop was destroyed, along with 40 per cent ofNiger’s animal fodder, and nine million people wereshort of food. In total, 13 West African countrieswere affected and about 4 million ha of land wastreated with airborne insecticide sprays. These sprayscost more than US$ 10 million per year. Given thelow value of the crops protected, it is doubtful if thisapproach is economically successful (Krall, 1995).
Wildfires develop because surface material,normally natural vegetation, is sufficiently dry toburn and the prevailing weather conditions encour-age the fire to spread. The fires may be ignited eitherby natural events, such as lightning strikes, or byhuman actions, such as sparks from a campfire. Themost dangerous wildfires mirror the increasingrecreational and development pressures on land atthe interface between native bush and urban areas.
EXTREME TEMPERATURE HAZARDS
The average human body is most efficient at a coretemperature of 37°C. Compared with the naturalvariations of air temperature, physiological comfortand safety can be maintained within only a relativelynarrow thermal range. Irreversible deterioration and death frequently occur if the internal bodytemperature falls below 26°C or rises above 40°C.
Cold stress
Cold stress can create physiological damage in theform of hypothermia or frostbite. The effects of lowtemperature alone are compounded by wind andmoisture, so that windchill, for example, is causedby the combination of low temperature and highwind speed. Outside the tropics, most temperature-related mortality is associated with outbursts of coldarctic air into the mid-latitudes during spells ofsevere winter weather. A regular pattern of excesswinter deaths occurs in many MDCs, including the
United States and Europe, and exceeds the loss oflife currently due to heat stress. This pattern is dueto the adverse effect of low temperatures on existingcommon illnesses, such as coronary thrombosis andrespiratory disease.
Within Europe, the highest excess winter deathrates exist in Portugal, Spain and Ireland (ratherthan Scandinavia) and have been linked to povertyand poor housing conditions (Healy, 2003). The UKalso fares badly. Wilkinson et al. (2001) found thatdeaths in England from heart attacks and strokeswere 23 per cent higher during December andMarch than in other months. Mortality rose by 2 percent for every 1°C fall in outdoor temperature below19°C. Older people (over 65 years) living in poorlyheated houses with low energy efficiency were atgreatest risk. In Scotland there is a difference of 30per cent between the summer trough of weeklydeath rates and the winter peak (Gemmell et al.,2000). The highest cold-related death rates occurduring the most severe winter weather. Thedevelopment of a winter ridge of high pressure overnorth-west North America encourages arctic air topenetrate through the Midwest of the USA andbring air frost to Florida. When this happens, manyexcess deaths result from hypothermia and cold-aggravated illnesses together with indirect deathsdue to snow shovelling, exposure, house fires due tothe use of emergency heaters and automobile acci-dents. Once again, the elderly and the poor, includ-ing the homeless, suffer the most.
The most common adjustment to cold stress isthrough additional clothing and improved housing.In the MDCs, domestic central heating systems arewidely used to combat cold conditions but therising cost of energy makes this response eco-nomically difficult for poor people living inproperties which have inadequate heat sources andlack good thermal insulation.
Heat stress
Heat stress creates the greatest hazard when bothatmospheric temperature and humidity are high andphysical discomfort turns into disease and mortality.
THE EXPER IENCE AND REDUCT ION OF HAZARD208

B IOPHYSICAL HAZARDS 209
The amount by which the temperature exceeds thelocal mean is more important than the absolutevalue of temperature and the threat is high in thefirst heat wave of the season before acclimatisationcan occur. After several days of excessive heat, themortality rate typically increases to two and threetimes the normal seasonal rate. Extreme heat wavesare experienced widely in the United States and havea greater adverse effect on human health, especiallyamong the elderly and those with existing heartdisease, than any other type of severe weather(Changnon et al., 1996). Other high-risk groups arethe urban poor, especially people who lack domesticair conditioning or those dependent on alcohol ordrugs. Heat waves in the USA have been well-documented: in 1966 a 36 per cent increase indeaths was recorded over a five-day period (Bridgerand Helfand, 1968), in 1955, 946 excess deathsresulted in Los Angeles, more than twice the mor-tality recorded in the 1906 San Francisco earthquakeand fire (Oeschli and Buechly, 1970) and over 700people died in Chicago in 1995 (Klinenberg, 2002).
Heat stress is an environmental hazard thatprimarily affects high-income countries and isconfidently expected to increase with global warm-ing with a possible doubling of heat-related deathsworldwide by 2020. During the 2003 summer inEurope, the warmest on record since 1500 withtemperatures reaching 40°C, over 30,000 excessheat-related deaths were reported (Haines et al.,2006). Half of these fatalities (14,947) occurred inFrance during August (see Figure 10.1) whenoverall excess mortality averaged 60 per cent andparts of Paris experienced values over 150 per cent(Poumadère et al., 2005). Apart from temperature,many socio-economic factors were implicated in thisdisaster including age, gender, dehydration, medi-cation, urban residence, poverty and social isolation.Most fatalities were elderly people living alone incities where many medical staff were absent for thetraditional summer holiday. Stott et al. (2004)claimed that man-made atmospheric warming hasalready more than doubled the risk of Europeansummers as hot as 2003 and, according to Lagadec
2000
1600
1200
800
400
-200
0
40
35
30
25
20
15
10
Mo
rtal
ity
August 2003
Tem
per
atur
e(°
C)
28272625242322212019181716151413121110987654321
Male excess mortality
Female excess mortality
Maximum temperature
Minimum temperature
Figure 10.1 The number of excess deaths recorded in France each day during the 2003 heatwave in relation tomaximum and minimum temperatures. Between August 4 and 15 almost 15,000 deaths directly attributed to heatoccurred mainly caused by dehydration, hyperthermia and heat stroke. After Poumadère et al. (2005).

(2004), the scale and complexity of the impactexposed a lack of preparedness for such urbandisasters in the developed countries.
Urban areas pose the greatest risks – partlybecause of socio-economic disadvantage – but alsobecause of the enhanced heat-island effect, and thereis growing awareness of the need to reduce the heat-related health inequalities in inner-cities (Harlan etal., 2006). This problem was highlighted for a heatwave in the New York-New Jersey metropolitanarea over thirty years ago when up to 200 extradeaths occurred in the city core over the numberexpected in the suburbs (Beechley et al., 1972).Neighbourhood microclimates can be modifiedthrough the shading of houses by trees against directsolar radiation and by the use of higher-albedobuilding materials to reflect more of the incidentradiation on individual properties (Solecki et al.,2005). The planting of trees can also be useful inreducing urban air pollution, often a contributoryfactor in heat stress, although inner cities rarely havespace for more vegetation. The wider introductionof domestic air conditioning is likely to be a majorresponse in the MDCs but the widespread lack ofsuch facilities for most inhabitants of Third Worldcountries is likely to continue.
THE NATURE OF DISEASE EP IDEMICS
Over millions of years, biological adaptation hasenabled Homo sapiens to evolve through a process ofnatural selection that has helped the species to resistdisease. For example, mass migrations and inter-marriage have produced a genetic diversity amongsthuman populations that promotes disease resistancebecause it reduces the chance of a new organismbeing introduced into a community. In Africa, long-term exposure to malaria provides some immunity.More recently, an increase in medical knowledge andthe spread of good practice in public health – bothtrends evident since the nineteenth century – has ledto further controls on infectious diseases. During the1960s and 1970s, with the introduction of new
antibiotic drugs and vaccines, the goal of eliminatingdisease epidemics appeared attainable, at least for theMDCs. This mood of complacency has since beenreplaced by one of concern due to the rapid re-emergence of old diseases and the emergence of newones (Noji, 2001). One example of an ‘old’ disease isplague, the disease responsible for the ‘Black Death’of the Middle Ages. This is an infectious disease ofanimals and humans caused by the bacteriumYersinia pestis. It is normally transferred to humansby a rodent flea. The World Health Organization(WHO) still reports around 3,000 cases per year. A‘new’ disease is Ebola hemorrhagic fever. The Ebolavirus was first identified in Sudan and Zaire in 1976and kills 50–90 per cent of infected humans withina few days. It is believed to be a zoonotic (animal-borne) disease but it is not clear which animalsconstitute the natural reservoir for the disease.Infections are acute and, at present, there is no cure.
The spread of disease in recent decades has beenfacilitated by a general breakdown in public healthoperations throughout the world (Garrett, 2000).Good public health services are vital for diseaseprevention – through the greater use of clean water,sanitation, safe food, prophylactic drugs andimmunisation, health education and mass screeningfor communicable and preventable diseases. But thecurrent emphasis is on disease cure, a thrust encour-aged by multi-national pharmaceutical companiesand the privatisation of government health care.According to Berlinguer (1999), an earlier belief inhealth as a cornerstone of economic development hasbeen replaced by a view that health services are anobstacle to growth. The result is a public healthcrisis. Another recent cause of disease outbreaks isthe crowding of refugees into emergency camps. Inthese circumstances, the risk of infection fromcommunicable disease increases for all three modesof transmission:
• Person-to-person transmission – e.g. measles,meningitis, tuberculosis
• Enteric (intestine) transmission – e.g. diarrhoealdiseases, hepatitis
• Vector-borne transmission – e.g. malaria.
THE EXPER IENCE AND REDUCT ION OF HAZARD210

B IOPHYSICAL HAZARDS 211
In the poorest countries of Asia and Africa, endemicdiseases like measles and tuberculosis, which havebeen effectively eradicated from the MDCs, have acontinuing debilitating effect on people. Localpopulations have a reduced ability to produce foodor earn a living and they become more vulnerable toother hazards. It is estimated that almost 60 per centof deaths due to infectious diseases are among thepoorest 20 per cent of the world’s population whilstonly 7 per cent of victims are in the richest 20 percent (IFRCRCS, 2000). Such imbalances are likelyto remain. As shown in Figure 10.2, public expendi-ture on health in low-income countries averages 1per cent of gross domestic product (GDP) comparedwith the 6 per cent spent in high-income countries.This pattern is a cause for concern given that lessthan 5 per cent of the total global spend on bio-medical research is allocated to the chief killerdiseases in the LDCs when millions of annual deathsfrom infectious diseases could be prevented at a costof only US$5 per person.
Disease epidemics create special problems and aredefined by the World Health Organization as:
the occurrence of a number of cases of a disease, knownor suspected to be of infectious or parasitic origin, thatis unusually large or unexpected for the given place andtime. An epidemic often evolves rapidly so that a quickresponse is required.
From this definition it is clear that epidemics sharemany characteristics of rapid-onset environmentalhazards but little attention has been paid to the basichazard concepts of human exposure and vulnerabilityor to disease ecology (Box 10.1). Bacterial, viral andparasitic infections are all capable of causing disasters,especially in the poorest countries of the world,through the transmission to humans of pathogens viainsects, rodents or other vector organisms. Some vectors(lice, bugs, fleas and certain mosquitoes) benefit fromhuman-aided transport. Others, such as mosquitoes,biting midges and flies, are sensitive to weatherconditions like temperature, humidity, rainfall (forsurface water) and tend to migrate spontaneously(Lounibos, 2002).
The re-emergence of old diseases and theemergence of new ones can be attributed to acomplex interaction of factors involved in globalchange (Molyneux, 1998; Murphy and Nathanson,1994). These factors fall into three categories:
• Changing environmental factors – changes toenvironmental conditions alter the ecologicalniches occupied by infected hosts and the vectorsof existing disease. This allows epidemics tospread to new areas. Such changes include urban-isation, economic development, water resourcedevelopment (more dams and irrigation),
India
Cambodia
Zimbabwe
Botswana
Kenya
Uganda
Thailand
China
Albania
Turkey
Belarus
Costa Rica
United States
Germany
0 2 4 6 8 10%
Averagelow-incomecountries
Averagemiddle-income
countries
Averagehigh-income
countries
Low income
Middle income
High income
Figure 10.2 Examples ofspending on health provision bynational governments as apercentage of gross domesticproduct (GDP) in low, mediumand high income economies. The lowest proportions occur inthe poorest countries. AfterIFRCRCS (2000).

THE EXPER IENCE AND REDUCT ION OF HAZARD212
Noji (1997) defined epidemiology as ‘the quanti-tative study of the distribution and determinantsof health-related events in human populations’. Itis a specialised branch of public health medicineserved by many agencies – such as the Centers forDisease Control and Prevention (CDC) based inAtlanta, Georgia – and a variety of emergencyresponse units worldwide. An important objectiveof epidemiology is to reduce the effects of naturaldisaster on disease, a link that is most prevalentfor flood, drought and hurricane disasters, byundertaking three activities:
• surveillance – the study of endemic diseaselevels and an associated vulnerability analysisof local populations before disaster strikes
• assessment of disaster impacts – short-termfield surveys and other methods to monitordisease outbreaks and the nature of theemergency responses
• evaluation – the appraisal of the overallresponse to the health impacts of disaster as anaid to better planning for the future.
In the period immediately following a disaster, thethreat of an outbreak of infectious disease is highand the priority of the emergency health responseis to prevent an epidemic of any diseases likely tocause excess mortality. Aid agencies always givepriority to basic post-disaster operations such asdisease vector control, the management of humanwaste disposal, good personal hygiene and the safepreparation of food.
The conditions necessary for disease epidemicsoften exist before a pathogen is introduced into asuitable environment after a disaster. The under-lying pre-disposing factor is poverty. Infants andchildren in the LDCs are several hundred timesmore likely to die from diarrhoea, pneumonia andmeasles than those in Europe or North America
(Cairncross et al., 1990). Poor housing, mal-nutrition, lack of hygiene to protect againstvectors, inadequate clean water supplies andrestricted access to healthcare facilities all play apart. For example, in Peru the poor suffer fromover 20 water-borne diseases and a major choleraoutbreak in the early 1990s was attributed to acombination of contaminated water supplies andpoor hygiene (Witt and Rieff, 1991). Many urbancentres lack a safe sewerage system and rendertheir populations vulnerable to many diseases.
There is a very wide range of communicabledisease epidemics that can occur after naturaldisasters (Ligon, 2006). According to Seaman et al. (1984), such outbreaks may result from:
• diseases present in the population before theevent
• ecological changes resulting from a naturaldisaster
• population movements• damage to public utilities• disruption of disease control programmes • altered individual resistance to disease.
Natural disasters often provoke large populationmovements and subsequent housing in refugeecamps. People, frequently malnourished and witha low level of disease immunity, are crowded intotemporary shelters with inadequate sanitationfacilities and depend on contaminated water anda shortage of food (Morris et al., 1982; Waring andBrown, 2005). For example, after the 1991eruption of Mount Pinatubo, Philippines, over100,000 refugees were accommodated in 100 suchcamps. The migrants themselves bring in newpathogens or move into a contaminated area andcatch disease because of their lower resistance.Such factors often combine. For example, vector-borne diseases – especially malaria and yellow
Box 10.1
DISEASES AND DISASTERS

B IOPHYSICAL HAZARDS 213
deforestation and climate change. All these canpotentially increase human exposure to insectvectors or sources of new pathogens.
• Changing socio-economic factors – changes inmedical practice and in human behaviour canassist the rise and the spread of both old and newdiseases. Relevant factors include the trend tomore cross-border travel, delays in developingnew antibiotics, reduced disease surveillance inareas known to be disease-prone, reducedfunding for public health-care facilities. Othermajor factors are wars, poverty and changes inhuman sexual behaviour.
• Changing viral profiles – changes in drug resistanceare a feature of several disease agents, a featuresometimes caused by the over-use of antibioticsand other drug therapies. In particular, new virusdiseases appear to be emerging in both animalsand humans with greater frequency due tocontinuous virus evolution and genetic mutation.Such changes occur when viruses replicate, becausethe genes may recombine and re-assort. Someviruses can recombine with genetic elements oftheir host cells and thus acquire new genes.
The first entirely new disease epidemic of thetwenty-first century was the SARS (Severe AcuteRespiratory Syndrome) outbreak of early 2003. Thedisease started in southern China during November2002 when an animal virus jumped species to infecta human. Instead of dying, the virus multiplied andspread rapidly within the local community. Withinsix weeks of the recognition of the new disease bythe WHO, SARS had been spread by internationalair travel to about 30 different countries worldwideand, in the absence of a cure, several hundred peopledied. Most countries used strict isolation measuresto prevent the virus from infecting the generalpublic but the disease proved difficult to control insouthern China and other warm, humid areas ofsouth-east Asia. In the future, it is likely that avaccine will be developed so that SARS can be addedto the expanding list of diseases for which travellerswill require protection. Some major ‘new’ diseasesfor which little or no medical treatment is currentlyavailable are indicated in Box 10.2.
fever – increase after floods in tropical areas due tothe increase in mosquito and other insect breedingsites. Any loss of housing will cause people to liveoutdoors and be at greater risk from biting insects.‘Hurricane Flora’ struck Haiti in 1963. It left200,000 people homeless and an estimated 75,000cases of malaria occurred over the following sixmonths (Mason and Cavalie, 1965). The epidemicwas due to several interacting factors; an incom-plete malaria eradication programme, the washingof insecticide from houses by heavy rain, anincrease of mosquito breeding in areas of standingwater and a lack of shelter for the local population.
In the worst cases, malarial epidemics mayspread to urban areas previously free of suchdiseases through infected people sheltering withrelatives or moving around in search of food,construction materials and employment. Other
sources of epidemic disease are rats, which act asreservoirs of plague and often emerge from sewersafter floods, and abandoned dogs infected withrabies that are more likely to bite humansfollowing a breakdown in living conditions. Thephysical disruption of water supply and sewagedisposal systems is most serious in areas wheresanitation levels are already low. In Bangladeshfour-fifths of the population rely on tube wells fordrinking water and use surface sources – such asshallow ponds – for bathing, washing andcooking. After the 1991 cyclone, about 40 percent of the tube wells were damaged and thesurface sources became highly contaminated withsewage and salt (Hoque et al., 1993). As a result,water became extremely scarce and there was alarge increase in diarrhoeal diseases.

THE EXPER IENCE AND REDUCT ION OF HAZARD214
The most significant newly emerging diseases arethose of the Flavivirus family. This group is namedfrom one of greatest plague diseases, yellow fever.‘Flavus’ is Latin for yellow and the diseases areassociated with jaundice and the yellowing of avictim’s skin. They originated from a commonancestor 10–20,000 years ago but are nowevolving effectively to fill new ecological niches(Solomon and Mallewa, 2001). More than 70flaviviruses have been identified but only abouthalf cause disease in humans and only a few are ofglobal importance (Table 10.1). The natural viralhost is found in local wildlife. In the vast majorityof cases, the disease is carried to humans byarthropod (insect) vectors – mosquitoes in thetropics and ticks in the higher latitudes. A smallnumber of disease transmissions occur throughrodents and bats (Fig. 10.3). Tick-borneflaviviruses are less important than mosquito-borne viruses for human disease because tickspecies feed on animals in the wild rather thanhumans. Tick-borne diseases also tend to be morerestricted geographically. For example, Louping illvirus is the only flavivirus found naturally in the British Isles but tick-borne encephalitis(inflammation of the brain) is an important sourceof infection in Europe and parts of Asia. Many ofthe mosquito-borne diseases have been known forcenturies but have recently up-surged due tocombinations of environmental, socio-economicand viral factors.
Dengue fever
Dengue fever has been widespread in the tropicsfor over 200 years with intermittent pandemicsemerging at roughly 10–40 year intervals.Together with dengue hemorraghic fever (DHF),
it is caused by one of four related virus serotypesof the genus Flavivirus. Infection with oneserotype provides no immunity against any of theother three. It is also unusual in that humans arethe natural hosts for the virus. Humans areinfected by Aedes aegyti, a domestic, day-bitingmosquito. The population density of this insect ishighly dependent on human habitation. Waterstorage facilities and the availability of breedingsites around residential buildings are key factorsin promoting the disease. Dengue fever is now themost widely distributed mosquito-borne diseaseof humans (Fig. 10.4). Its emergence during thetwentieth century has been attributed to poorvector control, over-crowding of refugee and urbanpopulations and more frequent internationaltravel.
Between 1947 and 1972, the world-wideenthusiasm for DDT sprays eliminated Aedesaegypti from 19 countries but dengue feverepidemics have increased markedly in the last 30 years, partly because effective mosquito controlis now almost non-existent in the countries whereit is endemic (Monath, 1994). In the Pacificregion, dengue viruses were re-introduced in the1970s after an absence of over 25 years and therehas been a remarkable re-emergence in Central andSouth America where the geographical distri-bution is now wider than it was before themosquito eradication programme. For the patient,dengue fever produces a range of viral symptomscapable of developing into severe and fatalhemorrhagic disease. There are approximately 100million cases of infection per year with 2.5 billionpeople at risk (Ligon, 2004). The case-fatality ratefor DHF is low at 5 per cent, mostly amongchildren and young adults. No dengue vaccine isavailable.
Box 10.2
THE EMERGING FLAVIVIRUSES
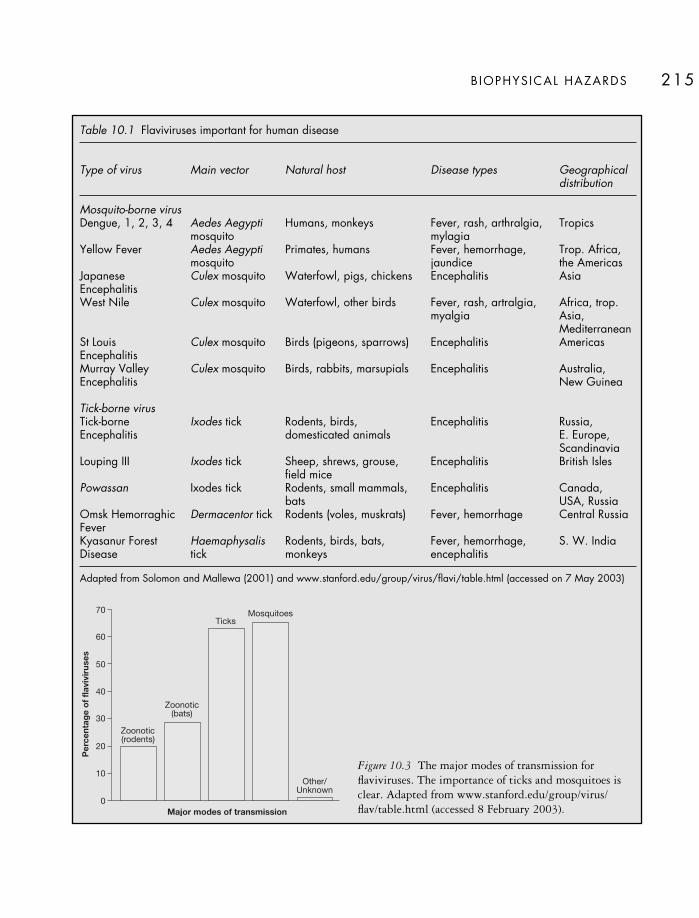
B IOPHYSICAL HAZARDS 215
Table 10.1 Flaviviruses important for human disease
Type of virus Main vector Natural host Disease types Geographical distribution
Mosquito-borne virusDengue, 1, 2, 3, 4 Aedes Aegypti Humans, monkeys Fever, rash, arthralgia, Tropics
mosquito mylagiaYellow Fever Aedes Aegypti Primates, humans Fever, hemorrhage, Trop. Africa,
mosquito jaundice the AmericasJapanese Culex mosquito Waterfowl, pigs, chickens Encephalitis AsiaEncephalitisWest Nile Culex mosquito Waterfowl, other birds Fever, rash, artralgia, Africa, trop.
myalgia Asia, Mediterranean
St Louis Culex mosquito Birds (pigeons, sparrows) Encephalitis AmericasEncephalitis Murray Valley Culex mosquito Birds, rabbits, marsupials Encephalitis Australia, Encephalitis New Guinea
Tick-borne virusTick-borne Ixodes tick Rodents, birds, Encephalitis Russia, Encephalitis domesticated animals E. Europe,
ScandinaviaLouping III Ixodes tick Sheep, shrews, grouse, Encephalitis British Isles
field micePowassan Ixodes tick Rodents, small mammals, Encephalitis Canada,
bats USA, RussiaOmsk Hemorraghic Dermacentor tick Rodents (voles, muskrats) Fever, hemorrhage Central RussiaFeverKyasanur Forest Haemaphysalis Rodents, birds, bats, Fever, hemorrhage, S. W. IndiaDisease tick monkeys encephalitis
Adapted from Solomon and Mallewa (2001) and www.stanford.edu/group/virus/flavi/table.html (accessed on 7 May 2003)
70
60
50
40
30
20
10
0
Zoonotic(rodents)
Zoonotic(bats)
TicksMosquitoes
Other/Unknown
Per
cent
age
of
flavi
viru
ses
Major modes of transmission
Figure 10.3 The major modes of transmission forflaviviruses. The importance of ticks and mosquitoes isclear. Adapted from www.stanford.edu/group/virus/flav/table.html (accessed 8 February 2003).
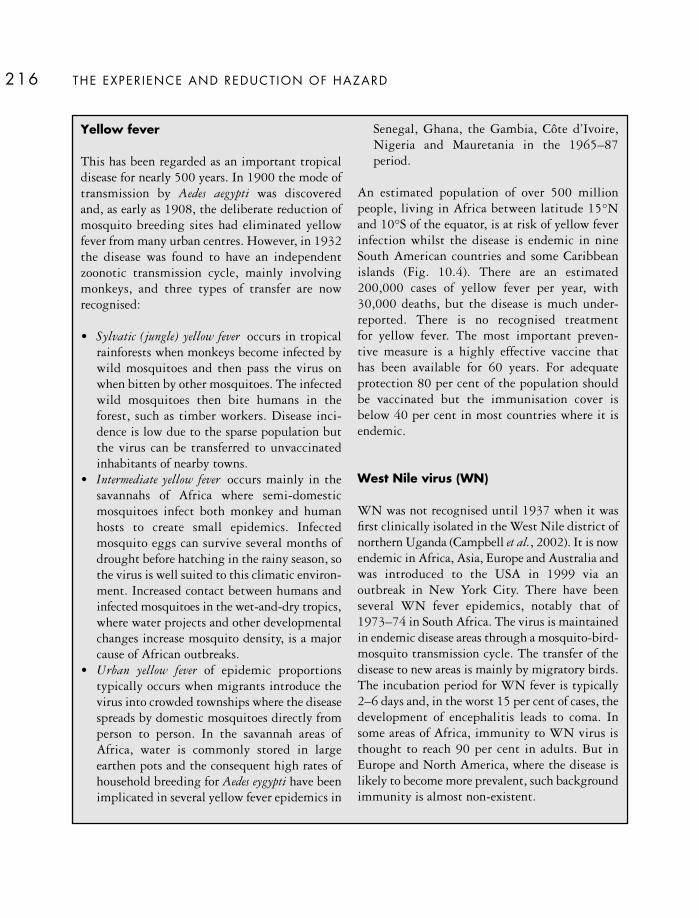
THE EXPER IENCE AND REDUCT ION OF HAZARD216
Yellow fever
This has been regarded as an important tropicaldisease for nearly 500 years. In 1900 the mode oftransmission by Aedes aegypti was discovered and, as early as 1908, the deliberate reduction ofmosquito breeding sites had eliminated yellowfever from many urban centres. However, in 1932the disease was found to have an independentzoonotic transmission cycle, mainly involvingmonkeys, and three types of transfer are nowrecognised:
• Sylvatic (jungle) yellow fever occurs in tropicalrainforests when monkeys become infected bywild mosquitoes and then pass the virus onwhen bitten by other mosquitoes. The infectedwild mosquitoes then bite humans in theforest, such as timber workers. Disease inci-dence is low due to the sparse population butthe virus can be transferred to unvaccinatedinhabitants of nearby towns.
• Intermediate yellow fever occurs mainly in thesavannahs of Africa where semi-domesticmosquitoes infect both monkey and humanhosts to create small epidemics. Infectedmosquito eggs can survive several months ofdrought before hatching in the rainy season, sothe virus is well suited to this climatic environ-ment. Increased contact between humans andinfected mosquitoes in the wet-and-dry tropics,where water projects and other developmentalchanges increase mosquito density, is a majorcause of African outbreaks.
• Urban yellow fever of epidemic proportionstypically occurs when migrants introduce thevirus into crowded townships where the diseasespreads by domestic mosquitoes directly fromperson to person. In the savannah areas ofAfrica, water is commonly stored in largeearthen pots and the consequent high rates ofhousehold breeding for Aedes eygypti have beenimplicated in several yellow fever epidemics in
Senegal, Ghana, the Gambia, Côte d’Ivoire,Nigeria and Mauretania in the 1965–87period.
An estimated population of over 500 millionpeople, living in Africa between latitude 15°Nand 10°S of the equator, is at risk of yellow feverinfection whilst the disease is endemic in nineSouth American countries and some Caribbeanislands (Fig. 10.4). There are an estimated200,000 cases of yellow fever per year, with30,000 deaths, but the disease is much under-reported. There is no recognised treatment for yellow fever. The most important preven-tive measure is a highly effective vaccine that has been available for 60 years. For adequateprotection 80 per cent of the population should be vaccinated but the immunisation cover is below 40 per cent in most countries where it isendemic.
West Nile virus (WN)
WN was not recognised until 1937 when it wasfirst clinically isolated in the West Nile district ofnorthern Uganda (Campbell et al., 2002). It is nowendemic in Africa, Asia, Europe and Australia andwas introduced to the USA in 1999 via anoutbreak in New York City. There have beenseveral WN fever epidemics, notably that of1973–74 in South Africa. The virus is maintainedin endemic disease areas through a mosquito-bird-mosquito transmission cycle. The transfer of thedisease to new areas is mainly by migratory birds.The incubation period for WN fever is typically2–6 days and, in the worst 15 per cent of cases, thedevelopment of encephalitis leads to coma. Insome areas of Africa, immunity to WN virus isthought to reach 90 per cent in adults. But inEurope and North America, where the disease islikely to become more prevalent, such backgroundimmunity is almost non-existent.
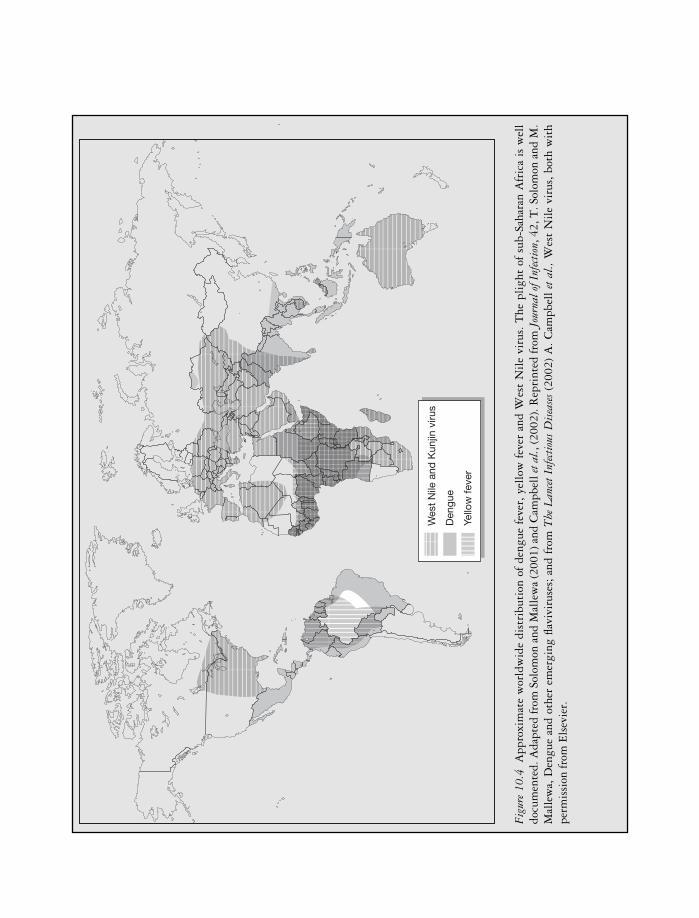
Wes
tN
ilean
dK
unjin
viru
s
Den
gue
Yello
wfe
ver
Fig
ure
10.4
App
roxi
mat
ew
orld
wid
edi
stri
buti
onof
deng
uefe
ver,
yell
owfe
ver
and
Wes
tN
ile
viru
s.T
hepl
ight
ofsu
b-Sa
hara
nA
fric
ais
wel
ldo
cum
ente
d.A
dapt
edfr
omSo
lom
onan
dM
alle
wa
(200
1)an
dC
ampb
elle
tal.,
(200
2).R
epri
nted
from
Jour
nalo
fInf
ecti
on,4
2,T
.Sol
omon
and
M.
Mal
lew
a,D
engu
ean
dot
her
emer
ging
flavi
viru
ses;
and
from
The
Lan
cet
Infe
ctio
usD
isea
ses
(200
2)A
.C
ampb
ell
etal
.,W
est
Nil
evi
rus,
both
wit
hpe
rmis
sion
from
Els
evie
r.
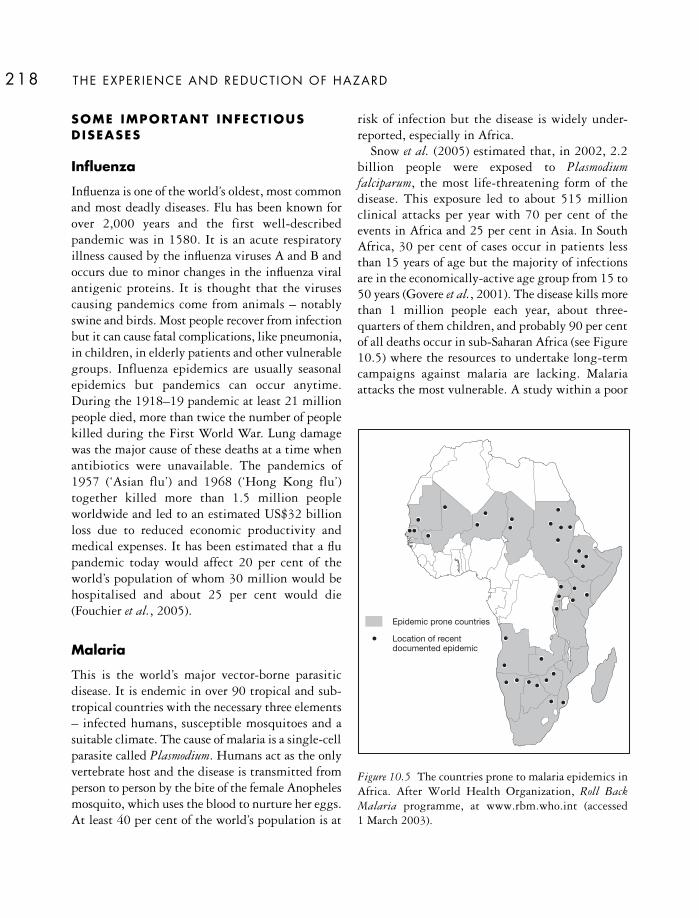
THE EXPER IENCE AND REDUCT ION OF HAZARD218
SOME IMPORTANT INFECT IOUSDISEASES
Influenza
Influenza is one of the world’s oldest, most commonand most deadly diseases. Flu has been known forover 2,000 years and the first well-describedpandemic was in 1580. It is an acute respiratoryillness caused by the influenza viruses A and B andoccurs due to minor changes in the influenza viralantigenic proteins. It is thought that the virusescausing pandemics come from animals – notablyswine and birds. Most people recover from infectionbut it can cause fatal complications, like pneumonia,in children, in elderly patients and other vulnerablegroups. Influenza epidemics are usually seasonalepidemics but pandemics can occur anytime.During the 1918–19 pandemic at least 21 millionpeople died, more than twice the number of peoplekilled during the First World War. Lung damagewas the major cause of these deaths at a time whenantibiotics were unavailable. The pandemics of1957 (‘Asian flu’) and 1968 (‘Hong Kong flu’)together killed more than 1.5 million peopleworldwide and led to an estimated US$32 billionloss due to reduced economic productivity andmedical expenses. It has been estimated that a flupandemic today would affect 20 per cent of theworld’s population of whom 30 million would behospitalised and about 25 per cent would die(Fouchier et al., 2005).
Malaria
This is the world’s major vector-borne parasiticdisease. It is endemic in over 90 tropical and sub-tropical countries with the necessary three elements– infected humans, susceptible mosquitoes and asuitable climate. The cause of malaria is a single-cellparasite called Plasmodium. Humans act as the onlyvertebrate host and the disease is transmitted fromperson to person by the bite of the female Anophelesmosquito, which uses the blood to nurture her eggs.At least 40 per cent of the world’s population is at
risk of infection but the disease is widely under-reported, especially in Africa.
Snow et al. (2005) estimated that, in 2002, 2.2billion people were exposed to Plasmodiumfalciparum, the most life-threatening form of thedisease. This exposure led to about 515 millionclinical attacks per year with 70 per cent of theevents in Africa and 25 per cent in Asia. In SouthAfrica, 30 per cent of cases occur in patients lessthan 15 years of age but the majority of infectionsare in the economically-active age group from 15 to50 years (Govere et al., 2001). The disease kills morethan 1 million people each year, about three-quarters of them children, and probably 90 per centof all deaths occur in sub-Saharan Africa (see Figure10.5) where the resources to undertake long-termcampaigns against malaria are lacking. Malariaattacks the most vulnerable. A study within a poor
Location of recentdocumented epidemic
Epidemic prone countries
Figure 10.5 The countries prone to malaria epidemics inAfrica. After World Health Organization, Roll BackMalaria programme, at www.rbm.who.int (accessed 1 March 2003).

urban area of Kolkata, India, found a high incidenceof the disease and that having a household memberwith malaria, illiteracy, low income and living in adwelling not built of brick led to an increased riskof malaria (Sur et al., 2006).
Epidemics of malaria create major health prob-lems in countries like Thailand where outbreaks,like elsewhere, are closely associated with seasonalrainfall. Other factors, such as farming practices andmovements of population, may also be involved(Wiwanitkit, 2006; Childs et al., 2006). Thissuggests that disease control may be improved byincreased surveillance during the rainy season and,perhaps in Africa, greater preparedness based onearly warnings derived from seasonal climate fore-casts (Thomson et al., 2006).
Cholera
Cholera is an acute intestinal infection caused by thebacterium Vibrio cholerae. It has a short incubationperiod of 1–5 days with early symptoms of diarrhoeaand vomiting. In about 10 per cent of cases, there issevere hydration that, without treatment, can leadto death. Vibrio cholerae is found mainly in aquaticenvironments. Ecologically it is part of the flora ofbrackish water and estuaries in tropical areas and itis spread to humans through contaminated food andwater. Cholera has an ability to spread rapidly intonew areas and create pandemics. For example, in1970 and 1991, the disease struck West Africa andLatin America respectively, although both regionshad not suffered major outbreaks for around 100years. It is now endemic in both continents. Likemany infectious diseases, it is particularly dangerouswhen newly introduced into an unprepared areawhere the fatality rate per infected case can reach 50per cent. Multiple causes are associated with alloutbreaks. In rural north-east India during 2002,inadequate antibacterial treatment, plus poorhygiene and sanitation were responsible (Phukan etal., 2004) whilst urban epidemics in Peru during1991 were associated with the micobial contami-nation of water supplies due to poor separation ofwater supply and waste disposal systems and
ineffective chlorination procedures (Tickner andGouveia-Vigeant, 2005).
DISEASE HAZARD REDUCTION
As with other environmental hazards, the effectivemitigation of infectious diseases depends onreplacing public apathy and emergency responseswith a strategy aimed at long-term control andprevention. Such a strategy has several key features.
Surveillance
Good surveillance is critical for the promptrecognition and control of an emerging epidemic,especially in countries where the population has alow rate of vaccination cover. If a disease is wellknown, like cholera, it can be recognised early andaction taken to control the epidemic. Other diseases,like dengue fever, are more difficult to identify. Theycan also spread quickly into areas with highconcentrations of Aedes aegypti mosquitoes andproduce new virus strains and serotypes againstwhich there is little local resistance. Apart fromhindering an effective response to infections, poorsurveillance leads to the routine under-reporting ofmany diseases, such as yellow fever. Once a diseaseoutbreak is suspected, there is a need for rapid accessto laboratory testing and diagnostic facilities. Manydiseases now present a world-wide problem and, in1984, the World Health Organization (WHO)established the Global Influenza SurveillanceNetwork, using 110 laboratories in 82 countries, asan alert system for the identification of new viruses(Kitler et al., 2002).
Disease prevention
Where an effective vaccine is available, immunisationis the best defence against infectious disease. Forexample, a good vaccine exists for yellow fever. Thisprovides immunity within one week for 95 per centof people vaccinated. The immunity lasts at least 10years and has few side effects. Following the success
B IOPHYSICAL HAZARDS 219

of global immunisation programmes in the 1960sand 1970s to eradicate smallpox, the WHO re-organised its emergency division in 1993 with aview to extending such responses to epidemics. Massvaccinations could save millions of lives each yearfrom common diseases like tuberculosis, measles,whooping cough, tetanus and diphtheria but thecost is high and the support infrastructure of health-care clinics is often missing. In addition, it isestimated that up to 80 per cent of the populationneeds to be vaccinated to prevent epidemics.
Vector control is the other key element in diseaseprevention. For example, special attempts are madeto suppress mosquitoes by pesticide applications atthe beginning of a disease outbreak before vaccina-tion programmes take effect. For dengue fever, theabsence of vaccines or any other cure means that preventive measures are the only option butvector control programmes have had little success(Brightmer and Fantato, 1998). Such responsescould be improved by the mapping of mosquitobreeding sites and preparedness campaigns designedto increase local awareness of such sites. Althoughliquid pesticides can be effective in controllingdiseases like malaria, the longer-term ecologicaleffects of large-scale applications are not wellunderstood.
Treatment
If administered in good time, treatments can beeffective in dealing with the clinical symptoms ofsome infectious diseases. In the case of malaria, ithas been suggested that infants and children inAfrica should be treated even before they show anysymptoms (Vogel, 2005). Simple treatments can beeffective. For example, the dehydration and feverassociated with yellow fever can be treated with oral rehydration salts and paracetomol, although any bacterial infection will need antibiotics.Unfortunately, many patients die before reachinghospital – often through a lack of local transport. Inmany urban areas, there is a shortage of medicalprovision and, in parts of East Africa, over 50 percent of hospital beds are occupied by AIDS victims.
Some diseases lack reliable hospital therapies. Forexample, malaria parasites quickly become resistantto drugs. Resistance to chloroquine is high, parti-cularly in SE Asia, and there is a need for new anti-malarial drugs. In other instances, such as cholera,oral vaccine may be available but in such smallquantities that it is used for individual travellersrather than the public as a whole. With pandemics,like AIDS, antiretroviral drug combinations (ARVs)have been used to good effect in the MDCs but theexpense places them beyond the means of govern-ments in the LDCs. Such countries also lack theclinical expertise and infrastructure necessary toadminister some therapies in an optimal way.Because public health facilities are under threat inso many countries, there is a need for internationalpartnerships capable of taking a longer-term view.Roll Back Malaria is a scheme initiated in 1998 bythe WHO, UNDP, UNICEF and the World Bankto work with governments, NGOs, and the privatesector in order to reduce the impact of this disease.
Education
In the longer term, people at risk must becomebetter informed about infectious diseases. Ideally,public education should be re-enforced by primaryhealth care, including local facilities – like phar-macies and reference laboratories – combined withgood community health practice taught to emer-gency health managers and local officials throughregional workshops. In many areas, parallelimprovements in domestic water supply andsanitation, are required to combat diseases likecholera that spread through contaminated food andwater.
Some educational responses are simpler, cheaperand quicker to implement at the community level.Thus, an understanding of the importance of betterpersonal hygiene, the effective maintenance oflatrines, the introduction of safe water supplies andsuitable methods for rubbish disposal would help.The hygienic disposal of human waste, safe waterand food supplies are crucial steps against choleraepidemics, especially when linked to basic house-
THE EXPER IENCE AND REDUCT ION OF HAZARD220
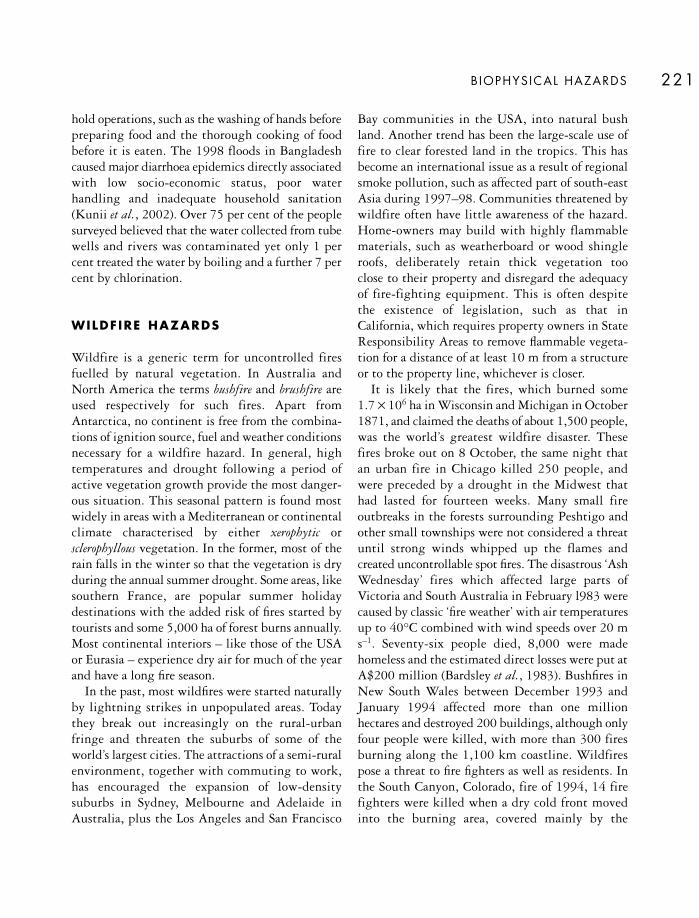
B IOPHYSICAL HAZARDS 221
hold operations, such as the washing of hands beforepreparing food and the thorough cooking of foodbefore it is eaten. The 1998 floods in Bangladeshcaused major diarrhoea epidemics directly associatedwith low socio-economic status, poor waterhandling and inadequate household sanitation(Kunii et al., 2002). Over 75 per cent of the peoplesurveyed believed that the water collected from tubewells and rivers was contaminated yet only 1 percent treated the water by boiling and a further 7 percent by chlorination.
WILDFIRE HAZARDS
Wildfire is a generic term for uncontrolled firesfuelled by natural vegetation. In Australia andNorth America the terms bushfire and brushfire areused respectively for such fires. Apart fromAntarctica, no continent is free from the combina-tions of ignition source, fuel and weather conditionsnecessary for a wildfire hazard. In general, hightemperatures and drought following a period ofactive vegetation growth provide the most danger-ous situation. This seasonal pattern is found mostwidely in areas with a Mediterranean or continentalclimate characterised by either xerophytic orsclerophyllous vegetation. In the former, most of therain falls in the winter so that the vegetation is dryduring the annual summer drought. Some areas, likesouthern France, are popular summer holidaydestinations with the added risk of fires started bytourists and some 5,000 ha of forest burns annually.Most continental interiors – like those of the USAor Eurasia – experience dry air for much of the yearand have a long fire season.
In the past, most wildfires were started naturallyby lightning strikes in unpopulated areas. Todaythey break out increasingly on the rural-urbanfringe and threaten the suburbs of some of theworld’s largest cities. The attractions of a semi-ruralenvironment, together with commuting to work,has encouraged the expansion of low-densitysuburbs in Sydney, Melbourne and Adelaide inAustralia, plus the Los Angeles and San Francisco
Bay communities in the USA, into natural bushland. Another trend has been the large-scale use offire to clear forested land in the tropics. This hasbecome an international issue as a result of regionalsmoke pollution, such as affected part of south-eastAsia during 1997–98. Communities threatened bywildfire often have little awareness of the hazard.Home-owners may build with highly flammablematerials, such as weatherboard or wood shingleroofs, deliberately retain thick vegetation too close to their property and disregard the adequacyof fire-fighting equipment. This is often despite the existence of legislation, such as that inCalifornia, which requires property owners in StateResponsibility Areas to remove flammable vegeta-tion for a distance of at least 10 m from a structureor to the property line, whichever is closer.
It is likely that the fires, which burned some 1.7 × 10⁶ ha in Wisconsin and Michigan in October1871, and claimed the deaths of about 1,500 people,was the world’s greatest wildfire disaster. These fires broke out on 8 October, the same night that an urban fire in Chicago killed 250 people, and were preceded by a drought in the Midwest that had lasted for fourteen weeks. Many small fireoutbreaks in the forests surrounding Peshtigo andother small townships were not considered a threatuntil strong winds whipped up the flames andcreated uncontrollable spot fires. The disastrous ‘AshWednesday’ fires which affected large parts ofVictoria and South Australia in February l983 werecaused by classic ‘fire weather’ with air temperaturesup to 40°C combined with wind speeds over 20 ms–1. Seventy-six people died, 8,000 were madehomeless and the estimated direct losses were put atA$200 million (Bardsley et al., 1983). Bushfires inNew South Wales between December 1993 andJanuary 1994 affected more than one millionhectares and destroyed 200 buildings, although onlyfour people were killed, with more than 300 firesburning along the 1,100 km coastline. Wildfirespose a threat to fire fighters as well as residents. Inthe South Canyon, Colorado, fire of 1994, 14 firefighters were killed when a dry cold front movedinto the burning area, covered mainly by the
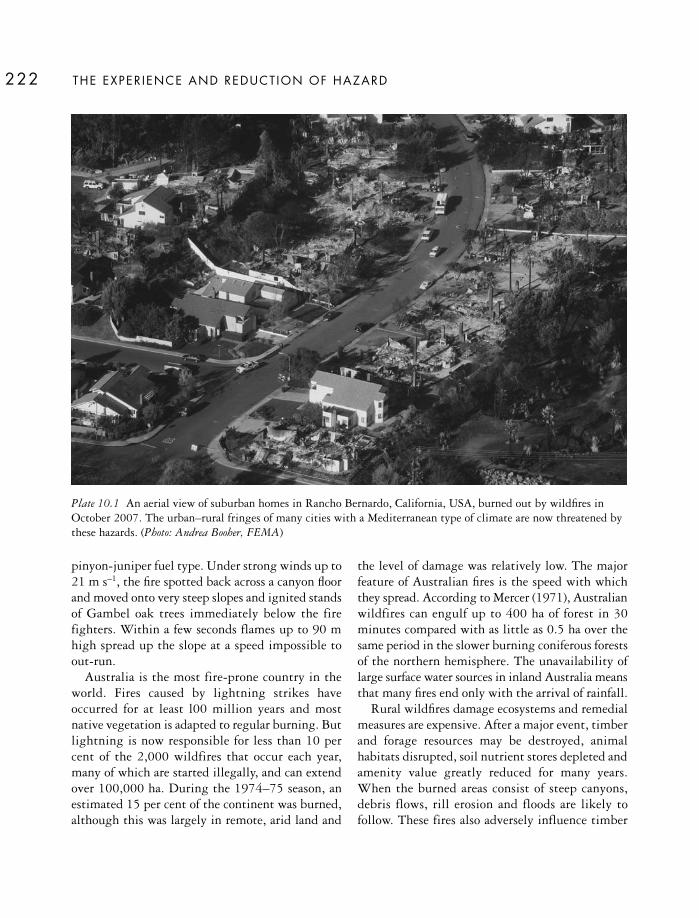
pinyon-juniper fuel type. Under strong winds up to21 m s–1, the fire spotted back across a canyon floorand moved onto very steep slopes and ignited standsof Gambel oak trees immediately below the firefighters. Within a few seconds flames up to 90 mhigh spread up the slope at a speed impossible toout-run.
Australia is the most fire-prone country in theworld. Fires caused by lightning strikes haveoccurred for at least l00 million years and mostnative vegetation is adapted to regular burning. Butlightning is now responsible for less than 10 percent of the 2,000 wildfires that occur each year,many of which are started illegally, and can extendover 100,000 ha. During the 1974–75 season, anestimated 15 per cent of the continent was burned,although this was largely in remote, arid land and
the level of damage was relatively low. The majorfeature of Australian fires is the speed with whichthey spread. According to Mercer (1971), Australianwildfires can engulf up to 400 ha of forest in 30minutes compared with as little as 0.5 ha over thesame period in the slower burning coniferous forestsof the northern hemisphere. The unavailability oflarge surface water sources in inland Australia meansthat many fires end only with the arrival of rainfall.
Rural wildfires damage ecosystems and remedialmeasures are expensive. After a major event, timberand forage resources may be destroyed, animalhabitats disrupted, soil nutrient stores depleted andamenity value greatly reduced for many years.When the burned areas consist of steep canyons,debris flows, rill erosion and floods are likely tofollow. These fires also adversely influence timber
THE EXPER IENCE AND REDUCT ION OF HAZARD222
Plate 10.1 An aerial view of suburban homes in Rancho Bernardo, California, USA, burned out by wildfires inOctober 2007. The urban–rural fringes of many cities with a Mediterranean type of climate are now threatened bythese hazards. (Photo: Andrea Booher, FEMA)
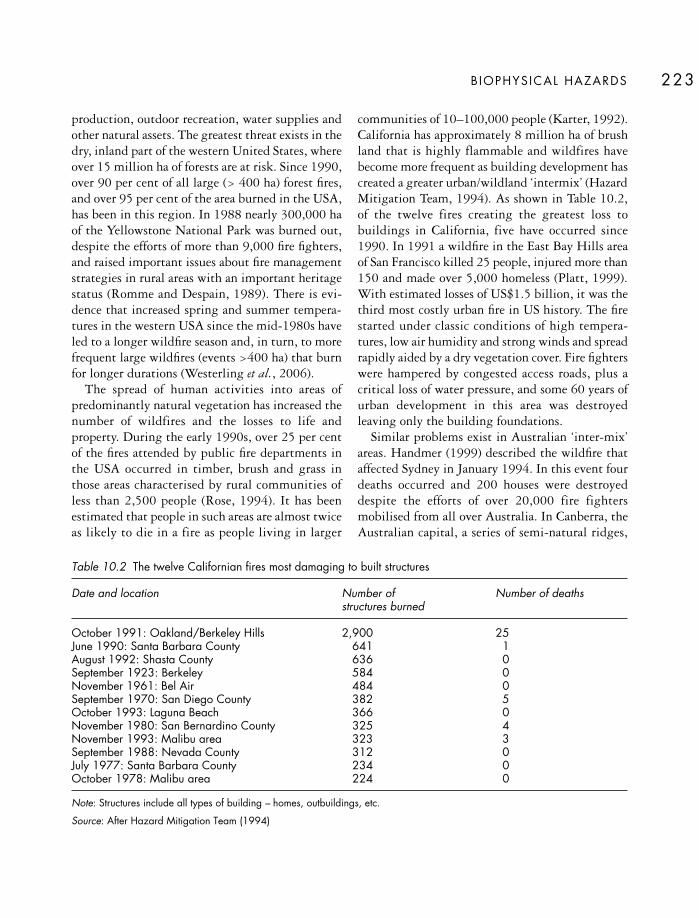
production, outdoor recreation, water supplies andother natural assets. The greatest threat exists in thedry, inland part of the western United States, whereover 15 million ha of forests are at risk. Since 1990,over 90 per cent of all large (> 400 ha) forest fires,and over 95 per cent of the area burned in the USA,has been in this region. In 1988 nearly 300,000 haof the Yellowstone National Park was burned out,despite the efforts of more than 9,000 fire fighters,and raised important issues about fire managementstrategies in rural areas with an important heritagestatus (Romme and Despain, 1989). There is evi-dence that increased spring and summer tempera-tures in the western USA since the mid-1980s haveled to a longer wildfire season and, in turn, to morefrequent large wildfires (events >400 ha) that burnfor longer durations (Westerling et al., 2006).
The spread of human activities into areas ofpredominantly natural vegetation has increased thenumber of wildfires and the losses to life andproperty. During the early 1990s, over 25 per centof the fires attended by public fire departments inthe USA occurred in timber, brush and grass inthose areas characterised by rural communities ofless than 2,500 people (Rose, 1994). It has beenestimated that people in such areas are almost twiceas likely to die in a fire as people living in larger
communities of 10–100,000 people (Karter, 1992).California has approximately 8 million ha of brushland that is highly flammable and wildfires havebecome more frequent as building development hascreated a greater urban/wildland ‘intermix’ (HazardMitigation Team, 1994). As shown in Table 10.2,of the twelve fires creating the greatest loss tobuildings in California, five have occurred since1990. In 1991 a wildfire in the East Bay Hills areaof San Francisco killed 25 people, injured more than150 and made over 5,000 homeless (Platt, 1999).With estimated losses of US$1.5 billion, it was thethird most costly urban fire in US history. The firestarted under classic conditions of high tempera-tures, low air humidity and strong winds and spreadrapidly aided by a dry vegetation cover. Fire fighterswere hampered by congested access roads, plus acritical loss of water pressure, and some 60 years ofurban development in this area was destroyedleaving only the building foundations.
Similar problems exist in Australian ‘inter-mix’areas. Handmer (1999) described the wildfire thataffected Sydney in January 1994. In this event fourdeaths occurred and 200 houses were destroyeddespite the efforts of over 20,000 fire fightersmobilised from all over Australia. In Canberra, theAustralian capital, a series of semi-natural ridges,
B IOPHYSICAL HAZARDS 223
Table 10.2 The twelve Californian fires most damaging to built structures
Date and location Number of Number of deathsstructures burned
October 1991: Oakland/Berkeley Hills 2,900 25June 1990: Santa Barbara County 641 1August 1992: Shasta County 636 0September 1923: Berkeley 584 0November 1961: Bel Air 484 0September 1970: San Diego County 382 5October 1993: Laguna Beach 366 0November 1980: San Bernardino County 325 4November 1993: Malibu area 323 3September 1988: Nevada County 312 0July 1977: Santa Barbara County 234 0October 1978: Malibu area 224 0
Note: Structures include all types of building – homes, outbuildings, etc.
Source: After Hazard Mitigation Team (1994)

THE EXPER IENCE AND REDUCT ION OF HAZARD224
used for open space recreation and nature con-servation, run through the city which, in manysuburbs, backs directly onto rural areas without anytransitional land uses (Lucas-Smith and McRae,1993). During January 2003, bushfires in theCanberra suburbs killed four people, injured 300others, destroyed 400 homes and forced more than2,000 residents to evacuate their homes.
THE NATURE OF WILDFIRES
Ignition
Fuel ignition is the first step and natural lightningstrikes remain the chief cause in remote areas.Although the origin of many fires is unknown, inmost countries the fires that start in the rural-urbaninterface are due to human actions. Figure 10.6compares the causes of wildfire ignition on publicland in the state of Victoria, Australia (a high-riskarea averaging 600 fires per year) and in Bagescounty, Catalonia, Spain (a typical westernMediterranean area of rural depopulation averaging15 fires per year). In both cases, natural causes(lightning) are small; arson may be higher thanindicated in Bages county due to the high per-centage of unknown causes. Deliberate fire-raisingis a widespread problem. In California one-quarterof all wildfires are due to arson but only 10 per centof police investigations lead to an arrest. Accidentalsources are a mix of agricultural and recreationalactivities.
Fuel
The nature and condition of the vegetationinfluences both the intensity of a bushfire (heatenergy output) and the rate of spread. Thus,grassland fires rarely produce the intensity of burn,and the degree of threat, associated with forest treesand mature shrubby vegetation. Apart from itsquantity, the moisture content of the fuel isimportant and this depends largely on the weather.These inter-relationships lead to a marked seasonalprocession of risk in most countries. Figure 10.7
illustrates the pattern for Australia where the risk isclimatically driven by the sequence of rains.According to Cunningham (1984), south-eastAustralia – where the peak danger period occurs insummer and autumn – is the most hazardous
Arson
Lightning
Agricultural
Publicutilities
Prescribedburn
Machinery/exhausts
Miscellaneous
Causeunknown
Cigarettes/matches
Campfires
Unknown
Lightning
Powerlines
Othernegligences
Intentional
Smokers
Agriculturaltasks
MachineryForestry works
Grazing
Wastedumps
Others
A
B
Figure 10.6 The sources of wildfire ignition in twodifferent regions. (A) the state of Victoria, Australia; (B) Bages county, Catalonia, Spain. Adapted from Stateof Victoria at http://www.nre.vic.gov (accessed 29January 2003) and after Badia et al., (2002). Reprintedfrom Global Environmental Change 4, Badia et al., Causalityand management of forest fires in Mediterranean environments, copyright (2002), with permission fromElsevier.

wildfire region on earth. This is because manyforests are dominated by the genus Eucalyptus. MostAustralian forests accumulate a great deal of litteron the forest floor, mainly from bark shedding, aftera number of fire-free years. Apart from creating asource of fuel, bark shedding creates a specialproblem of rapid fire-spread known as ‘spotting’. Thisoccurs when ignited fuel is blown ahead of anadvancing fire front by strong winds to create ‘spot’fires. Australian eucalypts have the longest spottingdistances in the world. The reason is the barkshedding by the stringybark and candlebark speciesthat produce loose, fibrous tapers easily torn looseby strong winds and convection currents. Spottingdistances of 30 km or more have been authenticated,at least twice the distance recorded in the deciduoushardwood and coniferous forest fires of NorthAmerica. In addition, eucalyptus trees containvolatile waxes and oils within the leaves that releasea high heat output when burnt and greatly increasethe flammability of the vegetation (Chapman,
1999). At ambient fire temperatures of around2,000 oC these oils can create a spontaneous gasexplosion.
Weather
Weather conditions are crucial for wildfires.Drought periods provide an initial drying effect onvegetation and may also provide atmosphericconditions suitable for ‘dry lightning’ storms whenno appreciable rain falls. Such storms are most activeduring unstable weather conditions during thesummer months and ignite 60 per cent of all fireson public land in the western states of the USA. Inthe summer of 2000, 122,000 wildfires were startedin this area and burned out 3.2 × 10⁶ ha (Rorig andFerguson, 2002). Brotak (1980) compared extremefire hazard situations in the eastern USA and south-east Australia. They found that most fire outbreaksoccur near surface fronts, particularly in warm, dryconditions ahead of a well-developed cold front with
B IOPHYSICAL HAZARDS 225
Darwin
Perth Adelaide
Brisbane
Sydney
Canberra
Melbourne
Hobart
0 600km
Winter and Spring
Spring
Spring and Summer
Summer
Summer and Autumn
Major Wildlife Hazard Region
Figure 10.7 Pattern ofseasonal wildfireoccurrence in Australia.The centre of thecontinent is sparselyvegetated andpopulated so the majorhazard area lies in partsof South Australia,New South Wales,Queensland andTasmania. Adaptedfrom Bushfires inAustralia by R. H. Luke and A. G. McArthur,Forestry and TimberBureau, Division ofForest Research,CommonwealthScientific andIndustrial ResearchOrganisation, AGPSCanberra 1978.

THE EXPER IENCE AND REDUCT ION OF HAZARD226
unstable temperature lapse rates and strong windsat low levels. In California, easterly Santa Anawinds, which occur mainly in September andOctober – the driest and warmest months in the BayArea – create an extreme hazard in the fall seasonwhich may last right through to November. Strongnorth-easterly Santa Ana-type winds developed inlate July 1977 and led to a disastrous wildfire whichbegan in the hills and advanced to within a mile ofthe downtown area of the city of Santa Barbara. Over230 homes were destroyed (Graham, 1977). InOctober and November 1993, 21 major wildfiresdeveloped in six Southern Californian countiesfanned by hot, dry Santa Ana winds. Three peoplewere killed, 1,171 structures were destroyed andsome 80,000 ha were burned. The combinedproperty loss was estimated at US$1 billion.
Once ignited, the rate of fire spread is closelyrelated to the surface wind strength and direction.This is because the burning fire-front advances byfirst heating, and then igniting, vegetation in itspath through a combined process of convection andradiation. Most wildfire damage, including loss oflife, occurs during a relatively short period of time– usually a few hours – compared with the totalduration of the fire. These high-loss episodes areassociated with extreme fire risk weather, ofteninvolving high winds that shift in direction andcause the fire to accelerate in an unexpecteddirection. Fire acceleration is greatly aided by thetopography. For a fire driven upslope, wind andslope acting together increase the propagating heatflux by exposing the vegetation ahead of the fire toadditional convective and radiant heat. Thecombined effect of wind and slope is to position theadvancing flames in an acute angle so that, once theslope exceeds 15–20°, the flame front is effectivelya sheet moving parallel to the slope. Data fromexperimental fires in eucalyptus and grassland areasin Australia have shown that the rate of forwardprogress of a fire on level ground doubles on a 10°
slope and increases nearly four times when travellingup a 20°slope (Luke and McArthur, 1978).
The combined effects of fuel and weatherconditions were evident in the widespread Ash
Wednesday bushfires across southeast AustraliaFebruary 1983 (Fig. 10.8A) including the largestfires ever experienced in the Forest Reserves of SouthAustralia on 16 February 1983 (Keeves andDouglas, 1983). The area had been in drought forthe previous six months and the fires were all ignitedbetween 11.00–16.30 hr when air temperatures andsolar radiation were high, relative humidity was lowand the winds were strong and gusty. The first fire(the Narraweena fire) started at about 12.10 hr ingrassland and, within four hours, travelled 65 kmsouth-east through intensively managed agri-cultural land before veering with a change in winddirection. A parallel fire (the Clay Wells fire) beganat 13.30 hr in roadside grassland and quickly spreadto native forest and adjacent pine plantations wherelarge quantities of fuel created crown fires andallowed the development of spot fires down-wind(Fig. 10.8B). By 16.00 hr the wind had changedfrom north-west to west-south-west, and increasedin speed from 30–60 km h to 50–80 km h, withgusts over 100 km h, before dying down severalhours later. In total, fire damaged about 30 per centof the area planted with conifers in the forests ofSouth Australia.
WILDFIRE HAZARD REDUCTION
Wildfires represent complex problems arising fromthe interaction of physical, biological and socialcauses in different landscape settings and, as a result,a wide range of practical solutions has to beemployed (Gill, 2005).
Disaster aid
Aid provides some mitigation when disaster strikes.The 1983 ‘Ash Wednesday’ fires in Victoria andSouth Australia raised a total donation of someA$12 million which was channelled through anappeal fund administered by the Department ofCommunity Welfare (Healey et al., 1985). Aboutthree-quarters of this sum originated withinAustralia itself including federal funds released

B IOPHYSICAL HAZARDS 227
200 km
Adelaide
Ouyen
Hamilton Melbourne
Shepparton
Wagga Wagga
Sydney
OtwaysFire
Clay WellsFire
S.A
.V
ICTO
RIA
Clay Wells
Penola
Nangwarry
KalangadooKalangadooKalangadoo
Tarpeena
Glencoe
Millicent
Mt. BurrMt. BurrMt. Burr
FurnerFurnerFurner
0 10km
Boundary of burnt area
Boundary of burnt areabefore wind change
Head fire direction
Main roads
Fire spotting
Afforested land
RivoliBay
A
B
Figure 10.8 The Ash Wednesday bushfires of 16 February 1983 in south-eastern Australia. (A) the location of themajor fires; (B) the progress of the Clay Wells fire, South Australia. This fire originally had the typical long narrowshape associated with strong, dry north-westerly winds ahead of a cold front. The change in shape was due to the lateronset of a south-westerly wind. Spot fire outbreaks can also be seen. After Keeves and Douglas (1983).
under the National Disaster Relief Arrangements.A large part of federal assistance was in the form ofinterest-free repayable loans rather than directgrants.
Disaster appeals raise the issue of whether peoplewith insurance who incur property losses should be compensated from donations to the same extentas those without private insurance. Current fireinsurance arrangements tend to rely on the privatesector. For example, about two-thirds of all thehomeowners affected by the 1991 East Bay Hills firein California had replacement-cost insurance cover.This was a major factor in defraying the costs of thefederal government and ensured that recovery andre-building went ahead quickly (Platt, 1999).However, there is usually no real difference in policypremiums according to risk. At best, the standardresidential policy considers only the presence orabsence of adequate fire-fighting services whenpremiums are set. In future, there is scope forpremiums to vary in response to the effectiveness ofthe community in enforcing fire-safe building codesand vegetation management. For example, roofingmaterials have long been recognised as a risk factorthat can increase the chances of a structure ignitingand a premium reduction could be offered for fire-resistant roofing materials.
Hazard resistance
After wildfire disasters, it is usual to see demandsfor stricter fire ban legislation. Such measures aredifficult to enforce, although Total Fire Bans on daysof extreme fire danger are necessary. They are usuallyapplied to a particular weather district and last for24 hours during which period no fire may be lit inthe open. Total Fire Bans can increase the risk of amajor event in future due to the availability of a fuelsupply that has been allowed to build up over time.The recognition of this relationship has led to theincreasing use of low-intensity fires (‘controlledburns’). The purpose of controlled burns is toconsume the existing fuel load and reduce theintensity of future wildfires, including the threat of‘spotting’ from fibrous-barked trees. This may be a
cost-effective policy for genuine wildland areas butis less useful in the mixed landscape of the rural-urban fringe where farmland, forest plantations andsuburban gardens co-exist. Prescribed burning islabour-intensive and can lead to uncontrolled fires,cause air pollution and have controversial effects onlocal ecosystems, such as a reduction in the diversityof flora. A simulation study of the effectiveness ofprescribed burning around Sydney, south-eastAustralia, showed that very frequent levels of burn-ing were needed to improve fire safety significantly(Bradstock et al., 1998). Such levels are difficult toachieve because of the high costs in steep terrain andthe lack of sufficient dry days in some winters. Dueto these difficulties, there is an increasing view thatexcess fuel must be removed by mechanical means– including commercial timber harvesting – as wellas controlled burning.
The recognition that, in many countries, mostbushfires are started by people – often intentionally– has attracted the attention of criminologistsseeking a better understanding of the motivation ofwildfire arsonists (Willis, 2005).
Community preparedness
Preparedness, including plans for the early detectionand suppression of wildfires, is a vital element indisaster reduction. In most countries, rural fire-fighting groups are the first line of defence. Suchgroups are composed of volunteers and are oftentaken for granted by state and federal governments.For example, in the USA the value of rural fire-fighting services to the nation has been estimated toexceed US$36 billion each year but the fire fightersfeel they can neither influence policy nor obtain theresources needed to work effectively (Rural FireProtection in America, 1994). In Australia there areover 200,000 volunteers but, as in North America,the number is declining rapidly due to socio-economic factors including demographic trends thatreduce the proportion of the population between 25and 45 years of age (McLennan and Birch, 2005).Rural fire services need costly training and access tospecialised equipment. Because piped water supplies
THE EXPER IENCE AND REDUCT ION OF HAZARD228

B IOPHYSICAL HAZARDS 229
are not always available in rural areas, fire teamsneed methods to deliver and use water moreefficiently. This might mean dedicated items suchas tankers for transporting water or access to aircraft.There is also a need for more general tools such asearth-moving plant to construct access tracks andfirebreaks.
In the United States there are attempts tointegrate all rural fire and emergency responseactivities under a common emergency managementsystem. Most major wildfires cross local governmentboundaries and affect land managed by privatelandowners and state and federal agencies. Acomprehensive fuel modification plan should beagreed to reduce fire intensity, including prescribedburns and vegetation thinning. It is also necessaryto have an overall view of fire fighting infrastructure,including water supply and equipment. Thisapproach was tried in California after the Oakland-Berkeley Hills firestorm of 1991 when the cities ofOakland and Berkeley formed a consortium withother major ‘inter-mix’ landowners to develop acoordinated hazard reduction plan. Similar bushfiremanagement committees, representative of localinterest groups, exist in Australia.
There are many reasons why preparedness forwildfires may be low. In Edmonton, Canada, house-holds hold complex views on the effectiveness of firereduction and rarely completed the full range ofmeasures available (McGee, 2005). From a study inCalifornia, Collins (2005) concluded that residentswere reluctant to remove vegetation from aroundtheir property because they attached a high amenityvalue to their semi-natural environment. Others,such as those living in areas lacking basic com-munity services (roads, piped water) and those whodid not own their properties, lacked the incentivesand the financial means to make hazard adjust-ments. In parts of Victoria, Australia, residentsrecognised the risk of fire but many expected to be protected by volunteer fire fighters and made few preparations of their own (Beringer, 2000).Awareness of the fire hazard tends to grow withresidence time in the area and Figure 10.9 showsthat the deployment of self-reliant protection
measures can increase four-fold with residenceperiods of 25 years or longer.
Forecasting and warning
This option plays a limited role in wildfire hazardreduction. For example, in Australia a fire season maybe declared by emergency agencies during whichcertain restrictions on outdoor fires apply. Daily fire danger ratings are issued by the Bureau ofMeteorology during the season and fire-weatherwarnings are given on days with a forecast of extremefire risk when a total fire ban is likely to be imposed.Comparatively little is known about the accuracyand the effectiveness of these warnings.
In populated areas, lookout points may besufficient for early fire detection but, in more remote
50
40
30
20
10
0<1 1-5 5-10 10-15 15-25 25+
%R
esp
ons
esfr
om
resi
den
ts
Residence time in area (years)
A water storage tank
A fire fighting pump
A knapsack
Figure 10.9 The relationship between length of residencein the North Warrendyte area, Victoria, Australia – anarea of high bushfire risk – and the ownership of fire-fighting equipment. After Beringer (2000). Reprintedfrom Fire Safety Journal 35, J. Beringer, Community firesafety at the urban/rural interface, copyright (2000), withpermission from Elsevier.

regions, regular surveys by aircraft or other remotesensing means may be necessary. During dry weatherplants reduce the amount of evapotranspiration fromtheir leaves with a consequent increase in the surfacetemperature of large vegetation stands, such asforests. These changes in temperature can bedetected on satellite images and the derivation of anappropriate ‘vegetation stress index’ can be used asan indication of where wildfire outbreaks are mostlikely to occur (Patel, 1995). It is then possible tointensify ground surveillance in these areas or toexclude the public until the fire risk starts to fall.
Early fire detection is important because riskreduction options decline rapidly after a majoroutbreak. In Australia, Handmer and Tibbits (2005)have shown that the late evacuation of properties,rather than staying inside, results in a high fatalityrate. In the western USA, most fires are caused bysummer lightning strikes, so investment in auto-mated lightning detection systems, with the optionof a follow-up aerial survey, is a prudent strategy.Florida, on the other hand, has a year-round fireseason due to the fuel types and weather patternsand most of the fires are human-caused. Here earlyfire detection is based on a fixed position, passiveinfra-red system (Greene, 1994). This uses sets of computer-controlled infrared sensors, weathermonitors and video cameras located at remote obser-vation points to scan the horizon and mountainsidesfor thermal variations. Each system can detectthermal variations and provide a control centre withdetails of the fire location, estimated size of the fireand current weather conditions.
Land use planning
Much of the wildfire threat exists because localgovernments have not factored this hazard into thedevelopment control system. It is increasinglyrecognised that land-use planning and publiceducation have an essential role to play in hazardreduction. The basic tool is a map showing severewildfire hazard areas that can be used to steerdevelopment. For example, wide fire-breaks are anintegral part of rural land planning either to exclude
fire or to isolate crops, timber plantations or otherhigh-risk areas, such as building development.Within high-risk areas, detailed landscaping isnecessary, including:
• cluster development – individual homes orapartments built in small groups (saving land forcommunity open space)
• low overall housing density – individualresidential lots at least 0.5 ha
• minimum spaces between buildings (approx. 10 m) and clusters
• access lanes wide enough for fire-fightingequipment
• all properties with a minimum set-back from thenatural bush (approx. 30 m)
• mature trees and large shrubs on edge of bushpruned to avoid direct spread of fire from one treeto another
• intermediate area managed by clearing all deadvegetation and planting grass or small, low fuel-volume vegetation.
More thought should be given to imposingmaximum occupancy rates, and the capability of the road network for emergency evacuation, when fire-prone areas are approved for new residentialdevelopment (Cova, 2005). It is also important forneighbouring local authorities to work together onland and vegetation management and develop acommon database for land planning in the ‘inter-mix’ zones. It follows that public fire preventioneducation deserves more attention. The persuasiveapproach can be reinforced in a variety of ways. Forexample, the provision of barbecue places set up bylocal authorities in safe clearings alongside roadstends to discourage indiscriminate fire lighting. Inaddition, an increased understanding of the benefitsof prescribed burns could help officials to obtain thecooperation of landowners for fuel managementpractices. Finally, when areas have been burned out,consideration should be given to the governmentacquisition of land for public open space and the re-building of properties at lower densities on largerplots.
THE EXPER IENCE AND REDUCT ION OF HAZARD230

KEY READING
Noji, E. K. (ed.) (1997) The Public HealthConsequences of Disaster. Oxford University Press,New York. This remains a useful source of reference.
Beringer, J. (2000) Community fire safety at theurban/rural interface: the bushfire risk. Fire SafetyJournal 35:1–23. Gives a clear account of wildfireissues in Australia.
Lagadec, P. (2004) Understanding the French 2003heat wave experience: beyond the heat, a multi-layered challenge. Journal of Contingencies and CrisisManagement 12; 160–69. A thought-provokinginsight into just one of the consequences of climatechange.
Ligon, B. L. (2006) Infectious diseases that posespecific challenges after natural disasters: a review.Seminars in Pediatric Infectious Diseases 17: 36–45.Demonstrates the link between disaster and disease.
Thomson, M. C. et al. (2006) Malaria early warningsbased on seasonal climate forecasts from multi-model ensembles. Nature 439: 576–79.
WEB L INKS
Centers for Disease Control and Prevention, USAwww.cdc.gov
History of bushfires in the Australian CapitalTerritory www.esb.act.gov.au/firebreak/actbushfire.html
Food and Agriculture Organisation Locust WatchGroup www.fao.org/ag/locusts/en/info/index.html
Fire Weather Information Center USA www.noaa.gov/fireweather/
Roll Back Malaria Pertnership www.rbm.who.int/
World Health Organisation www.who.int/en/
Wildfire Impact Reduction Center, USA www.westernwildfire.org/
B IOPHYSICAL HAZARDS 231

FLOOD HAZARDS
Flooding is a very common environmental hazardwith over 3,000 disasters recorded in the CREDdatabase since 1900. This is because of thewidespread distribution of river floodplains and low-lying coasts and their long-standing attractions forhuman settlement. Each year, floods claim around20,000 lives and adversely affect at least 20 millionpeople worldwide, mostly through homelessness.These figures are inexact because floods are linkedto other environmental processes and can be difficultto classify. For example, floods can be the conse-quence of storms and tsunamis but they are also thecause of some epidemics and landslides. Althoughflood-related deaths and homelessness are con-centrated in the LDCs, industrialised countries –which invest heavily in flood defence and emergencymeasures – suffer large economic losses. The degreeof flood hazard is dependent on factors such as thedepth and velocity of the water, the duration of the flood and the load (sediment, salts, sewage,chemicals) carried. Figure 11.1 shows some approxi-mate hazard thresholds for depth and velocity.People and cars can be washed away in about 0.5 mof fast-flowing water. Buildings, and other obstruc-tions, create turbulent scour effects and manybuildings start to fail at velocities of 2 m sec1. The
physical stresses on structures are greatly increasedwhen rapidly flowing water contains debris such asrock or ice. The collapse of sewerage systems andstorage facilities for products like oil or chemicalsmeans that flood waters create pollution hazards. InNovember 1994 over 100 people were killed inDurunqa, Egypt, when floods destroyed a petroleumstorage facility and carried burning oil into the heartof the town.
Flood disasters are heavily concentrated in Asiawhere over 90 per cent of the human impacts andover half of the economic damage occurs (Table11.1). China and Bangladesh are the two most flood-prone countries in the world, despite the fact thatthe flood defences of certain cities in the former dateback over 4,000 years (Wu, 1989). Some idea of thescale of the problem can be obtained from Box 11.1.In Asia as a whole, investment in flood control anddisaster preparedness, combined with improvedsanitation, has reduced mortality but large numbersof people are still made homeless by floods. Floodimpacts are not restricted to the LDCs. The Midwestfloods of 1993 in the United States had a returnperiod of 100–500 years on the Mississippi andMissouri rivers and affected over 15 per cent of thecountry. More than 50,000 homes were damaged ordestroyed and 54,000 persons were evacuated fromflooded areas. Total losses were US$15–20 billion
11
HYDROLOGICAL HAZARDS
F loods

HYDROLOGICAL HAZARDS: F LOODS 233
(US Dept. of Commerce, 1994) although fewer than50 deaths occurred.
Flood-related mortality includes diseaseepidemics as well as deaths from drowning. Gastro-intestinal diseases break out where sanitationstandards are low or when sewerage systems aredamaged creating water pollution. In tropicalcountries the increased incidence of water-relateddiseases, such as typhoid or malaria, can double theendemic mortality rate. In the MDCs, survivorssuffer different health problems. Eighteen monthsafter the 1972 flood disaster at Buffalo Creek, WestVirginia, over 90 per cent of the survivors weresuffering from mental disorders (Newman, 1976).Physical damage to property, especially in urbanareas, is the major cause of tangible flood losses.There are also secondary losses due to a loss in house
values (Tobin and Montz, 1997b). Damage to crops,livestock and the agricultural infrastructure is highin intensively cultivated rural areas. In India, forexample, almost 75 per cent of the direct flooddamage has been attributed to crop losses whilstriverbank erosion of farmland and villages inBangladesh destroys crops and renders up to onemillion people landless and homeless every year(Zaman, 1991).
More than any other environmental hazard, floodsbring benefits as well as losses (Smith and Ward,1998). The seasonal ‘flood pulse’ is a vital part ofthose river ecosystems where the flow regimemaintains a diverse range of wetland habitats. Afterthe initial physical and ecological disturbanceassociated with major floods, there is a burst ofbiological productivity. Floods maintain the fertility
3
2
1
00 1 2 3 4 5 6 7 8
Dep
th(m
)
Velocity (m sec1)
Pedestrian safetyDanger to humans and vehiclesErosion and property lossSingle-storey woodframeBrick veneer
12345
Figure 11.1 Approximate flood hazard thresholds as afunction of depth and velocity of water flow. Curve 2indicates the danger of death by drowning; Curve 3 thedanger of bank erosion and the loss of shanty-typehousing; Curves 4 and 5 the destruction of morepermanently constructed residential buildings. Adaptedfrom D. I. Smith (2000) and other sources.
Table 11.1 The percentage of flood disasters recorded by continent showing the relative incidence of flood-related deaths and other impacts over the period 1900–2006
Continent Disasters People People People People Economic killed injured homeless affected damage
Africa 17 0.5 2 4 1 1Americas 25 1 3 3 2 17Asia 41 98 93 91 96 58Europe 14 0.5 2 2 1 23Oceania 3 – – – – 1
Source: Adapted from CRED database

THE EXPER IENCE AND REDUCT ION OF HAZARD234
Most of the cultivable land and human settlementin China exists on the alluvial floodplains of greatrivers. The largest of these is the Ch’ang Chiang(Yangtze) – third longest river in the world – thatflows for 6,300 km towards the Pacific Ocean withhighly flood-prone areas of the valley containingmore than 75 million people. This river killedmore than 300,000 people during the twentiethcentury. In the middle reaches, two hugeconnected depressions – containing the Dongtinglake (covering an area the size of Luxembourg) andthe smaller Poyang lake – provide natural floodwater storage and help protect downstream areas.In an average year, the Yangtze carries 500 milliontonnes of sediment, mostly in the flood season, and– under entirely natural conditions – all the riversin the Yangtze valley would change their coursesfrequently in response to the progressive rise of theland surface by silt deposition. The river drainagearea is subject to prolonged summer monsoonrains and tropical cyclones. Records extendingback for over 2,000 years show that damagingfloods occur, on average, once in every 10 yearsand, over the last 500 years, the variability offloods and droughts can be linked to ENSOepisodes (Jiang et al., 2006). In 1998, 32 millionha of land were flooded, over 3,000 people werekilled or injured and more than 200 millionpeople were affected with the direct propertydamage estimated at US$20 billion.
• Levees The earliest flood levees date back to AD
345. There are now about 3,600 km of mainriver levees and 30,000 km of tributary leveesprotecting farmland, oilfields and cities. But,due to silt deposition in the constricted riverchannel – rather than across the wide floodplain– the level of the Yangtze in a high flood is now10 m above the land behind the levee and the
levees themselves reach 16 m in height inplaces. Many levees are old and weak andsubject to breaching.
• Lakes Lake Dongting provides valuable floodstorage but, when the lake is full, it starts tobreak its banks and threaten 667,000 ha ofdensely populated farmland and over 10million people, many in cities like Yueyangand Wuhan. Major lake failures have becomemore likely due to silt deposition and landreclamation which have reduced the capacity ofthe lake by nearly 80 per cent since 1950. InAugust 2002, the Dongting lake reached arecord high level of 35.9 m, a state ofemergency was declared and more than 80,000people were mobilised to strengthen the levees.
• Dams China has already built about half of allthe world’s 45,000 large dams. This traditioncontinues with the construction of the ThreeGorges Dam (TGD) near Chingquing which isdesigned to produce hydro-electricity andcontrol floods in the middle and lower reachesof the Yangtze. The TGD will store up to 39billion m3 of water, held in a reservoir 600 kmlong behind a dam 175 m high and nearly 2 km long. It will form the largest hydropowerstation and dam in the world and – probably –the most expensive single structure ever built.The Yangtze river finally came under controlon 1 June 2003 when it started to fill thereservoir. The project is due for completion in2009.
Before the onset of the flood season in June, thereservoir level will be lowered to provide storagefor flood flows equivalent to 22 billion m3. Thisshould reduce the peak flow of the 100-year flood in the downstream Jinjiang section from86,000 m3 sec1 to less than 60,000 m3 sec1, a
Box 11.1
FLOOD MANAGEMENT ON THE YANGTZE R IVER, CHINA
HYDROLOGICAL HAZARDS: F LOODS 235
of soils by depositing layers of silt and flushing salts from the surface layers. Although silt-ladenfloodwater regularly reaches only a small area ofBangladesh, the new alluvium enriches the phos-phorous and potash content of the soil. Along low-lying coasts and estuaries, regular inundations helpto maintain salt-marshes and mudflats, which areoften rich in wildlife, as well as specialised vege-tation such as mangrove forest. Most traditionalsocieties are well-adapted to the flood pulse. Floodsprovide water for irrigation and for village fisheries,which are a major source of protein. Flood retreatagriculture, where the moist soil left after floodrecession is planted with food crops, is also widelyundertaken in the tropics. The seasonal inundationof large floodplains in semi-arid West Africa is ofcrucial ecological and economic importance and isresponsible for a larger agricultural output than thatassociated with formal irrigation systems (Adams,1993). In a normal year, floods may be expected tobring all these benefits and it is only the rare, high-magnitude, events that create disaster.
The number of flood events, and flood impacts,appears to be increasing on a global scale but it is
difficult to identify trends in physical causes alone.Although climate change will become an increas-ingly important driver in the future, most observersbelieve that current increased losses are mainly dueto a combination of better event monitoring andmore intensive landuse. Urbanisation, in particular,transforms hydrologicial systems and creates agrowing risk through continued floodplain invasionand rising property wealth (Mitchell, 2003, Hall etal., 2003). Most countries have found it difficult toreverse such trends. For example, Canada – facedwith mounting flood losses in insurance claims anddisaster relief – introduced a comprehensive FloodDisaster Reduction Program in 1971 (Shrubsole,2000). The aim was to decrease reliance on struc-tural schemes and introduce a wider strategy basedon floodplain mapping and public education. TheProgram administration fell between two federalagencies (Environment Canada and EmergencyPreparedness Canada) and was closed in 1999 (de Loë and Wojtanowski, 2001).
discharge within the safe capacity of this part ofthe river. The TGD is also expected to contributeto lower flood peaks in some downstreamtributaries. But the risks and costs – known andunknown – are also large. Some observers believethat sediment deposition behind the dam willseverely limit its efficiency and there are manynegative aspects including the displacement of upto 1.7 million people, major losses for biodiversityand wildlife and the destruction of over 300heritage sites.
• Other options These are few and likely to havelimited flood alleviation benefits. For example,legislation to encourage more afforestation,combined with controls on illegal logging, hasbeen passed. But this is unlikely either to befully implemented or to have much influence
on peak flows. Further raising of the levees isimpractical in many areas. Already the reducedstorage capacity in Dongting lake is causingYangtze river levels to rise by 0.5 m every 20years. Similarly, emergency evacuation and theprovision of safe refuges for up to one millionevacuees, their livestock and possessions, is alsoproblematical. The scale of flood problems onthe Yangtze river remains daunting.
Source: Much of the material for Box 11.1 wasadapted from review papers and other documentsmade available by the World Commission onDams website http://www.dams.org (accessed on17 March 2002) and the Chinese Embassy web-site www.chinese-embassy.org.uk (accessed on 3 December 2006).
THE EXPER IENCE AND REDUCT ION OF HAZARD236
FLOOD-PRONE ENVIRONMENTS
The nature and scale of the flood risk varies greatly.In most countries rivers are the greatest hazard, asin the United States, where river flooding accountsfor about two-thirds of all federally-declared dis-asters. In Britain, rivers represent about one-thirdof the total flood risk, for two reasons. First, stormrainfall maxima are low when measured againstworld extremes, thus creating less aggressive rivers.Second, virtually all buildings are constructed ofbrick or stone and are not easily damaged. On theother hand, sea flooding is a serious threat caused bythe coastal configuration of eastern and southernEngland combined with long-term land subsidence,rising sea levels and under-investment in seadefences over many years. In February 1953 over300 people died in eastern England when thesedefences were overtopped.
A comparison of the proportion of the populationthat is flood-prone in different countries shows widevariations (Parker, 2000; Blanchard-Boehm et al.,2001):
• France 3.5 per cent• United Kingdom 4.8 per cent• United States 12 per cent• Netherlands 50 per cent• Vietnam 70 per cent• Bangladesh 80 per cent.
Exposure to risk is related to rural populationdensities, especially in the LDCs, and to the locationof urban areas. For example, in China the vastalluvial river plains contain half the total popu-lation. In countries like Bangladesh and Vietnamthere is a combined threat from river, delta and seafloods. Although New Zealand has a smallpopulation, nearly 70 per cent of the towns andcities with populations in excess of 20,000 have ariver flood problem (Ericksen, 1986).
The most vulnerable landscape settings for floodsare:
Low-lying parts of major floodplains
In their natural state, these settings will suffer themost frequent inundation. Because of the highfrequency of events, such areas in the MDCs areoften given some protection by engineering worksand are also subject to planning controls. Withinthe LDCs the risk of disaster is much greater. InBangladesh over 110 million people are relativelyunprotected on the floodplain of southern Asia’smost flood-prone river system – the Ganges-Brahmaputra-Megna. This river basin extends overmore than 1,750,000 km2 and, in an average year,receives about four times the annual rainfall of theMississippi basin in the USA. As shown in Figure11.2, the complex deltaic terrain of Bangladesh issubject to several types of flooding. Half of thecountry is less than 12.5 m above mean sea level andseasonal floods regularly cover an estimated 20 percent of the total land area. In very high flood years,up to two-thirds of the country may be inundatedat any one time. The 1988 floods affected 46 percent of the land area and killed an estimated 1,500people; in 1998 over 1,000 people were killed anddirect damages reached US$ 2–3 billion, the highestrecorded to that date (Mirza et al., 2001).
Low-lying coasts and deltas
Estuarine areas are often exposed to a combinedthreat from river floods and high tides, as in the caseof the Thames in London, England. Such areas canbe submerged when river floods are prevented fromreaching the sea, perhaps as a result of high-tideconditions, and a mixture of fresh and marine waterspills over the land. More direct marine floodingoccurs when salt water is driven onshore by wind-generated waves or storm surges (see Chapter 9).Storm surges are responsible for most of theworldwide loss of life from coastal floods. Other,much rarer, marine invasions can result fromtsunami waves, created by earthquakes out at sea(see Chapter 6).
Coasts and deltas are high-risk settings becausethey are subject to both freshwater and marine
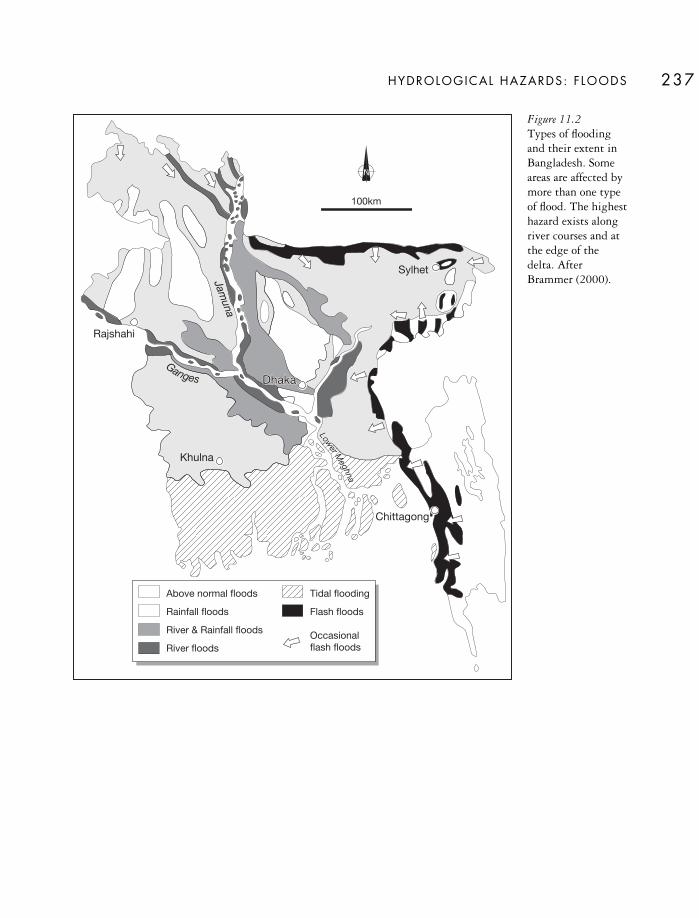
HYDROLOGICAL HAZARDS: F LOODS 237
100km
DhakaDhakaDhaka
Sylhet
Khulna
Chittagong
Rajshahi
Ganges
J amu na
LLoowweerr MM
eegghhnnaa
Lower M
eghna
Above normal floods
Rainfall floods
River & Rainfall floods
River floods
Tidal flooding
Flash floods
Occasionalflash floods
Figure 11.2Types of floodingand their extent inBangladesh. Someareas are affected bymore than one typeof flood. The highesthazard exists alongriver courses and atthe edge of thedelta. AfterBrammer (2000).

floods and are usually densely populated. In Vietnamall the low-lying areas have been intensivelyexploited by the rural population for wet-ricecultivation, especially in the deltas of the Red Riverin the north and the Mekong in the south(Department of Humanitarian Affairs, 1994). As aresult, there is a close relationship between thedistribution of population and the distribution offlooded land. Many urban areas are also at risk. Atthe start of the twenty-first century, 17 out of the25 cities with populations in excess of 9 million,were on the coast (Timmerman and White, 1997).These cities, often surrounded by heavily populatedrural areas, tend to be in countries lacking effectivecoastal zone management and planning controls.During severe spells of weather, a marine flood riskexists for cities as varied as Venice, Alexandria andShanghai.
Small basins subject to flash floods
Flash floods are found mainly in arid and semi-aridzones where there is a combination of steeptopography, little vegetation and high-intensity,short-duration convective rain storms. They can alsooccur in narrow valleys and heavily developed urbansettings. Warning times are invariably limited andflash floods are a major cause of weather-relateddeaths. In the Big Thompson Canyon, Colorado,flood of July 1976, 139 people were drowned withmillions of dollars damage after a thunderstormproduced 300 mm of rain in less than six hours.Many of the dead were tourists with little awarenessof the dangers and the need to escape from thecanyon floor. Estimates suggest that in tropicalcountries some 90 per cent of the lives lost throughdrowning are the result of intense rainfall on smallsteep catchments upstream of poorly drained urbanareas. For example, the city of Kuala Lumpur,Malaysia, is at the foot of a relatively steep, fan-shaped basin with almost perfect hydrologicalconditions for generating flash floods.
Areas below unsafe or inadequate dams
Dam failures happen relatively infrequently buthave great disaster potential. According to theInternational Commission on Large Dams, there are45,000 dams worldwide that exceed 15 m in height.About three-quarters were built before 1980. In theUSA alone more than 2,000 communities are at riskfrom dams believed to be unsafe and there is littleopportunity for warning and evacuation. When thefoundations of the Malpasset dam, France, failed in1959 421 people died. Even dams that are struc-turally sound may be overtopped by surges of waterinduced by earth movements. In 1963 a landslidecreated a major flood surge behind the Vaiont damin Italy. Although the structure held, the sub-sequent wave of water killed 3,000 peopledownstream. When a dam burst in 1972 in the coalmining valley of Buffalo Creek, West Virginia, therewas no warning and 125 people were killed and4–5,000 became homeless. Few countries haveprepared inundation maps or made emergency plansfor such events.
Low-lying inland shorelines
These extend for thousands of kilometres andinvolve much property, as around the Great Lakesand the Great Salt Lake in North America.Fluctuating lake levels from high river inputs is themain problem. Lake levels rise to damaging heightsonly after a period of wet years but the erosion ofbarrier islands, sand dunes or bluffs removes anynatural protection from wind-driven wave attack onbuildings and other shoreline facilities.
Alluvial fans
These environments have a special type of flash floodthreat, especially in semi-arid areas. About 15–25per cent of the arid American West is covered byalluvial fans that often provide attractive develop-ment sites due to their commanding views and goodlocal drainage (FEMA, 1989). The flood hazard isunderestimated because of the prevailing dryconditions, which lead to long intervals between
THE EXPER IENCE AND REDUCT ION OF HAZARD238

HYDROLOGICAL HAZARDS: F LOODS 239
successive floods, and the absence of well-definedsurface watercourses. The braided drainage channelsmeander unpredictably across the steep slopes,bringing velocities of 5–10 m s–1 and high sedimentloads.
THE NATURE OF FLOODS
Physical causes – river floods
A river flood hazard results from a water level thatovertops the banks – natural or artificial – of a riverand threatens human life and property. For ahydrologist, flood magnitude is best expressed interms of instantaneous peak river flow (discharge)whilst the hazard potential will relate more to themaximum height (stage) that the water reaches.Smith and Ward (1998) distinguished between theprimary causes of floods, mainly resulting fromwidespread climatological forces, and secondaryflood-intensifying conditions that are more drainagebasin-specific (see Box 11.2). It is also possible torelate the physical causes of floods to otherenvironmental hazards (Fig. 11.3).
Excessive rainfallAtmospheric extremes, especially excessive rainfalls,are the most common cause of floods. They vary
from the semi-predictable seasonal rains over widegeographic areas, which give rise to the annual wet-season floods in tropical areas, to almost randomconvectional storms over small basins. About 70 percent of India’s rainfall comes during the l00 days ofthe summer south-west monsoon. Large rainfallamounts over large drainage basins are oftenassociated with tropical cyclones (mainly latesummer in the sub-tropics) or major depressions(mainly winter in the mid-latitudes).
In early February 2000, heavy rains began to fallover a wide area of southern Africa in the middle ofthe wet season. Such rains are routine. They areassociated with the inter-tropical convergence andstrong convection in the hot moist air. But thefloods in this particular year were supplemented byadditional rainfall from two tropical cyclones. Themain disaster was in Mozambique, the mostindebted country in the world relative to income.The land consists largely of coastal plains intersectedby rivers where the only flood refuges are trees androoftops. On the Limpopo river, the water reached3 m higher than any flood in the last 150 years and submerged an area almost the size of theNetherlands and Belgium combined (IFRCRCS,2002): 700 people were killed, 450,000 madehomeless, 544,000 displaced, 800,000 placed at riskfrom epidemics (mainly malaria and cholera) and4.5 million otherwise affected. A refugee camp at
ATMOSPHERICHAZARDS
TECTONICHAZARDS
TECHNOLOGICHAZARDS
PHYSICALCAUSES OF FLOODS
Rainfall Snowmelt Ice Jam Landslides Dam Failures
TECTONICHAZARDS
Tsunamis
ATMOSPHERICHAZARDS
Storm Surges
RIVER FLOODS COASTAL FLOODS
Figure 11.3 The physical causes of floods in relation to other environmental hazards. Atmospheric hazards creatinglarge amounts of rainfall are the most important cause but this diagram also illustrates the problems of separatingfloods from other hazards.
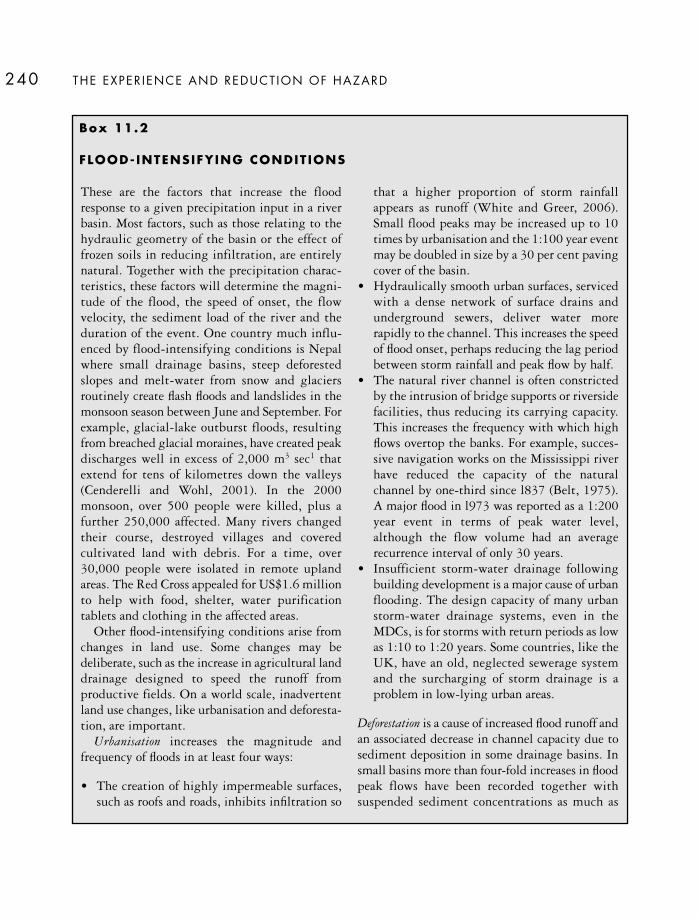
THE EXPER IENCE AND REDUCT ION OF HAZARD240
These are the factors that increase the floodresponse to a given precipitation input in a riverbasin. Most factors, such as those relating to thehydraulic geometry of the basin or the effect offrozen soils in reducing infiltration, are entirelynatural. Together with the precipitation charac-teristics, these factors will determine the magni-tude of the flood, the speed of onset, the flowvelocity, the sediment load of the river and theduration of the event. One country much influ-enced by flood-intensifying conditions is Nepalwhere small drainage basins, steep deforestedslopes and melt-water from snow and glaciersroutinely create flash floods and landslides in themonsoon season between June and September. Forexample, glacial-lake outburst floods, resultingfrom breached glacial moraines, have created peakdischarges well in excess of 2,000 m3 sec1 thatextend for tens of kilometres down the valleys(Cenderelli and Wohl, 2001). In the 2000monsoon, over 500 people were killed, plus afurther 250,000 affected. Many rivers changedtheir course, destroyed villages and coveredcultivated land with debris. For a time, over30,000 people were isolated in remote uplandareas. The Red Cross appealed for US$1.6 millionto help with food, shelter, water purificationtablets and clothing in the affected areas.
Other flood-intensifying conditions arise fromchanges in land use. Some changes may bedeliberate, such as the increase in agricultural landdrainage designed to speed the runoff fromproductive fields. On a world scale, inadvertentland use changes, like urbanisation and deforesta-tion, are important.
Urbanisation increases the magnitude andfrequency of floods in at least four ways:
• The creation of highly impermeable surfaces,such as roofs and roads, inhibits infiltration so
that a higher proportion of storm rainfallappears as runoff (White and Greer, 2006).Small flood peaks may be increased up to 10times by urbanisation and the 1:100 year eventmay be doubled in size by a 30 per cent pavingcover of the basin.
• Hydraulically smooth urban surfaces, servicedwith a dense network of surface drains andunderground sewers, deliver water morerapidly to the channel. This increases the speedof flood onset, perhaps reducing the lag periodbetween storm rainfall and peak flow by half.
• The natural river channel is often constrictedby the intrusion of bridge supports or riversidefacilities, thus reducing its carrying capacity.This increases the frequency with which highflows overtop the banks. For example, succes-sive navigation works on the Mississippi riverhave reduced the capacity of the naturalchannel by one-third since l837 (Belt, 1975).A major flood in l973 was reported as a 1:200year event in terms of peak water level,although the flow volume had an averagerecurrence interval of only 30 years.
• Insufficient storm-water drainage followingbuilding development is a major cause of urbanflooding. The design capacity of many urbanstorm-water drainage systems, even in theMDCs, is for storms with return periods as lowas 1:10 to 1:20 years. Some countries, like theUK, have an old, neglected sewerage systemand the surcharging of storm drainage is aproblem in low-lying urban areas.
Deforestation is a cause of increased flood runoff andan associated decrease in channel capacity due tosediment deposition in some drainage basins. Insmall basins more than four-fold increases in floodpeak flows have been recorded together withsuspended sediment concentrations as much as
Box 11.2
FLOOD- INTENSIFYING CONDIT IONS
HYDROLOGICAL HAZARDS: F LOODS 241
Chaquelane, 100 miles north-east of Maputo, alonereceived 15,000 people. In total, 10 per cent of allthe cultivated land was destroyed, including one-third of the staple maize crop and 80 per cent ofcattle.
High intensity rainfall is associated with morelocalised storms. If the intense convectional cellscoincide with small drainage basins, thencatastrophic flash floods can result. These floodsoccur mainly in the summer season, especially incontinental interiors. They produce large volumesof water, rapidly concentrated in both time andspace, with great damage potential. In June l972,Rapid City (South Dakota) was devastated by a flashflood and the associated failure of a dam. There were238 deaths, the highest recorded loss of life from asingle flood in the United States.
Snow and ice-melt
Melting snow is responsible for widespread floodingin the continental interiors of both North Americaand Asia in late spring and early summer. Manydisasters have resulted. The most dangerous melt
conditions often arise from rain falling on snow togive a combined flow. This occurred in theRomanian floods of May l970, when theTransylvanian basin was devastated by heavy rainfrom a deep depression plus snowmelt from theCarpathian mountains. Melt-water floods arecompounded by ice jam flooding. This occurs whenan accumulation of large chunks of floating ice,resulting from the spring break-up, causes thetemporary damming of a river. The floating icelodges at bridges and other constrictions in thechannel or at shallows where the channel freezessolid. The largest ice masses can destroy buildingsand shear off trees above the water level. Near lakeshorelines, pressure ridges in the ice can dislodgehouses from their foundations.
Physical causes – coastal floods
Hazardous flooding of coasts and estuaries tends tooccur when the sea surface is raised above the normalfluctuations created by waves and tides. Suchincreases in height result either from short-termfactors or from very much longer-term processes.
100 times greater than in rivers drainingundisturbed forested land. Specifically, the 1966flood that claimed 33 lives and damaged 1,400works of art and 300,000 rare books in the city ofFlorence, Italy, was partially attributed to long-term deforestation in the upper Arno basin.Charoenphong (1991) and others have claimedsimilar effects for larger basins but direct cause-and-effect relationships between forest cutting in the headwaters, mainly for fuel wood, andincreased floods far downstream are hard to find.
Hamilton (1987) conceded that forest cuttingfollowed by abusive agricultural practices in theHimalayas may aggravate flooding but cautionedagainst the misunderstanding of natural processes.Despite the availability of hydrological records foralmost 100 years, no statistically reliable increasein physical flooding has been found in the plains
and delta areas of the Ganges-Brahmaputra riversystem. Ives and Messerli (1989) concluded thatthere was no evidence to support any directrelationship between human-induced landscapechanges in the Himalayas and changes in thehydrology and sediment transfer processes in therivers of the plains. This is because the highmonsoon rains in the Himalayas, combined withsteep slopes, ensure rapid runoff and highsedimentation rates irrespective of the vegetationcover. Despite the apparent continued increase inflood losses, Mirza et al. (2001) confirmed thegeneral absence of any statistically significantincrease in peak discharges within this riversystem and attributed the losses to a combinationof population growth and an expansion in theagricultural area.

THE EXPER IENCE AND REDUCT ION OF HAZARD242
Short-term factors
These include storm surges driven by hurricane-force onshore winds (see ‘Hurricane Katrina’, Box9.1) and tsunamis created by earthquakes on the seafloor (see Chapter 6). In addition, certain meteoro-logical and hydrological conditions can combinewith the coastal configuration to create floods. Forexample, the semi-enclosed, low-lying coast of theNorth Sea is exposed to northerly gales that forcewater to pile up towards the south where the seanarrows. This combination of meteorological andgeographical features has led to a complex system of barrages to protect extensive areas of theNetherlands and seawall defences throughout south-east England. Estuarine floods are likely if a riverflood peak coincides with high tides or any othercause of elevated sea level. In January 1928 the riverThames, England, produced a high flood peakcaused by heavy rain and snowmelt. The passage ofthe flood crest was impeded by a spring tideenhanced by on-shore winds and the water levelreached 1.8 m above the expected height resultingin extensive flooding.
Long-term factors
Relative increases in sea level along low-lying coasts create longer-term threats by changing thefrequency with which sea defences are overtoppedby wind-driven waves or storm surges. During thelast 100 years, there has been a eustatic (worldwide)increase in sea level of 0.10–0.20 m. This has beenattributed to a combination of the thermalexpansion of seawater and the melting of ice-capsafter the end of the last ice-age, a process nowaccelerated by global warming. In addition, somecoastal areas have experienced an additional isostatic(local) increase in sea level due to a lowering of theland surface. For example, the south-east corner ofEngland, including London, is slowly sinking as thenorth-west of Britain rises in response to theremoval of the mass of ice that accumulated theremore than 10,000 years ago. The city of Venice issinking into the Adriatic due to local land sub-sidence due to the over-extraction of ground water.
In the lowest-lying coastal zones, the increasedvolume of water in the oceans basins and localsubsidence has resulted in a net rate of sea level riseof about 0.3 m per century. As a consequence,natural shore defences, such as salt marshes, beachesand dune systems, have suffered increased erosionand many of the 300 barrier islands along the coastof the United States are driven further landwardwith onshore storm winds.
Human causes
The earliest settlers were usually aware of thedangers of flood-prone land. In many countries,major floodplain invasion did not occur until thelate nineteenth century but then expanded rapidly.By 1975 more than half of the floodplain land in theUSA was developed and urban areas were spreadingonto floodplains at the rate of 2 per cent per year.Rapid City, South Dakota, is a typical case. Theinitial site was laid out south of the floodplain butthere was progressive floodplain invasion from 1940onwards (Rahn, 1984). By 1972, the year of the flashflood disaster, the entire floodplain within the citylimits had been urbanised. Similar processes haveaffected coastal cities. It is estimated that 21 percent of the world’s population lives within 30 kmof the sea and that these populations are growing attwice the overall global rate (Nicholls, 1998). As aresult, average annual flood damages in the USAgrew four-fold during the twentieth century – fromaround 1 billion to 3.5 billion US$ – even whenadjustment is made for cost inflation and are now atthe highest level recorded (Fig. 11.4).
Floodplain invasion has occurred as a result ofcountless individual decisions rooted in the beliefthat the locational benefits outweighed the risks. Anappreciation of these attitudes is as important asflood hydrology in understanding flood hazardbearing in mind that floodplain development is notnecessarily irrational. A net economic benefit canoccur if the additional benefits derived from locat-ing on the floodplain (i.e. the benefits over and above those available at the next best flood-free site) outweigh the average annual flood losses.

Unfortunately, it is virtually impossible to assesscosts and benefits accurately at both local andnational levels. Moreover, a major flood can easilywipe out the benefits accumulated over previousyears. What is more certain is that, once flood-plains become urbanised, there follows a demandfrom the local community for flood protection that often leads to even greater future losses (see Box 11.3).
MITIGATION
Disaster aid
For the LDCs international aid is the key factor,supported by contributions from the nationalgovernment and locally-based NGOs. Past experi-ence of the mis-use of funds by government bodies,coupled with poor performances in aid distribution,have prompted donors to channel more and moreassistance through the NGOs, as in the case of
HYDROLOGICAL HAZARDS: F LOODS 243
19101900 1920 1930 1940 1950 1960 1970 1980 1990 2000
45
40
35
30
25
20
15
10
5
0
Year
Dam
ages
($b
illio
n)
1972
1993
2005
Figure 11.4 Directannual flood damage(at 2006 US$ values)from rivers in theUSA 1903–2006.The data are forwater years (starting1 October andending 30September) and donot include coastalflooding. Apart fromthe upward trend,the graph shows theimportance of the1972 floods from‘Hurricane Agnes’,the 1993 Midwestfloods and the lossesfrom Hurricanes‘Katrina’ and ‘Rita’in 2005. Compiledfrom data at the USNational WeatherService HydrologicInformation Center.

THE EXPER IENCE AND REDUCT ION OF HAZARD244
For many years, the prime response to flood risk has been the structural or engineeringapproach, where funds from central and localgovernment have been used to protect existingdevelopment by flood defence works. In somecases, this response has proved counter-productivedue to the levee effect. This effect exists when flooddefence works are erroneously perceived to renderthe floodplain safe for development irrespective of the size of the flood. In this situation, new flood defences can increase the demand forbuilding on floodplain land, land values rise and, if new development follows, more propertyis placed at risk. For example, Montz andGruntfest (1986) found that, although structuralcontrols were common over the USA, floodplaininvasion and flood losses continued to increase.The pressure on flood-prone land – both protectedand unprotected – is most difficult to control in communities experiencing high economicgrowth that lack alternative, risk-free, sites fordevelopment.
The process is well-documented for the UK.Neal and Parker (1988) illustrated the process for Datchet, a town of 6,000 people on the Thames floodplain, England. Despite the absenceof any flood protection works, the planningcontrol system failed to prevent the location of an additional 425 new houses on the floodplain inthe 1974–83 decade. In England and Wales, theplanning system often requires new developmentto be linked with the construction of flooddefences, rather than being excluded completelyfrom floodplains (White and Howe, 2002). Evenso, the development pressure on floodplainscontinues to grow (Fig. 11.5). Applications tobuild on floodplain land increased from 8 per centof all development applications in 1996–97 to 13per cent in 2001–02 and the number of housing
units proposed, though not actually built, rosealmost six-fold during the period (Pottier et al.,2005). The Environment Agency (EA), whichadvises local authorities in England and Walesabout the flood risk attached to planningapplications, successfully objected to 353 majordevelopments in 2004–05, almost 60 per cent ofthem related to housing, because of the flood risk.But between 2002 and 2006 over 700 newhousing developments have gone ahead despiteopposition from the EA. Central government
Box 11.3
THE LEVEE EFFECT
0
1
2
3
4
5
1996/97 1997/98 1998/99 1999/00 2000/01 2001/02
Num
ber
of
app
licat
ions
(000
s)
Financial years
Figure 11.5 The number of planning applications for residential and non-residential development onfloodplain land in England between the financial years 1996/97 and 2001/02. After Pottier et al. (2005).Reprinted from Applied Geography 25, N. Pottier et al., Land use and flood protection: contrastingapproaches and outcomes in France and in England andWales, copyright (2005), with permission fromElsevier.

Bangladesh. However, following the most damag-ing flood on record in 1998, the Bangladeshigovernment significantly improved the delivery ofaid to flood victims in an attempt to raise itspolitical profile within the country (Paul, 2003).
For most LDCs it is the productive sector, notablyagriculture, that bears most of the direct losses infloods. It is also true that the reconstruction costsoften outweigh the direct damages. This feature isillustrated in Table 11.2 after exceptional rainfallsover Mozambique in February and March 2000.Flooding occurred over 12 per cent of the cultivatedland with total disaster-related costs, includingindirect losses and relief efforts, estimated atUS$980 million. Recovery from such disasters isbeyond the capacity of developing nations alone andan international financial package is required. Thishappened in Sudan during 1988, following flooddamage totalling US$1 billion, when the WorldBank helped to prepare a US$408 million recon-
struction programme consisting of both local andforeign investment, as shown in Table 11.3 (Brownand Muhsin, 1991).
Insurance
In most MDCs there is a recognition by govern-ments that the taxpayer cannot be expected torefund the flood losses sustained by uninsuredmembers of the public. But the relationshipsbetween government, the insurance industry andthe individual property owner may be confused andliable to change. In some countries, like Germanyand the UK, householders can buy flood insurancefrom private companies within comprehensivepolicies for buildings and their contents so that flood losses are subsidised by the market as a whole.But buildings insurance is only mandatory duringthe life of a mortgage and many householders –notably tenants, pensioners and those in the lower
HYDROLOGICAL HAZARDS: F LOODS 245
plans for further urban expansion in southernEngland (Thames Gateway, the M11 Corridor andthe South Midlands) could add over 100,000 newhomes to the local floodplains. Surprisingly, thelevee effect can be strong even after a damagingflood. The 1993 Midwest floods created up to $16billion in damages and the loss of 7,700 propertiesbut this event was soon followed by a rush for newdevelopment on the floodplains. In the St Louismetropolitan region alone, 28,000 new homeshave been built and nearly 27 km2 of commer-cial and industrial land have been developed – amounting to $2.2 billion in new investment – on land that was under water in 1993 (Pinter,2005).
The circular link between flood control worksand floodplain encroachment (the levee effect) canbe explained by three factors:
• The more intensive the floodplain develop-ment, and the greater the existing investment,
the greater are the local economic benefitsperceived to result from flood control struc-tures. Therefore, flood protection schemes can be justified on cost–benefit grounds.
• The cost–benefit ratio also weighs in favour of new building construction when land cangain a perceived high level of protection fromrisk and be freed for development. The higherland values in the ‘protected’ area then makefurther floodplain invasion more likely.
• The process exists because the real costs arenot borne by those gaining the benefits. Mostflood defence is financed by central govern-ment in an attempt to serve national economicefficiency whilst planning authorities pursuemore local development goals. Since privateinvestment in the floodplain appears to be protected by public money, it is perfectlyrational for an individual or a company tolocate there and transfer any hazard-relatedcosts elsewhere.
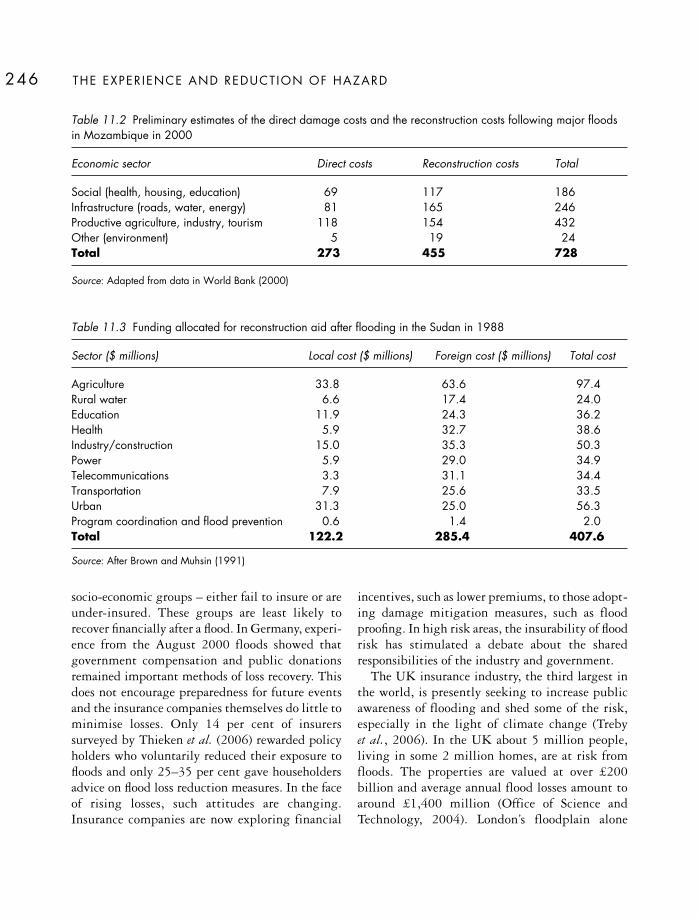
socio-economic groups – either fail to insure or areunder-insured. These groups are least likely torecover financially after a flood. In Germany, experi-ence from the August 2000 floods showed thatgovernment compensation and public donationsremained important methods of loss recovery. Thisdoes not encourage preparedness for future eventsand the insurance companies themselves do little tominimise losses. Only 14 per cent of insurerssurveyed by Thieken et al. (2006) rewarded policyholders who voluntarily reduced their exposure tofloods and only 25–35 per cent gave householdersadvice on flood loss reduction measures. In the faceof rising losses, such attitudes are changing.Insurance companies are now exploring financial
incentives, such as lower premiums, to those adopt-ing damage mitigation measures, such as floodproofing. In high risk areas, the insurability of floodrisk has stimulated a debate about the sharedresponsibilities of the industry and government.
The UK insurance industry, the third largest inthe world, is presently seeking to increase publicawareness of flooding and shed some of the risk,especially in the light of climate change (Treby et al., 2006). In the UK about 5 million people,living in some 2 million homes, are at risk fromfloods. The properties are valued at over £200billion and average annual flood losses amount toaround £1,400 million (Office of Science andTechnology, 2004). London’s floodplain alone
THE EXPER IENCE AND REDUCT ION OF HAZARD246
Table 11.2 Preliminary estimates of the direct damage costs and the reconstruction costs following major floodsin Mozambique in 2000
Economic sector Direct costs Reconstruction costs Total
Social (health, housing, education) 69 117 186Infrastructure (roads, water, energy) 81 165 246Productive agriculture, industry, tourism 118 154 432Other (environment) 5 19 24Total 273 455 728
Source: Adapted from data in World Bank (2000)
Table 11.3 Funding allocated for reconstruction aid after flooding in the Sudan in 1988
Sector ($ millions) Local cost ($ millions) Foreign cost ($ millions) Total cost
Agriculture 33.8 63.6 97.4Rural water 6.6 17.4 24.0Education 11.9 24.3 36.2Health 5.9 32.7 38.6Industry/construction 15.0 35.3 50.3Power 5.9 29.0 34.9Telecommunications 3.3 31.1 34.4Transportation 7.9 25.6 33.5Urban 31.3 25.0 56.3Program coordination and flood prevention 0.6 1.4 2.0Total 122.2 285.4 407.6
Source: After Brown and Muhsin (1991)
accounts for about 16 hospitals, 200 schools and500,000 properties. Most of the risk is associatedwith river and coastal flooding but about 80,000 ofthe flood-prone properties (4 per cent) are vulnerableto flooding from intense rainfall that overwhelmsthe capacity of urban drains. This intra-urbanflooding is responsible for about one-fifth of theaverage annual damage. New housing developmentscontinue to appear in flood-prone areas, oftenagainst the advice given by the EnvironmentAgency to local authority planning committees. Forexample one-third of the 200,000 new homes to bebuilt in south-east England are scheduled forfloodplains. Flooding costs the insurance industry
about £1.5 billion per year. As a general rule,commercial insurers in the UK will not insure anynew build unless it has an annual flood risk of lessthan 0.5 per cent. This has led to a loose agreementbetween central government and the insurancecompanies that, as long as government continues toinvest adequately in flood defences, the industry willcontinue to insure homeowners and smallbusinesses. But, with floodplains under increasingdevelopment pressure and growing concern aboutthe effect of climate change on future rainfallintensities, the cost of new flood defences may proveunsustainable and flood insurance may becomeunobtainable for many householders (see Box 11.4).
HYDROLOGICAL HAZARDS: F LOODS 247
Most floods in England are associated with thearrival of deep Atlantic storms in the winter half-year between October and March. Over three-quarters of peak annual river flows are recordedduring this season. Other factors further amplifythe winter flood risk. For example, damagingfloods occurred in eastern England in March 1947due to spring snowmelt whilst a tidal surge in the North Sea during January 1953 inundatedover 800 km2 of land between the Humber estuaryand Dover with much loss of life. During thesummer months localised floods may be createdby thunderstorms but relatively dry weather tendsto prevail owing to a northward extension of the Azores high pressure cell. At this season theNorth Atlantic jet stream is typically positionedwell to the north between Scotland and Iceland.Unusually, during June and July 2007, the Azoreshigh remained weak and a marked southerlydisplacement of the jet stream introduced a steadystream of Atlantic depressions, embedded inwarm, humid south-westerly air, across southernBritain.
As a result, the early summer from May to Julywas the wettest since records began in 1766 withgeneral rainfall over England and Wales more thandouble the average amount. Isolated intense falls,giving as much as five inches of rain in five hours,created widespread flooding over parts of centralEngland and Wales. Such events may well becomemore frequent. For example, based on a currentclimate change scenario that envisages a five-foldincrease in winter precipitation over the UKduring the next 100 years, the insurance industryestimates doubling of the existing flood risk at thisseason alone (ABI, 2004).
In June 2007 flooding occurred in south andeast Yorkshire with problems experienced inSheffield, Doncaster and Hull. More than 11,000homes were flooded in East Yorkshire, over 8,000of them in the city of Hull where approximately90 per cent of the houses are below sea level. Herethe prime cause was localised intra-urban floodingas the water table rose to fill the drainage systembeyond the capacity of the elderly pumps toremove the storm water. Most properties were
Box 11.4
FLOODS IN ENGLAND: THE SUMMER OF 2007

THE EXPER IENCE AND REDUCT ION OF HAZARD248
flooded to a depth of less than 0.5 m but about1,200 people were evacuated for several months totemporary accommodation, mainly in caravans.The schools were disproportionally affected andmany were forced to close. Local residents werecompletely unprepared and failed to receive a floodwarning.
Rather different flood problems occurred nearTewkesbury due to the combined flood peaks atconfluence of the rivers Severn and Avon. Upton-on-Severn was inundated because demountableflood barriers, designed for the town but stored 20miles away, arrived two days late because ofcongested motorway traffic. Local flash floodstrapped people overnight in vehicles, emergencyshelters were opened and RAF helicopters weredeployed to evacuate hundreds of people,especially from care homes, in one of the largest-ever peace-time rescue missions. Nearly 10,000homes were flooded and some communities cut offfor periods. In Gloucester 15,000 people werewithout electricity and 140,000 without a mainswater supply for several days when a watertreatment works became disabled. Firemen weredrafted in from other areas to help with pumping-out operations and the army carried water bowsersand bottled water into the town.
In total it is estimated that over 1 millionpeople were affected in some way by these floods.There were direct losses to field crops – mainlypeas, broccoli and lettuce – estimated at £220million with further unspecified direct costs toroad surfaces and associated infrastructure plusindirect costs to tourism and sporting events.Total losses were placed at £5 billion; theinsurance industry alone faced 60,000 claimsestimated at £3.0 billion. The average domesticclaim was £20–30,000 and, with a drying-outprocess taking several months, many householdershad to accept temporary accommodation forextended periods.
The 2007 floods exposed several weaknesses inflood preparedness in England:
• Lack of warning The highly localised intra-urban flooding that characterised much ofnorthern England is notoriously difficult toforecast but residents frequently complainedabout the total lack of warning. The Environ-ment Agency admitted that only 30 per cent ofall flood-prone houses in England and Waleshave signed-up for the telephone flood warningservice. All flood-prone householders should beinformed of the risks involved and be givendetailed advice on appropriate methods ofpreparedness and flood-proofing.
• Lack of investment Spending on flood defencesin 2007 amounted to £600 million, a cut of£14 million from the previous year. Somecommentators have contrasted this situationwith the profits achieved by the privatisedwater companies; in 2007 the Severn Trentwater authority realised profits of some £300million. During 2005–06 these authoritieswere supposed to spend £4.3 billion onimproving infrastructure but only about £3.4billion was invested despite above-inflationincreases in domestic water bills.
• Lack of flood protection standards At present there are no national flood defence standardsdesigned to protect individual sites and infra-structure such as water pumping stations,power facilities and schools. Across the country,hundreds of electricity sub-stations are at riskfrom local flooding. As a result of climatechange, it is becoming clear that even thegeneral aspiration to protect urban areas againstthe 1:100 event may be unobtainable. Forexample, since the Thames flood barrier startedoperating in 1983, the estimated annual floodrisk in the area has been doubled from 1:2,000to 1:1,000.
• Lack of sustainable planning The 2007 floodsshowed that many urban drainage systemsfailed in areas remote from river courses. Apartfrom the presence of outdated sewerage andwater pumping systems, many householders
By contrast, the National Flood InsuranceProgram (NFIP) is an integral part of floodplainmanagement in the USA. The NFIP was introducedby the federal government in l968 because of risingflood losses, a growing reluctance by the industry to continue selling cover and a high degree ofoptimism about the part non-structural methodsmight play in flood damage reduction. The schemehas developed into a partnership between the federalgovernment, state and local governments and theinsurance industry – administered by the FederalEmergency Management Agency (FEMA) – toprovide financial assistance to flood victims and toestablish better land use regulations for floodplains(see Box 11.5).
PROTECT ION
Physical intervention is used more against floodsthan any other environmental hazard. This isbecause flood hydrology is well understood andlimited land areas can often be protected from morefrequent floods, although long-standing concernabout the side-effects of river engineering works hasraised questions about the overall effectiveness ofthese measures. More recently, attention has beendrawn to the need for adequate maintenance of allflood protection works, as in the case of the NewOrleans levees (see Box 9.1). This is not an isolatedproblem: in the UK only about 50 per cent of lineardefences (embankments and flood walls) and 60 percent of the associated infrastructure (sluices andpumping stations) are currently judged to be in agood state of repair.
Flood abatement
Flood abatement is not site-specific but operates bydecreasing the amount of runoff contributing to aflood within a total river basin, of small to mediumsize, through land use management. To be useful,such land practices have to be adopted over morethan half of the drainage basin. Typical strategiesinclude reforestation or reseeding of sparselyvegetated areas (to increase evaporative losses);mechanical land treatment of slopes, such as contourploughing or terracing (to reduce the runoffcoefficient); comprehensive protection of vegetationfrom wildfires, over-grazing, clear-cutting of forestland or any other uses likely to increase flooddischarges and sediment loads. To some extent, peakflows downstream can be reduced by the clearanceof sediment and other debris from headwaterstreams, construction of small water and sedimentholding areas (farm ponds) and the preservation ofnatural water detention zones such as sloughs,swamps and other wetland environments. Withinurban areas some water storage can be achieved bythe grading of building plots and the creation ofdetention ponds and parkland.
The potential for dealing with flood problemsthrough the integrated management of soil,vegetation and drainage processes is well-known –New Zealand set up a Soil Conservation and RiversControl Council as early as 1941 – but the practicalresults are often inconclusive. Most flood reductionhas been achieved for flows from comparativelysmall catchment areas. For extensive drainage basinsthe area to be treated is so large that it would takedecades of reforestation and soil conservation to havean appreciable effect. In brief, headwater forests will
HYDROLOGICAL HAZARDS: F LOODS 249
have recently paved over their front gardens toprovide car parking in response to increasedtraffic congestion on residential streets. Thiscan lead to the localised accumulation of excesssurface water and has sometimes happened incontravention of local planning rules. The new
housing developments planned for floodplainlocations need to be built with flood-proofingmore prominently in mind. Water-proofground floors and the introduction of basicservices, such as electricty supply, at a higherlevel should become normal requirements.

THE EXPER IENCE AND REDUCT ION OF HAZARD250
The first step in the NFIP is the publication of aFlood Hazard Boundary Map that outlines theapproximate area at risk from either river or coastalflooding. In order to join the NFIP, a communitymust agree to adopt certain minimum land usecontrols within this area during the so-called‘Emergency Program’. In return, flood insuranceis made available at nation-wide subsidised rates. FEMA then supplies more detailed maps todefine the 1:100 year floodplain and the floodway
– the area within which the 100-year flow can becontained without raising the water surface at any point by more than 0.3 m (see Figure 11.6).The 100-year flood was adopted as the stand-ard hazard in recognition of the benefits, as well as the costs, associated with floodplain devel-opment. These designated floodplains cover, in total, an area almost the size of California and contain about 10 per cent of the nation’s 100million households. A few communities also
Box 11.5
THE NATIONAL FLOOD INSURANCE PROGRAM IN THE USA
100 year level
20 year level
river channel
1% annual probability
5% annual probability
floodway
100 year floodplain
South
North
North
South
river channel
100 year flood limit
20 year flood limit
A
B
Figure 11.6 Schematicrepresentation of riverflow as a spatial hazard.(A) river stage in relationto potential landplanning zones across afloodplain; (B) map of theassociated flood risk ineach zone.

HYDROLOGICAL HAZARDS: F LOODS 251
regulate some types of development in the 1:500year floodplain.
At this point, the community must then jointhe ‘Regular Program’. This involves morestringent land use controls, such as prohibitingfurther development in the floodway and elevatingresidential development in the rest of the flood-plain (floodway fringe) to at least the 1:100 yearflood level. The designated river or coastal flood-plain is divided into risk categories on the basis ofa large-scale Flood Insurance Rate Map (FIRM) sothat insurance ratings can be applied to individualproperties. All new property holders within thel:l00 year floodplain must then buy insurance atactuarial rates, although reduced rates are availablefor properties erected before the FIRM map wasproduced.
Immediately after 1968, local governmentswere slow to adopt the scheme. In 1973 the FloodDisaster Protection Act was passed to encouragemore participation by denying non-compliantlocal authorities various federal grants-in-aid andmaking property owners ineligible for floodinsurance or federal flood relief. Since then therehas been a steady increase in the number ofpolicies taken out to reach a current total of around4.5 million.
The NFIP has achieved some success:
• nearly 20,000 flood-prone communities acrossthe USA have adopted floodplain regulationsand zoning;
• low-cost insurance has been made available and35–40 per cent of all properties insured benefitfrom subsidised rates;
• building construction has improved so thatnew flood-resistant homes suffer about 80 percent less flood-damage than other properties;
• annual flood damage costs have been reducedby nearly US$1 billion with associated savingsin disaster assistance;
• the NFIP operating costs and claims are paid bypremiums rather than the tax-payer (Fig. 11.7).
0
1
2
3
1978
1980
1982
1984
1986
1988
1990
1992
1994
1996
1998
2000
2002
2004
2006
Inco
me
fro
mp
rem
ium
s(U
S$
bill
ion)
Loss
esfr
om
clai
ms
(US
$b
illio
n)
Year
1978
1980
1982
1984
1986
1988
1990
1992
1994
1996
1998
2000
2002
2004
2006
Year
18
10
0
A
B
Figure 11.7 Annual income from premiums and the expenditure in claims under the US NationalFlood Insurance Program for the fiscal years from1978 to 2005. A steep rise has occurred over theperiod. Adapted from FEMA data at www.fema.gov/nfip (accessed on 3 April 2007).

THE EXPER IENCE AND REDUCT ION OF HAZARD252
not prevent floods or sedimentation in the lowerreaches of major river basins nor will they signifi-cantly reduce flood losses arising from major stormevents.
Flood control
Once flood flows have been generated, they can be partially controlled and re-directed away fromvulnerable areas by engineered structures.
Levees
Levees, also called embankments, dykes or stop-banks, are the most common form of river controlengineering (Starosolszky, 1994). It is relativelycheap to construct earth banks that offer protectionup to the height or design limits of a particularflood. In China, dykes built largely since 1949 nowprotect large alluvial plains from floods with a10–20 year return period. Over 4,500 km of theMississippi river, USA, is embanked in this way.Major cities, such as New Orleans, lie below riverlevel and rely on such structures. During the floodof 1993 most of the levees performed as designed.
Although the failure rate of non-Federal levees wasquite high, this was attributable to the fact thatmost Federal levees are designed for 1:100 to 1:500-year return intervals whilst other levees are designedto withstand smaller floods with recurrence intervalsof 50 years or less.
Levee failure can occur because of poor design,inadequate construction or by breaching due to the erosive force of major floods. In 1993, theMississippi levees rarely failed until the river stagereached a metre or more above the design level.When flood banks are breached, they increase localfloodplain storage and water conveyance in reliefchannels behind the levee but reduce flood stagesdownstream. Figure 11.8 shows the effects along a 150 km stretch of the Mississippi during July1993. The levees above Keithsburg held, resultingin a smooth variation in river stage within thechannel whilst multiple levee failures upstream ofHannibal led to water spilling onto the flood-plain and sudden drops in the river level at thesesites. In contrast, the levee failures around NewOrleans during ‘Hurricane Katrina’ occurred beforeovertopping and have been directly attributed toconstruction problems and poor maintenance.
In the high-flood years, when premiums fail tocover costs, the deficit is plugged by loans fromthe US Treasury paid back with interest.
But, according to Burby (2001):
• flood hazards remain ill-defined due to the useof out-dated FIRMs. The exclusion of localisedstorm water drainage flooding means thatpremiums do not always match risk;
• the scheme has not stopped floodplain develop-ment, although new developments are moreflood-resistant. There has been a 53 per centincrease in floodplain development in the 30years of the NFIP’s existence, especially incoastal areas;
• the aim of spreading risk more widely has notbeen achieved. Despite the number of policies,
the market penetration of flood insurance isonly about 25 per cent.
In a study of the twin cities of Reno and Sparks,Nevada, Blanchard-Boehm et al. (2001) confirmedthe limited penetration of insurance due to aperception that flood risks were low, insurance was poor value for money and governmentassistance would be available in the event of loss.Less than one-third of householders would pur-chase insurance voluntarily. Even if insurance wasmade compulsory, it was concluded that manywould not be eligible either because their houses were built before the publication of FIRMs orbecause, with an ageing population, increasingnumbers of property owners have paid off theirmortgage.

HYDROLOGICAL HAZARDS: F LOODS 253
Floodplains and river deltas are characterised bymixed alluvial sediments and it is important thatlevees have sufficiently deep foundations to with-stand long-term under-seepage. In at least one NewOrleans levee failure, it appears that the metal sheet-piling used to anchor the levee into the underlyingsands did not penetrate far enough into theunderlying sands (Kintisch, 2005).
Channel improvements
Artificial channel enlargement increases the carryingcapacity of any river so that higher flood flows canbe contained within the banks. Dredging on theriver Arno at Florence, Italy, after the disastrousflooding of November 1966 aimed to lower the riverbed near two of the old bridges by one metre. Thiswas designed to increase the channel discharge
capacity from 2,900 m3 s–1 to 3,200 m3 s–1 andthereby increase the return period of major floods.Natural river channels can be straightend andsmoothed to increase the flow velocity therebyremoving flood waters downstream more quickly. Inaddition, entirely new flood relief channels can bebuilt to provide extra overspill storage or to divertwater around an area of urban development.
All these methods, including levees and concrete-lined channels, create visual intrusions in thelandscape. More significantly, they do not alwayswork efficiently. They also isolate the river from itsalluvial plain with negative consequences for theriparian ecosystem. Over large deltaic areas ofBangladesh and Vietnam the construction ofembankments to protect agricultural land has beenfound to close tidal channels and reduce surfacedrainage opportunities in the monsoon season.
Sta
ge
(m)
Sta
ge
(m)
Hunt and Lima Lakelevee failed, July 9
North Indian Graveslevee failed, July 13
North section ofSny Island leveefailed, July 25
South Indian Graveslevee failed, July 12
B) HANNIBAL, MO
July 1993
July 1993
9
9.5
8
1st 10th 20th 30th
8.5
7.5
A) KEITHSBURG, IL
7
7.5
6
5.5
5
6.5
Figure 11.8 Flood stages ofthe Mississippi river duringJuly 1993. (A) Keithsburg;(B) Hannibal. Because thelevees in the Rock Islandarea above Keithsburg held,the river stage shows asmooth transition comparedto the sudden fallsassociated with levee failuresand widespread floodplainstorage just upstream ofHannibal. After Bhowmik etal. (1994).
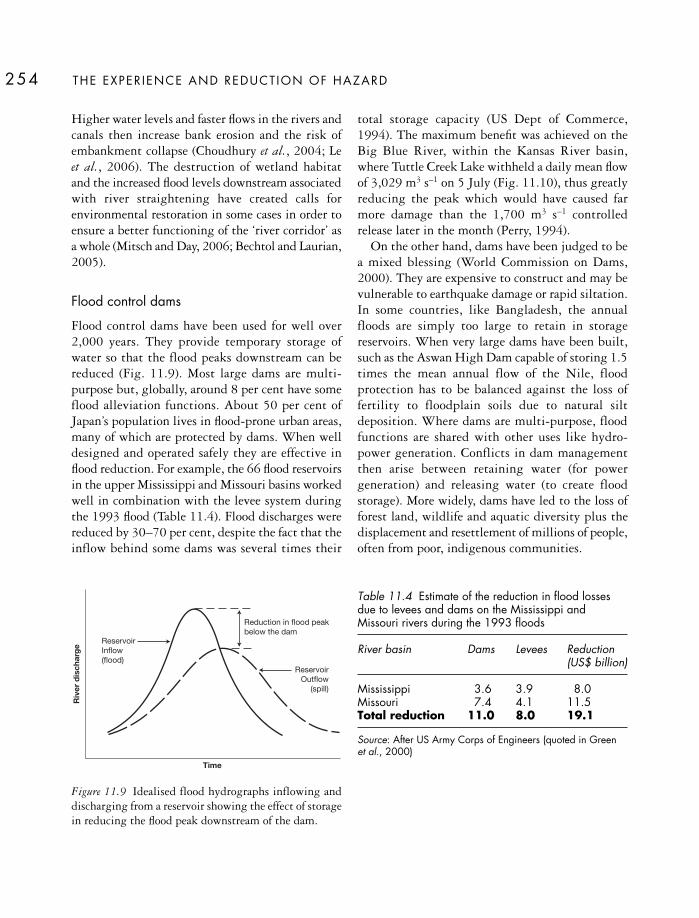
THE EXPER IENCE AND REDUCT ION OF HAZARD254
Higher water levels and faster flows in the rivers andcanals then increase bank erosion and the risk ofembankment collapse (Choudhury et al., 2004; Le et al., 2006). The destruction of wetland habitat and the increased flood levels downstream associatedwith river straightening have created calls forenvironmental restoration in some cases in order toensure a better functioning of the ‘river corridor’ asa whole (Mitsch and Day, 2006; Bechtol and Laurian,2005).
Flood control dams
Flood control dams have been used for well over2,000 years. They provide temporary storage ofwater so that the flood peaks downstream can bereduced (Fig. 11.9). Most large dams are multi-purpose but, globally, around 8 per cent have someflood alleviation functions. About 50 per cent ofJapan’s population lives in flood-prone urban areas,many of which are protected by dams. When welldesigned and operated safely they are effective inflood reduction. For example, the 66 flood reservoirsin the upper Mississippi and Missouri basins workedwell in combination with the levee system duringthe 1993 flood (Table 11.4). Flood discharges werereduced by 30–70 per cent, despite the fact that theinflow behind some dams was several times their
total storage capacity (US Dept of Commerce,1994). The maximum benefit was achieved on theBig Blue River, within the Kansas River basin,where Tuttle Creek Lake withheld a daily mean flowof 3,029 m3 s–1 on 5 July (Fig. 11.10), thus greatlyreducing the peak which would have caused farmore damage than the 1,700 m3 s–1 controlledrelease later in the month (Perry, 1994).
On the other hand, dams have been judged to bea mixed blessing (World Commission on Dams,2000). They are expensive to construct and may bevulnerable to earthquake damage or rapid siltation.In some countries, like Bangladesh, the annualfloods are simply too large to retain in storagereservoirs. When very large dams have been built,such as the Aswan High Dam capable of storing 1.5times the mean annual flow of the Nile, floodprotection has to be balanced against the loss offertility to floodplain soils due to natural siltdeposition. Where dams are multi-purpose, floodfunctions are shared with other uses like hydro-power generation. Conflicts in dam managementthen arise between retaining water (for powergeneration) and releasing water (to create floodstorage). More widely, dams have led to the loss offorest land, wildlife and aquatic diversity plus thedisplacement and resettlement of millions of people,often from poor, indigenous communities.
ReservoirInflow(flood)
ReservoirOutflow
(spill)
Reduction in flood peakbelow the dam
Time
Riv
erd
isch
arg
e
Figure 11.9 Idealised flood hydrographs inflowing anddischarging from a reservoir showing the effect of storagein reducing the flood peak downstream of the dam.
Table 11.4 Estimate of the reduction in flood lossesdue to levees and dams on the Mississippi andMissouri rivers during the 1993 floods
River basin Dams Levees Reduction (US$ billion)
Mississippi 3.6 3.9 8.0Missouri 7.4 4.1 11.5Total reduction 11.0 8.0 19.1
Source: After US Army Corps of Engineers (quoted in Green et al., 2000)

Coastal flooding
Economic development along the coast tends to‘harden’ the shoreline through building works. Thisprocess can block natural shoreline retreat and leadto beach erosion with a consequent reduction in thesand supply and the recreational space available.Generally, coastal flooding is best addressed byavoidance through set-back policies – sometimescalled ‘managed retreat’ – rather than through theconstruction of sea walls or other ‘hard’ structures.For example, beach replenishment is a method ofplacing sand on an eroding or limited-width beachin order to extend it seaward and keep floods at bay(Daniel, 2001). It has been successful for storm
mitigation and has benefits for wildlife habitat and the tourism industry. However, it often failsconventional cost-benefit tests and there are alsoproblems of obtaining environmentally-sustainablesand supplies (Jones and Mangun, 2001; Nordstromet al., 2002).
Flood proofing
This is a means of retrofitting at-risk buildings, andtheir contents, to make them more resistant to floodlosses. Several methods exist:
• elevation – raising the habitable parts of theproperty above flood level by elevation on stilts,elevation on land-fill or making basementswater-tight (Fig. 11.11)
• wet flood proofing – making uninhabited parts ofthe property resistant to flood damage andallowing water to enter during floods
• dry flood-proofing – sealing the property to preventflood water from entering
• floodwalls – building a floodwall around theproperty to hold back the water
• relocation – moving the house, if timber-framed,to higher ground
• demolition – demolishing a damaged property andeither rebuilding more securely on the same siteor rebuilding at a safer site.
HYDROLOGICAL HAZARDS: F LOODS 255D
aily
dis
char
ge
(m3
s-1)
3000
2000
1000
0
Simulateduncontrolled
Observedcontrolled
July 19931 6 11 16 21 26 31
Figure 11.10 Simulated flood discharges on the upperMississippi river during July 1993 in the absence ofreservoirs. Without the reservoir storage, the Big BlueRiver near Manhattan, Kansas, would have quicklyovertopped the Federal levee and flooding downstreamwould have been more severe. After Perry (1994).
Basement
Habitable area
Watertightbasement Watertight
enclosureElevation bystructural means Elevation on fill
D.F.L.
F.C.L.
setback
River
setback
Extent of design flood
D.F.L.
F.C.L. Flood construction level
0.5m Freeboard
Design flood level
Figure 11.11 Flood-proofed new residential buildings on an idealised floodplain. Habitable areas are raised above theflood construction level. The flood construction level allows 0.5 m of freeboard above the predicted maximum heightof the design flood, e.g. the 1:100 year event. Adapted from Rapanos (1981).

Some of these changes can be temporary and somemay be activated by flood warnings. Temporaryresponses include the blocking-up of certainentrances, the use of shields to seal doors andwindows and the use of sand bags to keep wateraway from structures. Further simple measuresinclude removing damageable goods to higher levelsor the pre-flood greasing and covering of mechanicalequipment. The most common permanent altera-tion consists of raising the living spaces above thelikely flood level. Flood proofing is increasingly usedin combination with floodplain zoning and otherlocal ordinances. Figure 11.11 shows that propertycan be elevated above the prescribed design-floodlevel (commonly the 1:100 year flood height) eitherby structural means (stilts) or by raising theproperty on land-fill. Usually a safety factor calledthe freeboard, amounting to about 0.5 m, is added tothe design flood level for construction purposes.This is the minimum elevation for the underside ofthe floor system for habitable buildings. It alsoestablishes the top of any protective structure, suchas a dyke. Other measures, such as setting the build-ing back from any water body and the waterproofingof any basement spaces, are also likely to be specifiedin local planning regulations.
ADAPTATION
Preparedness
Many countries rely on routine civil emergencyarrangements, such as voluntary organisations andthe armed forces, to combat flood losses. This isoften regarded as a low-cost option but a study ofUK flooding in autumn 2000 showed that theemergency response costs accounted for about 15 percent of the total economic flood losses (Penning-Rowsell and Wilson, 2006). More specialised floodpreparedness programmes have increased with thespread of forecasting and warning systems. Thegreatest need for advice exists in flash flood eventswith short warning times where lives can be savedprovided people run immediately to higher ground.
Preparedness has become a key flood mitigationfactor in the LDCs. Large flood disasters in the LDCsoverwhelm local resources but there can be atendency to exaggerate the reliance on externalsupport. For example, the Mozambique floods of2000, when almost 500,000 people were eitherdisplaced from their homes or trapped in flood-isolated areas, attracted thousands of overseas aidworkers attached to 250 different organisations. Atone time, nine military air forces were coordinatedin a high-profile operation of search and rescue but,as shown in Table 11.5, most of those rescued fromdrowning were saved by boat. In fact, Mozambicansthemselves rescued nearly two-thirds of all floodvictims.
There are 30,000 Red Cross-trained flood volun-teers in Bangladesh charged with a wide range oftasks from raising hazard awareness, health andhygiene education and first aid techniques throughto emergency response skills that include the warn-ing of villages through loud hailers and the eva-cuation of people to refuges and higher ground.Other adaptations are more indigenous. For exam-ple, on the chars – the vulnerable silt islands inBangladeshi rivers and offshore – ordinary life ishighly flexible (IFRCRCS, 2002) and includes:
• moving livestock and possession quickly awayfrom flood or erosion threats
THE EXPER IENCE AND REDUCT ION OF HAZARD256
Table 11.5 Numbers of flood victims rescued by airand boat in the Mozambique floods of 2000
Operator Air Boat*
Mozambique military 17,612Mozambique Red Cross 4,483Local fire service, private boats 7,000South African military 14,391Malawian military 1,873French military 79Air Service (international NGO) 208Totals 16,551 29,095
Note: * Many of the boats used were donated byinternational agencies
Source: After IFRCRCS (2002)
• sometimes dismantling thatched houses andmoving them by boat to a temporary site onhigher ground
• using reeds to stabilise new silt deposits ready forcultivation
• planting rice in moveable seed beds for trans-planting when flood water recedes
• seeking marriage partners on other chars to secureescape routes and refuges.
Forecasting and warning
Flood forecasting and warning schemes exist widelyand are most effective for large rivers in the MDCs,such as the Danube in Europe and the Mississippiin the USA. Advances in hydro-meteorology andflood hydrology now permit the modelling of stormrainfall and runoff conditions to high levels ofaccuracy. Automatic rainfall and river flow gauges,linked to satellite and radar sequences, provide real-time data handling capabilities so that meso-scalecomputer models can supply the forecast infor-mation used for Numerical Weather Prediction(NWP) and Quantitative Precipitation Forecasting(QPF). Estimates of storm precipitation can then befed into hydrological models of a river to produceforecasts of the height and timing of flow levelsmoving through the drainage basin. Flood wavesmoving down large rivers can also be tracked bysatellites in real-time, a useful feature in a countrylike Bangladesh where about 90 per cent of riverflow originates outside the national territory.
Important practical problems remain when thewatershed response time is short compared to thetime required for the effective warning and evacua-tion of people at risk. It has been shown that flashflood warnings are not always accurate or timely insmall river basins (Montz and Gruntfest, 2002),despite the fact that large sums of money have beenspent on meso-scale forecasting systems in someMDCs. In Britain a network of integrated weatherradars was built during the 1980s, mainly for floodwarning purposes, but a combination of short riversand highly urbanised drainage basins ensureslimited warning times. Over 50 per cent of the
dwellings at risk in England and Wales have lessthan six hours flood lead time, a period regarded asthe absolute minimum for effective warning in somecountries. In certain urban centres the flood warningtime may be as little as 30 minutes. Flood esti-mation for such basins is notoriously prone to error,largely because the standard prediction methodsmay be over-ridden by local factors, such as soil typeor the degree of urbanisation. Other case studieshave indicated that flood forecasts and warningshave the potential to reduce economic losses by upto one-third on the floodplains of large rivers. Inpractice, actual damage reduction may be less thanhalf of these estimates. There are many reasons whyforecasting and warning schemes fail to performwell but difficulties often lie in the disseminationand response phases. For example, 60 per cent ofthose who survived the Big Thompson Canyon,Colorado, flash flood in 1976 received no officialwarning. Even when warnings are received theresponse rate is likely to be poor, especially amongstdisadvantaged groups like the elderly or the infirm.
Flood forecasting and warning in the LDCs ishampered by a more limited access to science andtechnology, poor communication systems and highrates of illiteracy. In 2003 the World MeteorologicalOrganization recognised that only just over one-third of its members had the capability to run NWPmodels and apply them to flood forecasting. Sincethen the WMO has embarked on a programme forimproving meteorological and hydrological fore-casting for floods but common weaknesses remain:
• limited access to radar and satellite data• meteorological forecasts which are qualitative not
quantitative• meteorological and hydrological services which
are not integrated• fragmented and non-standard data archives• shortage of qualified personnel• lack of a lead agency responsible for flood warnings • flood warnings not focused on those most at risk.
When, in the year 2000, floods struck the Limpoporiver, which drains the fifth largest river basin in
HYDROLOGICAL HAZARDS: F LOODS 257

THE EXPER IENCE AND REDUCT ION OF HAZARD258
southern Africa, a survey of two affected communi-ties in Mozambique showed that official warningsfailed to reach nearly 60 per cent of the householdsand residents had to rely entirely on relatives andfriends for assistance (Brouwer and Nhassengo,2006).
Land use planning
During recent decades, urban communities espe-cially in the MDCs, have adopted stricter controlson land use management in order to limit floodplaindevelopment. These policies depend on the avail-ability of accurate flood-risk mapping, includinginformation on water depth, flow velocity and floodduration. According to Marco (1994), flood map-
ping was first attempted in the USA and remainsunder-used in Europe where the EU has shown littleinitiative in setting continent-wide standards.Burby et al. (1988) concluded that land manage-ment in the USA had been effective in protectingnew development from losses up to the 1:100 yearflood event. The benefits far exceeded the costs toeither individuals or government and were achievedmainly through influencing the decisions of buildersand land developers. Floodplain development pres-sures are also reduced in countries where there is anadequate supply of flood-free land for development.
In the USA land planning for floods has beensteered by the National Flood Insurance program(see Box 11.5). By contrast, controls on floodplaindevelopment in the UK have been more voluntary.
Plate 11.1 A house floats in an irrigation ditch in Plaquemines County, Louisiana, USA, in October 2005. Thiswas typical of the fate of homes ripped from their foundations, and then carried away, by the floods that followed‘Hurricane Katrina’. (Photo: Andrea Booher, FEMA)
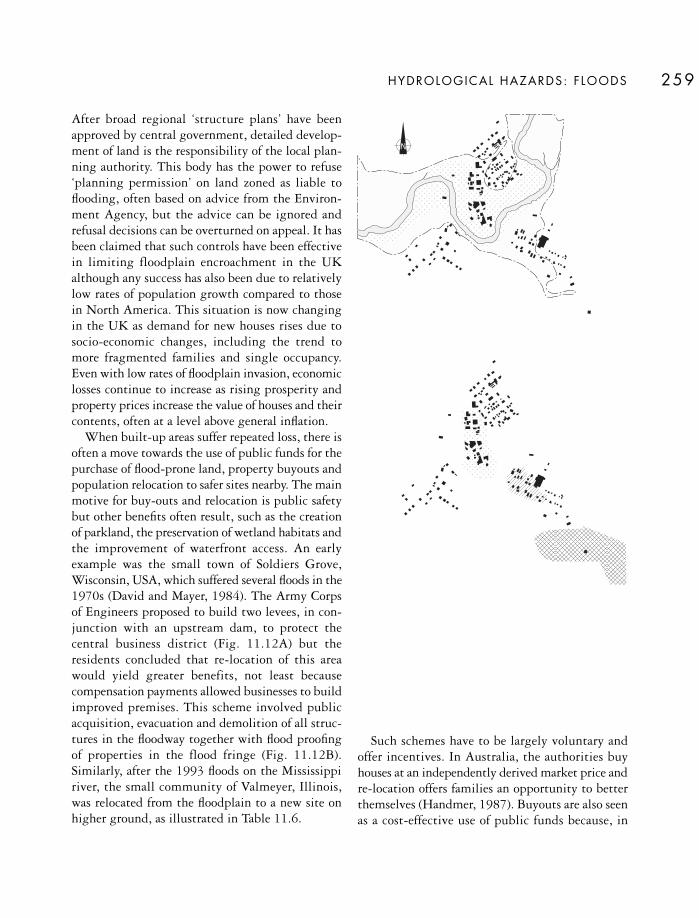
HYDROLOGICAL HAZARDS: F LOODS 259
After broad regional ‘structure plans’ have beenapproved by central government, detailed develop-ment of land is the responsibility of the local plan-ning authority. This body has the power to refuse‘planning permission’ on land zoned as liable toflooding, often based on advice from the Environ-ment Agency, but the advice can be ignored andrefusal decisions can be overturned on appeal. It hasbeen claimed that such controls have been effectivein limiting floodplain encroachment in the UKalthough any success has also been due to relativelylow rates of population growth compared to thosein North America. This situation is now changingin the UK as demand for new houses rises due tosocio-economic changes, including the trend tomore fragmented families and single occupancy.Even with low rates of floodplain invasion, economiclosses continue to increase as rising prosperity andproperty prices increase the value of houses and theircontents, often at a level above general inflation.
When built-up areas suffer repeated loss, there isoften a move towards the use of public funds for thepurchase of flood-prone land, property buyouts andpopulation relocation to safer sites nearby. The mainmotive for buy-outs and relocation is public safetybut other benefits often result, such as the creationof parkland, the preservation of wetland habitats andthe improvement of waterfront access. An earlyexample was the small town of Soldiers Grove,Wisconsin, USA, which suffered several floods in the1970s (David and Mayer, 1984). The Army Corpsof Engineers proposed to build two levees, in con-junction with an upstream dam, to protect thecentral business district (Fig. 11.12A) but theresidents concluded that re-location of this areawould yield greater benefits, not least becausecompensation payments allowed businesses to buildimproved premises. This scheme involved publicacquisition, evacuation and demolition of all struc-tures in the floodway together with flood proofingof properties in the flood fringe (Fig. 11.12B).Similarly, after the 1993 floods on the Mississippiriver, the small community of Valmeyer, Illinois,was relocated from the floodplain to a new site onhigher ground, as illustrated in Table 11.6.
Such schemes have to be largely voluntary andoffer incentives. In Australia, the authorities buyhouses at an independently derived market price andre-location offers families an opportunity to betterthemselves (Handmer, 1987). Buyouts are also seenas a cost-effective use of public funds because, in
A
B
Area being abandoned
Flood-proofing area
Relocation sites
Floodway
Flood fringe
Proposed levees
U.S. 61
U.S. 61
Kickapoo R.
Kickapoo R.
OldDowntown
Business
Industrial
Residential
Figure 11.12 Adjustment to the flood hazard at SoldiersGrove, Wisconsin, USA. (A) the floodway and the floodfringe, together with the location of two proposed levees;(B) the areas eventually flood-proofed and abandoned,together with the relocation sites. After David and Mayer(1984). Reprinted by permission of the Journal of theAmerican Planning Association 50: 22–35.

return for the one-off purchase cost, the propertybecomes ineligible for any future assistance follow-ing disaster. In the USA, FEMA’s Hazard MitigationProgram, introduced in 1988, facilitates similarbuy-outs especially for high-risk properties thatmake repeated loss claims and account for a largefraction of the NFIP’s costs. For example, FEMA hasidentified over 30,000 repeatedly flooded homesincluding more than 5,000 where the owners havereceived insurance payouts that exceed the value of their property. Following the Midwest floods in 1993, more than 10,000 homes and businesses were relocated away from valley bottoms. Abouthalf of all the relocations took place in Illinois and Missouri and cost US$66 million but theseproperties had previously received US$191 millionin flood insurance claims. Federal disaster legislationnow reserves 15 per cent of all relief funds for landacquisition, relocation and similar hazardadaptation.
In future, land planning will include a greaterelement of the ‘living with floods’ approach. Follow-ing disastrous 1:100 year flooding in Bangladesh in 1988, the United Nations Development Pro-gramme commissioned various flood studies incollaboration with the Bangladeshi government.
The proposal was for increased reliance on embank-ments along the Brahmaputra and Ganges riverstogether with special defences to protect the capitalDhaka and at least 80 other towns where floodwaters are eroding the foundations of buildings.This plan has not been adopted in full because thereare alternative strategies that place more reliance on traditional and sustainable flood responses. These include village-level warning and evacuationschemes, organising working parties to repair leveebreaches, developing plans to provide emergencysupplies of food and fresh water and stockpiling vitaltools and equipment. Small-scale, self-help strate-gies, which fit in with present land use practices and reduce the ecological impacts of engineeringschemes, are likely to assume increasing importancein the future. Within the MDCs, there is a similarmovement towards ‘multi-objective river corridormanagement’ which seeks to improve floodplaindevelopment so that they are better equipped tocope with the complex, and sometime conflicting,demands which are placed upon them (Kusler andLarson, 1993). The traditional defence of floodplainsand coasts is looking increasingly unsustainable inthe light of climate change and growing socio-economic risk. In England and Wales the present
THE EXPER IENCE AND REDUCT ION OF HAZARD260
Table 11.6 Fact file on the post-1993 flood relocation of Valmeyer, Illinois
Before the flood During the flood Flood responses After the flood
Population 900 All people flooded eligible Population 1,000, although for relocation grants about half former residents
moved elsewhere
350 houses and 90% of structures Temporary accommodation Full re-building took more than other buildings substantially damaged provided in FEMA trailers 10 years
Site protected by Levees overtopped. Community decision to New site flood freelevees built after Floodwaters in town re-locate. Federal and state flood in 1947 from Aug–Oct funding provided. Purchase
of some 200 ha about 3 km away and 150 m higher.
25 businesses Commercial sector Commercial sector rebuilt with hit badly growth potential
Note: This table, and other information on Valmeyer, was kindly provided by Graham Tobin and Burrell Montz (personalcommunication)

expenditure on flood defence is believed to be lessthan half that required simply to maintain currentlevels of protection so managed retreat and re-alignment is likely to become more prominent inthe coming decades (Ledoux et al., 2005).
KEY READING
Changnon, S. A. (ed.) (1996) The Great Flood of1993. Boulder, CO: Westview Press. Describes theworst river flooding experienced during recent yearsin the USA.
Parker, D. J. (ed.) (2000) Floods (Volumes 1 and 2).London and New York: Routledge. A detailed andauthoritative reference source.
Pinter, N. (2005) One step forward, two steps back on US floodplains. Science 308: 207–8. Clearlydemonstrates the difficulty of changing people’sattitude to flood risk even after a major event.
Treby, E. J., Clark, M. J. and Priest, S. J. (2006)Confronting flood risk: implications for insuranceand risk transfer. Journal of Environmental Management
81: 351–9. Rehearses the ongoing questions aboutwho should pay what when disaster strikes.
White, I. and Howe, J. (2002) Flooding and the roleof planning in England and Wales: a critical review.Journal of Environmental Planning and Management45: 735–45. Points the way towards better land useas a means of risk reduction.
WEB L INKS
Association of British Insurers www.abi.org.uk/floodinfo/
UK Environment Agency www.environment-agency.gov.uk/regions/thames
National flood Insurance Program, USA www.fema.gov./nfip
Flood Hazard Research Centre, Middlesex Universitywww.fhrc.mdx.ac.uk/
UK Meteorological Office www.metoffice.gov.uk/corporate/pressoffice/anniversary/floods1953html
HYDROLOGICAL HAZARDS: F LOODS 261

DROUGHT HAZARDS
Drought is different from most other environmentalhazards. It is called a ‘creeping’ hazard becausedroughts develop slowly and have a prolongedexistence, sometimes over several years. Unlikeearthquakes or floods, droughts are not constrainedto a particular tectonic or topographic setting. Theycan extend over regions sub-continental in scale andaffect several counties. Therefore, drought is similarto context hazards (Chapter 14). The human impactof drought varies between countries more than anyother hazard. National wealth is the main criterion.There are no deaths from drought in the developedcountries but, in many LDCs, the effect of unusuallylow rainfall on already precarious food supplies maycreate a link between drought and famine-relateddeath. But, in many LDCs, drought is only part ofa ‘complex emergency’ where food shortage mayresult from various combinations of war, poverty,agricultural policy and environmental degradationas well as rainfall deficiency. Consequently, directdrought impacts are often difficult to assess. As a result, a revised procedure was recently adoptedfor drought entries in the EM-DAT record held by CRED for the 1900–2004 period. This re-classification led to some reduction in the originalnumber of recorded drought events but drought-
related deaths increased to the extent that more thanhalf of all deaths associated with natural hazardswere attributed to drought (Below et al. 2007).
The adverse effects of drought are common insemi-arid regions where there is a dependence,either economically or for subsistence purposes, ondryland agriculture. Food-shortages and famine-related deaths are the most serious outcomes ofdrought although – as already indicated – the linksbetween drought and famine are not simple (see Box12.1). Drought can occur anywhere, because it is anintegral part of climatic variation, but it tends to bemost important in semi-arid regions for two reasons.First, a low mean annual rainfall is associated witha high variability of total falls from season to seasonand from year to year. The lack of rainfall reliability(rather than the low absolute amounts) creates uncer-tainty about available water supplies. Too often,inappropriately optimistic development takes placein agriculture during the wetter phases and thenleads to drought in the dry spells. Second, the dura-tion of drought is longer in the drier lands. In thewetter climates, a rainfall deficit is likely to persistfor a few months only. For example, the 1975–76drought over north-west Europe lasted only 16months whereas the late twentieth century droughtin the African Sahel was created by persistently dryconditions that lasted for over 15 years from l968,
12
HYDROLOGICAL HAZARDS
Drough t s

HYDROLOGICAL HAZARDS: DROUGHTS 263
In the public mind, drought and famine appear tobe perceived as cause and effect. In practice, anyrelationship that exists is indirect and complicated:
• Drought is a geophysical hazard whereas famineis a cultural phenomenon. Drought results froma lower than expected amount of precipitation.Famine results from an acute food shortage. Afood crisis may be associated with low rainfalland crop failure but famine disasters are also dueto human factors. When famine-related deathsoccur, a ‘complex emergency’ – due to multiplecauses – exists. Such causes may includemeteorological factors but will definitelyinclude poverty, malnutrition, environmentaldegradation, poor governance and war as well(White, 2005).
• Neither drought nor famine are easily defined.Unlike short-term, localised hazards, they areoften multi-year and multi-country events.This characteristic leads to an over-counting of events if each year and each country isseparately recorded. A review by CRED of EM-DAT drought and famine data showed that thepractice of compiling records on an individualannual and national basis produced a total of808 drought entries over the 1900–2004period. When the methodology was changedto merge the duration and areal extent in orderto better represent the scale of droughts, thetotal fell to 389, a reduction of 66 per cent fromthe original number. Over the same period, 76famines were recorded. Of these, 68 (almost 90per cent) were classified as drought-relatedevents; the remaining famine entries wereattributed to ‘complex disasters’.
• Both phenomena create problems of measure-ment because they are identified on the basis ofhuman impacts, rather than physical causes. Also
both phenomena represent relative, rather thanabsolute, variations from the norm. These factorsmake all the various emergency reponses, suchas early warning and food aid donations,difficult to implement when there is doubt anddisagreement between field workers and donorsabout whether a crisis really exists.
• A famine disaster is especially difficult todistinguish from lesser states of hunger such asmalnutrition and and varying degrees of foodscarcity. Most attempts at a famine definitiontry to capture the situation where a total short-age of food lasts long enough to cause wide-spread suffering, severe malnutrition and deathfrom starvation, particularly amongst the mostvulnerable groups in any area or community(Howe and Devereux, 2004). Because the time-scale is protracted, some observers see famineas a process, rather than as an event, as with mostenvironmental hazards.
Famine disasters have been recorded for at least6,000 years and have only recently been elimi-nated from the developed world (Dando, 1980).In the 1947 famine in the USSR, starvationtriggered by a poor harvest led to an estimated 1.0to 1.5 million excess deaths, although enough foodwas available within the country to prevent deathson this scale. As recently as 1959–61, 30 millionpeasants died from famine in northern China,again largely because of government inaction(Jowett, 1989). Because drought is so mixed upwith other processes that make people prone tofamine, drought impacts in the LDCs may beunder-estimated. On the other hand, whilst thenumber of food emergencies worldwide reportedby the FAO doubled from 15 per year during the 1980s to more than 30 per year in the early2000s, over 50 per cent of these emergencies
Box 12.1
THE RELATIONSHIPS BETWEEN DROUGHT AND FAMINE

THE EXPER IENCE AND REDUCT ION OF HAZARD264
and led to widespread famine in the mid-1980s. In1991–92 drought covered 6.7 million square kilo-metres of Africa, affecting 24 million people.
Well-organised, industrialised countries have themeans to avert the worst effects of drought in bothurban and rural settings. This has not always beenthe case. Major droughts tend to occur on the GreatPlains of the USA every 20 years and duringdroughts in the 1890s and 1910s there were deathsdue to malnutrition. A turning point was reachedwith the ‘Dust Bowl’ years of the 1930s whenalmost two-thirds of the United States was indrought and the human impact was exacerbated bypoor farming techniques and a depressed economy.After this, massive state and federal aid resulted ingreater control of soil erosion and the develop-ment of better irrigation practices. These measures,combined with improved farm management andcrop insurance, ensured that the 1950s drought had less severe impacts. Even so, problems of US drought management remain (Pulwarty et al.,2007).
The following are special features of drought:
• Unlike most hazards, drought can be difficult torecognise, especially in the early stages (see alsoBox 12.1). The simplest definition of drought is‘any unusual dry period which results in ashortage of water’. Rainfall deficiency is,therefore, the ‘trigger’ but it is the shortage ofuseful water – in the soil, in rivers or reservoirs –which creates the hazard. In practice, droughtdisasters are better defined according to theirimpacts on human activities and resources, suchas agricultural production, water supplies andfood availability, rather than on the basis ofrainfall statistics alone.
• It is important to view any water shortage interms of need rather than in absolute rainfallamounts. In other words, drought and aridity arenot the same. This is because humans adapt theiractivities to the expected moisture environment:a yearly rainfall of 200 mm might be reasonablefor a semi-arid sheep farmer but could be a
were attributed to human causes (Pingali et al.,2005).
Malnutrition is always a contributory com-ponent of famine. It has been described as the mostwidespread disease in the world and one-third ofthe population of the LDCs is malnourished.There is a general under-registration of populationin the LDCs and many countries lack reliable dataon the causes of death. It has been said that, wherethere are statistics there is no malnutrition and,more significantly, where there is malnutritionthere are no statistics. Given these limitations, itis impossible to produce a fully reliable estimateof the average annual number of people eitherkilled or affected by drought-related famine.
Most famine-related deaths during recent yearshave occurred in the semi-arid areas of sub-SaharanAfrica. In February 1985 the United Nations esti-mated that 150 million people living in twenty
African countries were affected, of which 30million were in urgent need of food aid. Anestimated 10 million of these people abandonedtheir homes in search of food and water and up to250,000 people died. There were also huge lossesof cattle and sheep. Asian countries, like India, areregularly affected by drought but some havesought to avoid famine through policies that seeknational self-sufficiency in the production of foodgrains (Mathur and Jayal, 1992). In SouthAmerica, the semi-arid area of north-east Brazilsuffered frequent droughts in the twentiethcentury (1915, 1919, 1934, 1983 and 1994).Children under five years of age constitute almost20 per cent of the population and endemic mal-nutrition, especially within marginalised groups,greatly increased the vulnerability to droughtperiods.
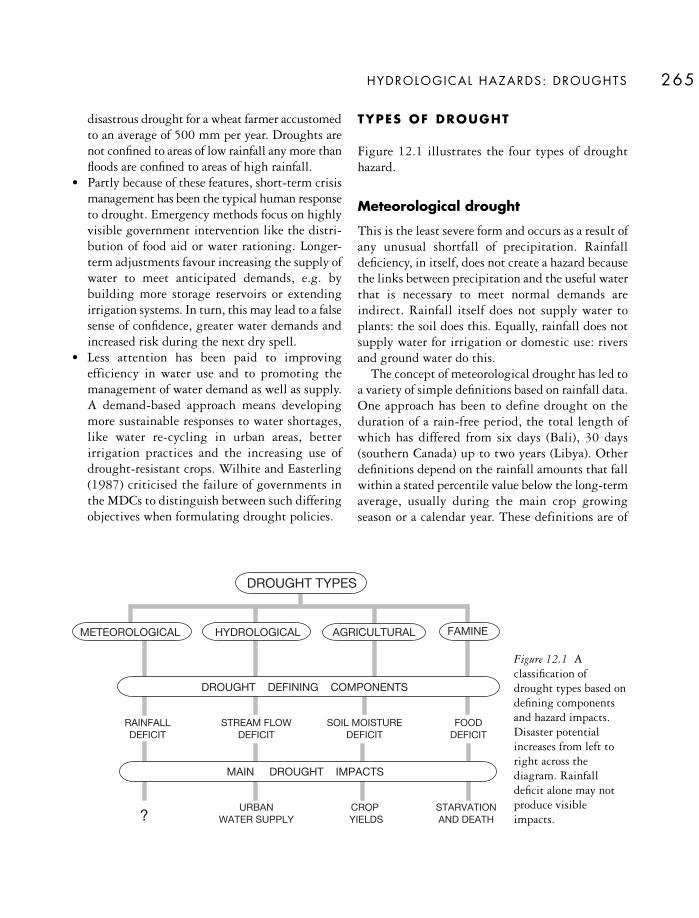
disastrous drought for a wheat farmer accustomedto an average of 500 mm per year. Droughts arenot confined to areas of low rainfall any more thanfloods are confined to areas of high rainfall.
• Partly because of these features, short-term crisismanagement has been the typical human responseto drought. Emergency methods focus on highlyvisible government intervention like the distri-bution of food aid or water rationing. Longer-term adjustments favour increasing the supply ofwater to meet anticipated demands, e.g. bybuilding more storage reservoirs or extendingirrigation systems. In turn, this may lead to a falsesense of confidence, greater water demands andincreased risk during the next dry spell.
• Less attention has been paid to improvingefficiency in water use and to promoting themanagement of water demand as well as supply.A demand-based approach means developingmore sustainable responses to water shortages,like water re-cycling in urban areas, betterirrigation practices and the increasing use ofdrought-resistant crops. Wilhite and Easterling(1987) criticised the failure of governments inthe MDCs to distinguish between such differingobjectives when formulating drought policies.
TYPES OF DROUGHT
Figure 12.1 illustrates the four types of droughthazard.
Meteorological drought
This is the least severe form and occurs as a result ofany unusual shortfall of precipitation. Rainfalldeficiency, in itself, does not create a hazard becausethe links between precipitation and the useful waterthat is necessary to meet normal demands areindirect. Rainfall itself does not supply water toplants: the soil does this. Equally, rainfall does notsupply water for irrigation or domestic use: riversand ground water do this.
The concept of meteorological drought has led toa variety of simple definitions based on rainfall data.One approach has been to define drought on theduration of a rain-free period, the total length ofwhich has differed from six days (Bali), 30 days(southern Canada) up to two years (Libya). Otherdefinitions depend on the rainfall amounts that fallwithin a stated percentile value below the long-termaverage, usually during the main crop growingseason or a calendar year. These definitions are of
HYDROLOGICAL HAZARDS: DROUGHTS 265
URBANWATER SUPPLY
CROPYIELDS
METEOROLOGICAL HYDROLOGICAL AGRICULTURAL
MAIN DROUGHT IMPACTS
RAINFALLDEFICIT
STREAM FLOWDEFICIT
SOIL MOISTUREDEFICIT
FOODDEFICIT
STARVATIONAND DEATH
DROUGHT DEFINING COMPONENTS
FAMINE
DROUGHT TYPES
?
Figure 12.1 Aclassification ofdrought types based ondefining componentsand hazard impacts.Disaster potentialincreases from left toright across thediagram. Rainfalldeficit alone may notproduce visibleimpacts.

THE EXPER IENCE AND REDUCT ION OF HAZARD266
limited value unless they recognise that the impactof any rainfall deficiency is likely to vary throughthe period in question. The Australian Bureau ofMeteorology employs such a period-specific rainfallsystem. A drought is declared if the rainfall in anarea fails to exceed 10 per cent of all previous totalsfor the same period of the year and if the situationpersists for at least three months.
More complex approaches estimate the moisturedeficit within the soil in an attempt to assess theavailability of water for plants and crops. The PalmerDrought Severity Index (PDSI), widely used in theUSA, is based on such a soil moisture budgetingsystem that considers precipitation and temperaturefor a given area over a period of months or years(Palmer, 1965). Drought is then defined in terms ofavailable moisture relative to the norm. The severityof drought is considered to be a function of thelength of period of abnormal moisture deficiency, aswell as the magnitude of this deficiency. The PDSIprovides a single hydrological measure for the effectson soil moisture, groundwater and stream flow buteven these values cannot be easily related to specifichazard impacts, e.g. reduced yields of different croptypes.
Hydrological drought
This occurs when natural stream flows or ground-water levels are sufficiently reduced to impactadversely on water resources. Therefore, hydro-logical drought tends to be measured by relating ashortfall of water supply to water demand. It isassociated mainly with urban areas and the MDCs,although it can be recognised elsewhere. For exam-ple, in the rural areas of north-eastern Brazil, thereare no permanent rivers and water supplies aredependent on seasonal rains which are stored inshallow reservoirs and ponds prone to high rates ofevaporation. After two or three years with belowaverage rains, these storages dry up. Drought givesrural dwellers here less access than usual to cleanwater supplies; isolated communities have to rely onthe distribution of water by road tankers with nega-tive consequences for community health.
Hydrological drought is often managed throughlegislation, either already in force or introduced asan emergency measure, that specifies the maximumamount of water that may be abstracted from asource during low levels of availability. For example,the 95 per cent value on the flow duration curve, asshown in Figure 12.2, is often taken as an appro-priate minimum discharge for the setting of legalcontrols. By definition, drought flows become riverdischarges below this percentile and water abstrac-tions are then restricted accordingly. During themid-1970s, drought was widespread in north-westEurope. In the winter of 1975–76 the recharge ofgroundwater into the aquifers of England and Waleswas less than 30 per cent of the average. As a result,many rivers recorded very low flows during 1976,supply abstractions were reduced and water ration-ing was imposed in the worst affected areas. TheUnited States’ drought of 1988 was the most severein the Mississippi basin since 1936. By July 1988barge traffic was drastically reduced on the Ohio andMississippi rivers. The reduced river flows alsocaused hydropower generation to fall 25–40 per centbelow average over large areas of the USA withsignificant losses in company revenue (Wilhite andVanyarkho, 2000).
00 20 40
Per cent of time discharge equalled or exceeded
Dis
char
ge
(m3
s-1 )
60 80 100
10
20
30
40
50
Figure 12.2 An idealised flow duration curve for a rivershowing the normal dry weather discharge based on the95 per cent exceedance flow level.

Agricultural drought
Agricultural drought is crucial because of theimplications for food production. It is important inthose MDCs with a dependence on agriculturaloutput for their economic well-being, like Australia(see Box 12.2), and also in the LDCs where sub-sistence agriculture supports most of the population.For example, during the drought years of 1992 and1994 in Malawi, agricultural sector output fell 25per cent and 30 per cent respectively below normal.All farmers, whether arable or pastoral, ultimatelyrely on the water available for plant growth in thesoil. Therefore, an agricultural drought occurs whensoil moisture is insufficient to maintain average cropgrowth and yields. Ideally, the severity of agri-
cultural drought should be based on direct soilmoisture measurements but moisture levels areusually assessed indirectly by water balance calcu-lations like the PDSI.
The main consequence of agricultural drought isthe reduced output of crops and animal production.When fodder is inadequate there is a mass slaughterof livestock from which it may take up to five yearsfor animal stocking levels to recover. In 1988 theUSA experienced a costly agricultural drought overthe Midwest. The 1988 corn yield was 31 per centbelow the progressive upward trend that is drivenby improved technology, the largest drop since themid-1930s (Fig. 12.4). More than one-third of theAmerican corn crops were destroyed, a loss put atUS$4.7 billion (Donald, 1988). The overall 1988
HYDROLOGICAL HAZARDS: DROUGHTS 267
Drought is a recurrent feature in Australia. Themost costly impacts are on agricultural produc-tivity, especially in the south-eastern parts of thecountry where most of Australia’s 50,000 farmingfamilies live. Although less than 4 per cent ofAustralia’s GDP comes from agriculture, theeconomic consequences reach national level. Thisis because 80 per cent of all agricultural productsare exported and account for nearly half the valueof all exported goods. Drought causes the failureof rain-fed crops, like wheat and barley, and haltsthe growth of pasture so that stock levels, notablyfor cattle and sheep, fall sharply. For example, overthe 1979–83 dry period over half the nation’sfarms, housing about 60 per cent of the livestock,were affected and, in 1982–83, the yearly cashsurplus on Australian farms fell from an averageof A$21,700 down to A$12,200 (Purtill, 1983).The Federal government now accepts drought asan integral feature of the climate and providesemergency funds for rural communities in timesof ‘exceptional circumstances’. The long-term
economic and ecological impacts of droughtinclude the loss of agricultural jobs, the erosion ofinvestment capital for rural industries, damage to timber stocks due to bushfires, the degradationof natural vegetation and the wind erosion of soils.
It can be difficult to judge the precise beginningand end of drought episodes. The AustralianBureau of Meteorology recognises two rainfallcriteria in drought definition:
• Serious deficiency – rainfall totals within thelowest 10 per cent of values on record for atleast three months
• Severe deficiency – rainfall totals within the lowest5 per cent of values on record for at least threemonths.
The worst droughts tend to occur after a signifi-cant spell of below-average rainfall. Australianormally experiences low, and highly variable,rainfall totals partly because the climate is domi-nated by the subtropical high pressure belt of the
Box 12.2
DROUGHT IN AUSTRALIA

THE EXPER IENCE AND REDUCT ION OF HAZARD268
southern hemisphere. According to Chapman(1999), it is unusual for more than 30 per cent ofthe country to be affected at any one time butdroughts vary greatly; some are intense and short-lived, some last for years, some are localised whilstothers cover large areas (see Table 12.1 and Figure12.3). Severe Australian droughts are often closelylinked to negative phases in the El Niño–SouthernOscillation (ENSO) phenomenon. Under theselarge-scale atmospheric influences, relatively coolsea-surface temperatures prevail off northernAustralia and tend to produce low rainfall overeastern and northern Australia (see Figure 12.3C).
Since the 1970s, there has been a shift in overallrainfall patterns with the sparsely populated areas
of the north becoming wetter and the easternareas, where most people live, becoming drier.Recently, Australia experienced two closely spacedEl Niño events (2002–03) and (2006–07) with nointerspersed wet period (Nowak, 2007). Duringthe past decade most years have also been warmerthan average, with 2005 the the warmest thenrecorded, thereby increasing evaporation losses. At the time of writing (mid-2007), Australia was suffering from the ‘Big Dry’, a long spell ofunusually dry and warm conditions that began in2002. This was the first drought in Australianhistory to be associated explicity by some com-mentators with climate change and has beenpredicted by others to be a possible 1:100 year
Table 12.1 Major droughts and their impact in Australia
Period General characteristics Economic losses
1895–1903 The ‘Federation drought’ followed several Devastating stock losses – 50% reduction in years of low rainfall, especially in sheep and 40% in cattle stock. Wheat crop Queensland; an early ENSO-related event. almost totally destroyed.
1913–1916 Most severe in 1914, an ENSO year. Cattle transported in attempt to find better This drought spread over most of the pasture; 19 million sheep and 2 million cattle country. lost. Bushfires in Victoria.
1937–1945 The ‘World War II droughts’ mainly affected Loss of almost 30 million sheep between eastern Australia; 1940 and 1941 were 1942 and 1945. Wheat yields lowest sinceENSO years. 1914. Some large rivers almost dried up.
1963–1968 Widespread drought, mainly in central 1967–68 40% drop in wheat yields, loss of Australia but also affected the eastern states 20 million sheep decrease in farm income of in the 1965–68 period. A$300–500 million.
1982–1983 A severe short-term drought due to the Total economic cost over A$3,000 million, strongest recorded ENSO event in 1982; mainly due to impact on wheat yields and very extensive across whole eastern half sheep stocks.of Australia.
1991–1995 An extended ENSO drought, the longest so Productivity of rural industries down 10% and far recorded; mostly in central and southern an estimated A$5 billion loss to Australian Queensland plus northern New South Wales. economy. Nearly A$600 million provided in
drought relief.
2002–? The ‘Big Dry’ drought. Began in 2002, the GDP down 1% in 2002–03 with some 70,000 fourth driest year on record. Warmer and jobs lost in the rural sector. The Federal drier than average during 2004 and 2005 government spent A$740 million in aid in many south-eastern areas. The rainfall during 2002–05 estimated that farm output deficits continued into 2007. might be down by 20%.
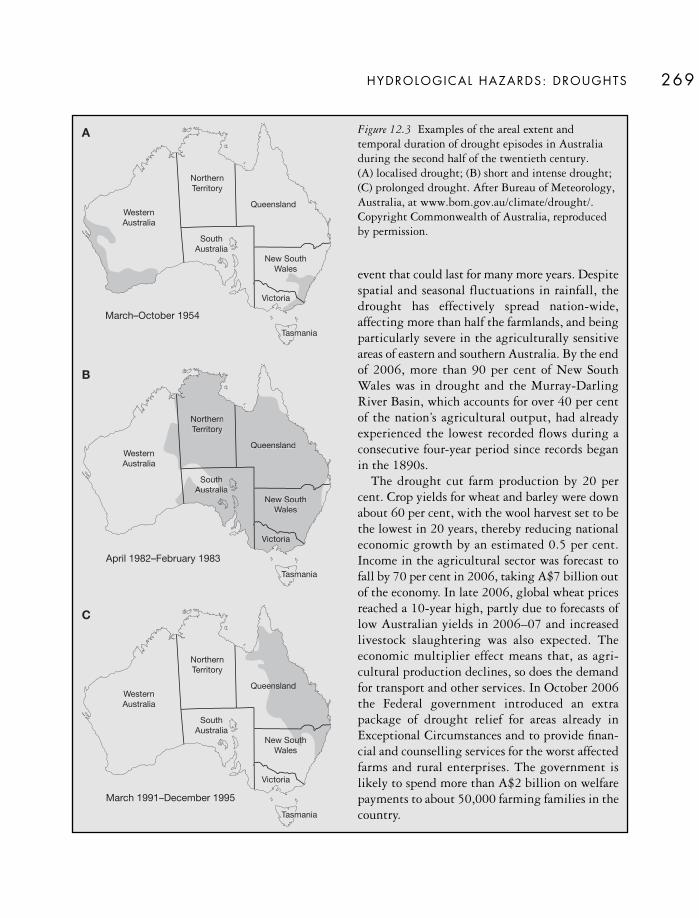
HYDROLOGICAL HAZARDS: DROUGHTS 269
event that could last for many more years. Despitespatial and seasonal fluctuations in rainfall, thedrought has effectively spread nation-wide,affecting more than half the farmlands, and beingparticularly severe in the agriculturally sensitiveareas of eastern and southern Australia. By the endof 2006, more than 90 per cent of New SouthWales was in drought and the Murray-DarlingRiver Basin, which accounts for over 40 per centof the nation’s agricultural output, had alreadyexperienced the lowest recorded flows during aconsecutive four-year period since records beganin the 1890s.
The drought cut farm production by 20 percent. Crop yields for wheat and barley were downabout 60 per cent, with the wool harvest set to bethe lowest in 20 years, thereby reducing nationaleconomic growth by an estimated 0.5 per cent.Income in the agricultural sector was forecast tofall by 70 per cent in 2006, taking A$7 billion outof the economy. In late 2006, global wheat pricesreached a 10-year high, partly due to forecasts oflow Australian yields in 2006–07 and increasedlivestock slaughtering was also expected. Theeconomic multiplier effect means that, as agri-cultural production declines, so does the demandfor transport and other services. In October 2006the Federal government introduced an extrapackage of drought relief for areas already inExceptional Circumstances and to provide finan-cial and counselling services for the worst affectedfarms and rural enterprises. The government islikely to spend more than A$2 billion on welfarepayments to about 50,000 farming families in thecountry.
NorthernTerritory
WesternAustralia
SouthAustralia
Queensland
New SouthWales
Victoria
NorthernTerritory
WesternAustralia
SouthAustralia
Queensland
New SouthWales
Victoria
NorthernTerritory
WesternAustralia
SouthAustralia
Queensland
New SouthWales
Victoria
Tasmania
Tasmania
Tasmania
March–October 1954
April 1982–February 1983
March 1991–December 1995
A
B
C
NorthernTerritory
uthAustralia
Queensland
New SouthWales
Victoria
Figure 12.3 Examples of the areal extent andtemporal duration of drought episodes in Australiaduring the second half of the twentieth century. (A) localised drought; (B) short and intense drought;(C) prolonged drought. After Bureau of Meteorology,Australia, at www.bom.gov.au/climate/drought/.Copyright Commonwealth of Australia, reproducedby permission.

THE EXPER IENCE AND REDUCT ION OF HAZARD270
American grain harvest was the smallest since 1970and smaller than the Soviet harvest for the first timein decades. Agricultural drought on this scaledisrupts international trade in food and world grainstocks fell to a 63-day supply, the lowest since themid-1970s. At the farm level, severe droughtdisrupts normal activities and causes a diversion ofcapital from farm development to drought-reducingstrategies, a fall in cash liquidity and a rise in debt.
In the poorest countries, drought disrupts thesubsistence food supply and increases seasonalhunger. This happened during the 1990–92 droughtin southern Africa. In general, the harvest failure was30–80 per cent below normal and 86 million peoplewere affected over an area of almost 7 × 10⁶ km2. Thedrought caused severe hardship, although there wascomparatively little loss of human life directlyattributable to drought-related malnutrition. InZimbabwe, for example, the volume of agriculturalproduction fell by one-third and contributed only 8per cent to GDP, compared to 16 per cent in normalyears. By November 1992 half the population hadregistered for drought relief. Conditions in Zambiawere typical. In the Southern, Western and EasternProvinces, yields of maize were down by 40–100 percent and some 2 million rural people were affected(IFRCRCS, 1994). According to Kajoba (1992), partof the grain shortfall was due to the cultivation ofhybrid maize under imported fertilizer regimes,rather than a reliance on more traditional drought-resistant crops like sorghum, millets and cassava. Thecommunities at greatest risk were in remote areasbadly served by transport links and with limitedaccess to health care. The drought impacts cascadedrapidly through these areas leading to the closure ofprimary schools and a decline in tourism as wildlifecamps became deserted. Due to low water levels, the
The drought has affected much more than agri-culture. Despite the fact that most of Australia’scities are served by massive water supply schemesdesigned to withstand multi-year episodes of lowrunoff, most reservoirs had fallen below half theircapacity by late 2006 and many towns and citiesin the southern half of the country were subject towater restrictions. The Murray-Darling systemsuffered water stress with reduced allocations forirrigation, a decline in the Red Gum trees alongthe river, fish kills due to low flows and a build-up of salt on some floodplains and wetlands.Adelaide in South Australia is vulnerable becausethe city draws 40 per cent of its drinking water
from the river Murray. The per capita consumptionof water in Australia is high. In 2006 Perth beganoperating a water desalination plant, partlypowered by electricity from wind energy, withSydney and Melbourne expected to follow verysoon. Such schemes may not be enough to meetfuture urban and industrial needs unless measures– like recycling waste water or higher watercharges – are also introduced to curb demand.
With large areas of Australia’s seven states andterritories – plus all the major cities – officiallydeclared ‘in drought’ during 2007, the nationfaces important long-term questions about thefuture utilisation of its water resources.
501960 1970
Years
Ann
ualc
orn
yiel
d(b
ushe
ls/
acre
)
1980 1988
1988
60
70
80
90
100
110
120
130
± one standard deviation
Figure 12.4 Annual corn yields in the United States1960–89 showing the effect of the 1988 drought. In1988 yields were more than 30 per cent below trend, thelargest annual drop recorded since the mid-1930s.Updated after Donald (1988).

Kariba, Kafue and Victoria Falls hydropower stationsworked at 30 per cent capacity and the governmentwas forced to impose daily power stoppages.
Famine drought
This is sometimes regarded as an extreme form ofagricultural drought when food security collapses sothat large numbers of people are unable to maintainan active healthy life. At worst, mass deaths fromstarvation may occur. Today, famine only occurs incertain LDCs and is associated with semi-arid areasof subsistence, or near-subsistence, agriculturewhere rain-fed crop failure results from drought.However, evidence from the Darfur region, Sudan,during the great African drought of 1984–85
challenged the common concept of mass starvationarising directly from crop failure. According to deWaal (1989), the great majority of people survivedin Darfur, despite a doubling of the overall mortalityrate. The excess mortality was heavily concentratedon children and the elderly because people between10 and 50 years old accounted for less than 10 percent of the excess deaths. Many deaths were causedby the transmission of disease (measles, diarrhoeaand malaria) arising from the crowding of refugeesinto centres where water supplies were poor andhealth care was inadequate. This interpretation castsdoubt on the conventional indicators of faminedrought, such as mass starvation, and on theassumed efficacy of conventional disaster reductionstrategies, such as the supply of food aid.
HYDROLOGICAL HAZARDS: DROUGHTS 271
Plate 12.1 A goatherder climbs a tree in Rajasthan, India, during continuing drought conditions in order to chop down fodder for her animals. When this photograph was taken in 2007, the drought had already lasted foreight years. (Photo: Robert Wallis, PANOS)

THE EXPER IENCE AND REDUCT ION OF HAZARD272
Although scarcity of food is a leading factor infamine drought, its effects are compounded byunderlying and long-term socio-economic andhealth-related problems, such as limited access topotable water, a lack of modern sanitation andinadequate health care, especially for the veryyoung. Another feature of severe droughts is thatthey undermine rural stability by encouraging out-migration. After the 1985 drought in north-eastBrazil, up to one million people – mainly men –abandoned their small farms in search of work. Thisproduced a wave of rural-urban migration thatadded significantly to the ‘favelas’ or shanty townssurrounding every Brazilian city.
CAUSES OF DROUGHT
Physical factors
The atmospheric processes that cause drought are notcompletely understood but originate in anomalieswithin the general atmospheric circulation. Researchhas concentrated on teleconnections – the linkagesbetween climatic anomalies occurring at longdistances apart – and there is growing evidence thatlarge-scale interactions between the atmosphere andthe oceans are implicated. This conclusion highlightsthe significance of sea-surface temperature anomalies(SSTAs) because it is known that these influence theflux of both sensible heat and moisture at the ocean-atmosphere interface. Moisture conditions have equalimportance with temperature because they influencethe subsequent latent heat release and also theamount of precipitable water in the atmosphere.Drought is most likely to be initiated by negative(relatively cold) SSTAs leading to descending air andanticyclonic weather. For example, the probablestarting point for the drought over north-westEurope in 1975–76 was abnormally low sea-surfacetemperatures over the Atlantic ocean north of 40°N.This SSTA typically causes near-surface stability inthe atmosphere and a high frequency of blockinganticyclones over western Europe. The same pheno-menon exists when El Niño conditions (ENSO)
bring descending air to the western Pacific andsouth-east Asia.
ENSO events are well recognised as a cause ofdrought. According to Dilley and Heyman (1995),worldwide drought disasters double during thesecond year of an El Niño episode compared withall other years. This feature was illustrated during1982–83 when droughts in Africa, Australia, India,north-east Brazil and the United States coincidedwith a major El Niño phase. Most major droughtsin Australia are related to the below-average rainfallin northern and eastern Australia associated with anEl Niño event (Allan et al., 1996). The 1988 NorthAmerican drought was linked to a shift in theSouthern Oscillation associated with a widespreaddecrease in Pacific sea-surface temperatures. This ledto a northward displacement of the Inter-tropicalConvergence Zone southeast of Hawaii and theeventual appearance of a strong anticyclone at upperlevels over the American Midwest (Trenberth et al.1988).
Related attempts have been made to link SSTAsin the tropical Atlantic to rainfall in the Sahel zoneof Africa. It is known that there are recurring SSTApatterns and that these tend to differ around theglobe depending on wet or dry conditions in Africa.As indicated by Gray (1990), a season-to-season linkhas been found between the frequency of Atlantichurricanes and rainfall in the Sahel. Other researchhas suggested that the underlying forcing agentmight be the global transport of oceanic water thatis dependent on the sinking of cold, salty water inthe North Atlantic Ocean (see Chapter 14). Abackground to drought conditions in the Sahel isprovided in Box 12.3.
Human factors
Major drought disasters are concentrated in the semi-arid, developing countries where they are often bestdescribed as ‘complex emergencies’. This feature iswell illustrated in Africa, a continent where two-thirds of the area is dryland and where the onset ofdrier conditions in the late twentieth centuryexacerbated problems of food supply. At the height

HYDROLOGICAL HAZARDS: DROUGHTS 273
The term Sahel derives from a local Arabic wordmeaning ‘the edge’ (of the Sahara desert). Becauseof its geographical location, this is one of thehottest regions of the world and, even under‘normal’ climatic conditions, has a semi-arid cli-mate. Overall, the Sahel covers some 5 × 10⁶ km2
with a mean annual rainfall ranging from100–400 mm in the northern zone (on the Saharanedge) to 400–800 mm along the southernmargins. But mean values are highly misleadingsince normality is not a feature of the rainfallregime here. The annual rainfall patterns arecharacterised by high variability on all three keyclimatic time-scales – seasonal, year-to-year anddecadal. Thus, more than 80 per cent of the annualrainfall is likely to occur in the rainy season dur-ing the months of July, August and September. As shown in Figure 12.5, the average year-to-year variability, expressed by the coefficient ofvariation, is large. It ranges from 25 per cent to40 per cent and leads to low reliability of the
annual rainy season. In the longer term, theseuncertain short-term patterns have been disruptedby prolonged rainfall anomalies such as therelatively wet periods in 1905–09 and 1950–69and the main dry periods of 1910–14 and1970–1997 (with severe droughts in 1973, 1984and 1990).
From the late 1960s onwards there was apronounced decline in annual rainfall. Figure 12.6indicates that a drought started in 1968. Duringthe early 1980s it produced the lowest rainfalltotals during the twentieth century. Overall, theSahel experienced a period of some 30 years withbelow average rainfall conditions broken only bythe widespread rains in the 1994 wet season. Thedifference between the means for the periodsbefore and after 1968 is approximately 30 percent. According to Hulme (2001), this sequencerepresents the most dramatic example of recordedclimate variability anywhere in the world and was also the most striking trend in precipitation anywhere during the twentieth century. The agri-cultural impact of the drought was made worse by the good rains of the 1950s and 1960s, whichencouraged rain-fed cropping into marginal lands and led to increased herd sizes. Although the climate became wetter towards the end of thetwentieth century, Sahelian rainfall will continueto fluctuate in the future showing variability(from season to season and year to year, trends(towards wetter or drier conditions over severalyears) and persistence (wetness or dryness groupedover a period of years).
Two main reasons have been put forward toexplain the Sahelian (and other) droughts of thelate twentieth century.
• Remote forcing of the climate This explanationhinges on changes in the interaction betweenoceans and the atmosphere (teleconnections).
Box 12.3
DROUGHT IN THE AFRICAN SAHEL
MALINIGER CHAD SUDAN
BURKINOFASO
A F R I C A
20 to 25%
25 to 30%
30 to 40%
ETHIOPIAETHIOPIAETHIOPIAETHIOPIAETHIOPIAETHIOPIA
SOM
AL IA
SOM
AL IA
SOM
AL IA
MAURITANIA
Figure 12.5 The countries of the Sahel most affected bydrought. The shaded areas show the average annualdepartures from normal rainfall. Where the variabilityof rainfall is high, and the amount of rainfall is low,drought is likely to be a recurrent feature of the climate.
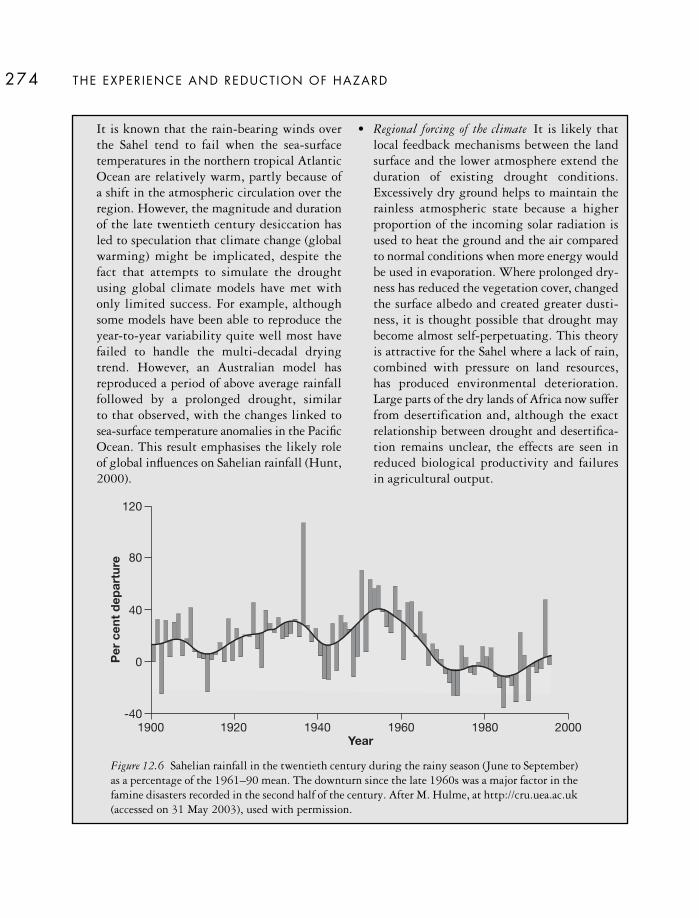
THE EXPER IENCE AND REDUCT ION OF HAZARD274
It is known that the rain-bearing winds overthe Sahel tend to fail when the sea-surfacetemperatures in the northern tropical AtlanticOcean are relatively warm, partly because of a shift in the atmospheric circulation over theregion. However, the magnitude and durationof the late twentieth century desiccation has led to speculation that climate change (globalwarming) might be implicated, despite the fact that attempts to simulate the droughtusing global climate models have met withonly limited success. For example, althoughsome models have been able to reproduce theyear-to-year variability quite well most havefailed to handle the multi-decadal dryingtrend. However, an Australian model hasreproduced a period of above average rainfallfollowed by a prolonged drought, similar to that observed, with the changes linked to sea-surface temperature anomalies in the PacificOcean. This result emphasises the likely role of global influences on Sahelian rainfall (Hunt,2000).
• Regional forcing of the climate It is likely thatlocal feedback mechanisms between the landsurface and the lower atmosphere extend theduration of existing drought conditions.Excessively dry ground helps to maintain therainless atmospheric state because a higherproportion of the incoming solar radiation isused to heat the ground and the air comparedto normal conditions when more energy wouldbe used in evaporation. Where prolonged dry-ness has reduced the vegetation cover, changedthe surface albedo and created greater dusti-ness, it is thought possible that drought maybecome almost self-perpetuating. This theoryis attractive for the Sahel where a lack of rain,combined with pressure on land resources, has produced environmental deterioration.Large parts of the dry lands of Africa now sufferfrom desertification and, although the exactrelationship between drought and desertifica-tion remains unclear, the effects are seen inreduced biological productivity and failures in agricultural output.
1900 1920 1940 1960 1980 2000
120
80
40
0
-40
Year
Per
cent
dep
artu
re
Figure 12.6 Sahelian rainfall in the twentieth century during the rainy season (June to September)as a percentage of the 1961–90 mean. The downturn since the late 1960s was a major factor in thefamine disasters recorded in the second half of the century. After M. Hulme, at http://cru.uea.ac.uk(accessed on 31 May 2003), used with permission.
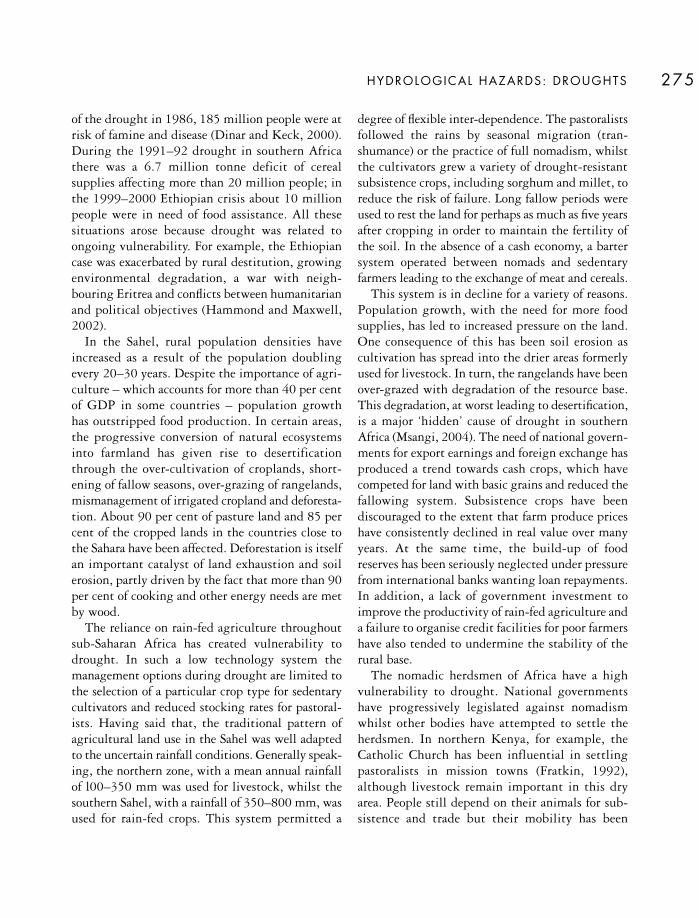
HYDROLOGICAL HAZARDS: DROUGHTS 275
of the drought in 1986, 185 million people were atrisk of famine and disease (Dinar and Keck, 2000).During the 1991–92 drought in southern Africathere was a 6.7 million tonne deficit of cerealsupplies affecting more than 20 million people; inthe 1999–2000 Ethiopian crisis about 10 millionpeople were in need of food assistance. All thesesituations arose because drought was related toongoing vulnerability. For example, the Ethiopiancase was exacerbated by rural destitution, growingenvironmental degradation, a war with neigh-bouring Eritrea and conflicts between humanitarianand political objectives (Hammond and Maxwell,2002).
In the Sahel, rural population densities haveincreased as a result of the population doublingevery 20–30 years. Despite the importance of agri-culture – which accounts for more than 40 per centof GDP in some countries – population growth has outstripped food production. In certain areas,the progressive conversion of natural ecosystemsinto farmland has given rise to desertificationthrough the over-cultivation of croplands, short-ening of fallow seasons, over-grazing of rangelands,mismanagement of irrigated cropland and deforesta-tion. About 90 per cent of pasture land and 85 percent of the cropped lands in the countries close tothe Sahara have been affected. Deforestation is itselfan important catalyst of land exhaustion and soilerosion, partly driven by the fact that more than 90per cent of cooking and other energy needs are metby wood.
The reliance on rain-fed agriculture throughoutsub-Saharan Africa has created vulnerability todrought. In such a low technology system themanagement options during drought are limited tothe selection of a particular crop type for sedentarycultivators and reduced stocking rates for pastoral-ists. Having said that, the traditional pattern ofagricultural land use in the Sahel was well adaptedto the uncertain rainfall conditions. Generally speak-ing, the northern zone, with a mean annual rainfallof l00–350 mm was used for livestock, whilst thesouthern Sahel, with a rainfall of 350–800 mm, wasused for rain-fed crops. This system permitted a
degree of flexible inter-dependence. The pastoralistsfollowed the rains by seasonal migration (tran-shumance) or the practice of full nomadism, whilstthe cultivators grew a variety of drought-resistantsubsistence crops, including sorghum and millet, toreduce the risk of failure. Long fallow periods wereused to rest the land for perhaps as much as five yearsafter cropping in order to maintain the fertility ofthe soil. In the absence of a cash economy, a bartersystem operated between nomads and sedentaryfarmers leading to the exchange of meat and cereals.
This system is in decline for a variety of reasons.Population growth, with the need for more foodsupplies, has led to increased pressure on the land.One consequence of this has been soil erosion ascultivation has spread into the drier areas formerlyused for livestock. In turn, the rangelands have beenover-grazed with degradation of the resource base.This degradation, at worst leading to desertification,is a major ‘hidden’ cause of drought in southernAfrica (Msangi, 2004). The need of national govern-ments for export earnings and foreign exchange hasproduced a trend towards cash crops, which havecompeted for land with basic grains and reduced thefallowing system. Subsistence crops have beendiscouraged to the extent that farm produce priceshave consistently declined in real value over manyyears. At the same time, the build-up of foodreserves has been seriously neglected under pressurefrom international banks wanting loan repayments.In addition, a lack of government investment toimprove the productivity of rain-fed agriculture anda failure to organise credit facilities for poor farmershave also tended to undermine the stability of therural base.
The nomadic herdsmen of Africa have a highvulnerability to drought. National governmentshave progressively legislated against nomadismwhilst other bodies have attempted to settle theherdsmen. In northern Kenya, for example, theCatholic Church has been influential in settlingpastoralists in mission towns (Fratkin, 1992),although livestock remain important in this dryarea. People still depend on their animals for sub-sistence and trade but their mobility has been

restricted. In many instances foreign aid has beenearmarked for sedentary agriculture rather thanpastoralism. The traditional system of animalaccumulation was not understood so governmentshave taxed animals in the belief that the herdsmenshould be forced to sell. Increasingly strict gamepreservation laws have been introduced whichrestrict the possibility of hunting for meat duringdrought. Traditional forms of employment, such as caravan trading, have declined as a result of theenforcement of international boundaries and cus-toms duties, together with competition from lorries.Thus, African agriculture faces many problems ofwhich the lack of rainfall is just one.
Poverty is also a factor. Sub-Saharan Africa con-tains over two-thirds of the world’s poorest countries.There is a widespread view, particularly amongstthose who support the structuralist view of hazards,that colonialism and the international trading systemhave reduced the innate ability of Africans to copewith fluctuations in their physical and societalenvironments. As in any disaster, the impact differsgreatly; some prosper, some migrate to refugeecamps and others die. Worst hit are the landless andjobless, especially the women and children in therural areas, who lack the means to ensure their ownfood security. Factors such as the declining terms oftrade for primary agricultural products, marketprotection by the industrialised countries, extremecommodity price fluctuations on internationalmarkets and the need to service enormous overseasdebts have all restricted the ability of Africangovernments to address their internal problems.
These are all serious problems but it is importantto attempt a balanced view. There are varyingperspectives now available on the great faminedrought of the 1980s, some which are relativelyoptimistic about the future. For example, there isan emerging consensus that, despite the socialupheavals and loss of life, many of the traditionaladaptive strategies of the people worked well andimply greater resilience than is often assumed(Mortimore and Adams, 2001). In a review paper,Batterbury and Warren (2001) stressed the con-tinuing flexibility of Sahelian ecosystems and
identified several factors that alleviate some of theresource limitations, including migration, assetsales, cash-crop production and the generation ofnon-farm income.
MITIGATION
Disaster aid
In financial – as well as humanitarian – terms, foodaid is the most important response of the inter-national community to disaster (Leader, 2000). Forsome LDCs, food aid has become almost synonymouswith drought relief. The 1991–92 El Niño-relateddrought in southern and eastern Africa threatened30 million people and generated a major inter-national aid effort. From April 1992 to June 1993roughly five times more food and relief goods wereshipped into southern Africa than were delivered tothe Horn of Africa during the 1984–85 famine(IFRCRCS, 1994). In Zambia, the governmentinformed the donors about the food security situa-tion in March 1992 and, by August, it was believedthat sufficient food was arriving in the country toprevent famine, although there were internal prob-lems with distribution due to congested railheadsand poor road transport. A ‘Programme to PreventMalnutrition’ (PPM) was established to coordinateactivities between the agencies representing each ofthe geographic areas targeted for food assistance.This structure gave more than 50 NGOs access tonearly 250,000 tonnes of maize for distribution to about two million people.
Despite its life-saving value in emergencysituations, food aid can be controversial and wasdescribed as a ‘blunt instrument’ by de Waal (1989).This is because, in some LDCs, it is likely to bediverted from the needy to more prosperous elitegroups and because it is based on the Western viewof famine as a mass starvation event. Given thisinterpretation of famine, the large-scale distributionof food appears to be a sensible strategy. But, iffamine-related deaths are highly age-specific and aredependent on other factors, such as the presence ofendemic disease, the indiscriminate distribution of
THE EXPER IENCE AND REDUCT ION OF HAZARD276

food may not always help those at greatest risk. Onthe basis of their experience in northern Sudan in1991, Kelly and Buchanan-Smith (1994) haveargued that, in the absence of many excess deathsdue to starvation (i.e. a substantial ‘body count’),donors are unwilling to accept the real needs and tocontribute fully to humanitarian relief. It is highlydesirable to prioritise aid to those most vulnerablebut it is difficult, in practice, to provide selectiveassistance at the household level (Kelly, 1992). Forexample, targeting food according to anthro-pometric criteria, such as weight-for-height indices,has sometimes led to the deliberate under-feedingof children to ensure that the household qualifies forrations. Above all, it is most difficult to optimisefood aid in complex emergencies where civil unrest,war and political interference obscure basic humani-tarian aims (Ojaba et al., 2002).
There are problems attached to emergencydrought responses and longer-term aid has notalways been invested wisely. Comparatively littlemoney has been spent directly on agriculture andforestry or on field action at a local level. In theshort-term, the better deployment of disaster reliefcan be achieved only when those in most need havebeen identified and transportation methods havebeen improved. In the longer run, aid should bedirected to small farmers so that the rural sector canbe stabilised again. Only lip service has really beenpaid to this. Part of the difficulty is that studentsselected for overseas training come from the urbanelites. After their return, the temptation is to remainin the cities. So the transfer of agricultural tech-nology is from city to city, rather than into the ruralareas where the food must be grown.
More attention must be paid to sustainabledevelopment in the rural areas. In the short term,this might well mean the provision of food aid viawork programmes. This is the main method ofdistributing free maize in Zambia to those withoutfood or cash resources. Recipients are required toparticipate in self-help projects like repairing feederroads, digging pit latrines to improve sanitation,drilling boreholes and wells and constructing diptanks for cattle. A similar cash-for-work scheme
operates in north-east Brazil. Here the programmeis meant to guarantee a small salary and, in 1993,an estimated two million people, with another 4–6million dependants, were employed in this way.More research on staple grains and better drylandfarming techniques, such as terracing, strip crop-ping and soil erosion control, suitable to rain-fedagriculture is needed. It may even be more produc-tive to support nomadic pastoralism rather thanirrigation schemes. New attitudes are required thatchange the normal funding priorities. Improvingthe physical infrastructure in areas at risk by theprovision of better roads will not only reduce short-term vulnerability by helping the distribution ofemergency food aid but will also allow the optimumlocation of new facilities, such as well-equippedhealth clinics, which will lead to more long-termresilience in the face of drought. Above all, there isa need to release local initiatives in order to producemore self-reliance in the people to release them fromdependence on famine aid.
Emergency drought relief has been a priority forgovernments in the MDCs too. In a comparison ofdrought policy in the USA and Australia some yearsago, Wilhite (1986) showed that actions have takena loss-sharing character, dependent on loans andgrants, and that most drought mitigation hasoccurred in a crisis-management framework similarto that for emergency overseas aid. In severedroughts, governments are the only bodies able tointervene at the scale required and the costs can behigh. For example, the total cost of federal droughtrelief programmes in the form of loans and grantsduring the 1974–77 drought in the USA has beenestimated at US$7–8 billion.
More recently, the rising cost of drought relief inthe industrialised countries, has led to a policy trendaway from emergency subsidies provided by thetaxpayer towards more long-term self-reliance byrural communities. In 1989 the Australian govern-ment removed drought from the terms of theNatural Disaster Relief Arrangements (O’Meagheret al., 2000). The new National Drought Policy –in belated recognition that drought is an integralpart of the Australian climate – viewed drought as
HYDROLOGICAL HAZARDS: DROUGHTS 277
an element in all agricultural decisions rather thanas a random factor requiring an emergency response.But, during the 1990s, this policy became increas-ingly confused with farm poverty in the publicmind and the continued government acceptance of‘severe droughts’ has enabled ‘exceptional’ reliefpayments to continue (Botterill, 2003). Centralgovernment responsibility for drought assistance hasalso declined in New Zealand with the progressivetightening of the definition of a drought eligible forsupport (Haylock and Ericksen, 2000). In 1996 thisdefinition was restricted to a 1:50 year event (2 percent annual probability of exceedance). The presentaim is to devolve drought response to rural com-munities, within a more sustainable approach tonatural resources, but it is still unclear how thesechanges in national policy will affect long-termdrought management.
PROTECT ION
Environmental control
In theory, the artificial stimulation of rainfall bycloud seeding could reduce the hazard but thistechnique can only work with clouds that havenatural precipitation potential. Such clouds areunlikely to be present in large numbers duringdrought conditions and there is, therefore, littlepractical scope for this option although experimentscontinue.
The additional supply of water is not necessarilya solution. Although every year about 5,000 ha ofnew land comes under irrigation in the Sahel, thisis balanced by about the same area going out of usethrough waterlogging or soil salinity. The drillingof new boreholes in dry areas is an example of howaid and technology, without proper local manage-ment, can actually increase disaster. Along thesouthern edge of the Sahara desert new tube wellswere constructed to provide water points so that thelast reserves of rangeland could be opened up.Without the imposition of effective controls, theborehole sites provided an attractive focus for manycattle and humans. The water encouraged the
growth of herds beyond the available feed until thenew areas were stripped and the cattle died. Otherinappropriate uses of irrigation water exist. Some ofthe new supplies have been used to irrigate exportcrops, such as pineapples, and rice grown for theurban elites. Both these crops are highly consump-tive of water and have done nothing to alleviate foodshortages in the rural areas.
Hazard-resistant design
The standard defence against hydrological droughthas been the use of dams and pipelines for theartificial storage and transfer of water supplies. Theemphasis on these ‘tech-fix’ engineering solutions issymbolised by the global spread of large dams.Regulated rivers smooth out the seasonal variationsin river flow and, in particular, provide artificiallyenhanced dry weather flows for water abstractionpurposes. Figure 12.7 shows the half-monthlyregulated flows for the river Blithe, England, duringthe 1976 drought at a point downstream from aregulating reservoir. When these actual flows arecompared with the modelled ‘naturalised’ flows thatwould have occurred at this point in the absence ofa reservoir, it can be seen that the reservoir was ableto contain river discharges within a narrow bandright through the year. During the winter months,reservoir storage retained the flood peaks that wouldotherwise have gone down the river and reducedaverage flows. Between May and September theregulated river discharge was enhanced above thenatural flow regime. The river never fell below thedesignated minimum acceptable flow of 0.263 m3
s–1, despite the severity of the drought conditionsthat would have reduced natural flows below thislevel for three months.
Reservoirs have been used extensively to maintainurban water supplies. The greatest buffering againstdrought exists for those areas with a large marginbetween the daily supply capacity of the system and the maximum daily use. Many reservoir-basedurban water systems are designed to provide a pre-determined minimum supply during roughly98 per cent of the time (2 per cent probability of
THE EXPER IENCE AND REDUCT ION OF HAZARD278

HYDROLOGICAL HAZARDS: DROUGHTS 279
failure), although relatively minor shortages may beaccepted more frequently. With an element of over-design and careful crisis management, it is possiblefor these systems to perform well during droughtsof a magnitude beyond the 1:100 event. Figure 12.8shows how the enforcement of domestic water
intake restrictions on the river Tone, Japan, duringthe summer 1994 drought helped to maintainsupplies (Omachi, 1997). Without these droughtresponses, the content of the reservoirs would havedeclined more quickly and the water supply storagewould have been exhausted by 12 August 1994.
10 naturalised flow
regulated flow
period of enhanced dry weather flow
1
0.1
MINIMUM
ACCEPTABLE FLOW
J F M A M J
Months
Mea
nha
lf–
mo
nthl
yflo
w(m
3s-1
)
J A S O N D
Figure 12.7 Reservoir storage and flow regulation alleviatethe hydrological drought of 1976 on the river Blithe,England. In the absence of a reservoir, the estimatednaturalised flow would have fallen below that minimumacceptable level for more than three months of summerdrought. After David J. Gilvear (personal communication,1990).
Month/ Day (June–August 1994)
Sto
rag
e(x
103 m
3 )
6/1 6/6 6/11 6/16 6/21 6/26 7/1 7/6 7/11 7/16 7/21 7/26 7/31 8/5 8/10 8/15 8/20 8/25 8/30
0
100,000
200,000
300,000
400,000
500,000
Without Intake Restriction
Met
ro.T
okyo
upst
ream
inta
kecu
t
10%
Res
tric
tion
20%
Res
tric
tion
30%
Res
tric
tion
20%
Res
tric
tion
Actual
Full Storage Capacity for Water Supply
Storage Capacity for Water Supply during Flood Control
Figure 12.8 Changes inwater storage in reservoirsalong the upper Toneriver, Japan, showing theeffect of intake restrictionsduring the summerdrought of 1994. AfterOmachi (1997).

ADAPTATION
Community preparednessAccording to Wilhite (2002), preparedness is thekey to drought hazard reduction. Arguably, it hasbeen most successful amongst traditional societiesin dry rural areas that have evolved ‘coping’ strate-gies to anticipate food insecurity. For example, tocope with a ‘normal’ drought, nomadic people in the Sahel have adopted the practice of herd diversi-fication, involving camels, cattle, sheep and goats,all with different grazing habits, water requirementsand breeding cycles which helped to spread any riskof pasture failure. During years with abundantrainfall, the tribes would increase their herds forfood storage and as an insurance against drought.When drought did occur such people regularlymigrated to find good pasture and, in the mostsevere episodes, could either eat or sell off thesurplus livestock. Informal systems of communalloss sharing allowed the transfer of gifts or loans ofany spare animals available for those in greatestdistress and various fall-back activities, such asgazelle hunting or caravan trading, were intensifiedas temporary measures to help survive the drought.In a similar way, villagers in rural Mali, haveadjusted to decreasing harvests by diversifying theirincome sources from non-agricultural activities(Cekan, 1992).
Under severe conditions, all rural people have todo more. They often start simply by eating less, inan attempt to conserve food stocks. For farmers,agricultural adjustments include crop replacement(drought-resistant crops preferred at the normalplanting time), gap filling in fields (where germi-nation of an earlier crop has been poor) and re-sowing or irrigating crops. When food stocks havebeen exhausted, they turn to a wide variety of wild‘famine’ foods that are not normally part of the dietbecause of their low nutritional value. In Zambia,for example, this includes eating honey mixed withsoil, wild fruits and wild roots, some of which arepoisonous unless boiled for several hours beforeeating. The selling of livestock is usually underwayby this stage, although a case has been made for
external intervention to ensure that de-stockingtakes place early in the drought cycle to preventecological damage to the grazing land (Morton and Barton, 2002). Unfortunately, de-stockingaccelerates the fall in the value of livestock at a timewhen the cost of grain is rising. This produces achange in the relative terms of trade that isdisadvantageous for nomadic people. Poor pastoral-ists have to sell a larger proportion of their animalsin order buy to food than do the wealthy. During asevere drought, therefore, many of the poor aresqueezed out of the pastoral economy and forced tosettle in towns to live on famine relief or from wagespaid to herders or labourers (Haug, 2002). Withoutfood and other resources, rural dwellers routinelyturn to local wage labour for support, rather thanwork on their own unproductive land.
For some households, outstanding debts and otherfavours can be called in. Cash or food entitlementsmay be borrowed from more prosperous relatives,neighbours or other support groups in a non-agricultural response strategy. Without access toexternal help, there is little option but to resort tothe trading of valuables, such as jewellery, or othercapital assets, such as radios, bicycles or firearms,which can be sold to buy grain. As incomes decline,health conditions also deteriorate. This deteriorationis exacerbated by poor nutrition and growingcompetition for declining, and increasingly polluted,water supplies. Wherever possible, villagers alsopoach wild game in order to survive. Table 12.2shows that, during a severe drought in 1994–95,that affected over 10 per cent of Bangladesh, house-holds adopted a variety of non-agricultural adjust-ments. Over half of those questioned sold livestockand over 70 per cent of the respondents either soldor mortgaged land (Paul, 1995).
Ultimately, the family starts to break up. Somechildren may be sent to distant relatives out of thefamine zone and male members may seek work inthe towns. This can lead to large-scale migrationthat may be permanent if families lose their landrights because of moving. In a study of ruralhouseholds which had migrated from famine-affected communities in northern Darfur, Sudan, it
THE EXPER IENCE AND REDUCT ION OF HAZARD280
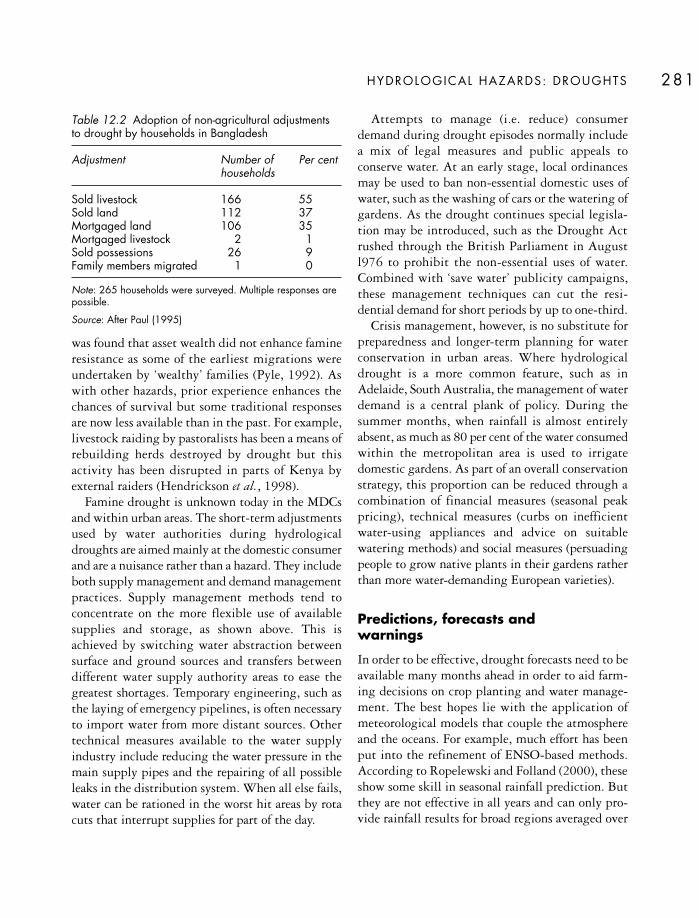
was found that asset wealth did not enhance famineresistance as some of the earliest migrations wereundertaken by ‘wealthy’ families (Pyle, 1992). Aswith other hazards, prior experience enhances thechances of survival but some traditional responsesare now less available than in the past. For example,livestock raiding by pastoralists has been a means ofrebuilding herds destroyed by drought but thisactivity has been disrupted in parts of Kenya byexternal raiders (Hendrickson et al., 1998).
Famine drought is unknown today in the MDCsand within urban areas. The short-term adjustmentsused by water authorities during hydrologicaldroughts are aimed mainly at the domestic consumerand are a nuisance rather than a hazard. They includeboth supply management and demand managementpractices. Supply management methods tend toconcentrate on the more flexible use of availablesupplies and storage, as shown above. This isachieved by switching water abstraction betweensurface and ground sources and transfers betweendifferent water supply authority areas to ease thegreatest shortages. Temporary engineering, such asthe laying of emergency pipelines, is often necessaryto import water from more distant sources. Othertechnical measures available to the water supplyindustry include reducing the water pressure in themain supply pipes and the repairing of all possibleleaks in the distribution system. When all else fails,water can be rationed in the worst hit areas by rotacuts that interrupt supplies for part of the day.
Attempts to manage (i.e. reduce) consumerdemand during drought episodes normally includea mix of legal measures and public appeals toconserve water. At an early stage, local ordinancesmay be used to ban non-essential domestic uses ofwater, such as the washing of cars or the watering ofgardens. As the drought continues special legisla-tion may be introduced, such as the Drought Actrushed through the British Parliament in Augustl976 to prohibit the non-essential uses of water.Combined with ‘save water’ publicity campaigns,these management techniques can cut the resi-dential demand for short periods by up to one-third.
Crisis management, however, is no substitute forpreparedness and longer-term planning for waterconservation in urban areas. Where hydrologicaldrought is a more common feature, such as inAdelaide, South Australia, the management of waterdemand is a central plank of policy. During thesummer months, when rainfall is almost entirelyabsent, as much as 80 per cent of the water consumedwithin the metropolitan area is used to irrigatedomestic gardens. As part of an overall conservationstrategy, this proportion can be reduced through acombination of financial measures (seasonal peakpricing), technical measures (curbs on inefficientwater-using appliances and advice on suitablewatering methods) and social measures (persuadingpeople to grow native plants in their gardens ratherthan more water-demanding European varieties).
Predictions, forecasts and warnings
In order to be effective, drought forecasts need to beavailable many months ahead in order to aid farm-ing decisions on crop planting and water manage-ment. The best hopes lie with the application ofmeteorological models that couple the atmosphereand the oceans. For example, much effort has beenput into the refinement of ENSO-based methods.According to Ropelewski and Folland (2000), theseshow some skill in seasonal rainfall prediction. Butthey are not effective in all years and can only pro-vide rainfall results for broad regions averaged over
HYDROLOGICAL HAZARDS: DROUGHTS 281
Table 12.2 Adoption of non-agricultural adjustmentsto drought by households in Bangladesh
Adjustment Number of Per centhouseholds
Sold livestock 166 55Sold land 112 37Mortgaged land 106 35Mortgaged livestock 2 1Sold possessions 26 9Family members migrated 1 0
Note: 265 households were surveyed. Multiple responses arepossible.
Source: After Paul (1995)

several months, information that lacks sufficientprecision for many individual decision-makers.
Two global warning systems are in place to antici-pate crop failure and food shortage; the UN-sponsored Global Information and Early WarningSystem (GIEWS) and the USA-sponsored FamineEarly Warning System (FEWS NET). Both initia-tives followed severe food emergencies in the 1970sand 1980s. As shown in Table 12.3, both systemsrely on multi-agency support and focus on large-scale monitoring and forecasting activities tosupport potential intervention at a more local level.The primary data come from satellites that producenear real-time images on a regular 10-day basis. Forexample, GIEWS operations centre on the AfricaReal Time Environmental Monitoring InformationSystem (ARTEMIS). The European METEOSATsatellite monitors cloud types to produce proxyrainfall estimates for Africa. These data are thenlinked to Advanced Very High Resolution Radio-meter (AVHRR) information on the status of thevegetation cover at a resolution of 8km, via theNormalised Difference Vegetation Images (NDVI)that are available from NOAA’s polar orbiting
satellites. Rainfall and vegetation estimates are thenprocessed into maps of current and forecast condi-tions for staple food crops and pasture land. Regularreports on rainfall, food production and faminevulnerability are published and, when dangerthreatens, local offices facilitate rapid assessmentsurveys that provide field data to clarify the situationon the ground.
Large-scale surveillance, however sophisticated,cannot detect food security issues at the sub-nationalor local levels when the prompt detection of failingsupplies is necessary to prompt swift reactions fromdonors. After the famine droughts of the mid-1980s, several sub-Saharan countries – notably Chadand Mali – set up comprehensive food and nutritionmonitoring systems (Autier, et al. 1989). Regionalexpertise and indigenous support is vital as shownby the establishment of the Southern AfricanDevelopment Community (SADC) Remote SensingUnit in Harare, Zimbabwe and the AGRHYMETRegional Centre in Niamey, Niger. Created in 1974,this is a specialised institute sponsored by nine sub-Saharan states for improving food supplies andnatural resource management in the Sahel. It
THE EXPER IENCE AND REDUCT ION OF HAZARD282
Table 12.3 Global monitoring and warning for drought and food shortages
Organisations Global information and early warning Famine early warning system (FEWS NET)system (GIEWS)
Origins Started 1975 by the Food and Agriculture Started 1986 as the FEW program by Organisation (FAO) of the United Nations; USAID, an agency of the Federal government; HQ Rome, Italy re-named FEWS NET in 2000; HQ
Washington DC
Main objectives To improve food security in 22 drought-prone Monitoring food supply and demand in all African countries and improve response countries with emphasis on 80 low-income planning to reduce famine vulnerability food-deficit nations
Technical Mainly other UN and FAO bodies – Chemionics International Consultancy, cooperating including WFP, UNDP, EU, OCHA NASA, NOAAagencies
Routine Regular publication of global and regional Issue of monthly bulletins from surveillance operations reports on crop production, demand for for the 22 African host countries to determine
staple foodstuffs, reserve stock levels, food alert level – Watch, Warning or agricultural trade Emergency
Emergency FAO HQ issues Special Alerts for areas FEWS/Chemionics head office issues operations where crops or food supply are threatened warnings to decision makers based on advice
to activate decision makers and aid donors from field-based-staff

provides food security assessments and NDVIproduct enhancement but also trains local staff inagrometeorological and hydrological monitoring,statistics, data compilation and disseminationdesigned to predict food shortages.
The difference between regional food availabilityand household-level access to food, however, meansthat any early indication of the downward spiral intofamine is also dependent on local nutritional fieldsurveys. These measure body conditions such asheight-for-age, weight-for-age and weight-for-height measurements, to identify those, like pre-school children, with the greatest needs. Otherreasonably reliable famine precursors are rising grainprices, combined with falling livestock prices andwages, as the economic balance shifts from assets andservices, like jewellery and labour, to food which risesin value both absolutely and relatively. The range ofrisk assessment methods used can result in differingviews about the severity of the situation and lead to discrepancies in the distribution of food aid. Onthe other hand, most of the measures adopted docontribute to predictions of food insecurity. A moreimportant problem is the lack of a sufficiently rapidhumanitarian response due to the fact that excessmortality now has to be clearly demonstrated beforedonors are willing to act in drought emergencies.
Land use planning
Drought increases pressure on land resources.Overgrazing, poor cropping methods, deforestationand improper soil conservation techniques may notcreate drought but they amplify drought-relateddisaster. There is a need, therefore, for betteragricultural land-use practices. Sustained drylandfarming is dependent on soil conservation measuresagainst water and wind erosion. A grass or legumecover is an effective control against water erosion, asare strip cropping and contour cultivation thatretard the flow of water down the slope. Winderosion can be greatly reduced by maintaining atrash cover at the soil surface plus the use of croprotations and shelterbelts to lower the wind velocityat the soil surface.
Rural areas rarely have the massive water storagesand the options for reducing consumer demand thatare available in the cities. Therefore, the mostprudent long-term drought strategies prepareagricultural production to withstand unexpectedshortfalls of precipitation. This involves theadoption of appropriate stocking rates, so that thepasture is not easily exhausted, the build-up of areserve of fodder and the improvement of on-farmwater supplies. The installation of an irrigationsystem may offer some security against drought butthe reliability of supplies may not be high enoughto provide complete drought proofing. Pigram(1986) cited the heavy losses sustained by irrigatorsof rice and cotton in New South Wales, Australia,during the latter stages of the 1979–83 droughtwhen water allocations were suspended in themiddle of the irrigation season. Flexible decision-taking is necessary to make the most of predictedwater shortages and drought resilience will bestrengthened by a greater diversity of croppingpatterns and income sources in drought-prone areas.For example, scope still exists for the developmentof more drought-resistant crops and crops withvarying production cycles that make it easier forrural communities to exist from one cropping seasonto another.
KEY READING
Wilhite, D. A. (ed.) (2000) Drought: A GlobalAssessment Vols 1 and 2. London and New York:Routledge. The most comprehensive survey madein recent years.
Below, R., Grover-Kopec, E. and Dilley, M. (2007)Documenting drought-related disasters. The Journalof Environment and Development 16: 328–44. A seriousattempt to unravel the true significance of droughtin complex disasters.
Botterill, L. C. (2003) Uncertain climate: The recenthistory of drought policy in Australia. AustralianJournal of Politics and History 49: 61–74. Illustratesthe problems that all governments face when coping
HYDROLOGICAL HAZARDS: DROUGHTS 283
with the socio-economic consequences of climaticvariability.
Howe, P. and Devereux, S. (2004) Famine intensityand magnitude scales: a proposal for an instrumentaldefinition of famine. Disasters 28: 353–72. Anattempt to bring a more systematic methodology toa notoriously difficult subject.
Pingali, P., Alinovi, L. and Sutton, J. (2005) Foodsecurity in complex emergencies: enhancing foodsystem resilience. Disasters 29: S5–S24. A problemof the greatest importance in many LDCs.
WEB L INKS
US Drought Information Center www.drought.noaa.gov/
Australian Bureau of Meteorology www.bom.gov.au/climate/
National Integrated Drought Information Center,USA www.drought.gov/
THE EXPER IENCE AND REDUCT ION OF HAZARD284

NATURE AND DEF INIT ION
The causes of technological hazards tend to be morediverse, and possibly less predictable, than thecauses of most natural hazards. Technologicalhazards result in ‘man-made accidents’ because thetrigger event is human action – or inaction – whendealing with dangerous technologies; thus thesehazards arise not simply from faults in technologyalone but are linked to human fallibility in decision-making. Accordingly, technological hazards arereally failures in complex systems caused by tech-nical, social, organisational or operational defects(Chapman, 2005; Shaluf et al., 2003). Turner (1994)and others went further and estimated that large-scale accidents may attribute about 20–30 per centto technical failings and 70–80 per cent to social,administrative or managerial failings. Some obser-vers have recognised links between technologicalhazards and terrorism and warfare. But terrorismand warfare are examples of the deliberately harmfuluse of technology, rather than the accidental releaseof hazardous energy or material from civilianprocesses. As such, they are acts of violence – likecrime – and are not ‘accidental’. The only direct linkbetween warfare and technological hazards existswhen a destructive technology developed formilitary purposes gets out of control. In effect, this
means either the accidental release of toxic materialfrom weapons of mass destruction or the accidentalstarting of a war where such weapons are deployed.
The term ‘technology’ has been applied indifferent ways ranging from a single toxic chemicalto an entire industry, like nuclear power. Sometimeshealth risks from long-term exposure to chemicalpollutants or low-level hazardous waste have beenincluded (Cutter, 1993). Others have drawnattention to ‘hybrid’ or ‘na-tech’ disasters whichoccur when natural hazards, such as earthquakes orfloods, result in dangerous spills of oil, chemicals orother dangerous materials (Young et al. 2004). Acommon form of na-tech hazard is the risk of deathor injury to road vehicle occupants caused by localweather conditions, such as snow or tornadoes.
In this book, technological hazards are defined as:
accidental failures of design or management relating tolarge-scale structures, transport systems or industrialprocesses that may cause the loss of life, injury, propertyor environmental damage on a community scale.
They are not new hazards. Nash (1976) showed thatriver dams and some other structures, have beenbuilt – and have failed – since antiquity. Table 13.1lists some major disasters that occurred before theend of the First World War, organised into the threecategories mentioned in the definition above:
13
TECHNOLOGICAL HAZARDS
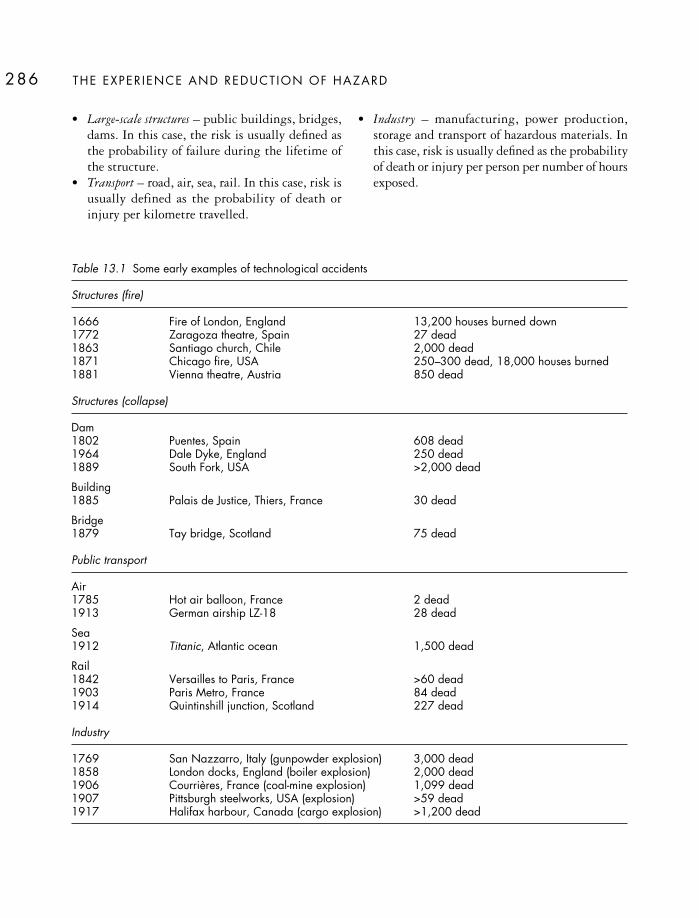
• Large-scale structures – public buildings, bridges,dams. In this case, the risk is usually defined asthe probability of failure during the lifetime ofthe structure.
• Transport – road, air, sea, rail. In this case, risk isusually defined as the probability of death orinjury per kilometre travelled.
• Industry – manufacturing, power production,storage and transport of hazardous materials. Inthis case, risk is usually defined as the probabilityof death or injury per person per number of hoursexposed.
THE EXPER IENCE AND REDUCT ION OF HAZARD286
Table 13.1 Some early examples of technological accidents
Structures (fire)
1666 Fire of London, England 13,200 houses burned down1772 Zaragoza theatre, Spain 27 dead1863 Santiago church, Chile 2,000 dead1871 Chicago fire, USA 250–300 dead, 18,000 houses burned1881 Vienna theatre, Austria 850 dead
Structures (collapse)
Dam1802 Puentes, Spain 608 dead1964 Dale Dyke, England 250 dead1889 South Fork, USA >2,000 dead
Building1885 Palais de Justice, Thiers, France 30 dead
Bridge1879 Tay bridge, Scotland 75 dead
Public transport
Air1785 Hot air balloon, France 2 dead1913 German airship LZ-18 28 dead
Sea1912 Titanic, Atlantic ocean 1,500 dead
Rail1842 Versailles to Paris, France >60 dead1903 Paris Metro, France 84 dead1914 Quintinshill junction, Scotland 227 dead
Industry
1769 San Nazzarro, Italy (gunpowder explosion) 3,000 dead1858 London docks, England (boiler explosion) 2,000 dead1906 Courrières, France (coal-mine explosion) 1,099 dead1907 Pittsburgh steelworks, USA (explosion) >59 dead1917 Halifax harbour, Canada (cargo explosion) >1,200 dead
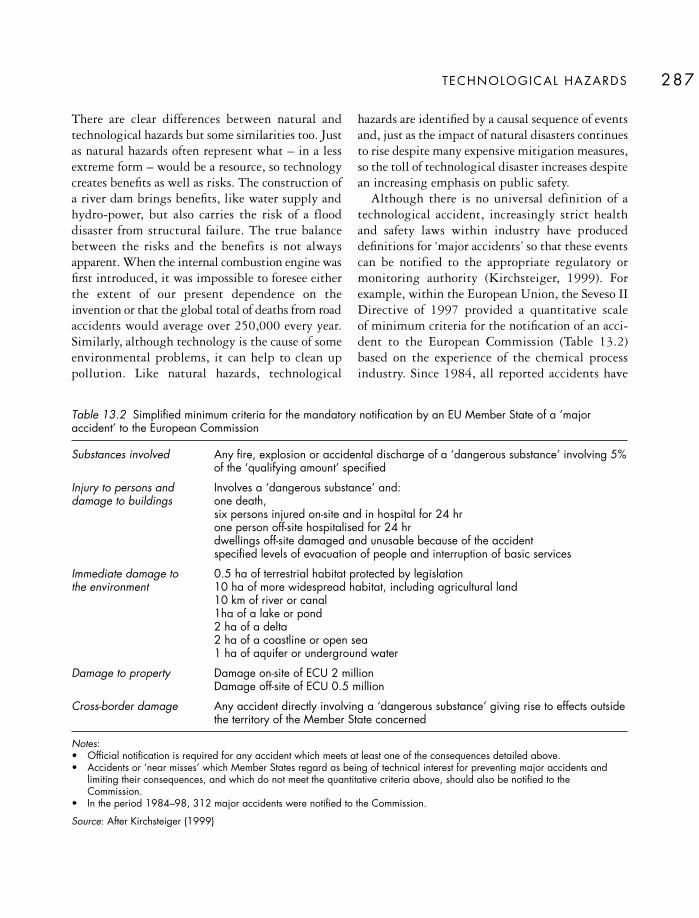
There are clear differences between natural andtechnological hazards but some similarities too. Justas natural hazards often represent what – in a lessextreme form – would be a resource, so technologycreates benefits as well as risks. The construction ofa river dam brings benefits, like water supply andhydro-power, but also carries the risk of a flooddisaster from structural failure. The true balancebetween the risks and the benefits is not alwaysapparent. When the internal combustion engine wasfirst introduced, it was impossible to foresee eitherthe extent of our present dependence on theinvention or that the global total of deaths from roadaccidents would average over 250,000 every year.Similarly, although technology is the cause of someenvironmental problems, it can help to clean uppollution. Like natural hazards, technological
hazards are identified by a causal sequence of eventsand, just as the impact of natural disasters continuesto rise despite many expensive mitigation measures,so the toll of technological disaster increases despitean increasing emphasis on public safety.
Although there is no universal definition of atechnological accident, increasingly strict healthand safety laws within industry have produceddefinitions for ‘major accidents’ so that these eventscan be notified to the appropriate regulatory ormonitoring authority (Kirchsteiger, 1999). Forexample, within the European Union, the Seveso IIDirective of 1997 provided a quantitative scale of minimum criteria for the notification of an acci-dent to the European Commission (Table 13.2)based on the experience of the chemical processindustry. Since 1984, all reported accidents have
TECHNOLOGICAL HAZARDS 287
Table 13.2 Simplified minimum criteria for the mandatory notification by an EU Member State of a ‘majoraccident’ to the European Commission
Substances involved Any fire, explosion or accidental discharge of a ‘dangerous substance’ involving 5%of the ‘qualifying amount’ specified
Injury to persons and Involves a ‘dangerous substance’ and:damage to buildings one death,
six persons injured on-site and in hospital for 24 hrone person off-site hospitalised for 24 hrdwellings off-site damaged and unusable because of the accidentspecified levels of evacuation of people and interruption of basic services
Immediate damage to 0.5 ha of terrestrial habitat protected by legislationthe environment 10 ha of more widespread habitat, including agricultural land
10 km of river or canal1ha of a lake or pond2 ha of a delta2 ha of a coastline or open sea1 ha of aquifer or underground water
Damage to property Damage on-site of ECU 2 millionDamage off-site of ECU 0.5 million
Cross-border damage Any accident directly involving a ‘dangerous substance’ giving rise to effects outsidethe territory of the Member State concerned
Notes:• Official notification is required for any accident which meets at least one of the consequences detailed above.• Accidents or ‘near misses’ which Member States regard as being of technical interest for preventing major accidents and
limiting their consequences, and which do not meet the quantitative criteria above, should also be notified to theCommission.
• In the period 1984–98, 312 major accidents were notified to the Commission.
Source: After Kirchsteiger (1999)

been archived in the MARS (Major AccidentReporting System) database. In 1992, the Inter-national Atomic Energy Authority formalised theInternational Nuclear Event Scale (INES) thatrecognises ‘anomalies’ and ‘incidents’ leading up toa range of ‘accident’ severities (Table 13.3).
THEORY AND PRACTICE
Theory
Theory is not always closely associated withtechnological hazard and many accounts in theliterature dwell on case-study detail. But, as withnatural hazards, there are at least two schools ofthought, developed by organisational theorists,about these hazards (Sagan, 1993).
The High Reliability School
This view does admit the potential for individualhuman error in complex, dangerous technologiesand the possibility of accidents. But the dominantbelief is that properly designed and managedorganisations can compensate for such errors andlargely prevent accidents. Its supporters argue that:
• Most of the high-risk procedures and organisa-tions always seek a failure-free performance andgive top priority to reliability and safety.
• Complex organisations have in-built redundancy.This means that duplication and overlap ofcomponents and procedures provides a back-upsystem and a fail-safe environment if somethinggoes wrong.
THE EXPER IENCE AND REDUCT ION OF HAZARD288
Table 13.3 The international nuclear event scale
Level of event Criteria
Off-site impact On-site impact Defence-in-depth degradation
Major accident Major release, widespread health and environmental effects
Serious accident Significant release, full implementation of local emergency plans
Accident with Limited release, partial Severe core damageoff-site risks implementation of local
emergency plans
Accident mainly Minor release, public exposure Partial core damage, acute in installation of the order of prescribed limits health effects on workers
Serious incident Very small release, public Major contamination, Near accident, loss of exposure at a fraction of over-exposure of workers defence-in-depth provisionsprescribed limits
Incident Incidents with potential safetyconsequences
Anomaly Deviations from authorisedfunctional domains
Below scale No safety significance
Note: Nuclear events leading to off-site impact are rare and none has occurred in Europe since the Chernobyl ‘major accident’of 1986.
Source: After International Atomic Energy Authority (personal communication)
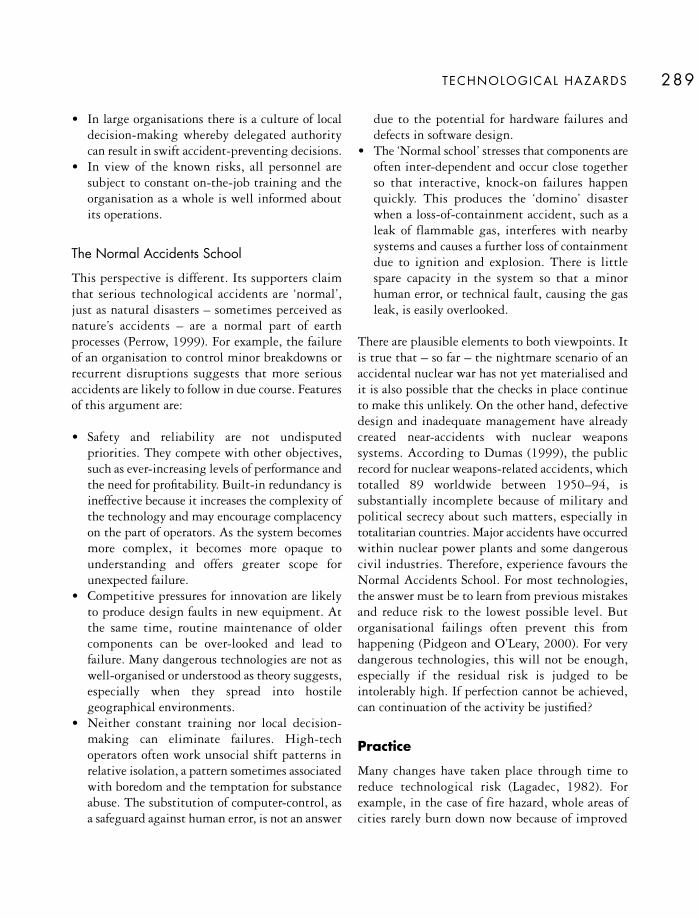
• In large organisations there is a culture of localdecision-making whereby delegated authoritycan result in swift accident-preventing decisions.
• In view of the known risks, all personnel aresubject to constant on-the-job training and theorganisation as a whole is well informed aboutits operations.
The Normal Accidents School
This perspective is different. Its supporters claimthat serious technological accidents are ‘normal’,just as natural disasters – sometimes perceived asnature’s accidents – are a normal part of earthprocesses (Perrow, 1999). For example, the failureof an organisation to control minor breakdowns orrecurrent disruptions suggests that more seriousaccidents are likely to follow in due course. Featuresof this argument are:
• Safety and reliability are not undisputedpriorities. They compete with other objectives,such as ever-increasing levels of performance andthe need for profitability. Built-in redundancy isineffective because it increases the complexity ofthe technology and may encourage complacencyon the part of operators. As the system becomesmore complex, it becomes more opaque tounderstanding and offers greater scope forunexpected failure.
• Competitive pressures for innovation are likelyto produce design faults in new equipment. Atthe same time, routine maintenance of oldercomponents can be over-looked and lead tofailure. Many dangerous technologies are not aswell-organised or understood as theory suggests,especially when they spread into hostilegeographical environments.
• Neither constant training nor local decision-making can eliminate failures. High-techoperators often work unsocial shift patterns inrelative isolation, a pattern sometimes associatedwith boredom and the temptation for substanceabuse. The substitution of computer-control, asa safeguard against human error, is not an answer
due to the potential for hardware failures anddefects in software design.
• The ‘Normal school’ stresses that components areoften inter-dependent and occur close togetherso that interactive, knock-on failures happenquickly. This produces the ‘domino’ disasterwhen a loss-of-containment accident, such as aleak of flammable gas, interferes with nearbysystems and causes a further loss of containmentdue to ignition and explosion. There is littlespare capacity in the system so that a minorhuman error, or technical fault, causing the gasleak, is easily overlooked.
There are plausible elements to both viewpoints. Itis true that – so far – the nightmare scenario of anaccidental nuclear war has not yet materialised andit is also possible that the checks in place continueto make this unlikely. On the other hand, defectivedesign and inadequate management have alreadycreated near-accidents with nuclear weaponssystems. According to Dumas (1999), the publicrecord for nuclear weapons-related accidents, whichtotalled 89 worldwide between 1950–94, issubstantially incomplete because of military andpolitical secrecy about such matters, especially intotalitarian countries. Major accidents have occurredwithin nuclear power plants and some dangerouscivil industries. Therefore, experience favours theNormal Accidents School. For most technologies,the answer must be to learn from previous mistakesand reduce risk to the lowest possible level. Butorganisational failings often prevent this fromhappening (Pidgeon and O’Leary, 2000). For verydangerous technologies, this will not be enough,especially if the residual risk is judged to beintolerably high. If perfection cannot be achieved,can continuation of the activity be justified?
Practice
Many changes have taken place through time toreduce technological risk (Lagadec, 1982). Forexample, in the case of fire hazard, whole areas ofcities rarely burn down now because of improved
TECHNOLOGICAL HAZARDS 289

fire regulations and more efficient fire-fightingservices. During the twentieth century, improve-ments in engineering design and a growingawareness of health and safety issues, reinforced bygovernment legislation, have made large structuresmuch safer than in the past (see Box 13.1 for theexample of dam safety). In the case of publictransport, individual cars, ships, trains and aircraftare all safer than a few decades ago. Variousinternational organisations, like the UN and theOECD) promote improved safety in industry. For
example, UNEP has the APELL Programme(Awareness and Preparedness for Emergencies atLocal Level) designed to improve the responsivenessof local communities. These organisations andprogrammes sponsor manuals and guidelines forhazard reduction in high-risk industries dealingwith hazardous materials in general and specificareas such as chemicals (OECD, 2003) or mining(Emery, 2005). Individual countries enact their own legislation to improve industrial safety (see Box 13.1).
THE EXPER IENCE AND REDUCT ION OF HAZARD290
Dam failures fall into the category of lowrisk–high impact hazards. They do not occur oftenbut they can be catastrophic. Within the last 50years, there have been several examples. In thePeople’s Republic of China a typhoon in August1975 produced total rainfalls of over 1,000 mm in24-hours, and more than 1,500 mm during threedays, in Henan province. The Banqiao dam on the upper Ruhe river failed and contributedsignificantly to the floods that inundated over 1 × 10⁶ ha of land and killed some 20,000 people.In 1993, the Gouhou dam in Qinghai provincesuffered structural failure and a further 1,200 liveswere lost in flooding. Within Europe, the failureof the high gravity-arch Maupassant dam insouthern France led to more than 450 deaths inthe town of Frejus. Interestingly, the October1963 disaster below the Vaoint dam in the Paivevalley of northern Italy was caused by a landslide-induced wave of water – estimated at 200 ×106 m3 – that overtopped the dam. The dam itselfremained intact but the event did cost 1,189 lives.
Some 70 per cent of all dam failures occurwithin 10 years of construction but the overall rateof collapse has been declining for many years.Figure 13.1 illustrates the improving safety record
during the first 20 years of service for damsconstructed up to 1950. More recently, the averagefailure rate has fallen below 0.5 per cent. It shouldalso be remembered that most failures involvesmall dams simply because most dams worldwideare small. There is little relationship between theheight and safety of a dam and failures are moredependent on the type of dam involved. The mostcommon dams are fill-type structures, built ofcompacted earth or rock, and these are also mostlikely to fail. Concrete dams may fail withfoundation problems due to internal erosion orinsufficient bedrock strength but earth and rock-fill dams are vulnerable both to overtopping byfloods and to inadequate foundation drains thatfail to prevent sub-surface erosion (piping) thatcan lead to the collapse of earth embankments.
Most of the world’s highest and largest capacitydams have been built within the last 25 years.Despite the trend towards greater safety, this trenddoes provide the potential for large losses. Mostnew large-scale projects are highly controversialbut often on ecological and socio-economicgrounds as well as safety. For example, the ThreeGorges dam on the upper Yangtze river, China, isa concrete-gravity structure built on granite
Box 13.1
THE SAFETY OF DAMS
TECHNOLOGICAL HAZARDS 291
Despite these developments, technologicaldisasters continue to increase. In an early study,(Lagadec, 1987) detailed most recorded industrialaccidents up to 1984 causing more than 50 deathsto workers and third parties. It can be see fromFigure 13.2 that the first half of the twentiethcentury had few events. It was not until 1948 thatmore than one such accident occurred in any oneyear and not until 1957 that the first incidentoccurred outside the industrialised world (Europe,the USA, the Soviet bloc and Japan). The year 1984was a watershed when three industrial accidentscaused around 3,500 deaths.
• Cubatao, Brazil, 25 February – petroleum spillageand fire in a shanty town built illegally on theindustrial company’s land – 500 deaths
• Mexico City, Mexico, 19 November – multipleexplosions of liquefied petroleum gas in anindustrial site in a heavily populated poor area –at least 452 deaths, 31,000 homeless, 300,000evacuated
• Bhopal, India, 2–3 December – release of toxic gasfrom an urban factory – well over 2,000 imme-diate deaths, 34,000 eye defects, 200,000 peoplevoluntarily migrated. This remains the world’sdeadliest industrial accident (see Box 13.2).
bedrock. It is specifically designed so that itsweight resists the pressure from the stored water.No failures of concrete-gravity dams have beenrecorded in recent times but, in this case, concerns
have been expressed about the possibility ofinduced earthquake activity in the area due to thegreat weight of the stored water. There is also anassociated risk of large landslides.
1900–1909
1850–1899 1930–19491910–1919
1920–1929
0
1000
2000
0
1
2
3
4
Num
ber
of
dam
sco
nstr
ucte
dP
erce
ntag
eo
fd
ams
faili
ng Figure 13.1 The inverse relationshipbetween the percentage failure rate ofdams and the number newlyconstructed worldwide between 1850and 1950. Compiled from datapresented in Lagedec (1987).

THE EXPER IENCE AND REDUCT ION OF HAZARD292
Methyl isocyanate (MIC) is a fairly commonindustrial chemical used in the production ofpesticides but has qualities that make it hazardous(Lewis, 1990). First, it is extremely volatile andvaporises easily. Since MIC can boil at a tempera-ture as low as 38°C, it is important for it to bekept cool. Second, MIC is active chemically andreacts violently with water. Third, MIC is highlytoxic, perhaps one hundred times more lethal thancyanide gas and more dangerous than phosgene, apoison gas used in World War I. Fourth, MIC isheavier than air and, when released, stays nearground level.
During the early morning of 3 December 1984,some 45 tonnes of MIC gas leaked from a pesticidefactory in the industrial town of Bhopal, India,and created the world’s worst industrial disaster ina town of over one million people (Hazarika,1988). The chemical was stored in an under-ground tank that became contaminated withwater. This contamination produced a chemical
reaction, followed by a rise in gas pressure and asubsequent leak. An investigative report indicatedthat the safety devices failed through a com-bination of faulty engineering and inadequatemaintenance, although the company claimed thatthe cause was sabotage. A contributory factor wasthat the air-conditioning system, normally in useto keep the MIC cool, was shut down at the timeof the accident. It is likely that the real trigger ofthis disaster will never be known, but safety wasinadequate. For example, the Bhopal plant lackedthe computerised warning and fail-safe systemused in the company’s factory in the USA.
The Bhopal factory had been built by UnionCarbide, a multi-national company based in theUSA, within 5 km of the city centre. A densecloud of gas drifted over an area with a radius ofsome 7 km. It is now believed that up to 6,400people may have been killed by cyanide-relatedpoisoning with a further 200,000 injured. In fact,a total of 600,000 injury claims and 15,000 death
Box 13.2
THE DISASTER AT BHOPAL, INDIA
1900 1910 1920 1930 1940 1950 1960 1970 1980 19900
200
400
600
800
1000
3000
3200
3400
3600
Years
Num
ber
of
fata
litie
s
Figure 13.2 Annual numberof deaths from industrialaccidents causing more than50 fatalities in the period1900–84. Compiled fromdata presented in Lagadec(1987).
TECHNOLOGICAL HAZARDS 293
claims were ultimately filed with the Indiangovernment. The greatest number of casualtiesoccurred in the poor neighbourhoods located inlow-lying parts of the city, including a shantytown of some 12,000 people near the gates of thefactory. Most of the victims were the very youngand the very old, although pregnant womensuffered badly too. The disaster was severe becauseof the large numbers of people inhaling the gasand the lack of any emergency planning. Therewas no local knowledge of the nature of thechemicals in the factory, no adequate warning andonly limited means of evacuation. The companyprovided no information about the medical treat-ment required by the victims and key resources,such as oxygen needed to treat respiratoryproblems, were in short supply.
The plant was unprofitable at the time of theaccident and, because cut-backs had been made inmaintenance, blame was attached to the localIndian management. Over the following two years,the parent company slimmed down, partly bydistributing assets to shareholders and creditors,who were mainly banks. This strategy was deemednecessary in order to fend off a hostile take-over bidbut it also served to off-load assets that were notthen exposed to compensation claims. At the sametime, the US legal system overturned precedentand opposed compensation claims for such anoverseas liability, on the grounds that it wouldunfairly tax the US courts. So the responsibility waspassed back to the Indian government.
The Indian government made itself the solerepresentative of the victims and filed com-pensation claims against the company both in theUSA and in India. In 1989 Union Carbide madea final out-of-court compensation payment ofUS$470 million. This compares unfavourablywith the US$5 billion awarded in the USA afterthe Exxon Valdez oil spill. Special courts were setup to hear compensation claims. These weretypically settled at £500 for injury and £2,000 fordeath. In the meantime, the Indian government
distributed relief at about £4 per month for eachfamily affected. But the Indian government failedto organise efficient legal or medical aid for thevictims. As a result, victims found it difficult tohave their cases brought to court without resortingto bribes, commonly £10 to a middleman, orpaying private lawyers. Many medicines thatshould have been supplied free to patients wereobtainable only on the black market. Familiessometimes had to spend double their monthlygovernment allowance on medicines. Ten yearsafter the event, it was estimated that less than onequarter of the total claims have been settled andthat less than 10 per cent of the damages paid byUnion Carbide reached the victims.
The Bhopal accident led to a greatly increasedawareness of the hazards associated with largechemical plants. The main Union Carbide plantin West Virginia was quickly closed and aboutUS$5 million was spent on technical improve-ments at other Union Carbide sites in the USA(Cutter, 1993). Over 20 years later, Bhopal leavesa clear legacy of improved regulation in thechemical industry worldwide although safetyinnovation is more apparent in the MDCs, such asCanada (Lacoursiere, 2005), than in the develop-ing countries. Generally speaking, better consulta-tion between the industry and governments nowexists as well as greater preparedness for emer-gencies. Academic interest has also increased. Theterm ‘process-safety’ was used around 500 timesper year as a key word in science and engineeringjournals at the time of Bhopal but usage rose to anannual frequency of over 2,500 by 2004 (Mannanet al., 2005). Despite an enhanced awareness ofsafety issues, the chemical industry remains in theforefront of technology transfers from the MDCsto countries with different cultures and regulatoryregimes. Due to the increasing globalisation of the chemical process industry, it is difficult tojudge how much real progress in safety has beenachieved, especially for new plants dealing withhighly toxic substances.

THE EXPER IENCE AND REDUCT ION OF HAZARD294
These events marked a changing situation. First,they showed that technological hazard was no longerconfined to the MDCs. Second, they confirmed that,as with natural disasters, poor people suffer most.Third, the Mexico City disaster marked the arrivalof the ‘domino’ disaster. These are accident ‘chains’or ‘cascades’ that occur when an accident in oneindustrial unit causes a secondary accident nearbythat, in turn, triggers a tertiary accident and so on.According to Khan and Abbasi (2001), dominoaccidents result from increasing congestion withinindustrial complexes coupled with large concen-trations of population around such plants. Thesecharacteristics are particularly common in theLDCs. The Bhopal disaster sprang from some ofthese factors as did the refinery accident atVishakhapatam, India, in September 1997 thatclaimed 60 lives.
After the mid-1980s there was a steady increasein the annual number of technological disastersrecorded worldwide (Fig. 13.3A) although thistrend is not directly reflected in the death toll (Fig.13.3B), probably due to the growing effectivenessof health and safety legislation. Any apparent trendin deaths is complicated for all disaster categoriesby high mortality in the very worst events. The
importance of these disasters can be understood byreference to Table 13.4 listing the 10 deadliestevents recorded for each accident category. Causalagents are interesting. For example, in addition tothe 1987 Philippine ferry disaster, several otherdisasters taking over 500 lives each have involvedseriously over-loaded ferries in the LDCs. Majorindustrial disasters have more varied causesalthough explosion, as at a dynamite factory in Cali,Colombia (1956), when at least 2,700 were killed,and the release of toxic gas, as at Bhopal, India(1984) are important. As might be expected, miscel-laneous accidents have the widest range of causes.Some of the worst events (Japan, 1923; USA, 1906)were classic ‘na-tech’ disasters of urban fire causedby an earthquake. Some factors leading to increasedtechnological hazards are detailed in Box 13.3.
The impact of technological hazards is differentfrom that of natural hazards. Fritzsche (1992)showed that, in the two most developed continents(Europe and North America), the fatality rate isabout the same for both natural and man-madedisasters (Table 13.6). This contrasts with thesituation in the LDCs where natural hazards aremore prominent and the average fatality rate fromall disasters is perhaps 20 times higher than in the
Table 13.4 The ten deadliest transport, industry and miscellaneous accidents
Transport Industry Miscellaneous
Country Year Deaths Country Year Deaths Country Year Deaths
Philippines 1987 4,386 Colombia 1956 2,700 Japan 1923 3,800Haiti 1993 1,800 India 1984 2,500 Turkey 1954 2,000Canada 1917 1,600 China 1942 1,549 China 1949 1,700UK 1912 1,500 France 1906 1,099 Japan 1934 1,500Senegal 2002 1,200 Nigeria 1998 1,082 Saudi Arabia 1990 1,426Japan 1954 1,172 Iraq 1989 700 India 1979 1,335China 1948 1,100 Soviet Un 1989 607 Iraq 2005 1,199Egypt 2006 1,028 Germany 1921 600 United States 1906 1,188Canada 1914 1,014 USA 1947 561 Nigeria 2002 1,000United States 1904 1,000 Brazil 1984 508 Guyana 1978 900
Note: All events listed fulfil at least one of the following criteria: 10 or more people reported killed, 100 people reportedaffected, a call for international assistance, a declaration of a state of emergency.
Source: Updated from CRED database

TECHNOLOGICAL HAZARDS 295
1975 1980 1985 1990 1995 2000 2005
1975 1980 1985 1990 1995 2000 2005
400
300
200
100
0
15,000
12,000
9,000
6,000
3,000
0
Year
Year
Num
ber
of
tech
nolo
gic
ald
isas
ters
Num
ber
of
peo
ple
rep
ort
edki
lled
A
B
Figure 13.3 The annual pattern of technological disasters across the world 1975–2005. (A) number of technologicaldisasters recorded; (B) number of people reported killed.
Source: CRED graph of Disaster Trends, reproduced with permission.

THE EXPER IENCE AND REDUCT ION OF HAZARD296
Technical and legislative developments that fosteroccupational safety have to be set against trendsthat increase industrial risks. For example, theemergence of the modern chemical and petro-chemical industry over the past century hascreated a suite of entirely new technologies. Thisindustry has tended to group on large sites near tosignificant concentrations of population. About 30years ago, a study of Canvey Island – a majorchemical and oil-refining complex on the northshore of the river Thames about 40 km down-stream from London, England – revealed that thequantities of flammable and toxic materials eitherin process, store or transport created a severepublic safety hazard (Health and Safety Executive,1978). The hazards included fire, explosion,missiles and the spread of toxic gases. The mostsignificant conclusion was that the existingindustrial installations possessed a quantifiablerisk of killing up to 18,000 people.
Glickman et al. (1992) found that majorindustrial accidents occurred at refineries andmanufacturing plants, or during transportation,and were linked with the nature and scale ofindustrial activity. The harmful energy may bereleased in either mechanical impact form (damburst, waste tip slippage, vehicle deceleration) orchemical impact form (explosion, fire). The mosthazardous materials are high-level radioactivematerials, explosives and a limited number ofgases and liquids that are poisonous when inhaledor ingested. Many chemicals are a hazard becausethey are flammable, explosive, corrosive or toxicin low concentrations. In order to constitute acommunity-scale risk, such substances must bepresent in large quantities and must be stored ortransported in a less than secure manner. Toxicmaterials are most hazardous if transferred to theaffected population by severe air pollution in a
‘toxic cloud’. A feature of severe pollution episodesis that the adverse effects, both on the human bodyand on the environment, can outlast the impactsassociated with natural disasters.
The demand for energy has created industrialrisks, including those associated with the nuclearindustry. The exhaustion of easily won fossil fuelsources has pushed the exploitation of hydrocarbondeposits into increasingly hostile physical environ-ments. Oil and gas have been developed offshorein areas like Alaska and the North Sea as a resultof innovations, such as large drilling platforms,which have proved vulnerable to human safety. In 1988 the Piper Alpha platform disaster in the North Sea claimed 167 lives. According toPaté-Cornell (1993), this was a largely self-inflicted disaster resulting from accumulateddesign and management errors that ranged frominsufficient protection of the structure againstintense fires to a lack of communication aboutequipment that had been turned off for repair.Such failures in the MDCs raise even greaterimplications for the LDCs.
Another factor has been the increased trans-portation of hazardous materials, including radio-active waste. Table 13.5, from Cutter and Ji(1997), lists the number of reported transportationincidents in the USA between and 1971 and 1991.Most of the accidents, and most of the deaths,occurred as a result of road transportation butwater carrier incidents harmed people the most.The regional incidence of risk over the USA variedaccording to the extent of dependence on thechemical industry, the number of hazardous wastefacilities and the length of rail track in each state.In other countries, major disasters have resultedfrom transportation accidents. For example, in1978 more than 200 people were killed and 120injured when a road tanker containing liquid
Box 13.3
THE GROWTH OF INDUSTRIAL HAZARDS
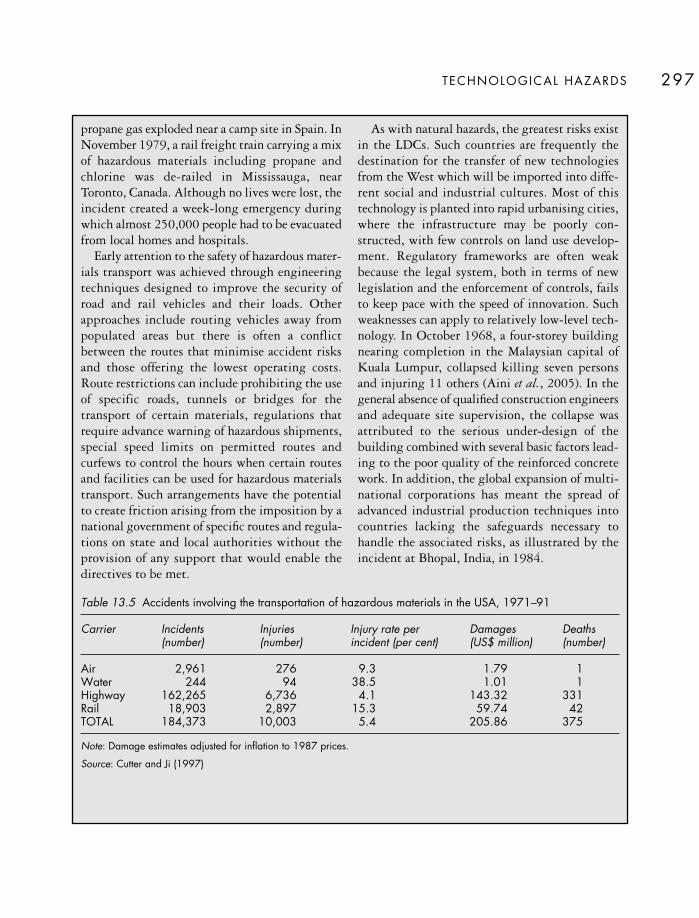
TECHNOLOGICAL HAZARDS 297
propane gas exploded near a camp site in Spain. InNovember 1979, a rail freight train carrying a mixof hazardous materials including propane andchlorine was de-railed in Mississauga, nearToronto, Canada. Although no lives were lost, theincident created a week-long emergency duringwhich almost 250,000 people had to be evacuatedfrom local homes and hospitals.
Early attention to the safety of hazardous mater-ials transport was achieved through engineeringtechniques designed to improve the security ofroad and rail vehicles and their loads. Otherapproaches include routing vehicles away frompopulated areas but there is often a conflictbetween the routes that minimise accident risksand those offering the lowest operating costs.Route restrictions can include prohibiting the useof specific roads, tunnels or bridges for thetransport of certain materials, regulations thatrequire advance warning of hazardous shipments,special speed limits on permitted routes andcurfews to control the hours when certain routesand facilities can be used for hazardous materialstransport. Such arrangements have the potentialto create friction arising from the imposition by anational government of specific routes and regula-tions on state and local authorities without theprovision of any support that would enable thedirectives to be met.
As with natural hazards, the greatest risks existin the LDCs. Such countries are frequently thedestination for the transfer of new technologiesfrom the West which will be imported into diffe-rent social and industrial cultures. Most of thistechnology is planted into rapid urbanising cities,where the infrastructure may be poorly con-structed, with few controls on land use develop-ment. Regulatory frameworks are often weakbecause the legal system, both in terms of newlegislation and the enforcement of controls, failsto keep pace with the speed of innovation. Suchweaknesses can apply to relatively low-level tech-nology. In October 1968, a four-storey buildingnearing completion in the Malaysian capital ofKuala Lumpur, collapsed killing seven persons and injuring 11 others (Aini et al., 2005). In thegeneral absence of qualified construction engineersand adequate site supervision, the collapse wasattributed to the serious under-design of thebuilding combined with several basic factors lead-ing to the poor quality of the reinforced concretework. In addition, the global expansion of multi-national corporations has meant the spread ofadvanced industrial production techniques intocountries lacking the safeguards necessary tohandle the associated risks, as illustrated by theincident at Bhopal, India, in 1984.
Table 13.5 Accidents involving the transportation of hazardous materials in the USA, 1971–91
Carrier Incidents Injuries Injury rate per Damages Deaths(number) (number) incident (per cent) (US$ million) (number)
Air 2,961 276 9.3 1.79 1Water 244 94 38.5 1.01 1Highway 162,265 6,736 4.1 143.32 331Rail 18,903 2,897 15.3 59.74 42TOTAL 184,373 10,003 5.4 205.86 375
Note: Damage estimates adjusted for inflation to 1987 prices.
Source: Cutter and Ji (1997)

industrialised countries. Even so, compared with theoverall annual mortality rate of about 900 fatalitiesper 100,000 of the population in North America,the number due to major technological accidents issmall. This pattern is repeated worldwide. Smets(1987) claimed that, apart from three industrialdisasters involving the concentrated release of toxicsubstances, no instance of accidental pollution had– at that time – directly caused more than 50 deathsanywhere in the world.
PERCEPT ION – THE TRANSPORTAND NUCLEAR INDUSTRIES
People often perceive technological risks as tolerablewhen balanced against the benefits (see Chapter 4).This attitude is apparent in the medical field whencertain treatments require patients to take chemicalsubstances in prescribed measures, and exposethemselves to ionising radiation through x-rays,knowing that larger doses can be extremely harmful.Such public acceptance is critical for technologicalhazards. Compared to natural hazards, there isusually less statistical evidence on which to base aprobability assessment of technological risks.Therefore, the public perception of the advantagesand disadvantages of a technology may be even moredifferent to that of scientists and technicians thanin the case of natural hazards. Gardner and Gould(1989) found that lay people take a complex viewwith an emphasis on so-called ‘dread’ risks. Thismeans that technological hazards create specialproblems, either because they exert a higher toll on
society than is generally perceived, or – more usually– because they increase the perception of threats inexcess of experience. An example of risk amplifi-cation occurred at Henderson, Nevada, in 1988when explosions at an industrial site killed twopeople and injured some 300 more (Olurominiyi etal., 2004). This event raised the perception ofresidents about other latent public safety issues inthe community ranging from the confidentialitylaws to the fragmentation of political responsibilityfor land use.
The feature of amplified risk perception can bedemonstrated by considering a relatively large actualrisk industry (transport) and a relatively largeperceived risk industry (nuclear power).
The transport industry
The ongoing rise in transport-related deaths ismainly a function of the rise in the distance travelledper year and the size of vehicles (Yagar, 1984). Thehuge increase in business travel, together with thegreater amounts of leisure time and disposablewealth in the MDCs, has led to more mobility. Carownership is widespread. Air travel is as common-place today as rail travel was for the previous genera-tion. Therefore, the total exposure to transport-related risks has grown. Also many passengervehicles carry more passengers, so that when anaccident occurs it creates more victims. This featurewas illustrated in late 1994 when the sinking of theferry ship Estonia claimed 800 lives in Europe. As aresult, many passenger carriers now undertake riskassessment exercises (van Dorp et al., 2001).
THE EXPER IENCE AND REDUCT ION OF HAZARD298
Table 13.6 Annual death toll, averaged over the 1970–85 period, due to natural (N) and man-made (M)disasters for the world, North America and Europe
Populations and fatalities World North America Europe
Population (millions) 4,264 245 477Cause of death N M N M N MFatalities per year 88,900 5,500 220 310 450 540Fatality rate per 100,00 per year 2.1 0.13 0.09 0.13 0.09 0.11
Source: After Fritzsche (1992)

Most forms of transport are getting safer. Table13.7 shows that, with the exception of rail travel,which reflects the importance of two major accidentsin the period concerned, the risk of death perpassenger distance travelled in the UK fell duringthe late twentieth century (Cox et al., 1992). Airtravel is particularly safe. According to Lewis (1990),despite the media attention paid to air crashes, theaverage risk in the USA is one fatality per billionpassenger miles and this seems to be expressed in atrust in commercial airlines. For example, Barnett etal. (1992) investigated the public response in theUSA to the Sioux City disaster of 1989. This was thethird DC-10 crash caused by the loss of hydraulicpower and killed 112 out of 282 passengers on board.Despite adverse publicity, within two monthsbookings recovered to about 90 per cent of the levelexpected in the absence of the incident. This appearsto be a demonstration of the ‘willingness-to-pay’principle in safety management which lets themarketplace adjudicate on what is an ‘acceptable’risk (McDaniels et al., 1992).
Road travel is much more risky. In fact, if tech-nological disaster is expressed through prematuredeaths alone, it is the motor vehicle that has mostto answer for. Traffic accidents claimed over 30million lives worldwide during the twentiethcentury but the personal convenience of car travel iswidely perceived to outweigh the risk of death orinjury. Indeed, the spread of car ownership is soassociated with human progress that over 70 per
cent of all road deaths now occur in the LDCs wherethe annual cost of traffic accidents now rivals theamount of international aid received by thesecountries.
In the USA, road collisions account for about halfof all accidental deaths. In Japan traffic accidentsaccount for 0.01 per cent of all deaths, comparedwith a death rate of only 0.00025 per cent fornatural disasters (Mizutani and Nakano, 1989). Inthe UK the average driver faces a risk of about 8 in100,000 per year of being killed in a car accidentand a 100 in 100,000 risk of being seriously injured.The threats to other persons are greater. The averagerisk of killing someone else in a road accident is 13in 100,000 and of seriously injuring another personas high as 151 in 100,000. Such risks are stronglyage-dependent. For example, driving accidentsaccount for about three quarters of all accidents inthe 16–19 age group and drivers aged 21 years orunder are responsible for about one quarter of allroad deaths. These are the highest risks routinelyfaced by the public from technology.
The public perception does not fit the facts,however. Although road deaths in private vehiclesdwarf public transport deaths in most countries, thegreatest public concern is with the latter. This mis-emphasis probably stems from the larger groupdeaths associated with public transport accidentsand also from the extra opportunity for blaminglarge corporations in an age when litigation isgrowing. Because of the high risks, investment in
TECHNOLOGICAL HAZARDS 299
Table 13.7 Deaths per 109 kilometres travelled in the UK
Years 1967–71 1972–76 1986–90
Railway passengers 0.65 0.45 1.1Passengers on scheduled UK airlines 2.3 1.4 0.23Bus or coach drivers and passengers 1.2 1.2 0.45Car or taxi drivers and passengers 9.0 7.5 4.4Two-wheeled motor vehicle passengers 375.0 359.0 104.0Pedal cyclists 88.0 85.0 50.0Pedestrians* 110.0 105.0 70.0
Note: *Assuming travel at 8.7 km per person per week
Source: After Cox et al. (1992)
THE EXPER IENCE AND REDUCT ION OF HAZARD300
highway safety is a ‘good buy’. Risk reduction hasbeen achieved at relatively low cost throughimprovements in car design, more use of motorwaysand legislation, such as the compulsory wearing ofseat belts and stricter enforcement of drink-drivinglaws. This is not to say that other highway risks arenot emerging. In parts of the MDCs, the number ofvehicle miles travelled by large trucks is increas-ing at a faster rate than that for other vehicles.Increasing competition for road space betweencommercial vehicles and cars is likely to create moremulti-vehicle collisions.
The nuclear industry
At the present time, there are about 500 nuclearpower plants either operating or under construction
around the world with major clusters in westernEurope, eastern USA and Japan. About 25 per centof the existing plants are over 20 years old. Largenuclear power stations have the capability to causemany deaths and extreme social disruption. Becauseof this, the nuclear industry is highly regulated andplants are rarely sited in close proximity to urbanareas. But this is not a solution to the worst-casescenarios. During the night of 25–26 April 1986,the world’s worst nuclear accident to date occurredat Chernobyl about 130 km north of the city ofKiev, in the Republic of Ukraine (see Box 13.4). Itwas an example of a major trans-continental pollu-tion incident stemming largely from human error.In addition, about 40 countries either have nuclearweapons or have the technical capacity to producethem.
The immediate cause was an unauthorised experi-ment conducted by workers at the nuclear plantto determine the length of time that mechanicalinertia would keep a steam turbine freewheeling,and the amount of electricity it would produce,before the diesel generators needed to be switchedon. During the experiment, the routine supply of steam from the reactor was turned off and the power level was allowed to drop below 20 percent, well within the unstable zone for this type of water-cooled, graphite-moderated reactordesign.
During the experiment, the reactor was not shutdown and a number of the built-in safety deviceswere deliberately over-ridden. In this situationvast quantities of steam and chemical reactionsbuilt up sufficient pressure to create an explosionwhich blew the 1,000 tonne protective slab off thetop of the reactor vessel. Lumps of radioactivematerial were ejected from the reactor anddeposited within 1 km of the plant where they
started other fires. The main plume of radioactivedust and gas was sent into the atmosphere. Thisplume was rich in fission products and containediodine-131 and caesium-137, both of which canbe readily absorbed by living tissue.
Immediate efforts were made to control therelease of radioactive material. A major limitationwas that water could not be used on the burninggraphite reactor core because this would havecreated further clouds of radioactive steam. Insteadthe fire had to be starved of oxygen by the dump-ing from helicopters of many tonnes of materialincluding lead, boron, dolomite, clay and sand. Inthis early emergency period, 31 people died tryingto contain the accident and a further 200 peoplesustained serious injuries through exposure to over2,000 times the normal annual dose from back-ground levels of radiation. Eventually some135,000 people were evacuated from within a 30km radius exclusion zone around the plant and thetown of Pripyat was abandoned.
Box 13.4
THE DISASTER AT CHERNOBYL, UKRAINE
TECHNOLOGICAL HAZARDS 301
Practical problems are caused by the extremepublic perception (dread) of nuclear risks and toxicwaste sites. For example, the risk from hazardous-waste sites has been indicated as the most worryingenvironmental problem in polls of public opinionconducted in the USA (Dunlap and Scarce, 1991).Yet, according to Lewis (1990), the risk from aproperly constructed nuclear waste repository is ‘asnegligible as it is possible to imagine . . . [and] anon-risk’. Opposition to this technology is, however,underpinned by public concern that the risks arevery great (Slovic et al., 1991). In a wide-rangingstudy in Japan and the United States, Hinman et al.(1993) found that people in both countries dreadednuclear waste and nuclear accidents at a level ofperception exceeding their fear of crime or AIDS.
Nuclear power poses a risk of an additional doseof ionising radiation beyond the background levels
emitted via the Earth and its atmosphere. High-levelnuclear wastes are products from nuclear reactors,including spent or used fuel, with a radioactive half-life (the period taken for half the atoms to dis-integrate) of more than 1,000 years. Intermediatelevel waste has a shorter half-life but exists in largerquantities. The general solution to the disposal ofnuclear waste has been to store it for several years inpools of water near to the power plant, so that thetemperature falls and some of the radioactivitydecays. Then the plan has usually been to transportit to a permanent storage site. This means that publichighways are increasingly used for the transport ofradioactive waste, which is a highly contentiousissue. For example, in a study of radioactive wastetransport through Oregon, MacGregor et al. (1994)found no reduction in public concern with distanceaway from the transport corridor.
In the two weeks following the accident, theradioactive plume circulated over much of north-western Europe. Away from Chernobyl itself, thegreatest depositions of radioactive materialoccurred in areas affected by rain, which flushedmuch of the particulate material out of theatmosphere. These areas included Scandinavia,Austria, Germany, Poland, the UK and Ireland.Some of the heaviest fall-out was experienced inthe Lapland province of Sweden, where it affectedthe grazing land of reindeer, contaminated themeat and dealt the Lapp culture a great blow.More widely, the immediate consequence was ageneral contamination of the food chain andrestrictions on the sale of vegetables, milk andmeat were imposed. Some countries also issued aban on grazing cattle out of doors and warnings toavoid contact with rainwater.
It has proved difficult to assess the long-termhealth consequences, notably the increase in fatalcancers, attributable to the Chernobyl accident.The 50,000 soldiers who fought to control the fireon the reactor roof clearly suffered the greatestexposure to radiation, followed by the 500,000
workers who subsequently cleaned up the site.Others subjected to high doses include some of thetotal 400,000 people who were relocated. Over 15years later, it was estimated that 2 million peoplein Belarus were affected with various healthdisorders, including a marked drop in the humanbirth rate (IFRCRCS, 2000). Rahu (2003) wasmore cautious and claimed that the only directpublic health consequence of radiation exposurewas 1,800 cases of childhood thyroid cancerrecorded between 1990 and 1998 but did acknow-ledge many cases of psychological illness attri-butable to factors like fear of radiation, relocationand economic hardship. As a result of politicalchange, there is now a greater spirit of openness.Since 1993 a UN-appointed Coordinator ofInternational Cooperation has acted as a catalystbetween organisations and member states inaddressing issues such as better medical provisionfor children with thyroid cancer, the establishmentof socio-psychological rehabilitation centres, thecreation of an economic development zone in theaffected area and the restoration of contaminatedland to safe agricultural use.

THE EXPER IENCE AND REDUCT ION OF HAZARD302
It is the permanent storage risks that arouse mostanxiety. By the year 2000, the USA had some40,000 tonnes of spent nuclear fuel stored at about70 sites awaiting disposal. Many workers have foundwide differences in attitude between the public andthe technical community with respect to storinghigh-level nuclear waste. Such differences have beenhighlighted by the decision of the US Congress todesignate Yucca Mountain, Nevada, as the solerepository site for the nation’s high-level nuclearwaste, a decision opposed by the citizens of the state(Flynn et al., 1993a and 1993b). Opposition hasbeen strengthened by those who argue that thestorage of nuclear waste above ground for the next100 years, then burying it in a permanent reposi-tory, would be US$10–50,000 million cheaper thandeveloping Yucca Mountain now (Keeney and vonWinterfeldt, 1994). In practice, Yucca Mountain, along ridge of volcanic ash 1,500 m high, isscheduled to receive deliveries of waste from acrossthe USA every two days for the next 24 years. Onceinside the storage tunnels, up to 70,000 tonnes ofspent fuel will be placed in titanium-covered tubesand monitored for 300 years before the mountain issealed.
MITIGATION
Loss-sharing arrangements differ between naturaland technological hazards. For example, the explicitallocation of blame is much more likely after tech-nological disasters. This is because they are a moreobvious product of human decisions and actions.The need for attaching blame is also reflected in theincreasing public pressure for corporate man-slaughter charges to be brought against organisa-tional failure. Such a case was brought in Britainafter the Herald of Free Enterprise disaster, when 193people died in a North Sea ferry disaster, but thetrial collapsed halfway through. It was not until1994 that 400 years of legal history was swept awaywhen the first successful case of manslaughter wasbrought in the UK, albeit against a small companyrunning an outdoor activity centre held responsible
for the deaths of four schoolchildren in a canoeingaccident. Since then, other cases have been proved.
Because of the perceived importance of corporatefailings in technological accidents, whether by com-mercial companies or governments, the victims ofsuch incidents tend to attract less public sympathythan those suffering from natural disasters. There-fore, the role of international disaster aid is reducedand even the LDCs have to rely more on their ownresources. Thus, after the Bhopal disaster, it was theIndian government that set up a relief fund. Thequestion of corporate responsibility raises theimportance of legal compensation to the pointwhere it tends to replace the loss-sharing functionprovided by aid.
Compensation
Compensation is a much less spontaneous form ofloss-sharing than disaster aid. Indeed, it is oftenresisted by the donor and has to be legally enforced.Where litigation is involved, the final compensationsettlement may include a punitive element that goesbeyond the recovery of costs. Persons in the MDCsnow seek compensation for actual and perceivedharm, including emotional distress, caused byindustrial emissions (Baram, 1987). In the USA, thelegal system allows people, either injured or at risk,to bring ‘toxic tort’ actions against industry andsecure high monetary damages. Governments arealso suing industry for large sums in order to cleanup hazardous waste sites. Some of the firms involvedare multi-nationals, so the repercussions of suchactions on profits and jobs may be worldwide.
Although legal compensation can provide highmonetary returns, it is not very effective for loss-sharing. Quite apart from the major economic lossesfaced by industrial plants losing liability suits, it isnot always to the advantage of the disaster victim.For example, litigation can delay settlements foryears. In some cases, the plaintiff may die or the firmmay go out of business before compensation can bepaid. In India the lack of formal documentation heldby many Bhopal victims, combined with inertia andinefficiency, has delayed the settlement of many

claims more than ten years after the accident. Clearly,it would be better to have compensation schemesthat discharge sums quickly to help victims whilstalso safeguarding the financial future of responsiblecompanies producing or using hazardous substances.
Such compensation schemes are unlikely to existwithout government intervention. Theoretically, agovernment could establish a national technologicaldisaster fund or could ensure that the industry setsone up financed by a levy imposed on the product.Neither of these arrangements is wholly satisfactorysince they devolve the cost onto innocent thirdparties, respectively the taxpayer or the safe indus-trial plant. There are some instances where a con-tribution from the taxpayer is appropriate. Thus, itmight be deemed equitable to compensate from
general taxation a community that assumes localrisks, perhaps from a nuclear power plant, on behalfof the nation as a whole. But, ideally, direct govern-ment intervention should be motivated by theprinciple of making the hazard-maker pay. Inpractice, this suggests that government involvementmight be best directed to ensuring that individualplants carry full insurance cover against civil liabilityfor death, injury and environmental damage arisingfrom industrial activities and emissions.
Insurance
Insurance can be used to spread the financial risksassociated with technological hazards. Within theMDCs, many people are likely to be insured because
TECHNOLOGICAL HAZARDS 303
Plate 13.1 A government-funded helicopter drops water on a major warehouse fire in New Orleans, USA, duringMay 2006. Low water pressure and limited equipment available to the ground and fire boat crews already inattendance made this extra assistance necessary. (Photo: Marvin Nauman, FEMA)

personal life and accident policies often cover ‘all-risks’. This means that cover is normally availablefor exposure to hazardous substances, although suchpolicies invariably exclude exposure to radiation.Property insurance similarly tends to cover all risksand include hazardous materials, unless they arespecifically excluded. On the other hand, personalinsurance has some practical disadvantages. Forexample, it may be difficult to establish a linkbetween liability and damage, especially in moredelayed-effect cases involving toxins such ascarcinogens. This is particularly true when thedamage results from long-term, low-level leakagerather than from a rapid-onset accident.
Insurance against technological risks can also betaken out by industry. With increasing demands forcorporate safety, there is a growing economic needfor industrial plants to have full insurance coveragainst civil liability for human injury or environ-mental pollution. A pro-active partnership betweenindustry and insurers could result in insuranceencouraging industry to take a more responsibleattitude towards hazard reduction. But, as withother types of hazard insurance, the difficulty lies insetting realistic premiums for industry to pay.Unless the premiums are fully economic, an indus-try will not take technological hazards seriously andinsurance companies may fail commercially or with-draw from this market. Equally, unless premiumsare weighted according to the actual risks involvedat the level of individual plants, insurance willamount to little more than an unfair tax on the safe,well-managed sites within an industry.
PROTECT ION
Technological hazards offer more potential for modi-fying the events at source than exists for many geo-physical hazards. Most technological disasters havetheir roots in a combination of faulty engineering andhuman weakness. Since the latter includes humanflaws such as greed and carelessness, against whichthere are few reliable defences, it is the engineeringroute that offers the better chance of success.
There is no possibility of totally risk-free designand construction because it would be too expensiveto build against all possibilities of failure. Butindustrial plant and transport design has all toooften been changed after, rather than before, anevent. The risks at Chernobyl would have been lesshad the reactor been surrounded by a protectiveshield. The risks at Bhopal would have beenreduced, although not eliminated, if the factory hadbeen equipped with an effective gas exhaust facility,including a very high chimney that would havepierced the nocturnal inversion layer and dispersedthe toxic material through a much larger volume ofair. There is a special need to ensure that, whenmulti-national corporations operate within theLDCs, the safety standards in the subsidiary plantsat least match those at the parent site.
The mitigation of frost hazards on highways is aroutine example of event modification. Icing on roadsurfaces causes an increase in deaths and vehicledamage from skidding accidents during periods oflow temperature. Salt is an effective de-icing agentdown to temperatures of –21.0 oC but it should bespread sparingly to reduce the financial andenvironmental costs. The most efficient use of roadsalt occurs when it is spread as an anti-icing agent atlow application rates of about 10g m2, which issufficient to prevent the formation of a thin film ofice. When ice has already formed, salt has to be usedas a de-icing agent at application rates which aresome five times higher per unit area. Advances intechnology and highway meteorology have enabledroad engineers to monitor and forecast localised roadtemperatures. Together with the use of ice detectionsensors, this has led to economies in winter saltusage amounting to 20 per cent or more in Europeand elsewhere (Perry and Symons, 1991).
ADAPTATION
Preparedness
A pre-planned, preventive approach to technologicalhazards is desirable. In the UK, legal responsibilities
THE EXPER IENCE AND REDUCT ION OF HAZARD304

TECHNOLOGICAL HAZARDS 305
designed to enhance safety are normally required tobe carried out so far as reasonably practicable (Sobyet al., 1993). Wider attention has been given to theharmonisation of control measures designed toeliminate or control major accidents. Within theEuropean Community, the various amendments ofthe 1982 ‘Seveso Directive’ require that premisesstoring or using more than certain specified quanti-ties of very hazardous substances are designated‘major hazard sites’. The operators of such sites mustprepare emergency plans and communicate thedangers to the public nearby. In the USA theChemical Emergency Preparedness Program (CEPP)has been developed by the Environmental Pro-tection Agency to increase the understanding of, andto lower the threat from, chemical risks. One focusfor community planning has been the prepara-tion of a list of acutely toxic chemicals that mightendanger public health in the event of an accidentalair-borne release. Emergency response planning forhazardous industrial sites is less advanced in theLDCs. Some progress is being made, for example inIndia (Ramabrahmam and Swaminathan, 2000).But these plans are rarely a priority for newlyindustrialising countries and inaction becomespossible by both national and local governmentauthorities (de Souza, 2000).
Although in-plant preparedness at individualsites may be high, the level of preparation forchemical emergencies at the community level isoften low and little attention has been given to theneeds of the most vulnerable groups in chemicalemergencies. Phillips et al. (2005) conducted arandom 10 per cent sample survey of the estimated31,000 households situated within the 13–16 kmradius Immediate Response Zone surrounding a USArmy depot holding stockpiled chemical weaponsin Alabama, USA. Special attention was paid tothose in the lowest income quartile, a group con-taining 43 per cent of all households reporting aneed for special assistance in the event of a chemicalemergency. Figure 13.4 illustrates some ways inwhich the poorest households were disadvantagedrelative to the rest of the population surveyed.Despite being more concerned than other residents
about the threat of a chemical accident (Fig. 13.4A),this group was less well informed about the pro-visions of the federal Chemical Stockpile EmergencyPreparedness Program (CSEPP), designed in part toaid such people. The lower income householdsdemonstrated less willingness to participate inpreparedness classes (Fig. 13.4C) and had less accessto their own transport when faced with a warningto evacuate (Fig. 13.4D). New initiatives are re-quired. For example, programmes aimed at motivat-ing preparedness may well remain ineffective ifnothing is done to alleviate the poverty that createsthe most vulnerable groups. Another priority isbetter, more scientific training for the local emer-gency responders – such as the police, fire and medi-cal services. In addition, effective public responsedepends on more ‘freedom of information’ withregard to industrial hazards. Despite legislativestrides in this direction by certain countries, like theUSA, there are still important restrictions whencommercial competitiveness, or terrorist activity,might be involved.
As far as off-site safety is concerned, most progressin developing emergency response plans has beenachieved by the nuclear power industry. Followingthe accident at the Three Mile Island, Pennsylvania,nuclear power plant in 1979, all reactors in the USAare now required to produce emergency responseplans which meet criteria laid down by the FederalEmergency Management Agency and the NuclearRegulatory Commission (NRC). Formal approval ofthese plans is a condition for granting and main-taining operating licences for commercial nuclearpower plants. They normally include the three pro-tective measures used in any radiological emergency– indoor shelter (to protect against the short-termrelease of radionuclides); medical treatment (use ofpotassium iodide as a thyroid blocking agent) andevacuation (to remove the population from longer-term exposure to the pollution plume). Theseresponse measures are taken within the context oftwo standardised Emergency Planning Zones(EPZs). The first EPZ (the plume exposure pathway)extends over an approximate 10-mile (16 km) radiusof the plant downwind from the plant. It represents
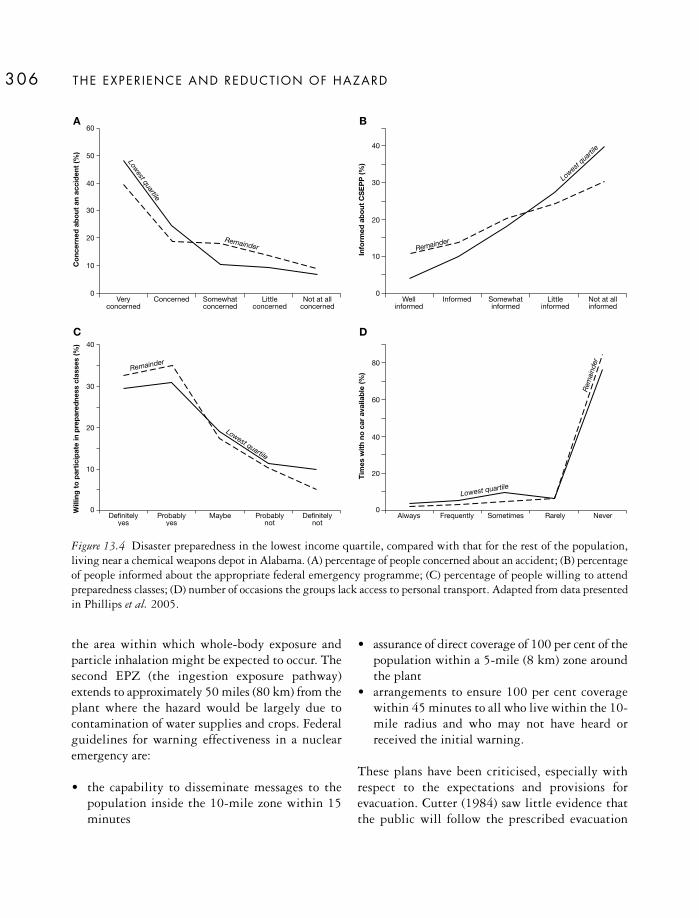
the area within which whole-body exposure andparticle inhalation might be expected to occur. Thesecond EPZ (the ingestion exposure pathway)extends to approximately 50 miles (80 km) from theplant where the hazard would be largely due tocontamination of water supplies and crops. Federalguidelines for warning effectiveness in a nuclearemergency are:
• the capability to disseminate messages to thepopulation inside the 10-mile zone within 15minutes
• assurance of direct coverage of 100 per cent of thepopulation within a 5-mile (8 km) zone aroundthe plant
• arrangements to ensure 100 per cent coveragewithin 45 minutes to all who live within the 10-mile radius and who may not have heard orreceived the initial warning.
These plans have been criticised, especially withrespect to the expectations and provisions forevacuation. Cutter (1984) saw little evidence thatthe public will follow the prescribed evacuation
THE EXPER IENCE AND REDUCT ION OF HAZARD306
Veryconcerned
Somewhatconcerned
Littleconcerned
Not at allconcerned
Concerned
60
50
40
30
20
10
0
Co
ncer
ned
abo
utan
acci
den
t(%
)
Wellinformed
Somewhatinformed
Littleinformed
Not at allinformed
Informed0
10
20
30
40
Info
rmed
abo
utC
SE
PP
(%)
Definitelyyes
Maybe Probablynot
Definitelynot
Probablyyes
40
30
20
10
0Will
ing
top
arti
cip
ate
inp
rep
ared
ness
clas
ses
(%)
Always Sometimes Rarely NeverFrequently0
20
40
60
80T
imes
wit
hno
car
avai
lab
le(%
)
L o wes t q u a rt i l e
L o w es t q u a rt i l e
L o w es t q u a rt i l e
L ow es
t q u art i
l e
R em a i n d er
R em a i n d er
Rem
a in d
er
R em a i n d er
A
C
B
D
Figure 13.4 Disaster preparedness in the lowest income quartile, compared with that for the rest of the population,living near a chemical weapons depot in Alabama. (A) percentage of people concerned about an accident; (B) percentageof people informed about the appropriate federal emergency programme; (C) percentage of people willing to attendpreparedness classes; (D) number of occasions the groups lack access to personal transport. Adapted from data presentedin Phillips et al. 2005.

procedures, including the time-frame specified andthe identified routes, as laid down by the authorities.A survey of the population affected by the emer-gency response plan for the Diablo Canyon nuclearpower plant on the southern Californian coastrevealed that only one-third of the households hadany familiarity with the plan and less than 6 per centclaimed they had information telling them whataction to take in an emergency (Belletto de Pujo,1985). In terms of response, only about half of thehouseholds questioned felt they would followemergency instructions from the authorities, despitethe fact that 40 per cent perceived the risk of a majoraccident at Diablo canyon to be either high or veryhigh. In general, there has been a failure to learnfrom evacuation behaviour after natural disasters,although it could be misleading to transfer thatexperience directly to technological hazards. Thefear of radiation is so great that 196,000 peopleevacuated in response to the Three Mile Islandincident, although no formal and comprehensiveevacuation order was issued. As a proportion of thelocal population, this is a far greater response thancan be expected when people are ordered to evacuateafter natural disasters.
Forecasting and warning
Some technological accidents, such as industrialexplosions, provide little scope for forecasting andwarning, although the anomalous heat emissionsassociated with the Chernobyl accident in 1986were detected after the event by satellite imagery(Givri, 1995). For certain types of structural failureand the release of toxic materials from industrialplants, a warning to the local population may begiven by sirens, or other audible means, but thelimited timescale between the initiating event andthe advent of the hazard often precludes preventiveaction. Where longer lead times are available,warnings are likely to be more beneficial. D. I.Smith (1989) quoted work on the effectiveness ofwarning systems for major dam failures followingflash floods in the United States. In the cases wheremore than 90 minutes’ warning had been possible,
the average loss of life averaged as little as twopeople per 10,000 residents. But, when the localcommunity received either less than 90 minutes’warning, or no warning at all, the average numberof lives lost rose to the equivalent of 250 per 10,000residents.
Land use planning
The purpose of land-use planning is to resolve theconflicts, and reduce the risks, associated with the location of dangerous facilities. High-hazardinstallations will almost certainly be unwanted bymost of the local population. The least accept-able facilities tend to be nuclear waste and toxicchemical disposal sites, plus chemical plants,nuclear power plants and fuel storage depots. Major industrial accidents tend to result from aninitial planning decision, which locates a dangeroustechnology in an inappropriate place, possibly com-bined with a failure to control subsequent intensiveland uses from invading the around the site (see Box 13.5).
At the simplest level, land use zoning should aimto separate densely-populated areas from hazardousindustrial facilities, and their associated transportroutes, and also reduce any exposure to risk throughthe use of buffer zones. Ideally, other aspects ofvulnerability, such as the level of preparedness andthe social characteristics of local communities,should also be considered but the spatial context oftechnological risk appears to be poorly understood.All too often it is inadequately integrated into landplanning, even in the LDCs (Walker et al., 2000),partly because of the vested interests in the urbanland market. There is, therefore, a growing need forbetter planning of all hazardous installations,including a requirement for improved publicinformation and acceptance.
In the UK the Flixborough chemical plantdisaster of 1974, which killed 29 people and injuredmore than 100 others, was a watershed. Imme-diately after that event, the Health and SafetyExecutive (HSE) began to examine the location ofmajor industrial risks and to consider how best to
TECHNOLOGICAL HAZARDS 307

THE EXPER IENCE AND REDUCT ION OF HAZARD308
The management of technological risks in thehigh-hazard sectors of industry within the UKreally began with the Health and Safety at WorkAct 1974 (Health and Safety Executive, 2004).This legislation established two bodies: the Healthand Safety Commission (HSC) responsible for newlaws, setting of standards, research and infor-mation and the Health and Safety Executive (HSE)responsible for enforcement of the regulations (inassociation with Local Authorities) and advice tothe HSE. During the first 30 years, several majorfatal accidents occurred (Table 13.8) some ofwhich led to the transfer of greater responsibilitiesto the HSE, for example Piper Alpha in the energyfield and King’s Cross and Clapham in the trans-port field.
For high-hazard sites, mainly but not exclu-sively those operated by the chemical industry,two pieces of legislation have proved significant:
• 1984 Control of Industrial Major AccidentHazards Regulations (CIMAH) This Act wasdesigned to implement, within the UK, theEuropean Communities ‘Seveso Directive’. The Directive resulted from the accidentalrelease of dioxin at Seveso, Italy, in 1976 whichcaused widespread contamination. Industrial-scale manufacturers and storers of specifieddangerous substances were required to identify
high-hazard sites, to provide evidence to showthat adequate control measures were in place toprevent major accidents and also to limit theeffects of any accidents that might occur(Welsh, 1994).
• 1999 Control of Major Accident HazardsRegulations (COMAH) This Act replaced theCIMAH regulations by implementing new EClegislation known as the ‘Seveso II Directive’.The Act applies to the chemical industry butalso includes some storage activities and nuclearsites. It aims to mitigate the harm potentialfrom dangerous substances such as chlorine,liquefied petroleum gas and explosives andtreats risks to the environment as seriously asthose to people. The regulations are enforced bythe HSE in association with the EnvironmentAgency in England and Wales and the ScottishEnvironment Protection Agency in Scotland.The land-use planning aspects of the Directiveare covered by separate planning legislationunder the Office of the Deputy Prime Minister,the Scottish Executive and the NationalAssembly for Wales. Minor amendments weremade to the Act in 2005.
Despite these measures, industrial accidentscontinue to happen. One example is the explosionsand fire that took place on 11 December 2005 at
Box 13.5
TECHNOLOGICAL R ISK REGULATION IN THE UK AND THE BUNCEF IELDEXPLOSIONS
Table 13.8 Technological disasters causing deaths in the UK during the last quarter of the twentieth century
1974 Flixborough chemical explosion 28 deaths1979 Golbourne colliery explosion 10 deaths1984 Abbeystead water pumping station explosion 16 deaths1985 Putney domestic explosion 8 deaths1987 King’s Cross underground station fire 31 deaths1988 Piper Alpha – offshore oil explosion and fire 167 deaths1986 Clapham rail crash 35 deaths1999 Ladbroke Grove rail crash 31 deaths

TECHNOLOGICAL HAZARDS 309
the Buncefield oil storage depot on the outskirtsof Hemel Hempstead, Hertfordshire (BuncefieldMajor Incident Investigation Board, 2006a). Inthis incident, involving over 20 large fuel storagetanks, 43 people were injured with 2,000 personsevacuated. Twenty business premises, employing500 people, were destroyed and a further 60businesses, employing 3,500 people, suffereddamage. At least 300 residential properties were
damaged and fuel supplies to London and parts ofsouth-east England, including Heathrow airport,were disrupted. Preliminary findings from theinvestigation suggest that the main explosionoccurred due to the ignition of a vapour cloudoriginating from Tank 912 in Bund A (see Figure13.5) as a result of over-filling with unleadedpetrol (Buncefield Major Incident InvestigationBoard, 2006b).
Lagoon
Bund A
Bund B
TANK912
Local business premises
Buncefield depot sites
Fuel storage tanks
Extent of burn damage
Figure 13.5 Map of the detailed pre-incident layout of the Buncefield fuel site showing the extent of the burndamage.
Source: Buncefield Major Incident Investigation Board (2006b), Health and Safety Executive. Used with permission.
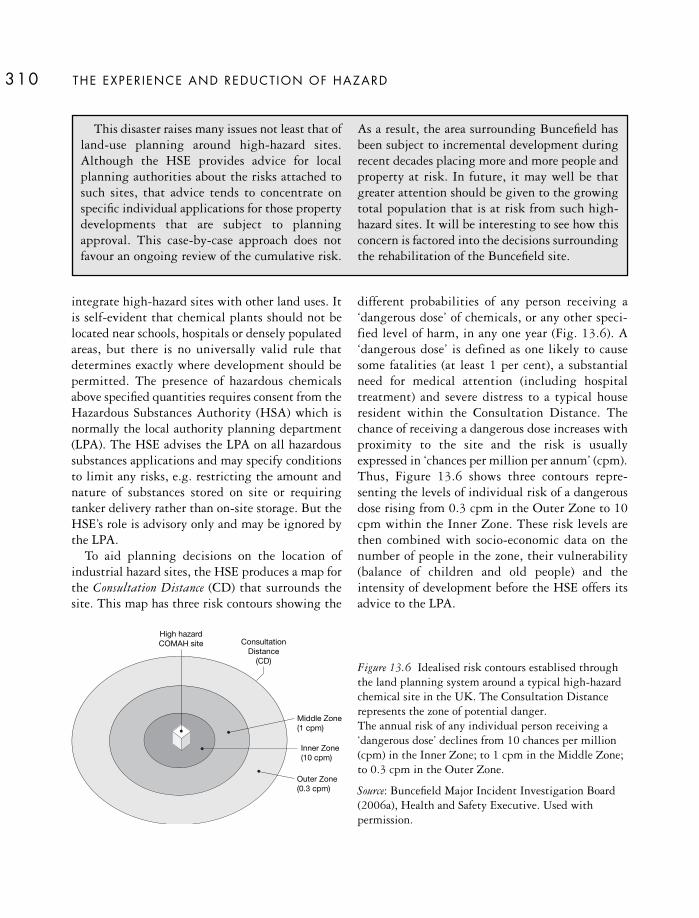
THE EXPER IENCE AND REDUCT ION OF HAZARD310
integrate high-hazard sites with other land uses. Itis self-evident that chemical plants should not belocated near schools, hospitals or densely populatedareas, but there is no universally valid rule thatdetermines exactly where development should bepermitted. The presence of hazardous chemicalsabove specified quantities requires consent from theHazardous Substances Authority (HSA) which isnormally the local authority planning department(LPA). The HSE advises the LPA on all hazardoussubstances applications and may specify conditionsto limit any risks, e.g. restricting the amount andnature of substances stored on site or requiringtanker delivery rather than on-site storage. But theHSE’s role is advisory only and may be ignored bythe LPA.
To aid planning decisions on the location ofindustrial hazard sites, the HSE produces a map forthe Consultation Distance (CD) that surrounds thesite. This map has three risk contours showing the
different probabilities of any person receiving a‘dangerous dose’ of chemicals, or any other speci-fied level of harm, in any one year (Fig. 13.6). A‘dangerous dose’ is defined as one likely to causesome fatalities (at least 1 per cent), a substantialneed for medical attention (including hospitaltreatment) and severe distress to a typical houseresident within the Consultation Distance. Thechance of receiving a dangerous dose increases withproximity to the site and the risk is usuallyexpressed in ‘chances per million per annum’ (cpm).Thus, Figure 13.6 shows three contours repre-senting the levels of individual risk of a dangerousdose rising from 0.3 cpm in the Outer Zone to 10cpm within the Inner Zone. These risk levels arethen combined with socio-economic data on thenumber of people in the zone, their vulnerability(balance of children and old people) and theintensity of development before the HSE offers itsadvice to the LPA.
This disaster raises many issues not least that ofland-use planning around high-hazard sites.Although the HSE provides advice for localplanning authorities about the risks attached tosuch sites, that advice tends to concentrate onspecific individual applications for those propertydevelopments that are subject to planningapproval. This case-by-case approach does notfavour an ongoing review of the cumulative risk.
As a result, the area surrounding Buncefield hasbeen subject to incremental development duringrecent decades placing more and more people andproperty at risk. In future, it may well be thatgreater attention should be given to the growingtotal population that is at risk from such high-hazard sites. It will be interesting to see how thisconcern is factored into the decisions surroundingthe rehabilitation of the Buncefield site.
Inner Zone(10 cpm)
Outer Zone(0.3 cpm)
Middle Zone(1 cpm)
High hazardCOMAH site Consultation
Distance(CD)
Figure 13.6 Idealised risk contours establised throughthe land planning system around a typical high-hazardchemical site in the UK. The Consultation Distancerepresents the zone of potential danger. The annual risk of any individual person receiving a‘dangerous dose’ declines from 10 chances per million(cpm) in the Inner Zone; to 1 cpm in the Middle Zone;to 0.3 cpm in the Outer Zone.
Source: Buncefield Major Incident Investigation Board(2006a), Health and Safety Executive. Used withpermission.

Some of the issues concerning the conflictbetween state and community interests in landplanning may be illustrated by the November 1984disaster at a liquid petroleum gas plant operated bythe national oil corporation (PEMEX) in MexicoCity. In this event a series of explosions resulted inaround 500 deaths and some 2,500 injuries,together with the partial destruction of a nearbyworking-class district (Johnson, 1985). Within afew days of the disaster the government decided notto rebuild this devastated area and to create a 14 ha‘commemorative park’. However, this change inland use failed to reflect the residents’ wishes for are-siting of the PEMEX facility, involved thedemolition of the remaining dwellings in thedamaged zone and the resettlement of almost 200families in other parts of the city. Such centraliseddecisions, made when the community was stillrecovering from the immediate aftermath of thedisaster, can be seen as both arbitrary and insensitivefrom a local perspective.
Land use control relies on a balanced appraisal ofthe probability of large escapes of toxic material orexplosions from a site, the local consequences of amajor accident and the necessity for acceptingparticular types of risk in the regional or nationalinterest. Economies of scale mean that large-scalesites often provide cheaper manufacturing andtransport costs but bigger operations also tend tocreate larger risks. In the USA the EnvironmentalProtection Agency has used a GIS to map the releasesof toxic chemicals in eight states to show that thelargest releases have taken place near densely-populated areas (Stockwell et al., 1993). At the urbanscale, there is evidence that the proliferation ofhazardous industrial sites has occurred primarily inareas of lower income and minority populationgroups that were already in residence before thefacilities and transport routes were built. Forexample, in Phoenix, Arizona, such disadvantagedcommunities face greater potential risks from proxi-mity to hazardous releases of material than othersocial groups in the city (Bolin et al., 2000).
The perceived risks of nuclear power have led tothe location of these facilities in relatively remote or
rural areas but even greenfield industrial sites tendto attract later development and create planningtensions. The problem of subsequent developmentaround one high-hazard site is illustrated in Box13.5. In the absence of strong planning control, itis likely that unwanted hazardous facilities willcontinue to be placed by developers and govern-ments where local resistance is less than at othercandidate sites. Therefore, small rural communitieswith low income and high unemployment, whichare remote from political influence, are most likelyto have industrial hazards imposed upon them inthe future.
KEY READING
Chapman, J. (2005) Predicting technologicaldisasters: mission impossible? Disaster Prevention andManagement 14: 343–52. An attempt to place theserisks within a wider framework.
Dumas, L. J. (1999) Lethal Arrogance: HumanFallibility and Dangerous Technologies. St Martin’s,New York. An assessment of the threats associatedwith nuclear weapons and other high-risk tech-nologies.
Mannan, M.S. et al. (2005) The legacy of Bhopal:the impact over the last 20 years and futuredirection. Journal of Loss Prevention in the ProcessIndustries 18: 218–24. The worst industrial disasterin Asia viewed with hindsight.
Phillips, B. D., Metz, W. C. and Nieves, L. A. (2005)Disaster threat: preparedness and potential responseof the lowest income quartile. Environmental Hazards6: 123–33. A reminder that technological disasters,like natural disasters, strike most severly at dis-advantaged social groups.
Rahn, M. (2003) Health effects of the Chernobylaccident: fears, rumours and the truth. EuropeanJournal of Cancer 39: 295–9. An attempt to place the most dread hazard within an objectiveperspective.
TECHNOLOGICAL HAZARDS 311

Young, S., Balluz, L. and Malily, J. (2004) Naturaland technologic hazardous material releases duringand after natural disasters: a review. Science of the TotalEnvironment 322: 3–20. The best overview to date ofthe interactive nature of ‘na-tech’ hazards.
WEB L INKS
Bhopal Disaster Information Centre www.bhopal.com
International Information Centre on the Chernobyldisaster www.chernobyl.inf/
International Atomic Energy Authority www.iaea.org/
List of recent technological disasters compiledthrough UNEP www.unepie.org/pc/apell/disasters/lists/technological
THE EXPER IENCE AND REDUCT ION OF HAZARD312
INTRODUCTION
Over the last decade the field of environmentalhazards has evolved rapidly. There are many reasonsfor this. These include the occurrence of some major,high profile disasters (notably the Sumatra earth-quake and Indian Ocean tsunami in 2004, theKashmir earthquake and ‘Hurricane Katrina’ in2005); the growing availability of observer photo-graphs and videos (often collected with cameras on mobile phones and made available worldwide viathe internet, with video-sharing sites now playinga role in the rapid dissemination of images); a newlevel of understanding of planetary-scale processes;and an increasing level of awareness of, and concernabout, anthropogenic climate change. To a largedegree, these changes represent a ‘globalisation’ ofenvironmental hazards. This globalisation takesthree distinct forms:
• Changes to the location, magnitude andfrequency of chronic (sometimes termed elusive)hazards. Such hazards are comparatively low-intensity, local-scale problems that, in mostcases, have existed in some form for centuries.Examples include air pollution and soil erosion.As a result of ongoing changes to the human andnatural domains, these processes now affect much
larger areas and operate with greater intensity.For example, air quality in Hong Kong hasdrastically reduced over the last decade, notbecause of pollution produced in Hong Kongitself, but due to industrial emissions from overthe border in China.
• Changes in the rate of operation of high-intensity, low-frequency hazards, such as tropicalcyclones, floods and landslides. The future holdsthe prospect of environmental changes across theEarth on a scale unprecedented in historicaltimes. These changes – some already underway– provide a mix of uncertainty, risk andopportunity similar to those already described forthe hazards in the preceding chapters. To thisextent, global environmental change can beregarded as an environmental hazard, althoughmany of the consequences lie beyond the scopeof this book. However, it is becoming acceptedthat environmental change and, especiallyhuman-induced global warming, is causingchanges to the magnitude and frequency ofcertain environmental hazards and increasinghuman exposure or vulnerability to risk. Otherpotential outcomes of global environmentalchange are less clear. Although there is a greatdeal of emphasis on the negative impacts ofenvironmental change, there will also be some
14
CONTEXT HAZARDS

benefits. The balance will vary in different loca-tions but, given the likely scale of future change,most of the effects will require human adjust-ments and, to that extent, can be said to benegative.
• An increased awareness of rare but global-scalethreats. Recent research in the reconstruction of the geological history of the world has high-lighted the existence of a set of previouslyunknown very high-intensity but low-frequencyhazards with the potential for causing cata-strophe on a world-wide scale. Examples includemeteor and asteroid impact events and massivevolcanic flank collapses.
We term these environmental threats context hazards.Critical here is the recognition that the origin ofthese threats is often a distant, rather than a local,source. They stem partly from the fact that eco-nomic globalisation and modern technology makethe modern world an inter-connected place. Majordisasters – like the 1995 Kobe earthquake – disrupteconomies on the other side of the globe through‘echo disruption’. The MW=7.1 26 December 2006Hengchun earthquake off the south-west coast ofTaiwan caused limited damage to the island, butsevered submarine communication cables thatserved much of east and south-east Asia. Trans-actions on the international money markets wereparticularly badly affected. Natural events are alsocompounded through teleconnections – the linkagesbetween natural events in widely separated parts ofthe Earth. For example, hemispheric-scale inter-actions between air and ocean masses producesignificant climatic variations, like El Niño epi-sodes, and major volcanic eruptions can also disruptthe climate.
In the previous chapters, some consideration hasbeen given to the changes that are occurring withhigh-intensity/low-frequency hazards such aslandslides and floods. In this chapter we considerchronic hazards and the rare (very low-frequency/high-magnitude) threats.
Chronic (‘elusive’) hazards
These are the product of ongoing physical processes– sometimes influenced by human actions – thatresult in increased environmental variability andchange. They tend to involve atmosphere–oceaninteractions that, in the shorter-term, provideclimatic anomalies on either a seasonal basis or fora few years only. But this short-term atmosphericvariability may be over-ridden by longer-termchanges – such as excessive land degradation – sothat the hazard potential is extended and amplified.Climate change itself is a long-term trend extendingover many decades that has created concern aboutthe sustainability of the world’s natural resources. Italso provides the framework in which shorter-termdisasters can occur. Sometimes the probable impactscan be hard to isolate, as when extrapolatingtheoretical links between global warming and futurepatterns of severe storms. The future link betweensea-level rise and increased coastal flooding is clearer,both in terms of the science of sea-level rise and thelikely socio-economic effects. Concern about theselinks tends to be high in the LDCs where coastaldisasters already hit hard.
Rare (‘new’) hazards
Rare hazards are highly unusual events capable ofcreating catastrophic global-scale losses. They are aform of ‘dread’ or ‘super’ natural hazard with lowrisk but high impact potential, exacerbated by thelikelihood of rapid-onset. So far, our understandingof these threats has been gained from the geologicalrecord rather than from human experience. Most ofthe current concern is focused on marine changesdue to geophysical instability, like super tsunamisand collisions between planet Earth and extra-terrestrial objects. These are comparatively newconcerns. For example, it was not until quite late inthe twentieth century that many of the crater-likedepressions known on the Earth’s surface – whichhad previously been thought of volcanic origin –were recognised as the result of collisions withasteroids, comets and planetary debris.
THE EXPER IENCE AND REDUCT ION OF HAZARD314

CHRONIC HAZARDS
The El Niño–Southern Oscillation(ENSO) and La NiñaThe ENSO system is a prime example of short-termclimatic variability involving hemispheric-scaleinteractions (teleconnections) between the atmo-sphere and the oceans. ENSO events, which involvea change in the oceanic circulation pattern in thePacific Basin, normally happen every 2–7 yearsaround the Christmas season, thereby resulting in
the name ‘El Niño’ (The Christ Child). ENSO eventsstart with the local incursion of abnormally warmsurface water southward along the Peruvian coastbut, in association with changed airflow patternsacross the Pacific, an El Niño event can spread muchmore widely and last for over a year. The termSouthern Oscillation refers to the cycle of varyingstrength in the atmospheric pressure gradientbetween the Indo-Australian low and the SouthPacific high-pressure cell. Under normal conditions,shown in Figure 14.1A, this pressure gradient
CONTEXT HAZARDS 315
Risingair
Lowpressure
Equator
High altitude flow
Surface flow
Descendingair
Highpressure
Risingair
Lowpressure
Equator
High altitude flow
Surface flow
Descendingair
Highpressure
Warm water
Warm water120°W
Cold water and nutrients
120°E
120°W 120°E100–400m
A
B
Figure 14.1 Idealiseddepiction of the two phases ofthe Walker circulation thatmake up the SouthernOscillation pressure variationin the southern hemisphere.(A) Normal cell pattern; (B) ElNiño phase. When the normalWalker circulation becomesexceptionally strong, a LaNiña phase of the cycle isrecognised.
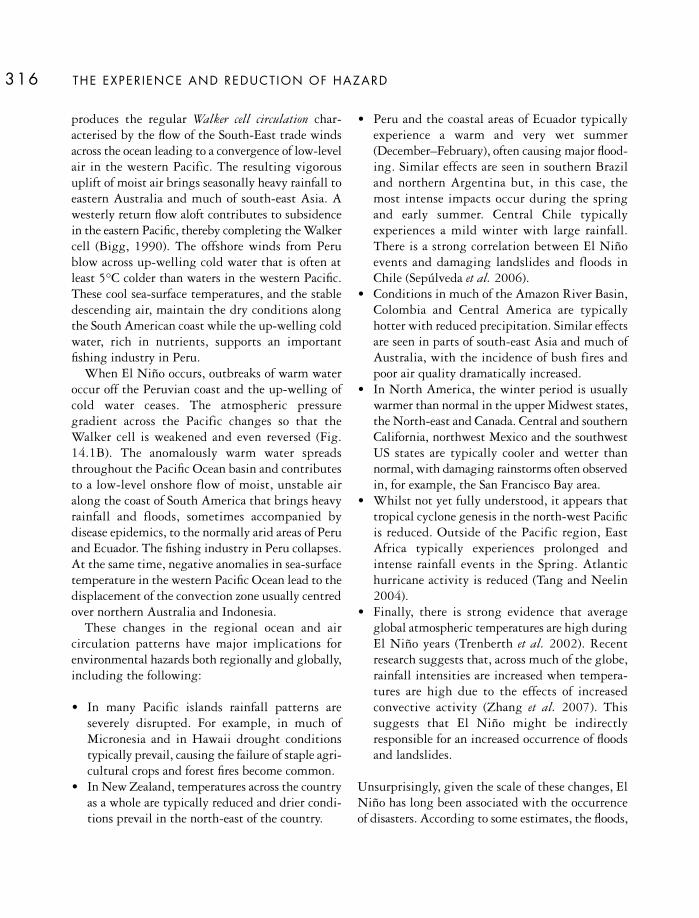
THE EXPER IENCE AND REDUCT ION OF HAZARD316
produces the regular Walker cell circulation char-acterised by the flow of the South-East trade windsacross the ocean leading to a convergence of low-levelair in the western Pacific. The resulting vigorousuplift of moist air brings seasonally heavy rainfall toeastern Australia and much of south-east Asia. Awesterly return flow aloft contributes to subsidencein the eastern Pacific, thereby completing the Walkercell (Bigg, 1990). The offshore winds from Perublow across up-welling cold water that is often atleast 5°C colder than waters in the western Pacific.These cool sea-surface temperatures, and the stabledescending air, maintain the dry conditions alongthe South American coast while the up-welling coldwater, rich in nutrients, supports an importantfishing industry in Peru.
When El Niño occurs, outbreaks of warm wateroccur off the Peruvian coast and the up-welling ofcold water ceases. The atmospheric pressuregradient across the Pacific changes so that theWalker cell is weakened and even reversed (Fig.14.1B). The anomalously warm water spreadsthroughout the Pacific Ocean basin and contributesto a low-level onshore flow of moist, unstable airalong the coast of South America that brings heavyrainfall and floods, sometimes accompanied bydisease epidemics, to the normally arid areas of Peruand Ecuador. The fishing industry in Peru collapses.At the same time, negative anomalies in sea-surfacetemperature in the western Pacific Ocean lead to thedisplacement of the convection zone usually centredover northern Australia and Indonesia.
These changes in the regional ocean and aircirculation patterns have major implications forenvironmental hazards both regionally and globally,including the following:
• In many Pacific islands rainfall patterns areseverely disrupted. For example, in much ofMicronesia and in Hawaii drought conditionstypically prevail, causing the failure of staple agri-cultural crops and forest fires become common.
• In New Zealand, temperatures across the countryas a whole are typically reduced and drier condi-tions prevail in the north-east of the country.
• Peru and the coastal areas of Ecuador typicallyexperience a warm and very wet summer(December–February), often causing major flood-ing. Similar effects are seen in southern Braziland northern Argentina but, in this case, themost intense impacts occur during the springand early summer. Central Chile typicallyexperiences a mild winter with large rainfall.There is a strong correlation between El Niñoevents and damaging landslides and floods inChile (Sepúlveda et al. 2006).
• Conditions in much of the Amazon River Basin,Colombia and Central America are typicallyhotter with reduced precipitation. Similar effectsare seen in parts of south-east Asia and much ofAustralia, with the incidence of bush fires andpoor air quality dramatically increased.
• In North America, the winter period is usuallywarmer than normal in the upper Midwest states,the North-east and Canada. Central and southernCalifornia, northwest Mexico and the southwestUS states are typically cooler and wetter thannormal, with damaging rainstorms often observedin, for example, the San Francisco Bay area.
• Whilst not yet fully understood, it appears thattropical cyclone genesis in the north-west Pacificis reduced. Outside of the Pacific region, EastAfrica typically experiences prolonged andintense rainfall events in the Spring. Atlantichurricane activity is reduced (Tang and Neelin2004).
• Finally, there is strong evidence that averageglobal atmospheric temperatures are high duringEl Niño years (Trenberth et al. 2002). Recentresearch suggests that, across much of the globe,rainfall intensities are increased when tempera-tures are high due to the effects of increasedconvective activity (Zhang et al. 2007). Thissuggests that El Niño might be indirectlyresponsible for an increased occurrence of floodsand landslides.
Unsurprisingly, given the scale of these changes, ElNiño has long been associated with the occurrenceof disasters. According to some estimates, the floods,

droughts, wildfires and diseases attributed to the1997–98 event claimed over 21,000 lives world-wide with damage costs exceeding US$8 billion(IFRCRCS, 1999). The most severe economic losseswere in South America. For example, floods in Perumade 500,000 people homeless and destroyedUS$2.6 billion worth of public utilities, equivalentto nearly 5 per cent of national GDP. The Peruvianfishing industry declined by 96 per cent in the firstthree months of 1998 compared to the same periodthe year before. The range of associated hazard typesis wide:
• Drought Several workers have shown that thenumber of disasters related to drought is signifi-cantly associated with ENSO events (Dilley andHeyman, 1995; Bouma et al., 1997). In thesevere event of 1877–78, drought and faminecreated 10 million deaths in northern China, 8million in India, up to 1 million in Brazil and anunknown, but high number, of deaths in Africa.In India, severe droughts are often linked to ElNiño events although this does not apply in allcases (Kumar et al. 2006).
• Flood Regional floods are related to atmosphericand oceanic processes on a large scale. The major1993 floods in the Midwest of the USA werelinked to El Niño (Lott, 1994). The west coastof South America is vulnerable and, in 1982–83,widespread floods tripled the cases of acutediarrhoeal diseases. In late 1997, El Niño coastalstorms in Peru carried a sea surge 15 km inlandand flooded the main square in the coastal city ofTrujillo. Along the Pacific coast of Colombia,short-term sea level rises of about 30 cm havebeen linked to El Niño. Faced with a com-bination of marine erosion and flooding of thebarrier islands, some villages have either movedfurther along the barrier islands or migrated tofossil beach ridges on the mainland (Correa andGonzalez, 2000).
• Disease Kovats et al. (2003) demonstrated clearlythat El Niño events are associated with anincreased occurrence of disease. This is primarilybecause of the raised potential for transmission
by infectious agents. For example, increasedrainfall and humidity encourages the trans-mission of vector-borne infectious diseases suchas malaria and dengue fever in many parts of thetropics and sub-tropics. In the USA the mild,humid summer of 1878 led to an epidemic ofmosquito-borne yellow fever and in Memphis,Tennessee, up to 20,000 people died out of a totalinfected population estimated at 100,000(McMichael, 2001). There is now ample evidencethat epidemics of several mosquito-borne androdent-borne diseases are triggered by ENSOphases (Bouma et al., 1997). Specific examples ofENSO-related disease outbreaks are those ofcholera in Bengal and dengue fever in Indonesiaand northern South America provided by Boumaand Pascual (2001) and Gagnon et al. (2001)respectively. Figure 14.2 illustrates the ENSO-related variability of epidemics of Ross Rivervirus in south-east Australia. This is the mostcommon mosquito-borne viral disease inAustralia, with more than 5,000 cases reportedannually, and is found in rural areas near inten-sive irrigation or salt marshes.
• Wildfire When drought conditions prevail, therisk of wildfire increases. Some of Australia’s worstbushfires, such as the 1983 ‘Ash Wednesday’disaster, occur during El Niño events. During thestrong 1997–98 El Niño, parts of south-east Asiasuffered the worst drought for about 50 years. Therain forests became very dry and, aided byuncontrolled forest clearance, widespread firesbroke out. Over 5 million ha of forest, somecontaining the habitat of several endangeredspecies, was burned out in Kalimantan andSumatra (Siegert et al., 2001) and the associatedsmoke pall covered large areas of south-east Asia.This event was created by the coincidence of ashort-term climatic anomaly with much longer-term environmental degradation (Harwell, 2000).In the past, individual farmers used traditionalslash-and-burn methods during the dry season inIndonesia without creating disaster. A govern-ment drive to raise economic production from thetimber, palm-oil and rubber sectors, however, led
CONTEXT HAZARDS 317
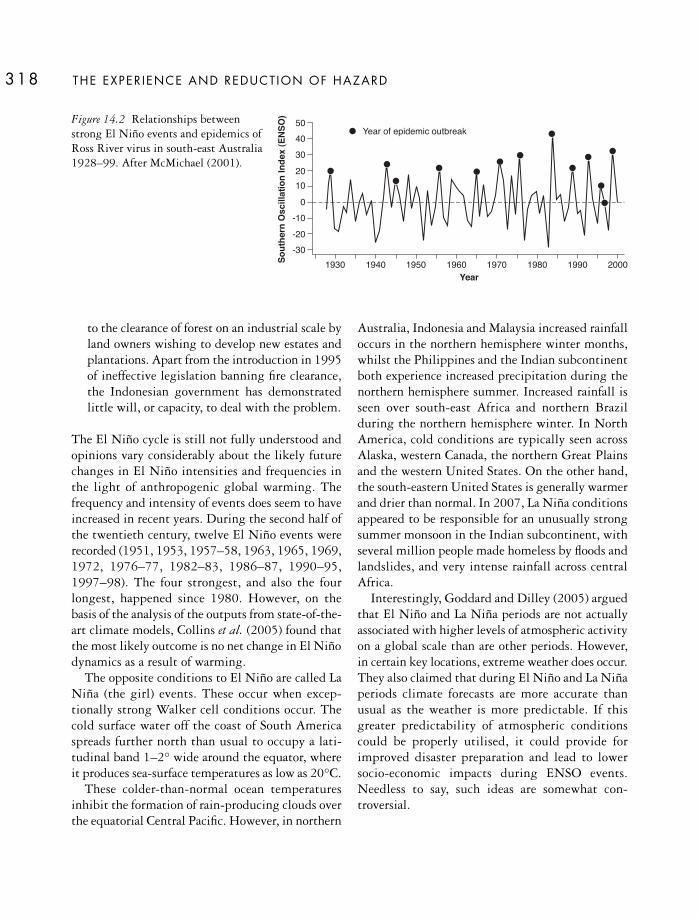
THE EXPER IENCE AND REDUCT ION OF HAZARD318
to the clearance of forest on an industrial scale byland owners wishing to develop new estates andplantations. Apart from the introduction in 1995of ineffective legislation banning fire clearance,the Indonesian government has demonstratedlittle will, or capacity, to deal with the problem.
The El Niño cycle is still not fully understood andopinions vary considerably about the likely futurechanges in El Niño intensities and frequencies inthe light of anthropogenic global warming. Thefrequency and intensity of events does seem to haveincreased in recent years. During the second half ofthe twentieth century, twelve El Niño events wererecorded (1951, 1953, 1957–58, 1963, 1965, 1969,1972, 1976–77, 1982–83, 1986–87, 1990–95,1997–98). The four strongest, and also the fourlongest, happened since 1980. However, on thebasis of the analysis of the outputs from state-of-the-art climate models, Collins et al. (2005) found thatthe most likely outcome is no net change in El Niñodynamics as a result of warming.
The opposite conditions to El Niño are called LaNiña (the girl) events. These occur when excep-tionally strong Walker cell conditions occur. Thecold surface water off the coast of South Americaspreads further north than usual to occupy a lati-tudinal band 1–2° wide around the equator, whereit produces sea-surface temperatures as low as 20°C.
These colder-than-normal ocean temperaturesinhibit the formation of rain-producing clouds overthe equatorial Central Pacific. However, in northern
Australia, Indonesia and Malaysia increased rainfalloccurs in the northern hemisphere winter months,whilst the Philippines and the Indian subcontinentboth experience increased precipitation during thenorthern hemisphere summer. Increased rainfall isseen over south-east Africa and northern Brazilduring the northern hemisphere winter. In NorthAmerica, cold conditions are typically seen acrossAlaska, western Canada, the northern Great Plainsand the western United States. On the other hand,the south-eastern United States is generally warmerand drier than normal. In 2007, La Niña conditionsappeared to be responsible for an unusually strongsummer monsoon in the Indian subcontinent, withseveral million people made homeless by floods andlandslides, and very intense rainfall across centralAfrica.
Interestingly, Goddard and Dilley (2005) arguedthat El Niño and La Niña periods are not actuallyassociated with higher levels of atmospheric activityon a global scale than are other periods. However,in certain key locations, extreme weather does occur.They also claimed that during El Niño and La Niñaperiods climate forecasts are more accurate thanusual as the weather is more predictable. If thisgreater predictability of atmospheric conditionscould be properly utilised, it could provide forimproved disaster preparation and lead to lowersocio-economic impacts during ENSO events.Needless to say, such ideas are somewhat con-troversial.
1930 1940 1950 1960 1970 1980 1990 2000
0
2010
30
5040
-20-10
-30
YearSo
uthe
rnOs
cilla
tion
Inde
x(E
NSO)
Year of epidemic outbreakFigure 14.2 Relationships betweenstrong El Niño events and epidemics ofRoss River virus in south-east Australia1928–99. After McMichael (2001).

The North Atlantic Oscillation (NAO)
The NAO is one of the major ways in which climaticvariability is imposed on parts of the northernhemisphere. Like the ENSO, it is a rhythmicoscillation of atmospheric and ocean massesalternating, in this case, between polar influences tothe north and sub-tropical influences to the south.The relative strength of these influences leads tovariations in both the strength, and the track, of thedepression systems crossing the Atlantic Ocean fromthe east coast of the USA. The effects are greatest inthe winter and the pattern has great relevance forunderstanding winter storm hazards in westernEurope (see Chapter 9).
In many ways the nature of NAO is simpler thanENSO. In the North Atlantic, there are two keysemi-static pressure systems, the Icelandic Lowpressure system and the Azores High pressure system. TheNAO index is a measure of the relative strength ofthese two pressure systems which largely control thestrength of the westerly winds, and their related
weather, over western Europe (Fig. 14.3). A PositiveIndex represents a stronger than average pressuregradient, which results in more, and stronger,winter storms crossing the Atlantic on a morenortherly track. When the westerlies are strong, thesummers tend to be cool, the winters mild andrainfall totals are high. A Negative Index representsa weak pressure gradient between the Azores andIceland leading to fewer, and weaker, winterAtlantic storms crossing on a more east–west track.If the westerlies are weak, the temperatures arerelatively high in summer and low in winter andrainfall totals are below normal.
Until recently, the NAO attracted much lessattention than ENSO. However, the NAO has beenincreasingly linked to the occurrence of flood,drought, storm surge and landslide events inEurope, on a decadal scale at least. In the UK,Woodworth et al. (2007) have shown how extremesea level events and storm surges exhibit adependence on the NAO, although the actualmagnitude of the sea level change is comparatively
CONTEXT HAZARDS 319
1850 1900 1950 2000
-2
-1
0
1
2
3
Year
NAO
norm
alis
edin
dex
Figure 14.3 Variations in the North Atlantic Oscillation (NAO) index for the winter months (December to March)from 1823–24 to 2001–02. Positive values indicate above normal storminess in Western Europe, including the UK.After the Climatic Research Unit, University of East Anglia website http://www.cru.uea.ac.uk (accessed on 16 May2003), used with permission.
small. Similarly, Macklin and Rumsby (2007),demonstrated a strong relationship between theoccurrence of flood events in upland areas of theBritish Isles with the NAO index over a period ofmore than 200 years. Elsewhere in Europe, theinfluence of NAO in flood and drought causation isalso evident. For example, Fagherazzi et al. (2005)noted a correlation between a negative NAO indexand the occurrence of flooding in Venice. Kaczmarek(2003) observed a strong influence of the NAO onfloods in Poland whilst Karabork (2007) demo-strated some NAO control on drought occurrencein Turkey. Some evidence is also emerging that theNAO is significant in landslide causation in bothPortugal (Zezere et al., 2005) and Italy (Clarke andRendell, 2006). The NAO may influence hazardousevents elsewhere in the northern hemisphere. Xin etal. (2006) found a strong correlation between theNAO and the occurrence of drought in southernChina and Cullen et al. (2002) noted a partialdependence of river flooding in the Middle East onthe NAO. It seems likely that further relationshipswill be found as datasets improve in the future.
The role of the NAO in atmospheric variabilityprovides some potential for longer-range fore-
casting. A few models for the forecasting ofprecipitation using NAO as an input have beendeveloped with some success (Murphy et al., 2001).To be fully useful, these models will need con-siderable refinement and perhaps the integration ofother continental-scale systems, including ENSO.Finally, some commentators have sought to linkchanges in the NAO to global climate change,suggesting that warming might lead to changes inthe dynamics of the NAO, and thus to the occur-rence of hazards. For example, using data extendingback over two millennia, Mann (2007) has providedstrong evidence that the strength of the NAO islinked to the global temperature.
ANTHROPOGENIC GLOBAL WARMING AND ENVIRONMENTALHAZARDS
Anthropogenic global warming (AGW) is differentfrom climate change and climatic variability (seeBox 14.1). Although AGW may have far-reachingconsequences for environmental hazards, to date ithas proved difficult to establish beyond doubt that
THE EXPER IENCE AND REDUCT ION OF HAZARD320
Climate change is any long-term trend or shift inclimate. The spatial scale may range from anindividual location to the entire planet and thenature of the shift may vary from place to place. Achange in climate is detected by a sustained shiftin the average value for any climatic element(temperature, sunshine, precipitation, winds, etc.) or any combination of such elements. Such a shift will usually be measurable over at least a decade and, often, for longer periods of time. By contrast, climatic variability is dominated by the differences in climate from one year to
the next. Although anomalies in some climaticelements – and in some regions – may be grouped in time and may persist for several years, there is no long-term influence on averagevalues.
Global warming refers specifically to a consistentmeasured increase in the average surfacetemperature of the planet. It is just one type ofpotentially detectable climate change but anyincrease in mean global temperature is likely tocause changes in other climatic characteristics –such as the atmospheric circulation. Neither
Box 14.1
CL IMATE CHANGE, CL IMATE VARIABIL ITY AND GLOBAL WARMING

CONTEXT HAZARDS 321
global warming, nor its related effects, is likely tooccur uniformly across the globe.
Changes in climate can be caused by naturalprocesses and/or human influences. Since the latenineteenth century, the average global surfacetemperature has increased by around 0.6°C, achange that is greater than can be explained bynatural variability. However, during the past 250years, the burning of fossil fuels – and otherhuman activities – has increased significantly theconcentration of ‘greenhouse gases’ in the atmo-sphere. Therefore, this trend in human emissionsis consistent with global warming. Globaltemperatures continue to rise giving growingconfidence that human activities have contributedto climate change (Jones et al., 1999). Figure 14.4shows the combined global land- and marine-surface annual temperature record from 1856 to2002 expressed as anomalies from the 1961–90average. Over land regions of the world more than
3,000 station records are used to compile thisrecord, with the densest cover in the more popu-lated regions. The much smaller marine dataset isderived from sea-surface temperature (SST)measurements taken from aboard vessels at sea.Regular revision of the data takes place (Jones andMoberg, 2003). Overall, the nine warmest yearsacross the globe have so far occurred in the 1990sand early 2000s. The 1990s was the warmestdecade of the millennium and the highestindividual values occurred in 1998 and 2002. Forthe UK – which has a very long time-series ofreliable temperatures going back to 1659 – 2002was the fourth warmest year. Without worldwideaction to reduce greenhouse gas emissions, theglobal average surface temperature is expected torise between 1.4 and 5.8°C by the year 2100. Evenif emissions are stabilised, temperatures areexpected to rise for centuries because of a lag inthe response of the world’s oceans.
0.8
0.6
0.4
0.2
0
-0.2
-0.4
-0.61860 1880 1900 1920 1940 1960 1980 2000
Year
Tem
pera
ture
anom
aly
(°C)
Figure 14.4 Annual time series of the combined global land- and marine-surface temperature record 1856–2002.The upward trend since about 1900 is regarded as one of the best measures of global warming during the twentiethcentury. After the Climatic Research Unit, University of East Anglia website http://www.cru.uea.ac.uk/info/warming (accessed on 26 March 2003), used with permission.

THE EXPER IENCE AND REDUCT ION OF HAZARD322
rising global temperatures have influenced certainkey hazard-inducing processes, such as intenseprecipitation events and tropical cyclones. Futurepatterns are even less well understood. TheIntergovernmental Panel on Climate Change (2007)was clear that AGW will lead to an increasedoccurrence of environmental hazards, particularly asa result of altered frequencies and intensities ofextreme weather, climate and sea-level events. Inessence, the basis for such assessments is simplebecause it is clear that a warmer atmosphere willhave more energy and moisture available for allprocesses. Thus, it is expected that higher averageglobal temperatures will lead to more frequent heatwaves; higher rates of precipitation, especially inconvective systems; a greater occurrence of increas-ingly intense storms; and a general rise in sea level.
Theoretically, many of these changes couldincrease the risk of disaster. For example, highertemperatures would lead to more physiological heat
stress on humans; more land evaporation wouldcreate more droughts; more atmospheric moisturewould foster more intense precipitation and floods;more storm energy would be available to morehurricanes, thunderstorms and tornadoes; higher sealevels would give rise to more coastal flooding andto more storm surges. Such theories of increasedhazard are usually tested through global climatechange models. For example, Cheng et al. (2007)examined estimates of the changes to the occurrenceof freezing rain events under future climate scenariosfor south-central Canada and found that theoccurrence of these events could increase by 40–85per cent by 2050. However, all such results aresubject to substantial uncertainties about futuregreenhouse gas emissions. Doubts remain also aboutthe ways in which the climate might behave in thefuture, especially on national scales, although thelatest generation of global climate models isreducing these uncertainties.
Current concerns about global warming canovershadow other recorded types of climate changethat are important for environmental hazards on aregional scale. Such changes include the downturnin rainfall over the Sahel since the 1970s (seeChapter 12) and increases in rainfall over someother regions. For example, a 30-year increase inannual rainfall over much of eastern Australia after1945 led to a marked increase in floods on theRichmond river at Lismore, New South Wales.Figure 14.5 shows that damaging floods, whichstart when the river stage reaches 10 m, occurredon average every two to three years between 1945and 1975 compared to about once every five yearsover the entire 1875–1975 period of record.
Return period (years)
Ga
ug
eh
eig
ht
(me
tre
s)
6.0
1 2 4 6 8 10 20 50 100
15 2102050100
8.0
10.0
1:100 YEAR FLOOD LEVEL
DAMAGE THRESHOLD LEVEL
19
45
–19
75
19
21
–19
76
18
75
–19
75
12.0
14.0
Annual Recurrence Probability (%)
Figure 14.5 Changes in flood frequency for theRichmond river, Lismore, Australia. The increasedfrequency in damaging floods since 1945 is associatedwith a rise in mean annual rainfall. After D. I. Smithet al. (1979).

There is evidence for an observed increase incertain weather extremes during recent decades inmany parts of the world. Some of these increases areconsistent with an association to global warming.For example, Zhang et al. (2007) showed thatprecipitation intensities changed during thetwentieth century and ascribed these changes to theeffects of climate change through a comparison ofthe observed changes with the outcomes of 14different climate simulations. It is not possible,however, to prove that cause and effect relationshipsexist because extreme events and weather-relateddisasters happen comparatively rarely, and manylinkages – especially those between the atmosphereand the oceans – are complex. The statisticalprobability of many extreme natural events is notwell established and any perceived increase inweather stress could be due to atmosphericvariability rather than change. Similarly, someportion – impossible to quantify – of any recent risein weather-related disasters can be attributed toincreases in human exposure and vulnerability tohazard (see Chapter 2). Few workers have so farattempted to detect multi-decadal variations andtrends in extremes and the observed evidence to dateis largely circumstantial, case study in nature andsometimes conflicting.
Severe storms
There has been much interest in the identification ofany trends in severe storm frequency and associateddisasters, whether linked to global warming or not,but the reliable evidence is limited. For example,Changnon and Changnon (1992) examined weatherdisasters in the USA over a 40-year period and foundonly that the incidence was related to spells ofcyclonic activity. More recently, the linkage betweenglobal temperature and tropical cyclone activity hasbeen one of the most contentious areas of climatescience. Opinion remains deeply divided (see alsoChapter 9). The debate began when Emanuel (1987and 2000) suggested that a rise in global sea-surfacetemperatures could result in a 10–20 per centincrease in tropical cyclone wind speeds that, in turn,
could raise the maximum destructive potential ofthese storms by 60 per cent. Emanuel (2005) – andothers – later claimed that there had been a markedincrease in the intensity of hurricanes since the 1970swhich correlated with a rise in sea-surface tem-perature. Various opponents rejected this hypothesis(Pielke et al. (2005), Landsea et al. (2006) andLandsea (2007). Most observers, such as Landsea etal. (1999) and Elsner et al. (2000) believe that theincidence of Atlantic hurricanes is dominated bymulti-decadal variations, rather than any trend,partly because these storms are linked to otherinfluences or teleconnections (like the ENSO, the NAO,African West Sahel rainfall and Atlantic sea-surfacetemperatures).
The situation with respect to intense winterstorms in the northern hemisphere is ratherdifferent. During the twentieth century, atmo-spheric lows with central pressures of 970 mbar, orless, were more numerous over the Atlantic than thePacific Ocean. Before 1970 there was little trendbut, since then, there has been a marked increase inthe number of events that appear, at least for thePacific, to be related to sea-surface temperatures(Lambert, 1996).
Floods and water resources
According to Knox (2000), the geological evidencefor the magnitude and frequency of floods shows asensitivity to past climate changes that was smallerthan the increases expected from global warming inthe twenty-first century. Flood patterns already varysignificantly in response to changing atmosphericconditions. For example, Figure 14.6 shows thatlarge annual floods have became more common since1950 on the upper Mississippi river, USA. Duringthese years, the upper westerly air circulation overthe Midwest had a relatively strong meridionalcomponent leading to marked north-south ex-changes of air masses and higher rainfall. Zonalflows, on the other hand, occur when the upperwesterlies are strong. The persistence of this patternbetween 1920 and 1950 led to a series of low-flowyears and, eventually, to the ‘Dust Bowl’ drought of
CONTEXT HAZARDS 323

THE EXPER IENCE AND REDUCT ION OF HAZARD324
the 1930s. The tropics are vulnerable to futurehydro-climatic changes, notably in the drainagebasins of large, unregulated rivers. For example, over90 per cent of the drainage basin of the Ganges–Meghna–Brahmaputra river system lies upstream of, and beyond the control of, Bangladesh. The floodregime may already be changing since the annualarea of Bangladesh flooded during 1980–99 waslarger, and more variable, than during the period1960–80. Climate change scenarios indicatesubstantial future increases in the peak dischargesof the contributing rivers (Mirza, 2002).
The arid and semi-arid regions of the tropics,already prone to seasonal or longer periods ofdrought, are home to about 350 million people insome of the most poverty-stricken countries onEarth. In 1990, nearly 2 billion people lived incountries using more than 20 per cent of theiravailable water resources – a common indicator ofwater stress. By 2025, this figure will rise to over 5billion as a result of population growth alone whilstthe effects of climate change will increase stresses inNorth Africa, southern Africa, the Middle East, the
Indian sub-continent, central America and largeparts of Europe.
Diseases
AGW is likely to change the risk profile for manyhuman diseases. Globally, the changes will be forthe worse. For example, it will almost certainlyencourage the poleward spread of some importantvector-borne diseases presently restricted to thetropics. On the other hand, on average, about20,000 people die from cold each year in Britain(Kovats 2008). Whilst an exceptional summer heatwave might cause up to 6,000 excess deaths, thewarming climate is likely to lead to a reduction ofmortality during the winter.
The transfer of malaria from mosquitoes tohumans is highly dependent on temperature and ismost effective within the range 15–32°C with arelative humidity of 50–60 per cent (Weihe andMertens, 1991). The largest changes are expected tooccur at the limits of the present-day risk areas. Asa result of global warming, and an extension of
1860 1880 1900 1920 1940 1960 1980 20000
1000
2000
3000
4000
5000
Disc
harg
e(m
3se
c-1)
Year
Figure 14.6 The annual maximum flood series for the upper Mississippi river at St Paul 1893–2002. Drainage basin95,312 km2; mean flood discharge 1,291 m3 sec–1. Large floods were common during the late nineteenth century andespecially since 1950. Adapted from US Geological Survey at http://www.waterdata.usgs.gov/mn/nwis/peak (accessedon 1 August 2003).
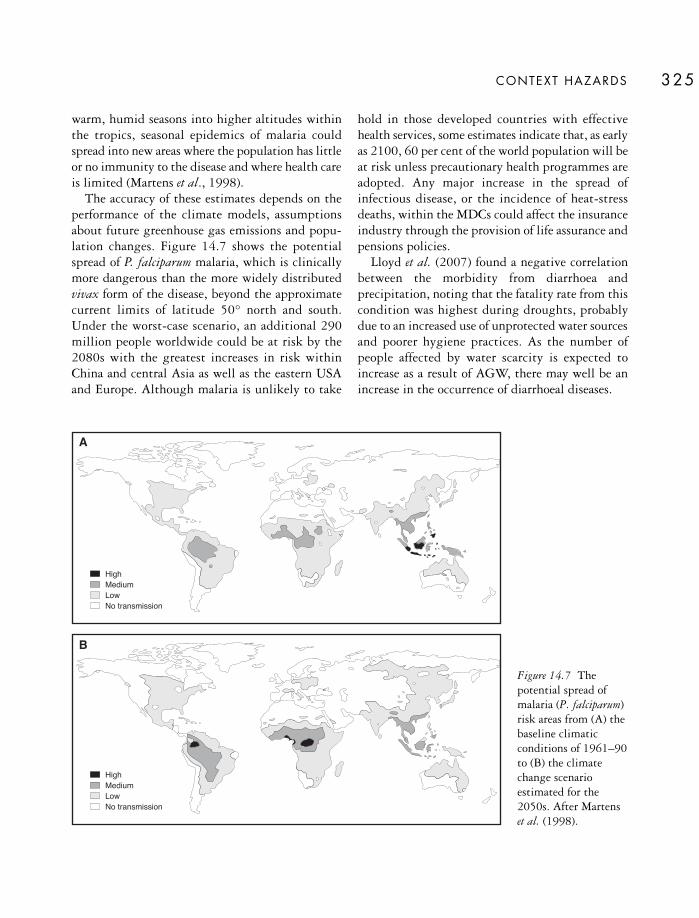
CONTEXT HAZARDS 325
warm, humid seasons into higher altitudes withinthe tropics, seasonal epidemics of malaria couldspread into new areas where the population has littleor no immunity to the disease and where health careis limited (Martens et al., 1998).
The accuracy of these estimates depends on theperformance of the climate models, assumptionsabout future greenhouse gas emissions and popu-lation changes. Figure 14.7 shows the potentialspread of P. falciparum malaria, which is clinicallymore dangerous than the more widely distributedvivax form of the disease, beyond the approximatecurrent limits of latitude 50° north and south.Under the worst-case scenario, an additional 290million people worldwide could be at risk by the2080s with the greatest increases in risk withinChina and central Asia as well as the eastern USAand Europe. Although malaria is unlikely to take
hold in those developed countries with effectivehealth services, some estimates indicate that, as earlyas 2100, 60 per cent of the world population will beat risk unless precautionary health programmes areadopted. Any major increase in the spread ofinfectious disease, or the incidence of heat-stressdeaths, within the MDCs could affect the insuranceindustry through the provision of life assurance andpensions policies.
Lloyd et al. (2007) found a negative correlationbetween the morbidity from diarrhoea andprecipitation, noting that the fatality rate from thiscondition was highest during droughts, probablydue to an increased use of unprotected water sourcesand poorer hygiene practices. As the number ofpeople affected by water scarcity is expected toincrease as a result of AGW, there may well be anincrease in the occurrence of diarrhoeal diseases.
HighMediumLowNo transmission
HighMediumLowNo transmission
A
B
Figure 14.7 Thepotential spread ofmalaria (P. falciparum)risk areas from (A) thebaseline climaticconditions of 1961–90to (B) the climatechange scenarioestimated for the2050s. After Martenset al. (1998).

THE EXPER IENCE AND REDUCT ION OF HAZARD326
Plate 14.1 Part of Southkhali village in the coastal Bagerhat District of Bangladesh. Such low-lying settlementsface many hazards. These range from cyclones and land erosion to the longer-term threats posed by salinisation andrising sea levels. (Photo: Joerg Boethling, STILL PICTURES)
Sea level rise
One of the most certain hazardous outcomes ofglobal warming is a further rise in mean sea-level.This will increase the catastrophe potential of stormsurge hazards for low-lying coastal communities. Asindicated in Chapter 11, over the last 100 years theglobal sea-level has risen by 0.10–0.20 m. Currentprojections suggest additional increases above the1990 level of about 0.2–0.6 m by the 2080s. Thiswill create an extra risk of marine flooding for theone-fifth of the world’s population living within 30km of the sea, especially those in the mega-citiesthat lie on the coast. The calculation of future riskcontains some uncertainties but, without anadaptive human response – such as improved seadefences or a managed retreat from the shoreline –
current estimates indicate that, by the 2080s, sea-level rise could have increased the number of peopleflooded by storm surge in a typical year by five timesover the 1990 total (Nicholls et al., 1999).
Such estimates depend not only on the amount ofsea-level rise itself but also on related assumptionsabout the coastal zone, such as the expectedfrequency of storm surges and the future standardof coastal protection achieved by any adaptiveresponses. If the incidence of storms is assumed toremain constant and the coastal population at riskis assumed to grow at twice the national rate(roughly in line with recent experience), the mainuncertainty lies in the assumptions made about seadefences. Nicholls (1998) presented results for twocases:

• constant protection: where no changes are assumedfrom 1990 levels
• evolving protection: where sea defences are upgradedin line with projected increases in economicgrowth measured by GDP. This latter casemimics historical development but makes noextra allowance for future sea-level rise.
Given these assumptions, Figure 14.8 shows that,with constant protection, the annual number of peopleat risk of flooding increases from 10 million in 1990to 78 million in the 2050s. With evolving protection,the number of people at risk in the 2050s is limitedto 50 million. By the 2080s the numbers at risk willhave increased to about 220 and 100 millionrespectively. Table 14.1 summarises the parts of theworld where most people are likely to be flooded bythe 2080s. These five regions contain more than 90per cent of the potential flood victims, irrespectiveof which flood protection scenario is considered.
These impacts will not occur uniformly aroundthe globe. The most serious problems in terms ofeconomics and human safety lie in the low-lyingcoastal zones with high-density concentrations ofpopulation, such as the delta areas of Egypt and
Bangladesh. Egypt could lose 2 million ha of fertileland, displacing 8–10 million people, whilst inGuyana, South America, a one-metre rise in sea levelwould displace 80 per cent of the population –about 600,000 people – and cost US$ 4 billion(IFRCRCS, 2002). These zones are expensive toprotect because of the long shoreline and the needfor on-going management of the fresh and salinewaters held behind the coastal barriers. However,the greatest relative exposure to increased hazard isfaced by the small island nations, like the Maldives(Indian Ocean) or Fiji (south Pacific Ocean) withvillages only a few metres above the sea. Oneexample is Tuvalu, a country with 10,000 peopleoccupying a string of coral atolls only a few metresabove the sea. As in other small Pacific com-munities, people typically depend on rain-feddrinking water and a narrow range of primaryproducts, but the already poor-quality agriculturalland and the shallow ground water supplies aresuffering salt contamination from the higher sealevels. Investment is limited. So are the options formitigation. There is no money for expensive engin-eered coastal defences and managed retreat from the shoreline is impossible. There is nowhere to goapart from other countries, like Australia or NewZealand. It is possible that a greater degree of inte-gration with the world economy, either export-ledor tourism-led, could provide a larger income streamwhich could fund specific projects such as cycloneshelters and secure water storages.
Changes to patterns of ocean circulation
In the past, sudden and dramatic shifts haveoccurred in the behaviour of the large-scale oceancurrent systems. In particular, there is ampleevidence that former global-scale cold periods havebeen associated with changes to ocean currents (USNational Academy of Sciences, 2002). Most interesttoday is focused upon the thermohaline oceancirculation (THC), an important context feature,and its significance for the Gulf Stream in the NorthAtlantic Ocean (Broecker, 1991). The THC is the
CONTEXT HAZARDS 327
300
200
100
01990 2020s 2050s 2080s
Popu
latio
nat
risk
(mill
ions
) constant flood protectionevolving flood protection
Figure 14.8 Growth in the annual number of people atrisk from coastal flooding due to sea-level rise1990–2080s. The left-hand bar indicates the estimatedchange assuming constant flood protection; the right-hand bar indicates the estimated change assumingevolving flood protection. After Nicholls (1998).

THE EXPER IENCE AND REDUCT ION OF HAZARD328
Table 14.1 The world regions most vulnerable to coastal flooding due to future sea level rise
Region Average annual number of people flooded (millions)
1990 2080s
Constant protection Evolving protection
S. Mediterranean 0.2 13 6West Africa 0.4 36 3East Africa 0.6 33 5South Asia 4.3 98 55South-east Asia 1.7 43 21
Source: After Nicholls et al. (1999)
world-wide ‘conveyor belt’ that transports deepwater around the lower reaches of the world’s oceans(Fig. 14.9). The key link with the North AtlanticDrift is that this surface current is driven by large-scale sinking of very saline and dense water in theNorth Atlantic Ocean. The North Atlantic is highlysaline because it consists of warm surface water(North Atlantic Drift/Gulf Stream) that hastravelled far from the south where relatively highrates of evaporation at the warm water surfaceincrease the salinity. After sinking, the deep waterthen flows southwards and eastwards through theIndian Ocean and wells up in the western Pacific. It
completes the circuit by returning as a surface flowwestward through the Indian Ocean before turningnorthwards to reach the North Atlantic again. Thisconveyor belt of water is of great importance interms of determining how heat is distributed aroundthe Earth’s surface from the tropics to the sub-polarregions. Changes to the ocean currents wouldprofoundly alter this distribution of heat and thusthe ways in which atmospheric systems operate. Itis generally considered that the greatest effectswould occur in the areas bordering the NorthAtlantic and in north-west Europe. Largely due tothe influence of the Gulf Stream, these areas have
CCOO
LL DDC
OL D
WWAA
RRMM
WA
RM
CC OO LL DDC O L D
WW AA RR MMW A R MI n d i a n
O c e a n
P a c i f i c O c e a n
A t l a n t i cA t l a n t i c
O c e a nO c e a n
A t l a n t i c
O c e a n
Figure 14.9 Conceptualview of the oceanic‘conveyor belt’associated with thesinking of cold, saltywater in the NorthAtlantic Ocean.Variations in thestrength of thiscirculation affect sea-surface temperaturesand may influencemajor climatic hazards,such as the frequency ofAtlantic hurricanes andthe duration of droughtin sub-Saharan Africa.After Broecker (1991).

annual mean temperatures about 9°C above theglobal average for their latitude.
Considerable evidence exists for previous abruptclimatic deteriorations affecting north-west Europe.These range from the onset of major glacial episodesfound in the geological record to the 200-year longphase of the Little Ice Age in historic times. Thereis now strong evidence that such downturns may beassociated with changes to ocean current dynamics(Broecker, 2000; Alley 2007). It has been hypo-thesised that the THC has slowed down duringrecent decades (Street-Perrott and Perrott, 1990)whilst Bryden et al. (2005) observed that circula-tion in the North Atlantic slowed by about 30 percent between 1957 and 2004. This is significant as Lund et al. (2006) noted a strong negativecorrelation between the strength of Atlantic Oceancirculation and the occurrence of cool periods. The chances of a complete change in the state of the ocean circulation patterns, which is one doom-laden scenario occasionally promoted in the media,are limited but smaller-scale changes appear to be occurring which may well affect the climatearound the Atlantic Ocean. For example, a reductionin the salinity and density of the North AtlanticOcean could result from the increased rainfallexpected due to the raised atmospheric green-house gas concentrations following AGW. In turn,this would weaken the Gulf Stream mechanism and reduce the poleward transfer of warm water andair.
Transboundary air pollution
Regional-scale air pollution has existed for manyyears but it is only recently that the nature of theprocesses involved has changed and made theproblem an environmental hazard, as defined in thisbook. For example, acid deposition from rainfall wasidentified in the nineteenth century as a localproblem associated with nearby industrial sources.But, by the mid-1960s, a trend to precipitationwith an acidity of pH 4.5 (or less) was recorded overlarge areas of north-western Europe and parts ofnorth-eastern North America. In Sweden and
elsewhere, diatom analysis of lake sediment coresconfirmed a longer-term trend to acidity. Aciddeposition in rural areas far removed from pollutionsources can be explained only by the transport ofoxides of sulphur and nitrogen from industrialsources hundreds of kilometres away. Althoughthese processes raised concern about rural eco-systems it was not until the Chernobyl incident thattransboundary pollution was fully recognised as anenvironmental hazard.
Biomass fires
The smoke pollution created by the 1997–98 firesin Indonesia spread over south-east Asia andinteracted with the seasonal monsoon circulation toaffect the region in different ways (Koe et al., 2001).These fires were often reported as the result ofburning of forests but, in reality, they were mostlycaused by fires within drained swamp vegetation.Over 31,500 fires burned during this period,destroying over 9 million hectares of land (Stolle andTomich 1999). Direct fire-related deaths wereestimated at 1,000. Throughout the region, over 20million people were exposed to extremely highlevels of pollutants known to cause ill-health andabout 40,000 people were treated in hospital for theeffects of smoke inhalation (IFRCRCS, 1999). Totaldirect economic losses were estimated at aroundUS$9.3 billion.
Such fires create regional-scale impacts but arealso of global significance. The clearance of forestsand other vegetation is driven by world-wide eco-nomic forces and the fires are major sources of thegreenhouse gas emissions which contribute toanthropogenic global warming. Under politicalpressure from neighbouring countries, an Agree-ment on Transboundary Haze Pollution was signedin June 2002 by the Association of South-East AsianNations (ASEAN) to prevent future incidents basedon the enhancement of fire fighting ability andcollaboration and the use of an early warning systemto detect emerging fires from satellite imagery.Unfortunately, Indonesia did not sign that agree-ment, and serious fires broke out again in 2006,
CONTEXT HAZARDS 329

when more than 40,000 fires were observed. In theaftermath of the 2006 events, Indonesia vowed tosign the ASEAN agreement, but the effectiveness ofsuch actions remains to be seen.
The Asian brown cloud
The rush to economic development in many LDCshas led to unprecedented emissions of air pollutionthat is no longer confined to a local scale. Thisprocess is most marked in Asia, home to 60 per centof the world’s population, where air pollution hasbecome a complex environmental issue linked toregional haze, smog, ozone depletion and globalwarming (UNEP and C4, 2002). The most obvioussign of the pollution is a brown layer of air overlyinglarge parts of the region from Pakistan to China. Ithas been estimated that anthropogenic sources areresponsible for three-quarters of the observed hazelayer, which is up to 3 km deep, through a com-bination of biomass burning and industrial sources.The reason is that, although the per capita con-sumption of fossil fuel in the region is still low bythe standards of many Western countries, the emis-sions of gaseous pollutants (like carbon monoxide)and particulate (aerosol) matter are higher andgrowing much faster. Biomass burning includesforest fires and the burning of agricultural wasteswhile fossil fuel emissions come mainly from roadvehicles, industry, power stations and inefficientdomestic cookers.
The haze layer reduces the amount of sunlight andsolar energy received at the earth’s surface by 10–15 per cent during the winter monsoon(December to April), although the heat-absorbingproperties of the aerosols lead to a warming of thelower atmosphere. Overall, there is likely to be areduction in evaporation, especially over the oceansurfaces. Such changes are predicted to change theregional climate and hydrology on a scale equivalentto that arising from global warming forces and also affect environmental hazards. For example, anobserved downward trend in Asian rainfall overseveral decades may already reflect reduced evapora-tion and its contribution to summer precipitation
(Fu et al., 1998). Xu (2001) noted a southwardmigration of the summer monsoon rain belt overeastern China since the late 1970s. This has led tomore frequent drought in the north and morefrequent floods in the south, a trend that may beexplained by the increased air pollution caused byaccelerated industrialisation in the area. Ramanathan(2007) suggested that warming in the Himalayasassociated with the Asian brown cloud might beresponsible for the alarmingly rapid rate of retreat ofglaciers in the high mountains. The effects may notbe limited to Asia alone. For example, Rotstayn(2007) presented evidence that the Asian browncloud is now affecting cloudiness and precipitationpatterns in Australia.
Perhaps of the greatest immediate concern is thepotential short- to medium-term health impacts,especially in relation to respiratory diseases. SeveralAsian megacities (Beijing, Delhi, Jakarta, Calcuttaand Mumbai) already exceed WHO standards forsuspended particulate matter and sulphur dioxidein the atmosphere and increases in the concentrationof these pollutants seem certain to cause furtherimpacts.
RARE HAZARDS
Rare hazards are very low frequency events thatinvolve massive releases of energy and materials atthe Earth’s surface. They are usually associated witheither a very intense volcanic event or the impact ofa large object from space. Some of these events aresufficiently large to immediately induce majorchanges to the fluid envelopes of air and water thatcloak the Earth, leading to super environmentalhazards in the form of climate change or tsunamiwaves. The geological record provides evidence ofsuch globally significant catastrophic hazards. Onrare occasions, they have led to ‘mass extinctions’ oflife on Earth. The most extreme of these occurred251 million years ago at the boundary between twoof the great geological periods, the Permian and theTriassic. Fossil evidence suggests that this eventkilled 96 per cent of all marine species and 70 per
THE EXPER IENCE AND REDUCT ION OF HAZARD330

cent of all land species (including plants, insects andvertebrate animals).
Popular explanations for these extinction eventstend to focus on large impacts from objects fromspace. Perhaps the most commonly cited example ofthis is the K/T extinction that occurred 65 millionyears ago at the boundary between the Cretaceousand Tertiary periods, which destroyed more thanhalf the species on Earth. However, this is the onlysuch episode that can be definitively linked to suchan impact, and even then there is at least someevidence that the mass fatalities did not coincidedirectly with the impact event.
Volcanic eruptions and climate
The largest magnitude explosive volcanic eruptionscan affect regional and global climates. To have suchinfluence, the eruption has to emit great volumes ofdebris into the lower stratosphere, some 20–25 kmabove the Earth’s surface, so that a ‘dust veil’ formsover the planet. The maximum impact is achievedby eruptions in lower latitudes. For example, afterthe 1883 eruption of Krakatau (Indonesia), an
aerosol cloud spread round the globe within twoweeks. As shown in Table 14.2, the effects caninfluence weather and climate on many timescales,ranging from single days (by reducing the diurnaltemperature cycle) to up to 100 years when a seriesof volcanic eruptions raises the mean optical depthof the atmosphere sufficiently to cause decadal-scalecooling. Important associated changes in atmo-spheric chemistry, especially ozone depletion, canalso occur.
The main direct effect is the net cooling of theEarth’s surface due to the back-scattering ofincoming short-wave radiation (Robock, 2000).But, just as the surface cools, so the stratosphere isheated by the absorption of near-infra-red solarradiation at the top of the dust layer and theincreased absorption of terrestrial radiation at thebottom of the veil. A large eruption can producehemispheric or global cooling for two to three years.For example, after the 1815 eruption of Tambora(Indonesia), with a VEI of 7, 1816 was called ‘theyear without a summer’ throughout the northernhemisphere. More recently, the eruption of Pinatuboin 1991 lowered surface air temperatures in parts of
CONTEXT HAZARDS 331
Table 14.2 The effects of large explosive volcanic eruptions on weather and climate
Effect Mechanism Begins Duration
Reduction of diurnal cycle Blockage of short wave and emission Immediately 1–4 daysof long wave radiation
Reduced tropical precipitation Blockage of short wave radiation, 1–3 months 3–6 monthsreduced evaporation
Summer cooling of N hemisphere Blockage of short wave radiation 1–3 months 1–2 yearstropics and sub-tropics
Stratospheric warming Stratospheric absorption of short wave 1–3 months 1–2 yearsand long wave radiation
Winter warming of N hemisphere Stratospheric absorption of short wave 6 months 1 or 2 winterscontinents and long wave radiation, dynamics
Global cooling Blockage of short wave radiation Immediately 1–3 years
Global cooling from multiple eruptions Blockage of short wave radiation Immediately 10–100 years
Ozone depletion, enhanced UV Dilution, heterogenous chemistry 1 day 1–2 yearson aerosols
Source: After Robock (2000). Reproduced by permission of American Geophysical Union.
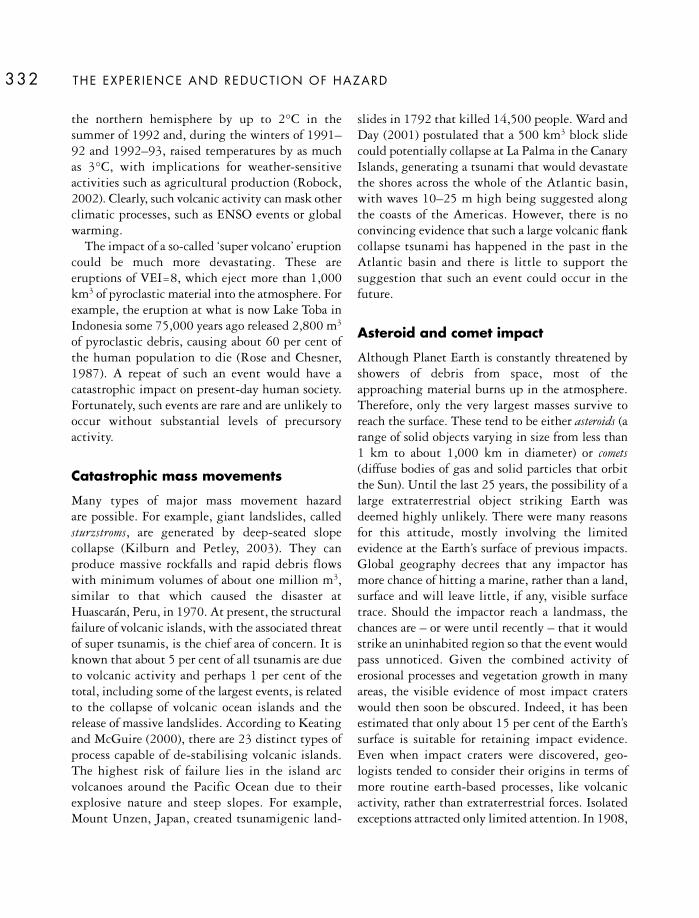
the northern hemisphere by up to 2°C in thesummer of 1992 and, during the winters of 1991–92 and 1992–93, raised temperatures by as much as 3°C, with implications for weather-sensitiveactivities such as agricultural production (Robock,2002). Clearly, such volcanic activity can mask otherclimatic processes, such as ENSO events or globalwarming.
The impact of a so-called ‘super volcano’ eruptioncould be much more devastating. These areeruptions of VEI=8, which eject more than 1,000km3 of pyroclastic material into the atmosphere. Forexample, the eruption at what is now Lake Toba inIndonesia some 75,000 years ago released 2,800 m3
of pyroclastic debris, causing about 60 per cent ofthe human population to die (Rose and Chesner,1987). A repeat of such an event would have acatastrophic impact on present-day human society.Fortunately, such events are rare and are unlikely tooccur without substantial levels of precursoryactivity.
Catastrophic mass movements
Many types of major mass movement hazard are possible. For example, giant landslides, calledsturzstroms, are generated by deep-seated slopecollapse (Kilburn and Petley, 2003). They canproduce massive rockfalls and rapid debris flowswith minimum volumes of about one million m3,similar to that which caused the disaster atHuascarán, Peru, in 1970. At present, the structuralfailure of volcanic islands, with the associated threatof super tsunamis, is the chief area of concern. It isknown that about 5 per cent of all tsunamis are dueto volcanic activity and perhaps 1 per cent of thetotal, including some of the largest events, is relatedto the collapse of volcanic ocean islands and therelease of massive landslides. According to Keatingand McGuire (2000), there are 23 distinct types ofprocess capable of de-stabilising volcanic islands.The highest risk of failure lies in the island arcvolcanoes around the Pacific Ocean due to theirexplosive nature and steep slopes. For example,Mount Unzen, Japan, created tsunamigenic land-
slides in 1792 that killed 14,500 people. Ward andDay (2001) postulated that a 500 km3 block slidecould potentially collapse at La Palma in the CanaryIslands, generating a tsunami that would devastatethe shores across the whole of the Atlantic basin,with waves 10–25 m high being suggested alongthe coasts of the Americas. However, there is noconvincing evidence that such a large volcanic flankcollapse tsunami has happened in the past in theAtlantic basin and there is little to support thesuggestion that such an event could occur in thefuture.
Asteroid and comet impact
Although Planet Earth is constantly threatened byshowers of debris from space, most of theapproaching material burns up in the atmosphere.Therefore, only the very largest masses survive toreach the surface. These tend to be either asteroids (arange of solid objects varying in size from less than1 km to about 1,000 km in diameter) or comets(diffuse bodies of gas and solid particles that orbitthe Sun). Until the last 25 years, the possibility of alarge extraterrestrial object striking Earth wasdeemed highly unlikely. There were many reasonsfor this attitude, mostly involving the limitedevidence at the Earth’s surface of previous impacts.Global geography decrees that any impactor hasmore chance of hitting a marine, rather than a land,surface and will leave little, if any, visible surfacetrace. Should the impactor reach a landmass, thechances are – or were until recently – that it wouldstrike an uninhabited region so that the event wouldpass unnoticed. Given the combined activity oferosional processes and vegetation growth in manyareas, the visible evidence of most impact craterswould then soon be obscured. Indeed, it has beenestimated that only about 15 per cent of the Earth’ssurface is suitable for retaining impact evidence.Even when impact craters were discovered, geo-logists tended to consider their origins in terms ofmore routine earth-based processes, like volcanicactivity, rather than extraterrestrial forces. Isolatedexceptions attracted only limited attention. In 1908,
THE EXPER IENCE AND REDUCT ION OF HAZARD332
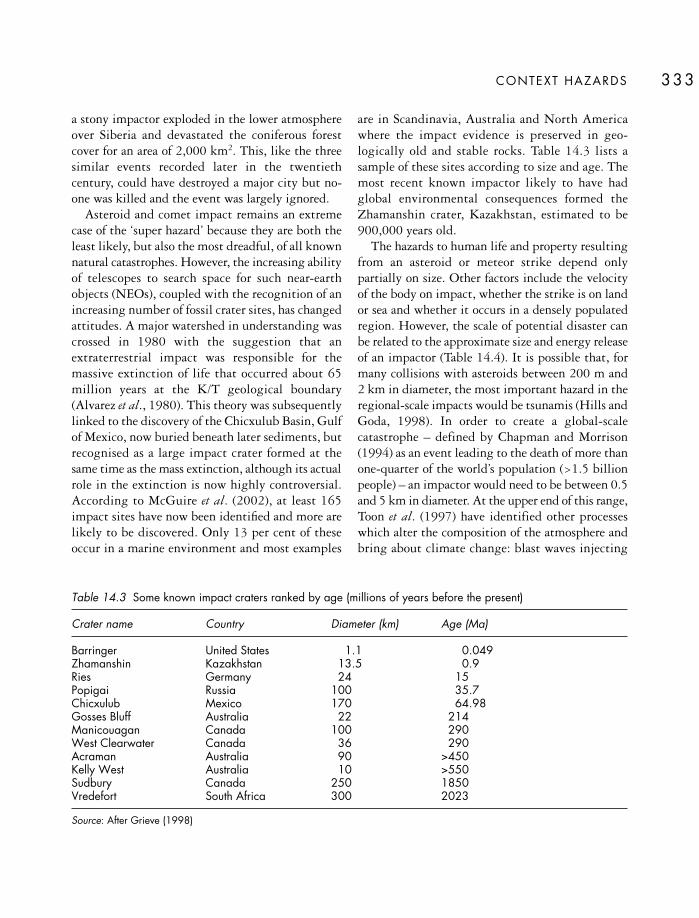
a stony impactor exploded in the lower atmosphereover Siberia and devastated the coniferous forestcover for an area of 2,000 km2. This, like the threesimilar events recorded later in the twentiethcentury, could have destroyed a major city but no-one was killed and the event was largely ignored.
Asteroid and comet impact remains an extremecase of the ‘super hazard’ because they are both theleast likely, but also the most dreadful, of all knownnatural catastrophes. However, the increasing abilityof telescopes to search space for such near-earthobjects (NEOs), coupled with the recognition of anincreasing number of fossil crater sites, has changedattitudes. A major watershed in understanding wascrossed in 1980 with the suggestion that anextraterrestrial impact was responsible for themassive extinction of life that occurred about 65million years at the K/T geological boundary(Alvarez et al., 1980). This theory was subsequentlylinked to the discovery of the Chicxulub Basin, Gulfof Mexico, now buried beneath later sediments, butrecognised as a large impact crater formed at thesame time as the mass extinction, although its actualrole in the extinction is now highly controversial.According to McGuire et al. (2002), at least 165impact sites have now been identified and more arelikely to be discovered. Only 13 per cent of theseoccur in a marine environment and most examples
are in Scandinavia, Australia and North Americawhere the impact evidence is preserved in geo-logically old and stable rocks. Table 14.3 lists asample of these sites according to size and age. Themost recent known impactor likely to have hadglobal environmental consequences formed theZhamanshin crater, Kazakhstan, estimated to be900,000 years old.
The hazards to human life and property resultingfrom an asteroid or meteor strike depend onlypartially on size. Other factors include the velocityof the body on impact, whether the strike is on landor sea and whether it occurs in a densely populatedregion. However, the scale of potential disaster canbe related to the approximate size and energy releaseof an impactor (Table 14.4). It is possible that, formany collisions with asteroids between 200 m and2 km in diameter, the most important hazard in theregional-scale impacts would be tsunamis (Hills andGoda, 1998). In order to create a global-scalecatastrophe – defined by Chapman and Morrison(1994) as an event leading to the death of more thanone-quarter of the world’s population (>1.5 billionpeople) – an impactor would need to be between 0.5and 5 km in diameter. At the upper end of this range,Toon et al. (1997) have identified other processeswhich alter the composition of the atmosphere andbring about climate change: blast waves injecting
CONTEXT HAZARDS 333
Table 14.3 Some known impact craters ranked by age (millions of years before the present)
Crater name Country Diameter (km) Age (Ma)
Barringer United States 1.1 0.049Zhamanshin Kazakhstan 13.5 0.9Ries Germany 24 15Popigai Russia 100 35.7Chicxulub Mexico 170 64.98Gosses Bluff Australia 22 214Manicouagan Canada 100 290West Clearwater Canada 36 290Acraman Australia 90 >450Kelly West Australia 10 >550Sudbury Canada 250 1850Vredefort South Africa 300 2023
Source: After Grieve (1998)

dust and water into the atmosphere, soot productionfrom burning forests, acid rain and ozone depletion.Under these conditions, most of the world’s popu-lation would probably die within the ensuingmonths or years.
According to the UK Task Force (2000), apotential hazard exists if a NEO at least 150 m indiameter is on an orbit that will bring it within 7.5million km of the Earth. The risk of impact fromcomets is assessed at 10–30 per cent of that for
asteroids. These hazards can be accommodated, atleast partially, into conventional disaster manage-ment strategies. Forecasting and warning is cer-tainly possible. For example, a lead time of 250–500days between detection and impact has been givenfor long-period comets (Marsden and Steel, 1994)while the period for asteroids might extend todecades or centuries. The real problems surroundthe NEOs that are not detected as soon as possibleand the uncertainties about practical disaster
THE EXPER IENCE AND REDUCT ION OF HAZARD334
Table 14.4 The likely energy release, environmental effects and possible fatality rates for different scales ofextraterrestrial impacts on Earth
Approximate Diameter Energy (Mt) Frequency Environmental effects Deathsscale of impact of impactor (years)
Tunguska-scale 50–300 m 9–2000 250 Regional catastrophe – many deaths 5 3 103
event in devastated urban areas the size of Tokyo or New York, major tsunamis created if an ocean impact occurs
Large sub- 300–600 m 2000– 35 3 103 Regional catastrophe – land impact 3 3 105
global event 1.5 3 104 destroys an area the size of Estonia,large impact blast, earthquakes, regional fires over 104–105 km2,large tsunamis reach 1 km inland
Nominal > 1.5 km 2 3 105 5 3 105 Global catastrophe – land impacts 1.5 3 109
global threshold destroy an area the size of France, impact dust and soot from fires alter optical depth of atmosphere, prolonged cooling of atmosphere, possible loss of ozone shield
High global >5 km 107 6 3 106 Global catastrophe – land impact 1.5 3 109
threshold destroys an area the size of India, high concentrations of dust and sulphate levels reduce sunlight and photosynthesis ceases, vision becomes difficult, ecosystem destruction
Rare K/T-scale >10 km 108 108 Global catastrophe – land 5 3 109
events destruction approaches continental scale, major earthquakes, global fires on land, 100m high tsunami waves reach 20 km inland, human vision ceases, all advanced life forms at risk
Source: Adapted from Chapman and Morrison (1994) and Toon et al. (1997)

reduction measures. The problems of detection withexisting search telescopes could be overcome by thedeployment of larger, wide-angled telescopes dedi-cated to whole-sky observation. The NASA Space-guard Survey, which has been operational since1995, seeks to identify 90 per cent of NEOs greaterthan 1 km by the end of 2008. To date, none havebeen found to have an orbit that would lead to animpact with the earth. If such an object werelocated, appropriate measures would need to betaken. For the smaller-scale threats, it might bepossible to evacuate people either from the likelyarea of impact or from low-lying coastal zones at riskfrom tsunami waves. For large regional and global-scale threats the only option would be to avert thepredicted collision. Suggestions have been madeabout the development of a defence system whichcould target dangerous NEOs with nuclear explo-sives, with a yield of more than 1 Mt, in order todeflect, fracture or fragment the largest bodies(Simonenko et al., 1994). However, fragmentedparticles could still provide a risk. An alternativestrategy might be to fly a space vehicle alongside theobject – perhaps for months or years – and use muchsmaller explosions, or other means, to steer the NEOinto a new, safe orbit.
However, in recent years the interest in NEOhazards has declined, and there seems to be littleprospect of a coordinated international effort tomitigate this threat. It appears that the magnitudeof concerns about anthropogenic climate change isso great that there is little scope in the internationalcommunity for worries about other global scalehazards.
KEY READING
Huppert, H. E and Sparks, S. J. (2006) Extremenatural hazards: population growth, globalizationand environmental change. Philosophical Transactionsof the Royal Society A: Mathematical, Physical andEngineering Sciences 364: 1875–88.
Kininmonth, W. (2003) Climate Change: A NaturalHazard. Energy & Environment, 14: 215–32.
McGuire, W. J. (2006) Global risk from extremegeophysical events: threat identification and assess-ment. Philosophical Transactions of the Royal Society A:Mathematical, Physical and Engineering Sciences 364:1889–1909.
Morrison, D. (2006) Asteroid and comet impacts:the ultimate environmental catastrophe. PhilosophicalTransactions of the Royal Society A: Mathematical,Physical and Engineering Sciences 364: 2041–54.
Trenberth, K. (2007) Climate change: Warmeroceans, stronger hurricanes. Scientific American 297:44–51.
WEB L INKS
Intergovernmental Panel on Climate Changehttp://www.ipcc.ch/
World Meteorological Organisation http://www.wmo.ch/pages/index_en.html
International Strategy for Disaster Reduction http://www.unisdr.org/
NOAA El Niño page http://www.elnino.noaa.gov/
World Health Organisation information on El Niñoand human health http://www.who.int/mediacentre/factsheets/fs192/en/
National Oceanographic Data Center naturalhazards page http://www.nodc.noaa.gov/General/Oceanthemes/hazards.html
The Spaceguard Foundation http://spaceguard.esa.int/
The earth impact database http://www.unb.ca/passc/ImpactDatabase/index.html
CONTEXT HAZARDS 335

TOWARDS A NEW CONSENSUS ONENVIRONMENTAL HAZARDS?
As the twentieth century drew to a close, theenvironmental hazards research community beganto express a growing concern that the modern worldwas not taking the threats posed by rare and large-scale hazardous events seriously enough. Thisconcern ranged across almost all the hazard types toinclude windstorms, floods, volcanic eruptions,epidemics and earthquakes. It applied equally to themost developed economies, which are highlyvulnerable to massive economic dislocation, and tothe least developed economies, in which the livesand livelihoods of millions of people are threatened.In this context, the first decade of the new centuryhas already proved remarkable. The combined lossesfrom the SARS outbreak in Asia, the Boxing Daytsunami in the Indian Ocean, ‘Hurricane Katrina’in the USA and the Kashmir earthquake in Pakistanand India convincingly illustrated the globalconsequences of major disasters and gave unpre-cedented publicity to these emerging academicconcerns.
Of the recent events, the Asian tsunami and‘Hurricane Katrina’ have probably had the greatestinfluence on current thought. The tsunami high-lighted the tragic vulnerability of poor people and
also the extraordinary impact that a hazard can haveon communities situated thousands of kilometresaway from the source of the event. The fact that thedisaster occurred at Christmas time, when therewere thousands of European tourists armed withvideo cameras and mobile phones on the affectedbeaches, magnified the media coverage. The impactof ‘Hurricane Katrina’, a few months later, has alsobeen extraordinary. That a city as well-known asNew Orleans, located in the world’s richest country,could be so damaged by a natural event clearly cameas a shock to most people, including the authorities.This was famously demonstrated by the commentmade by President George Bush to Michael Brown,then the director of FEMA, as the city lay devastatedand largely helpless – ‘Brownie, you’re doing a heckof a job’. Michael Brown resigned a few days later.Until ‘Katrina’, there appeared to be a prevailingsense of complacency about the resilience of moderncities in the MDCs to environmental hazards, basedon a widely-held view that urban areas wouldquickly bounce back from the impact of a disaster.That myth has been truly dispelled.
Both ‘Hurricane Katrina’ and the Indian Oceantsunami were clearly major disasters in everydefinition of the term. Indeed, it has been suggestedthat they were sufficiently significant to herald anew dawn in the perception of environmental
15
POSTSCRIPT

hazards and the priority given to practical disasterreduction. Perhaps more than ever before, the timeis ripe for a paradigm shift in our approach toenvironmental hazards. But, is the reality likely tosupport this view?
Undoubtedly, the level of hazard awareness andpractical interest in disaster reduction has increased.Many governments and organisations have maderenewed commitments to these goals. For example,the amount of funding into hazards research – inEurope at least – has been raised and there appearsto be a fresh appetite for international disasterreduction initiatives. In the aftermath of the IndianOcean tsunami, in particular, over US$13.5 billionwas committed by the international communitytowards aid and redevelopment projects (Telford etal. 2006). Perhaps surprisingly, the vast majority ofthis resource has already been spent as the donorsintended. On the other hand, despite these recentdevelopments, the emerging challenges for disasterreduction remain severe. Unless these issues aresatisfactorily resolved, it is likely that the futuredisaster toll across the globe will rise.
KEY CHALLENGES IN DISASTERRISK REDUCTION
Population growth
Perhaps the key challenge confronting effectivedisaster risk reduction is that of global populationgrowth. At the time of writing, in early 2008, theworld population is estimated to be about 6.7billion people (UNFPA, 2007). By 2050, this ispredicted to rise by a further 2.2 billion. Most of theincrease is expected to occur in less developedcountries, particularly in Africa. The consequencesof this increase are serious. Not only will thepresence of more people lead to greater humanexposure to risk and more potential disaster victimsbut the extra numbers will place further pressureson already scarce resources, like land, water, foodand fuel. For example, it is likely that increasinglymarginal – and often more hazardous – land willneed to be cultivated and settled.
Much of the expected growth in population willoccur in urban areas. For the first time in humanhistory, more than half of the global populationalready lives in urban areas. In 2007 there were anestimated 470 cities of more than 1 million people,most of which were in the LDCs. Within this total,there are some 24 cities each with a population of atleast 10 million; about two-thirds of these are in theLDCs. This urbanising trend will continue. By theyear 2020, about 30 per cent of the global popu-lation will live in large cities. Asia alone is expectedto have ten cities with populations of over 20million people by 2025. Most of these people willlive in urban slums, perhaps over 2 billion of themby 2030 (UNFPA, 2007). As explained by Mitchell(1999), this implies not only a more concentratedexposure to natural hazards but also the risk of moretechnological and ‘hybrid’ disasters due to air andwater pollution, fire, infectious disease and transportaccidents.
An associated problem is the rapid expansion inthe material assets at risk from disasters. It has beenwell-established that, in the LDCs, the main impactof disasters is the loss of life, whilst in the moredeveloped countries it is economic loss. However,the rapid development of some Asian economies –which tends to be concentrated in cities such asShanghai – is creating a new mix of high-valueeconomic assets and highly vulnerable poor people,many of whom live in poorly constructed buildingson the edge of the new economic centres. The globalrisk has never been higher of a disaster that causesthe loss of tens, and maybe even hundreds, ofthousands of lives as well as tens, or maybe evenhundreds, of billions of dollars of economic losses.
Food and fuel scarcity
It is too easy to ascribe global food scarcity directlyto a growth in world population. Food availabilityis a complex issue and there is a concern that theworld is heading for a so-called ‘perfect storm’. This‘storm’ will be driven by the combined, andinteractive, effects of rising demands for fuel,changing climates and increasing affluence, as well
POSTSCRIPT 337

as population growth. The negative impact of suchpressures on food availability and fuel supply willbe felt most acutely in less developed countries. The‘perfect storm’ scenario envisages a sudden dramaticdevelopment of the Chinese and Indian economiesleading to an increased demand for food, fuel andother resources. The emergence of a new middleclass in such countries has already created a markedincrease in the consumption of many commodities.These increased demands will raise commodityprices and, for example, global food prices increasedby 75 per cent in real terms between 2000 and early2008 (ODI, 2008). Furthermore, the combinedeffect of uncertainties about climate change impactsand the demand for oil to feed the booming eco-nomies has led to mistaken decisions wherebyagriculturally productive land has been allocated tothe generation of biofuels.
Although basic issues of food and fuel scarcity liebeyond the scope of this book, a marked decline inaccess to food is likely to influence longer-termvulnerability to environmental hazards. This isbecause greater poverty or malnourishment willreduce community resilience to most naturalhazards. At the time of writing, it seems that theseproblems are destined to outweigh any futureimprovements in the human condition arising fromdeliberate economic measures – such as debt relief– or international political aims – such as thosespecified in the Millennium Development Goals.
Anthropogenic global warming
The potential impacts of human-induced climatechange are rarely out of the news but remaincontroversial in the popular press. Within thescience community, the number of global scepticsis now small, although they continue to play avociferous role in the debate. Fortunately, politiciansappear to be understanding the message on climatechange that is being put over by most crediblescientists and there are signs of global action tomitigate some of the worst effects. However, themove towards a greener, less polluting society issufficiently slow in both the MDCs and the LDCs
to make certain impacts of climate changeinevitable. Although the future behaviour ofparticular hazards, such as hurricanes, remainsuncertain, it is very likely that a warmer, and moreenergetic, atmosphere will lead to an increase inhazardous events. There is a need for Westernsocieties, in particular, to face up to the adaptationsrequired in order to mitigate climate change, eventhough that process will be painful in most cases.
REASONS FOR OPTIMISM
Notwithstanding the challenges outlined above,there are reasons to be optimistic about the future.In a number of areas, new developments are creatingopportunities for the better anticipation of hazardsand the improved management of their impacts.The most important developments are listed below.
A developing sense of interdisciplinarity
The parallel existence of differing paradigms ofhazard and disaster, described in Chapter 1, hascreated a wasteful divide between natural and socialscientists for many years. Today, the emergence of theComplexity paradigm, illustrated in Chapter 3, isbreaking down some of these barriers and facilitat-ing more inter-disciplinary approaches to hazardmanagement. For example, Hayes (2004) demon-strated how an integrated approach to flood risk inthe USA could achieve the required level of flood riskreduction in a residential area at less than half theestimated costs of conventional river engineering.International evidence of cross-subject cooperationcan be seen in the development of the new IndianOcean tsunami warning system (Normile, 2007).Such cooperation depends on a broadening ofsubject-bound mind-sets in order to gain freshinsights into old problems. For natural scientists,there is a need to recognise the benefits provided bysocial scientists. In some cases, there will be a needto learn a new vocabulary. Equally, social scientistsmust accept that engineering interventions have
THE EXPER IENCE AND REDUCT ION OF HAZARD338
proven to be successful more often than not, aswitnessed by the progressive reduction in fatalitiesfrom natural hazards in more developed countries.Sometimes, an engineering response is the only onepossible. As inter-disciplinary collaboration grows,so will the quantitative evidence that non-engineeredhazard reduction measures can work and be be cost-effective.
New international initiatives
The recent past has been characterised by a stronginternational rhetoric regarding the need for actionon environmental hazards coupled with adisappointing lack of progress. The most notableinitiative was the International Decade for NaturalDisaster Reduction (IDNDR), which ran for 10 yearsfrom 1 January 1990 to 31 December 1999. Thebasic aim of the IDNDR was to shift natural disastermanagement from a reactive strategy that reliedmainly upon emergency aid to a more pro-activeapproach rooted in pre-disaster planning andpreparedness.
As the IDNDR progressed, it attracted criticismsabout the undue reliance on hazard-mitigatingtechnologies at the expense of the social, economicand political dimensions of disasters. Some of theseweaknesses were recognised during a mid-pointreview of the programme and there was a lateremphasis on more integrated approaches to disasterreduction. The follow-on UN programme, theInternational Strategy for Disaster Reduction (ISDR), hascontinued this ethos with greater effectiveness.Perhaps the best example of this to date was theadoption, in 2005, of the Hyogo Framework for Action,which aims to improve the resilience of buildings todisasters within nations and communities. Thedetermination to implement this Framework is a realcause for optimism. Other ISDR programmes thatcan be cited include the International Charter forDisasters and Space, which seeks to provide emergencyaccess to satellite imagery in the aftermath ofdisastrous events and the Global Platform for DisasterRisk Reduction, which seeks to facilitate informationsharing between international stakeholders.
The culture of anticipation and mitigation
Most important, there now appears to be a genuineacceptance of the need to anticipate and preventdisasters, rather than react to them. This culture isreflected in the shape of the ISDR but goes muchdeeper than that. It stems from a general recognitionthat the rush to modernisation has frequently led toa loss of connection between local people and theirenvironment. Whilst this is most evident in thehighly urbanised, developed countries, it is also truefor many rural communities in the LDCs. Forexample, Petley et al. (2007) ascribed increases in the occurrence of landslide fatalities in theHimalayas, in part, to this loss of community con-nections with their environmental roots.
Any improvements in the connectivity betweenpeople and their environment depends on assistingall communities exposed to risk to develop theirown hazard-reducing capabilities and local self-reliance following disaster. This is not always an easytask because it depends, to some extent, on externalinputs. For example, the construction of rural roadsin landslide-prone terrain is doomed to failure if no provision is made for the use of appropriateengineering measures. Once again, there is a needfor integrated approaches in which sensitive externalassistance is deployed to help build communityskills for the anticipation of hazards and the miti-gation of their impact.
WEB L INKS
UNESCO/IOC global tsunami website http://www.ioc-tsunami.org/ http://www.unisdr.org/
International Strategy for Disaster Reduction http://www.unisdr.org/eng/hfa/hfa.htm
The Hyogo Framework http://www.preventionweb.net/globalplatform/ The Global Platform forDisaster Risk Reduction
POSTSCRIPT 339

Abersten, L. (1984) Diversion of a lava flow from itsnatural bed to an artificial channel with the aid ofexplosives: Etna, 1983. Bulletin of Volcanology 47:1165–74.
Abrahams, J. (2001) Disaster management inAustralia: The national emergency managementsystem. Emergency Medicine 13: 165–73.
Adams, J., Maslin, M. and Thomas, E. (1999)Sudden climate transitions during the Quaternary.Progress in Physical Geography 23: 1–36.
Adams, W. C. (1986) Whose lives count? TVcoverage of natural disasters. Journal of Communication36: 113–22.
Adams, W. M. (1993) Indigenous use of wetlandsand sustainable development in West Africa.Geographical Journal 159: 209–18.
Adger, W. N., Hughes, T. P., Folke, C., Carpenter,S. R. and Rockström, J. (2005) Social-ecologicalresilience to coastal disasters. Science 309: 1036–39.
Ahmadizadeh, M. and Shakib, H. (2004) On theDecember 26 2003 south-eastern Iran earthquakein Bam region. Engineering Structures 26: 1055–70.
Aini, M. S., Fakhru’l-Razi, A., Daud, M., Adam, N. M. and Kadir, R. A. (2005) Analysis of royalinquiry report on the collapse of a building in Kuala
Lumpur. Disaster Prevention and Management 14:55–79.
Akbari, M. E., Farshad, A. A. and Asadi-Lari, M.(2004) The devastation of Bam: an overview ofhealth issues one month after the earthquake. PublicHealth 18: 403–8.
Alexander, D. (1987) The 1982 Urban LandslideDisaster at Ancona, Italy. Working Paper 57. Boulder,CO: Institute of Behavioral Science, University ofColorado.
Alexander, D. (1993) Natural Disasters. London:UCL Press Limited.
Alexander, D. (1997) The study of natural disasters1977–1997: some reflections on a changing field ofknowledge. Disasters 21: 284–304.
Alexander, D. (2000) Confronting Catastrophe: NewPerspectives on Natural Disasters. Harpenden: TerraPublishing.
Allan, R., Lindesay, J. and Parker, D. (1996) The ElNiño-Southern Oscillation and Climatic Vulnerability.Collingwood, Victoria: CSIRO Publishing.
Alley, R. B. (2007) Wally was right: predictiveability of the North Atlantic ‘conveyor belt’hypothesis for abrupt climate change. Annual Reviewof Earth and Planetary Sciences 35: 241–72.
B IBL IOGRAPHY

Alvarez, L., Alvarez, W., Asaro, F. and Michel, H. V.(1980) Extra-terrestrial cause for the Cretaceous-Tertiary extinction. Science 208: 1095–108.
Angeli, M-G., Gasparetto, P., Menotti, R. M.,Pasuto, A. and Silvano, S. (1994) A system ofmonitoring and warning in a complex landslide innorth-eastern Italy. Landslide News 8: 12–15.
Anonymous (2000) Storm over Europe: AnUnderestimated Risk. Zurich: Swiss Re Publishing.
Araña, V., Felpeto, A., Astiz, M., Garía, A., Ortiz,R. and Abella, R. (2000) Zonation of the mainvolcanic hazards (lava flows and ashfall) in Tenerife,Canary Islands: a proposal for a surveillancenetwork. Journal of Volcanology and GeothermalResearch 103: 377–91.
Arthurton, R. S. (1998) Marine-related physicalnatural hazards affecting coastal megacities of theAsia-Pacific region – awareness and mitigation.Ocean and Coastal Management 40: 65–85.
Artunduaga, A. D. H. and Jiménez, G. P. C. (1997)Third version of the hazard map of Galeras volcano,Colombia. Journal of Volcanology and GeothermalResearch 77: 89–100.
Association of British Insurers (ABI) (2004) Reviewof Planning Policy Guidance Note 25: Development andFlood Risk. Consultation Response, London: ABI.
Atkinson, T. C. (1987) Seasonal temperatures inBritain during the past 22,000 years reconstructedusing beetle remains. Nature 325: 587–92.
Au, S. W. C. (1998) Rain-induced slope instabilityin Hong Kong. Engineering Geology 51: 1–36.
Autier, P., D’Altilia, J-P., Delamalle, J.-P. andVercruysse, V. (1989) The food and nutritionsurveillance systems of Chad and Mali: the ‘SAP’after two years. Disasters 13: 9–32.
Autier, P., Ferir, M.-C., Hairapetien, A., Alexanian,A., Agoudian, V., Sehmets, G., Dallemagne, G.,Leva, M.-N. and Pinel, J. (1990) Drugs supply inthe aftermath of the 1988 Armenian earthquake.The Lancet (9 June): 1388–90.
Ayscue, J. K. (1996) Hurricane damage toresidential structures: risk and mitigation. WorkingPaper 94. Boulder, CO: Natural Hazards Researchand Applications Information Center.
Badia, A., Sauri, D., Cerdan, R. and Llurdes, J.-C.(2002) Causality and management of forest fires inMediterranean environments: an example fromCatalonia. Global Environmental Change B:Environmental Hazards 4: 23–32.
Baker, E. J. (2000) Hurricane evacuation in theUnited States. In R. A. Pielke, Jr and R. A. Pielke,Sr (eds) Storms, vol. 1, pp. 306–19. London and NewYork: Routledge.
Baram, M. S. (1987) Chemical industry hazards:liability, insurance and the role of risk analysis. InP. R. Kleindorfer and H. C. Kunreuther (eds)Insuring and Managing Hazardous Risks, pp. 415–42.New York, Springer-Verlag.
Barberi, F. and Carapezza, M. L. (1996) The problemof volcanic unrest: the Campi Flegrei case history.In R. Scarpa and R. I. Tilling (eds) Monitoring andMitigation of Volcano Hazards, pp. 771–86. Berlin:Springer-Verlag.
Barclay, J., Johnstone, J. E. and Matthews, A. J.(2006) Meteorological monitoring of an activevolcano: implications for eruption prediction. Journalof Volcanology and Geothermal Research 150: 339–58.
Bardsley, K. L., Fraser, A. S. and Heathcote, R. L.(1983) The second Ash Wednesday: 16 February1983. Australian Geographical Studies 21: 129–41.
Barnett, A., Menighetti, J. and Prete, M. (1992)The market response to the Sioux City DC-10 crash.Risk Analysis 12: 45–52.
Barnett, B. J. (1999) US government naturaldisaster assistance: historical analysis and a proposalfor the future. Disasters 23: 139–55.
Barry, R. G. and Chorley, R. J. (1987) Atmosphere,Weather and Climate. London: Methuen.
Basher, R. (2006) Global early warning systems fornatural hazards: systematic and people-centred.
B IBL IOGRAPHY 341
Philosophical Transactions of the Royal Society (A): 364:2167–82.
Batterbury, S. and Warren, A. (2001) The AfricanSahel 25 years after the great drought: assessingprogress and moving towards new agendas andapproaches. Global Environmental Change 11: 1–8.
BBC (1999) Horizon documentary programme on theGaltür avalanche. Broadcast 25 November 1999.
Bechtol, V. and Laurian, L. (2005) Restoringstraightened rivers for sustainable flood mitigation.Disaster Prevention and Management 14: 6–19.
Beechley, R. W., van Bruggen. J. and Truppi, L. E.(1972) Heat island = death island? EnvironmentalResearch 5: 85–92.
Beer, T. and Williams, A. (1995) EstimatingAustralian forest fire danger under conditions ofdoubled carbon dioxide concentrations. ClimaticChange 29: 169–88.
Belletto de Pujo, J. (1985) Emergency Planning: theCase of Diablo Canyon Nuclear Power Plant.Natural Hazard Research Working Paper 51. Boulder,CO: Institute of Behavioral Sciences, University ofColorado.
Below, R., Grover-Kopec, E. and Dilley, M. (2007)Documenting drought-related disasters. The Journalof Environment and Development 16: 328–44.
Belt, C. B. Jr (1975) The 1973 flood and man’sconstriction of the Mississippi river. Science 189:681–4.
Beringer, J. (2000) Community fire safety at theurban/rural interface: the bushfire risk. Fire SafetyJournal 35: 1–23.
Berlinguer, G. (1999) Globalisation and globalhealth. International Journal of Health Services 29:579–95.
Bernknopf, R. L, Campbell, R. H., Brookshire, D. S. and Shapiro, C. D. (1988) A probabilisticapproach to landslide hazard mapping inCincinnati, Ohio, with applications for economic
evaluation. Bulletin of the Association of EngineeringGeologists 25: 39–56.
Berz, G. (1990) Natural disasters and insurance/reinsurance. UNDRO News Jan–Feb: 18–19.
Berz, G. (1999) Disasters and climate change: theinsurance industry looks ahead. In IDNDRSecretariat, World Disaster Reduction Campaign‘Prevention Pays’, pp. 45–8. Geneva: United Nations.
Bhowmik, N. G. (ed.) (1994) The 1993 Flood on theMississippi River in Illinois. MiscellaneousPublication 151. Champaign-Urbana, Il: IllinoisState Water Survey.
Bigg, G. R. (1990) E1 Niño and the SouthernOscillation. Weather 45: 2–8.
Binder, D. (1998) The duty to disclose geologichazards in real estate transactions. Chapman LawReview 1: 13–56.
Blaikie, P., Cannon, T., Davis I. and Wisner, B.(1994) At Risk: Natural Hazards, People’sVulnerability and Disasters. London and New York:Routledge (new edn 2004).
Blanchard-Boehm, R. D., Berry, K. A. andShowalter, P. S. (2001) Should flood insurance bemandatory? Insights in the wake of the 1997 NewYear’s Day flood in Reno-Sparks, Nevada. AppliedGeography 21: 199–221.
Bluestein, H. B. (1999) Tornado Alley: Monster Stormsof the Great Plains. New York: Oxford UniversityPress.
Bohonos, J. J. and Hogan, D. E. (1999) The medicalimpact of tornadoes in North America. The Journalof Emergency Medicine 17: 67–73.
Bolin, B., Matranga, E., Hackett, E. J., Sadalla, E. K., Pijawka, D., Brewer, D. and Sicotte, D.(2000) Environmental equity in a sunbelt city: thespatial distribution of toxic hazards in Phoenix,Arizona. Environmental Hazards 2: 11–24.
Bollinger, G. A., Chapman, M. C. and Sibol, M. S.(1993) A comparison of earthquake damage areas as
B IBL IOGRAPHY342

a function of magnitude across the United States.Bulletin of the Seismological Society of America 83:1064–80.
Bolt, B. A. (1993) Earthquakes. New York: W. H.Freeman.
Bolt, B. A., Horn, W. L., Macdonald, G. A. andScott, R. F. (1975) Geological Hazards. Berlin:Springer-Verlag.
Bommer, J. J. and Rodríguez, C. E. (2002)Earthquake-induced landslides in Central America.Engineering Geology 63: 189–220.
Bosher, L., Carrill, P., Dainty, A., Glass, J. and Price,A. (2007) Realising a resilient and sustainable builtenvironment: towards a strategic agenda for theUnited Kingdom. Disasters 31 (3): 236–55.
Botterill, L. C. (2003) Uncertain climate: the recenthistory of drought policy in Australia. AustralianJournal of Politics and History 49: 61–74.
Bouchon, M., Hatzfeld, D., Jackson, J. A. andHaghshenas, E. (2006) Some insight on why Bam(Iran) was destroyed by an earthquake of relativelymoderate size. Geophysical Research Letters 33:L09309. 1–L09309. 4.
Bouma, M. J. and Pascual, M. (2001) Seasonal andinterannual cycles of epidemic cholera in Bengal1891–1940 in relation to climate and geography.Hydrobiologia 460: 147–56.
Bouma, M. J., Kovat, R. S., Gobet, S. A., Cox, J. S.H. and Haines, A. (1997) Gobal assessment of ElNiño’s disaster burden. The Lancet 350: 1435–8.
Brabec, B., Meister, R., Stöckli, U., Stoffel, A. andStucki, T. (2001) RAIFOS: Regional AvalancheInformation and Forecasting System. Cold RegionsScience and Technology 33: 303–11.
Brabolini, M. and Savi, F. (2001) Estimate ofuncertainties in avalanche hazard mapping. Annalsof Glaciology 32: 299–305.
Bradley, J. T. (1972) Hurricane Agnes: the mostcostly storm. Weatherwise 25: 174–84.
Bradstock, R. A., Gill, A. M., Kenny, B. J. andScott, J. (1998) Bushfire risk at the urban interfaceestimated from historical weather records:consequences for the use of prescribed fire in theSydney region of south-eastern Australia. Journal ofEnvironmental Management 52: 259–71.
Brammer, H. (2000) Flood hazard vulnerability andflood disasters in Bangladesh. In D. J. Parker (ed.)Floods, vol. 1, 100–15. London and New York:Routledge.
Bremner, C. (2003) Toll from France’s heatwave hits11,435. The Times, 30 August: 18.
Bridger, C. A. and Helfand, L. A. (1968) Mortalityfrom heat during July 1966 in Illinois. InternationalJournal of Biometeorology 12: 51–70.
Brightmer, M. I. and Fantato, M. G. (1998) Humanand environmental factors in the increasingincidence of dengue fever: a case study fromVenezuela. Geojournal 44: 103–9.
Brodie, M. E., Weltzien, D., Altman, R. J. andBlendon, J. M. (2006) Experiences of HurricaneKatrina evacuees in Houston shelters: implicationsfor future planning. American Journal of Public Health96: 1402–8.
Broecker, W. S. (1991) The Great Ocean Conveyor.Oceanography 4: 79–89.
Broecker, W. S. (1997) Thermohaline circulation,the Achilles heel of our climate system: will man-made carbon dioxide upset the current balance?Science 278: 1582–8.
Broecker, W. S. (2000) Was a change in thermo-haline circulation responsible for the Little Ice Age?Proceedings of the National Academy of Science 97:1339–42.
Brotak, E. A. (1980) Comparison of the meteoro-logical conditions associated with a major wildlandfire in the United States and a major bushfire inAustralia. Journal of Applied Meteorology 19: 474–6.
Brouwer, R. and Nhassengo, J. (2006) Aboutbridges and bonds: community responses to the
B IBL IOGRAPHY 343

2000 floods in Mabalane District, Mozambique.Disasters 30: 234–55.
Brown, J. and Muhsin, M. (1991) Case study: Sudanemergency flood reconstruction program. In A.Kreimer and M. Munasínghe (eds) ManagingNatural Disasters and the Environment, pp. 157–62.Washington, DC: Environment Department, WorldBank.
Brugge, R. (1994) The blizzard of 12–15 March1993 in the USA and Canada. Weather 49: 82–9.
Bryant, E. A. (1991) Natural Hazards. Cambridgeand New York: Cambridge University Press.
Bryden, H. L., Longworth, H. R. and Cunningham,S. A. (2005) Slowing of the Atlantic meridionaloverturning circulation at 25 degrees N. Nature438: 655–7.
Buchroithner, M. F. (1995) Problems of mountainhazard mapping using spaceborne remote sensingtechniques. Advances in Space Research 15: 57–66.
Buchroithner, M. F. (2002) Meteorological and earthobservation remote sensing data for mass movementpreparedness. Advances in Space Research 29: 5–16.
Buller, P. S. J. (1986) Gale Damage to Buildings in the UK: An Illustrated Review. Watford, Herts.:Building Research Establishment.
Buncefield Major Incident Investigation Board(2006a) The Buncefield Investigation: Progress Report.21 February, Health and Safety Executive.
Buncefield Major Incident Investigation Board(2006b) Buncefield Major Incident Investigation: InitialReport. 13 July, Health and Safety Executive.
Burby, R. J. (2001) Flood insurance and floodplainmanagement: the US experience. EnvironmentalHazards 3: 111–22.
Burby, R. J. and Dalton, L. C. (1994) Plans canmatter! The role of land use plans and state planningmandates in limiting the development of hazardousareas. Public Administration Review 54: 229–37.
Burby, R. J. and May, P. J. (1999) Making buildingcodes an effective tool for earthquake hazard
mitigation. Global Environmental Change B:Environmental Hazards 1: 27–37.
Burby, R. J., Bollens, S. A., Holloway, J. M., Kaiser,E. J., Mullan, D. and Sheaffer, J. R. (1988) CitiesUnder Water. Monograph No. 47. Boulder, CO:Institute of Behavioral Science, University ofColorado.
Burby, R. J. with Cigler, B. A., French, S. P., Kaiser,E. J., Kartet, J., Roenigk, D., Weist, D. andWhittington, D. (1991) Sharing Environmental Risks:How to Control Governments’ Losses in NaturalDisasters. Boulder, CO: Westview Press.
Burton, I. and Kates, R. W. (1964a) The perceptionof natural hazards in resource management. NaturalResources Journal 3: 412–41.
Burton, I. and Kates, R. W. (1964b) The floodplainand the seashore: a comparative analysis of hazard-zone occupants. Geographical Review 54: 366–85.
Burton, I., Kates, R. W. and White, G. F. (1993)The Environment as Hazard, 2nd edn. New York andLondon: Guilford Press (1st edn, 1978).
Bush, D. M., Webb, C. A., Young, R. S., Johnson,B. D. and Bates, G. M. (1996) Impact of hurricane‘Opal’ on the Florida–Alabama coast. Quick ResponseReport 84. Boulder, CO: Natural Hazards Researchand Applications Information Center.
Butler, I. (1997) Selected Internet sites on naturalhazards and disasters. International Journal of MassEmergencies and Disasters 15: 197–215.
Butler, D. R. (1997) A major snow-avalancheepisode in north-west Montana, February, 1996.Quick Response Report 100: Boulder, CO: NaturalHazards Research and Applications InformationCenter.
Cairncross, S., Hardoy, J. E. and Satterthwaite, D.(eds) (1990) The Poor Die Young: Housing and Healthin Third World Cities. London: Earthscan.
Calcaterra, D., Parise, M. and Palma, B. (2003)Combining historical and geological data for theassessment of landslide hazard: a case study from
B IBL IOGRAPHY344

Campania, Italy. Natural Hazards and Earth SystemSciences 3: 3–16.
California Seismic Safety Commission (CSSC)(1995) Northridge Earthquake: Turning Loss to Gain.Report CSSC95–01. Sacramento, CA: GovernorsExecutive Order W-78–94.
California Seismic Safety Commission (CSSC) (2003)Status of the Unreinforced Masonry Building Law.Report CSSC2003–03. Sacramento, CA: CSSC.
Campbell, G. L., Marfin, A. A., Lanciotti, R. S. andGubler, D. J. (2002) West Nile virus. The LancetInfectious Diseases 2: 519–29.
Canuti, P., Casaglia, N., Cantani, F. and Fanti, R.(2000) Hydrogeological hazard and risk inarchaeological sites: some case studies in Italy.Journal of Cultural Heritage 1: 117–25.
Capra, L., Poblete, M. A. and Alvarado, R. (2004)The 1997 and 2001 lahars of Popocatépetl volcano(central Mexico): textural and sedimentologicalconstraints on their origin and hazards. Journal ofVolcanology and Geothermal Research 131: 351–69.
Cardona, O. D. (1997) Management of the volcaniccrises of Galeras volcano: social, economic andinstitutional aspects. Journal of Volcanology andGeothermal Research 77: 313–24.
Carn, S. A., Watts, R. B., Thompson, G. andNorton, G. E. (2004) Anatomy of a lava domecollapse: the 20 March 2000 event at Soufrière Hillsvolcano, Montserrat. Journal of Volcanology andGeothermal Research 131: 241–64.
Carter, W. N. (1991) Disaster Management A DisasterManager’s Handbook. Manila: Asian DevelopmentBank.
Cekan, J. (1992) Seasonal coping strategies inGental Mali: five villages during the ‘Soudiere’.Disasters 16: 66–73.
Cenderelli, D. A. and Wohl, E. E. (2001) Peakdischarge estimates of glacial-lake outburst floodsand ‘normal’ climatic floods in the Mount Everestregion, Nepal. Geomorphology 40: 57–90.
Centre for Research on the Epidemiology ofDisasters (CRED) (2005) Are natural disastersincreasing? CRED Crunch 2, Université Catholiquede Louvain, Louvain-la-Neuve, France: CRED.
Chaine, P. M. (1973) Glaze and its misery: the icestorm of 22–23 March 1972 north of Montreal.Weatherwise 26: 124–7.
Chakraborty, J., Tobin, G. A. and Montz, B. E.(2005) Population evacuation: assessing spatialvariability in geophysical risk and social vulner-ability to natural hazards. Natural Hazards Review6 (1): 23–33.
Changnon, S. A. (2000) Impacts of hail in theUnited States. In R. A. Pielke Jr and R. A. Pielke(eds) Storms, vol. 2, 163–91. London and New York:Routledge.
Changnon, S. A. and Changnon, D. (2005)Snowstorm catastrophes in the United States.Environmental Hazards 6: 158–66.
Changnon, S. A. and Changnon, J. M. (1992)Temporal fluctuations in weather disasters:1950–1989. Climatic Change 22: 191–208.
Changnon, S. A., Kunkel, K. E. and Reinke, B. C.(1996) Impacts and responses to the 1995 heatwave: a call to action. Bulletin of the AmericanMeteorological Society 77: 1497–506.
Changnon S. A. and Semonin, R. G. (1966) A greattornado disaster in retrospect. Weatherwise 19: 56–65.
Changnon, S. A., Pielke, R. A. Jr., Changnon, D.,Sylves, R. T. and Pulwarty, R. (2000) Human factorsexplain the increased losses from weather andclimate extremes. Bulletin of the AmericanMeteorological Society 81: 437–42.
Chappelow, B. F. (1989) Repair and restoration ofsupplies in Jamaica in the wake of hurricane Gilbert.Distribution Developments (June): 10–14.
Chapman, C. R. and Morrison, D. (1994) Impactson the Earth by asteroids and comets: assessing thehazard. Nature 367: 33–9.
B IBL IOGRAPHY 345

Chapman, D. (1999) Natural Hazards. Melbourne,Oxford University Press.
Chapman, J. (2005) Predicting technologicaldisasters: mission impossible? Disaster Prevention andManagement 14: 343–52.
Charlton, R. M. (1990) How Safe is Safe Enough?Selected Papers Group Public Affairs, London: ShellInternational Petroleum.
Charoenphong, S. (1991) Environmental calamityin southern Thailand headwaters. Land Use Policy18: 185–8.
Chen, C. C. et al. (2001) Psychiatric morbidity andpost-traumatic symptoms among survivors in theearly stage following the 1999 earthquake inTaiwan. Psychiatry Research 105: 13–22.
Cheng, C. S., Auld, H., Li, G., Klaassen, J. and Li,Q. (2007) Possible impacts of climate change on freezing rain in south-central Canada usingdownscaled future climate scenarios. NaturalHazards and Earth System Sciences 7: 71–87.
Chester, D. (1993) Volcanoes and Society. London: E.Arnold.
Chester, D. K., Degg. M., Duncan, A. M. andGuest, J. E. (2001) The increasing exposure of citiesto the effects of volcanic eruptions: a global survey.Global Environmental Change B: EnvironmentalHazards 2: 89–103.
Childs, D. Z., Cattadori, I. M., Suwonkerd, W.,Prajakwong, S. and Boots, M. (2006) Spatio-temporal patterns of malaria incidence in northernThailand. Transactions of the Royal Society of TropicalMedicine and Hygiene 100: 623–31.
Choudhury, N. Y., Paul, A. and Paul, B. K. (2004)Impact of coastal embankment on the flash flood inBangladesh: a case study. Applied Geography 24:241–58.
Clapperton, C. M. (1986) Fire and water in theAndes. Geographical Magazine 58: 74–9.
Clark, K. M. (1997) Current and potential impactof hurricane variability on the insurance industry.
In H. Diaz and R. S. Pulwarty (eds) Hurricanes:Climate and Socioeconomic Impacts. Heidelberg:Springer-Verlag.
Clark, R. A. (1994) Evolution of the national floodforecasting system in the USA. In G. Rossi, N.Harmancioglu and V. Yevjevich (eds) Coping withFloods, NATO Advanced Study Institute, vol. 257,pp. 437–44. Dordrecht: Kluwer.
Clarke, C. L. and Munasinghe, M. (1995) Economicaspects of disasters and sustainable development: anintroduction. In M. Munasinghe and C. Clarke (eds)Disaster Prevention for Sustainable Development, pp.1–9. Washington, DC: IDNDR and World Bank.
Clarke, M. L. and Rendell, H. M. (2006)Hindcasting extreme events: the occurrence andexpression of damaging floods and landslides insouthern Italy. Land Degradation and Development 17:365–80.
Clay, E. et al. (1999) An Evaluation of HMG’s Responseto the Montserrat Volcanic Emergency. Vol. I. London:Department for International Development.
Colby, J. D., Mulcahy, K. A. and Yong, W. (2000)Modelling flooding extent from hurricane Floyd inthe coastal plain of North Carolina. GlobalEnvironmental Change B: Environmental Hazards 2:157–68.
Collins, M. and CMIP Modelling Groups (2005) ElNiño or La Niña-like climate change? ClimateDynamics 24: 89–104.
Collins, T. W. (2005) Households, forests and firehazard vulnerability in the American West: a casestudy of a California community. EnvironmentalHazards 6: 23–37.
Comfort, L. K. (1986) International disasterassistance in the Mexico City earthquake. NewWorld: Journal of Latin American Studies 1: 12–43.
Comfort, L. K. (1996) Self-organisation in disasterresponse: the Great Hanshin, Japan, earthquake ofJanuary 17, 1995. Quick Response Report 78: Boulder,CO: Natural Hazards Research and ApplicationsInformation Center.
B IBL IOGRAPHY346

Comfort, L. K. (1999) Shared Risk: Complex Systemsin Seismic Response. Oxford: Pergamon Press.
Comfort, L. K. (2006) Cities at risk: HurricaneKatrina and the drowning of New Orleans. UrbanAffairs Review 41: 501–16.
Comfort, L. K., Wisner, B., Cutter, S., Pulwarty, R.,Hewitt, K., Oliver-Smith, A., Wiener, J., Fordham,M., Peacock, W. and Krimgold, F. (1999) Reframingdisaster policy: The global evolution of vulnerablecommunities. Environmental Hazards 1: 39–44.
Cordes, J. J., Gatzlaff, D. H. and Yezer, A. M.(2001) To the water’s edge and beyond: effects ofshore protection projects on beach development.Journal of Real Estate Finance and Economics 22:287–302.
Correa, I. D. and Gonzalez, J. L. (2000) Coastalerosion and village relocation: a Colombian casestudy. Ocean and Coastal Management 43: 51–64.
Cova, T. J. (2005) Public safety in the urban-wildland interface: Should fire-prone communitieshave a maximum occupancy? Natural HazardsReview 6: 99–107.
Covello, V. T. and Mumpower, J. (1985) Riskanalysis and risk management: an historicalperspective. Risk Analysis 5: 103–20.
Cox, D., Crossland, B., Darby, S. C., Forman, D.,Fox, A. J., Gore, S. M., Hambly, E. C., Kletz, T. A.and Neill, N. V. (1992) Estimation of risk fromobservation on humans. In Risk, pp. 67–87. London,Royal Society.
Crandell, D. R., Mullineaux, D. R. and Miller, C. D. (1979) Volcanic–hazards studies in theCascades Range of the western United States. In P. D. Sheets and D. K. Grayson (eds) Volcanic Activityand Human Ecology, pp. 195–219. London:Academic Press.
Cross, J. A. (1985) Residents’ Acceptance of HurricaneHazard Mitigation Measures. Final Summary Report,NSF Grant no. CEE-8211441. Oshkosh: Universityof Wisconsin.
Cross, J. A. (2001) Megacities and small towns:different perspectives on hazard vulnerability. Global
Environmental Change B: Environmental Hazards 3:63–80.
Crozier, M. (2005) Multiple-occurrence regionallandslide events in New Zealand: hazard manage-ment issues. Landslides 2: 247–56.
Cruden, D. M. and Krahn, J. (1978) Frankrockslide, Alberta, Canada. In B. Voight (ed.)Rockslides and Avalanches, vol. 1 Natural Phenomena,pp. 97–112. Amsterdam: Elsevier.
Cullen, H. M., Kaplan, A., Arkin, P. A. andDemenocal, P. B. (2002) Impact of the NorthAtlantic Oscillation on Middle Eastern climate andstreamflow. Climatic Change 55: 315–38.
Cunningham, C. J. (1984) Recurring natural fire hazards: a case study of the Blue Mountains,New South Wales, Australia. Applied Geography 4:5–57.
Cuny, E. C. (1991) Living with floods: alternativesfor riverive flood mitigation. In A. Kreimer and M.Munasinghe (eds) Managing Natural Disasters andthe Environment, pp. 62–73. Washington, DC:Environment Department, World Bank.
Cutter, S. L. (1984) Emergency preparedness andplanning for nuclear power plant accidents. AppliedGeography 4: 235–45.
Cutter, S. L. (1993) Living with Risk: The Geographyof Technological Hazards. London and New York: E.Arnold.
Cutter, S. L. and Ji, M. (1997) Trends in UShazardous materials transportation spills. ProfessionalGeographer 49: 318–31.
Dai, F. C., Lee, C. F. and Ngai, Y. Y. (2002)Landslide risk assessment and management: anoverview. Engineering Geology 64: 65–87.
Daley, W. R., Smith, A., Paz-Argandona, E., Malily,J. and McGeehin, M. (2000) An outbreak of carbonmonoxide poisoning after a major ice storm inMaine. The Journal of Emergency Medicine 18: 87–93.
Dando, W. A. (1980) The Geography of Famine.London: Edward Arnold.
B IBL IOGRAPHY 347

Daniel, H. (2001) Replenishment versus retreat: thecost of maintaining Delaware’s beaches. Ocean andCoastal Management 44: 87–104.
Danielsen, F. et al. (2005) The Asian tsunami: aprotective role for coastal vegetation. Science 310, 28October: 643.
Darcy, J. and Hofmann, C.-A. (2003) According toNeed? Needs Assessment and Decision-Making in theHumanitarian Sector. Report 15. London: Humani-tarian Policy Group, Overseas DevelopmentInstitute.
Da Silva Curiel, A., Wicks, A., Meerman, M.,Boland, L. and Sweeting, M. (2002) Second genera-tion disaster-monitoring microsatellite platform.Acta Astronautica 51: 191–7.
Dash, N. and Morrow, B. H. (2000) Return delaysand evacuation order compliance: the case ofHurricane Georges and the Florida Keys. GlobalEnvironmental Change B: Environmental Hazards 2:119–28.
David, E. and Mayer, J. (1984) Comparing costs ofalternative flood hazard mitigation plans. Journal ofthe American Planning Association 50: 22–35.
Davis, I. (1978) Shelter after Disaster. Oxford: OxfordPolytechnic Press.
Day, J. W. et al. (2007) Restoration of theMississippi delta: Lessons from hurricanes Katrinaand Rita. Science 315, 23 March: 1679–84.
De Bruycker, M., Greco, D. and Lechat, M. F.(1985) The 1980 earthquake in southern Italy:mortality and morbidity. International Journal ofEpidemiology 14: 113–17.
De Cock, K. M., Mbori-Ngacha, D. and Marum, E.(2002) AIDS in Africa V: public health andHIV/AIDS in Africa in the 21st century. The Lancet360: 67–72.
Decker, R. W. (1986) Forecasting volcaniceruptions. Annals and Review of Earth and PlanetaryScience 14: 267–91.
Degg, M. (1992) Natural disasters: recent trendsand future prospects. Geography 77: 198–209.
De Loë, R. and Wojtanowski, D. (2001) Associatedbenefits and costs of the Canadian Flood DamageReduction Program. Applied Geography 21: 1–21.
Department of Humanitarian Affairs (1994) Strategyand Action Plan for Mitigating Water Disasters inVietnam. New York and Geneva: United NationsDevelopment Programme.
Derbyshire, E. (2001) Geological hazards in loessterrain with particular reference to the loess regionsof China. Earth Science Reviews 54: 231–60.
De Scally, F. A. and Gardner, J. S. (1994)Characteristics and mitigation of the snow avalanchehazard in Kaghan valley, Pakistan Himalaya.Natural Hazards 9: 197–213.
De Souza, A. B. Jr. (2000) Emergency planning forhazardous industrial areas: a Brazilian case study.Risk Analysis 20: 483–93.
De Vries, J. (1985) Analysis of historicalclimate–society interaction. In R. W. Kates, J. H.Ausubel and M. Berberian (eds) Climate ImpactAssessment, pp. 273–91. New York: John Wiley.
De Waal, A. (1989) Famine that Kills: Darfur,Sudan, 1984–85. Oxford: Clarendon Press.
Dilley, M. and Heyman, B. N. (1995) ENSO and disaster: droughts, floods and E1 Niño–Southern Oscillation warm events. Disasters 19:181–93.
Dilley, M., Chen, R. S., Deichmann, U., Lerner-Lam, A. and Arnold, M. (2005) Natural DisasterHotspots: A Global Risk Analysis. Washington, DC:World Bank Publications.
Dinar, A. and Keck, A. (2000) Water supplyvariability and drought impact and mitigation insub-Saharan Africa. In Wilhite, D. A. (ed.) Drought:A Global Assessment, vol. 2, pp. 129–48. London andNew York: Routledge.
Dohler, G. C. (1988) A general outline of the ITSUmaster plan for the tsunami warning system in thePacific. Natural Hazards 1: 295–302.
Dolan, M. A. and Krug, S. E. (2006) Pediatricdisaster preparedness in the wake of Katrina: lessons
B IBL IOGRAPHY348

to be learned. Clinical Pediatric Emergency Medicine 7:59–66.
Dolan, J. F., Sieh, K., Rockwell, T. K., Yeats, R. S.,Shaw, J., Suppe, J., Huftile, G. J. and Gath, E. M.(1995) Prospects for larger or more frequent earth-quakes in the Los Angeles Metropolitan Region.Science 267: 199–205.
Dominey-Howes, D. and Minos-Minopoulos, D.(2004) Perceptions of hazard and risk on Santorini.Journal of Volcanology and Geothermal Research 137:285–310.
Donald, J. R. (1988) Drought effects on cropproduction and the US economy. The Drought of 1988and Beyond. Proceedings of a Strategic PlanningSeminar, 18 October, pp. 143–62. Rockville, MD:National Climate Program Office.
Doocy, S., Gabriel, M., Collins, S., Robinson, C. andStevenson, P. (2006) Implementing cash-for-workprogrammes in post-tsunami Aceh: experiences andlessons learned. Disasters 30: 277–96.
Dow, K. and Cutter, S. L. (1997) Repeat responseto hurricane evacuation orders. Quick Response Report101. Boulder, CO: Natural Hazards Research andApplications Information Center.
Dow, K. and Cutter, S. L. (2000) Public orders andpersonal opinions: household strategies for hurricanerisk assessment. Global Environmental Change B:Environmental Hazards 2: 143–55.
Drabek, T. E. (1991) Microcomputers in EmergencyManagement. Monograph no. 51, Boulder, CO:Institute of Behavioral Science, University ofColorado.
Drabek, T. E. (1995) Disaster responses within thetourist industry. International Journal of MassEmergencies and Disasters 13: 7–23.
Drury, A. C., Olson, R. S. and Van Belle, D. A.(2005) The politics of humanitarian aid: US foreigndisaster assistance 1964–1995. The Journal of Politics67: 454–73.
Dumas, L. J. (1999) Lethal Arrogance: HumanFallibility and Dangerous Technologies. New York: StMartin’s Press.
Dunlap, R. E. and Scarce, R. (1991) The polls-polltrends: environmental problems and protection.Public Opinion Quarterly 55 (4): 651–72.
Dymon, U. J. (1999) Effectiveness of geographicinformation systems (GIS) applications in floodmanagement during and after hurricane ‘Fran’.Quick Response Report 114, Boulder, CO: NaturalHazards Research and Applications InformationCenter.
Dynes, R. (2004) Expanding the horizons of disasterresearch. Natural Hazards Observer 28 (4): 1–2.
Earth Policy Institute (2005) World Economic OutlookDatabase. From International Monetary Fund atwww. imf.org/external/pubs/ft/weo (updated April2005).
Easterling, D. R., Evans, J. L., Groisman, P. Y.,Karl, T. R., Kunkel, K. E. and Ambenje, P. (2000)Observed variability and trends in extreme climateevents: a brief review. Bulletin of the AmericanMeteorological Society 81: 417–25.
Economic Commission for Latin America and theCaribbean (1992a) Economic Impacts of the Eruption ofthe Cerro Negro Volcano in Nicaragua. Paper LC/L.686. Geneva: United Nations.
Economic Commission for Latin America and theCaribbean (1992b) The Tsunami of September 1992 inNicaragua and its Effects on Development. Paper LC/L.708, Geneva: United Nations.
Earthquake Engineering Research Institute (EERI)(2004) Preliminary Observations on the Bam, Iran,Earthquake of December 26, 2003, 12 pp. Oakland,California: EERI.
Ellemor, H. (2005) Reconsidering emergencymanagement and indigenous communities inAustralia. Environmental Hazards 6: 1–7.
Elliott, J. R. and Pais, J. (2006) Race, class andHurricane Katrina: social differences in humanresponses to disaster. Social Science Research 35:295–321.
El-Masri, S. and Tipple, G. (2002) Natural disaster,mitigation and sustainability: the case of developingcountries. International Planning Studies 7: 157–75.
B IBL IOGRAPHY 349

El-Sayed, B. B., Arnot, D. E., Mukhtar, M. M.,Baraka, O. Z., Dafalla, A. A., Elnaiem, D. E. A. andNugud, A. H. D. (2000) A study of the urbanmalaria transmission problem in Khartoum. ActaTropica 75: 163–71.
Elsner, J. B. (2003) Tracking hurricanes. Bulletin ofthe American Meteorological Society 84: 353–6.
Elsner, J. B., Jagger, T. and Niu, X-F. (2000)Changes in the rates of North Atlantic majorhurricane activity during the 20th century.Geophysical Research Letters 27: 1743–6.
Elsom, D. M. (1993) Deaths caused by lightning inEngland and Wales, 1852–1990. Weather 48:83–90.
Emanuel, K. A. (1987) The dependence of hurricaneintensity on climate. Nature 326: 483–5.
Emanuel, K. A. (1999) Thermodynamic control ofhurricane intensity. Nature 401: 665–9.
Emanuel, K. A. (2000) A statistical analysis oftropical cyclone intensity. Monthly Weather Review128: 1139–52.
Emanuel, K. A. (2005) Increasing destructivenessof tropical cyclones over the past 30 years. Nature436: 686–8.
Emery, A. C. (2005) Good Practice in EmergencyPreparedness and Response. London: UNEP andInternational Council on Mining and Metals.
Emmi, P. C. and Horton, C. A. (1993) A GIS-basedassessment of earthquake property damage andcasualty risk: Salt Lake City, Utah. EarthquakeSpectra 9: 11–33.
Ericksen, N. J. (1986) Creating Flood Disasters? NewZealand’s Need for a New Approach to Urban FloodHazard. Wellington: National Water and SoilConservation Authority.
Fagherazzi, S., Fosser, G., D’Alpaos L. andD’Odorico, P. (2005) Climatic oscillations influencethe flooding of Venice. Geophysical Research Letters32: L19710. 1–L19710. 5.
Falck, L. B. (1991) Disaster insurance in NewZealand. In A. Kreimer and M. Munasinghe (eds)Managing Natural Disasters and Environment, pp.120–5. Washington, DC: Environment Department,World Bank.
Federal Emergency Management Agency (FEMA)(1989) Alluvial Fans: Hazards and Management.Washington, DC: Federal Emergency ManagementAgency.
Fell, R. (1994) Landslide risk assessment andacceptable risk. Canadian Geotechnical Journal 31:261–72.
Fischer, G. W., Morgan, M. G., Fischhoff B., Nair,I. and Lave, L. B. (1991) What risks are peopleconcerned about? Risk Analysis 11: 303–14.
Fischhoff, B., Lichtenstein, S., Slovíc, P., Derby, S. L. and Keeney, R. L. (1981) Acceptable Risk.Cambridge: Cambridge University Press.
Fisher, H. W. (1996) What emergency managementofficials should know to enhance mitigation andeffective disaster response. Journal of Contingenciesand Crisis Management 4: 209–17.
Flores, M., Khwaja, Y. and White, P. (2005) Food security in protracted crises: building moreefficient policy frameworks. Disasters 29 (SI):S25–51.
Flynn, J., Slovic, P. and Mertz, C. K. (1993a)Decidedly different: expert and public views of risksfrom a radioactive waste repository. Risk Analysis 13:643–8.
Flynn, J., Slovic, P. and Mertz, C. K. (1993b) TheNevada initiative: a risk communication fiasco. RiskAnalysis 13: 497–502.
Food and Agriculture Organisation (FAO) (1999)Assessment of the World Food Security Situation. ReportNo. CFS:99/2 of the 25th Session of the Committeeon World Food Security. Washington, DC andRome, Italy: United Nations.
Foster, H. D. (1975) The forgotten ingredient:paying nature’s rent. Habitat 18: 18–21.
B IBL IOGRAPHY350
Fouchier, R., Kuiken, T., Rimmelzwaan, G. andOsterhaus, A. (2005) Global task force for influenza.Nature 435 (26 May): 419–20.
Foxworthy, B. L. and Hi11, M. (1982) VolcanicEruptions of 1980 at Mount St Helens: The First 100Days. Geological Survey Professional Paper 1249.Washington, DC: Government Printing Office.
Francis, P. W. (1989) Remote sensing of volcanoes.Advances in Space Research 9: 89–92.
Fratkin, E. (1992) Drought and development inMarsabit District, Kenya. Disasters 16: 119–30.
Friis, H. (2007) International nutrition and health.Danish Medical Bulletin 54: 55–57.
Fritzsche, A. F. (1992) Severe accidents: can theyoccur only in the nuclear production of electricity?Risk Analysis 12: 327–9.
Fu, C. B., Kim, J.-W. and Zhao, Z. C. (1998)Preliminary assessment of impacts of global changeon Asia. In J. N. Galloway and J. M. Melillo (eds)Asian Change in the Context of Global Climate Change.Cambridge: Cambridge University Press.
Fuchs, S. and McAlpin, M. C. (2005) The net benefitof public expenditures on avalanche defencestructures in the municipality of Davos, Switzerland.Natural Hazards and Earth System Sciences 5: 319–30.
Fujita, T. T. (1973) Tornadoes around the world.Weatherwise 26: 56–62, 79–83.
Fukuchi, T. and Mitsuhashi, K. (1983) Tsunamicountermeasures in fishing villages along theSanriku coast, Japan. In K. Iida and T. Iwasaki (eds)Tsunamis, pp. 389–96. Boston, MA: D. Reidel.
Gagnon, A. S., Bush, A. B. G. and Smoyer-Tomic,K. E. (2001) Dengue epidemics and the El NiñoSouthern Oscillation. Climate Research 19: 35–43.
Galle, B., Oppenheimer, C., Geyer, A., McGonigle,A. J. S., Edmonds, M. and Horrocks, L. (2003) Aminiaturised ultraviolet spectrometer for remotesensing of SO2 fluxes: a new tool for volcanicsurveillance. Journal of Volcanology and GeothermalResearch 119: 241–54.
Gardner G. T. and Gould, L. C. (1989) Publicperceptions of the risks and benefits of technology.Risk Analysis 9: 225–42.
Garner, A. C. and Huff, W. A. K. (1997) The wreckof Amtrak’s Sunset Limited: news coverage of a masstransport disaster. Disasters 21: 4–19.
Garrett, L. (2000) Betrayal of Trust: The Collapse ofGlobal Public Health. New York: Hyperion.
Garvin, T. (2001) Analytical paradigms: Theepistemiological distances between scientists, policymakers and the public. Risk Analysis 21: 443–55.
Gehrels, T. (ed.) (1994) Hazards due to Asteroids andComets. Tucson: University of Arizona Press.
Gemmell, I., McLoone, P., Boddy, F. A., Dickinson,G. J. and Watt, G. C. M. (2000) Seasonal variationin mortality in Scotland. International Journal ofEpidemiology 29: 274–79.
Gill, A. M. (2005) Landscape fires as social disasters:an overview of the bushfire problem. EnvironmentalHazards 6: 65–80.
Gilvear, D. J., Davies, J. R. and Winterbottom, S. J. (1994) Mechanisms of floodbank failure duringlarge flood events on the rivers Tay and Earn,Scotland. Quarterly Journal of Engineering Geology 27:319–32.
Givri, J. R. (1995) Satellite remote sensing data onindustrial hazards. Advances in Space Research 15:87–90.
Glauber, J. (2004) Crop insurance reconsidered.American Journal of Agricultural Economics 86:1179–95.
Glickman, T. S. and Sontag, M. A. (1995) Thetrade-offs associated with re-routing highwayshipments of hazardous materials to minimise risk.Risk Analysis 15: 61–7.
Glickman, T. S., Golding, D. and Silverman, E. D.(1992) Acts of God and Acts of Man: Recent Trends inNatural Disasters and Major Industrial Accidents.Discussion Paper CRM 92–02. Washington, DC:Resources for the Future.
B IBL IOGRAPHY 351

Glickman, T. S., Golding, D. and Terry K. S. (1993)Fatal Hazardous Materials Accidents in Industry:Domestic and Foreign Experience from 1945–1991.Washington, DC: Resources for the Future.
Goddard, L. and Dilley, M. (2005) El Niño:catastrophe or opportunity? Journal of Climate 18:651–65.
Goff, F., Love, S. P., Warren, R. G., Counce, D.,Obenholzner, J., Siebe, C. and Schmidt, C. (2001)Passive infrared remote sensing evidence for largeintermittent CO2 emissions at Popocatépetl volcano,Mexico. Chemical Geology 177: 133–56.
González, F. I. (1999) Tsunami. Scientific American280: 56–65.
Goring, D. G. (2002) Response of New Zealandwaters to the Peru tsunami of 23 June 2001. NewZealand Journal of Marine and Freshwater Research 36:225–32.
Govere, J. M., Durrheim, D. N., Coetzee, M. andHunt, R. H. (2001) Malaria in MpumalangaProvince, South Africa, with special reference to theperiod 1987–1999. South African Journal of Science97: 55–58.
Graham, N. E. (1977) Weather surrounding theSanta Barbara fire: 26 July 1977. Weatherwise 30 (4):158–9.
Gray, W. M. (1990) Strong association betweenWest African rainfall and US landfall of intensehurricanes. Science 249: 1251–6.
Gray, W. M. and Landsea, C. W. (1992) Africanrainfall as a precursor of hurricane-related destructionon the US east coast. Bulletin of the AmericanMeteorological Society 73: 1352–64.
Green, C. H., Parker, D. J. and Tunstall, S. M.(2000) Assessment of Flood Control and ManagementOptions. Working Paper IV. 4, prepared for WorldCommission on Dams, Cape Town.
Greenberg, M. R., Sachsman, D. B., Sandman, P. M.and Salomone, K. L. (1989) Network evening news
coverage of environmental risk. Risk Analysis 9:119–26.
Greene, J. P. (1994) Automated forest fire detection.STOP Disasters 18: 18–19.
Gregg, C. E., Houghton, B. F., Johnston, D. M.,Paton, D. and Swanson, D. A. (2004) The perceptionof volcanic risk in Kona communities from MaunaLoa and Hualalai volcanoes, Hawaii. Journal ofVolcanology and Geothermal Research 130: 179–96.
Grieve, R. A. F. (1998) Extra-terrestrial impacts onearth: the evidence and the consequences. In M. M.Grady, R. Hutchinson, G. J. H. McCall and D. A.Rothery (eds), Meteorites: Flux with Time and ImpactEffects. Special Publication 140, pp. 105–31.London: Geological Society of London.
Griffiths, J. S., Hutchinson, J. N., Brundsen, D.,Petley, D. and Fookes, P. G. (2004) The reactiva-tion of a landslide during the construction of the Ok Ma tailings dam, Papua New Guinea. QuarterlyJournal of Engineering Geology and Hydrogeology 37:173–86.
Gruber, U. and Haefner, H. (1995) Avalanchehazard mapping with satellite data and a digitalelevation model. Applied Geography 15: 99–114.
Gruntfest, E. (1987) Warning dissemination andresponse with short lead times. In J. W. Handmer(ed.) Flood Hazard Management, pp. 191–202.Norwich: Geo Books.
Gruntfest, E. and Weber, M. (1998) Internet andemergency management: prospects for the future.International Journal of Mass Emergencies and Disasters16: 55–72.
Guffanti, M., Ewert, J. W., Gallina, G. M., Bluth,G. J. S. and Swanson, G. L. (2005) Volcanic ashhazard to aviation during the 2003–2004 eruptiveactivity of Anatahua volcano, Commonwealth of theNorthern Marianas Islands. Journal of Volcanology andGeothermal Research 146: 241–55.
Guha-Sapir, D. and Below, R. (2002) Quality andAccuracy of Disaster Data: A Comparative Analysis of
B IBL IOGRAPHY352
Three Global Datasets. Working paper prepared forthe Disaster Management Facility, World Bank,Brussels.
Guha-Sapir, D., Hargitt, D. and Hoyois, P. (2004)Thirty Years of Natural Disasters 1974–2003.Louvain-la-Neuve, France: Presses Universitaires deLouvain.
Gupta, H. K. (2001) Short-term earthquakeforecasting may be feasible at Koyna, India.Tectonophysics 338: 353–7.
Gupta, H. K., Rao, N. P., Rastogi, B. K. and Sarkar,D. (2001) The deadliest intraplate earthquake.Science 291: 2101–2.
Guzzetti, F. (2000) Landslide fatalities and theevaluation of landslide risk in Italy. EngineeringGeology 58: 89–107.
Haas, J. E., Kates, R. W. and Bowden, M. J. (eds)(1977) Reconstruction Following Disaster. Cambridge,MA: MIT Press.
Hall, J. W., Evans, E. P., Penning-Rowsell, E. C.,Sayers, P. B., Thorne, C. R. and Saul, A. J. (2003)Quantified scenarios analysis of drivers and impactsof changing flood risk in England and Wales2030–2100. Environmental Hazards 5: 51–65.
Haines, A., Kovacs, R. S., Campbell-Lendrum, D.and Corvalan, C. (2006) Climate change and humanhealth: impacts, vulnerability and mitigation. Lancet367: 2101–9.
Hamilton, L. S. (1987) What are the impacts of Himalayan deforestation on the Ganges–Brahmaputra lowlands and delta? Assumptions andfacts. Mountain Research and Development 7: 256–63.
Hammer, B. O. and Schmidlin, T. W. (2000)Vehicle-occupant deaths caused by tornadoes in theUnited States 1900–1998. Global EnvironmentalChange B: Environmental Hazards 2: 105–18.
Hammer, B. O. and Schmidlin, T. W. (2002)Response to warnings during the 3 May 1999Oklahoma City tornado: reasons and relative injuryrates. Weather and Forecasting 17: 577–81.
Hammond, L. and Maxwell, D. (2002) TheEthiopian crisis of 1991–2000: lessons learned,questions unanswered. Disasters 26: 262–79.
Handmer, J. W. (1987) Guidelines for floodplainacquisition. Applied Geography 7: 203–21.
Handmer, J. W. (1999) Natural and anthropogenichazards in the Sydney sprawl: is the city sustainable?In J. K. Mitchell (ed.) Crucibles of Hazard, pp.138–85. Tokyo: United Nations University Press.
Handmer, J. W. and Tibbits, A. (2005) Is staying athome the safest option during bushfires? Historicalevidence for an Australian approach. EnvironmentalHazards 6: 81–91.
Harlan, S. L., Brazel, A. J., Prashad, L., Stefanov, W.L. and Larsen, L. (2006) Neighbourhood micro-climates and vulnerability to heat stress. Social Scienceand Medicine 63: 2847–63.
Harwell, E. E. (2000) Remote sensibilities: dis-courses of technology and the making of Indonesia’snatural disaster. Development and Change 31: 307–40.
Haskell, R. C. and Christiansen, J. R. (1985) Seismicbracing of equipment. Journal of Environmental Sciences9: 67–70.
Haug, R. (2002) Forced migration, processes ofreturn and livelihood construction among pastoral-ists in northern Sudan. Disasters 26: 70–84.
Hay, I. (1996) Neo-liberalism and criticisms ofearthquake insurance arrangements in NewZealand. Disasters 20: 34–48.
Hayes, B. D. (2004) Interdisciplinary planning ofnon-structural flood hazard mitigation. Journal ofWater Resources Planning and Management 130: 15–25.
Haylock, H. J. K. and Ericksen, N. J. (2000) Fromstate dependency to self-reliance. In D. A. Wilhite(ed.) Drought, vol. 2, pp. 105–14. London and NewYork: Routledge.
Hazard Mitigation Team (1994) Southern CaliforniaFirestorms. FEMA-1005-DR-CA Report. SanFrancisco, CA: Federal Emergency ManagementAgency (FEMA).
B IBL IOGRAPHY 353

Hazarika, S. (1988) Bhopal: The Lessons of a Tragedy.New Delhi: Penguin Books.
Healey, D. T., Jarrett, F. G. and McKay, J. M. (1985)The Economics of Bushfires: The South AustralianExperience. Melbourne: Oxford University Press.
Health and Safety Executive (1978) Canvey: AnInvestigation of Potential Hazards from Operations in theCanvey Island/Thurrock Area. London: HMSO.
Health and Safety Executive (2004) Thirty Years Onand Looking Forward. London: Health and SafetyExecutive.
Healy, J. D. (2003) Excess winter mortality inEurope: a cross-country analysis identifying key riskfactors. Journal of Epidemiology and Community Health57: 784–9.
Hearn, G. and Jones, D. K. C. (1987)Geomorphology and mountain highway design:some lessons from the Dharan–Dhankuta highway,east Nepal. In V. Gardiner (ed.) InternationalGeomorphology 1986, Proceedings of the FirstInternational Conference on Geomorphology, pp. 203–19. Chichester: John Wiley.
Helm, P. (1996) Integrated risk management for natural and technological disasters. Tephra 15:4–13.
Hemrich, G. (2005) Matching food security analysisto context: the experience of the Somalia FoodSecurity Assessment Unit. Disasters 29 (Supplement1): 567–91.
Hendrickson, D., Armon, J. and Mearns, R. (1998)The changing nature of conflict and faminevulnerability: the case of livestock raiding inTurkana District, Kenya. Disasters 22: 185–99.
Hewitt, K. (ed.) (1983) Interpretations of Calamity.Boston, MA and London: Allen and Unwin.
Hewitt, K. (1992) Mountain hazards. Geojournal 27:47–60.
Hewitt, K. (1997) Regions of Risk: A GeographicalIntroduction to Disasters. London: Longman.
Hewitt, K. and Burton, I. (1971) The Hazardousnessof a Place: A Regional Ecology of Damaging Events.Toronto: Department of Geography, University ofToronto.
Hilhorst, D. (2004) Unlocking domains of disasterresponse. In G. Bankoff, G. Frerks and D. Hilhorst(eds) Mapping Vulnerability: Disasters, Development andPeople, pp. 52–66. London: Earthscan Publications.
Hills, J. G. and Goda, M. P. (1998) Tsunami fromasteroid and comet impacts: the vulnerability ofEurope. Science of Tsunami Hazards 16: 3–10.
Hinman, G. W., Rosa, E. A., Kleinhesselink, R. R.and Lowinger, T. C. (1993) Perceptions of nuclearand other risks in Japan and the United States. RiskAnalysis 14: 449–55.
Hoffman, S. M. and Oliver-Smith, A. (eds) (2002)Catastrophe and Culture: The Anthropology of Disaster.Santa Fe: School of American Research Press.
Hohenemser, C., Kates, R. W. and Slovic, P. (1983)The nature of technological hazard. Science 220:378–84.
Hohl, R., Schiesser, H.-H. and Knepper, I. (2002)The use of weather radars to estimate hail damageto automobiles: an exploratory study in Switzerland.Atmospheric Research 61: 215–38.
Holzer, T. L. (1994) Loma Prieta damage largelyattributed to enhanced ground shaking. EOS:Transactions of the American Geophysical Union 75 (26):299–301.
Hoque, B. A., Sack, R. B., Siddiqui, M., Jahangir,A. M., Hazera, N. and Nahid, A. (1993)Environmental health and the 1993 Bangladeshcyclone. Disasters 17: 144–52.
Horikawa, K. and Shuto, N. (1983) Tsunamidisasters and protection measures in Japan. In K.Iida and T. Iwasaki (eds) Tsunamis, pp. 9–22.Boston, MA: D. Reidel.
Houze, R. A. Jr et al. (2007) Hurricane intensityand eyewall replacement. Science 315, 2 March:1235–9.
B IBL IOGRAPHY354

Howe, P. and Devereux, S. (2004) Famine intensityand magnitude scales: a proposal for an instrumentaldefinition of famine. Disasters 28: 353–72.
Hoyos, C. D., Agudelo, P. A., Webster, P. J. andCurry, J. A. (2006) Deconvolution of the factorscontributing to the increase in global hurricaneintensity. Science 312: 94–7.
Hoyt, W. G. and Langbein, W. B. (1955) Floods.Princeton, NJ: Princeton University Press.
Huang, Z., Rosowsky, D. V. and Sparks, P. R.(2001) Long-term hurricane risk assessment andexpected damage to residential structures. ReliabilityEngineering and System Safety 74: 239–49.
Hughes, P. (1979) The great Galveston hurricane.Weatherwise 32: 148–56.
Hulme, M. (2001) Climatic perspectives on Saharandesiccation: 1973–1998. Global EnvironmentalChange 11: 19–29.
Hung, J. J. (2000) Chi-Chi earthquake-inducedlandslides in Taiwan. Earthquake Engineering andEngineering Seismology 2: 25–33.
Hungr, O., Corominas, J. and Eberhardt, E. (2005)Estimating landslide motion mechanism, traveldistance and velocity. In O. Hungr, R. Fell, R.Couture and E. Eberhardt (eds) Landslide RiskManagement, pp. 99–128. London: Taylor andFrancis.
Hunt, B. G. (2000) Natural climatic variability andSahelian rainfall trends. Global and Planetary Change24: 107–31.
Hupp, C. R., Osterkamp, W. R. and Thornton, J. L. (1987) Dendrogeomorphic Evidence and Dating of Recent Debris Flows on Mount Shasta, NorthernCalifornia. US Geological Survey Professional Paper 1396–B. Washington, DC: US GeologicalSurvey.
Huppert, H. E. and Sparks, S. J. (2006) Extremenatural hazards: population growth, globalisationand environmental change. Philosophical Transactions
of the Royal Society A: Mathematical, Physical andEngineering Sciences 364: 1875–8.
Hürlimann, M., Copons, R. and Altimir, J. (2006)Detailed debris flow hazard assessment in Andorra:a multidisciplinary approach. Geomorphology 78:359–72.
Hurrell, J. W., Kushnir, Y. and Visbeck, M. (2001)The North Atlantic Oscillation. Science 291: 603–4.
Hwang, A. (2001) AIDS has arrived in India andChina: how will the world’s two most populouscountries cope with the pandemic? World Watch 14:12–20.
Hyde, W. T. and Crowley, T. J. (2000) Probabilityof climatically significant volcanic eruptions. Journalof Climate 13: 1445–50.
Institution of Civil Engineers (1995) Megacities:Reducing Vulnerability to Natural Disasters. London:Thomas Telford.
Interagency Performance Evaluation Taskforce(2006) Performance Evaluation of the New Orleans andSoutheast Louisiana Hurricane Protection System. DraftFinal report. Vol. I – Executive Summary andOverview. US Army Corps of Engineers.
International Federation of Red Cross and RedCrescent Societies (IFRCRCS) (1994) World DisastersReport 1994. Dordrecht: Martinus Nijhoff.
IFRCRCS (1999) World Disasters Report 1999:Geneva, International Federation of Red Cross andRed Crescent Societies.
IFRCRCS (2000) World Disasters Report 2000.Geneva: International Federation of Red Cross andRed Crescent Societies.
IFRCRCS (2002) World Disasters Report 2002.Geneva: International Federation of Red Cross andRed Crescent Societies.
IFRCRCS 2004 World Disasters Report 2004.Geneva: International Federation of Red Cross andRed Crescent Societies.
B IBL IOGRAPHY 355
IFRCRCS (2005) World Disasters Report 2005.Geneva: International Federation of Red Cross andRed Crescent Societies.
IFRCRCS (2006) World Disasters Report 2006.Geneva, International Federation of Red Cross andRed Crescent Societies.
Intergovernmental Panel on Climate Change (IPCC) (2007) Summary for policymakers. In M. L.Parry, O. F. Canziani, J. P. Palutikof, P. J. van der Linden and C. E. Hanson (eds) Climate Change2007: Impacts, Adaptation and Vulnerability.Contribution of Working Group II to the FourthAssessment Report, Intergovernmental Panel onClimate Change, pp. 7–22. Cambridge: CambridgeUniversity Press.
Intergovernmental Panel on Climate Change (IPCC)(2008) Climate Change 2007: Contribution of WorkingGroups I, II and III to the Fourth Assessment Report.Geneva: IPCC.
International Strategy for Disaster Reduction(ISDR) Secretariat (2003) Living with Risk: Turningthe Tide on Disasters Towards Sustainable Development.Geneva: United Nations.
International Strategy for Disaster Reduction(ISDR) (2006) Support for Sri Lanka from theUnited Nations University. Disaster Reduction in AsiaPacific-ISDR Informs 2: 63–5.
Ives, J. D. and Messerli, B. (1989) The HimalayanDilemma: Reconciling Development and Conservation.London: Routledge.
Jackson, E. L. and Burton, I. (1978) The process ofhuman adjustment to earthquake risk. In TheAssessment and Mitigation of Earthquake Risk, pp.241–60. Paris: UNESCO.
Jayaraman, V., Chandrasekhar, M. G. and Rao, V.R. (1997) Managing the natural disasters from spacetechnology inputs. Acta Astronautica 40: 291–325.
Jiang, T., Zhang, Q., Zhu, D. and Wu, Y. (2006)Yangtze floods and droughts (China) and tele-connections with ENSO activities (1470–2003).Quaternary International 144: 29–37.
Jibson, R. W. and Baum, R. L. (1999) Assessment ofLandslide Hazards in Kaluanui and Maakua Gulches,Oahu, Hawaii Following the 9 May Sacred FallsLandslide. Open File Report 99–364. Reston, VA:US Geological Survey.
Jiminez Dias, V. (1992) Landslides and the squattersettlements of Caracas. Environment and Urbanisation4: 80–9.
Jóhannesson, T. (2001) Run-up of two avalancheson the deflecting dams at Flateyri, north-westernIceland. Annals of Glaciology 32: 350–4.
Johnson, K. (1985) State and Community during theAftermath of Mexico City’s November 19, 1984, GasExplosion. Special Publication 13. Boulder, CO:Institute o£ Behavioral Science, University ofColorado.
Jones, D. K. C. (1992) Landslide hazard assessmentin the context of development. In G. J. H. McCall,J. C. Laming and S. C. Scott (eds) Geohazards,pp. 117–41. London: Chapman and Hall.
Jones, D. K. C. (1995) The relevance of landslidehazard to the International Decade for NaturalDisaster Reduction. In Landslide Hazard Mitigationwith Particular Reference to Developing Countries,pp. 19–33. Proceedings of a Conference. London:Royal Academy of Engineering.
Jones, D. K. C., Lee, E. M., Hearn, G. J. and Gene,S. (1989) The Catak landslide disaster, Trabzonprovince, Turkey. Terra Nova 1: 84–90.
Jones, F. O. (1973) Landslides of Rio de Janeiro and the Serra das Araras escarpment. Professional Paper697. Washington DC: US Geological Survey.
Jones, P. D. and Moberg, A. (2003) Hemisphericand large-scale surface air temperature variations: anextensive revision and update to 2001. Journal ofClimate 16: 206–23.
Jones, P. D., New, M., Parker, D. E., Martin, S. andRigor, I. G. (1999) Surface air temperature and itschanges over the past 150 years. Reviews of Geophysics37: 173–99.
B IBL IOGRAPHY356

Jones, S. R. and Mangun, W. R. (2001) Beachnourishment and public policy after HurricaneFloyd: where do we go from here? Ocean and CoastalManagement 44: 207–20.
Jones-Lee, M. W., Hammerton, M. and Philips, P. R. (1985) The value of safety: the results of anational survey. Economic Journal 95: 49–72.
Jowett, A. J. (1989) China: the demographicdisaster of 1958–1961. In J. L. Clarke, P. Curson, S. L. Kayastha and P. Nag (eds) Population andDisaster, pp. 137–58. Oxford: Basil Blackwell.
Kaczmarek, Z. (2003) The impact of climatevariability on flood risk in Poland. Risk Analysis 3:559–66.
Kaiser, R., Spiegel, P. B. Henderson, A. K. andGerber, M. L. (2003) The application of GeographicInformation Systems and Global PositioningSystems in humanitarian emergencies: lessonslearned, programme implications and futureresearch. Disasters 27: 127–40.
Kajoba, G. M. (1992) Food security and the impact ofthe 1991–92 drought in Zambia. Unpublished text oflecture delivered at the University of Stirling,October.
Karabork, M. C. (2007) Trends in drought patternsof Turkey. Journal of Environmental Engineering andScience 6: 45–52.
Karanci, A. N. and Rüstemli, A. (1995)Psychological consequences of the 1992 Erzincan(Turkey) earthquake. Disasters 19: 8–18.
Karter, M. J. (1992) Fire Loss in the United Statesduring 1991. Quincy, MA: Fire Analysis andResearch Division, National Fire ProtectionAssociation.
Kasperson, R. E., Renn, O., Slovic, P., Brown, H. S., Emel, J., Goble, R., Kasperson, J. X. andRatick, S. (1988) The social amplification of risk: aconceptual framework. Risk Analysis 8: 177–87.
Kates, R. W. (1962) Hazard and Choice Perception inFlood Plain Management. Paper 78. Chicago, IL:Department of Geography, University of Chicago.
Kates, R. W. (1971) Natural hazard in humanecological perspective: hypotheses and models.Economic Geography 47: 438–51.
Kates, R. W. (1978) Risk Assessment of EnvironmentalHazard. SCOPE report 8. New York: John Wiley.
Kates, R. W. and Kasperson, J. X. (1983)Comparative risk analysis of technological hazards(a review). Proceedings of National Academy of ScienceUSA 80: 7027–38.
Kates, R. W. et al. (2001) Sustainability science.Science 292: 641–2.
Keating, B. H. and McGuire, W. (2000) Islandedifice failures and associated tsunami hazards. Pureand Applied Geophysics 157: 899–955.
Keaton, J. R. (1994) Risk-based probabilisticapproach to site selection. Bulletin of the Associationof Engineering Geologists 31: 217–29.
Keefer, D. K. (1984) Landslides caused byearthquakes. Bulletin of the Geological Society ofAmerica. 95: 406–21.
Keefer, D. K., Wilson, R. C., Mark, R. K., Brabb,E. E., Brown, W. M. III., Ellen, S. D., Harp, E. L.,Wieczorek, G. F., Alger, C. S. and Zatkin, R. S.(1987) Real-time landslide warning during heavyrainfall. Science 238: 921–5.
Keeney, R. L. (1995) Understanding life-threatening risks. Risk Analysis 15: 627–37.
Keeney, R. L. and von Winterfeldt, D. (1994)Managing nuclear waste from power plants. RiskAnalysis 14: 107–8.
Keeves, A. and Douglas, D. R. (1983) Forest firesin South Australia on 16 February 1983 andconsequent future forest management aims.Australian Forestry 46: 148–64.
Kelly, M. (1992) Anthropometry as an indicator ofaccess to food in populations prone to famine. FoodPolicy 17: 443–54.
Kelly, M. and Buchanan-Smith, M. (1994)Northern Sudan in 1991: food crisis and theinternational relief response. Disasters 18: 16–34.
B IBL IOGRAPHY 357

Kerle, N. and Oppenheimer, C. (2002) Satelliteremote sensing as a tool in lahar disastermanagement. Disasters 26: 140–60.
Kervyn, F. 2001 Modelling topography with SARinterferometry: illustrations of a favourable and lessfavourable environment. Computers and Geosciences27: 1039–50.
Key, D. (ed.) (1995) Structures to Withstand Disaster.London: Institution of Civil Engineers and ThomasTelford.
Khan, F. I. and Abbasi, S. A. (2001) An assessmentof the likelihood of occurrence and the damagepotential of domino effect (chain of accidents) in atypical cluster of industries. Journal of Loss Preventionin the Process Industries 14: 283–306.
Kidon, J., Fox, G., McKenney, D. and Rollins, K.(2002) An enterprise-level economic analysis oflosses and financial assistance for eastern Ontariomaple syrup producers from the 1998 ice storm.Forest Policy and Economics 4: 201–11.
Kilburn, C. R. J. and Petley, D. N. (2003)Forecasting giant catastrophic slope collapse: lessonsfrom Vajont, northern Italy. Geomorphology 54:21–32.
Kininmonth, W. (2003) Climate change – a naturalhazard. Energy and Environment 14: 215–32.
Kintisch, E. 2005 Levees came up short, researcherstell Congress. Science 310: 953–5.
Kirchsteiger, C. (1999) Trends in accidents,disasters and risk sources in Europe. Journal of LossPrevention in the Process Industries 12: 7–17.
Kitler, M. E., Gavinio, P. and Lavanchy, D. (2002)Influenza and the work of the World HealthOrganisation. Vaccine (Supplement 2) 20: 5–14.
Kiyono, J. and Kalantari, A. (2004) Collapsemechanism of adobe and masonry structures duringthe 2003 Iran Bam earthquake. Bulletin of EarthquakeResearch Institute, University of Tokyo 13: 157–61.
Klein, R. J. T., Nicholls, R. J. and Thomalla, F.(2003) Resilience to natural hazards: how useful isthis concept? Environmental Hazards 5: 35–45.
Klinenberg, E. (2002) Heat Wave: A Social Autopsyof Disaster in Chicago. Chicago and London:University of Chicago Press.
Kling, G. W. et al. (2005) Degassing Lakes Nyosand Momoun: defusing certain disaster. Proceedingsof the National Academy of Sciences of the USA 102:1485–90.
Knox, J. C. (2000) Sensitivity of modern andHolocene floods to climate change. Quaternary ScienceReviews 19: 439–57.
Koe, L. C. C., Arellano, A. F. Jr. and McGregor, J. L.(2001) Investigating the haze transport from 1997biomass burning in south-east Asia: its impact uponSingapore. Atmospheric Environment 35: 2723–34.
Kobayashi, Y. (1981) Causes of fatalities in recentearthquakes in Japan. Journal of Disaster Science 3:15–22.
Kovats, R., Bouma, M., Hajat, S., Worrall, E. andHaines A. (2003) El Niño and health. The Lancet362: 1481–9.
Kovats, S. (2008) Health Effects of Climate Change inthe UK. London: Health Protection Agency.
Krall, S. (1995) Desert locusts in Africa: a disaster?Disasters 19: 1–7.
Kreimer, A. and Munasinghe, M. (eds) (1991)Managing Natural Disasters and the Environment.Washington, DC: Environment Department, WorldBank.
Krewski, D., Clayson, D. and McCullough, R. S.(1982) Identification and measurement of risk. In I. Burton, C. D. Fowle and R. S. McCullough (eds)Living with Risk. Environmental Monograph 3, pp. 7–23. Toronto: Institute of EnvironmentalStudies, University of Toronto.
Krinitsky, E. L. and Hynes, M. E. (2002) The Bhuj,India, earthquake: lessons learned for earthquakesafety of dams on alluvium. Engineering Geology 66:163–96.
Kumar, K. K., Rajagopatan, B., Hoerling, M.,Bates, G. and Cane, M. (2006) Unravelling themystery of Indian monsoon failure during El Niño.Science 314: 115–19.
B IBL IOGRAPHY358

Kunii, O., Nakamura, S., Abdur, R. and Wakai, S.(2002) The impact on health and risk factors of thediarrhoea epidemics in the 1998 Bangladesh floods.Public Health 116: 68–74.
Kusler, J. and Larson, L. (1993) Beyond the ark: anew approach to US floodplain management.Environment 35: 7–34.
Lacoursiere, P. E. J.-P. (2005) Bhopal and its effectson the Canadian regulatory framework. Journal ofLoss Prevention in the Process Industries 18: 353–9.
Lagadec, P. (1982) Major Technological Risk: AnAssessment of Industrial Disasters. Oxford: PergamonPress.
Lagadec, P. (1987) From Seveso to Mexico andBhopal: learning to cope with crises. In P. R.Kleindorfer and H. C. Kunreuther (eds) Insuring andManaging Hazardous Risks, pp. 13–27. New York:Springer-Verlag.
Lagadec, P. (2004) Understanding the French 2003heat wave experience: beyond the heat, a multi-layered challenge. Journal of Contingencies and CrisisManagement 12: 160–9.
Lambert, S. J. (1996) Intense extratropical northernhemisphere winter cyclone events: 1899–1991.Journal of Geophysical Research 101: 21319–25.
Lander, J. F., Whiteside, L. S. and Lockridge, P. A.(2003) Two decades of global tsunamis 1982–2002.Science of Tsunami Hazards 21: 3–88.
Landsea, C. W. (2000) Climate variability of tropicalcyclones. In R. A. Pielke Jr and R. A. Pielke Sr (eds)Storms, vol. 1, pp. 220–41. London and New York:Routledge.
Landsea, C. W. (2005) Meteorology: hurricanes andglobal warming. Nature 438: E11–E12.
Landsea, C. W. (2007) Counting Atlantic tropicalcyclones back to 1900. Eos 88: 197–202.
Landsea, C. W., Gray, W. M, Mielke, P. W. andBerry, K. J. (1994) Seasonal forecasting of Atlantichurricane activity. Weather 49: 273–84.
Landsea, C. W., Pielke, R. A. Jr., Mestas-Nuñez, A. M. and Knaff, J. A. (1999) Atlantic basinhurricanes: indices of climatic changes. ClimaticChange 42: 89–129.
Landsea, C. W., Harper, B. A., Hoarau, K. andKnaff, J. A. (2006) Can we detect trends in extremetropical cyclones? Science 313: 452–4.
Lane, L. R., Tobin, G. A. and Whiteford, L. M.(2003) Volcanic hazard or economic destitution:hard choices in Baños, Ecuador. EnvironmentalHazards 5: 23–34.
Langenbach, R. (2005) Performance of the earthenArg-e-Bam (Bam citadel) during the 2003 Bam,Iran, earthquake. Earthquake Spectra 21: S345–74.
Lavigne, F., Thouret, J. C., Voight, B., Suwa, H. andSumaryono, A. (2000) Lahars at Merapi volcano,central Java: an overview. Journal of Volcanology andGeothermal Research 100: 423–56.
Le, T. V. H., Nguyen, H. N., Wolanski, E., Tran, T. C. and Haruyama, S. (2006) The combinedimpact on the flooding of Vietnam’s Mekong riverdelta of local man-made structures, sea level rise anddams upstream in the river catchment. Estuarine,Coastal and Shelf Science 65: 1–7.
Leader, N. (2000) The Politics of Principle: ThePrinciples of Humanitarian Action in Practice. Report2. London: Humanitarian Policy Group, OverseasDevelopment Institute.
Lecomte, E. (1989) Earthquakes and the insuranceindustry. Natural Hazards Observer 14: 1–2.
Ledoux, L., Cornell, S., O’Riordan, T., Harvey, R.and Banyard, L. (2005) Towards sustainable floodand coastal management: identifying drivers of, andobstacles to, managed realignment. Land Use Policy22: 129–44.
Leimena, S. L. (1980) Traditional Balineseearthquake-proof housing structures. Disasters 4:147–50.
Lewis, H. W. (1990) Technological Risk. New York:W. H. Norton.
B IBL IOGRAPHY 359
Liao, Y.-H., Lin, S.-F., Liao, W.-H., Hunag, J.-H.,Shen, M., Lin, C.-H., and Huang, C.-H. (2005)Deaths related to housing in 1999 Chi-Chi, Taiwan,earthquake. Safety Science 43: 29–37.
Ligon, B. L. (2004) Dengue fever and denguehemorrhagic fever: a review of the history, trans-mission, treatment and prevention. Seminars inPediatric Infectious Diseases, 15, pp. 60–5. Oxford:Elsevier.
Ligon, B. L. (2006) Infectious diseases that posespecific challenges after natural disasters: a review.Seminars in Pediatric Infectious Diseases, 17, pp. 36–45.Oxford: Elsevier.
Lindell, M. K. and Perry, R. W. (2000) Householdadjustment to earthquake hazards: a review ofresearch. Environment and Behavior 32: 461–501.
Lindell, M. K. and Whitney, D. J. (2000) Correlatesof household seismic hazard adjustment adoption.Risk Analysis 20: 13–25.
Lindell, M. K., Lu, J.-C. and Prater, C. S. (2005)Household decision-making and evacuation inresponse to Hurricane Lili. Natural Hazards Review6: 171–9.
Linnerooth-Bayer, J., Mechler, R. and Pflug, G.(2005) Refocusing disaster aid. Science 309: 1044–6.
Litman, T. (2006) Lessons from Katrina and Rita:what major disasters can teach transportationplanners. Journal of Transportation Engineering 132:11–18.
Lloyd, S. J., Kovats, R. S. and Armstrong, B. G.(2007) Global diarrhoea morbidity, weather andclimate. Climate Research 34: 119–27.
Lockridge, P. (1985) Tsunamis: the scourge of thePacific. UNDRO News (Jan/Feb): 14–17.
Lott, J. N. (1994) The US summer of 1993: a sharpcontrast in weather extremes. Weather 49: 370–83.
Lounibos, L. P. (2002) Invasions by insect vectors ofhuman disease. Annual Review of Entomology 47:233–66.
Lucas-Smith, P. and McRae, R. (1993) Fire riskproblems in Australia. STOP Disasters 11: 3–4.
Luke, R. H. and McArthur, A. G. (1978) Bushfiresin Australia. Canberra, Australian GovernmentPublishing Service.
Lumb, P. (1975) Slope failures in Hong Kong.Quarterly Journal of Engineering Geology 8: 31–65.
Lund, D. C., Lynch-Stieglitz, J. and Curry, W. B.(2006) Gulf stream density structure and trans-port during the past milennium. Nature 444:601–4.
McDaniels, T. L., Karalet, M. S. and Fischer, G. W.(1992) Risk perception and the value of safety. RiskAnalysis 12: 495–503.
MacGregor, D., Slovic, P., Mason, R. G., Detweiler,J., Binney, S. E. and Dodd, B. (1994) Perceived
risks of radioactive waste transport throughOregon: results of a statewide survey. Risk Analysis14: 5–14.
McGee, T. K. (2005) Completion of recommendedWUI fire mitigation measures within urban house-holds in Edmonton, Canada. Environmental Hazards6: 147–57.
McGee, T. K. and Russell, S. (2003) ‘It’s just anatural way of life . . .’ An investigation of wildfirepreparedness in rural Australia. EnvironmentalHazards 5: 1–12.
McGuire, W. J. (2006) Global risk from extremegeophysical events: threat identification andassessment. Philosophical Transactions of the RoyalSociety A: Mathematical, Physical and EngineeringSciences 364: 1889–909.
McGuire, B., Mason, I. and Kilburn, C. (2002)Natural Hazards and Environmental Change. London:E. Arnold.
McGuire, L. C., Ford, E. S. and Okoro, C. A. (2007)Natural disasters and older US adults with dis-abilities: implications for evacuation. Disasters 31:49–56.
B IBL IOGRAPHY360

McKay, J. M. (1983) Newspaper reporting ofbushfire disaster in south-eastern Australia: AshWednesday 1983. Disasters 7: 283–90.
McKee, C. O., Johnson, R. W., Lowenstein, P. L.,Riley, S. J., Blong R. J., de Saint Ours, P. and Talai,B. (1985) Volcanic hazards, surveillance and eruptioncontingency planning. Journal of Volcanology andGeothermal Research 23: 195–237.
McLean, S. N. and Moore, D. R. (2005) A miti-gation strategy for the natural disaster of poverty inBangladesh. Disaster Prevention and Management 14:223–32.
McLennan, J. and Birch, A. (2005) A potential crisisin wildfire emergency response capability? Australia’svolunteer firefighters. Environmental Hazards 6:101–7.
McMichael, T. (2001) Human Frontiers, Environmentsand Disease: Past Patterns, Uncertain Futures.Cambridge: Cambridge University Press.
McNutt, S. R. (1996) Seismic monitoring anderuption forecasting of volcanoes: a review of thestate of the art and case histories. In R. Scarpa andR. I. Tilling (eds) Monitoring and Mitigation ofVolcano Hazards, pp. 99–146. Berlin: Springer-Verlag.
McSaveney, M. J. (2002) Recent rockfalls and rockavalanches in Mount Cook National Park, NewZealand. In S. G. Evans and J. V. DeGraff (eds)Catastrophic Landslides: Effects, Occurrence andMechanisms, pp. 35–70. Boulder, CO: GeologicalSociety of America.
Macrae, J., Collinson, S., Buchanan-Smith, M.,Reindorp, N., Schmidt, A., Mowjee, T. and Harmer,A. (2002) Uncertain Power: The Changing Role ofOfficial Donors in Humanitarian Action. Report 12.London: Humanitarian Policy Group, OverseasDevelopment Institute.
Macklin, M. G. and Rumsby, B. T. (2007) Changingclimate and extreme floods in the British uplands.Transactions of the Institute of British Geographers 32:168–86.
Major, J. J., Schilling, S. P., Pullinger, C. R.,Escobar, C. D. and Howell, M. M. (2001) Volcano-Hazard Zonation for San Vicente Volcano, El Salvador.Open-File Report 01–387, Vancouver, WA: USGeological Survey.
Malet, J.-P., Maquaire, O., and Calais, E. (2002) Theuse of Global Positioning System techniques for the continuous monitoring of landslides: applicationto the Super-Sauze earthflow (Alpes-de-Haute-Provence, France). Geomorphology 43: 33–54.
Malheiro, A. (2006) Geological hazards in theAzores archipelago: volcanic terrain instability andhuman vulnerability. Journal of Volcanology andGeothermal Research 156: 158–71.
Malingreau, J. P. and Kasawanda, X. (1986)Monitoring volcanic eruptions in Indonesia usingweather satellite data: the Colo eruption of July 281983. Journal of Volcanology and Geothermal Research27: 179–94.
Malmquist, D. L. and Michaels, A. F. (2000) Severestorms and the insurance industry. In R. A. PielkeJr and R. A. Pielke Sr (eds), Storms, vol. 1, pp.54–69. London and New York: Routledge.
Malone, A. W. (2005) The story of quantified riskand its place in slope safety policy in Hong Kong.In T. Glade, M. G. Anderson and M. Crozier (eds)Landslide Hazard and Risk, pp. 643–74. Chichester:John Wiley.
Maneyena, S. B. (2006) The concept of resiliencerevisited. Disasters 30 (4): 433–50.
Mann, M. E. (2007) Climate over the past twomillenia. Annual Review of Earth and PlanetarySciences 35: 111–36.
Mannan, M. S. et al. (2005) The legacy of Bhopal:the impact over the last 20 years and futuredirection. Journal of Loss Prevention in the ProcessIndustries 18: 218–24.
Marco, J. B. (1994) Flood risk mapping. In G. Rossi, N. Harmancioglu and V. Yevjevich (eds) Coping with Floods, pp. 353–73. Dordrecht:Kluwer.
B IBL IOGRAPHY 361
Margreth, S. and Funk, M. (1999) Hazard mappingfor ice and combined snow/ice avalanches – two casestudies from the Swiss and Italian Alps. Cold RegionsScience and Technology 30: 159–73.
Marinos, P., Bouckovalas, G., Tsiambaos, G.,Sabatakakis, N. and Antoniou, A. (2001) Groundzoning against seismic hazard in Athens, Greece.Engineering Geology 62: 343–56.
Marsden, B. G. and Steel, D. I. (1994) Warningtimes and impact probabilities for long-periodcomets. In T. Gehrels (ed.) Hazards due to Asteroidsand Comets, pp. 221–39. Tucson: University ofArizona Press.
Martens, P., McMichael, A., Kovats, S. andLivermore, M. (1998) Impacts of climate change onhuman health: malaria. In Climate Change and ItsImpacts, p. 10. Bracknell, Berks: MeteorologicalOffice and Department of Energy, Transport and theRegions.
Mason, J. and Cavalie, P. (1965) Malaria epidemicin Haiti following a hurricane. American Journal ofTropical Medicine and Hygiene 14: 533–9.
Mathur, K. and Jayal, N. G. (1992) Droughtmanagement in India: the long term perspective.Disasters 16: 60–5.
Mattinen, H. and Ogden, K. (2006) Cash-basedinterventions: lessons from southern Somalia.Disasters 30: 297–315.
Maxwell, D. (2007) Global factors shaping thefuture of food aid: the implications for WFP.Disasters 31 (Supplement 1): S25–S39.
Meehl, G. A., Karl, T., Easterling, D. R. et al.(2000) An introduction to trends in extremeweather and climate events: observations, socio-economic impacts, terrestrial ecological impacts andmodel projections. Bulletin of the AmericanMeteorological Society 81: 413–16.
Mejía-Navarro, M. and Garcia, L. A. (1996) Naturalhazard and risk assessment using decision-supportsystems: Glenwood Springs, Colorado. Environmentaland Engineering Geoscience 1: 291–8.
Meltsner, A. J. (1978) Public support for seismicsafety: where is it in California? Mass Emergencies 3:167–84.
Menoni, S. (2001) Chains of damages and failuresin a metropolitan environment: some observationson the Kobe earthquake in 1995. Journal ofHazardous Materials 86: 101–19.
Mercer, D. (1971) Scourge of an arid continent.Geographical Magazine 45: 563–7.
Messerli, B., Grosjean, M., Hofer, T., Lautaro, N. andPfister, C. (2000) From nature-dominated to human-dominated environmental changes. Quaternary ScienceReviews 19: 459–79.
Mileti, D. S. and Darlington, J. D. (1995) Societalresponses to revised earthquake probabilities in theSan Francisco Bay area. International Journal of MassEmergencies and Disasters 13: 119–45.
Mileti, D. S. and Myers, M. F. (1997) A bolder coursefor disaster reduction: imagining a sustainablefuture. Revista Geofisica 47: 41–58.
Mileti, D. S., Darlington, J. D., Passerine, E.,Forrest, B. C. and Myers, M. F. (1995) Toward anintegration of natural hazards and sustainability.Environmental Professional 17: 117–26.
Mileti, D. S. et al. (1999) Disasters by Design: AReassessment of Natural Hazards in the United States.Washington, DC: Joseph Henry Press.
Miller, C. D., Mullineaux, D. R. and Crandell, D. R.(1981) Hazards assessments at Mount St Helens. InR. W. Lipman and D. R. Mullineaux (eds) The 1980Eruption of Mount St Helens, Washington. US GeologicalSurvey Professional Paper 1250: 789–802.
Mills, E. (2005) Insurance in a climate of change.Science 309: 1040–3.
Mirza, M. M. Q. (2002) Global warming andchanges in the probability of occurrence of floods inBangladesh and implications. Global EnvironmentalChange 12: 127–38.
Mirza, M. M. Q., Warrick, R. A., Ericksen, N. J.and Kenny, G. J. (2001) Are floods getting worse in
B IBL IOGRAPHY362
the Ganges, Brahmaputra and Meghna basins?Environmental Hazards 3: 37–48.
Mitchell, J. K. (1999) Natural disasters in thecontext of mega-cities. In J. K. Mitchell (ed.)Crucibles of Hazard, pp. 15–55. Tokyo: UnitedNations University Press.
Mitchell, J. K. (2003) European river floods in achanging world. Risk Analysis 23: 567–71.
Mitsch, W. J. and Day, J. W. (2006) Restoration ofwetlands in the Mississippi-Ohio-Missouri (MOM)River Basin: experience and needed research.Ecological Engineering 26: 55–69.
Mizutani, T. and Nakano, T. (1989) The impact ofnatural disasters on the population of Japan. In J. I. Clarke, P. Curson, S. L. Kayastha and P. Nag(eds) Population and Disaster, pp. 24–33. Oxford:Basil Blackwell.
Mogil, H. M. et al. (1984) The Great Freeze of ’83: analysing the causes and the effects. Weatherwise7: 304–8.
Molyneux, D. H. (1998) Vector-borne parasiticdiseases – an overview of recent changes. InternationalJournal of Parasitology 28: 927–34.
Monath, T. P. (1994) Yellow fever and dengue – theinteractions of virus, vector and host in the re-emergence of epidemic disease. Seminars in Virology5: 133–45.
Montz, B. E. and Grundfest, E. C. (1986) Changesin American floodplain occupancy since 1958: theexperiences of nine cities. Applied Geography 6:325–38.
Montz, B. E. and Gruntfest, E. C. (2002) Flash floodmitigation: recommendations for research andapplications. Environmental Hazards 4: 15–22.
Moore, P. G. (1983) The Business of Risk. Cambridge:Cambridge University Press.
Morris, J., West, G., Holck, S., Blake, P.,Echeverria, P. and Karaulnik, M. (1982) Choleraamong refugees in Rangsil, Thailand. Journal ofInfectious Diseases 1: 131–4.
Morris, S. S., Neidecker-Gonzales, O., Carletto, C.,Munguia, M., Medina, J. M. and Wodon, Q. (2002)Hurricane ‘Mitch’ and the livelihoods of the ruralpoor in Honduras. World Development 30: 49–60.
Morrison, D. (2006) Asteroid and comet impacts:the ultimate environmental catastrophe. PhilosophicalTransactions of the Royal Society A: Mathematical,Physical and Engineering Sciences 364: 2041–54.
Morrow, B. H. (1999) Identifying and mappingcommunity vulnerability. Disasters 23: 1–18.
Mortimore, M. J. and Adams, W. M. (2001) Farmeradaptation, change and ‘crisis’ in the Sahel. GlobalEnvironmental Change 11: 49–57.
Morton, A. (1998) Hong Kong: managing slopesafety in urban systems. STOP Disasters 33: 8–9.
Morton, J. and Barton, D. (2002) Destocking as adrought-mitigation strategy: clarifying rationalesand answering critiques. Disasters 26: 213–28.
Moszynski, P. (2004) Cold is the main health threatafter the Bam earthquake. British Medical Journal328: 66.
Mothes, P. A. (1992) Lahars of Cotopaxi volcano,Ecuador: hazard and risk evaluation. In G. J. H.McCall, D. J. C. Laming and S. C. Scott (eds)Geohazards, pp. 53–63. London: Chapman and Hall.
Msangi, J. P. (2004) Drought hazard and desertifi-cation management in the dry lands of SouthernAfrica. Environmmental Monitoring and Assessment 99:75–87.
Mulady, J. J. (1994) Building codes: they’re not justhot air. Natural Hazards Observer 18: 4–5.
Munich Re (1999) Topics 2000. Report of theGeoscience Research Group. Munich: MunichReinsurance Company.
Munich Re (2001) Topics 2001. Report of theGeoscience Research Group. Munich: MunichReinsurance Company.
Munich Re (2002a) Topics 2002. Report of theGeoscience Research Group. Munich: MunichReinsurance Company.
B IBL IOGRAPHY 363
Munich Re (2002b) Winter Storms in Europe (II):Analysis of 1999 Losses and Loss Potentials. Munich:Geo Risks Research Department, Munich ReGroup.
Munich Re (2005) Topics Geo Annual Review: NaturalCatastrophes 2005. Munich: Geo Risks ResearchDepartment, Munich Re Group.
Munich Re (2006) Topics Geo Annual Review: NaturalCatastrophes 2006. Munich: Geo Risks ResearchDepartment, Munich Re Group.
Murphy, F. A. and Nathanson, N. (1994) Theemergence of new virus diseases: an overview.Seminars in Virology 5: 87–102.
Murphy, S. J., Washington, R., Downing, T. E.,Martin, R. V., Ziervogel, G., Preston, A., Todd, M.,Butterfield, R. and Briden, J. (2001) Seasonalforecasting for climate hazards: prospects andresponses. Natural Hazards 23: 171–96.
Mustafa, D. (2003) Reinforcing vulnerability?Disaster relief, recovery and response to the 2001flood in Rawalpindi, Pakistan. EnvironmentalHazards 5: 71–82.
Nakano, T. and Matsuda, I. (1984) Earthquakedamage, damage prediction and counter measuresin Tokyo, Japan. Ekistics 51: 415–20.
Nash, J. R. (1976) Darkest Hours: A NarrativeEncyclopaedia of Worldwide Disasters from Ancient Timesto the Present. Chicago, IL: Nelson Hall.
Nasrabadi, A. A., Naji, H., Mirzabeigi, G. andDadbakhs, M. (2007) Earthquake relief: Iraniannurses’ responses in Bam, 2003, and lessons learned.International Nursing Review 54: 13–18.
National Weather Service (2006) Hurricane KatrinaAugust 23–31 2005: Service Assessment. Silver Spring, MD: National Oceanic and AtmosphericAdministration, US Department of Commerce.
Neal, J. and Parker, D. J. (1988) FloodplainEncroachment: a Case Study of Datchet, UK. Geographyand Planning Paper 22. Enfield, Middx: MiddlesexPolytechnic.
Nelson, A. C. and French, S. P. (2002) Plan qualityand mitigating damage from natural disasters.Journal of the American Planning Association 68:194–207.
Newhall, C. G. and Self, S. (1982) The VolcanicExplosivity Index (VEI): an estimate of explosivemagnitude for historical volcanism. Journal ofGeophysical Research 87: 1231–8.
Newman, C. J. (1976) Children of disaster: clinicalobservations at Buffalo Creek. American Journal ofPsychiatry 133: 306–12.
Nicholls, R. J. (1998) Impacts on coastal com-munities. In Climate Change and its Impacts, p. 9.Bracknell, Berks: Meteorological Office andDepartment of Energy Transport and the Regions.
Nicholls, R. J., Hoozemans, F. M. J. and Marchand,M. (1999) Increasing flood risk and wetland losses due to global sea-level rise: regional andglobal analyses. Global Environmental Change 9:S69–S87.
Noji, E. K. (ed.) (1997) The Public Health Consequencesof Disaster. New York: Oxford University Press.
Noji, E. K. (2001) The global resurgence ofinfectious diseases. Journal of Contingencies and CrisisManagement 9: 223–32.
Noji, E. K., Armenian, H. K. and Oganessian, A.(1993) Issues of rescue and medical care followingthe 1988 Armenian earthquake. International Journalof Epidemiology 22: 1070–6.
Nordstrom, K. F., Jackson, N. L., Bruno, M. S. andde Butts, H. A. (2002) Municipal initiatives formanaging dunes in coastal residential areas: a casestudy of Avalon, New Jersey, USA. Geomorphology47: 137–52.
Normile, D. (2007) Tsunami warning system showsagility and gaps in Indian Ocean network. Science317: 1661.
Nowak, R. (2007) The continent that ran dry. NewScientist 16 June: 8–11.
B IBL IOGRAPHY364

Nyberg, J. et al. (2007) Low Atlantic hurricaneactivity in the 1970s and 1980s compared to thepast 270 years. Nature 447, 7 June: 698–701.
Overseas Development Institute (ODI) (2008)Rising food prices: A global crisis. London: ODI, 4 pp. XXXXXXX
Organisation for Economic Co-operation andDevelopment (OECD) (2003) OECD GuidingPrinciples for Chemical Accident Prevention, Preparednessand Response. Paris: OECD Publications Service.
Oechsli, F. W. and Buechly, R. W. (1970) Excessmortality associated with three Los AngelesSeptember hot spells. Environmental Research 3:277–84.
Office of Science and Technology (2004) FutureFlooding. Report produced by the Flood and CoastalDefence Project. London: Foresight Programme.
Office of US Foreign Disaster Assistance (OFDA)(1994) Annual Report Financial Year 1993.Washington, DC: Office of US Foreign DisasterAssistance, Agency for International Development.
Ojaba, E., Leonardo, A. I. and Leonardo, M. I.(2002) Food aid in complex emergencies: lessonsfrom Sudan. Social Policy and Administration 36:664–84.
Okrent, D. (1980) Comment on societal risk. Science208: 372–5.
Olsen, G. R., Carstensen, N. and Høyen, K. (2003)Humanitarian crises: What determines the level ofemergency assistance? Media coverage, donorinterests and the aid business. Disasters 27: 109–26.
Olshansky, R. B. (2006) Planning after HurricaneKatrina. Journal of the American Planning Association72: 147–54.
Olshansky, R. B. and Wu, Y. (2001) Earthquake riskanalysis for Los Angeles County under present andplanned land uses. Environment and Planning B:Planning and Design 28: 419–32.
Olurominiyi, O. I., Mushkatel, A. and Pijawka, K. D. (2004) Social and political amplification of
technological hazards: the case of the PEPCONexplosion. Journal of Hazardous Materials A114:15–25.
Omachi, T. (1997) Drought Conciliation and WaterRights: Japanese Experience. Water Series 1. Tokyo:Infrastructure Development Institute.
O’Meagher, B., Stafford-Smith, M. and White, D. H. (2000) Approaches to integrated drought risk management. In D. A. Wilhite (ed.) Drought,pp. 115–28. London and New York: Routledge.
Othman-Chande, M. (1987) The Cameroon volcanicgas disaster: an analysis of a makeshift response.Disasters 11: 96–101.
Palmer, W. C. (1965) Meteorological Drought.Research Paper 45. Washington, DC: US WeatherBureau, Department of Commerce.
Parasuraman, S. (1995) The impact of the 1993Latur-Osmanabad (Maharashtra) earthquake onlives, livelihoods and property. Disasters 19: 156–69.
Parise, M. (2001) Landslide mapping techniquesand their use in the assessment of landslide hazard.Solar, Terrestrial and Planetary Science 26: 697–703.
Parker, D. J. (ed.) (2000) Floods, Vols 1 and 2.London and New York: Routledge.
Park, S. K., Dalrymple, W. and Larsen, J. C. (2007)The 2004 Parkfield earthquake: test of theelectromagnetic precursor hypothesis. Journal ofGeophysical Research – Solid Earth 112: B05302.
Parliamentary Office of Science and Technology(2005) Early Warnings for Natural Disasters.Postnote 239. London: UK Parliament.
Paté-Cornell, M. E. (1993) Learning from the Piper Alpha accident: a postmortem analysis oftechnical and organizational factors. Risk Analysis 13:215–32.
Patel, T. (1995) Satellite senses risk of forest fires.New Scientist (11 March): 12.
Paul, A. and Rahman, M. (2006) Cyclone miti-gation perspective in the islands of Bangladesh: a
B IBL IOGRAPHY 365

case study of Sandwip and Hatia Islands. CoastalManagement 34: 199–215.
Paul, B. K. (1995) Farmers’ and public responses tothe 1994–95 drought in Bangladesh: A case study.Quick Response Report 76. Boulder, CO: NaturalHazards Research and Applications InformationCenter.
Paul, B. K. (1997) Survival mechanisms to copewith the 1996 tornado in Tangail, Bangladesh: acase study. Quick Response Report 92. Boulder, CO:Natural Hazards Research and ApplicationsInformation Center.
Paul, B. K. (2003) Relief assistance to 1998 floodvictims: a comparison of the performance of thegovernment and NGOs. The Geographical Journal169: 75–89.
Paul, B. K. and Bhuiyan, R. H. (2004) The April2004 tornado in north-central Bangladesh: a case forintroducing tornado forecasting and warningsystems. Quick Response Report 169. Boulder, CO:Natural Hazards Research and ApplicationsInformation Center.
Paul, B. K., Brock, V. T., Csiki, S and Emerson, L.(2003) Public response to tornado warnings: acomparative study of the May 4 2003 tornadoes inKansas, Missouri and Tennessee. Quick ResponseReport 165. Boulder, CO: Natural Hazards Researchand Applications Information Center.
Peacock, W. G., Brody, S. D. and Highfield, W.(2005) Hurricane risk perceptions among Florida’ssingle family homeowners. Landscape and UrbanPlanning 73: 120–35.
Peacock, W. G., Morrow, B. H. and Gladwin, H.(eds) (1997) Hurricane Andrew: Ethnicity, Gender andthe Sociology of Disasters. London and New York:Routledge.
Peek-Asa, C., Ramirez, M., Shoaf, K. and Seligson,H. (2002) Population-based case-control study ofinjury risk factors in the Northridge earthquake.Annals of Epidemiology 12: 525–6.
Peiris, L. M. N., Rossetto, T., Burton, P. W. andMahmood, S. (2006) EEFIT Mission: October 8 2005Kashmir Earthquake. Preliminary Reconnaisancereport, London, 31pp.
Pelling, M. and Uitto, J. I. (2001) Small islanddeveloping states: natural disaster vulnerability andglobal change. Global Environmental Change B:Environmental Hazards 3: 49–62.
Penning-Rowsell, E. C. and Wilson, T. (2006)Gauging the impact of natural hazards: the patternand cost of emergency response during flood events.Transactions of the Institute of British Geographers 31:99–115.
Perla, R. I. and Martinelli, M. Jr. (1976) AvalancheHandbook. Agriculture Handbook 489. Washington,DC: US Department of Agriculture (Forest Service).
Perrow, C. (1999) Natural Accidents: Living withHigh-risk Technologies (2nd edn). Princeton, NJ:Princeton University Press.
Perry, A. H. and Symons, L. J. (eds) (1991) HighwayMeteorology. London: E. and F. N. Spon.
Perry, C. A. (1994) Effects of Reservoirs on FloodDischarges in the Kansas and the Missouri River Basins,1993. Circular l20E. Denver, CO: US GeologicalSurvey.
Perry, R. W. and Godchaux, J. D. (2005) Volcanohazard management strategies: fitting policy topatterned human responses. Disaster Prevention andManagement 14: 183–95.
Perry, R. W. and Lindell, M. K. (1990) Predictinglong-term adjustment to volcano hazard. InternationalJournal of Mass Emergencies and Disasters 8: 117–36.
Peterson, D. W. (1996) Mitigation measures andpreparedness plans for volcanic emergencies. In R.Scarpa and R. I. Tilling (eds) Monitoring andMitigation of Volcano Hazards, pp. 701–18. Berlin:Springer-Verlag.
Petley, D. N., Hearn, G. J. and Hart, A. (2005)Towards the development of a landslide riskassessment for rural roads in Nepal. In T. Glade,
B IBL IOGRAPHY366

M. Anderson and M. J. Crozier (eds) LandslideHazard and Risk, pp. 597–620. Chichester: JohnWiley.
Petley, D. N., Dunning, S. A., Rosser, N. J. andKausar, A. B. (2006) Incipient earthquakes in the Jhelum valley, Pakistan, following the 8thOctober 2005 earthquake. In H. Marui (ed.) DisasterMitigation of Debris Flows, Slope Failures andLandslides. Frontiers of Science Series 47, pp. 47–56.Tokyo, Japan: Universal Academy Press.
Petley, D. N., Hearn, G. J., Hart, A., Rosser, N. J.,Dunning, S. A., Oven, K. and Mitchell, W. A.(2007) Trends in landslide occurrence in Nepal.Natural Hazards 43: 23–44.
Petrazzuoli, S. M. and Zuccaro, G. (2004) Structuralresistance of reinforced concrete buildings underpyroclastic flows: a study of the Vesuvian area.Journal of Volcanology and Geothermal Research 133:353–67.
Peyret, M., Chéry, J., Djamour, Y., Avallone, A.,Sarti, F., Briole, P. and Sarpoulaki, M. (2007) The source motion of 2003 Bam (Iran) earth-quake constrained by satellite and ground-basedgeodetic data. Geophysical Journal International 169:849–65.
Phillips, B. D., Metz, W. C. and Nieves, L. A. (2005)Disaster threat: preparedness and potential responseof the lowest income quartile. Environmental Hazards6: 123–33.
Phukan, A. C., Borah, P. K., Biswas, D. andMahanta, J. (2004) A cholera epidemic in a ruralarea of north-east India. Transactions of the RoyalSociety of Tropical Medicine and Hygiene 98: 563–6.
Pickrell, J. (2001) Scientists begin taming killerlake. Science 291: 965–6.
Pidgeon, N. and O’Leary, M. (2000) Man-madedisasters: why technology and organisationssometimes fail. Safety Science 34: 15–30.
Pielke, R. A. Jr (1997) Reframing the US hurricaneproblem. Society and Natural Resources 10: 485–99.
Pielke, R. A. Jr and Klein, R. (2005)Distinguishing tropical cyclone-related flooding inUS Presidential Disaster Declarations. NaturalHazards Review 6: 55–9.
Pielke, R. A. Jr and Landsea, C. W. (1998)Normalised hurricane damages in the United States1925–95. Weather and Forecasting 13: 621–31.
Pielke, R. A. Jr and Pielke, R. A. Sr (1997)Hurricanes: Their Nature and Impacts on Society.Chichester and New York: John Wiley.
Pielke, R. A. Jr and Pielke, R. A. Sr (2000) Stormsvols 1 and 2. London and New York: Routledge.
Pielke, R. A. Jr., Landsea, C. W., Mayfield, M.,Laver, J. and Pasch, R. (2005) Hurricanes and globalwarming. Bulletin of the American MeteorologicalSociety 86: 1571–5.
Pigram, J. J. (1986) Issues in the Management ofAustralia’s Water Resources. Melbourne: LongmanCheshire.
Pingali, P., Alinovi, L. and Sutton, J. (2005) Foodsecurity in complex emergencies: enhancing foodsystem resilience. Disasters 29 (SI): S5–S24.
Pinter, N. (2005) One step forward, two steps backon US floodplains. Science 308: 207–8.
Plafker, G. and Eriksen, G. E. (1978) NevadosHuascaran avalanches, Peru. In B. Voight (ed.)Rockslides and Avalanches, vol. 1: Natural Disasters,pp. 48–55. Amsterdam: Elsevier.
Platt, R. H. (1999) Natural hazards of the SanFrancisco Bay mega-city: trial by earthquake, windand fire. In J. K. Mitchell (ed.) Crucibles of Hazard,pp. 335–74. Tokyo: United Nations UniversityPress.
Platt, R. H., Salvesen, D. and Baldwin, G. H.(2002) Rebuilding the North Carolina coast afterHurricane Fran: did public regulations matter?Coastal Management 30: 249–69.
Ploughman, P. (1995) The American print newsmedia ‘construction’ of five natural disasters.Disasters 19: 308–26.
B IBL IOGRAPHY 367

Polemio, M. and Sdao, F. (1999) The role of rainfallin the landslide hazard: the case of the Aviglianourban area (southern Apennines, Italy). EngineeringGeology 53: 297–309.
Pomonis, A., Coburn, A. W. and Spence, R. J. S.(1993) Seismic vulnerability, mitigation of humancasualties and guidelines for low-cost earthquakeresistant housing. STOP Disasters 12, March–April: 6–8.
Pottier, N., Penning-Rowsell, E., Tunstall, S. andHubert, G. (2005) Land use and flood protection:contrasting approaches and outcomes in France andin England and Wales. Applied Geography 25: 1–27.
Poumadère, M., Mays, C., Le Mer, S. and Blong, R.(2005) The 2003 heat wave in France: dangerousclimate change here and now. Risk Analysis 25:1483–94.
Powell, M. D. (2000) Tropical cyclones during andafter landfall. In R. Pielke, Jr and R. Pielke, Snr (eds)Storms, vol. 1, pp. 196–219. London: Routledge.
Pradhan, E. K., West, K. P., Katz, J., Leclerk, S. C.,Khatry, S. K. and Shrestha, S. R. (2007) Risk offlood-related mortality in Nepal. Disasters 31:57–70.
Preuss, J. (1983) Land management guidelines fortsunami hazard zones. In K. Tida and T. Iwasaki(eds) Tsunamis, pp. 527–39. Boston, MA: Reidel.
Purtill, A. (1983) A study of the drought. QuarterlyReview of the Rural Economy 5: 3–11.
Pulwarty, R. S., Wilhite, D. A., Diodato, D. M. andNelson, D. I. (2007) Drought in changingenvironments: creating a roadmap, vehicles anddrivers. Natural Hazards Observer 31 (5): 10–12.
Pyle, A. S. (1992) The resilience of households tofamine in E1 Fasher, Sudan, 1982–89. Disasters 16:19–27.
Quarantelli, E. L. (1984) Perceptions and reactionsto emergency warnings of sudden hazards. Ekistics51: 511–15.
Quarantelli, E. L. (ed.) (1998) What is a Disaster?London and New York: Routledge.
Quayle, R. and Doehring, F. (1981) Heat stress: acomparison of indices. Weatherwise 34: 120–4.
Rahn, P. H. (1984) Floodplain managementprogram in Rapid City, South Dakota. Bulletin of theGeological Society of America 95: 838–43.
Rahu, M. (2003) Health effects of the Chernobylaccident: fears, rumours and the truth. EuropeanJournal of Cancer 39: 295–9.
Ramabrahmam, B. V. and Swaminathan, G. (2000)Disaster management plan for chemical processindustries. Case study: investigation of release ofchlorine to atmosphere. Journal of Loss Prevention inthe Process Industries 13: 57–62.
Ramachandran, R. and Thakur, S. C. (1974) Indiaand the Ganga floodplains. In G. F. White (ed.)Natural Hazards, pp. 36–43. New York: OxfordUniversity Press.
Ramanathan, V. (2007) Warming trends in Asiaamplified by brown cloud solar absorption. Nature448: 575–8.
Ramsey, M. S. and Flynn, L. P. (2004) Strategies,insights and the recent advances in volcanicmonitoring and mapping with data from NASA’sEarth Observing System. Journal of Volcanology andGeothermal Research 135: 1–11.
Ramsli, G. (1974) Avalanche problems in Norway.In G. F. White (ed.) Natural Hazards, pp. 175–80.New York: Oxford University Press.
Rapanos, D. et al. (1981) Floodproofing New Residential Buildings in British Columbia. Victoria, BC:Ministry of Environment, Province of BritishColumbia.
Ray, P. S. and Burgess, D. W. (1979) Doppler radar:research at the National Severe Storms Laboratory.Weatherwise 32: 68–75.
Reason, J. T. (1990) Human Error. Cambridge:Cambridge University Press.
Reichhardt, T., Check, E. and Marris, E. (2005)After the flood. Nature 437, 8 Sept: 174–6.
B IBL IOGRAPHY368

Renne, J. (2006) Evacuation and equity: a post-Katrina New Orleans diary. Planning 72: 44–6.
Reyes, P. J. D. (1992) Volunteer observers’ program:a tool for monitoring volcanic and seismic events inthe Philippines. In G. J. H. McCall, D. J. C. Lamingand S. C. Scott (eds) Geohazards, pp. 13–24. London:Chapman and Hall.
Rice, R. Jr., Decker, R., Jensen, N., Patterson, R.,Singer, S., Sullivan, C. and Wells, L. (2002)Avalanche hazard reduction for transportationcorridors using real-time detection and alarms. ColdRegions Science and Technology 34: 31–42.
Richardson, S. D. and Reynolds, J. M. (2000) Anoverview of glacial hazards in the Himalayas.Quaternary International 65: 31–47.
Riebsame, W. E., Diaz, H. F., Moses, T. and Price,M. (1986) The social burden of weather and climatehazards. Bulletin of the American Meteorological Society67: 1378–88.
Robertson, I. N., Riggs, H. R., Yim, S. and Young,Y. L. (2006) Lessons from Katrina. Civil EngineeringApril: 56–63.
Robock, A. (2000) Volcanic eruptions and climate.Reviews of Geophysics 38: 191–219.
Robock, A. (2002) Pinatubo eruption: the climaticaftermath. Science 295: 1242–4.
Rodrigue, C. M. and Rovai, E. (1995) The‘Northridge’ earthquake: differential geographies ofdamage, media attention and recovery. NationalSocial Science Perspectives Journal 7: 98–111.
Rohrmann, B. (1994) Risk perception of differentsocietal groups: Australian findings and cross-national comparisons. Australian Journal of Psychology46: 150–63.
Romme, W. H. and Despain, D. G. (1989) TheYellowstone fires. Scientific American 261: 37–46.
Ropelewski, C. F. and Folland, C. K. (2000)Prospects for the prediction of meteorologicaldrought. In D. A. Wilhite (ed.) Drought, vol. 1, pp. 21–40. London and New York: Routledge.
Rorig, M. L. and Ferguson, S. A. (2002) The 2000fire season: lightning-caused fires. Journal of AppliedMeteorology 41: 786–91.
Rose, G. A. (ed.) (1994) Fire Protection in RuralAmerica: A Challenge for the Future. Rural FireProtection in America Steering Committee, Reportto Congress sponsored by the National Associationof State Foresters, Washington, DC.
Rose, W. I. and Chesner, C. A. (1987) Dispersal ofash in the great Toba eruption, 75 k. a. Geology 15:913–17.
Ross, S. (2004) Toward New Understandings:Journalists and Humanitarian Relief Coverage. SanFrancisco, CA: Fritz Institute.
Rotstayn, L. (2007) Have Australian rainfall andcloudiness increased due to the remote effects ofAsian anthropogenic aerosols? Journal of GeophysicalResearch 112: D09202.
Royal Society (1992) Risk: Analysis, Perception andManagement. Report of a Royal Society Study Group.London: Royal Society.
Rubin, C. B. (1998) What hazards and disasters arelikely in the twenty-first century – or sooner? WorkingPaper 99. Boulder, CO: Natural Hazards Researchand Applications Information Center.
Rural Fire Protection in America (1994) FireProtection in Rural America: A Challenge for the Future.Washington DC: Rural Fire Protection in America.
Russell, L. A., Goltz, J. D. and Bourque, L. B.(1995) Preparedness and hazard mitigation actionsbefore and after two earthquakes. Environment andBehaviour 27: 744–70.
Sagan, L. A. (1984) Problems in healthmeasurements for the risk assessor. In P. F. Ricci, L. A. Sagan and C. G. Whipple (eds) TechnologicalRisk Assessment, pp. 1–9. The Hague: MartinusNijhoff.
Sagan, S. D. (1993) The Limits of Safety: Organisations,Accidents and Nuclear Weapons. Princeton, NJ:Princeton University Press.
B IBL IOGRAPHY 369

Salcioglu, E., Basoglu, M. and Livanov, M. (2007)Post-traumatic stress disorder and comorbiddepression among survivors of the 1999 earthquakein Turkey. Disasters 31: 115–29.
Sanders, J. F. and Gyakum, J. R. (1980) Synoptic-dynamic climatology of the bomb. Monthly WeatherReview 108: 1598–606.
Sapir, D. G. and Misson, C. (1992) The develop-ment of a database on disasters. Disasters 16: 74–80.
Sass, O. (2005) Temporal variability of rockfall inthe Bavarian Alps, Germany. Arctic, Antarctic andAlpine Research 37: 564–73.
Sauchyn, D. J. and Trench, N. R. (1978) LANDSATapplied to landslide mapping. PhotogrammetricEngineering and Remote Sensing 44: 735–41.
Saunders, M. A. and Lea, A. S. (2005) Seasonalpredictions of hurricane activity reaching the coastof the United States. Nature 434, April 21: 1005–8.
Scarpa, R. and Gasparini, P. (1996) A review ofvolcano geophysics and volcano-monitoringmethods. In R. Scarpa and R. I. Tilling (eds)Monitoring and Mitigation of Volcano Hazards,pp. 3–22. Berlin: Springer-Verlag.
Schaerer, P. A. (1981) Avalanches. In D. M. Gray andD. H. Male (eds) Handbook of Snow, pp. 475–518.Toronto: Pergamon.
Schmidlin, T. W., King, P. S., Hammer, B. O. andOno, Y. (1998) Risk factors for death in the 22–23February 1998 Florida tornadoes. Quick ResponseReport 106. Boulder, CO: Natural Hazards Researchand Applications Information Center.
Schuster, R. L. and Highland, L. M. (2001) Socio-economic and Environmental Costs of Landslides in theWestern Hemisphere. Open File Report 01–276.Reston, VA: US Geological Survey.
Schwartz, R. M. and Schmidlin, T. W. (2002)Climatology of blizzards in the coterminous UnitedStates 1959–2000. Journal of Climate 15: 1765–72.
Seaman, J., Leivesley, S. and Hogg, C. (1984)Epidemiology of Natural Disasters. Contributions toEpidemiology and Biostatistics, vol. 5. Basel. S. Karger.
Sepúlveda, S. A., Rebolledo, S. and Vargas, G.(2006) Recent catastrophic debris flows in Chile:geological hazards, climatic relationships andhuman response. Quaternary International 158:83–95.
Shaluf, I. M., Ahmadun, F. R. and Shariff, A. R.(2003) Technological disaster factors. Journal of LossPrevention in the Process Industries 16: 513–21.
Shanmugasundaram, J., Arunachalam, S.,Gomathinayagam, S., Lakshmanan, N. andHarikrishna, P. (2000) Cyclone damage to buildingsand structures – a case study. Journal of WindEngineering and Industrial Aerodynamics 84: 369–80.
Shaw, B. E. (1995) Frictional weakening and slipcomplexity in earthquake faults. Journal ofGeophysical Research 100: 18239–52.
Shepherd, J. M. and Knutson, T. (2007) The currentdebate on the linkage between global warming andhurricanes. Geography Compass 1: 1–24.
Shrubsole, D. (2000) Flood management in Canadaat the crossroads. Environmental Hazards 2: 63–75.
Siebert, L. (1992) Threats from debris avalanches.Nature 356: 658–9.
Siegert, F., Ruecker, G., Hinrichs, A. and Hoffman,A. A. (2001) Increased damage from fires in loggedforests during droughts caused by El Niño. Nature414: 437–40.
Sigurdsson, H. (1988) Gas bursts from Camerooncrater lakes: a new natural hazard. Disasters 12:131–46.
Sigurdsson, H. and Carey, S. (1986) Volcanicdisasters in Latin America and the 13 Novembereruption of Nevado del Ruiz volcano in Colombia.Disasters 10: 205–16.
Simkin, T. and Siebert, L. (1994) Volcanoes of theWorld. 2nd edn. Tucson, AZ: Geoscience Press.
Simkin, T., Siebert, L. and Blong, R. (2001) Volcanofatalities – lessons from the historical record. Science291: 255.
B IBL IOGRAPHY370

Simmons, K. M. and Sutter, D. (2005) Protectionfrom Nature’s fury: analysis of fatalities and injuriesfrom F5 tornadoes. Natural Hazards Review 6: 82–6.
Simmons, K. M. and Sutter, D. (2006) Directestimation of the cost effectiveness of tornadoshelters. Risk Analysis 26: 945–54.
Simpson, D. M. (2002) Earthquake drills andsimulations in community-based training andpreparedness programmes. Disasters 26: 55–69.
Simonenko, V. A., Nogin, V. N., Petrov, D. V.,Shubin, O. N. and Solem, J. C. (1994) Defendingthe earth against impacts from large comets andasteroids. In T. Gehrels (ed.) Hazards due to Asteroidsand Comets, pp. 929–53. Tucson: University ofArizona Press.
Singhroy, V. (1995) SAR integrated techniques forgeohazard assessment. Advances in Space Research 15:67–78.
Sjöberg, L. (2001) Limits of knowledge and thelimited importance of trust. Risk Analysis 21:189–98.
Slovic, P. (1986) Informing and educating thepublic about risk. Risk Analysis 6: 280–5.
Slovic, P., Flynn, J. H. and Layman, M. (1991)Perceived risk, trust, and the politics of nuclearwaste. Science 254: 1603–7.
Small, C. and Naumann, T. (2001) The globaldistribution of human population and recentvolcanism. Global Environmental Change B:Environmental Hazards 3: 93–109.
Smets, H. (1987) Compensation for exceptionalenvironmental damage caused by industrialactivities. In P. R. Kleindorfer and H, C. Kunreuther(eds) Insuring and Managing Hazardous Risks,pp. 79–138. New York: Springer-Verlag.
Smith, B. J. and de Sanchez, B. A. (1992) Erosionhazards in a Brazilian suburb. Geographical Review6: 37–41.
Smith, D. I. (1989) A dam disaster waiting to break.New Scientist 11 November, 42–6.
Smith, D. I. (2000) Floodplain management:problems, issues and opportunities. In D. J. Parker(ed.) Floods, vol. 1, 254–67. London and New York:Routledge.
Smith, D. I, Den Exter, P., Dowling, M. A., Jelliffe,P. A., Munro, R. G. and Martin, W. C. (1979) FloodDamage in the Richmond River Valley, New South Wales.Canberra: Centre for Resource and EnvironmentalStudies, Australian National University.
Smith, K. and Ward, R. (1998) Floods: PhysicalProcesses and Human Impacts. Chichester and NewYork: John Wiley.
Smith, N. and Salt, G. (1988) Predicting landslidemobility: An application to the east Abbotsfordslide, New Zealand. In Fifth Australia-New ZealandConference on Geomechanics: Prediction versus Performance,pp. 567–73. Canberra, Australia: Institution ofEngineers Australia.
Smith, W. D. and Berryman, K. R. (1986)Earthquake hazard in New Zealand: inferences fromseismology and geology. Bulletin of the Royal Societyof New Zealand 24: 223–42.
Smyth, C. G. and Royle, S. A. (2000) Urbanlandslide hazards: incidence and causative factors inNiterói, Rio de Janeiro State, Brazil. AppliedGeography 20: 95–117.
Snow, R. W., Guerra, C. A., Noor, A. M., Myint, H.Y. and Hay, S. I. (2005) The global distribution ofclinical episodes of Plasmodium falciparum malaria.Nature 434 (10 March): 214–17.
Soby, B. A., Ball, D. J. and Ives, D. P. (1993) Safetyinvestment and the value of life and injury. RiskAnalysis 13: 356–70.
Sokolowska, J. and Tyszka, T. (1995) Perception andacceptance of technological and environmental risks:Why are poor countries less concerned? RiskAnalysis 15: 733–43.
Solecki, W. D., Rosenzweg, C., Parshall, L., Pope,G., Clark, M., Cox, J. and Wiencke, M. (2005)Mitigation of the heat island effect in urban NewJersey. Environmental Hazards 6: 39–49.
B IBL IOGRAPHY 371
Solomon, T. and Mallewa, M. (2001) Dengue andother emerging flaviviruses. Journal of Infection 42:104–15.
Somers, E. (1995) Perspectives on risk management.Risk Analysis 15: 677–84.
Sommer, A. and Mosely, W. H. (1972) East Bengalcyclone of November 1970: epidemiologicalapproach to disaster assessment. The Lancet 1:1029–36.
Southern, R. L. (2000) Tropical cyclone warning-response strategies. In R. A. Pielke Jr and R. A.Pielke Sr (eds) Storms, vol. 1, pp. 259–305. Londonand New York: Routledge.
Spangle, W. and Associates Inc. (1988) California atRisk: Steps to Earthquake Safety for Local Government.Sacramento, CA: California Seismic SafetyCommission.
Spence, R. J. S., Baxter, P. J. and Zuccaro, G. (2004)Building vulnerability and human casualtyestimation for a pyroclastic flow: a model and itsapplication to Vesuvius. Journal of Volcanology andGeothermal Research 133: 321–43.
Stark, K. P. and Walker, G. R. (1979) Engineeringfor natural hazards with particular reference totropical cyclones. In R. C. Heathcote and B. G.Thom (eds) Natural Hazards in Australia, pp.189–203. Canberra: Australian Academy of Science.
Starosolszky, O. (1994) Flood control by levees. InG. Rossi, N. Harmancogliu and V. Yevjevich (eds)Coping with Floods, pp. 617–35. Kluwer: Dordrecht.
Starr, C. (1969) Social benefit versus technologicalrisk. Science 165: 1232–8.
Starr, C. and Whipple, C. (1980) Risk of riskdecisions. Science 208: 1114–9.
Stephenson, R. and Anderson, P. S. (1997) Disastersand the information technology revolution. Disasters21: 305–34.
Stockwell, J. R., Sorenson, J. W., Eckert, J. W. Jr.and Carreras, E. M. (1993) The US EPA Geographic
Information System for mapping environmentalreleases of toxic chemical releases. Risk Analysis 13:155–64.
Stoddard, A. (2003) Humanitarian NGOs:Challenges and trends. In J. Macrae and A. Harmer(eds) Humanitarian Action and the ‘Global War onTerror’: A Review of Trends and Issues, Report 14.London: Humanitarian Policy Group, OverseasDevelopment Institute.
Stolle, F. and Tomich, T. P. (1999) The 1997–1998fire event. Nature and Resources 35: 22–30.
Stott, P. A., Stone, D. A. and Allen, M. R. (2004)Human contribution to the European heatwave of2003. Nature 432 (2 December): 610–14.
Street-Perrott, F. A. and Perrott, R. A. (1990)Abrupt climate fluctuations in the tropics: theinfluence of the Atlantic circulation. Nature 343:607–12.
Sullivent, E. E., West, C. A., Noe, R. S., Thomas,K. E., Wallace, L. J. D. and Leeb, R. T. (2006) Non-fatal injuries following Hurricane Katrina, NewOrleans, Louisiana, 2005. Journal of Safety Research37: 213–17.
Sur, D. et al. (2006) The malaria and typhoid feverburden in the slums of Kolkata, India: data from aprospective community-based study. Transactions ofthe Royal Society of Tropical Medicine and Hygiene 100:725–33.
Suryo, I. and Clarke, M. C. G. (1985) Theoccurrence and mitigation of volcanic hazards inIndonesia as exemplified at the Mount Merapi,Mount Kelut and Mount Galunggung volcanoes.Quarterly Journal of Engineering Geology 18: 79–98.
Sylves, R. (1996) The politics and administration ofpresidential disaster declarations. Quick ResponseReport 86. Boulder, CO: Natural Hazards Researchand Information Center.
Tang, B. H. and Neelin, J. D. (2004) ENSOinfluence on Atlantic hurricanes via troposphericwarming. Geophysical Research Letters 31: xxx.
B IBL IOGRAPHY372

Tayag, J. C. and Punongbayan, R. S. (1994)Volcanic disaster mitigation in the Philippines:experience from Mt Pinatubo. Disasters 18: 1–15.
Taylor, K. C., Mayewski, P. A., Alley, R. B., Brook,E. J., Gow, A. J., Grootes, P. M., Meese, D. A.,Saltzman, E. S., Severinghaus, J. P., Twickler, M. S., White, J. W. C., Whitlow, S. and Zielinski,G. A. (1997) The Holocene-Younger Dryas tran-sition recorded at Summit, Greenland. Science 278:825–7.
Telford, J. and Cosgrave, J. (2007) The internationalhumanitarian system and the 2004 Indian Oceanearthquake and tsunamis. Disasters 31: 1–28.
Telford, J., Cosgrave, J. and Houghton, R. (2006)Joint Evaluation of the International Response to theIndian Ocean Tsunami. Synthesis Report. London:Tsunami Evaluation Coalition.
Teng, W. L. (1990) AVHRR monitoring of UScrops during the 1988 drought. PhotogrammetricEngineering and Remote Sensing 56: 1143–6.
Thieken, A. H., Petrow, T., Kreibich, H. and Merz,B. (2006) Insurability and mitigation of flood lossesin private households in Germany. Risk Analysis 26:383–91.
Thomalla, F and Schmuck, H. (2004) ‘We all knewthat a cyclone was coming’: Disaster preparednessand the cyclone of 1999 in Orissa, India. Disasters28: 373–87.
Thomas, M. F. (1994) Geomorphology in the Tropics.Chichester and New York: John Wiley.
Thomson, M. C. et al. (2006) Malaria early warningsbased on seasonal climate forecasts from multi-model ensembles. Nature 439 (2 February): 576–9.
Thompson, S. A. (1982) Trends and Developments inGlobal Natural Disasters 1947 to 1981. WorkingPaper 45. Boulder, CO: Institute of BehavioralScience, University of Colorado.
Thorarinsson, S. (1979) On the damage caused byvolcanic eruptions with special reference to tephraand gases. In P. D. Sheets and D. K. Grayson (eds)
Volcanic Activity and Human Ecology, pp. 125–59.London: Academic Press.
Tickner, J. and Gouveia-Vigeant, T. (2005) The1991 cholera epidemic in Peru: not a case ofprecaution gone awry. Risk Analysis 25: 495–502.
Tierney, K., Bevc, C. and Kuligowski, E. (2006)Metaphors matter: disaster myths, media frames andtheir consequences in Hurricane Katrina. Annals ofthe American Academy of Political and Social Science604: 57–81.
Timmerman, P. (1981) Vulnerability, Resilience andthe Collapse of Society. Environmental Monograph 1.Toronto: Institute for Environmental Studies,University of Toronto.
Timmerman, P. and White, R. (1997) Mega-hydropolis: coastal cities in the context of globalenvironmental change. Global Environmental Change7: 205–34.
Tinsley, J. C., Youd, T., Perkins, D. M. and Chen,A. T. F. (1985) Evaluating liquefaction potential. InJ. I. Ziony (ed.) Evaluating Earthquake Hazards in theLos Angeles Region, pp. 263–315. Washington, DC:Department of the Interior.
Tobin, G. A. and Montz, B. E. (1997a) NaturalHazards: Explanation and Integration. New York:Guilford Press.
Tobin, G. A. and Montz, B. E. (1997b) The impactsof a second catastrophic flood on property values inLinda and Olivehurst, California. Quick ResponseReport 95. Boulder, CO: Natural Hazards Researchand Applications Information Center.
Tobin, G. A. and Whiteford, L. M. (2002)Community resilience and volcano hazard: theeruption of Tungurahua and evacuation of the Faldasin Ecuador. Disasters 26: 28–48.
Toon, O. B., Zahnle, K., Morrison, D., Turco, R. P.and Covey, C. (1997) Environmental perturbationscaused by the impacts of asteroids and comets.Annals of the New York Academy of Sciences 822:403–31.
B IBL IOGRAPHY 373

Treby, E. J., Clark, M. J. and Priest, S. J. (2006)Confronting flood risk: implications for insuranceand risk transfer. Journal of Enviromental Management81: 351–9.
Trenberth, K. (2000) Short-term climate variations.In R. A. Pielke Jr and R. A. Pielke Sr (eds) Storms,vol. 1, pp. 126–41. London and New York:Routledge.
Trenberth, K. (2005) Uncertainty in hurricanes andglobal warming. Science 308: 1753–4.
Trenberth, K., Branstator, G. W. and Arkin, P. A.(1988) Origins of the 1988 North Americandrought. Science 242: 1640–5.
Trenberth, K., Caron, J. M., Stepaniak, D. P. andWorley, S. (2002) Evolution of El Niño-SouthernOscillation and global atmospheric surfacetemperatures. Journal of Geophysical Research 107: xxx.
Turner, B. A. (1994) Causes of disaster: sloppymanagement. British Journal of Management 5:215–19.
Twigg, J. (ed.) (1998) Development at Risk? NaturalDisasters and the Third World. London: UK NationalCoordination Committee for the IDNDR.
UK Task Force (2000) Report on Potentially HazardousNear-Earth Objects. London: Stationery Office.
Ulbrich, U. and Christoph, M. (1999) A shift of theNAO and increasing storm track activity overEurope due to anthropogenic greenhouse gasforcing. Climate Dynamics 15: 551–9.
Ulbrich, U., Kink, A. H., Klawa, M. and Pinto, J. G. (2001) Three extreme storms over Europe inDecember 1999. Weather 56: 70–80.
Unganai, L. S. and Kogan, F. N. (1998) Droughtmonitoring and corn yield estimation in southernAfrica from AVHRR data. Remote Sensing ofEnvironment 63: 219–32.
United Nations/International Strategy for DisasterReduction (UN/ISDR) (2004) Living with Risk: AGlobal Review of Diasaster Reduction Initiatives.Geneva: United Nations.
United Nations Development Programme (UNDP)(1998) Human Development Report 1998. Oxford:Oxford University Press.
United Nations Development Programme (UNDP)(2004) Reducing Disaster Risk: A Challenge forDevelopment. New York: UN Bureau for CrisisPrevention and Recovery.
United Nations Disaster Relief Organization(UNDRO) (1985) Volcanic Emergency Management.New York: United Nations.
United Nations Disaster Relief Organization(UNDRO) (1990) Disaster Prevention and PreparednessProject for Ecuador and Neighbouring Countries. ProjectReport. Geneva: Office of the Disaster Relief Co-ordinator.
United Nations Environment Programme (UNEP)(1987) Environmental Data Report. Oxford: BasilBlackwell.
United Nations Environment Programme (UNEP)and Center for Clouds, Chemistry and Climate (C4)(2002) The Asian Brown Cloud: Climate and OtherEnvironmental Impacts. Nairobi: UNEP.
United Nations Population Fund (UNFPA) (2007)State of World Population. New York: United NationsPopulation Fund.
Urbina, E. and Wolshon, B. (2003) National reviewof hurricane evacuation plans and policies: acomparison and contrast of state practices.Transportation Research A 37: 257–75.
US-Canada Power System Outage Task Force (2004)Final Report on the August 14 2003 Blackout in theUnited States and Canada: Causes and Recommendations.Washington, DC and Ottawa: US-Canada JointReport of Governments.
US Department of Commerce (1994) The GreatFlood of 1993. Natural Disaster Survey Report.Silver Spring, MD: Department of Commerce.
US National Academy of Sciences (2002) AbruptClimate Change: Inevitable Surprises. NationalResearch Council Committee on Abrupt ClimateChange. Washington, DC: National Academy Press.
B IBL IOGRAPHY374
Valery, N. (1995) Earthquake engineering: a survey.The Economist 22 April: 18–20.
Van Asch, T. W. J., Malet, J. P., van Beek, L. P. H.and Amittrano, D. (2007) Techniques, issues andadvances in numerical modelling of landslidehazard. Bulletin de la Societé Geologique de France. 178:65–88.
Van Dorp, J. R., Merrick, J. R. W., Harrald, J. R.,Mazzuchi, T. A. and Grabowski, M. (2001) A riskmanagement procedure for the Washington stateferry. Risk Analysis 21: 127–42.
Varnes, D. J. (1978) Slope movements and types andprocesses. In Landslides: Analysis and Control.Transportation Research Board, Special Report 176,pp. 11–13. Washington, DC: National Academy ofSciences.
Vogel, G. (2005) Will a preemptive strike againstmalaria pay off? Science 310 (9 December): 1606–7.
Voight, B. (1996) The management of volcanoemergencies: Nevado del Ruiz. In R. Scarpa and R. I. Tilling (eds) Monitoring and Mitigation ofVolcano Hazards, pp. 719–69. Berlin: Springer-Verlag.
Wadge, G. (1993) Remote sensing for naturalhazard assessment and mitigation. STOP Disasters16 (Nov–Dec): 9–10.
Wadge, G. (ed.) (1994) Natural Hazards and RemoteSensing. London: Royal Society and Royal Academyof Engineering.
Walker, G., Mooney, J. and Pratts, D. (2000) Thepeople and the hazard: the spatial context of majoraccident hazard management in Britain. AppliedGeography 20: 119–35.
Walker, J. (1998) Malaria in a changing world: anAustralian perspective. International Journal ofParasitology 28: 947–53.
Walsh, K. J. E. and Ryan, B. F. (2000) Tropicalcyclone intensity increase near Australia as a result of climate change. Journal of Climate 13:3029–36.
Waltham, T. (2005) The flooding of New Orleans.Geology Today 21: 225–31.
Ward, S. N. and Day, S. (2001) Cumbre Viejavolcano – potential collapse and tsunami at LaPalma, Canary Islands. Geophysical Research Letters28: 3397–400.
Waring, S. C. and Brown, B. J. (2005) The threat ofcommunicable diseases following natural disasters:a public health response. Disaster Management andResponse 3: 41–7.
Warner, J., Waalewijn, P. and Hilhorst, D. (2002)Public participation for disaster-prone watersheds:time for multi-stakeholder platforms? Water andClimate Dialogue Thematic Paper 6. Wageningen:Wageningen University.
Warrick, R. A., Anderson, J., Downing, T., Lyons,J., Ressler, J., Warrick, M. and Warrick, T. (1981)Four Communities under Ash. Monograph 34. Boulder,CO: Institute of Behavioral Science, University ofColorado.
Webster, P. J., Holland, G. J., Curry, J. A. andChang, H.-R. (2005) Changes in tropical cyclonenumber, duration and intensity in a warmingenvironment. Science 309: 1844–6.
Weihe, W. H. and Mertens, R. (1991) Human well-being, diseases and climate. In J. Jager and H. L.Ferguson (eds) Climate Change, pp. 345–59.Cambridge: Cambridge University Press.
Weisæth, L., Knudsen, Ø. Jr and Tønnessen, A.(2002) Technological disasters, crisis managementand leadership stress. Journal of Hazardous Materials93: 33–45.
Wells, L. (2002) Avalanche hazard reduction fortransportation corridors using real-time detectionand alarms. Cold Regions Science and Technology 34:31–42.
Welsh, S. (1994) CIMAH and the environment.Disaster Prevention and Management 3: 28–43.
Wenger, D. (2006) Hazards and disasters research:how would the past 40 years rate? Natural HazardsObserver 31 (1): 1–3.
B IBL IOGRAPHY 375

Westerling, A. L., Hidalgo, H. G., Cayan, D. R. andSwetnam, T. W. (2006) Warming and earlier springincrease in western US forest wildfire activity. Science313 (18 August): 940–3.
White, G. F. (1936) The limit of economicjustification for flood protection. Journal of Land andPublic Utility Economics 12: 133–48.
White, G. F. (1945) Human Adjustment to Floods: AGeographical Approach to the Flood Problem in theUnited States. Research Paper 29: Chicago, IL:Department of Geography, University of Chicago.
White, G. F. (ed.) (1974) Natural Hazards: Local,National, Global. New York: Oxford UniversityPress.
White, G. F. and Haas, J. E. (1975) Assessment ofResearch on Natural Hazards. Cambridge, MA: MITPress.
White, G. F., Kates, R. W. and Burton, I. (2001)Knowing better and losing even more: the use ofknowledge in hazards management. EnvironmentalHazards 3: 81–92.
White, I. and Howe, J. (2002) Flooding and the roleof planning in England and Wales: a critical review.Journal of Environmental Planning and Management45: 735–45.
White, M. D. and Greer, K. A. (2006) The effectsof watershed urbanisation on the stream hydrologyand riparian vegetation of Los Peñasquitos Creek,California. Landscape and Urban Planning 74:125–38.
White, P. (2005) War and food security in Eritreaand Ethiopia 1998–2000. Disasters 29 (SI):S92–S113.
Whitehead, J. C., Edwards, B., van Willigen, M.,Maiolo, J. R., Wilson, K. and Smith, K. T. (2000)Heading for higher ground: factors affecting realand hypothetical hurricane evacuation. GlobalEnvironmental Change B Environmental Hazards2: 133–42.
Whittow, J. (1980) Disasters. Harmondsworth,Middx: Penguin Books.
Whyte, A. V. and Burton, I. (1982) Perception ofrisk in Canada. In I. Burton, C. D. Fowle and R. S.McCullough (eds) Living with Risk, pp. 39–69.Toronto: Institute of Environmental Studies,University of Toronto.
Wieczorek, G. F., Larsen, M. C., Eaton, L. S.,Morgan, B. A. and Blair, J. L. (2001) Debris-flow andFlooding Hazards Associated with the December 1999Storm in Coastal Venezuela and Strategies for Mitigation.Open File Report 01–144. Reston, Virginia: USGeological Survey.
Wigley, T. M. L. (1985) Impact of extreme events.Nature 316: 106–7.
Wilhite, D. A. (1986) Drought policy in the US andAustralia: a comparative analysis. Water ResourcesBulletin 22: 425–38.
Wilhite, D. A. (2002) Combatting drought throughpreparedness. Natural Resources Forum 26: 275–85.
Wilhite, D. A. and Easterling, W. E. (eds) (1987)Planning for Drought: Toward a Reduction of SocietalVulnerability. Boulder, CO and London: WestviewPress.
Wilhite, D. A. and Vanyarkho, O. (2000) Drought:pervasive impacts of a creeping phenomenon. In D. A. Wilhite (ed.) Drought, vol. 1, pp. 245–55.London and New York: Routledge.
Wilkinson, P., Armstrong, B. and Landon, M.(2001) Cold Comfort: The Social and EnvironmentalDeterminants of Excess Winter Deaths in England1986–1996. London: The Policy Press.
Williams, R. S Jr. and Moore, J. G. (1983) Man Against Volcano: The Eruption on Heimaey,Vestmannaeyjar, Iceland (2nd edn). Reston, UA: U.S.Geological Survey (USGS) Information Services.
Willis, M. (2005) Bushfires – how can we avoid theunavoidable? Environmental Hazards 6: 93–99.
Willoughby, H. E., Jorgensen, D. P., Black, R. A.and Rosenthal, S. L. (1985) Project STORMFURY:scientific chronicle 1962–1983. Bulletin of theAmerican Meteorological Society 66: 505–14.
B IBL IOGRAPHY376

Wisner, B., Blaikie, P., Cannon, T. and Davis, I.(2004) At Risk: Natural Hazards, People’s Vulnerabilityand Disasters. London and New York: Routledge.
Witham, C. S. (2005) Volcanic disasters andincidents: a new database. Journal of Volcanology andGeothermal Research 148: 191–233.
Witt, V. M. and Reiff, F. M. (1991) Environmentalhealth conditions and cholera vulnerability in LatinAmerica and the Caribbean. Journal of Public HealthPolicy 12: 450–64.
Wiwanitkit, V. (2006) Correlation between rainfalland the prevalence of malaria in Thailand. Journalof Infection 52: 227–30.
Wolshon, B., Urbina, E., Wilmot, C. and Levitan,M. (2005) Review of policies and practices forhurricane evacuation. I: Transportation planning,preparedness and response. Natural Hazards Review6: 129–42.
Woodworth, P. L., Flather, R. A., Williams, J. A.,Wakelin, S. L. and Jevrejeva, S. (2007) Thedependence of UK extreme sea levels and stormsurges on the North Alantic Oscillation. ContinentalShelf Research 27: 935–46.
World Bank (2000) Republic of Mozambique: APreliminary Assessment of Damage from the Flood andCyclone Emergency of Feb–March 2000. Washington,DC: World Bank.
World Commission on Dams (2000) Dams andDevelopment: A New Framework for Decision-Making.Nairobi: United Nations Environment Programme.
Wrathall. J. E. (1988) Natural hazard reporting inthe UK press. Disasters 12: 177–82.
Wu, Q. (1989) The protection of China’s ancientcities from flood damage. Disasters 13: 193–227.
Wu, Y. M., Teng,T. L., Hsiao, N. C., Shin, T. C.,Lee, W. H. K. and Tsai, Y. B. (2004) Progress onearthquake rapid reporting and early warningsystems in Taiwan. In T. Chen, G. F. Panza and Z. L. Wu (eds) Earthquake Hazard, Risk and StrongGround Motion, pp. 463–86. Beijing: SeismologicalPress.
Xin X. G., Yu, R. C., Zhou, T. J. and Wang, B.(2006) Drought in late spring of China in recentdecades. Journal of Climate 19: 3197–206.
Xu, Q. (2001) Abrupt change of the mid-summerclimate in central east China by the influence ofatmospheric pollution. Atmospheric Environment 35:5029–40.
Yagar, S. (ed.) (1984) Transport Risk Assessment.Waterloo, Ontario: University of Waterloo Press.
Young, S., Balluz, L. and Malily, J. (2004) Naturaland technologic hazardous materials releases duringand after natural disasters: a review. Science of the TotalEnvironment 322: 3–20.
Zaman, M. Q. (1991) The displaced poor andresettlement policies in Bangladesh. Disasters 15:117–25.
Zeckhauser, R. and Shepard, D. S. (1984) Principlesfor saving and valuing lives. In P. F. Ricci, L. A.Sagan and C. G. Whipple (eds) Technological RiskAssessment, pp. 133–68. The Hague: MartinusNijhoff.
Zerger, A., Smith, D. I., Hunter, G. J. and Jones, S. D. (2002) Riding the storm: a comparison ofuncertainty modelling techniques for storm surgerisk management. Applied Geography 22: 307–30.
Zezere, J. L., Trigo, R. M. and Trigo, I. F. (2005)Shallow and deep landslides induced by rainfall inthe Lisbon region (Portugal): assessment ofrelationships with the North Atlantic Oscillation.Natural Hazards and Earth System Sciences 5: 331–4.
Zhang, X., Zwiers, F. W., Hegerl, G. C., Lambert,F. H., Gillett, N. P., Solomon, S., Stott, P. A. andNozawa, T. (2007) Detection of human influence ontwentieth-century precipitation trends. Nature 448:461–5.
Zhang, Y., Prater, C. S. and Lindell, M. K. (2004)Risk area accuracy and evacuation from HurricaneBrett. Natural Hazards Review 5: 115–19.
Zobin, V. M. (2001) Seismic hazard of volcanicactivity. Journal of Volcanology and Geothermal Research112: 1–14.
B IBL IOGRAPHY 377

Aa lava 137‘Act of God’ syndrome 4, 62, 63, 169adaptation: to environmental hazards 88–100: to
droughts 280–3; to earthquakes 124–31; to floods256–61; to mass movement hazards 137–9; tosevere storm hazards 201–5; to technologicalhazards 304–11; to volcanoes 146–53; to wildfires228–30
adobe structures 119adverse selection 80Aedes Aegypti mosquito 214, 215, 219AGRHYMET programme 282agricultural drought 267–70agricultural losses: from drought 264, 267–70, 281;
from floods 233, 241, 246; from hailstorms 194;tropical from cyclones 183, 186, 201–5; fromvolcanoes 137, 140, 142
aid following disaster 73–9: after avalanches 74, 168–9; after drought 269, 276–8; afterearthquakes 74, 117–8; after floods 243, 245;after tropical cyclones 196; after volcaniceruptions 140–3; after wildfires 226, 228;categories of 76–9; effectiveness of 78–9; purposesof 73–6
AIDS see HIV/AIDSALARP principle 66–7Alquist-Priolo Earthquake Fault Zoning Act 99,
100 Anthropogenic Global Warming (AGW) 320–30,
338ashfall (tephra) 25, 135, 136–7, 146
‘Ash Wednesday’ wildfires 23, 226, 227Asian ‘brown cloud’ 330asteroids 332–5 avalanches (snow) 166–79: adaptation to 173–9;
causes of 166–8; deaths from 157–8, 168, 169;protection against 85–6, 170–3; types of 167–8
band of tolerance 11–12, 58–9behavioural paradigm 4–6, 38, 44–5Bhopal 292–3biomass fires 329–30Black Death 207, 210blizzard(s) 181brushfires see wildfiresbuilding codes 87–8, 120–3, 199–201, 205bushfires see wildfires
cascade of hazard impacts 14, 289, 294caveat emptor 96Centre for Research on the Epidemiology of
Disasters (CRED) database 24, 26, 27, 262, 263
Centers for Disease Control and Prevention (CDC)212
channel improvement 253–54chars 256–7Chemical Emergency Preparedness Program (CEPP)
305Chernobyl 300–1choices in adjustment to hazard 72–73cholera 212, 219, 220, 317
INDEX

chronic hazards 314, 315–30climate change 31–2, 35, 57–9, 320–22, climatic variability 57–59, 272–74, 320–22coastal floods 255; see also storm surgescold stress 208comets 332–5 compensation after technological disaster 302–3complexity: and disaster reduction 49; and emergent
behaviour 41–3; paradigms of 4, 8–9, 338–9context hazards 9–11, 313–35; see also global
environmental changeControl of Major Accident Hazards Regulations
(COMAH) 308controlled burns 228, 230Cyclone Preparedness Programme (CPP) 201
dams 278–9: floods from failures of 290; safety of290–1; use in flood control 234, 238, 254–5
databases of disaster 24–28, 32–3deaths in disaster 14–15, 18–19, 22, 23, 28–9, 317;
from avalanches 157–8; from cold stress 208;from disease epidemics 207, 208, 218, 317; fromearthquakes 44, 105, 106, 111, 113, 114, 115,118, 123; from famine 134; from floods 18–19,232–3, 234, 236, 239, 240; from heat stress209–10; from ice and snow storms 196; fromlahars 139 ; from landslides 155–6, 163, 164,165, 177; from road accidents 287; fromtechnological hazards 287, 290, 291, 292–3,294–5, 297, 298, 299, 300, 302, 308, 311; fromtornadoes 192–3; from transport disasters 294,296, 299; from tropical cyclones 38, 182–3, 186, 199; from tsunamis 115–6; from volcaniceruptions 133–4, 135; from wildfires 221, 223–4,226; from windstorms 194, 195; in disasterdefinition 24, 27
debris flows 98–9, 135, 153, 162–3, 320definition of environmental hazards and disasters
9–15 deforestation 240–1degradation of land 5, 19, 133, 225, 263dengue fever 214, 215, 217, 220desertification 274desert locust 207–8development and underdevelopment 4, 67, 16–17,
18–20, 30, 33development paradigm 4–7, 38, 45–7 diarrhoeal diseases 212, 213, 221, 325disaster aid 73–6
disaster: databases of 24–8; deaths in 14–15, 18–19, 22, 23, 28–9, 317; definition of 13, 24, 27; epidemics after 212–3; factors causingincreases in 33–6; trends in 30–6; types of 26, 28
Disaster Risk Index (DRI) 16 disease epidemics 207, 210–19: and global warming
324–5; causes of 211–13, 317, 318; deaths from207, 317; modes of transmission of 210
‘domino’ disaster(s) 289, 294drought(s) 262–283: adaptation to 280–3;
agricultural losses in 264, 267–70, 281; andfamine 14, 263–4, 271–2, 276–7, 282–3; causesof 262, 264–5, 272–6, 317; definitions of 262,263, 265–6; economic costs in 277; effects onriver navigation of 266; effects on water resourcesof 266; mitigation of 276–8; protection against278–9; remote sensing of 282; types of 265–72;water management in 281
Drought Act 1976 281dry flowing avalanche 168 ‘Dust Bowl’ years 264, 323
earthquake(s) 105–132: adaptation to 124–9; causesof 106–7; deaths from 44, 105, 106, 111, 113,114, 115, 118, 119, 123; economic losses from105, 109, 111, 114; ground shaking in 107–9,112–3, 164, 166; ill health after 18; insuranceagainst 118–9; intensity of 109–11; landslidesfrom 113–15; magnitude of 107–9; mitigation of117–9; protection against 119–24; retrofittingagainst 88, 123
Earthquake and War Damage Act 1944 84 Earthquake Commission (EQC) 84, 169Ebola hemorrhagic fever 210economic losses in disasters 15, 18, 30–31, 319: in
disaster definition 27; from drought 277; fromearthquakes 105, 111, 114; from floods 18–19,232–3, 236, 239, 241, 245, 246, 247, 260; fromlandslides 169, 170; from mid-latitude cyclones196; from tornadoes 192, 193; from tropicalcyclones 38, 182–3, 186, 187; from wildfires221–3, 226
El Niño Southern Oscillation (ENSO) 267, 272,315–8
elusive hazards see context hazards Emergency Events Database (EM-DAT) 24, 26Emergency Management Australia (EMA) 88–9Emergency Planning Zones (EPZs) 305–6 Emergency Preparedness Canada 201, 235
INDEX 379

energy releases by environmental hazards 72, 106,107–8, 334
engineering paradigm 4–5environmental hazards (see also disasters): awareness
of 4–9; classification of 9–10; definition of 9–15;paradigms of 4–9, 44–46, 288–89; physicalexposure to 10–12, 16
epicentre 107epidemiology 212estate agents (realtors) 96, 131 eucalyptus trees 225European Community (EC)/European Union (EU)
77, 287European Community Humanitarian Office (ECHO)
77evacuation/relocation 72, 87, 88, 89, 90, 97: and
earthquakes 115, 146, 148; and floods 248,259–60; and landslides 169; and technologicalhazards 297, 305–7, 309; and tornadoes 197; andtropical cyclones 87, 94, 183, 185–6, 199, 202,204–5, 213; and tsunamis 89–90; and volcanoes72, 93, 95, 140, 146, 148, 212
event tree analysis 53extreme events: analysis of 56–9; change in
stationarity of 57–9; early interest in 4
false warnings of disaster 95, 202famine 133, 134, 263–4: and drought 14, 263–4,
271–2, 276–7, 282–3; deaths from 134;definition of 263
Famine Early Warning System (FEWS NET) 282fault 106Federal Emergency Management Agency (FEMA)
249, 250, 305, 336fire breaks 229, 230flash floods 238, 241, 242, 257flaviviruses 214–7flood abatement 249, 253Flood Control Act 1936 5Flood Disaster Protection Act 1973 251floodplain(s): invasion of 236, 238, 240, 242, 243,
244–5floodproofing 255–6floods 232–61, 322: adaptation to 256–61; and
global warming 323–4; and urbanisation 235,238, 242–3, 244–5; areas at risk 236–9; causes of 239–43, 317, 319–20; deaths from 18–19,232–3, 234, 236, 239, 240, 241; economic costsof 18–19, 232–3, 236, 239, 245, 246, 247; gains
from 233, 235; living with 260–1; mitigation of 243, 245–9; protection from 249–56; remotesensing for 257
food aid 78–9, 276–8food scarcity 337–8forecasting and warning schemes 93–6, 126–9,
174–6: for dam failures 307; for disease epidemics219–20; for drought 281–3; for earthquakes126–9; for floods 257–8; for mass movementhazards 174–6; for technological hazards 307; fortornadoes 203; for tropical cyclones 92–3, 201–3;for tsunamis 128–9; for volcanic eruptions 93; for wildfires 229–30; public responses to 95–6
forests, afforestation: and avalanche prediction 177,178; and flood abatement 249, 252; wildfire in223, 225, 226–7
freeboard 256Fujita scale 192
gains following disaster 25–6: from floods 233, 235; from tropical cyclones 182; from volcaniceruptions 133
geographical information systems (GIS) 70, 80, 176,177, 199, 311
global environmental change (GEC) 9–10, 320–30Global Influenza Surveillance Network 219Global Information and Early Warning System
(GIEWS) 282 global positioning systems (GPS) 68, 69, 70, 138,
174global warming see also climate change ‘golden hours’ 73–4, 88, 117–8‘greenhouse effect’ see global warmingground deformation 138, 149–50 ground shaking 107–9, 112–3
hailstorm(s) 194 hazard-resistant design 86–7 hazardous materials transport 296–7, 301Health and Safety at Work Act 1974 308Health and Safety Executive (HSE) 66, 296, 308, 310heat stress 208–10‘High Reliability School’ 288–9history of hazards and disasters research 4–9HIV/AIDS 220hurricane(s) see tropical cyclones hybrid hazards see ‘na tech’ hazards hydrological drought 266hypocentre 106
INDEX380

ice hazards on highways 64, 304 ice (glaze) storms 182, 196 ill-health (after disaster) 18, 25, 212–3indirect losses 25industrial hazards 287–9, 291, 292–7, 300–2,
308–11inequality 35 influenza 218, 219information technology (IT) 68–70, 174–5 insurance 79–84: against earthquakes 118–9; against
floods 245–9; against landslides 169–70; againstsevere storms 196–7; against technologicalhazards 303–4; against wildfires 228; costs of 31,79–84; effectiveness of 80, 81; purpose of 79
intangible loss 25–6internal government aid 75–6 international aid 76–9International Atomic Energy Authority (IAEA) 288International Decade for Natural Disaster Reduction
(IDNDR) 7, 339International Federation of Red Cross and Red
Crescent Societies (IFRCRCS) 73, 77International Nuclear Event Scale (INES) 288International Strategy for Disaster Reduction (ISDR)
9, 339Inter-tropical Convergence Zone 190, 239involuntary risk(s) 10, 51–2
lahars 138–9: deaths from 139; protection against143–5
landslides 155–66: adaptation to 173–9; afterearthquakes 113–5; areas at risk from 158–9;catastrophic 332; causes of 163–6; classification of 159; deaths from 155–6, 163, 164, 165, 169,177, 332; economic costs of 156–7, 169, 170;mitigation of 168–70; protection against 170–3
land use planning 96–100, 129–31: debris flows 97,98–9; for avalanches 176–9; for droughts 283; for earthquakes 97, 99–100, 129–31; for floods258–61; for landslides 176–9; for technologicalhazards 307–11; for tropical cyclones 205; fortsunamis 124, 131 ; for volcanic eruptions 151–3;for wildfires 230; limitations of 96–7; purpose of96
lava flows 135, 137; control of 143 levee(s) 234, 252–3‘levee effect’ 244–5; see also floodplain invasionlightning 194‘locus of control’ 63
loose snow avalanche 167 loss acceptance 72–3Louping ill virus 214–5
macro-protection 84–6magma 134magnitude–frequency relationships 53–9Major Accident Reporting System (MARS) 288malaria 212–3, 218–9, 220, 271, 317, 325malnutrition 263–4, 277managed retreat see setback ordinances management of risk 52, 65–71man-made hazards see technological hazardsmapping of hazard zones 68–70, 86, 98, 100, 109,
116, 127, 130, 141, 151, 152, 153, 175, 185,237, 250, 259, 310, 325
mass extinctions 333, 334media coverage of hazards and disasters 14, 22–3,
62–3meteorological drought 265–6 micro-protection 86–7 micro-zonation 97–100mid-latitude cyclones 191–6; deaths from 194, 195;
economic losses from 195mitigation of environmental hazards 79–84Modified Mercalli scale (MM) 109–10moment magnitude 108moral hazard 83mudflows 162–3 see also lahars
‘na-tech’ disasters 9, 232, 285, 294national disaster funds 83–4National Flood Insurance Program (NFIP) 84, 169,
197, 205, 249, 250–2, 258natural hazards 9, 10 then see environmental hazardsNear-Earth Objects see asteroids and cometsnomadism 275–6, 280non-governmental organisations (NGOs) 73, 77,
243‘Normal Accidents School’ 289‘normality’ and disaster 5–6North Atlantic Oscillation (NAO) 319–20 nuclear industry hazards 300–2, 307nuées ardentes 136
Office of Foreign Disaster Assistance (OFDA) 24outburst floods 240Oxford Committee for Famine Relief (Oxfam) 73,
92
INDEX 381

pahoehoe lava 137Palmer Drought Severity Index (PDSI) 266Pan Caribbean Disaster Preparedness and Prevention
Project 201 pandemic 217, 218, 220paradigms of hazard 4–9, 44–7, 288–9perception of hazard(s) 10, 50–2, 59–65, 288–9:
‘prison of experience’ 59 plague see Black Death Plasmodium falciparum 218, 325plate tectonics 106–7population change 30, 33–4, 186–7, 197, 205,
337 post-disaster recovery 65, 68 potato blight 207powder avalanche 167 pre-disaster protection 65, 68 preparedness 88–93: for disease epidemics 219–21;
for drought 280–1; for earthquakes 88, 89,124–6; for floods 256–7; for mass movementhazards 173–4; for severe storms 201; fortechnological hazards 288–9; for tropical cyclones201; for tsunamis 88–9; for volcanic eruptions146–8 ; for wildfires 228–9; role in hazardmanagement 88–9, 99
Presidential Disaster Declarations (USA) 75–6‘prison of experience’ 59Project STORMFURY 198protection: against avalanches 85–6, 170–3; against
droughts 278–9; against earthquakes 119–24;against environmental hazards 84–8, 197–201;against floods 249, 252–256; against landslides170–3; against severe storms 197–201; againsttechnological hazards 304; against volcaniceruptions 143–6; against wildfires 228
public acquisition of hazardous land 97, 99, 230,259–61
public health 210–11pyroclastic falls/flows 135, 136, 152–3
rain-fed agriculture 233, 235, 275rapidly deepening depressions 194rare hazards 11, 314, 330–5realtors see estate agentsrefugees from disaster see evacuation/relocationreinsurance see insurancereliability 15remote sensing 68–70: for droughts 282; for floods
257; for mass movement hazards 174, 175–7; for
severe storms 202–3; for technological hazards307; for volcanic eruptions 148, 149–50
reservoirs: for drought control 278–92; for floodcontrol 254–5
resilience 15, 90–1 restoration after disaster 74–5retrofitting 88, 123, 255–6return periods 55–9, 87, 108, 126, 127, 322Richter scale 107–8 ‘Ring of Fire’ 106risk(s): acceptable level of 52; amplification of 63–5;
assessment of 50–1, 53–62; definition of 13;involuntary 10, 51–2; management of 52, 65–71;perception of 50–2, 59–65; tolerable 52, 66–7;voluntary 10–11, 51–2
risk-benefit analysis 51–2 rockfalls 159 ‘Roll Back Malaria’ campaign 220 Ross River virus 317, 318rotational slide 161–2
Saffir/Simpson scale 186Santa Ana winds 226SARS (Severe Acute Respiratory Syndrome) 213sea level rise 326–7 sea surface temperature anomalies (SSTAs) 272, 315,
316setback ordinances 98–100, 130–1, 205, 250, 255Seveso Directive 287, 305 slab avalanche 167slope stabilisation 170–1SLOSH computer model 202smoking as a hazard 10, 15 snow avalanche defences 172snowstorms see mid-latitude cyclonessoft storey(s) 122Soil Conservation and Rivers Control Council 1941
249spot fires 225, 226stage-damage curves 233, 322storm surge from cyclones 189, 194, 242, 326structures (failures of) 286 sturzstroms 332subduction zones 106Swiss Cheese model 47–9
Taiwan Residential Earthquake Insurance Fund 119
tangible loss 25–6
INDEX382

technological hazard(s) 10, 285–311: adaptation to304–11; at Bhopal 292–3; at Chernobyl 300–1;compensation after 302–3; deaths from 286,291–2, 294–5, 296, 298, 299, 302, 307, 308,311; definition of 285; history of 285–6;mitigation of 302–4; perception of 288–9;protection from 304
teleconnections 323 tephra see ashfallthermahaline ocean circulation (THC) 327–9Three Gorges Dam 234–5, 290tornado(es) 189, 192–3, 197, 203 ‘Tornado Alley’ 192Total Fire Bans 228toxic waste 301–2trans-boundary air pollution 301, 329transport hazards 294, 296–7, 298–300, 304 trends in recorded disasters 27–8, 30–1, 32, 33,
156–7tropical cyclones 182–205: adaptation to 183, 186,
201–5; and diseases 213; and global warming323; areas at risk from 182–3, 188; causes of188–92; control of 198–9; deaths from 38,182–3, 186, 199; economic losses from 182–3,186, 187; evacuation in 87, 94, 183, 185–6, 199,202, 204–5; insurance against 196–7; mitigationof 196–7; protection against 197, 199–201;remote sensing of 202
tsunamis 115–118: adaptation to 128–9, 131; causesof 116–118; deaths from 115, 116, 117;protection against 124
typhoon(s) see tropical cyclones
Uniform Building Code 123, 171 United Nations (UN) 7, 77, 78, 89, 264United Nations Department of Humanitarian
Affairs (DHA) 77United Nations Development Programme (UNDP)
16United Nations Disaster Relief Organisation
(UNDRO) 77United Nations International Children’s Emergency
Fund (UNICEF) 77United States Army Corps of Engineers 5, 205, 259
United States Geological Survey 126, 127Unreinforced Masonry Law 1986 123unreinforced masonry structures (URMs) 88, 112,
119, 120, 123 urban fires 106, 109, 286urban heat island 210urbanisation: and disaster 33–4, 36, 337
vaccines 219–20Vibrio cholerae 219volcanic gases 138volcanic eruptions 133–154: adaptation to 146–53;
and climate 331–2; deaths from 133–4, 135, 137,138, 139, 140, 142; gains from 25, 133;mitigation of 140–3; protection against 143–6;remote sensing of 148, 149–50; reporting of 27–8
Volcanic Explosivity Index (VEI) 134, 137volcanoes: classification of 134voluntary risk(s) 10–11, 51–2vulnerability to disaster 11–12, 15–20, 33–6, 90–1
Walker cell circulation 315–6watershed treatments for flood abatement 249, 252weather modification 198–9West Nile virus (WN) 215, 216, 217wet flowing avalanche 168 wildfires 221–30: adaptation to 228–30; areas at risk
from 221, 222–4, 225; causes of 208, 317–8;deaths from 221, 223–4, 226; economic losses in221, 224–6; mitigation of 226–30; protectionfrom 228
willingness to pay 67, 299windchill see cold stresswindstorms: see tropical cyclones, tropical storms and
mid-latitude cyclones World Food Programme (WFP) 77 World Health Organization (WHO) 210, 211, 213,
218, 219, 220 World Meteorological Organization (WMO) 257
yellow fever 215, 216, 217
zoning ordinances 97–100
INDEX 383