environmental health and safety department annual report – 2009 an administrative and business...
TRANSCRIPT

Environmental Health and Safety Department Annual Report – 2009An Administrative and Business Services DepartmentEnsuring Safety and Health on Campus
UNIVERSITY OF CALIFORNIA AT IRVINE
2
Environmental Health & SafetyMission and Vision
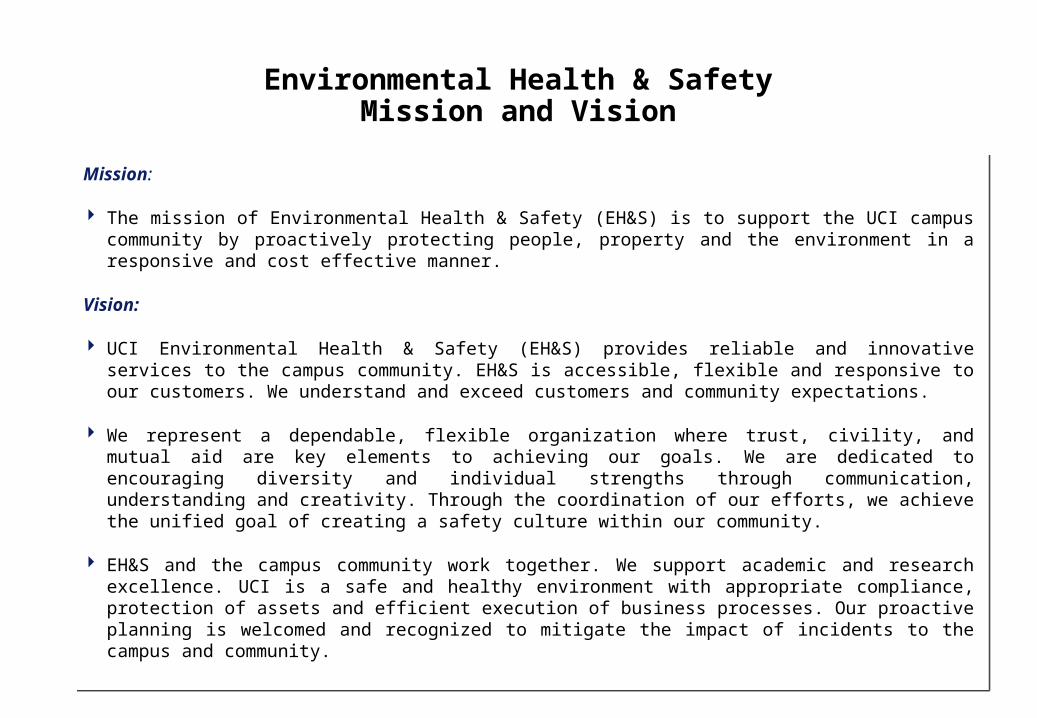
Mission:
The mission of Environmental Health & Safety (EH&S) is to support the UCI campus community by proactively protecting people, property and the environment in a responsive and cost effective manner.
Vision:
UCI Environmental Health & Safety (EH&S) provides reliable and innovative services to the campus community. EH&S is accessible, flexible and responsive to our customers. We understand and exceed customers and community expectations.
We represent a dependable, flexible organization where trust, civility, and mutual aid are key elements to achieving our goals. We are dedicated to encouraging diversity and individual strengths through communication, understanding and creativity. Through the coordination of our efforts, we achieve the unified goal of creating a safety culture within our community.
EH&S and the campus community work together. We support academic and research excellence. UCI is a safe and healthy environment with appropriate compliance, protection of assets and efficient execution of business processes. Our proactive planning is welcomed and recognized to mitigate the impact of incidents to the campus and community.

3
Table Of Contents
I. Customer SatisfactionII. FinancialIII. Key Performance Indicators
A. LossesB. Activities
IV.Regulatory Compliance – External Agencies
2009 EH&S Annual Report
4
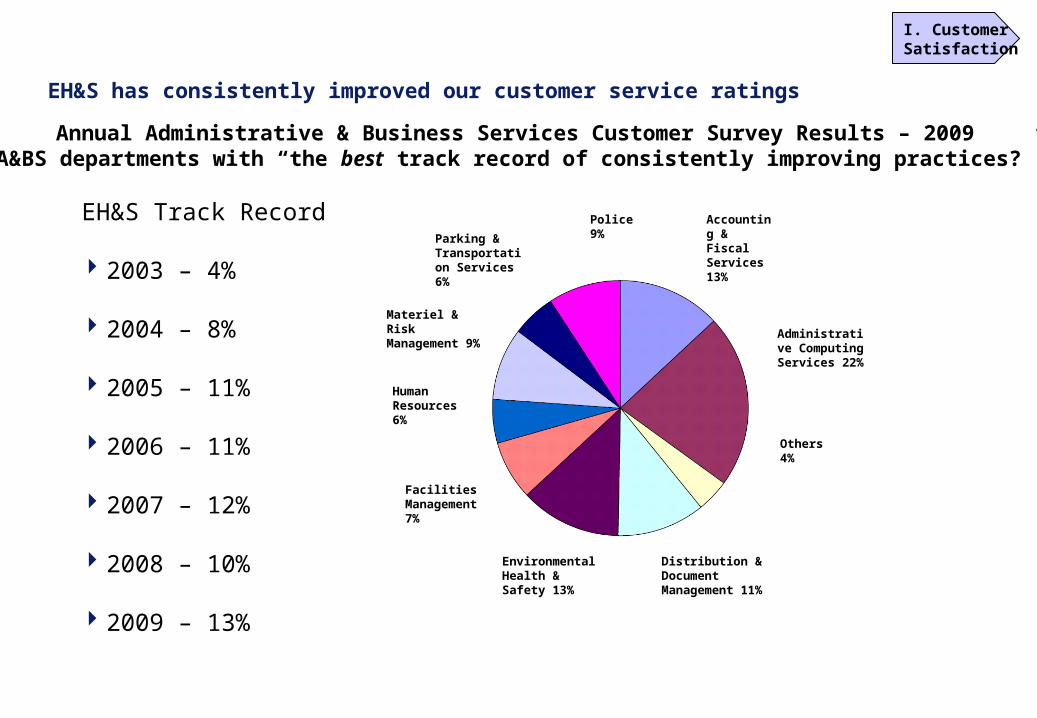
EH&S Track Record
2003 – 4%
2004 – 8%
2005 – 11%
2006 – 11%
2007 – 12%
2008 – 10%
2009 – 13%
EH&S has consistently improved our customer service ratings
Annual Administrative & Business Services Customer Survey Results – 2009 A&BS departments with “the best track record of consistently improving practices?”
Accounting & Fiscal Services 13%
Administrative Computing Services 22%
Others 4%
Distribution & Document Management 11%
Police 9%Parking &
Transportation Services 6%
Materiel & Risk Management 9%
Human Resources 6%
Facilities Management 7%
Environmental Health & Safety 13%
I. Customer Satisfaction

5
EH&S funding per Net Assignable Square Footage (NASF) has dropped over the past year.
EH&S Funding Per Laboratory NASF
$3.10
$3.20
$3.30
$3.40
$3.50
$3.60
$3.70
2006-2007 2007-2008 2008-2009
EH&S
$ P
er N
ASF
Lab Space NASF
II. Financial
EH&S Funding Per Total Campus NASF
$0.72
$0.74
$0.76
$0.78
$0.80
$0.82
$0.84
2006-2007 2007-2008 2008-2009
EH&S
$ P
er N
ASF
Campus NASF
2008-09 Funding:
ESP - Employee Support Program (2.2 Million) Funded by tax on campus payroll for campus support services. Supports 20.7 career FTEs (over half of EH&S staff) in salaries and benefits. Supports the general EH&S operational expenses such as supplies, materials & equipments.
Special Services Recharge ($740,000) - Supports & recovers all costs related to special services such as plan reviews and asbestos/lead/mold abatements.
Hazardous Waste Disposal Recharge ($550,000) - Supports & recovers all costs related to Hazardous Waste Disposal Program.
Permanent State Funds from the UC Irvine Office of Research (1.6 Million)

6
Workers’ Compensation Claims per 100 employees has been reduced by 31% over the past 3 years
UCI Claims Per 100 Employees
2.5
2.72.9
3.13.3
3.53.7
3.94.1
2005-2006 2006-2007 2007-2008 2008-2009
UCI Workers’ Compensation Claims Per 100 Employees
Cla
ims
Pe
r 1
00
Em
plo
ye
es
III. Key Performance Indicators

7
Compared to the UC average, UCI’s cost savings from FY 04/05 to FY 08/09 totals approximately $12 million
UCI and UC Employee Injury Costs
UCI vs. UC Workers' Comp Payroll Rates(Campus Payment Rate Per $100 of Payroll into UC WC Self Insurance Fund)
$0.40
$0.60
$0.80
$1.00
$1.20
$1.40
2005-2006 2006-2007 2007-2008 2008-2009
WC
Pay
roll
Rat
e
UCI UC
III. Key Performance Indicators

8
There are approximately 900 work units on the UC Irvine Campus. Of these work units 54% have Identified SOS representatives and 8% of these work units are currently actively engaged in the SOS program.
III. Key Performance Indicators
0%
10%
20%
30%
40%
50%
60%
70%
80%
90%
100%
2007 2008 2009
Campus Work Unit Actively Participating in SOS Campus Work Units with SOS Reps Identified

9
Percentage of Lab Deficiencies Corrected
This graph illustrates success within the labs in correcting hazards identified during lab surveys. The trend is positive as EH&S utilizes Be Smart About Safety (BSAS) funding and implements strategies to correct survey items.
0%
10%
20%
30%
40%
50%
60%
2006 2007 2008 2009
% F
ixe
d
Year # of findings # of findings fixed Percentage Fixed
2006 2486 387 16%
2007 2320 751 32%
2008 1794 746 42%
2009 1885 1017 54%
III. Key Performance Indicators
10
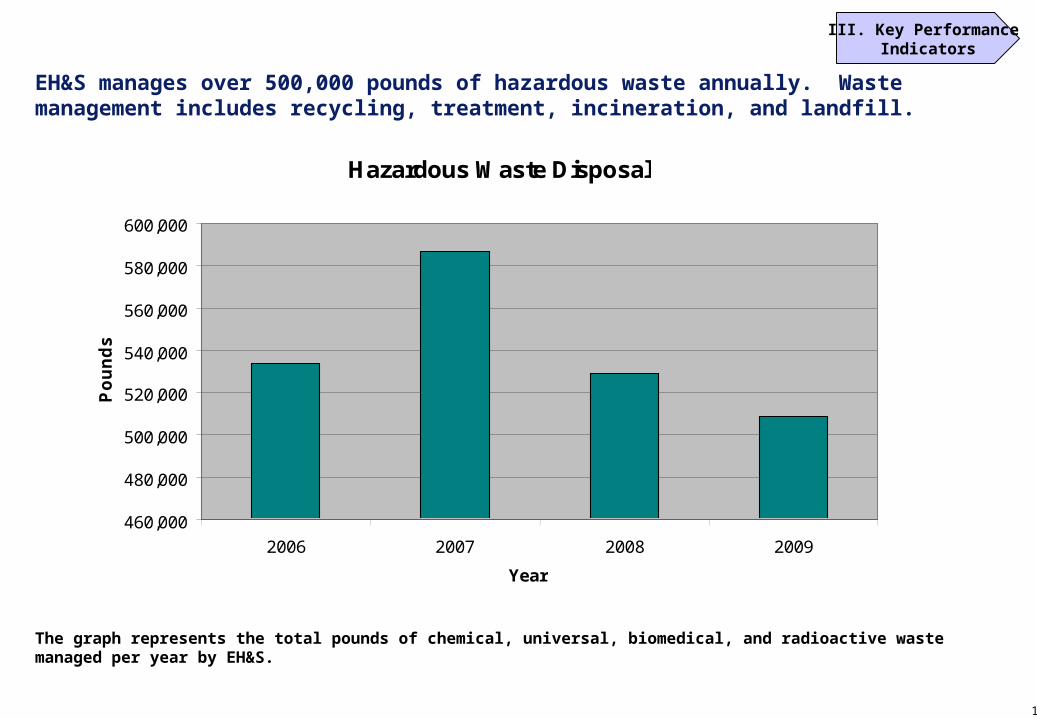
The graph represents the total pounds of chemical, universal, biomedical, and radioactive waste managed per year by EH&S.
III. Key Performance Indicators
EH&S manages over 500,000 pounds of hazardous waste annually. Waste management includes recycling, treatment, incineration, and landfill.
Hazardous Waste Disposal
460,000
480,000
500,000
520,000
540,000
560,000
580,000
600,000
2006 2007 2008 2009
Year
Po
un
ds
11
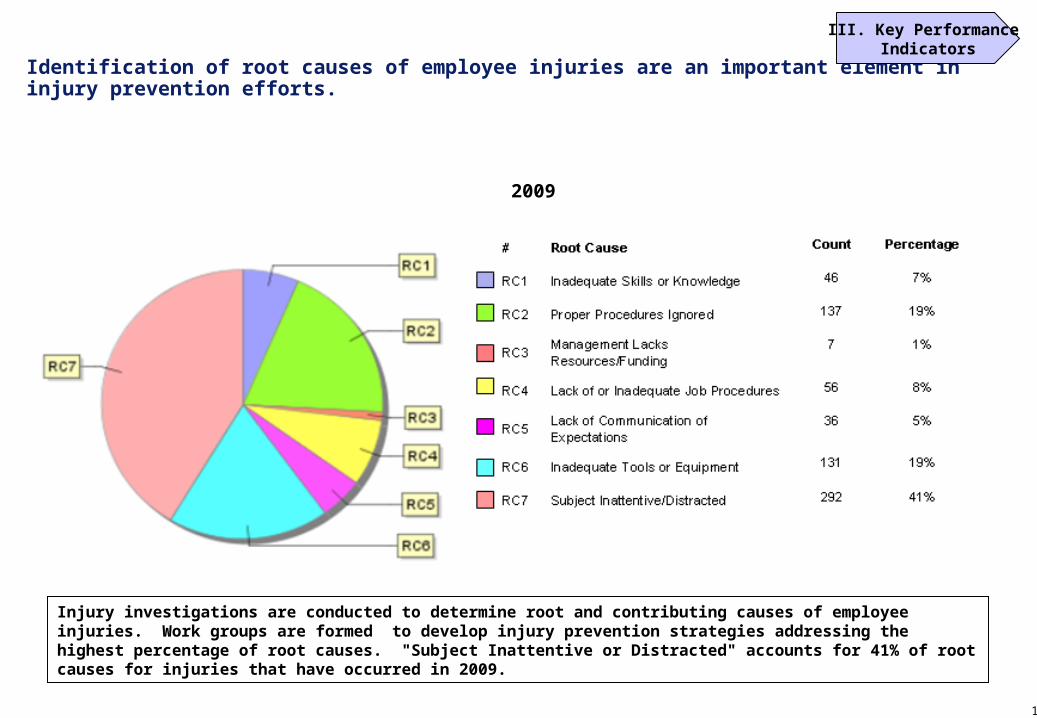
Identification of root causes of employee injuries are an important element in injury prevention efforts.
2009
Injury investigations are conducted to determine root and contributing causes of employee injuries. Work groups are formed to develop injury prevention strategies addressing the highest percentage of root causes. "Subject Inattentive or Distracted" accounts for 41% of root causes for injuries that have occurred in 2009.
III. Key Performance Indicators

12
EH&S manages approximately 110 safety and environmental programs. The graph above indicates campus compliance with these programs.
UCI Campus Compliance with Environmental Health and Safety Programs
7169
3340
4854
5963
66
0
10
20
30
40
50
60
70
80
90
100
FY 01-02 FY 02-03 FY 03-04 FY 04-05 FY 05-06 FY 06-07 FY 07-08 FY 08-09 Projected09-10
Perc
ent C
ompl
ianc
e
III. Key Performance Indicators
13
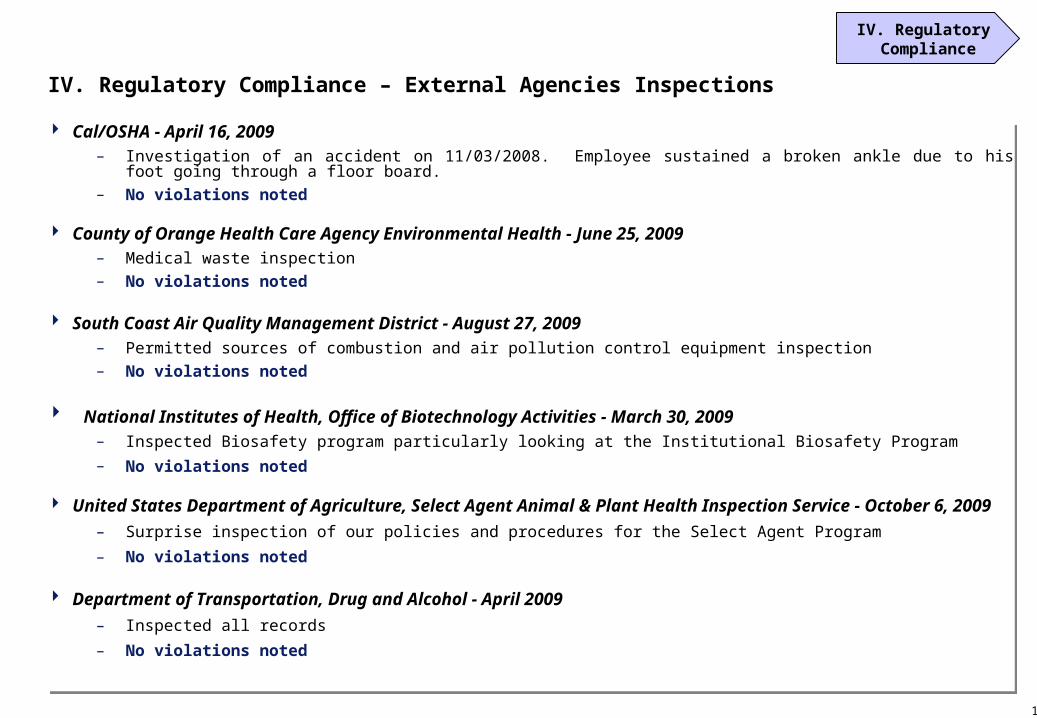
IV. Regulatory Compliance – External Agencies Inspections
Cal/OSHA - April 16, 2009– Investigation of an accident on 11/03/2008. Employee sustained a broken ankle due to his foot going through a floor board. – No violations noted
County of Orange Health Care Agency Environmental Health - June 25, 2009 – Medical waste inspection– No violations noted
South Coast Air Quality Management District - August 27, 2009 – Permitted sources of combustion and air pollution control equipment inspection– No violations noted
National Institutes of Health, Office of Biotechnology Activities - March 30, 2009 – Inspected Biosafety program particularly looking at the Institutional Biosafety Program
– No violations noted
United States Department of Agriculture, Select Agent Animal & Plant Health Inspection Service - October 6, 2009
– Surprise inspection of our policies and procedures for the Select Agent Program
– No violations noted
Department of Transportation, Drug and Alcohol - April 2009 – Inspected all records
– No violations noted
IV. Regulatory Compliance