environmental impact assessment - aga-portal · list of tables table 2.1 ... international...
TRANSCRIPT
Confidentiality Clause: This is a confidential document expressly prepared for the client’s evaluation of EIC’s technical report with
regard to the above referenced project. Unauthorized copying, duplication, and transmittal of this document in whole or in part for
other projects or to a third party is prohibited. We do not hold responsibility or any legal liability for the consequences arising from
the results or interpretations made therein.
Environmental Impact Assessment _____________________________________________________
For
Jebel Ali Power and Desalination Station M
April 1, 2009
Prepared for:
Prepared By:
Environmental International ConsultanEnvironmental International ConsultanEnvironmental International ConsultanEnvironmental International Consultantstststs
Office: P.O. Box 123401, Dubai, UAE
Tel: 04-3357044, Fax: 04-335733
http://www.eicon.ae

Table of Contents
1
EIA study for the proposed Jebel Ali Power and Desalination Station M
EXECUTIVE SUMMARY
CHAPTER 1 INTRODUCTION
1.1 Preamble 1-1
1.2 Objective of the study 1-2
1.3 Objective of the Project 1-2
1.4 Location and Accessibility 1-3
1.5 Methodology of EIA study 1-7
1.6 Approach of the EIA study 1-7
1.7 Structure of Report 1-8
CHAPTER 2 POLICY AND LEGAL FRAMEWORK
2.1 Preamble 2-1
2.2 Guidelines 2-1
2.3 Standards 2-3
2.3.1 Ambient Air Quality Standards 2-3
2.3.2 Ambient Noise Level 2-4
2.3.3 Wastewater Discharge Limits 2-5
2.3.4 Solid Waste 2-8
2.4 ISO 14000 2-10
CHAPTER 3 PROJECT DETAILS
3.0 Project Characteristics 3-1
3.1 Outline and Rationale of the Project 3-1
3.2 Plant Layout and Land Requirement 3-1
3.3 Project Description – Power Plant (2000 MW) 3-2
3.3.1 Main Systems / Components 3-3
3.3.2 Modes of Operation 3-4
3.3.3 Abnormal Operating modes 3-5

Table of Contents
2
EIA study for the proposed Jebel Ali Power and Desalination Station M
3.4 Project Description – Desalination plant 3-6
3.4.1 Details of Proposed Desalination Plant 3-9
3.5 Operational Features of the Project 3-11
3.5.1 Fuel 3-11
3.5.2 Chemicals 3-14
3.6 Water System 3-15
3.7 Wastewater Treatment System 3-16
3.7.1 The Treatment for the Oily Wastewater 3-18
3.7.2 Treatment for Chemical Wastewater 3-19
3.8 Details of Sewage Water Treatment System 3-23
3.9 Sources of Pollution 3-25
3.9.1 Air Environment 3-26
3.9.2 Water Environment 3-27
3.9.3 Solid waste 3-27
3.9.4 Noise Levels 3-28
CHAPTER 4 BASELINE ENVIRONMENTAL STATUS
4.1 Preamble 4-1
4.2 Climatology and Meteorology 4-1
4.2.1 General 4-1
4.2.2 Temperature 4-2
4.2.3 Relative Humidity 4-2
4.2.4 Atmospheric Pressure 4-3
4.2.5 Rainfall 4-3
4.2.6 Annual Wind Pattern 4-4
4.3 Sea Surface Water Treatment 4-6
4.4 Landuse 4-7
4.5 Regional Geology 4-8
4.6 Existing Baseline Air Quality 4-8
4.7 Biological Features 4-11

Table of Contents
3
EIA study for the proposed Jebel Ali Power and Desalination Station M
4.7.1 General 4-11
4.7.2 Birds 4-12
4.7.3 Fauna, Wildlife 4-12
4.8 Soil, Geology and Geomorphology 4-13
4.8.1 General 4-13
4.8.2 Regional geology and Hydrogeology 4-13
4.9 Shoreline, Water Courses and Discharges 4-14
4.10 Cultural Heritage 4-15
4.11 Lanscape and Topography 4-15
4.12 Surrounding Recreational Land uses 4-15
4.13 Population 4-16
4.14 Water Quality 4-16
4.14.1 General Characteristics of the Arabian Gulf 4-17
4.14.2 Water Quality of the Gulf 4-18
4.14.3 Environmental threats of the Gulf 4-18
4.14.4 Water Quality off DEWA Station M 4-18
4.14.5 Results and Discussion 4-20
4.15 Marine Ecology 4-23
4.15.1 The Arabian Gulf Marine Environment 4-25
4.15.2 Objective of the Marine Study 4-26
4.15.3 Data Collection and Monitoring Stations 4-26
4.15.4 Strategy of Selecting Biological Variables 4-27
4.15.5 Methodology of Sampling and Analysis 4-30
4.15.6 Phytoplankton 4-31
4.15.7 Macro – Benthos 4-33
4.15.8 Conclusion 4-34
4.16 Terrestrial Ecology 4-37

Table of Contents
4
EIA study for the proposed Jebel Ali Power and Desalination Station M
CHAPTER 5 ENVIRONMENTAL IMPACT ASSESSMENT
5.1 Preamble 5-1
5.2 Impacts during Construction Phase 5-4
5.2.1 Impact on Air Quality 5-4
5.2.2 Impact on Water Quality 5-5
5.2.3 Impact on Noise Level 5-6
5.2.4 Impact on Landuse 5-7
5.2.5 Assessment of Works, Health and Safety 5-7
5.3 Impacts during Operation Phase 5-8
5.3.1 Impact on Ambient Air Quality 5-8
5.3.2 Impact on Water Quality 5-12
5.3.3 Impact of Brine from Desalination Plant 5-14
5.3.4 Impact on Noise Levels 5-18
5.3.5 Impact on Social Life 5-20
5.3.6 Impact on Cultural Heritage 5-21
5.3.7 Impact on Terrestrial Ecology 5-21
5.3.8 Solid Waste 5-21
CHAPTER 6 PROPOSED MITIGATION MEASURES
6.1 Preamble 6-1
6.2 Mitigation Measures during Design and Construction 6-1
6.2.1 Dust Emissions 6-1
6.2.2 Noise Emissions 6-3
6.2.3 Flora and Fauna 6-3
6.2.4 Traffic and Transport 6-4
6.2.5 Socio – economic effects 6-4
6.2.6 Archaeology 6-5
6.2.7 Solid wastes during Construction 6-5
6.2.8 Occupational Health and Safety 6-6
6.3 Mitigation Measures during Operation 6-7

Table of Contents
5
EIA study for the proposed Jebel Ali Power and Desalination Station M
6.3.1 Introduction 6-7
6.3.2 Air Quality during operation 6-8
6.3.3 Noise Emissions during Operation 6-8
6.3.4 Flora and Fauna during Operation 6-9
6.3.5 Visual Impact during Operation 6-9
6.3.6 Solid Waste Impacts during Operation 6-9
6.3.7 Health and Safety during Operation 6-10
6.4 Environment Monitoring Program 6-11
6.5 Hazard Protective Measures 6-15

Table of Contents
6
EIA study for the proposed Jebel Ali Power and Desalination Station M
LIST OF TABLES
Table 2.1 Ambient Air Quality Standards 2-3
Table 2.2 Standards For Ambient Noise Levels 2-4
Table 2.3 Limits for Discharges into the Marine Environment 2-5
Table 2.4 Dubai Municipality Wastewater Discharge Standards 2-6
Table 2.5 Limits of Trace Metals in Sludge intended for Disposal on Land 2-8
Table 2.6 Land Contamination Indicator Levels 2-9
Table 3.1 Parameters for the Calculation of Emissions 3-2
Table 3.2 Natural Gas Analysis 3-11
Table 3.3 The Typical Diesel Oil Analysis 3-12
Table 3.4 Quality of the Wastewater Prior to the Treatment 3-17
Table 3.5 Details of Stack and Gaseous Emission 3-25
Table 4.1 Climatological Data – Dubai International Airport – 2008 4-3
Table 4.2 Monthly Sea Temperature Variation for the Year 2007 4-6
Table 4.3 Jebel Ali Village Air Quality Monitoring 4-10
Table 4.4 Background Heavy Metals in Soil in Dubai 4-14
Table 4.5 Selected Water Quality Parameters and Their Test Methods 4-19
Table 4.6 Distribution of Phytoplankton Cell Counts (NO/L) Along
Different Stations
4-35
Table 4.7 Distribution of Macro-Benthos Biomass (gm/m2) and Population
(no/m2)
4-36
Table 5.1 Impact Rating Assessment Matrix 5-2
Table 5.2 Impact Rating Assessment Matrix 5-3
Table 5.3 Source Data of the proposed ‘M’ Station Desalination Plant 5-10
Table 5.4 Predicted 24-Hourly short term Incremental Concentrations of
NOx
5-11
Table 5.5 Quality of Wastewater 5-13
Table 5.6 Predicted Noise Levels Plant Boundary 5-19
Table 6.1 Role and Responsibilities of the Project Proponent 6-2
Table 6.2 Responsibilities of Environmental Team during Operational 6-7

Table of Contents
7
EIA study for the proposed Jebel Ali Power and Desalination Station M
Phase
Table 6.3 Environmental Monitoring During Construction Period 6-12
Table 6.4 Environmental Monitoring During Operation Period 6-13

Table of Contents
8
EIA study for the proposed Jebel Ali Power and Desalination Station M
LIST OF FIGURES
Figure 1.1 Proposed Project site 1-4
Figure 3.1 Process Flow Diagram of MSF with Brine Circulation 3-7
Figure 4.1 Annual Windrose of Dubai International Airport – 2008 4-5
Figure 4.2 Monthly Sea Water Temperature 4-7
Figure 4.3 Marine Water Quality Monitoring 4-20
Figure 4.4 Monitoring Stations Along Coastal Environment of DEWA 4-27
Figure 4.5 Marine Environment of DEWA showing outfall Locations 4-29
Figure 4.6 Distribution of Macro-Benthos Biomass (gm/m2 ) and
Population (no/m2)
4-37
Figure 5.1 Noise Dispersion Contours 5-20
LIST OF APPENDICES
Appendix 1 Layout Plan of the Desalination plan
Appendix 2 Main Stack and Bypass Stack
Appendix 3 Wastwater Treatment P & I Diagram
Appendix 4 Sewage Treatment Plan

Executive Summary
E-1
EIA study for the proposed Jebel Ali Power and Desalination Station M
M/s Fisia Italimpianti, Gruppo Impregilo & M/s Doosan are the main
contractor for the execution of the project, retained M/s. Environmental
International Consultants, Dubai to carry out the Environmental Impact
Assessment (EIA).
The EIA has been carried out as per the ETG 53 prescribed by Dubai
Municipality for getting environment clearance. EIA report has been prepared
in accordance with the Guidelines of Local Order 61 of 1991 published by
Dubai Municipality (DM). The environmental impacts of the proposed project
for the activities during construction as well as operation phase. As far as
possible, these evaluations are quantitative and based on comparisons with
relevant available standards specified by Dubai Municipality and International
Organizations (WHO, World Health Organization, World Bank).
Location of the project:
Proposed project is located in Dubai, U.A.E and is about 0.5 km from west of
the Dubai-Abu Dhabi highway and adjacent to Jebel Ali Free Zone. The
proposed site is at the existing Jebel Ali Power Station Complex. The project
location is already owned by DEWA. The project site is located along the
shore of the Arabian Gulf and adjacent to existing Jebel Ali ‘L’ power station.
The new desalination plant will be part of the Jebel Ali Power Station.
Project description:
The project consists of gas-based power plant to generate 2000 MW of
electricity and desalination plant of 140 MIGD capacities to produce potable
water.

Executive Summary
E-2
EIA study for the proposed Jebel Ali Power and Desalination Station M
The seawater desalination plant shall consist of eight desalination units
having capacity of 17.5 MIGD each. This will result in total desalination plant
capacity of 140 MIGD.
1 Power Plant
To meet the continuously growing requirement for power in the emirate of
Dubai, UAE, the Dubai Electricity and Water Authority (DEWA) has planned to
install 2000 MW power plant.
The power plant of Jebel Ali ‘M’ station extension includes a total of six Gas
Turbines (GTs), equipped with Heat Recovery Steam Generators (HRSG)
comprising duct burners for supplementary firing, 3 condensing extraction
Steam Turbines (STs), and 2 Auxiliary Boilers (ABs). All considerations in the
present Report are based on this configuration.
In order to achieve a gross output of 2000 MW, six gas turbines will be
installed in ‘M’ station. The GTs will be equipped with dry low NO2 combustion
chambers for natural gas and Diesel oil fuel operation. No injection water or
steam injection facilities will be foreseen for NO2 reduction in case of Diesel oil
operation (only emergency cases).
2 Desalination Plant
The proposed desalination plant will be operated on Multi Stage Flash (MSF)
process.
Each distiller unit consists on a multistage flash evaporator chamber with its
auxiliary and ancillary equipment.

Executive Summary
E-3
EIA study for the proposed Jebel Ali Power and Desalination Station M
The evaporator is a Multi Stage Flash type (MSF) with brine recirculation and
of cross tube single tier design. An anti scale system is used to treat the
recirculating brine in the whole temperature operating range of the evaporator.
The distillate produced by the eight desalination units is sent to the product
water system and blending plant. Each Unit can be subdivided from the
functional point of view in the following sections:
• Brine Heater Section;
• Heat Recovery Section; and
• Heat Reject Section.
Sources of Pollution:
1 Air emission:
In the proposed project the air emissions will be from the six stacks of power
plant and two stacks of auxiliary boilers in desalination plant. Since the power
plant and boilers will be fired on natural gas, the gaseous emissions will
comprise of NOx. These power units will be provided with stacks of adequate
height for the wider and quicker dispersion of the gaseous emissions.
The maximum incremental concentrations of NOX will be 8.6 µg/m3 and
occurring at a distance of about 3.0 km in southeast direction from the plant,
which are well within the stipulated standards of Dubai Municipality.
2 Wastewater
The wastewater generated in the project consists of;
• Oily Wastewater from service area of the power plant;

Executive Summary
E-4
EIA study for the proposed Jebel Ali Power and Desalination Station M
• Chemical dosing area of power plant;
• Condensate discharge from the steam generator;
• Closed cooling water system;
• Brine from desalination plant; and
• Sewage from the restrooms.
The wastewater generated in the power plant shall be treated in the Effluent
Treatment Plant before sending it to desalination plant. The quality of the
discharge shall comply with Dubai Municipality regulation applicable for the
discharge into sea. The quality of condensate and discharge from closed
cooling water system will be similar to sea water quality except for the higher
temperature. These wastewater discharges shall be mixed with brine before
discharging into sea through out fall point.
The domestic wastewater shall be treated in the Sewage Treatment Plant and
treated wastewater shall be utilized in the landscaping.
3 Noise
The major noise generating equipment in the proposed facility will be pumps
used in pumping of seawater and brine. These pumps will be designed for
noise levels <85 dB (A) at 1 m from the equipment. These pumps will be
provided with pump house with adequate acoustic to attenuate the noise
levels. The noise levels shall fall below 70 dB (A) outside the pump house.
4 Solid waste
The solid waste shall be generated at the screening unit, where the debris
from the seawater will be screened out. The solid waste will be sent to the

Executive Summary
E-5
EIA study for the proposed Jebel Ali Power and Desalination Station M
solid waste shall be non-hazardous in nature and disposed off as per Dubai
Municipality guidelines.
5 Salinity
Salt concentrations of the final effluent are above those of the receiving
waters, and will be consistently between 1 and 2.5 ppt above the existing
seawater background levels. In normal and minimal conditions, the salinity of
the effluent at the exit of the outfall (end-of-pipe) will be less than a 5%
increase above background seawater salinity. It is expected that at the edge
of the mixing zone, the Dubai Municipality (DM) Marine Standard (no more
than 5% in background concentration) would be respected at all conditions.
6 Chlorine
A chlorine generating system will produce the 0.1 to 0.15% sodium
hypochlorite solution from seawater feed. This solution will be injected into the
cooling tower and MED makeup streams on a continuous basis for a chlorine
residual of 0.5 ppm in these flows.
7 Oxygen
The DEWA effluent will be aerated in a way that the dissolved oxygen (DO)
concentration at the exit of the aeration basin would be at least 3 mg/l and at
the edge of the mixing zone, the dissolved oxygen levels should be close to
the background dissolved oxygen levels. The DO concentrations in the
effluent should not cause any mortality and should not affect the marine
organisms.

Executive Summary
E-6
EIA study for the proposed Jebel Ali Power and Desalination Station M
8 Anti-scaling and antifoaming agents
Use of anti-scaling agents may lead to formation of orthophosphates from
hydrolysis of polyphosphates. Orthophosphates are a macronutrient that may
enhance biological growth (e.g. red and green algae). Polymeric additives
based on polyacrylate or polycarboxylic acids prevent this problem, and are
biodegradable and certified non-toxic.
Similarly, antifoaming agents are also degradable and non-toxic. Therefore
anti-scaling and antifoaming agents will be selected to avoid polyphosphate
formation and their impact on the marine environment will be considered
negligible.
9 Heavy Metals
Discharged brine contains low concentrations of metal ions resulting from
corrosion, namely copper, nickel, chromium and iron. These concentrations
are profoundly increased with acid cleaning of the plants, which occurs once
or twice per year.
Bioaccumulation of heavy metals in benthic fauna around the outfall could, in
theory, occur. Nevertheless, heavy metal concentrations at the outfall would
be very low due to the cooling water dilution, and below DM regulations.
These metals are also normal constituents of the sea (even if in low
concentrations) and are not of great concern except in extreme occurrences.
If bioaccumulation would occur, it would be locally.

Executive Summary
E-7
EIA study for the proposed Jebel Ali Power and Desalination Station M
10 Thermal Impacts
The use of seawater will result in a discharge seawater temperature will
comply DM Standards. This small change in seawater temperature should not
be of concern for the marine environment, keeping in mind the choice of the
outfall location and design for the initial dilution
11 Socio economic
The new power plant will create new employment opportunities for
approximately 200 qualified employees, who will most likely be living in
downtown Dubai. Therefore the corresponding effect on population around
the project area will not be significant.

CHAPTER 1
Introduction
1-1
EIA study for the proposed Jebel Ali Power and Desalination Station M
1.1 Preamble
The demand of power and water is rapidly increasing in Dubai Emirates due
to growing industrial activities in the region. To meet the growing demand of
waster and power, Dubai Electricity and Water Authority (DEWA) is proposing
the Jebel Ali Power and Desalination Station ‘M’ in addition to the existing
power project located adjacent to the project site. The project consists of
power plant with capacity of 2000 MW, 140 MIGD desalination plant and 400
kV substation.
The Environmental Impact Assessment is carried out for the proposed project
consisting of power having capacity of 2000 MW and 140 MIGD capacity
desalination plant. The desalination plant shall cater the requirement of power
plant and fulfill the water demand of Dubai city.
The power plant will be planned and built by M/s Doosan Heavy
Industries & Construction Company. The Desalination plant shall be
designed and constructed by M/s Fisia Italimpianti, Gruppo Impregilo.
Both these companies retained M/s. Environmental International
Consultants, Dubai to carry out the Environmental Impact Assessment (EIA).
The EIA shall be carried out as per the ETG 53 prescribed by Dubai
Municipality for getting environment clearance. EIA report has been prepared
in accordance with the Guidelines of Local Order 61 of 1991 published by
Dubai Municipality (DM). The environmental impacts of the proposed project
for the activities during construction as well as operation phase. As far as
possible, these evaluations are quantitative and based on comparisons with
relevant available standards specified by Dubai Municipality and International
Organizations (WHO, World Health Organization, World Bank).

CHAPTER 1
Introduction
1-2
EIA study for the proposed Jebel Ali Power and Desalination Station M
1.2 Objective of the Study
EIA is a tool to assess the sustainability of the project with respect to benefits
of the project and environmental issues. The objective of EIA is to improve the
decision making process and to ensure that the project options under
consideration are environmentally sound and sustainable. EIA identifies the
ways to minimize the adverse impacts and identify the ways to improve the
environment.
The advantages of an EIA are:
• It allows project designers and implementing agencies to address
environmental issues in a timely and cost effective manner;
• Reduces the need for the project conditionality since appropriate steps can
be taken in advance or incorporated into project design or alternatives to
the proposed project can be considered; and
• Helps to avoid costs and delays in implementation due to unanticipated
environmental problems.
The basic objective of conducting an EIA study for the proposed project is to
rationalize the procedure for an effective environmental management plan,
leading to an improvement in environmental quality as a result of constructing
this power station.
1.3 Objective of the Project
Desalination capacities offered by the project are of basic importance for the
future water supply needs of the Dubai. Therefore, type, size and location of
the plant as well as the fuel to be used have been determined to meet
necessary development in energy supply as well as the limitation or
environmental impacts resulting from the plant.
CHAPTER 1
Introduction
1-3
EIA study for the proposed Jebel Ali Power and Desalination Station M
To meet the continuously growing requirement for water in Dubai, UAE, the
Dubai Electricity and Water Authority (DEWA) is planning to extend the
existing Jebel Ali Power and Desalination unit to have an additional installed
capacity of 2000 MW power with 140 MIGD desalination plant.
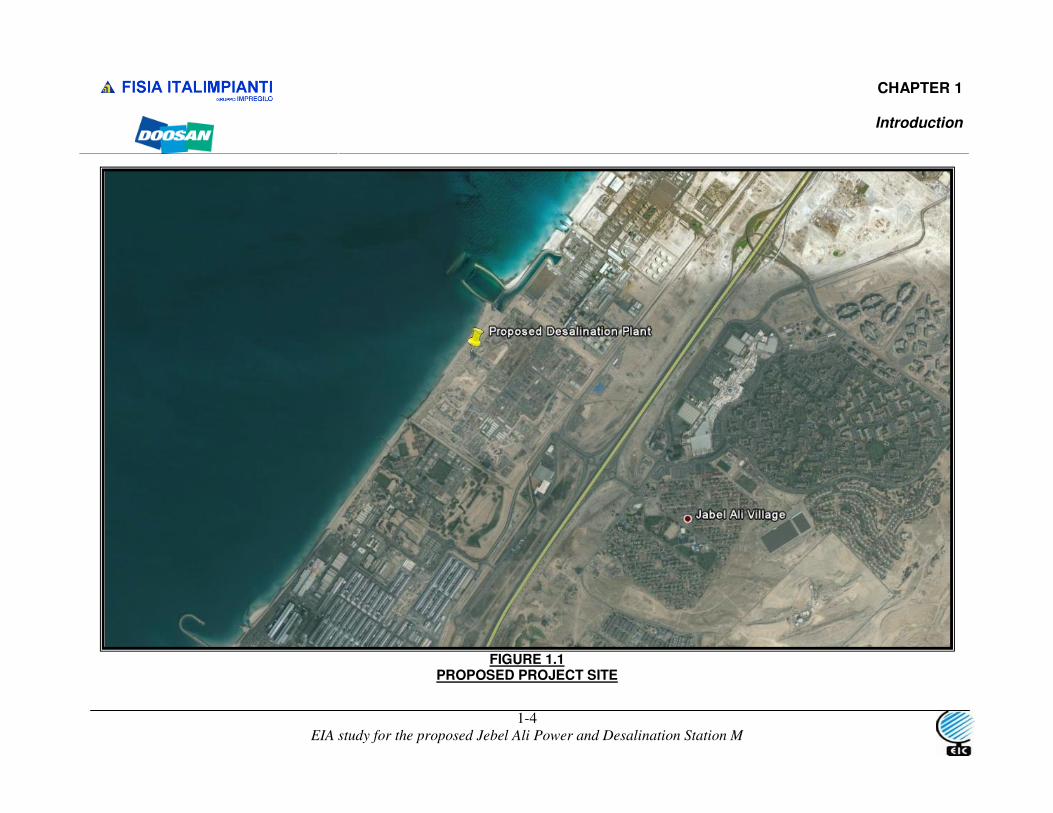
1.4 Location and Accessibility
Proposed project is located in Dubai, U.A.E and is about 0.5 km from west of
the Dubai-Abu Dhabi highway and adjacent to Jebel Ali Free Zone. The
present location of the proposed project is shown in Figure 1.1.
The proposed site is at the existing Jebel Ali Power Station Complex. The
project location is already owned by DEWA.
The project site is located along the shore of the Arabian Gulf and adjacent to
existing Jebel Ali ‘L’ power station. The new desalination plant will be part of
the Jebel Ali Power Station.
Jebel Ali Power complex consist of the following operating units:
• Station ‘D’ Phase I, was built between 1976 and 1980. The plant consist
of five steam turbine generators each of 68 MW capacity and five
desalination plants producing in total 14.38 MIGD of water. During the
years 1982 and 1983, two gas turbines each with a summer site rating
capacity of 42.50 MW were added.
• Station ‘D’ Phase II, was built between 1981 and 1984. It consists of
three steam turbine generators each of 75 mw capacity and three
desalination plants producing in total 17.16 MIGD of water.
CHAPTER 1
Introduction
1-4
EIA study for the proposed Jebel Ali Power and Desalination Station M
FIGURE 1.1
PROPOSED PROJECT SITE

CHAPTER 1
Introduction
1-5
EIA study for the proposed Jebel Ali Power and Desalination Station M
• Station ‘E’, consisting of three gas turbine generating plants each of 84
MW capacity (gross) at 50o C and four desalination plants producing 24
MIGD, was commissioned between 1989 and 1991. The station was
extended by two gas turbine generators with a total site summer output of
around 180 MW (gross). These two units were commissioned in 1992. The
extension part was converted to combined cycle operation by adding heat
recovery systems and a steam turbine generator of around 112 MW
(gross) capacity, these being finally commissioned in 1996
• Station ‘G’, consisting of four gas turbine generators having a total
capacity of 457 MW (gross) and eight desalination plants producing 60
MIGD of water, was commissioned between 1993 and 1994.
• Station ‘G’ extension consists of one gas turbine generator and one
WHRB of the same type as for Station ‘G’. The gas turbine generator has
a capacity during summer of 121 MW (gross). In addition, the station
possess two backpressure steam turbines each with a capacity of 71 MW
and a further backpressure steam turbine with a capacity of around 58 MW
located at E station. The units were commissioned between 1996 and
1997.
• Station ‘K’ Phase I plant was awarded at the beginning of 1999 and has
two desalination units (10 MIGD each) associated with blending plant,
potable water reservoir, and potable water pumps etc. The steam supply
for these two desalination units was sourced from existing auxiliary boilers
at ‘G’ Station until the new power plant ‘K’ Station Phase II took over the
steam supply for the desalination units of Phase I & II.
• Repowering of ‘D’ Station Phase II was awarded in 1999 and comprises
self contained gas turbine generator units (GT) having a total capacity of
approximately 400 MW at 50o C ambient temperature net of all auxiliary
power demands and losses, exporting to the existing Dubai grid and

CHAPTER 1
Introduction
1-6
EIA study for the proposed Jebel Ali Power and Desalination Station M
equipped with Waste Heat Recovery Boilers (WHRB) to generate steam
by utilising all the waste heat available in Gas Turbine exhaust gas and
supply steam to the existing three 75 MW steam turbines and three 5.75
MIGD desalination plants of Station ‘D’ Phase II plant.
• Station ‘K’ Phase II, was built between 2000 and 2003 and consists of
three gas turbine generators with WHRB, two pressure steam turbines
having a total capacity of 835 MW (gross) as well as three desalination
plants producing 40 MIGD of water. The combined cycle power plant also
supply low pressure steam for Station ‘K’ Phase I.
• Station ‘H’, Phase I, consisting of six simple cycle Gas Turbines suitable
for quick starting & Peak shaving operations having a total capacity of 607
MW at 50° C ambient temperature, was commissioned between 1998 and
1999.
• Phase II, consisting of three simple cycle Gas Turbines suitable for quick
starting & Peak shaving operations having a total capacity of 800 MW, to
be commissioned between May 2006 and June 2006.
• Phase III, consisting of four simple cycle Gas Turbines suitable for quick
starting & Peak shaving operations having a total capacity of 800 MW, to
be commissioned by April 2008.
• Station ‘L’, Phase I, consisting of three Gas Turbines, three Waste Heat
recovery Boilers, two Auxiliary Boilers, two Back Pressure Steam turbines
and three Desalination Plants with a total capacity of 850 MW and 70
MIGD of water, to be commissioned between December 2005 and
February 2006.

CHAPTER 1
Introduction
1-7
EIA study for the proposed Jebel Ali Power and Desalination Station M
• Station ‘L’, Phase II, consisting of four Gas Turbines, four Waste Heat
Recovery Boilers. Two Auxiliary Boilers, two Condensing Steam Turbines
and four Desalination Plants with a total capacity of 1200 MW and 55
MIGD of water to be commissioned between April 2007 and April 2008.
In total the Jebel Ali Power and Desalination Station has at the moment
without the installation for ‘M’ Station a total installed capacity of 3833 MW
power generation plus 188 MIGD water productions. Layout plan of the
proposed Desalination plant is shown in Appendix 1.
1.5 Methodology of EIA study
The proposed Desalination project is designated to be developed under the
Local Order 61/1991 of Environmental Protection and Safety Section, which is
guided by Technical Guideline 53 for Environmental Impact Assessment
Procedure by Dubai Municipality.
This report presents the results of the EIA process, which is intended to:
• Establish and review existing conditions pertaining to the plant site and
surrounding areas;
• Identify and assess the environmental impacts during construction phase
and subsequently during operation phase; and
• Advise and assist in identifying appropriate measures to mitigate adverse
impacts to be adopted under Environment Management Plan (EMP) for all
specified significant environmental impacts likely to emerge.
1.6 Approach of the EIA study
EIC has adopted stepwise screening procedures for environmental impacts
identification and assessment. This report on EIA is based on the
observations made by the EIC team during visits to the study area and

CHAPTER 1
Introduction
1-8
EIA study for the proposed Jebel Ali Power and Desalination Station M
collection of available environmental data from secondary sources. Literature
has also been reviewed and relevant information has been collected for
environmental and social baseline. Reconnaissance surveys have been
conducted to identify the major environmental and safety issues from the
proposed project.
EIC has followed the standard EIA methodology and technique during the
entire study and whenever necessary it has used its own judgment based on
its own experience and knowledge. During the entire study appropriate quality
checks have been taken into consideration and best management practices
have been followed for a quality output.
Impacts are identified based on the actual and foreseeable events, including
operational events and typical events of the proposed expansion. Processes
that may create risks to the natural environment are considered in terms of
key potential environmental impacts. Mitigation measures to be adopted
under Mitigation Management Plan for all specified significant environmental
impacts likely to result during the construction and subsequently during
operation, is also a part of the EIA report. The likely impacts identified and
recommended mitigation measures are based on the following:
• Project information provided by project proponent;
• Baseline information and reconnaissance survey of the study area;
• EIC’s past experience on similar projects; and
• Standard National/International environmental management guidelines/
practices.
1.7 Structure of Report
This report is structured based on the table of contents suggested in ETG 53
by Dubai Municipality. A brief description of each chapter is presented below;

CHAPTER 1
Introduction
1-9
EIA study for the proposed Jebel Ali Power and Desalination Station M
Executive Summary Presents significant findings and
recommended actions.
Chapter 1 Introduction Presents, an introduction along with scope
and objective of this EIA study.
Chapter 2 Policy and Legal
Framework
Presents, Policy, legal, and administrative
framework applicable to the proposed
project.
Chapter 3 Project
Description
Presents, project details with regards to the
proposed project.
Chapter 4 Baseline Study Presents, description of existing
environment based on monitoring /
collection and evaluation of baseline data.
Chapter 5 Environment
Impact
Assessment
Presents, the significant environment
impacts of proposed project with respect to
air, water, soil, noise, solid waste and
Terrestrial and Marine ecological
environment.
Chapter 6 Mitigation
Measures
Presents, the followings:
• Mitigation Management Plan during
construction and operation of the
proposed project.
• Environmental Monitoring Plan
Appendices

CHAPTER 2
Policy and Legal Framework
2-1
EIA study for the proposed Jebel Ali Power and Desalination Station M
2.1 Preamble
The proposed power plant and desalination plant is designated to be
developed under the Local Order 61/1991 of Environmental Protection and
Safety Section.
The environmental health and safety department, Dubai Municipality has
developed environmental control rules, standards and guidelines for air, water
pollution management, dangerous/hazardous materials, solid wastes, noise
control for environmental management. These requirements are finalized in
close coordination with Federal Environmental Agency or Federal
Environmental law would be dealt with penalties as per EHS rules.
These guidelines give the authority to:
Issue environmental permits to the entity responsible for undertaking any
enterprise;
• Issue permits for discharge of trade waste/hazardous waste water,
domestic and hazardous solid waste;
• Request information as the authority thinks fit;
• Request Environmental Impact Assessment report containing relevant
information;
• Request information on pollution control activities;
• Issue an annually renewable Operation Fitness Certificate (OFC);and
• Revoke or suspend permits.
2.2 Guidelines
The owner of a works shall use the Best Practicable Environmental Option
(BPEO) for preventing the discharge of noxious or offensive substances into

CHAPTER 2
Policy and Legal Framework
2-2
EIA study for the proposed Jebel Ali Power and Desalination Station M
environment from the premises and for rendering harmless and inoffensive
such substances as may be so discharged. Whether or not a substance is
noxious or offensive shall be in the judgement of the authority and shall
include gases, vapours, smoke, grit, fume, noise, solid and liquid wastes etc.
The EHS department, Dubai Municipality has prepared Environmental
Technical Guidelines (ETGs) for specific facilities and concerns which need to
be addressed. The following EHS guidelines shall be applicable for the
proposed facility during operation:
• ETG 53, Environmental Impact Assessment Procedure by Dubai
Municipality;
• ETG 1, Application for waste discharge permits to sewer, land and marine
environment by Dubai Municipality;
• ETG 3, Guidelines for safety audit report by Dubai Municipality;
• ETG 7, Heat Stress at Work by Dubai Municipality;
• ETG 8, Entry into Confined Space by Dubai Municipality;
• ETG 10, Guarding of Dangerous Machinery by Dubai Municipality;
• ETG 13, Industrial Wastewater Disposal by Dubai Municipality;
• ETG 14 - 21, Personal Protective Equipments by Dubai Municipality;
• ETG 25, First aid requirements by Dubai Municipality;
• ETG 26, Application for approval of disposal of hazardous wastes by
Dubai Municipality;
• ETG 27, Annual approval for hazardous waste disposal by Dubai
Municipality;
• ETG 28, Waste minimization by Dubai Municipality;
• ETG 29, Requirements for the Discharge of Waste Gases, Fumes and
Dusts to the Atmosphere by Dubai Municipality;
• ETG 34, Requirement for the use of Waste Oil in Boilers and Furnaces;
CHAPTER 2
Policy and Legal Framework
2-3
EIA study for the proposed Jebel Ali Power and Desalination Station M
• ETG 37, Transport of Non-hazardous wastewater by tanker vehicles by
Dubai Municipality;
• ETG 40, Examination and Certification of Boilers and Pressure Vessels;
• ETG 44, Requirement for Reduction of Construction/demolition noise;
• ETG 45 , Requirements for the Control of Entertainment Noise by Dubai
Municipality;
• ETG 49, Hazardous waste exemption policy by Dubai Municipality;
• ETG 50, Requirements for transport of hazardous waste by Dubai
Municipality;
2.3 Standards
The following EHS standards are / shall be applicable during the construction
and operation of proposed desalination plant project:
• Environmental Standard and Allowable Limits of Pollutants on Land, Water
and Air environment (May, 2003) by Dubai Municipality; and
• Final Air Pollution Law, 2006 by FEA.
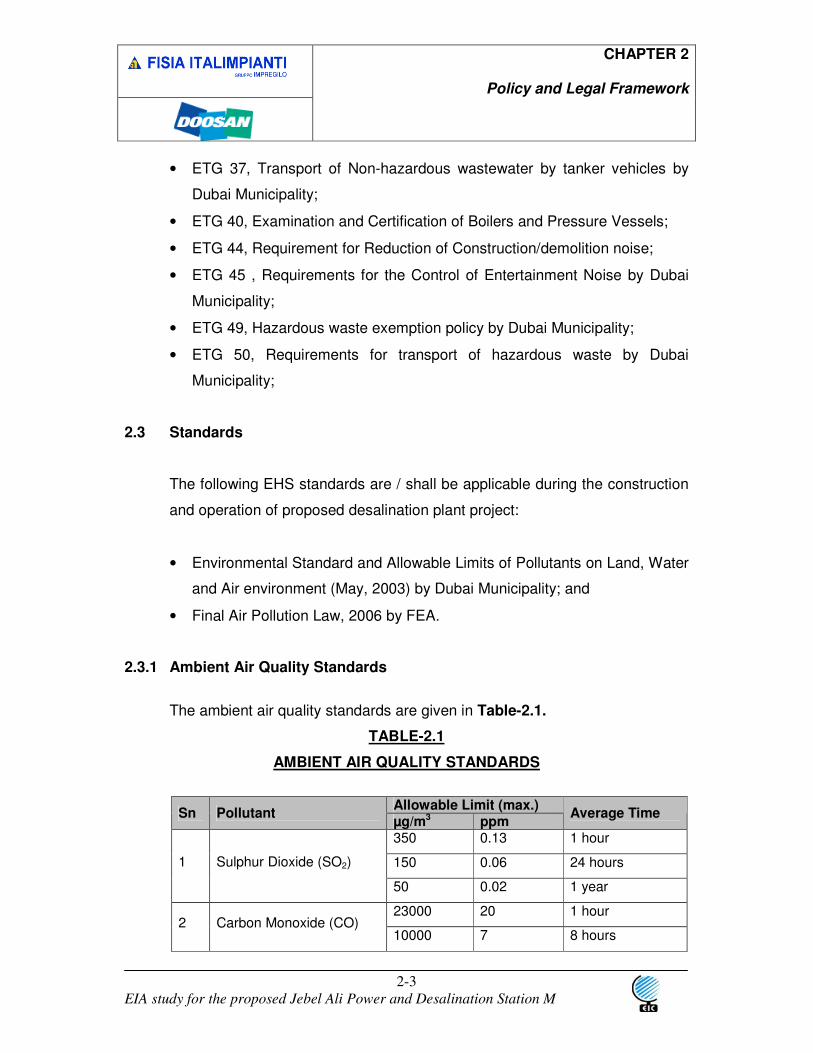
2.3.1 Ambient Air Quality Standards
The ambient air quality standards are given in Table-2.1.
TABLE-2.1
AMBIENT AIR QUALITY STANDARDS
Allowable Limit (max.) Sn Pollutant
µg/m3 ppm
Average Time
350 0.13 1 hour
150 0.06 24 hours 1 Sulphur Dioxide (SO2)
50 0.02 1 year
23000 20 1 hour 2 Carbon Monoxide (CO)
10000 7 8 hours

CHAPTER 2
Policy and Legal Framework
2-4
EIA study for the proposed Jebel Ali Power and Desalination Station M
Allowable Limit (max.) Sn Pollutant
µg/m3 ppm
Average Time
290 0.15 1 hour 3 Nitrogen Dioxide (NO2)
110 0.06 24 hours
160 0.08 1 hour 4 Ozone (O3)
120 0.06 8 hours
230 - 1 hour 5 TSPM
90 - 24 hours
300 - 1 hour
150 - 24 hours 6 PM10
0.5 600 3 months
Prescribed by FEA.
2.3.2 Ambient Noise Level
The standards are presented in Table- 2.2.
TABLE-2.2
STANDARDS FOR AMBIENT NOISE LEVELS
Allowable Limits for Noise
Level dBA* Sn Area
Day
7 a.m-8 p.m
Night
8 p.m-7 a.m
1 Residential areas with light traffic 40-50 30-40
2 Residential areas in downtown 45-55 35-45
3
Residential areas which includes
some workshops & commercial
business or residential areas near
highways
50-60 40-50
4 Commercial areas & Downtown 55-65 45-55
5 Industrial Areas Fence lines (Heavy
industry) 60-70 50-60
*Prescribed by FEA.
CHAPTER 2
Policy and Legal Framework
2-5
EIA study for the proposed Jebel Ali Power and Desalination Station M
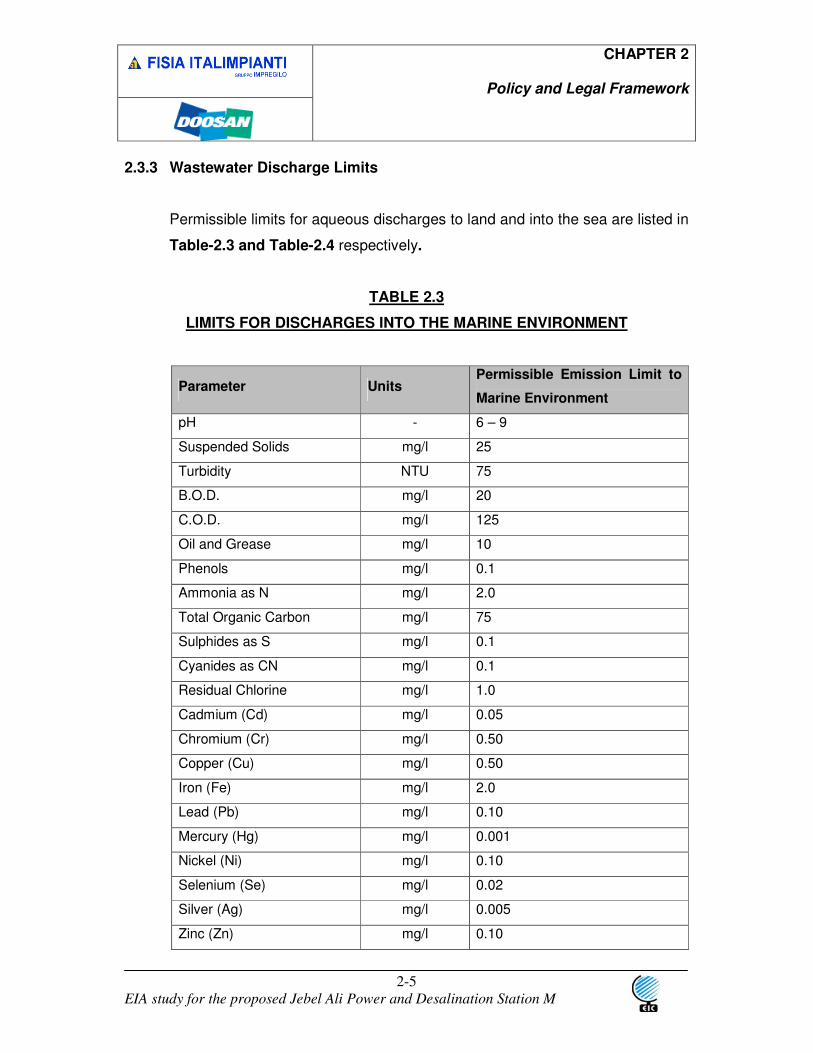
2.3.3 Wastewater Discharge Limits
Permissible limits for aqueous discharges to land and into the sea are listed in
Table-2.3 and Table-2.4 respectively.
TABLE 2.3
LIMITS FOR DISCHARGES INTO THE MARINE ENVIRONMENT
Parameter Units Permissible Emission Limit to
Marine Environment
pH - 6 – 9
Suspended Solids mg/l 25
Turbidity NTU 75
B.O.D. mg/l 20
C.O.D. mg/l 125
Oil and Grease mg/l 10
Phenols mg/l 0.1
Ammonia as N mg/l 2.0
Total Organic Carbon mg/l 75
Sulphides as S mg/l 0.1
Cyanides as CN mg/l 0.1
Residual Chlorine mg/l 1.0
Cadmium (Cd) mg/l 0.05
Chromium (Cr) mg/l 0.50
Copper (Cu) mg/l 0.50
Iron (Fe) mg/l 2.0
Lead (Pb) mg/l 0.10
Mercury (Hg) mg/l 0.001
Nickel (Ni) mg/l 0.10
Selenium (Se) mg/l 0.02
Silver (Ag) mg/l 0.005
Zinc (Zn) mg/l 0.10

CHAPTER 2
Policy and Legal Framework
2-6
EIA study for the proposed Jebel Ali Power and Desalination Station M
Parameter Units Permissible Emission Limit to
Marine Environment
Faecal Coliforms MPN/ 100 ml 1000
Source : Federal Regulation of Law No. 24, 1999.
TABLE 2.4
DUBAI MUNICIPALITY WASTEWATER DISCHARGE STANDARDS
Maximum Allowable Limits
Discharged to
Land as for
Irrigation
Sr.
No. Parameters Unit
Sewerage
System Drip Spray
Physical-Chemical
1 Biochemical Oxygen
Demand Mg/l 1000 20 10
2 Chemical Oxygen
Demand Mg/l 3,000 100 50
3 Chlorides Mg/l - 500 350
4 Chlorine – residual Mg/l 10 Not less than 0.5 mg/l
after 30 min contact time
5 Cyanides as CN Mg/l 1 0.05 0.05
6 Detergents Mg/l 30 - -
7 Fluorides mg/l - 1 1
8 Nitrogen, ammoniacal Mg/l 40 5 1
9 Nitrogen, organic
(Kjeldhal) Mg/l - 10 5
10 Nitrogen, total Mg/l - 50 30
11 Oil & Grease – Emulsified Mg/l 150 - -
12 Oil & Grease – Free oil Mg/l 50 5 5
13 pH (range) units 6 – 10 6.0–8.0 6.0–8.0
14 Pesticides, non-
chlorinated Mg/l 5 - -

CHAPTER 2
Policy and Legal Framework
2-7
EIA study for the proposed Jebel Ali Power and Desalination Station M
Maximum Allowable Limits
Discharged to
Land as for
Irrigation
Sr.
No. Parameters Unit
Sewerage
System Drip Spray
15 Phenols Mg/l 50 0.1 0.1
16 Phosphorous (P) Mg/l 30 20 20
17 Sulfates, total Mg/l 500 200 200
18 Sulfides as S Mg/l 10 0.05 0.05
19 Surfactants Mg/l - - -
20 Suspended Solids (SS) Mg/l 500 50 10
21 Temperature 0C 45 or > 5 of
ambient - -
22 Total Dissolved Solids Mg/l 3,000 1,500 1,000
Metals
23 Total Metals Mg/l 10 - -
24 Aluminum (Al) Mg/l - 2 2
25 Arsenic (As) Mg/l 0.50 0.05 0.05
26 Barium (Ba) Mg/l - 1 1
27 Beryllium (Be) Mg/l - 0.1 0.1
28 Boron (B) Mg/l 2.0 2.0 2.0
29 Cadmium (Cd) Mg/l 0.3 0.01 0.01
30 Chromium (Cr) Mg/l 1.0 0.1 0.1
31 Cobalt Mg/l - 0.1 0.1
32 Copper (Cu) Mg/l 1.0 0.2 0.2
33 Iron (Fe) Mg/l - 2.0 2.0
34 Lead (Pb) Mg/l 1.0 0.5 0.5
35 Magnesium (mg) Mg/l - 100 100
36 Manganese (Mn) Mg/l 1.0 0.2 0.2
37 Mercury (Hg) Mg/l 0.01 0.001 0.001
38 Molybdenum (Mo) Mg/l - 0.01 0.01
39 Nickel (Ni) Mg/l 1.0 0.2 0.2
40 Selenium (Se) Mg/l - 0.02 0.02

CHAPTER 2
Policy and Legal Framework
2-8
EIA study for the proposed Jebel Ali Power and Desalination Station M
Maximum Allowable Limits
Discharged to
Land as for
Irrigation
Sr.
No. Parameters Unit
Sewerage
System Drip Spray
41 Silver (Ag) Mg/l 1.0 - -
42 Sodium (Na) Mg/l - 500 200
43 Zinc (Zn) Mg/l 2.0 0.5 0.2
Bacteriological
44 Fecal Coliforms MPN/100
ml. 500 20 -
2.3.4 Solid Waste
The standards are applicable for different usages of solid wastes (hazardous
and non-hazardous) are given in Table 2.5.
TABLE 2.5
LIMITS OF TRACE METALS IN SLUDGE INTENDED FOR DISPOSAL ON LAND
Sn Contaminant Maximum Limit
(mg/kg)
10 year cumulative
loading on land
(kg/hectare)
1 Cadmium 30 20
2 Chromium 1,000 200
3 Cobalt 100 30
4 Copper 1,000 50
5 Lead 1,000 125
6 Mercury 10 5
7 Molybdenum 20 5
CHAPTER 2
Policy and Legal Framework
2-9
EIA study for the proposed Jebel Ali Power and Desalination Station M
Sn Contaminant Maximum Limit
(mg/kg)
10 year cumulative
loading on land
(kg/hectare)
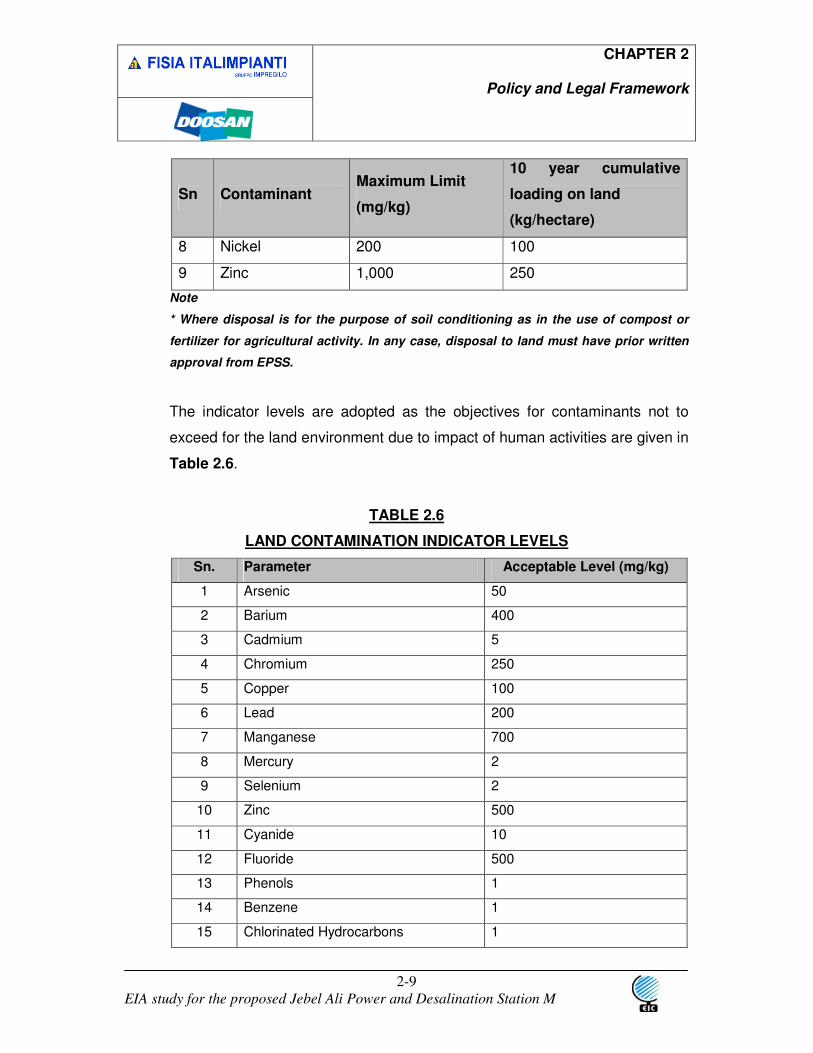
8 Nickel 200 100
9 Zinc 1,000 250
Note
* Where disposal is for the purpose of soil conditioning as in the use of compost or
fertilizer for agricultural activity. In any case, disposal to land must have prior written
approval from EPSS.
The indicator levels are adopted as the objectives for contaminants not to
exceed for the land environment due to impact of human activities are given in
Table 2.6.
TABLE 2.6
LAND CONTAMINATION INDICATOR LEVELS
Sn. Parameter Acceptable Level (mg/kg)
1 Arsenic 50
2 Barium 400
3 Cadmium 5
4 Chromium 250
5 Copper 100
6 Lead 200
7 Manganese 700
8 Mercury 2
9 Selenium 2
10 Zinc 500
11 Cyanide 10
12 Fluoride 500
13 Phenols 1
14 Benzene 1
15 Chlorinated Hydrocarbons 1

CHAPTER 2
Policy and Legal Framework
2-10
EIA study for the proposed Jebel Ali Power and Desalination Station M
16 Pesticides (Total) 2
17 Polychlorinated Biphenyls (PCBs) 0.5
18
Total Petroleum Hydrocarbons
<C9
>C9
1000
10000
19 BTEX (Total) 100
Note
** Depending on the source, location and intended land use, the EPSS may specify
stringent level where the health of expected receptors will be at risk or to maintain the
background quality of the site.
2.4 ISO 14000
DEWA, the owner and operator of Jebel Ali Power Station, is an ISO 14001
certified company (Environmental Management System). Further, proposed
project shall also comply with the ISO 14001 requirements.

CHAPTER 3
Project Details
3-1
EIA study for the proposed Jebel Ali Power and Desalination Station M
3.0 Project Characteristics
3.1 Outline and Rationale of the Project
The proposed Power plant of 2000 MW and Desalination plant of 140 MIGD
capacity is of basic importance to meet the increased demand of power and
drinking water requirement of UAE. Therefore, type, size and location of the
plant have been determined to meet both, the necessary development in
public water and energy supply as well as the limitation or environmental
impacts resulting from the plant.
3.2 Plant Layout and Land Requirement
The proposed desalination plant is located along the shore and power plant is
located adjacent to the desalination plant.
The total land required for the project is about 218250 m2. The water supply
pipelines and brine discharge pipelines are laid along the length of the plant
boundary parallel to sea shore.
The desalination plant is part of the Power Station ‘M’, therefore it is located
near the power station and no alternate site was identified.
All considerations made in this report regarding environmental impact are
based on the power plant of 2000 MW capacity and desalination plant of 140
MIGD capacity.

CHAPTER 3
Project Details
3-2
EIA study for the proposed Jebel Ali Power and Desalination Station M
3.3 Project Description – Power Plant (2000 MW)
The power plant of Jebel Ali ‘M’ extension includes three modules and each
module consist of two gas turbines, two heat recovery steam generators
(HRSG) and one steam turbine. All considerations in the present report are
based on this configuration.
The gas turbines can be operated with supplementary firing into the HRSG for
additional steam production. For supplementary firing, solely natural gas will
be used.
The gas turbines will also be operated with natural gas supplied by gas
pipeline connection. In emergency cases and for the unlikely event of a
natural gas shortage, the gas turbines can also be operated with Diesel oil.
Table 3.1 presents the reference parameters for the calculation of emissions
represent the worst case normal operation scenario at full plant load firing
natural gas in summer (ambient Temperature 50° C) with full supplementary
firing.
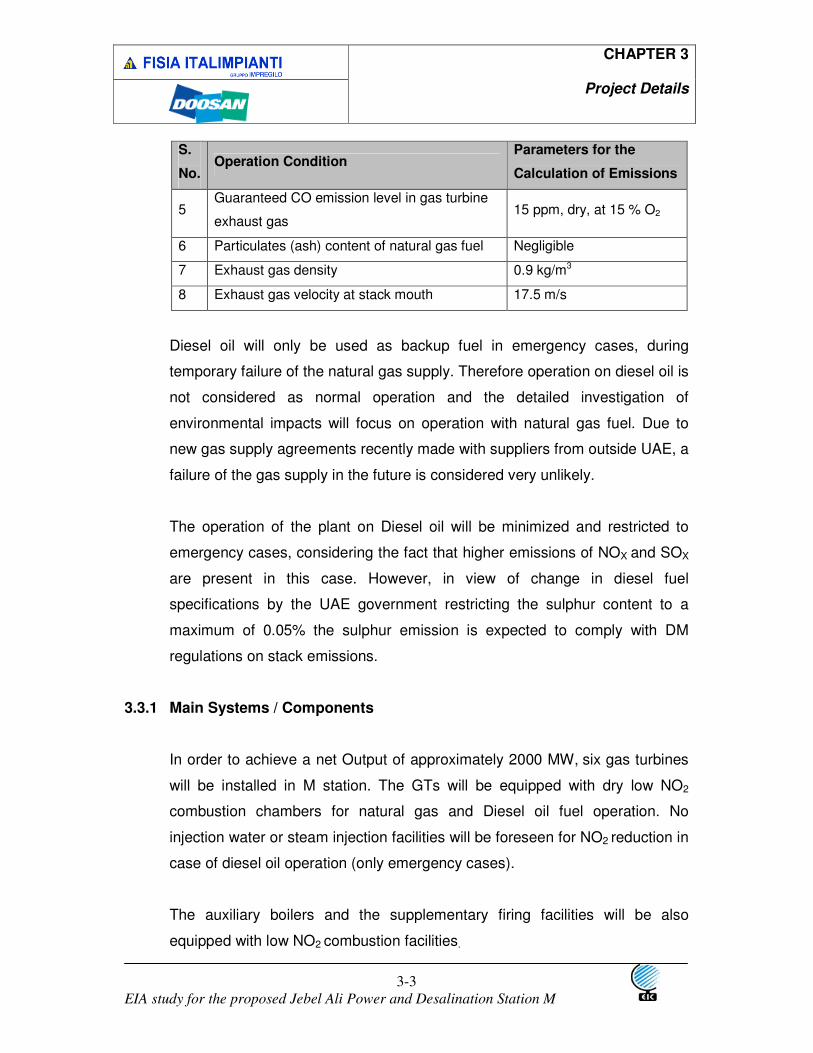
TABLE 3.1
PARAMETERS FOR THE CALCULATION OF EMISSIONS
S.
No. Operation Condition
Parameters for the
Calculation of Emissions
1 Exhaust gas mass flow related to each gas
turbine 608.33 kg/s
2 Exhaust gas emission temperature after
HRSGs 118.4°C
3 Residual oxygen concentration in exhaust gas 11.5 vol %
4 Guaranteed NOX emission level in gas turbine
exhaust gas 25 ppm, dry, at 15 % O2
CHAPTER 3
Project Details
3-3
EIA study for the proposed Jebel Ali Power and Desalination Station M
S.
No. Operation Condition
Parameters for the
Calculation of Emissions
5 Guaranteed CO emission level in gas turbine
exhaust gas 15 ppm, dry, at 15 % O2
6 Particulates (ash) content of natural gas fuel Negligible
7 Exhaust gas density 0.9 kg/m3
8 Exhaust gas velocity at stack mouth 17.5 m/s
Diesel oil will only be used as backup fuel in emergency cases, during
temporary failure of the natural gas supply. Therefore operation on diesel oil is
not considered as normal operation and the detailed investigation of
environmental impacts will focus on operation with natural gas fuel. Due to
new gas supply agreements recently made with suppliers from outside UAE, a
failure of the gas supply in the future is considered very unlikely.
The operation of the plant on Diesel oil will be minimized and restricted to
emergency cases, considering the fact that higher emissions of NOX and SOX
are present in this case. However, in view of change in diesel fuel
specifications by the UAE government restricting the sulphur content to a
maximum of 0.05% the sulphur emission is expected to comply with DM
regulations on stack emissions.
3.3.1 Main Systems / Components
In order to achieve a net Output of approximately 2000 MW, six gas turbines
will be installed in M station. The GTs will be equipped with dry low NO2
combustion chambers for natural gas and Diesel oil fuel operation. No
injection water or steam injection facilities will be foreseen for NO2 reduction in
case of diesel oil operation (only emergency cases).
The auxiliary boilers and the supplementary firing facilities will be also
equipped with low NO2 combustion facilities.

CHAPTER 3
Project Details
3-4
EIA study for the proposed Jebel Ali Power and Desalination Station M
Each of the gas turbines (GTs) will be equipped with an individual Heat
Recovery Steam Generator (HRSG) adequately sized for the related GT, so
that identical HRSGs, will be installed. The GTs will be provided with bypass
stacks to allow GT operation independent from the operation of the HRSG in
emergency cases.
All gas turbines have to be equipped with air inlet cooling system. The
plant/unit capacity at 50o C shall be achieved at normal GT Turbine Inlet
Temperature (TIT) and not of increased TIT (peak load operation). The heat
of the exhaust gases shall be utilized in the respective heat recovery steam
generators.
The heat of the exhaust gases will be utilized in the respective heat recovery
steam generators. The HRSGs will be of two pressure type with
supplementary firing and shall be designed for an optimum utilization of the
exhaust heat. The summary of operating conditions at main stack and bypass
stack is attached as Appendix 2.
3.3.2 Modes of Operation
The plant shall be designed to ensure flexibility of operation, a high level of
fault tolerance and ease of maintenance. It shall meet the following
operational and design requirements.
• Each gas turbine generator shall be capable of operating in open cycle
independent of the steam generation plant;
• Each HRSG shall be capable of being started up as the first and
subsequent steam generator from any condition of GT loading within
predetermined thermal stress margins an a run up time to full load agreed
as being operationally acceptable;

CHAPTER 3
Project Details
3-5
EIA study for the proposed Jebel Ali Power and Desalination Station M
• Each GT/HRSG unit shall be capable of being operated at part load in
conjunction with other units operating at full or near full load continuously
without detriment to plant life expectancy;
• Each HRSG or GT/HRSG unit shall be capable of independent shut down;
• Each steam turbine shall be capable of operating from minimum load up to
maximum load. In the event of a steam turbine trip, the unit is to transfer to
steam turbine by-pass mode automatically without loss of water
production;
• The duct burners shall cut in automatically in case of steam generated in
the HRSG from waste heat in the gas turbine exhaust is not sufficient to
maintain steam turbine output.
3.3.3 Abnormal operating modes
The plant will be designed to operate satisfactorily under automatic control
without undo perturbation of the steam temperature and pressure under all
normal operational transients arising, for example, from the bringing into or
out of service of a gas turbine, HRSG unit or a steam turbine. Furthermore,
the Station shall satisfactorily run under automatic control and without direct
operator intervention during such fault conditions which be reasonably
anticipated, including the following:
• A trip of one power plant block from full or part load;
• A gas turbine generator trip from full or part load when either operating in
open or closed cycle;
• A HRSG trip any load with or without auxiliary firing;
• When auxiliary firing is tripped and HRSG is still in service;
• A steam turbine trip from full or partial load;

CHAPTER 3
Project Details
3-6
EIA study for the proposed Jebel Ali Power and Desalination Station M
• The loss of the normal fuel gas supply to the Station and transfer to the
diesel oil stand-by system;
• In the event of full or partial load rejection of single GT unit, that unit shall
continue to operate at synchronous speed, feeding its own auxiliaries. The
unit shall be capable of resynchronized and reloaded to MCR at the
maximum loading rate.
In the event of a trip of a gas turbine and/or a HRSG, the associated steam
turbine shall continue to operate at reduced output. If applicable (for example
only one GT/HRSG was in operation) trip of the steam turbine shall be
delayed as much as possible after the GT trip. The steam turbine shall be
restarted using steam generated once the required steam conditions have
been established.
The impact on plant operation of any other major fault conditions shall be
minimized and the control strategy of the plant shall ensure an orderly and
effective recovery from such conditions.
3.4 Project Description – Desalination Plant
The seawater desalination plant shall consist of eight desalination units
having capacity of 17.5 MIGD each. This will result in total desalination plant
capacity of 140 MIGD.
The proposed desalination plant will be operated on Multi Stage Flash (MSF)
process. In this process, two types of operations are available i.e.
1 Multi Stage Flash Once through desalination process; and
2 Multi Stage Flash process with brine recirculation.

CHAPTER 3
Project Details
3-7
EIA study for the proposed Jebel Ali Power and Desalination Station M
The proposed plant will be operated on Multi Stage Flash with brine
circulation process.
Multi Stage Flash Process with Brine Circulation
In Multi Stage Flash process, an evaporator consists of several consecutive
stages (evaporating chambers) maintained at decreasing pressures from the
first stage (hot) to the last stage (cold). Sea-water flows through the tubes of
the heat exchangers where it is warmed by condensation of the vapour
produced in each stage. Its temperature increases from sea temperature to
inlet temperature of the brine heater. The sea water then flows through the
brine heater where it receives the heat necessary for the process (generally
by condensing steam). At the outlet of the brine heater, when entering the first
cell, sea water is overheated compared to the temperature and pressure of
stage 1. Thus it will immediately "flash" i.e. release heat, and thus vapour, to
reach equilibrium with stage conditions. The produced vapour is condensed
into fresh water on the tubular exchanger at the top of the stage. The process
takes place again when the water is introduced into the following stage, and
so on until the last and coldest stage. The cumulated fresh water builds up the
distillate production which is extracted from the coldest stage. Sea water
slightly concentrates from stage to stage and builds up the brine flow which is
extracted from the last stage. The typical drawing process flow diagram of
MSF is given in Figure-3.1.

CHAPTER 3
Project Details
3-8
EIA study for the proposed Jebel Ali Power and Desalination Station M
FIGURE 3.1
PROCESS FLOW DIAGRAM OF MSF WITH BRINE CIRCULATION
The desalination units shall be of the Multi Stage Flash type with brine
recirculation of cross tube and single deck design.
The once-through flash type evaporator uses the sea-water flow both for
purposes of cooling (sea-water is introduced into the evaporator at the sea
temperature and is rejected at the brine temperature) and production of
distillate (by flashing from the outlet temperature of the brine heater to the
brine extraction temperature). This has two consequences on plant design:
• The whole sea water flow being heated to high temperature, it has to be
treated with anti-scale which increases operating costs.
• As the sea water flow cannot be decreased below values allowing safe
working conditions, the stages must be designed for winter operation,
leading to an increased evaporator volume and thus increased investment
costs.
These two points have led to the separation of the two functions (cooling and
production).

CHAPTER 3
Project Details
3-9
EIA study for the proposed Jebel Ali Power and Desalination Station M
The cooling sea-water flows through the condensers of the two (or generally
three) last stages, named "heat reject section". Upon leaving the evaporator,
part of the warmed water is rejected to sea; part is used as the make-up for
the plant. Only this part of the water is treated instead of the whole cooling
water. The production is insured by the brine recycling flow that is drawn from
the last stage towards the condensers of the other stages, named "heat gain
section", and then to the brine heater.
The warmed water leaving the heat reject section may be used in winter to
warm up the cooling sea-water, thus enabling the evaporator volume to be
designed for a reasonably high temperature.
MSF plants with brine recycling are widely used all over the world. Once-
through desalination plant should only be used for small plants (when the cost
of the chemicals is not of great importance) and in areas where the
temperature of the sea-water remains approximately constant throughout the
year.
3.4.1 Details of Proposed Desalination Plant
Each distiller unit consists on a multistage flash evaporator chamber with its
auxiliary and ancillary equipment.
The evaporator is a Multi Stage Flash type (MSF) with brine recirculation and
of cross tube single tier design. An anti scale system is used to treat the
recirculating brine in the whole temperature operating range of the evaporator.
The distillate produced by the eight desalination units is sent to the product
water system and Blending Plant. Each Unit can be subdivided from the
functional point of view in the following sections:
• Brine Heater Section;
• Heat Recovery Section; and
• Heat Reject Section

CHAPTER 3
Project Details
3-10
EIA study for the proposed Jebel Ali Power and Desalination Station M
The process is based on the recycle of the brine in the recovery section where
the latent heat of condensing vapour is recovered by increasing the
temperature of the brine recirculating in the condensers tubes. The heat input
to the system is supplied by the low pressure steam coming from the Power
Station (Package P) and the Auxiliary Boilers System to the Brine Heater in
which the brine flowing in the tube side is heated up to Top Brine
Temperature. One evaporation unit will be operated on steam procured from
existing Power Station ‘L’. The heated brine then passes through all the
stages where it flashes because of the higher temperature in respect of the
brine flowing inside the tube bundle.
This “flashed off” vapour rises through the tube bundle and condenses on the
tubes surface. The condensed water, called distillate, falls into a dedicate tray
and it is collected together with distillate coming from the other stages and
then sent to the distillate extraction pumping system.
The salt concentration of the recirculating brine is kept at the required value
by a continuous blow down of the concentrated brine and a congruent feed of
make-up sea water, which is deareted and treated with antifoam additive prior
entering the evaporator. Sodium Sulphate is also used as oxygen scavenger
in brine recycle line to recovery section. Most of the evaporator chambers
operate under vacuum; in order to maintain the vacuum condition, leakages
and non-condensable gases released from feed sea water are purged to
atmosphere by a dedicated vacuum system (ejectors and condensers
system).
• Discharge System
The discharge system includes one barometric pit system and one drain pit
for each distiller and the outfall system with provisions for the eight units of M
Station and all Power Plant discharges. For each unit, the relevant barometric
pit collects all condensate discharges and drains from the three exchangers of

CHAPTER 3
Project Details
3-11
EIA study for the proposed Jebel Ali Power and Desalination Station M
the vacuum system and it is equipped with of two sump pumps one on duty
and one in stand by mode to send the vacuum system discharges to drain pit.
The drain pit collects the discharges from the distiller and the M. P. steam
condensate from the steam trap on the vacuum system steam supply line.
The discharges of two units are collected together and sent to outfall.
3.5 Operational Features of the Project
3.5.1 Fuel
At present DEWA utilizes Natural Gas (NG) as primary fuel and Diesel Oil
(DO) as secondary fuel. The natural Gas fuel is arranged by Dubai Supply
Authority (DUSUP) from different sources.
For the Jebel Ali ‘M’ project natural gas shall be used as primary fuel and
diesel oil shall serve as back up fuel. The gas turbines and the heat recovery
steam generators will be operated with natural gas as a main fuel. The gas
turbines and the auxiliary boilers will be able to use Diesel oil if required while
the duct burners of the HRSG’s (for supplementary firing) will be designed for
natural gas operation only.
The gas supply system will be designed to handle the fuel demand when the
gas turbine and the supplementary burning system are operating at maximum
consumption.
The Diesel oil storage tank capacity will be sufficient for 8 days continuous
operation of the plant considering full load of the gas turbines with condensing
steam turbine at design conditions. When the supplementary firing is out of
service, the auxiliary boilers will be operated to produce the additional steam
flow required for 100% water production. As the auxiliary boilers are also
equipped with low NOX combustion facilities, the specific pollutant emission
rates at auxiliary boiler operation will be similar as with supplementary firing.
CHAPTER 3
Project Details
3-12
EIA study for the proposed Jebel Ali Power and Desalination Station M
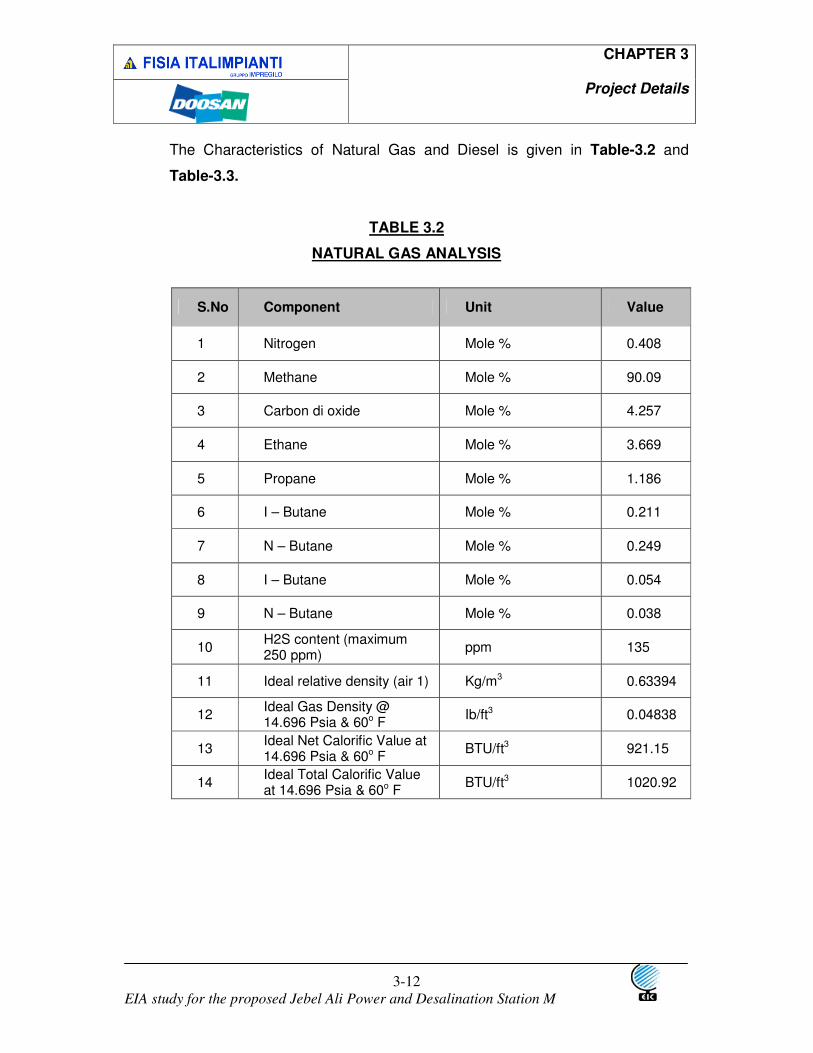
The Characteristics of Natural Gas and Diesel is given in Table-3.2 and
Table-3.3.
TABLE 3.2
NATURAL GAS ANALYSIS
S.No Component Unit Value
1 Nitrogen Mole % 0.408
2 Methane Mole % 90.09
3 Carbon di oxide Mole % 4.257
4 Ethane Mole % 3.669
5 Propane Mole % 1.186
6 I – Butane Mole % 0.211
7 N – Butane Mole % 0.249
8 I – Butane Mole % 0.054
9 N – Butane Mole % 0.038
10 H2S content (maximum 250 ppm)
ppm 135
11 Ideal relative density (air 1) Kg/m3 0.63394
12 Ideal Gas Density @ 14.696 Psia & 60o F
Ib/ft3 0.04838
13 Ideal Net Calorific Value at 14.696 Psia & 60o F
BTU/ft3 921.15
14 Ideal Total Calorific Value at 14.696 Psia & 60o F
BTU/ft3 1020.92

CHAPTER 3
Project Details
3-13
EIA study for the proposed Jebel Ali Power and Desalination Station M
TABLE 3.3
THE TYPICAL DIESEL OIL ANALYSIS
Description Unit Specification Typical
Low Heating Value (LHV) MJ/kg min 42.3 42.7
High Heating Value (HHV) MJ/kg min 45.0 45.7
Specific gravity at 60°F - 0.83 – 0.8 0.85
API gravity deg min 30 35.5
Flash point °C min 65 69
Pour point °C max -3 -
Kinematic Viscosity at 50° C cSt 2.0 – 5.5 2.8
Kinematic Viscosity at 37.8°C cSt 3.2 - 5.8 3.8
Distillation
• I.B.P. °C - 155
• 10% evaporated °C - 231
• 20% °C - 264
• 50% °C - 292
• 90% °C - 338
• FBP °C - 369
• Residue % - 1.0
• Loss % - <0.5
Water wt% max 0.05 < 0.05
Sediment wt% max 0.01 0.005
Sulphur, Total wt% max 0.25 0.25
Mercapatan sulphur ppm - 25
Aromatics vol% - 18
Olefins vol% - Nil
Asphaltene wt% Nil <0.05
Carbon residue on 10% residue wt% max 0.1 0.035
Diesel index - min 55 -
Cetane index - min 50 -
Copper strip corrosion (3 h.v. at
100°C) - - No. 1
Ash ppm max 100 25

CHAPTER 3
Project Details
3-14
EIA study for the proposed Jebel Ali Power and Desalination Station M
Description Unit Specification Typical
Calcium ppm - 1
Lead ppm - Nil
Sodium & Potassium ppm max 1.0 -
Vanadium ppm max 0.5 -
Total carbon wt% - 85.85
Hydrogen wt% - 13.25
3.5.2 Chemicals
Small amounts of dosing and treatment chemicals will be stored in the
chemical stores for operation of the power facilities. Dosing quantities are
manually regulated as per results of the water sample analyses.
Trisodiumphosphate (Na3PO4) solution will be dosed into the boiler drums to
prevent the precipitation of carbonate hardness traces within the boiler water
and for pH adjustment.
Ammonia (NH3) will be dosed into the boiler feed water as volatile alkalizing
agent for pH adjustment and corrosion inhibition. The pH of the process water
will be adjusted to 8.5 – 9.0 which will prevent corrosion within the
water/steam cycle.
A corrosion inhibitor (e.g. NaOH) will be dosed into the closed cooling system
to ensure an adequate pH value in the system water which prevents material
corrosion.
All dosing devices will be placed in the turbine house building and will
comprise chemical unloading facilities, chemical storage tanks, transfer and
dosing pumps, dosing pipelines, injection facilities and control equipment.

CHAPTER 3
Project Details
3-15
EIA study for the proposed Jebel Ali Power and Desalination Station M
A suitable amount of all chemicals needed for the operation of the Jebel Ali
‘M’ CCPP will be stored inside a separate storage building at site (chemical
storage building) Ammonia and Hydrazine will be stored as aqueous solutions
with a chemical content of approx. 25 % wt.
3.6 Water System
The project consists of many units which are discussed in subsequent
sections:
1 Seawater Screening System
The seawater received from transition bay from the intake channel shall be
passed through screening trains installed in the screening and pumping
station to remove all kinds of debris having particle size larger than 2 mm.
Each screening train shall be divided into two sections;
• Bar Screen with revolving rake;
• Traveling band screen with spray water system.
The debris collected in the screening plant shall be transported with spray
water via a conveyor through and special sluice gates to trash containers
equipped with dewatering sieve. The wastewater collected from the
containers shall be pumped back to sea via the discharge culverts/outfall
structure. The debris collected shall be transported to disposal area.
The clear seawater shall be treated by hypochlorite solution to control organic
substances and the growth of mussels, barnacles etc. Dosing shall take place
continuous (0.5 to 1.0 ppm) and shock dosing (5 ppm) behind the bar screens
and in the seawater pumped streamlines to the individual plants.

CHAPTER 3
Project Details
3-16
EIA study for the proposed Jebel Ali Power and Desalination Station M
2 Seawater Filtration and Chlorination
The seawater from the screen unit shall be passed through gravel filters of 2 x
100% for automatic operation and backwash.
The filtered water shall be treated with chlorine to disinfect before routing it to
desalination plant.
3 Water Intake
The total water requirement of the desalination plant shall be 310,000 m3/hr
and same shall be met from the sea. The water intake point is about 500 m
from the plant and water shall be transported through channel. The existing
water intake structure of Package L shall be augmented for the purpose of
proposed desalination plant by adding water channel, pumping system and
screening unit etc.
4 Outfall unit
The total expected brine generation shall be 197,392m3/hr from the
desalination plant i.e. 24674 m3/hr from each 17.5 MIGD unit. The brine shall
be transported through pipeline to outfall point, which is located in SW of the
project.
3.7 Wastewater Treatment System
The wastewater originating from the power plant only, can be classified into
two categories such as oily wastewater and chemical wastewater.
The oily wastewater will be collected from the following location.
CHAPTER 3
Project Details
3-17
EIA study for the proposed Jebel Ali Power and Desalination Station M
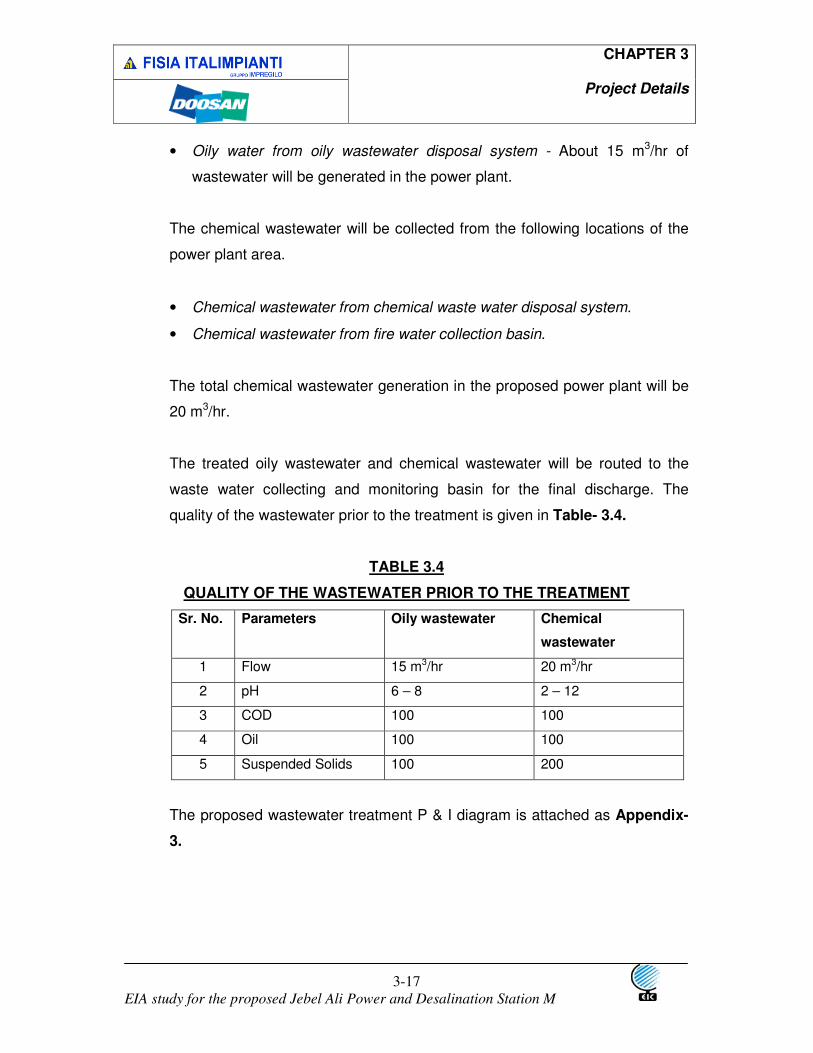
• Oily water from oily wastewater disposal system - About 15 m3/hr of
wastewater will be generated in the power plant.
The chemical wastewater will be collected from the following locations of the
power plant area.
• Chemical wastewater from chemical waste water disposal system.
• Chemical wastewater from fire water collection basin.
The total chemical wastewater generation in the proposed power plant will be
20 m3/hr.
The treated oily wastewater and chemical wastewater will be routed to the
waste water collecting and monitoring basin for the final discharge. The
quality of the wastewater prior to the treatment is given in Table- 3.4.
TABLE 3.4
QUALITY OF THE WASTEWATER PRIOR TO THE TREATMENT
Sr. No. Parameters Oily wastewater Chemical
wastewater
1 Flow 15 m3/hr 20 m3/hr
2 pH 6 – 8 2 – 12
3 COD 100 100
4 Oil 100 100
5 Suspended Solids 100 200
The proposed wastewater treatment P & I diagram is attached as Appendix-
3.

CHAPTER 3
Project Details
3-18
EIA study for the proposed Jebel Ali Power and Desalination Station M
3.7.1 The Treatment for the Oily Wastewater.
1 Portable Oil Skimmer
The initial suspended oil will be drawn by rotating high adhesive nitrite belt
equipped in oil skimmer that is located on the oily water collecting basin.
The skimmed oil gravitates to the skimmed oil tank while the separated
excess water drop back to oily water collecting basin, flow quantity is
controlled by the oil dam equipped in oil skimmer.
Once oil skimmer is started, it always works except for the case of shut down.
2 Oil Water Separator
The oily water transfer pump shift the composite homogenized oil-water
emulsion to the oil water separator at the constant rate, so as to separate the
residual tiny oil in the water that is not removed with oil skimmer.
The oily water flows into the EPS oil water separator that consist of number of
corrugated plate mounted parallel to each other at a space. When the raw
waste water containing the oil passes between the plates (laminar flow is
mandatory for the proper functioning of the operation) in the course of passing
from EPS pack inlet to EPS pack outlet, the oil float upwards into the top of
EPS pack and rise up the incline of the plates to the surface of the system
where it can be removed by pipe oil separator.
The treated water will be overflowed to the waste water collecting and
monitoring basin by gravity after the oil content is reduced to less than 5ppm.
The skimmed oil shall be collected in the skimmed oil tank for disposal by
truck. The oil sludge is displaced to the oil sludge tank periodically by the
operator.

CHAPTER 3
Project Details
3-19
EIA study for the proposed Jebel Ali Power and Desalination Station M
3.7.2 Treatment for Chemical Wastewater
1 Chemical Wastewater Buffer Basin
The chemical wastewater from acid dosing, NaOH dosing, alum dosing and
polymer dosing units will be collected in the buffer basin. This basin is to
collect and store chemical wastewater from chemical wastewater disposal
system and fire water collecting basin. The first operation is to provide
adequate flow to compensate the daily fluctuation of chemical wastewater
from the various sources.
By means of air blower, scour air keep steering the liquid to prevent settling of
denser material inside the basin. Also, scour air also helps in removing the
volatile substance present in wastewater.
By means of two numbers of chemical w/w transfer pump that are controlled
by the level transmitter, chemical wastewater is transferred to reaction basin.
This contain following functions:
• To provide adequate flow to compensate the daily fluctuation of chemical
wastewater from the sources.
• To homogenize chemical wastewater from the sources.
2 Reaction Basin and Flocculation Basin
This is main equipment in wastewater treatment system. The debris and
dense material is removed by means of chemical cohesion. The pumped raw
chemical wastewater initially enters a reaction basin at the constant rate
where it is mixed with the injected chemicals from chemical dosing equipment
by mix on the basin.

CHAPTER 3
Project Details
3-20
EIA study for the proposed Jebel Ali Power and Desalination Station M
Because zeta potential is reduced and cohesion is increased by chemicals,
colloidal pollutions are cohered rapidly. Commonly alum is used and the
reaction of cohesion is as following:
Al2 (SO4)3 · 18 H2O + 3 Ca (HCO3)2 → 2Al (OH)3↓ + 3CaSO4 + 6CO2 + 18H2O
The formed floc in the reaction basin overflows to flocculation basin where it
grows big and heavy by reacting with the polymer from polymer dosing
equipment. The function of flocculation basin is to remove colloidal pollutions
by means of chemical cohesion.
3 Sedimentation Basin
The mixed liquor is now flow to sedimentation basin, the velocity is reduced
and the activated sludge is separated from the secondary effluent.
The secondary effluent discharge from the sedimentation basin via an over
flow weir into the waste water collecting and monitoring basin.
The sludge is settled and stored up in the centre of hopper by means of
rotating scraper, from where it is shifted by gravity to sludge thickening basin.
The function of sedimentation basin is to separate water and sludge by means
of the difference of specific gravity.
4 Sludge Thickening Basin
The collected sludge is disposed in the sludge storage tank. When it is filled,
the sludge is discharged by means of thickened sludge pumps. Scour air keep
steering the liquid to prevent settling of denser materials inside the tank. The
function of the sludge thickening basin is to store and thicken the sludge.

CHAPTER 3
Project Details
3-21
EIA study for the proposed Jebel Ali Power and Desalination Station M
5 Wastewater Collecting and Monitoring Basin
The final treated water from sedimentation basin, cooling water, final filter for
sewage treatment system, neutralisation tank of demineralisation plant and
boiler blowdown overflows to waste water collecting and monitoring basin.
By means of analyser, the value of pH and temperature shell be constantly
monitored.
6 Hydrochloric Acid (HCL) Dosing System
HCL dosing system consists of following main components:
• One number HCl dosing vessel of a capacity of 2㎥
• Two numbers HCl dosing pumps.
• One number level transmitter (Ultrasonic Type).
• One number calibration column.
• Four numbers pressure gauges in suction line and discharge line
• Piping system
Operation: It is charged from demineralisation plant to HCl dosing vessel by
means of unloading pump. 33% hydrochloric acid is used to wastewater
treatment system. HCl dosing pump feed to reaction basin at the preset value,
to keep the pH level in the basic region.
7 NaOH Dosing System
NaOH dosing system consists of following main components:
• One number NaOH dosing vessel of a capacity of 2㎥
• Two numbers NaOH dosing pumps
• One number level transmitter (Ultrasonic Type).
• One number calibration column.
• Four numbers pressure gauges in suction line and discharge line

CHAPTER 3
Project Details
3-22
EIA study for the proposed Jebel Ali Power and Desalination Station M
• Piping system
Operation: It is charged from demineralisation plant to NaOH dosing vessel by
means of unloading pump. 50% caustic soda is used to wastewater treatment
system. NaOH dosing pump feed to reaction basin at the preset value, to
keep the pH level in the basic region.
8 Alum Dosing System
Alum dosing system consists of following main components:
• One number alum dosing vessel of a capacity of 5㎥.
• Two numbers alum dosing pumps.
• One number level transmitter (Ultrasonic Type).
• One number calibration column.
• Four numbers pressure gauges in suction line and discharge line.
• One number drum pump to charge alum.
• Piping system.
Operation: It is charged from alum drum to alum dosing vessel by means of
drum pump. About 10% alum is used in wastewater treatment system. In
charging, operator keeps a watch level gauge to prevent over flow. Alum
dosing pump feed to flocculation basin at the preset value, to get the best
cohesion in the basic region.
9 Polymer Dosing System
Polymer dosing system consists of following main components:
• One number polymer auto dissolving unit of a capacity of 1㎥
• Two numbers polymer dosing pumps.
• One number calibration column.
• Four numbers pressure gauges in suction line and discharge line.
• Piping system.

CHAPTER 3
Project Details
3-23
EIA study for the proposed Jebel Ali Power and Desalination Station M
Operation: The system feed water from service water source and by solid
polymer from Vinyl pack. The polymer auto dissolving unit is equipment for
inserting good quality solution after complete dilution of polymer at fixed
degree of density continuously in order to supply fully maturated cohesion
material and needs to be charged carefully. Polymer dosing pump feed to
flocculation basin at the preset value, to get the best cohesion in the basic
region.
3.8 Details of Sewage Water Treatment System
The sewage wastewater of 75 m3/day will be generated in the plant from the
rest rooms will be treated in Sewage Treatment Plant. The quality of the
untreated sewage wastewater will be:
BOD : 300 mg/l
SS : 300 mg/l
pH : 6.5 ~ 7.5
The proposed sewage P & I diagram is attached as Appendix 4. The sewage
treatment plant will consist the following units:
1 Screen Tank
In the preliminary treatment, the suspended debris and coarse material will be
removed in the screen tank. The sewage wastewater will be passed through
screen tank in which auto bar screens are installed to remove coarse material.
In addition, parallel separate channel will be provided with manual bar
screens, which will be operated in case of maintenance of auto screen tank.
2 Grit Chamber

CHAPTER 3
Project Details
3-24
EIA study for the proposed Jebel Ali Power and Desalination Station M
The grit is accumulated at the bottom of chamber and the collected grit is
removed by operator manually & on demand.
3 Equalization Basin
This under ground Equalization Basin takes all the sewage that is free from
debris and grit. In equalization tank, the submersible mixer keep steering the
liquid inside the tank to prevent settling of denser material.
4 Aeration Tank
The pumped raw sewage water initially enters an aeration tank for the
removal of BOD. The tank requires sufficient contact time between the
wastewater and heterotrophic micro organisms, and sufficient oxygen and
nutrients.
In aerobic oxidation, the conversion of organic matter is carried out by mixed
bacterial cultures in general accordance with the stoichiometry shown below.
- Oxidation and synthesis:
Bacteria
COHNS + O2 + Nutrients CO2 + NH3 + C5H7NO2 + (Other end-products)
Organic Matter New cells
- Endogenous respiration:
Bacteria
C5 H7 NO2 + 5O2 5CO2 + 2H2O + NH3 + (Energy)

CHAPTER 3
Project Details
3-25
EIA study for the proposed Jebel Ali Power and Desalination Station M
For carbonaceous removal, pH in the range of 6.0 to 9.0 is tolerable, while
optimal performance occurs near a neutral pH. The dissolved concentration
0.2 mg/l is commonly maintained in the aeration tank.
5 Clarifier Tank
After aeration, the liquor is sent to clarifier tank, for settling of the sludge. In
the clarifier, velocity is reduced to give sufficient time for settlement of sludge.
Then the effluent will be discharged from the settlement tank via an over flow
weir into the disinfection tank, where the NaOCl is added at the preset value
for the disinfection of the system. The sludge is collected from the bottom
(Hopper) of clarifier tank, where the two Sludge Transfer Pumps operate to
shift the sludge in two parts:
• Return activated sludge to aeration tank via V- notch for the improvement
of the system biology.
• Excess sludge to Sludge Holding & Thickening Basin for its further shifting
to sludge tank for the final disposal.
6 Sludge Holding & Thickening Basin
Excess sludge shall be sent to sludge holding & thickening basin. The basin
will be equipped with baffles at the inlet point to reduce the velocity of the
flow. This will provide sufficient time for the settlement of sludge.
3.9 Sources of Pollution
While designing the proposed project, number of measures have been
incorporated to minimize the adverse impacts on the surroundings. In order to
achieve this, lot of process based precautions have been integrated in the

CHAPTER 3
Project Details
3-26
EIA study for the proposed Jebel Ali Power and Desalination Station M
basic design itself as described earlier. An attempt has been made here to
identify and quantify the sources of final emissions/discharges/solid wastes
etc. based on the process design.
3.9.1 Air Environment
The gaseous emissions form the project will be from six stacks of Power plant
and two stacks of auxiliary boilers of desalination plant. The turbines and
boilers shall be operated on the clean fuel i.e. natural gas. The details of the
stacks and emissions are given in Table-3.5.
TABLE-3.5
DETAILS OF STACK AND GASEOUS EMISSION
Details Sr.
No.
Parameters Unit
Power
Station M
Power
Station L
Desalination
Plant
1 Stack height m 60 60 75
2 Number of Stacks M 6 7 2
3 Stack diameter m 7 7 3.4
4 Flue Gas velocity m/s 17.5 17.5 18
5 Exit flue gas
Temperature
°C 118.4 118.4 204
6 Volumetric flow Nm3/s 512 512 102.1
mg/Nm3 51 51 51 7 Emission rate of NOx
from each stack gm/s 26 26 5.2
The adequate stacks will provided for wider and quicker dispersion of the
gaseous emissions. The turbines and boilers shall be provided with low NOx
burners to control the NOx emissions.
CHAPTER 3
Project Details
3-27
EIA study for the proposed Jebel Ali Power and Desalination Station M
3.9.2 Water Environment
The wastewater generated in the power plant shall be treated in oil water
separator, effluent treatment plant. The domestic wastewater shall be treated in
the Sewage Treatment Plant.
The treated domestic wastewater shall be utilized in landscaping and the
excess quantity shall be supplied to Dubai Municipality.
The trade wastewater of power plant along with hot water shall be mixed with
brine generated in desalination plant. The brine shall be discharged in sea
through outfall point located about 0.5 km away from the site.
The wastewater generated from the desalination plant is called Brine, which is
a high in salt concentration and alkaline in nature. The quality of the brine is
almost like sea water.
The domestic wastewater generated in the restroom and canteen will be about
20m3/day. This wastewater shall be sent to Dubai Municipality for the disposal.
3.9.3 Solid waste
The solid waste shall be generated at the screening unit, where the debris
from the seawater will be screened out. The solid waste will be sent to the
solid waste shall be non-hazardous in nature and disposed off as per Dubai
Municipality guidelines.
The sludge from the settling tank of potable water treatment plant shall be
sent to sludge drying bed located within the plant facility.
CHAPTER 3
Project Details
3-28
EIA study for the proposed Jebel Ali Power and Desalination Station M
3.9.4 Noise Levels
The major noise generating equipment in the proposed facility will be pumps
used in pumping of seawater and brine. These pumps will be designed for
noise levels <85 dB (A) at 1 m from the equipment. These pumps will be
provided with pump house with adequate acoustic to attenuate the noise
levels. The noise levels shall fall below 70 dB (A) outside the pump house.

CHAPTER 4
Baseline Environmental Status
4-1
EIA study for the proposed Jebel Ali Power and Desalination Station M
4.1 Preamble
This chapter describes in detail the current/existing environmental conditions
at the proposed project site. Jebel Ali desalination plant is located 25 km
southwest of the city centre of Dubai and 7 km Northeast of Jebel Ali Port.
Southwest of the site is a wide intertidal area with a variety of productive
biotopes such as fringing strips of mangrove etc. Northeast of the site up to
the Dubai Creek is a 25 km long beach shoreline (small sand dunes) which
represents a wide intertidal area and are intensively used for tourism and
recreational purposes.
4.2 Climatology and Meteorology
The meteorological data is necessary for the proper interpretation of baseline
information of ambient air quality and other environmental attributes. It is
important to understand the meteorological conditions of the study area for
the evaluation of impacts of the proposed project. Historical data on
meteorological parameters also plays an important role in identifying the
synoptic meteorological regime of the region.
4.2.1 General
Dubai climate is an arid subtropical climate due to Dubai being located within
the Northern desert belt. The skies over Dubai are generally blue with little
cloud cover. Dubai has a typical desert climate with very hot summers and
warm winters. The low precipitation falls almost exclusively between
December and April. Despite of the missing rainfall humidity of the air is
relatively high, due to its proximity to the Arabian Gulf. Especially in the
summer months the humidity is often very high.

CHAPTER 4
Baseline Environmental Status
4-2
EIA study for the proposed Jebel Ali Power and Desalination Station M
Strong Northwesterly ‘Shamals’ can occur quite suddenly and associated with
squalls caused by cold front pressure troughs. In summer, these Shamals are
associated with dry air, cloudless skies and dust haze.
Dust haze is common in the summer months with visibility being generally
restricted to less than 10 km. Sandstorms occur occasionally, when strong
south easterly winds transport sand from the interior to the coastal region.
These sandstorms lead to a build up of sand on highways and alongside
buildings. They also significantly affect visibility.
The local climate is broadly characterized by two seasons. There are distinct
summer and winter weather patterns, with spring and autumn as transitional
periods lasting approx. one month.
4.2.2 Temperature
January is the coolest month of the year 2008 with the maximum temperature
around 28.9°C and minimum of 11.6°C. The period from March to May is the
"spring" months in Dubai when the temperature begins its steady climb
towards the summer peaks.
During summer season the maximum temperature (July) is observed to be
45.6 °C with the minimum temperature of 25.5°C (September). During autumn
season the maximum temperature (October) is observed to be 38.9°C with
the minimum temperature of 13.8°C (December). The monthly variations of
temperatures are presented in Table-4.1
4.2.3 Relative Humidity
The air is generally very humid in the region, the maximum relative humidity is
observed to be around 83 and minimum 26%. The monthly mean variations in
relative humidity are presented in Table-4.1

CHAPTER 4
Baseline Environmental Status
4-3
EIA study for the proposed Jebel Ali Power and Desalination Station M
4.2.4 Atmospheric Pressure
The atmospheric pressure observed is in the range of 995.6 to 1019.3 mb,
with the maximum pressure (1019.3 mb) occurring during the winter season,
in the month of December and January. The monthly variations in the
pressure levels are presented in Table-4.1
TABLE - 4.1
CLIMATOLOGICAL DATA - DUBAI INTERNATIONAL AIRPORT - 2008
Temperature (0C)
Relative
Humidity
(%) Month
Atmospheric
Pressure
(Mb) Max. Mean. Min. Max. Min.
Rainfall
(mm)
January 1019.3 28.9 18.2 11.6 83.0 44.0 15.6
February 1012.5 31.7 21.3 13.8 83.0 41.0 25.0
March 1012.5 36.7 24.7 15.0 82.0 37.0 21.0
April 1009.1 40.0 29.3 16.6 76.4 30.1 7.0
May 1005.8 42.8 33.5 23.8 72.5 26.0 0.4
June 995.6 45.0 35.3 28.8 79.0 28.3 0.0
July 995.6 45.6 35.1 28.8 76.0 30.3 0.8
August 999.0 45.0 36.3 30.5 75.0 30.0 0.0
September 1002.4 43.9 34.7 25.5 80.6 30.4 0.0
October 1012.5 38.9 30.6 21.6 81.3 33.1 1.2
November 1015.9 33.9 25.2 17.7 80.0 38.0 2.7
December 1019.3 30.0 22.4 13.8 82.6 43.7 14.9
4.2.5 Rainfall
Short and irregular rainfalls occurred in 2008. Most of the rainfall occurs
between December and March. The total rainfall observed in year 2008 is
88.6 mm. Annual and monthly variations in the rainfall are given in Table-4.1
CHAPTER 4
Baseline Environmental Status
4-4
EIA study for the proposed Jebel Ali Power and Desalination Station M
4.2.6 Annual Wind Pattern
A review of the wind rose diagram shows that predominant winds are mostly
from W and WNW directions followed by S direction (Figure-4.1).
Predominant winds from W direction were observed for 11.2% of the total
time, with wind speeds (% frequencies) in the range of 5.1-11.0 kmph (0.6),
11.1-19.0 kmph (5.1%) and >19.01 kmph (5.5%). In the S direction winds
were observed for 10.9% of the total time, with wind speeds (% frequencies)
in the range 5.1-11.0 kmph (4.1%), 11.1-19.0 kmph (5.8 %) and >19.01 kmph
(0.9%). Whereas for WNW direction the winds were observed for 10.1% of the
total time with wind speeds and frequencies in the range of 1.0-5.0 kmph
(0.2%), 5.1-11.0 kmph (0.9%), 11.1-19.0 kmph (4.8 %) and >19.01 kmph
(4.3%).
In other directions, the percentage frequencies observed were N (4.9%), NNE
(3.0%), NE (4.4%), ENE (6.1%), E (9.3%), ESE (3.5%), SE (3.5%), SSE
(5.5%), SSW (3.1%), SW (2.1%), WSW (4.1%), NW (9.4%), and NNW (6.5%).
Calm conditions prevailed for 2.21% of the total time.
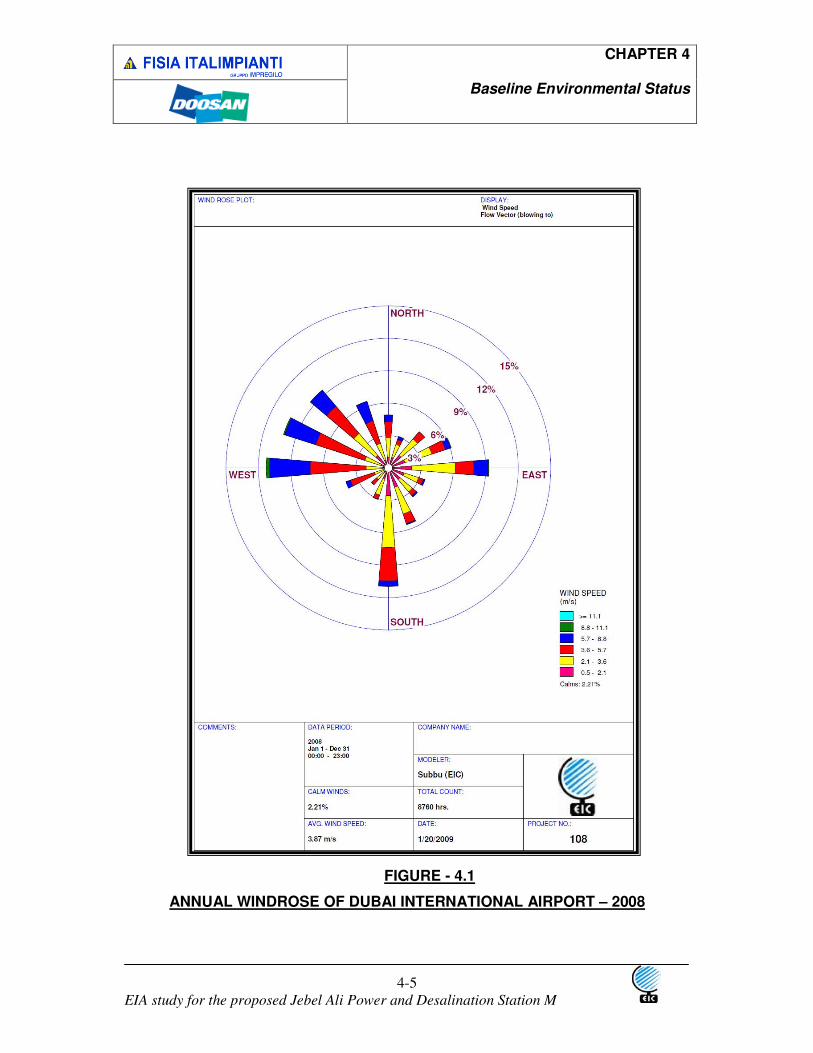
CHAPTER 4
Baseline Environmental Status
4-5
EIA study for the proposed Jebel Ali Power and Desalination Station M
FIGURE - 4.1
ANNUAL WINDROSE OF DUBAI INTERNATIONAL AIRPORT – 2008

CHAPTER 4
Baseline Environmental Status
4-6
EIA study for the proposed Jebel Ali Power and Desalination Station M
4.3 Sea Surface Water Temperatures
The maximum, minimum and mean seawater temperatures recorded at Jebel
Ali Port of the year 2007 recorded to be 34.6oC (August), 17.7oC (February)
and 26.5oC respectively. The monthly variations in sea temperatures are
given in Table-4.2. This is in contrary to the normal year where in minimum
occurs in winter and maximum in summer.
The monthly-recorded seawater temperatures of the year 2007 at Jebel Ali
are shown in Figure 4.2. The ground water table corresponds with the sea
water and is established at an average elevation of approx. +1.6 m, which is
approx. 4.4 m below the ground level of the existing stations. The ground
water table is subject to seasonal variation and dewatering in the site vicinity.
TABLE – 4.2
MONTHLY SEA TEMPERATURE VARIATION FOR THE YEAR 2007
Sea Temperature Month
Mean Max Min
January 20.9 23.0 19.0
February 20.7 23.0 17.7
March 22.3 24.3 18.0
April 25.0 29.0 24.0
May 28.5 32.0 24.0
June 31.2 32.0 22.0
July 32.2 34.0 30.0
August 32.9 34.6 25.0
September 31.9 32.0 28.0
October 29.9 32.0 27.0
November 27.0 29.0 26.0
December 23.4 27.0 24.0

CHAPTER 4
Baseline Environmental Status
4-7
EIA study for the proposed Jebel Ali Power and Desalination Station M
DUBAI INTERNATIONAL AIRPORT
SEA TEMPERATURE – JEBEL ALI PORT 2007
0
5
10
15
20
25
30
35
40
Jan Feb Mar Apr May Jun Jul Aug Sep Oct Nov Dec
MONTH OF THE YEAR
DE
GR
EE
(0C
)Monthly Mean 2007
Monthly Max 2007
Monthly Min 2007
FIGURE 4.2
MONTHLY SEA WATER TEMPERATURE
4.4 Landuse
The proposed project site is currently undeveloped desert land. The area
comprises low-lying, sandy, extensive flat, stony and gravel plains. The
topography is mainly gently undulating sandy slopes, with occasional Sabkha
flats. The height of ground varies from 33.0m to 62.0 m above sea level. The
surrounding area is in the process of large-scale development for a variety of
uses.
The nature of surrounding land use will therefore change significantly in the
future, as large-scale infrastructure projects, including the new Jebel Ali
Airport City, Techno Park and Dubai Waterfront, Dubai Industrial city, develop
in the next few years. The proposed project will change the present
undeveloped desert land to industrial land use.

CHAPTER 4
Baseline Environmental Status
4-8
EIA study for the proposed Jebel Ali Power and Desalination Station M
4.5 Regional Geology
The general geology of the UAE has been substantially influenced by the
deposition of marine deposits associated with the continuous sea level
changes during the relatively recent geological time. Moreover, with the
existing mountainous geology across the UAE the country is considered to be
of relatively low-laying area.
The geological conditions in Dubai essentially consist in general of a linear
coastline dissected by creeks. Superficial deposits consisting of beach dune
sands with marine sands and silts. Furthermore, erosion, capillary rise
phenomena as well as evaporations have led to extensive silt deposits in
some areas especially near to the creeks. These superficial underlined by
altering layers of calcarenite, carbonate sandstone, sand as well as cemented
sand layers.
4.6 Existing Baseline Air Quality
Apart from the existing power production facilities at Jebel Ali Power Station
the nearest major point source of atmospheric pollutants to the project site is
the Dubal Aluminum Factory adjacent to the southwestern border of the Jebel
Ali Site. At Dubal, several power plants are installed for the production of
electricity which is required for the electrolytic aluminum smelting process.
The ambient air impacts of the existing industrial facilities in the vicinity of the
project site are reflected, by the results of regular ambient air quality
measurements, which are available from DM environment department for the
locations Jebel Ali Village and Jebel Ali Port.
In accordance with the requirement of the Environmental Protection and
Safety Section of the Dubai Municipality (E.P.S.S.), the air quality impact
assessment in this report focuses on the additional impact of the new project
which has to be added to the existing ambient air pollutant levels which are

CHAPTER 4
Baseline Environmental Status
4-9
EIA study for the proposed Jebel Ali Power and Desalination Station M
measured regularly at two monitoring stations in Jebel Ali Village and at Jebel
Ali Port.
The E.P.S.S carries out hourly measurements of NO2 and SO2 and Ozone
(O3) at Jebel Ali Village. At Jebel Ali Port hourly measurements of SO2 and
Ozone at four monitoring stations. The closest station to the project site is 2
km south-south-east in Jebel Ali Village. The station is influenced by traffic on
the Sheikh Zayed Road, which runs between the project site and Jebel Ali
Village.
The second measuring station is located approx. 4 km southwest of the
project site at Jebel Ali Port. This location is also influenced by the Sheikh
Zayed Road and by the installations at Dubal.
The air quality monitoring results from these sites are summarized in the
Table 4.3 for the period 2008.
At all sites the highest 1 hour and 24 hour Nitrogen Dioxide concentrations
are well below the corresponding Dubai, World Bank and WHO air quality
standards.
At all sites the highest 1 hour and 24 hour Nitrogen Dioxide concentrations
are well below the corresponding Dubai, World Bank and WHO air quality
standards.
The highest 1 hour average concentrations measured for SO2 are well below
the Standards of Dubai, World Bank, and WHO (350 µg/m³) considerably.
A similar situation is present for Ozone At all sites the highest 1 hour and 24
hour O3 concentrations are well below the corresponding Dubai, World Bank
and WHO air quality standards.

CHAPTER 4
Baseline Environmental Status
4-10
EIA study for the proposed Jebel Ali Power and Desalination Station M
Ozone levels are of interest for this project because the NOX emitted by the
plant is a precursor of Ozone in the atmospheric chemistry involving NO, NO2,
Hydrocarbons, and solar irradiation, where the nitrogen oxides act as a
catalyst of Ozone formation in the troposphere
Besides from the existing power plant of the Jebel Ali Power Station the main
ambient air pollution source in the area is Dubai Aluminum factory adjacent to
the south-western border of the Jebel Ali Site.
The only air pollutants to be considered with plant operation on natural gas
are NOX and CO. Due to the fact, that only very small traces of sulphur and
particulates are contained in the natural gas, the corresponding SO2 and
particulate matter emissions are negligible. Consequently only emissions of
NOX and CO are considered in detail.
The background NOx and SO2 concentrations were taken from the online
recording done by Dubai Municipality. The monitoring location located at
Jebel Ali village which is the nearest monitoring station to the proposed power
project site. The recorded concentrations are hourly concentrations of NOx
and SO2 collected for the period of two months from March and April 2008.
The 24 hourly concentrations were calculated based on these hourly values.
TABLE 4.3
JEBEL ALI VILLAGE AIR QUALITY MONITORING RESULTS 2008
Monitoring Site Maximum Minimum
Nitrogen Oxide Concentration
1 Hourly (Limit – 290 µg/m3) 121.0 74.6
24 hourly (Limit – 110 µg/m3) 46.6 28.7
Sulphur dioxide Concentration
1 Hourly (Limit – 350 µg/m3) 5.3 3.0
24 hourly (Limit – 150 µg/m3) 2.0 1.2

CHAPTER 4
Baseline Environmental Status
4-11
EIA study for the proposed Jebel Ali Power and Desalination Station M
The gas turbine emission concentrations of CO are in the same order of
magnitude as those of NOX. However, the toxicity of NOX exceeds the toxicity
of CO by a factor of more than 100, which corresponds in the much higher
emission limits set for CO. Therefore, the only air pollutant of significance with
regard to air quality impact is NOX.
Consequently the only air pollutant which was considered in the air dispersion
calculation and in the assessment of ambient air quality is NOX.
4.7 Biological Features
4.7.1 General
Due to the desert climate there is only very few natural vegetation in the
project area. However the coastal region is heavily irrigated using water from
desalination plants and re-used treated wastewater. The main vegetation
growing in the irrigated area land are palm trees, grass and shrubs.
The Gulf coasts of the Arabian countries do not vary grossly in their
geomorphologic structures. Nevertheless, there is a rich diversity of biotopes,
some of international nature protection interest. Sensitive marine Gulf-specific
biotopes are e.g. shallow bays, coral reefs, seaweed meadows, intertidal
sand- and mudflats. Sensitive coastal biotopes are mangrove areas,
saltmarshes, rocky shores, bird islands, coastal sabkhas, cyanobacterial
mats, sand beaches and beachrock flats. Accompanying this variety of
biotopes is a rich diversity of species.
Use of natural marine resources belongs to the biological context. The Gulf is
a productive sea and a rich source of fish and shrimps. Even if fishery is
negligible within the gross domestic product, it is present all along the Gulf
coast and supplies the food of high quality and variety. The number of people
engaged in traditional and modern fishery should not be underestimated.
CHAPTER 4
Baseline Environmental Status
4-12
EIA study for the proposed Jebel Ali Power and Desalination Station M
Conflicts between interests of desalination industry and fishery can be
expected wherever desalination plants are erected or enlarged. Productive
fishery is a good indicator for a healthy marine ecosystem.
4.7.2 Birds
The UAE Golf coast is rich of `Important Bird Areas (IBA's)'. In general, the
UAE Golf coast has functions for birds such as:
Flyways: For waders and other species from Eurasia / West Asia to Africa and
vice versa, mainly during April/May and July/November. Probably more than
250,000 waders are recorded `at any one time' during the migration period. At
the same time the Gulf coast works as a
Resting/Feeding Place: Several million shore birds are dependent on the
nutritious intertidal mudflats all year.
Wintering: For instance, the Crab Plover' and Great Knot' are dependent on
places such as Khor al Beidah.
Breeding; Up till now, there are various bird Priority Species' (Aspinall, 1996)
such as the Socotra Cormorant' (Endemic to Arabia), `Western Reef Heron'
the `Crab Plover and Kentish Plover (throughout UAE) recorded, ussing parts
of the shoreline as a breeding site.
In general, among others, 61 species of water birds alone were counted along
the Golf shoreline of the UAE.
4.7.3 Fauna, Wildlife
The most frequent animals in Dubai are camels and goats. Indigenous fauna
includes the Arabian Leopard and the Ibex, but sightings of them are

CHAPTER 4
Baseline Environmental Status
4-13
EIA study for the proposed Jebel Ali Power and Desalination Station M
extremely rare. Other desert life includes the sand cat, sand fox and desert
hare, plus gerbils, hedgehogs, snakes and geckos.
No wildlife is present at the selected project location which is situated in a
fenced industrial area
4.8 Soil, Geology and Geomorphology
4.8.1 General
Borings performed in previous projects at the project site showed non
homogeneous surface layers of loose to medium sand with a variable
concentration of seashell fragments. Approx 10 meters below the
unconsolidated soil strata, layers of weak, fine to medium grained calcareous
sandstone (occasionally with layers of limestone and conglomerate) were
encountered.
4.8.2 Regional geology and Hydrogeology
Geologically, the UAE occupies a corner of the Arabian Platform, a body of
continental rock that has remained relatively stable since the Cambrian
Period-more than 500 million years ago. Ancient sediments over time,
accumulated on the coast of UAE including Dubai and continental shelf that
was to become the UAE. The geology in Dubai and environs is essentially
unconsolidated desert plain deposits of sandy silt to fine sand followed by
bedrock. Locally Dubai is built on two major geological and geo-
morphological units.
• Desert plain deposits consisting of sand and silt, form low flying flat or
gently undulating surface with isolated dunes
• Coastal Sabkah: calcareous silt, muddy sand with considerable salt
content, salt crusts flooded by storm

CHAPTER 4
Baseline Environmental Status
4-14
EIA study for the proposed Jebel Ali Power and Desalination Station M
Regionally ground water flow from South East to North West. Ground water
quality along the coast of Dubai is brackish to saline and shallow water level
conditions (water level is 3.0 to 12 meters below ground level depending on
ground elevation).
A study on the background heavy metals data in Dubai was conducted in
1995 by Dubai Municipality EPSS section and following are the soil
background concentrations observed in Dubai as shown in Table 4.4
TABLE 4.4
BACKGROUND HEAVY METALS IN SOIL IN DUBAI
Parameter Mean value(µg/g or mg/kg) Ranges (µg/g or mg/kg)
Copper 10 5 -24
Zinc 23 7-129
Cadmium 2 0.2 to 8
Lead 22 5 to 23
Nickel 27 2 to 62
Chromium 27 5 to 50
Manganese 165 33 to 253
4.9 Shoreline, Water Courses and Discharges
Dubai has an almost linear coastline to the Arabian Gulf, which is interrupted
by the Dubai Creek and some other bays. Presently there are several projects
which will change the natural coastline. In the vicinity of the project area a
marina is constructed for which an artificial creek was created by excavation
of land. Furthermore two artificial Palm Island projects are being built close to
the shoreline.

CHAPTER 4
Baseline Environmental Status
4-15
EIA study for the proposed Jebel Ali Power and Desalination Station M
Dubai is lacking of natural freshwater resources which is overcome by use of
desalination plants. The desalination installations at Jebel Ali are the largest in
Dubai. By the evaporation process utilized in the desalination plants large
amounts of sea water are taken from the gulf and discharged again with
increased temperature and salinity. The natural cooling down of the
discharge water by mixing with colder sea water from the open sea will be
considerably hindered by the construction of the two palm islands.
The ground water table corresponds with the sea water and is established at
an average elevation of approximately + 1.6 m, which is approx. 4.4 m below
the ground level of the existing stations.
The ground water table is subject to seasonal variation and dewatering in the
site vicinity
4.10 Cultural Heritage
The project area is assigned for industrial use. No items of special cultural
heritage are present within a radius of 10 Km around the projected plant.
4.11 Landscape and Topography
The topography in the region consists of flat, barren coastal plain merging into
rolling sand dunes of vast desert land in the south.
4.12 Surrounding Recreational Land uses
The coastline east of the project area is strongly utilized for recreational and
tourist purposes and will be more extended by future developments, such as
the two very large `Palm Islands Projects'.

CHAPTER 4
Baseline Environmental Status
4-16
EIA study for the proposed Jebel Ali Power and Desalination Station M
4.13 Population
The total population of the UAE was estimated in 2001 to be 2,407,460. The
population of Dubai was 1,241, 000 in the year 2006. Of the total population,
73 per cent or 911,000 are male and 27 per cent or 330,000 are female.
Within a radius of 10 km around the plant area, which has been defined as
area of investigation for the atmospheric dispersion calculations, there are
several locations of considerable population density.
Situated approx. 5 km south of the Project Site (minimum distance) are Jebel
Ali Industrial Village and Dubai Investment Park with a population of approx.
3800. Approx. 3 km north of the site is a major residential community in Dubai
Marina and Jumeirah Lake towers with an expected population of 120000, 10
km north-east of the site are Al Mina Al Seyahi, Al Safouh and Palm Jumeirah
future development area with a total population of approx. 80000. Situated
approx. 3 km south-east is Jebel Ali Village and gardens with a population of
around 12000.
Further the industrial areas of Jebel Ali Port and Dubal Aluminium are located
within the zone of potential ambient air impact from the project.
4.14 Water Quality
Oceans, seas and coastal waters have an important influence on our lifestyle.
These ecosystems provide mankind with food, transport and recreation, but
also ultimately receive our waste. The major source of marine pollution is from
land-based human activities, these anthropogenic sources being responsible
for around 77% of the pollutants that enter the oceans and seas. Shockingly,
some 6500 x106 tonnes of litter find their way into the oceans and seas each
year and ocean currents transport pollutants considerable distances.

CHAPTER 4
Baseline Environmental Status
4-17
EIA study for the proposed Jebel Ali Power and Desalination Station M
Chemical pollutants entering marine systems are divided into 2 broad groups
of compounds: inorganic (phosphates, nitrates, metals etc.) and organic
substances (pesticides, hydrocarbons etc.). These pollutants interact with the
other components of seawater, which is a complex conglomeration of animal,
vegetable and mineral matter widely dispersed within a saline-water-matrix .
The full spectrum of organic species is presented from the smallest bacteria,
algae, diatoms and plankton through the full diversity of plant and animal life.
All oceans and seas (especially the Atlantic Ocean, North Sea and
Mediterranean Sea) are now experiencing serious threats due to pollution .
Marine water quality has therefore become a matter of serious concern for
mankind because of its effects on human health and aquatic ecosystems,
including the rich array of marine life that is often exploited for human use.
Water quality characteristics of an aquatic environment are of great
significance for the proper understanding of distribution, growth and
physiological function of the biotic community inhabiting the area.
4.14.1 General characteristics of the Arabian Gulf
The Arabian Gulf covers an area of 226 000 km2 and has a mean depth of 35
m. The Gulf is nearly 1000 km long, with a maximum width of around 370 km.
The coastline along its south-western side is low, whilst the Iranian side is
mountainous. Due to its enclosed and shallow nature, the Gulf is particularly
subject to the accumulation of anthropogenic contaminants. There is only a
very narrow exchange through the Strait of Hormuz into the Gulf of Oman,
which means that the time required for all of the Gulf’s water to come within
the influence of the open sea is 2.4 years or an actual flushing time of 3 -5.5
years .
The Arabian Gulf is mainly a sedimentary environment with a predominantly
soft substrate benthos. Sediments of biogenic carbonates predominate

CHAPTER 4
Baseline Environmental Status
4-18
EIA study for the proposed Jebel Ali Power and Desalination Station M
(derived mainly from micro-fauna), but strong terrigenous influences are
apparent at the northwest end where the Shatt El-Arab discharges to the
Arabian Gulf.
4.14.2 Water quality of the Gulf
Limited information is available on the water quality of the Arabian Gulf. The
Regional Organization for the Protection of the Marine Environment (ROPME)
is currently collecting environmental statistics from the member countries
(ROPME 2000).
4.14.3 Environmental threats of the Gulf
The Arabian Gulf is a unique biotope, distinct from other tropical and
subtropical systems (Rao & Al-Yamani 1999). The Gulf has experienced
severe environmental disturbances, most notably the leakage of an estimated
10.8 x10⁶(1.7x10⁶ m3) barrels of oil into the marine environment during the
1991 Gulf War and the deposition of an estimated further 8.0 x10⁶ (1.3 x10⁶
m3) barrels of oil fallout from the smoke plumes of the well blowouts and fires
in Kuwaiti oil fields (Al-Ghadban et al 1998).
4.14.4 Water quality off DEWA station M
The water quality monitoring survey involved the collection of marine water
samples from 2 sampling locations and results which are illustrated in Figure
4.3. The survey sites were selected to provide data for the water quality in
order to reflect the changes and variations in water quality between sampling
locations. Table 4.5 provides a detailed list of the parameters analyzed.
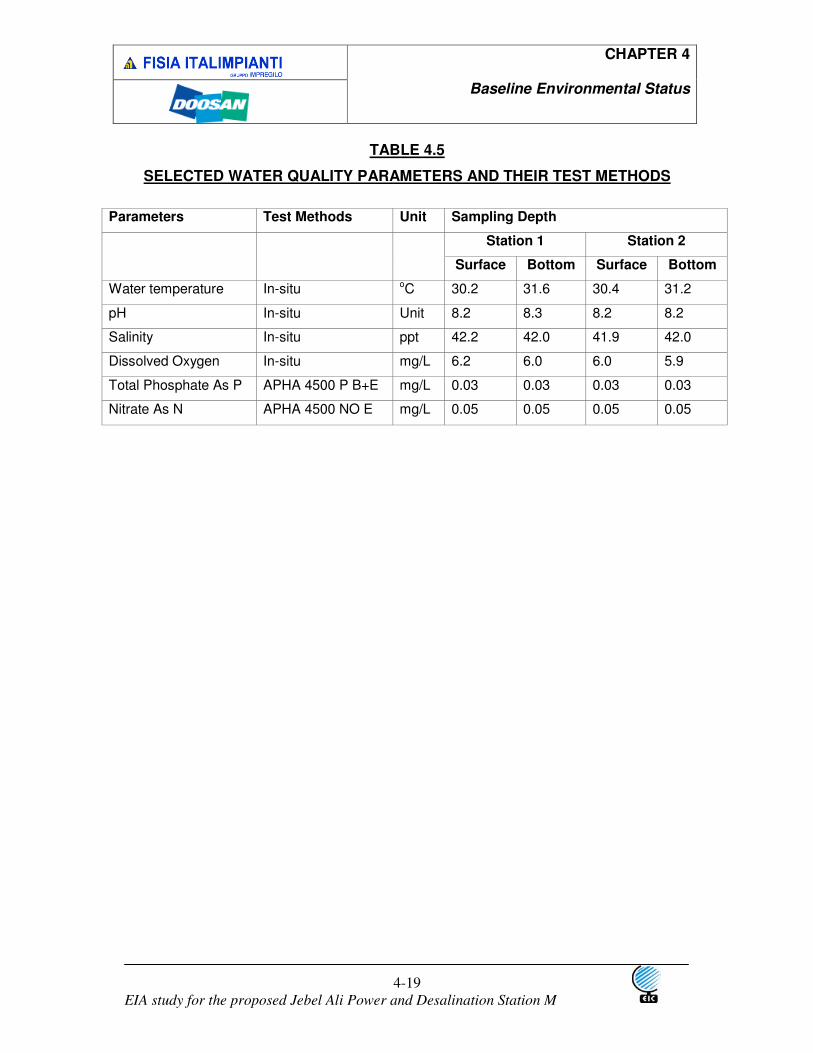
CHAPTER 4
Baseline Environmental Status
4-19
EIA study for the proposed Jebel Ali Power and Desalination Station M
TABLE 4.5
SELECTED WATER QUALITY PARAMETERS AND THEIR TEST METHODS
Parameters Test Methods Unit Sampling Depth
Station 1 Station 2
Surface Bottom Surface Bottom
Water temperature In-situ oC 30.2 31.6 30.4 31.2
pH In-situ Unit 8.2 8.3 8.2 8.2
Salinity In-situ ppt 42.2 42.0 41.9 42.0
Dissolved Oxygen In-situ mg/L 6.2 6.0 6.0 5.9
Total Phosphate As P APHA 4500 P B+E mg/L 0.03 0.03 0.03 0.03
Nitrate As N APHA 4500 NO E mg/L 0.05 0.05 0.05 0.05

CHAPTER 4
Baseline Environmental Status
4-20
EIA study for the proposed Jebel Ali Power and Desalination Station M
FIGURE 4.3
MARINE WATER QUALITY MONITORING STATIONS
4.14.5 Results and Discussion
Understanding of water quality characteristics of a marine environment is of
great importance. The water quality of the sea is not static even in the
absence of anthropogenic influences and is subjected to changes due to a
number of factors which are often natural. Such changes can be on short
time-scale days and seasons or long time-scale. Near shore and shelf waters
that are more biologically productive and influenced by terrestrial run off,
anthropogenic activities and atmospheric fall out often reveal seasonal

CHAPTER 4
Baseline Environmental Status
4-21
EIA study for the proposed Jebel Ali Power and Desalination Station M
changes in water quality. Coastal waters particularly those receiving
anthropogenic inputs and stagnation, variations in water quality are possible
even with the state of the tide.
The following provides a summary of the results taken from the 10 water
quality monitoring stations.
Temperature
Generally, the temperature variation in the tropical region is limited. As
expected for dynamic shallow coastal areas, the water temperature varies in
accordance with the air temperature. The observed range of water
temperature at station 1 and 2 during the present study is well comparable
with the earlier records of temperature in the temperature records of the
ROPME Sea Area (ROPME 2000).
pH
Unpolluted natural waters show a pH range from 3.0 to 11.0; those lying
between 5.0 and 9.0 generally supporting the most diverse assemblage of
species. The pH of coastal water varies in a narrow range (7.8-8.3) due to the
presence of buffer (CO32- -HCO3
- - CO2).
External factors such as pollutants, algae growth or bacteria may cause rapid
changes in pH unless it is buffered. The pH of coastal waters can also be
affected by changes in DO, alkalinity, hydrogen ion concentration and
temperature. The magnitude of any change varies with salinity because of
the concentrations of the various ions involved in acid-based reactions.
The pH range found within the survey stations was 8.2-8.4 with an overall
average of 8.3. The ranges found within the survey stations indicate little
variation between the sites. In general the levels of Ph were higher in the

CHAPTER 4
Baseline Environmental Status
4-22
EIA study for the proposed Jebel Ali Power and Desalination Station M
lagoon (8.9) as compared to coastal waters (8.2). Levels are conducive to the
growth of marine organisms.
Dissolved Oxygen
DO is a measure of the amount of oxygen dissolved in water. It is essential to
aquatic life and is a good indicator of water quality and the presence (or lack
of) of pollutants in the water column. The DO content of natural water can
vary with temperature, salinity and biological activity. For example, DO
decreases with the increase in temperature, salinity and biological activity.
Waste discharges containing high amounts of organic matter and nutrients
can reduce DO as a result of increased biological respiration (bacteria in the
water degrade the organic pollution utilizing dissolved oxygen).
Variation in DO levels were in the range of 5.9-6.1. The average DO level
recorded 6.0 mg/L. These figures show that the levels of DO are comparable
to the average of the Arabian Gulf region, which fluctuate between 4.8-6.5mg/l
depending on salinity and temperature.
Salinity and Conductivity
Conductivity is the ability of a medium to support the flow of an electric current
and can be used as a measure of the salinity of seawater. Seawater contains
about 3.5% dissolved salts and its conductivity is primarily due to these
charged solute ions. Conductivity of sea water varies predictably with
temperature and total ionic concentration. Hence, Salinity is the amount of
salt dissolved in seawater. Moreover, measurements of conductivity and
temperature can be used to calculate the salinity of the seawater. The results
indicate a range in the salinity shows normal values
Inorganic Nutrients
Dissolved inorganic phosphorous and nitrogen compounds play an important
role in controlling the production at primary level. Dissolved nitrogen and
phosphorous compounds are present in low concentrations in seawaters.

CHAPTER 4
Baseline Environmental Status
4-23
EIA study for the proposed Jebel Ali Power and Desalination Station M
Nitrogen is mainly present as nitrate with low concentrations of nitrite and
ammonia, while the major inorganic species of phosphorous is phosphate. High
concentrations of these nutrients in water however can lead to excessive
growth of algae resulting in eutrophication in extreme cases.
Nitrogen in the seawater is mainly present as nitrate with low concentrations
of nitrite and ammonia. High concentrations of nitrogen in water however can
lead to excessive growth of algae resulting in eutrophication in extreme cases.
Generally, the nutrient increases in the marine waters due to stagnation of
water quality. PO4 -P concentration of 0.3 mg/L will support plankton growth,
while concentrations of 1.0-3.2 mg/L PO4-P will trigger blooms.
The phosphate ion is a polyatomic ion (PO4 -P) and the term ‘phosphates’
refers to salts of phosphoric acid. Phosphates occur naturally in geological
features and play an important role in biological systems. It is generally non
toxic to aquatic organisms, however, conditions can exist such that excessive
growth of algae (which may have toxic components) can occur, referred to as
harmful algal blooms (HABs). Excessive levels in the environment are
therefore not desirable.
Levels of nitrate and phosphate were found in the normal range as observed
in the Arabian Gulf.
4.15 Marine Ecology
The coastal waters have been extensively utilized for sea transport,
desalination, fish harvest and culture, dredging and reclamation and dumping
of domestic wastes. Offshore waters have been extensively used for fish
harvest, sea transport & exploration and exploitation of oil and natural gas at
certain places. Apart from these certain areas along the sea bed used for
desalination for fulfilling the water demand. Overall, the near shore waters
play an important role in the production, maintenance and protection of

CHAPTER 4
Baseline Environmental Status
4-24
EIA study for the proposed Jebel Ali Power and Desalination Station M
potential biological habitat of fish and wildlife. Although much of the direct
deleterious impacts due to environmental degradation have been mitigated in
cases where commercially important species have been threatened.
It has been recognized, however that effective management of coastal is
accomplished at the level of community and habitat. It is at community level
that ecological relationship among biotic-abiotic factors can be interpreted in
terns of the functional process, however the knowledge of ecosystem at
species and taxa level ultimately determines the resistance of an ecosystem
and its components to natural and man induced alterations.
The living community of an ecosystem comprises of consumers, producers
and decomposers and related non-living constituents interacting together and
interchanging materials as a whole system. The basic process in an aquatic
ecosystem is its primary productivity. The transfer of energy from the primary
source through a series of organisms is defined as the food chains which are
of two basic types; the grazing food chain and the detritus food chain. The
stress may cause the communities to exhibit low biomass and high
metabolism. In addition, due to depressed functions of less tolerant
predators, there may be also a significant increase of dead organic matter
deposited in sediments of ecosystems modified under stress. Depending
upon the type, strength and extent of a stress factor, the ecosystem will react
to either reestablish the previous equilibrium or establish a new one, or it may
remain under prolonged disequilibrium.
The biological parameters considered for the present study are phytoplankton
cell counts, and their species diversity, and macro-benthos (biomass,
population and total faunal groups). The first one reflects the productivity of a
water column at the primary level. Benthic organisms being sedentary animals
associated with bed, provide information regarding the integrated effects of
stress, if any, and hence are good indicators of early warnings of potential
damages.

CHAPTER 4
Baseline Environmental Status
4-25
EIA study for the proposed Jebel Ali Power and Desalination Station M
4.15.1 The Arabian Gulf Marine Environment
Project area being an integral part of the Gulf, its ecology is controlled by the
dynamics of the Gulf. Hence, knowledge about the general environmental
setting of the Gulf is necessary for comparing the site-specific environmental
conditions with that of the surroundings.
The Arabian Gulf, or al-Khaleej al-Arabi in Arabic, lies between the Arabian
Peninsula and Southwest Asia. It is connected by the Straits of Hormuz to the
Arabian Sea, the northwest part of the Indian Ocean. The Gulf is some 615
miles long and has a maximum width of 210 miles, with an area of about
93,000 square miles. Gulf bordering Iran, Iraq, Kuwait, Saudi Arabia, Bahrain,
Qatar, United Arab Emirates and Oman, with an area of 240,000 km², a
maximum depth of 90 meters, and an average depth is 50 meters. In Western
countries it is called Persian Gulf; in most Arab countries it is called Arabian
Gulf.
The length is 1,000 km, and the maximum width is 370 km. To the south, the
coast line is flat, while the coast on the Iranian side is mountainous. The
temperatures are high, and the salt level is as high as 40%, which results from
an evaporation higher than the supply of fresh water. The main fresh water
source is from Iraq, through the Shatt El Arab, the confluence of the rivers
Euphrates, Tigris and Karun.
Through the Strait of Hormuz, the gulf is connected to Gulf of Oman and the
Arabian Sea. There have been serious incidents that have affected the
environment of the gulf in recent years. While oil spills from the heavy traffic of
oil tankers over years have been serious enough, oil spills from 1983, during
the Iran-Iraq War, and in 1991, during the Gulf War, have been catastrophic.
The area of the Arabian Gulf has slowly decreased during the last 6,000
years, when most of Kuwait and lower Iraq were part of the total basin. This

CHAPTER 4
Baseline Environmental Status
4-26
EIA study for the proposed Jebel Ali Power and Desalination Station M
process continues still as sediment from the Shatt El Arab enlarges the delta
area and reduces the area of the gulf.
The coastal configuration is very irregular with numerous islands, creeks and
bays. Besides, there are a number of eroded shallow banks, many of which
harbor living corals. The intertidal region is sandy and rocky.
Sand storms disturbances strike southern coast of the Gulf regions,
periodically. These disturbances generally originate over the Arabian Gulf.
4.15.2 Objective of the Marine Study
The following objectives are identified for the baseline condition of the Jebel
Ali power and desalination station “M”.
• To assess the biological characteristics at primary as well as secondary
trophic level;
• To establish the baseline conditions and ecological characterization of the
area.
4.15.3 Data Collection and Monitoring Stations
Field data collection with respect to flora and fauna for baseline investigation
were collected at three locations in a distance of 500 m from the shoreline
starting from the proposed location of the outfall for Jebel Ali Station ‘M’ in
western direction and shown in Figure 4.4.

CHAPTER 4
Baseline Environmental Status
4-27
EIA study for the proposed Jebel Ali Power and Desalination Station M
FIGURE 4.4
MONITORING STATIONS ALONG COASTAL ENVIRONMENT OF DEWA
4.15.4 Strategy of Selecting Biological Variables
Evaluation of biological sensitivity of the area is an integral part of the
ecological assessment. The baseline information on the biological
characteristics has been evaluated based on the qualitative and quantitative
data on organisms representative of different trophic levels. The parameters
selected during the present study were phytoplankton for covering the
biological productivity and ecological characteristics respectively at primary
levels while the benthic data were collected to ensure the life at the bottom of
the area.
It is inevitable that a marine structure in the coastal zone would cause certain
environmental impacts, the intensity of which would vary depending on
several factors such as prevailing dynamics of the area and its ecological

CHAPTER 4
Baseline Environmental Status
4-28
EIA study for the proposed Jebel Ali Power and Desalination Station M
sensitivity. Assessment of probable impacts of a development in the coastal
zone therefore needs the site-specific information on components of the
marine environment especially biological characteristics of the area likely to
be influenced.
Published scientific literature and available technical reports indicated that
apart from studies conducted by Environment International Corporation (EIA)
the information related to the ecology of the UAE water was rather scanty in
this area. The available information for the UAE water was assessed to plan
field data acquisition for the present study. Accordingly, two sub-tidal stations
near discharge point and associated coastal water was considered adequate
to describe the prevailing environment of the project site.
Coastal waters often reveal significant seasonal changes in ecology. These
variations should be clearly understood for assessing the prevailing status of
a water body. However due to limited scope of work only one time data
collection was considered adequate for establishing the prevailing ecology of
the project area (Figure 4.5).

CHAPTER 4
Baseline Environmental Status
4-29
EIA study for the proposed Jebel Ali Power and Desalination Station M
FIGURE 4.5
MARINE ENVIRONMENT OF DEWA SHOWING OUTFALL LOCATIONS

CHAPTER 4
Baseline Environmental Status
4-30
EIA study for the proposed Jebel Ali Power and Desalination Station M
4.15.5 Methodology of Sampling and Analysis
The sampling was done at three locations as mentioned in Figure 4.4 at
500±25 meter away from the shoreline for phytoplankton, zooplankton and
Macro-benthos.
Four samples for phytoplankton were collected from surface using Niskin
water sampler (General Oceanic) once during sampling period, preserved
with formaldehyde lugol’s solution till further analysis.
Two grabs of sediment samples from each station were collected with van
Veen type of grab (Hydro-bios), sieved through 500 micron sieve. The
material retained on sieve was collected in polythene bag, stain with rose
Bengal and preserved with 5% formaldehyde solution.
Phytoplankton samples were collected from surface, mid and bottom depth
using Niskin water sampler of 1.7 liters capacity during both the tides. The
samples were collected and preserved in 500 ml of HDPE bottles, preserved
with formaldehyde lugol Iodine solution till further analysis.
Phytoplankton samples were allowed to settle for minimum 96 hrs, decant the
supernatant solution and made the volume of 50 ml, then 1 ml of sample was
taken in Sedgwick-Rafter slide (1 ml capacity) with the help of glass dropper.
Initially the sample was examined for the qualitative analysis, and then the
different genera/species were counted. The same procedure was repeated
thrice or four times. Every time fresh aliquot of sample was examined to
minimize the variability in the phytoplankton cell counts. The identification of
the phytoplankton up to species was done using many international
phytoplankton references with the help of compound microscope. The 100
times magnification (10x eyepieces and 10 x objective) was normally used for
the counting, whereas 400 times magnification (40x eyepiece and 10x
objective) was used for the identification of certain species of phytoplankton.

CHAPTER 4
Baseline Environmental Status
4-31
EIA study for the proposed Jebel Ali Power and Desalination Station M
The number of phytoplankton present in 1 ml of sample was multiplied for the
total aliquot of sample and then converted in to number per liter. For the final
counting, an average of 3 to 4 (each with 1 ml of sample) counting was
considered.
The identification of the phytoplankton up to species was done using many
international phytoplankton references with the help of compound microscope.
Samples were washed again in laboratory in running water using sieve of 500
µm mesh size to remove excess of Rose Bengal and formaldehyde, Sorting of
the fauna was done under binocular Stereo microscope using 20 times
magnification (20x eyepiece and 1x objective). Specimen belonging to a
particular species or taxon has been enumerated individually. Fragments
were counted only after ascertaining that they belong to a single organism.
After enumeration, the specimens were stored in separate containers. Data
on enumeration was used to study the distribution, abundance and population
dynamics.
4.15.6 Phytoplankton
Phytoplankton cell counts between different stations (Station 1 & 2) showed
fluctuating due to variability in the phytoplankton species. Highest population
was recorded at station 1 (surface) whereas the lowest population was
noticed in station 2 (bottom). Dominant groups of phytoplankton were
recorded in all two stations were diatoms followed by dinoflagellates.
Nitzschia followed by the Rhizosolenia and Ceratium were the major species
in both stations at surface and bottom. These species are generally observed
in the offshore marine environment of Dubai. Vertical variations in terms of
species composition and population were not significant due to shallow water
in the sampling region. All species were seen as healthy conditions.

CHAPTER 4
Baseline Environmental Status
4-32
EIA study for the proposed Jebel Ali Power and Desalination Station M
The effects of temperature changes on marine life are greater than those of
salinity. In general, water temperatures over 34oC suppress the rate of
phytoplankton photosynthesis and can disrupt the survival and normal
metabolism of plankton. Temperatures exceeding 33o to 35oC may result in
the large-scale destruction of algae, and while benthonic organisms can
tolerate temporary water temperatures of roughly 33o to 36oC, fish can only
withstand temperatures of around 34oC.
Increases in salinity may also affect marine life, in so far as changes in salinity
disturb the equilibrium between the osmotic pressure of body fluid and the
surrounding seawater. There is also a close relationship between the
respiration and excretion of several species of marine life and the salinity of
their surrounding environment.
Research indicates that the tolerance of plankton to salinity changes is fairly
strong, though its growth rate drops dramatically in waters of greater than
40ppt salinity. While intertidal algae can tolerate environmental salinity
variations of 0.1 to 0.3 times normal, tidal algae can only survive within a
range of between 0 and 1.5 times normal levels. The sensitivity of benthonic
animals towards interrelated variations in temperature and salinity is generally
greater than that of benthonic plants. Invertebrates living in intertidal and sub-
tidal bands of several meters deep are more adaptable than euryhaline
organisms in their capacity to withstand a greater range of salinity variations
through the physiological process of osmotic pressure regulation. In addition
to the self-regulation of osmotic pressure, fish can also adapt to
environmental changes through migration.
Information with regards to the phytoplankton cell counts in the Arabian Gulf is
very few to absent. We compared our data and found that cell counts of
30x103l-1 have been reported in the coastal waters of India (Qasim, 1979).
However we found very low species richness as compared to the coastal area
of India. Despite possibilities of nutrient limitation for the primary productivity

CHAPTER 4
Baseline Environmental Status
4-33
EIA study for the proposed Jebel Ali Power and Desalination Station M
in the Arabian Gulf (Kimor, 1979), 400 phytoplankton species including 225
diatoms and 152 dinoflagellates were recorded (Dorgham and Mufatah, 1986,
Dorgham et al 1987). In our study we found only 9 species during sampling
period which clearly shows the impact of thermal discharge on the
phytoplankton species. Planktonic organisms have been recognized as
indicators of water masses and their movements (Raymont, 1963). It is also
reported that the coastal zone throughout the Arabian Gulf coast is already
exposed to major conflict on resources utilization (MEPA, 1992). Studies
along the offshore marine environment of desalination outfall off Jubail,
Arabian Gulf shows seasonal changes in the phytoplankton community and
their population abundance during summer (Abdul-Aziz, 1998) associated
with phytoplankton blooms during August and May. Another study from the
same location indicates that seawater temperature and salinity did not
impact on the abundance of the phytoplankton (Abdul-Aziz, 2003). Although
phytoplankton blooms and harmful algal bloom of red tide in the Arabian Gulf
are quite common (Rao et al, 1999) and exposed to fish kill in mass (Gilbert et
al 2001), we did not find any algal bloom in the present studied area.
Overall present assessment (Table 4.6) suggests low cell counts and diversity
possibly associated with harsh environment associated with thermal
discharge in the close vicinity. The dominant species of phytoplankton
existing in this area were Ceratium and Nitzschia.
4.15.7 Macro-Benthos
Macro-benthic biomass of 12.4 – 18.6 gm/m2, (Table 4.7) at station 1 and 2 is
slightly lesser then the biomass of northern Arabian Gulf environment
(Sheppard et al, 1992). The low biomass at station 1 and 2 possibly
associated with harsh environmental conditions and thermal discharges from
the outfalls located along DUBAL and DEWA.
CHAPTER 4
Baseline Environmental Status
4-34
EIA study for the proposed Jebel Ali Power and Desalination Station M
Salinity and sediment particle are the two parameter effect benthic community
of the Arabian Gulf (Stephens and McCain 1990). In-faunal abundance
commonly increases with decreasing particle size and reduced of benthic
organism by increasing salinity has been quantitatively observed in the gulf at
salinities above 45 ppt in the gulf of Swah and Abu Dhabi barrier island (Clark
and Keij 1973, Evans et al 1973).
The present results shown in the tables are an average values of two samples
collected from each station. The two samples were collected from two
directions of each station location. These stations are mainly dominated by
polychaetes and crustaceans. The polychaetes species mainly comprised of
Nephthys sp, Eunice sp., Ammotrypane sp., Glycera sp., Lumbrineris sp.,
Scoloplos sp. and Sthenelais sp recorded at these stations. The crustaceans
were mainly dominated by amphipods, and cumaceans. The molluscans were
mainly dominated by Tellina sp., Chama sp., Cerathium, Bellusina and
Mactra sp (Table 4.7 and Fig 4.6).
4.15.8 Conclusion
Overall, the baseline study along the stretch of Jebel Ali Station ‘M’ envisaged
the following:
• Phytoplankton assessment shows low diversity at station 1 & 2 possibly
associated with harsh environment and thermal discharge in the close
vicinity.
• Benthic biomass at station 1 and 2 were observed slightly lesser than the
recorded biomass of the northern Arabian Gulf environment. However
biomass does not shows any impact of heated brine, quantitative
estimation of the biomass of macro-benthos was similar to the Northern
Arabian Gulf. Although heated brine from adjacent outfalls from DEWA
and DUBAL may disturb the balance of marine ecosystem in the vicinity of
station 1 and 2, however their impacts could not be identified. Similar to

CHAPTER 4
Baseline Environmental Status
4-35
EIA study for the proposed Jebel Ali Power and Desalination Station M
our results the impacts due to heated brine on the marine environment is
not yet established in Saudi Arabia (LBA –Saudi Arabia, 1999).
TABLE 4.6
DISTRIBUTION OF PHYTOPLANKTON CELL COUNTS (NO/L) ALONG
DIFFERENT STATIONS
Phytoplankton Surface Bottom Surface Bottom
Chaetocerose sp 40 40 40 40
Coscinodiscus sp 40 40 30 40
Cyclotella 20 20 20 20
Guinardia delicatula 80 80 40 80
Melosira sp. 40 60 40 40
Nitzschia spp 980 880 780 840
Pleurosigma sp 20 20 20 20
Rhizosolenia sp 540 480 400 340
Synedra alna 140 20 80 40
Thalassionema nitzschioides 80 80 40 40
Ceratium sp. 720 780 640 620
Peridinium sp 640 540 740 640
No. of species 12 12 12 12
Total Cell counts 3340 3040 2870 2760

CHAPTER 4
Baseline Environmental Status
4-36
EIA study for the proposed Jebel Ali Power and Desalination Station M
TABLE 4.7
DISTRIBUTION OF MACRO-BENTHOS BIOMASS (gm/m2) AND
POPULATION (no/m2)
Species/Groups Station 1 Station 2
Amphipods - 120
Cumaceans - 40
Nephthys paradoxa 520 210
Glycera sp. 220 240
Eunice sp. 200 80
Ammotrypane sp. 2420 1160
Nereis sp. 200 240
Sthenelais boa 40 20
Strombus sp. 100 40
Cymatium sp. - 80
Cerithium sp 120 320
Mitrella blanda 80 80
Tellina sp. 120 400
Timoclea arkana 40 40
Mactra sp. 40 40
Bellucina semperiana 120 320
Biomass (g/m2; wet wt) 12.6 18.2
Population 3600 3190

CHAPTER 4
Baseline Environmental Status
4-37
EIA study for the proposed Jebel Ali Power and Desalination Station M
0
500
1000
1500
2000
2500
3000
3500
Am
phip
ods
Cum
aceans
Nephth
ys
para
doxa
Gly
cera
sp.
Eunic
e s
p.
Am
motrypane
sp.
Nere
is sp.
Sth
enela
is
boa
Strom
bus s
p.
Cym
atium
sp.
Cerith
ium
sp
Mitre
lla
bla
nda
Tellina s
p.
Tim
ocle
a
ark
ana
Mactra s
p.
Station 1 Station 2
FIGURE 4.6
DISTRIBUTION OF MACRO-BENTHOS BIOMASS (gm/m2 ) AND
POPULATION (no/m2)
4.16 Terrestrial Ecology
The natural surface comprises an area of sand sheets, low dunes, and
ridges and small gravel plains. The site lies in the geomorphological
region VI, the Gulf Coast, as recognized to Dubai Emirates. The pale
sand typical of coastal areas along the UAE Gulf Coast, is relatively
coarse and is rich in calcium carbonate. The site has low, parallel WNW-
ESE oriented sand ridges and interdune plains.

CHAPTER 5
Environmental Impact Assessment
5-1 EIA study for the proposed Jebel Ali Power and Desalination Station M
5.1 Preamble
Actual and foreseeable events, including operational and typical events are
discussed in this chapter. Processes that may create risks to the environment
are considered and are analyzed in terms of key potential environmental
impacts.
Generally, the environmental impacts can be categorized as either primary or
secondary. Primary impacts are those, which are attributed directly by the
project and secondary impacts are those, which are indirectly induced and
typically include the associated investment and changed patterns of social
and economic activities by the proposed actions. In this chapter, only
significant direct and indirect impacts have been considered. The details of
criteria opted for impacts assessment are as per described hereunder.
The environmental impacts may include all those that are beneficial or
adverse, short or long term (acute or chronic), temporary or permanent, direct
or indirect and local or regional. The adverse impacts may include all those
leading to harm to living resources, damage to human health, hindrance to
other activities, impairment of quality for use, reduction of amenities, damage
to cultural and heritage resources and damage to physical structures. For
each identified potential environmental impact, the associated environmental
risk is assessed based on its likelihood and significance. The impacts
assessment is being performed in three steps:
Step 1 : Identification of interactions between activities and
environmental receptors
Step 2 : Identification of potentially significant environmental impacts
Step 3 : Evaluation of all significant environmental impacts

CHAPTER 5
Environmental Impact Assessment
5-2 EIA study for the proposed Jebel Ali Power and Desalination Station M
In Step 1, based on the project description and environmental baseline
description, a detailed matrix of activities and environmental receptors is
prepared. Then based on the legal framework and baseline environment data,
it is determined whether an interaction exists between an activity and a
receptor.
In Step 2, based on the interactions identified in Step 1, potentially significant
impacts due to the proposed changes are identified. The impacts may be
beneficial/ adverse, direct / indirect, reversible / irreversible and short-
term/long-term as per criteria given in Table 5.1.
TABLE 5.1
IMPACT RATING ASSESSMENT MATRIX
Impact Criteria
Beneficial Positive Nature of
impact Adverse Negative
Short term Impacts shall be confined to a stipulated time Duration of
impact Long term Impacts shall be continued till the end of plant life
Localized Impacts shall be confined within 5 km radius Impacted Area
Regional Impacts shall be continued beyond 5 km radius
In Step 3, all the potentially significant impacts are evaluated and a qualitative
evaluation is made. An impact level is rated as “low”, “medium” or “high”. The
impact rating is based on two parameters i.e. the “severity of impact” and the
“likelihood of occurrence of impact”.
• Impact Severity: The severity of an impact is a function of a range of
considerations including impact magnitude, impact duration, impact extent,
legal and guideline compliance and the characteristics of the receptor/
resource; and

CHAPTER 5
Environmental Impact Assessment
5-3 EIA study for the proposed Jebel Ali Power and Desalination Station M
• Likelihood of Occurrence: How likely is the impact (this is a particularly
important consideration in the evaluation of unplanned / accidental
events).
The significance of each impact is determined by assessing the impact
severity against the likelihood of the impact occurring as summarized in the
impact significance assessment matrix provided in Table 5.2.
TABLE 5.2
IMPACT RATING ASSESSMENT MATRIX
Impact Likelihood
Impact
Severity
Unlikely (e.g. Not
expected to occur
during project
lifetime)
Low Likelihood
(e.g. may occur
once or twice
during project
lifetime)
Medium
Likelihood (e.g.
may occur every
few year)
High Likelihood
(e.g. Routine,
happens several
times a year)
Slight Negligible
Impact
Negligible
Impact
Negligible
Impact
Negligible
Impact
Low Negligible
Impact
Negligible
Impact
Negligible to
Minor Impact
Minor Impact
Medium Negligible
Impact
Minor Impact Minor–Moderate
Impact
Moderate
Impact
High Minor Impact Moderate Impact Major Impact Major Impact
Notes:
Negligible Impact : Defined as magnitude of change comparable to natural variation
Minor Impact : Defined as detectable but not significant
Moderate Impact : Defined as not insignificant; amenable to mitigation; should be mitigated
where practicable
Major Impact : Defined as significant; amenable to mitigation; must be mitigated

CHAPTER 5
Environmental Impact Assessment
5-4 EIA study for the proposed Jebel Ali Power and Desalination Station M
The proposed project is likely to create impact on the environment in two
distinct phases:
• Construction phase
• Operational Phase
The construction and operation of the proposed project comprises of various
activities, each of which will have some impact on one or more environmental
parameters. The identification, prediction and evaluation of the associated
and potential impacts are presented as under:
5.2 Impacts during Construction Phase
Generally, impacts during the construction phase are temporary. The impacts
are localized in nature and limited to work area. The construction activities
include excavation, leveling, erection and construction. The major impacts
during construction phase on various attributes of environment are described
below;
5.2.1 Impact on Air Quality
Impact on the ambient air quality occurs during construction phase due to
vehicular traffic, leveling of the site, grading earthwork, foundation work. Mainly
fugitive dust is emitted during construction activities.
Vehicular emissions and emissions from other diesel operated equipment
during construction phase are likely to contribute to the higher concentration
of gaseous pollutants like Oxides of Nitrogen (NOX), Carbon Monoxide (CO)
and Hydrocarbons. The impact will, however, be marginal in nature.

CHAPTER 5
Environmental Impact Assessment
5-5 EIA study for the proposed Jebel Ali Power and Desalination Station M
The impact of such activities would be temporary. The impact will be confined
within the project boundary and is expected to be negligible outside the plant
boundaries. However, proper upkeep and maintenance of vehicles, sprinkling
of water on roads and construction site are some of the measures that would
greatly reduce the impacts during the construction phase. Moreover, the site
is already leveled and the dust generation will be substantially low. Based on
the above discussion, the overall is rated as per given below;
Impact Rating Air Quality
Nature of impact Adverse
Duration of impact Short term
Impacted Area Localized
Likelihood of occurrence Low
Severity of impact Very Low
Significance of impact Insignificant
5.2.2 Impact on Water Quality
The construction work mainly consists of fabrication, erection and assembly
where water requirement is very small. The main source of water pollution will
be from loose soil at the construction site.
Make shift sanitary facilities will have to be set up for disposal of sanitary
waste generated by the labours at work place. The wastewater from the
sanitary facilities will be collected in the tanker and disposed as per Dubai
Municipality regulations.
Impact Rating Water Quality
Nature of impact Adverse
Duration of impact Short term

CHAPTER 5
Environmental Impact Assessment
5-6 EIA study for the proposed Jebel Ali Power and Desalination Station M
Impacted Area Localized
Likelihood of occurrence Low
Severity of impact Very Low
Significance of impact Insignificant
5.2.3 Impact on Noise Level
The major noise generating sources during the construction phase are
vehicular traffic, construction equipment like dozers, scrapers, concrete
mixers, cranes, generators, compressors etc. The operation of these
equipments will generate noise ranging between 75 – 85 dB (A). All the
machinery will comply with the relevant international noise protection
standards. As far as necessary, times and conditions of operation will be fixed
in detail in co-operation with the competent authorities.
The nearest residential area are approximately 3 km from the edge of the
proposed desalination plant. There are existing power stations adjacent to the
proposed desalination plant station ‘M’ and Sheikh Zayed Road which
contribute to the background noise.
Although the existing noise levels have not been monitored, measurements
conducted in similar areas show levels to be typically about 50 to 55 dB (A)
during the day time, falling to between about 35 and 40 dB (A) at night time
which is well with DM limits.
Impact Rating Noise Levels
Nature of impact Adverse
Duration of impact Short term
Impacted Area Localized
Likelihood of occurrence Low

CHAPTER 5
Environmental Impact Assessment
5-7 EIA study for the proposed Jebel Ali Power and Desalination Station M
Severity of impact Very Low
Significance of impact Insignificant
5.2.4 Impact on Landuse
The new installations to be constructed for station ‘M’ will be adjacent to
existing Package ‘P’ power station in eastern side. The entire location is
developed for power station and desalination plant. The proposed
desalination plant also located within existing power complex. Therefore the
proposed desalination plant will not change the existing view.
Impact Rating Landuse
Nature of impact Adverse
Duration of impact Short term
Impacted Area Localized
Likelihood of occurrence Low
Severity of impact Very Low
Significance of impact Insignificant
5.2.5 Assessment of Works, Health and Safety
During construction work the usual Standards on workmanship and safety
regulations are applicable. Recommended construction practices will
eliminate or diminish the disturbances and irritations that construction can
cause. For road, power line and telephone crossings special arrangements
will be made such as scaffolding etc. During erection work of overhead lines
running parallel to hot lines, special provisions concerning worker health and
safety will be made such as keeping vertical and horizontal clearance
between the conductors and all parts of the new installation (cranes, trucks,
winches etc). As a protection against induced current on the new conductors
CHAPTER 5
Environmental Impact Assessment
5-8 EIA study for the proposed Jebel Ali Power and Desalination Station M
careful earthing of these conductors will be provided.
About 1000 work men will be employed at the site during the construction
period and hence will have significant occupational health and safety issues to
be dealt with unless a proper safety management system is implemented.
5.3 Impacts during Operation Phase
Operation phase of the proposed facility mainly comprises of the following
activities:
5.3.1 Impact on Ambient Air Quality
All the pumps and equipments will be operated on the electricity. The major
portion of steam requirement shall be procured from existing Package ‘P’
power station. All the turbines in power plant and auxiliary boilers of
desalination plant shall be operated on the natural gas. There will be six
stacks in power plant and 2 stacks in desalination plant which will be the
source of gaseous emissions. The gaseous emission from these stacks shall
be the only source of gaseous emission which may contribute to increased
level of oxides of nitrogen.
The auxiliary boilers will be equipped with Low NOX burner arrangements,
which are able to reduce the NOX emissions in the flue gas from around 300
ppm without this technology to approximately 25 ppm or 51 mg/Nm3 (dry, at
25 °C, 15 % O2) during normal operation.
CO emissions of the plant will be in the same order of magnitude as the NOX
emissions. However the toxicity of CO is around 100 times lower compared to
the toxicity of NOX, which is expressed by its much higher ambient air quality
limit (23,000 for CO compared to 290 for NOX). Therefore the ambient air

CHAPTER 5
Environmental Impact Assessment
5-9 EIA study for the proposed Jebel Ali Power and Desalination Station M
impact by CO is considered negligible and was not explicitly calculated by
dispersion calculation.
• Methodology of air Dispersion Calculation
A dispersion model provides more accurate estimates of a source’s impact
and consequently requires more detailed and precise data. In the present
case guideline model known as AIRMOD based on Industrial Source Complex
Model (ISC-3) is used. The model is the U.S. EPA approved air dispersion
model which is widely used and accepted by regulators across the world.
The increment of the ground level concentration arising from the emission of
Desalination plant ‘M’ was calculated and the background pollution level was
added. The total ground level concentrations were compared with the relevant
air quality standards of Dubai Municipality.
• Meteorological Data
As required by the model, input meteorological data of 2008 is collected from
Dubai International Airport. The metrological parameters collected were Wind
speed, Wind Direction, Temperature, Relative Humidity, Atmospheric
Pressure, Rainfall, Solar radiation.
• Receptor Network
In this case the concentrations are estimated by Cartesian receptor method. A
Cartesian network consists of north – south and east-west oriented lines
forming a rectangular grid with receptors located at each intersection point. In
most refined air quality analysis, a Cartesian grid with 50 receptors (where the
distance from the source to the farthest receptor is 5 km) is usually adequate

CHAPTER 5
Environmental Impact Assessment
5-10 EIA study for the proposed Jebel Ali Power and Desalination Station M
to identify areas of maximum concentration.
• Emission source Data.
The proposed project will have auxiliary boilers of advanced technology. The
emissions details are given in Table 5.3.
The maximum nitrogen oxide concentration in the flue gas of the auxiliary
boilers will be 150 mg/Nm3. However, with advance low NOx burners the
concentration of NOx shall be 51 mg/Nm3.
The following table shows the source emission parameters of proposed
desalination plant.
TABLE-5.3
SOURCE DATA OF THE PROPOSED STATION ‘M’
Details Sr.
No.
Parameters Unit
Power
Station M
Power
Station L
Desalination
Plant
1 Stack height M 60 60 75
2 Number of Stacks M 6 7 2
3 Stack diameter M 7 7 3.4
4 Flue Gas velocity m/s 17.5 17.5 18
5 Exit flue gas
Temperature
°C 118.4 118.4 204
6 Volumetric flow Nm3/s 512 512 102.1
mg/Nm3 51 51 51 7 Emission rate of NOx
from each stack gm/s 26 26 5.2

CHAPTER 5
Environmental Impact Assessment
5-11 EIA study for the proposed Jebel Ali Power and Desalination Station M
• Ground Level Incremental Concentration
The NOX ground level pollution increments were calculated for 24 hour period.
The air quality impacts have been predicted for the proposed desalination
plant on the basis that the pollution due to the existing activities has already
been covered under baseline environmental monitoring.
In the present case, model simulations have been carried out for the
monitoring period using the hourly Triple Joint frequency data viz., stability,
wind speed, mixing height and temperature. For the short term simulation, the
concentrations were estimated at around 50 receptors to obtain an optimum
description of variations in concentrations over the site in 5 km radius
covering 16 directions. For each time scale, i.e. for 24 hr (short term) the
model computes the highest concentrations observed during the period over
all the measurement points. The maximum 24 hourly short term NOX
incremental concentrations are presented in Table-5.4.
TABLE - 5.4
PREDICTED 24-HOURLY SHORT TERM
INCREMENTAL CONCENTRATIONS OF NOX
Concentration µg/m3 Pollutant
Baseline Incremental Resultant DM Standard
NOX (51mg/Nm3) 46.6 8.6 55.2 110
The maximum incremental concentrations of NOX is 8.6 µg/m3 respectively at
a receptor point about 3.1 km southeast from the stacks of the proposed
plant, which are well within the stipulated standards of Dubai Municipality.
Based on the above discussion, the overall is rated as per given below:

CHAPTER 5
Environmental Impact Assessment
5-12 EIA study for the proposed Jebel Ali Power and Desalination Station M
Impact Rating Air Quality
Nature of impact Adverse
Duration of impact Long term
Impacted Area Localized
Likelihood of occurrence Very Low
Severity of impact Low
Significance of impact Insignificant
5.3.2 Impact on Water Quality
1 Power Plant
In power plant, about 15 m3/hr of oily wastewater generated in service area
and chemical wastewater of 20 m3/hr will be generated in chemical dosing
area. These wastewaters will be collected in separate collection tanks. The
oily wastewater shall be treated in oil water separation tank. The chemical
wastewater shall be treated in a Effluent Treatment Plant (ETP) consisting of
following treatment units:
• Chemical wastewater buffer basin;
• Reaction basin and Flocculation basin;
• Sedimentation basin;
• Sludge Thickening basin;
• Hydrochloric acid dosing system;
• Alum dosing basin; and
• Polymer dosing basin.
The quantity and quality of before and after treatment is given in Table-5.5.

CHAPTER 5
Environmental Impact Assessment
5-13 EIA study for the proposed Jebel Ali Power and Desalination Station M
TABLE-5.5
QUALITY OF WASTEWATER
Oily wastewater Chemical wastewater Sr.
No.
Parameters
Before After Before After
1 pH 6 - 8 6 - 8 2 - 12 6 – 8
2 COD (mg/l) 125 100 125 100 3 Oil & Grease (mg/l) 100 10 50 10
4 Suspended Solids (mg/l) 100 25 200 25
In addition there will be discharge from steam turbine condenser and closed
cooling water system.
The sea water will be supplied from FISIA side for condenser cooling water
(28200 ton/hr) and for auxiliary cooling water separately (1500 ton/hr) for each
block at the temperature and the water quality as supplied by FISIA (normal
condition 37°C). The above water will return (29700 ton/hr) combined-way
through seal pit of each block to FISIA side. The temperature rise in the power
plant cooling water circuits under normal operating condition is about 3.5 °C
(40.5 °C considering 37 °C inlet water from FISIA side) and maximum
temperature rise will be limited to 8 °C. The flow indicated is for Block-1 and
the similar flows are to be considered for Block-2 & Block-3 (which will return
to FISIA side separately) to ascertain the total sea water into power plant and
return from power plant.
2 Desalination Plant
In the desalination plant the main wastewater will be generated in the form of
brine, which is similar to sea water quality with high Total Dissolved Solids
concentration. The total quantity of brine generation in the plant will be about
197392 m3/hr. The brine will be discharged through outfall point in sea.

CHAPTER 5
Environmental Impact Assessment
5-14 EIA study for the proposed Jebel Ali Power and Desalination Station M
All the above mentioned wastewater after treatment shall be collected and
mixed together will result in;
1 Dilution of the brine
2 Decrease the temperature of condense water discharge
Thus the final discharge shall have almost similar quality of the seawater.
Therefore the impact on the seawater quality and marine life will be
insignificant.
In addition to these wastewater discharges, domestic wastewater shall be
generated in rest rooms provided in power plant (75 m3/day) and desalination
plant (20 m3/day). The sewerage will be treated in Sewage Treatment Plant
and treated wastewater shall be used in landscaping. No domestic
wastewater shall be discharged into sea.
Impact Rating Water Quality
Nature of impact Adverse
Duration of impact Long term
Impacted Area Localized
Likelihood of occurrence High
Severity of impact Low
Significance of impact Insignificant
5.3.3 Impact of Brine from Desalination Plant
During the operation of the desalination plant, a variety of chemicals control
scale formation and biological growth. It is possible that the discharge to the
Gulf of seawater used in production processes and in chemical treatments
could affect the marine environment in the following ways:

CHAPTER 5
Environmental Impact Assessment
5-15 EIA study for the proposed Jebel Ali Power and Desalination Station M
• Increase of chemical pollutants;
• Localized increase of the water temperature (thermal pollution);
• Localized increase of salinity and decrease of dissolved oxygen;
• Changes or modification in the marine biota.
Chemicals likely to be of importance include anti-scaling agent addition for
scale inhibition, bio-fouling control by chlorination, antifoam dosing to reduce
foaming and corrosion inhibition by oxygen depletion. However, the particular
additives that will be used during the plant operation have yet to be decided.
The anticipated effects on the marine environment that could be expected
during the operational phase of the complex’s outfall are analyzed below:
• Salinity.
Salt concentrations of the final effluent are above those of the receiving
waters, and will be consistently between 1 and 2.5 ppt above the existing
seawater background levels. In normal and minimal conditions, the salinity of
the effluent at the exit of the outfall (end-of-pipe) will be less than a 5%
increase above background seawater salinity. During the summer, when
seawater temperature and salinity levels are high, the increase above ambient
salinity levels could reach 5.5%. It is expected that at the edge of the mixing
zone, the Dubai Municipality (DM) Marine Standard (no more than 5% in
background concentration) would be respected at all conditions. Respecting
this DM criterion should be sufficient to avoid impacts on the marine
environment.
• Chlorine
A chlorine generating system will produce the 0.1 to 0.15% sodium

CHAPTER 5
Environmental Impact Assessment
5-16 EIA study for the proposed Jebel Ali Power and Desalination Station M
hypochlorite solution from seawater feed. This solution will be injected into the
cooling tower and MED makeup streams on a continuous basis for a chlorine
residual of 0.5 ppm in these flows.
• Oxygen
The DEWA effluent will be aerated in a way that the dissolved oxygen (DO)
concentration at the exit of the aeration basin would be at least 3 mg/l and at
the edge of the mixing zone, the dissolved oxygen levels should be close to
the background dissolved oxygen levels. Oxygen scavengers are likely to
comprise sodium sulphite, which is oxidized to sulphate, a normal constituent
of seawater.
Carbon dioxide, oxygen, and nitrogen are the principal dissolved gases in
seawater. These atmospheric gases are dissolved in surface waters by the
movement of winds and waves at the air-sea interface. Temperature and
salinity rule the amount of gas that can be dissolved in seawater. When either
of these increases, the amount of gas that can be dissolved decreases. This
may affect the distribution and composition of communities of marine
organisms.
Hypoxia occurs when the DO level reaches a point at which organisms can no
longer survive. In marine waters, mortalities generally occur at oxygen
concentrations below 2 mg/l.
In the Gulf, the DO levels in surface waters are expected to range between
90- 103% saturation throughout the year, equivalent to 4.8-6.5 mg DO/l.
The DO concentrations in the effluent should not cause any mortality and
should not affect the marine organisms.

CHAPTER 5
Environmental Impact Assessment
5-17 EIA study for the proposed Jebel Ali Power and Desalination Station M
• Addition of anti-scaling and antifoaming agents.
Use of anti-scaling agents may lead to formation of orthophosphates from
hydrolysis of polyphosphates. Orthophosphates are a macronutrient that may
enhance biological growth (e.g. red and green algae). Polymeric additives
based on polyacrylate or polycarboxylic acids prevent this problem, and are
biodegradable and certified non-toxic.
Similarly, antifoaming agents are also degradable and non-toxic. Therefore
anti-scaling and antifoaming agents will be selected to avoid polyphosphate
formation and their impact on the marine environment will be considered
negligible.
• Heavy Metals.
Discharged brine contains low concentrations of metal ions resulting from
corrosion, namely copper, nickel, chromium and iron. These concentrations
are profoundly increased with acid cleaning of the plants, which occurs once
or twice per year.
Bioaccumulation of heavy metals in benthic fauna around the outfall could, in
theory, occur. Nevertheless, heavy metal concentrations at the outfall would
be very low due to the cooling water dilution, and below DM regulations.
These metals are also normal constituents of the sea (even if in low
concentrations) and are not of great concern except in extreme occurrences.
If bioaccumulation would occur, it would be locally.
• Thermal Impacts
The use of seawater will result in a discharge seawater temperature will

CHAPTER 5
Environmental Impact Assessment
5-18 EIA study for the proposed Jebel Ali Power and Desalination Station M
comply DM Standards. This small change in seawater temperature should not
be of concern for the marine environment, keeping in mind the choice of the
outfall location and design for the initial dilution.
Based on the above discussion, the overall is rated as per given below:
Impact Rating Brine from Desalination Plant
Nature of impact Adverse
Duration of impact Long term
Impacted Area Localized
Likelihood of occurrence High
Severity of impact Low
Significance of impact Minor
5.3.4 Impact on Noise Levels
Noise will be generated during operation of the plant, the main noise emitters
being the pumps, compressors, turbines etc. The entire plant will be designed
to meet the limits set by the Dubai Municipality for noise emission from
premises. Appropriate acoustics enclosures will be installed to reduce noise
levels at the project site and in the surroundings.
The designed noise levels for the pumps and compressors shall be less than
85 dB (A) at 1.0 m distance.
In order to predict the incremental noise due to the operation of the above
units, noise modeling has been carried out. The model does not take into
account the background noise levels. The predicted noise levels at the
boundary of the plant in different directions are given in Table-5.6. The

CHAPTER 5
Environmental Impact Assessment
5-19 EIA study for the proposed Jebel Ali Power and Desalination Station M
predicted noise values calculated in the model were found to be well within
Dubai Municipality limits.
TABLE - 5.6
PREDICTED NOISE LEVELS AT PLANT BOUNDARY
Sr. No. Direction Noise Levels dB(A)
1 N 50
2 NE 52
3 E 50
4 SE 48
5 S 48
6 SW 48
7 W 50
8 NW 48
The predicted maximum incremental noise levels occur at western boundary
of the plant along the sea coast. The noise levels further falls below 46 dB(A)
at distance of 200 m from the boundary. The other three side of the plant
boundary the existing power stations are located. The impact rating is given
below;
Impact Rating Noise Level
Nature of impact Adverse
Duration of impact Long term
Impacted Area Localized
Likelihood of occurrence High
Severity of impact Low
Significance of impact Insignificant

CHAPTER 5
Environmental Impact Assessment
5-20 EIA study for the proposed Jebel Ali Power and Desalination Station M
FIGURE-5.1
NOISE DISPERSION CONTOURS
5.3.5 Impact on Social Life
In the operational phase the Project will provide full time employment for
about 200 employees and managerial staff. This will be beneficial to the
society.

CHAPTER 5
Environmental Impact Assessment
5-21 EIA study for the proposed Jebel Ali Power and Desalination Station M
Impact Rating Socio-Economic
Nature of impact Beneficial
Duration of impact Long term
Impacted Area Localized
Likelihood of occurrence High
Severity of impact Moderate
Significance of impact Significant
5.3.6 Impact on Cultural Heritage
Emissions of gases NOX may have adverse effects on cultural heritage due to
their corrosive nature. However, the proposed Desalination Plant ‘M’ will be
fired solely with natural gas during normal operation. NOX emissions will be
considerably reduced by means of low NOX combustion chambers. The
maximum predicted incremental concentrations of NOX are falling within 1-km
from the plant site. The noise levels will also not adversely affect area beyond
500 m from the plant site. There are no sites with cultural heritage importance
and residential townships within 1-km from the plant boundary.
Impact Rating Cultural Heritage
Nature of impact Adverse
Duration of impact Long term
Impacted Area Localized
Likelihood of occurrence Low
Severity of impact Low
Significance of impact Insignificant
5.3.7 Impacts on Terrestrial Ecology
The site is barren and sandy. The terrestrial flora and fauna do not exist in the
surrounding of the project site. Therefore, the impact on the terrestrial ecology

CHAPTER 5
Environmental Impact Assessment
5-22 EIA study for the proposed Jebel Ali Power and Desalination Station M
is not envisaged.
Impact Rating Terrestrial Ecology
Nature of impact Adverse
Duration of impact Long term
Impacted Area Localized
Likelihood of occurrence Very Low
Severity of impact Very Low
Significance of impact Insignificant
5.3.8 Solid Waste
In settling tank of the potable water treatment plant, dissolved and suspended
solids are settled at the bottom in the form of sludge. The sludge from the tank
is removed and dumped in the sludge drying beds located within the plant
premises. This sludge will be non-hazardous in nature and no adverse impact
is envisaged on the surrounding.
The sea water is screened at the initial stage to remove debris. This debris
will be collected in the skip and sent for disposal through authorized
transporter to disposal site of DM. Therefore, the impact on the surrounding
will be insignificant.
Impact Rating Solid Waste
Nature of impact Adverse
Duration of impact Long term
Impacted Area Localized
Likelihood of occurrence High
Severity of impact Low
Significance of impact Minor

CHAPTER 6
Proposed Mitigation Measures
6-1
EIA study for the proposed Jebel Ali Power and Desalination Station M
6.1 Preamble
The proposed Power and Desalination Plant ‘M’ will be constructed and
operated according to high environment, health and safety (EHS) standards.
This section provides a summary of mitigation measures, as well as
environmental enhancement opportunities, for the key EHS impacts which
have been identified through the EIA.
The mitigation, monitoring and management measures proposed below, shall
be adopted by M/s Doosan and M/s Fisia and imposed as conditions of
contract on any sub-contractors employed to build or operate any part of the
proposed plant. Many of the mitigation measures presented are considered as
essential, integrated components of the construction and operation works.
6.2 Mitigation Measures during Design and Construction
6.2.1 Dust Emissions
Dust generated by construction activities could be significant locally during fill
sand hauling operations. To minimize dust nuisance, certain good site
practices will be employed as follows:
• Roads will be kept damp through use of water bowsers where applicable;
• Stockpiles of friable materials will be sited and maintained appropriately
(including the use of sheets) so as to minimize dust blow (such as
balancing of cut and fill operations);
• Drop heights for material transfer activities such as loading and unloading
of materials shall be minimized;
• The construction phase will begin with the construction of access roads;

CHAPTER 6
Proposed Mitigation Measures
6-2
EIA study for the proposed Jebel Ali Power and Desalination Station M
• Roads created during construction shall be compacted adequately;
• Regular water shall be sprinkled on the roads and at work place;
• Access into the site will be regulated;
• The vehicles carrying construction material like sand, soil, boulders,
cement etc. shall be properly covered.
In addition, to ensure that pollutant levels resulting from transport operations
are kept to a minimum during construction activities, all vehicles being used
on site will meet pollutant emission standards.
The role and responsibilities of the project proponent are given in Table 6.1
TABLE 6.1
ROLE AND RESPONSIBILITIES OF THE PROJECT PROPONENT
Personnel Key Responsibilities
HSE Manager
(Consultant)
To undertake regular site inspection and environmental
parameters to assess to assign corrective actions where
required.
To manage environmental monitoring program
To liaise with Dubai Municipality about all
environmental issues and compliance/non-compliance
with the EMP.
Environmental
Officers
(Contractors)
Provide method statements and ensure compliance with
relevant aspects of the EMP to consultant HSE Manger
Carry out daily inspection of operations
Conduct Day-to-day implementation of the EMP
specifications
Ensuring that all construction staff understand and
adhere to the EMP

CHAPTER 6
Proposed Mitigation Measures
6-3
EIA study for the proposed Jebel Ali Power and Desalination Station M
6.2.2 Noise Emissions
Specific noise mitigation measures for the construction phase reflect standard
good site management practices and include:
• Enforcement of vehicle speed limits, orderly movement of the vehicles
within the site;
• The vehicles and construction equipment will be equipped with effective
silencers;
• Activities with highest noise emissions (e.g. piling) will be undertaken only
during the daytime; and
• Personnel working at site will be provided with hearing protection.
6.2.3 Flora and Fauna
Impacts on flora and fauna during construction are not considered to be
significant since the site is devoid of vegetation.
However, species on or close to the site may be disturbed and displaced as a
result of increased noise, dust and human activity. Good site management
practices as discussed elsewhere in this section, and implementation of the
following mitigation measures, will ensure that any disturbance is reduced to a
minimum:
• Run-off from construction activities will be collected and disposed to
ensure that surrounding species/habitats are not significantly affected;
• Vehicles will be restricted to within the boundaries of the construction site,
lay down areas and hauling / access roads, arid will not be permitted to
enter surrounding land.

CHAPTER 6
Proposed Mitigation Measures
6-4
EIA study for the proposed Jebel Ali Power and Desalination Station M
6.2.4 Traffic and Transport
Construction activities will generate only limit additional traffic on local roads.
No significant volumes of heavy plant traffic and occasional abnormal loads
are foreseen, as transport of heavy and bulky items is done by boat or barge.
However, to minimize any inconvenience, hazards and damage caused to
other road users, local people and the local road network, the following
mitigation and management measures will be implemented:
• Any abnormal load movements will be confirmed with the Competent
Administrative Authority (CAA) and will adhere to prescribed routes. Their
movement will be scheduled to avoid peak hours and notices will be
published in advance to minimize disruption if required by the CAA;
• Consideration will be given to staggering construction shifts to split arrival
and departure times;
• Scheduling of traffic will be undertaken to avoid the peak hours on the
local road network wherever practicable; and
• Construction workers will be transported to the site by contract bus.
6.2.5 Socio-economic effects
The construction activities will have an overall positive impact on the local
economy. Given that the use of locally available labor will be prioritized during
construction, no mitigation measures are proposed.
6.2.6 Archaeology
No sites of archaeological or cultural heritage importance on or around the
site are expected. In any case, construction works will therefore be monitored
to ensure that in the event of remains being found construction activities will

CHAPTER 6
Proposed Mitigation Measures
6-5
EIA study for the proposed Jebel Ali Power and Desalination Station M
be stopped and the responsible authority are consulted on the appropriate
measures, which could include the following:
• Where possible, remains will be protected in-situ from construction
activities, by relocating non essential activities;
• Where identified remains cannot be protected, an excavation of the
indicated area will be undertaken prior to the commencement of
construction activities to record and remove vulnerable remains and
features
6.2.7 Solid Wastes during Construction
To ensure that impacts from solid waste generation and disposal are
successfully avoided, the following mitigation measures will be undertaken
during plant construction:
• All waste taken off site will be carried out by a licensed waste contractor
and DEWA will audit the disposal procedure;
• All solid waste will be segregated into different waste types, collected and
stored on site in designated storage facilities and areas prior to release to
off-site disposal facilities;
• All relevant consignments of waste for disposal, will be recorded,
indicating their type, destination and other relevant information, prior to
being taken off site; and
• Standards for storage area, management systems and disposal facilities
will be agreed with the relevant parties.
An engineer with responsibility for environmental aspects will be responsible
for solid waste management at the site and will ensure that all wastes are
managed to minimize any environmental risks.

CHAPTER 6
Proposed Mitigation Measures
6-6
EIA study for the proposed Jebel Ali Power and Desalination Station M
6.2.8 Occupational Health and Safety
The project owner will ensure that construction activities are undertaken in a
manner which does not present hazards to workers' health and safety. In
particular, the project company shall establish and integrate policies and
procedures on occupational health and safety into the construction of the
desalination plant. Emergency and accident response procedures shall also
be included in the safety manual of M/s Fisia
The following measures will be carried out in both the construction and
operational phases:
• Compliance with international standards for good practice;
• Adherence to local and international guidance and codes of practice on
Environment, Health and Safety (EHS) management:
• Management, supervision, monitoring and record-keeping as set out in the
plants operational manual;
• Implementation of EHS procedures as a condition of all contracts;
• Clear definition of the EHS roles and responsibilities of the companies
contracted to work on site and to all their individual staff (including the
nomination of EHS supervisors and coordinator);
• Pre-construction and operation assessment of the EHS risks and hazards
associated with construction and operation, including consideration of
local cultural attitudes, education level of workforce and local work
practices;
• Provision of appropriate training on EHS issues for all employees on site,
including initial induction and regular refresher training, taking into
account local cultural issues;
• Provision of health and safety information;
• Regular inspection, review and recording of EHS performance; and
• Maintenance of a high standard of housekeeping at all times.

CHAPTER 6
Proposed Mitigation Measures
6-7
EIA study for the proposed Jebel Ali Power and Desalination Station M
6.3 Mitigation Measures during Operation
6.3.1 Introduction
Mitigation measures introduced into the design and construction phase of the
proposed project will be carried forward into the operational phase by the
Operating Company. Many mitigation measures, as described in this report,
have already been integrated into the design of the proposed project in order
to minimize any operational impacts on the environment. Mitigation measures
such as, noise silencers and water discharge controls are for example
considered integral part to the design of the desalination plant.
The following section builds on the design criteria for the proposed project in
order to reduce to a minimal level any further potential negative impacts.
Areas where positive impacts can be introduced or maximized are also
considered.
The core responsibilities of the Environmental Department for the operational
phase are shown in Table 6.2
Table 6.2
Responsibilities of Environmental Team during Operational Phase
HSE
Department
To ensure compliance of marine discharge
To respond and report on environmental incidents
To manage environmental monitoring program.
To monitor annual environmental targets
To implement a marine spill response plan
To publish State of the Environment Report
To promote environmental awareness and clean
neighborhood policy
CHAPTER 6
Proposed Mitigation Measures
6-8
EIA study for the proposed Jebel Ali Power and Desalination Station M
6.3.2 Air Quality during operation
6.3.2.1 Emissions Guidelines
Several specific measures have been taken to reduce boiler stack emissions
from the proposed project and to comply with Dubai and World Bank
standards. The proposed plant will be fired on natural gas as its fuel which is
the least polluting fuel available. In order to reduce NOX emissions, low-NOx
burners will be installed. In addition, a stack measuring adequate hight has
been designed to allow adequate dispersion of emissions into the surrounding
atmosphere.
6.3.2.2 Air Quality Guidelines
To investigate the issue of atmospheric emissions from the desalination plant
and their impact on ambient air quality, dispersion modeling has been
undertaken and the results of the modeling were presented earlier in Section
5. The modeling clearly Shows that the predicted maximum 24 hour mean
max ground levels of NO2 concentrations, do not exceed the Dubai, World
Bank and WHO ambient air quality guidelines.
No further requirement for mitigation of the emissions to air from the
desalination plant is proposed.
6.3.3 Noise Emissions during Operation
A number of noise mitigation measures will be implemented in order to ensure
the lower noise levels well within the local and international noise standards.
Specific design mitigation measures include:

CHAPTER 6
Proposed Mitigation Measures
6-9
EIA study for the proposed Jebel Ali Power and Desalination Station M
• Air compressors are equipped with air silencers; and
• Noisy outdoor equipment will be designed to a noise limit of 85 dB(A) at
one meter a stance.
All personnel working in noisy areas will be required to wear hearing
protection.
6.3.4 Flora and Fauna during Operation
The potential impacts of the proposed development on any existing flora and
fauna will be minimized as a result of the following mitigation measures:
• Vehicles will be restricted to within the boundaries of the site and access
roads, and will not be permitted to enter surrounding land.
• Noise will be controlled during operation, and will dissipate rapidly with
distance from source. Any disturbance during operation will therefore be
localized.
6.3.5 Visual Impact during Operation
A green belt with trees around the project boundary (where technically
permissible) will assure the improved aesthetic and help in shielding the the
technical structure. This will also help to reduce the noise levels to some
extent.
6.3.6 Solid Waste Impacts during Operation
To ensure that impacts from solid waste generation and disposal are
successfully avoided, the following mitigation measures will be undertaken
during plant operation:

CHAPTER 6
Proposed Mitigation Measures
6-10
EIA study for the proposed Jebel Ali Power and Desalination Station M
• All the waste taken off site will be carried out by a licensed waste
contractor and DEWA will audit the disposal procedure;
• All solid waste will be segregated into different waste types, collected and
stored on site in designated storage facilities and areas prior to release to
off-site disposal facilities;
• All relevant consignments of waste for disposal will be recorded, indicating
their type, destination and other relevant information, prior to being taken
off site; and
• Standards for storage area, management systems and disposal facilities
will be agreed with the relevant parties.
An engineer with responsibility for environmental aspects will be responsible
for solid waste management at the site and will ensure that all wastes are
managed to minimize any environmental risks.
6.3.7 Health and Safety during Operation
The following mitigation and management measures will ensure that the
health and safety of staff and any visitors on and to the site is not jeopardized
during operation of the plant:
• Further development and implementation of an Operational Health and
Safety Plan with appropriate training;
• Provision of training in use of protection equipment and chemical handling;
• Clear marking of work site hazards and training in recognition of hazard
symbols;
• Installation of vapour detection equipment and control systems;
• Further development of site emergency response plans;
• All personnel working or standing close to noisy equipment will be required
to wear noise protectors.
CHAPTER 6
Proposed Mitigation Measures
6-11
EIA study for the proposed Jebel Ali Power and Desalination Station M
In addition, the operational health and safety measures during construction
described in Section 6.3.7 above will be carried forward into the operational
phase of the desalination plant.
6.4 Environmental Monitoring Program
The environmental monitoring is very essential during operation of the project.
This will help to assess the efficacy of the pollution control equipment. The
monitoring includes the following:
• Ambient air quality in and around the project site;
• Stack monitoring to assess the gaseous emission with respect to
concentration of the pollutants, flow, temperature etc.
• Marine water quality at intake and at final discharge point;
• Ambient noise levels around the plant boundary;
• The noise levels of the major equipment at 1- distance;
• Assessment of quality and quantity of the solid waste;
The flue gas will be monitored continuously by automatic operating monitoring
equipment. The ambient air pollutants NO2, SO2, Particulate Matter, as well as
the required reference parameters Flue gas shall be monitored.
Temperature, Oxygen Content and Pressure will be measured. The
monitoring results will be transmitted to the Main control and supervision
system of the plant (DCS) and evaluated by responsible environmental
engineers by means of computer facilities for selective evaluation of emission
data.
Additionally flue gas samples can be tapped from the stacks from special
platforms providing safe access to the tapping points.

CHAPTER 6
Proposed Mitigation Measures
6-12
EIA study for the proposed Jebel Ali Power and Desalination Station M
Analyses will be performed on regular basis by the plant's laboratory or
specialized outside laboratories.
The parameters to be monitored during construction period are given in
Table-6.3 and the parameters to be monitored during operation are given in
Table-6.4.
TABLE 6.3
ENVIRONMENTAL MONITORING DURING CONSTRUCTION PERIOD
Sr.
No.
Environmental
Attributes Locations Parameters Frequency
3 Locations NOX, SO2, CO, SPM 24 hourly twice a week 1
Ambient air
quality 2 Locations Heavy Metals, Ozone Quarterly
Industrial noise 5 locations plant
equipment Leq Once in every year
2
Ambient noise 5 locations for ambient
noise level
Leq 24 hr continuous with
hourly Leq Once in every year
3 Water quality 2 locations
Salinity, temperature, pH,
DO, BOD, suspended solids,
total nitrogen, total
phosphorous, Ammonical
nitrogen, nitrate, nitrite,
bacteria (Coliforms),
chlorophyll a.
Monthly once
4 Solid waste 1 location Physicochemical At the time of the
disposal
5 Sanitary effluent 1 Location TSS, DO and BOD At the time of the
disposal
6 Sediment quality 3 locations Organic carbon, total
phosphorous, petroleum
Quarterly during
construction phase

CHAPTER 6
Proposed Mitigation Measures
6-13
EIA study for the proposed Jebel Ali Power and Desalination Station M
Sr.
No.
Environmental
Attributes Locations Parameters Frequency
hydrocarbons and
selected metals- Al, Cr,
Mn, Fe, Co, Ni, Cu, Zn,
Cd, Pb and Hg.
7 Ecology 3 locations
• Phytoplankton biomass,
population and faunal
groups,
• Zooplankton biomass,
population and faunal
groups and biomass,
• Macro benthic biomass,
population and faunal
groups
Monthly during
construction phase
8
Occupational
Health and
Safety
Workers in potentially
hazardous workplaces Health status Once in a year
TABLE 6.4
ENVIRONMENTAL MONITORING PROGRAMME DURING OPERATION PERIOD
Sr.
No.
Environmental
Attributes Locations Parameters Frequency
1 Ambient air
quality Three Locations
NOX, SO2, CO, SPM
24 hourly Once a
week
2 Stack
emissions Each Unit
NOX
Continuous
3 Water quality 3 locations
Salinity, temperature, pH,
DO, BOD, suspended
solids, total nitrogen, total
Quarterly once

CHAPTER 6
Proposed Mitigation Measures
6-14
EIA study for the proposed Jebel Ali Power and Desalination Station M
Sr.
No.
Environmental
Attributes Locations Parameters Frequency
phosphorous, Ammonical
nitrogen, nitrate, nitrite,
bacteria (Coliforms),
chlorophyll a.
Plant effluents One Location
pH, Temperature, TSS,
TDS, Total Residual
Chlorine, Oil and Grease
At the time of the
disposal 4
Sanitary
effluent One Location TSS, DO and BOD
At the time of the
disposal
Industrial noise 6 locations plant
equipment Leq Once in six months
5
Ambient noise Four locations for
ambient noise level
Leq 24 hr continuous with
hourly Leq Once in year
6 Sediment
quality 3 locations
Organic carbon, total
phosphorous, petroleum
hydrocarbons and selected
metals- Al, Cr, Mn, Fe, Co,
Ni, Cu, Zn, Cd, Pb and Hg.
Twice in a year
7 Ecology 3 locations
• Phytoplankton biomass,
population and faunal
groups,
• Zooplankton biomass,
population and faunal
groups and biomass,
• Macro benthic biomass,
population and faunal
groups
Quarterly once
8
Occupational
Health and
Safety
Workers in potentially
hazardous workplaces Health status Once in a year

CHAPTER 6
Proposed Mitigation Measures
6-15
EIA study for the proposed Jebel Ali Power and Desalination Station M
6.5 Hazard Protective Measures
Any upset operation of the turbine generators, steam turbine, auxiliary boiler,
evaporators etc. will lead to an electrical trip and as a consequence to a shut
down of the natural gas supply. Therefore it will not cause a rise of emissions.
The stack emissions are continuously analyzed and monitored by automatic
equipment. Additional sample extraction points are provided.
The operation of the waste water treatment systems will be controlled and
monitored continuously.
All effluents from the several waste water treatment systems are analyzed
periodically to detect any upset operation.
Spillage of chemicals and oily liquids, possibly diluted with water, will be
collected to be treated at site or disposed according to the environmental
protection requirements of the Dubai Municipality, if a treatment at site is not
feasible.

Summary of Operating condition at main and bypass Stack
1.0 General
1.1 Operating Case STG Max.RCR
Base
NCR1
BaseNCR2 NCR3
NCRev
100
NCRo
100
MNCR
Base
STG
MCR
MIN
GT30%
MIN
GT30%
1.2 GT Load % 100 100 100Around
81%
Around
79%100 100 100 30 30
1.3 Ambient Temperature oC 50 50 32 22 10 50 50 50 50 10 50
2.0 Bypass Stack Outlet Condition
2.1 GT Exhaust gas mass flow rate kg/s 607.10 607.10 624.00 578.59 601.45 563.10 571.19 607.10 607.10 379.60 356.50
GT Outlet Gas Temp. oC 601.2 601.2 594.9 577.0 558.8 613.8 604.1 601.2 601.2 558.8 552.6
GT Exhaust gas composition *1) *1)
O2 Vol % 12.04 12.04 12.44 12.99 13.17 12.40 11.45 12.04 12.04 14.48 14.48
N2 Vol % 71.85 71.85 73.21 74.25 74.72 72.63 70.51 71.85 71.85 73.33 73.33
CO2 Vol % 3.83 3.83 3.81 3.67 3.65 3.75 5.13 3.83 3.83 2.76 2.76
SO2 Vol % 0.0002 0.0002 0.0002 0.0002 0.0002 0.0002 0.0194 0.0002 0.0002 0.0002 0.0002
H2O Vol % 11.43 11.43 9.67 8.21 7.59 10.37 12.07 11.43 11.43 8.57 8.57
Ar Vol % 0.84 0.84 0.86 0.87 0.88 0.85 0.83 0.84 0.84 0.86 0.86
GT Exhaust gas density kg/m^3 0.4001 0.4001 0.4046 0.4143 0.4239 0.3952 0.4021 0.4001 0.4001 0.4207 0.4239
GT Exhaust gas velocity at
Stack Mouthm/s 39.4 39.4 40.1 36.3 36.9 37.0 36.9 39.4 39.4 23.4 21.9
2.2 Emission
NOx ppmvd @15%O2 25 25 25 25 25 25 25 25 25 25 25
NOx mg/Nm3 @15%O2 50 50 50 50 50 50 50 50 50 50 50
CO ppmvd @15%O2 15 15 15 15 15 15 15 15 15 15 15
CO mg/Nm3 @15%O2 19 19 19 19 19 19 19 19 19 19 19
Particle mg/Nm3 @15%O2 5 5 5 5 5 5 5 5 5 5 5
Smoke Density Bacharach 1 1 1 1 1 1 1 1 1 1 1
3.0 Main Stack Outlet Condition
3.1 Duct Burner fuel type NG NG NG - - NG - NG NG NG NG
3.2 Fuel Heating Value (LHV) kJ/kg 45,300 45,300 45,300 - - 45,300 - 45,300 45,300 45,300 45,300
3.3 Duct Burner fuel mass flow kg/s 1.2310 1.3080 0.5560 - - 1.5610 - 1.3083 1.3083 3.6800 2.8100
3.5 Duct Burner Heat Input MW 55.76 59.25 25.19 - - 70.71 - 59.27 59.27 166.70 127.29
3.1 Exhaust gas mass flow rate kg/s 608.33 608.41 624.56 578.59 601.45 564.66 571.19 608.41 608.41 383.28 359.31
Exhaust gas temperature oC 110.0 121.5 122.5 125.1 126.6 120.7 149.5 123.1 112.5 120.0 120.0
Exhaust gas composition
O2 Vol % 11.35 11.31 12.14 12.99 13.17 11.46 11.45 11.31 11.31 11.35 11.58
N2 Vol % 71.54 71.52 73.02 74.25 74.72 72.22 70.51 71.52 71.52 71.54 72.27
CO2 Vol % 4.16 4.18 3.96 3.67 3.65 4.20 5.13 4.18 4.18 4.16 4.10
SO2 Vol % 0.0002 0.0002 0.0002 0.0002 0.0002 0.0002 0.0194 0.0002 0.0002 0.0002 0.0002
H2O Vol % 12.03 12.07 9.94 8.21 7.59 11.20 12.07 12.07 12.07 12.03 11.12
Appendix 2
Page 1 of 2

