environmental impact of road freight transport in 2020 · environmental impact of road freight ......
TRANSCRIPT

Environmental Impact of Road Freight Transport in 2020
M.I. Piecyk and A.C. McKinnon
August 2009
www.sml.hw.ac.uk/logisticswww.greenlogistics.org
Logistics Research Centre School of Management and Languages Heriot-Watt University Edinburgh EH14 4AS
Full Report of a Delphi Survey

Executive Summary
This report summarises the results of a Delphi survey of 100 logistics specialists
which sought their views on future freight transport and environmental trends in the
UK up to 2020. According to this panel of experts, over 50% of companies involved
in road freight transport operation are likely to see their activities affected by climate
change concerns to a significant or large extent by 2015. This proportion is expected
to rise to over 80% by 2020.
Some long-established production and logistics trends which exert a strong influence
on road freight demand, such as the centralisation of manufacturing and inventory, the
adoption of JIT replenishment and the outsourcing of non-core activities, cannot
continue indefinitely. The results of the Delphi survey reported in this paper suggest
that these trends are likely to continue at least until 2020. The following trends were
identified as most likely to occur up to 2020:
• Further relocation of production capacity to other countries.
• Increase in primary consolidation of inbound loads to manufacturing plants
and / or distribution centres.
• Significant growth in online retailing.
• Reverse logistics is likely to gain in importance with more products re-
entering the supply chains for recycling, refurbishment and resale.
• More frequent ‘out-of-hours’ operation, especially increase in proportion of
night-time deliveries.
• Growth in the use of advanced IT systems for transport planning and
management (telematics, computerised vehicle routing and scheduling, etc).
• Increase in logistical collaboration initiatives between companies.
• Greater use of online freight exchanges online and load matching services.
• Fuel prices and availability of drivers were identified as major threats to the
road freight industry.
The inter-relationships between this broad range of business trends, freight traffic
levels and related CO2 emissions are very complex. While some of the trends
predicted by the panel of experts will increase the environmental footprint of road
2

freight operations, others will have the opposite effect. Generally speaking, many of
the trends anticipated at the upper strategic, commercial and operational levels in the
decision-making hierarchy are likely to increase their environmental impact, while
those projected to occur at a functional level in the management of transport resources
will have an offsetting effect. The actual net impact of all these changes on freight-
related energy consumption and emissions is difficult to quantify. Nevertheless, an
attempt has been made to construct three possible road-freight CO2 scenarios for 2020
using the experts’ opinions to calibrate the spreadsheet-based forecasting model. The
mid-range BAU scenario indicates that the most likely outcome is a marginal
reduction in CO2 emissions from road freight transport of around 10% to 17.4 million
tonnes per annum. This would occur despite an increase of 21% in the amount of
road freight movement above the 2007 level. Substantial improvements in vehicle
utilisation and fuel efficiency and shifts to alternative transport modes and lower
carbon fuels would more than offset the effect of this growth in road tonne-kms on
CO2 emissions.
The optimistic and pessimistic scenarios, defined by a one standard deviation range on
either side of the mean Delphi scores, envisage road-freight-related CO2 emissions
falling by 47% or rising by 56%. If the optimistic projection proved accurate, the GB
road freight sector would be on a trajectory that would comfortably meet the 80%
CO2 reduction that the UK government has set for the economy as a whole by 2050.
If, however, the mid-range BAU forecast is adopted, as it reflects the majority opinion
of the Delphi panellists, the road freight sector will fall well short of the necessary
‘carbon pathway’ to an 80% CO2 reduction by 2050. Government and business will
then have to intensify their efforts to decarbonise the movement of freight by road.
3

Contents
Acknowledgement ............................................................................................................... 5
Introduction......................................................................................................................... 6
1. The Delphi method.......................................................................................................... 6
2. Research design and analysis ......................................................................................... 9
2.1. Sample ....................................................................................................................... 9
2.2. Non-response bias .................................................................................................. 11
2.3. Data analysis........................................................................................................... 12
3. Survey results ................................................................................................................ 15
3.1. Importance of environmental concerns in logistical decision making .............. 15
3.2. Future trends in key logistics variables ............................................................... 16
3.3. Factors influencing environmental impact of road freight transport in 2020 . 20
Structural factors ...................................................................................................... 22
Commercial factors................................................................................................... 26
Operational factors ................................................................................................... 29
Functional factors ..................................................................................................... 30
External factors ......................................................................................................... 32
Product-related factors............................................................................................. 34
3.4. Modal split .............................................................................................................. 36
3.5. Fuel management ................................................................................................... 41
4. Effects on the carbon footprint of road freight transport in 2020 ........................... 44
5. Conclusions .................................................................................................................... 46
References:......................................................................................................................... 48
Appendix 1. Detailed results of the Delphi survey ......................................................... 52
4

Acknowledgement
The authors would like to thank all the members of the Delphi panel who contributed to this
research. Without their support the study would not have been possible. They are also
grateful to the Engineering and Physical Sciences Research Council which is funding the work
as part of the Green Logistics project. Responsibility for the rigour and accuracy of the
research rests with the authors.
5

Environmental Impact of Road Freight Transport in 2020
Introduction
This report summarises the results of a study undertaken as a part of an EPSRC-
funded project called Green Logistics. The objective of this research was to produce a
forecast of business-as-usual (BAU) trends in key logistics and supply chain variables
and associated environmental effects of road freight transport up to 2020. It
employed the Delphi method to survey the opinions of a large and varied sample of
experts on these trends.
1. The Delphi method
The Delphi method is a systematic, iterative procedure for “structuring a group
communication process so that the process is effective in allowing a group of
individuals, as a whole, to deal with a complex problem” (Linstone and Turoff, 2002,
p.3). A Delphi survey usually involves sending a first-round questionnaire to a
number of respondents, collating and analysing the data and then re-circulating the
questionnaire accompanied by a summary of results. The experts are asked to confirm
or modify their previous responses. This procedure is repeated for a pre-determined
number of rounds or until a desired degree of consensus has been reached or response
rates dwindle (Rowe and Wright, 1999, Hasson et al., 2000, Linstone and Turoff,
2002, Mullen, 2003, Okoli and Pawlowski, 2004, Hsu and Sandford, 2007a).
The three main characteristics of the Delphi method are as follows (Woudenberg,
1991, Gupta and Clarke, 1996, Rowe and Wright, 1999, Linstone and Turoff, 2002,
Loo, 2002, Landeta, 2006):
• Anonymity of participants – typically experts are approached by mail or
computer and they remain anonymous to the other members of the panel. The
anonymity of participants eliminates the problems associated with group
decision making.
• Iteration – there are several rounds of consultation and thus a narrowing of
the initial range of opinion.
• Feedback – in the second or subsequent round, the results of the whole group
on the previous round are analysed and fed back to the experts in a statistical
format.
© M.I. Piecyk and A.C. McKinnon 6
Environmental Impact of Road Freight Transport in 2020
The Delphi method is a popular forecasting technique that can be applied to a wide
range of research problems and disciplines. In the 1950s it was used by the RAND
corporation as a means of expert-supported military decision-making, particularly
with reference to planning and developing new technology (Rieger, 1986, Loo, 2002).
Since then the Delphi technique has been widely recognised as a means of supporting
decision-making processes through the development of more reliable forecasts
(Landeta, 2006). It has been applied across disciplines and extensively used in
planning and policy-making, long- range forecasting and decision support in both
private and public sectors.
The Delphi method has been relatively widely applied in the field of logistics and
supply chain management, mainly to the forecasting of future logistics trends, at
different geographical, industrial and operational levels. To date it has been used to
predict changes in the physical distribution of food products in the UK (Walters, 1975,
1976), project future directions in distribution systems, logistics and supply chain
management at a national and European level (Cranfield School of Management,
1984, Cooper, 1994, McKinnon and Forster, 2000, Runhaar et al., 2002, Ogden et al.,
2005), as well as to investigate factors affecting location decisions in international
operations (MacCarthy and Atthirawong, 2003). In the most recent studies the Delphi
method was used to investigate factors crucial for supply chain flexibility (Lummus et
al., 2005) and to project the future of supply chain management up to 2011 (Melnyk et
al., 2008).
As the main objective of the current research is to construct a baseline BAU scenario
of freight transport futures, forecasting based on expert opinion has been identified as
the most suitable approach. It has the major advantage of rooting the forecasts in a
detailed understanding of the underlying causes of freight traffic growth and its
environmental impact. A Delphi questionnaire survey was chosen as a formal means
of capturing and consolidating expert judgment. In order to increase the reliability of
the forecast a large panel of experts has been consulted. A structured questionnaire
has been used to enable statistical analysis of the responses. The results have been
used to construct future scenarios of developments in the road freight transport system.
An advantage of using scenarios is that it assesses possible future trajectories for a
range of variables and attempts to determine their likely consequences (Firth, 1977). It
© M.I. Piecyk and A.C. McKinnon 7

Environmental Impact of Road Freight Transport in 2020
can take account of the interrelationship between the variables. It is believed that a
real-world expert outlook on future developments in logistics and supply chain trends
and analysis of their underlying causes will help to maximise the credibility and
accuracy of the forecasts produced by this research.
The Delphi method has been selected as the most appropriate means of achieving the
purpose of this study for a number of reasons. Firstly, due to the recent breaks in the
statistical data series, extrapolatory forecasting methods could not be applied without
a great deal of uncertainty about the accuracy of results. Qualitative forecasting was
considered as a more reliable alternative. The opinions expressed by specialists
directly involved in distribution and supply chain activities and, hence, contributing to
the future direction of the key logistics variables, were regarded as the best available
indicators of prospective developments in road freight transport operation. In order to
maximise accuracy of the forecast and to get a broad spectrum of perspectives a large
and diverse panel of experts was consulted. The survey was used to collect
quantitative estimates of the strength and directions of the trends in the series of key
logistics ratios. It also permitted statistical analysis of panellists’ projections. The aim
was to build the best available forecast based on the available expert evidence. The
Delphi survey dataset permits not only the estimation of an average projected value
for each variable but also, based on differences in opinion, the construction of a
number of scenarios to reflect alternative future changes in the key ratios.
© M.I. Piecyk and A.C. McKinnon 8

Environmental Impact of Road Freight Transport in 2020
2. Research design and analysis
The survey was organised by the Logistics Research Centre at Heriot-Watt University
between January and August 2008. A web-based questionnaire was designed for the
purpose of the study. Within the time allocated for the survey, it was possible to
achieve one iteration of results.
2.1. Sample
A sampling frame of approximately 600 specialists was constructed on the basis of
previous surveys, participation in workshops and networking with professional and
trade bodies. From this ‘population’, a stratified sample was drawn to reflect the
shares of seven different types of organisation involved in logistics: producers,
retailers, logistics service providers, public policy-makers, trade organisations,
consultants and researchers. As the main objective of the Delphi study was to produce
a reliable forecast based on expert judgement, only those specialists considered to
have sufficient knowledge and experience of the subject were selected. An invitation
to join the Delphi panel was emailed to 347 potential participants. In the first round
100 invitees filled in the questionnaire giving an overall response rate of 29%.
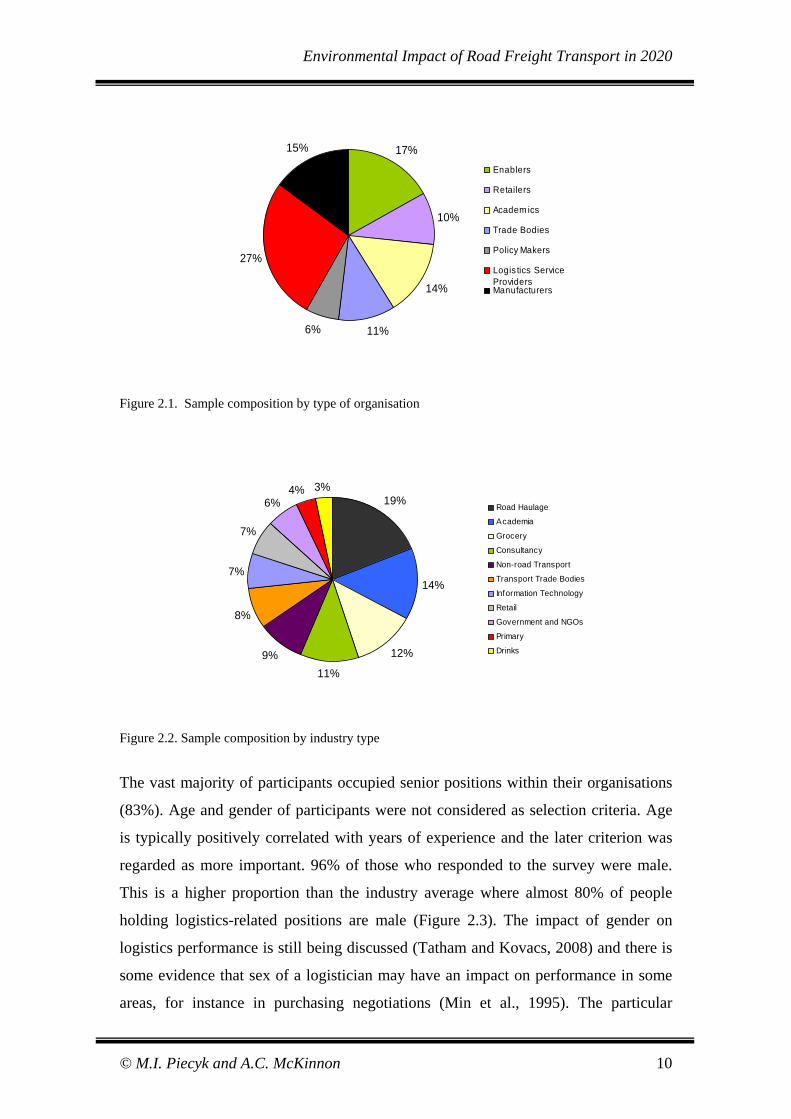
Figures 2.1 and 2.2 show the composition of the sample by type of organisation and
industry. In the second round, the participants were sent the questionnaire again but
this time annotated with a mean panel response from the first round and their previous
responses. They were offered an option to modify their answers in the light of the
first-round results. They were also informed that if they did not fill in the
questionnaire again it would be assumed that they did not wish to alter their first
round responses. 66 participants filled in the questionnaire again, 59 of whom
changed at least one answer in almost all cases increasing the degree of consensus.
The average standard deviation of the responses declined between the rounds by 9%.
© M.I. Piecyk and A.C. McKinnon 9
Environmental Impact of Road Freight Transport in 2020
17%
10%
14%
11%6%
27%
15%
Enablers
Retailers
Academ ics
Trade Bodies
Policy Makers
Logis tics ServiceProvidersManufacturers
Figure 2.1. Sample composition by type of organisation
19%
14%
12%
11%9%
8%
7%
7%
6%4% 3%
Road Haulage
Academia
Grocery
Consultancy
Non-road Transport
Transport Trade Bodies
Information Technology
Retail
Government and NGOs
Primary
Drinks
Figure 2.2. Sample composition by industry type
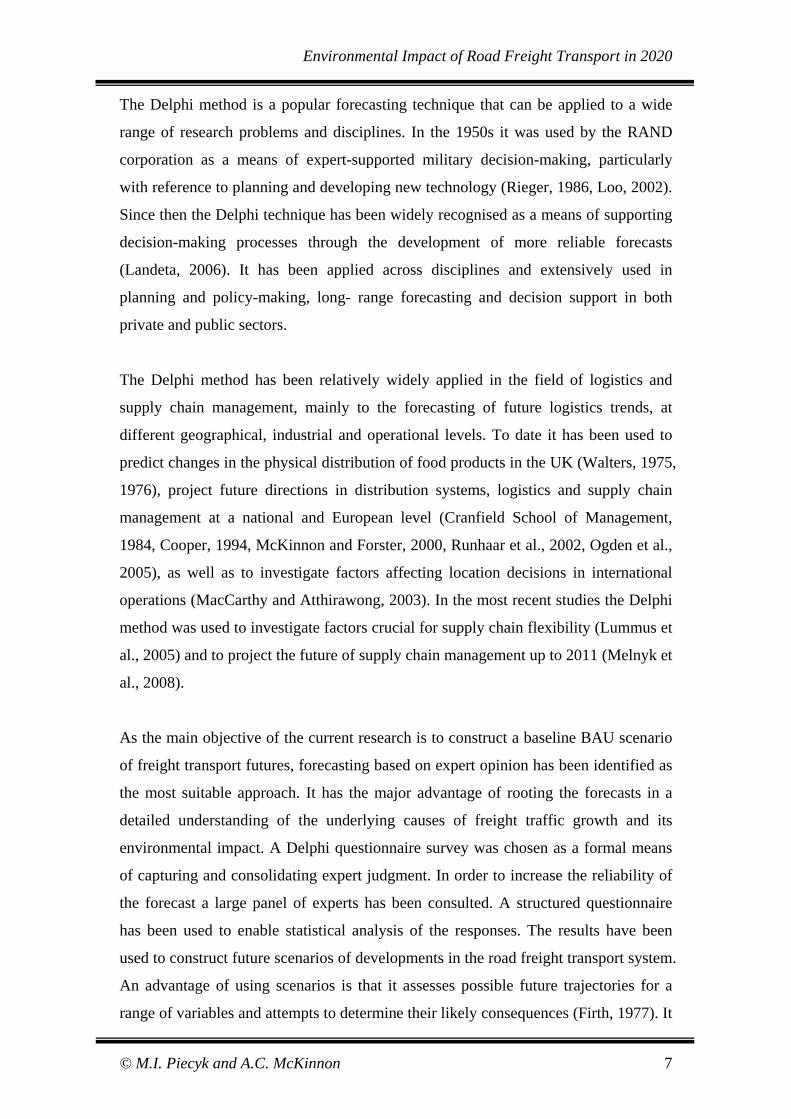
The vast majority of participants occupied senior positions within their organisations
(83%). Age and gender of participants were not considered as selection criteria. Age
is typically positively correlated with years of experience and the later criterion was
regarded as more important. 96% of those who responded to the survey were male.
This is a higher proportion than the industry average where almost 80% of people
holding logistics-related positions are male (Figure 2.3). The impact of gender on
logistics performance is still being discussed (Tatham and Kovacs, 2008) and there is
some evidence that sex of a logistician may have an impact on performance in some
areas, for instance in purchasing negotiations (Min et al., 1995). The particular
© M.I. Piecyk and A.C. McKinnon 10

Environmental Impact of Road Freight Transport in 2020
characteristics of female logistics executives have already been investigated (Cooper
et al., 2007) as yet there has been no attempt to compare them with those of male
logistics professionals. Given the lack of evidence that gender is a significant
differentiation factor in the logistics profession, the gender criterion was not
considered to be relevant for this research.
Figure 2.3. Employment in logistics-related jobs, by gender. Source: (Dickerson et al., 2008).
2.2. Non-response bias
The data from both rounds was entered into a statistical software package (SPSS 16.0)
for analysis. It was first tested for the non-response bias which may arise when the
characteristics of the respondents vary significantly from those of the non-respondents.
Most of the literature focuses on non-response to mail surveys. However, Hudson et al.
(2004) could find no evidence that the incidence of non-response bias was
significantly different in mail or Internet surveys. Non-response bias may occur even
in research with relatively high response rates (Carter and Jennings, 2002). This is of
a particular importance in case of a Delphi study where there is a need not only to
achieve a desirable response rate in the first round but also to maintain a high level of
response in the following iterations (Hsu and Sandford, 2007b). Lambert and
© M.I. Piecyk and A.C. McKinnon 11

Environmental Impact of Road Freight Transport in 2020
Harrington (1990) suggest that non-response bias can be a problem where response
rates are lower than 40%. The most common protection against this bias is to increase
response rates. This was done in the Delphi survey by sending out a follow-up emails
in each round. Additionally, in the second round a personalised questionnaire was
prepared, summarising their responses in the previous round. This helped to stimulate
their interest in the study and maintain a high level of expert involvement. The
panellists were also informed that they would be sent a report summarising the
research findings once the study was completed.
Having collected the data, one way of testing for non-response bias is to compare the
answers of early and late respondents to the survey (Diaz de Rada, 2005). Participants
who respond in later waves of the survey (e.g. after a follow-up letter) may only have
responded because of the additional stimulus and, thus, be similar to non-respondents
(Armstrong and Overton, 1977). In this study the first and last quartile of respondents
in both rounds were compared to assess the potential non-response bias. The data
collected for all survey questions was first tested for normality within the early and
late respondent groups (using normal Q-Q probability plots and Shapiro-Wilk test). A
t-test or a Mann-Whitney test was then used to compare the differences in responses,
depending on whether the distribution has proven to be normal or not. The results
suggested that the responses of the last quartile participants did not display
statistically significant differences from the responses of the first quartile participants
in both rounds. It was therefore concluded that no significant non-response bias was
present.
2.3. Data analysis
In the next stage of the analysis, the spread of data for each variable was assessed
visually by constructing histograms to detect cases with non-normal distributions (for
instance a binominal spread of responses). None of such cases were identified.
Statistical measures of central tendency and variability were calculated to summarise
the experts’ speculations. This analysis was conducted on the whole sample and then
repeated for individual respondent groups. For the purpose of inter-group comparisons
(by type of supply chain member and by industry sector) the data was tested for
normality within groups (using normal Q-Q probability plots and Shapiro-Wilk test).
Where the data was shown to be normally distributed a test for homogeneity of
© M.I. Piecyk and A.C. McKinnon 12

Environmental Impact of Road Freight Transport in 2020
variance was carried out (Levene’s test). In the case of questions where data within
groups was normal and of homogeneous variance, a one-way analysis of variance
(ANOVA) was carried out to detect whether there are significant differences in
opinion between different participant groups. Where data were not normally
distributed a non-parametric Kruskal-Wallis test was used instead of ANOVA.
For most of the questions no statistically significant differences in opinion were found
between the various respondent groups. Reference will be made later in the report to
variables on which statistically significant differences of opinion emerged.
The mean responses from the first and the second rounds were also compared to see if
there were any significant changes in experts’ attitudes between rounds. The analysis
of what happens between rounds is an important part of the process as it shows not
only whether a consensus has been reached and what the final opinion was, but also
the extent to which the opinion of the panel as a whole changed between rounds
(Greatorex and Dexter, 2000). For instance, changes in circumstances between rounds
may result in altering experts’ opinions. The survey was carried out between January
and August 2008, a period during which some important changes occurred in the
external business environment. Particularly notable were a 14% increase in the
average price of diesel fuel (European Commission, 2008) and negative press
coverage about the use of biofuel. Only very minor changes in the average opinion
were detected, however, suggesting that short-term market distortions did not
influence the long-term outlook of the logistics and supply chain professionals
consulted.
The final analysis is based on the results of the two-round Delphi study. The mean
and standard deviation values were used to project the future trends. The mean values
indicate the group opinion on both the direction of trends and their relative strength.
Standard deviation measures how widely spread the values in the data set are,
representing the amount of disagreement within the panel. The respondents were
asked what changes would occur by 2020 using the following types of questions:
• To what extent would a particular variable increase or decrease against a base
index value of 100, representing the current level?
© M.I. Piecyk and A.C. McKinnon 13

Environmental Impact of Road Freight Transport in 2020
• To what extent would a particular variable change as compared to its actual
value in 2006?
• What would be the intensity, importance or impact of future changes in a
particular variable on a five point Lickert scale?
As was noted before, the results summarised in the next part of the report are based on
the combination of the second-round responses, where participants revised their
opinions (59% of the panel) and first-round responses for the remaining 41% of
experts.
© M.I. Piecyk and A.C. McKinnon 14

Environmental Impact of Road Freight Transport in 2020
3. Survey results
The survey consisted of 21 questions, many of them multi-faceted. The experts were
asked to express their views on a number of factors that may influence supply chain
structures, modal split, vehicle management and fuel management up to 2020 and
evaluate their likely impact. The results of the survey are presented below.
3.1. Importance of environmental concerns in logistical decision making
In order to investigate the impact of global warming on supply chain practice,
participants were asked to assess to what extent concern about climate change had
forced their companies to modify their freight transport operations over the last three
years and how they expected it to affect their logistics systems in the future. The
answers for the 65% of respondents belonging to companies with a freight transport
operation were rated on a five-point Likert scale where 0 = not at all, 4 = large extent
(Figure 3.1).
0%
20%
40%
60%
80%
100%
in last three by 2010 by 2015 by 2020
0 1 2 3 4
Figure 3.1. Impact of climate change concerns on companies’ freight transport operations
In less than 40 percent of the businesses had concern about global warming influenced
freight transport operations significantly in last three years (response 3 or 4). This
percentage is expected to increase to over 80 percent by 2020. The proportion of
company transport operations on which it will have no or a very limited impact
(response 0 or 1) is likely to drop from 30 percent in last three years to 3 percent in
2020. This confirms that managers are aware of the growing scale and severity of the
© M.I. Piecyk and A.C. McKinnon 15

Environmental Impact of Road Freight Transport in 2020
climate change problem. It also highlights the need for companies to understand how
to measure and manage CO2 emissions from their road fleets.
3.2. Future trends in key logistics variables
On a macro-level, underpinning the future trend in these CO2 emissions will be the
relationship between the volume of road freight movement and economic growth.
Recent experience in the UK suggests that there has been a decoupling of economic
growth and the growth in road freight movement (Figure 3.2). Between 1997 and
2007, GDP rose by 32% in real terms while road tonne-kms grew by only 7%. If this
decoupling were to continue, it would indicate a long-term structural change in the
UK economy, in which increasing national prosperity would not generate a
proportional increase in freight traffic volumes. Stabilisation and subsequent
reduction in freight-related externalities would help to promote the sustainable
development policy advocated by the British Government and European Union
(DETR, 1999, European Commission, 2001, European Commission, 2006).
Nonetheless, it is questionable if this trend is going to endure, as recent evidence
suggests that expectations of the long-term decoupling may have been premature
(McKinnon et al., 2008).
80
90
100
110
120
130
140
150
160
1990
1991
1992
1993
1994
1995
1996
1997
1998
1999
2000
2001
2002
2003
2004
2005
2006
2007
Inde
x va
lue
(199
0 =
100)
decoupling
Gross Domestic Product(GDP)
road tonne-kms
Figure 3.2. Decoupling of economic growth and road freight transport.
© M.I. Piecyk and A.C. McKinnon 16

Environmental Impact of Road Freight Transport in 2020
The Delphi panellists were asked to rate how road tonne-kms will grow relative to
GDP up to 2020, where -2 = much slower, 0 = same rate, 2 = much faster. The mean
response was -0.5 with a standard deviation of 0.9. This indicated that freight
transport activity will continue to grow at a slower pace than economic performance.
However, this decoupling may not be strong enough to achieve major reductions in
the environmental impact of freight transport.
Next, experts were asked to indicate if total freight tonne-kms are going to increase or
decrease by 2020 against a base index value of 100, representing the current situation.
The average response was 127 with a standard deviation of 21. This suggests that total
tonne-kms will rise from 255 billion in 2007, (Department for Transport, 2008a) to
325 billion tonne-kms in 2020.
Table 3.1. Projected changes in supply chain structure and vehicle utilisation
How are the following road freight parameters likely to change between now and 2020? Now 2020
(Mean) Standard deviation
Average length of haul (km) 87 85.7 15.0 Handling factor 3.4 3.4 0.7 Lading factor (%) 57 64.4 5.8 Empty running (%) 27 21.9 4.3
Supply chain structure and vehicle utilisation strongly influence the environmental
performance of road freight transport sector. Supply chain structure is determined by
the number of links and their average length. The number of links in the supply chain
is measured crudely by handling factor which is a ratio of the tonnes-lifted to the
actual weight of goods produced or consumed. However, very limited data are
available on the weight of goods produced and consumed (McKinnon, 2003). An
approximate handling factor was calculated by dividing the tonnes-lifted estimate for
2006 (Department for Transport, 2008b) by corresponding material flow value
published in the UK National Accounts (Office for National Statistics, 2008). Vehicle
utilisation is measured by the lading factor and percentage of empty running. The
lading factor is a ratio of the tonne-kms that a vehicle actually carries to the tonne-
kms it could have carried if it was running at its maximum gross weight. Empty
running is expressed as a percentage of the total lorry kilometres run. The average
length of haul, lading factor and empty running figures for 2006 were published by
© M.I. Piecyk and A.C. McKinnon 17

Environmental Impact of Road Freight Transport in 2020
the Department for Transport, (2008b). Table 3.1 presents the experts’ opinion on
future directions in these parameters up to 2020.
The panellists did not expect any significant changes in supply chain structure. The
number of links is going to remain the same and their average length will be reduced
by only 1 km to 86 kms. This suggests that that supply chain links are now almost
fully extended and that, within a BAU scenario, the domestic pattern of road freight
movement is going to experience only modest change by 2020. There will, however,
be considerable improvements in the utilisation of HGVs by this date. Lading factor is
expected to increase to 64.4 percent from 57 percent and only 21.9 percent of vehicle
kilometres will be run empty, down from 27 percent in 2006. If these improvements
can be achieved, they will yield substantial environmental benefit.
50
55
60
65
70
75
Drinks
Acade
mia
Transpo
rt trad
e bod
ies
Non-ro
ad tra
nspo
rt
Primary
Road h
aulag
e
Consu
ltancy
Inform
ation
tech
nolog
y
Govern
ment a
nd N
GO's
Grocery Reta
il
%
Current level: 57%
Figure 3.3. Differences in opinion on lading factor in 2020 (by industry)
It should be noted here that even though representatives of all industry sectors
expected better vehicle utilisation in 2020, statistically significant differences in
opinion emerged on the extent of the likely increase in lading factor and reduction in
the percentage of kilometres run empty (Figures 3.3 and 3.4). Panellists from the retail
sector were the most optimistic in their projections (average lading factor of 71% and
drop in empty running to 19%). On the contrary, only a modest positive change was
© M.I. Piecyk and A.C. McKinnon 18

Environmental Impact of Road Freight Transport in 2020
expected by the experts from the drinks industry (3% increase in lading factor and 2%
reduction in empty running). A significant decrease in empty running was also
anticipated by panellists involved in consultancy work (20%). However, their
projections for the lading factor in 2020 were in line with the overall average (65%).
15
20
25
30
Retail
Consu
ltancy
Govern
ment a
nd N
GO's
Inform
ation
tech
nolog
y
Grocery
Road h
aulag
e
Acade
mia
Primary
Transpo
rt trad
e bod
ies
Non-ro
ad tra
nspo
rtDrin
ks
%
Current level: 27%
Figure 3.4. Differences in opinion on empty running in 2020 (by industry)
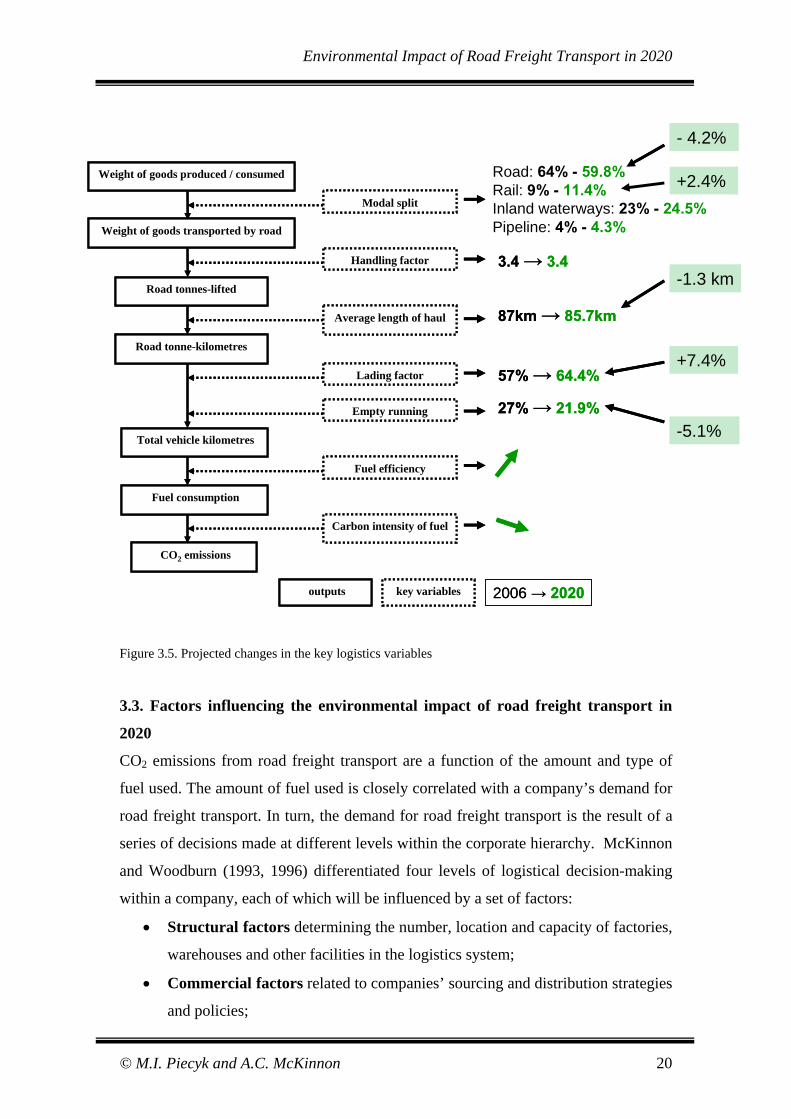
A summary of changes in the key logistics variables projected by the Delphi panel is
presented in Figure 3.5. These changes will be a result of a number of factors
occurring at company, supply chain and industry levels as well as in the wider socio-
economic environment. The next section explains how logistical decisions made at
different levels within a business affect key variables such as supply chain structure,
modal split, vehicle utilisation and fuel management.
© M.I. Piecyk and A.C. McKinnon 19
Environmental Impact of Road Freight Transport in 2020
Handling factor
Road tonnes-lifted
Road tonne-kilometres
Total vehicle kilometres
Fuel consumption
CO2 emissions
Average length of haul
Lading factor
Empty running
Fuel efficiency
Carbon intensity of fuel
Weight of goods produced / consumed
Weight of goods transported by road
Modal split
outputs key variables
Road: 64% - 59.8%Rail: 9% - 11.4%Inland waterways: 23% - 24.5%Pipeline: 4% - 4.3%
3.4 → 3.4
87km → 85.7km
57% → 64.4%
27% → 21.9%-5.1%
+7.4%
-1.3 km
- 4.2%
+2.4%
2006 → 2020
Figure 3.5. Projected changes in the key logistics variables
3.3. Factors influencing the environmental impact of road freight transport in
2020
CO2 emissions from road freight transport are a function of the amount and type of
fuel used. The amount of fuel used is closely correlated with a company’s demand for
road freight transport. In turn, the demand for road freight transport is the result of a
series of decisions made at different levels within the corporate hierarchy. McKinnon
and Woodburn (1993, 1996) differentiated four levels of logistical decision-making
within a company, each of which will be influenced by a set of factors:
• Structural factors determining the number, location and capacity of factories,
warehouses and other facilities in the logistics system;
• Commercial factors related to companies’ sourcing and distribution strategies
and policies;
© M.I. Piecyk and A.C. McKinnon 20
Environmental Impact of Road Freight Transport in 2020
• Operational factors affecting the scheduling of product flow;
• Functional factors relating to the management of transport resources –
usually regarding the choice of vehicle, planning of loads and routeing of
deliveries.
The complex interaction between decisions made at these four levels largely
determines the amount of road freight traffic.
This framework has been extended to include two further factors:
• Product-related factors affecting the nature of the transport operation;
• External factors – such as government regulations and tax policy, wider
macroeconomic trends, market dynamics and advances in technology.
The six sets of factors have a complex inter-relationship with the key freight transport
variables as shown in Figure 3.6. Each set of factors exerts an influence on more than
one variable, while some have a pervasive effect on most of the variables. The
Delphi questions were broadly defined to elicit the opinions of the logistics specialists
on the impact of this wide range of factors. There was one issue, however, about
which there was a great deal of uncertainty. This was the likelihood of a major switch
to alternative fuels, and particularly biodiesel. Around the time of the Delphi survey,
doubts were being expressed in official reports and in the press about the net
environmental benefits of biodiesel. Given this uncertainty, it was decided to focus on
the overall demand for fuel and potential for improving fuel efficiency, and not
speculate about future changes in its average carbon content.
© M.I. Piecyk and A.C. McKinnon 21

Environmental Impact of Road Freight Transport in 2020
Handling factor
Road tonnes-lifted
Road tonne-kilometres
Total vehicle kilometres
Fuel consumption
CO2 emissions
Average length of haul
Lading factor
Empty running
Fuel efficiency
Carbon intensity of fuel
Weight of goods produced / consumed
Weight of goods transported by road
Modal split
Commercial factors
Operational factors
Functional factors
External factors
Product-related factors
Structural factors
outputs key variables determinants
Figure 3.6. Relationship between logistical variables, determinants and environmental impacts
Structural factors
There was general agreement that in 2020 the UK market will be predominantly
supplied with goods produced overseas and then distributed through centralised
© M.I. Piecyk and A.C. McKinnon 22

Environmental Impact of Road Freight Transport in 2020
logistics networks within the country. The majority of respondents believed that
pressures to centralise production and inventory within the UK will remain much
stronger than any tendency to decentralise (Figure 3.7).
0.0 0.5 1.0 1.5 2.0 2.5 3.0 3.5
Increasing the storage area at retail outlets
Relocation of w arehousing to other countries
Decentralisation of inventory
Decentralisation of production
Centralisation of production
Centralisation of inventory
Reducing the storage area at retail outlets
Grow th of hub & spoke netw orks
Development of urban consolidation centres
Concentration of trade through hub ports / airports
Primary consolidation of inbound loads
Relocation of production capacity to other countries
Round 2Round 1
Figure 3.7. Structural factors affecting road freight demand (where 0 = no occurrence and 4 = occurrence to large extent)
However, in case of the centralisation of inventory, statistically significant differences
in opinion emerged both between different types of specialist and between different
sectors (Figure 3.8). For example, retail logistics managers predicted strong pressure
for further centralisation (mean response of 3.4), while academics and trade body
representatives anticipated only a very limited increase (mean response of 1.5).
© M.I. Piecyk and A.C. McKinnon 23

Environmental Impact of Road Freight Transport in 2020
0.0
0.5
1.0
1.5
2.0
2.5
3.0
3.5
4.0
Acade
mics
Trade bo
dies
Policy
mak
ers
Logis
tics s
e rvice
prov
iders
Enable
rs
Manufac
turers
Retaile
rs
Figure 3.8. Differences in opinion on the extent of further centralisation of inventory (where 0 = no occurrence and 4 = occurrence to large extent)
There was also disagreement on the extent to which warehousing operations would
relocate to other countries (Figure 3.9). Logistics service providers and manufacturers
expected a significantly greater degree of relocation (1.8 and 1.7), than retailers and
trade bodies (0.8 and 1.1).
0.0
0.5
1.0
1.5
2.0
Retaile
rs
Acade
mics
Trade bo
dies
Enable
rs
Manu fac
turers
Policy
mak
ers
Logis
tics s
ervice
prov
iders
Figure 3.9. Differences in opinion on the extent of relocation of warehousing to other countries (where 0 = no occurrence and 4 = occurrence to large extent)
© M.I. Piecyk and A.C. McKinnon 24

Environmental Impact of Road Freight Transport in 2020
If, as the majority of respondents suggested, the geographical concentration of
manufacturing capacity and inventory continues, average length of haul and total
tonne-kms are likely to rise. It was also anticipated that an increasing proportion of
freight will be channelled through the hub-and-spoke networks of parcel and pallet-
load networks and through primary consolidation centres upstream of retailers’
distribution centres. This typically has the effect of adding links to the supply chain
and therefore generating additional tonne-kms. The forecast growth of port- and
airport-centric logistics, on the other hand, has the potential to streamline distribution
channels, removing links and moderating any increase in tonne-kms.
0.0
0.5
1.0
1.5
2.0
2.5
3.0
3.5
4.0
Academ
ics
Enable
rs
Trade bodie
s
Manufac
turers
Logis
tics s
e rvice pr
ovide
rs
Policy
mak
ers
Retaile
rs
Figure 3.10. Differences in opinion on the extent of reduction of shop storage areas (where 0 = no occurrence and 4 = occurrence to large extent)
Increases in tonne-kms will not necessarily translate into a growth in vehicle traffic as
vehicle loading may change. Structural factors can also influence vehicle utilisation.
The centralisation of economic activity, the shift to hub-and-spoke networks and
insertion of primary consolidation centres into distribution channels typically lead to
greater consolidation of loads. In theory this should ensure that freight vehicle-kms
increase less than tonne-kms. Other structural developments could have the opposite
effect on vehicle utilisation. For example, it is predicted that in the retail sector, the
storage area in the shops is going to be reduced, forcing more frequent but smaller
© M.I. Piecyk and A.C. McKinnon 25

Environmental Impact of Road Freight Transport in 2020
deliveries and potentially increasing the negative environmental impact of the store
deliveries. Retailers, policy makers and logistics service providers expected greatest
contraction of shop storage areas (scores of respectively, 3.1, 3.0 and 2.7) (Figure
3.10).
Commercial factors
Increases in the volumes of goods and services traded online and in the amount of
product being returned for recycling or reuse were identified as two of the main
commercial factors impacting on freight transport demand in 2020. Although previous
research suggested that there would be a significant increase in local sourcing,
particularly in case of food produce, (Piecyk et al., 2007), the Delphi panellists on
average felt that this will occur only to a limited extent (Figure 3.11).
0.0 0.2 0.4 0.6 0.8 1.0 1.2 1.4 1.6 1.8
Localised sourcing of supplies
Expansion of the market areas of UKbusinesses
Retailer control of the supply chain
Global sourcing of supplies
Subcontracting of non-core processes
Return of products for reuse / recycling
Online retailing
Round 2Round 1
Figure 3.11. Commercial factors affecting road freight demand (where -2 = much less important than now and 2 = much more important than now)
There was, nevertheless, a divergence of opinion between retailers and logistics
service providers who felt that local sourcing in 2020 will be less important than now
(-0.3 and -0.2), whereas trade bodies, academics and policy makers expected it to be
more common (0.9, 0.8 and 0.7) (Figure 3.12).
© M.I. Piecyk and A.C. McKinnon 26

Environmental Impact of Road Freight Transport in 2020
-0.5
0.0
0.5
1.0
Enab
lers
Man
ufac
ture
rs
Polic
y m
aker
s
Acad
emic
s
Trad
e bo
dies
Ret
aile
rs
Logi
stic
s se
rvic
e pr
ovid
ers
Figure 3.12. Differences in opinion on the importance of local sourcing in 2020 (where -2 = much less important than now and 2 = much more important than now)
On the other hand, there was unanimous agreement that global sourcing will expand,
though opinions differed on the extent of the trend, with retailers (1.6) and logistics
service providers (1.2) assigning it higher scores than academics (0.6) and
manufacturers (0.7) (Figure 3.13). The increase in global sourcing will increase
freight volumes on external links though may have the effect of reducing the freight
transport intensity of the UK economy. This may make it easier to cut CO2 emission
from domestic freight movement in the UK, but at the expense of a net increase in
freight-related CO2 emissions at a global scale (McKinnon, 2007).
0.0
0.5
1.0
1.5
2.0
Acade
mics
Manufac
turers
Enable
rs
Policy
mak
ers
Trade bo
dies
Logist
ics se
rvice
prov
iders
Retaile
rs
Figure 3.13. Differences in opinion on the importance of global sourcing in 2020 (where -2 = much less important than now and 2 = much more important than now)
© M.I. Piecyk and A.C. McKinnon 27

Environmental Impact of Road Freight Transport in 2020
According to the survey respondents, retailers’ control over supply chains is going to
strengthen even further, increasing their responsibility for improving the
environmental performance across the chains. The largest growth in retailers’ power
was expected, perhaps unsurprisingly, by the retailers themselves (1.4), with logistics
service providers (1.1) and trade bodies (1.1) averaging slightly lower scores (Figure
3.14). Academics, enablers, manufacturers and policy makers predicted smaller
increases in retailers’ domination. There was a general expectation that growing
demand for “green” products and services may give retailers an incentive to involve
supply chain partners in joint efficiency initiatives yielding an overall economic and
environmental benefit.
0.0
0.5
1.0
1.5
2.0
Acade
mics
Enable
rs
Manu fac
turers
Policy
mak
ers
Trade bo
dies
Logist
ics se
rvice
prov
iders
Retaile
rs
Figure 3.14. Differences in opinion on the importance of retailers’ control over the supply chain (where -2 = much less important than now and 2 = much more important than now)
Panellists also anticipated a significant further increase in the ‘vertical disintegration’
of manufacturing operations with more non-core processes being subcontracted and,
presumably, extra links being added to supply chains. The long term trend towards
greater outsourcing of logistics is also expected to continue, with logistics service
providers (1.4), enablers (1.3) and manufacturers (1.2) anticipating the strongest move
in this direction (Figure 3.15).
© M.I. Piecyk and A.C. McKinnon 28

Environmental Impact of Road Freight Transport in 2020
0.0
0.5
1.0
1.5
2.0
Trade bo
dies
Retaile
rs
Policy
mak
ers
Acade
mics
Manufac
turers
Enable
rs
Logis
tics s
ervice
prov
iders
Figure 3.15. Differences in opinion on the importance of outsourcing in 2020 (where -2 = much less important than now and 2 = much more important than now)
Operational factors
Panel members forecast a further reduction of order lead times, modest tightening of
the delivery windows, the need for slightly more frequent deliveries to retail outlets
and even greater application of the Just-In-Time (JIT) principle. In 2020, variability of
order sizes will make it more difficult for companies to match load and vehicle
capacity efficiently. These trends are likely to frustrate companies’ efforts to improve
current levels of vehicle utilisation. Overall the Delphi panel did not endorse recent
suggestions that environmental pressures to use transport capacity more efficiently
will force a relaxation of JIT regimes. On the other hand, it was predicted that an
increasing proportion of freight would be moved during the night, when deliveries
would be made on less congested infrastructure and freight vehicles able to achieve
more fuel efficient speeds (Figure 3.16).
© M.I. Piecyk and A.C. McKinnon 29

Environmental Impact of Road Freight Transport in 2020
-1.0 -0.5 0.0 0.5 1.0 1.5
Round 2Round 1
Night-time delivery to retail units
Variability of order size
Application of JIT principle
Frequency of delivery to shops
Width of delivery time windows
Order lead times
Figure 3.16. Operational factors affecting road freight demand (where -2 = large reduction and 2 = large increase)
Functional factors
Within a logistics system defined by higher-level decisions made at the strategic,
commercial and operational levels, managers still have considerable scope to ‘green’
the transport operation at a functional level. The panel predicted that by 2020 this will
be facilitated by wide application of telematics and computerised vehicle routing and
scheduling systems (CVRS). Companies are also expected to get more heavily
involved in various collaboration initiatives, to improve the utilisation of their fleets
by increasing the level of backloading and to achieve greater integration of production
and distribution operations. Panellists envisaged much greater use being made of
online freight exchanges / load matching services by 2020, which will be likely to
promote further reductions in empty running and exhaust emissions. Better matching
of vehicle capacity to transport demands will lead to better resource planning and
vehicle utilisation. Service quality requirements are going to remain important but
increases in the real cost of transport will cause some rebalancing of cost and service
priorities (Figure 3.17).
© M.I. Piecyk and A.C. McKinnon 30

Environmental Impact of Road Freight Transport in 2020
0.0 0.2 0.4 0.6 0.8 1.0 1.2 1.4 1.6
Focus on service quality rather than cos ts
Use of vans for deliveries
Integration of production and dis tribution
Matching of vehicle fleet to transport dem ands
Inves tm ent in double-deck / high-cube vehicles
Backloading of vehicles
Logis tical collaboration between com panies
Use of vehicle routing and scheduling sys tem s
Use of telem atics
Round 2Round 1
Figure 3.17. Functional factors affecting road freight demand (where -2 = much less important and 2 = much more important)
Investment in double-deck / high cube vehicles is expected to rise, with the greatest
uptake in the retail, road haulage and grocery sectors (2.0, 1.5 and 1.5) (Figure 3.18).
0.0
0.5
1.0
1.5
2.0
Drinks
Acade
mia
Governm
ent and N
GO's
Informatio
n tech
nology
Non-ro
ad tra
nsport
Primary
Consu
ltancy
Transport t
rade bodie
sGroce
ry
Road hau
lageReta
il
Figure 3.18. Differences in opinion on the uptake of double-deck / high-cube vehicles (where -2 = large reduction and 2 = large increase)
© M.I. Piecyk and A.C. McKinnon 31

Environmental Impact of Road Freight Transport in 2020
Almost all of the functional factors rated by the respondents are likely to bring
significant savings in fuel consumption and emission levels in the short to medium
term. Many of these best-practice measures, after all, require modest investment, are
self-financing and carry little risk. As they are applied at the lowest and most flexible
level in the decision-making hierarchy, they can allow companies to improve their
environmental performance within fixed logistics structures or where commercial and
operational constraints are imposed by a more powerful partner in the supply chain.
External factors
External factors will have an effect on all the key freight transport variables. Fuel
prices were perceived as the biggest threat to transport operations. However,
increasing fuel prices can have a beneficial effect in reinforcing fuel efficiency
initiatives among road freight users (Figure 3.19). If combined with an extension of
the European emissions trading scheme to transport and a switch to some types of
alternative fuels1 high oil prices may induce significant reductions in freight-related
CO2 emissions.
-1.0 -0.8 -0.6 -0.4 -0.2 0.0 0.2 0.4 0.6 0.8
Round 2Round 1Fuel prices
Availability of drivers
Restrictions on drivers' time
Quality of road infrastructure
Competition from foreign operators
Introduction of user charging on the national road network
Congestion charging in urban areas
Extension of emission trading scheme tofreight transport
Polarisation of the road freight market
Use of alternative fuels
Development of online freight exchanges / loadmatching services
Figure 3.19. External factors affecting road freight sector (where -2 = large negative impact and 2 = large positive impact) 1 Since the survey was completed, new scientific evidence has been published which suggests that, on a life-cycle basis, some biofuels are more carbon-intensive than conventional fossil fuels
© M.I. Piecyk and A.C. McKinnon 32

Environmental Impact of Road Freight Transport in 2020
Infrastructure charges on the national road network as well as congestion charging in
urban areas were judged as likely to have slightly negative consequences for the UK
freight transport sector. However, there were statistically significant differences in
perceptions of the impact of the user charging on the national road network across the
different groups of experts. The panellists from primary manufacturing, retail, road
haulage and information technology sectors believed that road charging presented a
threat to the road freight system (-1.0, -1.0, -0.8 and -0.6). On the other hand,
participants from consulting, drinks industry, academia, government, NGOs and
transport trade bodies predicted that national road charging would have a slightly
positive or neutral effect on the UK road freight transport in 2020 (0.4,0.3, 0.0, 0.0
and 0.0) (Figure 3.20). From an environmental perspective, fiscal measures which
reduce traffic congestion on both urban and rural roads are definitely beneficial,
though they impose an additional economic burden on road transport operators using
road infrastructure at busy times.
-1.5
-1.0
-0.5
0.0
0.5
1.0
Aca
dem
ia
Gov
ernm
ent
and
NG
O's
Tran
spor
t tra
debo
dies D
rinks
Con
sulta
ncy
Prim
ary
Ret
ail
Roa
d ha
ulag
e
Info
rmat
ion
tech
nolo
gy
Non
-road
tran
spor
t
Gro
cery
Figure 3.20. Projected impact of road charging on the road transport sector (where -2 = large negative impact and 2 = large positive impact)
Restrictions on drivers’ time and a shortage of qualified drivers are expected to make
management of delivery operations more difficult in 2020 resulting in a potential loss
of flexibility and deterioration in performance. Driver availability was a particular
© M.I. Piecyk and A.C. McKinnon 33

Environmental Impact of Road Freight Transport in 2020
concern of logistics service providers, retailers, and enablers (-0.9, -0.8 and -0.7)
(Figure 3.21). Increased penetration of the UK haulage market by foreign operators
was perceived as a moderate threat to the UK road freight market in 2020. At present,
foreign operators, unlike their domestic counterparts, pay very little tax in the UK to
compensate for their use of transport infrastructure and the related environmental
impact (Piecyk and McKinnon, 2007). Current plans by the European Commission to
internalise the environmental costs of freight operations across the EU should have
corrected this anomaly by 2020.
-1.0
-0.5
0.0
0.5
1.0
Polic
y m
aker
s
Acad
emic
s
Logi
stic
s se
rvic
e pr
ovid
ers
Ret
aile
rs
Enab
lers
Man
ufac
ture
rs
Trad
e bo
dies
Figure 3.21. Projected impact of drivers’ availability on the road transport sector (where -2 = large negative impact and 2 = large positive impact)
Product-related factors
Design of products and packaging can impact on vehicle utilisation and thus on the
environmental performance of logistics. Two contradicting trends were identified by
panel members. Greater use of space-efficient packaging and handling equipment and
increase in the amount of attention given to logistical requirements at the design stage
of the product development process should improve vehicle fill and cut emissions. On
the other hand, the projected increase in the use of shelf-ready packaging and imports
of goods in store-ready format may undermine efforts to optimise vehicle utilisation
and lead to increased fuel consumption and emissions (Figure 3.22).
© M.I. Piecyk and A.C. McKinnon 34

Environmental Impact of Road Freight Transport in 2020
Further miniaturisation of products and an increase in their value-density can also
have offsetting effects. If products are smaller and lighter, more of them can be
transported in one vehicle and so fewer journeys are needed. The higher the real value
of goods, however, the greater will be the emphasis on customer service and inventory
minimisation, possibly at the expense of vehicle utilisation.
0.0 0.5 1.0 1.5 2.0 2.5 3.0 3.5
Miniaturisation of products
Design of products more sensitive to logisticalrequirements
Increase in the value-density of products
Increase in the use of shelf -ready packaging
Import of goods in store-ready format
Greater use of space-ef f icient packaging / handlingequipment
Round 2Round 1
Figure 3.22. Product-related factors affecting road freight demand (where 0 = no impact and 4 = large impact)
© M.I. Piecyk and A.C. McKinnon 35
Environmental Impact of Road Freight Transport in 2020
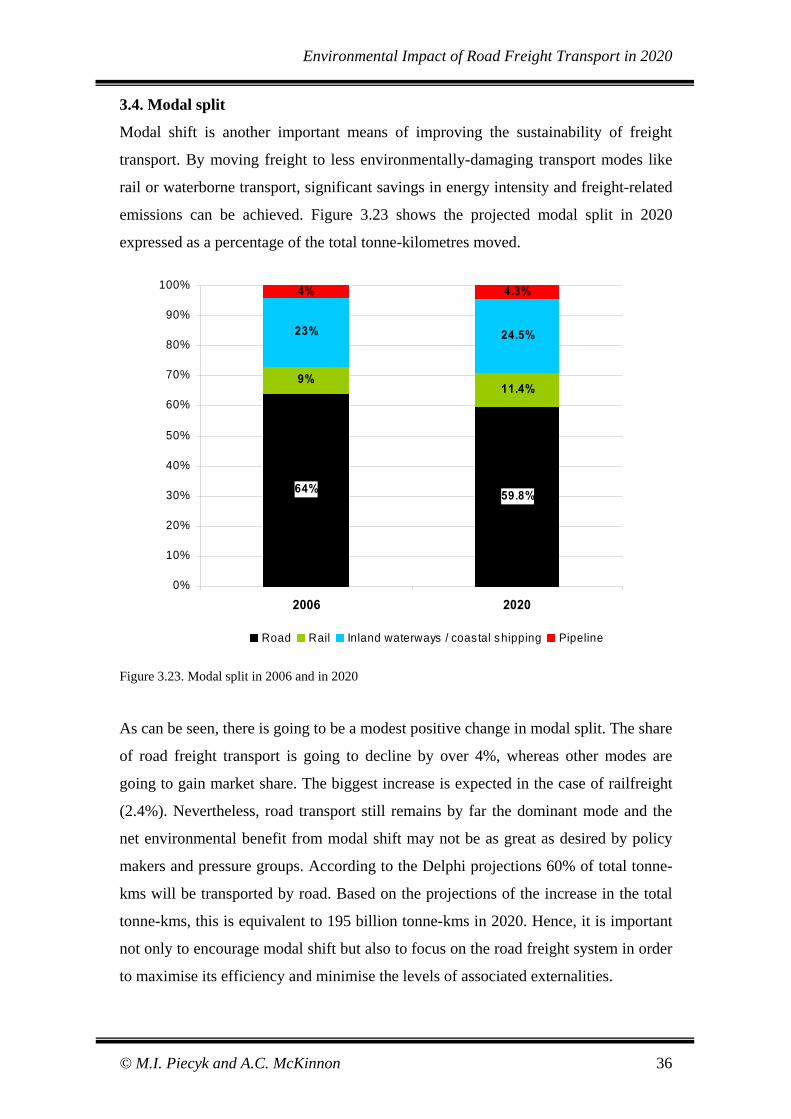
3.4. Modal split
Modal shift is another important means of improving the sustainability of freight
transport. By moving freight to less environmentally-damaging transport modes like
rail or waterborne transport, significant savings in energy intensity and freight-related
emissions can be achieved. Figure 3.23 shows the projected modal split in 2020
expressed as a percentage of the total tonne-kilometres moved.
64% 59.8%
9%11.4%
23% 24.5%
4% 4.3%
0%
10%
20%
30%
40%
50%
60%
70%
80%
90%
100%
2006 2020
Road Rail Inland waterways / coas tal shipping Pipeline
Figure 3.23. Modal split in 2006 and in 2020
As can be seen, there is going to be a modest positive change in modal split. The share
of road freight transport is going to decline by over 4%, whereas other modes are
going to gain market share. The biggest increase is expected in the case of railfreight
(2.4%). Nevertheless, road transport still remains by far the dominant mode and the
net environmental benefit from modal shift may not be as great as desired by policy
makers and pressure groups. According to the Delphi projections 60% of total tonne-
kms will be transported by road. Based on the projections of the increase in the total
tonne-kms, this is equivalent to 195 billion tonne-kms in 2020. Hence, it is important
not only to encourage modal shift but also to focus on the road freight system in order
to maximise its efficiency and minimise the levels of associated externalities.
© M.I. Piecyk and A.C. McKinnon 36

Environmental Impact of Road Freight Transport in 2020
Forecasts of the future share of airfreight were excluded from the survey. Aeroplanes
carry currently only 0.01% of all tonne-kms in the UK. Even assuming a huge
percentage growth, this mode’s share is going to be marginal. Airfreight, nevertheless,
produces a high level of externalities per tonne-km. For example, domestic air cargo
in the UK is estimated to emit 11 times more CO2 per tonne-km than HGVs and 79
times more than railfreight (McKinnon, 2007).
0.0
0.1
0.2
0.3
0.4
0.5
0.6
0.7
0.8
Inland w aterw ay/ coastal shipping
Road Rail Deep seashipping
Airf reight
Round 1 Round 2
Figure 3.24. Projected change in value of goods carried by different modes (where -2 = large decrease and 2 = large increase)
The experts were also asked what changes they expect in the value of products moved
by different transport modes (Figure 3.24). The biggest increase in value was
anticipated in case of goods delivered to the UK by air. From an environmental
perspective this could be a positive development, as only the most valuable goods
might be transported by air. If airfreight operators are required to internalise the
external costs of their activities, for instance through taxing kerosene fuel, it will
become uneconomic to move by air some of the lower value commodities currently
moved by this mode. On the other hand, the value of goods moved by inland
waterway or coastal shipping was predicted to stay at the current level. This suggests
that the experts were very doubtful about initiatives aiming to shift higher value-
density products onto these modes. Bulk, low-value goods are going to remain the
main products carried by inland waterway and coastal shipping services. A moderate
© M.I. Piecyk and A.C. McKinnon 37

Environmental Impact of Road Freight Transport in 2020
increase in value was expected for goods transported by road, rail and deep-sea
shipping.
-0.8
-0.6
-0.4
-0.2
0.0
0.2
0.4
0.6
0.8
1.0
1.2
Drin
ks
Roa
d ha
ulag
e
Gov
ernm
ent a
ndN
GO
's Prim
ary
Non
-roa
dtra
nspo
rt
Gro
cery
Info
rmat
ion
tech
nolo
gy
Con
sulta
ncy
Acad
emia
Tran
spor
t tra
debo
dies R
etai
l
Figure 3.25. Differences in opinion on the change of value of goods carried by rail (where -2 = large decrease in value and 2 = large increase in value)
There was, nevertheless, a disagreement about the projected change in the real value
of goods transported by rail amongst panellists representing different industry sectors.
Experts from the retail sector and transport trade bodies expected a significant
increase in the real value of products transported by rail (1.0 and 0.9). A decrease in
the real value of products moved by this mode was predicted by panellists from the
drinks industry (-0.7) (Figure 3.25).
0.0 0.5 1.0 1.5 2.0 2.5 3.0 3.5
Com m odity m ix
Speed
Bureaucracy
Additional handling involved
Congested rail infras tructure
Access ibility of term inals
Cost
Flexibility
Reliability
Round 2Round 1
Figure 3.26. Factors influencing the amount of cargo carried by rail in 2020 (where 0 = no impact and 4 = large impact)
© M.I. Piecyk and A.C. McKinnon 38

Environmental Impact of Road Freight Transport in 2020
With regard to rail transport, reliability, flexibility, cost and accessibility of terminals
were identified as the major factors influencing the amount of freight carried by 2020.
Speed, commodity mix and bureaucracy were least important in comparison to other
factors (Figure 3.26).
According to the experts, upgrading rail infrastructure, provision of dedicated freight
lanes and simplifying administrative / regulatory framework for rail freight would be
most effective means of increasing rail’s share of the UK freight market.
Encouraging modal shift by enforcing regulations on road freight more rigorously,
increasing taxes on diesel fuel or extending emission trading scheme to freight
transport were accorded much less importance (Figure 3.27).
0.0 0.5 1.0 1.5 2.0 2.5 3.0 3.5
Enforcing regulations on road freight operators m orerigorous ly
Promotion of bes t practice in com pany freightmanagem ent
Introduction of a road pricing schem e for HGVs
Extending em iss ions trading schem e to freighttransport
Higher duties on diesel fuel
Revenue support for Channel Tunnel connections
Simplifying adm inis trative / regulatory fram ework forrail freight
Expanding Freight Facilities Grant schem e
Planning policies for m ore effective co-ordination oftransport modes
Provis ion of dedicated rail freight routes
Upgrading rail infras tructure
Round 2Round 1
Figure 3.27. Efficiency of potential measures to increase rail’s share of freight market (where 0 = no effect and 4 = very effective)
The amount of cargo carried by coastal shipping up to 2020 will be largely
determined by the cost of using this transport mode. Accessibility of ports and
congested infrastructure may be the key factors inhibiting an increase in coastal
shipping’s share of the freight market. Reliability of this transport mode was
considered to be more important than its speed. Bureaucracy and additional handling
associated with using coastal shipping were not considered as major obstacles (Figure
3.28).
© M.I. Piecyk and A.C. McKinnon 39

Environmental Impact of Road Freight Transport in 2020
0.0 0.5 1.0 1.5 2.0 2.5 3.0 3.5
Bureaucracy
Speed
Additional handling involved
Flexibility
Reliability
Congested port infras tructure
Access ibility of ports
Cos t
Round 2Round 1
Figure 3.28. Factors influencing the amount of cargo carried by coastal / short-sea shipping in 2020 (where 0 = no impact and 4 = large impact)
In order to promote the use of coastal shipping, the UK Government should focus its
efforts on providing better infrastructure and consider expansion of the Waterborne
Freight Grant scheme. New policies are needed to support more effective co-
ordination of transport modes. As in the case of promoting modal shift to rail, more
rigorous enforcement of regulations on road freight operators, extension of emission
trading scheme to freight transport or raising taxes on diesel fuel were not considered
to be very effective means of encouraging businesses to use coastal shipping more
extensively (Figure 3.29).
0.0 0.5 1.0 1.5 2.0 2.5 3.0
Enforcing regulations on road freight operatorsm ore rigorous ly
Prom otion of best practice in com pany freightm anagem ent
Extending em iss ions trading schem e to freighttransport
Higher duties on diesel fuel
Introduction of a road pricing schem e for HGVs
Planning policies for m ore effective co-ordination of transport m odes
Expanding Waterborne Freight Grant schem e
Upgrading port infras tructure
Round 2Round 1
Figure 3.29. Efficiency of potential measures to increase coastal / short-sea shipping’s share of freight market (where 0 = no effect and 4 = very effective)
© M.I. Piecyk and A.C. McKinnon 40

Environmental Impact of Road Freight Transport in 2020
Overall, the panellists predicted a slight relaxation of the constraints on using rail and
shipping services by 2020. Furthermore, constraints on coastal shipping services are
predicted to ease to a slightly larger extent than those on rail (Figure 3.30).
-0.40
-0.30
-0.20
-0.10
0.00
Railfre ight se rv ices Short-sea / coastal shippingserv ices
Round 1 Round 2
Figure 3.30. Projected changes in the constraints on using rail and shipping services (where -2 = constraints significantly easing and 2 = constraints significantly tightening)
3.5. Fuel management
According to the Delphi panellists, additional environmental benefit will accrue from
increases in fuel efficiency (expressed as vehicle-kms per litre of fuel consumed) and
a reduction in the carbon intensity of fuel (i.e. CO2 emitted per litre of fuel) (Figure
3.31).
-1.00
-0.50
0.00
0.50
1.00
1.50
Fuel ef f iciency Carbon intensity of fuel
Round 1Round 2
Figure 3.31. Projected changes in efficiency and carbon intensity of fuel (where -2 = large decrease and 2 = large increase)
© M.I. Piecyk and A.C. McKinnon 41

Environmental Impact of Road Freight Transport in 2020
Vehicle design, engine performance, information technology (telematics, vehicle
routing software) and training schemes for fuel efficient driving were identified as the
main drivers of improved fuel efficiency (Figure 3.32). The greatest external pressure
on companies to reduce their fleets’ fuel consumption will be high fuel prices.
Relative to other factors, dissemination of best practice in fuel management was given
a low rating. Overall, the results suggest that technological developments are going to
play the main role in improving fuel efficiency. In order to achieve synergy of efforts,
the promotion of best practice should focus on the dissemination about knowledge on
available technological solutions to reduce fuel consumption.
0.0 0.5 1.0 1.5 2.0 2.5 3.0 3.5
Improved vehicle maintenance
Dissemination of best practice in fuelmanagement
Incentive schemes for employees
Higher fuel prices
Out of hours' delivery operation
Training schemes for fuel efficient driving
Engine performance
Information technology (telematics / vehiclerouting software)
Vehicle design
Round 2Round 1
Figure 3.32. Projected importance of fuel efficiency measures (where 0 = no importance and 4 = very important)
Although all participants perceived higher fuel prices as an significant factor
encouraging companies to improve their fuel efficiency, policy makers, academics
and retailers regarded it as more important (3.3, 3.1 and 3.0) than representatives of
trade organisations and manufacturers (2.1 and 2.1) (Figure 3.33).
© M.I. Piecyk and A.C. McKinnon 42

Environmental Impact of Road Freight Transport in 2020
0.0
0.5
1.0
1.5
2.0
2.5
3.0
3.5
Trade bo
dies
Manufac
turers
Logis
tics s
ervice
prov
iders
Enable
rs
Retaile
rs
Acade
mics
Policy
mak
ers
Figure 3.33. Projected impact of higher fuel prices on improving the fuel efficiency (where 0 = no importance and 4 = very important) – differences in opinion by type of organization represented
© M.I. Piecyk and A.C. McKinnon 43

Environmental Impact of Road Freight Transport in 2020
4. Effects on the carbon footprint of road freight transport in 2020
Based on the survey results three scenarios were constructed: business-as-usual
(BAU), optimistic and pessimistic. The BAU scenario was based on the mean
responses of the Delphi panellists. The optimistic and pessimistic scenarios were
defined, respectively, as being one standard deviation above and below the mean
value of each key parameter. Assumptions were made about changes in fuel efficiency
and the carbon intensity of fuel to reflect the experts’ opinions as discussed above.
The results of the analysis are shown in Table 4.1. Please note that the results exclude
Northern Ireland and apply to Great Britain only.
Current Situation
(2007)
2020 BAU
2020 Optimistic
2020 Pessimistic
Total tonne-kms (billion) 255 325 271 378Share of road (HGVs) 63% 60% 54% 66%Road tonne-kms (billion) 161 195 147 248Lading factor 57% 64% 70% 59%Empty running 27% 22% 18% 26%Average length of haul (kms) 86 86 71 101Tonnes lifted (billion tonnes) 1.9 2.3 2.1 2.5Average load (tonnes) 9.8 11.1 12.1 10.1Laden vehicle kilometres (billion) 16.4 17.5 12.1 24.5Total vehicle kms (billion) 22.4 22.4 14.7 33.2Projected change in fuel efficiency +5% +10% -5%Fuel efficiency (mpg) 8.7 9.1 9.6 8.3Fuel efficiency (litre/km) 0.33 0.31 0.29 0.34Projected change in carbon intensity of fuel -5% -10% no change
Conversion ratio (kg CO2 / litre of fuel) 2.63 2.50 2.37 2.63
Total fuel consumption (billion litres) 7.3 7.0 4.3 11.4
Total CO2 emissions (million tonnes) 19.3 17.4 10.3 30.0
% change from current level -10% -47% +56%Table 4.1. Carbon footprint of road freight transport in Great Britain now and in 2020.
When the BAU scenario is considered, positive developments in modal split, vehicle
utilisation, fuel efficiency and carbon intensity are likely to result in a 10% percent
reduction in CO2 emissions from the current level, decreasing the carbon footprint of
road freight transport to 17.4 million tonnes of CO2 in 2020. This occurs despite the
fact that there would be an underlying growth in road tonne-kms of 21%. As the
© M.I. Piecyk and A.C. McKinnon 44

Environmental Impact of Road Freight Transport in 2020
average length of haul is likely to remain relatively stable, the increase in tonne-kms
is driven mainly by a growth in the weight of goods transported (to 2.3 billion tonnes
in 2020). Panellists predicted that the average number of links in the supply chain
will also remain stable, suggesting that future increases in the transported weight will
be due mainly to an increase in the physical mass of goods in the economy. The 21%
of tonne-kms will be largely offset by better loading (resulting in the weight of an
average load rising to 11.1 tonnes from 9.8 tonnes) and less empty running of HGVs.
As a result, total truck-kms will not rise. When improvements in fuel efficiency and
reductions in carbon intensity are factored into the calculation, total CO2 emissions
from road freight transport will actually fall by 2020.
In the optimistic scenario CO2 emissions from road freight would be 47% below the
current level (10.3 million tonnes of CO2 in 2020). The decrease in road tonne-kms (8
percent) would be a result of a 9% shift of freight away from road transport to
alternative modes and a reduction in the average length of haul by 15 kms relative to
the present value. Significant improvements in vehicle utilisation parameters (lading
factor of 70% and empty running of only 18%), would further convert this decrease in
tonne-kms into a 34 percent reduction in the total vehicle kms. In this scenario, the
fuel efficiency of HGVs is assumed to improve by 10% and the carbon intensity of
fuel to fall by 10%, reinforcing the beneficial CO2 trend.
In the pessimistic scenario, the carbon footprint of the road freight sector increases to
30.0 million tonnes of CO2 in 2020 (56% above the present level). An underlying
growth in tonne-kms of 48% is supplemented by a slight increase in road’s share of
the freight market (from 64 to 66%). Very modest improvements in vehicle
utilisation will fail to offset this growth in road tonne-kms, resulting in a 48% increase
in the total vehicle kms travelled. This scenario also assumes slight worsening of fuel
efficiency (-5%) which could be a consequence, for instance, of increasing traffic
congestion or a further tightening of regulatory controls on emissions of other
pollutants (for example, the imposition of the Euro 6 emission standard in 2013 will
carry a 2%-3% fuel penalty (European Commission, 2007)). No change in the carbon
intensity of fuel is assumed in this scenario.
© M.I. Piecyk and A.C. McKinnon 45

Environmental Impact of Road Freight Transport in 2020
5. Conclusions
Climate change and CO2 emissions are clearly becoming significant factors in
logistical decision-making. Over 50% of companies involved in road freight transport
operations are likely to see their activities affected by climate change concerns to a
significant or large extent by 2015. This is expected to rise to over 80% by 2020.
Some long-established production and logistics trends which exert a strong influence
on road freight demand, such as the centralisation of manufacturing and inventory, the
adoption of JIT replenishment and the outsourcing of non-core activities, cannot
continue indefinitely. The results of the Delphi survey reported in this paper suggest
that these trends are likely to continue at least until 2020. They also show the
complexity of the inter-relationships between a broad range of business trends, freight
traffic levels and related CO2 emissions. While some of the trends predicted by the
panel of experts will increase the environmental footprint of road freight operations,
others will have the opposite effect. Generally speaking, many of the trends
anticipated at the upper strategic, commercial and operational levels in the decision-
making hierarchy are likely to increase their environmental impact, while those
projected to occur at a functional level in the management of transport resources will
have an offsetting effect. However, if the BAU scenario is considered, overall changes
in the key logistical variables, such as percentage of tonne-kms transported by road,
average length of haul, empty running or lading factor, should have a positive or, in
the worst case, neutral effect on the environmental performance of road freight
transport (Figure 5.2).
• Decoupling
• Modal shift
• Supply chain structure
• Vehicle utilisation
• Fuel management
(quite positive)
(quite positive)
(neutral)
(very positive)
(positive)
Figure 5.2. Likely environmental impact of changes in the key logistics variables.
© M.I. Piecyk and A.C. McKinnon 46

Environmental Impact of Road Freight Transport in 2020
The actual net impact of all these changes on freight-related energy consumption and
emissions is difficult to quantify. Nevertheless, an attempt has been made to construct
three possible road-freight CO2 scenarios for 2020 using the experts’ opinions to
calibrate the spreadsheet-based forecasting model.
The standard deviation values in the first round of the Delphi survey revealed
significant differences of opinion on some of the key variables. Overall, the Delphi
process produced, on average, a 9% convergence of expert views. Where statistically
significant differences in opinion persisted between respondents in different
stakeholder or industry groups, additional analysis was carried out to avoid
misrepresenting their viewpoints. The scenario-building exercise, however, relied on
average scores for the Delphi panel as a whole
The mid-range BAU scenario indicates that the most likely outcome is a marginal
reduction in CO2 emissions from road freight transport of around 10%. This would
occur despite an increase of 21% in the amount of road freight movement above the
2006 level. Substantial improvements in vehicle utilisation and fuel efficiency and
shifts to alternative transport modes and lower carbon fuels would more than offset
the effect of this growth in road tonne-kms on CO2 emissions. The optimistic and
pessimistic scenarios, defined by a one standard deviation range on either side of the
mean Delphi scores, envisage road-freight-related CO2 emissions falling by 47% or
rising by 56%. If the optimistic projection proved accurate, the GB road freight sector
would be on a trajectory that would comfortably meet the 80% CO2 reduction that the
UK government has set for the economy as a whole by 2050. If, however, the mid-
range BAU forecast is adopted, as it reflects the majority opinion of the Delphi
panellists, the road freight sector will fall well short of the necessary ‘carbon
pathway’ to an 80% CO2 reduction by 2050 (Department for Transport, 2008c).
Government and business will then have to intensify their efforts to decarbonise the
movement of freight by road.
© M.I. Piecyk and A.C. McKinnon 47

Environmental Impact of Road Freight Transport in 2020
References:
Armstrong, J.S. and Overton, T.S. (1977), Estimating nonresponse bias in mail
surveys, Journal of Marketing Research, Vol. 14, pp. 396 - 402. Carter, C.R. and Jennings, M.M. (2002), Social responsibility and supply chain
relationships, Transportation Research Part E, Vol. 32, pp. 37 - 52. Cooper, J.C. (1994), Logistics futures in Europe: a Delphi study, Cranfield, Cranfield
Centre for Logistics and Transportation. Cooper, M.C., Santosa, J. and Burgos - Dominguez, A. (2007), Career Patterns of
Women in Logistics, Lombard, CSCMP. Cranfield School of Management (1984), Distribution in the Year 2003: Summary of
Delphi Forecasts, Cranfield. Department for Transport (2008a), Transport Statistics Great Britain: 2008 Edition,
London. Department for Transport (2008b), Road Freight Statistics 2007, London. Department for Transport (2008c), Carbon Pathways Analysis. Informing
Development of a Carbon Reduction Strategy for the Transport Sector, London.
DETR (1999), Sustainable Distribution: A Strategy, London. Diaz de Rada, V. (2005), Measure and control of non-response in a mail survey,
European Journal of Marketing, Vol. 39 No.1/2, pp. 16 - 32. Dickerson, A., Homenidou, K. and Wilson, R. (2008), Working Futures 2004 - 2014.
Sectoral Report, Coventry, University of Warwick. European Commission (2001), White Paper- European Transport Policy for 2010:
Time to Decide, Luxembourg. European Commission (2006), Keep Europe Moving. Sustainable Mobility for Our
Continent, Luxembourg. European Commission (2007), Impact Assessment. Annex to the Proposal for a
Regulation of the European Parliament and of the Council on the Approximation of the Laws of the Member States with Respect to Emissions from On-road Heavy Duty Vehicles and on Access to Vehicle Repair Information, Brussels.
European Commission (2008), Oil Bulletin, Brussels, Directorate-General Energy and
Transport.
© M.I. Piecyk and A.C. McKinnon 48
Environmental Impact of Road Freight Transport in 2020
Firth, M. (1977), Forcasting Methods in Business and Management, Edward Arnold Publishers, London.
Greatorex, J. and Dexter, T. (2000), An accessible analytical approach for investigating what happens between the rounds of a Delphi study, Journal of Advanced Nursing, Vol. 32 No.4, pp. 1016 - 1024.
Gupta, U.G. and Clarke, R.E. (1996), Theory and Applications of the Delphi
Technique: A Bibliography (1975-1994), Technological Forecasting and Social Change, Vol. 53, pp. 185-211.
Hasson, F., Keeney, S. and McKenna, H. (2000), Research guidelines for the Delphi
survey technique, Journal of Advanced Nursing, Vol. 32 No.4, pp. 1008 - 1015.
Hsu, C.-C. and Sandford, B.A. (2007a), The Delphi Technique: Making Sense Of
Consensus, Practical Assessment, Research & Evaluation, Vol. 12 No. 10, pp. 1-8.
Hsu, C.-C. and Sandford, B.A. (2007b), Minimising non-response in the Delphi
process: how to respond to non-response, Practical Assessment, Research & Evaluation, Vol. 12 No.17, pp. 1- 6.
Hudson, D., Seah, L.-H., Hite, D. and Haab, T. (2004), Telephone presurveys, self-
selection and non-response bias to mail and Internet surveys in economics research, Applied Economics Letters, Vol. 11, pp. 237 - 240.
Lambert, D.M. and Harrington, T.C. (1990), Measuring nonresponse bias in customer
service mail surveys, Journal of Business Logistics, Vol. 11 No.2, pp. 5 - 25. Landeta, J. (2006), Current validity of the Delphi method in social sciences,
Technological Forecasting and Social Change, Vol. 73 No. 5, pp. 467- 482. Linstone, H.A. and Turoff, M. (2002), The Delphi Method, Techniques and
Applications, Addison-Wesley, London. Loo, R. (2002), The Delphi method: a powerful tool for strategic management, An
International Journal of Police Strategies & Management, Vol. 25 No. 4, pp. 762 - 769.
Lummus, R.R., Vokurka, R.J. and Duclos, L.K. (2005), Delphi study on supply chain
flexibility, International Journal of Production Research, Vol. 43 No.13, pp. 2687 - 2708.
MacCarthy, B.L. and Atthirawong, W. (2003), Factors affecting location decisions in
international operations - a Delphi study, International Journal of Operations & Production Management, Vol. 23 No. 7, pp. 794-818.
McKinnon, A. (2007), CO2 Emissions from Freight Transport in the UK, London, UK
Commission for Integrated Transport.
© M.I. Piecyk and A.C. McKinnon 49

Environmental Impact of Road Freight Transport in 2020
McKinnon, A.C. (2003), Logistics and the Environment, in: Hensher, D.A. and Button, K.J. (Eds.) Handbook of Transport and the Environment. Elsevier Science Oxford.
McKinnon, A.C. and Forster, M. (2000), Full Report of the Delphi 2005 Survey:
European Logistical and Supply Chain Trends: 1999-2005, Edinburgh, Heriot-Watt University.
McKinnon, A.C., Piecyk, M.I. and Somerville, A. (2008), Decoupling, recoupling and
the future growth of road freight, Logistics & Transport Focus, Vol. 10 No.12, pp. 40 - 46.
McKinnon, A.C. and Woodburn, A.G. (1993), A logistical perspective on the growth
of lorry traffic, Traffic Engineering and Control, Vol. 34 No. 10, pp. 466 - 471. McKinnon, A.C. and Woodburn, A.G. (1996), Logistical restructuring and road
freight traffic growth: an empirical assessment, Transportation, Vol. 23 No. 2, pp. 141 - 161.
Melnyk, S.A., Lummus, R.R., Vokurka, R.J., Burns, L.J. and Sandor, J. (2008),
Mapping the future supply chain management: a Delphi study, International Journal of Production Research, Vol. fortcoming, pp.
Min, H., LaTour, M.S. and Jones, M.A. (1995), Negotiation outcomes: The impact of
the initial offer, time, gender and team size, The Journal of Supply Chain Management, Vol. 31 No.4, pp. 19 - 24.
Office for National Statistics (2008), Material flow account for the United Kingdom
1970 to 2007. Ogden, J.A., Petersen, K.J., Carter, J.R. and Monczka, R.M. (2005), Supply chain
strategies for the future: A Delphi study, The Journal of Supply Chain Management: A Global Review of Purchasing and Supply, Vol. 3, pp. 29-48.
Okoli, C. and Pawlowski, S.D. (2004), The Delphi method as a reseach tool: an
example, design considerations and applications, Information & Management, Vol. 42, pp. 15 - 29.
Piecyk, M., Edwards, J. and McKinnon, A. (2007), Modelling the future impact of
freight transport on the environment, in: Lalwani, C., Mangan, J., Butcher, T. and Mondragon, A.C. (Eds.), Logistics Research Network 2007. Conference Proceedings. Hull, CILT.
Piecyk, M. and McKinnon, A. (2007), Internalising the External Costs of Road
Freight Transport in the UK, Edinburgh, Heriot-Watt University. Rieger, W.G. (1986), Directions in Delphi Developments: Dissertations and Their
Quality, Technological Forecasting and Social Change, Vol. 29 No. 2, pp. 195- 204.
© M.I. Piecyk and A.C. McKinnon 50

Environmental Impact of Road Freight Transport in 2020
Rowe, G. and Wright, G. (1999), The Delphi technique as a forecasting tool: issues and analysis, International Journal of Forecasting, Vol. 15, pp. 353 - 375.
Runhaar, H., van der Heijden, R. and Kuipers, B. (2002), Flexibility of freight
transport sectors. An exploration of carriers' responses to external pressure on prices and service, European Journal of Transport and Infrastructure Research, Vol. 2 No. 1, pp. 19 - 40.
Tatham, P. and Kovacs, G. (2008), Logistics skills and performance, Logistics
Research Network 2008. Liverpool, CILT. Walters, D. (1975), Physical distribution futures for UK food industry, International
Journal of Retail & Distribution Management, Vol. 3 No.5, pp. 42 - 57. Walters, D. (1976), Futures for Physical Distribution in the Food Industry, Saxon
House, Farnborough. Woudenberg, F. (1991), An evaluation of Delphi, Technological Forecasting and
Social Change, Vol. 40 No. 2, pp. 131-150.
© M.I. Piecyk and A.C. McKinnon 51

Appendix 1. Detailed results of the Delphi survey
To what extent will the following changes to logistics and supply chain systems occur within UK by 2020? (where 0 = not at all and 4 = large extent)
Mean (round
1)
Mean (round
2)
Reduction of
standard deviation1
Centralisation of production 2.2 2.2 -9% Decentralisation of production 1.5 1.6 -1% Centralisation of inventory 2.3 2.2 -7% Decentralisation of inventory 1.5 1.5 -1% Relocation of production capacity to other countries 3.0 2.9 -10% Relocation of warehousing to other countries 1.6 1.5 -10% Concentration of trade through hub ports / airports 2.7 2.7 -14% Growth of hub & spoke networks 2.6 2.6 -2% Development of urban consolidation centres 2.6 2.6 -4% Primary consolidation of inbound loads to distribution centres / factories 2.8 2.8 -17%
Increasing the storage area at retail outlets 1.1 1.1 -8% Reducing the storage area at retail outlets 2.4 2.4 -11%
Table 1. Structural factors affecting road freight demand 1 between rounds 1 and 2 of the survey
How are the following commercial practices likely to change by 2020? (where -2 = much less important than now and 2 = much more important than now)
Mean (round
1)
Mean (round
2)
Reduction of
standard deviation
Online retailing 1.6 1.7 -11% Return of products for reuse / recycling 1.6 1.6 -8% Global sourcing of supplies 0.9 0.9 -15% Localised sourcing of supplies 0.4 0.3 -7% Expansion of the market areas of UK businesses 0.8 0.8 -5% Retailer control of the supply chain 0.8 0.9 -18% Subcontracting of non-core processes 1.0 1.1 -6%
Table 2. Commercial factors affecting road freight demand
52
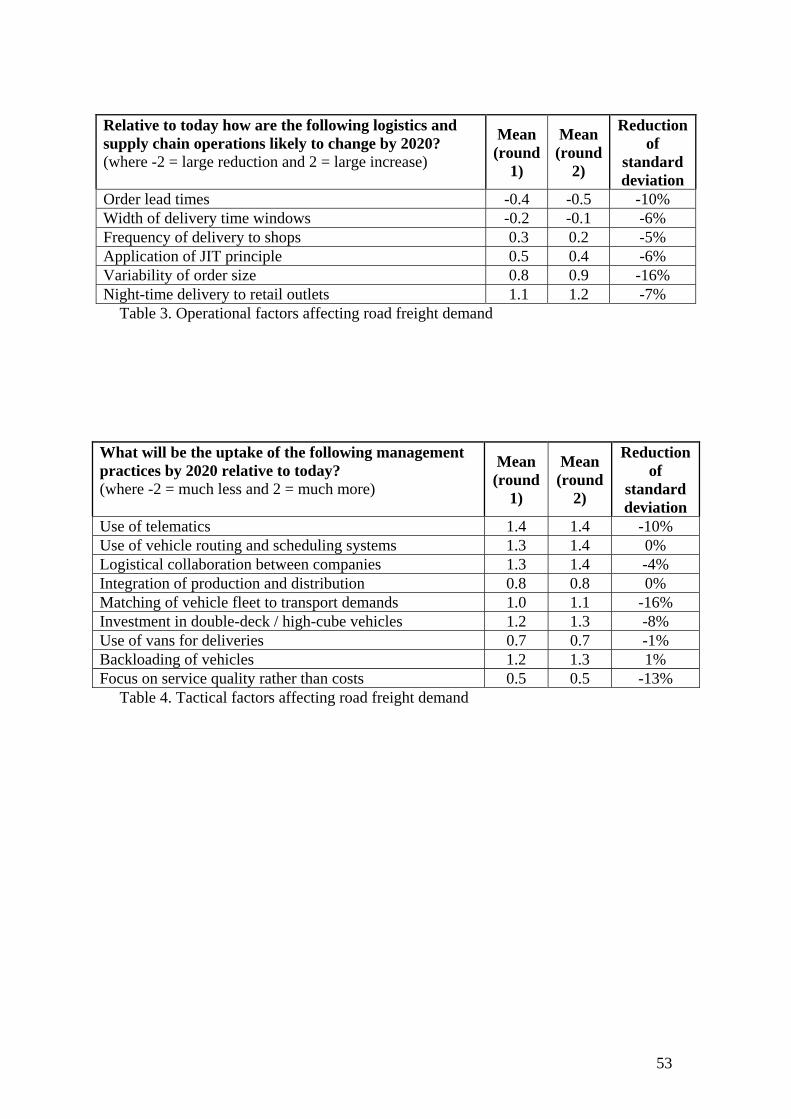
Relative to today how are the following logistics and supply chain operations likely to change by 2020? (where -2 = large reduction and 2 = large increase)
Mean (round
1)
Mean (round
2)
Reduction of
standard deviation
Order lead times -0.4 -0.5 -10% Width of delivery time windows -0.2 -0.1 -6% Frequency of delivery to shops 0.3 0.2 -5% Application of JIT principle 0.5 0.4 -6% Variability of order size 0.8 0.9 -16% Night-time delivery to retail outlets 1.1 1.2 -7%
Table 3. Operational factors affecting road freight demand
What will be the uptake of the following management practices by 2020 relative to today? (where -2 = much less and 2 = much more)
Mean (round
1)
Mean (round
2)
Reduction of
standard deviation
Use of telematics 1.4 1.4 -10% Use of vehicle routing and scheduling systems 1.3 1.4 0% Logistical collaboration between companies 1.3 1.4 -4% Integration of production and distribution 0.8 0.8 0% Matching of vehicle fleet to transport demands 1.0 1.1 -16% Investment in double-deck / high-cube vehicles 1.2 1.3 -8% Use of vans for deliveries 0.7 0.7 -1% Backloading of vehicles 1.2 1.3 1% Focus on service quality rather than costs 0.5 0.5 -13%
Table 4. Tactical factors affecting road freight demand
53

What will be the impact of the following external factors on the UK road freight transport by 2020? (where -2 = large negative impact and 2 = large positive impact)
Mean (round
1)
Mean (round
2)
Reduction of
standard deviation
Fuel prices -0.9 -0.9 -1% Extension of emission trading scheme to freight transport 0.2 0.2 -6% Use of alternative fuels 0.7 0.6 1% Introduction of user charging on the national road network -0.2 -0.3 -9% Congestion charging in urban areas -0.2 -0.2 -5% Quality of road infrastructure -0.5 -0.5 -13% Availability of drivers -0.6 -0.7 -5% Restrictions on drivers’ time -0.5 -0.5 -8% Development of online freight exchanges / load matching services 0.7 0.7 -9%
Polarisation of the road freight market 0.2 0.2 -5% Competition from foreign operators -0.4 -0.4 -10%
Table 5. External factors affecting road freight demand
To what extent will the following changes in product and packaging design occur within UK by 2020? (where 0 = not at all and 4 = large extent)
Mean (round
1)
Mean (round
2)
Reduction of standard deviation
Greater use of space-efficient packaging / handling equipment 2.9 2.9 -5%
Design of products more sensitive to logistical requirements 2.1 2.2 -11%
Increase in the use of shelf-ready packaging 2.6 2.6 -10% Import of goods in store-ready format 2.6 2.7 -15% Miniaturisation of products 2.1 2.1 -14% Increase in the value-density of products 2.3 2.3 -8%
Table 6. Product-related factors affecting road freight demand
54

How will the value, in real terms, of 1 tonne of product moved by the following modes to, from and within UK change by 2020? (where -2 = large decrease and 2 = large increase)
Mean (round
1)
Mean (round 2)
Reduction of
standard deviation
Road 0.4 0.5 -7% Rail 0.4 0.5 -13% Inland waterway / coastal shipping 0.1 0.1 -9% Deep sea shipping 0.5 0.5 -14% Airfreight 0.7 0.7 -9%
Table 7. Projected changes in value of goods transported by different modes
To what extent will the amount carried by rail by 2020 be influenced by the following factors? (where 0 = not at all and 4 = large extent)
Mean (round
1)
Mean (round 2)
Reduction of
standard deviation
Reliability 3.1 3.3 -24% Speed 2.4 2.4 -11% Congested rail infrastructure 2.9 3.0 -18% Flexibility 3.0 3.1 -17% Accessibility of terminals 3.0 3.0 -17% Cost 3.0 3.1 -15% Bureaucracy 2.5 2.6 -9% Additional handling involved 2.6 2.8 -10% Commodity mix 2.1 2.2 -7%
Table 8. Factors affecting the amount of cargo carried by rail
How effective would the following Government measures be in increasing rail’s share of the UK freight market? (where 0 = no effect and 4 = very effective)
Mean (round
1)
Mean (round 2)
Reduction of
standard deviation
Upgrading rail infrastructure 3.1 3.1 -17% Introduction of a road pricing scheme for HGVs 2.1 2.1 -1% Expanding Freight Facilities Grant scheme 2.3 2.4 -10% Revenue support for Channel Tunnel connections 2.2 2.3 -13% Provision of dedicated rail freight routes 2.9 2.9 -14% Promotion of best practice in company freight management 1.9 1.9 -9% Planning policies for more effective co-ordination of transport modes 2.3 2.4 -9%
Higher duties on diesel fuel 2.0 2.1 -8% Extending emissions trading scheme to freight transport 2.0 2.1 -12% Enforcing regulations on road freight operators more rigorously 1.5 1.5 -5% Simplifying administrative / regulatory framework for rail freight 2.2 2.3 -8%
Table 9. Efficiency of potential measures to increase rail’s share of freight market
55

To what extent will the amount carried by coastal / short-sea shipping by 2020 be influenced by the following factors? (where 0 = not at all and 4 = large extent)
Mean (round
1)
Mean (round 2)
Reduction of
standard deviation
Reliability 2.6 2.6 -7% Speed 2.4 2.4 -4% Congested port infrastructure 2.6 2.7 -7% Flexibility 2.5 2.6 -13% Accessibility of ports 2.6 2.7 -16% Cost 2.8 2.9 -6% Bureaucracy 1.9 2.0 -13% Additional handling involved 2.3 2.4 -9%
Table 10. Factors affecting the amount of cargo carried by coastal / short-sea shipping
How effective would the following Government measures be in increasing coastal / short-sea shipping’s share of the UK freight market? (where 0 = no effect and 4 = very effective)
Mean (round
1)
Mean (round 2)
Reduction of
standard deviation
Upgrading port infrastructure 2.6 2.7 -12% Introduction of a road pricing scheme for HGVs 1.8 1.8 -6% Expanding Waterborne Freight Grant scheme 2.2 2.3 -15% Promotion of best practice in company freight management 1.6 1.6 -9% Planning policies for more effective co-ordination of transport modes 2.1 2.1 -7%
Higher duties on diesel fuel 1.7 1.8 -6% Extending emissions trading scheme to freight transport 1.6 1.7 -8% Enforcing regulations on road freight operators more rigorously 1.3 1.3 -1%
Table 11. Efficiency of potential measures to increase coastal / short-sea shipping’s
share of freight market
How are the constraints on using rail and shipping services likely to change by 2020? (where -2 = constraints significantly easing and 2 = constraints significantly tightening)
Mean (round
1)
Mean (round 2)
Reduction of
standard deviation
Railfreight services -0.29 -0.32 -5% Short-sea / coastal shipping services -0.33 -0.34 -9%
Table 12. Projected changes in the constraints on using rail and shipping services
56

What is the likely change in the following factors going to be between now and 2020? (where -2 = large decrease and 2 = large increase)
Mean (round
1)
Mean (round 2)
Reduction of
standard deviation
Fuel efficiency 1.1 1.1 -16% Carbon intensity of fuel -0.7 -0.7 -14%
Table 13. Changes in fuel efficiency and carbon intensity of fuel
Please rate the likely importance of the following means of improving the fuel efficiency of freight transport operations by 2020 (where 0 = no importance and 4 = very important)
Mean (round
1)
Mean (round 2)
Reduction of
standard deviation
Training schemes for fuel efficient driving 2.7 2.7 -8% Higher fuel prices 2.4 2.6 -17% Dissemination of best practice in fuel management 2.1 2.1 -9% Out of hours' delivery operation 2.6 2.7 -8% Information technology (telematics / vehicle routing software) 2.7 2.8 -8% Vehicle design 2.8 2.9 -15% Incentive schemes for employees 2.2 2.2 -9% Improved vehicle maintenance 2.1 2.1 -3% Engine performance 2.7 2.8 -8%
Table 14. Projected importance of fuel efficiency measures
57