environmental impact study - eis · the environmental impact study and ... environment and...
TRANSCRIPT

EnvironmentalImpact Study - EIS
Implantation of a SmallHydroelectric Power Station –
Santa Luzia Alto SHS
Prepared by:
AUGUST / 2007

2
Terra - Consultoria em Engenharia e Meio AmbienteLtda.
PRESENTATION
Increasing concern regarding the environment has led the country to deploy a moreefficient and comprehensive environmental policy, aiming at fulfilling new environmentalneeds. This new environmental policy can be found in the legislation currently in force.
Environmental studies aim to ensure welfare of the today’s society as well as futuregenerations, thus we must adhere strictly to the rules governing these studies and thereare further efficiency requirements and more constant oversight, to ensure compliancewith environmental legislation.
The project’s characteristics and the location proposed for construction, require theassessment of possible environmental impacts caused by the project within the scope ofthe Environmental Impact Study and Environmental Impact Report – EIS/EIR.
This work presents the Environmental Impact Study – EIS for the works to build andoperate of the Small Hydroelectric Power Station – Santa Luzia Alto SHS, located on theriver Chapecó, near the cities of São Domingos and Ipuaçu, State of Santa Catarina, asa basis for the environmental licensing process involving the state environmentalagency, FATMA – Fundação do Meio Ambiente (Environment Foundation).
This study was developed by an independent and reputable company, with amultidisciplinary team, registered in the Federal Technical Register for EnvironmentalProtection Activities and Instruments held by IBAMA - Brazilian Institute of theEnvironment and Renewable Natural Resources and with broad experience in thesetypes of studies.
This Study aims to present technical solutions and actions to avoid or minimize variousenvironmental impacts from the works to build operate the Small Hydroelectric PowerStation – Santa Luzia Alto SHS, located on the river Chapecó, between the cities of SãoDomingos and Ipuaçu, which will have a 28.5 MW output.
Therefore, Construtora Gomes Lourenço LTDA., the company building the SHS,contracted a special consultancy to produce this Environmental Study to comply with theenvironmental legislation, specificallt CONAMA Resolution 001, of January 23rd, 1986,CONAMA Resolution No. 237, of December 19th, 1997, as well as CONSEMAResolution 01/2006, which requires an EIS/EIR for hydroelectric power generationprojects above 10 MW.
The scope of this study comprises general information, project description,environmental diagnosis, integrated environmental analysis, identification andassessment of environmental impacts, environmental control measures, culminating withcontrol and monitoring programs for SHS deployment, in order to avoid, minimize andcontrol negative environmental impacts and leverage positive impacts.

3
Terra - Consultoria em Engenharia e Meio AmbienteLtda.
TABLE OF CONTENTS1. JUSTIFICATION ................................................................................................................6
2. OBJECTIVES......................................................................................................................8
3. GENERAL DESCRIPTION OF THE PROJECT ..............................................................9
3.1. General Information ......................................................................................................................93. 1 . 1. Name of Project....................................................................................................................................93. 1 .2. Project Location ....................................................................................................................................93.1.3. Company Details ...................................................................................................................................10
3.2. Project’s Description .....................................................................................................................103.2.1. General Project Layout ......................................................................................................................... 123.2.2. River Diversion ..................................................................................................................................133.2.3. Dam ........................................................................................................................................................ 143.2.4. Spillway ................................................................................................................................................. 143.2.5. Diffusion Valve .....................................................................................................................................153.2.6. Adduction Channel................................................................................................................................ 153.2.7. Water Intake........................................................................................................................................... 153.2.8. Penstock ................................................................................................................................................. 153.2.9. Power House and Flow Channel ..........................................................................................................163.2.10. Mechanic Equipment .......................................................................................................................... 163.2. 1 1. Transmission Line for interconnection with System ...................................................................1 83.2.12. Sanitary Output................................................................................................................................. 18
3.3. Construction Planning .................................................................................................................203.3. 1. Construction Planning........................................................................................................................213.3.2. Construction and Assembling Phases ................................................................................................233.3.3. Construction Site Planning ................................................................................................................... 253.3.4. Physical Schedule ..................................................................................................................................27
4. LEGAL AND INSTITUTIONAL ASPECTS.................................................................. 28
4.1. Environmental Licensing ............................................................................................................28
4.2. Licensing Competences ................................................................................................................29
4.3. Licensing Stages ............................................................................................................................29
4.4. Legislation Related to the Project ..............................................................................................30
4.5. Fauna and Flora Protection ........................................................................................................35
4.6. Historic, Artistic and Natural Heritage Protection.................................................................39
4.7. Collocated Plans and Programs .................................................................................................40
5. ALTERNATIVE LOCATION AND TECHNOLOGIES ..............................................43
5.1. Technology Alternatives ..............................................................................................................43
5.2. Location Alternative ....................................................................................................................456. PROJECT INFLUENCE AREAS.................................................................................... 48
6.1. Directly Affected Area – DAA ...................................................................................................48
6.2. Direct Influence Area – DIA .......................................................................................................48
6.3. Indirect Influence Area – IIA .....................................................................................................48
7. METHODOLOGY ........................................................................................................... 49
7.1. Introduction ...................................................................................................................................49
7.2. “Diagnosis” Particularities ..........................................................................................................49

4
Terra - Consultoria em Engenharia e Meio AmbienteLtda.
7.2. 1. Research Techniques and Sources of Information ............................................................................. 50
7.3. Identification and Evaluation of Impact s .................................................................................518. ENVIRONMENTAL DIAGNOSTIC.............................................................................. 55
8.1. Physical Environment ..................................................................................................................558. 1 . 1. Weather and Meteorological Conditions .......................................................................................... 558. 1 .2. Geology, Geomorphology and Soils ..................................................................................................588.1.3. Water Resources ...................................................................................................................................648.1.4. Water Quality ........................................................................................................................................78
8.2. Biotic Environment ......................................................................................................................818.2.1. Terrestrial Biota.....................................................................................................................................818.2.1.1. Flora .................................................................................................................................................... 812.1.1.2. Fauna ................................................................................................................................................... 988.2.3. Aquatic Biota .......................................................................................................................................1088.2.4. Preservation Units ...............................................................................................................................111
8.3. Socio-Economic Environment ................................................................................................ 1 128.3.1. Occupation History .............................................................................................................................1128.3.2. Demographics ......................................................................................................................................1138.3.3. Infrastructure .......................................................................................................................................1158.3.3.1. Water Supply ....................................................................................................................................1158.3.3.2. Sanitary Depletion........................................................................................................................... 1168.3.3.3. Solid Waste Collection ....................................................................................................................1178.3.3.4. Electric Power ................................................................................................................................. 1188.3.3.5. Means of Communication................................................................................................................1188.3.3.6. Road System .....................................................................................................................................1188.3.4. Social Indicators ................................................................................................................................. 1198.3.4.1 Education and Health ........................................................................................................................1198.3.4.2. Human Development Index - IDH..................................................................................................1218.3.5. Economic aspects ................................................................................................................................1228.3.6. Soil Use and Occupation.....................................................................................................................1248.3.7. Leisure, Tourism and Culture .............................................................................................................1268.3.8. World Heritage, Cultural and Archeological Site .............................................................................1298.3.8.1 Archeological Site Survey ................................................................................................................1318.3.9. Land Characteristics of Affected Properties ......................................................................................146
9. INTEGRATED ANALYSIS .......................................................................................... 149
10. PROGNOSTIC .............................................................................................................. 151
10.1. Scenarios Projection .................................................................................................................15110.1.1. Scenario Tendencies .........................................................................................................................15110.1.2. Target Scenario..................................................................................................................................152
10.2. Environmental Impact Evaluation and Identification .......................................................15210.2.1. Planning Phase Impacts ....................................................................................................................1531 0.2.2. Implantation Phase Impacts .............................................................................................................15310.2.3. Operation Phase Impacts ..................................................................................................................156
10.3. Environmental Impact Evaluation and Description............................................................15710.3.1. Physical Environment .......................................................................................................................15710.3.2. Biotic Environment ...........................................................................................................................16110.3.3. Socio-Economic Environment..........................................................................................................168
10.4. Conclusive Impacts Analysis ..................................................................................................184
10.5. Program Control and Environmental Monitoring .............................................................185
10.6. Project Deactivation .................................................................................................................20111. TECHNICAL TEAM..................................................................................................... 202

5
Terra - Consultoria em Engenharia e Meio AmbienteLtda.
12. BIBLIOGRAPHY .........................................................................................................204
13. ANNEXES..................................................................................................................... 207

6
Terra - Consultoria em Engenharia e Meio AmbienteLtda.
1. JUSTIFICATION
In the beginning of this third millennium, developing countries are facing a dichotomybetween a lack of resources on one hand, and the overarching need for investmentin areas vital for economic development, on the other.
Specifically in terms of electrical power, this problem has a different scale, as withoutelectrical power, further development is very restricted, with many implications forthe welfare of the population.
The desire to achieve a certain status on the international market, however,depends essentially on energy self-sufficiency, not only in terms of generation, butalso on appropriate transmission systems.
These conditions are common in various countries however, based on its size, thissituation becomes more critical in Brazil.
The expansion of energy generating capacity in Brazil has been defined based onplanning studies which cover different time frames. These studies, consolidated indocuments such as Plan 2015 and the Ten Year Expansion Plan 1996/2005, definethe sequence of generation projects and regional interconnections needed to supplythe consumer market.
However, in the last few years investments in electricity generation in Brazil have notfollowed growth in demand. Brazil is a developing country, however the growth ofgeneration capacity has not been proportional, thus increasing the risks of anelectricity shortfall.
Energy consumption growth in Brazil is estimated to be approximately 5% a year, forthe next five years. This growth estimate may vary mainly because of the followingreasons: variation in per capita revenue, variation in population, need for rationing,excess capacity or low price of electric power, appearance of new products orservices which consume electricity, appearance of new industrial sectors or ofelectro-intensive services, new technologies for electric power generation with lowercosts.
The fall in government investment in the sector, which until the 80s received anaverage US$ 13 billion a year and in the 90s started to receive only US$ 7 billion, ispointed out by specialists as one of the main reasons the country is facing an energycrisis.
The continued increase in energy consumption and the fact that no new investmentsare made by State-owned companies (which control most of the distribution network)has boosted investment from the private sector, which takes on areas essential tothe economy by investing capital in small projects. Within the current nationalscenario and with the need to supply power in the short term, this seems to be,perhaps, the only feasible alternative for the country.
Meeting growing national energy demand has required constant action from theMME - Ministério de Minas e Energia (Ministry of Mines and Energy) in order toguarantee

7
Terra - Consultoria em Engenharia e Meio AmbienteLtda.
conditions so that the private sector can start developing new power generationunits, to expand power supplies rapidly and efficiently.
According to data from the BIG - Banco de Informações de Geração (GenerationInformation Database) from ANEEL - Agência Nacional de Energia Elétrica (NationalElectric Power Agency), there are 1,619 operating projects registered in Brazil,generating 98,435,675 kW of power. For the next few years an increase of26,298,868 kW will be provided in the generation capacity, based on the 88 projectscurrently under construction and another 521 which have been authorized,according to the figures in Table 01 below.
Table 01 – Description of the Brazilian Power Sector.Tipo de Usina
Situação AtualEOL SHS CGH UHE UTE UTN SOL SOMA
Usinas emOperação
15 281 204 158 958 2 1 1.619
Potência (KW) 239.250 1.696.87 108.328 74.438.69 23.129.335 2.007.000 20 101.619.498Usinas emConstrução
1 58 1 12 16 - - 88
Potência (KW) 10.200 1.059.57 848 2.539.800 797.818 - - 4.408.236UsinasOutorgadas
108 190 67 22 134 - - 521
Potência (KW) 4.681.74 2.825.79 45.495 3.987.900 10.349.703 - - 21.890.632TotalQuantitativ
124 529 272 192 1108 2 1 2.187
Potência (KW) 4.931 . 193
5.582.231
1 54.671 80.966.395
34.276.856 2.007.000 20 1 27.918.366Source: Generation Information Database – BIG / ANEEL
Of the operational power plants in Brazil, a total of 947 (59.11%) are UTE –Thermoelectric Power Plants, 277 (17.29%) are SHS – Small Hydroelectric Stations,157 (9.80%) are UHE – Hydroelectric Power Plants, 01 (0.06%) are SOL – SolarPhotovoltaic Power Plants; 15 are EOL – Aeolian Electric Power Plants (0.94%); 02(0.12%) are UTN – Thermal Nuclear Power Plants and 203 are CGH – HydroelectricGenerating Stations (12.68%).
Brazil has massive and unexplored hydroelectric potential, especially in State ofSanta Catarina. Of the above, potential Small Hydroelectric Stations – SHS are themost attractive projects because of their low environmental impact, lower level ofinvestment, shorter maturity and legal incentives.
The investor’s main objective is to generate power at a lower social andenvironmental cost, using this study to present technical solutions and actions toprevent, minimize and offset environmental impacts which may occur.
In this sense, the Santa Luzia Alto SHS is another step towards meeting energydemand in Brazil, contributing to local, regional and national economic development,while also addressing concerns involving the environment.

8
Terra - Consultoria em Engenharia e Meio AmbienteLtda.
2. OBJECTIVES
This Environmental Impact Study – EIS aims to comply with the environmentallegislation that addresses the need to develop environmental studies for thelicensing activities that alter the environment, in particular CONAMA Resolution 001dated January 23rd, 1986, CONAMA Resolution No. 237, December 19 th, 1997, andCONSEMA Resolution 01/2006 which determines the production of EIS / EIRs forhydroelectric power generation projects exceeding 10MW.
This study will present technical solutions and actions to prevent or minimize thevarious environmental impacts of the works planned for the construction andoperation of the Small Hydroelectric Station - Santa Luzia Alto SHS on the Chapecóriver, in the municipal regions of São Domingos and Ipuaçu, with 28.5 MW capacity.
Information contained in this document complies with the rules in the ReferenceTerm for Environmental Study, prepared by Terra Consultoria em Engenharia eMeio Ambiente Ltda and assessed and approved by the Environment Foundation(Fundação de Meio Ambiente) of the State of Santa Catarina – FATMA.
9
Terra - Consultoria em Engenharia e Meio AmbienteLtda.
3. GENERAL DESCRIPTION OF THE PROJECT
3.1. General Information
3.1.1. Project Name
Small Hydroelectric Station – Santa Luzia Alto SHS.
3.1.2. Project Location
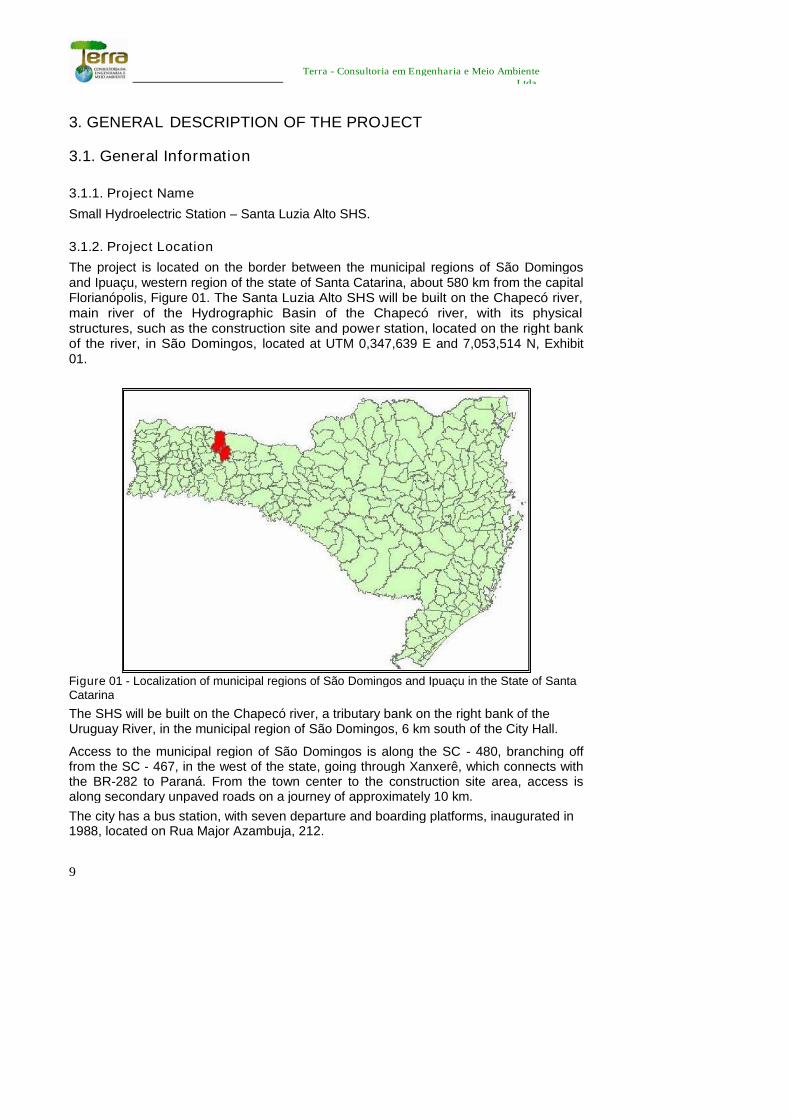
The project is located on the border between the municipal regions of São Domingosand Ipuaçu, western region of the state of Santa Catarina, about 580 km from the capitalFlorianópolis, Figure 01. The Santa Luzia Alto SHS will be built on the Chapecó river,main river of the Hydrographic Basin of the Chapecó river, with its physicalstructures, such as the construction site and power station, located on the right bankof the river, in São Domingos, located at UTM 0,347,639 E and 7,053,514 N, Exhibit01.
Figure 01 - Localization of municipal regions of São Domingos and Ipuaçu in the State of SantaCatarina
The SHS will be built on the Chapecó river, a tributary bank on the right bank of theUruguay River, in the municipal region of São Domingos, 6 km south of the City Hall.
Access to the municipal region of São Domingos is along the SC - 480, branching offfrom the SC - 467, in the west of the state, going through Xanxerê, which connects withthe BR-282 to Paraná. From the town center to the construction site area, access isalong secondary unpaved roads on a journey of approximately 10 km.
The city has a bus station, with seven departure and boarding platforms, inaugurated in1988, located on Rua Major Azambuja, 212.

10
Terra - Consultoria em Engenharia e Meio AmbienteLtda.
3.1.3. Entrepreneur’s Details
Company name: Construtora Gomes Lourenço Ltda.
CNPJ: 61.069.050/0001-10 Address: Av. Antônio Ramiro da Silva, n.º 250 – Butantã – São Paulo/SP CEP: 05.397-000 E-mail: www.gomeslourenco.com.br Telephone/Fax: (11) 3789-0500
Legal Representative: Guilherme Andrioni Salgueiro Lourenço
CPF: 066.537.858-07 Address: Av. Antônio Ramiro da Silva, n.º 250 – Butantã – São Paulo/SP CEP: 05.397-000 E-mail: [email protected] Telephone/Fax: (11) 3789-0500
Contacts:
Geographer Dr. Paulo Cesar Leal CPF: 376.927.559-49 Address: Rua Felipe Schmidt, 649 sl. 1301, Centro - Florianópolis/SC E-mail: [email protected] Telephone/Fax: Phone: (048) 3024-1436 / Fax (048) 3024-1436
3.2. Project Characteristics
This SHS is part of the hydropower project for the Chapecó river, in line with thewater head divisions based on the Review of Inventory Studies drawn up in May2001 and approved by ANEEL.
The project presented, prepared by RA Engenharia e Consultoria, has beendeveloped in line with the standards and recommendations in force in the energysector for the preparation and presentation of studies and projects for SmallHydroelectric Stations.
The implementation of the Santa Luzia Alto SHS aims to supply power atcompetitive costs to the consumer market.
The basic project and the engineering studies of the Santa Luzia Alto SHS weredeveloped out by Construtora Gomes Lourenço Ltda. based on the instructionsissued for SHS studies, projects and standards by ANEEL, relevant Brazilianstandards and previous studies on site.
After field investigations and analysis of existing studies, we can safely say that thelocation specified for the Santa Luzia Alto Small Hydroelectric Station offers goodconditions for construction, within the criteria established by ANEEL.
The proposed hydroelectric project for the Santa Luzia Alto SHS, for powergeneration, is located on the river Chapecó, 180 km from its mouth, on the border ofthe municipal regions of Ipuaçu and São Domingos, at UTM coordinates 0,347,639E and 7,053,514 N.

11
Terra - Consultoria em Engenharia e Meio AmbienteLtda.
The project will form a lake with a total area of 7.09 km² and an area, excluding the river,of 5.58 km², in other words, 709 ha and 558 ha respectively, Exhibit 02.
In developing the Basic Usage Project for Santa Luzia Alto, motorization studieswere performed to analyze 24.0 MW, 25.5 MW, 27.0 MW and 28.5 MW outputcapabilities, in order to evaluate optimal output levels.
The power studies conducted allow us to evaluate the energy benefit of eachalternative, in terms of the average power generated by the plant. In order to definethe power output for the Santa Luzia Alto SHS, a study of energy/economicanalyses, on a marginal cost-benefit basis, was performed considering the alternateconfigurations, their costs and energy benefits, seeking to obtain the bestconfiguration in terms of the availability of water resources and the feasibility ofconstruction.
In this analysis, we used the following criterion:
The energy benefits were estimated based on the average monthly flows forthe Santa Luzia Alto SHS, for 24.0 MW, 25.5 MW, 27.0 MW and 28.5 MWconfigurations;
The costs of implementation were calculated at the Santa Luzia Alto SHS, for24.0 MW, 25.5 MW, 27.0 MW and 28.5 MW configurations, with the costsbased on June/2006;
The period considered for amortization of the investment was 30 years, withthe capital recovery at 10 % per year;
The operation and maintenance cost were estimated at 12.00 R$/MWh;
The sizing reference cost for expanding the electricity sector was equal to131.00 R$/MWh;
For upstream water level a normal maximum value of N.A. 589.00 m wasused;
For downstream water level the corresponding normal maximum value ofN.A. was used for the plant immediately downstream from Santa Luzia Alto,called UHE Quebra Queixo, specified in Inventory Studies of the Chapecóriver, and equivalent to 552.00 m.
In the current phase of studies for the Santa Luzia Alto SHS, in which the BasicProject is being consolidated, based on SIPOT/ANEEL data we found that themaximum N.A. at the Quebra Queixo plant, which is already in operation, is equal to549.00 m, or three meters less than expected.
This increases the energy generated at the Santa Luzia Alto SHS, based on to thehigher head available at the location (since N.A. of Quebra Queixo at a height of552.00 m would "drown" the output from the power station at Santa Luzia Alto). Withthe change to 549 m, the power station is freed up, the reservoir retreats, leaving thepower station above the still water level, draining immediately after it ends. Thisaspect allowed us to change the optimum capacity at Santa Luzia Alto SHS to 28.5MW.

12
Terra - Consultoria em Engenharia e Meio AmbienteLtda.
Thus, we again find that with the reduction in the level at UHE Quebra Queixo theSanta Luzia Alto power station water outlet will no longer empty into the UHEreservoir, although it is within the riparian range originally planned.
From an environmental standpoint the boost to 28.5 MW is positive, because thesize of the lake will not change. Increasing the capacity at Santa Luzia SHS will notreduce or increase its negative impacts, however, there would be a considerableincrease in positive impacts, especially in socioeconomic environment, encouragingeconomic activity and increasing the supply of electricity in the region.
We also noted, from an environmental standpoint, that the new position of the powerstation, does not alter the impact previously diagnosed, as the water output not onlydoes not reach the Quebra Queixo reservoir, but also does not affect the aquaticbiota or the sedimentary aspects of the section in question.
3.2.1. General Project Layout
The project to build the Santa Luzia Alto SHS presents a block formed by a dam withconcrete spillway located on the river bed and by two small earth abutmentscompleting the closure of the river on the left and right banks.
The concrete dam, to be built in C.C.R. (concrete compacted with roller), will be builton a section of riverbed and in the spillway. The spillway will be the free flowing type,with a crest at an elevation of 589.00 m, and total length of 350 m. The rest of theconcrete dam will crest at an elevation of 594.00 m, will be 5.0 m wide, with anupstream vertical face and with slope 0.75 H:1.0V downstream. The maximumheight of the foundation will be 35.0 m.
The earth abutments on the left and right banks will crest at an elevation of 594.00m with lengths of 228.3 m and 235.6 m respectively, with embankments sloping at0.0V:2.0H upstream and downstream. The maximum height of the foundation will be26.0 m.
The river diversion for construction of the dam will use concrete penstocks built onthe left bank, formed by 03 cells 4.50 m wide and 8.0 m tall. Its total length will be35m.
The supply pipeline circuit, to be built on the right abutment, will consist of thefollowing structures: adduction channel, water intake, a set of three penstocks,power station with three horizontal Francis units and tailrace. Given the relativeproximity of the power station and the water intake, the latter will act as a cargochamber, not requiring the balance funnel.
The substation will be conventional, a single line with three entry bays and two linebays. The substation courtyard will be located on the right side of the power station anddownstream from the tailrace, in an area approximately 800m2 available at an elevationof 565m.
The general layout of the works can be seen in Exhibit 03.

13
Terra - Consultoria em Engenharia e Meio AmbienteLtda.
3.2.2. River diversion
The river diversion was designed so that the dam could be built in a dry area, andthis is a simple and low cost diversion.
The river diversion will use concrete sluice gates comprising three 4.50 m wide by8.0 m high cells, to be built on the river’s left bank, and two rock cofferdams, oneupstream and the other downstream.
This gallery, scaled in order to allow an outgoing flow of 843m3/s, which correspondsto the output with an ROI of 25 years within the quarterly period of January/April, willhave a total length of 30m, with a floor at an elevation of 559m.
The diversion gallery mouth will be provided with two closing grooves, one upstreamfor the flow-cut metal floodgate and downstream for the concrete cofferdam gates.After closing the first cell with the metal flow-cut floodgate and concrete cofferdamgate, the flow-cut floodgate will be removed for use in the second cell and so on untilfinal closing.
The cofferdams will be constructed using a 12.00 m wide crest, made of foundationrock with external clay soil sealing. Sand filters and transitions made from processedgranular materials will be inserted between the soil and foundation rock.
The upstream and downstream gallery will be excavated with channels to adduceand return the gallery diversion waters. The upstream channel will be approximately170 m long and the downstream channel 100m long and they will be partiallyexcavated in soil and rock.
In the first phase the river will flow along its natural bed. The left and right bankworks will be executed dry to shelter natural barriers, therefore maintaining a 570 melevation for the natural terrain. This level is higher than the river water level foroutput over a period of 5 years in terms of the complete hydrologic year.
In this phase, the following works will be required:
Partial excavation of the upstream and downstream channels for thediversion gallery (left bank);
Excavation and construction of the diversion gallery (left bank);
Link wall with the earth dam, at least up to an elevation of 573.0 m;
Left bank dam, at least up to an elevation of 573.0 m;
Left bank dam, at least up to an elevation of 573.0 m;
Closing in the area between the excavation and the spillway blocks using acofferdam, upstream and downstream from the gallery
On the right bank, all services up to an elevation of 570 m, may be executed in orderto avoid works creating a bottleneck in the 2nd Phase of the diversion which will beonly 4 months long.
In the second phase of the diversion, which will be carried out during the dryseason, the excavations of the upstream and downstream channels will becompleted, allowing the water to run through the gallery diversion.

14
Terra - Consultoria em Engenharia e Meio AmbienteLtda.
Upstream and downstream cofferdams will be built in sequence at respectiveelevations of 573.60m and 565.60m.
The cofferdams will be built at an embankment point, using foundation rock withexternal clay soil sealing. Processed granular transition materials will be usedbetween the soil and foundation rock.
3.2.3. Dam
The concrete barrier measuring 430m will be the main structure of the dam. In thecentral part above the bed of the river there will be a free-flowing spillway 300m inlength and a crest at an elevation of 589,00m, which corresponds to normal waterlevel for water-level plants. Closing the abutments on the left and right banks we willuse concrete blocks connecting with the earth embankments, both at an elevation of594m.
The dams on the left and right banks will have vertical and horizontal drainage forcontrolling percolation.
The earth dams, which complete the enclosures on the left and right abutments, willcrest at an elevation of 594,00m, and length of 228,3m. The upstream anddownstream embankments will slope at 1.0V:2.0H.
In Exhibit 04 the plant and barrier sections are presented.
3.2.4. Spillway
The spillway will use a gravity type concrete structure, and will function hydraulicallywith a free-flowing weir, releasing floodwaters along its 250m length.
The crest of the spillway will be at an elevation of 589.00m, which corresponds tothe normal water level of the plant, which will operate at water level.
The spillway structure will be fully supported by rock. The downstream face, in astepped format, will allow the dissipation of most of the effluent energy flow.
The spillway will allow the passage of the maximum flood levels, whose peak valueis equal to 3,877.0 m3/s, with a maximum height of 3.00m.
A dispersion valve will be installed in the concrete dam structure on the left bank toguarantee the environmental flow discharge necessary downstream from the barrier.
Upstream from the dispersion valve a gate vale will be installed for maintenancepurposes.

15
Terra - Consultoria em Engenharia e Meio AmbienteLtda.
3.2.5. Dispersion valve
In the concrete dam structure on the left bank a dispersion valve will be installed with3.60m³/s output, which will guarantee the environmental flow necessary downstreamfrom the barrier.
The flow will be taken in frontally, on the upstream face of the spillway, through anopening 1.40m by 1.40m, equipped with a grille. A 900 mm diameter pipe willconduct this flow to the dispersion valve, with a diameter of 700 mm.
Upstream from the disperser valve a slide valve will be installed, 700 mm indiameter, for maintenance of the disperser valve.The axis of the disperser valve is positioned so that its discharge flow is above thedownstream water level.
The valves, both the butterfly and dispersion vales, will be operatedmanually. 3.2.6. Adduction Channel
The adduction channel in the trapezoidal section was designed so that the speed ofthe flow will not exceed 1,0 m/s, as part of the channel will be excavated from thesoil, without a lining. The length of the channel will be about 202m.
3.2.7. Water intake
The location of the water intake aims to reduce the length of the penstocks as muchas possible.
Based on this, the water intake structure was placed on the top of the natural slope,with suitable foundation structure and easy access.
The water intake structure will be a gravity type supported on solid rock. Its totalheight will be about 20m reaching an elevation of 595m.
For the operating conditions of the intake, with a flow of 85,0m3/s, the maximumspeeds through the grille and in the emergency floodgate section are 1,0 m/s and2,0 m/s, normal values in hydraulic designs for this type of mechanism. Thesubmergence adopted for the water intake is sufficient for the maximum turbine flow.
The analysis of the global stability and security revealed that the structure of thewater intake is secure, with security factors and tension levels in the foundationcompatible with normal values, under all conditions.
3.2.8. Penstock
The penstocks at Santa Luzia Alto SHS are exposed, open air, anchored andsupported by concrete blocks set on rock. The general layout of the penstocks wasbased on the proposed geometry of the adduction circuit, of the

16
Terra - Consultoria em Engenharia e Meio AmbienteLtda.
position chosen for the water intake and for the power station.
When defining the diameter of the penstocks, the economic aspects and operatingconditions of the turbines were considered, namely: turbine regulation andefficiency.
The operating conditions for the turbines depend on the inertia of the water columnin the penstock, in other words, the sum of the products of the speed and length ofeach section of the penstock.
They therefore depend on the diameter and length of the pipe. Followingconsultation with the manufacturers, for adequate regulation and efficiency of theturbine-generator group, each penstock needs to be 2.8m in diameter, requiringthree penstocks around 285m in length.
3.2.9. Power station and Tailrace
The Santa Luzia Alto SHS with a total output of 28.5 MW will include a power stationlocated downstream from the dam and built on the right bank of the Chapecó river,Exhibit 05.
The structure of the power station was designed to contain three horizontal Francisturbo-generators units providing 9.50 MW.
The power station is 25.8m long and 54.9 m wide, including the assembly area. Theelectrical and mechanical galleries, as well as the command room are locatedupstream from the units.
Downstream, a group of cofferdam floodgates will close the suction pipes of theunits.
The tailrace was designed based on the hydraulic conditions, the size of the powerstation and the turbine suction pipe, as well as the topographic characteristics onsite. The trapezoidal channel will have a mouth 45.0m wide and about 100m long.
3.2.10. Mechanical Equipment
Mechanical Equipment installed at the Santa Luzia Alto SHS:
Water Intake Metal Grills: Metal grills will be installed to retain submerged materialslarger than 50 mm, thus protecting the turbines.
Water Intake Wagon Gate: The wagon gates protect the penstocks. Each wagongate will be made of a single panel and will sealed upstream, which will facilitateaeration of the penstock downstream of the floodgate and reduce the hydrodynamiceffects when closed.
Water Intake Overhead Crane: The overhead crane will be installed on a concretestructure at the top of the water intake and will be used for assembly andmaintenance services involving the wagon gate grills and the rake that cleans thegrills.

17
Terra - Consultoria em Engenharia e Meio AmbienteLtda.
Penstock: The penstocks will feed three turbines. They will be installed externallyand inclined with the upstream ends supported by the structure of the water intake,with intermediate sections supported by concrete blocks and the downstream endsdirectly connected to the input system for the 3 turbines.
Hydraulic Turbines, Regulators and Valves: In the Power Station there will be threegroups of similar horizontal turbine generators installed, each group made upbasically of one generator with 10,0 MVA rated power at 13.8 kV and frequency of60 Hz, and one Francis hydraulic turbine with rated power of 9.5 MW under rated nethead of 35.9m.
Power Station Overhead Crane: In the Power Station there will be an overheadcrane with a capacity of 350 kN which will help to assemble the hydro generator andauxiliary equipment After generator group startup, the cranes will be used for Plantmaintenance operations.
Suction Pipe Cofferdam Gate: The cofferdam floodgate for the suction pipes emptythe turbines by sealing the water inlet in the suction pipe tailrace. In the PowerStation there will be a floodgate cofferdam made of a single element, with the samefront and lateral floor height which can therefore be installed in any of the threesuction pipes.
Electric Downstream Hoist: In the External Area Downstream an electrical pulley willbe installed to operate the cofferdam floodgate for the Suction Pipe.
Filling and Emptying System The emptying and filling system will completely emptyor fill the penstock, spiral casing and suction pipe for the generator units. Thepenstock filling will use gravity, through one pipe installed upstream of the floodgatefor the Water intake. The spiral casing and suction pipe will be emptied by a pump.
Drainage System: The drainage system will collect all of the water in the PowerStation from percolation, infiltration, equipment discharges, pipe leaks and floorcleaning and transport it to the tailrace.
Compressed Air Service System: The compressed air service system will produce,store and provide compressed air for the Power Station, for piping, equipment andsurface cleaning, operation of pneumatic tools and air supply for instruments. Thissystem will include 1 (one) air compressor, one air reservoir and one feeding pipeand a pipe network.
Hydraulic Measurement System: The hydraulic measurement system will include thefollowing measuring instruments: Measurement of the Downstream Levels of thePlant, Measurement of the Water levels upstream, Measurement of Load Loss at theGrills, Detection of Balance of Pressure in the Wagon Gate and Measurement of theFlow in the Spiral Casing, Measurement of Pressure of the Spiral Casing,Measurement of Pressure in the Suction Tube.

18
Terra - Consultoria em Engenharia e Meio AmbienteLtda.
3.2.11. Transmission Line for interlinking with the System
The project at Santa Luzia Alto SHS includes interconnection of the pumping andmaneuvering substation SE-SL to the 138 kV dam at the Ludesa SHS substation,using a 138 kV single circuit transmission line approximately 6 km long.
3.2.12. Sanitary Flow
In order to evaluate the minimum flow over 7 consecutive days associated with a 10years of return period, in the basin of the Chapecó river at the Abelardo Luz station(code ANA 73600000), a series of daily average flows at the station was used,covering the period from April/1953 to January/2006, with data missing from a fewyears: 1953 and 1956, inconsistent values for 1990 and 1991 and more extensiveperiods with no data in 1966 and 1967.
Based on the series of daily average flows, the moving averages for 7 consecutivedays were calculated, establishing the minimum discharge over 7 days for eachyear, building a series of 47 values, as presented in Chart 02.
Table 02 – Minimum weekly flow.
Year Minimum 7 Day Flow (m3/s)
1953 ----1954 9.81955 4.91956 4.21957 4.61958 3.91959 9.81960 4.91961 7.31962 7.31963 8.01964 9.81965 7.31966 ----1967 ----1968 6.11969 16.81970 11.01971 10.41972 11.01973 16.81974 11.01975 11.01976 12.01977 6.71978 2.91979 4.61980 12.01981 9.8

19
Terra - Consultoria em Engenharia e Meio AmbienteLtda.
1982 8.01983 17.81984 11.01985 10.81986 8.11987 9.41988 6.81989 22.61990 32.01991 23.81992 22.61993 18.01994 18.01995 10.11996 13.81997 13.81998 18.01999 13.12000 13.12001 18.02002 7.82003 9.42004 10.52005 11.6
Average (m3/s) 11 .44Standard (m3/s) 5.84
Initially, we define the reduced and variable data expressed through (Gumbel
distribution line): y = a * (x - 3 ) , being a and 3 the parameters:
a = - ry / rx and 3 = µx – (µy / a)
Based on the sample size (50 values), we obtained the following table
values: ry = 1.1607 (function of sample size); and
rx = 5.84 (standard sample diversion) which provides = 0.1988
µx = 11.44 (sample average); and
µy = 0.5485 (function of sample size) which provides 3= 8.68
Finally, utilizing the Gumbel distribution expression:
-0.1988 * (Q7,T – 8.68 ) = - ln * ( -ln (1 – 1/T), for T = 10 years with:
Q 7.10 = 5.03 * ln ( - ln (1 – 1/10) + 8.68 , we obtained:Q 7.10 = 2.624 m3/s which corresponds to the flow for 7consecutive days and 10 year return period.
Based on the equations defined by Tucci (1991) for the 18 homogeneous regions inRio Grande do Sul, an evaluation was made based on the data from the AbelardoLuz station.
In the regions defined by Tucci, the course of the Chapecó river corresponds toregion 5, providing for TR= 10 years a minimal adimensional flow of 0.50.

20
Terra - Consultoria em Engenharia e Meio AmbienteLtda.
Using the proposed methodology, a minimal flow of Q 7,10 = 2,68 m3/s was obtained,a value which is compatible with that defined by Gumbel's equation (2,624 m3/s),adopting the latter.
In order to define the flow for 7 days and 10 year return period at the Santa LuziaAlto site, we transferred the flow obtained at the Abelardo Luz station to the projectlocation, applying a factor based on the drainage area ratios in both locations,obtaining:
AD Sta Luzia / AD A Luz = 2,540/1 850 = 1.3730
Applying this factor to the minimum flow from Abelardo Luz, the following flow wasobtained for the SHS:
Q 7.10 = 1.3730 * 2.624 = 3.60 m3/s
3.3. Construction Planning
Planning mainly aims to define the building sequence for the services based on anadequate methodology in relation to the local conditions, establishing supportlogistics for the construction, complying with the deadlines and reasonable andtechnically optimized costs. This involves construction of the Santa Luiza Alto SHSpower plant with the power station built in the right bank of the Chapecó river andincludes the following structures:
Works on the River
Diversion:
Cofferdam
Detour Sluice
Work on the Generation Circuit
Adduction Channel; Water Intake;
Penstock; Power Station and
Tailrace.
Barrier and Control works:
Free-flowing Spillway in CCR;
Lateral Walls in CCR;
Earth dam on the right bankEarth dam on the left bank
Lateral Walls
Control of Sanitary Discharge
Work on the Associated Transmission System:
Pumping Substation
Transmission Line
Prior to the constructive planning per se, the general aspects of the projectconstruction area and the regional logistics were analyzed.

21
Terra - Consultoria em Engenharia e Meio AmbienteLtda.
For a better understanding of the general planning for the works, the presentationwas laid out as follows:
Construction Planning, where various construction and assembly phaseswere defined, the sequence of construction by structure, the work plan, theresources needed in terms of equipment and the construction site;
Detailed physical timetable, showing the sequence of construction worksdetailed by type of service and structure.
The description of the above items intends, in a simple and objective manner, topresent the events which will occur during the works, the sequence and form inwhich they will be executed and all the necessary logistical support, such as:Resource mobilization, supplies, construction site and other support infrastructureworks.
Prior to beginning the works, the detailed engineering design is required, as part ofthe planning process, which will consist of scaling, detailing and consolidating earthand concrete structures to be built, as well as electromechanical equipment, suchas: turbines, generators, hydromechanical equipment, cargo moving equipment andelectric equipment. Based on the guidelines adopted in the basic project the size,location, form and composition of each structure and equipment will be defined andconsolidated, based on local conditions.
Thus, January 2007 was the date set to start detailing the detailed engineeringdesign, which may be modified as a result of ANEEL’s releases and approvals,consequently causing some alterations and changes to the schedule, but withoutaffecting the final deadline for the works.
3.3.1. Construction Planning
Specific Considerations
The plans for the works at Santa Luzia Alto SHS and for the Transmission Systemwere developed after a detailed analysis of the basic project, the local conditionsand logistics supporting the service fronts, also based on a preliminary evaluation ofthe specific details in the detailed engineering design in order to ensure technicallyand economically consistent building methods are used in the construction area.
Initially the basic assumption for our planning was that the works would begin in mid-August 2007 (month 01) and the operations would start up in May 2009.
It is essentially a SHS project with quite specific characteristics, in which the workson the generation circuit and the dam (VT) are isolated and concentrated at theriver’s right bank and bed. This means they can be built at any time, completelyreusing the materials dug in earth or rock.
The works present a moderate movement of earth and rock from cuts andembankments, with production hardly influenced by the rain. May, June, July andAugust are the most unfavorable months for excavations, when it is more risky tocarry out construction work on land, requiring

22
Terra - Consultoria em Engenharia e Meio AmbienteLtda.
continuous and temporary drainage works. 30 to 50% of the time spent workingduring this period will be lost.
Because of the very good location of the power station at the foot of a slope, theplanning for excavation works during the first months takes into account theexpansion of the area at an elevation of 552m with the use of material dug from thefoundation of the power station, heading partially towards the river, creating aprotecting cofferdam in the final section of the tailrace, fully encompassing theexcavation area at the power station. That protection will use the material from ofthe initial excavations of the power station and will be placed directly in the river.Subsequently, the excavations and the respective protections will be built.
The excavation of the adduction channel can be performed at any time will not beinfluenced by the water levels, which will always be at elevations below 570m.
The following parameters were deemed critical factors during planning, in addition toa careful study of the basic project:
Volume of services;
Local topographic conditions;
Climatic conditions;
Work support logistics;
Definition of proper construction methods;
Productivity of construction equipment.
Among the items above, we shall quickly cover the Work Support Logistics, as theothers are covered in specific items. In this category we grouped all measuresexpected to provide the sites with facilities required for its construction, as well asensuring continuity at service fronts. Within this area, the following issues arehighlighted:
Mobilization Plan;
Supply Plan;
Availability of equipment;
Stock of fuel and basic materials;
Availability of qualified personnel and accurate forms of hiring;
Employees’ meals, rest and leisure;
Hospital and medical care;
Proper application of safety standards;
Regional supply sources;
Infrastructure and work site.It is important to point out that within the support logistics, we have included theactivities required to comply with Hygiene and Occupational Medicine regulations,as well as the standards on Safety and Accident Prevention.

23
Terra - Consultoria em Engenharia e Meio AmbienteLtda.
3.3.2. Construction and Assembly Phases
The construction and assembly stages require different construction phases withinthe conditions established by the project. They must always comply with thetechnical and economic conditions in order to conduct of the services withinacceptable costs parameters and periods, describing the difficulties involvingsupport infrastructure and supply conditions.
In the executive planning, four construction phases and assembly phases arehighlighted and presented in Exhibit 06.
First Phase
The first phase of services characterized below, involve mobilizing the constructioncompany, building the infrastructure and work site. The initial phase of the detailedengineering design includes establishing further details as well as confirmation andevidence of services carried out in the field.
The first phase involves keeping the river in its natural bed and the beginning of theexcavation works for the diversion channel and dry sluices at the left bank.
At the same time, the earthworks for the generation circuit include the power stationand tailrace, water intake and penstocks.
Initially the excavations for the power station will be carried out by raising theprotection wall downstream from the tailrace and slopes of the power station, initiallyused as a protecting cofferdam. This will stop the water from penetrating theexcavations for the power station and tailrace.
This work shall be supplemented by the embankments for the substation andassembly area. Next, additional access ways shall be completed so that excavationservices can be carried out at any time of the year. Additionally, note that the barrierdownstream from the tailrace will act as a cofferdam up to construction of thefloodgates for the suction pipe. Among the other services and works in this phase,the following are highlighted:
Surveys and supplementary investigations;
Detailing of the detailed engineering design
Deforestation and clearing of the work site areas and structures at the rightbank;
Construction of the support works (work site, service roads and others);
Excavation of the adduction channel between the downstream and upstreambarriers (ME);
Excavation of sluices and blocks 01 and 02 of the embracing wall (ME);
Treatment of foundation and concrete application of sluices and blocks 01and 02 of the spillway next to sluices at an elevation of 573 (ME);
Excavation of the power station, water inlet and adduction channel (MD);
Earthwork of the substation and assembly areas;
Excavations of the power station, tailrace and penstock.

24
Second Phase
The second phase diverts the river with the underwater construction of the first stageof cofferdams upstream up to an elevation of 573m and downstream at an elevationof 567m, completely closing off the river.
This phase involves the excavations of other works for the generation circuit andexecution of the river diversion, concreting the diversion gallery and excavations ofthe water inlet, adduction channel and control inlet. Subsequently, the concreteworks on the power station, penstocks, and spillway, as well as the stabilization ofthe balancing berms for the embankments formed by cuts and land-fills. This is alsowhen assembly of the fixed parts and moulds of the suction pipes begins. Thefollowing services are highlighted at this stage:
Closing off the cofferdam between VT-ME blocks and natural slopes 573;
Removal of the upstream and downstream barrier ME;
Construction of both cofferdams upstream and downstream;
Excavation and lining of the VT foundation of river bed;
Treatment and concrete application for the foundation for the power station;
Concrete Application of the VT in CCR up to an elevation of 573;
Concrete Application VT up to an elevation of 589 and walls up to anelevation of 595 ;
Execution of the land dam for the ME;
Execution of the land dam for the MD;
Concrete application for the structures of the power station and penstocks;
Concrete application for the drain structures and walls;
Excavation of the foundations for the water inlet, adduction channel andcontrol structure;
Excavation and treatment of the foundation for the protection dike.
Third Phase
Completion of the dam works – VT, Walls, BTMD and BTME. The followingservices are highlighted:
Concreting of the power station and water inlet;
Concrete application of the foundation blocks for the penstocks;
Construction of built-in metal items;
Assembly of the penstocks;
Construction of the earth dikes on lake abutments;
Assembly of electro-mechanical equipment.
Treatment of the adduction channel;
Assembly of hydromechanical equipment;
Assembly of the lifting and cargo transportation equipment.

25
Terra - Consultoria em Engenharia e Meio AmbienteLtda.
Fourth Phase
The fourth phase involves receiving the first turbine on site, starting the electro-mechanical assembly of the generating equipment through to commissioning,testing and commercial generation.
The following services are included:
Covering and finishing of the power station;
Assembly of turbines and generators;
Assembly of electric equipment;
Civil works and assembly of substation and transmission line;
Plugging the galleries – river through the spillway.
Commissioning and Testing
Commercial energy production
Assembly of turbines and butterfly valves;
Assembly of generators and accessories;
Assembly of auxiliary mechanical equipment;
Assembly of electric and accessory equipment
Assembly of substation;
Commissioning and Testing
Commercial energy production.
The works on the 138 kV transmission line that connects the substations at LudesaSHS and Santa Luzia Alto are external works included in this phase, forming, theentire generation and transmission system.
3.3.3. Construction Site Planning
The facilities on the works site, Exhibit 07, were designed based on field surveys atthe work site, experience at similar sites and requirements drawn up from executiveplanning. The size of the facilities always considered the peak needs of each workfront, both cumulatively and individually.
The work site and accommodation will be modular and pre-fabricated so that theycan be used again, a critical condition for selection because of the short period oftime they will remain on site.
The site accommodation will be sufficient to accommodate employees during peakwork periods and, if required, the projected modules can be enlarged. The projecttakes into account the fact that some employees will be hired from neighboring citiesand will be driven to work daily. The canteen will be able to serve up to 120 peoplein three shifts.
The following facilities are highlighted here as the main facilities:
Accommodation; Leisure Area;

26
Terra – Consultoria em Engenharia e MeioAmbiente Ltda.
Administrative Technical Office;
Warehouse;
Out-patient clinic;
Guard house and Chapeira;
Soil and Concrete Laboratory;
Store-room for Sacked Cement; Concrete Centre and Wet Chamber
Mould Centre;
Frame Centre;
Storeroom for Explosives;
Crushing Centre;
Assembly and Maintenance Workshop;
Deposits of Fuels and Lub-oils; Water Collection and Reservation System.
Treatment systems of Sanitary Effluents and others.
The Crushing Centre and Concrete Centre provided for on site will be installed close tothe quarry located downstream from the power station.
The work site will be located on a plateau located between the 600 m and 615 melevations upstream from the generation circuit on the right bank, at approximately 900m from the geometric center of the power station. The explosives storeroom will bedesigned accordingly and be built at the hillside downstream, complying with the relevantsafety standards.
Construction at a strategic location aims to offer better services on sites and facilitate themachine, vehicle and equipment traffic, without interfering with the service units.
The proposed layout includes independent areas for each activity, be they management,accommodation or production areas.
In addition to the facilities at the main work site, we have included field WCs for theservice fronts and an auxiliary work site close to the power station on the right bank,basically comprising of a large service tent, field office and WCs.
When building the work site, earthworks and adaptations as well as infrastructure works,such as electric network, supply of drinking water, water networks, sewerage systemsand individual concrete cesspools for each facility and drainage services are included.The maintenance workshops will include sand / pebble boxes for the collection of oilywater, preventing contamination of local water sources.
The mobilization of the work site will begin immediately, starting with the earthworks andimplementation of the inspection and builder’s offices, mechanical workshop, kitchen andcanteen and outpatient clinic. Afterwards, the industrial facilities will be built and thestore-areas for rock, pebbles and sand will be defined.
27
Terra - Consultoria em Engenharia e Meio AmbienteLtda.
3.3.4. Physical Schedule
The physical timetable submitted reflects the general course of services and works,showing the construction sequence, their deadlines and the inter-relationship amongthe events.
March 2007 was defined as the deadline to start works, taking into account theperiods for ANEEL approval and licensing.
Commercial generation is scheduled to occur in May 2009.
The main condition used to specify the milestones was the period required tomanufacture and supply the turbines with a minimum deadline of twelve months forthe first machine and up to sixteen months, for the third.
The critical path includes construction of the power station, including civil works,designs, production, transport, assembly/supervision, testing and commissioning ofthe turbo-generating units and the electromechanical equipment. The physicaltimetable is represented in Exhibit 08.
28
Terra - Consultoria em Engenharia e Meio AmbienteLtda.
4. LEGAL AND INSTITUTIONAL ASPECTS
Environmental law provides rules that regulate the interrelation between man and theenvironment and aims to defend and preserve the latter, ensuring oversight andcompliance with these rules.
Environmental licensing is an administrative procedure through which the State orFederal Government requires parties that want to develop potentially or effectivelypollutant activities to issue environmental studies and environmental monitoring andcontrol plans and programs.
This chapter is devoted to the introduction and analysis of the main legal provisionswithin the Federal, State and Local spheres which must be taken into account whenplanning and operating the Santa Luzia Alto SHS.
4.1. Environmental Licensing
Environmental Licensing is a planning tool, part of National Environment Policy (Law No.6.938/81 – amended by Laws 7.804/89 and 8.028/90; regulated by Ordinances89.336/84, 97.632/89 and 99.274/90), to preserve, improve and recover environmentalquality and support life, ensuring conditions for socioeconomic development andprotection of human dignity.
This means that any construction, installation, extension and operation of any activity orfacility using natural resources and which is deemed effectively or potentially pollutant orwhich may cause environmental degradation is required to apply for advanced licensing.
Although enacted in 1981, some orders included in the National Environment Policywere only regulated in 1986, by Resolution No. 001 issued by the National EnvironmentCouncil - CONAMA (amended by CONAMA Resolutions 01 1/86 and 237/97), attributingresponsibilities and governing the institutional channels to implement the aforementionedregulations.
This was therefore the basis for defining the Environmental Impact project andestablishing criteria for preparing the Environmental Impact Assessment (EIA) and theEnvironmental Impact Report (RIMA), both critical documents when obtaining the PriorEnvironmental License (LAP).
Environmental Law in the State of Santa Catarina, Decree 14.250, dated June 05, 1981,which regulates Law No. 5.793, dated October 15, 1980, which provide for the protectionand improvement of the environmental quality, states, in article 69: “The construction,the expansion and operation of equipment or industrial, commercial and serviceactivities depends on prior authorization and registration, provided they are includedin the list of activities which could possibly cause environmental degradation.”
CONSEMA Resolution of 2006, “Approves the list of Activities Deemed Potential Causesof Environmental Degradation requiring environmental licensing by the EnvironmentFoundation - FATMA and relevant environmental assessment for licensing purposes”, inits Exhibit I - Activities

29
Terra - Consultoria em Engenharia e Meio AmbienteLtda.
Subject to Environmental Licensing and Respective Prior Studies – classifies energyproduction with 28.5 MW of nominal output as a medium size project, requiring anEnvironmental Impact Assessment and respective Environmental Impact Report.
4.2. Licensing Powers
In general terms, the environmental licensing processes are described in CONAMAResolution No. 237/97.
The State environmental body is responsible for licensing any project or activitieswith significant environmental impacts located or developed in two or more MunicipalDistricts, or in State preservation units or where the direct environmental impactsoccur within inter-municipal areas or, additionally, when the Municipal District doesnot have the relevant infrastructure (an Environment Department).
The projects or activities that are located or developed in forests and other areas ofnatural vegetation subject to permanent preservation, established in article 2 of LawNo. 4.771, of 1965 or in those that are designated as such by act of Government orwhen assigned by the Federal Government, fall under this rule.
Considering this information and the fact that the Federal Government has notdelegated this task to the Municipal Districts affected by the project, theenvironmental licensing process at Santa Luzia Alto SHS is governed by the Stateenvironmental body for the State of Santa Catarina, FATMA.
In compliance with CONAMA Resolution No. 237/97, in Art. 10, 1 st paragraph,environmental licensing procedures shall provide a Municipal Governmentcertificate, stating that the location and type of project or activity are in compliancewith laws applicable to the use and occupancy of the land. In this case, the LocalGovernments of São Domingos and Ipuaçu were consulted and the certificates weresubmitted in Exhibit 09.
4.3. Licensing Stages
The Environmental Licensing through FATMA involves three different phases:
Prior Environmental License - LAP: This is the document requested in the preliminaryplanning phase, corresponding to the studies defining the location of the project.The issuance of the LAP does not authorize any works or activities for theimplementation of the project.
LAP is valid for up to two years and establishes the feasibility of the project and/orlocation of equipment or activities, in terms of the environmental impact andguidelines for land usage.
Environmental Facility License - LAI: This is the document that must be requestedbefore the construction. At this phase, the following documents, and others, arerequired: copy of the authorization for tree felling issued by FATMA (as applicable),the

30
Terra - Consultoria em Engenharia e Meio AmbienteLtda.
licenses from the municipal governments and the Detailed Report of EnvironmentalPrograms. The issuance of LAI is a commitment from the interested party tomaintain the final project in line with the approved conditions.
LAI is valid for up to three years and it authorizes the construction activity orinstallation of equipment, based on the final detailed engineering design.
It is the document that must be requested before the starting the project. Theissuance of the LAO implies a commitment from the interested party to maintain thepollution control equipment pursuant to approval conditions.
The LAO is valid for up to eight years and authorizes operation of the equipment,activity or service, based on survey, operation test or any technical means ofverification.
4.4. Legislation Related to the Project
Below is a list of the legislation related, either directly or indirectly, with the project,representing general and specific rules or regulations in the environmental licensingprocess.
Federal Legislation
Federal Constitution of 1988– In article 225, it states that “everyone is entitledto an ecologically balanced environment, which is public property of commonuse and essential to a healthy quality of life, where the Government and thepopulation are responsible for defending and preserving it for current andfuture generations.”. It also states that the Federal Government, the States,the Federal District and the Municipal Districts are liable for preserving theforests, fauna and flora, prohibiting practices or activities that endanger thesurvival of these resources, or cause their extinction. With regard toauthority, it allows States and Local Governments to create a law on almostall subjects associated with the environment, in accordance with their specificneeds. The State environmental agency can stipulate the generalrequirements and define specific standards of requirements that are moresevere but not less detailed or restrictive than those issued by the FederalGovernment. They must comply with art. 5, item XXIII, which amended thecharacteristic of the property right stating that property must fulfill its socialfunction, which, in compliance with art. 186, referring to rural property,includes, but is not limited to, environmental preservation.
Law No. 4.132/1962 – Provides for cases of expropriation based on socialinterests, making instruments available to the energy industry providingeffective measures for the protection of reservoirs and corrections to theimpacts caused in the Area of Influence around these projects.
Law No. 6.513/1977– Requires the electric industry to consider, whenselecting its projects, special areas and areas of tourist interest.

31
Terra - Consultoria em Engenharia e Meio AmbienteLtda.
Law No. 6.938/1981 – In article 3 “Provides for the national environmentalpolicy, its purposes and mechanisms of formulation and application and othermeasures.” This Law established an approach involving detailed planning withregard to the preparation of environmental regulations, creating a licensingprocess in three stages for economic activities that may cause environmentalimpacts: Prior Licensing, Facility Licensing and Operation Licensing.
Law No. 7.347/1985 – Regulates the Public Civil Action of liability fordamages caused to the environment, consumers, property and rights ofartistic, aesthetic, historical, tourist and landscape (cancelled) value andother measures.
Law No. 7.990/1989 – Provides for a 6% tariff on the value of the powergenerated to be paid to the States and Municipal districts and bodies withinthe direct administration of the Federal Government.
Law No. 8.001/1996 – Provides for the correction of environmental damagecaused by the destruction of forests and other ecosystems by projects thatcause environmental impacts, including the distribution of “royalties” from theelectrical industry.
Law No. 9.427/1996 – Provides the rules for the electric industry comprisingissues related with the energy production and SHS’s.
Law No. 9.433/1 997 – Creates the National Policy of Water Resources andthe National Management System of Water Resources, partially amendingthe water code of 1934.
Law No. 9.478/1997 – Provides for the national energy policy and othermeasures.
Law No. 9.605/1998 – Enacts criminal and administrative penalties resultingfrom behavior and activities that are harmful to the environment, which werelater regulated by Decree no. 3.179 of September 21, 1999. These legal rulesdefine the application of fines and other punitive measures for offencesagainst the environment, specifying, in chapter V, Sections I and II, thecrimes and punishments referring to aggression against fauna and flora,respectively.
Law No. 9.984/2000 - Creates the National Water Agency – ANA, a federalagency for implementing the National Policy of Water Resources andcoordination of the National Management System of Water Resources.
Law No. 9.985/2000 – Regulates article 225, 1st paragraph, items I, II, III and VIIof the Federal Constitution, creates the National System of Nature PreservationUnits for the Conservation of Nature – SNUC, establishing criteria and standardsfor the creation, implementation and management of preservation units.
Law No. 9.993/2000 – Redefines the distribution of the portion referring to theFederal Government’s interest in “royalties” based on 6% of electric powergeneration.
32
Terra - Consultoria em Engenharia e Meio AmbienteLtda.
Law No. 11.428/2006 – Provides for the use and protection of the nativevegetation of the Atlantic Forest Biome, and other measures.
Provisional Measure No. 1.956/1952 - Provides, in article 4, the requirementregarding expropriation or purchase, by developers, of the permanentpreservation areas created following the construction of artificial reservoirs,the parameters and usage regime which shall be defined by CONAMAResolution.
Decree No. 26.643/1934 – Creates the Water Code and regulates the actionsthat involve the multiple uses and preservation of waterways.
Decree-Law No. 852/1938 – Defines the concept of public waters forcommon use and other related measures.
Decree-Law No 2.848/1948 (Criminal Code) – In article 271 it states that theconcessionaire that uses water will be responsible for its quality.
Decree No. 40.974-A/1961 – Established mandatory maintenance of thequality of the water and reservoirs in the downstream area, applicable to theelectricity industry.
Decree No. 50.887/1961 – Defines the pollution of waters and characterizesthe construction of hydroelectric projects as potentially pollutant, requiringdevelopment of corrective or offsetting measures.
Decree No. 221/1967 – Provides for the protection and incentives for fishing.
Decree No. 99.274/1990 - Regulates Law 6.902/81 and Law 9.938/81, whichrespectively provide for the creation of Ecological Stations and EnvironmentalProtection Areas and the National Environment Policy (amended by Decrees122/91 and 2.120/97; revokes Decree 88.351/83 and others). Provides for thelicensing of activities that use environmental resources, deemed effectively orpotentially pollutant or able to cause environmental degradation.
Decree No. 2.612/1998 – Regulates the National Council of Water Resourcesand provides other measures.
CONAMA Resolution No. 002/1985 – Includes the construction of dams aspotentially pollutant activities.
CONAMA Resolution No. 001/1986 – Establishes that the licensing ofactivities that change the environment shall depend on the development of anEnvironmental Impact Assessment –EIA and respective EnvironmentalImpact Report –RIMA to be submitted for analysis by the relevantenvironmental bodies.
CONAMA Resolution No. 006/1986 – Approves the models for licensingrequests. Provides instructions for publication of licensing applications, renewaland issuance of licenses in newspapers and official gazettes published by theState or Federal Government.
CONAMA Resolution No. 006/1987 - Establishes general rules forenvironmental licensing of large scale works, specially electrical energygeneration. States that the power exploration, generation and

33
Terra - Consultoria em Engenharia e Meio AmbienteLtda.
distribution concessionaires, upon submitting their projects for environmentallicensing shall provide technical information, as provided in environmental law andprocedures defined in this Resolution (art. 1).
CONAMA Resolution No. 009/1987 – Provides for Public Hearings. The PublicHearing referred to in CONAMA Resolution No. 001/86 aims at providinginterested parties with information on items analyzed and the related RIMA,answering questions and receiving comments and suggestions from thosepresent.
CONAMA Resolution No. 002/1996 – States that projects that causeenvironmental damage related to destruction of forests and other ecosystemsshall undertake responsibility for the implementation of new or existingPreservation Units (UC’s) to be defined by the environmental licensing bodyas a means of off-setting environmental damage caused that can not bemitigated.
CONAMA Resolution No. 237/1 997 – Reviews the procedures and criteriaused in the environmental licensing to ensure their use as environmentalmanagement instruments as provided for in the National EnvironmentalPolicy.
CONAMA Resolution No. 279/2001 – Establishes the simplified procedure forenvironmental licensing of electric projects with little potential environmentalimpact.
CONAMA Resolution No. 281/2001 – Provides for environmental licensingapplications, allowing the possibility of establishing simplified types of licenserequests and renewal of some types of these licenses.
CONAMA Resolution No. 303/2002 – Provides parameters, definitions andlimits of Permanent Preservation Areas.
CONAMA Resolution No. 306/2002 - Provides the minimum requirementsand the reference period for concluding environmental audits.
CONAMA Resolution No. 307/2002 – Defines the guidelines, criteria andprocedures for the management of waste from civil construction.
CONAMA Resolution No. 357/2005 – Provides for the classification of bodiesof water and environmental guidelines on classification, and establishes theconditions and standards of effluents discharge and other measures.
CONAMA Resolution No. 369/2006 – Provides for exceptional cases of publicutility, social interest or low environmental impact that allows the interventionor suppression of vegetation in a Permanent Preservation Area - APP.
CONAMA Resolution No. 388/2007 – Provides for the authentication of theResolutions that define the primary and secondary vegetation at the initial,medium and advanced stages of regeneration of the Atlantic Forest for thepurposes of art. 4, 1st paragraph of Law No. 11.428 of December 22, 2006.

34
Terra - Consultoria em Engenharia e Meio AmbienteLtda.
CONAMA Resolution No. 371/2006 – Establishes the guidelines forenvironmental bodies for the calculation, collection, application, approval andcontrol over expenditure of resources accruing from environmentalcompensation, in compliance with Law No. 9.985, of July 18, 2000, whichcreates the National System of Nature Preservation Units - SNUC and othermeasures.
ANEEL Resolution No. 394/1998 – States that power generation projects ofup to 30 MW with reservoirs of up to 3.000 m2 are deemed SmallHydroelectric Stations (SHS’s).
ANEEL Resolution No. 395/1995 – Establishes the procedures for filing andapproving feasibility studies and basic projects for hydroelectric generationand authorization for power generation plants of up to 30 MW.
ANEEL Resolution No. 652/2003 – Establishes the criteria for rating thehydroelectric use of SHS’s (power between 1 MW and 30 MW).
MME Ordinance No. 1.832/78 (Ministério de Minas e Energia) – Provides foruse of public waters.
SUDEPE Ordinance No. 001/1977 – Provides rules for protection of waterfauna for dams builders throughout Brazil.
State Legislation
State Constitution of 1989 – Chapter VI, related to the environment –provides, in article 181, that “everyone is entitled to an ecologically balancedenvironment, with government and the population being required to defendit for present and future generations.” In Article 182 item V, it states that theState shall require, for the installation of works or activity that potentiallycauses environmental degradation, prior environmental impactassessments, which it shall publish.
Law No. 5.793/1980 – Provides for protection and improvement of quality oflife. Article 3, 3rd paragraph states that the construction and expansion ofpublic or private business activities depend on consideration and licensingfrom the relevant State body responsible for the protection and improvementof the environment, to which the projects, together with the environmentalimpact reports, shall be submitted.
Decree No. 14.250/1981 – Regulates the provisions of Law No. 5.793, ofOctober 15, 1980, referring to the protection and improvement ofenvironmental quality. Article 65 states that projects for the installation andthe expansion of business activities included in the list of activities deemedpotential causes of environmental degradation require analysis andapproval, with the environmental impact reports and prior licensing forconstruction and operation. Article 69 states that the construction,expansion and operation of equipment or industrial, commercial and serviceactivities require prior registration, provided they are included in the list ofactivities considered
35
Terra - Consultoria em Engenharia e Meio AmbienteLtda.
potential causes of environmental degradation. Article 70 states that theauthorization to which Article 69 refers shall be granted through: I - PriorEnvironmental License - L.A.P.; II - Environmental Facility License - L.A.I.; III -Environmental Operating License - L.A.O. Articles 71 through 74 establish forhow long environmental licensing is valid.
Law No. 6739/1 985 - Creates the State Council of Water Resources.
Law No. 9.022/1993 – Provides for the creation, structuring and organizationof the State Management System of Water Resources.
Law No. 9.748/1994 – Provides for the State Policy of Water Resources andother measures.
FATMA Ordinance No. 078/2004 – Provides the criteria for defining andapplying environmental offsetting measures following environmental licensinginvolving significant environmental impact, environmental assessments andlegal uses of the permanent preservation area.
Ordinance No. 024/1979 – Classifies the water courses of the State of SantaCatarina.
CONSEMA Resolution No. 001/2006 - Approves the List of the ActivitiesDeemed Potential Causes of Environmental Degradation subject toenvironmental licensing from the Environment Foundation –FATMA andspecifies the proper environmental assessment for licensing purposes.
Municipal Legislation
Organic Law of the Municipal region of São Domingos (01/2005) – in chapterXII (Environment) provides the main concerns in terms of quality of theenvironment. In Article 280 states that any person that explores mineralresources and /or other resources shall repair the degraded environment, inaccordance with the technical solution required by the relevant body, as specifiedby law.
Organic Law of the Municipal region of Ipuaçu
4.5. Protection of Flora and
Fauna Fauna
Law No. 5.197/1967 – Main legal rule that regulates the protection of specificfauna and establishes the protection standards and basic premises ofdefense of animal life. In Law 5.197/67 it states that all animals that livenaturally in the wild are the property of the State, and the same applies to theirnests, shelters and natural nurseries and their use, hunting, persecution,destruction or apprehension is prohibited.
Law No. 7.653/1988 – Alters and complements Law No. 5.197/67 specially inrelation to the aquatic environment adding legal instruments regardingichthyologic fauna and defining penalties for aggressive action affecting fauna asa whole.

36
Terra - Consultoria em Engenharia e Meio AmbienteLtda.
Law No. 9.605/1998 – States that “all species that belong to native, migratoryand any other water or earth species whose life cycle occurs within Brazilianterritory or Brazilian territorial waters are wildlife species”.
Legislative Decree No. 3/1 948 – Approved the convention to protect the flora,fauna and natural landscapes in Latin America, limiting human intervention incertain areas and requiring the electric sector to consider these areas whendefining projects.
IBAMA Directive 1.522/1989 – Defines the list of species of Brazilian Faunathreatened with extinction (updated in 2003)
Flora
Law No. 4.771/1965 (Forest Code)–Defines the main instruments to protectand regulate use of the floral resources in the Country, creating the ForestCode. Article 2 defines forests and other forms of natural vegetation forpermanent preservation, including those located along rivers or any watercourse, around ponds, lakes or reservoirs of natural or artificial water, incompliance with specifications provided for herein. Grant Government theprerogative of declaring other permanent preservation areas according to criteriadefined in article 3 of this Law, and states that the suppression of these areas forthe execution of works, plans, activities or projects of public usefulness or socialinterest is only possible upon the prior authorization of the Federal Government,represented by IBAMA.
Law No. 1 1 .428/2006 - governs the use and protection of native vegetationin the Atlantic Forest Biome, and other measures.
I Federal Decree No. 750/1993 - Provides for the suppression of vegetationat initial, medium, and advanced stages of forest regeneration in the AtlanticForest Biome.
CONAMA Resolution no. 01 0/1 993 - establishes basic parameters foranalyzing the successive stages of the Atlantic forest.
CONAMA Resolution no. 004/1 994 - defines the basic parameters foranalysis of the successive stages of the Atlantic forest, coveringphysiognomy, predominant strata, diametric distribution and height,existence, diversity and amount of epiphytes , presence, diversity and amountof creepers, presence, absence and characteristics of vegetation detritus,sub-forest, diversity and prevalence of species and indicative vegetablespecies. It represents, therefore, a fundamental basis for producing studies inareas within the Atlantic forest defining the classification of the succession formsof this vegetation.
CONAMA Resolution no.. 388/2007 - provides for the joint validation ofResolutions that define the primary and secondary vegetation in the initial,medium and advanced stages of regeneration of the Atlantic forest for theterms of art. 4, 1st paragraph of Law 11.428 of December 22, 2006.

37
Terra - Consultoria em Engenharia e Meio AmbienteLtda.
IBAMA Ordinance no. 037-N/1 992 - defines the list of species of theBrazilian flora threatened with extinction.
State Law No. 5.793/1980 considers environmental degradation, amongother factors, to be any change caused to the environment capable ofcausing significant damage to flora, fauna and other natural resources.Decree no. 14.250 that regulates this Law states, in its Art. 42, item V, that thespecial protection areas are those where there are vegetable formations stoppingthe erosion of hillsides and environments of great biological diversity. In Art. 45,the same rule bans clear cutting forests on land adjacent to: I state parks; II:ecological stations or biological reserves; III: scenic highways. The sameprohibition is mentioned in Art. 47, 48, 50, 52, 57 and 58 for the case ofpromontories, within an area of 2000 meters, islands, estuaries, springs andnascent, state parks and ecological stations or biological reserves, respectively.
State Decree no. 14.250/1981 - In the areas of vegetation the help avoiderosion, Art. 49 of Decree no. 14.250/81 bans clearing trees and other forms ofnatural vegetation along the bank of rivers, around ponds, hillsides, sandbanksand plains.
Suppression of Vegetation
The suppression of the vegetation to build a project and maintain a safety area requiresprior issuance of a Cutting License granted by the environmental agencies. For this, aforest inventory of the area of direct influence (AID) is generally required, containing ananalysis section and subsequent field inspection.
In the Atlantic forest biome this issue is governed by Law No. 11.428, dated December22, 2006, which governs the use and protection of the native vegetation in the Atlanticforest Biome. And it establishes the prohibition of cutting, exploration and vegetationsuppression and exceptionally admits the vegetation clearing when required for theperformance of works, plans, activities or projects of public utility and social interest,upon authorization of the competent state agency with prior approval from IBAMA.
Based on afore-mentioned legal rules, there is the restriction on suppression in themedium and advanced stages of forest regeneration, being forecasted some handlingpossibilities for the initial stage.
When there is a justified need to suppress vegetation within the Permanent PreservationArea (APP), the procedures are established in Temporary Measure no. 2.166-67, ofAugust 24, 2001, where this is regulated: “(...) it can be authorized in case of publicutility or social interest, properly characterized and based on specific own administrativeproceedings, when there is no technical or local alternative to the proposed project.”
Another legal scenario is presented in CONAMA Resolution 369, of March 28, 2006,which “provides for the exceptional cases of public utility, social interest or lowenvironmental impact, which allows the intervention or suppression of vegetation in thePermanent Preservation Area -APP.” Thus, the environmental licensing body
38
Terra - Consultoria em Engenharia e Meio AmbienteLtda.
will evaluate the possible impacts defining the compensatory and mitigating measures tobe implemented by the developer.
In the specific case for Santa Catarina, FATMA usually has been consulting IBAMAbefore issuing an opinion for vegetation suppression and execution of projects within thePermanent Preservation Area (APP), requesting their approval. In this case, IBAMA justauthorizes the suppression of the vegetation of APP when it is of social interest andpublic utility of the project, which is the case with small hydroelectric power plants.
Next is a list of the legal rules that are either directly or indirectly related with the projectin question, based on standards or general and specific regulations regarding theprotection of native forests.
Other legal rules directly related to the issue of vegetation suppression are listed below:
Law No. 3.824/1 960– requires clearing of the hydraulic basins for dams,dikes and artificial lakes.
CONAMA Resolution 003/93 - creates the temporary Technical Committeefor Atlantic Forest issues, mainly to create and propose standards, aiming atdefining primary and secondary vegetation in the advanced, medium andinitial regeneration stages, in compliance with art. 6 of Decree 750/93. Thedefinitions of these parameters are included in CONAMA Resolution 010/93.
CONAMA Resolution 01 0/93 - defines the basic parameters for analysis ofthe succession stages of the Atlantic forest (amends CONAMA Resolution004/85; see Decree 750/93).
CONAMA Resolution 003/96 - defines the remaining vegetation of Atlanticforest (See Decree 750/93). It establishes that the remaining vegetation ofthe Atlantic forest covers the totality of the primary and secondary vegetationin the initial, medium and advanced regeneration stages (art. 1).
CONAMA Resolution 009/96 - provides for the corridors among theremaining ones of the Atlantic forest (See Decree 750/93).
CONAMA Resolution 278/2001 - establishes limitations and special rules forfelling endangered species of flora in the Atlantic forest Biome.
CONAMA Resolution 300/2002 - supplements Resolution 278/2001 on casesof authorization for vegetation suppression of the species threatened withextinction of the Atlantic forest Biome.
CONAMA Resolution 31 7/2002 - provides for the regulation of Resolutionno. 278/2001 establishing state plans for handling species threatened withextinction in the Atlantic forest.
CONAMA Resolution 369/2006 - provides for cases of the exceptional ,public utility, social interest or low environmental impact, which allowsintervention or suppression of vegetation within the Permanent PreservationArea - APP.

39
Terra - Consultoria em Engenharia e Meio AmbienteLtda.
CONAMA Resolution 388/2007 - provides for the co-authentication ofResolutions that define primary and secondary vegetation in the initial,medium and advanced regeneration stages of the Atlantic forest for purposesof art. 4, 1st paragraph of Law No. 11.428 of December 22, 2006.
Ordinance IBAMA 037-N/92, which defines the list of species of the Brazilianflora threatened with extinction.
State Sphere
Law No. 10.472/97 - This law regulates the preservation, conservation anduse of the forest resources in the State of Santa Catarina. Article 2 statesthat the forests and other forms of native vegetation that are useful for themaintenance and preservation of the lands are properties of common interest toall citizens, use of which is subject to the limitations established by in law.
Joint Resolution 01/95 (between IBAMA-SC and SEDUMA-SC) - regulatesthe cutting and exploration of the secondary vegetation at the initialregeneration stage of the Atlantic forest in the State of Santa Catarina.
4.6. Protection of Historic, Artistic and Natural Heritage
Assets of a material and non-material nature incorporating references and identity,involving actions and memory of the different groups forming Brazilian society thatinclude sites with historical references to slave descendants represent Cultural Heritageand are protected by the 1988 Federal Constitution.
The identification and the study of the historical, artistic and natural heritage of a certainarea aim to rescue the culture and the way of life of people that lived there in ancienttimes.
Article 20, item X, of the National Constitution states that the underground naturalcavities (caves) and prehistoric archaeological sites are Federal Government property,and the Federal Government, States and Municipal Districts are liable for protecting thedocuments, the works and other assets of historical, artistic and cultural value,monuments, outstanding landscapes and archaeological sites.
In order to conduct excavations for archaeological purposes, permission or authorizationis required in advance from the Instituto do Patrimônio Histórico e Artístico Nacional –IPHAN, regulated by Ordinance MC 07/88. IPHAN will respond to this application withinninety (90) days for this application and, when granted, they are valid for two years, andmay be revalidated for an equivalent period of time.
Federal Constitution (articles 5, 20 and 216) - Defines which assets aresubject to protection and rescue, among other provisions.
Decree-Law No. 25/37 - organizes the protection of the national historical andartistic heritage, establishing mandatory surveys of assets located within the areaaffected.
40
Terra - Consultoria em Engenharia e Meio AmbienteLtda.
Other laws (all issued by the Federal Government):
Law No. 3.866/44;
Law No. 3.924/61;
Law No. 4.845/65
Law No. 8.029/90;
Decree Law No. 25/44;
Decree no. 335/91;
Decree no. 1.361/95;
Temporary Measure no. 752/94;
Ordinance MC no. 07/88 (Ministry of the Culture).
4.7. Colocated Plans and Programs
SHS Santa Laura
The deployment process for the Small Hydroelectric Power Plant Santa Laura,located on the border of the municipal districts of Faxinal dos Guedes and OuroVerde in the state of Santa Catarina is at an initial stage. This SHS will be built onthe river Chapecozinho, an affluent of the river Chapecó.
The flooded area will measure 3,12 Km2. The dams and dikes will be CCR type –roller-compacted concrete, with crest length of 245 meters and maximum height of21 meters. The diversion will be sluice type, using two units and the flow rate at thesite will be 310m 3/s and 23 meters long.
The spillway will be a free-flowing weir type, with flow rate equal to 2,270m3/s and125 meters long. The adduction channel will be 320 meters, the adduction tunnel980 meters and the penstock 150 meters.
The water inlet will be a rock-fitted type, with a unit 12.5 high and 5.25 m wide. Thefloodgate will be wagon type, and 3.25m wide and 3.25m high.
The power station will be internally operated, with three generating units measuringa total of 48.10m. The horizontal Francis type turbines will have a power output of5,200 kW from the three units. The generators will have unit outputs of 5,600 kWA.
LT SHS Santa Laura–Xanxerê Substation
The transmission line leaves the SHS Santa Laura substation, in the municipaldistrict of São Domingos, latitude 26º45' 36” S, longitude 52° 19' 40”, State of SantaCatarina, passing through the Municipal District of Faxinal dos Guedes up to thesubstation on the CELESC Electric System in Xanxerê, latitude 26° 51 ' 47” S,longitude 52°23 ' 36” S, located in the City of Xanxerê.
In the area that extends for 13 Km, there is a prevalence of undulating to smoothundulating relief, which facilitates implantation quite a lot. The area presents
vegetation predominantly composed of cyclical cultures (corn, soy and wheat) and,

41
Terra - Consultoria em Engenharia e Meio AmbienteLtda.
there are also some dispersed fragments of secondary vegetation of Atlantic RainForest and Deciduous Seasonal Forest at the initial and medium regenerationstages.
The plan included the implementation of additional vertices to protect the remainingvegetation fragments found along the LT section. Additionally, there was a concernlocating the LT, with its respective towers, on better access ways, including locatingit along the edge of roads, which are not paved.
SHS Ludesa
Implementation of the Small Hydroelectric Power Station – SHS is being concludedon the border of the municipal districts of São Domingos and Ipuaçu of the State ofSanta Catarina. This SHS will be installed on the Chapecó river, 16 Km upstreamfrom the project under analysis.
São Domingos SHS, financed by the private sector, specifically by Indústria dePapel Dall'Asta Ltda will generate 28 MW. Its design complies with a general layoutformed pursuant to SHS criteria defined by ANEEL. It has a dam, the axis of whichis located about 200m upstream from the fall that exists in the vicinities of the currentdam from the plant maintained by the aforementioned company.
That dam will be formed by a rock dam with clay core, at an elevation of 641.5m,rising 28m above the foundations, 543m long and 8m wide, and free-flowingspillway, which will be implemented at the left abutment and 390m long, with a crestat an elevation of 635m and maximum height of 12m above the foundations.
The small reservoir to be formed will cover an estimated area of 6,45 ha andmaximum width around 1,000 m.
LT SHS Ludesa–Substation of Clevelândia
The transmission line leaves SHS Ludesa substation, in the municipal district of SãoDomingos, latitude 26° 34 ' 40” S, longitude 52° 29 ' 46” in the State of SantaCatarina, passing through the municipal district of Abelardo Luz up to the substationof COPEL Electric System in Clevelândia, latitude 26° 23 ' 45” S, longitude 52° 28 '15” S, located at Av. Nossa Senhora da Luz, s/nº, Bairro Jardim Brasília,Clevelândia, State of Paraná.
The line reaches the states of Santa Catarina and Paraná, being 89% in SantaCatarina territory and 11% in the State of Paraná. The route covers 22,643 metersmainly comprising average undulating relief with a small variation of up to 20%(twenty percent) for the small nodulations and 5% (five percent) for the largeundulations at the exit of SE SHS Ludesa.
UHE Quebra Queixo
UHE Quebra Queixo is implemented downstream from the plant at SHS Santa LuziaAlto. It was originally designed to generate 120 MW. However, after theconstruction of the project, it was noticed that the volume of water available, in termsof the design characteristics, did not allow the hydroelectric plant to reach fulloperation capabilities in terms of power generation, generating much less than itsnominal capacity.

42
Terra - Consultoria em Engenharia e Meio AmbienteLtda.
Today UEH Quebra Queixo produces an average of 35 MW/month, surpassing thatvalue at exceptional times. These issues led to the implementation of the QuebraQueixo reservoir at an elevation 3 (three) meters below the original project, fallingfrom 552 m to 549 m, reducing the reservoir level and volume. Note that this aspectmeant there were changes to the engineering designs at SHS Santa Luzia Alto,leading to an energy production gain for this SHS.

43
Terra - Consultoria em Engenharia e Meio AmbienteLtda.
5. ALTERNATIVE TECHNOLOGIES AND LOCATIONS
5.1. Technology Alternatives
Man’s history is intertwined with the history of energy. In the middle of the 19th Century,new power sources known as oil and electricity appeared. Today’s society becameextremely dependent on the energy, especially the electricity. Among the main forms ofelectric power generation the main ones are: wind, sun, nuclear energy, hydroelectric,thermal power and biomass plants.
Currently wind energy is deemed one of the most promising natural sources, mainlybecause it is renewable, in other words, it does not run out. Although the cost of thewind energy generation is falling quickly, it still does not present an economically feasiblemethod of generating energy. Furthermore, it requires good wind conditions for theconstruction of the air-generators. a
Solar energy is still being developed and it is not economically viable for large scalepower generation, suffering from variations in the energy produced in accordance withthe weather (rain, cloud), in addition to the fact that there is no production at night.
The need to import raw material for the operation of gas plants and, indirectly, oil firedplants, also leads to economic problems, as it affects a country’s balance of trade.
Thermoelectric coal plants have environmental pollution problems because of theemission of gases into the atmosphere, requiring the implementation of efficienttreatment and/or control systems. Coal production still involves problems of soil andwater degradation and risks to workers' health in mining.
Power generation through nuclear power plants suffers constant protests because of therisk of accidents and creation of great quantities of long term radioactive waste.
Although hydroelectric generation presents an investment slightly superior in comparisonto the thermoelectric coal plants, the latter have an additional operating cost: fuelacquisition. This makes the final generating cost of the hydroelectric plants lower thanthe alternatives.
Additionally, upon comparing the environmental impact derived from the construction ofa thermoelectric coal plant and the construction of a hydroelectric plant, the impacts ofthe latter are smaller. This is because of the damage caused by coal mining, alongsidethe gases emitted into the atmosphere and river pollution.
The reason for giving priority to construction of hydroelectric plants is primarily theexistent extensive hydroelectric potential in the country and the economic benefits thatsuch power sources present. Pursuant to Table 03, we can see that hydroelectricenergy is one of the main, if not the major form of low cost and large scale energyproduction.

44
Terra - Consultoria em Engenharia e Meio AmbienteLtda.
Table 03 – Power source per MW price.Power Source Price per MW
Nuclear Energy US$ 150.00Solar Energy US$ 600.00Wind Energy US$ 60.00Hydroelectric energy US$ 25.00
Source: Gazeta Mercantil, suppl. Grande São Paulo, 16.6.01
The hydraulic or hydro energetic potential in Brazil is 260 GW. Despite its importance inthe Brazilian energy matrix, generation from dams and water-falls produced by themedium and large hydroelectric plants and the Small Hydroelectric Stations –SHSs usesjust 25% of the national hydraulic potential.
The massive Brazilian hydroelectric potential represents an unquestionable comparativeadvantage in relation to the models in other countries, which mainly use fossil fuelsand/or nuclear plants for electricity. In addition to the abundant, clean and renewablesource, the hydroelectric alternative is a technology that Brazil has mastered.
The SHSs present a major advantage in relation to the large hydroelectric plants as theyhave less of an impact, the maturation time is shorter and there is a greater use of thehydro energetic potential on the rivers.
The Small Hydroelectric Stations (SHSs) represent one of the main priorities at ANEELfor increasing the availability of electricity in Brazil. Because of their characteristics,these plants with an output of over 1 MW and equal or less than 30 MW, better meet thepower requirements of small urban centers, rural areas and industrial projects. As of1998, the construction of these generation units was boosted by series of legal andregulatory mechanisms sponsored by ANEEL.
The project to build the SHS – Santa Luzia Alto, in the region of Santa Catarina, fundedby private sector, more specifically by Construtora Gomes Lourenço Ltd., aims togenerate 28.5 MW of energy.
This plant will bring, a series of benefits to the west region of Santa Catarina alongsidethe power it generates, including:
Support for expansion in the industrial sector;
Job creation;
Rise in municipal tax revenues.
Please note that the project area historically does not have any problems from a lack ofrain. This fact is important due the enormous criticism leveled at hydroelectric plants isreceiving, as they depend on the volume of water in the rivers.
The construction and operation of the Small Hydroelectric Station –Santa Luzia Alto SHSincludes the use of modern engineering technologies, avoiding any environmentalimpacts as far as possible. The SHS will be designed and built in accordance withANEEL’s normal techniques and procedures.

45
Terra - Consultoria em Engenharia e Meio AmbienteLtda.
Thus, we have tried to emphasize the environmental issues, using relevant materialsand techniques, approaching the environment in a way that affects it as little aspossible, strictly following the technical and environmental regulations in force.
5.2. Alternative Locations
Within the context of the basin of the Uruguay river, of which it is one of the affluentsof the right bank, the Chapecó river has been studied since 1966, assessing itshydro energetic potential, as described below:
Assessments performed from 1966 to 1969 by ENERSUL under the technicalsupervision of CANAMBRA Engineering Consultants Limited, covering thethree States of the Southern Region of Brazil;
Study of the Hydroenergetic Inventory of the Basin of the Uruguay Riverperformed in October 1979 jointly by the companies ELETROSUL and CNEC- National Consortium of Consultant Engineers;
Study of Head Division of the Chapecó river performed in February, 1996 byENGEVIX – Engenharia S/C Ltda and INTERTECHNE – ConsultoresAssociados S/C Ltda;
Study of Head Division of the Chapecó river – Addendum developed in July1996 by ENGEVIX and INTERTECHNE; and
Environmental Impact Report of the Hydroelectric Plant of Quebra Queixo onthe Chapecó river developed in 1997 by ENGEVIX.
In the studies conducted by ENERSUL the following were accepted: Cutia, Figueira,Golfo, Portela, Quebra Queixo, Toldo Velho, São Domingos, Abelardo Luz andAparecida, totalizing 622 MW.
Later the studies carried out by ELETROSUL/CNEC showed a new list of possiblelocations: Aparecida, Abelardo Luz, São Domingos, Quebra Queixo, Foz doChapecozinho, Nova Erechim, Xanxerê and Voltão Novo, totalizing 418 MW.
In both studies the traditional methodology was adopted (deterministic criteria),based on the concept of available energy associated with an average capacity factorof 55% and the critical hydrological period in the Southern Region (from April, 1944,to November, 1945). The historical series of the available monthly average flowrates correspond to January, 1941, to December, 1976.
The study developed in 1996 by ENGEVIX/INTERTECHNE aimed at assessing thehydro energetic capacity of the Head Division on the Chapecó river, within thecourse located upstream from the mouth of the Chapecozinho river, focusing on thefollowing assumptions:
New assessment of division of head for power generation along a section ofthe Chapecó river between the 430,00 m and 858,00 m elevations. Thishead division alternative proposed to make the best use of the waterresources available at a competitive cost, considering the technical aspectsinvolved and the implications of modifying the environment;
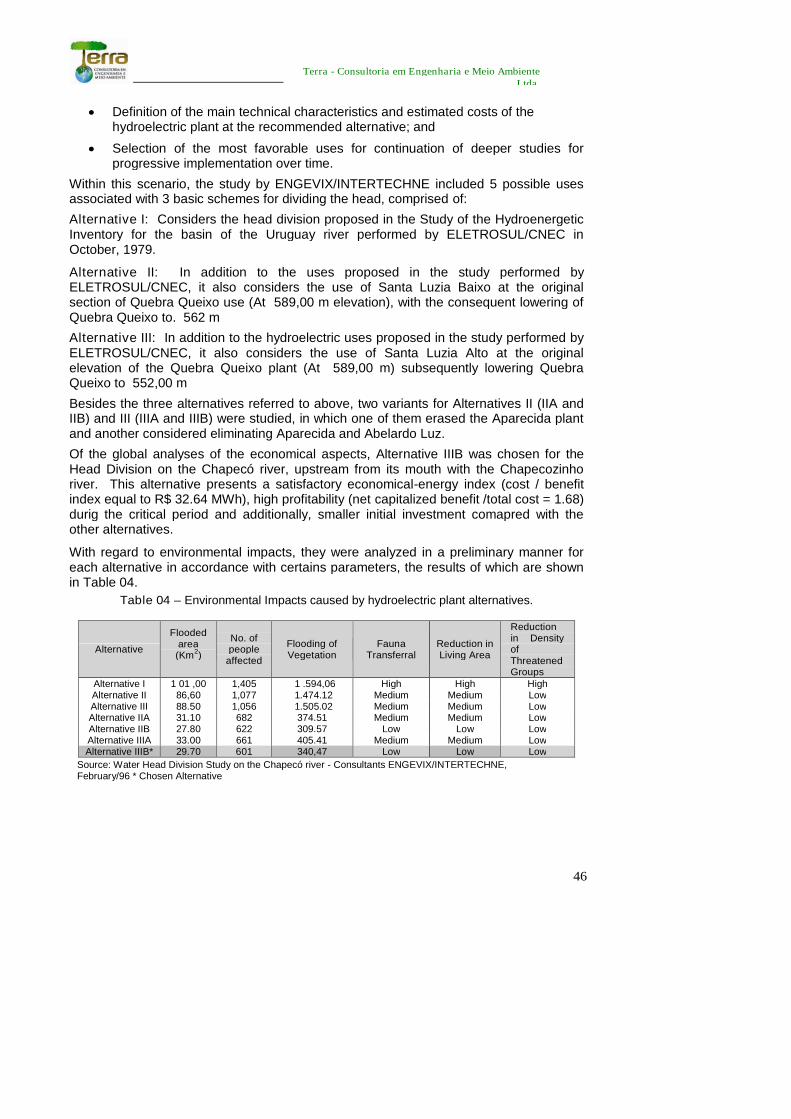
46
Terra - Consultoria em Engenharia e Meio AmbienteLtda.
Definition of the main technical characteristics and estimated costs of thehydroelectric plant at the recommended alternative; and
Selection of the most favorable uses for continuation of deeper studies forprogressive implementation over time.
Within this scenario, the study by ENGEVIX/INTERTECHNE included 5 possible usesassociated with 3 basic schemes for dividing the head, comprised of:
Alternative I: Considers the head division proposed in the Study of the HydroenergeticInventory for the basin of the Uruguay river performed by ELETROSUL/CNEC inOctober, 1979.
Alternative II: In addition to the uses proposed in the study performed byELETROSUL/CNEC, it also considers the use of Santa Luzia Baixo at the originalsection of Quebra Queixo use (At 589,00 m elevation), with the consequent lowering ofQuebra Queixo to. 562 m
Alternative III: In addition to the hydroelectric uses proposed in the study performed byELETROSUL/CNEC, it also considers the use of Santa Luzia Alto at the originalelevation of the Quebra Queixo plant (At 589,00 m) subsequently lowering QuebraQueixo to 552,00 m
Besides the three alternatives referred to above, two variants for Alternatives II (IIA andIIB) and III (IIIA and IIIB) were studied, in which one of them erased the Aparecida plantand another considered eliminating Aparecida and Abelardo Luz.
Of the global analyses of the economical aspects, Alternative IIIB was chosen for theHead Division on the Chapecó river, upstream from its mouth with the Chapecozinhoriver. This alternative presents a satisfactory economical-energy index (cost / benefitindex equal to R$ 32.64 MWh), high profitability (net capitalized benefit /total cost = 1.68)durig the critical period and additionally, smaller initial investment comapred with theother alternatives.
With regard to environmental impacts, they were analyzed in a preliminary manner foreach alternative in accordance with certains parameters, the results of which are shownin Table 04.
Table 04 – Environmental Impacts caused by hydroelectric plant alternatives.
Alternative
Floodedarea(Km
2)
No. ofpeople
affected
Flooding ofVegetation
FaunaTransferral
Reduction inLiving Area
Reductionin DensityofThreatenedGroups
Alternative I 1 01 ,00 1,405 1 .594,06 High High HighAlternative II 86,60 1,077 1.474.12 Medium Medium LowAlternative III 88.50 1,056 1.505.02 Medium Medium LowAlternative IIA 31.10 682 374.51 Medium Medium LowAlternative IIB 27.80 622 309.57 Low Low LowAlternative IIIA 33.00 661 405.41 Medium Medium LowAlternative IIIB* 29.70 601 340,47 Low Low Low
Source: Water Head Division Study on the Chapecó river - Consultants ENGEVIX/INTERTECHNE,February/96 * Chosen Alternative

47
Terra - Consultoria em Engenharia e Meio AmbienteLtda.
It also considered the disappearance of the natural waterfalls of high value to tourismclose to the City of Abelardo Luz. Additionally, the layout of the generating structurespresents construction problem, represented by the location of the adduction tunneldirectly beneath the City.
These environmental repercussions benefitted Alternative IIIB, which because of the factthat it does not include the plants in Abelardo Luz and Aparecida, has fewer impacts onthe environment.
In the development of the Basic Project of Santa Luzia Alto, motor studies were carriedout on outputs of 24.0 MW, 25.5 MW, 27.0 MW and 28.5 MW, to assess the optimalinstallation point.
The energy studies allowed us to assess the energetic benefit of each alternative, interms of the average power generated by the plant. In order to define the output atSanta Luzia Alto SHS, a cost/benefit study was carried out based on anenergy/economic analysis, the respective costs and energy benefits, trying to reach theoptimal point for the plant according to the available water resources and feasibility.
The alternative selected was defined in order to minimizing the impacts on theenvironment. The results of the environmental and economic factors resulted in theselection of Santa Luzia Alto SHS. The optimal output at Santa Luzia Alto SHS is 28.5MW. From an environmental standpoint the increment to a 28.5 MW output is positive,as the size of the lake does not change. The increased output at Santa Luzia Alto SHSwould not reduce or increase its negative impacts, however, there would be aconsiderable increase in positive impacts, mainly in the socioeconomic area, increasingeconomic activities and electrical power available in the region.

48
Terra - Consultoria em Engenharia e Meio AmbienteLtda.
6. PROJECT INFLUENCE AREAS
Influence area is the entire territorial area which might be affected, either directly orindirectly, by the positive and/or negative environmental impacts, caused by the projectduring the planning, implementation and operational stages.
In view of the regional importance of Santa Luzia Alto SHS, three Areas of Influencewere defined: Directly Affected Area (ADA), Area of Direct Influence – AID andArea of Indirect Influence (AII).
The physical limits defined for these areas vary in accordance with the physical, bioticand socioeconomic environments surveyed, in order to make adjustments to therequirements in each area. However, in order to set a restricting parameter of theseareas, we have defined a limit for each area of influence:
6.1. Directly Affected Area – DAA
It is restricted to the area where the construction works for Santa Luzia Alto SHS areplanned to occur, for the physical, biotic and socioeconomic environments, comprising:dam area, power plant, reservoir, access ways, work site, accommodation for the laborand lease and disposal areas.
6.2. Direct Influence Area – DIA
Area subject to the direct impacts of the construction and operation of the plant in thephysical and biotic environment, in a radius of 500 meters from the work location at theSHS plant and within an area of 100 meters from the flood area.
In the socioeconomic environment, the Area of Direct Influence is covered by themunicipal districts of Ipuaçu and São Domingos.
6.3. Indirect Influence Area – IIA
In project of this nature, it the entire region could be considered an Area of IndirectInfluence. However, in order to create a boundary for this area, it was limited to a morespecific region.
Therefore, the Area of Indirect Influence is the area actually or potentially affected by theindirect impacts of the construction and operation of the project, resulting from theplanned interventions for the construction and operation of Santa Luzia Alto SHS. Forthe physical and biotic environment, it is limited by the sub hydrographic basin of theChapecó river, and for the socioeconomic environment, the area covered by the Westernregion of Santa Catarina.

49
Terra - Consultoria em Engenharia e Meio AmbienteLtda.
7. METHODOLOGY
7.1. Introduction
The Environmental Impact Assessment –EIA aims at avoiding any project which isjustified from an economic standpoint or is in the immediate interest of the bidder is latershown to be disastrous for the environment, which is why it is a preventive andprecautionary tool. Undoubtedly, it is an efficient and reliable instrument to assessenvironmental impacts.
This statement shows the importance of environmental impact assessments. However,nowadays, there is difficulty adopting a methodological approach able to encompass themany environments and possibilities created by the human construction activities. Whatwe have available is a conceptual basis on which we have built a framework ofregulations.
Adoption of the AIA model (Environmental Impact Assessment) as part of environmentalstudies is widely accepted in the current stage of development of the socio-environmental sciences in Brazil, which addresses three basic areas:
a) description of the area per its physical, biotic, social and economical features beforethe construction of the project. What is traditionally referred to as “environmentaldiagnostics”
b) identification, description and assessment of impacts, in each phase of the project -planning, construction and operation – because these different phases have significantlydifferent impacts, specially in terms of time, location and intensity.
c) propose measures to minimize, or even revert any negative impacts, mitigating,compensatory or maximizing measures, the latter when increasing the positive impacts.
7.2. “Diagnosis” ParticularitiesThe environmental diagnosis aims to describe the environmental status of the areaaffected before project construction, based on the relevant considerations:
a) Physical environment: climate and weather conditions, geology, geomorphology andsoils, water resources and quality of the water;
b) biological environment: terrestrial biota; aquatic biota; preservation units;
c) social and economic aspects: History of occupation, population, infrastructure, watersupply, sewage disposal, collection of solid waste, electric power, communicationmeans, transportation system, social indexes, education and health, humandevelopment index – HDI, economic aspects, land use and occupation, leisure, tourismand culture, historical heritage, cultural and archeological sites.
As the collection of every single aspects is an exaggeration and will harm the study, thediagnosis in this assessment of the environmental impact of the
Terra - Consultoria em Engenharia e Meio AmbienteLtda.

50
building of the Small Hydroelectric Station –Santa Luzia Alto SHS was carried out intwo interlinked approaches:
a) PROSPECTION, where the study is characterized by vertical information on theenvironmental variables that best represent the current scenario and that are able toconsistently define the impact vectors of the project, which are more important interms of the risk to sustainability and, therefore, to quality of life within the region. Inthe this case, the emphasis of the diagnosis that will assess impacts restricted to thearea of direct influence (AID), with a horizontal focus on the area of direct influence,involving variables associated with the construction of this project;
b) CONSOLIDATION, where the diagnosis stops being merely a description,adopting an analysis guided by questions on the impacts and the variables that canbe most affected by project construction.
Although in the order the studies are presented the diagnosis precedes theassessment of the impacts, the investigation will not be linear and will allowadjustments between one phase and another. Thus, the team that analyzed thecurrent scenario relied on recommendations from the technicians responsible for thedesign and planning of the project works, initially analyzing their potential impacts,and, then, based on this, outline areas for in-depth diagnosis already established inthe reference material for the studies.
7.2.1. Research Techniques and Sources of Information
The EIA of the project in question is being developed, first of all, from the survey andreading of existing information, i.e. from secondary data. From this information, wecan highlight the environmental reports for the Ludesa SHS, the Transmission Lineat Ludesa SHS up to the substation at Clevelândia, PhD and Master's degreedissertations on the study area, as well as other studies and academic publications,among other texts.
In order to obtain information that identifies the characteristics of the municipaldistrict and the socioeconomic conditions of the populations that reside in the areadirectly and indirectly affected by the project, the following information was analyzed:
from the public bodies (IBGE, PMSFS, Municipal Secretariats, State Secretariats,Association of Municipal Districts, etc.); we acquired basic data on the economicsituation in the Municipal District and the Basic Plan for Ecological-EconomicDevelopment; Urban Zoning Law; Organic Laws in the Municipal Districts; municipaldata recorded by the IBGE, demographic census of 2000.
As cartographic resources, we use IBGE charts at a scale of 1:50,000 and satelliteimages.
After the initial survey of the secondary data, the field work started by looking forinformation more directly related to this project.

51
Terra - Consultoria em Engenharia e Meio AmbienteLtda.
The description of the socioeconomic aspects benefitted substantially from the fieldwork, as it provided a clear definition of the interference from the project on thecommunity present in the influence area.
The characteristics of the project were taken from the engineering designs, where theimpact-generating technical aspects were identified and analyzed. Both of them werejointly addressed by the entire multidisciplinary technical team.
7.3. Identification and Evaluation of Impacts
Based on a general overview, any type of project includes an aspect that induceseconomic development, as its area of influence is not restricted solely to the constructionsite, reaching a larger area, sometimes regional in size, where changes are broughtabout in a direct and indirect manner in the physical, biotic and socioeconomicenvironments.
The nature and intensity of the impacts are different in each phase of the project –planning, construction and operation – which implies significant differences, especiallywith regard to time and location. Therefore, this analysis takes into account thecharacteristics of the influence area and the activities of each phase and stage of theproject.
The current environmental conditions were presented throughout the development of thisEnvironmental Impact Assessment - EIA, which meant we were able to identify andanalyze the likely environmental impacts, either positive or negative. This will allow therelevant public authorities to decide on the feasibility of the project.
The execution and analysis of the prognostic and assessment tasks must comply withCONAMA Resolution 001/86, “in the use of the powers granted by article 48 of DecreeNo. 88.351, of June 1, 1983, for the effective performance of the responsibilitiesassigned by Art. 18 of the same decree, and also considering the need ofestablishing the definitions, responsibilities, basic criteria and general guidelines foruse and implementation of the Environmental Impact Assessments as one of theinstruments of the National Environment Policy, hereby establishes”:
Art. 1 – For the purpose of this Resolution, environmental impact is anychange in the physical, chemical and biological properties of environment,caused by any form of matter or energy resulting from human activities that,directly or indirectly, affect:
“I - Health, safety and the well-being of the population;
II - Social and economic activities;
III - The BIOTA;
IV - The aesthetic and sanitary conditions of the environment;
V - The quality of the environmental resources.”
In order to assess the environmental impacts of Santa Luzia Alto SHS, it was associatedwith some of the methods already used in the Environmental Impact Assessment

52
Terra - Consultoria em Engenharia e Meio AmbienteLtda.
(EIA), in compliance with the Environmental Impact Assessment Manual (SEMA PR,1992).
For impact analysis, the “ad hoc” method was adopted, which uses “brain storming”based on each team technician's specific knowledge, drawn up generically for this typeof project, based on the activities developed in each phase– planning, construction andoperation.
The evaluation of the environmental impacts in this project will be use two procedures:
Social and environmental analysis of the project, which includes information onthe construction process and plant operation, marking its initial stages, isolatingeach work in the general layout of the project for analysis;
Relationship between the actions in the project and socio-environmentalelements of the area, using the "Interaction Matrix" technique, created byLEOPOLD et. al. (1971), which views relationships with greater possibleimpacts;
It must be highlighted that, in order to classify an impact, in terms of an ecosystem, it isimportant to bear in mind the concepts of resilience and homeostasis.
Resilience is the measurement of the capacity of a system to persist in the presence of adisturbance. Thus, if the magnitude of the impact remains within the resilience limits, theeffects can be annulled by a new balance reached within the ecosystem, or when itreturns to its original condition. On the other hand, homeostasis is the measurement ofthe capacity of the ecosystem to maintain a stable internal balance in spite of externaldisturbances.
The method used as a basis for the interaction matrix from Leopold et al. (1 971) it is thebetter known technique among the methodologies of impact analysis, representing amatricial analysis of cause and effect.
The input data in this method is organized in a matrix, where the columns represent theimpact actions that can change the environment, and the lines are the environmentalcomponents (environmental changes) that can measure the intensity of the impact onthe environment caused by the actions. By cross-referencing the lines and columns, wecan identify the interactions between the tensile impact (actions) and the localenvironment, as well as the level of harm caused.
In order to overcome the assessment deficiencies of this method, allowing us to definethe significance of each environmental impact, the characteristics inherent to each ofthem were drawn up, establishing a group of classes to measure the weight of theimpacts according to Table 05, adapted from CONAMA Resolution 01/86.
The characteristics of the impacts were weighted, with differentiated values according tothe relevance of the environment and classification of the impacts. The weights rangedfrom 0 to 4, incrementally, in terms of

53
Terra - Consultoria em Engenharia e Meio AmbienteLtda.
interference into the environment based on the knowledge and environmentalawareness of each technician on the team.
The final value can be either positive (+) or negative (-), if the impact is positive ornegative, respectively. Furthermore, if that value is null or insignificant, the cell inthe matrix is left blank.
From this valuation, the relevance of each impact was defined in relation to eachsocio-environmental component. To achieve this, the assessment team, using themethod developed by Rocha et al. (2001), agreed that the module values, i.e.,irrespective of the sign, would represent irrelevant impacts if equal to or loewr than5,relevant impacts, fell between 6 and 10, and very relevant impacts were highlyrelevant with those above 16 considered extremely relevant.
In EIA–Environmental Impact Assessment of Santa Luzia Alto SHS, each impactwas rated according to its likelihood, accumulating the corresponding weights, withthe results transferred to the impact matrix in order to quantitatively measure theimpact, according to the following rating:
Table 05 – Description and evaluation of the environmental impacts for Santa Luzia Alto SHS.
Característica Classificação do Impacto
Característica devalor
Positivo (+) Negativo (-)
Característicaespacial
Local (1) Regional (2) Estratégico (4)
Característica demagn itude
Desprezível (1) Pequena (1) Média (2) Alta (3)
Característica deimportância
Desprezível (1) Pequena (1) Média (2) Alta (3)
Características deintervenção
Evitável (1) Mitigável (2) Compensável (3) Potencializável (4)
Value: corresponds to the value of impacts, which is, whether their effect on theenvironmental variable is beneficial or adverse to the quality present at the time theimpact occurs. Considering:
a positive or beneficial impact – when an action results in the improvement ofthe quality of a factor or environmental parameter; and
negative or adverse impact – when an action results in harm to the quality ofan environmental factor or parameter.
Spatial characteristic – refers to impact classification according to itscoverage area. Thus, it can have a:
Local impact–when the action affects only the site and its vicinities;
Regional impact–when an effect spreads across an area, beyond the sitewhere the action occurs; and
Strategic impact–when an environmental component of collective or nationalimportance is affected.

54
Terra - Consultoria em Engenharia e Meio AmbienteLtda.
Magnitude – Refers to the measurement of the change in an environmentalvariable in relation to its prior status, irrespective of its importance, be causeof the fact that it affects other environmental elements. In this sense, the impactcan be:
Impact of ignorable magnitude – when the change caused doesn't have anyimportance;
Impact of small magnitude – when the change caused has little or no importance;
Impact of average magnitude – when the extent of the change is at anintermediate level; and
Impact of high magnitude – when it extensively changes a pre-existing situation.
Importance – contrary to the magnitude, the importance expresses the eff ectof the environmental impact on a component and on the other environmentalvariables. Based on that characteristic, the impact can be rated as:
Irrelevant impact – when the impact only affects one environmental variable, inan insignificant way;
Impact of small importance – when the impact only affects one environmentalvariable without affecting other components;
Impact of average importance – when the effect of an impact affects othervariables, but it doesn't affect the range of the environmental factors in which it isincluded or the quality of life of the local population; and
Impact of great importance – when the impact on the variable risks the survival ofthe environmental in which it is included or acutely affects the population’s qualityof life.
Intervention – refers to the possibility of the impact being prevented,minimized, offset, if negative and increased, in if positive. The impact may berated as:
Avoidable – preventive solutions are possible;
Minimized – impact that cannot be avoided, but its effects can be minimized bythe adoption of mitigating measures;
Offset –impact that can neither be avoided nor minimized, only offsettingmeasures can be established; and
Incremental – impact that even though positive, may be optimized throughappropriate measures.

55
Terra - Consultoria em Engenharia e Meio AmbienteLtda.
8. ENVIRONMENTAL
DIAGNOSTIC
8.1. Physical Environment
8.1.1. Weather and Meteorological Conditions
Santa Luzia Alto SHS is located in the humid mesothermal Cfb type climate,according to the Köppen classification, the prevailing characteristics of which are asubtropical climate marked by pleasant summers and harsher winters, acharacteristic that is dictated by the latitude and altitude. It also suffers the influenceof air masses, which during the winter help to increase the cold in the region, when itis affected by the Polar air mass. It also has an influence on the high level ofregional rainfall, associated with relief characteristics.
In the municipal districts surveyed, only Abelardo Luz has a weather station, and asthese municipal districts are adjoining, the climatic difference between them isconsidered small, therefore we can use data from this station.
For about seven years, a Weather Station has been operating in Abelardo Luz,located at latitude 26° 34’ 11” South, and a longitude 52º 20’ 37” West and anapproximate altitude of 770 meters above sea level. This station is responsible formonitoring the data presented below in Tables 06, 07, 08 and 09, also specifying thenumber of years of observation.
Table 06 – Normal temperature data, municipal region of Abelardo Luz/SC.Temperatura (ºC) Temperatura Média (ºC)
MesesMé dia
MáximaAbsoluta
MínimaAbsoluta
Má xi ma Mínima
Janeiro 22,0 33,8 10,4 28,4 16,4Fevereiro 21,8 34,4 8,2 28,6 16,3
Março 20,9 35,0 5,0 27,8 15,1Abril 19,0 34,0 5,6 26,4 14,0Maio 15,9 30,4 -1,8 23,0 11,1
Junho 14,5 28,4 -3,2 20,9 9,9Julho 13,5 28,4 -6,0 19,8 9,0
Agosto 15,3 32,0 -2,3 22,5 10,2Setembro 16,3 33,8 -2,1 23,1 11,2Outubro 18,9 33,4 5,5 25,8 13,4
Novembro 20,5 38,4 2,3 28,6 15,0Dezembro 21,7 33,3 6,0 28,3 16,6
AnosObservados
5 7 6 6 5
Source: CLIMERH / EPAGRI – SC
The maximum absolute temperatures are around 38.4ºC. They are high values,however they are not the highest ones in State or the Country, but only occur duringthe summer. On the other hand, the absolute minimum can reach 6 degreesnegative, which can cause frequent frosts in the surrounding municipal districts.Such extreme values in the winter lead to a high absolute thermal range

56
Terra - Consultoria em Engenharia e Meio AmbienteLtda.
in the area, and sometimes exceeds 40ºC.
Table 08 – Normal precipitation, humidity and evaporation data, Abelardo Luz/SC.Precipitação (mm)
Meses Total Máximaem 24 horas
Número deDias deChuva
UmidadeRelativa
(%)
EvaporaçãoTotalPiche
Janeiro 281,0 91,1 15,3 77,8 73,4Fevereiro 151,4 39,8 12,9 79,8 63,3
Março 164,7 41,2 12,6 79,5 74,2Abril 169,3 61,2 8,9 81,7 58,5Maio 190,7 69,2 8,9 82,0 59,9
Junho 207,5 59,3 9,0 82,1 55,1Julho 137,9 40,1 8,6 82,8 66,2
Agosto 151,8 30,5 8,3 79,7 74,7Setembro 218,7 52,7 11,9 79,7 75,1Outubro 232,6 71,4 12,4 79,8 75,9
Novembro 146,3 44,4 10,2 73,0 100,0Dezembro 201,2 49,9 10,7 78,2 94,3
AnosObservados
7 7 7 5 3
Source: CLIMERH / EPAGRI – SC
The relief and the air masses that prevail in the area influence the other climaticelements, such as rainfall, atmospheric pressure, temperature and the relativehumidity of the air.
Table 08 – Normal meteorology data, Abelardo Luz/SC.
MesesNebulosidade
( 0 / 10 )Insolação
(horas)
Radiação SolarGlobal
(cal/cm2)
PressãoAtmosférica
(mb)Janeiro 5,8 155,1 1.042,9
Fevereiro 5,6 183,0 969,0 NMarço 5,5 166,1 846,2 ÃAbril 4,8 172,9 693,1 OMaio 4,7 168,2 565,3
Junho 4,9 156,6 502,4 EJulho 4,9 187,6 529,2 X
Agosto 4,5 196,8 632,7 ISetembro 5,0 153,3 777,8 SOutubro 5,7 157,3 914,7 T
Novembro 5,0 244,4 1.014,2 EDezembro 5,3 229,9 1.056,5
AnosObservados
6 1 1 *
Source: CLIMERH / EPAGRI – SC
The annual relative humidity can be considered continuously humid, with an annualaverage of 80%. The high relative humidity of the air is explained by the relief,vegetation, water courses and direction of the winds, and, on the plains, the humidityis moved towards the mountain by the winds and in the plain it follows the rivercourse. In this area, as well as in the remaining area in the south of the Country, theweather conditions depend on the behavior of the Atlantic Tropical Mass (ATM) andthe Atlantic Polar Mass (APM). The former acts throughout the year, especially inSpring and Summer, while the Atlantic Polar Mass acts more often in Autumn and
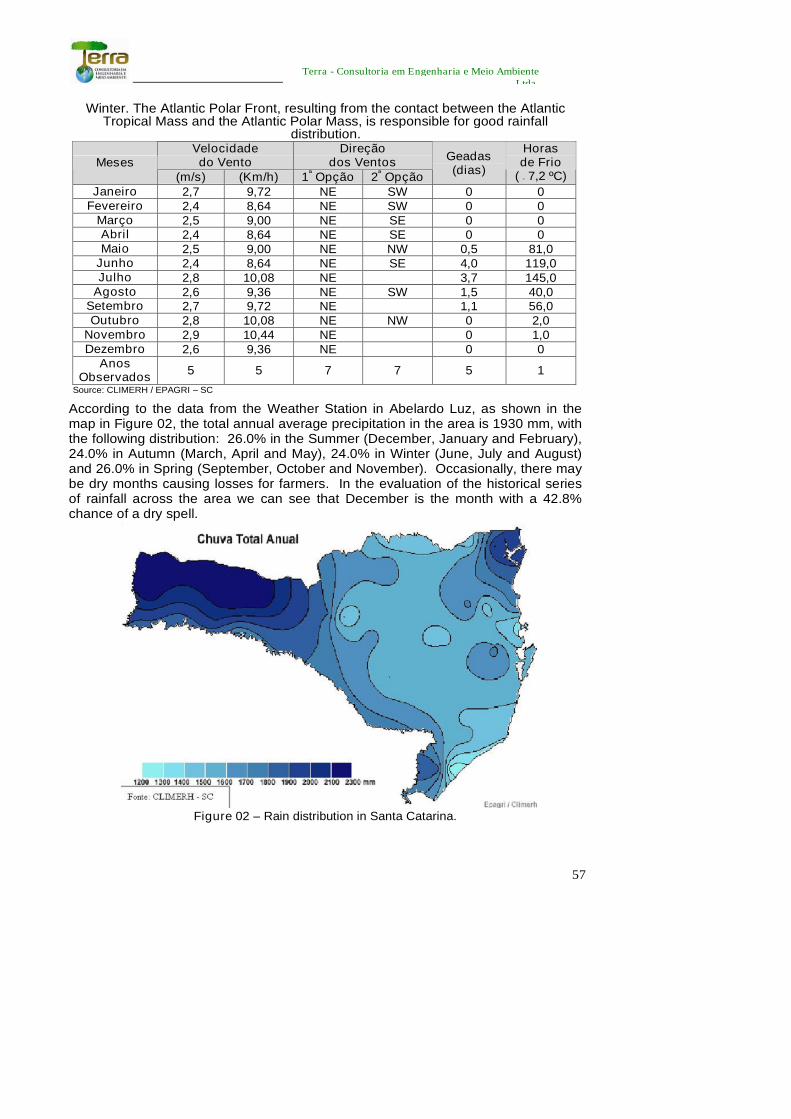
57
Terra - Consultoria em Engenharia e Meio AmbienteLtda.
Winter. The Atlantic Polar Front, resulting from the contact between the AtlanticTropical Mass and the Atlantic Polar Mass, is responsible for good rainfall
distribution.Velocidadedo Vento
Direçãodos VentosMeses
(m/s) (Km/h) 1ª Opção 2ª Opção
Geadas(dias)
Horasde Frio
( < 7,2 ºC)
Janeiro 2,7 9,72 NE SW 0 0Fevereiro 2,4 8,64 NE SW 0 0
Março 2,5 9,00 NE SE 0 0Abril 2,4 8,64 NE SE 0 0Maio 2,5 9,00 NE NW 0,5 81,0
Junho 2,4 8,64 NE SE 4,0 119,0Julho 2,8 10,08 NE 3,7 145,0
Agosto 2,6 9,36 NE SW 1,5 40,0Setembro 2,7 9,72 NE 1,1 56,0Outubro 2,8 10,08 NE NW 0 2,0
Novembro 2,9 10,44 NE 0 1,0Dezembro 2,6 9,36 NE 0 0
AnosObservados
5 5 7 7 5 1
Source: CLIMERH / EPAGRI – SC
According to the data from the Weather Station in Abelardo Luz, as shown in themap in Figure 02, the total annual average precipitation in the area is 1930 mm, withthe following distribution: 26.0% in the Summer (December, January and February),24.0% in Autumn (March, April and May), 24.0% in Winter (June, July and August)and 26.0% in Spring (September, October and November). Occasionally, there maybe dry months causing losses for farmers. In the evaluation of the historical seriesof rainfall across the area we can see that December is the month with a 42.8%chance of a dry spell.
Figure 02 – Rain distribution in Santa Catarina.
58
Terra - Consultoria em Engenharia e Meio AmbienteLtda.
8.1.2. Geology, Geomorphology and Soils
The area which Santa Luzia Alto SHS directly and indirectly influences, located in thecities of São Domingos and Ipuaçu, in the state of Santa Catarina, presents lithologicalaspects connected to the geology of the Southern Brazilian region. The geological andgeomorphological characteristics of the state of Santa Catarina will be described ingeneral terms and the West Catarinense geology and geomorphology in detail, for thestudy area.
Regional Geology
The general geological scenario in the state of Santa Catarina, based on informationfrom DNPM (1986) (National Department of Mineral Production) data, presents a broadlithological diversity with ages that date from Archean to Quaternary.
Horn Filho & Diehl (1994, 2001) and Horn Filho (2003) subdivided Catarinense geologyinto five large geological provinces positioned by their structural, petrographic,sedimentary and evolutionary characteristics: Escudo Catarinense; Paraná Basin;Planalto da Serra Geral; Alkaline Complex and Coastal Province.
From a chronological standpoint, the archean, proterozoic and cambrian rocks of theEscudo Catarinense represent the State’s oldest rocks ( ± 550 MA AP), followed byParaná Basin’s sedimentary rocks (between 500 MA AP and 180 MA AP), Serra GeralPlateau’s basalt (± 130 MA AP), Alkaline Complex (± 65-70 MA AP) and the sedimentarydeposits of Coastal Province from the quaternary age (± 2 MA AP to now).
Escudo Catarinense is restricted to the eastern sector of Catarinense territory, borderingthe Atlantic Ocean; Paraná Basin is in the State’s central sector; Alkaline Complexoutcrops are found mainly in the Lajes region; Coastal Province, represented by thesubmerged sediments of the continental shelf on the coastal plain, it has its depositsmapped next to the current coastline and the Plateaus of the General Mountain range,which occupies about 50% of the area of the state of Santa Catarina, in the central andwestern sector, represented by a classic sequence of dense plateau spills,predominantly of magmatic origin (Figure 03).
The plateau spill system was fed by intensive intrusive activity, normally represented bydykes and sills which follow the main structural discontinuity of the Paraná Basin, whichis sotoposta. These discontinuities, complementary to the Atlantic rift, are responsible forthe opening and distribution of gondwanic fragments and separation of the Paraná basinin South America, and Etendeka, in Africa. The fissural volcanism of the Paraná basinrepresents one of the greatest demonstrations of continental volcanism in the world. It isrepresented by thick and extensive lava spills, as well as dykes and sills, with small andoccasional bodies of associated sedimentary rock.
The dykes are kilometers in length marked by a unique parallelism and density, whichreveal old weak features based on the bedrock, through which the magma was expelledto form the basalt slope.

59
Terra - Consultoria em Engenharia e Meio AmbienteLtda.
Figure 03 – Lithostratigraphic units of Santa Catarina, according to SCHEIBE (1986).
The continental basaltic province is related to processes which differ from those relatedto the normal bedrock of the ocean floor. This province represents, after the ocean floor,the greatest igneous event on the planet, representing important temporal, spatial andarrangement relationships between continental and ocean basalts.
The Serra Geral magmatism of the Paraná basin, in the central-eastern portion of SouthAmerica and Etendeka, Northeast Namibia (Africa), represents a geotectonic unit withapproximately 1,700,000 km2, occupying part of the territories of Brazil, Argentina,Uruguay and Paraguay (South America) and Namibia (Africa).
The rupture and separation of Gondwana, during the inferior Cretaceous, wasresponsible for the volcanic event which covered the central-south portions of the Paranábasin and Northeast of Etendeka basin with lava, up to a thickness of approximately1,720m in the basin’s depocenter. The cooling of these lavas resulted in rocks withcharacteristics of bimodal tholeites, being dominantly composed of basalts and andesiticbasalts in the lower sequence and riolites and riodacites in the sequence above.
Local Geology
As seen on the map (Exhibit 10), the local geology in the direct influence area at SantaLuzia Alto SHS is directly based on stratigraphic, chronological, lithological andpedological aspects, among others, from the geological province of Planalto da SerraGeral.
The rocks of Planalto da Serra Geral originated from the lavas released from themagmatic chamber, being displaced through various cracks (geoclasses) open on thesurface. Lava spills cover various states nationwide, including Santa Catarina, occupyingan area of 1,200,000 km2.
60
Terra - Consultoria em Engenharia e Meio AmbienteLtda.
From a stratigraphic standpoint, the geology in the direct influence area is composed ofrocks of the São Bento Group, subdivided into formations of Serra Geral at the top of thesequence and Botucatu, at the bottom, which is made from extensive basaltic spills inthe form of basic effusive (tholeitic basalts) with eventual interspersion of intertrappeanarenites, which cover the aeolic arenites of the Paraná basin.
The Serra Geral Formation, according to DNPM (1984), was defined by White (1906) inthe location – same type as Serra Geral of the Meridional Plateau, between Lauro Mullerand São Joaquim, in the State of Santa Catarina. The designation of this formation refersto the magmatic province related to the spills and intrusions which cover the central-south region of Brazil and extends through the borders of Paraguay, Uruguay andArgentina (MELFI et al., 1988).
From a geochronological standpoint, rocks from the São Bento Group, are located in theMesozoic era, more precisely, the lithotypes of the Serra Geral Formation weregenerated between 119 MA AP and 147 MA AP, in the Jurassic and Cretaceous periodsand the arenites of the Botucatu Formation, older, in the Triassic (± 180 Mya). K - Ar andRb – Sr dating identified maximum intensity of volcanism between 120 Mya and 130Mya, according to data from Almeida (1986), corresponding, according to Amaral (1966),to the inferior Cretaceous.
The internal characteristic of the spills of Serra Geral Formation reveals four main zones:basal vitreous zone, with horizontal disjunction; intermediate zone, with vertical junctions;upper zone, with vertical and horizontal disjunction; and vesicular basalt, at the top.
According to Pinese (1989), the inferior contact of the Serra Geral Formation witharenites of the Botucatu Formation is discordant and with older units is marked byerosive discordance, in certain locations, directly on the bedrock. Basaltic and rioliticextrusive rocks are found covered in some locations by continental sediments of theBauru formation, of cretaceous age, according to the stratigraphic column of Mühlmannet al. (1974).
The Serra Geral Formation, from a perographic standpoint, presents a full set oflitological types, from basalts to acid rocks of the riolitic extreme. Basaltic volcanism isthe most extensive, located throughout the area of the Paraná basin and in the adjacenttectonic pools.
Intermediate composition spills present a very broad distribution, being recorded in allquadrants of the Paraná basin, although the extensions and thicknesses are lower thanthe basalts. Volcanism of acid filiation comprises discontinuous occurrences as well asbeing deeply cut by erosive processes (PINESE AND NARDY, 2003).This set of lithologies allows the division of Serra Geral Formation into two distinctsequences: basic sequence and acid sequence. The basic sequence is predominant inarea and volume, comprising basalt, andesite and obsidian spills, in addition to volcaniccracks and intertrappean arenites. The acid sequence comprises porphyry dacite,phelsitic dacite, felsitic riolite and felsitive riodacite spills.
Basalts are melanocratic rocks, of dark grey to black color, aphanitic dominant texture,whose minerals are not noticeable to the naked eye, being predominantly composed ofcalcic pyroxene, amphibolies and plagioclases.

61
Terra - Consultoria em Engenharia e Meio AmbienteLtda.
In thicker varieties, such as those encountered in the top zone, minerals form crystalsvisible to the naked eye, characterizing the geodes, with the presence of subedric toauedric minerals filling the spill’s top vesicles.
Basalts when altered, generally in the rock surface, create eluvial sediments which takeon brown-reddish colors, turning darker in inner parts, where the chemical decompositionis lower, according to field observation in the layout of the chosen alternative.
Eluvium gradate to coluvial and alluvial deposits, associated with the continental systemof slopes and accumulated in a non differential manner during the Quaternary. Theyoccupy the feet of hills, river lowlands, drainages and thalwegs, composed of fine andthick sands, unconsolidated pebbles, as well as flooding lowland clay.
Mineral Resources
Mineral resources of the influence area are light, being represented mainly byoccurrence of explored basalts from the outcrops as material for civil construction andaggregate production. Their economic importance is also in the extraction of semi-precious rock from the amygdaloid basalts at the spill’s top, whose main minerals are:rock crystal, citrine, amethyst, agate, chalcedony, onyx, calcite, zeolite, malachite,among others.
As verified in on site, no quarry was identified in the direct and indirect influence areas ofthe project.
The locations intended for the extraction of mineral inputs, lease land location and wastedeposits are located near the work site as shown in Exhibit 01.
Pedology
From a pedologic standpoint, according to SANTA CATARINA (1986), the direct andindirect influence area of the Santa Luzia Alto SHS is occupied by soils of the dystrophicRED NITOSOIL; RED LATOSOIL and Eutrophic Ta HAPLIC CAMBISOIL groups.Dystrophic RED NITOSOIL is developed throughout the main rivers and their affluents,involved by RED LATOSOIL and Eutrophic Ta HAPLIC CAMBISOIL.
Dystrophic RED NITOSOIL occurs in undulated and strong undulated relief , beingmineral, clayey, non hydromorphic soils, with presence in the B horizon of clay of lowcapacity cation exchange and derivatives. They represent deep, porous and well drainedsoils, with sequence of A, B and C type horizons, generally very clayey throughout theprofile. Because of small variations of color and texture, transitions between sub-horizons are gradual and diffuse.
RED LATOSOILS are mineral, non hydromorphic soils, characterized through thepresence of latosolic B horizon. They derive from basalts and less commonly from acidiceffusive rocks of the Serra Geral Formation, and present A, B and C horizon sequencewith diffuse and gradual transition. They are also deep and very deep soils with veryclayey texture; and they are located in a slightly undulated and undulated relief.
Terra - Consultoria em Engenharia e Meio AmbienteLtda.
Eutrophic Ta HAPLIC CAMBISOIL comprise mineral, non hydromorphic soilscharacterized by the occurrence of a incipient B horizon, defined by low textural gradient,

62
by medium and high silt/clay ratio or by the presence of primary minerals of easydecomposition. Generally, it has A, B and C horizon sequence, finding variations in soildepth, color, texture and structure. When derived from basalts generally they have highactivity clay, they are almost always graveled and are located in strong undulated andmountainous reliefs.
Regional Geomorphology
The model of the current surface of the State of Santa Catarina was a result of theintegrated action of pluvial, fluvial and tectonic processes, as well as climate influence.
The State of Santa Catarina presents from east to west, in terms of its topographical andgeological configuration, five large natural morphological landscapes: 1) CoastalLowland; 2) Crystalline Mountain Range; 3) Peripherical Depression; 4) Lajes and SerraGeral Plateaus.
Geological provinces of the State of Santa Catarina (Escudo Catarinense; Paraná Basin;Serra Geral Plateau; Alkaline Complex and Coastal Province) are correlated from thegeomorphological standpoint, to the following provinces: Crytalline Mountain Range;Peripherical Depression; Basaltic Plateau – Arenitic; Lajes Plateau and Coastal Lowland,respectively.
The Crystalline Mountain Ranges follow the coast line adjacent to the South Atlanticocean, characterizing a very different relief ranging between acute ridges and deepdrainage channels, with altitudes which reach 1,200 m above sea level. In the State ofSanta Catarina, they compose the Serra do Mar in the North coast and MountainRanges of the east of Santa Catarina, in the center-north coast, central and center-south. In the Peripheral Depression sedimentary rocks appear which originated from theDevonian to the Triassic (Basaltic-Arenitic Plateau), configuring a massivegeoenvironmental entity known as intracratonic basin of Paraná, whose relief isrepresented by hills and valleys at average altitudes of 700 m. The Lajes Plateaucomprises a restricted geomorphologic feature associated with alkaline magmatic rockswhich reach altitudes of 900m. The Coastal Lowland presents a morphologicaldominance of lower altitudes when compared to other geomorphologic provinces in theState, presenting types of relief such as alluvial lowlands, marine and lagoon terraces,dunes and coastal paleo-dunes, coastal regressive cords, tide and beach lowlands.
Local Geomorphology
From a geomorphologic standpoint, according to Bortoluzzi (1987), the direct influencearea of the Santa Luzia Alto SHS, subordinated to geological lowlands of Serra GeralPlateau and Paraná Basin, is found in the Domain of the Basaltic-Arenitic Plateau ofSanta Catarina or Acidic and Intermediate Basaltic Lava Plateau, which at their baseinvolve aeolian arenites from the Botucatu Formation and at the top, the eruptiveformations of the Serra Geral Formation, upon which the plateau relief was developed,which meets its eastern boundaries, acclivitous and strongly dissected by a drainagechannel subsequent to the Serra Geral.
Monteiro (1958) subdivided the basaltic complex in two geomorphological units,

63
Terra - Consultoria em Engenharia e Meio AmbienteLtda.
by altitude: the first, more elevated, with heights of 1,200m and the second, lesselevated, with heights of 900m, distributed across extensive areas with spatialdiscontinuities, presenting on one side, strongly dissected hilly forms, and in theother side, flat surfaces which are almost senile, undulated, cut by valleys of varyingdepth.
The level surfaces referred to by Monteiro (1958) may be correlated to the CamposGerais Plateau units (1,200m) and Dissected Plateau of the Iguaçu/Uruguay River(900m), defined by Rosa & Herrmann (1986). These units are different because theDissected Plateau of the Iguaçu/Uruguay River presents great variations of heightsbetween their maximum points and drainage located in the deeply uneven slopeswith steep sides, structurally controlled. The morphologic characteristics of thelandscape make the drainage network sinuous, with rocky surfaces, drops, smallwaterfalls, falls and islands.
The Iguaçu River/Uruguay River Plateau undulates to the east, also presenting agreat variation in altitude, resulting from the deepening of the main river’s drainage,which presents valleys and deep drops between the top and the bottom of the valley,between 200 m and 300 m.
The relief presents a great number of locations with steep slopes, sometimes in theform of escarpments, characteristic of intense movement. The slopes present stepsalong their length, frequently representing erosive processes and gullies which acton them, although covered by vegetation.
Drainage is very similar throughout the entire unit, because of being stronglycontrolled by the structure. This structural control is evident considering the variousoccurrences of rectilinear and abrupt inflections, as well as because of great quantityof rapids, falls and rocky surfaces. In virtue of morphologic conditions where they areassociated with the drainage network, they offer great hydroelectric potential whichis starting to be used.
On the other hand, the Campos Gerais Plateau is characterized by the presence ofrelief blocks isolated by the Dissected Plateau unit of the Iguaçu River/UruguayRiver. This compartmentalization is located above circumjacent areas andcorresponds to traces of a smoothing surface. The blocks appear fragmented as aconsequence of the process developed throughout the main drainage period.
In the study area, tholeitic basaltic lavas from the Serra Geral Plateau reach averagealtitudes between 750m and 850m, with the relief slightly falling towards the west. Aseries of structural lines, of predominant Northeast and Southwest direction, occurattached to acidic and basic rocks. SANTA CATARINA (1986) affirmed that the mostsignificant system of faults and fractures of the Serra Geral Formation is in theN50°E, N20°E and N20°W directions.
In the wider area of the Serra Geral Formation, the uniformity and horizontality, oralmost horizontality of various spills, was only interrupted in locations where therewere seesawing, irregular blocks. In these vaulting locations, spills are centrifugallyinclined up to approximately 20º.

64
Terra - Consultoria em Engenharia e Meio AmbienteLtda.
The most preserved areas of volcanic spills corresponds to regional tops and belongto the remains of a smoothing surface. Smooth areas generally correspond to areasof occurrence of acidic effusive rocks, being regionally known as Campos Gerais. Inareas where acidic effusive rocks occur the characteristics of the outcrops almostalways change, are deeply dissected, with deep valleys and layered slopes.
The model of small hills accompanying the drainage axis, associated with fertilesoils, drives the development of mechanized agriculture, mainly soybeans, corn andwheat. This has accelerated the erosion processes because of surface erosion,which is shown by furrows on the slopes.
All outcrop rocks are subjected to erosion processes over time, producing sedimentsthat are deposited in restricted sand-banks and sedimentary basins, where depositsof clayey sediments and sand, of predominantly Cenozoic age, occur.
Geomorphologic characteristics of lands adjacent to the project’s area characterize aslightly undulated relief to undulated at the top of plateaus and throughout the floodbasin of the Chapecó river, resulting from the intense dissection which they havebeen subjected to.
8.1.3. Water Resources
The project is located on the Dissected Plateau of the Iguaçú/Uruguay river, in theChapecó river basin, a tributary of the Uruguay River right bank, upstream from theChapecozinho river in the so-called Integrated System of Interior Watershed(Sistema Integrado da Vertente do Interior), whose waters drain into the Continent,from the divisor created by the Serra Geral, towards the great Hydrologic Complexof the Prata Basin.
As for fluvial regimes, we found that the rivers of Santa Catarina are governed, as arule, by the pluviometric regime which is characterized by the rain distributedthroughout the entire year, assuring in normal supplies for springs throughout theyear. The behavior of most of rivers, according to the rainfall distribution isrepresented by two maximums (occurring in the spring and at the end of summer,respectively) and two minimums (registered at the beginning of summer and fall,extending to winter), characteristics of a subtropical regime.
The project is located in the Hydrographic Region 2 – Mid-West, Figure 04,hydrologic unit formed by the Chapecó and Irani basins, this region has undergonegreat socio-economic growth in the last two decades. The rural populationsrepresent 47% of the total population, which reveals the social importance of thissector in the region. It is among the areas that represent the greatest number ofcities in the State, which is why three associations exist - AMEROS, AMOSC, andAMAI – that are responsible for local political-administrative regionally.

65
Terra - Consultoria em Engenharia e Meio Ambiente Ltda.
Figure 04 – Hydrographic region of Santa Catarina.
The Mid-west Hydrographic Region (HR – 2) forms the Uruguay river basin and hasas major water course that bring water to the region, the hydrographic basins of theChapecó River and Irani River. The Chapecó River, with an average flow of 263m3/s in the estuary, a drainage area of 8,190 Km2 and a drain density of 1.55Km/Km2, represents the main water course in this hydrographic region, draining theareas of 30 cities, including São Domingos and Ipuaçu.
The rivers of this watershed present, as a rule, a longitudinal profile with a longcourse and a number of waterfalls, which represent significant hydroelectric potentialfor the region. The Chapecó River, the biggest tributary of the Uruguay River inSanta Catarina, is very sinuous, as a water source it serves the cities included in thisstudy, among others along its course.
The relief is mostly steep, which contributes to erosion. In the same way, theregional vegetation coverage is degraded, with only 17% of primary and secondaryvegetation, and 15 of reforested area. The agricultural capacity of most of the soils isin classes 3 and 4 (restricted usage), which does not prevent it from coming first ingrain production and among the first in hog, fowl and milk production in the State.
As a consequence of the intense farming and breeding activity, we found aggravatedsoil erosion and the silting up of rivers, in addition to large scale contamination ofsprings from hog excrement and pesticides. When the availability of water iscompared with its various usages we find that there is a relative normal situation inthe most of the sub-basins in the region. However, in some of them there is lack ofwater, as is the case in the estuary of the Chalana river, near Chapecó, where thesituation can be considered critical because during dry weather, more than 70% ofthe water is consumed by current users.

66
Terra - Consultoria em Engenharia e Meio Ambiente Ltda.
The most serious problem is related to water contamination by hog excrement.According to surveys done by Epagri 84% of sources and small springs in the areastudied are contaminated by fecal coliforms.
In this context, the drilling of deep wells in the region has increased, without theproper registration and without the required assessment of aquifers and potentialgroundwater in the region.
West Santa Catarina was not included in conservation areas because there arealmost no expressive forests in that region, because of the degrading action ofagricultural, rural and industrial activities. IN addition to the Forest District that, in away, discourages aggression to forests, other preservation units were also createdin order to protect either the flora, fauna, water resources or soil. The parks,biological reserves, and ecological stations are approaches adopted according to theecological conditions of each area. The most important preservation unit nearest theregion studied is the Xanxerê Indigenous Reserve, a National Preservation unitsince 1985.
The cities of São Domingos and Ipuaçu are bathed by the hydrographic Basin of theChapecó river, which is its main river and whose main tributaries are the riversBonito, Saudades, Feliciano, Martins, Emigra, Lajeado Jacutinga, Lajeado Baitaca,Martins, and Lajeado Santo Antônio.
The Chapecó river is the main tributary of Uruguay river, draining an area of 8,180-km2 . Its springs are located in the Chapecó Ridge, near Capão Doce Hill (1,340 melevation), which borders the Iguaçu river basin, the main water course in Paranástate. Even with this unevenness, the river’s erosive power is not very strong throughoutits course (Figure 05 and Figure 06). Its average depth in the dam location and in thelongest part of the lake to be formed is 1 to 2 m.
Chapecó river main tributaries on the right bank are Ouro and Burro Branco rivers,and on the left bank only the Chapecozinho river is highlighted.
The hydrographic basin of the Chapecó river runs mostly east-west, up to AbeardoLuz, where it flows northeast-southwest thus it discharges into the Uruguay river,near São Carlos.
In the North, the Chapecó basin borders the Chopim river basin, a tributary on theIguaçu river left bank. Then in the south, it borders the Irani river basin, which is alsoa tributary of the Uruguay river.
The drainage density, as a good indicator of the hydrographic network developmentlevel, is obtained by the relationship of the sum of all tributaries’ lengths, includingthe main course, and the basin area. The drainage density ranges from 0.5 km/km2
in basins with poor drainage, to 3.5 km/km2 or more for basins exceptionally welldrained (Villela & Matos, 1975).
Chapecó river basin has 12,716 Km of water courses, resulting in a drainage densityof 1.55 km/km2. This result indicates thon the Chapecó river basin is in the averagerange of drainage density.

67
Terra - Consultoria em Engenharia e Meio Ambiente Ltda.
Figure 05 – View of the Chapecó River in the planned location of the power station.
Figure 06 – View of the Chapecó River between the power station and dam.
Its basin is located in one of the regions of Santa Catarina with the highest pluviometricindexes, and its drainage density is 1.55 km/km2. The basin’s typical drainage patternis dendritic, tending to Angular-subparallel. The average flow through the period atthe dam (Figure 07) is

68
Terra - Consultoria em Engenharia e Meio Ambiente Ltda.
about 64 m3/s which, after the completion of Ludesa SHS to the upstream, willchange to approximately 33 and 35 m3/s.
Figure 07 – View of the Chapecó River in the planned location of the dam.
The drainage system that constitutes the Chapecó river basin covers 8,190 km2 andits tributaries have strong structural control, shown by the shape of river beds thatrun straight and then form sharp bends and curves, and frequent rapids, waterfalls,falls, and rocky surfaces.
Points of use and employment of waters from the Chapecó river as a public supplyor for other applications are unknown and were not identified, either upstream ordownstream of the current dam.
Five micro hydrographic basins are going to be directly affected by the project,Appendix 11, three on the Chapecó river’s right bank and two on the left bank, inIpuaçu. On the Chapecó river’s right bank, in the area where the power station willbe built, the dam and the work site have Córrego Azul and Córrego São Lourençomicro basin specifically drained by Córrego Azul, Córrego São Lourenço, and ArroioSanta Luzia rivers, but the Córrego Azul will not be directly affected by the projectbecause it is upstream. Also on the right bank, there are the Bonito River Right Bankand Left Bank micro basins, between these micro basins, there is the Bonito river, amain tributary of the Chapecó river affected by the SHS. In this section, there aresome streams that drain their water to the Bonito river, they are not directly affected,and a small river directly drained to the Chapecó river.
In Ipuaçu, the Chapecó river left bank, there is the Toldo Velho river and LajeadoIpuaçu micro basin located in the section that will shelter the other end of the dam.Toldo Velho river as well as Lajeado Ipuaçu river are located between the

69
Terra - Consultoria em Engenharia e Meio Ambiente Ltda.
dam and the power station, decreasing the impact caused by the lower flow in thissection.
Downstream, there is the Lajeado Grande and Salomão river micro basin. In thismicro basin, there are the Lajeado Grande and Sanga União rivers inside theflooding area and upstream of the Salomão river flood plain.
São Domingos is supplied with water from the Bonito river, the main tributary of theChapecó river in the influence area, rising on the border with Paraná and crossingthe city to drain into the Chapecó river.
Bonito river discharges approximately 6.5 km downstream of the future dam at theSanta Luzia SHS, on the Chapecó river. Note that the Bonito river will have part ofits course flooded by the reservoir, Figure 08.
The most important hydro geological feature in regional terms is Guarani Aquifer, thecurrent name for the Botucatu Formation. This geological Formation, from the SãoBento Group, is made of aeolic sandstone from a desert environment, reddish, thinto average, with cross-stratification of average to large capacity; lacustrinesediments locally represented by argillaceous sandstone , mis-selected, morefrequent on the formation base.
Figure 08 – Bonito and Chapecó rivers combining.

70
Terra - Consultoria em Engenharia e Meio Ambiente Ltda.
Average Monthly FlowFor the assessment of monthly average flows of Santa Luzia Alto SHS utilization,using data from the following stations:
Table 10 – Monitoring Posts.
Código Posto RioAD
(Km2)Disponibilidade deDados Consistidos
73760000 Abelardo Luz Chapecó 1 .850 Abr/53 a Dez/9973850000 Passo Nova Erechim Chapecó 7.535 Jun/59 a Dez/86
Notes: The Passo Nova Erechim post was decomissioned in Sep/90.The period from Jan/87 to Sep/90 of the Passo Nova Erechim post was not subject to consistencyanalysis by ANEEL.
Note that only data already consolidated by ANEEL was used, not analyzing the rawdata available.
When defining the monthly average flow series at the Santa Luzia Alto SHS plant,the series from the Abelardo Luz and Passo Nova Erechim stations were basicallyused.
Initially, series from 2 stations were compared to the series used in previous studies.It was found that because of the consistency analysis performed by ANEEL, theseries of data from Abelardo Luz station (code 73760000) had changed.
Assuming Abelardo Luz station as the base point for the series of monthly averageflows of Santa Luzia Alto SHS plant, initially it was attempted to fill in the gapsexisting in the station series (Oct. and Dec/56, Jan./66 to Jul./87, and Feb., Mar. andDec./79). For that, a co-relation of monthly average flows among the data fromAbelardo Luz and Passo Nova Erechim was performed, resulting in the followingtransfer equation:
QA.L. = ( 0,27 x QNE ) + 3,861Where:
QA.L. = average monthly output of Abelardo Luz, in m3/sQN.E. = average monthly output of Passo Nova Erechim, in m3/sQSL = 1.373 x QA.L.
Since the gaps are filled in, a series of Abelardo Luz station for the period betweenMay/53 to Dec/99 was made, as presented in Table 11.
A series of monthly average flows at the site of the Santa Luzia Alto SHS plant(AD=2,540 km2) was obtained applying factors resulting from the ratio of DrainageAreas between Abelardo Luz station and the plant:
QSL = 1.373 x QA.L.
Note that the period before Apr/53 was preserved in the series for the plant,changing only the period from May/53 to Dec/99, following the consistency analysisthat the Abelardo Luz series underwent.
In Table 12, the series of monthly average flows of Santa Luzia Alto SHS plant maybe seen.

71
Terra - Consultoria em Engenharia e Meio Ambiente Ltda.
Table 11 – Series of average monthly flows (m3/s).Ano Jan Fev Mar Abr Mai Jun Jul Ago Set Out Nov Dez Média
1953 23 31.1 33.8 32.6 90 111 76.3 44.4 55.3
1954 46 33.3 52.3 44.4 83 175 140 47.3 174 201 37 33.8 88.9
1955 16 17.7 13.8 68 96.2 142 127 62.4 37.4 22.6 12.8 11.4 52.3
1956 29.8 24.8 10.2 57.1 67.3 34.2 44.3 36.2 117 35.9 9.8 12.6 39.9
1957 12.8 36.6 24.3 14 14.4 43.8 129 263 160 37.9 21.8 19.2 64.7
1958 13.2 9.5 46.5 20.9 8.9 26.2 19.6 55 114 70.1 71 91.1 45.5
1959 49.6 33.1 18.1 29 37.1 34.1 24.3 39.7 47.5 31 22.1 16.1 31.8
1960 10.8 14.2 9 10 14.8 32.1 15.8 80.5 69 99.9 73.2 24.2 37.8
1961 19.8 24.3 149 48.1 58.3 35.1 16 12.1 132 141 77.4 34.3 62.3
1962 22.5 52.3 28.2 16.1 57.1 39.7 39.5 25.6 73.8 80 44.1 20.2 41.6
1963 28.2 47.9 59.6 32.1 31 17.3 12.5 14.1 27.9 118 128 48.4 47.1
1964 19.7 30.8 25.8 41.3 65 25.6 36.7 65.7 49.3 30.3 24.9 17.5 36.1
1965 14.6 17.2 10.7 15.1 63.4 43.4 102 85.5 108 173 84.5 124 70.1
1966 66.0 175.0 83.2 33.6 18.1 50.8 58.1 53.0 96.2 135.0 57.9 73.2 75.0
1967 36.8 51.9 75.4 20.6 18.0 23.5 29.4 71.4 76.4 46.1 52.7 48.7 45.9
1968 18.1 10.1 9.6 17.2 19.3 18.9 29.7 16 16.8 29.8 48 35.5 22.4
1969 81.6 49.2 42.2 72.8 68.1 122 68.8 41.2 60.1 73.3 72.5 28.8 65.1
1970 37.8 32.3 30.6 23.1 42.1 87.6 102 40.1 50.7 72 26.7 140 57.1
1971 130 58.3 56.5 108 102 147 118 54.1 40.3 54.2 17 15.7 75.1
1972 32.1 46.4 48 46.9 20.9 93.3 46.4 181 179 85.3 39.3 42.2 71.7
1973 65.5 108 69.2 32.5 101 114 83.5 144 135 96.1 70.2 33.1 87.7
1974 50.5 51.2 43.2 37 43.5 73.5 41.4 29 66.2 29.1 52.1 34.5 45.9
1975 59 58 31.7 19.9 16.9 37.6 40 57 107 137 71.2 102 61.4
1976 70.2 39 26.9 26.3 53.2 79 44.8 66.2 51.9 54.5 75.9 27.6 51.3
1977 23.8 27 60.6 33 14.5 39.5 34.4 67.3 47.1 72.1 72.1 30.8 43.5
1978 14.4 9.1 10.9 4.7 4.7 8.6 61.3 28.3 45.2 23.4 55 36.3 25.2
1979 16.9 13.2 15 42.7 179 52.6 55.2 61.2 49.8 180 104 65.4 69.6
1980 41 28.5 60.4 25.9 41.1 23.8 64.9 84.5 78.9 42.9 54.8 72.8 51.6
1981 50.3 53.3 34.7 28.5 26.6 38.7 20.5 18.3 23.1 41.6 72.2 102 42.5
1982 30.5 38.6 26.8 12.7 16.7 93.5 173 65.1 40.9 131 282 78 82.4
1983 70.7 77.7 165 100 263 148 448 105 89.1 78.3 75.8 29.9 137.5
1984 31 38.2 27.3 38.4 46.3 107 40.3 133 75.8 52 55 26.5 55.9
1985 18.1 51.6 25.1 40.9 33 20.3 31.1 21.1 45.2 34.1 46.4 17.9 32.1
1986 21.6 42 26.8 57 61.7 58.2 23.8 31.1 53.7 63.4 35.2 25.9 41.7
1987 38.9 46.7 17.3 28.1 223 87.4 51.1 51.4 36 80 39 20.1 59.9
1988 16.9 17 11.3 28.5 188 106 42.1 19.4 17.4 51 30.8 26.8 46.3
1989 59 100 58.3 51.1 71.9 37.8 66.7 66.6 205 98.6 52.6 32.5 75.0
1990 119 58.2 44.5 117 105 282 94.3 113 126 114 88.3 91.1 112.7
1991 50.9 50.1 35.3 39.3 36.3 120 75 86.7 48.6 98.7 69 62.2 64.3
1992 61.3 71.4 81.9 73.2 221 153 185 130 107 93.3 88.9 55.2 110.1
1993 66.2 53.5 43.7 36.7 103 90.9 68.4 48 73.2 141 44.6 46.7 68.0
1994 21.8 62.5 36.3 38.1 82.2 113 130 50.4 50.3 77.9 135 91 74.0
1995 145 56 44.7 55.1 35.1 53.3 62.1 31.8 58.7 88.3 31.3 20.7 56.8

72
Terra - Consultoria em Engenharia e Meio Ambiente Ltda.
1996 35.9 81.2 78.3 56.4 20.5 69 110 74.5 116 191 68.1 70.9 81.0
1997 45.4 161 69.4 30.5 42.9 117 111 136 59.5 252 243 57.8 110.5
1998 97.9 151 111 257 121 46.8 90.4 213 155 130 43.5 35.1 121.0
1999 39.3 46.3 24.9 52.8 22.8 64.6 97.9 21.9 28.6 143 31.7 21.2 49.6
Média 44.5 51.2 45.1 45.3 65.6 73.6 75.3 68.7 78.9 90.2 65.6 46.7 62.6
Máxima 145 175 165 257 263 282 448 263 205 252 282 140 137.5
Mínima 10.8 9.1 9 4.7 4.7 8.6 12.5 12.1 16.8 22.6 9.8 11.4 22.4
Station: Abelardo Luz - AD = 1.850 Km
Table 12 – Series of average monthly flow (m3/s).
Ano Jan Fev Mar Abr Mai Jun Jul Ago Set Out Nov Dez Média
1931 49.2 28.3 26.3 23.5 172.9 120.1 135.9 104.3 152.4 65.2 53.0 68.9 83.3
1932 49.0 66.2 61.8 149.0 140.0 101.7 80.9 80.6 138.0 102.3 62.3 67.4 91.6
1933 28.1 33.9 24.8 20.0 29.9 29.3 44.4 61.8 82.7 140.2 55.1 25.8 48.0
1934 38.4 103.3 66.9 91.1 68.4 67.6 70.4 70.9 75.3 84.1 47.5 40.3 68.7
1935 29.1 25.0 21.1 18.7 12.1 25.4 78.4 109.4 146.2 194.0 82.0 114.7 71.3
1936 77.0 41.2 28.6 20.4 27.6 192.3 123.3 164.7 131.0 122.2 73.2 48.4 87.5
1937 36.6 40.3 57.5 53.2 20.4 13.6 28.4 69.3 64.2 77.8 70.9 43.1 47.9
1938 75.4 69.0 62.1 79.6 95.6 118.7 94.1 46.8 26.4 23.7 35.6 19.5 62.2
1939 28.3 46.5 64.3 51.4 81.0 79.3 33.7 50.2 63.6 54.1 111.0 152.8 68.0
1940 73.1 53.9 27.1 136.3 95.6 41.0 47.1 75.0 40.0 58.6 34.7 45.8 60.7
1941 36.4 64.2 54.7 72.4 117.1 120.0 192.9 155.1 160.3 76.3 101.2 206.4 113.1
1942 30.3 83.1 38.3 97.2 97.4 37.3 72.9 118.7 88.1 173.3 24.0 16.1 73.0
1943 10.0 8.3 13.0 10.4 82.0 290.2 103.3 194.3 161.5 70.3 28.8 17.2 82.4
1944 46.6 17.2 16.2 16.1 9.5 21.4 20.2 8.0 11.1 15.1 15.3 6.9 17.0
1945 4.5 18.5 9.2 5.1 7.3 9.2 11.6 15.5 23.3 20.2 16.9 19.9 13.4
1946 99.7 257.7 49.0 33.8 82.9 108.4 128.8 37.0 26.5 96.7 30.1 33.3 82.0
1947 30.5 45.0 19.3 10.2 37.3 129.7 33.6 66.1 140.8 47.8 25.8 35.6 51.8
1948 10.6 51.4 48.6 31.6 51.6 48.8 32.2 64.3 35.9 57.5 82.0 18.5 44.4
1949 10.6 8.5 25.1 28.4 49.2 80.7 46.9 44.8 61.2 63.0 19.9 13.2 37.6
1950 20.2 16.2 37.6 23.5 43.8 25.1 43.7 35.6 46.6 205.4 96.5 39.7 52.8
1951 51.4 68.1 110.7 22.7 13.2 13.4 22.3 7.9 11.6 88.1 132.0 46.6 49.0
1952 15.8 22.6 10.4 9.5 6.2 70.3 117.1 31.6 64.7 221.2 93.9 24.6 57.3
1953 20.3 64.4 9.7 36.8 31.6 42.7 46.4 44.8 123.6 152.4 104.8 61.0 61.6
1954 63.1 45.7 71.8 61.0 114.0 240.4 192.2 65.0 238.9 276.0 50.8 46.4 122.1
1955 22.2 24.5 19.1 93.4 132.1 195.0 174.4 85.7 51.4 31.1 17.5 15.6 71.9
1956 40.9 34.1 14.0 78.4 92.4 46.9 60.8 49.7 160.6 49.8 13.4 17.3 54.9
1957 17.5 50.2 33.4 19.2 19.7 60.1 177.1 361.2 219.7 52.0 29.9 26.4 88.8
1958 18.1 13.1 63.9 28.7 12.2 35.9 27.0 75.5 156.5 96.3 97.5 125.1 62.4
1959 68.1 45.5 24.8 39.8 50.9 46.8 33.4 54.5 65.2 42.6 30.4 22.1 43.7
1960 14.9 19.5 12.3 13.8 20.3 44.0 21.7 110.6 94.7 137.2 100.5 33.3 51.9
1961 27.2 33.4 204.6 66.0 80.1 48.3 22.0 16.6 181.2 193.7 106.3 47.1 85.5
1962 30.9 71.8 38.7 22.1 78.4 54.5 54.2 35.2 101.4 109.8 60.6 27.7 57.1

73
Terra - Consultoria em Engenharia e Meio Ambiente Ltda.
1963 38.7 65.8 81.9 44.0 42.6 23.7 17.2 19.4 38.3 162.1 175.8 66.4 64.7
1964 27.1 42.3 35.4 56.7 89.3 35.2 50.4 90.2 67.7 41.6 34.2 24.1 49.5
1965 20.1 23.6 14.6 20.7 87.1 59.6 140.1 117.4 148.3 237.6 116.0 170.3 96.3
1966 90.6 240.4 114.2 46.1 24.8 69.8 79.8 72.8 132.1 185.3 79.5 100.5 103.0
1967 50.6 71.3 103.5 28.3 24.7 32.3 40.4 98.1 104.9 63.3 72.3 66.9 63.0
1968 24.8 13.9 13.2 23.6 26.5 26.0 40.8 22.0 23.1 40.9 65.9 48.7 30.8
1969 112.0 67.6 57.9 99.9 93.5 167.5 94.5 56.6 82.5 100.6 99.6 39.6 89.3
1970 51.9 44.4 42.0 31.7 57.8 120.2 140.1 55.0 69.7 98.8 36.7 192.2 78.4
1971 178.5 80.1 77.5 148.3 140.1 201.9 162.1 74.3 55.3 74.4 23.3 21.5 103.2
1972 44.0 63.7 65.9 64.4 28.7 128.1 63.7 248.6 245.8 117.1 54.0 57.9 98.5
1973 90.0 148.3 95.1 44.6 138.7 156.5 114.7 197.8 185.3 132.0 96.4 45.5 120.3
1974 69.3 70.3 59.3 50.8 59.8 100.9 56.9 39.8 91.0 39.9 71.5 47.4 63.1
1975 81.0 79.6 43.5 27.3 23.2 51.6 54.9 78.3 147.0 188.1 97.7 140.1 84.4
1976 96.4 53.6 36.9 36.2 73.1 108.5 61.6 91.0 71.3 74.9 104.3 37.9 70.4
1977 32.7 37.0 83.2 45.4 20.0 54.2 47.3 92.4 64.7 99.1 99.1 42.3 59.8
1978 19.7 12.5 15.0 6.4 6.4 11.8 84.2 38.8 62.1 32.2 75.5 49.8 34.5
1979 23.2 18.1 20.6 58.7 245.8 72.2 75.8 84.1 68.4 247.1 142.9 89.8 95.5
1980 56.3 39.2 83.0 35.6 56.5 32.7 89.1 116.0 108.4 58.9 75.2 99.9 70.9
1981 69.1 73.2 47.7 39.2 36.5 53.1 28.2 25.2 31.7 57.1 99.2 140.1 58.3
1982 41.9 53.0 36.8 17.4 23.0 128.4 237.6 89.4 56.1 179.9 387.2 107.1 113.1
1983 97.1 106.7 226.6 137.3 361.2 203.2 615.2 144.2 122.3 107.5 104.0 41.0 188.9
1984 42.6 52.5 37.5 52.7 63.6 147.0 55.3 182.7 104.0 71.4 75.5 36.4 76.8
1985 24.8 70.9 34.5 56.1 45.4 27.8 42.7 29.0 62.1 46.8 63.7 24.6 44.0
1986 29.6 57.7 36.8 78.3 84.7 80.0 32.7 42.7 73.8 87.1 48.4 35.6 57.2
1987 53.5 64.1 23.7 38.6 306.3 120.0 70.2 70.5 49.5 109.8 53.6 27.6 82.3
1988 23.2 23.3 15.5 39.2 258.1 145.5 57.8 26.6 23.8 70.0 42.3 36.8 63.6
1989 81.0 137.3 80.1 70.2 98.7 51.9 91.6 91.5 281.5 135.4 72.2 44.6 103.0
1990 163.4 80.0 61.1 160.6 144.2 387.2 129.4 155.2 173.0 156.5 121.2 125.1 154.7
1991 69.9 68.8 48.5 54.0 49.8 164.8 103.0 119.0 66.8 135.5 94.7 85.4 88.4
1992 84.2 98.1 112.5 100.5 303.5 210.1 254.0 178.5 147.0 128.1 122.1 75.8 151.2
1993 91.0 73.4 60.0 50.4 141.4 124.8 93.9 65.9 100.5 193.7 61.2 64.1 93.4
1994 29.9 85.9 49.8 52.4 112.9 155.2 178.5 69.2 69.1 106.9 185.3 125.0 101.7
1995 199.1 76.9 61.3 75.6 48.3 73.2 85.3 43.7 80.6 121.2 42.9 28.4 78.1
1996 49.2 111.5 107.5 77.4 28.2 94.7 151.1 102.3 159.3 262.3 93.5 97.4 111.3
1997 62.3 221.1 95.3 41.9 58.9 160.6 152.4 186.8 81.7 346.1 333.6 79.4 151.6
1998 134.4 207.3 152.4 352.9 166.2 64.2 124.1 292.5 212.9 178.5 59.8 48.3 166.2
1999 54.0 63.6 34.2 72.5 31.3 88.7 134.4 30.1 39.3 196.3 43.5 29.1 68.1
Média 53.4 64.8 54.0 56.6 80.7 94.1 93.1 87.6 99.2 114.2 80.1 59.7 78.1
Máxima 199.1 257.7 226.6 352.9 361.2 387.2 615.2 361.2 281.5 346.1 387.2 206.4 188.9
Mínima 4.5 8.3 9.2 5.1 6.2 9.2 11.6 7.9 11.1 15.1 13.4 6.9 13.4
Santa Luzia Alto AD = 2,540km

74
Terra - Consultoria em Engenharia e Meio Ambiente Ltda.
Based on the series of outputs of the location defined the permanence curve, aspresented in Chart 01.
Chart 01 – Average monthly flow permanence curve.
Flood Outputs a)
Wet Period
For evaluation of flood outputs at the plant at the Santa Luzia Alto SHS, the followingposts' data wasused:
Table 13 – Posts analyzed for flood outputs.
Código ANEEL PostoÁrea de Drenagem
(km2)Cheia Média
(m3/s)
73 600 000 Abelardo Luz 1850 590
73 730 000 Porto Elvino 5239 1564
73 750 000 Porto Fae 5528 1526
73 850 000Passo Nova
Erechim7535 2144
Notes: The Porto Elvino post was decomissioned in Dec/78.The Porto Fae post was decomissioned in Jan/78.The Passo Nova Erechim post was decomissioned in Sep/90.The period from Jan/87 to Sep/90 of the Passo Nova Erechim post was not subject toconsistency analysis by ANEEL.
Based on the average flood levels and drainage area at each station, we were ableto define a regional equation to obtain the average overflow at any point of theChapecó river. The function is:
0.911
Qaverage = 0.6216 x AD3
For the Santa Luzia Alto SHS plant: Qaverage = 786 m /s
The ratio between the average flood levels at Santa Luzia Alto SHS plant andAbelardo Luz station was 1.332, which allowed us to define the ratio for themaximum flood level transfer, given by:
Qmax.S.L. = 1 ,332 x Qmax.A. L..

75
Terra - Consultoria em Engenharia e Meio Ambiente Ltda.
The following step was to submit a series of annual maximum flows from AbelardoLuz station to a flood frequency analysis, considering the following probabilitydistribution: Normal, Log-Normal, Gumbel, Gumbel Chow, Exponential, Pearsonand Log-Pearson. From the distribution adjustment, it was observed from the plot-position and assimetry coefficient (1.012) that the distribution of best adjustment isGumbel-Chow, as announced by Eletrobrás in its “Guide for overflow calculationof Spillways Project”, March/87. Applying the 1.332 coefficient defined above, tothe series of Abelardo Luz station, adjusted by Gumbel-Chow distribution, thevalues of overflow for different periods of return to Santa Luzia Alto SHS aredefined.
For the instant peak calculation, the Füller coefficient given by the following ratio wasapplied to the values that we obtained.
–0,3
Qpico = 1 +2.66 AD which results in Qpico = 1.253
The final flood level values at the Santa Luzia Alto SHS plant are presented in the Table14, as follows:
Table 14 – Flood Flood flows for Different Periods of Return on InvestmentTr
(anos)
Vazão de Cheia
(m3/s)
5 1.419
10 1.761
25 2.191
50 2.510
100 2.829
500 3.562
1.000 3.877
10.000 4.924
b) Dry Weather Period
For the estimate 10 and 25 years of return period flood levels in dry months, newstatistical inferences were performed with data from Abelardo Luz fluviometric station,using the series of maximum flows in January, February, March, and April of each year.The probabilistic distribution employed was, once again, the Gumbel-Chow distribution.
Table 15 - Flood flows for January to April.
Sanitary Output
For the minimum flow assessment for 7 successive days associated with 10 year returnperiod, in the Chapecó river basin next to Abelardo Luz station (code ANA 73600000),we used a series of daily average flows for the station covering the period fromApril/1953 to January/2006, with a few gaps in certain years: 1953 and 1956,inconsistent values for 1990 and 1991, and more extensive periods with the absence ofyears 1996 and 1997.

76
Terra - Consultoria em Engenharia e Meio Ambiente Ltda.
Based on the series of daily average flows, the moving averages of 7 successivedays were calculated, which allowed us to define a minimum 7 day flow for eachyear, creating a 47-value series, as presented in Table 16.
Table 16 – Minimum weekly output.
Ano Vazão Mínima de 7 dias (m3/s)
1953 ----1954 9.81955 4.91956 4.21957 4.61958 3.91959 9.81960 4.91961 7.31962 7.31963 8.01964 9.81965 7.31966 ----1967 ----1968 6.11969 16.81970 11.01971 10.41972 11.01973 16.81974 11.01975 11.01976 12.01977 6.71978 2.91979 4.61980 12.01981 9.81982 8.01983 17.81984 11.01985 10.81986 8.11987 9.41988 6.81989 22.61990 32.01991 23.81992 22.61993 18.01994 18.01995 10.11996 13.81997 13.8
Comment [NP1]: here

77
Terra - Consultoria em Engenharia e Meio Ambiente Ltda.
1998 18.01999 13.12000 13.12001 18.02002 7.82003 9.42004 10.52005 11.6
Média (m3/s) 11.44D. Padrão (m3/s) 5.84
First we defined a reduced variant given by the expression (Gumbel line): y = a *
(x - 3 ) , being a and 3 the parameters:
a = - ry / rx e 3 = µx – (µy / a)
Based on the sample size (50 values), we obtained the following table
values: ry = 1.1607 (function of sample size); and
rx = 5,84 (standard sample diversion) which provides = 0.1988
µx = 1 1 ,44 (sample average); and
µy = 0,5485 (function of sample size) which provides 3= 8.68 Finally,
utilizing the Gumbel distribution expression: -0,1988 * (Q7,T – 8,68 ) = -
ln * ( -ln (1 – 1/T) , for T = 10 years with:
Q 7,10 = 5,03 * ln ( - ln (1 – 1/10) + 8,68 , we obtained:Q 7,10 = 2,624 m3/s which corresponds to a week’s output and 10 year return period.
Based on the equations defined by Tucci (1991) for the 18 homogenous regions ofRio Grande do Sul, an assessment based on Abelardo Luz station data wasperformed.
In the regions defined by Tucci, the course of the Chapecó river corresponds toregion 5 supplying for TR= 1 0 years, a minimum adimensional flow of 0.50.Using the proposed methodology, a minimum flow Q 7,10 = 2.68 m3/s was obtained, avalue that is consistent with the one defined by the Gumbel equation (2.624 m3/s) asthis as the latest presumed value.
For the definition of a 7-day flow and 10 year return period at Santa Luzia Alto, atransfer of the flow obtained at Abelardo Luz was performed by applying the factordefined by the relatiration between the drainage areas in both places, reaching:
AD Sta Luzia / AD A Luz = 2.540/1 850 = 1 ,3730
Applying this factor to the Abelardo Luz minimum flow, the following flow for the SHSaxis was reached:
Q 7.10 = 1.3730 * 2.624 = 3.60 m3/s

78
Terra - Consultoria em Engenharia e Meio Ambiente
Ltda.
8.1 .4. Water Quality
It can be even said that Santa Catarina water pollution is completely the result oflocal activity, since its hydrographic basins are only under the influence of otherstates or countries’ activities in border regions.
The land pollution problems will end up almost entirely in bodies of water located inSanta Catarina. The water pollution in the state is caused by: deforestation,aggressive agricultural practices, discharge of liquid effluents from homes orindustry.
The sanitary sewage, for example, reveals that only 6.85% of the urban populationhave access to sewage systems. Only part of the sewage is gathered for treatment.The investment in sewage should be 0.37 of Santa Catarina GDP to provide thisservice to 41% of the urban population within 10 years.
The most serious problem is related to water contamination from hog excrement.According to surveys by Epagri, 84% of sources and small springs in the areastudied are contaminated by fecal coliforms.
The opening of channels and the dam construction are intended to change the riverflow regime, both downstream and upstream. During the filling of the reservoir, thewater course will have its flow reduced downstream, until the total formation of thereservoir, when the normal fow will be re-established, except in the area betweenthe dam and the water channel outelt.
On the other hand, the dam changes the ecosystem characteristics from lotic tolentic. In this situation, the water quality may change by nutrient retention, from thevegetation decomposing in the flooded area or by the release of waste waters,fertilizers, and animal excrement into the reservoir downstream.
Especially in hot weather, which encourages faster growth of algae and taller waterplants that consume the oxygen dissolved in water, there may be great biochemicaloxygen demand, generating undesirable impacts. The nutrient retention deprivesdownstream water of the required qualities for irrigation.
The impacts on the aquatic fauna may be casued by the flow reduction downstream,specifically between the dam and the power station, and by the loss of water quality,as nutrient levels increase during SHS operation, as well as the rising turbidityduring construction.
To perform the water quality analysis in the water complex of the project’s directinfluence area, we conducted sampling and analysis campaigns to check the qualityof the water from this area. The main goal of that campaign is to assess the waterquality in the project area.
The monitoring of physico-chemical parameters on the Chapecó river considers themain impact on the water quality caused by SHS construction and operation asmentioned above.

79
Terra - Consultoria em Engenharia e Meio Ambiente
Ltda.
Chapecó river water monitoring points were selected for comparison after projectconstruction. Samples from three points on the Chapecó river were collected andanalysed, points 01, 02, and 03. Point 01 is located upstream of the intendedreservoir or flooding area, and this point is considered to be a control point, since isquality will not change after SHS construction. Point 02 is located in the damupstream area, specifically between the dam and the power station, where the riverflow will be decreased. The last point, point 03, is located between the previous twopoints, where the flooding reservoir will be formed, Appendix 12.
To perform the surface water quality analysis in the area directly affected by theproject, sampling campaigns and analyses were performed by the Beckhauser &Barros lab in July, 2006 and July 2007, as show in appendix 13. The methods thatwere used were Standard Methods for the Examination of Water and Wastewater -20th edition.
The results can be viewed in Tables 17 and 18, for sampling performed on07/08/2006 and in 07/25/2007 respectively, and can be compared to 2005 CONAMAResolution 357 that governs ranking and environmental guidelines for classifyingboieds of water and establishes the conditions and patterns of effluent release, andother measures.
The criteria used for the comparison with CONAMA Resolution 357/05 was freshwater class 2 for the surface water that is used for: supply for human consumptionafter conventional treatment; protection of aquatic communities; primary contactrecreation, including swimming, water skiing, and diving, pursuant to CONAMAResolution 274 of 2000; irrigation of vegetation, fruit, plants and parks, gardens,sports and amusement fields, with which individuals may have direct contact; andacquiculture and fishing.
Table 17 – Results of surface water sample analysis for 08/07/2006.
ParâmetrosAnalisados
Unidade 01 02 03 Legislação
Amônia (NH3 ) mg/L <0.01 <0.01 <0.01 < 3.7
Cor mg/L Pt-Co 36.7 26.4 31.9 < 75
DBO mg/L O2 7.0 5.0 3.6 < 5
DQO mg/L O2 30 28 22 -
Fósforo Total mg/L P < 0.1 < 0.1 0.1 < 0.1
Nitrato mg/L N 0.06 0.04 0.02 < 10.0
Nitrito mg/L N 0.004 0.003 0.001 < 1.0
Nitrogênio Total mg/L N 0.068 0.043 0.029 > 3.7NitrogênioOrgânico
mg/L N < 0.01 <0.01 <0.01 -
OxigênioD issolvido
mg/L O2 7.69 7.84 7.92 > 6
Óleos e graxas mg/L < 0.20 <0.20 <0.20Virtualmente
Ausentes
SólidosSuspensos
mg/L 10 7 6 -
SólidosSedimentáveis
mg/L <0.10 <0.10 <0.10 < 1.0

80
Terra - Consultoria em Engenharia e Meio Ambiente
Ltda.
Sólidos TotaisDissolvidos
mg/L 26.5 23.3 20.07 500
Turbidez UNT 5.75 4.17 3.62 100
Temperatura °C 22.2 22.1 22.3 -
pH ---- 6.20 5.92 6.14 6 a 9
Coliforme totais NMP/100 mL 170000 110000 140000 5.000Col iformes
termotolerantesNMP/100 mL 27000 16000 13000 1.000
* Values in red are outside of the CONAMA Resolution standards 357/05.
Table 18 – Results of surface water sample analysis for 25/07/2007.ParâmetrosAnalisados
Unidade P1 P2 P3 Legislação
Amônia (NH3 ) mg/L 0.19 0.11 0.10 < 3.7
Cor mg/L Pt-Co 30.3 23.2 17.6 < 75
DBO mg/L O2 27.0 4.0 3.0 < 5
DQO mg/L O2 97 13 10 -
Fósforo Total mg/L P 0.04 0.02 0.04 < 0.1
Nitrato mg/L N 0.8 0.7 0.7 < 10.0
Nitrito mg/L N 0.005 0.005 0.006 < 1.0Oxigênio
D issolvidomg/L O2 9.70 9.74 9.57 > 5
Óleos e graxas mg/L 7.3 2.1 1.7Virtualmente
Ausentes
SólidosSuspensos
mg/L 12.40 12.00 9.00 -
SólidosSedimentáveis
mg/L < 0.10 0.1 < 0.10 < 1.0
Sólidos TotaisDissolvidos
mg/L 14.00 17.00 13.20 500
Turbidez UNT 21.5 16.4 13.3 100
pH ---- 6.73 6.96 6.90 6 a 9
Coliforme totais NMP/100 mL 210 330 220 5000Col iformes
termotolerantesNMP/100 mL 80 140 70 1000
* Values in red are outside of the CONAMA Resolution standar ds 357/05.
The analysis of the samples shows good quality in relation to the parameters analyzed,especially nitrogen, phosphorus, dissolved oxygen, solids and pH, however, it in the firstsample we found a large quantity of contamination by coliforms at the three points ofanalysis, which was not observed in the second sample, which shows a lowconcentration of coliforms, within the range permitted by law. During both sampleperiods, Point 01 presented values out of the permitted range in Biological OxygenDemand (BOD), specially in the second sampling period.
According to CONAMA Resolution 274 of 2000, which proposes the assessment offresh, brine and salt water for bathing purposes, classifying its condition as suitable andunsuitable, the Chapecó river section that was analyzed has water unsuitable for bathingin the first sample and suitable for bathing in the second sample.

81
Terra - Consultoria em Engenharia e Meio Ambiente
Ltda.
8.2. Biotic Environment
The objective of the diagnosis is to describe the ecosystems in the areas covered bythe development. Also, vegetation cover mapping and description, state of upkeep,and description of associated fauna. Special attention was given to the aquatic bioticin the River Chapecó hydrographic basin. Additionally, possible conservation units inthe area covered by the project were surveyed.
The data herein regarding the indirect area of influence was based on the secondarysurvey data and observations in the municipal regions São Domingos and Ipuaçu.The diagnostic methodology in the area of direct influence was based on satelliteimagery of the river Chapecó stretch, which covers the entire area previouslydefined as the project’s area of direct influence.
In this image, verification points were selected on site, especially considering thedensity of vegetation. During the on site verification, the vegetation was described interms of the size and state of regeneration according to CONAMA Resolution No.04/1994 (Brasil, 1994). The identification of some tree specimens involved on siteobservation and research in the work of Lorenzi (2002).
For the description of fauna, secondary data was collected and on site we observedmastofauna, avifauna and herpofaun. In view of the difficulty obtaining visualmaterial, especially of mastofauna animals, we looked for tracks, feces and denswhich revealed the presence of certain species.
The river Chapecó’s aquatic biotic was characterized based on secondary data andon interviews with residents along the river bank.
8.2.1. Terrestrial Biota
8.2.1.1. Flora
Indirect Influence Area
Originally, Chapecó River basin had a diverse phytogeography, with the followingvegetation formations:
Mixed Ombrophile (Brasil, 1973), also called Araucaria Forest (Klein, 1 978;SUDESUL, 1978) or Mata de Pinhais (Lorenzi, 2002);
Seasonal Deciduous Forest (Brasil, 1 973), also called Subtropical forest (Klein,1978), Uruguay Basin Forest (SUDESUL,1978) or Broadleaf Forest of Uruguay andParaná river basins (Lorenzi, 2002), and;
Savannah, called fields (Klein, 1978; Lorenzi, 2002) or natural fields (SUDESUL,1978).
The Mixed Rain Forest is located in the plateau that extends from Rio Grande do Sulto Paraná and in regions over 1,400 m in the other states (Lorenzi, 2002). It islimited to altitudes above 400 m (SUDESUL, 1978). It is located in places that arealways wet, with 4 to 6 cold months and up to 6 hot months, whose annual averagetemperature reaches 20ºC.

82
Terra - Consultoria em Engenharia e Meio Ambiente
Ltda.
Originally, a large part of the Santa Catarina plateau was covered by this vegetationformation. On the Chapecó river basin, it occupied mainly the North portion (Klein,1978, SUDESUL, 1978).
In the Mixed Rain Forest, the superior stratus is dominated by Araucaria (Araucariaangustifolia), and in the sub-forest we can find the cinnamons (Cryptocaryaaschersoniana, Nectandra sp., Ocotea sp.), pau-andrade (Persea major), cherry(Eugenia involucrata), araçazeiro (Myrcianthes gigantea), myrtle (Blepharocalyxlongipes), camboatá-branco (Piptocarpha augustifolia), bracatinga (Mimosascabrella), angico vermelho (Parapiptadenia rigida), cedar (Cedrela fissilis), tarumã(Vitez megapotamica), pessegueiro-brabo (Prunus sellowi), mate (Ilexparaguariensis), açoita-cavalo (Luehea divaricata), among others (Klein, 1 978).
The Seasonal Deciduous Forest follows the Uruguay river and its multiple tributaries,up to an altitude of 600 to 800 m (Klein, 1978). Xanxerê Indigenous Reserve holdsthe greatest remaining portion of the forest.
This vegetation formation presents three strata:
Superior stratum, where the crowns of high trees are predominant (biggerthan 25 m), emergent and discontinuous, and do not have winter leaves.They are grápia (Apuleia leiocarpa), laurel (cordia trichotoma), canafístula(Cássia multijuga), angico vermelho (Parapiptadenia rígida), cedar (Cedrelafissilis), among others;
Second stratum: it is the densest part of the woods, with trees 20 to 25m, withperennial leaves. Cinammons basically forms this stratum;
Small tree stratum, where trees between 6 and 15 m are predominant, suchas laranjeirado-mato (Actinostemon concolor) and falsa-espinheira-santa(Sorocea bonplandii).
Savannah vegetation, locally called fields, grows at the border region between SantaCatarina and Paraná and at the springs of Chapecó and Chapecozinho rivers, in theshape of discontinued spots that spread into the Mixed Rain Forest formations. Thisvegetation is associated with the presence of flatlands (Cambisoils), generally ataltitudes over 800m. According to Klein (1978), herbaceous groups formed byGrass, Cyperaceae, Composed, Leguminous, and Verbenaceae in “clean” fields arepredominant. The presence of carqueja-do-campo and samambaias-das-taperasmay also exist, which, among other species, will look like “dirty” fields.
In areas where the vegetation occurs, we find copses and riparian forests, which arerespectively develop near the depressions (thalwegs) and on the river banks,resulting from more favorable water and pedologic conditions.
Currently, this original finding has been greatly modified. According to Klein (1978),the intense farming and stockbreeding in Santa Catarina, specially in the 60s hasmodified the State’s primary vegetation substantially. According to the same author,the Seasonal Deciduous Forest occupies lands resulting from the degradation anddecomposition of basalt and melaphyre, which are well suited for agriculture.Because of this, since the beginning of the 20 th Century, this woodland is being cutdown in the rush to exploit the wood, especially to

83
Terra - Consultoria em Engenharia e Meio Ambiente
Ltda.
to open up new lands for agriculture. The fields were changed because of ruralactivities and periodical fires.In São Domingos there are vegetation area, isolated among farming areas wheresoy, beans and corn crops are predominant. The remaining areas are mostly inthalwegs or in other areas where the agricultural is not possible. This typicallandscape can be observed in Figures 09 and 10.
Figure 09 – Typical landscape of forest remnants in the municipal region of São Domingos.
Figure 10 – Typical landscape of forest remnants in the municipal region of São Domingos.

84
Terra - Consultoria em Engenharia e Meio Ambiente
Ltda.
Area of Direct Influence
Throughout the direct influence area, the soil is predominantly used for agricultureand reforestation. The most common crops are soybeans (Glycine max), corn (Zeamays) and beans (Phaseolus vulgaris). In the monocultures of reforestation, thereare exotic species such as pines (Pinus sp.) and eucalyptus (Eucalyptus sp.),alongside the native araucaria (Araucaria angustifolia).
The original vegetation has changed and the environment is highly anthropized.
We only find remaining fragments of this type of vegetations when farming areas areinterrupted by areas unsuitable for crops, like the sinuous line of a valley. In thissituation, we can find coppices of vegetation isolated by the farmed areas thatsurround them. Another situation where a minimum of native vegetation was sparedis on the banks of the Chapecó river, in the riparian forest. We can see that in thearea of direct influence related to the development, a riparian forest that varies fromtwo to, at most, 5m wide practically all along the river. This narrow riparian forest isat a mostly average stage of regeneration according to Brazil (1994).
Following this diagnosis, we can say that in the direct influence area there are atleast four species which are on the Official List of Endangered Species of BrazilianFlora. They are: the xaxim (Dicsonia sellowiana); the araucaria (Araucariaangustifolia), classified as vulnerable; the cinnamon imbuia (Ocotea porosa), alsoclassified as vulnerable; and the sassafras-cinnamon (Ocotea pretiosa), classified asendangered.
However, it is worth pointing out that in the locations where these species werefound, the formations are secondary. Still, the araucarias are young individuals,presenting reduced DAPs and heights compared with the normal potential of thespecies.
Because of the great environmental diversity found in the direct influence area, wechose to describe each significant stretch separately. They are identified by lettersand can be seen in Exhibit 14.
Stretch A
As we can see in Exhibit 14, Section A is an area widely used for agriculture. Thenative vegetation is the spared but narrow riparian forest and the small fragmentswhere agriculture is not possible. However, in these locations we can still find exoticspecies.
The riparian vegetation in section A is 1m to, at most, 5m in width. It is secondaryvegetation and the maximum height of the trees is of 20m, with eventual outlyingindividuals. The vegetation formation of this section is at a stage of regenerationbetween initial and average (Brazil, 1994). In Figure 11 we can see this structure.

85
Terra - Consultoria em Engenharia e Meio Ambiente
Ltda.
Figure 1 1 – Vegetation structure in section A.
Arboreal examples of two vegetation formations characteristic of the mixed Ombrophilaregion and Decidual Seasonal Forest were found. The most common examples of treesfound in section A are listed in Table 19.
Table 19 – Common vegetation species in section A.Scientific name Nome popular
Luehea divaricata Açoita cavaloParapiptadenia rigida Angico
Schinus sp. AroeiraSebastiana commersoniana Branquil ho
Cupania vernalis Camboatá vermel hoCasearia silvestris Chá de Bugre
Solanum erianthum Fumeiro bravoSyagrus romanzoffiana Gerivá
Trema micratha GrandiuvaFagara sp. Mamica de cadela
Mimosa bimucronata MaricáAllophylus edulis Olho de pomba
Not in the riparian forest, but in the surroundings, there are some araucarias (Araucariaangustifolia) planted in the properties adjacent to the river.
Throughout all the riparian forest there was presence of a bamboo species, popularlyknown as “taquara índia”. It’s a species from the Gramineae Family, with yellowishleaves. The origin of this species is in Asia and in the western region they have beenplanted by farmers in the riparian forests so that their roots would help hold up riverbanks. We also found Swiss Cheese Plant (Monstera deliciosa).

86
Terra - Consultoria em Engenharia e Meio Ambiente
Ltda.
Some eucalyptus (Eucalyptus sp.) are also planted along the banks of the Chapecóriver, as seen in Figure 12.
Figure 12 – Presence of eucalyptus exotic species (Eucalyptus sp.)
The flame vine (Pyrostegia venusta) was frequently found, conspicuous because ofits blossom.
There has been interference in the riparian forest, probably carried out by thefarmers, trying to prevent the forest from widening. In various spots there has treesadjacent to the crops have been pruned.
Section B
In Exhibit 14 you can see that section B is also highly agricultural and that the nativevegetation is present in the remaining riparian forest and in fragments whereagriculture is not possible, especially in thalwegs.
The riparian vegetation in section B is denser than in section A and also wider,varying from 3m to 5m in width, with some parts even wider. It is secondaryvegetation and the maximum height of the trees is 20m, with eventual outlyingindividuals. The vegetation formation in this section presents characteristics ofcoverage regeneration (Brazil, 1994). In Figure 1 3 we can observe this structure.Note the presence of araucarias in this forest.

87
Terra - Consultoria em Engenharia e Meio Ambiente
Ltda.
Figure 13 – Structure of section B. Extensive farming areas and riparian forest on the bankof the Chapecó river. In the background the denser vegetation characterizes section C.
The fragments of vegetation present in section B are dense, but not extensive (Figure14). Some were visited and the arboreal specimens found don’t characterize thevegetation formations in the region, there is a mixture of individuals from the MixedOmbrophila and the Deciduous Seasonal Forest. The regeneration stage could beclassified from initial to medium. The frequent arboreal individuals in the vegetationareas visited are listed on Chart 20.
Table 20 – Vegetation species common in section B, present in different fragments.
Scientific name Nome popular
Luehea divaricata Açoita cavaloParapiptadenia rigida AngicoAraucaria angustifolia AraucáriaSchinus sp. AroeiraCupania vernalis Camboatá vermel hoOcotea sp. CanelaNectandra sp. CanelaSorocea bonplandii CinchoSyagrus romanzoffiana GeriváCampomanesia xanthocarpa GuabirobaActinostemon concolor Laranjeira do matoFagara sp. Mamica de cadelaMimosa bimucronata MaricáAllophylus edulis Olho de pombaPodocarpus lamberti Pinheiro-bravoEugenia uniflora Pitangueira
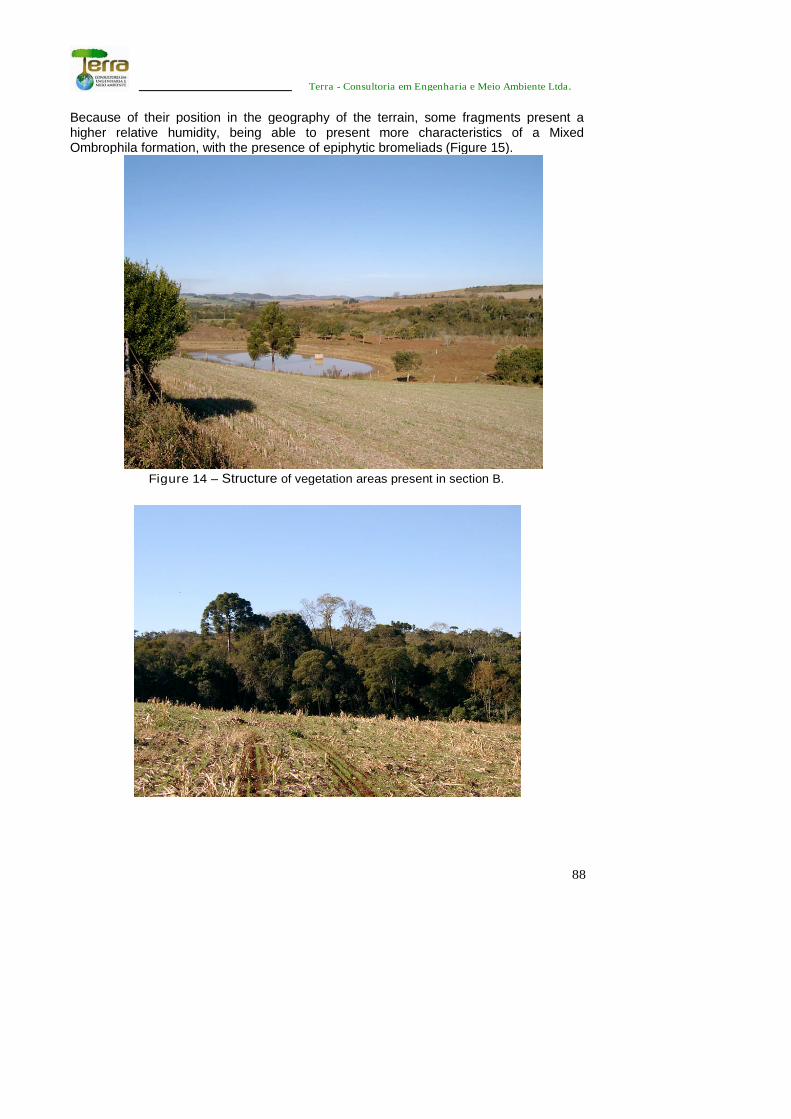
88
Terra - Consultoria em Engenharia e Meio Ambiente Ltda.
Because of their position in the geography of the terrain, some fragments present ahigher relative humidity, being able to present more characteristics of a MixedOmbrophila formation, with the presence of epiphytic bromeliads (Figure 15).
Figure 14 – Structure of vegetation areas present in section B.

89
Terra - Consultoria em Engenharia e Meio Ambiente Ltda.
Figure 15 – Fragment of vegetation in locations where there is greater humidity and vegetationhas typical characteristics of Mixed Ombrophila. In the interior eventual presence of epiphytic
bromeliads.
On the other hand, some fragments are totally decharacterized, presenting exoticspecies like the “taquara índia” (Graminae), as you can see on Figure 16.
Figure 16 – Fragment of vegetation decharacterized because of presence of exotic “taquaraíndia” species.

90
Terra - Consultoria em Engenharia e Meio Ambiente Ltda.
Section C
Based on the information from the satellite picture in Exhibit 14, and through on siteverification, you can see that the left bank of section C maintains the samevegetation pattern as the description of section B: wide areas covered by crops andnative vegetation present only in small fragments and in the riparian forest.
However, on the right bank of the Chapecó river, in section C, we can find an largeremnant of the Mixed Ombrophila. It’s secondary vegetation in an advanced stage ofregeneration (Brazil, 1994), with trees of primary vegetation. The arborealphysiognomy is dominant, forming a closed canopy and relatively uniform in size,with outlying trees. In Figure 17 we get an idea of the size of the area as well as itsphysiognomy, from a picture taken at a distance.
Figure 17 – Physionomy of strecth C on the right bank of the Chapecó river. Presence oflarge remnantsof Mixed Ombrophila.
In this forest we find a great diversity of arboreal species, among them we caninclude those in Table 21.
Table 21 – Arboreal vegetation present in section C.
Scientific name Nome popular
Luehea divaricata Açoita cavaloParapiptadenia rigida AngicoPsidium cattleianum. AraçáAraucaria angustifolia AraucáriaSchinus sp. AroeiraMimosa scabrella Bracatinga
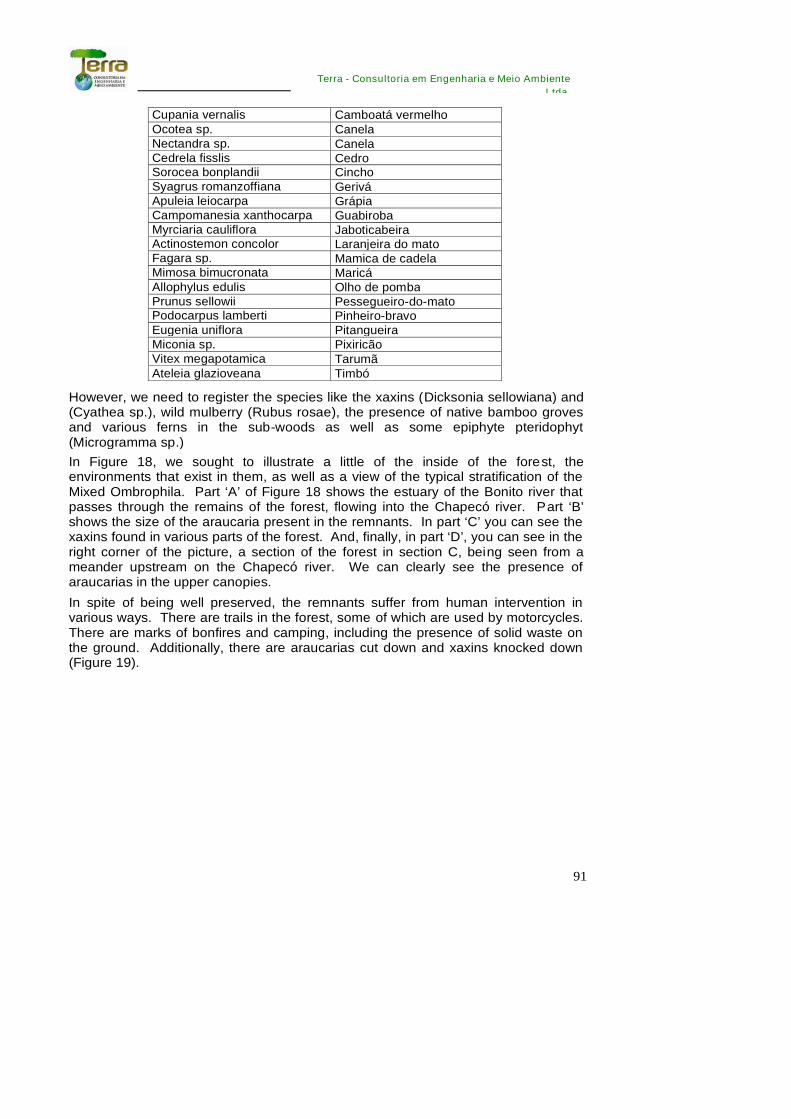
91
Terra - Consultoria em Engenharia e Meio Ambiente
Ltda.
Cupania vernalis Camboatá vermelhoOcotea sp. CanelaNectandra sp. CanelaCedrela fisslis CedroSorocea bonplandii CinchoSyagrus romanzoffiana GeriváApuleia leiocarpa GrápiaCampomanesia xanthocarpa GuabirobaMyrciaria cauliflora JaboticabeiraActinostemon concolor Laranjeira do matoFagara sp. Mamica de cadelaMimosa bimucronata MaricáAllophylus edulis Olho de pombaPrunus sellowii Pessegueiro-do-matoPodocarpus lamberti Pinheiro-bravoEugenia uniflora PitangueiraMiconia sp. PixiricãoVitex megapotamica TarumãAteleia glazioveana Timbó
However, we need to register the species like the xaxins (Dicksonia sellowiana) and(Cyathea sp.), wild mulberry (Rubus rosae), the presence of native bamboo grovesand various ferns in the sub-woods as well as some epiphyte pteridophyt(Microgramma sp.)
In Figure 18, we sought to illustrate a little of the inside of the forest, theenvironments that exist in them, as well as a view of the typical stratification of theMixed Ombrophila. Part ‘A’ of Figure 18 shows the estuary of the Bonito river thatpasses through the remains of the forest, flowing into the Chapecó river. Part ‘B’shows the size of the araucaria present in the remnants. In part ‘C’ you can see thexaxins found in various parts of the forest. And, finally, in part ‘D’, you can see in theright corner of the picture, a section of the forest in section C, being seen from ameander upstream on the Chapecó river. We can clearly see the presence ofaraucarias in the upper canopies.
In spite of being well preserved, the remnants suffer from human intervention invarious ways. There are trails in the forest, some of which are used by motorcycles.There are marks of bonfires and camping, including the presence of solid waste onthe ground. Additionally, there are araucarias cut down and xaxins knocked down(Figure 19).

92
Terra - Consultoria em Engenharia e Meio Ambiente Ltda.
Figure 18 – Large fragment of forest in section C.
B
C
D

93
Terra - Consultoria em Engenharia e Meio Ambiente Ltda.
Figure 19 – Anthropic presence in forest remnants. Felled xaxins and cut araucaria.
Section D
Accompanying Exhibit 14, on the right bank of section D there is a big reforestationarea of pines (Pinus sp.), as you can see in Figure 20. This image was obtainedfrom the left-bank of the Chapecó river.
Figure 20 – Reforestation in Section D.
However, there is a preservation of a native forest along the banks of the Chapecóriver, throughout the reforestation area. This riparian forest is narrow (5m at most)and presents vegetation at a a medium stage of regeneration. There is thepresence of a few eucalyptus among the planted pines. Also, we registered thepresence of native maritime pine (Podocarpus lamberti) growing within thereforested pines (Figure 21).

94
Terra - Consultoria em Engenharia e Meio Ambiente Ltda.
Figura 21 - Pinheiro-bravo (Podocarpus lamberti) no interior do reflorestamento de Pinussp..
This area of reforestation, near the mouth of the Bonito river, is used for get-togethers, using the area for leisure. However, we found no evidence ofenvironmental maintenance by those who uses the area. There is garbage on theground, a barbecue and a cesspit.
On the left bank, there is a riparian forest not well preserved, without sub-woods,especially because there is also intensive use of the area for leisure (fishing andspa). However, you can still find relevant arboreal species. The list of species foundin the left bank of section D is in Table 22.
Table 22 – List of arboreal species found on the left bank of section D.
Scientific name Nome popularLuehea divaricata Açoita cavaloSchinus sp. AroeiraOcotea sp. CanelaNectandra sp. CanelaCedrela fisslis CedroSyagrus romanzoffiana GeriváMimosa bimucronata MaricáPodocarpus lamberti Pinheiro-bravoAteleia glazioveana Timbó

95
Terra - Consultoria em Engenharia e Meio Ambiente
Ltda.
In this area, there are some epiphyte plants like cactus (Ripsalis sp.) and bromelias(Tilandsia sp.). In Figure 22 you can see the structure on site, with the presence ofranches. You can notice the absence of sub-woods and substantial anthropization.
Figure 22 – View of the left bank of the Chapecó river in section D.
Section E
This region in the direct influence area has three important regions of reforestation.The region in Exhibit 14 identified as ‘E.a’ is reforestation of araucaria (AraucariaangustifaliaI), probably with the proper registrations subsequent wood-cutting. Asfor the area identified as ‘E.b’, this is reforestation with pines (Pinus sp.) and, finally,the area identified as ‘E.c’ is reforestation with eucalyptus (Eucalyptus sp.).
The other areas of section E make up a mixed zone, where there are properties,small areas of reforestation, intense presence of exotic trees, which are therebecause of their proximity to the reforestation areas. The existing native vegetationagain is limited to isolated areas and to vegetation from the riparian forest. Thisstructure can be observed in Figure 23, noting that sometimes there is no riparianforest.

96
Terra - Consultoria em Engenharia e Meio Ambiente Ltda.
Figure 23 – Structure of vegetation in mixed zone of section E.
The existing species in the copses can reach a height of up to 20m. However, thereare no sub-woods and the existing species seem to have been spared fromdeforestation. The species that were found in these structures are listed in Table 23.
Table 23 – List of species found in section E, in clumps and riparian forest.
Scientific name Nome popular
Luehea divaricata Açoita cavaloPsidium cattleianum. AraçáAraucaria angustifolia AraucáriaCedrela fisslis CedroCasearia silvestris Chá de bugreSorocea bonplandii CinchoSyagrus romanzoffiana GeriváMyrciaria cauliflora JaboticabeiraActinostemon concolor Laranjeira do matoFagara sp. Mamica de cadelaMimosa bimucronata MaricáEugenia uniflora PitangueiraAteleia glazioveana Timbó
Of all the sections analyzed, this is the one that is most anthropized because of themonocultures for reforestation and the family properties near the river.
Section F
As you can see in Exhibit 14, section ‘F’ presents two important fragments ofvegetation, identified as ‘F.a’ and ‘F.b’. However, these fragments were notdescribed in much detail, despite being in a direct influence area,

97
Terra - Consultoria em Engenharia e Meio Ambiente Ltda.
and will suffer reduced impact for being further upstream from the SHS dam.
The fragment identified as ‘F.a’ is dense, the trees present heights of over 20m. Thearboreal physiognomy is dominant, forming a closed canopy and relatively uniformsize. The structure presents an advanced stage of regeneration (Brazil, 1994), witha physiognomy similar to primary vegetation. The structure described as DeciduousSeasonal Forest, contains grapia (Apuleia leiocarpa), angico vermelho(Parapiptadenia rigida) and cedar (Cedrela fissilis) (Figure 24).
Figure 24 - View of fragment ‘F.a’ in advanced regeneration stage.
The fragment identified as ‘F.b’ is also dense, the trees present heights of about15m and there are some emergent individuals, such as the araucarias (Araucariaangustifolia). The structure presents an advanced stage of regeneration (Brazil,1994), with a physiognomy similar to primary vegetation as the arboreal species aredominant, forming a closed and relatively uniform canopy and size. The structure isdescribed as Mixed Ombrophila (Figure 25) in general terms. However, thisfragment contains an affluent of the Chapecó river. In the valley where it is located,the abiotic conditions are beneficial for a typical formation of riparian forest, with theintense presence of maricas (Mimosa bimucronata).

98
Terra - Consultoria em Engenharia e Meio Ambiente Ltda.
Figure 25 – Aspect of fragment ‘F.b’ at an advanced regeneration stage.
The other zones of section F are family properties, with homes and small farms. Againthere are isolated copses and a narrow riparian forest.
2.1.1.2. Fauna
Area of Indirect Influence
Mastofauna
Regarding the associated fauna, the Mixed Ombrophila formations and the SeasonalDeciduous Forest, Cherem’s (2005) work presents the results of the survey of non-flyingmammals in seven environmental studies carried out in the south of Brazil, two of whichwere in areas whose the original formation is Mixed Ombrophila and other two whoseoriginal formation is Seasonal Deciduous Forest and Mixed Ombrophila. One of theareas in this study is located in the city of Chapecó.
The results revealed the presence of 46 species of non-flying mammals, which arelisted below by family, scientific and popular name.
Table 24 – Mammals species in the area of indirect influence.
Family - Species Popular nameDidelphidaeDidelphis albiventris gambáDidelphis aurita gambáDidelphis sp. gambáMicoureus paraguayanus cuícaMonodelphis sp. cuícaPhilander frenata cu íca-verdadeiraDasypodidae
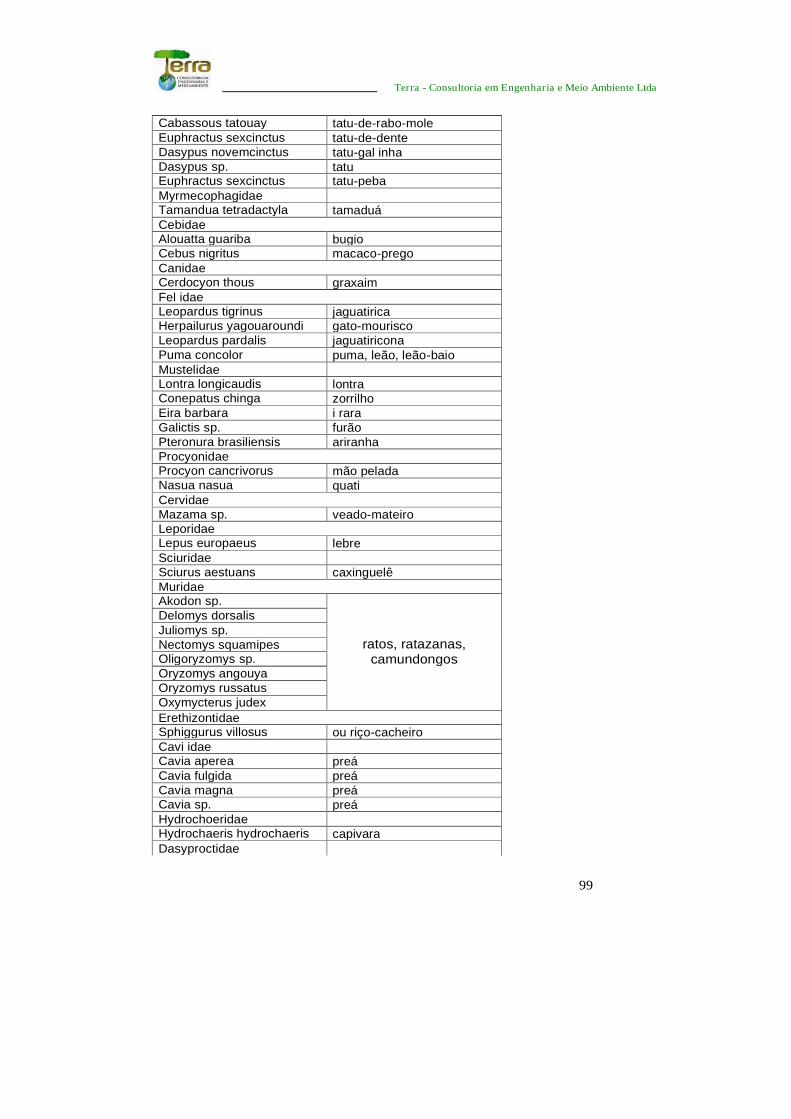
99
Terra - Consultoria em Engenharia e Meio Ambiente Ltda
Cabassous tatouay tatu-de-rabo-moleEuphractus sexcinctus tatu-de-denteDasypus novemcinctus tatu-gal inhaDasypus sp. tatuEuphractus sexcinctus tatu-pebaMyrmecophagidaeTamandua tetradactyla tamaduáCebidaeAlouatta guariba bugioCebus nigritus macaco-pregoCanidaeCerdocyon thous graxaimFel idaeLeopardus tigrinus jaguatiricaHerpailurus yagouaroundi gato-mouriscoLeopardus pardalis jaguatiriconaPuma concolor puma, leão, leão-baioMustelidaeLontra longicaudis lontraConepatus chinga zorrilhoEira barbara i raraGalictis sp. furãoPteronura brasiliensis ariranhaProcyonidaeProcyon cancrivorus mão peladaNasua nasua quatiCervidaeMazama sp. veado-mateiroLeporidaeLepus europaeus lebreSciuridaeSciurus aestuans caxinguelêMuridaeAkodon sp.Delomys dorsalisJuliomys sp.Nectomys squamipesOligoryzomys sp.Oryzomys angouyaOryzomys russatusOxymycterus judex
ratos, ratazanas,camundongos
ErethizontidaeSphiggurus villosus ou riço-cacheiroCavi idaeCavia aperea preáCavia fulgida preáCavia magna preáCavia sp. preáHydrochoeridaeHydrochaeris hydrochaeris capivaraDasyproctidae

1 00
Terra - Consultoria em Engenharia e Meio Ambiente Ltda.
Dasyprocta azarae cutiaMyocastoridaeMyocastor coypus ratão-do-banhado
The Chiroptera Order, not included in this study, is certainly present in the influencearea of the project, with representatives of the Noctilionidae, Phyllostomidae,Vespertilionidae and Molossidae Families. They are bats, mammals that haveacquired the capacity to fly. They have nocturnal or twilight habits. They can be atdifferent levels of the food chain, because their feeding habits place them as:frugivores, nectivores, piscivores, omnivores and insectivores.
Furthermore, Rocha-Mendes et al. (2005), in another survey in an area of SeasonalForest, mention the occurrence of the tamandua-bandeira (Tamandua tridactyla),bugio (Alouatta guariba), cuíca (Chironectes minimus) and tapir (Tapirus terrestris).
Works like that of Rocha-Mendes et al. (2005) and Cherem (2005) prove that inspiteof the strong anthropization, remaining populations of mastofauna are still present inSanta Catarina and they sample the fauna that existed in the past on the vegetationformations of Mixed Ombrophila and Deciduous Seasonal Forest.
In observation of the area of indirect influence, we found three graxains (Cerdocyonthous) which had been run over a few meters from one another (Figure 26) and oftwo skunks (Didelphis sp.).
Figure 26 – Crab Eating Fox (Cerdocyon thous) found run over on the road ofSãoDomingos/SC.
Despite these observations that indicate the presence of mastofauna, today, bigmammals are rare in the hydrographic bay of the Chapecó river or are extinct in thisregion.