environmental impact study of juice€¦ · · 2015-06-22environmental impact study of juice for...
TRANSCRIPT
Questionmark � thequestionmark.org
Environmental impact
study of juice For the sustainability database of
Questionmark
Amsterdam, June 2015
Version: 1.0
Writers: Sander Hegger
Gustaaf Haan

2
1 Contents 1 Contents 2
2 Introduction 3 2.1 Background 3 2.2 This study 3 2.3 Product scoring 4 2.4 Input of stakeholders 5
3 Goal and scope definition 6 3.1 Goal 6 3.2 Scope 6 3.3 System boundaries 7
3.3.1 Product system 7 3.3.2 Exclusions 7 3.3.3 Functional unit 8 3.3.4 Multifunctional processes 8
4 Data inventory 9 4.1 Juice production 9 4.2 Country mixes 9 4.3 Orange juice 9 4.4 Pineapple juice 9 4.5 Apple juice 10 4.6 Grape juice 10 4.7 Juice production 10
5 Results 12
Annex 1 - Data juice production 16
Annex 2 – country mixes 17
Annex 2 – Other fruit juices 18 Assumptions fertilizer use 18 Assumptions pesticide use 19 Assumptions energy use 19 Assumptions juice production 19
References 23
Questionmark � thequestionmark.org
2 Introduction
2.1 Background Questionmark rates thousands of consumer products based on their impact
on health, environment, human rights and animal welfare throughout the
production chain. In order to measure these impacts, Questionmark uses
robust methods that adhere to widely accepted scientific theories and can
be applied at product level.
To investigate the environmental impacts of products Questionmark uses
the Life Cycle Assessment (LCA) methodology. LCA models the complex
interaction between a product and the environment from cradle to grave. It
is also known as life cycle analysis.
The main phases of an LCA are:
1. Goal & Scope definition, the product or service to be assessed is defined, a functional basis for comparison is chosen and the required level of detail is defined.
2. Inventory analysis of extractions and emissions. An inventory list of all the inputs and outputs of a product or service.
3. Impact assessment the effects of the resource use and emissions generated are grouped and quantified into a limited number of impact categories, which may then be weighted for importance.
4. Interpretation, the results are reported in the most informative way possible.
2.2 This study This document describes the way in which LCA is applied to investigate the
environmental impact of juice. The goal of this study is to produce a
database of environmental impacts of these products, which will be used to
compare the different products.
This report does not include the cultivation phase of the juice production as
this is already described in the report of potatoes, vegetables and fruit

4
[reference]. The report refers to this reference for the methodology and
data concerning the cultivation.
2.3 Product scoring The scoring of products is done on two levels: product level and ingredient
level.
Product level
Pictures are taken of a selection of products from different supermarkets, in
this case of products related to potatoes, vegetables and fruit. The
products are analysed on at least ingredients, country of origin, labels,
packaging and type of storage in the supermarket (ambient temperature,
cooling and freezer).
The environmental impact of the different packaging, freezer, cooling and
ingredients is analysed using the life cycle assessment (LCA) methodology.
The environmental impact of these elements is determined using a LCA.
The ecopoints as calculated using the LCA impact assessment
methodology ReCiPe are added together and scaled as described on the
site of Questionmark: http://www.thequestionmark.org/methode/milieu
The products are compared based on the environmental impact of 1 kg of
the edible part of the products.
The product scoring on a scale from 1-10 is done by giving the 1% best
scoring products a 9.5 or higher. The 5% lowest scoring products get a
score of 1.
Ingredients
The environmental impact of the ingredients is determined using the LCA
methodology. The details of the LCA are described in the next chapters.
The LCA of the packaging is described in a separate report.

5
2.4 Input of stakeholders Questionmark invites stakeholders to provide feedback on each study
performed to obtain useful critique on methodological choices and
outcomes and thus to conduct studies in a robust and proficient manner. A
panel of experts and stakeholders is consulted in the study about the
cultivation of Potatoes, vegetables and fruit1. The stakeholders that have
been consulted in that study are requested to provide feedback on this
study again for their input. Stakeholders that are specific for he juice sector
are requested to provide feedback as well.
6
3 Goal and scope definition
3.1 Goal The goal of the study is to develop a life cycle assessment ingredient
database of juices. This database will be used as input to compare the
environmental aspects of different juices and juice related products.
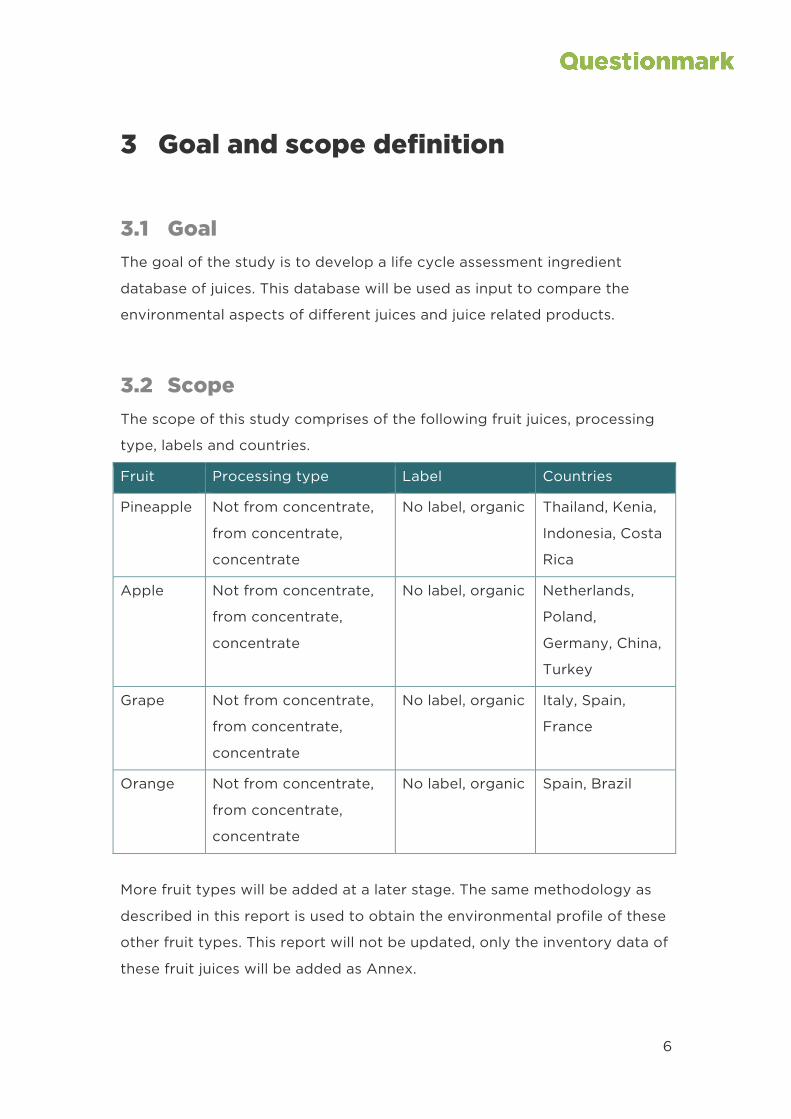
3.2 Scope The scope of this study comprises of the following fruit juices, processing
type, labels and countries.
Fruit Processing type Label Countries
Pineapple Not from concentrate,
from concentrate,
concentrate
No label, organic Thailand, Kenia,
Indonesia, Costa
Rica
Apple Not from concentrate,
from concentrate,
concentrate
No label, organic Netherlands,
Poland,
Germany, China,
Turkey
Grape Not from concentrate,
from concentrate,
concentrate
No label, organic Italy, Spain,
France
Orange Not from concentrate,
from concentrate,
concentrate
No label, organic Spain, Brazil
More fruit types will be added at a later stage. The same methodology as
described in this report is used to obtain the environmental profile of these
other fruit types. This report will not be updated, only the inventory data of
these fruit juices will be added as Annex.
7
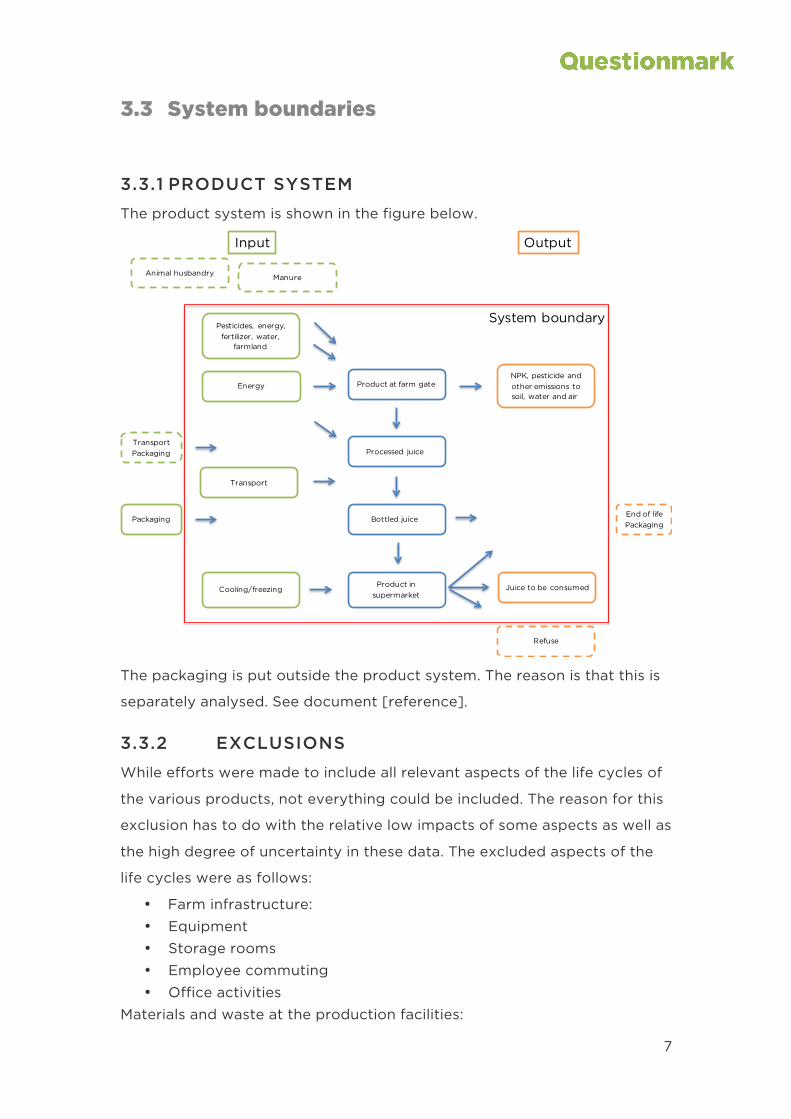
3.3 System boundaries
3.3.1 PRODUCT SYSTEM The product system is shown in the figure below.
The packaging is put outside the product system. The reason is that this is
separately analysed. See document [reference].
3.3.2 EXCLUSIONS While efforts were made to include all relevant aspects of the life cycles of
the various products, not everything could be included. The reason for this
exclusion has to do with the relative low impacts of some aspects as well as
the high degree of uncertainty in these data. The excluded aspects of the
life cycles were as follows:
• Farm infrastructure: • Equipment • Storage rooms • Employee commuting • Office activities
Materials and waste at the production facilities:
Pesticides, energy, fertilizer, water,
farmland
Product at farm gate
Processed juice
NPK, pesticide and other emissions to soil, water and air
Transport
Refuse
System boundary
Input Output
Product in supermarket
Cooling/freezing
Animal husbandry Manure
Transport Packaging
Energy
Juice to be consumed
Bottled juicePackagingEnd of life Packaging

8
• General materials used • Transport packaging • Wastewater • Production waste • Refuse from consumer
Transport packaging is not included in the scope of the project as it is not
expected that the transport packaging has a high impact and would
influence the results much.
The ingredients are modelled from cultivation to supermarket, including all
production processes and transport phases. A graphic representation of
the general life cycle of and the processes taken into account is shown in
3.3.3 FUNCTIONAL UNIT The functional unit follows the definition of the functional unit as described
in the general description of the environmental analysisa. This document
describes the functional unit as follows: the consumption of 1 kg juice as
consumed by the consumer.
3.3.4 MULTIFUNCTIONAL PROCESSES In the gate-to-gate analysis (processing and transport to the Netherlands)
of juices one multifunctional process has been identified: Juice production.
The products of the juice production process depend on the fruit but often
the following products are identified: juice, essential oils, pulp and scrap.
Economic allocation is used to divide the inventory between the different
products. This is done because mass allocation does not reflect the drivers
of the production well. Essential oils are only a fraction of the mass of the
products but the price per kg is high: 13 €/kg for essential oil and 0.2 €/kg
for juice2. Allocation is based on these product prices.
a Zie: http://www.thequestionmark.org/methode/milieu

9
4 Data inventory
4.1 Juice production The energy use of juice from fruit is based on three reports: Beccali
(2009)2, Knudsen (2011)3, a Sense (2013) project4 and a mass balance as
reported by FAO. See Annex 1 for an overview.
4.2 Country mixes Products often don’t mention the country of origin of the ingredients. The
country of origin of the juices is based on reports of AIJN from 2012 or
from CBS if not present in the AIJN reports. Se Annex 2 for more details.
4.3 Orange juice Orange juice is mainly produced in Spain, Brazil and the United States.
Orange juice is most often concentrated to about one sixth of the volume
at the country of orange cultivation. The origin of both types of juice is
different.
The mass balance of juice from fruit is based on three reports: Beccali
(2009)2, Knudsen (2011)3, a Sense (2013)4 project and a mass balance as
reported by FAO.
The energy use of the juice production is described in Annex I.
4.4 Pineapple juice Pineapple juice is mostly imported from Thailand and Costa Rica as
concentrate. Juice is extracted from the pineapple and is often the co-
product in the production of canned pineapple5. The non-fruit parts can be
used as feed6. We do not have information concerning the prices of juice,
canned pineapple and the remains. Therefore it is assumed that the price of
10
juice and canned pineapple is similar and much higher than the remains.
This results in an allocation of 100% to juice and canned fruit. The edible
part of a pineapple is about 64% according to FAO7. The energy use of the
juice production and concentration processes is based on the data of
frozen concentrated orange juice production.
4.5 Apple juice Apple juice is both available as pure juice and juice from concentrate. The
pure juice originates from mainly Germany and Poland. Also pure juice from
the Netherlands is available in Dutch stores. Apple juice concentrate is
mainly from China, Poland and Turkey.
The juice yield of apples used in this study, 73%, is based on an average of
five sources, see table below. The energy use of the juice production and
concentration processes is based on the data of frozen concentrated
orange juice production.
4.6 Grape juice Grape juice in Europe is produced mainly in Italy, Spain and France. The
juice is often from vineyards for wine production and not intentionally
produced for juice. The juice is assumed to be the only product of value
and the whole inventory of grape and juice production is allocated to the
juice. The amount of juice extracted from the grape, 82%, is based on a
report of the FAO8. The energy use of the juice production and
concentration processes is based on the data of frozen concentrated
orange juice production.
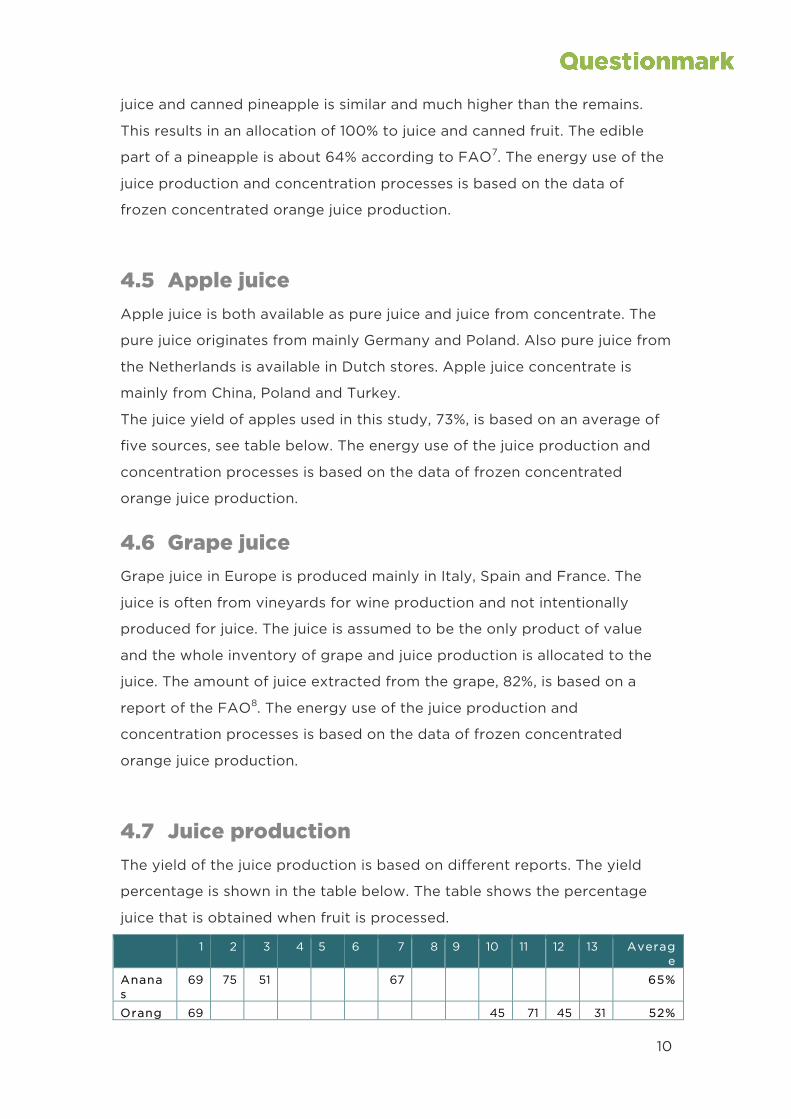
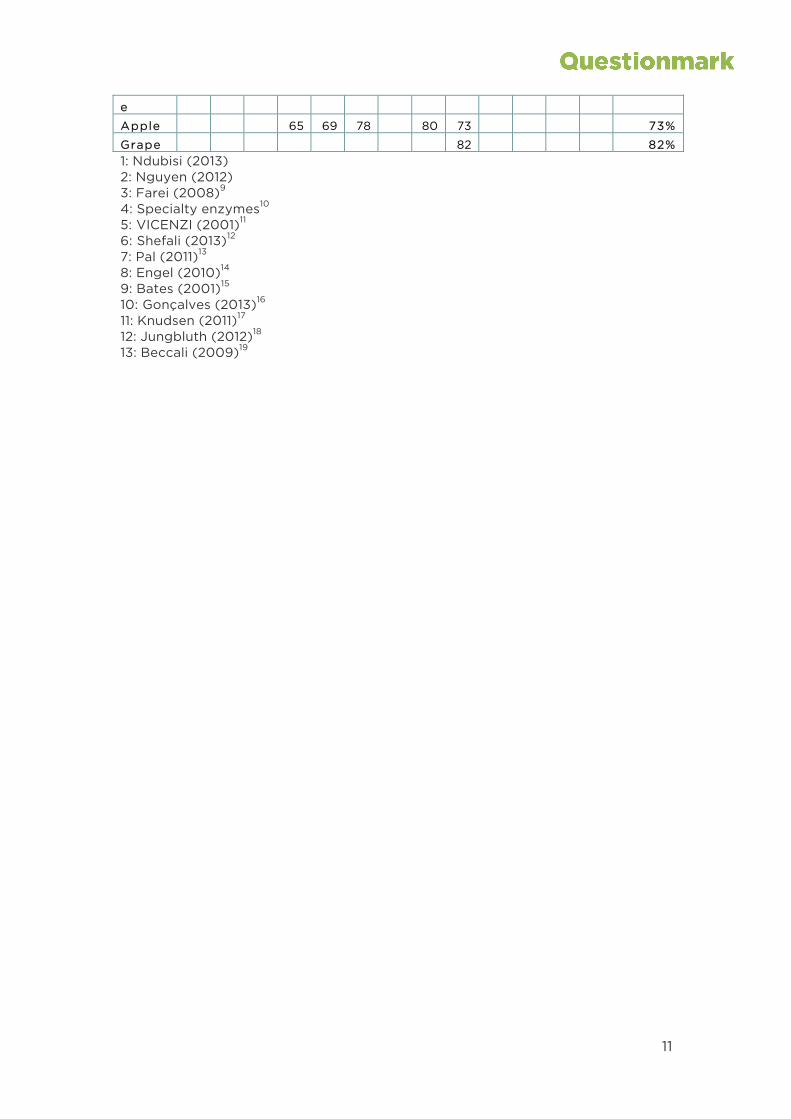
4.7 Juice production The yield of the juice production is based on different reports. The yield
percentage is shown in the table below. The table shows the percentage
juice that is obtained when fruit is processed.
1 2 3 4 5 6 7 8 9 10 11 12 13 Average
Ananas
69 75 51 67 65%
Orang 69 45 71 45 31 52%
11
e Apple 65 69 78 80 73 73% Grape 82 82% 1: Ndubisi (2013) 2: Nguyen (2012) 3: Farei (2008)9 4: Specialty enzymes10 5: VICENZI (2001)11 6: Shefali (2013)12 7: Pal (2011)13 8: Engel (2010)14 9: Bates (2001)15 10: Gonçalves (2013)16 11: Knudsen (2011)17 12: Jungbluth (2012)18 13: Beccali (2009)19

Questionmark � thequestionmark.org
5 Results The results are shown in the two figures below. The figures are the same but the pineapple cultivation in Kenia and Thailand is
removed from the results as this allows to see the results of the juices with the lower ReCiPe scores in more detail.
0
0,2
0,4
0,6
0,8
1
1,2
1,4
1,6
Sap -
Anana
s,Puu
r,Costa
Rica
,Gee
n keu
rmer
k
Sap -
Anana
s,Puu
r,Ken
ia,Gee
n keu
rmer
k
Sap -
Anana
s,Puu
r,Tha
iland
,Gee
n keu
rmer
k
Sap -
Anana
s,Uit
conc
entra
at,K
enia,
Geen
Sap -
Anana
s,Uit
conc
entra
at,Th
ailan
d,Gee
n
Sap -
Appel,Puu
r,Duit
sland
,Gee
n keu
rmer
k
Sap -
Appel,Puu
r,Ned
erlan
d,Gee
n keu
rmer
k
Sap -
Appel,Puu
r,Polen
,Gee
n keu
rmer
k
Sap -
Appel,Uit
conc
entra
at,C
hina,G
een
Sap -
Appel,Uit
conc
entra
at,D
uitsla
nd,G
een
Sap -
Appel,Uit
conc
entra
at,Polen
,Gee
n
Sap -
Appel,Uit
conc
entra
at,Tu
rkije
,Gee
n
Sap -
Druif,P
uur,F
rank
rijk,G
een k
eurm
erk
Sap -
Druif,P
uur,It
alië,G
een k
eurm
erk
Sap -
Druif,P
uur,S
panje,
Geen k
eurm
erk
Sap -
Druif,U
it co
ncen
traat
,Frank
rijk,G
een
Sap -
Druif,U
it co
ncen
traat
,Itali
ë,Gee
n keu
rmer
k
Sap -
Druif,U
it co
ncen
traat
,Spanje,
Geen
Sap -
Sinaas
appel,
Puur,B
razil
ië,Gee
n keu
rmer
k
Sap -
Sinaas
appel,
Puur,S
panje,
Geen k
eurm
erk
Sap -
Sinaas
appel,
Uit co
ncen
traat
,Bra
zilië,
Geen
Sap -
Sinaas
appel,
Uit co
ncen
traat
,Spanje,
Geen
Sap -
Sinaas
appel,
Uit co
ncen
traat
,Veren
igde
ReC
iPe
scor
e (P
t)
Land use N-fertiliser P2O5-fertiliser Lime Pesticiden Diesel Electricity Water use

13
0
0,02
0,04
0,06
0,08
0,1
0,12
0,14
Sap -
Appel,Puu
r,Duit
sland
,Gee
n keu
rmer
k
Sap -
Appel,Puu
r,Ned
erlan
d,Gee
n keu
rmer
k
Sap -
Appel,Puu
r,Polen
,Gee
n keu
rmer
k
Sap -
Appel,Uit
conc
entra
at,C
hina,G
een
Sap -
Appel,Uit
conc
entra
at,D
uitsla
nd,G
een
Sap -
Appel,Uit
conc
entra
at,Polen
,Gee
n
Sap -
Appel,Uit
conc
entra
at,Tu
rkije
,Gee
n
Sap -
Druif,P
uur,F
rank
rijk,G
een k
eurm
erk
Sap -
Druif,P
uur,It
alië,G
een k
eurm
erk
Sap -
Druif,P
uur,S
panje,
Geen k
eurm
erk
Sap -
Druif,U
it co
ncen
traat
,Frank
rijk,G
een
Sap -
Druif,U
it co
ncen
traat
,Itali
ë,Gee
n keu
rmer
k
Sap -
Druif,U
it co
ncen
traat
,Spanje,
Geen
Sap -
Sinaas
appel,
Puur,B
razil
ië,Gee
n keu
rmer
k
Sap -
Sinaas
appel,
Puur,S
panje,
Geen k
eurm
erk
Sap -
Sinaas
appel,
Uit co
ncen
traat
,Bra
zilië,
Geen
Sap -
Sinaas
appel,
Uit co
ncen
traat
,Spanje,
Geen
Sap -
Sinaas
appel,
Uit co
ncen
traat
,Veren
igde
ReC
iPe
scor
e (P
t)
Land use N-fertiliser P2O5-fertiliser Lime Pesticiden Diesel Electricity Water use

Questionmark � thequestionmark.org
Pineapple juice
Much of the pineapple juice originates from pineapples grown in Thailand
and Kenia. Both countries are linked with deforestation for their pineapple
plantations. This has a huge impact on the total ReCiPe score. The blue part
of the graph consists of the cultivation of the pineapple of which
deforestation is the main impact.
Orange juice
Orange juice is often produced from frozen concentrate (FC) originating
from Brazil. The concentration energy is besides the cultivation, a
substantial part of the impact. More and more orange juice is however
consumed from juice that has not been concentrated but directly bottled.
Spain is an important production country for this not for concentrate (NFC)
juice. The volume to be transported is about a factor six higher for NFC
than FC. The transport from Spain is mostly done by truck which is more
carbon intensive per kilometre transport. The additional transport this NFC
has a similar ReCiPe score as the concentration energy of the FC. This
results in similar ReCiPe score.
Grape juice
Grapes have a relative low yield, this results in a higher ReCiPe score for
grape juice as a result of additional use of farming land compared to
orange juice or apple juice. The yield in Italy is on average higher than in
France, which results in a lower ReCiPe score for Italy than for France.
Concentrate
Fruit concentrates are also used in beverages. We assume that concentrate
has a 6 times higher concentration than the original juice. Fruit juice has a
Brix value around 10, whereas concentrate often has a Brix value of 60. This
concentrate has a 6 times higher concentration.
Pulp and puree
Beverages sometimes contain pulp or purees. The environmental impact is
assumed to be the same as juice. This is consistent with the economic

15
allocation as it is assumed that the price of pulp and purees is the same as
for the juice.

16
Annex 1 - Data juice production Extraction of 1 kg oranges (averages of 2 publications2,4):
0.14 MJ electricity
0,0076 MJ natural gas
Production of 1 kg FJOC (average of two publications2,3):
1,81 MJ electricity
0,73 MJ natural gas
0.26 kg steam
Packaging of 1 kg FCOJ2:
4.1 MJ electricity
0.0026 LDPE bags
Transport tot the Netherlands
FCOJ and NFC from Brazil is transported in dedicated bulk tanker across
the ocean20 (AIJN 2012). The ships go back empty. The round trip of this
ship is therefore required to get one load of orange juice and concentrate
in Europe.
Reconstitution and bottling
The energy use of reconstitution is based on a report of Beccali2 and is
assumed to be 0.056 MJ per kg reconstituted juice.

17
Annex 2 – country mixes Orange juice
OFJC NFC Brazil 94% Brazil 70% USA 6% Spain 40% OFJC: Orange juice frozen concentrate
NFC: Not from concentrate
The figures of OFJC are from the AIJN 201220 report and the NFC figures
are from the AIJN 201421 report.
Apple juice
AJC ANFC China 37% Germany 66% Poland 46% Poland 34% Turkije 17%
AJC: Apple Juice concentrate
ANFC: Apple Juice not from concentrate
The figures from both the AJC and ANFC are from the AIJN 2012 report20.
Grape juice
GJC France 48% Spain 28% Italy 25% GJC: Grape juice concentrate
The figures from the GJC are from the CBS 2012 and 2013. This is based on
the following CBS categories: 20096110, 20096190, 20096911, 20096919,
20096951, 20096959, 20096971, 20096979, 20096990.
Pineapple juice
PJC Thailand 46% Costa Rica 54% PJC: Pineapple juice concentrate
The figures from PJC are from the AIJN 2012 report20.

18
Annex 2 – Other fruit juices
Assumptions fertilizer use Passionfruit
A book of Paull22 provides the following fertilizer use with a yield of 1000
kg/ha: fruit fertilizer 10:5:20 formulation at 50% efficiency: 66 kg/1000kg.
This is equivalent with 6,6 kg N/1000 kg fruit; 3,3 kg P/1000 kg fruit.
Blueberry
A report of Hayden23 provides an amount of nitrogen per acre of 60-80
pounds. This is equivalent with 67-90 kg/ha. The average between these
two figures is used as the nitrogen input for blueberry in this study.
60-80 pounds of actual nitrogen per acre.
Coconut
The amount of fertilizer use for the growth of coconut is based on a report
of Marinussen (2012)24.
Mango
The fertilizer use of Mango production is based on recommendations of a
fertilizer producer25. The growth of mango is associated with deforestation
according to the Direct Land Use Change Assessment Tool26.
Other
If no specific fertilizer use is available for a type of fruit, then the fertilizer
use is assumed to be the same as a similar type of fruit.
Fertiliser use of citrus fruit (lemon, grapefruit, mandarin) is assumed to be
the same as the fertilizer use of oranges. The fertilizer use of the orange
cultivation of the country of origin of the specific citrus fruit is used If data
is available. The fertilizer use of the orange cultivation in Spain is used if
this data is not available.

19
Fertilizer use of cranberry cultivation is assumed to be the same as
blueberry cultivation.
Fertilizer use of passion fruit is assumed to be the same as another type of
tropical fruit: pineapple.
Fertilizer use of plum cultivation is assumed to be similar with fertilizer use
of cherries as it is a stone fruit as well. An exception is plum cultivation in
South Africa, which is assumed to be the same as apple cultivation in South
Africa.
Assumptions pesticide use Pesticide use of all berries (blueberry, blackberry, raspberry, cranberry) is
assumed to be the same as pesticide use in strawberry cultivation.
The pesticide use of all citrus (lemon, grapefruit, mandarin) is assumed to
be the same as the pesticide use of orange cultivation.
The pesticide use of the cultivation of cherry and plum is assumed to the
same as the pesticide use of apple cultivation.
The pesticide use of the tropical fruit (coconut, mango and passion fruit) is
assumed to be the same as the pesticide use of pineapple cultivation.
Assumptions energy use The assumptions of energy use are based on the growth characteristics, the
energy use of fruit where no information is available from is based on types
of fruit which have a similar way of growing.
The energy use of all citrus (lemon, grapefruit, mandarin) is assumed to be
the energy use of orange cultivation.
The energy use of berries (blueberry, blackberry, raspberry, cranberry) is
assumed to be the same as the energy use of strawberry cultivation.
The energy use of the cultivation of cherry and plum is assumed to the
same as the energy use of apple cultivation.
Assumptions juice production The below provides an overview of the juice yield of different reports. The
average is used for this study.

20
1 2 3 4 5 6 7 8 9 Gemiddeld
Strawberry 49% 49% Banana 71% Blueberry 54% Lemon 42,3
% 42,3%
Mango 52.5%
52,5%
Passion fruit
39% 32.5%
36%
Pear 73% Peach 49% 49% Coconut 85% 35% Cranberry 75% 75% Kiwi 85% 85% Mandarin 52% 52% Raspberry 64% 64% Cherry 69% Grapefruit 75% 75% Plum 69% 69% Zwarte berry
54% 54%
1: http://www.brsquared.org/wine/CalcInfo/FruitDat.htm 2: http://www.fao.org/docrep/005/y2515e/y2515e15.htm 3: Practial action.org - Technical brief, passion fruit juice small-scale manufacture 4: Hai-ning Zhang (2011)27 5: FAHAD Y. AL-JUHAIMI AND KASHIF GHAFOOR (2013)28 6: F.T. Lynch (2008)29 7: Tamil Nadu Agricultural University30 8: University of Arizona31 9: Juan Buenrostro-Figueroa (2010)32 Coconut A coconut contains about 10% coconut water. The major part of the coconut is has a low economic value and is often discarded. A coconut consists of 50% husk, 15% shell, 25% coconut meat and 10% coconut water. The yield figures apply to husked coconuts. This means that 85% of the yield of cocnuts is edible. The environmental burden of coconut cultivation is allocated to the edible parts based on mass. Mango An article of Figueroa reports a by-product percentage of 35-60% of the total fruit weight. The average of these values is 47.5%. We assume that 52.5% of the mango is edible. The environmental burden of the cultivation of mango’s is allocated to this part of the fruit. Banana The juice yield of bananas is assumed to be the same as the percentage banana pulp in a whole banana. This percentage is set at 71%, based on the potatoes, fruit and vegetable study performed by Questionmark.

21
22
Cherry No data was found concerning the juice yield of cherries. The juice yield of plums is therefore used as approximation. Pear No data was found concerning the juice yield of pears. The juice yield of apples is therefore used as approximation. Blueberry No data was found concerning the juice yield of blueberries. The juice yield of black berries is therefore used as approximation.
23
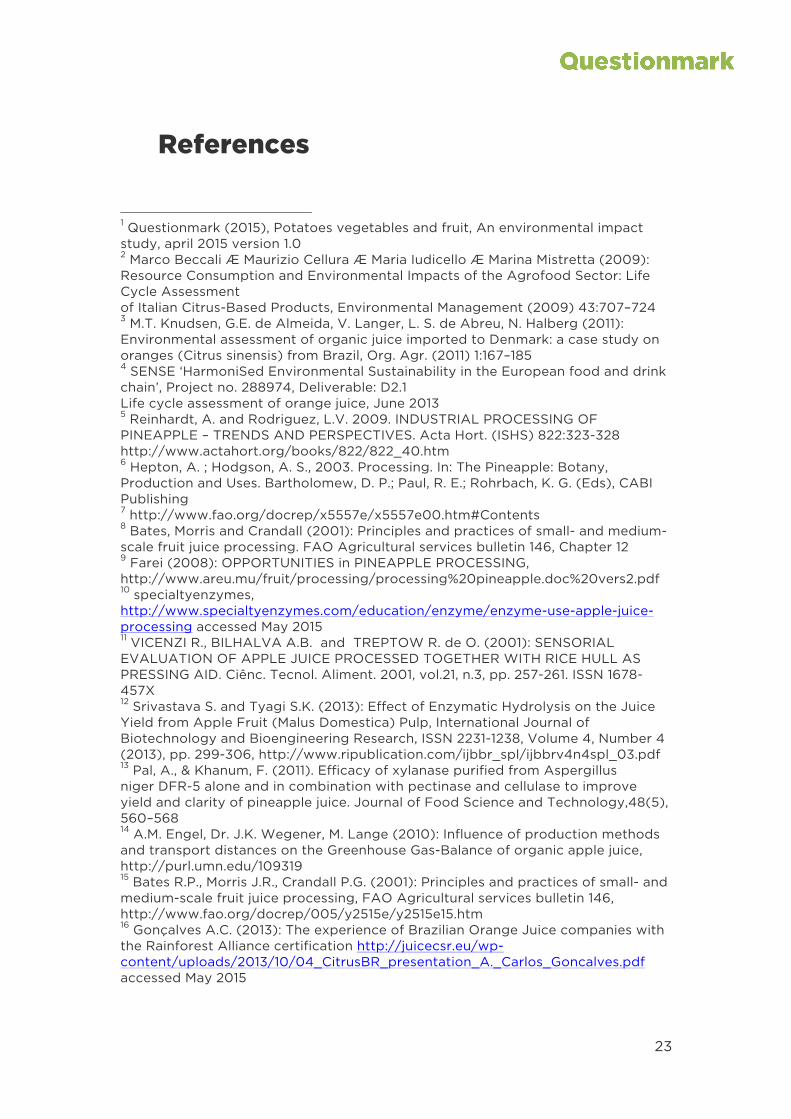
References
1 Questionmark (2015), Potatoes vegetables and fruit, An environmental impact study, april 2015 version 1.0 2 Marco Beccali Æ Maurizio Cellura Æ Maria Iudicello Æ Marina Mistretta (2009): Resource Consumption and Environmental Impacts of the Agrofood Sector: Life Cycle Assessment of Italian Citrus-Based Products, Environmental Management (2009) 43:707–724 3 M.T. Knudsen, G.E. de Almeida, V. Langer, L. S. de Abreu, N. Halberg (2011): Environmental assessment of organic juice imported to Denmark: a case study on oranges (Citrus sinensis) from Brazil, Org. Agr. (2011) 1:167–185 4 SENSE ‘HarmoniSed Environmental Sustainability in the European food and drink chain’, Project no. 288974, Deliverable: D2.1 Life cycle assessment of orange juice, June 2013 5 Reinhardt, A. and Rodriguez, L.V. 2009. INDUSTRIAL PROCESSING OF PINEAPPLE – TRENDS AND PERSPECTIVES. Acta Hort. (ISHS) 822:323-328 http://www.actahort.org/books/822/822_40.htm 6 Hepton, A. ; Hodgson, A. S., 2003. Processing. In: The Pineapple: Botany, Production and Uses. Bartholomew, D. P.; Paul, R. E.; Rohrbach, K. G. (Eds), CABI Publishing 7 http://www.fao.org/docrep/x5557e/x5557e00.htm#Contents 8 Bates, Morris and Crandall (2001): Principles and practices of small- and medium-scale fruit juice processing. FAO Agricultural services bulletin 146, Chapter 12 9 Farei (2008): OPPORTUNITIES in PINEAPPLE PROCESSING, http://www.areu.mu/fruit/processing/processing%20pineapple.doc%20vers2.pdf 10 specialtyenzymes, http://www.specialtyenzymes.com/education/enzyme/enzyme-use-apple-juice-processing accessed May 2015 11 VICENZI R., BILHALVA A.B. and TREPTOW R. de O. (2001): SENSORIAL EVALUATION OF APPLE JUICE PROCESSED TOGETHER WITH RICE HULL AS PRESSING AID. Ciênc. Tecnol. Aliment. 2001, vol.21, n.3, pp. 257-261. ISSN 1678-457X 12 Srivastava S. and Tyagi S.K. (2013): Effect of Enzymatic Hydrolysis on the Juice Yield from Apple Fruit (Malus Domestica) Pulp, International Journal of Biotechnology and Bioengineering Research, ISSN 2231-1238, Volume 4, Number 4 (2013), pp. 299-306, http://www.ripublication.com/ijbbr_spl/ijbbrv4n4spl_03.pdf 13 Pal, A., & Khanum, F. (2011). Efficacy of xylanase purified from Aspergillus niger DFR-5 alone and in combination with pectinase and cellulase to improve yield and clarity of pineapple juice. Journal of Food Science and Technology,48(5), 560–568 14 A.M. Engel, Dr. J.K. Wegener, M. Lange (2010): Influence of production methods and transport distances on the Greenhouse Gas-Balance of organic apple juice, http://purl.umn.edu/109319 15 Bates R.P., Morris J.R., Crandall P.G. (2001): Principles and practices of small- and medium-scale fruit juice processing, FAO Agricultural services bulletin 146, http://www.fao.org/docrep/005/y2515e/y2515e15.htm 16 Gonçalves A.C. (2013): The experience of Brazilian Orange Juice companies with the Rainforest Alliance certification http://juicecsr.eu/wp-content/uploads/2013/10/04_CitrusBR_presentation_A._Carlos_Goncalves.pdf accessed May 2015

24
17 Knudsen M.T., Fonseca de Almeida G. Langer V., Santiago de Abreu L., Halberg N.(2011): Environmental assessment of organic juice imported to Denmark: a case study on oranges (Citrus sinensis) from Brazil, Org. Agr. (2011) 1:167–185 18 Jungbluth N., Doublet G., Stucki M., Schori S. (2012): SENSE ‘HarmoniSed Environmental Sustainability in the European food and drink chain’, Deliverable: D2.1 Life cycle assessment of orange juice 19 Beccali M., Cellura M., Iudicello M., Mistretta M. (2009): Resource Consumption and Environmental Impacts of the Agrofood Sector: Life Cycle Assessment of Italian Citrus-Based Products, Environmental Management (2009) 43:707–724 20 European Fruit Juice Association (2012): Market Report 21 European Fruit Juice Association (2014): Market Report 22 Robert E. Paull,Odilio Duarte (2011): Tropical Fruits (Crop Production Science in Horticulture), ISBN 978-1-84593672-3 23 Hayden FERTILIZING BLUEBERRIES, Department of Horticulture, Purdue University Cooperative Extension Service • West Lafayette, IN 24 M. Marinussen, H. van Kernebeek, R. Broekema, E. Groen, A. Kool, W.J. van Zeist, M. Dolman, H. Blonk (2012): LCI data for the calculation tool Feedprint for greenhouse gas emissions of feed production and utilization, Blonk Consultants, Wageningen University and Research Centre November 2012 25 Haifa: Mango fertilizer: a fertilization program for mango trees - See more at: http://www.haifa-group.com/dutch/knowledge_center/recommendations/fruit_trees/a_fertilization_program_for_mango_trees.aspx#sthash.G2BUzCe5.dpuf 26 Direct Land Use Change Assessment Tool, Version 2013.1, Blonk Consultants, Gouda, 2013. 27 Hai-ning Zhang, Jia He, Dan Luo, Chun-yang Zheng, Gai-ping Zhai, Shuo-guo Zhang (2011): Study On Effect On Pulp Enzyme And Pectinase On The Juice Yield Of Kiwi Fruit, New Technology of Agricultural Engineering (ICAE), 2011 International Conference on, pages 1144 – 1147 28 FAHAD Y. AL-JUHAIMI AND KASHIF GHAFOOR (2013): BIOACTIVE COMPOUNDS, ANTIOXIDANT AND PHYSICO-CHEMICAL PROPERTIES OF JUICE FROM LEMON, MANDARIN AND ORANGE FRUITS CULTIVATED IN SAUDI ARABIA, Pak. J. Bot., 45(4): 1193-1196, 2013. 29 F.T. Lynch (2008): The Book of Yields: Accuracy in Food Costing and Purchasing, 7th edition ISBN-13: 978-0-471-74590-7 30 Tamil Nadu Agricultural University, Expert System for Coconut, Coconut processing, http://www.agritech.tnau.ac.in/expert_system/coconut/coconut/coconut_processing.html 31 University of Arizone - http%3A%2F%2Fcals.arizona.edu%2Ffps%2Fsites%2Fcals.arizona.edu.fps%2Ffiles%2Fcotw%2FGrapefruit.pdf&ei=gaZtVdDqJImqUdv2gYAI&usg=AFQjCNFSRzH4MroA3cVHtbQ5KIlnihUkCg&bvm=bv.94911696,d.d24 32 Juan Buenrostro-Figueroa, Heliodoro de la Garza-Toledo, Vrani Ibarra-Junquera, and Cristóbal Noe Aguilar (2010): Juice Extraction from Mango Pulp Using an Enzymatic Complex of Trichoderma sp. produced by Solid-state Fermentation, Food Sci. Biotechnol. 19(5): 1387-1390 (2010)