environmental impacts of -...
TRANSCRIPT

The Journal of Technology, Management, and Applied Engineering
The Journal of Technology, Management, and Applied Engineering© is an official
publication of the Association of Technology, Managment,
and Applied Engineering, Copyright 2012
ATMAE1390 Eisenhower Place
Ann Arbor, MI 48108
www.atmae.org
V O L U M E 2 8 , N U M B E R 3
July 2012 through
September 2012
Environmental Impacts of Using Welding Gas
P E E R - R E F E R E E D C AT E G O R Y n A P P L I E D R E S E A R C H
Keyword search:
Energy, Manufacturing, Material and Processes, Welding
formerly known as the “Journal of Industrial Technology”
Authors:Dr. Hany Nakhla,
Dr. Ji Y. Shen, & Mr. Malcolm Bethea
Abstract/Article 2 References 8
Appendix 9

2
The Journal of Technology, Management, and Applied Engineering
The Journal of Technology, Management, and Applied Engineering
VOLUME 28, NUMBER 3 JULY 2012 – SEPTEMBER 2012
ENVIRONMENTAL IMPACTS OF USING WELDING GAS
Dr. Hany Nakhla i s a n a s s o c i ate Professor at the D e p a r t m e n t o f applied Engineer-ing Technology at North Carolina A&T state University He received his Ph.D.
in Mechanical Engineering from Rensselaer Polytechnic Institute, Troy NY in 2001. His research interests include Computational Fluid Dynamics, thermal management and system analysis for applications in Automotive Aerospace and Energy. Dr. Na-khla is also a licensed PE in North Carolina.
Dr. Ji Yao Shen is a Professor and De-partment Chair of the Department of Applied Engineer-ing Technology at North Carolina A&T State University. He received his
Ph.D. in Mechanical Engineering from the Dept. of Mechanical Engineering & Mechanics, Old Dominion University, Norfolk, VA., 1991. His research interests include structural dynamics and control;
Environmental Impacts of Using Welding GasBy Dr. Hany Nakhla, Dr. Ji Y. Shen, & Mr. Malcom Bethea
ABSTRACT This paper presents a methodology to calculate car-bon emissions associated with an industrial process from energy resource and usage. A case study for shield gas production and transportation used in welding is presented. The study is performed using data gathered from the Department of Energy and gas production companies to quantify the emis-sions associated with the usage of weld gas. Results show that the environmental impact of weld gas utilization expands beyond the release of the weld gas into the atmosphere. Reducing carbon emis-sions require that industries be able to quantify and identify different sources of emissions and intro-duce new technologies that conserve and sustain their resources. The amount of savings that a gas regulator represents is significant for companies that heavily consume shield gas in welding. The amount of saving can vary significantly between different states in the US depending on the local source of energy and transportation from produc-tion to utilization. The use of a weld gas regulator that automatically synchronizes the welding cur-rent with shield gas consumption can account for significant savings for the production process and reduce the amount of greenhouse gases emitted indirectly from the welding process by production and transportation. The amount of saving ranges from 200 to 550kg of CO2 per weld unit per year. Exact savings are case dependent on the type of weld, operator setting, source of energy at produc-tion sites and location relative to the welding plant.
INTRODUCTIONEnergy conservation and reducing greenhouse gas emissions are important to preserve the quality of the environment and sustain our resources for future generations. A major contributor to emis-sions and release of gases is from the industrial processes and material transportation for manufac-turing purposes (Cook and Hockstad, 2011). The contribution of industrial processes to air pollu-tion addressed in this paper is gas shielded electric welding that is heavily used in steel and metal fab-rication. During the welding process an inert gas is used to protect the welding region and prevent oxidation. Carbon dioxide and argon gas are both used as a preferred shielding gas because of their availability and relatively low cost. Extensive use of shield gases has a negative impact on the environ-ment and presents needless expense to industry if not regulated properly. The environmental impact
rises from the energy usage and emissions associ-ated with the gas production and transportation, in addition to the incidental release into the environ-ment.In this paper the investigators used information from Department of Energy database and shield gas producers to analyze the environmental impact of producing shield gases. The data was used to develop an analytical model of emissions from pro-duction and transportation. A welding experiment at Alamance Community College was used to mea-sure expected savings from shield gas regulation.
SHIELDING GASESThe physical properties of shield gases have a major effect on welding speed, penetration, mechanical properties, weld appearance, fume generation and arc stability (Kim, Son and Chin, 2006). The speed of the welding process is largely influenced by the shielding gas or mixture being used and its heat transfer properties, oxidizing potential and metal transfer characteristics. High thermal conductiv-ity gases produce the hottest and most fluid weld puddle, while high oxidation gases reduce surface tension of the weld puddle to encourage wetting of the weld bead to the base material. The inert gas blends that promote spray transfer encour-age a higher level of wire electrode deposit more efficiently and generally travel at higher speeds. The use of argon blends for shield gas result in the highest levels of deposit of weld metal (Kim and Eager, 1993).The supply and distribution of industrial gases requires special considerations. The main factors considered include average consumption rate, us-age rate and the purity or mixture of the product needed. Small volume users typically purchase the gases in cylinders from specialty gas distributors. These distributors buy or produce the gases in bulk liquid form and package the gases into cylinders at their facilities. For the consideration of emissions attributable to the transport of specialty gases, a typical mileage estimate would be less than 200 miles due to the extensive network of distributors across the country.Shielding gases such as argon (Ar) and carbon dioxide (CO2) are an important component in the fabrication processes of the automotive, aerospace, railroad, trucking and construction industries. Mixtures of argon and carbon dioxide are used in the welding process as shielding gases to protect
M r . M a l c o l m Bethea is an In-struc tor in the D e p a r t m e nt o f Applied Engineer-ing Technology at North Carolina A &T State Univer-sity. He received
his Master of Science Degree in Mechani-cal Engineering from the Department of Mechanical Engineering, North Carolina A &T State University in 2004. Mr. Bethea’s research interests include lean operations and processes, design for manufacturing, computer integrated manufacturing, cellular manufacturing, intelligent manu-facturing, supply chain management, and architecture for production control.

3
The Journal of Technology, Management, and Applied Engineering
The Journal of Technology, Management, and Applied Engineering
VOLUME 28, NUMBER 3 JULY 2012 – SEPTEMBER 2012
ENVIRONMENTAL IMPACTS OF USING WELDING GAS
the weld puddle against oxidation by the surround-ing air. The Argon and carbon dioxide mixture has been found to increase the welding production rate and reduce imperfections in the weld which reduces the need for post-weld treatment.The amount of shielding gas used in the welding process is set by the operator depending on the type of weld. Current welding systems allow the operator to set a fixed flow rate of the shield gas independent of the weld current. This flow rate is typically at the highest setting to protect the weld at the peak demand throughout the cycle. Synchro-nizing the shield gas flow rate with the current can optimize the welding process for efficiency result-ing in greatly reduced consumption. Excessive shield gas flow can cause difficulty in weld start and rapid cooling of the weld which can cause internal stresses in the welded joint (Kim et al. 2006). Weld regulators reduce the amount of gas used while maintaining the weld region saturation with less turbulent gas flow. In addition to improving weld quality with better shield protection, the reduced gas usage will have environmental and economic benefits. Conservative utilization of shield gas by monitoring and regulation reduces production cost and greenhouse gas emissions.
Shield Gas - ArgonArgon (Ar), an important portion of the shielding gas mixture, is a colorless, tasteless, and nontoxic gas. It is present in the atmosphere at a concentra-tion of 0.934% by volume. Argon is a member of a special group of gases known as “rare”, ”noble”, or “inert” gases and is monatomic with a totally filled outermost shell of electrons. The argon gas has a boiling point of -302.6oF and the freezing point is -308.8oF. It is approximately 1.4 times as heavy as air, is slightly soluble in water, and produces a pale, blue-violet light when electrically excited. Argon is used for various industrial processes requiring total inertness at high temperatures such as the manufacturing of high quality stainless steels and semi-conductor components (Asami, et al., 1996). In the welding process, argon promotes good arc starting characteristics and stability due to its low ionization potential. Argon is typically mixed with carbon dioxide for shielding purposes, and com-monly is at ratios of 90% Argon to 10% CO2.
Shield Gas - Carbon DioxideCarbon dioxide (CO2) is an odorless, colorless gas with a slight toxicity. It is formed by combustion as well as biological processes such as decomposition of organic matter. Carbon dioxide is considered to be a greenhouse gas due to its ability to absorb infrared light.Commercially produced carbon dioxide is most commonly recovered in industrial plants which
produce hydrogen or ammonia from natural gas, coal, or other hydrocarbon feedstock, and in the production of calcium oxide (lime) for making ce-ment (Page, 2009). Corn to ethanol plants are now considered to be the most rapidly growing source of feed gas for CO2 recovery.Production of CO2 for commercial use requires capture and purification from a high volume gas stream with a large CO2 concentration. Gas by-products from simple combustion sources such as boilers, power plants, and process heaters are not desirable for commercial capture due to a low concentration of CO2 and a high concentration of impurities. The largest source of U.S. carbon diox-ide emissions other than fossil fuel consumption is cement manufacture, where most emissions result from the production of clinker (consisting of cal-cium carbonate sintered with silica in a cement kiln to produce calcium silicate) (Worrell and Galitsky, 2004). Limestone consumption, especially for lime manufacture, is the source of 15 to 20 Million Met-ric Tons (MMT) of carbon dioxide emissions per year. Additional sources include soda ash manufac-ture and consumption carbon dioxide manufacture aluminum manufacture flaring of natural gas at the wellhead carbon dioxide scrubbed from natural gas and waste combustion in the commercial and industrial sectors.
SHIELD GAS PRODUCTION ENERGY AND EMISSIONSArgon is usually produced as part of the air lique-faction process to extract Oxygen and Nitrogen. The main cost associated with the separation of air is the cost of electricity. Since argon is produced as a co-product of high purity oxygen and nitrogen production, it is necessary to figure the energy ex-penditure of production using the ideal (minimum) work required to liquefy and separate the gas from ambient temperature and pressure to liquid (Bern-stein, 1999). The amount of energy (Q) needed to liquefy a unit mass of argon gas can be calculated as
[1]Where Tat is the atmospheric temperature, TB,Ar is the boiling temperature of argon and LH is the latent heat of vaporization. The amount of work needed for the refrigeration cycle can be calculated from the Carnot ideal cycle based on the tempera-ture limit and compression efficiency. The coeffi-cient of performance (b) for refrigeration and compressor work will be
[2]
[3]
material analysis, characterization, and modeling; industrial material processing; quality control; enterprise management information systems such as enterprise re-source planning, manufacturing execution, and supply chain management.

4
The Journal of Technology, Management, and Applied Engineering
The Journal of Technology, Management, and Applied Engineering
VOLUME 28, NUMBER 3 JULY 2012 – SEPTEMBER 2012
ENVIRONMENTAL IMPACTS OF USING WELDING GAS
Carbon Dioxide Compression Energy: Since carbon dioxide is a by-product of an existing process, the amount of energy used for production can be ne-glected. However, due to the relatively low density of the gas, carbon dioxide is transported either in the form of cryogenic liquid gas or in high pressure containers with pressure of 3500psi (238 bar). The amount of energy needed to liquefy the CO2 can be calculated in a similar procedure as that for carbon to be:
[4]The amount of work needed for the refrigera-tion cycle can be calculated from the ideal cycle based on the temperature limit and assuming a compression efficiency of 50%. The coefficient of performance for refrigeration and the amount of electricity used to produce the carbon dioxide gas can be calculated from equation [2] and [3] is 0.384 kWh/1000liter.For gas compression, the process is done with a continuous cooling to reduce the work, and therefore can be considered a constant tempera-ture compression. The amount of work needed to compress the CO2 is calculated from the following relation as
[5]
Production of liquid CO2 consumes less energy and results in higher mass density, but the cost of liquid CO2 is higher due to the capital investment in the cryogenic plant. Pressure tanks will have lower mass density and therefore will be consumed much faster.
Emissions from Electric Energy Generation: In the United States, most of our energy comes from nonrenewable energy sources coal, petro-leum, natural gas, propane, and uranium. Figure 1 shows the energy consumption in 2008, with most of the energy generated from hydrocarbon which accounts for most of the pollution in the air and greenhouse gases. According to the US Department of Energy, coal accounts for 48% of the energy used to produce electricity (Yildiz, 2008) and (Conti and Sweetnam, 2008). The amount of carbon gases emitted from electric energy generation changes according to the state resources and consump-tion. Most industrial states rely heavily on coal for electricity generation since it is the least expensive source, which significantly contribute to carbon emissions.
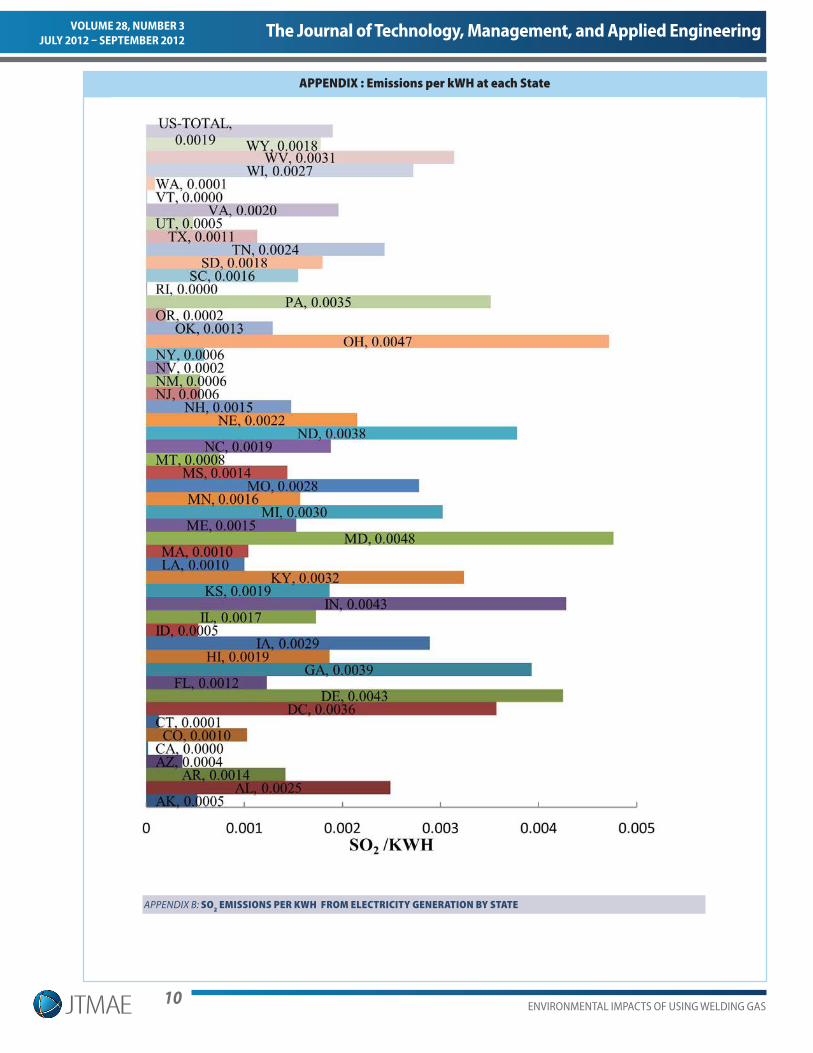
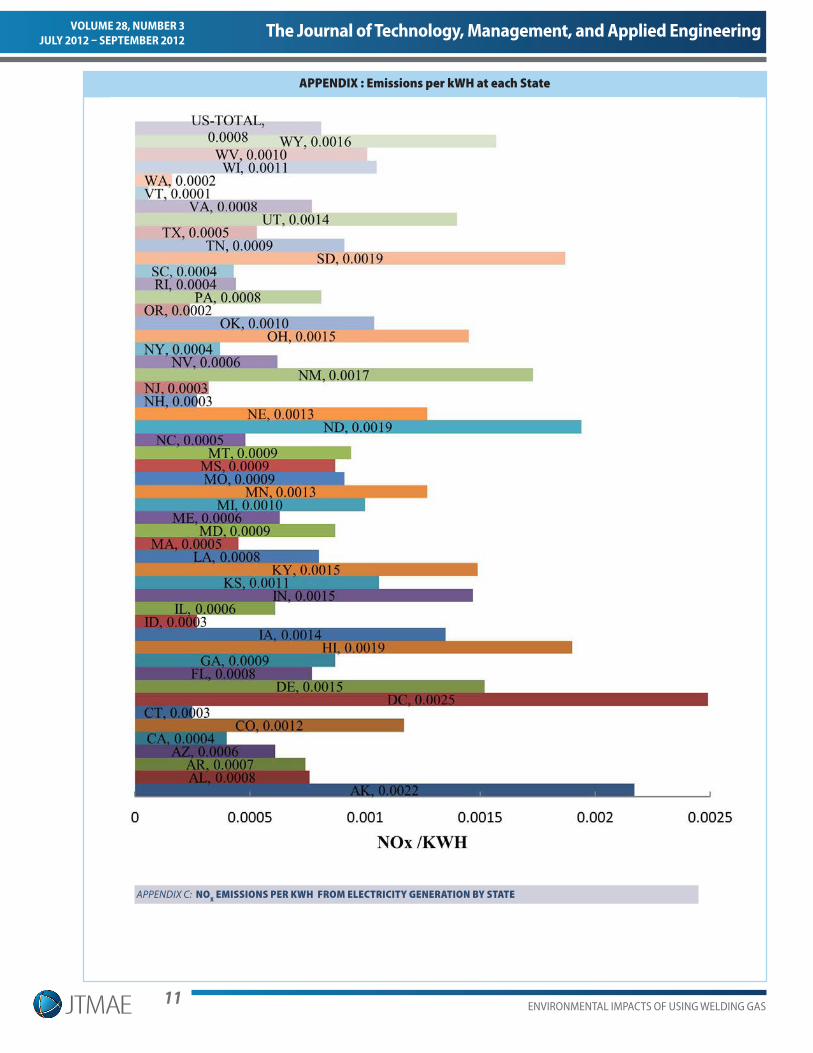
The average emissions per KWH in 2008 are shown in Table 1. The carbon emissions are lower by 7% from 2000 because of the increase of power plants efficiency, wind farms and nuclear power plants. These values are representative of the emissions per KWH and will be higher for industrial states that rely heavily on coal for electricity. Appendix A shows the emissions per state per the CO2 emis-sions range from 1 kgCO2 /KWH in Wyoming to 0.08 in Idaho. Appendix B and C summarize the emissions of sulfur dioxide and nitrous oxide per unit KWH of energy on each state.
CO2/KWH SO2/KWH NOX/KWH
0.6014 0.0019 0.00081
EMISSIONS FROM TRANSPORTATION OF SHIELD GASArgon and carbon dioxide are the two main gases used for shielding purposes in electric welding. These gases form a “shield” or barrier around the molten weld metal to protect it from atmospheric contamination and resulting imperfections. The energy expenditure and subsequent emissions from the separation and capture of these gases for commercial use is negligible since CO2 and Argon gases are produced as a result of other processes. However, the large scale transport of industrial gases bears consideration as it contributes to emis-sions and impacts the environment.The Code of Federal Regulations (40 CFR 600.113) provides values for carbon content per gallon of gasoline and diesel fuel which the EPA uses in cal-culating the fuel economy of vehicles (Singh, 2008).
TABLE 1: AVERAGE EMISSIONS IN US IN 2008
FIGURE 1. UNITED STATES ELECTRIC POWER INDUSTRY NET GENERATION BY FUEL IN 2008

5
The Journal of Technology, Management, and Applied Engineering
The Journal of Technology, Management, and Applied Engineering
VOLUME 28, NUMBER 3 JULY 2012 – SEPTEMBER 2012
ENVIRONMENTAL IMPACTS OF USING WELDING GAS
The gasoline carbon content per gallon is 2,421 grams and the diesel carbon content per gallon is 2,778 grams. To figure the CO2 emissions from a gallon of fuel, the carbon emissions are multiplied by the ratio of the molecular weight of CO2 (m.w.44) to the mo-lecular weight of carbon (m.w.12): 44/12. The CO2 emission from a gallon of gasoline is 8.8 kg/gallon, and CO2 emission from a gallon of diesel is 10.1 kg/gallon (Hutzler, 2002).
Heavy-duty trucks used to transport weld gases have a fuel economy between 4 to 8 mpg depending on the truck load and driving conditions (Cooper et al., 2009). The total weight of gas that can be transported in tank trucks and trailers ranges from 5000kg (11,000Ib) to 20,000kg (44,000Ib). The emission of carbon dioxide due to transporta-tion per 100 mile of travel from production site to utilization is calculated from the average fuel econ-omy of trucks and their capacity. Results presented in figure 2 shows that using large capacity trucks vehicles will result in lower emissions compared to small trucks even with better fuel economy.
Summary of Emissions Associated with Shield Gases The amount of greenhouse gas generated due to the carbon dioxide and argon used in shield gas is primarily due to the production energy and transportation. The amount of emissions from the production and transportation of carbon dioxide and Argon in the US based on 2008 data is summa-rized in Table 3 and 4. The amount of CO2 emitted as a result of the production and transportation of the shield gas has a significant impact on the environment. The reliance of the US on coal as
major source of electric generation (48%) increases the influence of production emissions compared to transportation.
Cryogenic processes used to liquefy CO2 and argon demand large amounts of electricity and account for most of the emissions. Argon gas production requires double the energy expenditure because of the need for cooling to a very low temperature and therefore generates more emissions than liquefying CO2 (Cary and Helzer, 2005)The compressed CO2 consumes more energy and is less efficient than the cryogenic process. The additional cost of electricity and emissions by gas compression is accepted since the production process is simpler and requires less capital invest-ment compared to the cryogenic process. Reducing the gas emissions during the weld process by using an on demand regulator can save up to 50% of the carbon emissions in addition to reducing the cost and electricity.
Functions of Shield Gas RegulatorsThe standard procedure to control shield gas flow rate use a throttle valve. The valve allows for a continuous flow at a fixed rate independent of the welding current. The gas flow rate is preset by the operator depending on the weld configuration. The fixed gas flow rate result in excess usage of shield gas and can affect the weld quality as it provides irregular cooling when the welding current changes particularly at the start and end of the weld, Kim, Kim, and Chin (2006). Automatic shield gas regulators use a variable pulsating flow of gas into the weld zone. The gas flow is synchronized with the welding process al-lowing flow only when the weld current is active. The flow rate is calibrated to change continuously with the magnitude of the current. The saving in the automatic regulator is contributed to the use of
TABLE 2. URBAN FREEWAY EMISSION FACTORS IN (KG/100 MILE) @ 6 MPG AND 10,000KG LOAD.
FIGURE 2. EMISSIONS FROM SHIELD GAS TRANSPORTATION IN CO2 IN (KG/M3/100MILE).
TABLE 3. EMISSIONS OF CO2 USED AS A SHIELD GAS AT STANDARD CONDITIONS IN (KG/M3).
TABLE 4. EMISSIONS OF ARGON USED AS A WELD SHIELD GAS AT STANDARD CONDITIONS IN (KG/M3)

6
The Journal of Technology, Management, and Applied Engineering
The Journal of Technology, Management, and Applied Engineering
VOLUME 28, NUMBER 3 JULY 2012 – SEPTEMBER 2012
ENVIRONMENTAL IMPACTS OF USING WELDING GAS
high frequency pulsating flow that allows the gas to create an insulating cloud in the weld region with less turbulence. The other important feature of a weld regulator is that it synchronizes the gas flow with the weld current, therefore reducing the over-all consumption. The use of automatic shield gas regulators shows a saving range from 40 to 60% of gas during operation as measured during a welding process shown in Figure 3 and 4. The variations in saving are due to weld speed and weld type. A case study to compare the effect of the regulator was done by the investigators at the welding facility of Alamance Community College in North Caro-lina. Samples of straight fillet weld 30cm in length were tested using constant gas flow and regulated gas flow. A sample of the results obtained from the weld current and flow rate monitor presented in Figures 3 and 4.
Figure 3 shows that for the constant flow case the gases are dispensed independent of the weld cur-rent. The regulator in figure 4 maintains a gas flow rate proportional to the weld current. The resulting weld from gas regulator had a more homogenous structure. A comparison of the two cases shows that the average gas flow for the unregulated weld gas was 12.93L/min and 6.11L/min for the regu-lated flow a difference of almost 50%. The analytical model estimated environmental saving in greenhouse gases for a single full time robotic weld process (8 hours x 50 weeks/year) ranges from 326 to 490Kg of CO2 per weld unit per year. Exact savings are dependent on the type of weld, operator setting and location of the shield gas production plant relative to utilization site.
FIGURE 3. UNREGULATED GAS FLOW CONSUMPTION.
FIGURE 4. REGULATED GAS FLOW SYNCHRONIZED WITH THE WELDING CURRENT.
7
The Journal of Technology, Management, and Applied Engineering
The Journal of Technology, Management, and Applied Engineering
VOLUME 28, NUMBER 3 JULY 2012 – SEPTEMBER 2012
ENVIRONMENTAL IMPACTS OF USING WELDING GAS
CONCLUSIONThe study determined the rate of carbon dioxide emissions from weld gas usage. Emissions are es-timated from the energy usage associated with the production and transportation of carbon dioxide and argon gases. The source of energy at different states in the US (Coal, gas, oil , nuclear or renew-able) influence the amount of emissions in the production process. The transportation emissions depend on distance from production to utilization. Adopting new technologies as weld gas regulators can help industries conserve and reduce emissions while maintaining quality welding process. Exact savings are case dependent on the type of weld, op-erator setting, source of energy at production sites
and location relative to the welding plant. Results from the study are limited to the experimental case of straight fillet weld. Further studies will be needed to evaluate regulator performance in industrial setting over longer period of time and for different weld configurations.
ACKNOWLEDGEMENTThe investigators would like to acknowledge the students Laura Bingham and Paul Tsekumah for the literature review and Regula Systems LLC in Greensboro, North Carolina for their support and providing information about weld gas regulators that was very helpful in conducting this study.

8
The Journal of Technology, Management, and Applied Engineering
The Journal of Technology, Management, and Applied Engineering
VOLUME 28, NUMBER 3 JULY 2012 – SEPTEMBER 2012
ENVIRONMENTAL IMPACTS OF USING WELDING GAS
REFERENCES
Asami, T., Tanakat, M. & Yanagisawa, Y. (1996). Energy Consumption in the Recovery of Argon from Purge Gas in Ammonia Synthesis Plant. El-sevier Science Limited. PII: SOOll-2275(96)00082.
Bernstein, J. T. (1999). Cryogenic Argon Produc-tion. Modern Air Separation Plant Technology Conference July 26 - 27, 1999 at Chengdu, People’s Republic of China.
Cary, H. B, & Helzer, S. C. (2005). Modern Welding Technology (6th edition). Prentice Hall, ISBN 0-13-113029-3.
Conti, J., & Sweetnam, G. E. (2008). Emissions of Greenhouse Gases Report. DOE/EIA-0573.
Cook, B., & Hockstad, L. (2011). Inventory of U.S. Greenhouse Gas Emissions and Sinks: 1990 – 2009. U.S. Environmental Protection Agency E PA 430-R-11-005. URL http://www.eia.doe.gov/cneaf/electricity/epa/epa_sum.html.
Cooper, C., Kamakate, F., Reinhart, T., Kromer, M., & Wilson, R. (2009). Reducing Heavy-Duty Long Haul Combination Truck Fuel Consump-tion and CO2 Emissions. International Council On Clean Transportation (ICCT) 2009 Final Report.
Kim L.S., Son, J.S., Kim, H.J., & Chin, B.A. (2006). A Study on Variations of Shield Gas in GTA Weld-ing Using Finite Element. Journal of Achieve-ments in Materials and Manufacturing Engineer-ing, Volume17, Issue 1 – 2, July – August 2006, 249 – 252.
Kim, Y. S., & Eagar, T. W. (1993). Analysis of Metal Transfer in Gas Metal Arc-Welding. Welding Journal 72(6): 269-s to 275-s.
Page, S. C., Williamson, A. G., & Mason, I. G. (2009). Carbon Capture and Storage: Fundamental Ther-modynamics and Current Technology. Energy Policy 37, 3314–3324.
Singh, G. (2008). Additional Combustion and Emis-sion Control Projects. Office of Heavy Vehicle Technology Annual Review Report 2008. U.S. Department of Energy.
Worrell, E., & Galitsky, C.(2004). Energy Efficiency Improvement Opportunities for Cement Making: An ENERGY STAR Guide for Energy and Plant Managers. Environmental Technologies Division. Lawrence Berkeley National Laboratory. January 2004. LBNL-54036.
Yildiz, O. (2008). Electric Power Industry 2008; Year in Review. U.S. Department of Energy.

9
The Journal of Technology, Management, and Applied Engineering
The Journal of Technology, Management, and Applied Engineering
VOLUME 28, NUMBER 3 JULY 2012 – SEPTEMBER 2012
ENVIRONMENTAL IMPACTS OF USING WELDING GAS
APPENDIX : Emissions per kWH at each State
APPENDIX A: CO2 EMISSIONS PER KWH FROM ELECTRICITY GENERATION BY STATE
10
The Journal of Technology, Management, and Applied Engineering
The Journal of Technology, Management, and Applied Engineering
VOLUME 28, NUMBER 3 JULY 2012 – SEPTEMBER 2012
ENVIRONMENTAL IMPACTS OF USING WELDING GAS
APPENDIX : Emissions per kWH at each State
APPENDIX B: SO2 EMISSIONS PER KWH FROM ELECTRICITY GENERATION BY STATE
11
The Journal of Technology, Management, and Applied Engineering
The Journal of Technology, Management, and Applied Engineering
VOLUME 28, NUMBER 3 JULY 2012 – SEPTEMBER 2012
ENVIRONMENTAL IMPACTS OF USING WELDING GAS
APPENDIX : Emissions per kWH at each State
APPENDIX C: NOX EMISSIONS PER KWH FROM ELECTRICITY GENERATION BY STATE