environmental influence on student academic …
TRANSCRIPT
ENVIRONMENTAL INFLUENCE ON STUDENT ACADEMIC
PERFORMANCE OF SECONDARY SCHOOLS
IN WEST POKOT DISTRICT,
KENYA
BY
CHEPSERGONJ.HELLEN
BED/10098/52/DF
A RESEARCH REPORT PRESENTED TO THE INSTITUTE OF OPEN
AND DISTANCE LEARNING AS A PARTIAL FULFILMENT FOR
THE AWARD OF BACHELOR OF ARTS WITH EDUCATION
OF KAMPALA INTERNATIONAL UNIVERSITY
APRIL, 2008

DECLARATION
I, the undersigned, declare that this work is my original work and has
never been presented to any other university for award of any
academic certificate or anything similar to such .
Signature .... ~ ......... ...... ........................ ,
CHEPSERGON J. HELLEN
-rf-f-DATE : .... ~9. ........ ~~~.! .. ~ .L .. 3.P.9.~ ............... .

APPROVAL
This proposal has been under my supervision as a university
supervisor.
SIGNATURE
... ~ : ..................................................... .
MS. NAKAWUNGU FARIDAH
DATE: .J>..tl~l .9.$. ......................................... .
11

DEDICATION
This work is effectionately dedicated to my beloved husband Mark
Kipkurui Yego and our dear children Dorcas, Kosgei, Kibet and Jeruto
for their support patience and understanding during this period of
study not forgetting all those who constantly wished me success.
111

AKNOWLEDGEMENT
My gratitude first goes to God who given me the strength and courage
to undertake this research.
I also owe a lot of appreciation to all those assisted me in carrying out
this research. I am grateful to my supervisor Ms. Faridah Nakawungu
who tirelessly went through my work and inspired me to dig deeper
into the core of the matter. Her kind criticism, patience and
understanding, assisted me a great deal.
I am indebted too, to my relatives Mark Kiptui and Priscillah
Chepsergon who gave me encouragement in time of difficulties.
Thanks also go to all those lecturers in the education Department who
impacted professionalism into my work, I also express my sincere
thanks to Lydia Chebet and Francis Kipchumba who tolerated my
handwriting and typed work neatly.
I wish to thank my family for their love, financial support and
inspiration during my stay in Kampala International University (K.I.U).
Finally, I would like to thank all my respondents and those within a
short notice without which this work would not have been possible.
GOD BLESS YOU ALL
IV
ABSTRACT
This study examined the environmental influence on the student
academic performance in Kapenguria Division, West Pokot District.
The objectives of the study were to identify and analyze the effects of
environmental influence on academic performance. it also aimed at
suggesting measures to remedy the situations.
Qualitative and Quantitative Designs were employed where convenient
sampling was applied to select the five secondary schools used for the
study
The main instruments used in the data collection were the
questionnaires; the data collected was analyzed manually where the
researcher used descriptive and quantitative analysis, which included
percentages and frequencies.
The findings of the study included among others the fact that the
cattle crisis and other environmental factors have negatively
influenced the student's academic performance in secondary schools in
the district.
This research recommended among other a Policy that should be a
strategy towards the improvement of schools in this part of Kenya
highlighted in this paper are addressing mainly to the Kenyan policy
makers in general, and to the Ministry of Education, Science, and
Technology in particular
V
TABLE OF CONTENTS
DECLARATION .................................................................................................................. i
APPROVAL ....................................................................................................................... ii
DlcDICA·1·1ON ................................................................................................................... iii
AKNOWLEDGEMENT .................................................................................................... iv
ABSTRACT ........................................................................................................................ v
TABLE OF CONTENTS ................................................................................................... vi
CHAPTER ONE .................................................................................................................. I
INTRODUCTION ............................................................................................................... I
I. I Background of the study ................................................................................................ I
I .2 Statement of the problem ............................................................................................... 2
I .3 Objectives of the study .................................................................................................. 3
I .3. I General objective ........................................................................................................ 3
I .3.2 Specific objectives will be to; ..................................................................................... 3
I .4 Research questions ........................................................................................................ 3
I .5 scope of the study ......................................................................................................... .4
1.6 Significance of'the study ............................................................................................... 4
CHAPTER TWO ................................................................................................................ 5
REVIEW OF RELATED LITERATURE ....................................................................... 5
2. 0 Introduction ................................................................................................................... 5
2.1 Peace and security and academic performance ............................................................. 5
2.2 Geographical location and academic performance ........................................................ 6
2.3 School buildings and academic perfonnance ................................................................ 7
2.4 Climate and academic performance .............................................................................. 8
CHAPTER TH REE ............................................................................................................ 9
METHODOLOGY .............................................................................................................. 9
3. 0 Introduction ................................................................................................................... 9
VJ

3.1 Research design ............................................................................................................. 9
3.2 Area of study and population ......................................................................................... 9
3 .3 Sample selection .......................................................................................................... IO
3 .4 Source of data .............................................................................................................. 1 O
3.4. I Primary data .............................................................................................................. 10
3.4.2 Secondary data .......................................................................................................... IO
3.5 Data collection methods .............................................................................................. 10
3.5.1 lnstrument ................................................................................................................. 10
3.6 Data analysis and interpretation .................................................................................. 11
3.6.1 Data analysis tools .................................................................................................... 11
3.6.2 Data interpretation .................................................................................................... 11
3.7. Conclusion ................................................................................................................. 11
CHAPTER FOUR ............................................................................................................ 12
PRESENTATION, INTERPRETATION AND DISCUSSION OF THE
FINDINGS ....................................................................................................................... 12
4.0 Introduction ................................................................................................................. 12
4.1 Demographic Characteristics of Respondents ............................................................. 12
4.1. I Sex of Respondents .................................................................................................. 12
4.1.2 Age or Respondents .................................................................................................. 13
4.1.3 Class or Responclents ................................................................................................ 13
4.2 peace and security and academic performance ............................................................ 14
4.2.1 Peace and security is a cause of poor performance .................................................. 14
4.2.2 Cattle rust[ ing and academic performance ............................................................... 14
4.3 School Type and Academic Performance ................................................................... 15
4.3. I Class Work and Academic Perfonnance .................................................................. 15
4.3.2 Examination and Test frequency and academic ....................................................... 16
4.3 .3 Respect of teachers and academic performance ....................................................... I 7
4.3.4 Absenteeism, class dodging and other acts of indiscipline ...................................... 18
4.4 Geographical location and academic performance of ................................................. 19
Vil

CHAPTER FIVE .............................................................................................................. 21
SUMMARY, CONCLUSIONS AND RECOMMENDATIONS ................................ 21
5.1 Introduction ................................................................................................................. 21
5.2 Summary ...................................................................................................................... 21
5.3 Conclusion ................................................................................................................... 22
5.4 Recommendations ....................................................................................................... 23
BIBLIOGRAPHY ............................................................................................................. 25
viii

the district. Secondary education is designed to provide children with
the academic knowledge and skills they need to function successfully
in society and to prepare them to pursue further education, to enter
the work force to be responsible active citizens.
Therefore these factors have led the researcher to study the situation
on environmental influence on student's academic performance in
secondary schools and find out ways electrify the situation.
The researcher has lived and studied almost all her life in the area of
study. She has taught in the area for more than 15 years and
researched on the same area at a diploma level which makes her an
expert in the area.
1.2 Statement of the problem
Environmental influence has been a challenge to many aspects of
education and learning in West Pokot secondary schools. This
challenge was present in the area even before the introduction of the
formal type of educations when schools were introduced by the
missionaries. Although the government has a great plan for bringing
about the desired changes and improvement in the system of
education, it is at this stage having severe constraints in achieving it
fully due to the environmental influence in the district. It's therefore,
quite a challenging factor to student's performance.
2
1.3 Objectives of the study
1.3.1 General objective
The general objective of the study is to investigate environmental
influence and the student's academic performance in West Pokot
Secondary schools, Kenya.
1.3.2 Specific objectives will be to;
1. Determine the profile of respondents of respondents as to; social
demographic data.
1.1 Age
1.2 Gender
1.3 Education level
2. Determine the environmental factors influencing the academic
performance.
2.1.1.1 Peace and security
2.1.1.2 School type
2.1.1.3
2.1.1.4
2.1.1.5
Geographical location
Buildings conditions
Climate
1.4 Research questions
1) What is the profile of respondents in relation to age, gender and
academic performance?
2) What are the environmental factors that influence academic
performance?
3

3) What is the relationship between environmental factors and
academic performance?
1.5 scope of the study
The study was carried out in West Pokot district which is located in the
North western region of Kenya bordering the Republic of Uganda in the
West; Turkana district in the north, and Transnzoa in the south. The
research will be limited to the objectives of the study.
1.6 Significance of the study
This study will benefit the following disciplines:
Will provide information to policy makers in the education Ministry,
administration of schools; teachers, parents and other stakeholders
who will enable them make improvements in education by allocating
schools in performance friendly environment.
It will help students together with their parents to identify schools in
which children will study freely without environmental interference.
It will also contribute to the existing literature about environmental
factors and their effect on academic performance and provoke further
research in this field.
4

CHAPTER TWO
REVIEW OF RELATED LITERATURE
2.0 Introduction
This chapter reviews literature as an account of the knowledge and
ideas that have been established by accredited scholars and experts in
the field of study. It is guided by the objectives of the study outlined in
chapter one
2.1 Peace and security and academic performance
Peace and security are major environmental factors to consider in tile
academic performance. with out peace, students can not settle
however much they are taught in class. Students in pastoral and war
affected areas never settle to their books and are ever wonders in
education (George Omoso, Daily Nation 20, Marcil, 2007). The article
on pastoralists' crisis further strengthens the fact that parents in
pastoral communities do not consider education the first priority. The
"after all even if they do not study" attitudes has affected the kids in
schools since their minds are poisoned at an early stage.
Tile cattle rustling attacks do only affect performance in class terms
only, it also cause many school drop outs and absenteeism level
numbers rise every day.
Environmental research has shown the importance socio-economic
status of the type of school a child attends in influencing educational
outcomes. While research in the US has found that SES variables
continue to influence educational attainment even after controlling for
different school types, tile school context tends to affect the strength
5

of the relationship between SES and educational outcomes (portes and
Maclleod, 1996).
Similarly, in Britain (Sparkes,1999). shows that schools have an
independent effect on student attainment While there is less data
available on this issue in Australia, several studies using the
longitudinal surveys of Australiam Youth have found that students
attending private non-Catholic schools were significantly more likely to
stay on at school than those attending state schools (Long et al, 1999;
Mark et al, 2000). Students from independent private schools are also
more likely to achieve higher end of school scores (Buckingham,
2000). While school-related factors are important, there is again an
indirect link to SES, as private schools are more likely to have a
greater number of students from high SES families, select students
with stronger academic abilities and have greater financial resources.
The school effect is also likely to operate through variation in the
quality and attitudes of teachers (Sparkes, 1999). Teachers at
disadvantaged schools, for instance, often hold low expectations of
their students, which compound the low expectations students and
their parents may also hold (Ruge, 1998).
2.2 Geographical location and academic performance
Students from poor geographical located areas like mountainous and
hilly, areas are more likely to have lower educational outcomes in
terms of academic performance and retention rates that students from
areas where the topography allows near schools construction (Cheers,
1990; HREOC, 2000). Despite an adequate number of educational
facilities in rural and remote areas, school children from these areas
remain disadvantaged by walking long distances to school every day
6
and reach school at late. This causes a delay in curriculum or other
late students being left behind by others. In addition, inequity exists
with regard to the quality of the education that rural students receive,
often as a result of restricted and limited subject choice. Furthermore,
students may also have limited recreational and educational facilities
within their school (HREOC, 2000)
Jonnassen and Grabowki (1993) have proposed a model divulging how
the broad range of student's individual differences can affect learning.
According to these researchers, a geographical metaphor, the mind is
compared to a landscape consisting of peaks and valleys. Just as
topography within a region is highly variable and unique, so is an
individual's mental landscape. The peak in Jonnassen and Grabowki's
metaphor represents trait strengths, whereas the valleys represent the
absence of specific learning abilities. "The relief of an individual's
landscape treats abilities and personality variables as unipolar values.
The particular combination of aptitudes and traits possessed by each
individual is reflected in the individual's cognitive styles, personality,
and learning styles" (Jonnassen and Grabowki, 1993, p. xi). The of
individual difference is analogous to mapping the relief on individual's
mental landscapes.
2.3 School buildings and academic performance
According Cash, C in his material "A study of the Relationship between
school Building Condition, Students Achievement and Behaviour".
(Virginia Polytechnic Institute and State University, 1993), class
environment is one of the artificial environmental major factors that
influence the academic performance. lower educational attainment has
also been found to be associated with children studying from a filthy
7
environment and under trees compared to those permanent built
classes (Sparkes, 1999). This may be due to the effects of
overcrowding, poor access to resources and a lack of social networks,
and in this sense, housing type may also be a measure of
neighborhood influence. A recent Australian study based on 17 1 year
12 students from 10 state schools, found that neighborhood effects
were an important influence on students' educational plans to continue
further, after controlling for a range of individual and family socio
economic characteristics (Jensen and Seltzer, 2000). Measure of the
neighborhood included the level of neighborhood noise environment,
the unemployment rate, an index of educational attainment and the
percentage employed in professional fields. Poor results were due to
spillover effects such as peer group influence, the presence or lack of
job networks and role models or whether the neighborhood variables
were acting as proxies for school quality or housing type.
2.4 Climate and academic performance
According to Lackney .J. A (1999), climate has the ability to affect
academic performance results from the causality between rain,
drought and rustling. The pastoral communities move from place to
place to raid other areas for cattle in response to food shortages in
their communities. All these are among the pastoral communities
which affect academic performance are a result of food and water
crisis.
However to much rainfall negatively affect academic performance in
that too much rainfall lead to destruction of muddy roads, as well as
leaking roofs in mainly bad thatched buildings.
8

CHAPTER THREE
METHODOLOGY
3.0 Introduction
This chapter focuses on the method and procedure used in the study.
This includes the research design, area of study, sample selection,
instrument and procedure of data collection and analysis.
3.1 Research design
Since the study was largely an evaluation one seeking opinions and
attitudes, the researcher used a descriptive research design, adopting
a cross sectional survey. The descriptive survey attempts to picture or
document current conditions or attitudes to describe what exists at the
moment Mouser & Katton (1989). A cross sectional survey design was
particularly chosen because the study is concerned with gathering
perceptions from a cross section of respondents.
The study employed both qualitative and quantitative methods of data
analysis. Most of the findings were analyzed qualitatively. The
quantitative measures and analyses were applied to test the
hypothesis of the study.
3.2 Area of study and population
The study was conducted in West Pokot district, Kenya. The population
of the study included students of the selected schools found in West
Pokot and some of the teachers found in those same schools
9
3.3 Sample selection
Using a convenience sampling technique, a total of sixty (56)
respondents, was selected for the study. The required sample was
arrived at after distributing 90 questionnaires and only 56 six were
returned for the data analysis.
3.4 Source of data
3.4.1 Primary data
The primary data used was from the students and Teachers who
participated in the study.
3.4.2 Secondary data
The secondary data about the environmental factors affecting students
performance comprised of information from the following;
Finance of Education Annual Reports;
West Pokot Education Department annual reports;
Library Publications and Articles;
Media Publications and reports and;
The Internet
3.5 Data collection methods
3.5.1 Instrument
A questionnaire structured to give information by way of content and
purpose will be the main instrument of data collection. A 3-point
Likert Scale (1-agree, 2-Disagree and 3-not sure) was used for the
questionnaire.
10

After the necessary introductions and outlining the objectives of the
study to the authority in the areas of the study, the researcher was
granted permission to carryout this research in the places of interest
for the study. Which the assistance of two (2) trained researcher
assistants, questionnaires were administered to the selected
respondents
3.6 Data analysis and interpretation
3.6.1 Data analysis tools
Data from each questionnaire was categorized and edited for accuracy
and completeness of information. This is to ensure that all questions
are answered. All the questions were pre coiled. After this process, the
statistical packages for social science (SPSS 12.0 version) computer
programme were used to produce frequencies and percentages.
3.6.2 Data interpretation
Analyzed data from the questionnaires were presented in chapter four
( 4) in form of tables showing frequency counts and percentages. This
information was further triangulated with information from secondary
sources for meaningful interpretation and discussion.
3.7. Conclusion
In this chapter, the researcher has presented the research techniques
and procedures adopted in the study.
I I

CHAPTER FOUR
PRESENTATION, INTERPRETATION AND DISCUSSION OF THE
FINDINGS
4.0 Introduction
This chapter is a presentation, interpretation and discussion of the field
results. Results are presented in tables and in form of frequency
counts and percentages.
4.1 Demographic Characteristics of Respondents
4.1.1 Sex of Respondents
During the survey 60 male respondents (67%) were given the
instruments, while 30 female respondents (33%) were given the
instruments. This selection was aiming at fair gender coverage. Out of
90 instruments distributed, 44 were returned by males giving 78.6%
while females returned only 12 which is 21.4% as illustrated by table 2
below.
Table 2: Distribution of the Respondents by Sex
Sex Respondents Percentage
Males 44 79
Females 12 21
Total 56 100
Source: Fieldwork west Pokot District (2008)
12
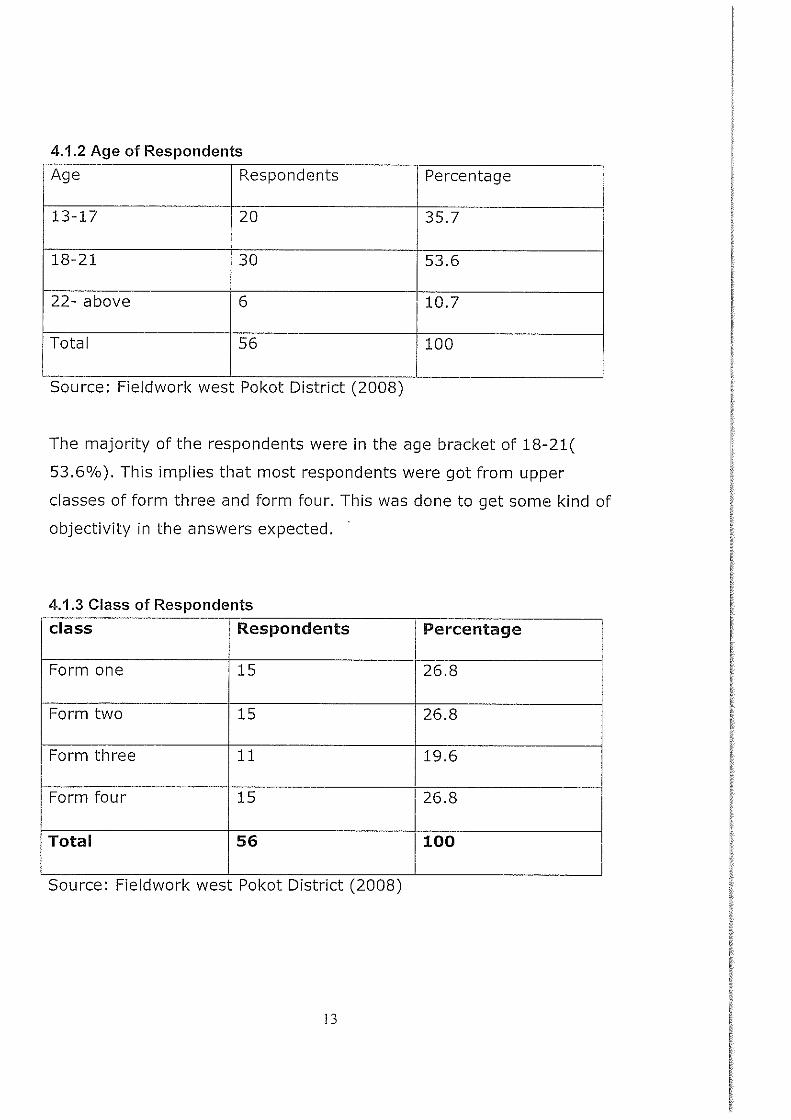
4.1.2 Age of Respondents
Age Respondents Percentage
13-17 20 35.7
18-21 30 53.6
22- above 6 10.7
Total 56 100
Source: Fieldwork west Pokot District (2008)
The majority of the respondents were in the age bracket of 18-21(
53.6%). This implies that most respondents were got from upper
classes of form three and form four. This was done to get some kind of
objectivity in the answers expected.
4.1.3 Class of Respondents
class Respondents Percentage
Form one 15 26.8
Form two 15 26.8
Form three 11 19.6
Form four 15 26.8
Total 56 100
Source: Fieldwork west Pokot District (2008)
13

4.2 peace and security and academic performance
4.2.1 Peace and security is a cause of poor performance
Response Respondents Percentage
Agree 30 53.6
Disagree 20 35.7
Not sure 6 10.7
Total 56 100
Source: Fieldwork west Pokot District (2008)
Out of the total number of respondents who responded to the question
30(53.6%) agreed with the statement that there poor performance is
as a result of the volatile security situation in this part of Kenya.
20(35.7%) did not agree with the statement while only 6(10.7%)
respondents were not sure what really causes there poor academic
performance.
4.2.2 Cattle rustling and academic performance
Response Respondents Percentage
Agree 40 71.4
Disagree 10 17.9
Not sure 6 10.7
Total 56 100
Source: Fieldwork west Pokot District (2008)
14

With regard to cattle rustling 40(71.4%) of the respondents are of the
view that it is the cause of the poor performance of students where as
10(17.9%) Of the respondents think cattle rustling has got nothing to
do with the performance of the students. Only 6(10.7%) of the
respondents are not sure whether cattle rustling has got any thing to
do with students' performance or not.
4.3 School Type and Academic Performance
4.3.1 Class Work and Academic Performance
Response Respondents
Agree 30
Disagree 10
Not sure 16
Total 56
Source: Fieldwork west Pokot District (2008)
15
Percentage
53.6
17.9
26.6
100

class work and academic performance
□ Agree
• Ill Disagree
□ Not sure 1
Out of the total number of respondents interviewed 53.6% of the
respondents agreed with the statement that class work given to
students has got a direst influence of the performance of students.
26% of the respondents where not sure while 17 .6% of the
respondents disagreed that class work has got any thing to do with
students' performance
4.3.2 Examination and Test frequency and academic performance
Response Respondents Percentage
Agree 56 100
Disagree - -
Not sure - -
Total 56 100
Source: Fieldwork west Pokot District (2008)
16

In regard to examination and test frequency all the respondents
agreed that it is responsible for shaping the performance of students in
that the more frequent the students do the tests and examination the
better prepared they become and hence improves their overall
performance.
4.3.3 Respect of teachers and academic performance
Response Respondents Percentage
Agree 50 89.3
Disagree 6 10.7
Not sure - -
Total 56 100
Source: Fieldwork west Pokot District (2008)
$ ..... C: 0 (I)
(I) "C O> C: (ti 0 ~ C. 0 rJ)
(I) ,_
Respect of teachers and academic performance
100
50
0
Agree Disagree
variables
17
Not sure
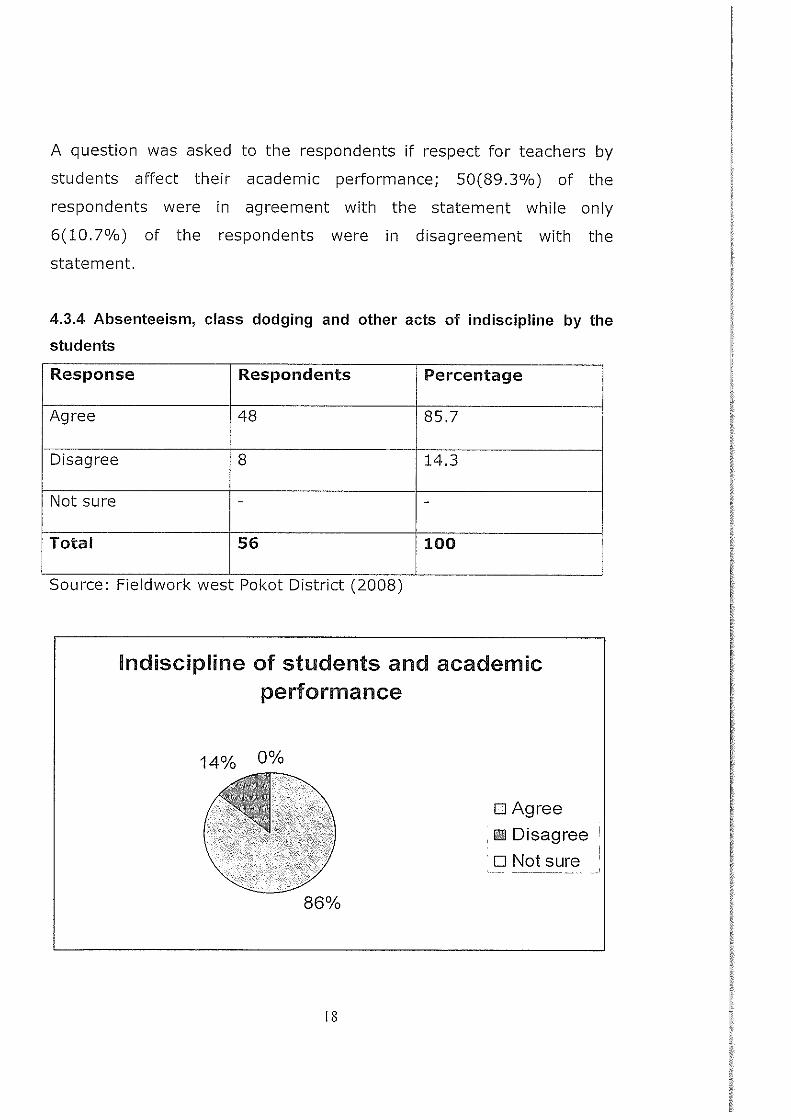
A question was asked to the respondents if respect for teachers by
students affect their academic performance; 50(89.3%) of the
respondents were in agreement with the statement while only
6(10.7%) of the respondents were in disagreement with the
statement.
4.3.4 Absenteeism, class dodging and other acts of indiscipline by the
students
Response Respondents Percentage
Agree 48 85.7
Disagree 8 14.3
Not sure - -
Total 56 100
Source: Fieldwork west Pokot District (2008)
Indiscipline of students and academic performance
14% O%
86%
18
□ Agree
. Ill Disagree
□ Not sure

Almost all respondents agreed that all kinds of indiscipline by the
students are the leading causes of poor academic performance of
students in this part of Kenya. Only 8(14.3%) of the respondents did
not agree with the statement.
4.4 Geographical location and academic performance of students
Response Respondents Percentage
Agree 40 71.4
Disagree 8 14.3
Not sure 8 14.3
Total 56 100
Source: Fieldwork west Pokot District (2008)
geographical location and academic performance
80 ,/!l 70 C: (lJ
60 "C C: 0 50 C.
~ 40
0 30 ! (lJ 20
C') ------- ------1
m 10 ::,!:: 0
0 Agree Disagree
variables
19
!
Not sure

With regard to the geographical location of the school, 40(71.4%) of
the respondents were of the view that the longer the students have to
walk to school the more likely some will miss out on some days and
the poorer such students will perform in class. Also some other
respondents concurred that since some schools are located in
mountainous areas some students find it difficult to go to school and
hence this affects there academic performance.
20

CHAPTER FIVE
SUMMARY, CONCLUSIONS AND RECOMMENDATIONS
5.1 Introduction
In this chapter, the
recommendations made
conclusions from the study and the
are presented. The study used both
qualitative and quantitative methods of analysis.
5.2 Summary
Chapter one gives a background to the study and problem statement,
three objectives and three research questions were given
Chapter two is a review of related literature, and the literature was
reviewed under four themes and linked to the problem under study.
Chapter three explains the method and procedures used in the study
which included the research techniques and design, population and
sample size; sampling method and procedure; sources and types of
data collection methods; data collection instruments and procedures.
Chapter four is a presentation, interpretation and discussion of the
field results. Hence data was analyzed, interpreted and discussed in
line with the study objectives and research questions. While linking to
the existing literature, Results included demographic characteristics,
frequency counts and percentages.
Chapter five presents the summary conclusions and recommendations
to the study.
21

5.3 Conclusion
The aim of this report was to investigate the influence of
environmental factors on the academic performance of students in
West Pokot District of Kenya.
The first question asked in this study was: what is the impact of Peace
and security in the area on the academic performance of students?
According to research findings, it is apparent that the majority of the
respondents thought that the volatile peace situation of the place
impacted negatively on the academic performance of the students in
the area. This forced may of the students ether not to attend school or
go there once or twice in a week. This meant that there academic
grades were always going to be poor compared to their other counter
parts from other regions of Kenya.
My second question was: Does Cattle rustling affect academic
performance of students in the area? The findings reported that indeed
that cattle rustling has got a negative impact on the performance of
students in that children who are supposed to be in school prefer to
take a shorter root of getting wealth by engaging in cattle rustling
instead of going to school. Even a few who choose to go to school are
absent in some days away to practice cattle rustling. This only meant
that the grades in school of these children will always be bad.
This leads me to my third question: Can Class Work affect the
Academic Performance of students? The majority of respondents felt
that actually class work really affects the performance of students in
that those who do not do work in class will most likely will not have
note to read and hence prepare for exams. This will only mean that
22
there performance in exams is not expected to be good since they did
not have what to read to pass the exams.
Finally, my fourth question was on Respect of teachers and academic
performance of students: Here most of the respondents were the
teachers them selves who stressed the importance of discipline and
respect of teachers from the students. This they said leads to students
being attentive in class and hence improves the grades of the student.
5.4 Recommendations
Policy: There should be a strategy towards the improvement of schools
in this part of Kenya highlighted in this paper are addressing mainly to
the Kenyan policy makers in general, and to the Ministry of Education,
Science, and Technology in particular.
Quality assurance programs should seek explicitly to evaluate the link
between the schools' development strategies and the outcomes
achieved. There is need on the part of the Inspectorate to strengthen
the existing mechanisms of ensuring educational quality in rural
Districts of Kenya.
Furthermore, the Inspectorate should look critically at the claim by the
Ministry of Education, Science, and Technology that schools are
concerned primarily with quality assurance. The possibility that they
prevent sufficient attention being given to the improvement process
may not be ruled out.
Additionally, a fundamental pre-requisite for programs and support
services to achieve continuous improvement in their performance is a
system for routinely monitoring the effectiveness of their impact on
23

schools. Such monitoring must be embedded into the existing normal
fabric of the school operating practices and programs.
24
BIBLIOGRAPHY
George Omoso, Daily Nation, March 20, 2007
Helwig R et al. Reading as an access to mathematical problem solving
on multiple choice tests for sixth grade students. Journal of
Educational Research, 1999.
Jonnassen, D. H & Grabowski, B. L. Handbook of individual Difference:
Learning and instruction, Hillsdale, NJ: Laurence Erlbaum, 1993
Lackney, J. A. "Assessing School Facilities for Learning/Assessing the
Impact of the Physical Environment on the Educational Process".
Mississippi State, MISS: Educational Design Institute, 1999.
Wigfield A & Guthrie J. T Relations of children's motivation for reading
to the amount and breadth of their reading. Journal of Educational
Psychology, 1997.
UN PUBLISHED MATERIAL
Cash, C. "A Study of the relationship between School Building
Condition and Student Achievement and Behaviour". Unpublished
doctoral dissertation, Virginia Polytechnic Institute and State
University, 1993.
Hansen, R. The effects of varied text conditions on field independent
and field dependent readers' formation of inferences in expository text.
Doctoral dissertation, University of Wisconsin, 1983.
25

lu. _KAMPALA INTERNATIONAL UNIVE.RSITY
Ggaba Road - Kansanga P.O. Box 20000, Kampala, Uganda Tel: +256- 41- 266813 / +256-41-261634 Fax: +256-41-501974 E-mail: [email protected], Website: www.kiu.ac.ug
OFFICE OF THE DIRECTOR INSTITUTE OF OPEN AND DISTANCE LEARNING ( IODL)
'
DATE: .t··~.I ~ .I .<:q (? ~ -
TO WHOM IT MAY CONCERN:
Dear Sir /Madam,
RE: INTRODUCTION LETTER FOR MS/MRS/MR .~l;-.~~N. Jc_Cff~$<?<oN
The above named· is our student in Institute of Open and Distance Learning
( IODL), pursuing a Diploma/Bachelors degree in Education.
He/She wishes to carry out a research in your Organization on:
~E - · ~ -NV\RoNM~'TA-L INt=LuE--N'c.£ · s ·T Ut:> ~ cs·' · · · · · · · · · · · · · · · · · · • • • • • . . . . .
o ('s.r A-C.A-D G:::-M, c.. Pbt2.k> 12 Nt A-NC£-. ~F 5-E c < ~cHaLs ... .. - .. ·/\ ........................... i . ... .
Case Study:. QF. ·.w~s-"T .. PC?~.q ~ . v.!0"r-<.rC:·Z:; .k~'/A,. The research is a requirement for the award of a Diploma/Bachelors degree in
Education. ' .!!' •
l . Any assistance a~corded to her regarding research will be highly appreciated.
i . . ' .
uvc, ,co~
"Exploring the Heights"
oil
l ' '

APPENDIX II
QUESTIONNAIRE
QUESTIONNAIRE FOR TEACHERS.
Please answer freely and sincerely in the spaces or tick the most appropriate_
alternative where applicable. The information required is only for academic
purposes in a research undertaking. Your response will be taken as confidential
as possible. Thank you.
Age
a) 25-30
c)36-40
Sex
b)31-35
d)Above 40 '----~
a) Male .___ _ __, b) Female
Highest qualification attained.
a)Certificate =~ -==--==--==-~~ b)Diploma c)Degree '----~ d)Other
State whether you are a
a) Trained teacher '------' b)Licensed teacher
Teaching experience
a)1-5yrs
c)11- 15yrs
b)6-10yrs
d)10yrs and above
13

Please indicate the number that is appropriate to you or your situation on the
right side boxes using the rates given below;
Strongly agree Agree Disagree Strongly disagree
4 3 2 1
Item Response
Does environment have a strong impact on the academic
performance?
Does the environment affect teachers teaching schedule?
Is the community perception towards education affected by
the environment they live in?
Does your geographical location affect academic
performance?
Is the area topography related to late coming?
Do the kinds of facilities you have affect performance?
Are the facilities enough to uplift the performance?
Does the climate change in the teaching schedule?
Are cultural traits a hindrance to education?
Which types of insecurities do you normally experience in your school and home
locations? ................................................................................................................. .
····································································································································
14

APPENDIX III
QUESTIONNAIRE FOR STUDENTS
Please kindly spare your valuable time. Respond the following questions. The
information is solely for academic purposes. You are assured that the
information/answers given shall be treated with utmost confidentiality therefore
do not disclose or write your name on the questionnaire.
Background Information
Age
a) 13-17
c) 22-25
Sex
a) Male
Class a) Form one
c) Form three
b) 18-21 [=:J
d) 25 above [=:J
b) Female
b) Form two
d) Form four
Please indicate the number that is appropriate to you or your situation on the
right boxes, using the rates given below.
Strongly agree Agree Disagree Strongly disagree
4 3 2 1
15
1::nv1ronmem: ana acaaem1c perrormance
1 Students regard peace and insecurity a cause for poor
performance.
2 Do cattle rustling affect class performance?
3 Is your community perception towards education affected by
insurgence?
Does your school type affect?
1 Class work
2 Absenteeism
3 Class dodging
4 Acts of vandalism
5 Disrespect for teachers
6 Examination and tests frequency
Does your geographical location affect?
1 School attendance
2 Class work
3 Teachers' attendance
Facilities and building conditions in school and academic performance
1 We have adequate classrooms
2 Big for enough fresh air to facilitate good study conditions
3 The available facilities are adequate for studies
Does climate affect?
1
2
I Teaching
School atteodance I I
16

CATEGORY
AGE
13-20
21-28
28 above
TOTAL
GENDER
MALE
FEMALE
TOTAL
ACADEMIC LEVEL
SECONDARY
COLLEGE/UNIVERSITY
TOTAL
Table 2
APPENDIX IV
PLAN FOR DATA PRESENTATION
Table 1
Profile of respondents
FREQUENCY
25
5
20
50
25
25
50
30
20
50
PERCENTAGE(%)
50
10
40
100
50
50
100
60
40
100
Respondents by occupation
Occupation Frequency Percentage
Students 30 60
Teachers 20 40
Total 50 100
17

' ' ' '-- < 'f '-"-'- 1 F \
·-,
LOCATIOI\I OF THE DISTRICT
'y-~ /
/
I / L.
/ I
TURl<ANA
'( \...,./'.
• I
I
:Y
- Di\t-rit1 Ooundary --.:1n1arndJ!onal Doundorr
\
I
I
I
m,wesr Pof.<..oT
1,:,,000,000
I
.,.
E T ·1-1 I O I' I ll
' ··'- .. -·· .{
MAR5AO\T
·-· .._
' \
\ . . . / !!i~M~P.U -·- ~,,.-·
)
')
·-"'-•· . '-' \
IJI0L0.
-·
\
\
_,
,.-1
I
.._.
' t" 't
I ~. I
. : .... - I
\
'·
',
·~. \
W,\Jlfl
\ ..........
(.
'
1~,
\
..--·. '-
f.{AHDEIU
'
/
/
/
r
-.
:_ ._
I Ii I I . I
\ I I'
! I I! I.
.... ,:; ' I
! ! I I
~ • - ! ! ' I I
I I
:
) I • r.· ======::.-===========----===========......1._ _______ , ______ ---======
··--·----·-