environmental innovation project
TRANSCRIPT
ENVIRONMENTAL INNOVATION PROJECT 6TH – 12TH GRADE
SECONDARY
STUDENT INFORMATION PACKET Revised 2015
Table of Contents
ENVIRONMENTAL INNOVATION
- - - - - - - - - - PUTTING IT ALL TOGETHER - - - - - - - - - - Science Fair Student Information Packet Introduction.......................................................... 1
Helpful Hints for Students .................................................................................................... 2 Developing a Science Fair ENVIRONMENTAL INNOVATION Project ................................. 3 Written Report Content ........................................................................................................ 4-5
Written Report Format ......................................................................................................... 6 Written Report Format for Citing Scientific Research Sources ............................................. 7 Written Report Format for Sources / Bibliography ................................................................ 8-9 Examples of Data Tables and Graphs ................................................................................. 10-11 Display Information .............................................................................................................. 12 Display Size and Set-up for School Site and LBUSD Science Fairs ..................................... 13 Display Labels ..................................................................................................................... 14-15 Display Items ....................................................................................................................... 16 Environmental Innovation Rubric Scoring Guide, 6th – 12th Grade ....................................... 17 Environmental Innovation Targets for Excellence, 6th – 12th Grade ...................................... 18
- - - - - - - - - - STUDENT APPENDICES - - - - - - - - - - Science Topics for Grades 6 -12 ......................................................................................... 1 Science Project Topic Ideas ................................................................................................ 2 Student Timeline (Example)................................................................................................. 3 Materials Sources ................................................................................................................ 4 Community Resources ........................................................................................................ 5 Internet References ............................................................................................................. 6
Library References .............................................................................................................. 7-8 Los Angeles County and CA State Science Fair Reference ................................................. 9
SCIENCE &
1
SCIENCE & ENGINEERING FAIR STUDENT INFORMATION PACKET INTRODUCTION You are surrounded by science. Everything uses some form of science to make it work. Even the chair you sit on was made by a person using tools to build it based on knowledge of science and technology. How did they know what shape to make the saw and how sharp the teeth needed to be to cut wood? How did they know to make one saw for wood and a different one for metal? Why does the wood-cutting saw have larger teeth than the metal-cutting saw? Science is asking questions and finding answers. A science project, simply put, is the process of asking a question about something you are interested in, for which you don’t already know the answer, and then hypothesizing (best-guessing) what the answer might be, researching for information on that topic, experimenting, inventing, surveying, etc., analyzing your results, and coming to a conclusion! The purpose of a science fair is to provide a focus for you, the student, to apply skills and concepts you have learned in science as well as in math, reading, writing, and technology. It gives you a place to use these skills creatively in your own way. What your accomplishment will mean for you: Developing self-reliance Gaining self-confidence Acquiring organizational skills Knowing what the scientific method is and how it can help you. Having your work viewed and recognized by your school and community Everything you need to know about doing a great science project is inside this packet. You’ll be discussing the contents in class. Approximately every two weeks between now and your school science fair, your teacher will give you a Student Timeline for Science Fair Project sheet to check your science project’s progress. The timeline sheet is designed to keep you on target, and keep your teacher and parents informed so that they can help you if needed You must keep this packet, timeline sheets, letters home to parents, and all other information in a separate folder. Your science fair folder should be kept at home unless your teacher asks you to bring it to school. You will find the science fair to be an exciting and rewarding experience. Let’s make this year’s fair the best ever!
2
HELPFUL HINTS FOR STUDENTS
Start EARLY; don’t wait until the last two weeks before it is due.
Plan it out. It will be much more fun if you spread the time out over several days per week or several weekends, and you won’t have to race to get it done!
It might look like this:
Week 1 – Decide on an environmental issue in your neighborhood and or geographic region.
Week 2 – Research current and past attempts to solve the issue, by visiting libraries, universities, making contact with other sources, and checking out web sites.
Week 3 – Define and explain your type of innovation. Show how it solves the problem in a new way. Make an action plan and analyze the costs and feasibility of your innovation.
Week 4 – Implement your plan.
Week 5 – Write your report.
Week 6 – Make your display.
The goal is that you learn to use “the scientific method” or “the engineering design process” through direct experience.
Check with your parent or teacher if you want to use a web site for research. Not all web sites give correct information. Remember:
o Anyone can create a web site; this does not mean its information is correct!
o Make sure the web site is run by a large, recognized group such as a college or organization.
o DOT “org”, “gov” or “edu” are generally trustworthy for accuracy of content.
What is an acceptable science fair project?
o Something that answers a question to which you do not know the answer
o Something you can figure out yourself
o Something you can change somehow, add another variable, and then predict the outcome. That’s an experiment!
What is NOT an acceptable science fair project?
o Reproducing results found on the web is not an experiment; it’s a reproduction.
o A demonstration is not an experiment (i.e., volcano).

3
ENVIRONMENTAL INNOVATION
DEVELOPING A SCIENCE FAIR ENVIRONMENTAL INNOVATION
PROJECT USING THE DESIGN PROCESS For 6th through 12th Grade Caring for our Earth and its many natural resources is a responsibility we all share. We have all seen, heard, and read about issues that threaten the environmental health of our neighborhood, city, and greater geographic area. All environmental innovations begin at a grassroots level with people who take action when they see an opportunity to improve environmental conditions. This project challenges students to identify environmental problems and take steps to solve the problem with innovations, new products, community events, and/or awareness campaigns. I. ENVIRONMENTAL PROBLEM
State the problem as one sentence in the form of a question. Choose an issue in which you are interested in learning more about.
II. PRELIMINARY RESEARCH
Conduct your research at city and college libraries, interview at least one expert in the field, make contact with other resources and people for information, and compare existing methodologies and solutions attempted.
III. INNOVATIVE IDEA Define and explain your type of innovation. The innovation can be a new product, a new or revised process, a promotional project to shine light on an issue and offer a solution, or a community event to share your new solution.
IV. ACTION PLAN
A. Materials/Resources: Plan, collect, and list the materials or resources you will need for your innovation, solution, project, and/or community event. Be specific. It is best to borrow, make, or use inexpensive materials.
B. Procedure/Timeline: Plan and keep track of the steps of your innovation or project carefully and thoroughly. Diagrams are a must, including a timeline (or Flow Map® with dates).
C. Action: Build or carry out your innovation, solution, or project according to your plan. Record what happens as you go through all action steps, explaining and defining as needed.
V. COST AND BENEFIT ANALYSIS
Analyze the monetary and nonmonetary costs associated with the implementation of your plan. VI. REFLECTION
The reflection describes the challenges and rewards of the project. This is also the place to argue for how practical the innovation is.
4
ENVIRONMENTAL INNOVATION WRITTEN REPORT CONTENT
6th - 12th Grade
Scientists always report their research and experiments so that others may benefit from this new knowledge. Some research is reported through published papers while other work is presented at
conventions, on TV, or through the Internet. Your research will be presented through your written report, a project display, and an oral presentation.
ABSTRACT The abstract is a concise summary of your whole project. Others can read the abstract if they do not have time to read your full report. The abstract must not be more than one page long. It includes your environmental problem and a very brief summary of the innovative idea, research, action plan, cost/benefit analysis and reflection. You will write the abstract after your report is complete.
TITLE PAGE
The title page belongs after the abstract. The project title must be centered on the page. See the Written Report Format sheet for information that needs to be in lower right corner.
PURPOSE In one short paragraph, tell why you did your project on the environmental issue you selected. ACKNOWLEDGEMENTS On one page, say “thank you” to all the people who helped you with your project. Include any
family members, teachers, or experts who assisted you with information, materials, or equipment, or participated in some way in your environmental innovation project.
TABLE OF CONTENTS
Divide your Table of Contents into sections as indicated on the Written Report Format sheet. Put the actual page numbers at the bottom of each page after you have finished the final copy of your report.
ENVIRONMENTAL PROBLEM State the problem as one sentence in the form of a question. Be specific.
Your page numbering begins here. PRELIMINARY RESEARCH
This section is a summary in essay form of the information you collected about the history and general background needed by the reader to understand your project. It should include any previous research on your topic. Compare existing methodologies and solutions attempted. Take a stand and argue for innovation. Use notes from books, journals, the Internet, magazines, and interviews. If you are required to cite sources within this section, see Written Report Format for Citing Scientific Research Sources.
5
WRITTEN REPORT CONTENT continued: INNOVATIVE IDEA
Define and explain your type of innovation. The innovation can be a new product, a new or revised process, a promotional project to shine light on an issue and offer a solution, a community event to share your new solution. Use visuals and notes to show how your innovative idea attempts to solve the problem with a new or original approach. The innovation identifies a means to minimize impact and counter an environmental threat or problem.
ACTION PLAN
Steps you took to solve the problem with your innovative idea.
MATERIALS/RESOURCES Be very specific when listing the materials you used for your innovation, solution, project, and community event.
PROCEDURE / TIMELINE Clearly explain each step of the action plan and the necessary supports for success such as resources, materials, partnerships, etc. Include dates, times, names, measurements, locations, and problems you had.
ACTION Record and explain in detail how your solution or innovation worked. Charts, maps, diagrams, and photos are helpful.
COST/BENEFIT ANALYSIS Analyze the monetary and nonmonetary costs and benefits and the impacted parties associated with the implementation of the action plan. Summarize your analysis in the form of readable and understandable data tables, graphs, and drawings. See Examples of Data Tables and Graphs. Write a narrative explanation of your analysis. At the end of your narrative explanation, analyze why you got the results you did. Include all possible variables and errors that may have affected the results of your action plan. State whether your innovation/solution is feasible or not.
REFLECTION
Clearly describes the challenges and rewards of the project and the opportunity for numerous applications. Discuss your personal strengths and possible applications of the innovative idea in other settings. Use evidence from your analysis to argue for the practicality of the innovation. Discuss how you might use what you learned in the future.
SOURCES / BIBLIOGRAPHY List all books, articles, pamphlets, and other communications or sources that you used for
writing your preliminary research section. You must have at least five sources, only one of which may be an encyclopedia. College libraries, as well as city libraries, should be used. Interviews with experts in your field of study are encouraged. See Written Report Format for Sources / Bibliography.
BOXED topics are part of the rubric criteria for judging. The other parts are used only for grading the written report by the teacher.
Rewrite your paper several times to correct errors. Have someone you trust proofread your report before you make the final copy.

6
ENVIRONMENTAL INNOVATION
WRITTEN REPORT FORMAT
Each line with a box () in front of it begins a new page in the report.
Abstract
Title page
Title in middle of page
In lower right-hand comer: Last Name, First Name Grade ___ Period ___ Teacher Name School Name Date (include year)
Purpose Acknowledgements Table of Contents (with page numbers) Environmental Problem (page numbering starts here) Preliminary Research Innovative Idea Action Plan
Materials/Resources Procedure/Timeline Action
Cost/Benefit Analysis Reflection Sources / Bibliography
1. The ORIGINAL report goes inside the report pocket on the display board. 2. A COPY should be kept at home or on the computer.
OTHER POINTS TO REMEMBER:
Type or write on one side of paper. Do not put pages in plastic. Make two copies of your original
report: Original to teacher, one copy you keep, second copy to use on display board (if you wish).
Put report in a store-bought folder with three brads or rings.
Put name, subject, period, date, and teacher’s name on front of the folder in upper right-hand corner.
7
WRITTEN REPORT FORMAT
FOR
CITING SCIENTIFIC RESEARCH SOURCES (When used within the report)
Citations are similar to footnotes in English or history papers but are much easier to include. Citations are included only in the Preliminary Research. Scientific citations are placed within the paper itself, not at the bottom of the page. Citations are placed at the end of a sentence or paragraph that contains the information you gathered from another source.
Rule 1: Cite all sources that refer to information on your species, experiment, or study site.
Rule 2: Cite all sources that back up your conclusions.
Rule 3: Cite anything that brings in a fact not directly taken from your own personal observations or experiment.
Rule 4: When in doubt, cite!
EXAMPLES OF PROPER CITING (author, date) White sharks are known to be maneaters (Halstead, 1954). They are the only shark that regularly preys on marine mammals for food. Some scientists believe that great whites attack humans by mistake: the silhouette of a surfer paddling on a surfboard may be mistaken for a seal sunning on the surface (Ellis, ed., 1987). (editor, date)
VARIATIONS IN SCIENTIFIC CITATIONS One
Author (last name only, date) Example (Bronowski, 1973)
Two Authors
(both last names only, date) Example (Walker and Maben, 1980)
Three or More Authors
(all last names only, date) Example: (Cochran, Wiles, and Kephart, 1975)
No Authors (abbreviated title, date) Example: (Insects of Guam, 1942)
Only an Editor (last name only, abbreviation for editor, date) Example: (Ellis, ed., 1987)
Citing an Expert You Have Spoken to or
Corresponded with
(last name, “personal communications”) Example: (Collins, pers. commun.)
8
WRITTEN REPORT FORMAT
FOR
SOURCES / BIBLIOGRAPHY
Entries in a Sources / Bibliography section of a report are alphabetized by the last name of the author and the date is placed directly afterwards. An entry for which the author is unknown, such as a newspaper article or an unsigned review, is alphabetized by the first word of the title, excluding the articles A, An, and The. Always double-space and indent the second and succeeding lines of each reference. Do not number your references and if you have two or more references by the same author, alphabetize them starting with the most recently written paper.
Books
One Author (last name) (initial) (date) (title) (city) (publisher) Bronowski, J. 1973. The Ascent of Man. Boston: Little & Brown, Inc. 376 pp. (total # of pages only)
By Editor (editor) Ellis, R. (ed.) 1987. Sharks. New York: Wiley, 256 pp.
2 Authors, Local Agency
Walker, R. G., and A. Maben. 1980. The Feeding Ecology of Bats. Guam Div. Aquatic & Wildlife Resources. Mangilao, Guam. 44 pp. (agency) (city) (country) (total # of pages)
Magazines and Scientific Journal Articles
3 Authors, Journal Article
(last name, first initial, then first initial, last names) (date) (title) Cochran, J. A., Wiles, G. and D. Kephart 1975. “Money, Banking, and the Economy”. Fortune 34 (4): 47-55. (vol.) (no.) (exact pages)
No Author, Scientific Bulletin
“Insects of Guam”. 1942. Bernice P. Bishop Museum, Honolulu Bull. 17. (title) (date) (publisher) (bulletin # only)
Newspapers
Basic Entry (author) (exact day) (title) Kristof, Nicholas D. 3 Jan. 1985: “Oil Futures Plunge on OPEC Doubt.” New York Times, Dl3. (publisher) (section #)
9
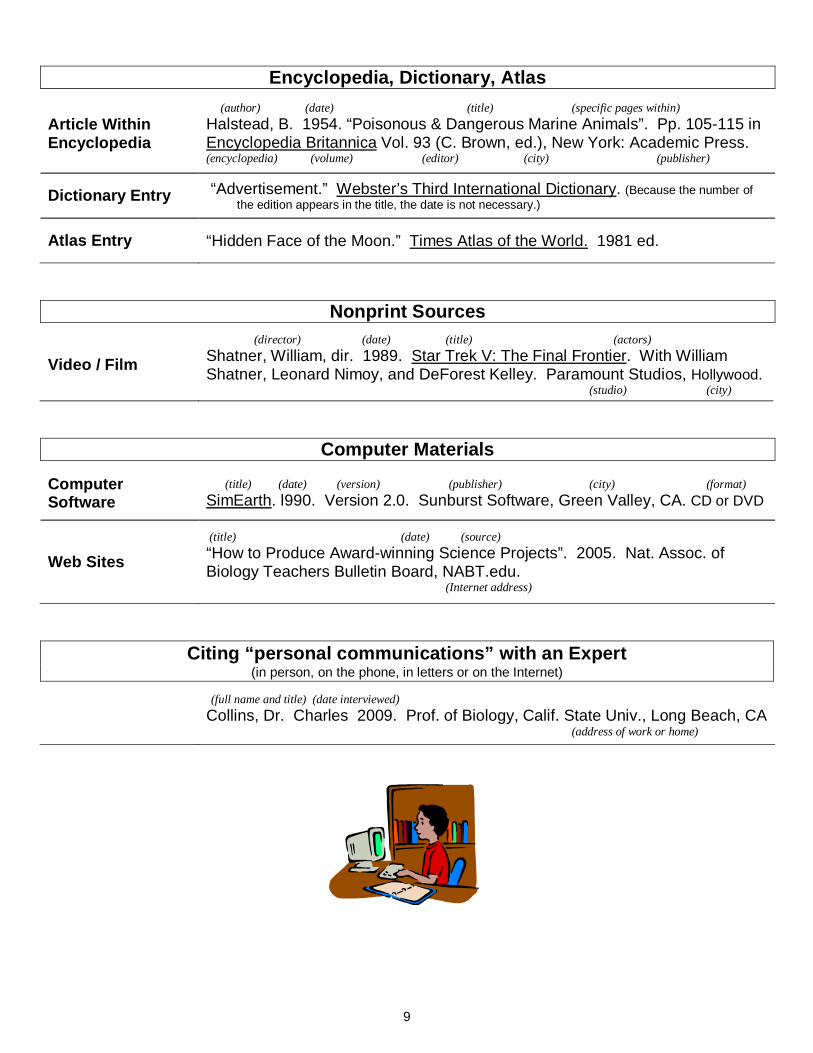
Encyclopedia, Dictionary, Atlas
Article Within Encyclopedia
(author) (date) (title) (specific pages within) Halstead, B. 1954. “Poisonous & Dangerous Marine Animals”. Pp. 105-115 in Encyclopedia Britannica Vol. 93 (C. Brown, ed.), New York: Academic Press. (encyclopedia) (volume) (editor) (city) (publisher)
Dictionary Entry “Advertisement.” Webster’s Third International Dictionary. (Because the number of the edition appears in the title, the date is not necessary.)
Atlas Entry “Hidden Face of the Moon.” Times Atlas of the World. 1981 ed.
Nonprint Sources
Video / Film (director) (date) (title) (actors) Shatner, William, dir. 1989. Star Trek V: The Final Frontier. With William Shatner, Leonard Nimoy, and DeForest Kelley. Paramount Studios, Hollywood. (studio) (city)
Computer Materials
Computer Software
(title) (date) (version) (publisher) (city) (format) SimEarth. l990. Version 2.0. Sunburst Software, Green Valley, CA. CD or DVD
Web Sites (title) (date) (source) “How to Produce Award-winning Science Projects”. 2005. Nat. Assoc. of Biology Teachers Bulletin Board, NABT.edu. (Internet address)
Citing “personal communications” with an Expert (in person, on the phone, in letters or on the Internet)
(full name and title) (date interviewed) Collins, Dr. Charles 2009. Prof. of Biology, Calif. State Univ., Long Beach, CA (address of work or home)

10
EXAMPLES OF DATA TABLES AND GRAPHS
DATA TABLES Experimentation that produced data in the form of numbers (quantitative data) must be placed in data tables. Data tables are needed in reports so that you can display your observations (data) in a clear, organized form. Several data tables may be included on one page, as long as the format is clear and easy to read. Data tables should be created on computers. Each table’s columns need headings above them (titles). Any units needed (centimeters, seconds, grams, etc.) should appear in the labels, not within the table itself. Rows may also need labels to identify a variable. Titles for data tables should go at the top of each table and include a specific description of the kind of data the table contains. In formal reports, each title should also include the date and location where the data was collected. High school reports working with specific animals or plants should include the scientific as well as the common name. Always remember to underline or put into italics all scientific names.
Table 1. Earth’s human population since 1 A.D.
YEAR POPULATION (in billions) 1 0.25
1600 0.45 1700 0.59 1800 0.90 1900 1.55 2000 6.10
Table 2. The number of brine shrimp found in sections of tubing after the shrimp were exposed
to differences in light, pH, or temperature, on October 2, 2009 at Poly High.
VARIABLES SECTION 1
SECTION 2
SECTION 3
SECTION 4
LIGHT 5 (brightest) 15 68 50 (darkest) pH 13 (pH 5.5) 37 (pH 6.7) 76 (pH 7.8) 65 (pH 8.6) TEMPERATURE (oC) 68 (coldest) 64 32 44 (warmest) CONTROL 23 34 21 37
GRAPHS
Graphs are a perfect way to visually present your data. A data table will show your results in numbers, but is often uninteresting or difficult to interpret. A graph can take the same data, make it eye-catching and easily show large differences in your results. Graphs show comparisons between two or more groups or differences between variables. A graph cannot stand alone - it must be preceded by a data table. The data table contains exact details from an experiment that a graph often cannot show. They complement each other: one gives the details, one displays the trends. Label both the X and Y axes and include any units necessary (grams, centimeters, etc.). Data from dependent variables (data that vary as the experiment continues) are placed on the Y axis. Data from independent variables (data that do not vary during the experiment, such as the days of the week, experimental group numbers, and time periods) are placed on the X axis.

11
Graphs must be properly titled. The formal title for a graph goes at the bottom of the graph and like a data table, includes a description of the kind of data the table contains. In formal reports, each title should also include the date and location where the data was collected.
An Example of a BAR GRAPH
(Three variables and the control are graphed)
An Example of a LINE GRAPH (Three variables and the control graphed)
NOTE: The preceding examples show three variables graphed. It is suggested that you use only one variable in your experiment unless you have teacher permission. Also, the preceding examples are of a bar and line graph. As you know, there are other types of graphs that you have seen or made in science and other classes. You may select the type of graph(s) you would like to use in your written report.
The number of brine shrimp preferring various levels of light, pH, and temperature.
(See Table 1 for details.)
# of
brin
e sh
rimp
The number of brine shrimp preferring
various levels of light, pH, and temperature. (See Table 1 for details.)

12
ENVIRONMENTAL INNOVATION
DISPLAY INFORMATION BACKBOARD MATERIALS
The backboard must be sturdy and stand by itself on a table. Foam core-board and cardboard are the best materials. If you need to cut through the sides of your core-board to make “wings”, do not cut all the way through. COLORS
If you need to paint your backboard, enamel paint works best. Do not use water-based paint. Contact paper may also be used. Use a minimum of three contrasting colors on your board. LETTERING
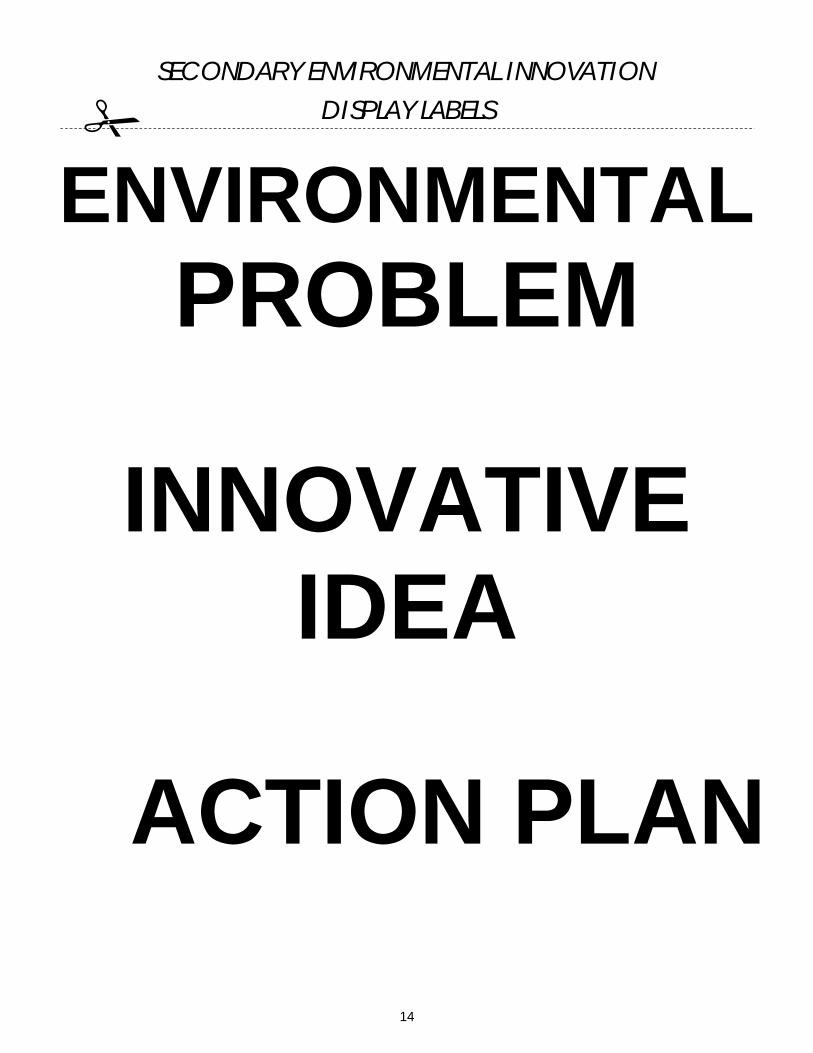
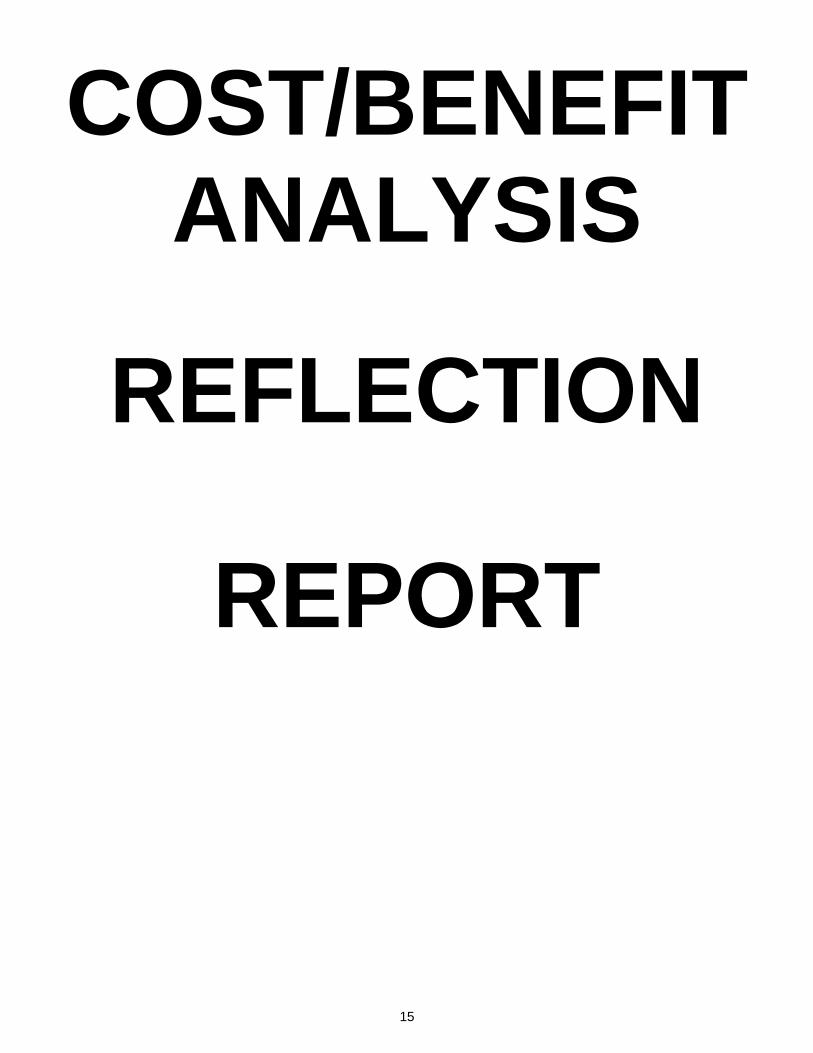
Your title and subtitles may be computer-generated or cut from construction paper. Do not freehand the letters. The title letters should be 3-4 inches high. The subtitle letters should be 1-2 inches high. The subtitles, which are mandatory on the display board, are: Environmental Problem, Innovative Idea, Action Plan, Cost/Benefit Analysis, Reflection, and Report. All items on the display must be glued to the board. Do not use pins, tacks, staples, or tape.
DRAWINGS, PHOTOS AND GRAPHS
Drawings and photos are most useful on the display. Drawings should be drawn in pencil first and then retraced. Drawings should be in color and outlined in thin black felt tip pen. Graphs and charts must be used in the results section. They may be computer-generated. All graphs and charts must have explanatory titles. Graph axes must be labeled. If you have a camera, you should photograph your environmental innovation. A photo of you with your project is encouraged. All photos must be titled. DISPLAY DIMENSIONS
1. When backboard (display portion) is flat, it should be 48 inches wide.
2. Side panels (“wings”) should be l2 to l8 inches.*
3. Height should be no more than 48 inches. REPORT POCKET
There must be a “pocket” on the display to hold your report.
When you have decided what you are going to put on the backboard (display), lay the unglued display on the floor and look at it carefully. Have family and
friends look at it and ask their opinions. Then, you should glue everything into place. Examples of displays will be shown and discussed in class.

13
DISPLAY SIZE & SET-UP FOR SCHOOL SITE AND LBUSD SCIENCE FAIRS
Minimum sizes are suggested, not required.
You may decide where to place these elements on your board.
This example is to give you an idea of what a display board for a project might look like.
DRAWINGS
PHOTOS GRAPHS
14
SECONDARY ENVIRONMENTAL INNOVATION
DISPLAY LABELS
ENVIRONMENTAL PROBLEM
INNOVATIVE IDEA
ACTION PLAN
15
COST/BENEFIT ANALYSIS
REFLECTION
REPORT

16
DISPLAY ITEMS
Part of your display should include something that represents the project and should be placed in front of or on the display board. Depending on the type of project you do, the display items may or may not be the focus of the display. If you cannot decide what to use to represent your project, brainstorm with family, friends, and classmates. Keep in mind that the items you choose will set the tone for your display and must be approved. No part of your display may pose a safety hazard. Do not include harmful chemicals, bacterial cultures, sharp objects, or any source of heat or flames. No live or preserved animals are allowed at the LBUSD district-level science fair, at the Los Angeles County Fair, or at the California State Fair.
Some examples of display items are listed below:
Equipment or materials you have built or used as part of your project or experiment (i.e., an incubator, variously shaped kites, a solar oven, a microscope with slides, etc.)
Models
Artistic representations of your topic (i.e., a large paper maché nose for an odor project,
toothpick bridges for a physics project, or a collage of leaves for a plant project) Samples or specimens
Simulated items such as photos, video, and audio taken while working on your project or
during your experiment. (Keep in mind that use of extension cords requires special permission.)
There are endless possibilities. Be creative! Put on your thinking cap!
17
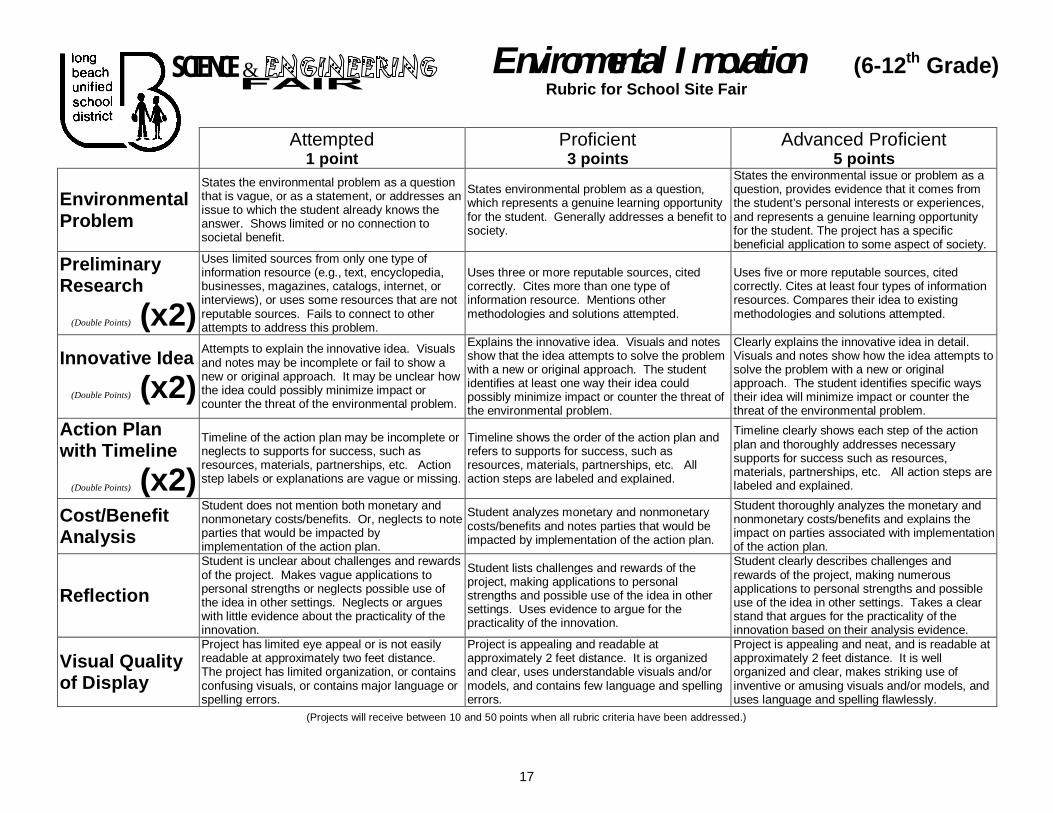
Environmental Innovation (6-12th Grade) Rubric for School Site Fair
Attempted 1 point
Proficient 3 points
Advanced Proficient 5 points
Environmental Problem
States the environmental problem as a question that is vague, or as a statement, or addresses an issue to which the student already knows the answer. Shows limited or no connection to societal benefit.
States environmental problem as a question, which represents a genuine learning opportunity for the student. Generally addresses a benefit to society.
States the environmental issue or problem as a question, provides evidence that it comes from the student’s personal interests or experiences, and represents a genuine learning opportunity for the student. The project has a specific beneficial application to some aspect of society.
Preliminary Research
(Double Points) (x2)
Uses limited sources from only one type of information resource (e.g., text, encyclopedia, businesses, magazines, catalogs, internet, or interviews), or uses some resources that are not reputable sources. Fails to connect to other attempts to address this problem.
Uses three or more reputable sources, cited correctly. Cites more than one type of information resource. Mentions other methodologies and solutions attempted.
Uses five or more reputable sources, cited correctly. Cites at least four types of information resources. Compares their idea to existing methodologies and solutions attempted.
Innovative Idea
(Double Points) (x2)
Attempts to explain the innovative idea. Visuals and notes may be incomplete or fail to show a new or original approach. It may be unclear how the idea could possibly minimize impact or counter the threat of the environmental problem.
Explains the innovative idea. Visuals and notes show that the idea attempts to solve the problem with a new or original approach. The student identifies at least one way their idea could possibly minimize impact or counter the threat of the environmental problem.
Clearly explains the innovative idea in detail. Visuals and notes show how the idea attempts to solve the problem with a new or original approach. The student identifies specific ways their idea will minimize impact or counter the threat of the environmental problem.
Action Plan with Timeline
(Double Points) (x2)
Timeline of the action plan may be incomplete or neglects to supports for success, such as resources, materials, partnerships, etc. Action step labels or explanations are vague or missing.
Timeline shows the order of the action plan and refers to supports for success, such as resources, materials, partnerships, etc. All action steps are labeled and explained.
Timeline clearly shows each step of the action plan and thoroughly addresses necessary supports for success such as resources, materials, partnerships, etc. All action steps are labeled and explained.
Cost/Benefit Analysis
Student does not mention both monetary and nonmonetary costs/benefits. Or, neglects to note parties that would be impacted by implementation of the action plan.
Student analyzes monetary and nonmonetary costs/benefits and notes parties that would be impacted by implementation of the action plan.
Student thoroughly analyzes the monetary and nonmonetary costs/benefits and explains the impact on parties associated with implementation of the action plan.
Reflection
Student is unclear about challenges and rewards of the project. Makes vague applications to personal strengths or neglects possible use of the idea in other settings. Neglects or argues with little evidence about the practicality of the innovation.
Student lists challenges and rewards of the project, making applications to personal strengths and possible use of the idea in other settings. Uses evidence to argue for the practicality of the innovation.
Student clearly describes challenges and rewards of the project, making numerous applications to personal strengths and possible use of the idea in other settings. Takes a clear stand that argues for the practicality of the innovation based on their analysis evidence.
Visual Quality of Display
Project has limited eye appeal or is not easily readable at approximately two feet distance. The project has limited organization, or contains confusing visuals, or contains major language or spelling errors.
Project is appealing and readable at approximately 2 feet distance. It is organized and clear, uses understandable visuals and/or models, and contains few language and spelling errors.
Project is appealing and neat, and is readable at approximately 2 feet distance. It is well organized and clear, makes striking use of inventive or amusing visuals and/or models, and uses language and spelling flawlessly.
(Projects will receive between 10 and 50 points when all rubric criteria have been addressed.)
SCIENCE &
18
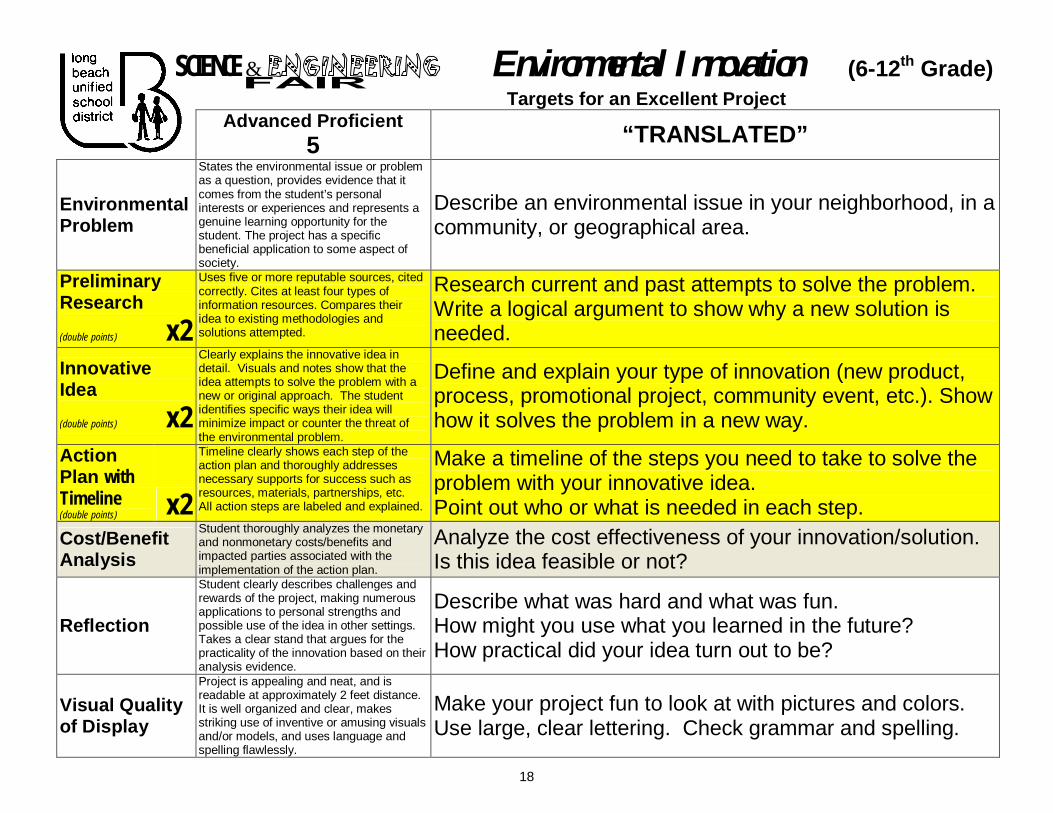
Environmental Innovation (6-12th Grade) Targets for an Excellent Project
Advanced Proficient
5 “TRANSLATED”
Environmental Problem
States the environmental issue or problem as a question, provides evidence that it comes from the student’s personal interests or experiences and represents a genuine learning opportunity for the student. The project has a specific beneficial application to some aspect of society.
Describe an environmental issue in your neighborhood, in a community, or geographical area.
Preliminary Research (double points) x2
Uses five or more reputable sources, cited correctly. Cites at least four types of information resources. Compares their idea to existing methodologies and solutions attempted.
Research current and past attempts to solve the problem. Write a logical argument to show why a new solution is needed.
Innovative Idea (double points) x2
Clearly explains the innovative idea in detail. Visuals and notes show that the idea attempts to solve the problem with a new or original approach. The student identifies specific ways their idea will minimize impact or counter the threat of the environmental problem.
Define and explain your type of innovation (new product, process, promotional project, community event, etc.). Show how it solves the problem in a new way.
Action Plan with Timeline (double points) x2
Timeline clearly shows each step of the action plan and thoroughly addresses necessary supports for success such as resources, materials, partnerships, etc. All action steps are labeled and explained.
Make a timeline of the steps you need to take to solve the problem with your innovative idea. Point out who or what is needed in each step.
Cost/Benefit Analysis
Student thoroughly analyzes the monetary and nonmonetary costs/benefits and impacted parties associated with the implementation of the action plan.
Analyze the cost effectiveness of your innovation/solution. Is this idea feasible or not?
Reflection
Student clearly describes challenges and rewards of the project, making numerous applications to personal strengths and possible use of the idea in other settings. Takes a clear stand that argues for the practicality of the innovation based on their analysis evidence.
Describe what was hard and what was fun. How might you use what you learned in the future? How practical did your idea turn out to be?
Visual Quality of Display
Project is appealing and neat, and is readable at approximately 2 feet distance. It is well organized and clear, makes striking use of inventive or amusing visuals and/or models, and uses language and spelling flawlessly.
Make your project fun to look at with pictures and colors. Use large, clear lettering. Check grammar and spelling.
SCIENCE &