environmental management 0680/12 - papacambridge
TRANSCRIPT
Cambridge IGCSE™
DC (JC/JG) 185352/3© UCLES 2020 [Turn over
This document has 20 pages. Blank pages are indicated.
*7347590160*
ENVIRONMENTAL MANAGEMENT 0680/12
Paper 1 Theory May/June 2020
1 hour 45 minutes
You must answer on the question paper.
No additional materials are needed.
INSTRUCTIONS ● Answer all questions. ● Use a black or dark blue pen. You may use an HB pencil for any diagrams or graphs. ● Write your name, centre number and candidate number in the boxes at the top of the page. ● Write your answer to each question in the space provided. ● Do not use an erasable pen or correction fluid. ● Do not write on any bar codes. ● You may use a calculator. ● You should show all your working and use appropriate units.
INFORMATION ● The total mark for this paper is 80. ● The number of marks for each question or part question is shown in brackets [ ].

2
0680/12/M/J/20© UCLES 2020
Section A
1 A magazine contains a report about the change in sea level around the Solomon Islands.
Five islands in the Pacific Ocean vanish as sea level rises.
Sea level in the Pacific Ocean around the Solomon Islands has been rising by 7 mm per year over the last 20 years.
Five islands that were present in 1947 had completely disappeared by 2014.
Other islands had reduced in size by between 20% and 62% during the same period. Houses are being washed into the sea. On the island of Nuatumbu, only 12 of the 23 houses remain.
The rise in sea level is predicted to continue. A scientist has linked this rise in sea level to carbon dioxide emissions. The scientist said, ‘There is a real risk that entire nations could face extinction.’
(a) Explain how a change in carbon dioxide emissions is linked to a rise in sea level.
...................................................................................................................................................
...................................................................................................................................................
...................................................................................................................................................
...................................................................................................................................................
...................................................................................................................................................
............................................................................................................................................. [3]
(b) (i) Calculate the percentage of houses on the island of Nuatumbu that have been lost due to the rise in sea level.
.......................................................... [2]

3
0680/12/M/J/20© UCLES 2020 [Turn over
(ii) Loss of houses is one problem caused by the rise in sea level.
Suggest other impacts the rise in sea level will have on people living in the Solomon Islands.
...........................................................................................................................................
...........................................................................................................................................
...........................................................................................................................................
...........................................................................................................................................
...........................................................................................................................................
..................................................................................................................................... [3]
[Total: 8]
4
0680/12/M/J/20© UCLES 2020
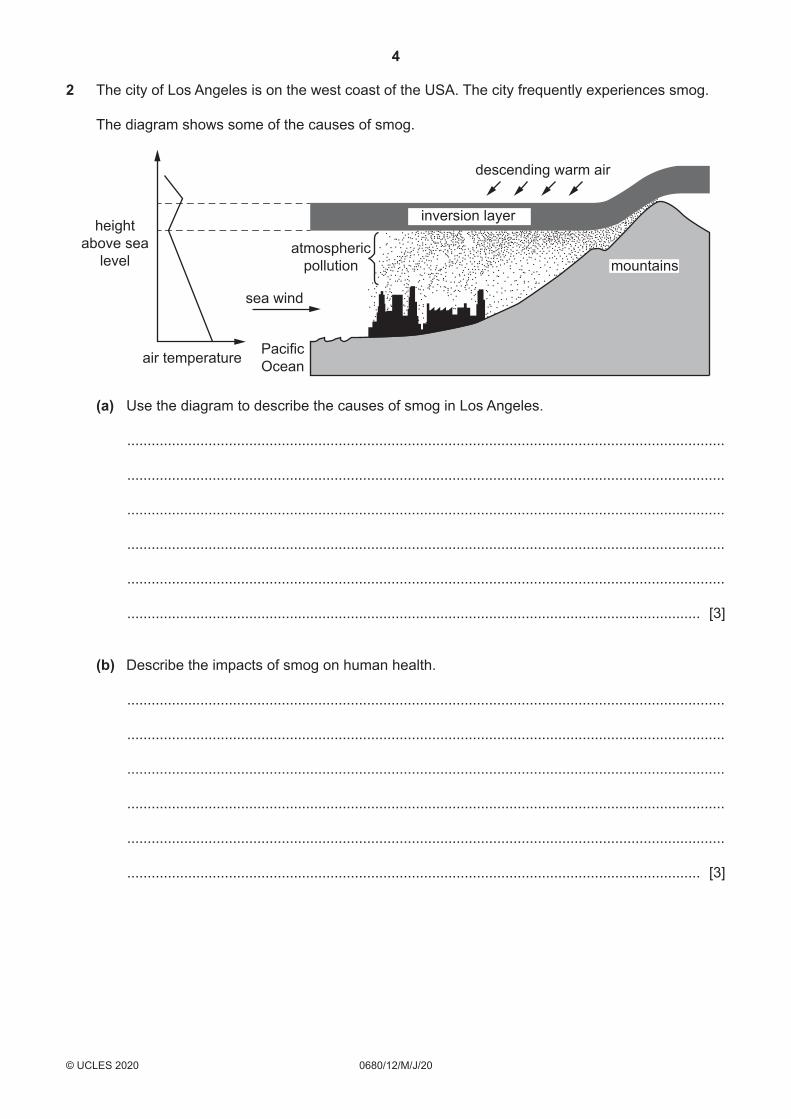
2 The city of Los Angeles is on the west coast of the USA. The city frequently experiences smog.
The diagram shows some of the causes of smog.
heightabove sea
level
air temperature
mountainsatmospheric
pollution
sea wind
inversion layer
descending warm air
PacificOcean
(a) Use the diagram to describe the causes of smog in Los Angeles.
...................................................................................................................................................
...................................................................................................................................................
...................................................................................................................................................
...................................................................................................................................................
...................................................................................................................................................
............................................................................................................................................. [3]
(b) Describe the impacts of smog on human health.
...................................................................................................................................................
...................................................................................................................................................
...................................................................................................................................................
...................................................................................................................................................
...................................................................................................................................................
............................................................................................................................................. [3]

5
0680/12/M/J/20© UCLES 2020 [Turn over
(c) Vehicle emissions are a major cause of smog.
Describe ways the government could reduce emissions from vehicles in Los Angeles.
...................................................................................................................................................
...................................................................................................................................................
...................................................................................................................................................
............................................................................................................................................. [2]
[Total: 8]

6
0680/12/M/J/20© UCLES 2020
3 The map shows the location of the Suez Canal in Egypt.
km0 25
N
Port Said
Mediterranean Sea
SuezCanal
Suez
E G Y P T
to theRed Sea
EgyptEgypt
The Suez Canal was opened in 1869 and links the Mediterranean Sea to the Red Sea. The canal runs from Port Said to Suez.
Using the canal saves a ship approximately 7000 km compared to the previous route.
The government has plans to increase the width and depth of the canal so it can take larger ships. Scientists are concerned that this will increase the risk of marine species from the Red Sea moving to the Mediterranean Sea.

7
0680/12/M/J/20© UCLES 2020 [Turn over
(a) Use the map to estimate the approximate length of the Suez Canal from Port Said to Suez.
Circle the correct answer.
125 km 175 km 225 km 275 km [1]
(b) Suggest reasons why scientists are concerned about marine species from the Red Sea moving to the Mediterranean Sea.
...................................................................................................................................................
...................................................................................................................................................
...................................................................................................................................................
............................................................................................................................................. [2]
(c) In recent years, the water in the middle of the Suez Canal has become more saline.
Suggest one reason for this increased salinity.
...................................................................................................................................................
............................................................................................................................................. [1]
[Total: 4]

8
0680/12/M/J/20© UCLES 2020
Section B
4 The map shows the areas of the world where cases of malaria occur.
Keymalaria cases in 2016malaria cases in 2000 but not in 2016no malaria cases
Equator
Tropic ofCapricorn
Tropic ofCancer
NorthAmerica
SouthAmerica
Africa
EuropeAsia
Oceania
(a) Use the map to describe the change in distribution of malaria cases from 2000 to 2016.
...................................................................................................................................................
...................................................................................................................................................
...................................................................................................................................................
...................................................................................................................................................
...................................................................................................................................................
............................................................................................................................................. [3]
(b) (i) State three methods used to control malaria.
1 ........................................................................................................................................
2 ........................................................................................................................................
3 ........................................................................................................................................ [3]
9
0680/12/M/J/20© UCLES 2020 [Turn over
(ii) A scientist said there were 445 000 deaths due to malaria in 2016. 80% of these deaths occurred in 15 countries.
Calculate how many deaths from malaria occurred in these 15 countries in 2016.
.......................................................... [1]
(iii) Suggest reasons why it is difficult to control malaria in some countries.
...........................................................................................................................................
...........................................................................................................................................
...........................................................................................................................................
...........................................................................................................................................
...........................................................................................................................................
..................................................................................................................................... [3]
[Total: 10]
10
0680/12/M/J/20© UCLES 2020
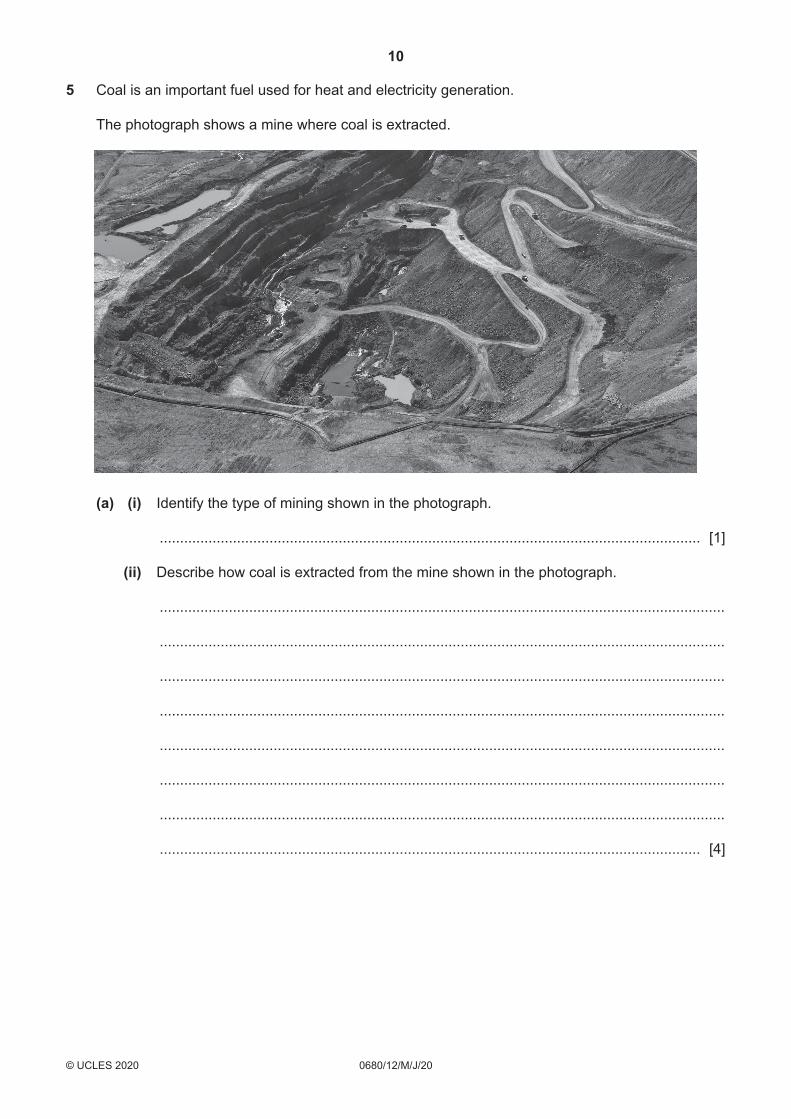
5 Coal is an important fuel used for heat and electricity generation.
The photograph shows a mine where coal is extracted.
(a) (i) Identify the type of mining shown in the photograph.
..................................................................................................................................... [1]
(ii) Describe how coal is extracted from the mine shown in the photograph.
...........................................................................................................................................
...........................................................................................................................................
...........................................................................................................................................
...........................................................................................................................................
...........................................................................................................................................
...........................................................................................................................................
...........................................................................................................................................
..................................................................................................................................... [4]
11
0680/12/M/J/20© UCLES 2020 [Turn over
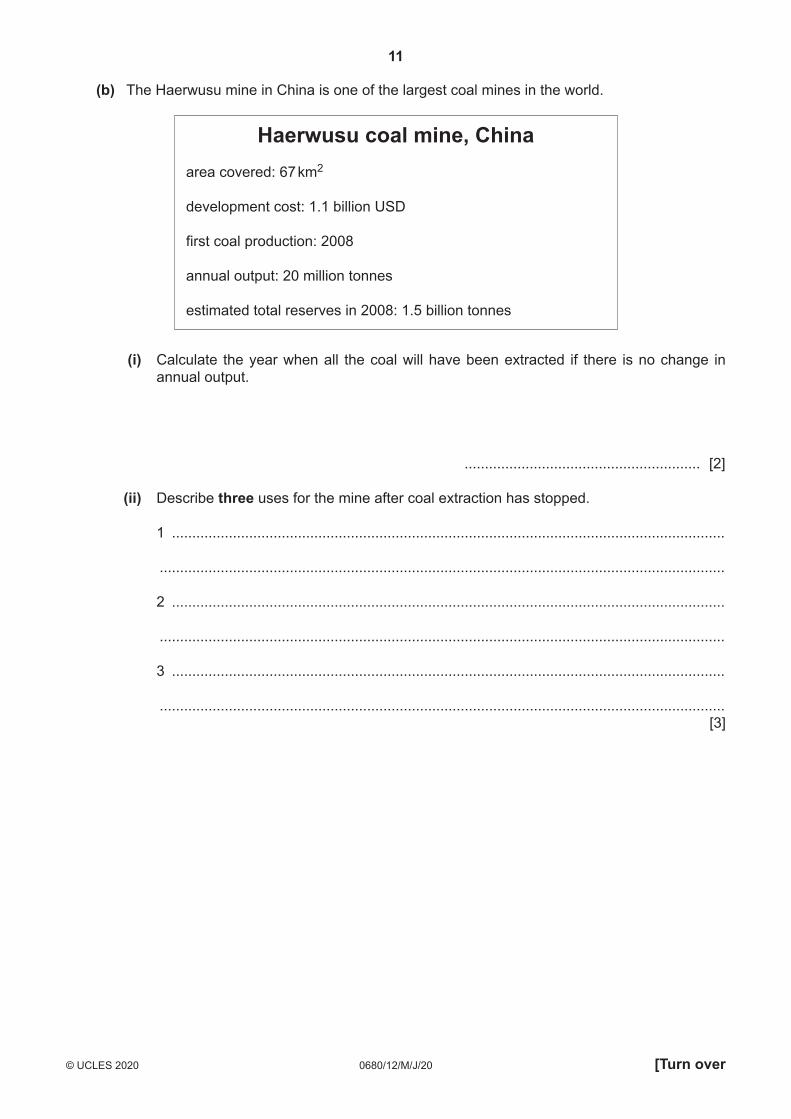
(b) The Haerwusu mine in China is one of the largest coal mines in the world.
Haerwusu coal mine, Chinaarea covered: 67 km2
development cost: 1.1 billion USD
first coal production: 2008
annual output: 20 million tonnes
estimated total reserves in 2008: 1.5 billion tonnes
(i) Calculate the year when all the coal will have been extracted if there is no change in annual output.
.......................................................... [2]
(ii) Describe three uses for the mine after coal extraction has stopped.
1 ........................................................................................................................................
...........................................................................................................................................
2 ........................................................................................................................................
...........................................................................................................................................
3 ........................................................................................................................................
........................................................................................................................................... [3]
12
0680/12/M/J/20© UCLES 2020
(c) Environmentalists are concerned about the use of coal. Some countries continue to use coal in large quantities.
Suggest reasons why these countries are not changing to other fuel sources.
...................................................................................................................................................
...................................................................................................................................................
...................................................................................................................................................
...................................................................................................................................................
...................................................................................................................................................
............................................................................................................................................. [3]
(d) Coal is a non-renewable energy resource.
Name one other non-renewable energy resource.
............................................................................................................................................. [1]
[Total: 14]

13
0680/12/M/J/20© UCLES 2020 [Turn over
BLANK PAGE

14
0680/12/M/J/20© UCLES 2020
6 The table shows the top five exports from Kenya, a country in East Africa, in 2015.
export value / million USD
coffee, tea and spices 1400
plants and cut flowers 717
fuels 426
vegetables 282
clothing 214
total .........................
(a) (i) Complete the table, by calculating the total value for the top five exports from Kenya. [1]
(ii) Draw a bar chart to show the top five exports from Kenya.
[4]

15
0680/12/M/J/20© UCLES 2020 [Turn over
(b) (i) Some plants and cut flowers are grown intensively. This requires large amounts of insecticides to control pests.
Describe two possible effects of the overuse of insecticides on the local environment.
1 ........................................................................................................................................
...........................................................................................................................................
2 ........................................................................................................................................
........................................................................................................................................... [2]
(ii) Two students are discussing the water availability in Kenya.
Suggest strategies for ensuring a reliable supply of water for all people in Kenya.
Use examples to justify your answer.
...........................................................................................................................................
...........................................................................................................................................
...........................................................................................................................................
...........................................................................................................................................
...........................................................................................................................................
...........................................................................................................................................
...........................................................................................................................................
...........................................................................................................................................
...........................................................................................................................................
..................................................................................................................................... [5]
[Total: 12]
Big farms must have water to grow plants for export. This could affect the water available for local people.
It’s possible for these big farms and local people to both have all the water they need. It just takes a bit of planning.

16
0680/12/M/J/20© UCLES 2020
7 The diagram shows part of a food web in an ocean.
killer whale
elephant seal
squid
zooplankton
phytoplankton
codkrill
leopard sealpenguin
not to scale
(a) (i) Name a secondary consumer shown on this food web.
..................................................................................................................................... [1]
(ii) Use the food web to complete this food chain.
........................................ krill ........................................ ........................................ [2]
17
0680/12/M/J/20© UCLES 2020 [Turn over
(iii) Describe the impacts on this food web if the cod population decreases.
...........................................................................................................................................
...........................................................................................................................................
...........................................................................................................................................
...........................................................................................................................................
...........................................................................................................................................
...........................................................................................................................................
...........................................................................................................................................
..................................................................................................................................... [4]
(iv) Explain how energy is lost between trophic levels in a food chain.
...........................................................................................................................................
...........................................................................................................................................
...........................................................................................................................................
..................................................................................................................................... [2]
(b) Humans catch and eat cod.
Describe strategies to ensure a sustainable supply of cod as a food source for humans.
...................................................................................................................................................
...................................................................................................................................................
...................................................................................................................................................
...................................................................................................................................................
...................................................................................................................................................
...................................................................................................................................................
...................................................................................................................................................
............................................................................................................................................. [4]
[Total: 13]

18
0680/12/M/J/20© UCLES 2020
8 Bulgaria is a country in Europe.
The graph shows the population of Bulgaria between 1890 and 2015. The graph is incomplete.
0
1
2
3
4
5
6
7
8
9
10
1890
1895
1900
1905
1910
1915
1920
1925
1930
1935
1940
1945
1950
1955
1960
1965
1970
1975
1980
1985
1990
1995
2000
2005
2010
2015
year
population/ million
(a) (i) Complete the graph using the information in the table.
year population/ million
1890 3.15
1895 3.30
1900 3.75
[2]
(ii) Describe the trends in the population of Bulgaria between 1890 and 2015.
...........................................................................................................................................
...........................................................................................................................................
...........................................................................................................................................
..................................................................................................................................... [2]

19
0680/12/M/J/20© UCLES 2020 [Turn over
(b) Bulgaria is a more economically developed country (MEDC).
Which population pyramid, A, B or C, best represents the population of Bulgaria in 2016?
0-45-9
10-1415-1920-2425-2930-3435-3940-4445-4950-5455-5960-6465-6970-7475-7980-8485-8990-9495-99100+
0-45-9
10-1415-1920-2425-2930-3435-3940-4445-4950-5455-5960-6465-6970-7475-7980-8485-8990-9495-99100+
0-45-9
10-1415-1920-2425-2930-3435-3940-4445-4950-5455-5960-6465-6970-7475-7980-8485-8990-9495-99100+
population
male female
agegroup
population
male female
agegroup
population
male female
agegroup
A B
C
population pyramid ..................... [1]
PLEASE TURN OVER FOR QUESTION 8(c)

20
0680/12/M/J/20© UCLES 2020
Permission to reproduce items where third-party owned material protected by copyright is included has been sought and cleared where possible. Every reasonable effort has been made by the publisher (UCLES) to trace copyright holders, but if any items requiring clearance have unwittingly been included, the publisher will be pleased to make amends at the earliest possible opportunity.
To avoid the issue of disclosure of answer-related information to candidates, all copyright acknowledgements are reproduced online in the Cambridge Assessment International Education Copyright Acknowledgements Booklet. This is produced for each series of examinations and is freely available to download at www.cambridgeinternational.org after the live examination series.
Cambridge Assessment International Education is part of the Cambridge Assessment Group. Cambridge Assessment is the brand name of the University of Cambridge Local Examinations Syndicate (UCLES), which itself is a department of the University of Cambridge.
(c) ‘Improved health and education are the best ways to manage the population size of a country.’
How far do you agree with this statement? Use examples to support your answer.
...................................................................................................................................................
...................................................................................................................................................
...................................................................................................................................................
...................................................................................................................................................
...................................................................................................................................................
...................................................................................................................................................
...................................................................................................................................................
...................................................................................................................................................
...................................................................................................................................................
...................................................................................................................................................
...................................................................................................................................................
...................................................................................................................................................
...................................................................................................................................................
...................................................................................................................................................
............................................................................................................................................. [6]
[Total: 11]