environmental monitoring survey of oil and gas fields in ... · environmental monitoring survey of...
TRANSCRIPT
Environmental monitoring survey of oil and gas fields in Region II, 2000
APN-411.1890 -1

Rapporttittel /Report title
Environmental monitoring survey of oil and
gas fields in Region II, 2000
Forfatter(e) / Author(s) Akvaplan-niva rapport nr / report no: Mannvik, Hans-Petter APN-411.1890 Pettersen, Anita Dato / Date: Lyngmo, Vegard 21/03/01 Mikkola, Frid Antall sider / No. of pages Lie Gabrielsen, Kjersti 389 + Appendix (CD-ROM) Distribusjon / Distribution Begrenset/Restricted Oppdragsgiver / Client Oppdragsg. ref. / Client ref. Statoil Norsk Hydro Elf Petroleum Esso Norge
Karl Henrik Bryne Sami Wakili Ulf Einar Moltu Ingvild Skare
Sammendrag / Summary
An environmental monitoring survey was carried out in Region II in the central North Sea. This report presents the results from the chemical and biological analyses performed on samples from a total of 230 stations at 15 fields and 9 regional stations in the area. The status of the conditions in the region is given at the end of the report. Emneord: Key words:
Region II Region II Hydrokarboner Hydrocarbons Tungmetaller Heavy metals Makrofauna Macro fauna Prosjektleder / Project manager Kvalitetskontroll / Quality control
Hans-Petter Mannvik Sabine Cochrane
© 2001 Akvaplan-niva AS
9296 Tromsø, Norway Tel. +47 77 75 03 00 Fax +47 77 75 03 01 www.akvaplan.com

Environmental monitoring survey of oil and gas fields in Region II, 2000 Akvaplan-niva report: APN-411.1890 -1
Page V
Preface The report presents the results from the environmental monitoring survey of Region II. After the introduction and chapters describing the fieldwork and methods used, the results of the regional stations are presented and discussed. In the following chapters each field is described separately with details on its history, sampling network and a presentation and discussion of the results in relation to previous investigations and results form the regional stations. A status of environmental conditions and regional trends is given as a separate chapter, followed by a presentation of the survey conclusions and recommendations for follow-up.
In addition to this main report, summary reports in English and Norwegian are available. All background data are available in the appendices on the CD-ROM included with this report.
Akvaplan-niva AS carried out the environmental monitoring survey in co-operation with the following research institutes and consultancies:
• Unilab Analyse AS, Tromsø • GeoGruppen AS, Tromsø • NIVA, Oslo
The work was commissioned by Statoil (Contract Agreement no. VMS135236) on behalf of the operators in this region.
Statoil Glitne, Sleipner Øst and Sleipner Vest fields Norsk Hydro Varg and Heimdal fields Elf Petroleum Frigg, Nordøst Frigg, Øst Frigg, Lille Frigg and Frøy fields Esso Norge Ringhorne, Sigyn, Balder, Jotun and Odin fields
Tromsø 20 March 2001 Akvaplan-niva AS
Hans-Petter Mannvik Jos Kögeler Project co-ordinator Acting director
Environmental monitoring survey of oil and gas fields in Region II, 2000 Akvaplan-niva report: APN-411.1890 -1
Page VI
Acknowledgments The following persons were involved in the project:
Field work K.-R. Fredriksen, GeoGruppen AS, A. Gunneriussen, Akvaplan-niva AS, V. Lyngmo, Unilab Analyse AS, H.-P. Mannvik, Akvaplan-niva AS, F. Mikkola, Akvaplan-niva AS, R. Palerud, Akvaplan-niva AS, L. Steinnes, Unilab Analyse AS.
Sorting biological materiale K. Dale, Akvaplan-niva AS, C. Hübner, Akvaplan-niva AS, S. Johannesen, Akvaplan-niva AS, R. Karlberg, Akvaplan-niva AS, F. Lundenes, Akvaplan-niva AS, A.G. Moen, Akvaplan-niva AS, R. Remen, Akvaplan-niva AS, V. Savinov, Akvaplan-niva AS, T. Skotvold, Akvaplan-niva AS, J.H. Thorarinson, Akvaplan-niva AS, T. Velvin, Akvaplan-niva AS.
Identification biological materiale S. Cochrane, Akvaplan-niva AS, B. Gulliksen, Akvaplan-niva AS, H.-P. Mannvik, Akvaplan-niva AS, E. Oug, NIVA, R. Palerud, Akvaplan-niva AS, A. Sikorski, Akvaplan-niva AS, R. Velvin, Akvaplan-niva AS, A. Warèn, Riksmuseet, Stockholm.
Organic chemical analyses B. Altermark, K. Lie Gabrielsen, M. Johnsen Gaski, V. Lyngmo, T. L. Gamst Moen, B. Ringstad Olsen, A. Pettersen, L. Steinnes, H. Toresen, Unilab Analyse AS.
Metal analyses B. Lauritzen, NIVA.
Physical analysis I. Bottolfsen, GeoGruppen AS, K.R. Fredriksen, GeoGruppen AS.
Computer analysis (biology) M. Melhus, Akvaplan-niva AS, L. Ringstad Olsen, Akvaplan-niva AS.
Computer analyses (chemistry) K. Lie Gabrielsen, M. Johnsen Gaski, V. Lyngmo, T. L. Gamst Moen, A. Pettersen, L. Steinnes, Unilab Analyse AS.
Reporting physical sections H.-P. Mannvik, Akvaplan-niva AS, F. Mikkola, Akvaplan-niva AS.
Reporting chemical sections A. Pettersen, Unilab Analyse AS, V. Lyngmo, Unilab Analyse AS, K. Lie Gabrielsen, Unilab Analyse AS.
Reporting biological sections H.-P. Mannvik, Akvaplan-niva AS, F. Mikkola, Akvaplan-niva AS.
Appendix preparation (CD-ROM) H.-P. Mannvik, Akvaplan-niva AS, F. Mikkola, Akvaplan-niva AS.
We also like to thank the master and crew of the vessel “Seaway Invincible”.
Environmental monitoring survey of oil and gas fields in Region II, 2000 Akvaplan-niva report: APN-411.1890 -1
Page VII
Table of Content
1 SUMMARY ..................................................................................................................... 1-1
2 INTRODUCTION............................................................................................................ 2-1
3 METHODS ...................................................................................................................... 3-3 3.1 Station network............................................................................................................ 3-3 3.2 Fieldwork..................................................................................................................... 3-4 3.3 Sampling and sample treatment .................................................................................. 3-4 3.4 Sample analyses .......................................................................................................... 3-4
3.4.1 Physical analyses.................................................................................................... 3-4 3.4.2 Chemical analyses .................................................................................................. 3-5 3.4.3 Biological analyses................................................................................................. 3-6 3.4.4 Quality control........................................................................................................ 3-7 3.4.5 Storage of sample material ..................................................................................... 3-8
4 REGIONAL AND REFERENCE STATIONS ............................................................... 4-1 4.1 Introduction ................................................................................................................. 4-1 4.2 Results and discussion................................................................................................. 4-1
4.2.1 Physical characteristics .......................................................................................... 4-1 4.2.2 Chemical characteristics......................................................................................... 4-3 4.2.3 Biology................................................................................................................. 4-13
4.3 Summary and conclusions......................................................................................... 4-19
5 FRIGG FIELD ................................................................................................................. 5-1 5.1 Introduction ................................................................................................................. 5-1 5.2 Results and discussion................................................................................................. 5-1
5.2.1 Physical characteristics .......................................................................................... 5-1 5.2.2 Chemical characteristics......................................................................................... 5-3 5.2.3 Biology................................................................................................................... 5-8
5.3 Summary and conclusions......................................................................................... 5-15
6 NORDØST FRIGG FIELD.............................................................................................. 6-1 6.1 Introduction ................................................................................................................. 6-1 6.2 Results and discussion................................................................................................. 6-1
6.2.1 Physical characteristics .......................................................................................... 6-1 6.2.2 Chemical characteristics......................................................................................... 6-2 6.2.3 Biology................................................................................................................... 6-6
6.3 Summary and conclusions......................................................................................... 6-12
7 ØST FRIGG FIELD......................................................................................................... 7-1 7.1 Introduction ................................................................................................................. 7-1 7.2 Results and discussion................................................................................................. 7-1
7.2.1 Physical characteristics .......................................................................................... 7-1 7.2.2 Chemical characteristics......................................................................................... 7-3 7.2.3 Biology................................................................................................................... 7-9
7.3 Summary and conclusions......................................................................................... 7-15
Environmental monitoring survey of oil and gas fields in Region II, 2000 Akvaplan-niva report: APN-411.1890 -1
Page VIII
8 LILLE FRIGG FIELD ..................................................................................................... 8-1 8.1 Introduction ................................................................................................................. 8-1 8.2 Results and discussion................................................................................................. 8-1
8.2.1 Physical characteristics .......................................................................................... 8-1 8.2.2 Chemical characteristics......................................................................................... 8-3 8.2.3 Biology................................................................................................................... 8-9
8.3 Summary and conclusions......................................................................................... 8-15
9 FRØY FIELD................................................................................................................... 9-1 9.1 Introduction ................................................................................................................. 9-1 9.2 Results and discussion................................................................................................. 9-1
9.2.1 Physical characteristics .......................................................................................... 9-1 9.2.2 Chemical characteristics......................................................................................... 9-3 9.2.3 Biology................................................................................................................. 9-10
9.3 Summary and conclusions......................................................................................... 9-17
10 RINGHORNE FIELD.................................................................................................... 10-1 10.1 Introduction ............................................................................................................... 10-1 10.2 Results and discussion............................................................................................... 10-1
10.2.1 Physical characteristics ...................................................................................... 10-1 10.2.2 Chemical characteristics..................................................................................... 10-3 10.2.3 Biology............................................................................................................. 10-11
10.3 Summary and conclusions....................................................................................... 10-19
11 SIGYN FIELD ............................................................................................................... 11-1 11.1 Introduction ............................................................................................................... 11-1 11.2 Results and discussion............................................................................................... 11-1
11.2.1 Physical characteristics ...................................................................................... 11-1 11.2.2 Chemical characteristics..................................................................................... 11-3 11.2.3 Biology............................................................................................................... 11-7
11.3 Summary and conclusions....................................................................................... 11-14
12 BALDER FIELD ........................................................................................................... 12-1 12.1 Introduction ............................................................................................................... 12-1 12.2 Results and discussion............................................................................................... 12-1
12.2.1 Physical characteristics ...................................................................................... 12-1 12.2.2 Chemical characteristics..................................................................................... 12-3 12.2.3 Biology............................................................................................................. 12-12
12.3 Summary and conclusions....................................................................................... 12-22
13 JOTUN FIELD............................................................................................................... 13-1 13.1 Introduction ............................................................................................................... 13-1 13.2 Results and discussion............................................................................................... 13-1
13.2.1 Physical characteristics ...................................................................................... 13-1 13.2.2 Chemical characteristics..................................................................................... 13-3 13.2.3 Biology............................................................................................................. 13-10
13.3 Summary and conclusions....................................................................................... 13-16
Environmental monitoring survey of oil and gas fields in Region II, 2000 Akvaplan-niva report: APN-411.1890 -1
Page IX
14 ODIN FIELD ................................................................................................................. 14-1 14.1 Introduction ............................................................................................................... 14-1 14.2 Results and discussion............................................................................................... 14-1
14.2.1 Physical characteristics ...................................................................................... 14-1 14.2.2 Chemical characteristics..................................................................................... 14-3 14.2.3 Biology............................................................................................................... 14-9
14.3 Summary and conclusions....................................................................................... 14-15
15 VARG FIELD ................................................................................................................ 15-1 15.1 Introduction ............................................................................................................... 15-1 15.2 Results and discussion............................................................................................... 15-1
15.2.1 Physical characteristics ...................................................................................... 15-1 15.2.2 Chemical characteristics..................................................................................... 15-3 15.2.3 Biology............................................................................................................... 15-8
15.3 Summary and conclusions....................................................................................... 15-15
16 HEIMDAL FIELD ......................................................................................................... 16-1 16.1 Introduction ............................................................................................................... 16-1 16.2 Results and discussion............................................................................................... 16-1
16.2.1 Physical characteristics ...................................................................................... 16-1 16.2.2 Chemical characteristics..................................................................................... 16-3 16.2.3 Biology............................................................................................................... 16-9
16.3 Summary and conclusions....................................................................................... 16-15
17 GLITNE FIELD ............................................................................................................. 17-1 17.1 Introduction ............................................................................................................... 17-1 17.2 Results and discussion............................................................................................... 17-1
17.2.1 Physical characteristics ...................................................................................... 17-1 17.2.2 Chemical characteristics..................................................................................... 17-2 17.2.3 Biology............................................................................................................... 17-7
17.3 Summary and conclusions .......................................................................................... 17-14
18 SLEIPNER VEST FIELD.............................................................................................. 18-1 18.1 Introduction ............................................................................................................... 18-1 18.2 Results and discussion............................................................................................... 18-1
18.2.1 Physical characteristics ...................................................................................... 18-1 18.2.2 Chemical characteristics..................................................................................... 18-3 18.2.3 Biology............................................................................................................... 18-8
18.3 Summary and conclusions .......................................................................................... 18-15
19 SLEIPNER ØST FIELD ................................................................................................ 19-1 19.1 Introduction ............................................................................................................... 19-1 19.2 Results and discussion............................................................................................... 19-2
19.2.1 Physical characteristics ...................................................................................... 19-2 19.2.2 Chemical characteristics..................................................................................... 19-3 19.2.3 Biology............................................................................................................. 19-12
19.3 Summary and conclusions....................................................................................... 19-18
Environmental monitoring survey of oil and gas fields in Region II, 2000 Akvaplan-niva report: APN-411.1890 -1
Page X
20 STATUS FOR REGION II ............................................................................................ 20-1 20.1 Physical characteristics.............................................................................................. 20-1 20.2 Chemical characteristics............................................................................................ 20-2 20.3 Biological characteristics .......................................................................................... 20-7
21 REFERENCES............................................................................................................... 21-1
22 LIST OF ABBREVIATIONS........................................................................................ 22-1
23 LIST OF FIGURES........................................................................................................ 23-1
24 LIST OF TABLES ......................................................................................................... 24-6
Environmental monitoring survey of oil and gas fields in Region II, 2000 Akvaplan-niva report: APN-411.1890 -1
Page 1-1
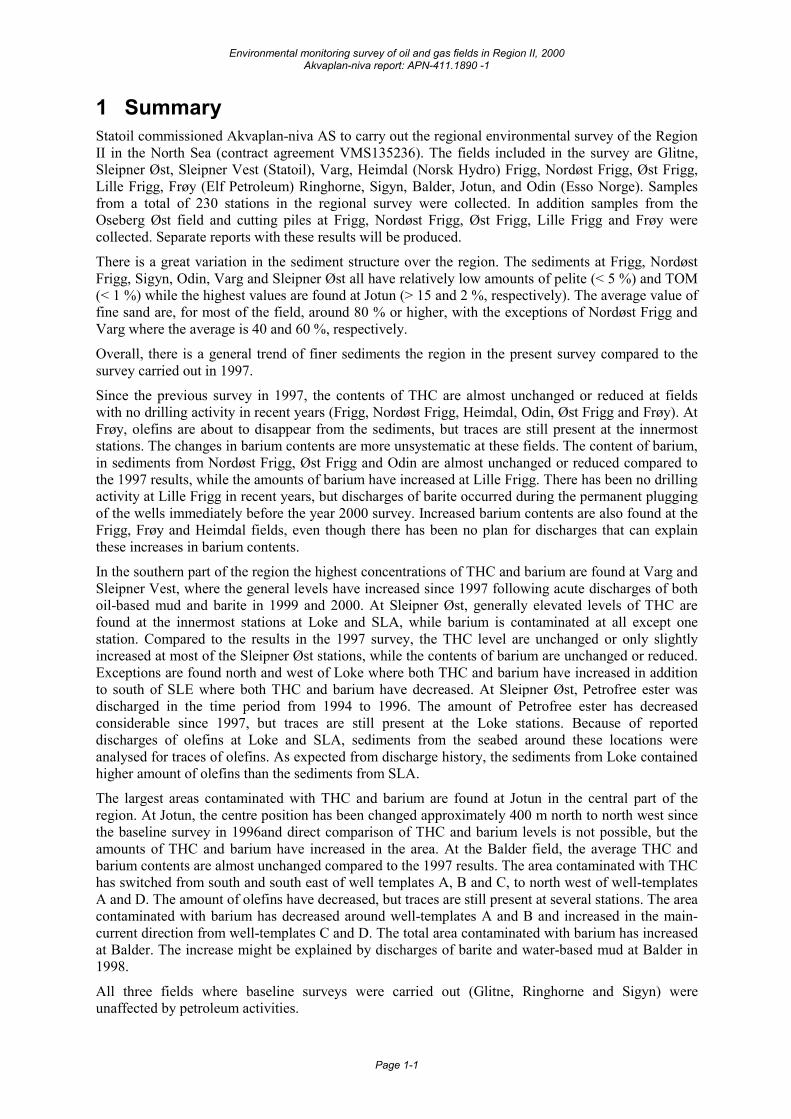
1 Summary Statoil commissioned Akvaplan-niva AS to carry out the regional environmental survey of the Region II in the North Sea (contract agreement VMS135236). The fields included in the survey are Glitne, Sleipner Øst, Sleipner Vest (Statoil), Varg, Heimdal (Norsk Hydro) Frigg, Nordøst Frigg, Øst Frigg, Lille Frigg, Frøy (Elf Petroleum) Ringhorne, Sigyn, Balder, Jotun, and Odin (Esso Norge). Samples from a total of 230 stations in the regional survey were collected. In addition samples from the Oseberg Øst field and cutting piles at Frigg, Nordøst Frigg, Øst Frigg, Lille Frigg and Frøy were collected. Separate reports with these results will be produced.
There is a great variation in the sediment structure over the region. The sediments at Frigg, Nordøst Frigg, Sigyn, Odin, Varg and Sleipner Øst all have relatively low amounts of pelite (< 5 %) and TOM (< 1 %) while the highest values are found at Jotun (> 15 and 2 %, respectively). The average value of fine sand are, for most of the field, around 80 % or higher, with the exceptions of Nordøst Frigg and Varg where the average is 40 and 60 %, respectively.
Overall, there is a general trend of finer sediments the region in the present survey compared to the survey carried out in 1997.
Since the previous survey in 1997, the contents of THC are almost unchanged or reduced at fields with no drilling activity in recent years (Frigg, Nordøst Frigg, Heimdal, Odin, Øst Frigg and Frøy). At Frøy, olefins are about to disappear from the sediments, but traces are still present at the innermost stations. The changes in barium contents are more unsystematic at these fields. The content of barium, in sediments from Nordøst Frigg, Øst Frigg and Odin are almost unchanged or reduced compared to the 1997 results, while the amounts of barium have increased at Lille Frigg. There has been no drilling activity at Lille Frigg in recent years, but discharges of barite occurred during the permanent plugging of the wells immediately before the year 2000 survey. Increased barium contents are also found at the Frigg, Frøy and Heimdal fields, even though there has been no plan for discharges that can explain these increases in barium contents.
In the southern part of the region the highest concentrations of THC and barium are found at Varg and Sleipner Vest, where the general levels have increased since 1997 following acute discharges of both oil-based mud and barite in 1999 and 2000. At Sleipner Øst, generally elevated levels of THC are found at the innermost stations at Loke and SLA, while barium is contaminated at all except one station. Compared to the results in the 1997 survey, the THC level are unchanged or only slightly increased at most of the Sleipner Øst stations, while the contents of barium are unchanged or reduced. Exceptions are found north and west of Loke where both THC and barium have increased in addition to south of SLE where both THC and barium have decreased. At Sleipner Øst, Petrofree ester was discharged in the time period from 1994 to 1996. The amount of Petrofree ester has decreased considerable since 1997, but traces are still present at the Loke stations. Because of reported discharges of olefins at Loke and SLA, sediments from the seabed around these locations were analysed for traces of olefins. As expected from discharge history, the sediments from Loke contained higher amount of olefins than the sediments from SLA.
The largest areas contaminated with THC and barium are found at Jotun in the central part of the region. At Jotun, the centre position has been changed approximately 400 m north to north west since the baseline survey in 1996and direct comparison of THC and barium levels is not possible, but the amounts of THC and barium have increased in the area. At the Balder field, the average THC and barium contents are almost unchanged compared to the 1997 results. The area contaminated with THC has switched from south and south east of well templates A, B and C, to north west of well-templates A and D. The amount of olefins have decreased, but traces are still present at several stations. The area contaminated with barium has decreased around well-templates A and B and increased in the main-current direction from well-templates C and D. The total area contaminated with barium has increased at Balder. The increase might be explained by discharges of barite and water-based mud at Balder in 1998.
All three fields where baseline surveys were carried out (Glitne, Ringhorne and Sigyn) were unaffected by petroleum activities.
Environmental monitoring survey of oil and gas fields in Region II, 2000 Akvaplan-niva report: APN-411.1890 -1
Page 1-2
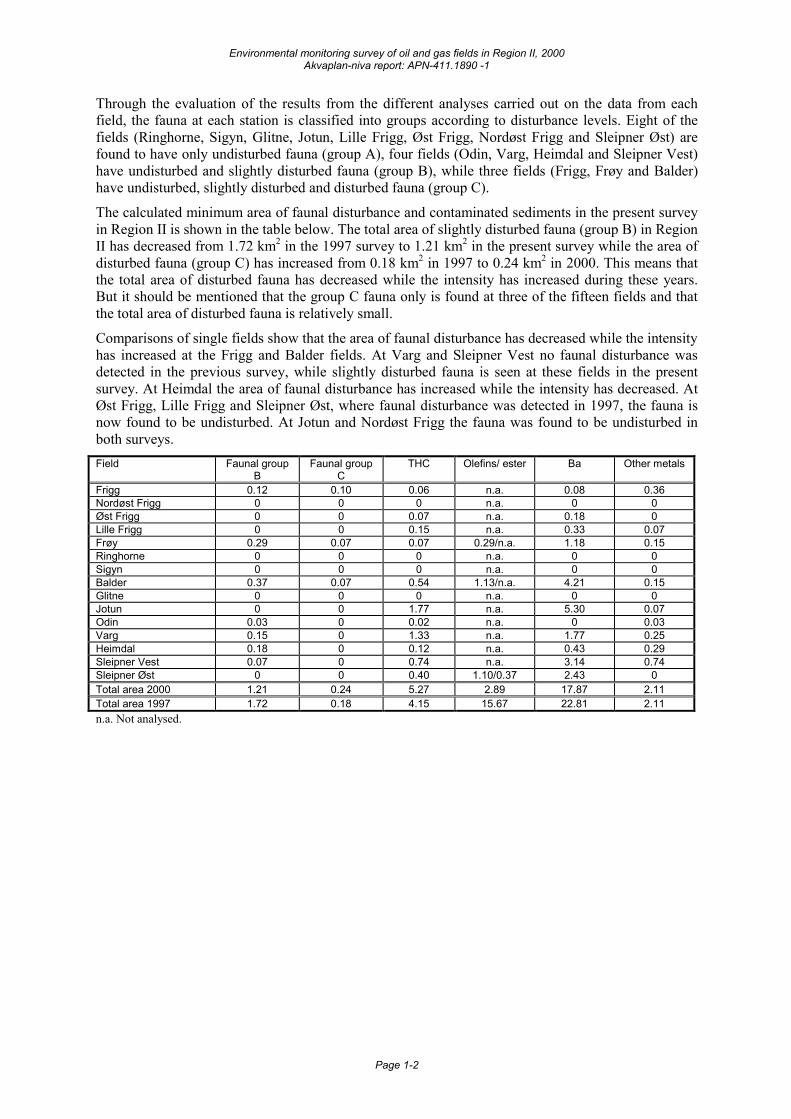
Through the evaluation of the results from the different analyses carried out on the data from each field, the fauna at each station is classified into groups according to disturbance levels. Eight of the fields (Ringhorne, Sigyn, Glitne, Jotun, Lille Frigg, Øst Frigg, Nordøst Frigg and Sleipner Øst) are found to have only undisturbed fauna (group A), four fields (Odin, Varg, Heimdal and Sleipner Vest) have undisturbed and slightly disturbed fauna (group B), while three fields (Frigg, Frøy and Balder) have undisturbed, slightly disturbed and disturbed fauna (group C).
The calculated minimum area of faunal disturbance and contaminated sediments in the present survey in Region II is shown in the table below. The total area of slightly disturbed fauna (group B) in Region II has decreased from 1.72 km2 in the 1997 survey to 1.21 km2 in the present survey while the area of disturbed fauna (group C) has increased from 0.18 km2 in 1997 to 0.24 km2 in 2000. This means that the total area of disturbed fauna has decreased while the intensity has increased during these years. But it should be mentioned that the group C fauna only is found at three of the fifteen fields and that the total area of disturbed fauna is relatively small.
Comparisons of single fields show that the area of faunal disturbance has decreased while the intensity has increased at the Frigg and Balder fields. At Varg and Sleipner Vest no faunal disturbance was detected in the previous survey, while slightly disturbed fauna is seen at these fields in the present survey. At Heimdal the area of faunal disturbance has increased while the intensity has decreased. At Øst Frigg, Lille Frigg and Sleipner Øst, where faunal disturbance was detected in 1997, the fauna is now found to be undisturbed. At Jotun and Nordøst Frigg the fauna was found to be undisturbed in both surveys. Field Faunal group
B Faunal group
C THC Olefins/ ester Ba Other metals
Frigg 0.12 0.10 0.06 n.a. 0.08 0.36 Nordøst Frigg 0 0 0 n.a. 0 0 Øst Frigg 0 0 0.07 n.a. 0.18 0 Lille Frigg 0 0 0.15 n.a. 0.33 0.07 Frøy 0.29 0.07 0.07 0.29/n.a. 1.18 0.15 Ringhorne 0 0 0 n.a. 0 0 Sigyn 0 0 0 n.a. 0 0 Balder 0.37 0.07 0.54 1.13/n.a. 4.21 0.15 Glitne 0 0 0 n.a. 0 0 Jotun 0 0 1.77 n.a. 5.30 0.07 Odin 0.03 0 0.02 n.a. 0 0.03 Varg 0.15 0 1.33 n.a. 1.77 0.25 Heimdal 0.18 0 0.12 n.a. 0.43 0.29 Sleipner Vest 0.07 0 0.74 n.a. 3.14 0.74 Sleipner Øst 0 0 0.40 1.10/0.37 2.43 0 Total area 2000 1.21 0.24 5.27 2.89 17.87 2.11 Total area 1997 1.72 0.18 4.15 15.67 22.81 2.11 n.a. Not analysed.
Environmental monitoring survey of oil and gas fields in Region II, 2000 Akvaplan-niva report: APN-411.1890 -1
Page 2-1
2 Introduction Statoil, Norsk Hydro, Elf Petroleum and Esso Norge commissioned Akvaplan-niva to carry out the regional monitoring survey in Region II in the North Sea (contract no. VMS135236). The programme for the regional monitoring survey was designed in accordance with the guidelines SFT 99:01 (Nilssen 1999). Samples were collected from a total of 208 field stations and 9 regional and 13 reference stations in the region. In addition to the usual physical, chemical and biological analyses, samples were collected for analysis of synthetic drilling mud at some of the fields. Samples were also collected at the Oseberg Øst field and cutting piles at the Frigg, Nordøst Frigg, Øst Frigg, Lille Frigg and Frøy. Separate reports with the results from these will be produced.
The fields included in the survey in Region II were:
Statoil Glitne, Sleipner Øst and Sleipner Vest
Norsk Hydro Varg and Heimdal
Elf Petroleum Frigg, Nordøst Frigg, Øst Frigg, Lille Frigg and Frøy
Esso Norge Ringhorne, Sigyn, Balder, Jotun and Odin
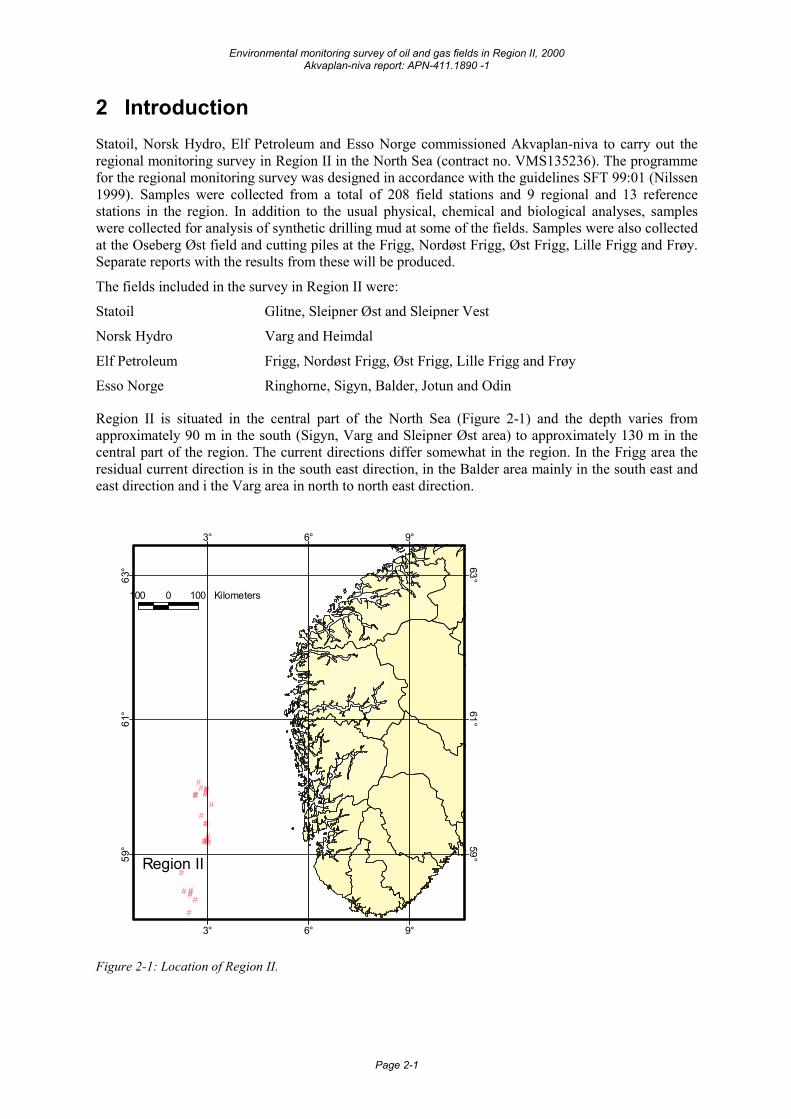
Region II is situated in the central part of the North Sea (Figure 2-1) and the depth varies from approximately 90 m in the south (Sigyn, Varg and Sleipner Øst area) to approximately 130 m in the central part of the region. The current directions differ somewhat in the region. In the Frigg area the residual current direction is in the south east direction, in the Balder area mainly in the south east and east direction and i the Varg area in north to north east direction.
#
#
######
#
##
##
#####
#
#### ##
###
#
Region II59° 59°
61° 61°
63° 63°
3°
3°
6°
6°
9°
9°
100 0 100 Kilometers
Figure 2-1: Location of Region II.

Environmental monitoring survey of oil and gas fields in Region II, 2000 Akvaplan-niva report: APN-411.1890 -1
Page 2-2
Offshore activities have been going on since the late 1970’ies in Region II when the Frigg field started the production. A summary of the operational and accidental discharges that may have influenced the current chemical and biological conditions is provided in the relevant field chapters (section 5 and further).
This is the second regional survey in Region II, but before regional surveys were introduced, environmental conditions have been monitored at single fields. The conclusions from these previous surveys are summarised in the field chapters.
The survey was carried out by Akvaplan-niva AS in co-operation with the following laboratories:
• Unilab Analyse AS, Tromsø • GeoGruppen AS, Tromsø • NIVA, Oslo
Environmental monitoring survey of oil and gas fields in Region II, 2000 Akvaplan-niva report: APN-411.1890 -1
Page 3-3
3 Methods Station selection, field sampling and laboratory analyses of the samples were performed in accordance with the Norwegian guidelines for environmental monitoring of petroleum activities on the Norwegian shelf (Nilssen 1999).
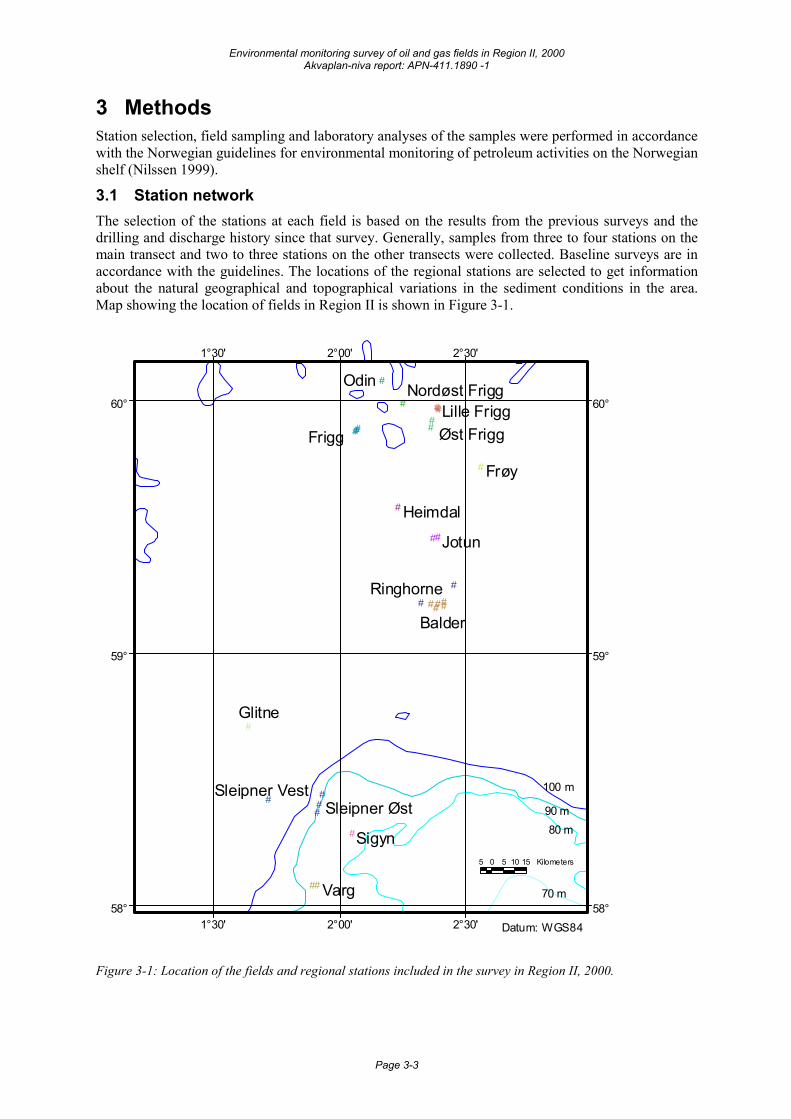
3.1 Station network The selection of the stations at each field is based on the results from the previous surveys and the drilling and discharge history since that survey. Generally, samples from three to four stations on the main transect and two to three stations on the other transects were collected. Baseline surveys are in accordance with the guidelines. The locations of the regional stations are selected to get information about the natural geographical and topographical variations in the sediment conditions in the area. Map showing the location of fields in Region II is shown in Figure 3-1.
##
#
#####
#
##
#
#
#
##
##
#
#
######
###
#
Varg
Sigyn
Glitne
Sleipner ØstSleipner Vest
Balder
Ringhorne
Jotun
Heimdal
Frøy
Øst FriggLille Frigg
Nordøst FriggOdin
Frigg
58° 58°
59° 59°
60° 60°
1°30'
1°30'
2°00'
2°00'
2°30'
2°30'
100 m
90 m80 m
70 m
Datum: WGS84
5 0 5 10 15 Kilometers
Figure 3-1: Location of the fields and regional stations included in the survey in Region II, 2000.
Environmental monitoring survey of oil and gas fields in Region II, 2000 Akvaplan-niva report: APN-411.1890 -1
Page 3-4
3.2 Fieldwork The fieldwork was carried out between 23.05. and 13.06. 2000, using MS "Seaway Invincible" (Stolt Offshore). The samples were collected at 9 regional stations, 13 reference stations and 208 field stations. At the regional and field stations three and five chemical and biological samples were collected, while at the reference stations five chemical and ten biological samples were collected. In addition, samples from the Oseberg Øst field and cutting piles at the Frigg, Nordøst Frigg, Øst Frigg, Lille Frigg and Frøy fields were collected. A separate report with these results will be produced. A total of 2104 samples from 251 stations were collected during the field work.
During sampling, the ship’s officers held the vessel within + 50 m of the station coordinates. Positioning was done using a differential GPS with accuracy better than 10 m and the vessel was held in position with a dynamic positioning system (DP).
The entire sampling programme was followed and sampling was conducted without deviating from the guidelines. Sampling positions, distances from the field centre and information on the samples retrieved are presented in the result chapters in the main report and the field report in the appendix.
Due to inaccurate echo sounder, the depths at the stations were not recorded.
3.3 Sampling and sample treatment Sampling was carried out with a 0.1 m2 lead weighted, modified van Veen grab. The grab had hinged and lockable inspection flaps constructed of 0.5 mm mesh, each covered by an additional rubber flap. This construction allows water to pass freely through the grab during lowering, but prevents disturbance of the sediment surface by water currents during hauling. While lowering and hauling the grab, the wire was positioned close to the side of the boat. This allowed the controller to manually determine when the grab had reached the seabed. The wire in use was marked at the depths of the stations. The grab was lowered at less than 1.5 m/s. At 5-10 m above the sediment surface, speed was reduced to less than 0.2 m/s.
Each grab sample was visually inspected to ensure there was no sediment disturbance. Disturbed samples were discarded.
Samples for analyses of hydrocarbons, metals, grain size and total organic matter were taken from the same grab sample. The hydrocarbon and metal samples were taken with suitable implements from the upper sediment layer (0 - 1 cm) while sediment for grain size analysis was taken from the upper 5 cm layer. At designated stations sub samples were taken for analysis of the vertical distribution of selected parameters. This was done by pressing a metal cylinder (10 cm long and approx. 7 cm in diameter) down in the sediment through the top opening of the grab. The samples were cut into sub samples at 1, 3 and 6 cm depths. All samples were marked and immediately frozen at -20°C.
Biological samples were taken from separate grab samples. After the sample volume was recorded, the sediment was gently sieved through a 1 mm round mesh sieve immersed in seawater. The fauna retained on the sieve was preserved in a 4 % formaldehyde solution, neutralised with borax.
The colour of the sediment profile was described from a sub sample, which was taken from one of the biological samples. The sample was gently washed out of the corer and combined with the sediment it originated from.
3.4 Sample analyses
3.4.1 Physical analyses On deck, each sample was described with respect to sediment type, smell, colour, larger, living animals and other prominent features (i.e. traces of oil, cuttings etc.). In one sample per station, a transparent PVC-corer was pressed down in the sediment through the top opening of the grab. The colour profile was determined using a Munsell Soil Colour Chart.
Environmental monitoring survey of oil and gas fields in Region II, 2000 Akvaplan-niva report: APN-411.1890 -1
Page 3-5
The amount of total organic material (TOM) was determined as loss by weight after combustion at 480°C. At this temperature carbonates are not oxidised and pre-treatment of the samples with HCl can be avoided. (Treatment with HCl (including washing of the sample) removes some organic matter, particularly the more labile and soluble components, from the sediment (Byers et al., 1978)). Samples with a known amount of carbonates were used as controls.
Analysis of grain size distribution was carried out in accordance with the methodology given in Buchanan (1984). From each station three sub samples from separate grab samples were collected, mixed and thoroughly homogenised. The homogenised sample was split into 2 fractions using wet-sieving. Following, the sandy fraction (particle size larger than 0.063 mm) was further analysed using dry-sieving.
All samples were analysed without deviation from the guidelines
3.4.2 Chemical analyses Three grab samples were taken at each station for chemical analyses. At the reference stations, two additional grab samples were collected.
The vertical distribution of hydrocarbons and metals were determined in vertical sections of core samples from selected stations. Sediments from the 0-1, 1-3 and 3-6 cm layers were analysed. At each field, core samples were collected at the field specific reference station and at the innermost and outermost stations on the main transect.
Sediments from stations with an average THC content at or above twice the value of the calculated limit of significant contamination for THC (2xLSC97-00RegII) were analysed for NPD, 3-6-ring aromatics and decalins.
3.4.2.1 Hydrocarbons The hydrocarbons were extracted from the sediment using saponification followed by solvent extraction. Concentration and isolation of the hydrocarbon fraction was accomplished by adsorption chromatography on a silica column.
THC was determined by gas chromatography, GC/FID, using an external standard for quantification. The base oil HDF 200 was used as reference oil and external standard for the whole region. THC was determined in all samples.
NPD, 3-6-ring aromatics and decalins in the hydrocarbon extract were analysed using gas chromatography/mass spectrometry, GC/MS, using a deuterium labelled internal standard for quantification.
Olefins in the hydrocarbon extract were identified in the gas chromatogram by comparing the profile of the sediment extract with the profile of the base oil used at the field. The amounts of olefins were quantified by GC/FID using a pure sample of the olefin-based base oil as external standard.
Esters, which are degenerated during the standard work-up procedure for hydrocarbons, were extracted from the sediment using a Soxhlet-extractor with dichloromethane as an extraction solvent. Further purification was accomplished by adsorption chromatography on a silica column. The amount of esters in the sediment was quantified by GC/FID using a pure sample of the ester-based base oil as external standard.
3.4.2.2 Metals The sediment was dried, homogenised and sieved prior to extraction in accordance with Norsk Standard 4770 (nitric acid digestion). Barium (Ba), copper (Cu) chromium (Cr) and zinc (Zn) were analysed by inductive coupled plasma atomic emission spectrometry (ICP-AES). Quantitative analysis of lead (Pb) and cadmium (Cd) was carried out by atomic absorption spectrometry (AAS). Mercury (Hg) was determined by cold vapour atomic absorption spectrometry (CVAAS).
Environmental monitoring survey of oil and gas fields in Region II, 2000 Akvaplan-niva report: APN-411.1890 -1
Page 3-6
The sediments from the regional stations were in addition analysed for Cd, Pb, Zn, Cu, Ba, Cr, aluminium (Al) and lithium (Li) using “total” digestion with hydrofluoric acid and aqua regia.
All chemical samples were analysed without deviating from the guidelines.
3.4.2.3 Calculation of Limits of Significant contamination (LSC) Prior to the calculation of background levels and Limits of Significant Contamination (LSC), a multivariate analysis of the chemical data from all regional and reference stations was performed on the current year’s data and on the data from both the present and previous regional survey(s). The results of these multivariate analyses clarify the need for a subdivision of the region into sub region(s) and indicate other “outliers”.
The average background levels of chemical parameters were calculated across:
• the whole region (all reference and regional stations) • any sub-regions (based on the chosen reference and regional stations) • each field reference station
By comparing the background values obtained by the calculations described above, a selection of suitable background levels for calculation of LSC for this region can be performed.
The final selection of background levels and calculation of LSC are described in the results and discussion chapter for regional and reference stations. The LSC values were calculated from the chosen background levels by using a one-tailed student t-test at 95% significant level according to the formula given in the NIVA-notat O-99218.
3.4.3 Biological analyses In the laboratory, each replicate sample was washed in freshwater on a submerged sieve with 1 mm round mesh prior to sorting. Sorting was conducted in water, in white shallow containers. All fauna was carefully removed from the sediment under a magnifying glass (10x) and sorted in a limited number of main groups. The animals were preserved in 75 % ethanol and identified to the lowest possible taxa.
Statistical analyses were performed on the entire set of benthos data. If juveniles appeared among the ten most dominant organisms in the data set, the statistical analysis was conducted both with and without these in order to evaluate their importance.
All biological samples were analysed without deviation from the guidelines.
Based on the statistical analyses the following information was provided:
• ten most prevalent species for every station • diversity index of "Shannon Wiener index" on log2 basis (McArthur & McArthur 1961) • evenness expressed as Pielou's "J" (Pielou 1966) • expected number of species per 100 individuals (Hulbert's ES 100) • cluster-analysis based on "Bray-Curtis dissimilarity index" (Bray & Curtis 1957), followed by
"Group Average Sorting" • ordination by "Multidimensional Scaling" • species/area curves (for the 10 replicates taken at the reference stations only).
The formulas used for calculation of the indices are provided in the appendix.
Multivariate analyses was performed both on the set of data from the replicate samples and on the totals for each station.
In addition to the above-mentioned (required) methods, a canonical correspondence analyses (CCA) were carried out as well:
Criteria for faunal impacts are based on a combination of multivariate analyses comprising cluster analysis and multidimensional scaling (MDS) and an evaluation of the faunal data (number of species
Environmental monitoring survey of oil and gas fields in Region II, 2000 Akvaplan-niva report: APN-411.1890 -1
Page 3-7
and individuals, diversity indices, dominant taxa etc.) at each station. In this way the following four faunal groups are defined in this report:
Group A: Undisturbed fauna, generally with low dominance (no taxa present in very high numbers) and a wide range of taxa from a variety of taxonomic groups, including polychaetes, molluscs, echinoderms and crustacea, are present. Taxa indicating disturbed sediments are absent or occur in very low individual numbers.
Group B: Slightly disturbed fauna: generally with higher dominance, number of taxa and total abundance. Taxa indicating disturbed sediments, usually including polychaetes and molluscs, increase in individual numbers, but are not usually dominant.
Group C: Disturbed fauna: generally with high dominance and lower number of taxa. Taxa indicating disturbed sediments, usually including polychaetes and molluscs, occur among the dominant taxa, echinoderms rare.
Group D: Highly disturbed fauna: small deposit feeding worms totally predominate (usually polychaetes). Echinoderms absent and molluscs and crustaceans rare or absent. Low number of taxa, high total abundance.
Natural variation might occur within each group.
The most familiar taxa that occur in disturbed sediments are the polychaetes Capitella capitata, Chaetozone sp., Cirratulus sp., Opryotrocha sp. and Ditrupa arietina and the molluscs Thyasira sarsi and T. flexuosa, while the echinoderm Amphiura filiformis disappears under such conditions.
The CCA analyses combine the environmental and biological parameters and the plots presented show the biological variance between the stations and those environmental parameters that explains the variance.
The estimated area of contaminated sediments and disturbed fauna is based on a calculation of the area of an asymmetric ellipse. The radius varies from field to field and between transects within each field. In calculation, the distance to contaminated/disturbed station is used. In cases with contamination/disturbance at one to three transects, 125 m was used at non contaminated/undisturbed transects.
3.4.4 Quality control Sampling and sample analyses were preformed by field personnel and laboratories accredited for these activities in accordance with the Norwegian Guideline and EN-45001. Copies of the accreditation documents are included in the Appendix. During fieldwork and laboratory treatment of the samples, detailed checklists and logbooks were kept in order to check whether all procedures had been followed, to allow a sample to be traced and to document the accuracy and reliability of the results. Full documentation on the QA results from the chemical laboratories is included in the appendix.
In the field, all disturbed samples are rejected. Also, if grab speed exceeded 0.2 m/sec immediately before reaching the bottom, the sample was discarded.
The limit of detection (LOD) and the limit of quantitation (LOQ) for hydrocarbons were determined to be 0.2 mg/kg and 0.4 mg/kg, respectively. The LOD and LOQ for the aromatic compounds are provided in the Appendix.
Recovery of the hydrocarbon extraction was checked using non-contaminated sediments spiked with 20 ppm of standard oil. The recovery of total hydrocarbons was 85%. Reproducibility was checked with house standard sediment. The relative standard deviation over the time period was 14 %. Accuracy of the aromatic analyses was determined using the standard reference sediment SRM 1941a. The results from this analysis are given in the Appendix.
Detection limits and the blind values for the metals are given in the Appendix. Precision of the analyses was checked using several sets of three parallel samples. Accuracy was examined by analysing four reference samples BCSS-1, MESS-2 and BCR-320 by the same procedure as for the samples. The results are given in the Appendix.
Environmental monitoring survey of oil and gas fields in Region II, 2000 Akvaplan-niva report: APN-411.1890 -1
Page 3-8
In order to assess sorting efficiency, a minimum of 10 % of the biological samples was subjected to control sorting. If more than 15 individuals were found in the residual sediment, all samples sorted by the same person are re-sorted. A similar control procedure is used to check the transfer of species lists to the database. A minimum of 10% of the species records for each field is checked. If the error is 1% or more, all records are checked and corrected, and a new check is conducted.
3.4.5 Storage of sample material Analysed samples are stored at the laboratory that conducted the analyses for at least five years after the client has accepted the environmental monitoring report. Reference collections are maintained for at least ten years. Analytical results (at replicate level) are kept for at least ten years in a database at Akvaplan-niva. During the period of storage, the material and results can be made available to the client.
Environmental monitoring survey of Region II, 2000 Akvaplan-niva report: APN-414.1890-1
Page 4-1
4 Regional and reference stations 4.1 Introduction Samples from 9 regional and 13 field reference stations were collected in the present survey. Two of the regional stations, stations RII07 and RII08, are also reference stations at the Glitne and Sleipner Vest fields, respectively. More information on these stations is shown in Figure 4-17 and Table 4-10, which can be found on the foldout page at the end of this chapter (page 4-23). The first regional survey was carried out in this region in 1997 (Mannvik et al., 1998). This survey did not reveal contaminated sediments or disturbed benthos communities at any regional or reference stations. Prior to 1997 single field surveys have been carried out at the different fields in the region.
4.2 Results and discussion
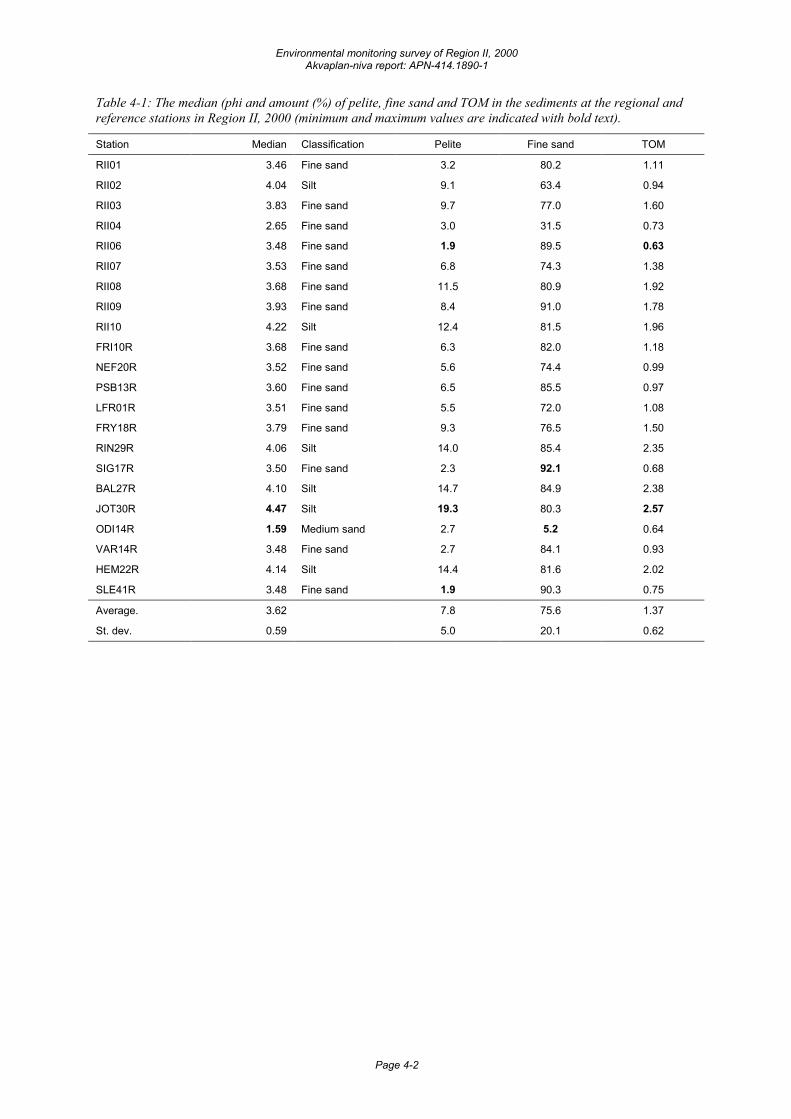
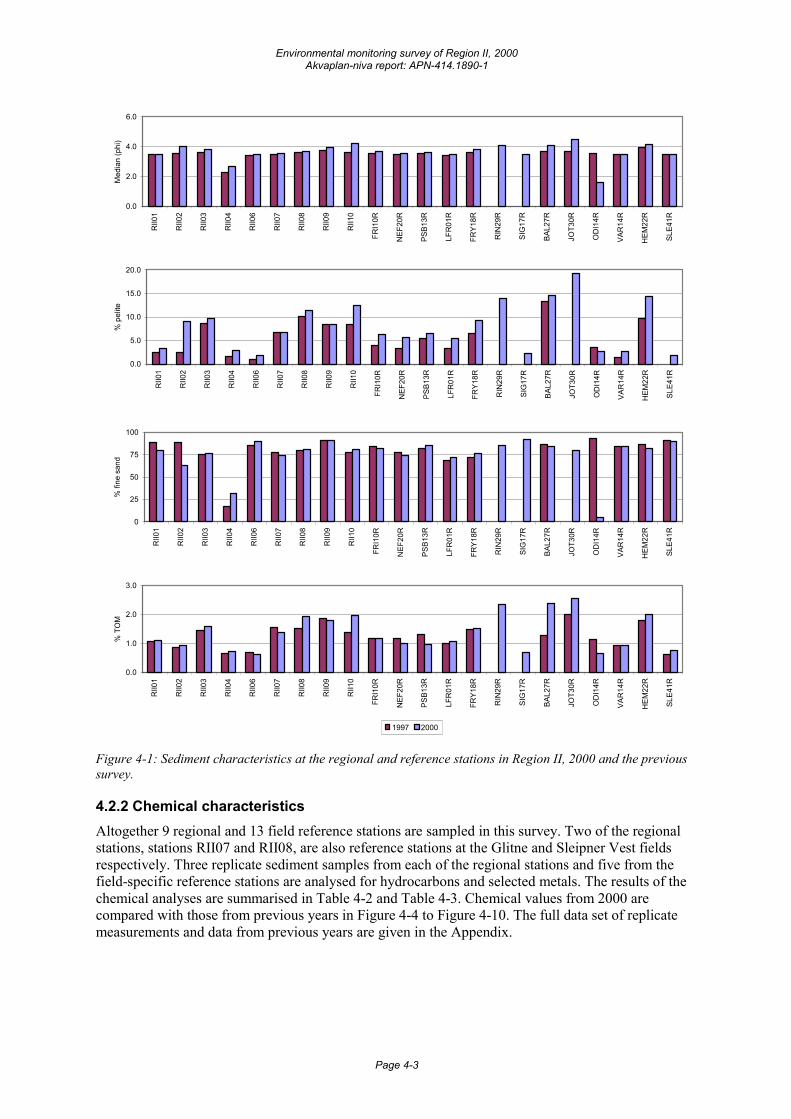
4.2.1 Physical characteristics The amounts (%) of pelite, fine sand, median phi value, and total organic material (TOM) in the sediment from the present and previous survey are shown in Table 4-1 and Figure 4-1. Detailed data on sediment characteristics such as colour, smell and a full set of analytical data, including TOM content and grain size distribution (with standard deviation, evenness and kurtosis) can be found in the Appendix.
The variation of the sediment structure in the region is great with a median value ranging from 1.59 (medium sand) at the Odin reference station to 4.47 (silt) at the Jotun reference station. The amount of pelite varies from 1.9 % at regional station RII06 and the reference station at Sleipner Øst (SLE41R) to19.3 % at the reference station at Jotun (JOT30R), the amount of fine sand from 5.2 % at the reference station at Odin (ODI14R) to 92.1 % at the reference station at Sigyn (SIG17R), while the TOM varies from 0.63 % at RII06 to 2.57 at JOT30R. This shows a tendency of coarser sediments in the shallower, southern part of the region (Sleipner Øst-, Sigyn- and Varg area) where the depths are less than 90 m.
Compared with the results from the 1997 survey, there is a general trend of finer sediments in the region in the present survey. This is shown by an increase in the median and pelite values at most of the stations surveyed. This is specially seen in the Balder – Heimdal area (including regional stations RII03 and RII10 and the reference stations at Balder, Jotun and Heimdal) where the TOM value as well has increased.
The results from the reference station at Odin need special attention as they differ greatly from those obtained in the previous surveys (see also chapter 14 where the results from the Odin field are presented). The median value at this station has decreased from 3.53 in 1997 to 1.59 in 2000, while the amount of pelite and fine sand in the sediment comprise less than 10 % in the present survey compared to more than 95 % in the 1997 survey. The most possible explanation for this is that the positions, where samples were collected in the two surveys, are different resulting in a different type of sediments collected.
Environmental monitoring survey of Region II, 2000 Akvaplan-niva report: APN-414.1890-1
Page 4-2
Table 4-1: The median (phi and amount (%) of pelite, fine sand and TOM in the sediments at the regional and reference stations in Region II, 2000 (minimum and maximum values are indicated with bold text).
Station Median Classification Pelite Fine sand TOM
RII01 3.46 Fine sand 3.2 80.2 1.11
RII02 4.04 Silt 9.1 63.4 0.94
RII03 3.83 Fine sand 9.7 77.0 1.60
RII04 2.65 Fine sand 3.0 31.5 0.73
RII06 3.48 Fine sand 1.9 89.5 0.63
RII07 3.53 Fine sand 6.8 74.3 1.38
RII08 3.68 Fine sand 11.5 80.9 1.92
RII09 3.93 Fine sand 8.4 91.0 1.78
RII10 4.22 Silt 12.4 81.5 1.96
FRI10R 3.68 Fine sand 6.3 82.0 1.18
NEF20R 3.52 Fine sand 5.6 74.4 0.99
PSB13R 3.60 Fine sand 6.5 85.5 0.97
LFR01R 3.51 Fine sand 5.5 72.0 1.08
FRY18R 3.79 Fine sand 9.3 76.5 1.50
RIN29R 4.06 Silt 14.0 85.4 2.35
SIG17R 3.50 Fine sand 2.3 92.1 0.68
BAL27R 4.10 Silt 14.7 84.9 2.38
JOT30R 4.47 Silt 19.3 80.3 2.57
ODI14R 1.59 Medium sand 2.7 5.2 0.64
VAR14R 3.48 Fine sand 2.7 84.1 0.93
HEM22R 4.14 Silt 14.4 81.6 2.02
SLE41R 3.48 Fine sand 1.9 90.3 0.75
Average. 3.62 7.8 75.6 1.37
St. dev. 0.59 5.0 20.1 0.62
Environmental monitoring survey of Region II, 2000 Akvaplan-niva report: APN-414.1890-1
Page 4-3
0.0
2.0
4.0
6.0
RII0
1
RII0
2
RII0
3
RII0
4
RII0
6
RII0
7
RII0
8
RII0
9
RII1
0
FRI1
0R
NEF
20R
PSB1
3R
LFR
01R
FRY1
8R
RIN
29R
SIG
17R
BAL2
7R
JOT3
0R
OD
I14R
VAR
14R
HEM
22R
SLE4
1R
Med
ian
(phi
)
0.0
5.0
10.0
15.0
20.0
RII0
1
RII0
2
RII0
3
RII0
4
RII0
6
RII0
7
RII0
8
RII0
9
RII1
0
FRI1
0R
NEF
20R
PSB1
3R
LFR
01R
FRY1
8R
RIN
29R
SIG
17R
BAL2
7R
JOT3
0R
OD
I14R
VAR
14R
HEM
22R
SLE4
1R
% p
elite
0
25
50
75
100
RII0
1
RII0
2
RII0
3
RII0
4
RII0
6
RII0
7
RII0
8
RII0
9
RII1
0
FRI1
0R
NEF
20R
PSB1
3R
LFR
01R
FRY1
8R
RIN
29R
SIG
17R
BAL2
7R
JOT3
0R
OD
I14R
VAR
14R
HEM
22R
SLE4
1R
% fi
ne s
and
0.0
1.0
2.0
3.0
RII0
1
RII0
2
RII0
3
RII0
4
RII0
6
RII0
7
RII0
8
RII0
9
RII1
0
FRI1
0R
NEF
20R
PSB1
3R
LFR
01R
FRY1
8R
RIN
29R
SIG
17R
BAL2
7R
JOT3
0R
OD
I14R
VAR
14R
HEM
22R
SLE4
1R
% T
OM
1997 2000
Figure 4-1: Sediment characteristics at the regional and reference stations in Region II, 2000 and the previous survey.
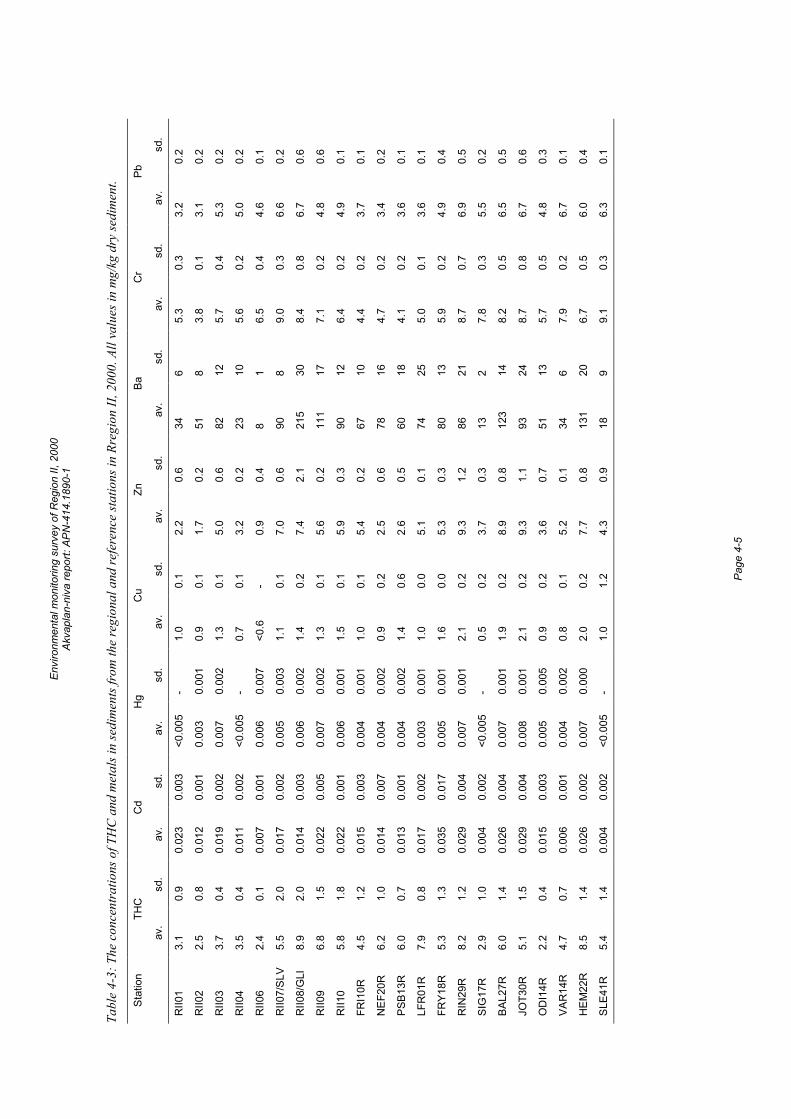
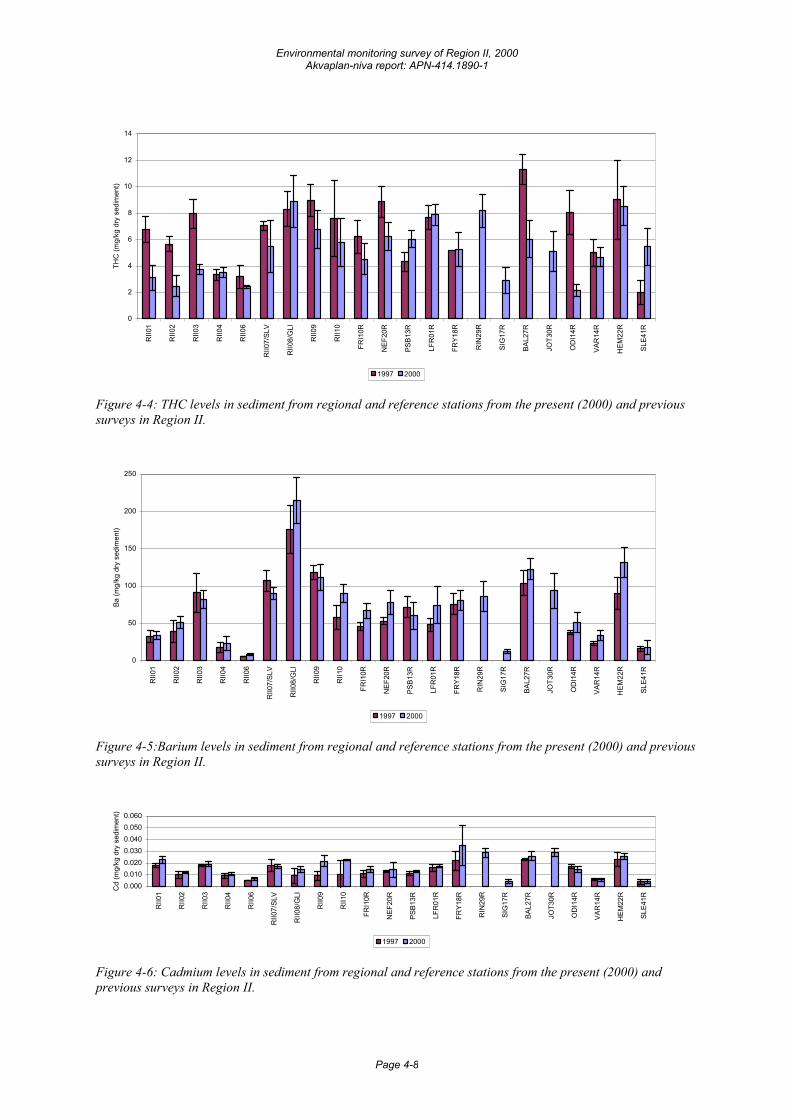
4.2.2 Chemical characteristics Altogether 9 regional and 13 field reference stations are sampled in this survey. Two of the regional stations, stations RII07 and RII08, are also reference stations at the Glitne and Sleipner Vest fields respectively. Three replicate sediment samples from each of the regional stations and five from the field-specific reference stations are analysed for hydrocarbons and selected metals. The results of the chemical analyses are summarised in Table 4-2 and Table 4-3. Chemical values from 2000 are compared with those from previous years in Figure 4-4 to Figure 4-10. The full data set of replicate measurements and data from previous years are given in the Appendix.
Environmental monitoring survey of Region II, 2000 Akvaplan-niva report: APN-414.1890-1
Page 4-4
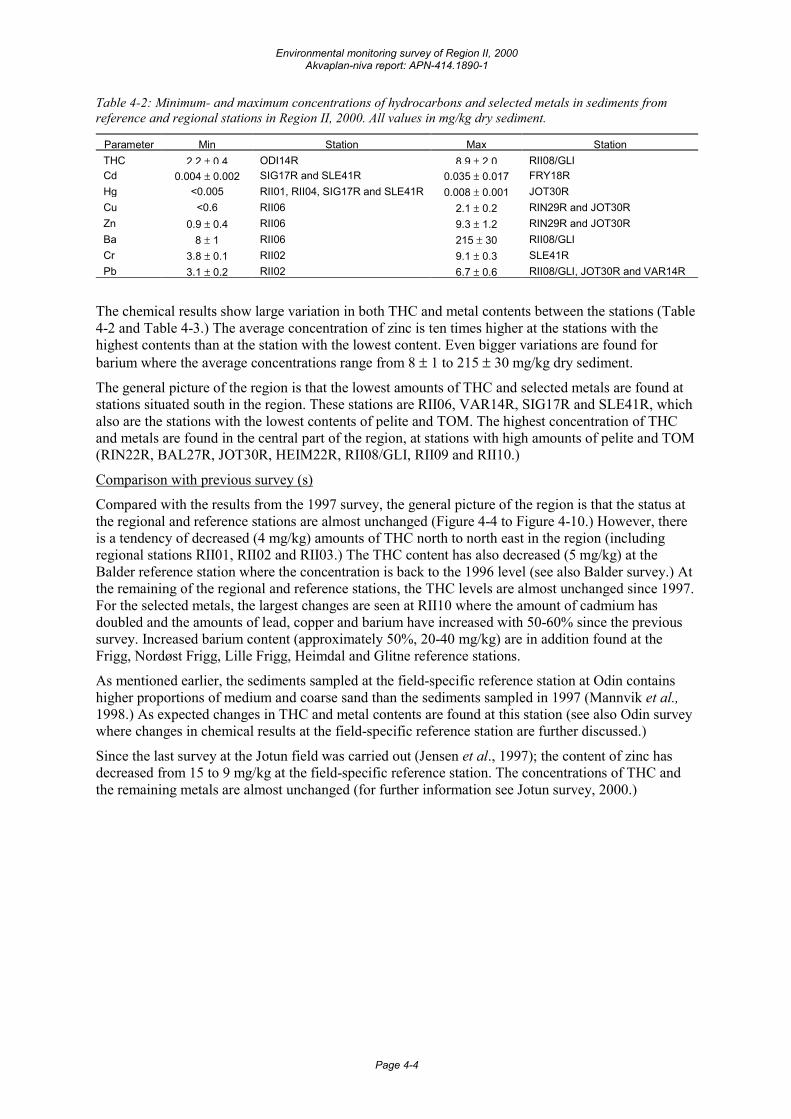
Table 4-2: Minimum- and maximum concentrations of hydrocarbons and selected metals in sediments from reference and regional stations in Region II, 2000. All values in mg/kg dry sediment.
Parameter Min Station Max Station THC 2.2 ± 0.4 ODI14R 8.9 ± 2.0 RII08/GLI Cd 0.004 ± 0.002 SIG17R and SLE41R 0.035 ± 0.017 FRY18R Hg <0.005 RII01, RII04, SIG17R and SLE41R 0.008 ± 0.001 JOT30R Cu <0.6 RII06 2.1 ± 0.2 RIN29R and JOT30R Zn 0.9 ± 0.4 RII06 9.3 ± 1.2 RIN29R and JOT30R Ba 8 ± 1 RII06 215 ± 30 RII08/GLI Cr 3.8 ± 0.1 RII02 9.1 ± 0.3 SLE41R Pb 3.1 ± 0.2 RII02 6.7 ± 0.6 RII08/GLI, JOT30R and VAR14R
The chemical results show large variation in both THC and metal contents between the stations (Table 4-2 and Table 4-3.) The average concentration of zinc is ten times higher at the stations with the highest contents than at the station with the lowest content. Even bigger variations are found for barium where the average concentrations range from 8 ± 1 to 215 ± 30 mg/kg dry sediment.
The general picture of the region is that the lowest amounts of THC and selected metals are found at stations situated south in the region. These stations are RII06, VAR14R, SIG17R and SLE41R, which also are the stations with the lowest contents of pelite and TOM. The highest concentration of THC and metals are found in the central part of the region, at stations with high amounts of pelite and TOM (RIN22R, BAL27R, JOT30R, HEIM22R, RII08/GLI, RII09 and RII10.)
Comparison with previous survey (s)
Compared with the results from the 1997 survey, the general picture of the region is that the status at the regional and reference stations are almost unchanged (Figure 4-4 to Figure 4-10.) However, there is a tendency of decreased (4 mg/kg) amounts of THC north to north east in the region (including regional stations RII01, RII02 and RII03.) The THC content has also decreased (5 mg/kg) at the Balder reference station where the concentration is back to the 1996 level (see also Balder survey.) At the remaining of the regional and reference stations, the THC levels are almost unchanged since 1997. For the selected metals, the largest changes are seen at RII10 where the amount of cadmium has doubled and the amounts of lead, copper and barium have increased with 50-60% since the previous survey. Increased barium content (approximately 50%, 20-40 mg/kg) are in addition found at the Frigg, Nordøst Frigg, Lille Frigg, Heimdal and Glitne reference stations.
As mentioned earlier, the sediments sampled at the field-specific reference station at Odin contains higher proportions of medium and coarse sand than the sediments sampled in 1997 (Mannvik et al., 1998.) As expected changes in THC and metal contents are found at this station (see also Odin survey where changes in chemical results at the field-specific reference station are further discussed.)
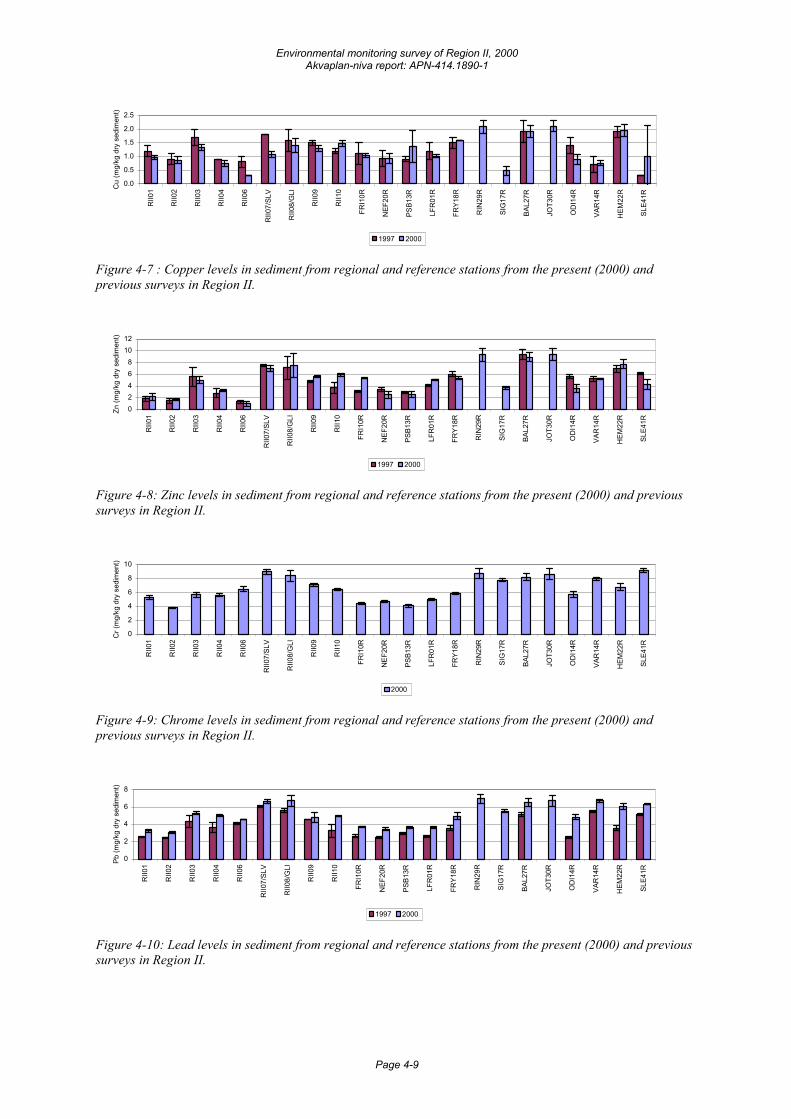
Since the last survey at the Jotun field was carried out (Jensen et al., 1997); the content of zinc has decreased from 15 to 9 mg/kg at the field-specific reference station. The concentrations of THC and the remaining metals are almost unchanged (for further information see Jotun survey, 2000.)
Envi
ronm
enta
l mon
itorin
g su
rvey
of R
egio
n II,
200
0 Ak
vapl
an-n
iva
repo
rt: A
PN-4
14.1
890-
1
Pa
ge 4
-5
Tabl
e 4-
3: T
he c
once
ntra
tions
of T
HC
and
met
als i
n se
dim
ents
from
the
regi
onal
and
refe
renc
e sta
tions
in R
regi
on II
, 200
0. A
ll va
lues
in m
g/kg
dry
sedi
men
t.
Stat
ion
THC
C
d H
g C
u Zn
Ba
C
r Pb
av
. sd
. av
. sd
. av
. sd
. av
. sd
. av
. sd
. av
. sd
. av
. sd
. av
. sd
.
RII0
1 3.
1 0.
9 0.
023
0.00
3 <0
.005
-
1.0
0.1
2.2
0.6
34
6 5.
3 0.
3 3.
2 0.
2
RII0
2 2.
5 0.
8 0.
012
0.00
1 0.
003
0.00
1 0.
9 0.
1 1.
7 0.
2 51
8
3.8
0.1
3.1
0.2
RII0
3 3.
7 0.
4 0.
019
0.00
2 0.
007
0.00
2 1.
3 0.
1 5.
0 0.
6 82
12
5.
7 0.
4 5.
3 0.
2
RII0
4 3.
5 0.
4 0.
011
0.00
2 <0
.005
-
0.7
0.1
3.2
0.2
23
10
5.6
0.2
5.0
0.2
RII0
6 2.
4 0.
1 0.
007
0.00
1 0.
006
0.00
7 <0
.6
- 0.
9 0.
4 8
1 6.
5 0.
4 4.
6 0.
1
RII0
7/SL
V 5.
5 2.
0 0.
017
0.00
2 0.
005
0.00
3 1.
1 0.
1 7.
0 0.
6 90
8
9.0
0.3
6.6
0.2
RII0
8/G
LI
8.9
2.0
0.01
4 0.
003
0.00
6 0.
002
1.4
0.2
7.4
2.1
215
30
8.4
0.8
6.7
0.6
RII0
9 6.
8 1.
5 0.
022
0.00
5 0.
007
0.00
2 1.
3 0.
1 5.
6 0.
2 11
1 17
7.
1 0.
2 4.
8 0.
6
RII1
0 5.
8 1.
8 0.
022
0.00
1 0.
006
0.00
1 1.
5 0.
1 5.
9 0.
3 90
12
6.
4 0.
2 4.
9 0.
1
FRI1
0R
4.5
1.2
0.01
5 0.
003
0.00
4 0.
001
1.0
0.1
5.4
0.2
67
10
4.4
0.2
3.7
0.1
NEF
20R
6.
2 1.
0 0.
014
0.00
7 0.
004
0.00
2 0.
9 0.
2 2.
5 0.
6 78
16
4.
7 0.
2 3.
4 0.
2
PSB1
3R
6.0
0.7
0.01
3 0.
001
0.00
4 0.
002
1.4
0.6
2.6
0.5
60
18
4.1
0.2
3.6
0.1
LFR
01R
7.
9 0.
8 0.
017
0.00
2 0.
003
0.00
1 1.
0 0.
0 5.
1 0.
1 74
25
5.
0 0.
1 3.
6 0.
1
FRY1
8R
5.3
1.3
0.03
5 0.
017
0.00
5 0.
001
1.6
0.0
5.3
0.3
80
13
5.9
0.2
4.9
0.4
RIN
29R
8.
2 1.
2 0.
029
0.00
4 0.
007
0.00
1 2.
1 0.
2 9.
3 1.
2 86
21
8.
7 0.
7 6.
9 0.
5
SIG
17R
2.
9 1.
0 0.
004
0.00
2 <0
.005
-
0.5
0.2
3.7
0.3
13
2 7.
8 0.
3 5.
5 0.
2
BAL2
7R
6.0
1.4
0.02
6 0.
004
0.00
7 0.
001
1.9
0.2
8.9
0.8
123
14
8.2
0.5
6.5
0.5
JOT3
0R
5.1
1.5
0.02
9 0.
004
0.00
8 0.
001
2.1
0.2
9.3
1.1
93
24
8.7
0.8
6.7
0.6
OD
I14R
2.
2 0.
4 0.
015
0.00
3 0.
005
0.00
5 0.
9 0.
2 3.
6 0.
7 51
13
5.
7 0.
5 4.
8 0.
3
VAR
14R
4.
7 0.
7 0.
006
0.00
1 0.
004
0.00
2 0.
8 0.
1 5.
2 0.
1 34
6
7.9
0.2
6.7
0.1
HEM
22R
8.
5 1.
4 0.
026
0.00
2 0.
007
0.00
0 2.
0 0.
2 7.
7 0.
8 13
1 20
6.
7 0.
5 6.
0 0.
4
SLE4
1R
5.4
1.4
0.00
4 0.
002
<0.0
05
- 1.
0 1.
2 4.
3 0.
9 18
9
9.1
0.3
6.3
0.1
Environmental monitoring survey of Region II, 2000 Akvaplan-niva report: APN-414.1890-1
Page 4-6
Background levels and calculated limits of significant contamination
Natural background levels of THC, NPD´s, 3-6 ring aromatics, decalins and metals will always be present in the sediments. Different natural background levels of chemical parameters reflect differences in sediment characteristics across the region.
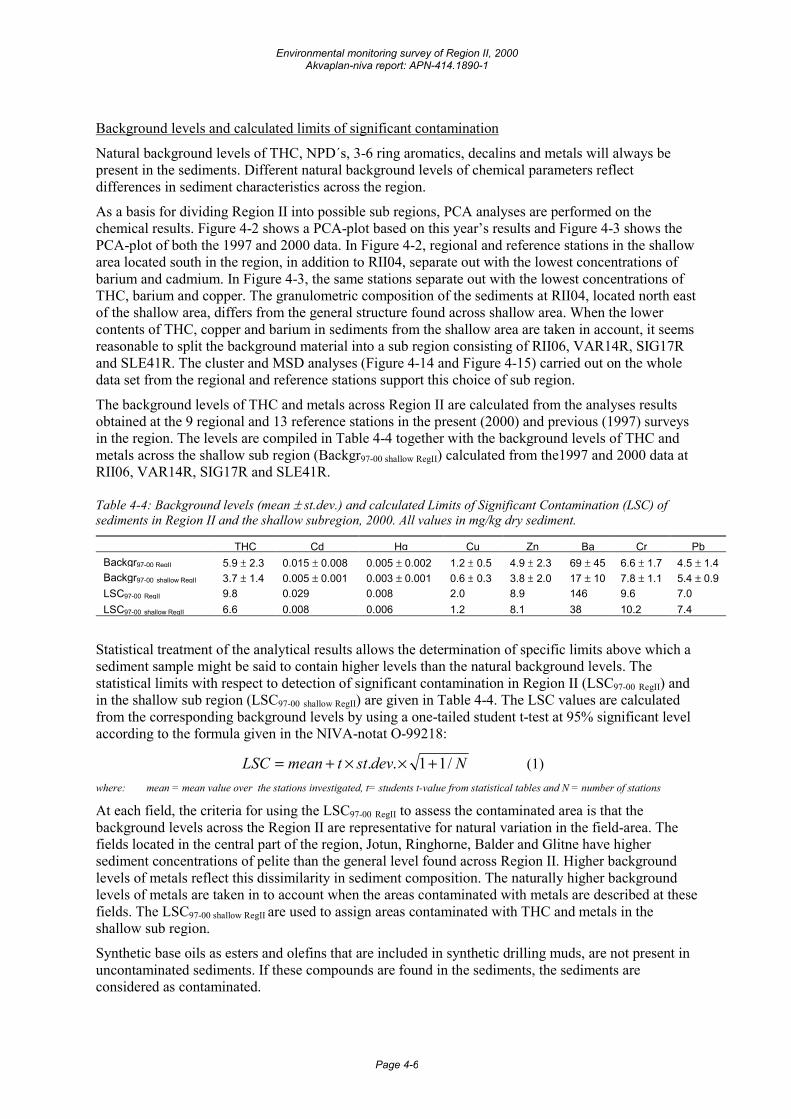
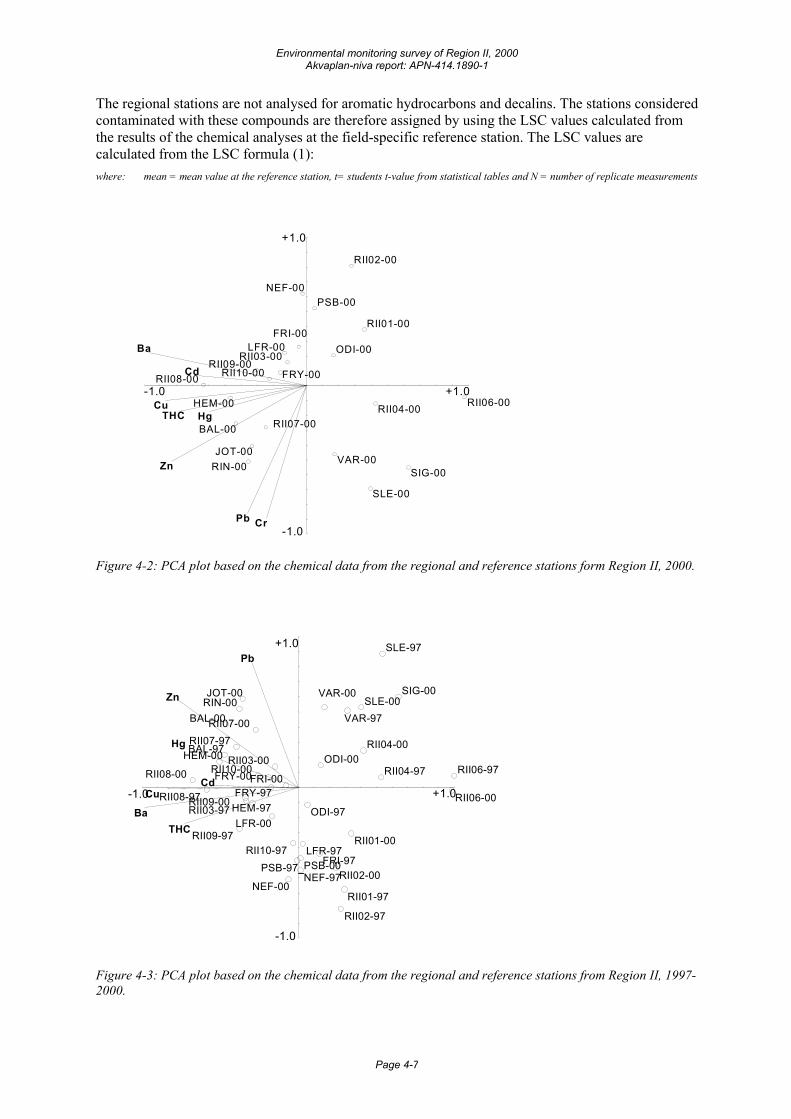
As a basis for dividing Region II into possible sub regions, PCA analyses are performed on the chemical results. Figure 4-2 shows a PCA-plot based on this year’s results and Figure 4-3 shows the PCA-plot of both the 1997 and 2000 data. In Figure 4-2, regional and reference stations in the shallow area located south in the region, in addition to RII04, separate out with the lowest concentrations of barium and cadmium. In Figure 4-3, the same stations separate out with the lowest concentrations of THC, barium and copper. The granulometric composition of the sediments at RII04, located north east of the shallow area, differs from the general structure found across shallow area. When the lower contents of THC, copper and barium in sediments from the shallow area are taken in account, it seems reasonable to split the background material into a sub region consisting of RII06, VAR14R, SIG17R and SLE41R. The cluster and MSD analyses (Figure 4-14 and Figure 4-15) carried out on the whole data set from the regional and reference stations support this choice of sub region.
The background levels of THC and metals across Region II are calculated from the analyses results obtained at the 9 regional and 13 reference stations in the present (2000) and previous (1997) surveys in the region. The levels are compiled in Table 4-4 together with the background levels of THC and metals across the shallow sub region (Backgr97-00 shallow RegII) calculated from the1997 and 2000 data at RII06, VAR14R, SIG17R and SLE41R.
Table 4-4: Background levels (mean ± st.dev.) and calculated Limits of Significant Contamination (LSC) of sediments in Region II and the shallow subregion, 2000. All values in mg/kg dry sediment.
THC Cd Hg Cu Zn Ba Cr PbBackgr97-00 RegII 5.9 ± 2.3 0.015 ± 0.008 0.005 ± 0.002 1.2 ± 0.5 4.9 ± 2.3 69 ± 45 6.6 ± 1.7 4.5 ± 1.4Backgr97-00 shallow RegII 3.7 ± 1.4 0.005 ± 0.001 0.003 ± 0.001 0.6 ± 0.3 3.8 ± 2.0 17 ± 10 7.8 ± 1.1 5.4 ± 0.9LSC97-00 RegII 9.8 0.029 0.008 2.0 8.9 146 9.6 7.0LSC97-00 shallow RegII 6.6 0.008 0.006 1.2 8.1 38 10.2 7.4
Statistical treatment of the analytical results allows the determination of specific limits above which a sediment sample might be said to contain higher levels than the natural background levels. The statistical limits with respect to detection of significant contamination in Region II (LSC97-00 RegII) and in the shallow sub region (LSC97-00 shallow RegII) are given in Table 4-4. The LSC values are calculated from the corresponding background levels by using a one-tailed student t-test at 95% significant level according to the formula given in the NIVA-notat O-99218:
NdevsttmeanLSC /11.. +××+= (1) where: mean = mean value over the stations investigated, t= students t-value from statistical tables and N = number of stations
At each field, the criteria for using the LSC97-00 RegII to assess the contaminated area is that the background levels across the Region II are representative for natural variation in the field-area. The fields located in the central part of the region, Jotun, Ringhorne, Balder and Glitne have higher sediment concentrations of pelite than the general level found across Region II. Higher background levels of metals reflect this dissimilarity in sediment composition. The naturally higher background levels of metals are taken in to account when the areas contaminated with metals are described at these fields. The LSC97-00 shallow RegII are used to assign areas contaminated with THC and metals in the shallow sub region.
Synthetic base oils as esters and olefins that are included in synthetic drilling muds, are not present in uncontaminated sediments. If these compounds are found in the sediments, the sediments are considered as contaminated.
Environmental monitoring survey of Region II, 2000 Akvaplan-niva report: APN-414.1890-1
Page 4-7
The regional stations are not analysed for aromatic hydrocarbons and decalins. The stations considered contaminated with these compounds are therefore assigned by using the LSC values calculated from the results of the chemical analyses at the field-specific reference station. The LSC values are calculated from the LSC formula (1): where: mean = mean value at the reference station, t= students t-value from statistical tables and N = number of replicate measurements
-1.0 +1.0
-1.0
+1.0
Ba
Cu
Zn
THC
Cd
Hg
Pb Cr
RII06-00
RII08-00
SIG-00
HEM-00
BAL-00
RII04-00
SLE-00
RII01-00
RIN-00JOT-00
RII09-00
RII02-00
RII07-00
RII10-00
VAR-00
ODI-00
FRY-00
LFR-00RII03-00
PSB-00
FRI-00
NEF-00
Figure 4-2: PCA plot based on the chemical data from the regional and reference stations form Region II, 2000.
-1.0 +1.0
-1.0
+1.0
Ba
Cu
Zn
THC
Hg
Cd
Pb
RII06-97
RII06-00
RII08-00
SIG-00
RII08-97
SLE-97
RII04-97HEM-00BAL-97
BAL-00
RII04-00
SLE-00
RII07-97
RIN-00
RII09-97
JOT-00
RII01-00
RII09-00 HEM-97
VAR-97
RII01-97
RII03-97
RII02-97
RII07-00
RII10-00
RII02-00
FRY-00FRY-97
VAR-00
LFR-00
RII03-00 ODI-00
FRI-97
FRI-00
NEF-00
ODI-97
RII10-97 LFR-97
NEF-97PSB-00PSB-97_
Figure 4-3: PCA plot based on the chemical data from the regional and reference stations from Region II, 1997-2000.
Environmental monitoring survey of Region II, 2000 Akvaplan-niva report: APN-414.1890-1
Page 4-8
0
2
4
6
8
10
12
14
RII0
1
RII0
2
RII0
3
RII0
4
RII0
6
RII0
7/SL
V
RII0
8/G
LI
RII0
9
RII1
0
FRI1
0R
NEF
20R
PSB1
3R
LFR
01R
FRY1
8R
RIN
29R
SIG
17R
BAL2
7R
JOT3
0R
OD
I14R
VAR
14R
HEM
22R
SLE4
1R
THC
(mg/
kg d
ry s
edim
ent)
1997 2000
Figure 4-4: THC levels in sediment from regional and reference stations from the present (2000) and previous surveys in Region II.
0
50
100
150
200
250
RII0
1
RII0
2
RII0
3
RII0
4
RII0
6
RII0
7/SL
V
RII0
8/G
LI
RII0
9
RII1
0
FRI1
0R
NEF
20R
PSB1
3R
LFR
01R
FRY1
8R
RIN
29R
SIG
17R
BAL2
7R
JOT3
0R
OD
I14R
VAR
14R
HEM
22R
SLE4
1R
Ba (m
g/kg
dry
sed
imen
t)
1997 2000
Figure 4-5:Barium levels in sediment from regional and reference stations from the present (2000) and previous surveys in Region II.
0.0000.0100.0200.0300.0400.0500.060
RII0
1
RII0
2
RII0
3
RII0
4
RII0
6
RII0
7/SL
V
RII0
8/G
LI
RII0
9
RII1
0
FRI1
0R
NEF
20R
PSB1
3R
LFR
01R
FRY1
8R
RIN
29R
SIG
17R
BAL2
7R
JOT3
0R
OD
I14R
VAR
14R
HEM
22R
SLE4
1R
Cd
(mg/
kg d
ry s
edim
ent)
1997 2000
Figure 4-6: Cadmium levels in sediment from regional and reference stations from the present (2000) and previous surveys in Region II.
Environmental monitoring survey of Region II, 2000 Akvaplan-niva report: APN-414.1890-1
Page 4-9
0.0
0.5
1.0
1.5
2.0
2.5
RII0
1
RII0
2
RII0
3
RII0
4
RII0
6
RII0
7/SL
V
RII0
8/G
LI
RII0
9
RII1
0
FRI1
0R
NEF
20R
PSB1
3R
LFR
01R
FRY1
8R
RIN
29R
SIG
17R
BAL2
7R
JOT3
0R
OD
I14R
VAR
14R
HEM
22R
SLE4
1R
Cu
(mg/
kg d
ry s
edim
ent)
1997 2000
Figure 4-7 : Copper levels in sediment from regional and reference stations from the present (2000) and previous surveys in Region II.
02468
1012
RII0
1
RII0
2
RII0
3
RII0
4
RII0
6
RII0
7/SL
V
RII0
8/G
LI
RII0
9
RII1
0
FRI1
0R
NEF
20R
PSB1
3R
LFR
01R
FRY1
8R
RIN
29R
SIG
17R
BAL2
7R
JOT3
0R
OD
I14R
VAR
14R
HEM
22R
SLE4
1R
Zn (m
g/kg
dry
sed
imen
t)
1997 2000
Figure 4-8: Zinc levels in sediment from regional and reference stations from the present (2000) and previous surveys in Region II.
0
2
4
6
8
10
RII0
1
RII0
2
RII0
3
RII0
4
RII0
6
RII0
7/SL
V
RII0
8/G
LI
RII0
9
RII1
0
FRI1
0R
NEF
20R
PSB1
3R
LFR
01R
FRY1
8R
RIN
29R
SIG
17R
BAL2
7R
JOT3
0R
OD
I14R
VAR
14R
HEM
22R
SLE4
1R
Cr (
mg/
kg d
ry s
edim
ent)
2000
Figure 4-9: Chrome levels in sediment from regional and reference stations from the present (2000) and previous surveys in Region II.
0
2
4
6
8
RII0
1
RII0
2
RII0
3
RII0
4
RII0
6
RII0
7/SL
V
RII0
8/G
LI
RII0
9
RII1
0
FRI1
0R
NEF
20R
PSB1
3R
LFR
01R
FRY1
8R
RIN
29R
SIG
17R
BAL2
7R
JOT3
0R
OD
I14R
VAR
14R
HEM
22R
SLE4
1R
Pb (m
g/kg
dry
sed
imen
t)
1997 2000
Figure 4-10: Lead levels in sediment from regional and reference stations from the present (2000) and previous surveys in Region II.
Environmental monitoring survey of Region II, 2000 Akvaplan-niva report: APN-414.1890-1
Page 4-10
The sediments from the regional stations are analysed for metals by two different analytical procedures. The sediment samples are first analysed for cadmium, mercury, copper, zinc, barium, chromium and lead by extraction of metals from the sediments by using nitric acid (NS 4770.) However, this procedure does not compensate for inherent differences in metal content related to the granulometric composition of the sediments.
Digestion with hydrofluoric acid (HF) and aqua regia is an improved extraction technique that results in larger yield of a metal compared to the total amount of an element in a sediment sample. The sediments from the regional stations digested with HF/aqua regia are, in addition to cadmium, copper, zinc, barium, lead and chromium, analysed for lithium and aluminium. The lithium and aluminium concentrations can be used to normalise the metal values. By using this method, it is to a larger extent possible to compare metal values from areas with different sediment composition and thus different natural metal content (Loring 1990). The average content of metals found by analyses of three replicate sediment samples from each regional station by using HF/aqua regia are summarised in Table 4-5 together with the average concentrations of metals found in the same three replicate sediment samples by using nitric acid. The full data set of replicate measurements is given in the Appendix.
As expected, the concentrations found by digestion with HF/aqua regia are higher than the concentrations found by using nitric acid. The relative amount of an element found by “partial” digestion with nitric acid, and by “total” digestion HF/aqua regia varies depending upon the sediment structure/mineralogy at the station. This is illustrated by the concentrations of barium found at the regional stations RII06 and RII08/GLI. At station RII06 the mean barium content are 8 mg/kg (NS1470) and 260 mg/kg (HF/aqua regia) whereas the concentrations at RII08/GLI are 215 mg/kg (NS1470) and 497 mg/kg (HF/aqua regia.) Thus a change in extraction method from digestion with nitric acid to “total” digestion results in 33 and 2 times higher concentrations of barium. For the remaining metals, except cadmium, the concentrations found by “total” digestion range from 1.6 to 12 times the levels found by digestion with nitric acid.
The concentrations of barium and lead are plotted against the concentration of lithium and aluminium in Figure 4-11. A certain correlation between increased concentrations of barium and increased concentrations of aluminium might be seen. The points are more random distributed for barium against lithium and for lead against both lithium and aluminium. Principally, anthropogenic trace metal input to sediments shall give an anomalous point in a scatter plot. The number of measurements is limited and anomalous points in a plot may also rise if the normalisation method is unsuitable for the sediment.
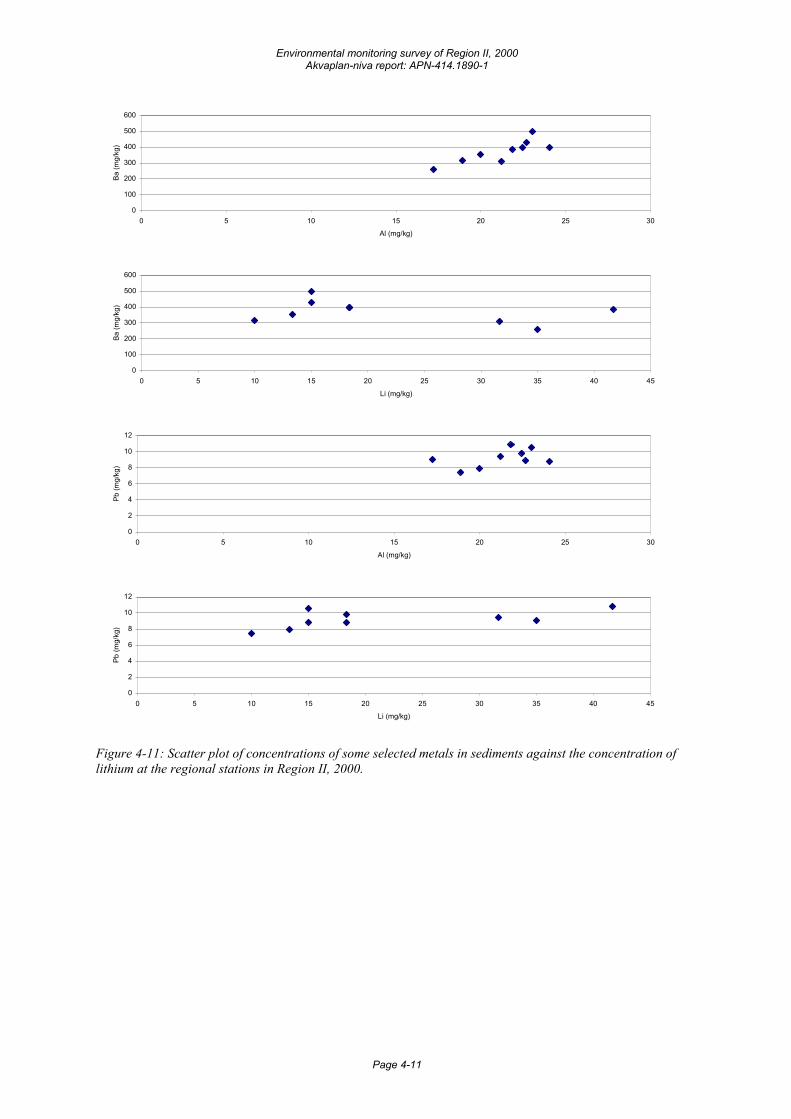
Environmental monitoring survey of Region II, 2000 Akvaplan-niva report: APN-414.1890-1
Page 4-11
0
100
200
300
400
500
600
0 5 10 15 20 25 30
Al (mg/kg)
Ba (m
g/kg
)
0
100
200
300
400
500
600
0 5 10 15 20 25 30 35 40 45
Li (mg/kg)
Ba (m
g/kg
)
0
2
4
6
8
10
12
0 5 10 15 20 25 30
Al (mg/kg)
Pb (m
g/kg
)
0
2
4
6
8
10
12
0 5 10 15 20 25 30 35 40 45
Li (mg/kg)
Pb (m
g/kg
)
Figure 4-11: Scatter plot of concentrations of some selected metals in sediments against the concentration of lithium at the regional stations in Region II, 2000.
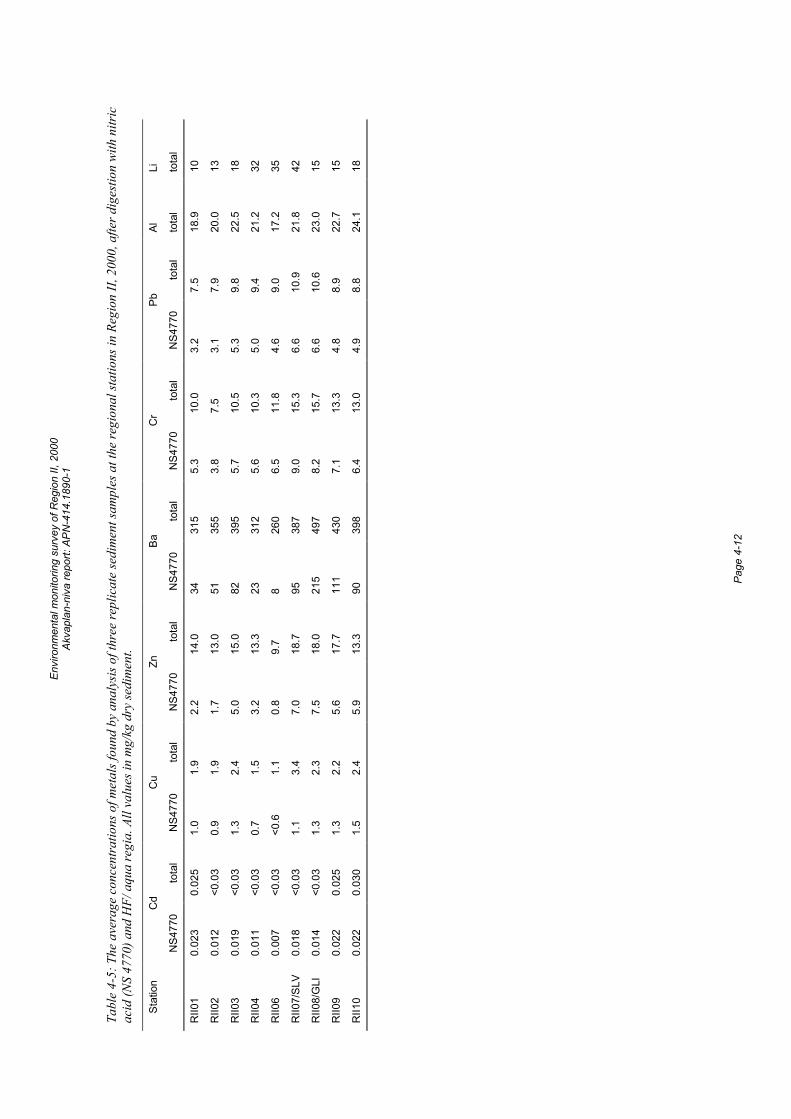
Envi
ronm
enta
l mon
itorin
g su
rvey
of R
egio
n II,
200
0 Ak
vapl
an-n
iva
repo
rt: A
PN-4
14.1
890-
1
Pa
ge 4
-12
Tabl
e 4-
5: T
he a
vera
ge c
once
ntra
tions
of m
etal
s fou
nd b
y an
alys
is of
thre
e re
plic
ate
sedi
men
t sam
ples
at t
he re
gion
al st
atio
ns in
Reg
ion
II, 2
000,
afte
r dig
estio
n wi
th n
itric
ac
id (N
S 47
70) a
nd H
F/ a
qua
regi
a. A
ll va
lues
in m
g/kg
dry
sedi
men
t.
Stat
ion
Cd
Cu
Zn
Ba
Cr
Pb
Al
Li
N
S477
0 to
tal
NS4
770
tota
l N
S477
0 to
tal
NS4
770
tota
l N
S477
0 to
tal
NS4
770
tota
l to
tal
tota
l
RII0
1 0.
023
0.02
5 1.
0 1.
9 2.
2 14
.0
34
315
5.3
10.0
3.
2 7.
5 18
.9
10
RII0
2 0.
012
<0.0
3 0.
9 1.
9 1.
7 13
.0
51
355
3.8
7.5
3.1
7.9
20.0
13
RII0
3 0.
019
<0.0
3 1.
3 2.
4 5.
0 15
.0
82
395
5.7
10.5
5.
3 9.
8 22
.5
18
RII0
4 0.
011
<0.0
3 0.
7 1.
5 3.
2 13
.3
23
312
5.6
10.3
5.
0 9.
4 21
.2
32
RII0
6 0.
007
<0.0
3 <0
.6
1.1
0.8
9.7
8 26
0 6.
5 11
.8
4.6
9.0
17.2
35
RII0
7/SL
V 0.
018
<0.0
3 1.
1 3.
4 7.
0 18
.7
95
387
9.0
15.3
6.
6 10
.9
21.8
42
RII0
8/G
LI
0.01
4 <0
.03
1.3
2.3
7.5
18.0
21
5 49
7 8.
2 15
.7
6.6
10.6
23
.0
15
RII0
9 0.
022
0.02
5 1.
3 2.
2 5.
6 17
.7
111
430
7.1
13.3
4.
8 8.
9 22
.7
15
RII1
0 0.
022
0.03
0 1.
5 2.
4 5.
9 13
.3
90
398
6.4
13.0
4.
9 8.
8 24
.1
18
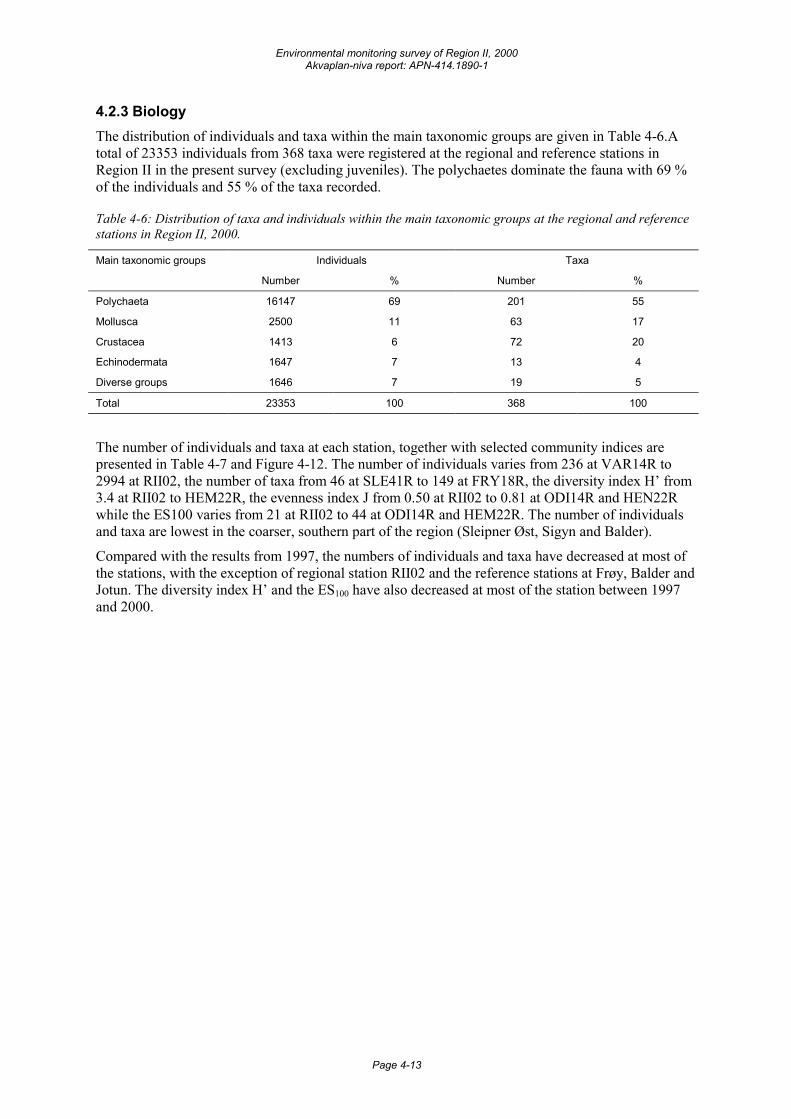
Environmental monitoring survey of Region II, 2000 Akvaplan-niva report: APN-414.1890-1
Page 4-13
4.2.3 Biology The distribution of individuals and taxa within the main taxonomic groups are given in Table 4-6.A total of 23353 individuals from 368 taxa were registered at the regional and reference stations in Region II in the present survey (excluding juveniles). The polychaetes dominate the fauna with 69 % of the individuals and 55 % of the taxa recorded.
Table 4-6: Distribution of taxa and individuals within the main taxonomic groups at the regional and reference stations in Region II, 2000.
Main taxonomic groups Individuals Taxa
Number % Number %
Polychaeta 16147 69 201 55
Mollusca 2500 11 63 17
Crustacea 1413 6 72 20
Echinodermata 1647 7 13 4
Diverse groups 1646 7 19 5
Total 23353 100 368 100
The number of individuals and taxa at each station, together with selected community indices are presented in Table 4-7 and Figure 4-12. The number of individuals varies from 236 at VAR14R to 2994 at RII02, the number of taxa from 46 at SLE41R to 149 at FRY18R, the diversity index H’ from 3.4 at RII02 to HEM22R, the evenness index J from 0.50 at RII02 to 0.81 at ODI14R and HEN22R while the ES100 varies from 21 at RII02 to 44 at ODI14R and HEM22R. The number of individuals and taxa are lowest in the coarser, southern part of the region (Sleipner Øst, Sigyn and Balder).
Compared with the results from 1997, the numbers of individuals and taxa have decreased at most of the stations, with the exception of regional station RII02 and the reference stations at Frøy, Balder and Jotun. The diversity index H’ and the ES100 have also decreased at most of the station between 1997 and 2000.
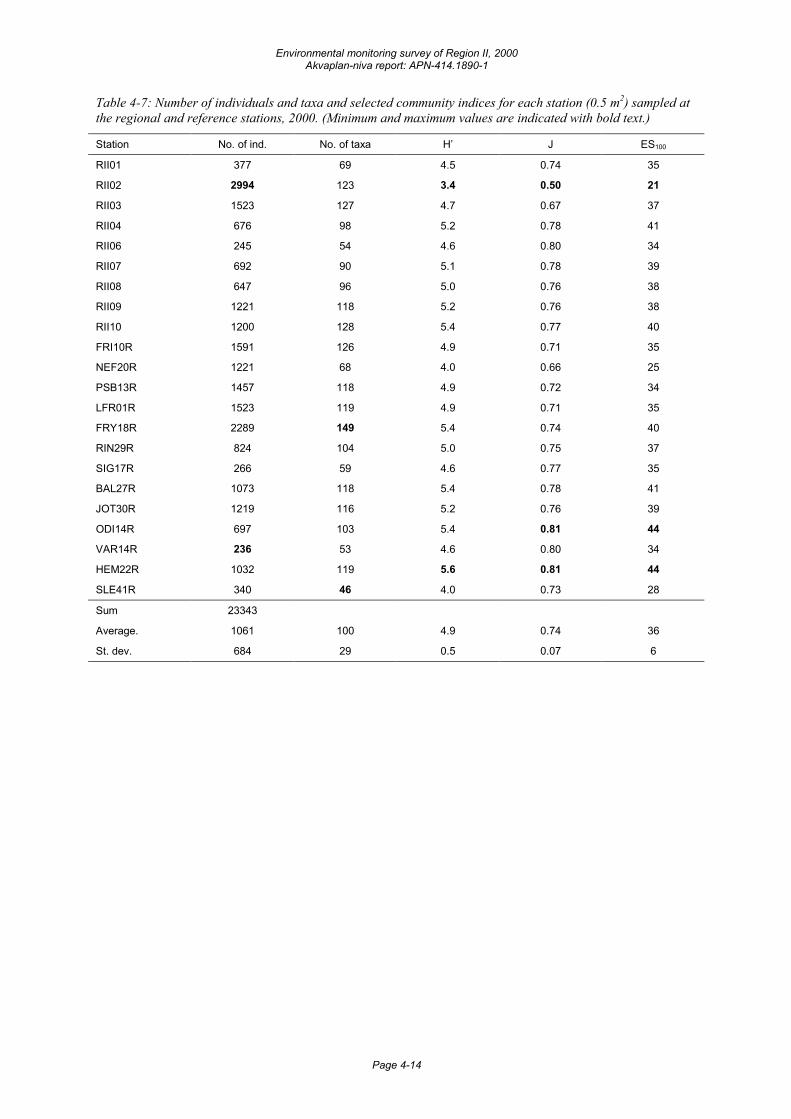
Environmental monitoring survey of Region II, 2000 Akvaplan-niva report: APN-414.1890-1
Page 4-14
Table 4-7: Number of individuals and taxa and selected community indices for each station (0.5 m2) sampled at the regional and reference stations, 2000. (Minimum and maximum values are indicated with bold text.)
Station No. of ind. No. of taxa H’ J ES100
RII01 377 69 4.5 0.74 35
RII02 2994 123 3.4 0.50 21
RII03 1523 127 4.7 0.67 37
RII04 676 98 5.2 0.78 41
RII06 245 54 4.6 0.80 34
RII07 692 90 5.1 0.78 39
RII08 647 96 5.0 0.76 38
RII09 1221 118 5.2 0.76 38
RII10 1200 128 5.4 0.77 40
FRI10R 1591 126 4.9 0.71 35
NEF20R 1221 68 4.0 0.66 25
PSB13R 1457 118 4.9 0.72 34
LFR01R 1523 119 4.9 0.71 35
FRY18R 2289 149 5.4 0.74 40
RIN29R 824 104 5.0 0.75 37
SIG17R 266 59 4.6 0.77 35
BAL27R 1073 118 5.4 0.78 41
JOT30R 1219 116 5.2 0.76 39
ODI14R 697 103 5.4 0.81 44
VAR14R 236 53 4.6 0.80 34
HEM22R 1032 119 5.6 0.81 44
SLE41R 340 46 4.0 0.73 28
Sum 23343
Average. 1061 100 4.9 0.74 36
St. dev. 684 29 0.5 0.07 6
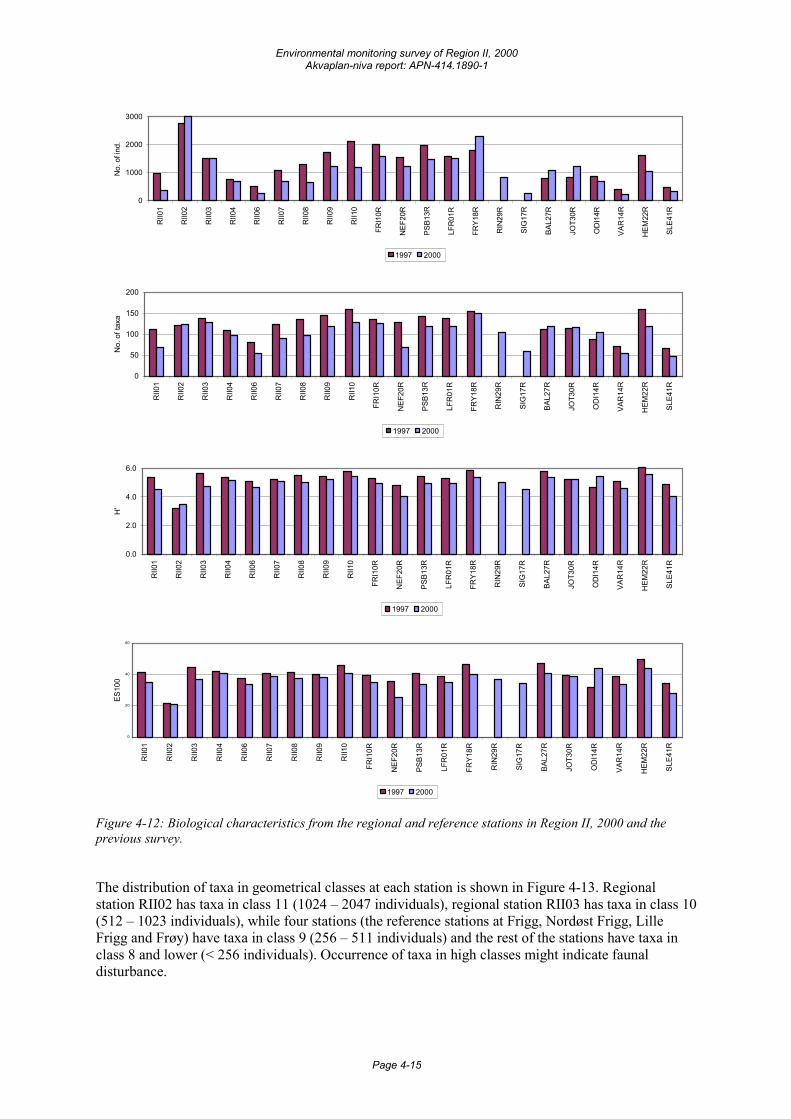
Environmental monitoring survey of Region II, 2000 Akvaplan-niva report: APN-414.1890-1
Page 4-15
0
1000
2000
3000
RII0
1
RII0
2
RII0
3
RII0
4
RII0
6
RII0
7
RII0
8
RII0
9
RII1
0
FRI1
0R
NEF
20R
PSB1
3R
LFR
01R
FRY1
8R
RIN
29R
SIG
17R
BAL2
7R
JOT3
0R
OD
I14R
VAR
14R
HEM
22R
SLE4
1R
No.
of i
nd.
1997 2000
0
50
100
150
200
RII0
1
RII0
2
RII0
3
RII0
4
RII0
6
RII0
7
RII0
8
RII0
9
RII1
0
FRI1
0R
NEF
20R
PSB1
3R
LFR
01R
FRY1
8R
RIN
29R
SIG
17R
BAL2
7R
JOT3
0R
OD
I14R
VAR
14R
HEM
22R
SLE4
1R
No.
of t
axa
1997 2000
0.0
2.0
4.0
6.0
RII0
1
RII0
2
RII0
3
RII0
4
RII0
6
RII0
7
RII0
8
RII0
9
RII1
0
FRI1
0R
NEF
20R
PSB1
3R
LFR
01R
FRY1
8R
RIN
29R
SIG
17R
BAL2
7R
JOT3
0R
OD
I14R
VAR
14R
HEM
22R
SLE4
1R
H'
1997 2000
0
20
40
60
RII0
1
RII0
2
RII0
3
RII0
4
RII0
6
RII0
7
RII0
8
RII0
9
RII1
0
FRI1
0R
NEF
20R
PSB1
3R
LFR
01R
FRY1
8R
RIN
29R
SIG
17R
BAL2
7R
JOT3
0R
OD
I14R
VAR
14R
HEM
22R
SLE4
1R
ES10
0
1997 2000
Figure 4-12: Biological characteristics from the regional and reference stations in Region II, 2000 and the previous survey.
The distribution of taxa in geometrical classes at each station is shown in Figure 4-13. Regional station RII02 has taxa in class 11 (1024 – 2047 individuals), regional station RII03 has taxa in class 10 (512 – 1023 individuals), while four stations (the reference stations at Frigg, Nordøst Frigg, Lille Frigg and Frøy) have taxa in class 9 (256 – 511 individuals) and the rest of the stations have taxa in class 8 and lower (< 256 individuals). Occurrence of taxa in high classes might indicate faunal disturbance.
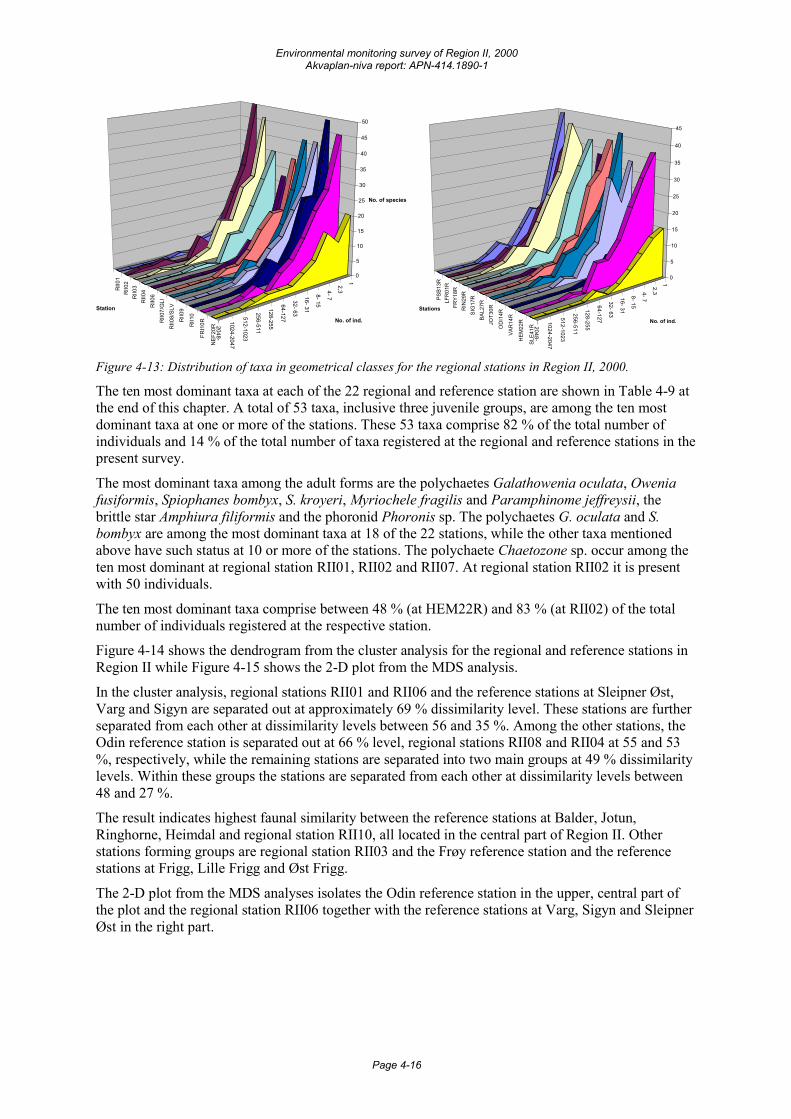
Environmental monitoring survey of Region II, 2000 Akvaplan-niva report: APN-414.1890-1
Page 4-16
12,3 4- 7
8- 15
16- 31
32- 63
64-127
128-255
256-511
512-1023
1024-2047
2048-
RII0
1R
II02
RII0
3R
II04
RII0
6R
II07/
GLI
RII0
8/SL
V
RII0
9
RII1
0
FRI1
0R
NEF
20R
0
5
10
15
20
25
30
35
40
45
50
No. of species
No. of ind.
Station
12,3 4- 7
8- 15
16- 31
32- 63
64-127
128-255
256-511
512-1023
1024-2047
2048-
PSB1
3RLF
R01
RFR
Y18R
RIN
29R
SIG
17R
BAL2
7RJO
T30R
OD
I14R
VAR
14R
HEM
22R
SLE4
1R
0
5
10
15
20
25
30
35
40
45
No. of ind.
Stations
Figure 4-13: Distribution of taxa in geometrical classes for the regional stations in Region II, 2000.
The ten most dominant taxa at each of the 22 regional and reference station are shown in Table 4-9 at the end of this chapter. A total of 53 taxa, inclusive three juvenile groups, are among the ten most dominant taxa at one or more of the stations. These 53 taxa comprise 82 % of the total number of individuals and 14 % of the total number of taxa registered at the regional and reference stations in the present survey.
The most dominant taxa among the adult forms are the polychaetes Galathowenia oculata, Owenia fusiformis, Spiophanes bombyx, S. kroyeri, Myriochele fragilis and Paramphinome jeffreysii, the brittle star Amphiura filiformis and the phoronid Phoronis sp. The polychaetes G. oculata and S. bombyx are among the most dominant taxa at 18 of the 22 stations, while the other taxa mentioned above have such status at 10 or more of the stations. The polychaete Chaetozone sp. occur among the ten most dominant at regional station RII01, RII02 and RII07. At regional station RII02 it is present with 50 individuals.
The ten most dominant taxa comprise between 48 % (at HEM22R) and 83 % (at RII02) of the total number of individuals registered at the respective station.
Figure 4-14 shows the dendrogram from the cluster analysis for the regional and reference stations in Region II while Figure 4-15 shows the 2-D plot from the MDS analysis.
In the cluster analysis, regional stations RII01 and RII06 and the reference stations at Sleipner Øst, Varg and Sigyn are separated out at approximately 69 % dissimilarity level. These stations are further separated from each other at dissimilarity levels between 56 and 35 %. Among the other stations, the Odin reference station is separated out at 66 % level, regional stations RII08 and RII04 at 55 and 53 %, respectively, while the remaining stations are separated into two main groups at 49 % dissimilarity levels. Within these groups the stations are separated from each other at dissimilarity levels between 48 and 27 %.
The result indicates highest faunal similarity between the reference stations at Balder, Jotun, Ringhorne, Heimdal and regional station RII10, all located in the central part of Region II. Other stations forming groups are regional station RII03 and the Frøy reference station and the reference stations at Frigg, Lille Frigg and Øst Frigg.
The 2-D plot from the MDS analyses isolates the Odin reference station in the upper, central part of the plot and the regional station RII06 together with the reference stations at Varg, Sigyn and Sleipner Øst in the right part.
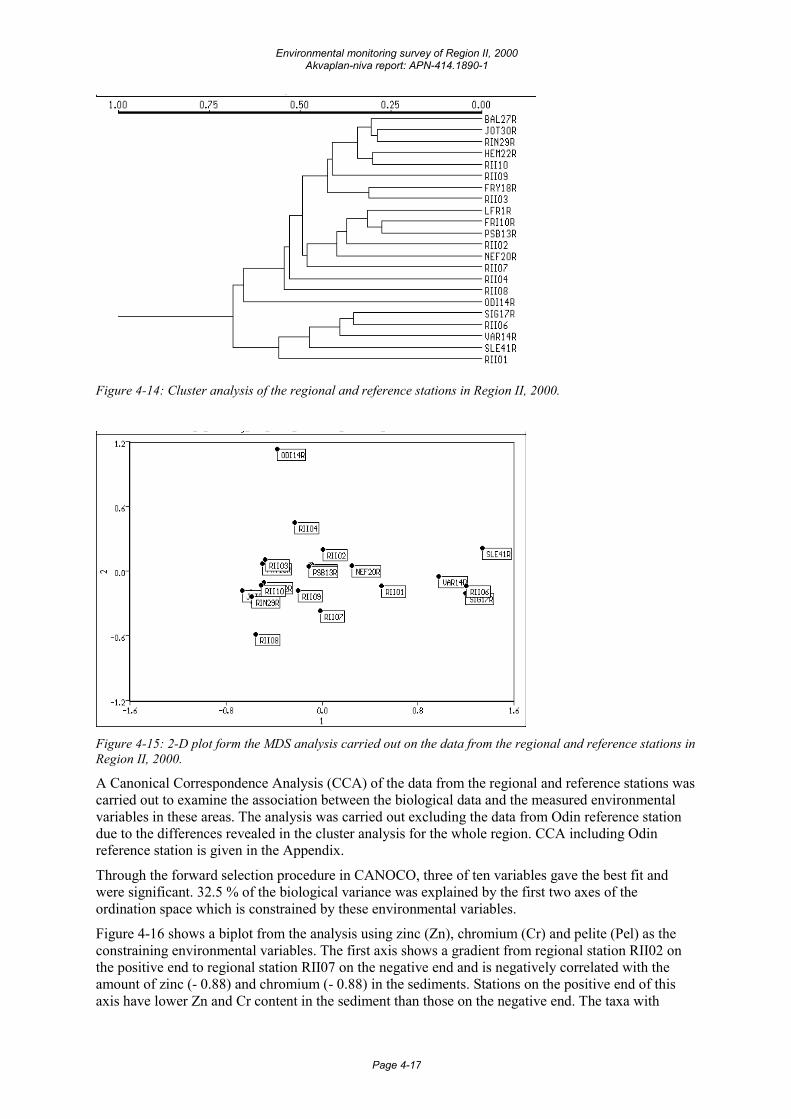
Environmental monitoring survey of Region II, 2000 Akvaplan-niva report: APN-414.1890-1
Page 4-17
Figure 4-14: Cluster analysis of the regional and reference stations in Region II, 2000.
Figure 4-15: 2-D plot form the MDS analysis carried out on the data from the regional and reference stations in Region II, 2000.
A Canonical Correspondence Analysis (CCA) of the data from the regional and reference stations was carried out to examine the association between the biological data and the measured environmental variables in these areas. The analysis was carried out excluding the data from Odin reference station due to the differences revealed in the cluster analysis for the whole region. CCA including Odin reference station is given in the Appendix.
Through the forward selection procedure in CANOCO, three of ten variables gave the best fit and were significant. 32.5 % of the biological variance was explained by the first two axes of the ordination space which is constrained by these environmental variables.
Figure 4-16 shows a biplot from the analysis using zinc (Zn), chromium (Cr) and pelite (Pel) as the constraining environmental variables. The first axis shows a gradient from regional station RII02 on the positive end to regional station RII07 on the negative end and is negatively correlated with the amount of zinc (- 0.88) and chromium (- 0.88) in the sediments. Stations on the positive end of this axis have lower Zn and Cr content in the sediment than those on the negative end. The taxa with
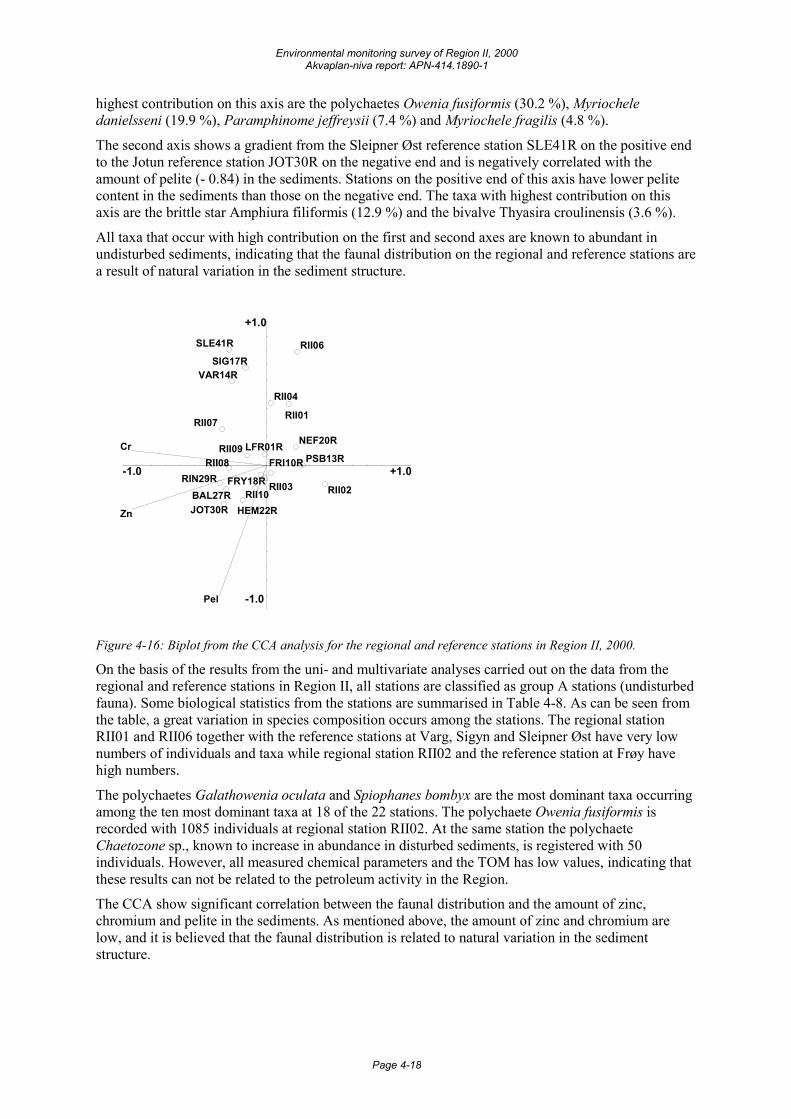
Environmental monitoring survey of Region II, 2000 Akvaplan-niva report: APN-414.1890-1
Page 4-18
highest contribution on this axis are the polychaetes Owenia fusiformis (30.2 %), Myriochele danielsseni (19.9 %), Paramphinome jeffreysii (7.4 %) and Myriochele fragilis (4.8 %).
The second axis shows a gradient from the Sleipner Øst reference station SLE41R on the positive end to the Jotun reference station JOT30R on the negative end and is negatively correlated with the amount of pelite (- 0.84) in the sediments. Stations on the positive end of this axis have lower pelite content in the sediments than those on the negative end. The taxa with highest contribution on this axis are the brittle star Amphiura filiformis (12.9 %) and the bivalve Thyasira croulinensis (3.6 %).
All taxa that occur with high contribution on the first and second axes are known to abundant in undisturbed sediments, indicating that the faunal distribution on the regional and reference stations are a result of natural variation in the sediment structure.
-1.0 +1.0
-1.0
+1.0
Cr
Zn
Pel
RII02RIN29R
RII07
JOT30RBAL27R
RII08
SLE41R
PSB13R
VAR14R
RII06
NEF20R
HEM22R
RII01
SIG17R
RII09
RII10FRY18R
FRI10R
RII04
LFR01R
RII03
Figure 4-16: Biplot from the CCA analysis for the regional and reference stations in Region II, 2000.
On the basis of the results from the uni- and multivariate analyses carried out on the data from the regional and reference stations in Region II, all stations are classified as group A stations (undisturbed fauna). Some biological statistics from the stations are summarised in Table 4-8. As can be seen from the table, a great variation in species composition occurs among the stations. The regional station RII01 and RII06 together with the reference stations at Varg, Sigyn and Sleipner Øst have very low numbers of individuals and taxa while regional station RII02 and the reference station at Frøy have high numbers.
The polychaetes Galathowenia oculata and Spiophanes bombyx are the most dominant taxa occurring among the ten most dominant taxa at 18 of the 22 stations. The polychaete Owenia fusiformis is recorded with 1085 individuals at regional station RII02. At the same station the polychaete Chaetozone sp., known to increase in abundance in disturbed sediments, is registered with 50 individuals. However, all measured chemical parameters and the TOM has low values, indicating that these results can not be related to the petroleum activity in the Region.
The CCA show significant correlation between the faunal distribution and the amount of zinc, chromium and pelite in the sediments. As mentioned above, the amount of zinc and chromium are low, and it is believed that the faunal distribution is related to natural variation in the sediment structure.
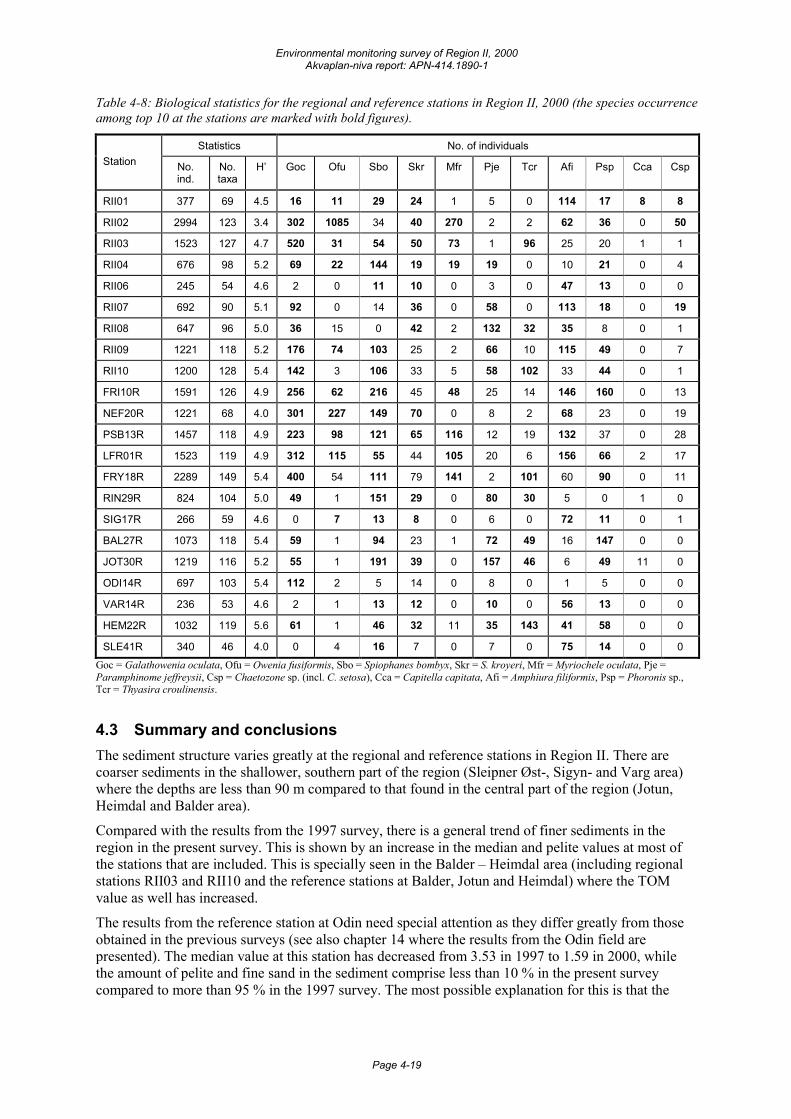
Environmental monitoring survey of Region II, 2000 Akvaplan-niva report: APN-414.1890-1
Page 4-19
Table 4-8: Biological statistics for the regional and reference stations in Region II, 2000 (the species occurrence among top 10 at the stations are marked with bold figures).
Statistics No. of individuals Station No.
ind. No. taxa
H’ Goc Ofu Sbo Skr Mfr Pje Tcr Afi Psp Cca Csp
RII01 377 69 4.5 16 11 29 24 1 5 0 114 17 8 8
RII02 2994 123 3.4 302 1085 34 40 270 2 2 62 36 0 50
RII03 1523 127 4.7 520 31 54 50 73 1 96 25 20 1 1
RII04 676 98 5.2 69 22 144 19 19 19 0 10 21 0 4
RII06 245 54 4.6 2 0 11 10 0 3 0 47 13 0 0
RII07 692 90 5.1 92 0 14 36 0 58 0 113 18 0 19
RII08 647 96 5.0 36 15 0 42 2 132 32 35 8 0 1
RII09 1221 118 5.2 176 74 103 25 2 66 10 115 49 0 7
RII10 1200 128 5.4 142 3 106 33 5 58 102 33 44 0 1
FRI10R 1591 126 4.9 256 62 216 45 48 25 14 146 160 0 13
NEF20R 1221 68 4.0 301 227 149 70 0 8 2 68 23 0 19
PSB13R 1457 118 4.9 223 98 121 65 116 12 19 132 37 0 28
LFR01R 1523 119 4.9 312 115 55 44 105 20 6 156 66 2 17
FRY18R 2289 149 5.4 400 54 111 79 141 2 101 60 90 0 11
RIN29R 824 104 5.0 49 1 151 29 0 80 30 5 0 1 0
SIG17R 266 59 4.6 0 7 13 8 0 6 0 72 11 0 1
BAL27R 1073 118 5.4 59 1 94 23 1 72 49 16 147 0 0
JOT30R 1219 116 5.2 55 1 191 39 0 157 46 6 49 11 0
ODI14R 697 103 5.4 112 2 5 14 0 8 0 1 5 0 0
VAR14R 236 53 4.6 2 1 13 12 0 10 0 56 13 0 0
HEM22R 1032 119 5.6 61 1 46 32 11 35 143 41 58 0 0
SLE41R 340 46 4.0 0 4 16 7 0 7 0 75 14 0 0 Goc = Galathowenia oculata, Ofu = Owenia fusiformis, Sbo = Spiophanes bombyx, Skr = S. kroyeri, Mfr = Myriochele oculata, Pje = Paramphinome jeffreysii, Csp = Chaetozone sp. (incl. C. setosa), Cca = Capitella capitata, Afi = Amphiura filiformis, Psp = Phoronis sp., Tcr = Thyasira croulinensis.
4.3 Summary and conclusions The sediment structure varies greatly at the regional and reference stations in Region II. There are coarser sediments in the shallower, southern part of the region (Sleipner Øst-, Sigyn- and Varg area) where the depths are less than 90 m compared to that found in the central part of the region (Jotun, Heimdal and Balder area).
Compared with the results from the 1997 survey, there is a general trend of finer sediments in the region in the present survey. This is shown by an increase in the median and pelite values at most of the stations that are included. This is specially seen in the Balder – Heimdal area (including regional stations RII03 and RII10 and the reference stations at Balder, Jotun and Heimdal) where the TOM value as well has increased.
The results from the reference station at Odin need special attention as they differ greatly from those obtained in the previous surveys (see also chapter 14 where the results from the Odin field are presented). The median value at this station has decreased from 3.53 in 1997 to 1.59 in 2000, while the amount of pelite and fine sand in the sediment comprise less than 10 % in the present survey compared to more than 95 % in the 1997 survey. The most possible explanation for this is that the
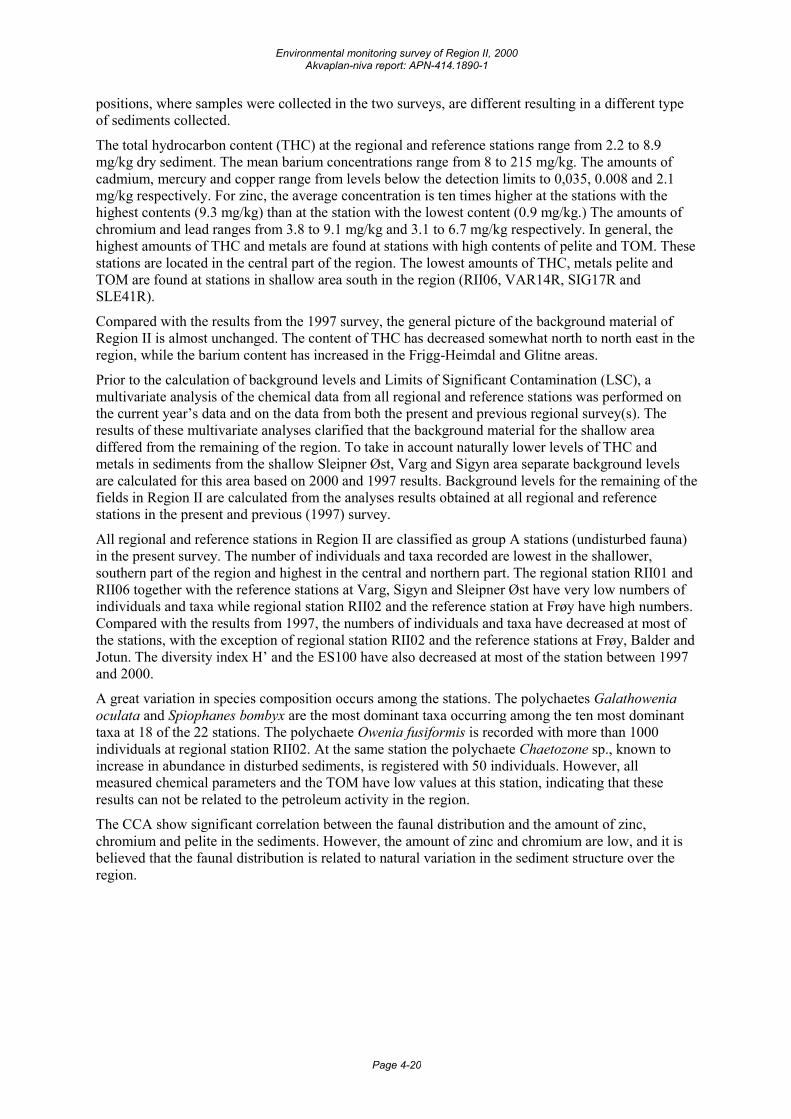
Environmental monitoring survey of Region II, 2000 Akvaplan-niva report: APN-414.1890-1
Page 4-20
positions, where samples were collected in the two surveys, are different resulting in a different type of sediments collected.
The total hydrocarbon content (THC) at the regional and reference stations range from 2.2 to 8.9 mg/kg dry sediment. The mean barium concentrations range from 8 to 215 mg/kg. The amounts of cadmium, mercury and copper range from levels below the detection limits to 0,035, 0.008 and 2.1 mg/kg respectively. For zinc, the average concentration is ten times higher at the stations with the highest contents (9.3 mg/kg) than at the station with the lowest content (0.9 mg/kg.) The amounts of chromium and lead ranges from 3.8 to 9.1 mg/kg and 3.1 to 6.7 mg/kg respectively. In general, the highest amounts of THC and metals are found at stations with high contents of pelite and TOM. These stations are located in the central part of the region. The lowest amounts of THC, metals pelite and TOM are found at stations in shallow area south in the region (RII06, VAR14R, SIG17R and SLE41R).
Compared with the results from the 1997 survey, the general picture of the background material of Region II is almost unchanged. The content of THC has decreased somewhat north to north east in the region, while the barium content has increased in the Frigg-Heimdal and Glitne areas.
Prior to the calculation of background levels and Limits of Significant Contamination (LSC), a multivariate analysis of the chemical data from all regional and reference stations was performed on the current year’s data and on the data from both the present and previous regional survey(s). The results of these multivariate analyses clarified that the background material for the shallow area differed from the remaining of the region. To take in account naturally lower levels of THC and metals in sediments from the shallow Sleipner Øst, Varg and Sigyn area separate background levels are calculated for this area based on 2000 and 1997 results. Background levels for the remaining of the fields in Region II are calculated from the analyses results obtained at all regional and reference stations in the present and previous (1997) survey.
All regional and reference stations in Region II are classified as group A stations (undisturbed fauna) in the present survey. The number of individuals and taxa recorded are lowest in the shallower, southern part of the region and highest in the central and northern part. The regional station RII01 and RII06 together with the reference stations at Varg, Sigyn and Sleipner Øst have very low numbers of individuals and taxa while regional station RII02 and the reference station at Frøy have high numbers. Compared with the results from 1997, the numbers of individuals and taxa have decreased at most of the stations, with the exception of regional station RII02 and the reference stations at Frøy, Balder and Jotun. The diversity index H’ and the ES100 have also decreased at most of the station between 1997 and 2000.
A great variation in species composition occurs among the stations. The polychaetes Galathowenia oculata and Spiophanes bombyx are the most dominant taxa occurring among the ten most dominant taxa at 18 of the 22 stations. The polychaete Owenia fusiformis is recorded with more than 1000 individuals at regional station RII02. At the same station the polychaete Chaetozone sp., known to increase in abundance in disturbed sediments, is registered with 50 individuals. However, all measured chemical parameters and the TOM have low values at this station, indicating that these results can not be related to the petroleum activity in the region.
The CCA show significant correlation between the faunal distribution and the amount of zinc, chromium and pelite in the sediments. However, the amount of zinc and chromium are low, and it is believed that the faunal distribution is related to natural variation in the sediment structure over the region.
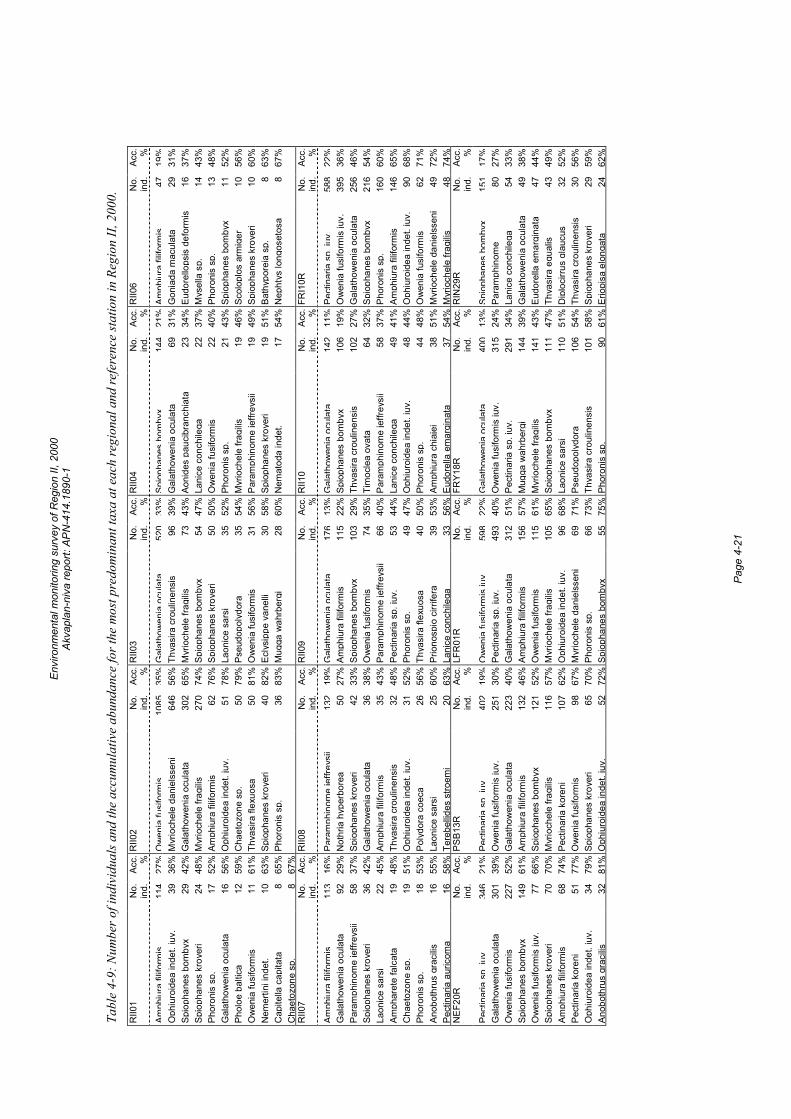
Envi
ronm
enta
l mon
itorin
g su
rvey
of R
egio
n II,
200
0 Ak
vapl
an-n
iva
repo
rt: A
PN-4
14.1
890-
1
Pa
ge 4
-21
Tabl
e 4-
9: N
umbe
r of i
ndiv
idua
ls an
d th
e ac
cum
ulat
ive
abun
danc
e fo
r the
mos
t pre
dom
inan
t tax
a at
eac
h re
gion
al a
nd re
fere
nce
stat
ion
in R
egio
n II
, 200
0.
RII0
1 N
o.
ind.
Ac
c.
% R
II02
No.
ind.
Acc. %
RII0
3 N
o.in
d.Ac
c.
% R
II04
No.
ind.
Acc. %
RII0
6 N
o.in
d.Ac
c. %Am
phiu
rafil
iform
is11
427
%O
wen
iafu
sifo
rmis
1085
35%
Gal
atho
wen
iaoc
ulat
a52
033
%Sp
ioph
anes
bom
byx
144
21%
Amph
iura
filifo
rmis
4719
%O
phiu
roid
ea in
det.
juv.
39
36
% M
yrio
chel
e da
niel
ssen
i64
656
%Th
yasi
ra c
roul
inen
sis
9639
% G
alat
how
enia
ocu
lata
6931
%G
onia
da m
acul
ata
2931
%Sp
ioph
anes
bom
byx
29
42%
Gal
atho
wen
ia o
cula
ta30
265
%M
yrio
chel
e fra
gilis
7343
% A
onid
es p
auci
bran
chia
ta23
34%
Eudo
rello
psis
def
orm
is16
37%
Spio
phan
es k
roye
ri 24
48
% M
yrio
chel
e fra
gilis
270
74%
Spio
phan
es b
omby
x54
47%
Lan
ice
conc
hile
ga22
37%
Mys
ella
sp.
1443
%Ph
oron
is s
p.
17
52%
Am
phiu
ra fi
lifor
mis
6276
%Sp
ioph
anes
kro
yeri
5050
% O
wen
ia fu
sifo
rmis
2240
%Ph
oron
is s
p.13
48%
Gal
atho
wen
ia o
cula
ta
16
56%
Oph
iuro
idea
inde
t. ju
v.51
78%
Laon
ice
sars
i35
52%
Pho
roni
s sp
.21
43%
Spio
phan
es b
omby
x11
52%
Phol
oe b
altic
a 12
59
% C
haet
ozon
e sp
.50
79%
Pseu
dopo
lydo
ra
3554
% M
yrio
chel
e fra
gilis
1946
%Sc
olop
los
arm
iger
1056
%O
wen
ia fu
sifo
rmis
11
61
% T
hyas
ira fl
exuo
sa50
81%
Ow
enia
fusi
form
is31
56%
Par
amph
inom
e je
ffrey
sii
1949
%Sp
ioph
anes
kro
yeri
1060
%N
emer
tini i
ndet
. 10
63
% S
piop
hane
s kr
oyer
i40
82%
Ecly
sipp
e va
nelli
3058
% S
piop
hane
s kr
oyer
i19
51%
Bath
ypor
eia
sp.
863
%C
apite
lla c
apita
ta
8 65
% P
horo
nis
sp.
3683
%M
ugga
wah
rber
gi28
60%
Nem
atod
a in
det.
1754
%N
epht
ys lo
ngos
etos
a8
67%
Cha
etoz
one
sp.
8 67
%
R
II07
No.
in
d.
Acc.
%
RII0
8 N
o.in
d.Ac
c. %R
II09
No.
ind.
Acc.
%
RII1
0 N
o.in
d.Ac
c. %FR
I10R
N
o.in
d.Ac
c. %Am
phiu
rafil
iform
is11
316
%Pa
ram
phin
ome
jeffr
eysi
i13
219
%G
alat
how
enia
ocul
ata
176
13%
Gal
atho
wen
iaoc
ulat
a14
211
%Pe
ctin
aria
sp.j
uv.
588
22%
Gal
atho
wen
ia o
cula
ta
92
29%
Not
hria
hyp
erbo
rea
5027
%Am
phiu
ra fi
lifor
mis
115
22%
Spi
opha
nes
bom
byx
106
19%
Ow
enia
fusi
form
is ju
v.39
536
%Pa
ram
phin
ome
jeffr
eysi
i 58
37
% S
piop
hane
s kr
oyer
i42
33%
Spio
phan
es b
omby
x10
329
% T
hyas
ira c
roul
inen
sis
102
27%
Gal
atho
wen
ia o
cula
ta25
646
%Sp
ioph
anes
kro
yeri
36
42%
Gal
atho
wen
ia o
cula
ta36
38%
Ow
enia
fusi
form
is74
35%
Tim
ocle
a ov
ata
6432
%Sp
ioph
anes
bom
byx
216
54%
Laon
ice
sars
i 22
45
% A
mph
iura
filif
orm
is35
43%
Para
mph
inom
e je
ffrey
sii
6640
% P
aram
phin
ome
jeffr
eysi
i58
37%
Phor
onis
sp.
160
60%
Amph
aret
e fa
lcat
a 19
48
% T
hyas
ira c
roul
inen
sis
3248
%Pe
ctin
aria
sp.
juv.
5344
% L
anic
e co
nchi
lega
4941
%Am
phiu
ra fi
lifor
mis
146
65%
Cha
etoz
one
sp.
19
51%
Oph
iuro
idea
inde
t. ju
v.31
52%
Phor
onis
sp.
4947
% O
phiu
roid
ea in
det.
juv.
4844
%O
phiu
roid
ea in
det.
juv.
9068
%Ph
oron
is s
p.
18
53%
Pol
ydor
a co
eca
2656
%Th
yasi
ra fl
exuo
sa40
50%
Pho
roni
s sp
.44
48%
Ow
enia
fusi
form
is62
71%
Anob
othr
us g
raci
lis
16
55%
Lao
nice
sar
si
2560
%Pr
iono
spio
cirr
ifera
3953
% A
mph
iura
chi
ajei
3851
%M
yrio
chel
e da
niel
ssen
i49
72%
Pect
inar
ia a
uric
oma
16
58%
Ter
ebel
lides
stro
emi
2063
%La
nice
con
chile
ga33
56%
Eud
orel
la e
mar
gina
ta37
54%
Myr
ioch
ele
fragi
lis48
74%
NEF
20R
N
o.
ind.
Ac
c.
% PS
B13R
N
o.in
d.Ac
c. %LF
R01
R
No.
ind.
Acc.
%
FRY1
8R
No.
ind.
Acc. %
RIN
29R
N
o.in
d.Ac
c. %Pe
ctin
aria
sp.j
uv.
346
21%
Pect
inar
iasp
.juv
.40
219
%O
wen
iafu
sifo
rmis
juv.
598
22%
Gal
atho
wen
iaoc
ulat
a40
013
%Sp
ioph
anes
bom
byx
151
17%
Gal
atho
wen
ia o
cula
ta
301
39%
Ow
enia
fusi
form
is ju
v.25
130
%Pe
ctin
aria
sp.
juv.
493
40%
Ow
enia
fusi
form
is ju
v.31
524
%Pa
ram
phin
ome
8027
%O
wen
ia fu
sifo
rmis
22
7 52
% G
alat
how
enia
ocu
lata
223
40%
Gal
atho
wen
ia o
cula
ta31
251
% P
ectin
aria
sp.
juv.
291
34%
Lani
ce c
onch
ilega
5433
%Sp
ioph
anes
bom
byx
149
61%
Am
phiu
ra fi
lifor
mis
132
46%
Amph
iura
filif
orm
is15
657
% M
ugga
wah
rber
gi14
439
%G
alat
how
enia
ocu
lata
4938
%O
wen
ia fu
sifo
rmis
juv.
77
66
% S
piop
hane
s bo
mby
x12
152
%O
wen
ia fu
sifo
rmis
115
61%
Myr
ioch
ele
fragi
lis14
143
%Eu
dore
lla e
mar
gina
ta47
44%
Spio
phan
es k
roye
ri 70
70
% M
yrio
chel
e fra
gilis
116
57%
Myr
ioch
ele
fragi
lis10
565
% S
piop
hane
s bo
mby
x11
147
%Th
yasi
ra e
qual
is43
49%
Amph
iura
filif
orm
is
68
74%
Pec
tinar
ia k
oren
i10
762
%O
phiu
roid
ea in
det.
juv.
9668
% L
aoni
ce s
arsi
110
51%
Dip
loci
rrus
glau
cus
3252
%Pe
ctin
aria
kor
eni
51
77%
Ow
enia
fusi
form
is98
67%
Myr
ioch
ele
dani
elss
eni
6971
% P
seud
opol
ydor
a 10
654
%Th
yasi
ra c
roul
inen
sis
3056
%O
phiu
roid
ea in
det.
juv.
34
79
% S
piop
hane
s kr
oyer
i65
70%
Phor
onis
sp.
6673
% T
hyas
ira c
roul
inen
sis
101
58%
Spio
phan
es k
roye
ri29
59%
Anob
othr
us g
raci
lis
32
81%
Oph
iuro
idea
inde
t. ju
v.52
72%
Spio
phan
es b
omby
x55
75%
Pho
roni
s sp
.90
61%
Erio
pisa
elo
ngat
a24
62%
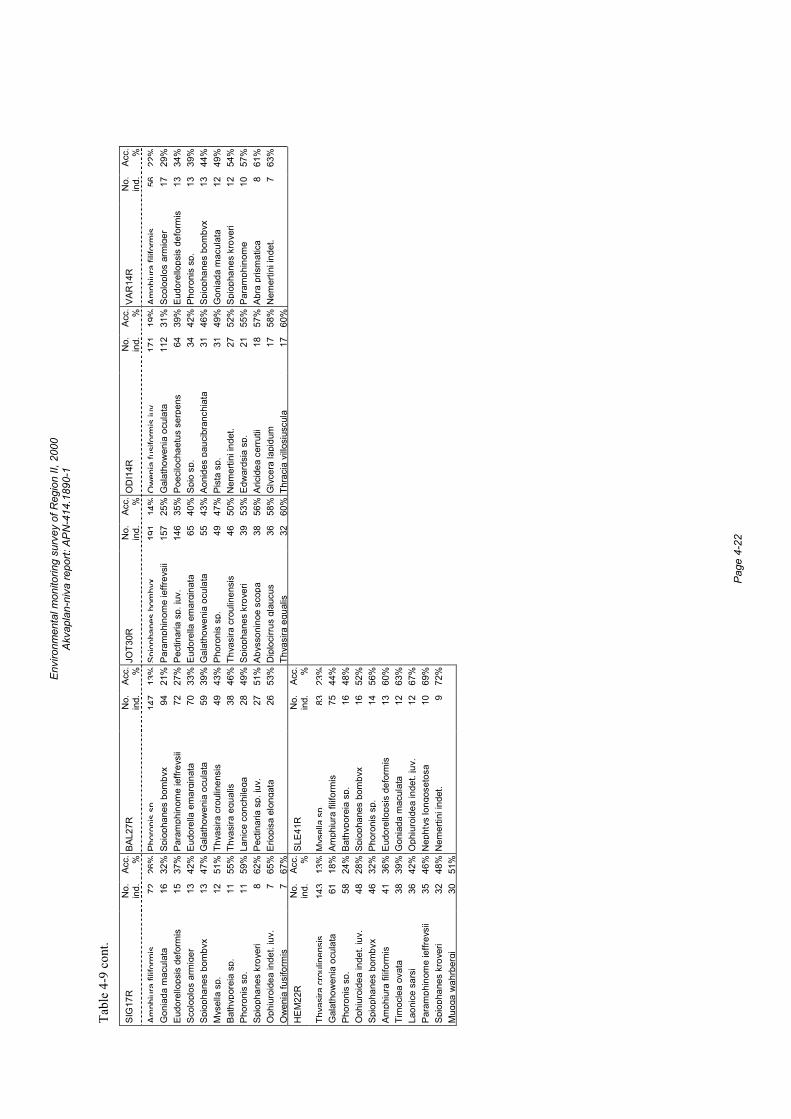
Envi
ronm
enta
l mon
itorin
g su
rvey
of R
egio
n II,
200
0 Ak
vapl
an-n
iva
repo
rt: A
PN-4
14.1
890-
1
Pa
ge 4
-22
Tabl
e 4-
9 co
nt.
SIG
17R
N
o.
ind.
Ac
c.
% BA
L27R
N
o.in
d.Ac
c. %JO
T30R
N
o.in
d.Ac
c.
% O
DI1
4R
No.
ind.
Acc. %
VAR
14R
N
o.in
d.Ac
c. %Am
phiu
rafil
iform
is72
26%
Phor
onis
sp.
147
13%
Spio
phan
esbo
mby
x19
114
%O
wen
iafu
sifo
rmis
juv.
171
19%
Amph
iura
filifo
rmis
5622
%G
onia
da m
acul
ata
16
32%
Spi
opha
nes
bom
byx
9421
%Pa
ram
phin
ome
jeffr
eysi
i15
725
% G
alat
how
enia
ocu
lata
112
31%
Scol
oplo
s ar
mig
er17
29%
Eudo
rello
psis
def
orm
is
15
37%
Par
amph
inom
e je
ffrey
sii
7227
%Pe
ctin
aria
sp.
juv.
146
35%
Poe
cilo
chae
tus
serp
ens
6439
%Eu
dore
llops
is d
efor
mis
1334
%Sc
olop
los
arm
iger
13
42
% E
udor
ella
em
argi
nata
7033
%Eu
dore
lla e
mar
gina
ta65
40%
Spi
o sp
.34
42%
Phor
onis
sp.
1339
%Sp
ioph
anes
bom
byx
13
47%
Gal
atho
wen
ia o
cula
ta59
39%
Gal
atho
wen
ia o
cula
ta55
43%
Aon
ides
pau
cibr
anch
iata
3146
%Sp
ioph
anes
bom
byx
1344
%M
ysel
la s
p.
12
51%
Thy
asira
cro
ulin
ensi
s49
43%
Phor
onis
sp.
4947
% P
ista
sp.
3149
%G
onia
da m
acul
ata
1249
%Ba
thyp
orei
a sp
. 11
55
% T
hyas
ira e
qual
is38
46%
Thya
sira
cro
ulin
ensi
s46
50%
Nem
ertin
i ind
et.
2752
%Sp
ioph
anes
kro
yeri
1254
%Ph
oron
is s
p.
11
59%
Lan
ice
conc
hile
ga28
49%
Spio
phan
es k
roye
ri39
53%
Edw
ards
ia s
p.21
55%
Para
mph
inom
e 10
57%
Spio
phan
es k
roye
ri 8
62%
Pec
tinar
ia s
p. ju
v.27
51%
Abys
soni
noe
scop
a 38
56%
Aric
idea
cer
rutii
1857
%Ab
ra p
rism
atic
a8
61%
Oph
iuro
idea
inde
t. ju
v.
7 65
% E
riopi
sa e
long
ata
2653
%D
iplo
cirru
s gl
aucu
s36
58%
Gly
cera
lapi
dum
1758
%N
emer
tini i
ndet
.7
63%
Ow
enia
fusi
form
is
7 67
%
Thya
sira
equ
alis
3260
% T
hrac
ia v
illosi
uscu
la17
60%
HE
M22
R
No.
in
d.
Acc.
%
SLE4
1R
No.
ind.
Acc. %
Thya
sira
crou
linen
sis
143
13%
Mys
ella
sp.
8323
%G
alat
how
enia
ocu
lata
61
18
% A
mph
iura
filif
orm
is75
44%
Ph
oron
is s
p.
58
24%
Bat
hypo
reia
sp.
1648
%
Oph
iuro
idea
inde
t. ju
v.
48
28%
Spi
opha
nes
bom
byx
1652
%
Spio
phan
es b
omby
x 46
32
% P
horo
nis
sp.
1456
%
Amph
iura
filif
orm
is
41
36%
Eud
orel
lops
is d
efor
mis
1360
%
Tim
ocle
a ov
ata
38
39%
Gon
iada
mac
ulat
a12
63%
La
onic
e sa
rsi
36
42%
Oph
iuro
idea
inde
t. ju
v.12
67%
Pa
ram
phin
ome
jeffr
eysi
i 35
46
% N
epht
ys lo
ngos
etos
a10
69%
Sp
ioph
anes
kro
yeri
32
48%
Nem
ertin
i ind
et.
972
%
Mug
ga w
ahrb
ergi
30
51
%
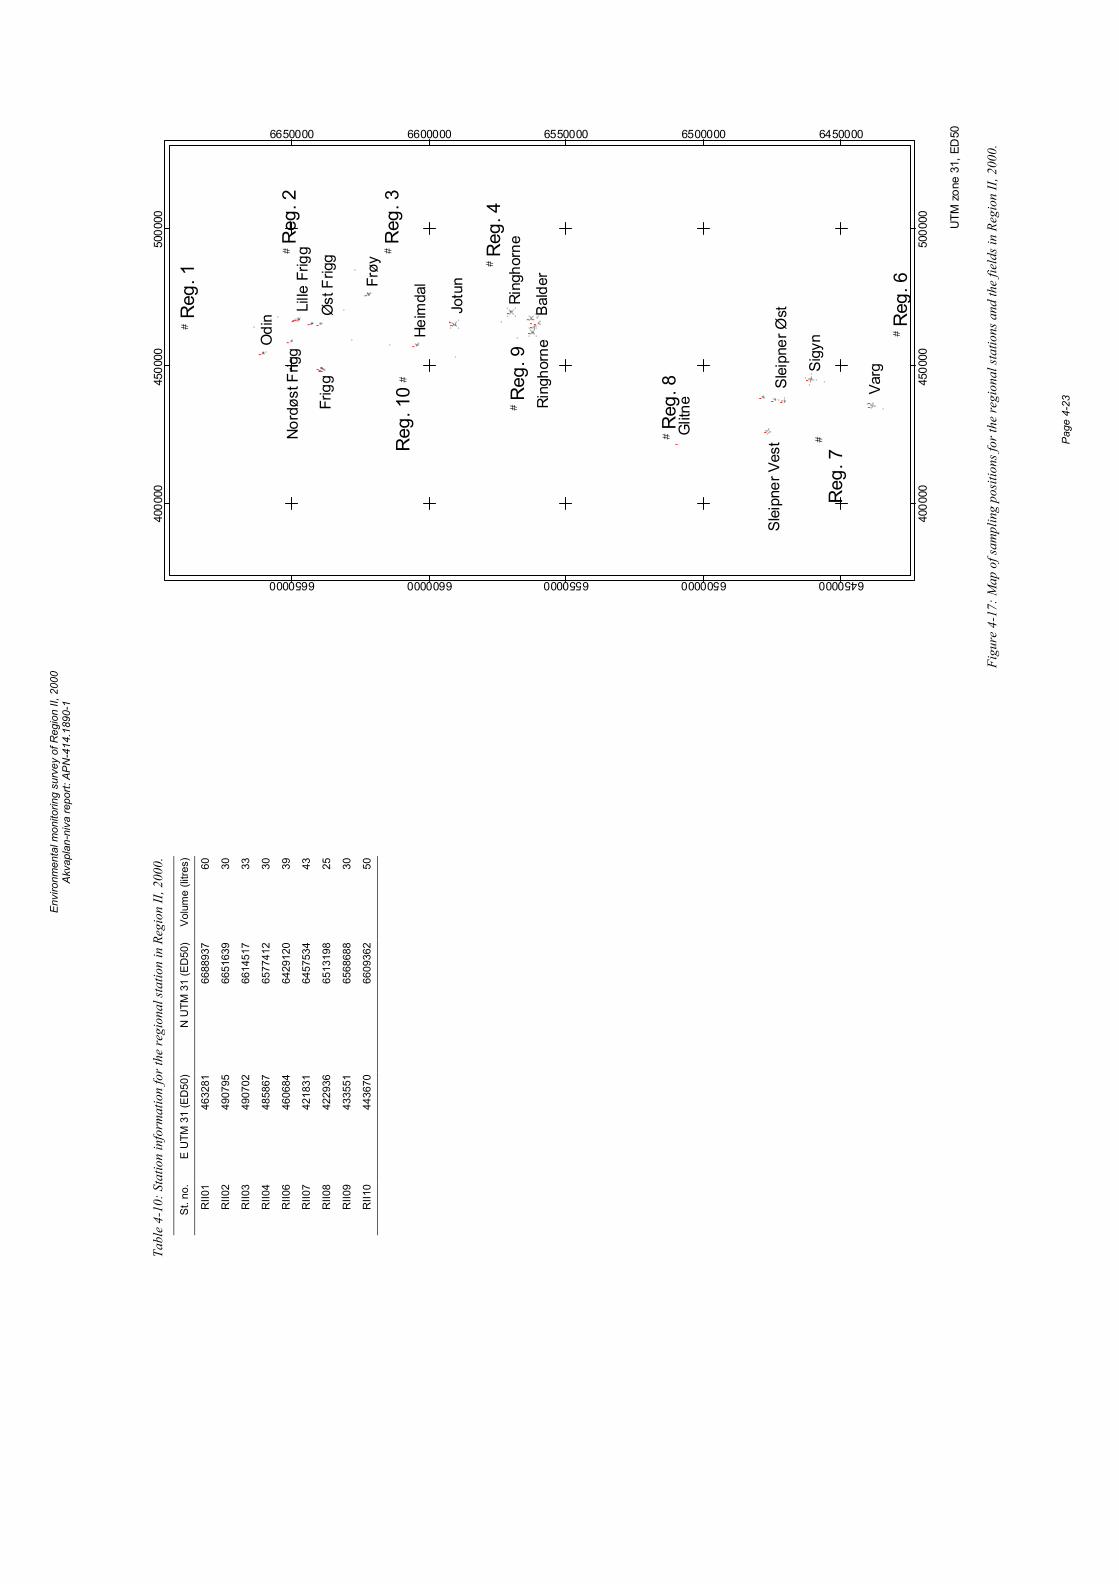
Envi
ronm
enta
l mon
itorin
g su
rvey
of R
egio
n II,
200
0 Ak
vapl
an-n
iva
repo
rt: A
PN-4
14.1
890-
1
Pa
ge 4
-23
Figu
re 4
-17:
Map
of s
ampl
ing
posit
ions
for t
he re
gion
al st
atio
ns a
nd th
e fie
lds i
n Re
gion
II, 2
000.
Tabl
e 4-
10: S
tatio
n in
form
atio
n fo
r the
regi
onal
stat
ion
in R
egio
n II,
200
0.
St. n
o.
E U
TM 3
1 (E
D50
) N
UTM
31
(ED
50)
Volu
me
(litre
s)
RII0
1 46
3281
66
8893
7 60
RII0
2 49
0795
66
5163
9 30
RII0
3 49
0702
66
1451
7 33
RII0
4 48
5867
65
7741
2 30
RII0
6 46
0684
64
2912
0 39
RII0
7 42
1831
64
5753
4 43
RII0
8 42
2936
65
1319
8 25
RII0
9 43
3551
65
6868
8 30
RII1
0 44
3670
66
0936
2 50
#
# #
#
#
##
#
#
# ##### # # #
# # #
#
###### # ##
###
###
## # #
###
# # ##
###
## #
# # #
##
#
#### # ## # #
#
#
# ## ###
#
## # # ## #
#
#
##
## # ##
##
#######
#######
#
###
#
###
#
#
#
# # # ###
##
### # # # #
#
## ### #
# # ### # # # ##
# ###
#
### ##
# ###
#
####
#
#
## ##
#
#### ###
#
## # #### # # ## #
#
#####
###
####
##### ##
##
#
##
''
'
' ''' '
'
' '
'
'
'
' '''
'
'
''' '
' ''''
'
Reg
. 1
Reg
. 2
Reg
. 3
Reg
. 4
Reg
. 10 Reg
. 9
Reg
. 8
Reg
. 7
Reg
. 6
Odi
n
Lille
Frig
g
Frøy
VargSi
gyn
Slei
pner
Øst
Slei
pner
Ves
t
Bald
er
Ring
horn
e
Jotu
n
Frig
g
Nord
øst F
rigg
Øst
Frig
g
Ring
horn
e
Glit
ne
Heim
dal
4000
00
4000
00
4500
00
4500
00
5000
00
5000
00
6450000
6450000
6500000
6500000
6550000
6550000
6600000
6600000
6650000
6650000
UTM
zon
e 31
, ED
50
Envi
ronm
enta
l mon
itorin
g su
rvey
of R
egio
n II,
200
0 Ak
vapl
an-n
iva
repo
rt: A
PN-4
14.1
890-
1
Pa
ge 4
-24
Environmental monitoring survey of Region II, 2000 Akvaplan-niva report: APN-411.1890-1
Frigg field 2000 Page 5-1
5 Frigg field 5.1 Introduction The Frigg field is located in blocks 25/1 and 30/10 in Region II. Production at the field started in 1977. There has been no drilling activity at the field since the previous survey. Recent discharges are summarised in Table 5-1. The accidental discharges in 1997 and 1998 all occur at the TCP2 installation and were related to the produced water system. It is believed that this oil quickly dispersed into the water masses. The drilling rig at the DP2 installation was removed during summer and autumn in 1999 and was cleaned during the operation. Sandy particles contaminated with hydrocarbons were released during this event.
In 1997 none of the sediment samples from Frigg were judged significantly contaminated by hydrocarbons. Sediments from the station situated 200 m in the 350° direction relative to TCP2 were contaminated by barium, cadmium, zinc, lead and copper, while sediments sampled 200 m in the 70° direction relative to TCP2 were contaminated by barium, zinc, lead and copper. Lead, zinc and copper contaminated sediments at the remaining stations, except the one situated 330 m at 70° relative to DP2. The fauna was found to be relatively undisturbed, although some minor signs of disturbance could be seen at the stations close to TCP2 and TP1. Therefore, the same set of stations is included in the present survey.
Information on the sampling stations is shown in Figure 5-13 and Table 5-13, both on the foldout page at the end of this chapter (page 5-19). In addition, samples from the cutting piles at the field were collected by use of a van Veen grab (biology) and box corer (chemistry). A separate report with these results will be produced.
Table 5-1: Summary of recent operational and accidental discharges at the Frigg field (all discharges in tonnes).
1997 1998 1999 2000 Comments
Oil in produced water 42.5 36.0 13.5 2.5
Accidental discharges 25.7 18.3 1.0 0.7
5.2 Results and discussion
5.2.1 Physical characteristics Th median phi value and the amounts (%) of pelite, fine sand and total organic material (TOM) in the sediments from the present and previous surveys are shown in Table 5-2 and Figure 5-1. Detailed data on sediment characteristics such as colour, smell and a full set of analytical data, including TOM content and grain size distribution (with standard deviation, evenness and kurtosis) can be found in the Appendix.
The sediments in the area are classified as fine sand with median values varying from 3.46 to 3.50. The amount of pelite in the sediment varies from 1.51 % (station FRI02) to 2.55 % (station FRI04), the fine sand from 85.6 % (station FRI25) to 91.1 % (station FRI02) while the TOM varies from 0.67 % (station FRI02) to 1.04 % (station FRI04). The sediment is finer at the reference station where the pelite content is 6.32 % and the TOM 1.18 %. At the field stations the pelite and TOM values are highest at stations south west of TP1 and DP2 (FRI04 and 11).
The pelite content has increased at all stations since the previous survey in 1997, while the TOM is more or less similar between the two surveys, with the exception of station FRI04 where an increase has occurred. Between 1992 and 1997, the pelite content has decreased at most of the stations. The median value has had a stable level throughout the period, with a small increase at the reference station between 1997 and 2000.
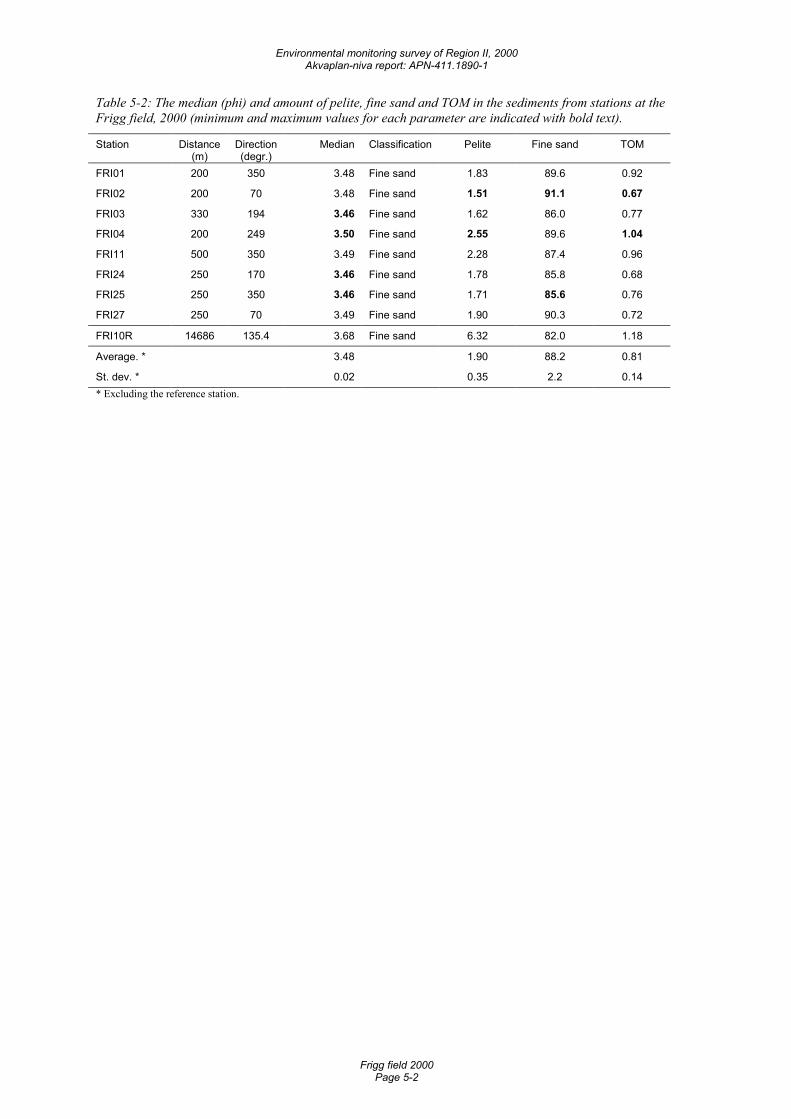
Environmental monitoring survey of Region II, 2000 Akvaplan-niva report: APN-411.1890-1
Frigg field 2000 Page 5-2
Table 5-2: The median (phi) and amount of pelite, fine sand and TOM in the sediments from stations at the Frigg field, 2000 (minimum and maximum values for each parameter are indicated with bold text).
Station Distance (m)
Direction (degr.)
Median Classification Pelite Fine sand TOM
FRI01 200 350 3.48 Fine sand 1.83 89.6 0.92
FRI02 200 70 3.48 Fine sand 1.51 91.1 0.67
FRI03 330 194 3.46 Fine sand 1.62 86.0 0.77
FRI04 200 249 3.50 Fine sand 2.55 89.6 1.04
FRI11 500 350 3.49 Fine sand 2.28 87.4 0.96
FRI24 250 170 3.46 Fine sand 1.78 85.8 0.68
FRI25 250 350 3.46 Fine sand 1.71 85.6 0.76
FRI27 250 70 3.49 Fine sand 1.90 90.3 0.72
FRI10R 14686 135.4 3.68 Fine sand 6.32 82.0 1.18
Average. * 3.48 1.90 88.2 0.81
St. dev. * 0.02 0.35 2.2 0.14 * Excluding the reference station.
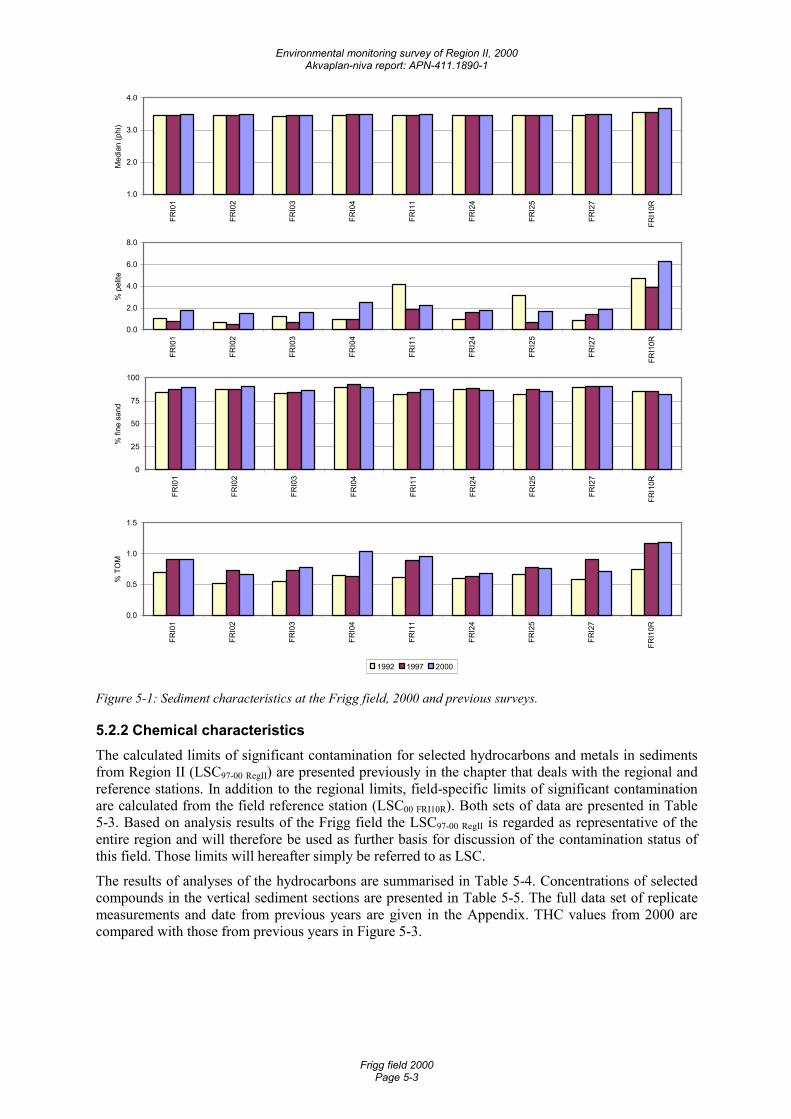
Environmental monitoring survey of Region II, 2000 Akvaplan-niva report: APN-411.1890-1
Frigg field 2000 Page 5-3
1.0
2.0
3.0
4.0
FRI0
1
FRI0
2
FRI0
3
FRI0
4
FRI1
1
FRI2
4
FRI2
5
FRI2
7
FRI1
0R
Med
ian
(phi
)
0.0
2.0
4.0
6.0
8.0
FRI0
1
FRI0
2
FRI0
3
FRI0
4
FRI1
1
FRI2
4
FRI2
5
FRI2
7
FRI1
0R
% p
elite
0
25
50
75
100
FRI0
1
FRI0
2
FRI0
3
FRI0
4
FRI1
1
FRI2
4
FRI2
5
FRI2
7
FRI1
0R
% fi
ne s
and
0.0
0.5
1.0
1.5
FRI0
1
FRI0
2
FRI0
3
FRI0
4
FRI1
1
FRI2
4
FRI2
5
FRI2
7
FRI1
0R
% T
OM
1992 1997 2000
Figure 5-1: Sediment characteristics at the Frigg field, 2000 and previous surveys.
5.2.2 Chemical characteristics The calculated limits of significant contamination for selected hydrocarbons and metals in sediments from Region II (LSC97-00 RegII) are presented previously in the chapter that deals with the regional and reference stations. In addition to the regional limits, field-specific limits of significant contamination are calculated from the field reference station (LSC00 FRI10R). Both sets of data are presented in Table 5-3. Based on analysis results of the Frigg field the LSC97-00 RegII is regarded as representative of the entire region and will therefore be used as further basis for discussion of the contamination status of this field. Those limits will hereafter simply be referred to as LSC.
The results of analyses of the hydrocarbons are summarised in Table 5-4. Concentrations of selected compounds in the vertical sediment sections are presented in Table 5-5. The full data set of replicate measurements and date from previous years are given in the Appendix. THC values from 2000 are compared with those from previous years in Figure 5-3.
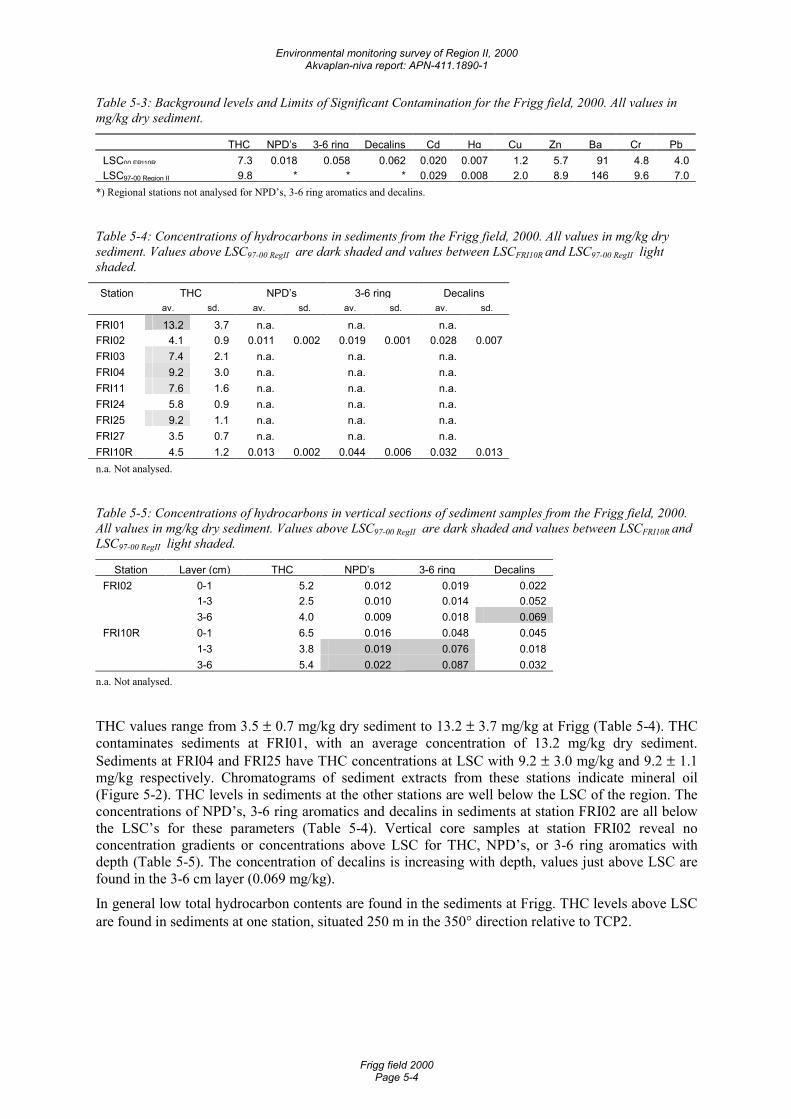
Environmental monitoring survey of Region II, 2000 Akvaplan-niva report: APN-411.1890-1
Frigg field 2000 Page 5-4
Table 5-3: Background levels and Limits of Significant Contamination for the Frigg field, 2000. All values in mg/kg dry sediment.
THC NPD’s 3-6 ring Decalins Cd Hg Cu Zn Ba Cr PbLSC00 FRI10R 7.3 0.018 0.058 0.062 0.020 0.007 1.2 5.7 91 4.8 4.0LSC97-00 Region II 9.8 * * * 0.029 0.008 2.0 8.9 146 9.6 7.0
*) Regional stations not analysed for NPD’s, 3-6 ring aromatics and decalins.
Table 5-4: Concentrations of hydrocarbons in sediments from the Frigg field, 2000. All values in mg/kg dry sediment. Values above LSC97-00 RegII are dark shaded and values between LSCFRI10R and LSC97-00 RegII light shaded.
Station THC NPD’s 3-6 ring Decalins av. sd. av. sd. av. sd. av. sd.
FRI01 13.2 3.7 n.a. n.a. n.a.FRI02 4.1 0.9 0.011 0.002 0.019 0.001 0.028 0.007FRI03 7.4 2.1 n.a. n.a. n.a.FRI04 9.2 3.0 n.a. n.a. n.a.FRI11 7.6 1.6 n.a. n.a. n.a.FRI24 5.8 0.9 n.a. n.a. n.a.FRI25 9.2 1.1 n.a. n.a. n.a.FRI27 3.5 0.7 n.a. n.a. n.a.FRI10R 4.5 1.2 0.013 0.002 0.044 0.006 0.032 0.013n.a. Not analysed.
Table 5-5: Concentrations of hydrocarbons in vertical sections of sediment samples from the Frigg field, 2000. All values in mg/kg dry sediment. Values above LSC97-00 RegII are dark shaded and values between LSCFRI10R and LSC97-00 RegII light shaded.
Station Layer (cm) THC NPD’s 3-6 ring DecalinsFRI02 0-1 5.2 0.012 0.019 0.022 1-3 2.5 0.010 0.014 0.052 3-6 4.0 0.009 0.018 0.069FRI10R 0-1 6.5 0.016 0.048 0.045 1-3 3.8 0.019 0.076 0.018 3-6 5.4 0.022 0.087 0.032
n.a. Not analysed.
THC values range from 3.5 ± 0.7 mg/kg dry sediment to 13.2 ± 3.7 mg/kg at Frigg (Table 5-4). THC contaminates sediments at FRI01, with an average concentration of 13.2 mg/kg dry sediment. Sediments at FRI04 and FRI25 have THC concentrations at LSC with 9.2 ± 3.0 mg/kg and 9.2 ± 1.1 mg/kg respectively. Chromatograms of sediment extracts from these stations indicate mineral oil (Figure 5-2). THC levels in sediments at the other stations are well below the LSC of the region. The concentrations of NPD’s, 3-6 ring aromatics and decalins in sediments at station FRI02 are all below the LSC’s for these parameters (Table 5-4). Vertical core samples at station FRI02 reveal no concentration gradients or concentrations above LSC for THC, NPD’s, or 3-6 ring aromatics with depth (Table 5-5). The concentration of decalins is increasing with depth, values just above LSC are found in the 3-6 cm layer (0.069 mg/kg).
In general low total hydrocarbon contents are found in the sediments at Frigg. THC levels above LSC are found in sediments at one station, situated 250 m in the 350° direction relative to TCP2.
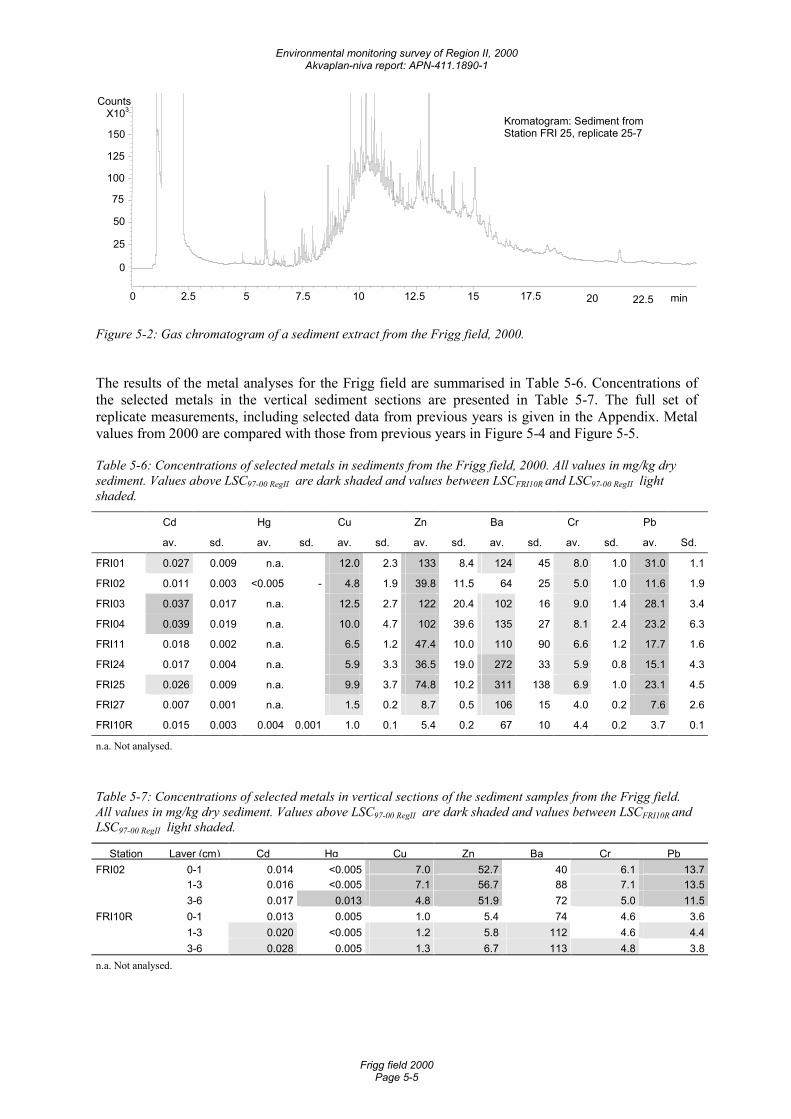
Environmental monitoring survey of Region II, 2000 Akvaplan-niva report: APN-411.1890-1
Frigg field 2000 Page 5-5
min 0 2.5 5 7.5 10 12.5 15 17.5 20 22.5
Counts X103
0
25
50
75
100
125
150 Kromatogram: Sediment from Station FRI 25, replicate 25-7
Figure 5-2: Gas chromatogram of a sediment extract from the Frigg field, 2000.
The results of the metal analyses for the Frigg field are summarised in Table 5-6. Concentrations of the selected metals in the vertical sediment sections are presented in Table 5-7. The full set of replicate measurements, including selected data from previous years is given in the Appendix. Metal values from 2000 are compared with those from previous years in Figure 5-4 and Figure 5-5.
Table 5-6: Concentrations of selected metals in sediments from the Frigg field, 2000. All values in mg/kg dry sediment. Values above LSC97-00 RegII are dark shaded and values between LSCFRI10R and LSC97-00 RegII light shaded.
Cd Hg Cu Zn Ba Cr Pb
av. sd. av. sd. av. sd. av. sd. av. sd. av. sd. av. Sd.
FRI01 0.027 0.009 n.a. 12.0 2.3 133 8.4 124 45 8.0 1.0 31.0 1.1
FRI02 0.011 0.003 <0.005 - 4.8 1.9 39.8 11.5 64 25 5.0 1.0 11.6 1.9
FRI03 0.037 0.017 n.a. 12.5 2.7 122 20.4 102 16 9.0 1.4 28.1 3.4
FRI04 0.039 0.019 n.a. 10.0 4.7 102 39.6 135 27 8.1 2.4 23.2 6.3
FRI11 0.018 0.002 n.a. 6.5 1.2 47.4 10.0 110 90 6.6 1.2 17.7 1.6
FRI24 0.017 0.004 n.a. 5.9 3.3 36.5 19.0 272 33 5.9 0.8 15.1 4.3
FRI25 0.026 0.009 n.a. 9.9 3.7 74.8 10.2 311 138 6.9 1.0 23.1 4.5
FRI27 0.007 0.001 n.a. 1.5 0.2 8.7 0.5 106 15 4.0 0.2 7.6 2.6
FRI10R 0.015 0.003 0.004 0.001 1.0 0.1 5.4 0.2 67 10 4.4 0.2 3.7 0.1
n.a. Not analysed.
Table 5-7: Concentrations of selected metals in vertical sections of the sediment samples from the Frigg field. All values in mg/kg dry sediment. Values above LSC97-00 RegII are dark shaded and values between LSCFRI10R and LSC97-00 RegII light shaded.
Station Layer (cm) Cd Hg Cu Zn Ba Cr PbFRI02 0-1 0.014 <0.005 7.0 52.7 40 6.1 13.7 1-3 0.016 <0.005 7.1 56.7 88 7.1 13.5 3-6 0.017 0.013 4.8 51.9 72 5.0 11.5FRI10R 0-1 0.013 0.005 1.0 5.4 74 4.6 3.6 1-3 0.020 <0.005 1.2 5.8 112 4.6 4.4 3-6 0.028 0.005 1.3 6.7 113 4.8 3.8n.a. Not analysed.
Environmental monitoring survey of Region II, 2000 Akvaplan-niva report: APN-411.1890-1
Frigg field 2000 Page 5-6
The barium values range from 64 ± 25 mg/kg to 311 ± 139 mg/kg dry sediment, cadmium from 0.006 ± 0.001 mg/kg to 0.039 ± 0.019 mg/kg, copper from1.5 ± 0.2 mg/kg to 12.5 ± 2.7 mg/kg, lead from 7.6 ± 2.6 mg/kg to 31.0 ± 1.1 mg/kg, zinc from 8.7 ± 0.5 mg/kg to 132.7 ± 8.4 mg/kg and chromium from 4.0 ± 0.1 to 9.0 ± 1.4 mg/kg.
Barium concentrations above LSC are found in sediments at FRI24 and FRI25, the highest concentrations found at FRI25 with 311 ± 139 mg/kg dry sediment. At the other field stations no sediment concentrations above LSC are measured. However, contamination by lead is found in sediments at all field stations. Contamination by copper and zinc are found in sediments at all stations except FRI27. Cadmium contamination is found in sediments at stations FRI03 and FRI04. The highest concentrations are found at station FRI01, with 12 mg copper /kg dry sediment, 133 mg zinc/kg and 31 mg lead/kg. No chromium or mercury contamination is found in sediments at Frigg.
Vertical core samples reveal elevated levels of copper, zinc and lead in all layers at FRI02 (Table 5-7). No distinct gradients are seen. Contamination with mercury is also found in the 3-6 cm layer on this location (0.013-mg/kg dry sediment).
In general low sediment concentrations of barium are found at Frigg. Contrary to this finding are the elevated levels of copper, zinc and lead with contamination at most stations sampled. No changes in mercury levels are observed.
Comparison with previous survey(s)
At the reference station sediment levels of THC, aromatics, decalins and selected metals except barium are comparable with the levels found in 1997. A minor increase in the barium level is found. Elevated levels of NPD’s and 3-6 ring aromatics are found in the 1-3 cm and 3-6 cm sediment layers on this location.
Contamination by hydrocarbons is only found in sediments at the station situated 200 m in the 350° direction relative to TCP2. The hydrocarbon levels in sediments at this station and at the one situated 330 m in the194° direction relative to TCP2 are a little higher in 2000 than in 1997 (Figure 5-3). This is also the case for sediments from the station situated 200 m in the 350° direction relative to DP2. Chromatograms of sediment extracts from these locations indicate mineral oil. This is in accordance with the field history, with spill of 92 tons oil in produced water and accidental discharges of 45 tons oil between 1997 and 1999. At the other field stations THC levels are comparable with those reported in 1997. The concentrations of NPD’s, 3-6 ring aromatics and decalins in sediments at the station situated 200 m in the 70° direction relative to TCP2 have decreased to about half of what were found in 1997 and the values are below LSC of the region. However, average THC concentrations in sediments at Frigg have increased from 6.6 mg/kg dry sediment to 7.5 mg/kg since 1997 (Figure 5-3).
Barium concentrations above LSC are found in sediments at two stations, situated 200 m in the 170° and 350° directions relative to DP2 (Figure 5-4). However, contamination by lead is found in sediments at all field stations (Figure 5-5). Contamination by copper and zinc are found in sediments at all field stations minus the one situated 330 m in the 70° direction relative to DP2. The highest concentrations of copper, zinc and lead are found 200 m in the 350° direction relative to TCP2, with 12 mg copper/kg, 133 mg zinc/kg and 31 mg lead/kg dry sediment. Cadmium contamination is found in sediments from position 330 m in the 194° direction relative to TCP2 and 200 m in the 249° direction relative to TP1. No chromium or mercury contamination is found in sediments at Frigg.
Sediment barium concentrations are higher in this survey than in 1997 at all stations except 200 m in the 70° and 350° directions relative to TCP2 (Figure 5-4). At stations situated 200 m in the 170°and 350° directions relative to DP2 the sediment concentrations of barium have increased about four times, bringing the levels above LSC of the region. The same pattern is seen for cadmium, copper, zinc and lead, with contamination in sediments at the majority of stations (Figure 5-5). The field history does not indicate anything that may explain this rise in metal concentrations.
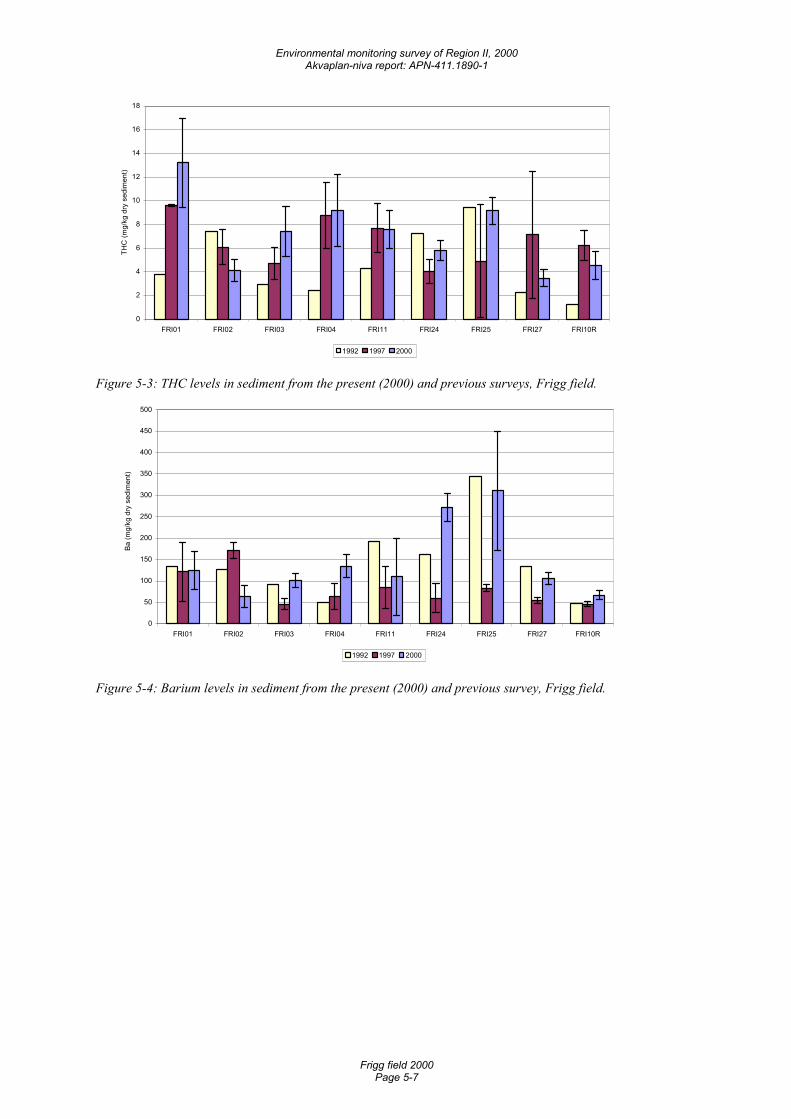
Environmental monitoring survey of Region II, 2000 Akvaplan-niva report: APN-411.1890-1
Frigg field 2000 Page 5-7
0
2
4
6
8
10
12
14
16
18
FRI01 FRI02 FRI03 FRI04 FRI11 FRI24 FRI25 FRI27 FRI10R
THC
(mg/
kg d
ry s
edim
ent)
1992 1997 2000
Figure 5-3: THC levels in sediment from the present (2000) and previous surveys, Frigg field.
0
50
100
150
200
250
300
350
400
450
500
FRI01 FRI02 FRI03 FRI04 FRI11 FRI24 FRI25 FRI27 FRI10R
Ba (m
g/kg
dry
sed
imen
t)
1992 1997 2000
Figure 5-4: Barium levels in sediment from the present (2000) and previous survey, Frigg field.
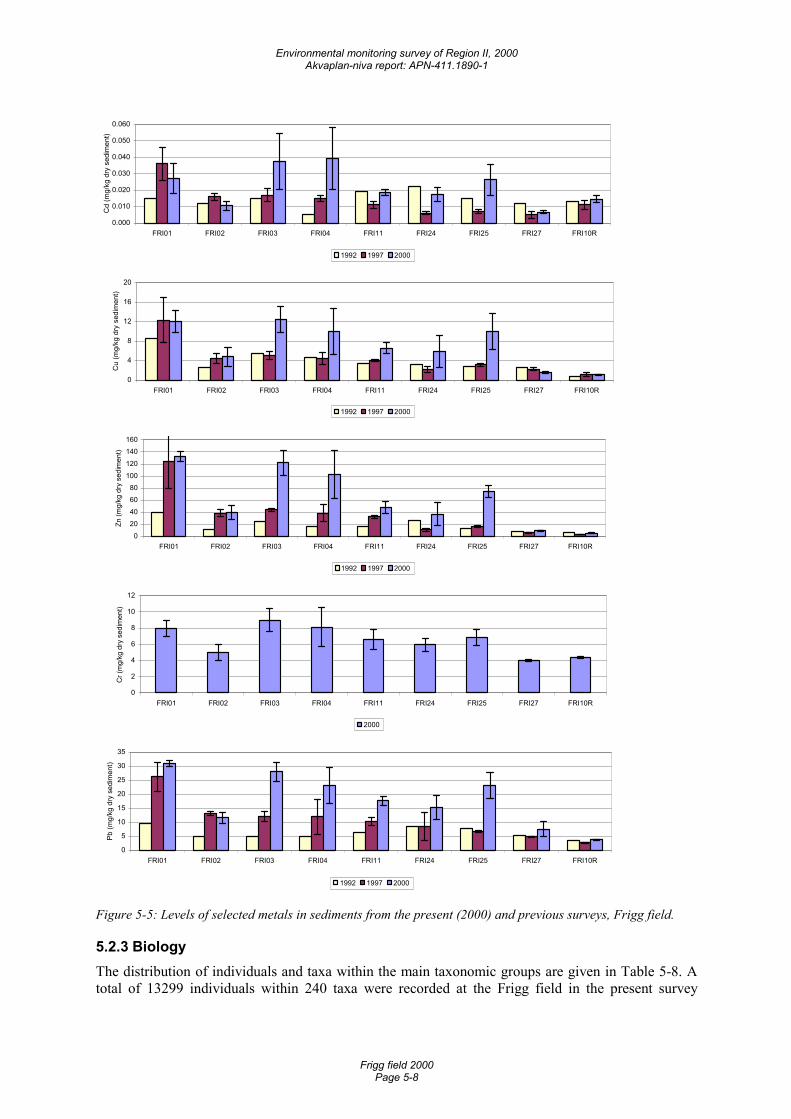
Environmental monitoring survey of Region II, 2000 Akvaplan-niva report: APN-411.1890-1
Frigg field 2000 Page 5-8
0.000
0.010
0.020
0.030
0.040
0.050
0.060
FRI01 FRI02 FRI03 FRI04 FRI11 FRI24 FRI25 FRI27 FRI10R
Cd
(mg/
kg d
ry s
edim
ent)
1992 1997 2000
0
4
8
12
16
20
FRI01 FRI02 FRI03 FRI04 FRI11 FRI24 FRI25 FRI27 FRI10R
Cu
(mg/
kg d
ry s
edim
ent)
1992 1997 2000
0
2040
6080
100
120
140160
FRI01 FRI02 FRI03 FRI04 FRI11 FRI24 FRI25 FRI27 FRI10R
Zn (m
g/kg
dry
sed
imen
t)
1992 1997 2000
0
2
4
6
8
10
12
FRI01 FRI02 FRI03 FRI04 FRI11 FRI24 FRI25 FRI27 FRI10R
Cr (
mg/
kg d
ry s
edim
ent)
2000
0
5
10
15
20
25
30
35
FRI01 FRI02 FRI03 FRI04 FRI11 FRI24 FRI25 FRI27 FRI10R
Pb (m
g/kg
dry
sed
imen
t)
1992 1997 2000
Figure 5-5: Levels of selected metals in sediments from the present (2000) and previous surveys, Frigg field.
5.2.3 Biology The distribution of individuals and taxa within the main taxonomic groups are given in Table 5-8. A total of 13299 individuals within 240 taxa were recorded at the Frigg field in the present survey
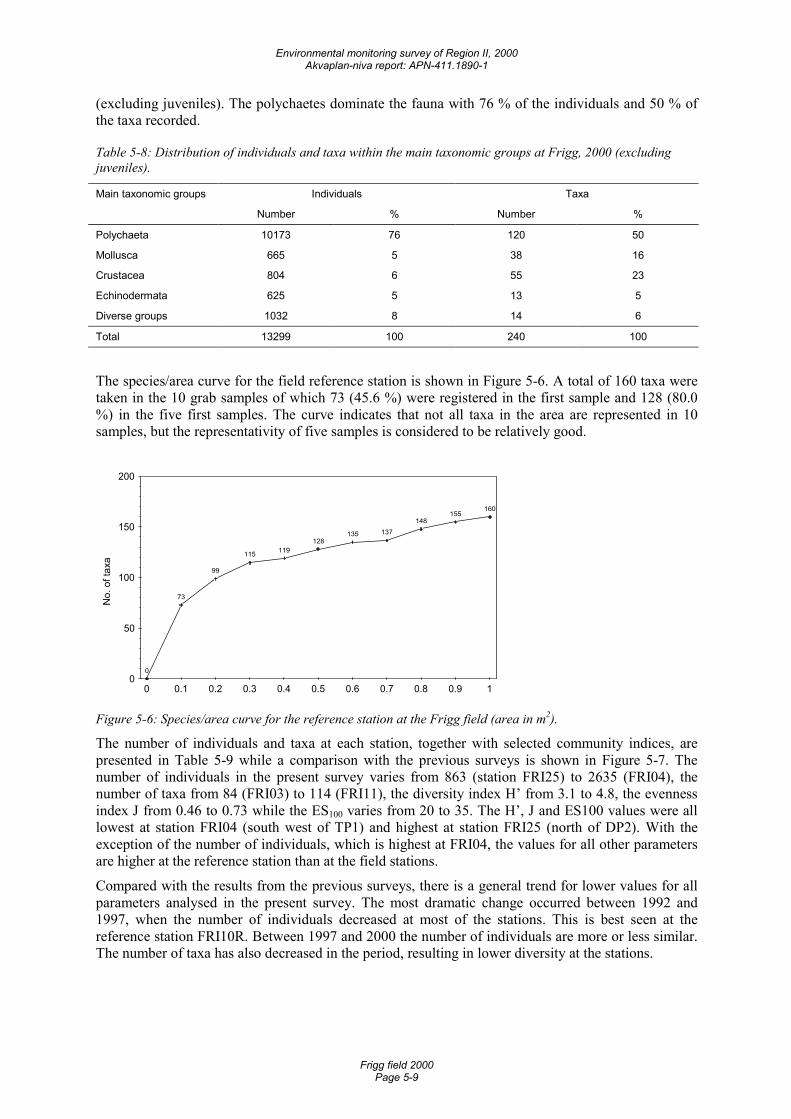
Environmental monitoring survey of Region II, 2000 Akvaplan-niva report: APN-411.1890-1
Frigg field 2000 Page 5-9
(excluding juveniles). The polychaetes dominate the fauna with 76 % of the individuals and 50 % of the taxa recorded.
Table 5-8: Distribution of individuals and taxa within the main taxonomic groups at Frigg, 2000 (excluding juveniles).
Main taxonomic groups Individuals Taxa
Number % Number %
Polychaeta 10173 76 120 50
Mollusca 665 5 38 16
Crustacea 804 6 55 23
Echinodermata 625 5 13 5
Diverse groups 1032 8 14 6
Total 13299 100 240 100
The species/area curve for the field reference station is shown in Figure 5-6. A total of 160 taxa were taken in the 10 grab samples of which 73 (45.6 %) were registered in the first sample and 128 (80.0 %) in the five first samples. The curve indicates that not all taxa in the area are represented in 10 samples, but the representativity of five samples is considered to be relatively good.
No.
of t
axa
0
73
99
115 119128
135 137148
155160
0
50
100
150
200
0 0.1 0.2 0.3 0.4 0.5 0.6 0.7 0.8 0.9 1
Figure 5-6: Species/area curve for the reference station at the Frigg field (area in m2).
The number of individuals and taxa at each station, together with selected community indices, are presented in Table 5-9 while a comparison with the previous surveys is shown in Figure 5-7. The number of individuals in the present survey varies from 863 (station FRI25) to 2635 (FRI04), the number of taxa from 84 (FRI03) to 114 (FRI11), the diversity index H’ from 3.1 to 4.8, the evenness index J from 0.46 to 0.73 while the ES100 varies from 20 to 35. The H’, J and ES100 values were all lowest at station FRI04 (south west of TP1) and highest at station FRI25 (north of DP2). With the exception of the number of individuals, which is highest at FRI04, the values for all other parameters are higher at the reference station than at the field stations.
Compared with the results from the previous surveys, there is a general trend for lower values for all parameters analysed in the present survey. The most dramatic change occurred between 1992 and 1997, when the number of individuals decreased at most of the stations. This is best seen at the reference station FRI10R. Between 1997 and 2000 the number of individuals are more or less similar. The number of taxa has also decreased in the period, resulting in lower diversity at the stations.

Environmental monitoring survey of Region II, 2000 Akvaplan-niva report: APN-411.1890-1
Frigg field 2000 Page 5-10
Table 5-9: Number of individuals and taxa and selected community indices for each station (0.5 m2) at the Frigg field, 2000 (minimum and maximum values for each parameter are indicated with bold text).
Station No. of ind. No. of taxa H’ J ES100
FRI01 1278 103 4.3 0.65 32
FRI02 1176 93 3.9 0.60 28
FRI03 1165 84 4.2 0.66 28
FRI04 2635 102 3.1 0.46 20
FRI11 1398 114 4.4 0.64 32
FRI24 1482 99 3.6 0.55 26
FRI25 863 93 4.8 0.73 35
FRI27 1704 99 3.7 0.56 25
FRI10R 1598 128 4.9 0.71 35
Sum * 11701
Average. * 1463 98 4.0 0.61 28
St. dev. * 535 9 0.5 0.08 5 * Excluding the reference station.
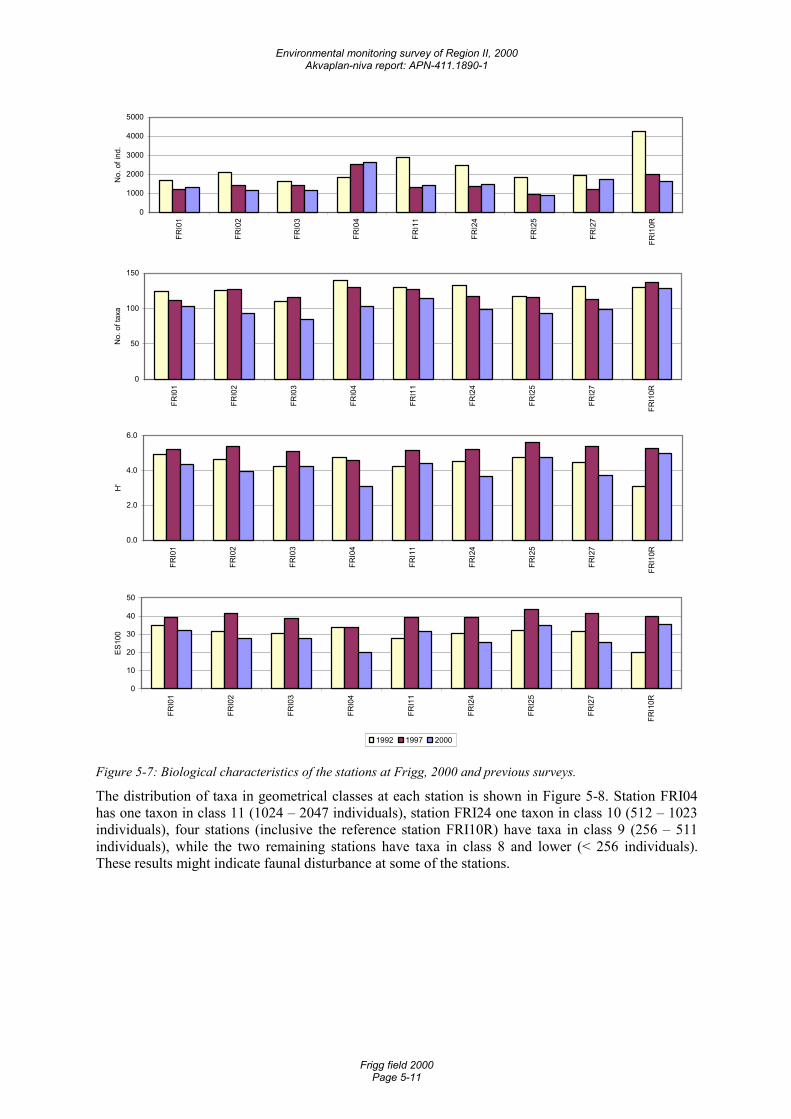
Environmental monitoring survey of Region II, 2000 Akvaplan-niva report: APN-411.1890-1
Frigg field 2000 Page 5-11
0
1000
2000
3000
4000
5000
FRI0
1
FRI0
2
FRI0
3
FRI0
4
FRI1
1
FRI2
4
FRI2
5
FRI2
7
FRI1
0R
No.
of i
nd.
0
50
100
150
FRI0
1
FRI0
2
FRI0
3
FRI0
4
FRI1
1
FRI2
4
FRI2
5
FRI2
7
FRI1
0R
No.
of t
axa
0.0
2.0
4.0
6.0
FRI0
1
FRI0
2
FRI0
3
FRI0
4
FRI1
1
FRI2
4
FRI2
5
FRI2
7
FRI1
0R
H'
0
10
20
30
40
50
FRI0
1
FRI0
2
FRI0
3
FRI0
4
FRI1
1
FRI2
4
FRI2
5
FRI2
7
FRI1
0R
ES10
0
1992 1997 2000
Figure 5-7: Biological characteristics of the stations at Frigg, 2000 and previous surveys.
The distribution of taxa in geometrical classes at each station is shown in Figure 5-8. Station FRI04 has one taxon in class 11 (1024 – 2047 individuals), station FRI24 one taxon in class 10 (512 – 1023 individuals), four stations (inclusive the reference station FRI10R) have taxa in class 9 (256 – 511 individuals), while the two remaining stations have taxa in class 8 and lower (< 256 individuals). These results might indicate faunal disturbance at some of the stations.
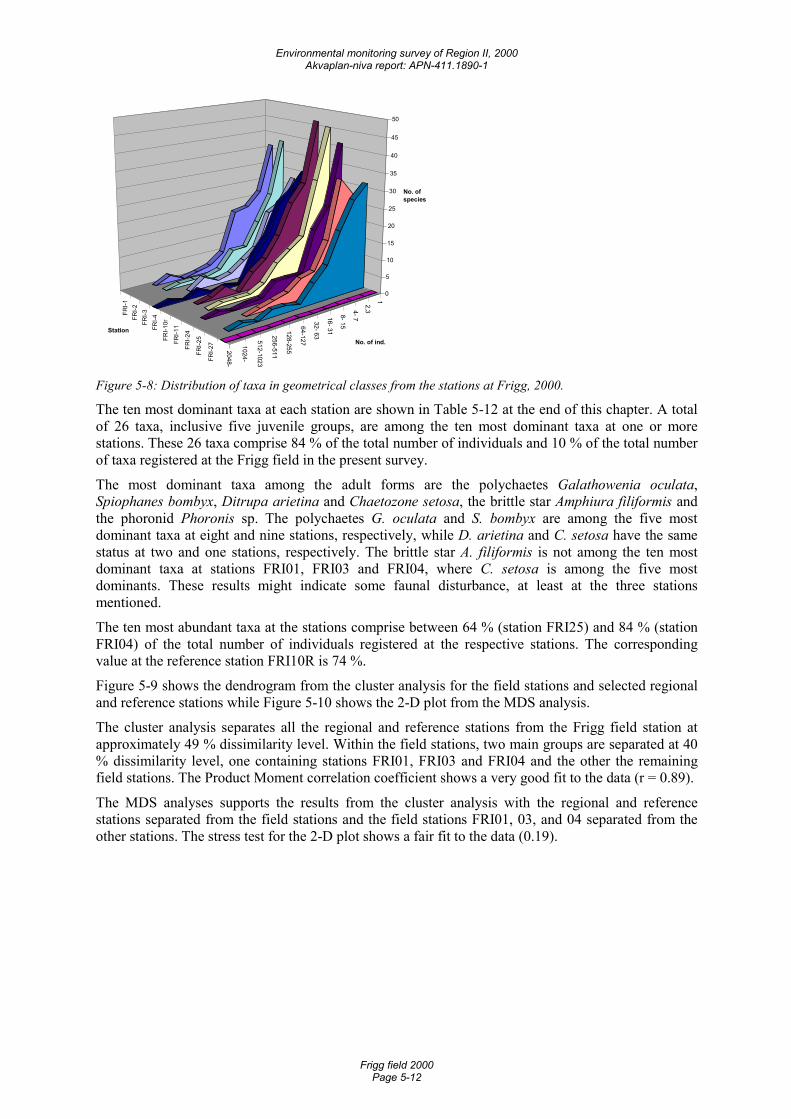
Environmental monitoring survey of Region II, 2000 Akvaplan-niva report: APN-411.1890-1
Frigg field 2000 Page 5-12
12,3 4- 7
8- 15
16- 31
32- 63
64-127
128-255
256-511
512-1023
1024-
2048-
FRI-1
FRI-2
FRI-3
FRI-4
FRI-1
0r
FRI-1
1
FRI-2
4
FRI-2
5
FRI-2
7
0
5
10
15
20
25
30
35
40
45
50
No. of ind.
Station
No. of species
Figure 5-8: Distribution of taxa in geometrical classes from the stations at Frigg, 2000.
The ten most dominant taxa at each station are shown in Table 5-12 at the end of this chapter. A total of 26 taxa, inclusive five juvenile groups, are among the ten most dominant taxa at one or more stations. These 26 taxa comprise 84 % of the total number of individuals and 10 % of the total number of taxa registered at the Frigg field in the present survey.
The most dominant taxa among the adult forms are the polychaetes Galathowenia oculata, Spiophanes bombyx, Ditrupa arietina and Chaetozone setosa, the brittle star Amphiura filiformis and the phoronid Phoronis sp. The polychaetes G. oculata and S. bombyx are among the five most dominant taxa at eight and nine stations, respectively, while D. arietina and C. setosa have the same status at two and one stations, respectively. The brittle star A. filiformis is not among the ten most dominant taxa at stations FRI01, FRI03 and FRI04, where C. setosa is among the five most dominants. These results might indicate some faunal disturbance, at least at the three stations mentioned.
The ten most abundant taxa at the stations comprise between 64 % (station FRI25) and 84 % (station FRI04) of the total number of individuals registered at the respective stations. The corresponding value at the reference station FRI10R is 74 %.
Figure 5-9 shows the dendrogram from the cluster analysis for the field stations and selected regional and reference stations while Figure 5-10 shows the 2-D plot from the MDS analysis.
The cluster analysis separates all the regional and reference stations from the Frigg field station at approximately 49 % dissimilarity level. Within the field stations, two main groups are separated at 40 % dissimilarity level, one containing stations FRI01, FRI03 and FRI04 and the other the remaining field stations. The Product Moment correlation coefficient shows a very good fit to the data (r = 0.89).
The MDS analyses supports the results from the cluster analysis with the regional and reference stations separated from the field stations and the field stations FRI01, 03, and 04 separated from the other stations. The stress test for the 2-D plot shows a fair fit to the data (0.19).
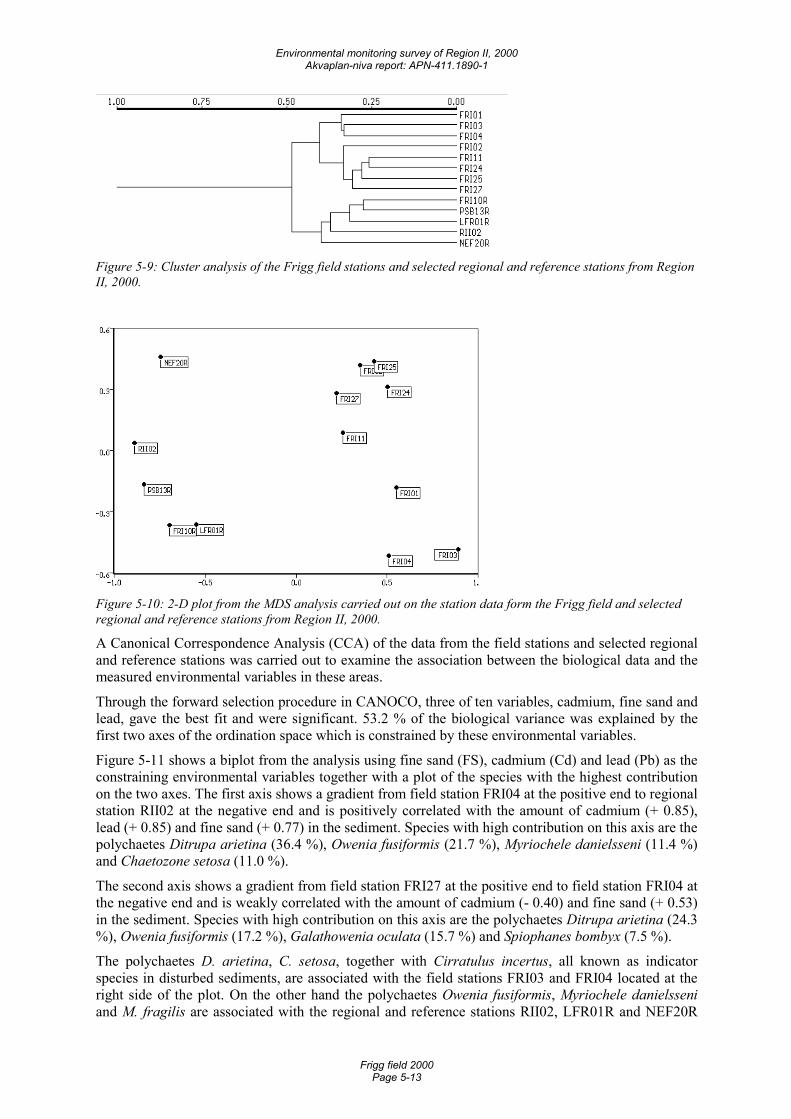
Environmental monitoring survey of Region II, 2000 Akvaplan-niva report: APN-411.1890-1
Frigg field 2000 Page 5-13
Figure 5-9: Cluster analysis of the Frigg field stations and selected regional and reference stations from Region II, 2000.
Figure 5-10: 2-D plot from the MDS analysis carried out on the station data form the Frigg field and selected regional and reference stations from Region II, 2000.
A Canonical Correspondence Analysis (CCA) of the data from the field stations and selected regional and reference stations was carried out to examine the association between the biological data and the measured environmental variables in these areas.
Through the forward selection procedure in CANOCO, three of ten variables, cadmium, fine sand and lead, gave the best fit and were significant. 53.2 % of the biological variance was explained by the first two axes of the ordination space which is constrained by these environmental variables.
Figure 5-11 shows a biplot from the analysis using fine sand (FS), cadmium (Cd) and lead (Pb) as the constraining environmental variables together with a plot of the species with the highest contribution on the two axes. The first axis shows a gradient from field station FRI04 at the positive end to regional station RII02 at the negative end and is positively correlated with the amount of cadmium (+ 0.85), lead (+ 0.85) and fine sand (+ 0.77) in the sediment. Species with high contribution on this axis are the polychaetes Ditrupa arietina (36.4 %), Owenia fusiformis (21.7 %), Myriochele danielsseni (11.4 %) and Chaetozone setosa (11.0 %).
The second axis shows a gradient from field station FRI27 at the positive end to field station FRI04 at the negative end and is weakly correlated with the amount of cadmium (- 0.40) and fine sand (+ 0.53) in the sediment. Species with high contribution on this axis are the polychaetes Ditrupa arietina (24.3 %), Owenia fusiformis (17.2 %), Galathowenia oculata (15.7 %) and Spiophanes bombyx (7.5 %).
The polychaetes D. arietina, C. setosa, together with Cirratulus incertus, all known as indicator species in disturbed sediments, are associated with the field stations FRI03 and FRI04 located at the right side of the plot. On the other hand the polychaetes Owenia fusiformis, Myriochele danielsseni and M. fragilis are associated with the regional and reference stations RII02, LFR01R and NEF20R
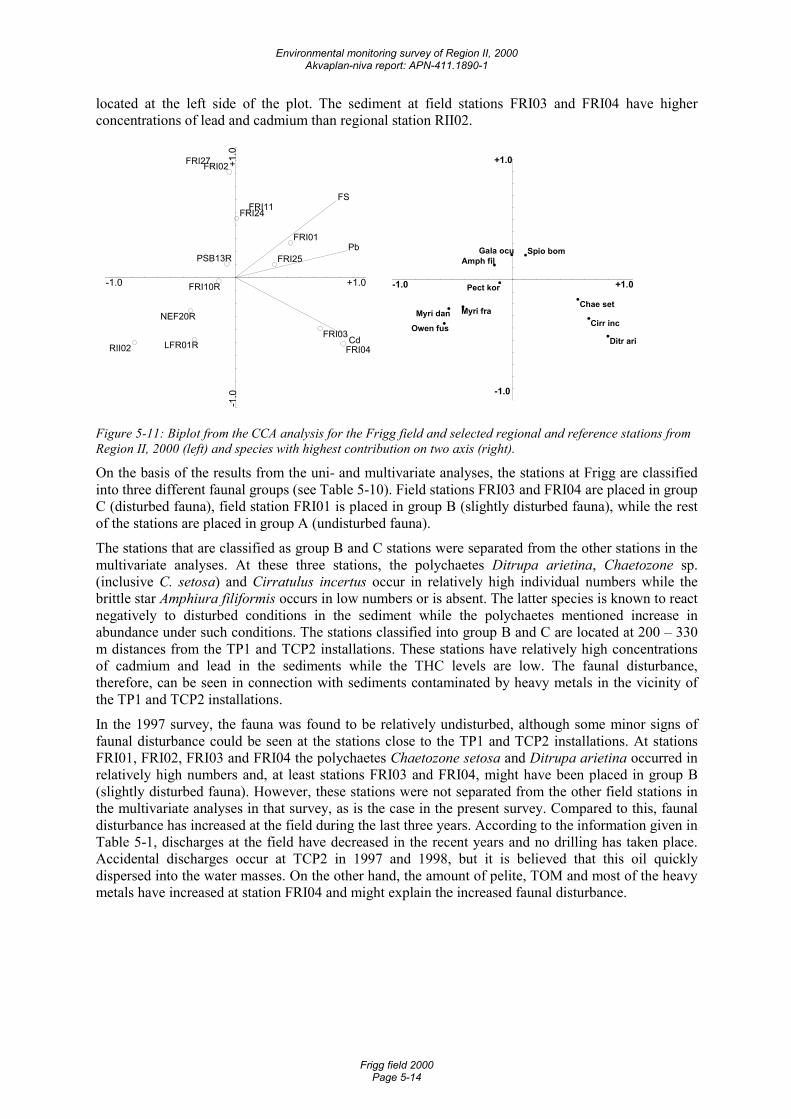
Environmental monitoring survey of Region II, 2000 Akvaplan-niva report: APN-411.1890-1
Frigg field 2000 Page 5-14
located at the left side of the plot. The sediment at field stations FRI03 and FRI04 have higher concentrations of lead and cadmium than regional station RII02.
-1.0 +1.0
-1.0
+1.0
Cd
Pb
FS
FRI04RII02FRI03
FRI01
NEF20R
LFR01R
FRI25
FRI27
FRI10R
FRI11
PSB13R
FRI02
FRI24�
-1.0 +1.0
-1.0
+1.0
Ditr ari
Cirr incOwen fus
Chae setMyri dan Myri fra
Amph filSpio bom
Pect kor
Gala ocu
Figure 5-11: Biplot from the CCA analysis for the Frigg field and selected regional and reference stations from Region II, 2000 (left) and species with highest contribution on two axis (right).
On the basis of the results from the uni- and multivariate analyses, the stations at Frigg are classified into three different faunal groups (see Table 5-10). Field stations FRI03 and FRI04 are placed in group C (disturbed fauna), field station FRI01 is placed in group B (slightly disturbed fauna), while the rest of the stations are placed in group A (undisturbed fauna).
The stations that are classified as group B and C stations were separated from the other stations in the multivariate analyses. At these three stations, the polychaetes Ditrupa arietina, Chaetozone sp. (inclusive C. setosa) and Cirratulus incertus occur in relatively high individual numbers while the brittle star Amphiura filiformis occurs in low numbers or is absent. The latter species is known to react negatively to disturbed conditions in the sediment while the polychaetes mentioned increase in abundance under such conditions. The stations classified into group B and C are located at 200 – 330 m distances from the TP1 and TCP2 installations. These stations have relatively high concentrations of cadmium and lead in the sediments while the THC levels are low. The faunal disturbance, therefore, can be seen in connection with sediments contaminated by heavy metals in the vicinity of the TP1 and TCP2 installations.
In the 1997 survey, the fauna was found to be relatively undisturbed, although some minor signs of faunal disturbance could be seen at the stations close to the TP1 and TCP2 installations. At stations FRI01, FRI02, FRI03 and FRI04 the polychaetes Chaetozone setosa and Ditrupa arietina occurred in relatively high numbers and, at least stations FRI03 and FRI04, might have been placed in group B (slightly disturbed fauna). However, these stations were not separated from the other field stations in the multivariate analyses in that survey, as is the case in the present survey. Compared to this, faunal disturbance has increased at the field during the last three years. According to the information given in Table 5-1, discharges at the field have decreased in the recent years and no drilling has taken place. Accidental discharges occur at TCP2 in 1997 and 1998, but it is believed that this oil quickly dispersed into the water masses. On the other hand, the amount of pelite, TOM and most of the heavy metals have increased at station FRI04 and might explain the increased faunal disturbance.
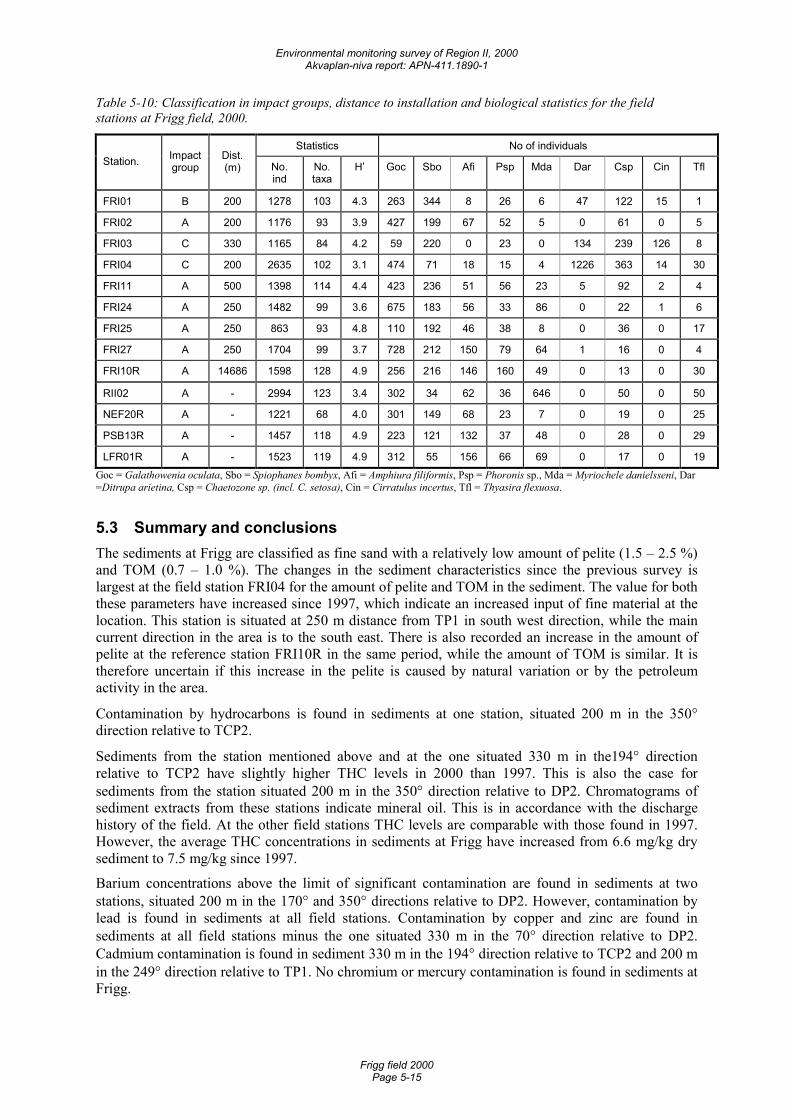
Environmental monitoring survey of Region II, 2000 Akvaplan-niva report: APN-411.1890-1
Frigg field 2000 Page 5-15
Table 5-10: Classification in impact groups, distance to installation and biological statistics for the field stations at Frigg field, 2000.
Statistics No of individuals Station. Impact
group Dist. (m) No.
ind No. taxa
H’ Goc Sbo Afi Psp Mda Dar Csp Cin Tfl
FRI01 B 200 1278 103 4.3 263 344 8 26 6 47 122 15 1
FRI02 A 200 1176 93 3.9 427 199 67 52 5 0 61 0 5
FRI03 C 330 1165 84 4.2 59 220 0 23 0 134 239 126 8
FRI04 C 200 2635 102 3.1 474 71 18 15 4 1226 363 14 30
FRI11 A 500 1398 114 4.4 423 236 51 56 23 5 92 2 4
FRI24 A 250 1482 99 3.6 675 183 56 33 86 0 22 1 6
FRI25 A 250 863 93 4.8 110 192 46 38 8 0 36 0 17
FRI27 A 250 1704 99 3.7 728 212 150 79 64 1 16 0 4
FRI10R A 14686 1598 128 4.9 256 216 146 160 49 0 13 0 30
RII02 A - 2994 123 3.4 302 34 62 36 646 0 50 0 50
NEF20R A - 1221 68 4.0 301 149 68 23 7 0 19 0 25
PSB13R A - 1457 118 4.9 223 121 132 37 48 0 28 0 29
LFR01R A - 1523 119 4.9 312 55 156 66 69 0 17 0 19 Goc = Galathowenia oculata, Sbo = Spiophanes bombyx, Afi = Amphiura filiformis, Psp = Phoronis sp., Mda = Myriochele danielsseni, Dar =Ditrupa arietina, Csp = Chaetozone sp. (incl. C. setosa), Cin = Cirratulus incertus, Tfl = Thyasira flexuosa.
5.3 Summary and conclusions The sediments at Frigg are classified as fine sand with a relatively low amount of pelite (1.5 – 2.5 %) and TOM (0.7 – 1.0 %). The changes in the sediment characteristics since the previous survey is largest at the field station FRI04 for the amount of pelite and TOM in the sediment. The value for both these parameters have increased since 1997, which indicate an increased input of fine material at the location. This station is situated at 250 m distance from TP1 in south west direction, while the main current direction in the area is to the south east. There is also recorded an increase in the amount of pelite at the reference station FRI10R in the same period, while the amount of TOM is similar. It is therefore uncertain if this increase in the pelite is caused by natural variation or by the petroleum activity in the area.
Contamination by hydrocarbons is found in sediments at one station, situated 200 m in the 350° direction relative to TCP2.
Sediments from the station mentioned above and at the one situated 330 m in the194° direction relative to TCP2 have slightly higher THC levels in 2000 than 1997. This is also the case for sediments from the station situated 200 m in the 350° direction relative to DP2. Chromatograms of sediment extracts from these stations indicate mineral oil. This is in accordance with the discharge history of the field. At the other field stations THC levels are comparable with those found in 1997. However, the average THC concentrations in sediments at Frigg have increased from 6.6 mg/kg dry sediment to 7.5 mg/kg since 1997.
Barium concentrations above the limit of significant contamination are found in sediments at two stations, situated 200 m in the 170° and 350° directions relative to DP2. However, contamination by lead is found in sediments at all field stations. Contamination by copper and zinc are found in sediments at all field stations minus the one situated 330 m in the 70° direction relative to DP2. Cadmium contamination is found in sediment 330 m in the 194° direction relative to TCP2 and 200 m in the 249° direction relative to TP1. No chromium or mercury contamination is found in sediments at Frigg.
Environmental monitoring survey of Region II, 2000 Akvaplan-niva report: APN-411.1890-1
Frigg field 2000 Page 5-16
Sediment barium concentrations are higher in this survey than in 1997 at all stations except 200 m in the 70° and 350° directions relative to TCP2. At stations situated 200 m in the 170°and 350° directions relative to DP2 the sediment concentrations of barium have increased about four times, bringing the levels above the limit of significant contamination. The same pattern is seen for cadmium, copper, zinc and lead. Mercury levels are unchanged in sediments on station FRI05.
Like the Frøy and Heimdal fields, the field history at Frigg does not reveal any discharges that can explain the rise in metal concentrations since the last survey. The proportion of pelite in sediments at Frigg has increased with about 3% at the reference station, with a concomitant increase at the field stations. At the reference station minor increases in barium concentrations are measured, not explaining the general rise of barium concentrations in the field.
The number of individuals at the stations in this and the previous survey is relatively similar, while the number of taxa has decreased somewhat. This has resulted in a decrease in the diversity at all stations. Fauna disturbance is registered at three of the stations in the present survey. Station FRI01 is classified as faunal group B (slightly disturbed fauna), stations FRI03 and FRI04 are classified as faunal group C (disturbed fauna) while the rest of the stations at the field have undisturbed fauna. The stations FRI01, FRI03 and FRI04 are situated at 250 – 330 m from the TP1 and TCP2 installations. At these stations the polychaetes Ditrupa arietina, Chaetozone sp. and Cirratulus incertus are recorded with relatively high individual numbers, while the brittle star Amphiura filiformis is absent or recorded with a few individuals. The mentioned polychaetes are often abundant in organic enriched or disturbed sediments, while the brittle star decrease in individual numbers with increasing disturbance. The same stations are also separated from the other stations in the multivariate analyses and the CCA show significant correlations between the faunal distribution and the amount of cadmium and lead in the sediment. At these stations also high levels of most of the heavy metals (i.e. cadmium, lead, copper and zinc) are recorded, while the amount of THC is similar to, or somewhat higher, than the LSC value in the present survey. The faunal disturbance can therefore be seen in connection with the contaminated sediments in the vicinity of the installations TP1 and TCP2.
Although minor signs of faunal disturbance could be seen at the stations in the vicinity of TP1 and TCP2 in the previous survey, it was concluded that the fauna at the field was relatively undisturbed. It is possible that at least stations FRI03 and FRI04 should have been classified as faunal group B (slightly disturbed fauna) due to the relatively high number of individuals of the polychaetes Ditrupa arietina and Chaetozone sp. However, these stations were not separated from the other field stations in the multivariate analyses in that survey, as is the case in the present survey. Anyhow, it can be concluded that the faunal disturbance has increased in intensity since 1997. In the same period the concentrations of some of the heavy metals have increased at the same stations. Discharges at the field have decreased in the recent years and no drilling has taken place. Accidental discharges occur at TCP2 in 1997 and 1998, but it is believed that this oil quickly dispersed into the water masses. On the other hand, the amount of pelite, TOM and most of the heavy metals have increased at station FRI04 and might explain the increased faunal disturbance.
The calculated minimum area and spatial extent of contaminated sediments and disturbed fauna at the Frigg field is shown in Table 5-11 and Figure 5-12. The THC level at one station at Frigg has increased with 3 mg/kg dry sediment since 1997 and the THC level has just exceeded the LSC in the present survey. However the result is increased area contaminated with THC since 1997.
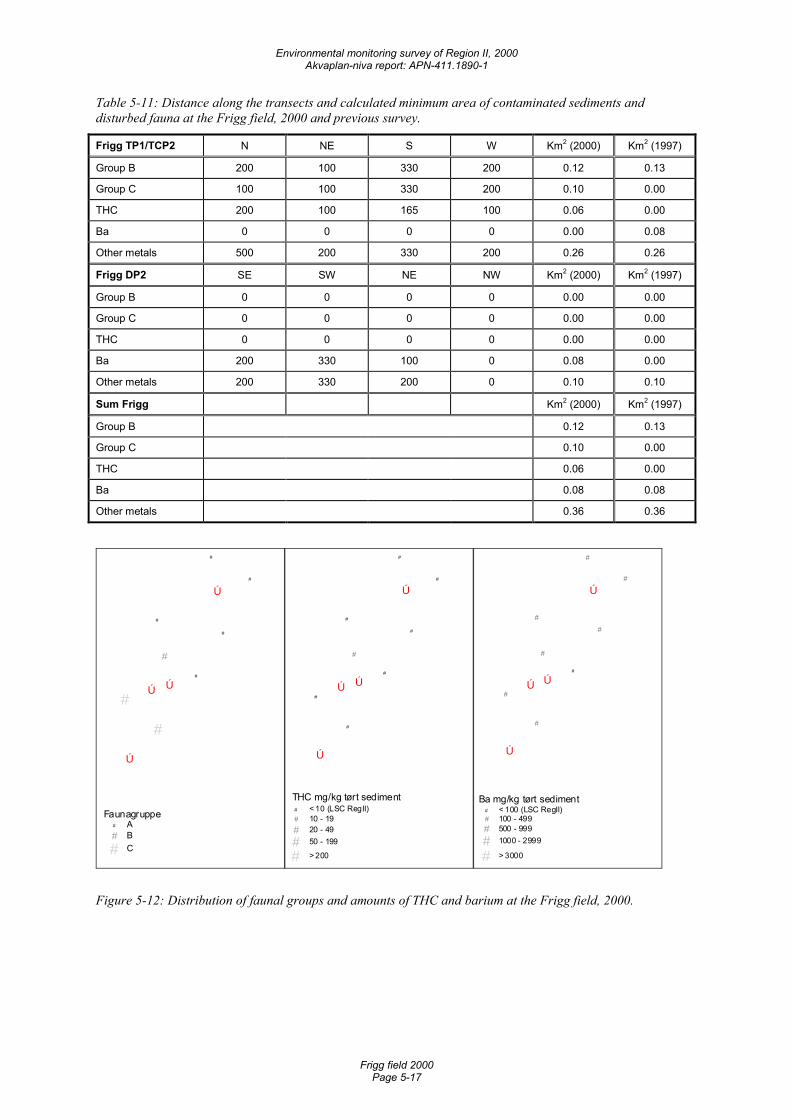
Environmental monitoring survey of Region II, 2000 Akvaplan-niva report: APN-411.1890-1
Frigg field 2000 Page 5-17
Table 5-11: Distance along the transects and calculated minimum area of contaminated sediments and disturbed fauna at the Frigg field, 2000 and previous survey.
Frigg TP1/TCP2 N NE S W Km2 (2000) Km2 (1997)
Group B 200 100 330 200 0.12 0.13
Group C 100 100 330 200 0.10 0.00
THC 200 100 165 100 0.06 0.00
Ba 0 0 0 0 0.00 0.08
Other metals 500 200 330 200 0.26 0.26
Frigg DP2 SE SW NE NW Km2 (2000) Km2 (1997)
Group B 0 0 0 0 0.00 0.00
Group C 0 0 0 0 0.00 0.00
THC 0 0 0 0 0.00 0.00
Ba 200 330 100 0 0.08 0.00
Other metals 200 330 200 0 0.10 0.10
Sum Frigg Km2 (2000) Km2 (1997)
Group B 0.12 0.13
Group C 0.10 0.00
THC 0.06 0.00
Ba 0.08 0.08
Other metals 0.36 0.36
ÚÚ
Ú
Ú
#
#
#
#
#
#
#
#
Faunagruppe# A# B
# C
ÚÚ
Ú
Ú
#
#
#
#
#
#
#
#
THC mg/kg tørt sediment# < 10 (LSC RegII)# 10 - 19# 20 - 49
# 50 - 199
# > 200
ÚÚ
Ú
Ú
#
#
#
#
#
#
#
#
Ba mg/kg tørt sediment# < 100 (LSC RegII)# 100 - 499# 500 - 999
# 1000 - 2999
# > 3000
Figure 5-12: Distribution of faunal groups and amounts of THC and barium at the Frigg field, 2000.
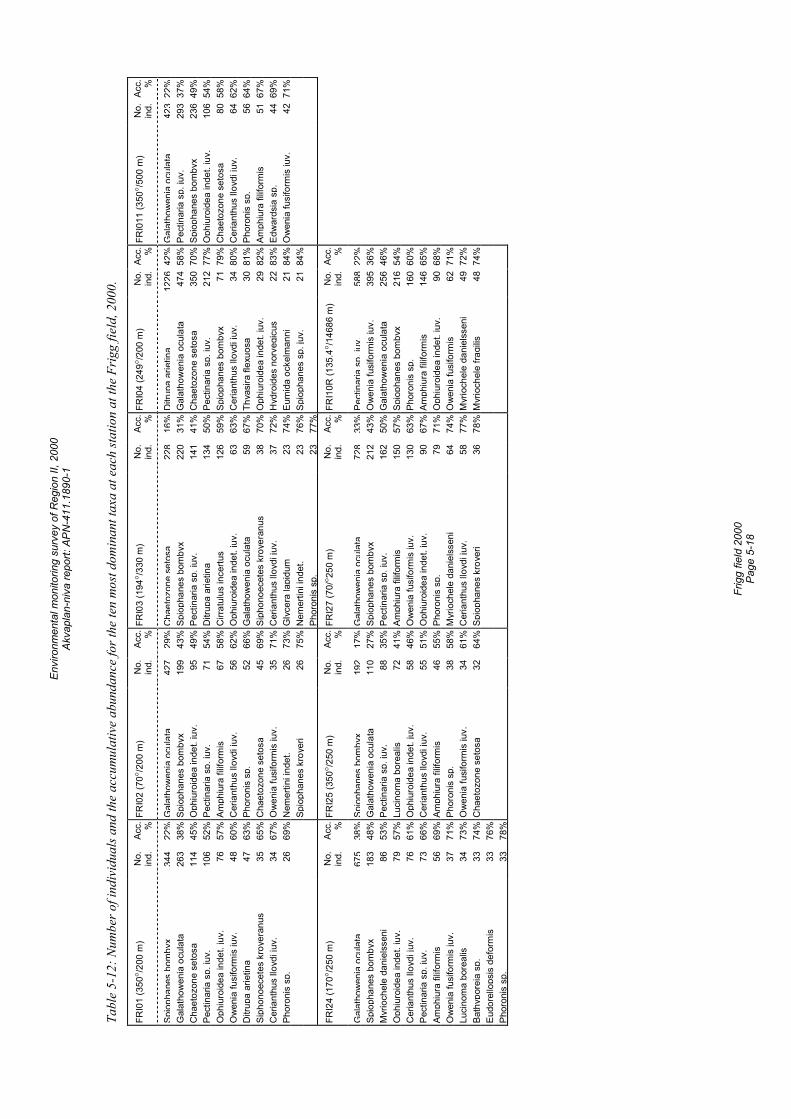
Envi
ronm
enta
l mon
itorin
g su
rvey
of R
egio
n II,
200
0 Ak
vapl
an-n
iva
repo
rt: A
PN-4
11.1
890-
1
Fr
igg
field
200
0 Pa
ge 5
-18
Tabl
e 5-
12: N
umbe
r of i
ndiv
idua
ls an
d th
e ac
cum
ulat
ive
abun
danc
e fo
r the
ten
mos
t dom
inan
t tax
a at
eac
h sta
tion
at th
e Fr
igg
field
, 200
0.
FRI0
1 (3
50°/2
00 m
) N
o.
ind.
Ac
c.
% FR
I02
(70°
/200
m)
No.
in
d.Ac
c.
%FR
I03
(194
°/330
m)
No.
in
d.Ac
c.
%FR
I04
(249
°/200
m)
No.
in
d.Ac
c.
%FR
I011
(350
°/50
0 m
) N
o.
ind.
Acc.
%
Spio
phan
esbo
mby
x34
422
%G
alat
how
enia
ocul
ata
427
29%
Cha
etoz
one
seto
sa22
816
%D
itrup
aar
ietin
a12
2642
%G
alat
how
enia
ocul
ata
423
22%
Gal
atho
wen
ia o
cula
ta
263
38%
Spi
opha
nes
bom
byx
199
43%
Spio
phan
es b
omby
x22
031
%G
alat
how
enia
ocu
lata
474
58%
Pect
inar
ia s
p. ju
v.29
3 37
%
Cha
etoz
one
seto
sa
114
45%
Oph
iuro
idea
inde
t. ju
v.95
49%
Pect
inar
ia s
p. ju
v.14
141
%C
haet
ozon
e se
tosa
350
70%
Spio
phan
es b
omby
x23
6 49
%
Pect
inar
ia s
p. ju
v.
106
52%
Pec
tinar
ia s
p. ju
v.71
54%
Ditr
upa
arie
tina
134
50%
Pect
inar
ia s
p. ju
v.21
277
%O
phiu
roid
ea in
det.
juv.
106
54%
O
phiu
roid
ea in
det.
juv.
76
57
% A
mph
iura
filif
orm
is67
58%
Cirr
atul
us in
certu
s12
659
%Sp
ioph
anes
bom
byx
7179
%C
haet
ozon
e se
tosa
80 5
8%
Ow
enia
fusi
form
is ju
v.
48
60%
Cer
iant
hus
lloyd
i juv
.56
62%
Oph
iuro
idea
inde
t. ju
v.63
63%
Cer
iant
hus
lloyd
i juv
.34
80%
Cer
iant
hus
lloyd
i juv
.64
62%
D
itrup
a ar
ietin
a 47
63
% P
horo
nis
sp.
5266
%G
alat
how
enia
ocu
lata
5967
%Th
yasi
ra fl
exuo
sa30
81%
Phor
onis
sp.
56 6
4%
Siph
onoe
cete
s kr
oyer
anus
35
65
% C
haet
ozon
e se
tosa
4569
%Si
phon
oece
tes
kroy
eran
us38
70%
Oph
iuro
idea
inde
t. ju
v.29
82%
Amph
iura
filif
orm
is51
67%
C
eria
nthu
s llo
ydi j
uv.
34
67%
Ow
enia
fusi
form
is ju
v.35
71%
Cer
iant
hus
lloyd
i juv
.37
72%
Hyd
roid
es n
orve
gicu
s22
83%
Edw
ards
ia s
p.44
69%
Ph
oron
is s
p.
26
69%
Nem
ertin
i ind
et.
2673
%G
lyce
ra la
pidu
m23
74%
Eum
ida
ocke
lman
ni21
84%
Ow
enia
fusi
form
is ju
v.42
71%
S
piop
hane
s kr
oyer
i26
75%
Nem
ertin
i ind
et.
2376
%Sp
ioph
anes
sp.
juv.
2184
%
Phor
onis
sp.
2377
%
FRI2
4 (1
70°/2
50 m
) N
o.
ind.
Ac
c.
% FR
I25
(350
°/250
m)
No.
in
d.Ac
c.
%FR
I27
(70/
°250
m)
No.
in
d.Ac
c.
%FR
I10R
(135
.4°/1
4686
m)
No.
in
d.Ac
c.
%
Gal
atho
wen
iaoc
ulat
a67
538
%Sp
ioph
anes
bom
byx
192
17%
Gal
atho
wen
iaoc
ulat
a72
833
%Pe
ctin
aria
sp.j
uv.
588
22%
Spio
phan
es b
omby
x 18
3 48
% G
alat
how
enia
ocu
lata
110
27%
Spio
phan
es b
omby
x21
243
%O
wen
ia fu
sifo
rmis
juv.
395
36%
Myr
ioch
ele
dani
elss
eni
86
53%
Pec
tinar
ia s
p. ju
v.88
35%
Pect
inar
ia s
p. ju
v.16
250
%G
alat
how
enia
ocu
lata
256
46%
Oph
iuro
idea
inde
t. ju
v.
79
57%
Luc
inom
a bo
real
is72
41%
Amph
iura
filif
orm
is15
057
%Sp
ioph
anes
bom
byx
216
54%
Cer
iant
hus
lloyd
i juv
. 76
61
% O
phiu
roid
ea in
det.
juv.
5846
%O
wen
ia fu
sifo
rmis
juv.
130
63%
Phor
onis
sp.
160
60%
Pect
inar
ia s
p. ju
v.
73
66%
Cer
iant
hus
lloyd
i juv
.55
51%
Oph
iuro
idea
inde
t. ju
v.90
67%
Amph
iura
filif
orm
is14
665
%
Am
phiu
ra fi
lifor
mis
56
69
% A
mph
iura
filif
orm
is46
55%
Phor
onis
sp.
7971
%O
phiu
roid
ea in
det.
juv.
9068
%
O
wen
ia fu
sifo
rmis
juv.
37
71
% P
horo
nis
sp.
3858
%M
yrio
chel
e da
niel
ssen
i64
74%
Ow
enia
fusi
form
is62
71%
Luci
nom
a bo
real
is
34
73%
Ow
enia
fusi
form
is ju
v.34
61%
Cer
iant
hus
lloyd
i juv
.58
77%
Myr
ioch
ele
dani
elss
eni
4972
%
Ba
thyp
orei
a sp
. 33
74
% C
haet
ozon
e se
tosa
3264
%Sp
ioph
anes
kro
yeri
3678
%M
yrio
chel
e fra
gilis
4874
%
Eu
dore
llops
is d
efor
mis
33
76
%
Phor
onis
sp.
33
78
%
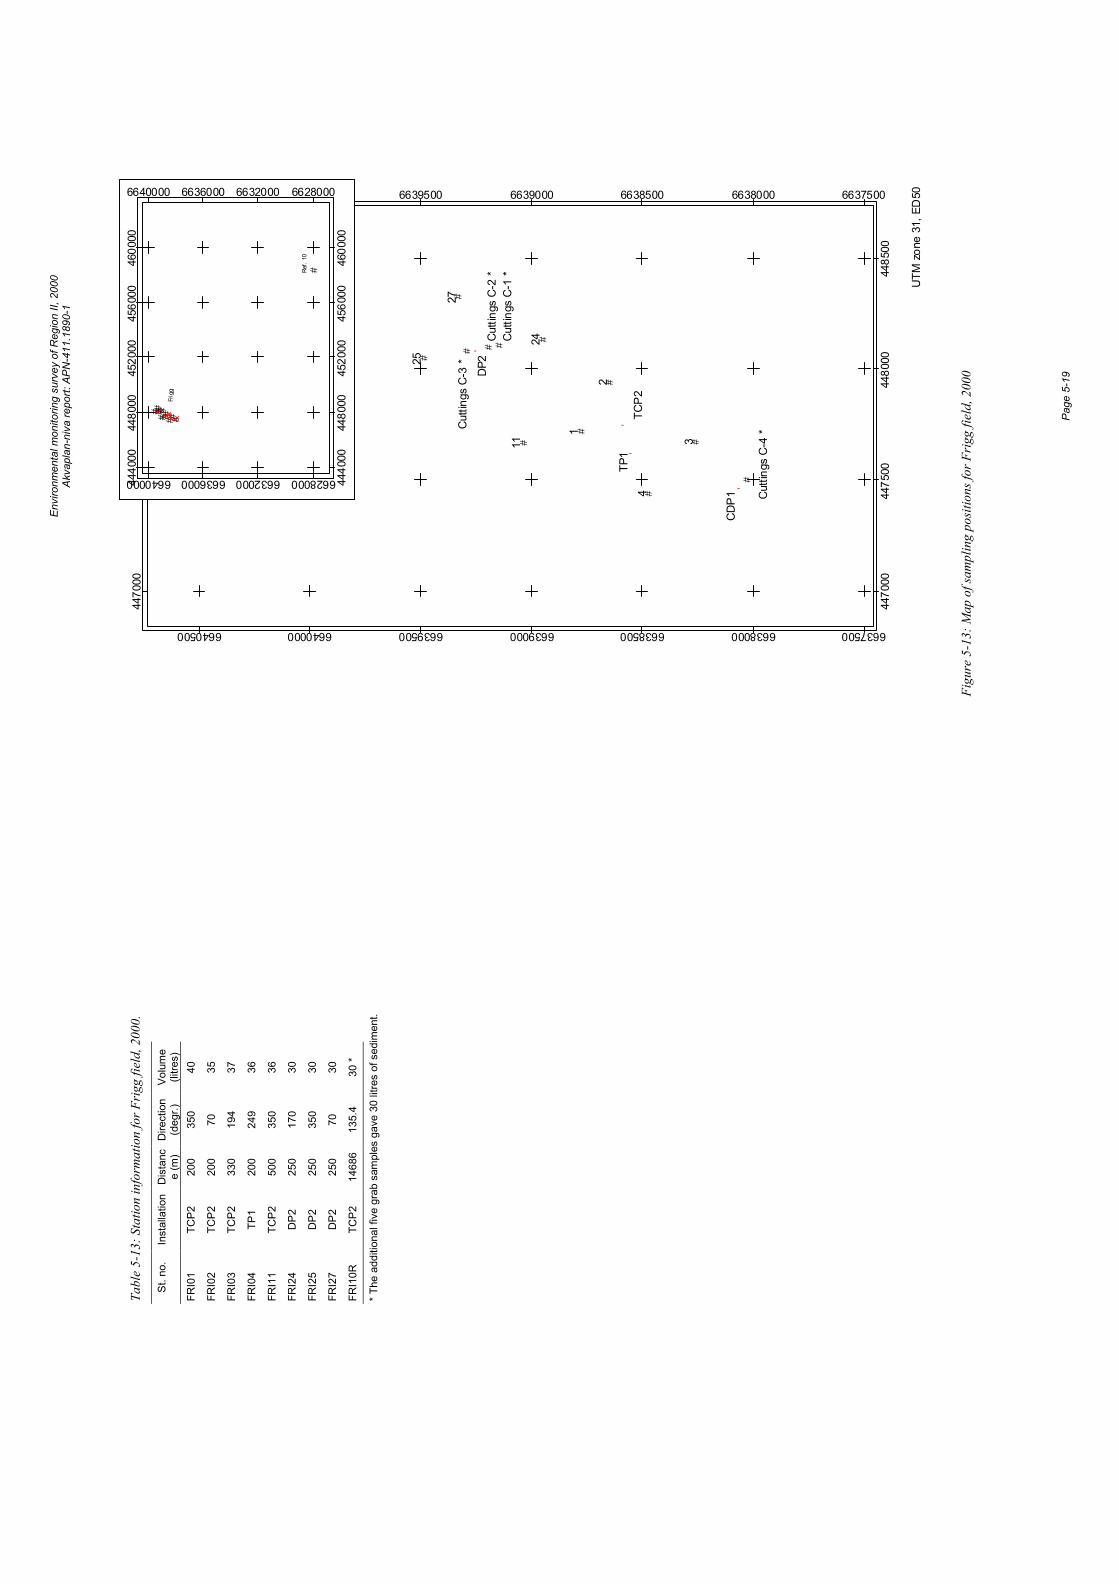
Envi
ronm
enta
l mon
itorin
g su
rvey
of R
egio
n II,
200
0 Ak
vapl
an-n
iva
repo
rt: A
PN-4
11.1
890-
1
Pa
ge 5
-19
#
#
##
#
#
#
#
###
#
''
'
'
1
2
3
4
11
24
25
27
Cut
tings
C-1
*C
uttin
gs C
-2 *
Cut
tings
C-3
*
Cut
tings
C-4
*
DP2
TCP
2TP
1
CD
P1
4470
00
4470
00
4475
00
4475
00
4480
00
4480
00
4485
00
4485
00
6637500
6637500
6638000
6638000
6638500
6638500
6639000
6639000
6639500
6639500
6640000
6640000
6640500
6640500
UTM
zon
e 31
, ED
50
# # ##
#
### # ###
#& &&
&
Ref.
10
Frig
g
4440
00
4440
00
4480
00
4480
00
4520
00
4520
00
4560
00
4560
00
4600
00
4600
00
6628000
6628000
6632000
6632000
6636000
6636000
6640000
6640000
Figu
re 5
-13:
Map
of s
ampl
ing
posit
ions
for F
rigg
field
, 200
0
Tabl
e 5-
13: S
tatio
n in
form
atio
n fo
r Frig
g fie
ld, 2
000.
St. n
o.
Inst
alla
tion
Dis
tanc
e (m
) D
irect
ion
(deg
r.)
Volu
me
(litre
s)
FRI0
1 TC
P2
200
350
40
FRI0
2 TC
P2
200
70
35
FRI0
3 TC
P2
330
194
37
FRI0
4 TP
1 20
0 24
9 36
FRI1
1 TC
P2
500
350
36
FRI2
4 D
P2
250
170
30
FRI2
5 D
P2
250
350
30
FRI2
7 D
P2
250
70
30
FRI1
0R
TCP2
14
686
135.
4 30
*
* The
add
ition
al fi
ve g
rab
sam
ples
gav
e 30
litre
s of
sed
imen
t.

Envi
ronm
enta
l mon
itorin
g su
rvey
of R
egio
n II,
200
0 Ak
vapl
an-n
iva
repo
rt: A
PN-4
11.1
890-
1
Pa
ge 5
-20
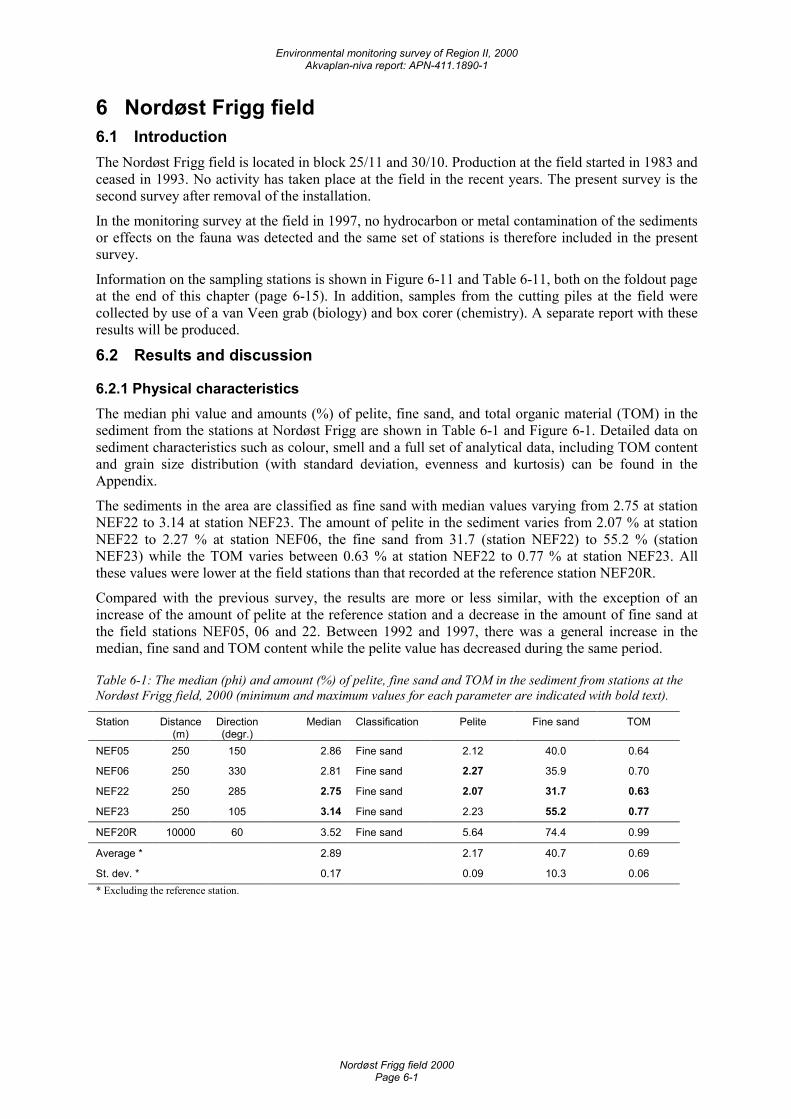
Environmental monitoring survey of Region II, 2000 Akvaplan-niva report: APN-411.1890-1
Nordøst Frigg field 2000 Page 6-1
6 Nordøst Frigg field 6.1 Introduction The Nordøst Frigg field is located in block 25/11 and 30/10. Production at the field started in 1983 and ceased in 1993. No activity has taken place at the field in the recent years. The present survey is the second survey after removal of the installation.
In the monitoring survey at the field in 1997, no hydrocarbon or metal contamination of the sediments or effects on the fauna was detected and the same set of stations is therefore included in the present survey.
Information on the sampling stations is shown in Figure 6-11 and Table 6-11, both on the foldout page at the end of this chapter (page 6-15). In addition, samples from the cutting piles at the field were collected by use of a van Veen grab (biology) and box corer (chemistry). A separate report with these results will be produced.
6.2 Results and discussion
6.2.1 Physical characteristics The median phi value and amounts (%) of pelite, fine sand, and total organic material (TOM) in the sediment from the stations at Nordøst Frigg are shown in Table 6-1 and Figure 6-1. Detailed data on sediment characteristics such as colour, smell and a full set of analytical data, including TOM content and grain size distribution (with standard deviation, evenness and kurtosis) can be found in the Appendix.
The sediments in the area are classified as fine sand with median values varying from 2.75 at station NEF22 to 3.14 at station NEF23. The amount of pelite in the sediment varies from 2.07 % at station NEF22 to 2.27 % at station NEF06, the fine sand from 31.7 (station NEF22) to 55.2 % (station NEF23) while the TOM varies between 0.63 % at station NEF22 to 0.77 % at station NEF23. All these values were lower at the field stations than that recorded at the reference station NEF20R.
Compared with the previous survey, the results are more or less similar, with the exception of an increase of the amount of pelite at the reference station and a decrease in the amount of fine sand at the field stations NEF05, 06 and 22. Between 1992 and 1997, there was a general increase in the median, fine sand and TOM content while the pelite value has decreased during the same period.
Table 6-1: The median (phi) and amount (%) of pelite, fine sand and TOM in the sediment from stations at the Nordøst Frigg field, 2000 (minimum and maximum values for each parameter are indicated with bold text).
Station Distance (m)
Direction (degr.)
Median Classification Pelite Fine sand TOM
NEF05 250 150 2.86 Fine sand 2.12 40.0 0.64
NEF06 250 330 2.81 Fine sand 2.27 35.9 0.70
NEF22 250 285 2.75 Fine sand 2.07 31.7 0.63
NEF23 250 105 3.14 Fine sand 2.23 55.2 0.77
NEF20R 10000 60 3.52 Fine sand 5.64 74.4 0.99
Average * 2.89 2.17 40.7 0.69
St. dev. * 0.17 0.09 10.3 0.06 * Excluding the reference station.
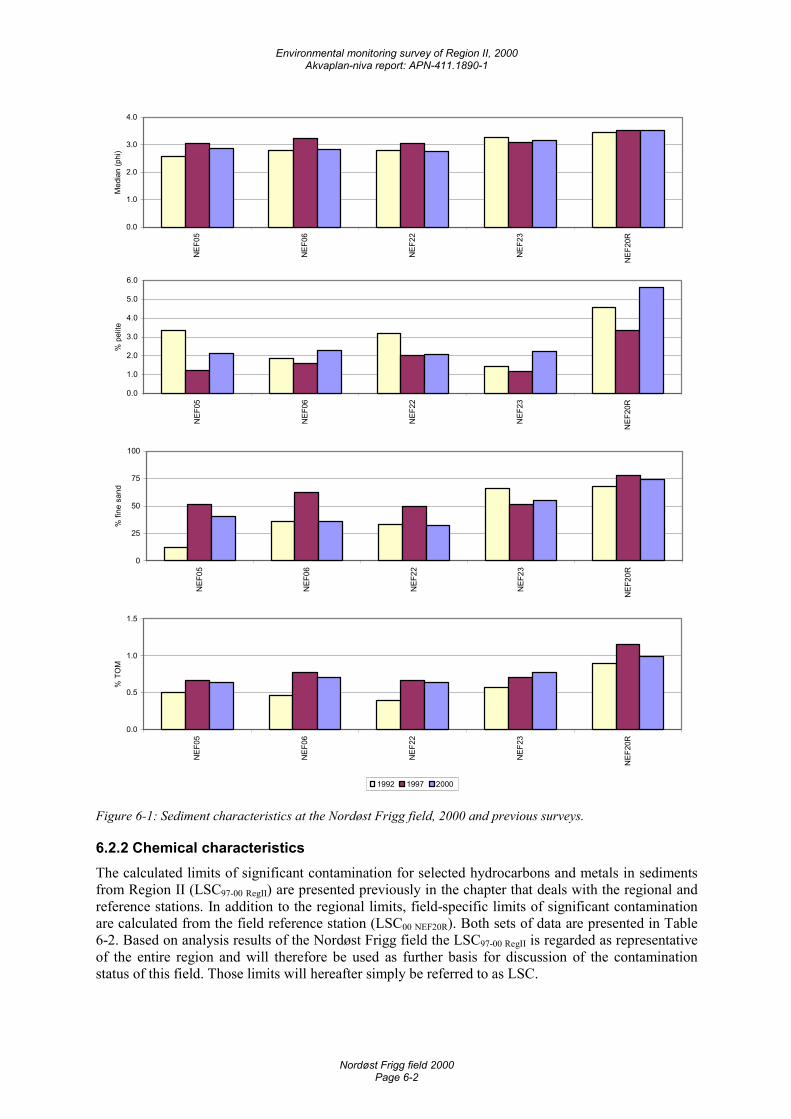
Environmental monitoring survey of Region II, 2000 Akvaplan-niva report: APN-411.1890-1
Nordøst Frigg field 2000 Page 6-2
0.0
1.0
2.0
3.0
4.0
NEF
05
NEF
06
NEF
22
NEF
23
NEF
20R
Med
ian
(phi
)
0.0
1.0
2.0
3.0
4.0
5.0
6.0
NEF
05
NEF
06
NEF
22
NEF
23
NEF
20R
% p
elite
0
25
50
75
100
NEF
05
NEF
06
NEF
22
NEF
23
NEF
20R
% fi
ne s
and
0.0
0.5
1.0
1.5
NEF
05
NEF
06
NEF
22
NEF
23
NEF
20R
% T
OM
1992 1997 2000
Figure 6-1: Sediment characteristics at the Nordøst Frigg field, 2000 and previous surveys.
6.2.2 Chemical characteristics The calculated limits of significant contamination for selected hydrocarbons and metals in sediments from Region II (LSC97-00 RegII) are presented previously in the chapter that deals with the regional and reference stations. In addition to the regional limits, field-specific limits of significant contamination are calculated from the field reference station (LSC00 NEF20R). Both sets of data are presented in Table 6-2. Based on analysis results of the Nordøst Frigg field the LSC97-00 RegII is regarded as representative of the entire region and will therefore be used as further basis for discussion of the contamination status of this field. Those limits will hereafter simply be referred to as LSC.
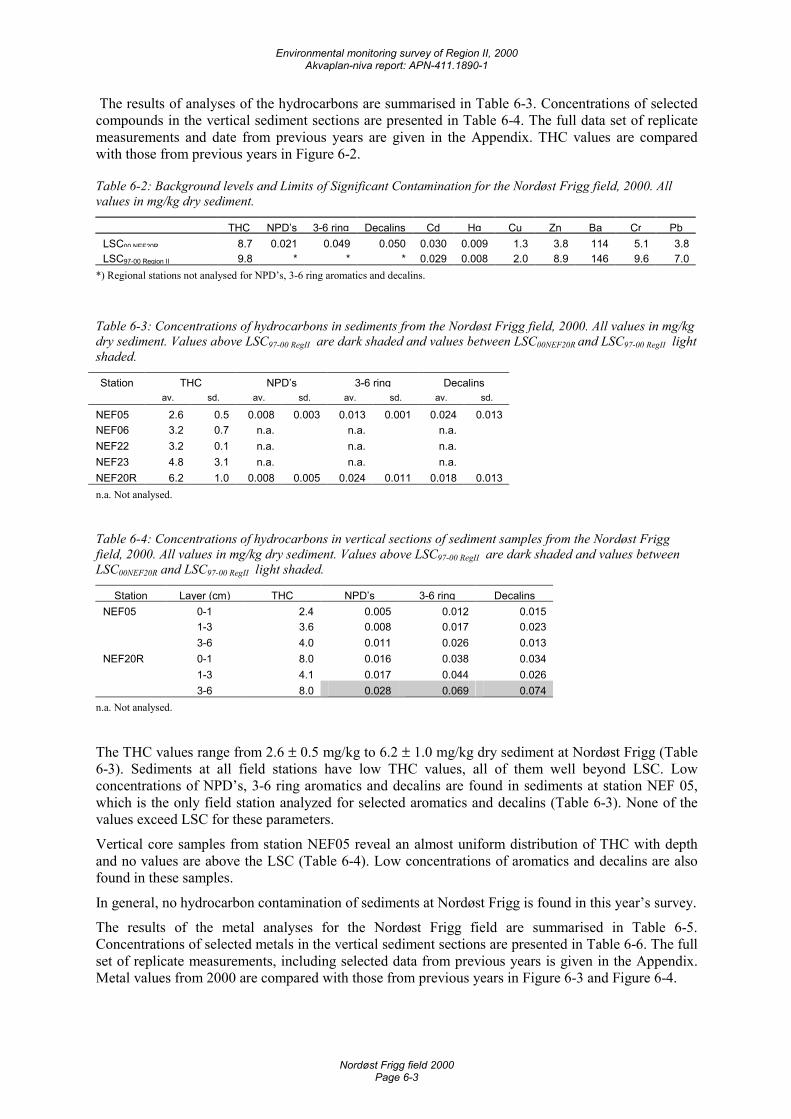
Environmental monitoring survey of Region II, 2000 Akvaplan-niva report: APN-411.1890-1
Nordøst Frigg field 2000 Page 6-3
The results of analyses of the hydrocarbons are summarised in Table 6-3. Concentrations of selected compounds in the vertical sediment sections are presented in Table 6-4. The full data set of replicate measurements and date from previous years are given in the Appendix. THC values are compared with those from previous years in Figure 6-2.
Table 6-2: Background levels and Limits of Significant Contamination for the Nordøst Frigg field, 2000. All values in mg/kg dry sediment.
THC NPD’s 3-6 ring Decalins Cd Hg Cu Zn Ba Cr PbLSC00 NEF20R 8.7 0.021 0.049 0.050 0.030 0.009 1.3 3.8 114 5.1 3.8LSC97-00 Region II 9.8 * * * 0.029 0.008 2.0 8.9 146 9.6 7.0
*) Regional stations not analysed for NPD’s, 3-6 ring aromatics and decalins.
Table 6-3: Concentrations of hydrocarbons in sediments from the Nordøst Frigg field, 2000. All values in mg/kg dry sediment. Values above LSC97-00 RegII are dark shaded and values between LSC00NEF20R and LSC97-00 RegII light shaded.
Station THC NPD’s 3-6 ring Decalins av. sd. av. sd. av. sd. av. sd.
NEF05 2.6 0.5 0.008 0.003 0.013 0.001 0.024 0.013NEF06 3.2 0.7 n.a. n.a. n.a.NEF22 3.2 0.1 n.a. n.a. n.a.NEF23 4.8 3.1 n.a. n.a. n.a.NEF20R 6.2 1.0 0.008 0.005 0.024 0.011 0.018 0.013n.a. Not analysed.
Table 6-4: Concentrations of hydrocarbons in vertical sections of sediment samples from the Nordøst Frigg field, 2000. All values in mg/kg dry sediment. Values above LSC97-00 RegII are dark shaded and values between LSC00NEF20R and LSC97-00 RegII light shaded.
Station Layer (cm) THC NPD’s 3-6 ring DecalinsNEF05 0-1 2.4 0.005 0.012 0.015 1-3 3.6 0.008 0.017 0.023 3-6 4.0 0.011 0.026 0.013NEF20R 0-1 8.0 0.016 0.038 0.034 1-3 4.1 0.017 0.044 0.026 3-6 8.0 0.028 0.069 0.074
n.a. Not analysed.
The THC values range from 2.6 ± 0.5 mg/kg to 6.2 ± 1.0 mg/kg dry sediment at Nordøst Frigg (Table 6-3). Sediments at all field stations have low THC values, all of them well beyond LSC. Low concentrations of NPD’s, 3-6 ring aromatics and decalins are found in sediments at station NEF 05, which is the only field station analyzed for selected aromatics and decalins (Table 6-3). None of the values exceed LSC for these parameters.
Vertical core samples from station NEF05 reveal an almost uniform distribution of THC with depth and no values are above the LSC (Table 6-4). Low concentrations of aromatics and decalins are also found in these samples.
In general, no hydrocarbon contamination of sediments at Nordøst Frigg is found in this year’s survey.
The results of the metal analyses for the Nordøst Frigg field are summarised in Table 6-5. Concentrations of selected metals in the vertical sediment sections are presented in Table 6-6. The full set of replicate measurements, including selected data from previous years is given in the Appendix. Metal values from 2000 are compared with those from previous years in Figure 6-3 and Figure 6-4.
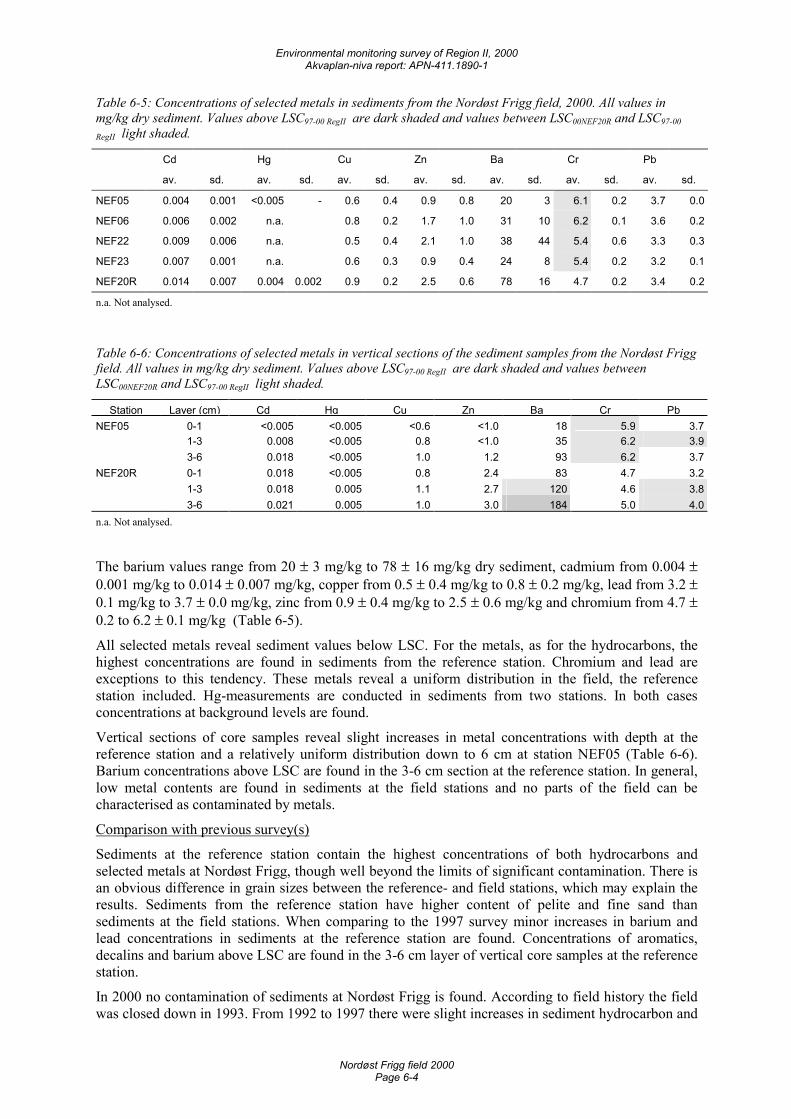
Environmental monitoring survey of Region II, 2000 Akvaplan-niva report: APN-411.1890-1
Nordøst Frigg field 2000 Page 6-4
Table 6-5: Concentrations of selected metals in sediments from the Nordøst Frigg field, 2000. All values in mg/kg dry sediment. Values above LSC97-00 RegII are dark shaded and values between LSC00NEF20R and LSC97-00
RegII light shaded.
Cd Hg Cu Zn Ba Cr Pb
av. sd. av. sd. av. sd. av. sd. av. sd. av. sd. av. sd.
NEF05 0.004 0.001 <0.005 - 0.6 0.4 0.9 0.8 20 3 6.1 0.2 3.7 0.0
NEF06 0.006 0.002 n.a. 0.8 0.2 1.7 1.0 31 10 6.2 0.1 3.6 0.2
NEF22 0.009 0.006 n.a. 0.5 0.4 2.1 1.0 38 44 5.4 0.6 3.3 0.3
NEF23 0.007 0.001 n.a. 0.6 0.3 0.9 0.4 24 8 5.4 0.2 3.2 0.1
NEF20R 0.014 0.007 0.004 0.002 0.9 0.2 2.5 0.6 78 16 4.7 0.2 3.4 0.2
n.a. Not analysed.
Table 6-6: Concentrations of selected metals in vertical sections of the sediment samples from the Nordøst Frigg field. All values in mg/kg dry sediment. Values above LSC97-00 RegII are dark shaded and values between LSC00NEF20R and LSC97-00 RegII light shaded.
Station Layer (cm) Cd Hg Cu Zn Ba Cr PbNEF05 0-1 <0.005 <0.005 <0.6 <1.0 18 5.9 3.7 1-3 0.008 <0.005 0.8 <1.0 35 6.2 3.9 3-6 0.018 <0.005 1.0 1.2 93 6.2 3.7NEF20R 0-1 0.018 <0.005 0.8 2.4 83 4.7 3.2 1-3 0.018 0.005 1.1 2.7 120 4.6 3.8 3-6 0.021 0.005 1.0 3.0 184 5.0 4.0n.a. Not analysed.
The barium values range from 20 ± 3 mg/kg to 78 ± 16 mg/kg dry sediment, cadmium from 0.004 ± 0.001 mg/kg to 0.014 ± 0.007 mg/kg, copper from 0.5 ± 0.4 mg/kg to 0.8 ± 0.2 mg/kg, lead from 3.2 ± 0.1 mg/kg to 3.7 ± 0.0 mg/kg, zinc from 0.9 ± 0.4 mg/kg to 2.5 ± 0.6 mg/kg and chromium from 4.7 ± 0.2 to 6.2 ± 0.1 mg/kg (Table 6-5).
All selected metals reveal sediment values below LSC. For the metals, as for the hydrocarbons, the highest concentrations are found in sediments from the reference station. Chromium and lead are exceptions to this tendency. These metals reveal a uniform distribution in the field, the reference station included. Hg-measurements are conducted in sediments from two stations. In both cases concentrations at background levels are found.
Vertical sections of core samples reveal slight increases in metal concentrations with depth at the reference station and a relatively uniform distribution down to 6 cm at station NEF05 (Table 6-6). Barium concentrations above LSC are found in the 3-6 cm section at the reference station. In general, low metal contents are found in sediments at the field stations and no parts of the field can be characterised as contaminated by metals.
Comparison with previous survey(s)
Sediments at the reference station contain the highest concentrations of both hydrocarbons and selected metals at Nordøst Frigg, though well beyond the limits of significant contamination. There is an obvious difference in grain sizes between the reference- and field stations, which may explain the results. Sediments from the reference station have higher content of pelite and fine sand than sediments at the field stations. When comparing to the 1997 survey minor increases in barium and lead concentrations in sediments at the reference station are found. Concentrations of aromatics, decalins and barium above LSC are found in the 3-6 cm layer of vertical core samples at the reference station.
In 2000 no contamination of sediments at Nordøst Frigg is found. According to field history the field was closed down in 1993. From 1992 to 1997 there were slight increases in sediment hydrocarbon and
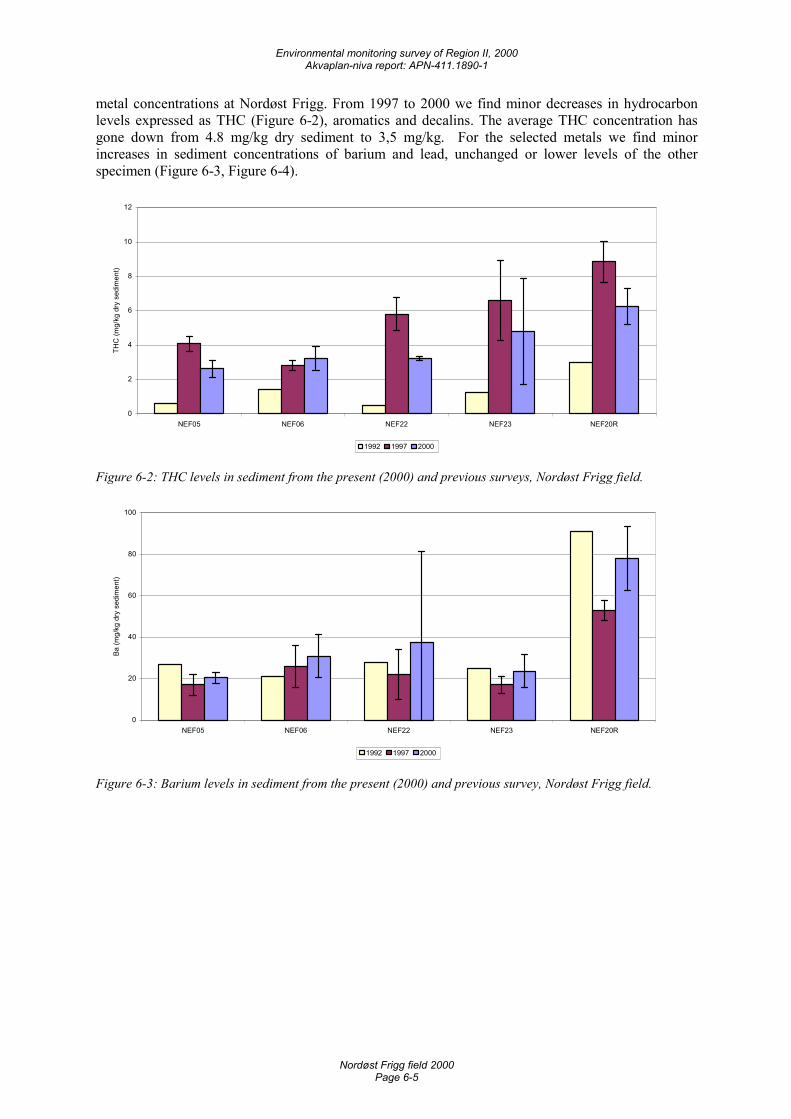
Environmental monitoring survey of Region II, 2000 Akvaplan-niva report: APN-411.1890-1
Nordøst Frigg field 2000 Page 6-5
metal concentrations at Nordøst Frigg. From 1997 to 2000 we find minor decreases in hydrocarbon levels expressed as THC (Figure 6-2), aromatics and decalins. The average THC concentration has gone down from 4.8 mg/kg dry sediment to 3,5 mg/kg. For the selected metals we find minor increases in sediment concentrations of barium and lead, unchanged or lower levels of the other specimen (Figure 6-3, Figure 6-4).
0
2
4
6
8
10
12
NEF05 NEF06 NEF22 NEF23 NEF20R
THC
(mg/
kg d
ry s
edim
ent)
1992 1997 2000
Figure 6-2: THC levels in sediment from the present (2000) and previous surveys, Nordøst Frigg field.
0
20
40
60
80
100
NEF05 NEF06 NEF22 NEF23 NEF20R
Ba (m
g/kg
dry
sed
imen
t)
1992 1997 2000
Figure 6-3: Barium levels in sediment from the present (2000) and previous survey, Nordøst Frigg field.
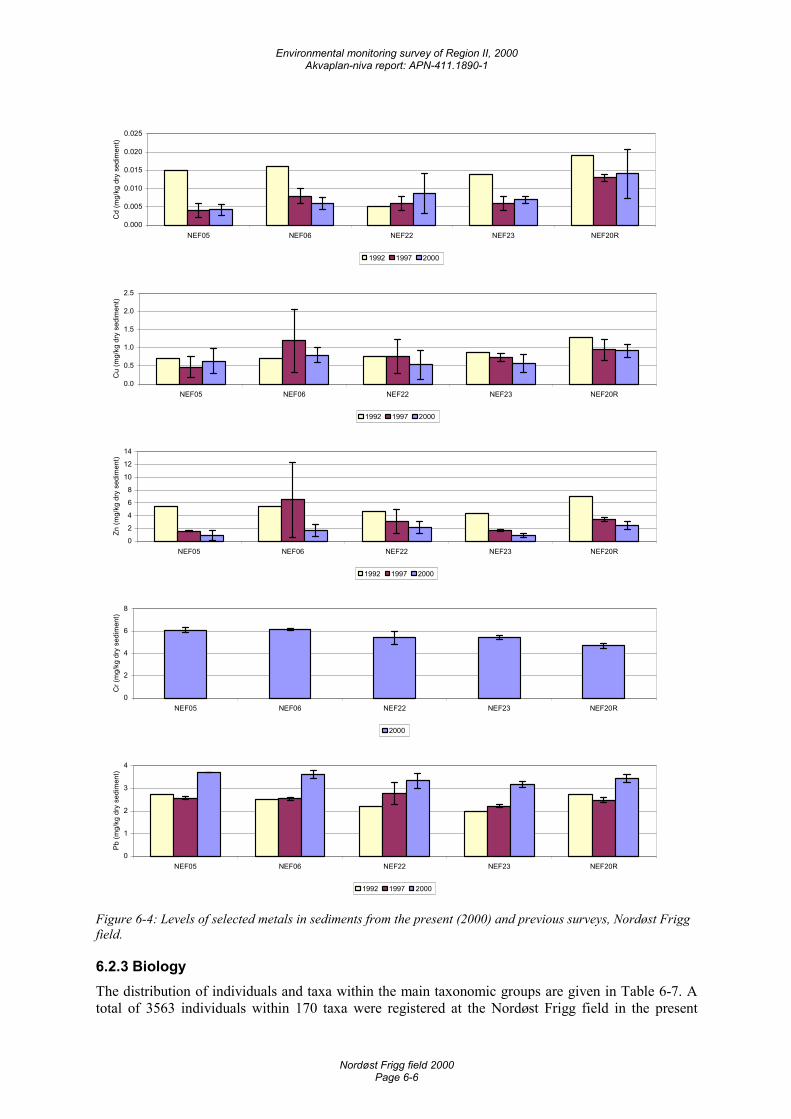
Environmental monitoring survey of Region II, 2000 Akvaplan-niva report: APN-411.1890-1
Nordøst Frigg field 2000 Page 6-6
0.000
0.005
0.010
0.015
0.020
0.025
NEF05 NEF06 NEF22 NEF23 NEF20R
Cd
(mg/
kg d
ry s
edim
ent)
1992 1997 2000
0.0
0.5
1.0
1.5
2.0
2.5
NEF05 NEF06 NEF22 NEF23 NEF20R
Cu
(mg/
kg d
ry s
edim
ent)
1992 1997 2000
0
2
4
6
8
10
12
14
NEF05 NEF06 NEF22 NEF23 NEF20R
Zn (m
g/kg
dry
sed
imen
t)
1992 1997 2000
0
2
4
6
8
NEF05 NEF06 NEF22 NEF23 NEF20R
Cr (
mg/
kg d
ry s
edim
ent)
2000
0
1
2
3
4
NEF05 NEF06 NEF22 NEF23 NEF20R
Pb (m
g/kg
dry
sed
imen
t)
1992 1997 2000
Figure 6-4: Levels of selected metals in sediments from the present (2000) and previous surveys, Nordøst Frigg field.
6.2.3 Biology The distribution of individuals and taxa within the main taxonomic groups are given in Table 6-7. A total of 3563 individuals within 170 taxa were registered at the Nordøst Frigg field in the present
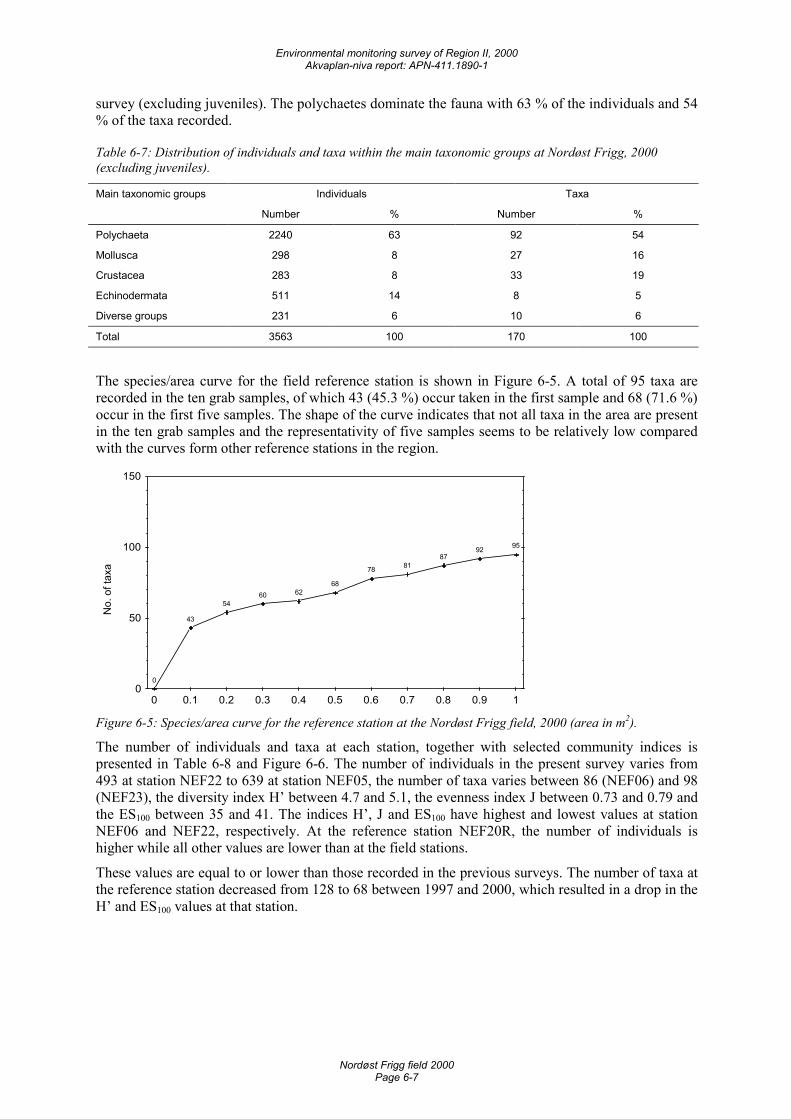
Environmental monitoring survey of Region II, 2000 Akvaplan-niva report: APN-411.1890-1
Nordøst Frigg field 2000 Page 6-7
survey (excluding juveniles). The polychaetes dominate the fauna with 63 % of the individuals and 54 % of the taxa recorded.
Table 6-7: Distribution of individuals and taxa within the main taxonomic groups at Nordøst Frigg, 2000 (excluding juveniles).
Main taxonomic groups Individuals Taxa
Number % Number %
Polychaeta 2240 63 92 54
Mollusca 298 8 27 16
Crustacea 283 8 33 19
Echinodermata 511 14 8 5
Diverse groups 231 6 10 6
Total 3563 100 170 100
The species/area curve for the field reference station is shown in Figure 6-5. A total of 95 taxa are recorded in the ten grab samples, of which 43 (45.3 %) occur taken in the first sample and 68 (71.6 %) occur in the first five samples. The shape of the curve indicates that not all taxa in the area are present in the ten grab samples and the representativity of five samples seems to be relatively low compared with the curves form other reference stations in the region.
No.
of t
axa
0
43
5460 62
68
78 8187
92 95
0
50
100
150
0 0.1 0.2 0.3 0.4 0.5 0.6 0.7 0.8 0.9 1 Figure 6-5: Species/area curve for the reference station at the Nordøst Frigg field, 2000 (area in m2).
The number of individuals and taxa at each station, together with selected community indices is presented in Table 6-8 and Figure 6-6. The number of individuals in the present survey varies from 493 at station NEF22 to 639 at station NEF05, the number of taxa varies between 86 (NEF06) and 98 (NEF23), the diversity index H’ between 4.7 and 5.1, the evenness index J between 0.73 and 0.79 and the ES100 between 35 and 41. The indices H’, J and ES100 have highest and lowest values at station NEF06 and NEF22, respectively. At the reference station NEF20R, the number of individuals is higher while all other values are lower than at the field stations.
These values are equal to or lower than those recorded in the previous surveys. The number of taxa at the reference station decreased from 128 to 68 between 1997 and 2000, which resulted in a drop in the H’ and ES100 values at that station.
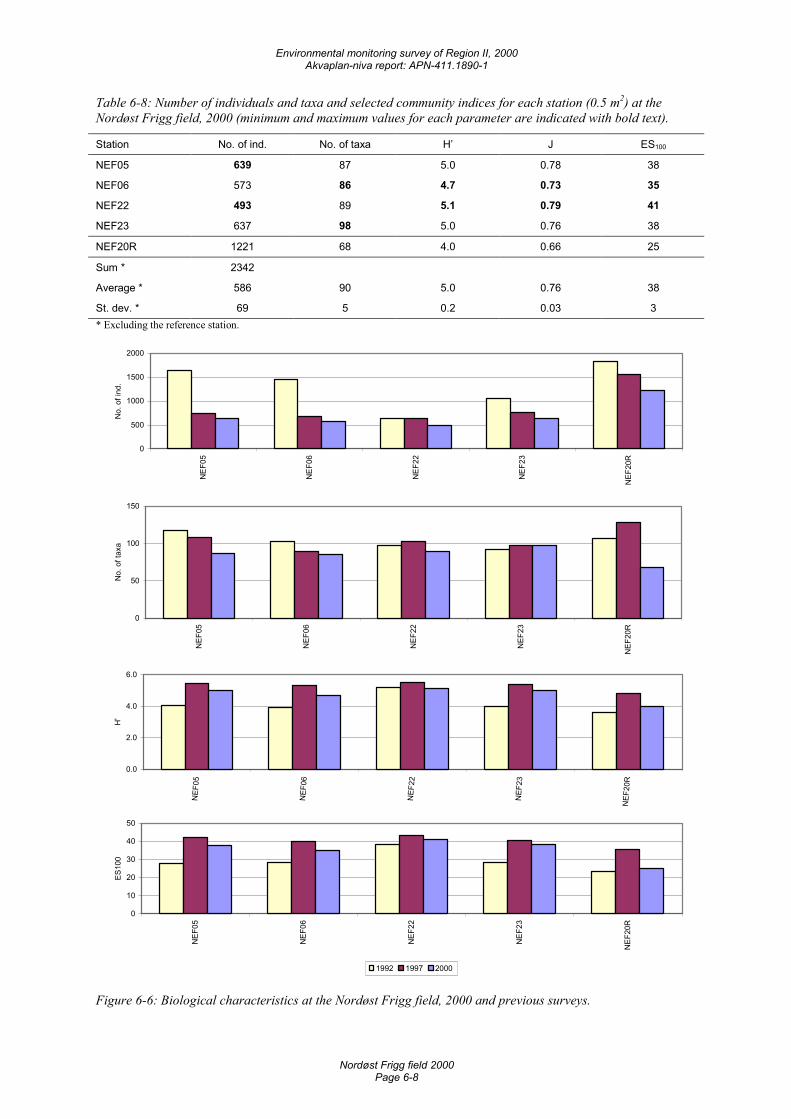
Environmental monitoring survey of Region II, 2000 Akvaplan-niva report: APN-411.1890-1
Nordøst Frigg field 2000 Page 6-8
Table 6-8: Number of individuals and taxa and selected community indices for each station (0.5 m2) at the Nordøst Frigg field, 2000 (minimum and maximum values for each parameter are indicated with bold text).
Station No. of ind. No. of taxa H’ J ES100
NEF05 639 87 5.0 0.78 38
NEF06 573 86 4.7 0.73 35
NEF22 493 89 5.1 0.79 41
NEF23 637 98 5.0 0.76 38
NEF20R 1221 68 4.0 0.66 25
Sum * 2342
Average * 586 90 5.0 0.76 38
St. dev. * 69 5 0.2 0.03 3 * Excluding the reference station.
0
500
1000
1500
2000
NEF
05
NEF
06
NEF
22
NEF
23
NEF
20R
No.
of i
nd.
0
50
100
150
NEF
05
NEF
06
NEF
22
NEF
23
NEF
20R
No.
of t
axa
0.0
2.0
4.0
6.0
NEF
05
NEF
06
NE F
22
NEF
23
NEF
20R
H'
0
10
20
30
40
50
NEF
05
NEF
06
NEF
22
NEF
23
NEF
20R
ES10
0
1992 1997 2000
Figure 6-6: Biological characteristics at the Nordøst Frigg field, 2000 and previous surveys.
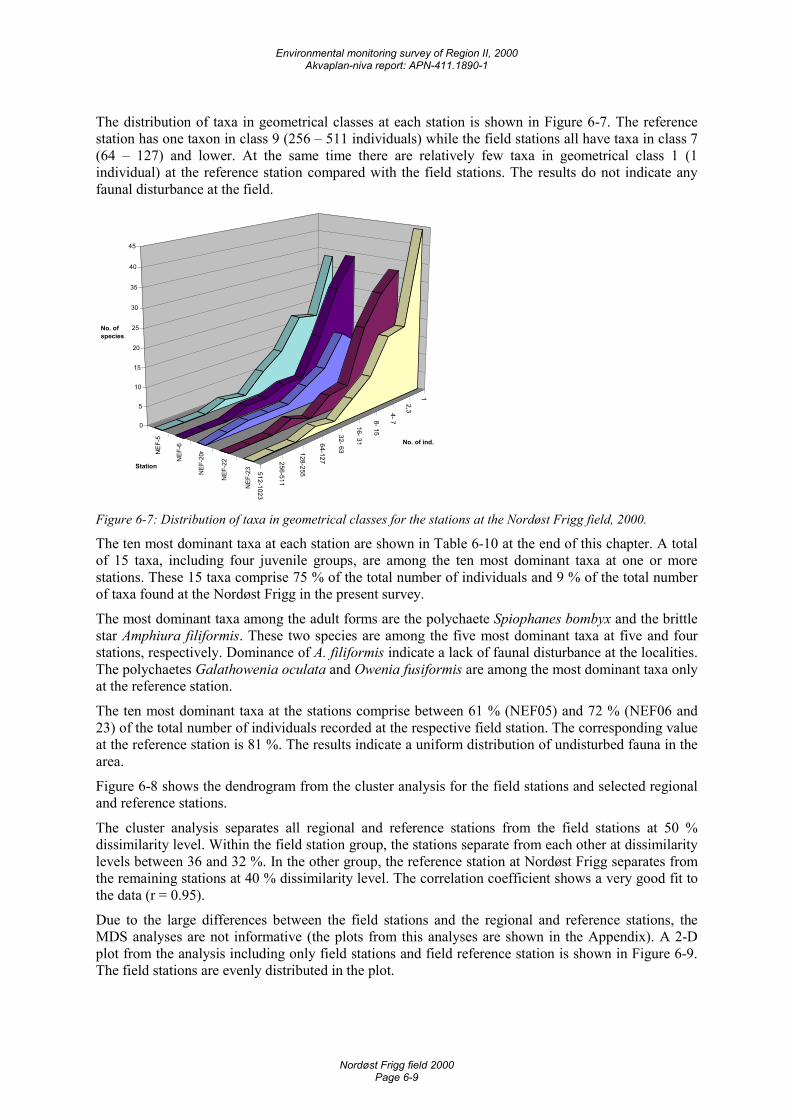
Environmental monitoring survey of Region II, 2000 Akvaplan-niva report: APN-411.1890-1
Nordøst Frigg field 2000 Page 6-9
The distribution of taxa in geometrical classes at each station is shown in Figure 6-7. The reference station has one taxon in class 9 (256 – 511 individuals) while the field stations all have taxa in class 7 (64 – 127) and lower. At the same time there are relatively few taxa in geometrical class 1 (1 individual) at the reference station compared with the field stations. The results do not indicate any faunal disturbance at the field.
1
2,3 4- 7 8- 15
16- 31
32- 63
64-127
128-255
256-511
512-1023
NEF
-5
NEF
-6
NEF
-20r
NEF
-22
NEF
-23
0
5
10
15
20
25
30
35
40
45
No. of ind.
Station
No. of species
Figure 6-7: Distribution of taxa in geometrical classes for the stations at the Nordøst Frigg field, 2000.
The ten most dominant taxa at each station are shown in Table 6-10 at the end of this chapter. A total of 15 taxa, including four juvenile groups, are among the ten most dominant taxa at one or more stations. These 15 taxa comprise 75 % of the total number of individuals and 9 % of the total number of taxa found at the Nordøst Frigg in the present survey.
The most dominant taxa among the adult forms are the polychaete Spiophanes bombyx and the brittle star Amphiura filiformis. These two species are among the five most dominant taxa at five and four stations, respectively. Dominance of A. filiformis indicate a lack of faunal disturbance at the localities. The polychaetes Galathowenia oculata and Owenia fusiformis are among the most dominant taxa only at the reference station.
The ten most dominant taxa at the stations comprise between 61 % (NEF05) and 72 % (NEF06 and 23) of the total number of individuals recorded at the respective field station. The corresponding value at the reference station is 81 %. The results indicate a uniform distribution of undisturbed fauna in the area.
Figure 6-8 shows the dendrogram from the cluster analysis for the field stations and selected regional and reference stations.
The cluster analysis separates all regional and reference stations from the field stations at 50 % dissimilarity level. Within the field station group, the stations separate from each other at dissimilarity levels between 36 and 32 %. In the other group, the reference station at Nordøst Frigg separates from the remaining stations at 40 % dissimilarity level. The correlation coefficient shows a very good fit to the data (r = 0.95).
Due to the large differences between the field stations and the regional and reference stations, the MDS analyses are not informative (the plots from this analyses are shown in the Appendix). A 2-D plot from the analysis including only field stations and field reference station is shown in Figure 6-9. The field stations are evenly distributed in the plot.
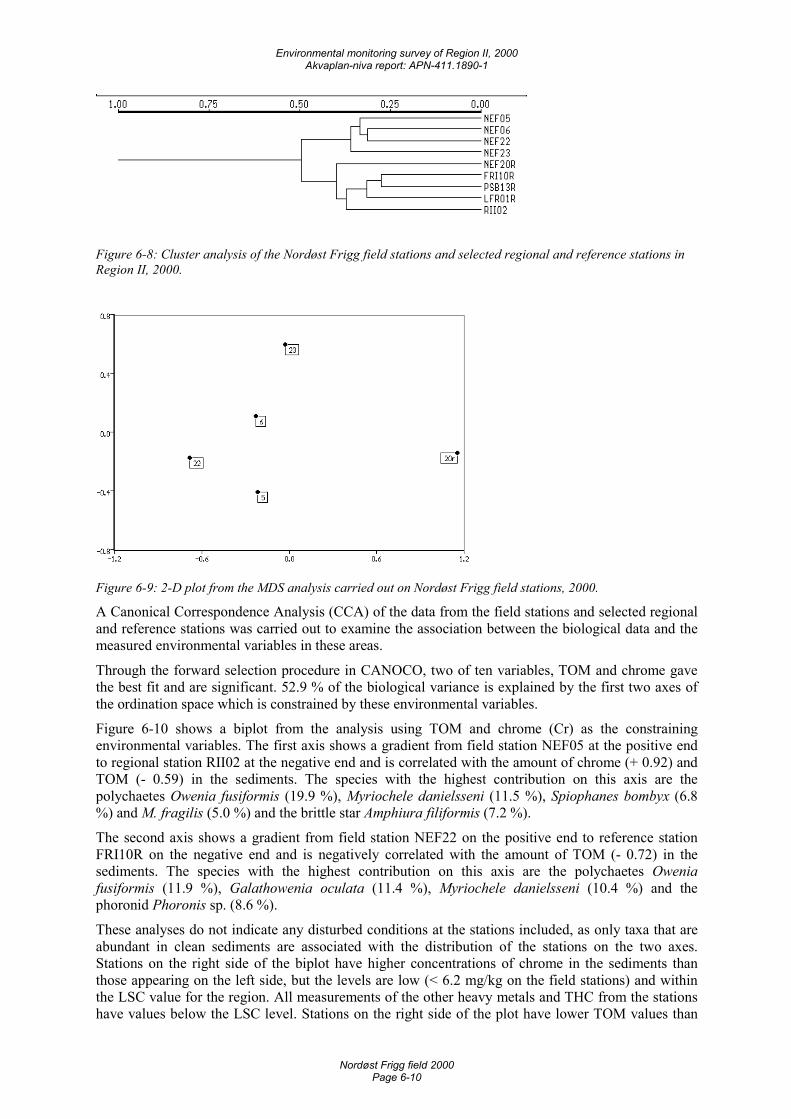
Environmental monitoring survey of Region II, 2000 Akvaplan-niva report: APN-411.1890-1
Nordøst Frigg field 2000 Page 6-10
Figure 6-8: Cluster analysis of the Nordøst Frigg field stations and selected regional and reference stations in Region II, 2000.
Figure 6-9: 2-D plot from the MDS analysis carried out on Nordøst Frigg field stations, 2000.
A Canonical Correspondence Analysis (CCA) of the data from the field stations and selected regional and reference stations was carried out to examine the association between the biological data and the measured environmental variables in these areas.
Through the forward selection procedure in CANOCO, two of ten variables, TOM and chrome gave the best fit and are significant. 52.9 % of the biological variance is explained by the first two axes of the ordination space which is constrained by these environmental variables.
Figure 6-10 shows a biplot from the analysis using TOM and chrome (Cr) as the constraining environmental variables. The first axis shows a gradient from field station NEF05 at the positive end to regional station RII02 at the negative end and is correlated with the amount of chrome (+ 0.92) and TOM (- 0.59) in the sediments. The species with the highest contribution on this axis are the polychaetes Owenia fusiformis (19.9 %), Myriochele danielsseni (11.5 %), Spiophanes bombyx (6.8 %) and M. fragilis (5.0 %) and the brittle star Amphiura filiformis (7.2 %).
The second axis shows a gradient from field station NEF22 on the positive end to reference station FRI10R on the negative end and is negatively correlated with the amount of TOM (- 0.72) in the sediments. The species with the highest contribution on this axis are the polychaetes Owenia fusiformis (11.9 %), Galathowenia oculata (11.4 %), Myriochele danielsseni (10.4 %) and the phoronid Phoronis sp. (8.6 %).
These analyses do not indicate any disturbed conditions at the stations included, as only taxa that are abundant in clean sediments are associated with the distribution of the stations on the two axes. Stations on the right side of the biplot have higher concentrations of chrome in the sediments than those appearing on the left side, but the levels are low (< 6.2 mg/kg on the field stations) and within the LSC value for the region. All measurements of the other heavy metals and THC from the stations have values below the LSC level. Stations on the right side of the plot have lower TOM values than
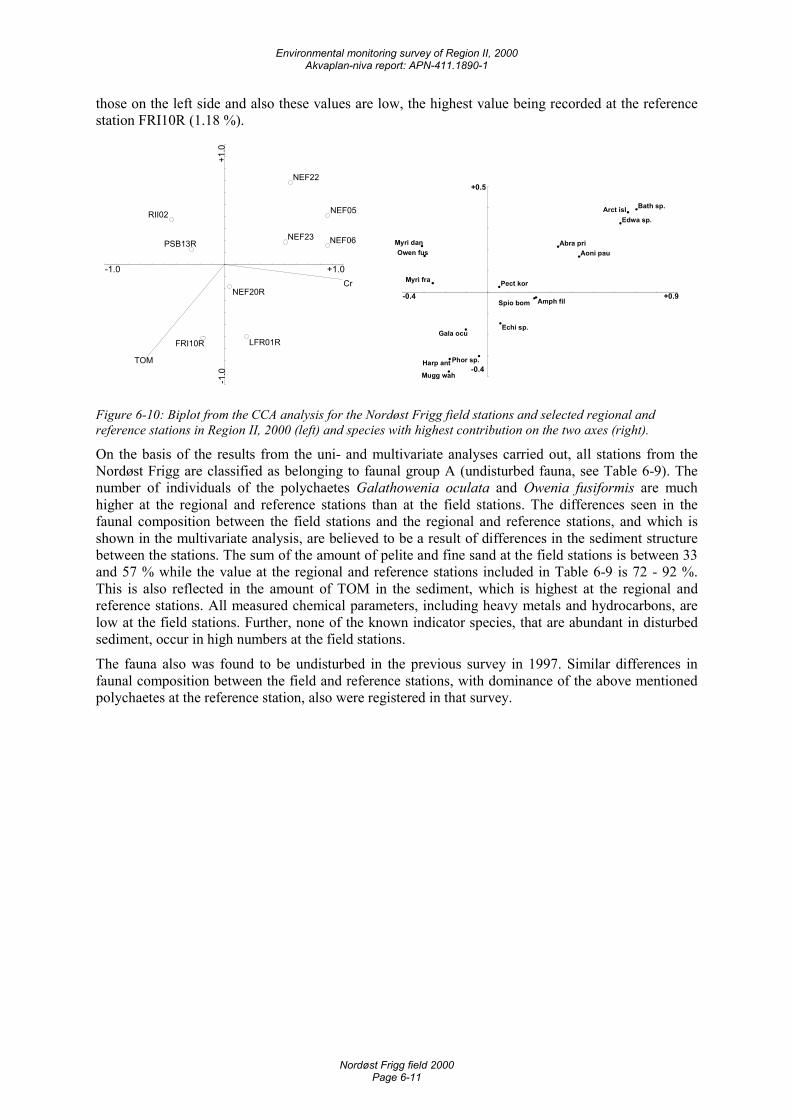
Environmental monitoring survey of Region II, 2000 Akvaplan-niva report: APN-411.1890-1
Nordøst Frigg field 2000 Page 6-11
those on the left side and also these values are low, the highest value being recorded at the reference station FRI10R (1.18 %).
-1.0 +1.0
-1.0
+1.0
Cr
TOM
NEF05
NEF06
NEF22
NEF23
RII02
PSB13R
LFR01RFRI10R
NEF20R� -0.4 +0.9
-0.4
+0.5
Bath sp.Arct islEdwa sp.
Aoni pauAbra priMyri dan
Owen fus
Myri fra
Amph filSpio bom
Mugg wah
Harp ant
Gala ocuEchi sp.
Pect kor
Phor sp.
Figure 6-10: Biplot from the CCA analysis for the Nordøst Frigg field stations and selected regional and reference stations in Region II, 2000 (left) and species with highest contribution on the two axes (right).
On the basis of the results from the uni- and multivariate analyses carried out, all stations from the Nordøst Frigg are classified as belonging to faunal group A (undisturbed fauna, see Table 6-9). The number of individuals of the polychaetes Galathowenia oculata and Owenia fusiformis are much higher at the regional and reference stations than at the field stations. The differences seen in the faunal composition between the field stations and the regional and reference stations, and which is shown in the multivariate analysis, are believed to be a result of differences in the sediment structure between the stations. The sum of the amount of pelite and fine sand at the field stations is between 33 and 57 % while the value at the regional and reference stations included in Table 6-9 is 72 - 92 %. This is also reflected in the amount of TOM in the sediment, which is highest at the regional and reference stations. All measured chemical parameters, including heavy metals and hydrocarbons, are low at the field stations. Further, none of the known indicator species, that are abundant in disturbed sediment, occur in high numbers at the field stations.
The fauna also was found to be undisturbed in the previous survey in 1997. Similar differences in faunal composition between the field and reference stations, with dominance of the above mentioned polychaetes at the reference station, also were registered in that survey.
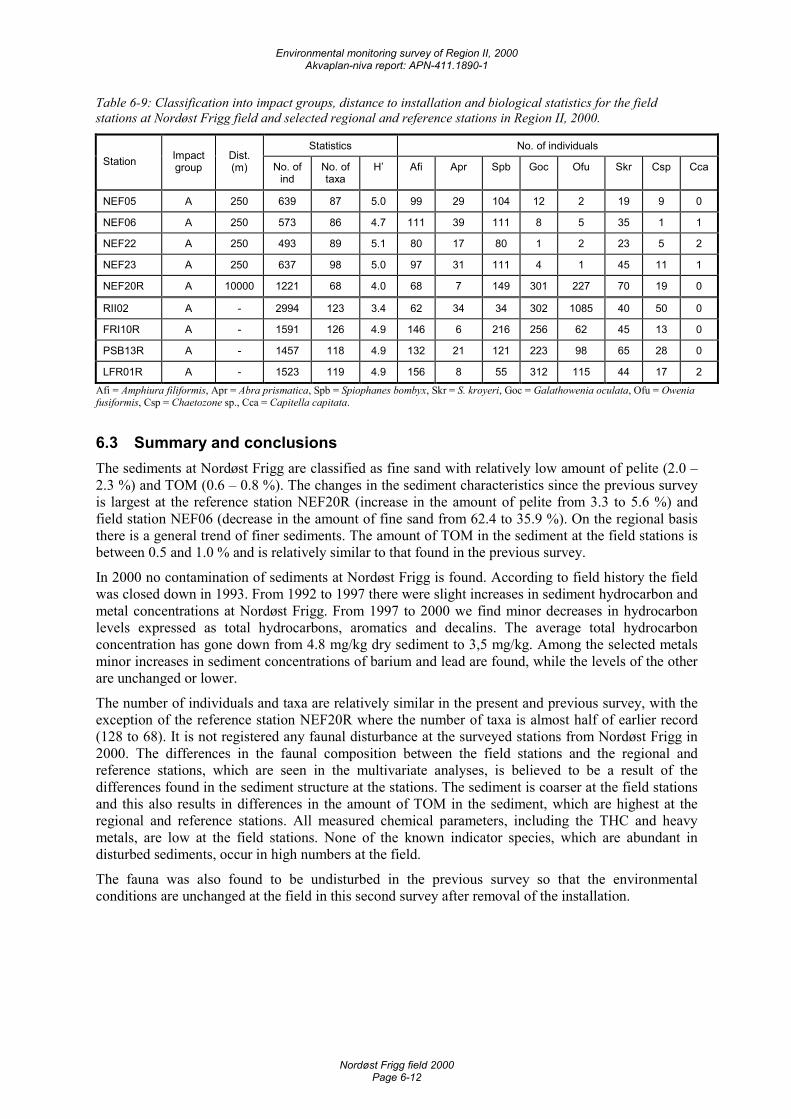
Environmental monitoring survey of Region II, 2000 Akvaplan-niva report: APN-411.1890-1
Nordøst Frigg field 2000 Page 6-12
Table 6-9: Classification into impact groups, distance to installation and biological statistics for the field stations at Nordøst Frigg field and selected regional and reference stations in Region II, 2000.
Statistics No. of individuals Station Impact
group Dist. (m) No. of
ind No. of taxa
H’ Afi Apr Spb Goc Ofu Skr Csp Cca
NEF05 A 250 639 87 5.0 99 29 104 12 2 19 9 0
NEF06 A 250 573 86 4.7 111 39 111 8 5 35 1 1
NEF22 A 250 493 89 5.1 80 17 80 1 2 23 5 2
NEF23 A 250 637 98 5.0 97 31 111 4 1 45 11 1
NEF20R A 10000 1221 68 4.0 68 7 149 301 227 70 19 0
RII02 A - 2994 123 3.4 62 34 34 302 1085 40 50 0
FRI10R A - 1591 126 4.9 146 6 216 256 62 45 13 0
PSB13R A - 1457 118 4.9 132 21 121 223 98 65 28 0
LFR01R A - 1523 119 4.9 156 8 55 312 115 44 17 2 Afi = Amphiura filiformis, Apr = Abra prismatica, Spb = Spiophanes bombyx, Skr = S. kroyeri, Goc = Galathowenia oculata, Ofu = Owenia fusiformis, Csp = Chaetozone sp., Cca = Capitella capitata.
6.3 Summary and conclusions The sediments at Nordøst Frigg are classified as fine sand with relatively low amount of pelite (2.0 – 2.3 %) and TOM (0.6 – 0.8 %). The changes in the sediment characteristics since the previous survey is largest at the reference station NEF20R (increase in the amount of pelite from 3.3 to 5.6 %) and field station NEF06 (decrease in the amount of fine sand from 62.4 to 35.9 %). On the regional basis there is a general trend of finer sediments. The amount of TOM in the sediment at the field stations is between 0.5 and 1.0 % and is relatively similar to that found in the previous survey.
In 2000 no contamination of sediments at Nordøst Frigg is found. According to field history the field was closed down in 1993. From 1992 to 1997 there were slight increases in sediment hydrocarbon and metal concentrations at Nordøst Frigg. From 1997 to 2000 we find minor decreases in hydrocarbon levels expressed as total hydrocarbons, aromatics and decalins. The average total hydrocarbon concentration has gone down from 4.8 mg/kg dry sediment to 3,5 mg/kg. Among the selected metals minor increases in sediment concentrations of barium and lead are found, while the levels of the other are unchanged or lower.
The number of individuals and taxa are relatively similar in the present and previous survey, with the exception of the reference station NEF20R where the number of taxa is almost half of earlier record (128 to 68). It is not registered any faunal disturbance at the surveyed stations from Nordøst Frigg in 2000. The differences in the faunal composition between the field stations and the regional and reference stations, which are seen in the multivariate analyses, is believed to be a result of the differences found in the sediment structure at the stations. The sediment is coarser at the field stations and this also results in differences in the amount of TOM in the sediment, which are highest at the regional and reference stations. All measured chemical parameters, including the THC and heavy metals, are low at the field stations. None of the known indicator species, which are abundant in disturbed sediments, occur in high numbers at the field.
The fauna was also found to be undisturbed in the previous survey so that the environmental conditions are unchanged at the field in this second survey after removal of the installation.
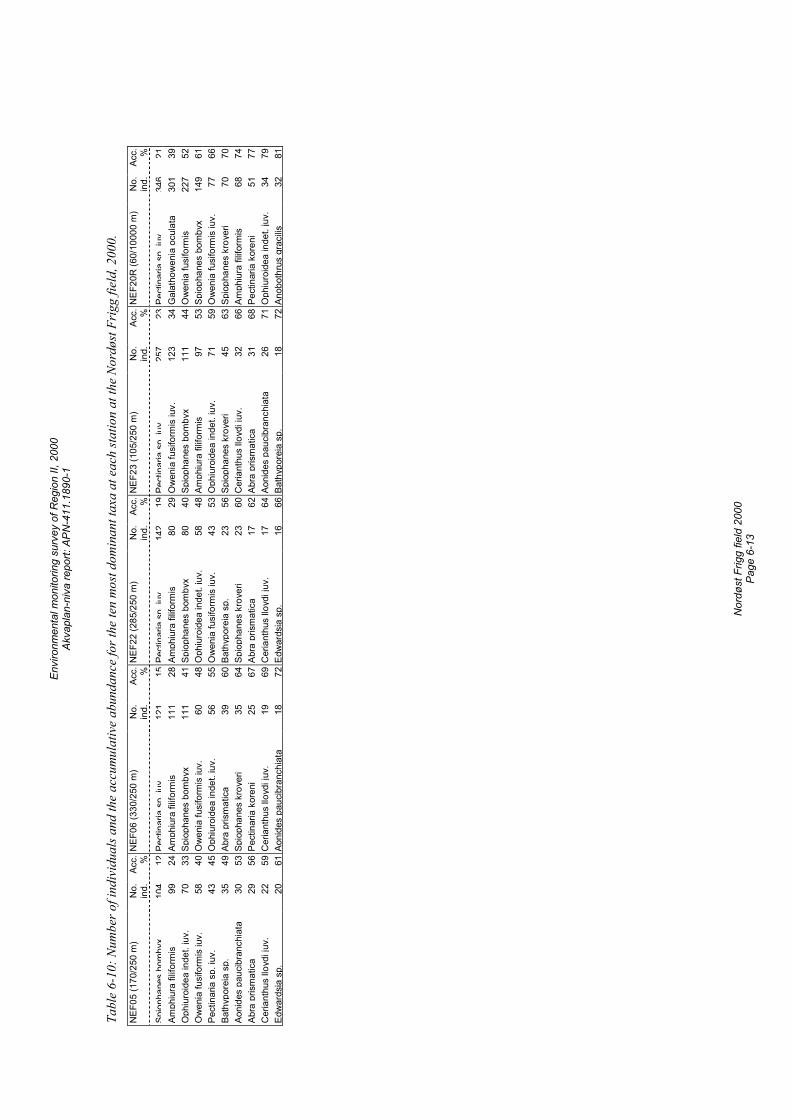
Envi
ronm
enta
l mon
itorin
g su
rvey
of R
egio
n II,
200
0 Ak
vapl
an-n
iva
repo
rt: A
PN-4
11.1
890-
1
N
ordø
st F
rigg
field
200
0 Pa
ge 6
-13
Tabl
e 6-
10: N
umbe
r of i
ndiv
idua
ls an
d th
e ac
cum
ulat
ive
abun
danc
e fo
r the
ten
mos
t dom
inan
t tax
a at
eac
h sta
tion
at th
e No
rdøs
t Frig
g fie
ld, 2
000.
N
EF05
(170
/250
m)
No.
in
d.
Acc.
%
NEF
06 (3
30/2
50 m
) N
o.
ind.
Acc.
%
NEF
22 (2
85/2
50 m
) N
o.
ind.
Acc.
%
NEF
23 (1
05/2
50 m
) N
o.
ind.
Acc.
%
NEF
20R
(60/
1000
0 m
) N
o.
ind.
Acc.
%
Spio
phan
esbo
mby
x10
412
Pect
inar
iasp
.juv
.12
115
Pect
inar
iasp
.juv
.14
219
Pect
inar
iasp
.juv
.25
723
Pect
inar
iasp
.juv
.34
621
Amph
iura
filif
orm
is
99
24 A
mph
iura
filif
orm
is11
128
Amph
iura
filif
orm
is80
29 O
wen
ia fu
sifo
rmis
juv.
123
34G
alat
how
enia
ocu
lata
301
39O
phiu
roid
ea in
det.
juv.
70
33
Spi
opha
nes
bom
byx
111
41Sp
ioph
anes
bom
byx
8040
Spi
opha
nes
bom
byx
111
44O
wen
ia fu
sifo
rmis
227
52O
wen
ia fu
sifo
rmis
juv.
58
40
Ow
enia
fusi
form
is ju
v.60
48O
phiu
roid
ea in
det.
juv.
5848
Am
phiu
ra fi
lifor
mis
9753
Spio
phan
es b
omby
x14
961
Pect
inar
ia s
p. ju
v.
43
45 O
phiu
roid
ea in
det.
juv.
5655
Ow
enia
fusi
form
is ju
v.43
53 O
phiu
roid
ea in
det.
juv.
7159
Ow
enia
fusi
form
is ju
v.77
66Ba
thyp
orei
a sp
. 35
49
Abr
a pr
ism
atic
a39
60Ba
thyp
orei
a sp
.23
56 S
piop
hane
s kr
oyer
i45
63Sp
ioph
anes
kro
yeri
7070
Aoni
des
pauc
ibra
nchi
ata
30
53 S
piop
hane
s kr
oyer
i35
64Sp
ioph
anes
kro
yeri
2360
Cer
iant
hus
lloyd
i juv
.32
66Am
phiu
ra fi
lifor
mis
6874
Abra
pris
mat
ica
29
56 P
ectin
aria
kor
eni
2567
Abra
pris
mat
ica
1762
Abr
a pr
ism
atic
a31
68Pe
ctin
aria
kor
eni
5177
Cer
iant
hus
lloyd
i juv
. 22
59
Cer
iant
hus
lloyd
i juv
.19
69C
eria
nthu
s llo
ydi j
uv.
1764
Aon
ides
pau
cibr
anch
iata
2671
Oph
iuro
idea
inde
t. ju
v.34
79Ed
war
dsia
sp.
20
61
Aon
ides
pau
cibr
anch
iata
1872
Edw
ards
ia s
p.16
66 B
athy
pore
ia s
p.18
72An
obot
hrus
gra
cilis
3281
Envi
ronm
enta
l mon
itorin
g su
rvey
of R
egio
n II,
200
0 Ak
vapl
an-n
iva
repo
rt: A
PN-4
11.1
890-
1
N
ordø
st F
rigg
field
200
0 Pa
ge 6
-14
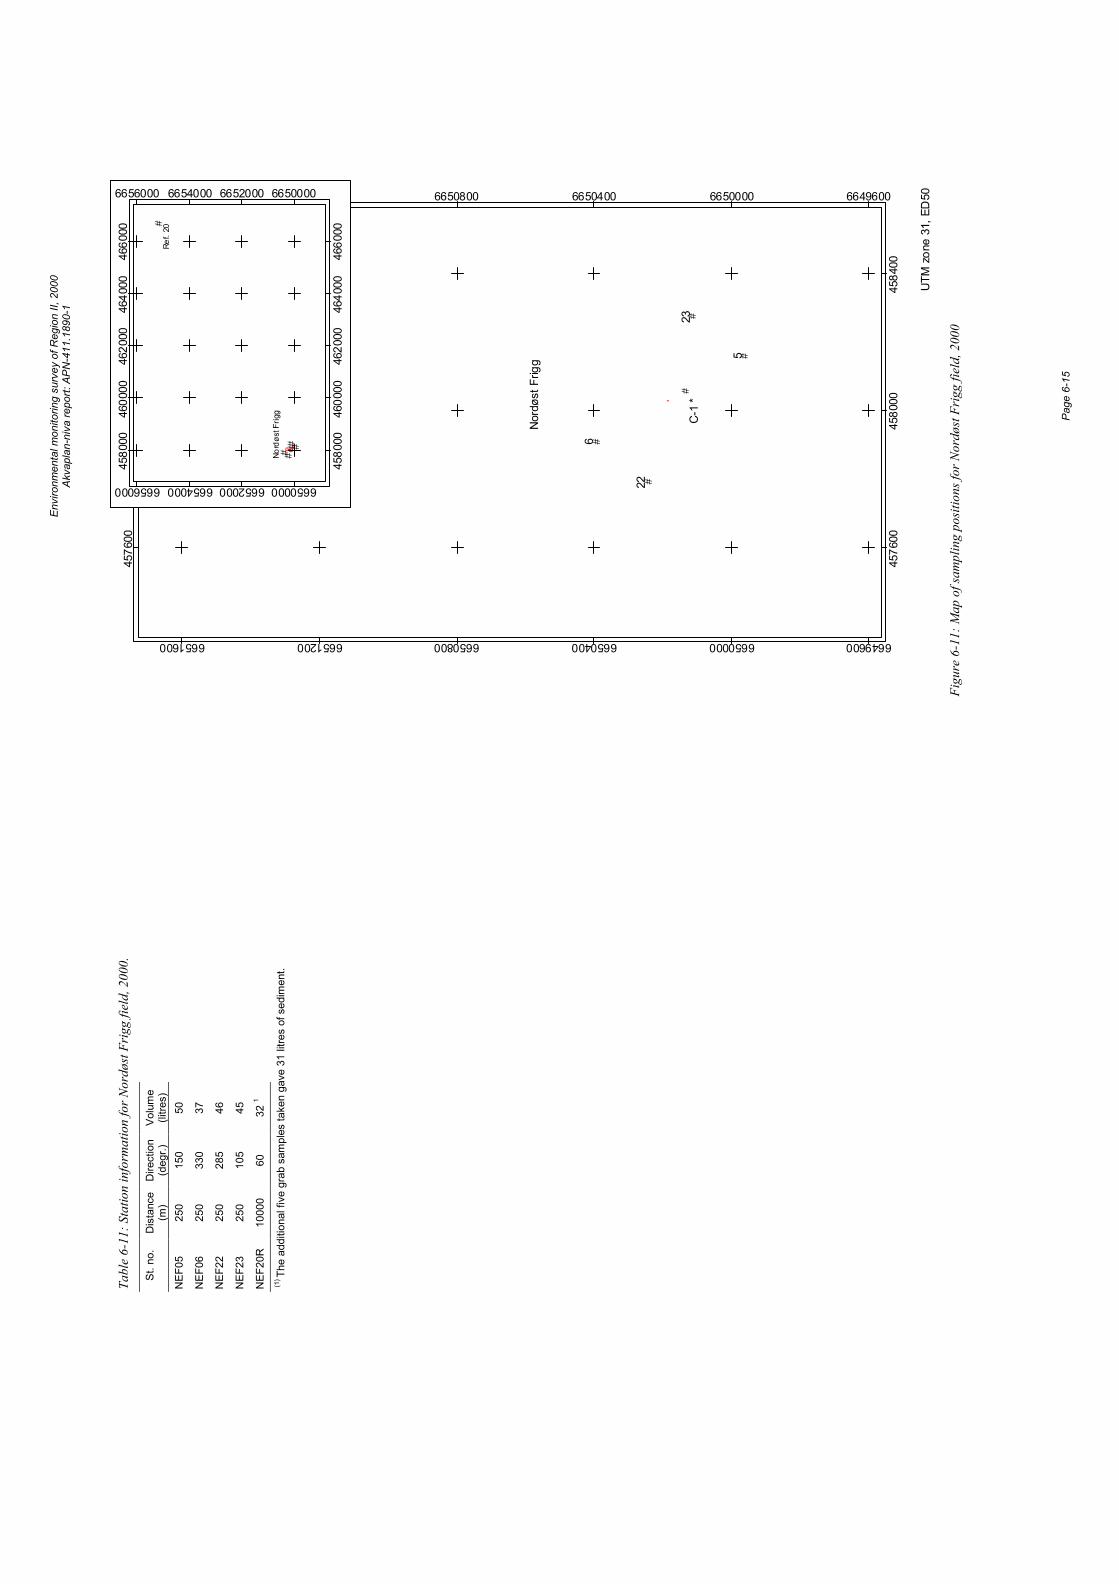
Envi
ronm
enta
l mon
itorin
g su
rvey
of R
egio
n II,
200
0 Ak
vapl
an-n
iva
repo
rt: A
PN-4
11.1
890-
1
Pa
ge 6
-15
#
#
#
##
'
5
6
22
23C
-1 *
Nor
døst
Frig
g
UTM
zon
e 31
, ED
50
4576
00
4576
00
4580
00
4580
00
4584
00
4584
00
6649600
6649600
6650000
6650000
6650400
6650400
6650800
6650800
6651200
6651200
6651600
6651600
## #
#
#
#&
Ref.
20
Nord
øst F
rigg
4580
00
4580
00
4600
00
4600
00
4620
00
4620
00
4640
00
4640
00
4660
00
4660
00
6650000
6650000
6652000
6652000
6654000
6654000
6656000
6656000
Fi
gure
6-1
1: M
ap o
f sam
plin
g po
sitio
ns fo
r Nor
døst
Frig
g fie
ld, 2
000
Tabl
e 6-
11: S
tatio
n in
form
atio
n fo
r Nor
døst
Frig
g fie
ld, 2
000.
St. n
o.
Dis
tanc
e (m
) D
irect
ion
(deg
r.)
Volu
me
(litre
s)
NEF
05
250
150
50
NEF
06
250
330
37
NEF
22
250
285
46
NEF
23
250
105
45
NEF
20R
10
000
60
32 1
(1) Th
e ad
ditio
nal f
ive
grab
sam
ples
take
n ga
ve 3
1 lit
res
of s
edim
ent.

Envi
ronm
enta
l mon
itorin
g su
rvey
of R
egio
n II,
200
0 Ak
vapl
an-n
iva
repo
rt: A
PN-4
11.1
890-
1
Pa
ge 6
-16
Environmental monitoring survey of Region II, 2000 Akvaplan-niva report: APN-411.1890-1
Øst Frigg field 2000 Page 7-1
7 Øst Frigg field 7.1 Introduction The Øst Frigg field is located in block 25/1 and 25/2 in the Region II. Production at the field started in 1988 and the field was closed down in 1997. There has been no drilling activity at the field since the previous survey. The wells were permanently plugged and abandoned in 1999 and the discharges given in Table 7-1 occur during this operation. Some parts of the well head equipment have been removed while the frame will be removed in 2001.
In the monitoring survey at the field in 1997 the stations situated 500 m in the 330°direction relative to PSA and 250 m in directions 150° and 240° were contaminated by hydrocarbons. The area contaminated with barium extended 500 m in the 330° direction and 250 m in directions 150° and 60° relative to PSA, in addition to the stations situated 250 m in directions 150°and 240°relative to PSB. Sediments contaminated by the other selected metals were not found in 1997. The fauna was found to be slightly disturbed at 250 m distance south east of PSA. Based on the results obtained in 1997, five field stations at 500 m and one of the reference stations were excluded from the present survey.
Information on the sampling stations is shown in Figure 7-13 and Table 7-13, both on the foldout page at the end of this chapter (page 7-19). In addition, samples from the cutting piles at the field were collected by use of a van Veen grab (biology) and box corer (chemistry). A separate report with these results will be produced.
Table 7-1: Summary of recent operational and accidental discharges at the Øst Frigg field (all discharges in tonnes).
1997 1998 1999 2000 Comments
Barite 0 0 81 -
Water-based drilling mud 0 0 804 -
Cementing chemicals 0 0 310 -
7.2 Results and discussion
7.2.1 Physical characteristics The median phi value and the amounts (%) of pelite, fine sand and total organic material (TOM) in the sediment from the present and previous surveys are shown in Table 7-2 and Figure 7-1. Detailed data on sediment characteristics such as colour, smell and a full set of analytical data, including TOM content and grain size distribution (with standard deviation, evenness and kurtosis) can be found in the Appendix.
The sediments in the area are classified as fine sand with a median value varying from 3.36 to 3.58. The amount of pelite in the sediment varies from 3.59 % (station PSA09) to 5.57 % (station PSA08), the fine sand from 65.4 % (station PSA08) to 90.6 % (station PSB17) while the TOM varies from 0.91 % (station PSB08) to 1.25 % (station PSB16). The median and pelite values are higher at the reference station PSB13R than at the field stations, while the fine sand and TOM values are within the range for the field stations.
Compared with the previous surveys, there is a general trend for finer sediments at the stations, while the amount of TOM in the sediment has decreased since 1997, with the exception of station PSB16.
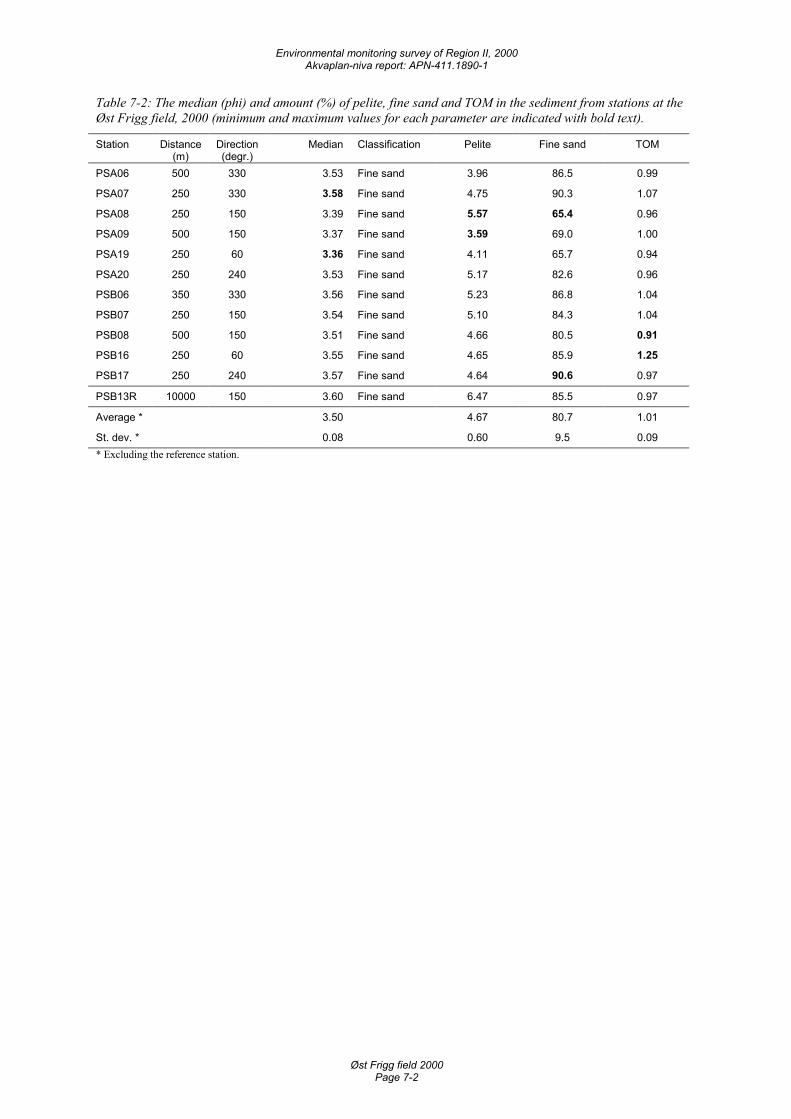
Environmental monitoring survey of Region II, 2000 Akvaplan-niva report: APN-411.1890-1
Øst Frigg field 2000 Page 7-2
Table 7-2: The median (phi) and amount (%) of pelite, fine sand and TOM in the sediment from stations at the Øst Frigg field, 2000 (minimum and maximum values for each parameter are indicated with bold text).
Station Distance (m)
Direction (degr.)
Median Classification Pelite Fine sand TOM
PSA06 500 330 3.53 Fine sand 3.96 86.5 0.99
PSA07 250 330 3.58 Fine sand 4.75 90.3 1.07
PSA08 250 150 3.39 Fine sand 5.57 65.4 0.96
PSA09 500 150 3.37 Fine sand 3.59 69.0 1.00
PSA19 250 60 3.36 Fine sand 4.11 65.7 0.94
PSA20 250 240 3.53 Fine sand 5.17 82.6 0.96
PSB06 350 330 3.56 Fine sand 5.23 86.8 1.04
PSB07 250 150 3.54 Fine sand 5.10 84.3 1.04
PSB08 500 150 3.51 Fine sand 4.66 80.5 0.91
PSB16 250 60 3.55 Fine sand 4.65 85.9 1.25
PSB17 250 240 3.57 Fine sand 4.64 90.6 0.97
PSB13R 10000 150 3.60 Fine sand 6.47 85.5 0.97
Average * 3.50 4.67 80.7 1.01
St. dev. * 0.08 0.60 9.5 0.09 * Excluding the reference station.
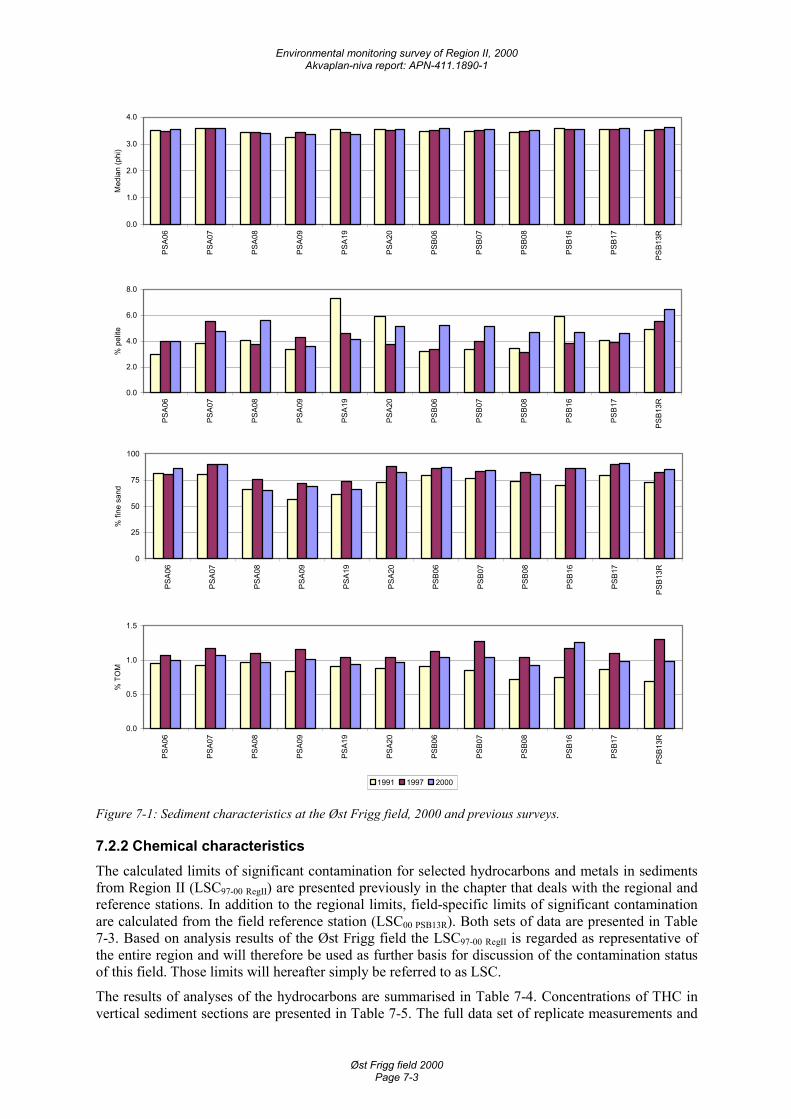
Environmental monitoring survey of Region II, 2000 Akvaplan-niva report: APN-411.1890-1
Øst Frigg field 2000 Page 7-3
0.0
1.0
2.0
3.0
4.0
PSA0
6
PSA0
7
PSA0
8
PSA0
9
PSA1
9
PSA2
0
PSB0
6
PSB0
7
PSB0
8
PSB1
6
PSB1
7
PSB1
3R
Med
ian
(phi
)
0.0
2.0
4.0
6.0
8.0
PSA0
6
PSA0
7
PSA0
8
PSA0
9
PSA1
9
PSA2
0
PSB0
6
PSB0
7
PSB0
8
PSB1
6
PSB1
7
PSB1
3R
% p
elite
0
25
50
75
100
PSA0
6
PSA0
7
PSA0
8
PSA0
9
PSA1
9
PSA2
0
PSB0
6
PSB0
7
PSB0
8
PSB1
6
PSB1
7
PSB1
3R
% fi
ne s
and
0.0
0.5
1.0
1.5
PSA0
6
PSA0
7
PSA0
8
PSA0
9
PSA1
9
PSA2
0
PSB0
6
PSB0
7
PSB0
8
PSB1
6
PSB1
7
PSB1
3R
% T
OM
1991 1997 2000
Figure 7-1: Sediment characteristics at the Øst Frigg field, 2000 and previous surveys.
7.2.2 Chemical characteristics The calculated limits of significant contamination for selected hydrocarbons and metals in sediments from Region II (LSC97-00 RegII) are presented previously in the chapter that deals with the regional and reference stations. In addition to the regional limits, field-specific limits of significant contamination are calculated from the field reference station (LSC00 PSB13R). Both sets of data are presented in Table 7-3. Based on analysis results of the Øst Frigg field the LSC97-00 RegII is regarded as representative of the entire region and will therefore be used as further basis for discussion of the contamination status of this field. Those limits will hereafter simply be referred to as LSC.
The results of analyses of the hydrocarbons are summarised in Table 7-4. Concentrations of THC in vertical sediment sections are presented in Table 7-5. The full data set of replicate measurements and
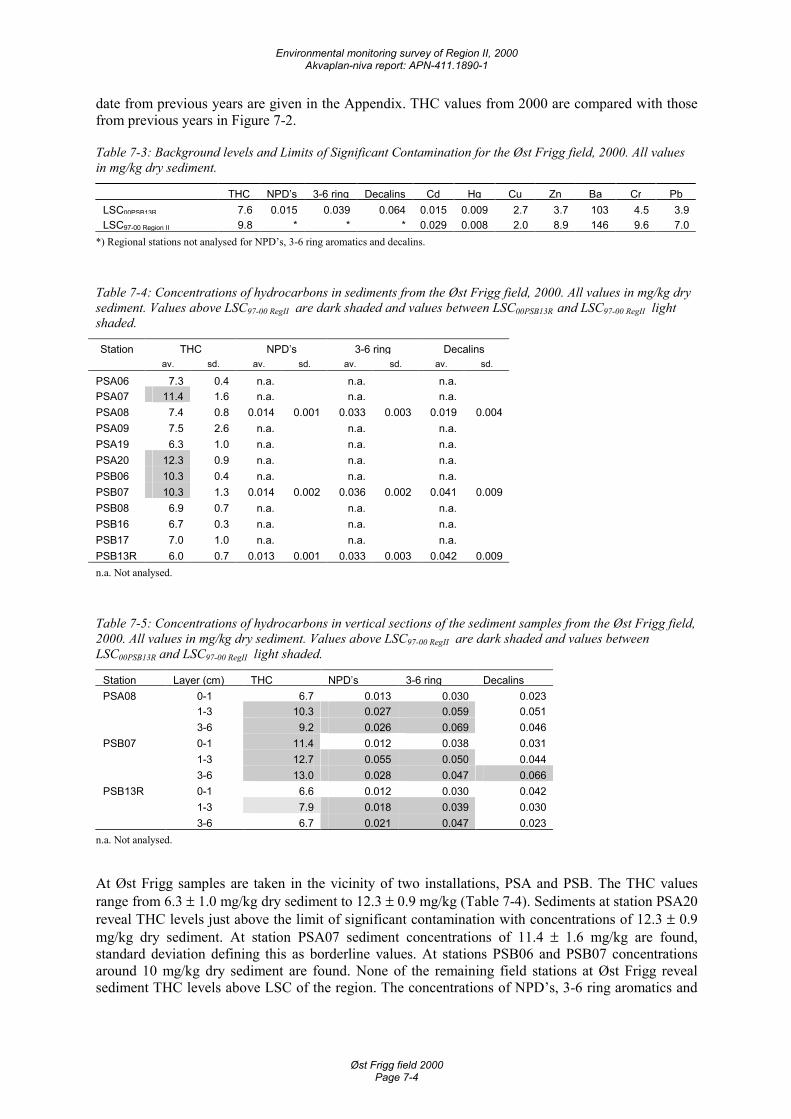
Environmental monitoring survey of Region II, 2000 Akvaplan-niva report: APN-411.1890-1
Øst Frigg field 2000 Page 7-4
date from previous years are given in the Appendix. THC values from 2000 are compared with those from previous years in Figure 7-2.
Table 7-3: Background levels and Limits of Significant Contamination for the Øst Frigg field, 2000. All values in mg/kg dry sediment.
THC NPD’s 3-6 ring Decalins Cd Hg Cu Zn Ba Cr PbLSC00PSB13R 7.6 0.015 0.039 0.064 0.015 0.009 2.7 3.7 103 4.5 3.9LSC97-00 Region II 9.8 * * * 0.029 0.008 2.0 8.9 146 9.6 7.0
*) Regional stations not analysed for NPD’s, 3-6 ring aromatics and decalins.
Table 7-4: Concentrations of hydrocarbons in sediments from the Øst Frigg field, 2000. All values in mg/kg dry sediment. Values above LSC97-00 RegII are dark shaded and values between LSC00PSB13R and LSC97-00 RegII light shaded.
Station THC NPD’s 3-6 ring Decalins av. sd. av. sd. av. sd. av. sd.
PSA06 7.3 0.4 n.a. n.a. n.a.PSA07 11.4 1.6 n.a. n.a. n.a.PSA08 7.4 0.8 0.014 0.001 0.033 0.003 0.019 0.004PSA09 7.5 2.6 n.a. n.a. n.a.PSA19 6.3 1.0 n.a. n.a. n.a.PSA20 12.3 0.9 n.a. n.a. n.a.PSB06 10.3 0.4 n.a. n.a. n.a.PSB07 10.3 1.3 0.014 0.002 0.036 0.002 0.041 0.009PSB08 6.9 0.7 n.a. n.a. n.a.PSB16 6.7 0.3 n.a. n.a. n.a.PSB17 7.0 1.0 n.a. n.a. n.a.PSB13R 6.0 0.7 0.013 0.001 0.033 0.003 0.042 0.009n.a. Not analysed.
Table 7-5: Concentrations of hydrocarbons in vertical sections of the sediment samples from the Øst Frigg field, 2000. All values in mg/kg dry sediment. Values above LSC97-00 RegII are dark shaded and values between LSC00PSB13R and LSC97-00 RegII light shaded.
Station Layer (cm) THC NPD’s 3-6 ring DecalinsPSA08 0-1 6.7 0.013 0.030 0.023 1-3 10.3 0.027 0.059 0.051 3-6 9.2 0.026 0.069 0.046PSB07 0-1 11.4 0.012 0.038 0.031 1-3 12.7 0.055 0.050 0.044 3-6 13.0 0.028 0.047 0.066PSB13R 0-1 6.6 0.012 0.030 0.042 1-3 7.9 0.018 0.039 0.030 3-6 6.7 0.021 0.047 0.023
n.a. Not analysed.
At Øst Frigg samples are taken in the vicinity of two installations, PSA and PSB. The THC values range from 6.3 ± 1.0 mg/kg dry sediment to 12.3 ± 0.9 mg/kg (Table 7-4). Sediments at station PSA20 reveal THC levels just above the limit of significant contamination with concentrations of 12.3 ± 0.9 mg/kg dry sediment. At station PSA07 sediment concentrations of 11.4 ± 1.6 mg/kg are found, standard deviation defining this as borderline values. At stations PSB06 and PSB07 concentrations around 10 mg/kg dry sediment are found. None of the remaining field stations at Øst Frigg reveal sediment THC levels above LSC of the region. The concentrations of NPD’s, 3-6 ring aromatics and
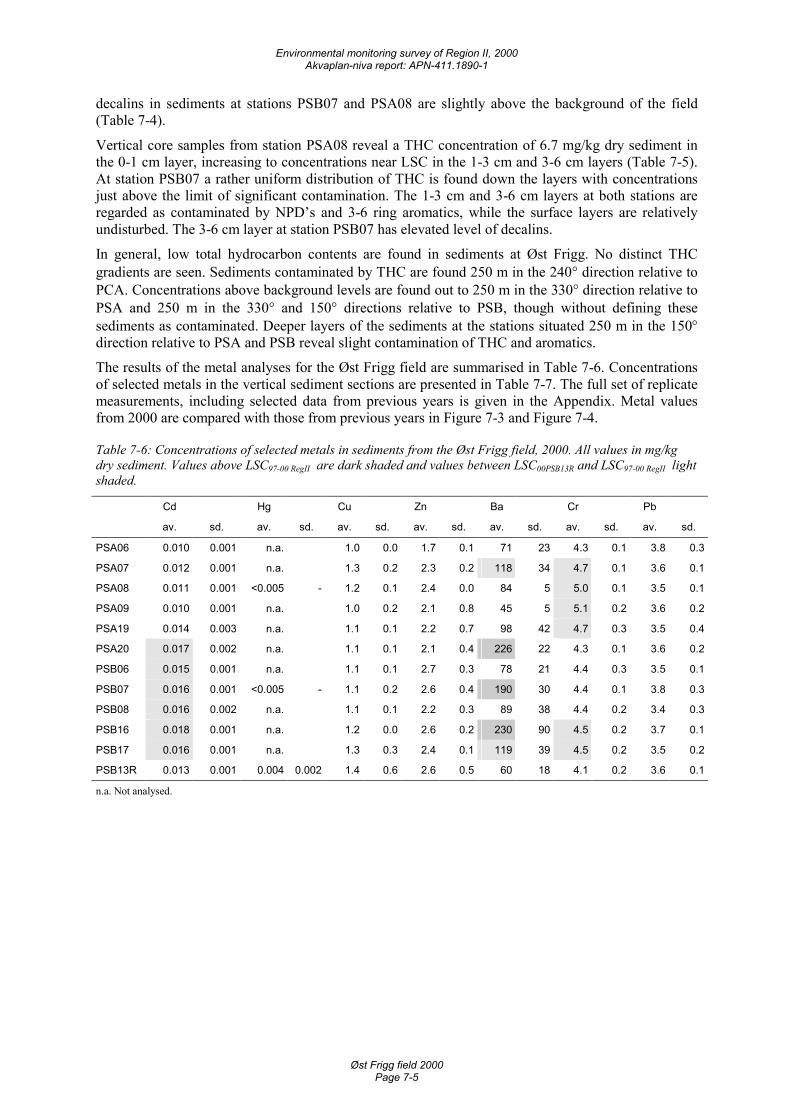
Environmental monitoring survey of Region II, 2000 Akvaplan-niva report: APN-411.1890-1
Øst Frigg field 2000 Page 7-5
decalins in sediments at stations PSB07 and PSA08 are slightly above the background of the field (Table 7-4).
Vertical core samples from station PSA08 reveal a THC concentration of 6.7 mg/kg dry sediment in the 0-1 cm layer, increasing to concentrations near LSC in the 1-3 cm and 3-6 cm layers (Table 7-5). At station PSB07 a rather uniform distribution of THC is found down the layers with concentrations just above the limit of significant contamination. The 1-3 cm and 3-6 cm layers at both stations are regarded as contaminated by NPD’s and 3-6 ring aromatics, while the surface layers are relatively undisturbed. The 3-6 cm layer at station PSB07 has elevated level of decalins.
In general, low total hydrocarbon contents are found in sediments at Øst Frigg. No distinct THC gradients are seen. Sediments contaminated by THC are found 250 m in the 240° direction relative to PCA. Concentrations above background levels are found out to 250 m in the 330° direction relative to PSA and 250 m in the 330° and 150° directions relative to PSB, though without defining these sediments as contaminated. Deeper layers of the sediments at the stations situated 250 m in the 150° direction relative to PSA and PSB reveal slight contamination of THC and aromatics.
The results of the metal analyses for the Øst Frigg field are summarised in Table 7-6. Concentrations of selected metals in the vertical sediment sections are presented in Table 7-7. The full set of replicate measurements, including selected data from previous years is given in the Appendix. Metal values from 2000 are compared with those from previous years in Figure 7-3 and Figure 7-4.
Table 7-6: Concentrations of selected metals in sediments from the Øst Frigg field, 2000. All values in mg/kg dry sediment. Values above LSC97-00 RegII are dark shaded and values between LSC00PSB13R and LSC97-00 RegII light shaded.
Cd Hg Cu Zn Ba Cr Pb
av. sd. av. sd. av. sd. av. sd. av. sd. av. sd. av. sd.
PSA06 0.010 0.001 n.a. 1.0 0.0 1.7 0.1 71 23 4.3 0.1 3.8 0.3
PSA07 0.012 0.001 n.a. 1.3 0.2 2.3 0.2 118 34 4.7 0.1 3.6 0.1
PSA08 0.011 0.001 <0.005 - 1.2 0.1 2.4 0.0 84 5 5.0 0.1 3.5 0.1
PSA09 0.010 0.001 n.a. 1.0 0.2 2.1 0.8 45 5 5.1 0.2 3.6 0.2
PSA19 0.014 0.003 n.a. 1.1 0.1 2.2 0.7 98 42 4.7 0.3 3.5 0.4
PSA20 0.017 0.002 n.a. 1.1 0.1 2.1 0.4 226 22 4.3 0.1 3.6 0.2
PSB06 0.015 0.001 n.a. 1.1 0.1 2.7 0.3 78 21 4.4 0.3 3.5 0.1
PSB07 0.016 0.001 <0.005 - 1.1 0.2 2.6 0.4 190 30 4.4 0.1 3.8 0.3
PSB08 0.016 0.002 n.a. 1.1 0.1 2.2 0.3 89 38 4.4 0.2 3.4 0.3
PSB16 0.018 0.001 n.a. 1.2 0.0 2.6 0.2 230 90 4.5 0.2 3.7 0.1
PSB17 0.016 0.001 n.a. 1.3 0.3 2.4 0.1 119 39 4.5 0.2 3.5 0.2
PSB13R 0.013 0.001 0.004 0.002 1.4 0.6 2.6 0.5 60 18 4.1 0.2 3.6 0.1
n.a. Not analysed.
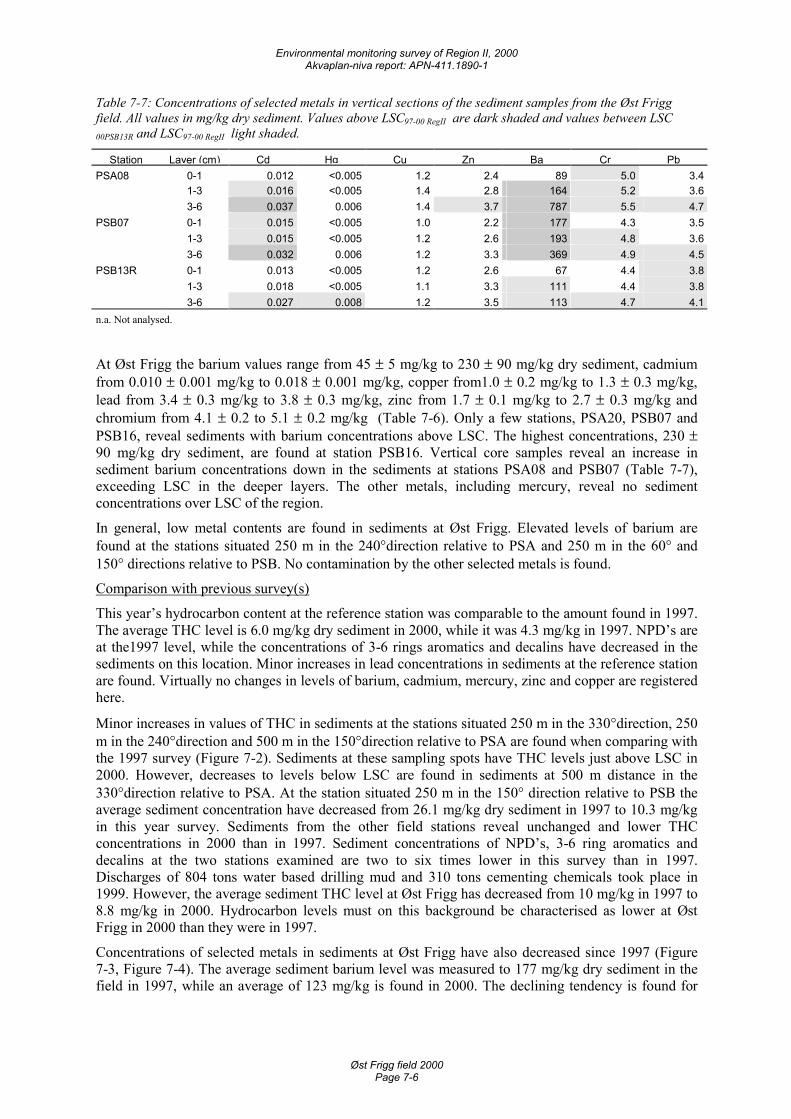
Environmental monitoring survey of Region II, 2000 Akvaplan-niva report: APN-411.1890-1
Øst Frigg field 2000 Page 7-6
Table 7-7: Concentrations of selected metals in vertical sections of the sediment samples from the Øst Frigg field. All values in mg/kg dry sediment. Values above LSC97-00 RegII are dark shaded and values between LSC
00PSB13R and LSC97-00 RegII light shaded.
Station Layer (cm) Cd Hg Cu Zn Ba Cr PbPSA08 0-1 0.012 <0.005 1.2 2.4 89 5.0 3.4 1-3 0.016 <0.005 1.4 2.8 164 5.2 3.6 3-6 0.037 0.006 1.4 3.7 787 5.5 4.7PSB07 0-1 0.015 <0.005 1.0 2.2 177 4.3 3.5 1-3 0.015 <0.005 1.2 2.6 193 4.8 3.6 3-6 0.032 0.006 1.2 3.3 369 4.9 4.5PSB13R 0-1 0.013 <0.005 1.2 2.6 67 4.4 3.8 1-3 0.018 <0.005 1.1 3.3 111 4.4 3.8 3-6 0.027 0.008 1.2 3.5 113 4.7 4.1n.a. Not analysed.
At Øst Frigg the barium values range from 45 ± 5 mg/kg to 230 ± 90 mg/kg dry sediment, cadmium from 0.010 ± 0.001 mg/kg to 0.018 ± 0.001 mg/kg, copper from1.0 ± 0.2 mg/kg to 1.3 ± 0.3 mg/kg, lead from 3.4 ± 0.3 mg/kg to 3.8 ± 0.3 mg/kg, zinc from 1.7 ± 0.1 mg/kg to 2.7 ± 0.3 mg/kg and chromium from 4.1 ± 0.2 to 5.1 ± 0.2 mg/kg (Table 7-6). Only a few stations, PSA20, PSB07 and PSB16, reveal sediments with barium concentrations above LSC. The highest concentrations, 230 ± 90 mg/kg dry sediment, are found at station PSB16. Vertical core samples reveal an increase in sediment barium concentrations down in the sediments at stations PSA08 and PSB07 (Table 7-7), exceeding LSC in the deeper layers. The other metals, including mercury, reveal no sediment concentrations over LSC of the region.
In general, low metal contents are found in sediments at Øst Frigg. Elevated levels of barium are found at the stations situated 250 m in the 240°direction relative to PSA and 250 m in the 60° and 150° directions relative to PSB. No contamination by the other selected metals is found.
Comparison with previous survey(s)
This year’s hydrocarbon content at the reference station was comparable to the amount found in 1997. The average THC level is 6.0 mg/kg dry sediment in 2000, while it was 4.3 mg/kg in 1997. NPD’s are at the1997 level, while the concentrations of 3-6 rings aromatics and decalins have decreased in the sediments on this location. Minor increases in lead concentrations in sediments at the reference station are found. Virtually no changes in levels of barium, cadmium, mercury, zinc and copper are registered here.
Minor increases in values of THC in sediments at the stations situated 250 m in the 330°direction, 250 m in the 240°direction and 500 m in the 150°direction relative to PSA are found when comparing with the 1997 survey (Figure 7-2). Sediments at these sampling spots have THC levels just above LSC in 2000. However, decreases to levels below LSC are found in sediments at 500 m distance in the 330°direction relative to PSA. At the station situated 250 m in the 150° direction relative to PSB the average sediment concentration have decreased from 26.1 mg/kg dry sediment in 1997 to 10.3 mg/kg in this year survey. Sediments from the other field stations reveal unchanged and lower THC concentrations in 2000 than in 1997. Sediment concentrations of NPD’s, 3-6 ring aromatics and decalins at the two stations examined are two to six times lower in this survey than in 1997. Discharges of 804 tons water based drilling mud and 310 tons cementing chemicals took place in 1999. However, the average sediment THC level at Øst Frigg has decreased from 10 mg/kg in 1997 to 8.8 mg/kg in 2000. Hydrocarbon levels must on this background be characterised as lower at Øst Frigg in 2000 than they were in 1997.
Concentrations of selected metals in sediments at Øst Frigg have also decreased since 1997 (Figure 7-3, Figure 7-4). The average sediment barium level was measured to 177 mg/kg dry sediment in the field in 1997, while an average of 123 mg/kg is found in 2000. The declining tendency is found for
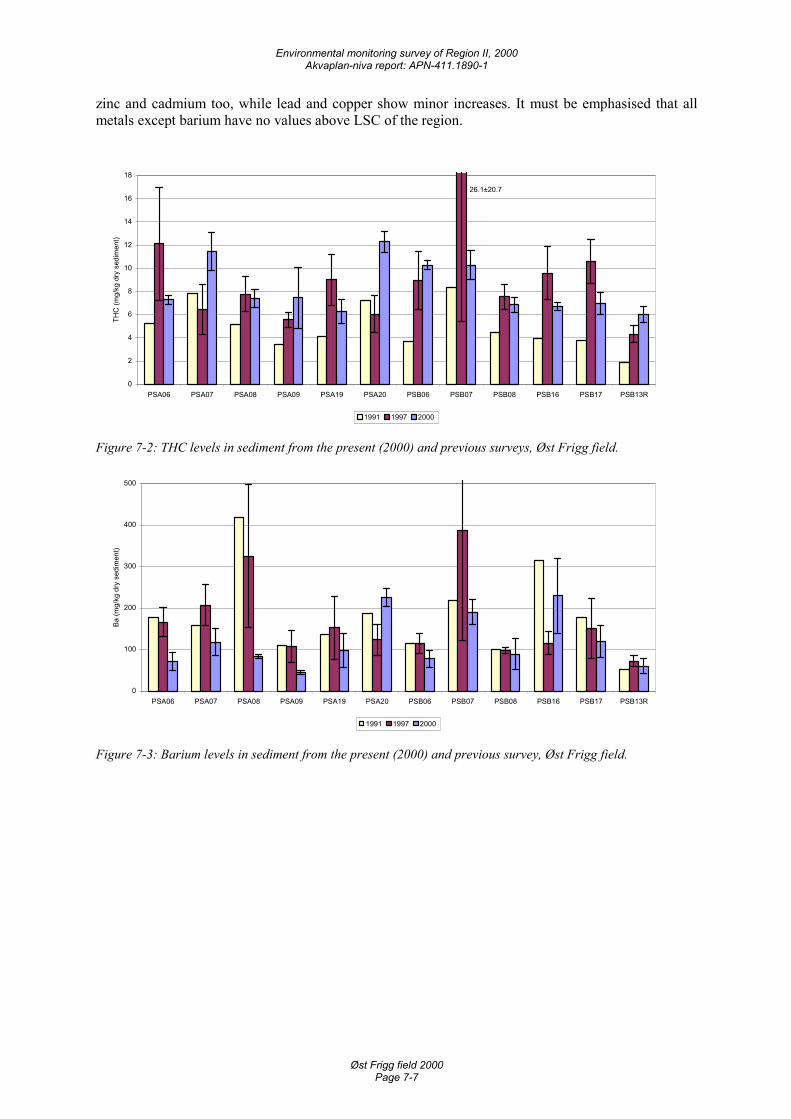
Environmental monitoring survey of Region II, 2000 Akvaplan-niva report: APN-411.1890-1
Øst Frigg field 2000 Page 7-7
zinc and cadmium too, while lead and copper show minor increases. It must be emphasised that all metals except barium have no values above LSC of the region.
26.1±20.7
0
2
4
6
8
10
12
14
16
18
PSA06 PSA07 PSA08 PSA09 PSA19 PSA20 PSB06 PSB07 PSB08 PSB16 PSB17 PSB13R
THC
(mg/
kg d
ry s
edim
ent)
1991 1997 2000
Figure 7-2: THC levels in sediment from the present (2000) and previous surveys, Øst Frigg field.
0
100
200
300
400
500
PSA06 PSA07 PSA08 PSA09 PSA19 PSA20 PSB06 PSB07 PSB08 PSB16 PSB17 PSB13R
Ba (m
g/kg
dry
sed
imen
t)
1991 1997 2000
Figure 7-3: Barium levels in sediment from the present (2000) and previous survey, Øst Frigg field.
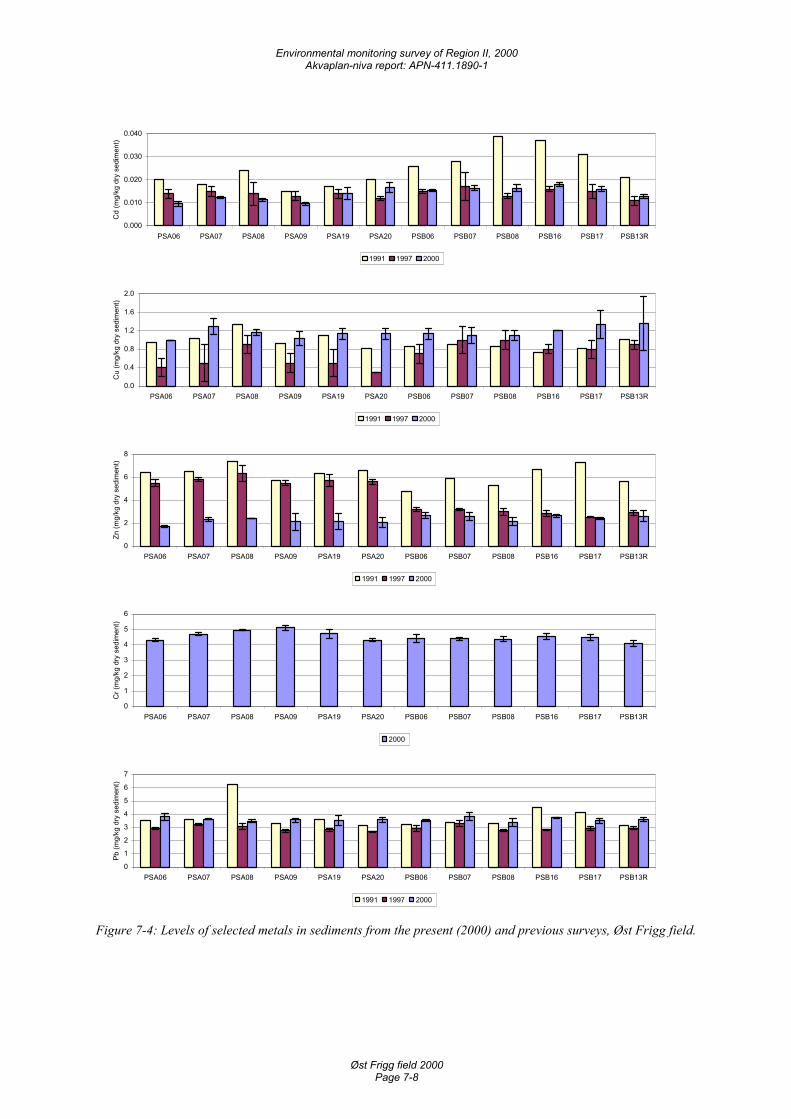
Environmental monitoring survey of Region II, 2000 Akvaplan-niva report: APN-411.1890-1
Øst Frigg field 2000 Page 7-8
0.000
0.010
0.020
0.030
0.040
PSA06 PSA07 PSA08 PSA09 PSA19 PSA20 PSB06 PSB07 PSB08 PSB16 PSB17 PSB13R
Cd
(mg/
kg d
ry s
edim
ent)
1991 1997 2000
0.0
0.4
0.8
1.2
1.6
2.0
PSA06 PSA07 PSA08 PSA09 PSA19 PSA20 PSB06 PSB07 PSB08 PSB16 PSB17 PSB13R
Cu
(mg/
kg d
ry s
edim
ent)
1991 1997 2000
0
2
4
6
8
PSA06 PSA07 PSA08 PSA09 PSA19 PSA20 PSB06 PSB07 PSB08 PSB16 PSB17 PSB13R
Zn (m
g/kg
dry
sed
imen
t)
1991 1997 2000
0
1
2
3
4
5
6
PSA06 PSA07 PSA08 PSA09 PSA19 PSA20 PSB06 PSB07 PSB08 PSB16 PSB17 PSB13R
Cr (
mg/
kg d
ry s
edim
ent)
2000
0
1
2
3
4
5
6
7
PSA06 PSA07 PSA08 PSA09 PSA19 PSA20 PSB06 PSB07 PSB08 PSB16 PSB17 PSB13R
Pb (m
g/kg
dry
sed
imen
t)
1991 1997 2000
Figure 7-4: Levels of selected metals in sediments from the present (2000) and previous surveys, Øst Frigg field.
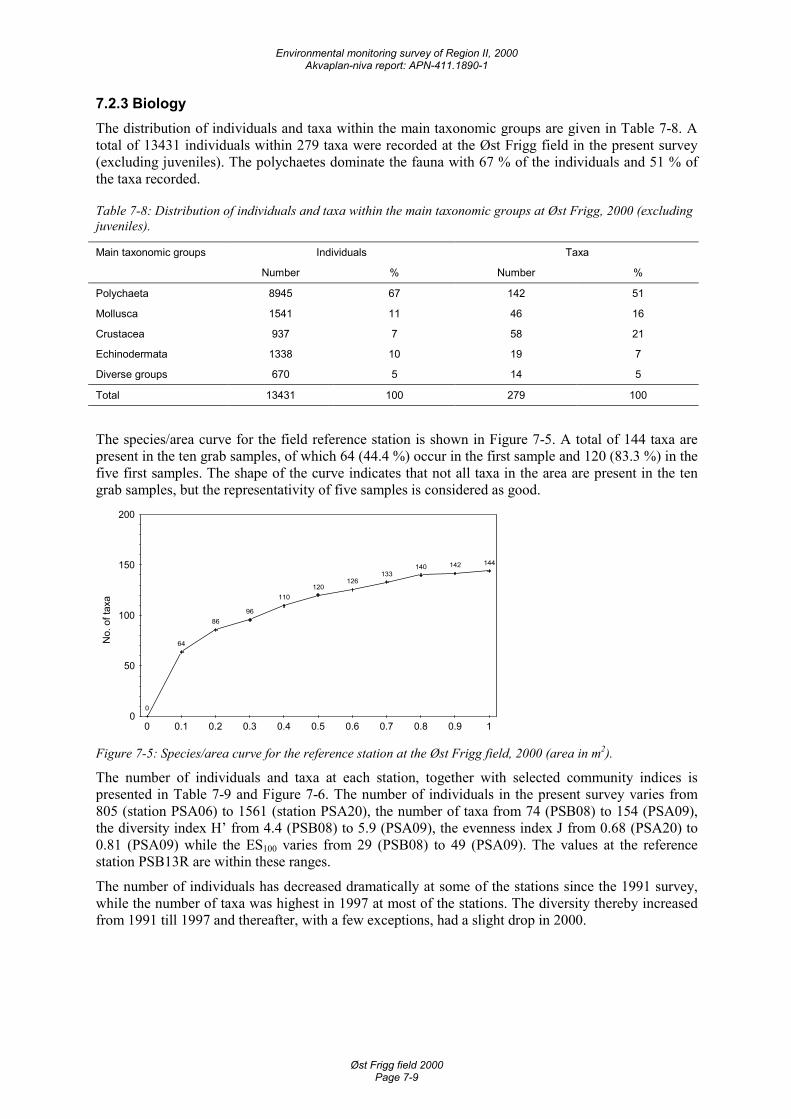
Environmental monitoring survey of Region II, 2000 Akvaplan-niva report: APN-411.1890-1
Øst Frigg field 2000 Page 7-9
7.2.3 Biology The distribution of individuals and taxa within the main taxonomic groups are given in Table 7-8. A total of 13431 individuals within 279 taxa were recorded at the Øst Frigg field in the present survey (excluding juveniles). The polychaetes dominate the fauna with 67 % of the individuals and 51 % of the taxa recorded.
Table 7-8: Distribution of individuals and taxa within the main taxonomic groups at Øst Frigg, 2000 (excluding juveniles).
Main taxonomic groups Individuals Taxa
Number % Number %
Polychaeta 8945 67 142 51
Mollusca 1541 11 46 16
Crustacea 937 7 58 21
Echinodermata 1338 10 19 7
Diverse groups 670 5 14 5
Total 13431 100 279 100
The species/area curve for the field reference station is shown in Figure 7-5. A total of 144 taxa are present in the ten grab samples, of which 64 (44.4 %) occur in the first sample and 120 (83.3 %) in the five first samples. The shape of the curve indicates that not all taxa in the area are present in the ten grab samples, but the representativity of five samples is considered as good.
No.
of t
axa
0
64
8696
110120
126133
140 142 144
0
50
100
150
200
0 0.1 0.2 0.3 0.4 0.5 0.6 0.7 0.8 0.9 1 Figure 7-5: Species/area curve for the reference station at the Øst Frigg field, 2000 (area in m2).
The number of individuals and taxa at each station, together with selected community indices is presented in Table 7-9 and Figure 7-6. The number of individuals in the present survey varies from 805 (station PSA06) to 1561 (station PSA20), the number of taxa from 74 (PSB08) to 154 (PSA09), the diversity index H’ from 4.4 (PSB08) to 5.9 (PSA09), the evenness index J from 0.68 (PSA20) to 0.81 (PSA09) while the ES100 varies from 29 (PSB08) to 49 (PSA09). The values at the reference station PSB13R are within these ranges.
The number of individuals has decreased dramatically at some of the stations since the 1991 survey, while the number of taxa was highest in 1997 at most of the stations. The diversity thereby increased from 1991 till 1997 and thereafter, with a few exceptions, had a slight drop in 2000.
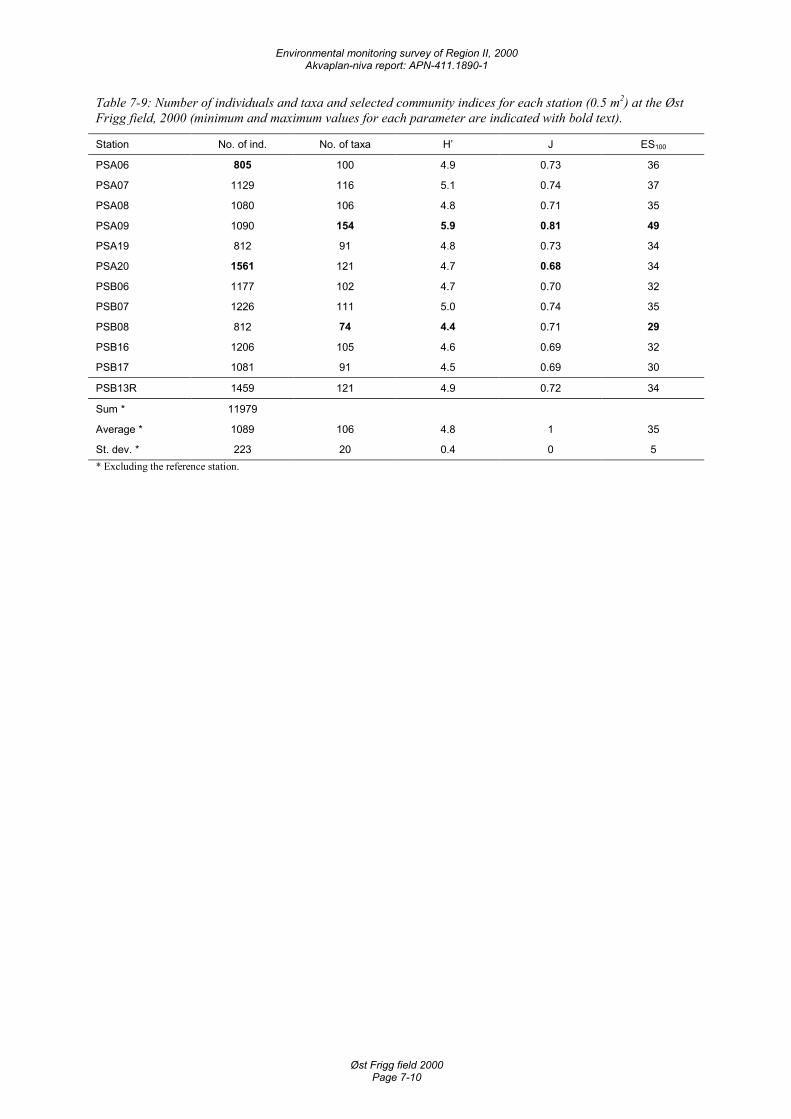
Environmental monitoring survey of Region II, 2000 Akvaplan-niva report: APN-411.1890-1
Øst Frigg field 2000 Page 7-10
Table 7-9: Number of individuals and taxa and selected community indices for each station (0.5 m2) at the Øst Frigg field, 2000 (minimum and maximum values for each parameter are indicated with bold text).
Station No. of ind. No. of taxa H’ J ES100
PSA06 805 100 4.9 0.73 36
PSA07 1129 116 5.1 0.74 37
PSA08 1080 106 4.8 0.71 35
PSA09 1090 154 5.9 0.81 49
PSA19 812 91 4.8 0.73 34
PSA20 1561 121 4.7 0.68 34
PSB06 1177 102 4.7 0.70 32
PSB07 1226 111 5.0 0.74 35
PSB08 812 74 4.4 0.71 29
PSB16 1206 105 4.6 0.69 32
PSB17 1081 91 4.5 0.69 30
PSB13R 1459 121 4.9 0.72 34
Sum * 11979
Average * 1089 106 4.8 1 35
St. dev. * 223 20 0.4 0 5 * Excluding the reference station.
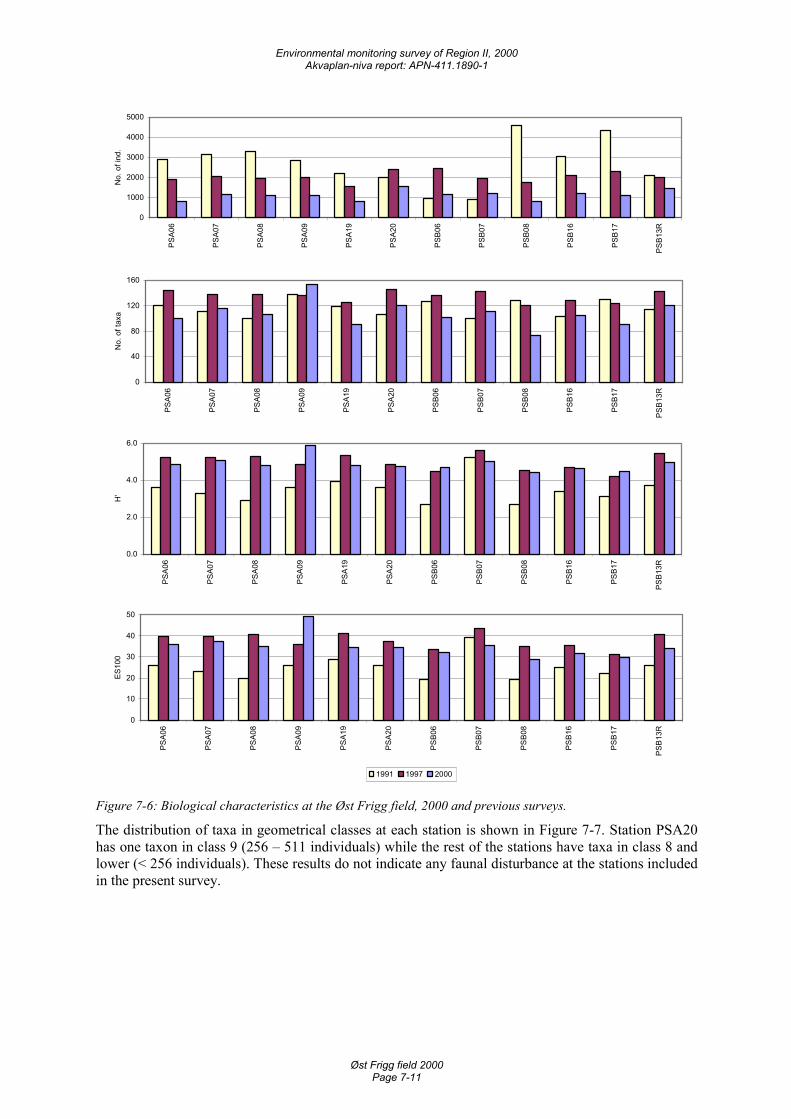
Environmental monitoring survey of Region II, 2000 Akvaplan-niva report: APN-411.1890-1
Øst Frigg field 2000 Page 7-11
0
1000
2000
3000
4000
5000
PSA0
6
PSA0
7
PSA0
8
PSA0
9
PSA1
9
PSA2
0
PSB0
6
PSB0
7
PSB0
8
PSB1
6
PSB1
7
PSB1
3R
No.
of i
nd.
0
40
80
120
160
PSA0
6
PSA0
7
PSA0
8
PSA0
9
PSA1
9
PSA2
0
PSB0
6
PSB0
7
PSB0
8
PSB1
6
PSB1
7
PSB1
3R
No.
of t
axa
0.0
2.0
4.0
6.0
PSA0
6
PSA0
7
PSA0
8
PSA0
9
PSA1
9
PSA2
0
PSB0
6
PSB0
7
PSB0
8
PSB1
6
PSB1
7
PSB1
3R
H'
0
10
20
30
40
50
PSA0
6
PSA0
7
PSA0
8
PSA0
9
PSA1
9
PSA2
0
PSB0
6
PSB0
7
PSB0
8
PSB1
6
PSB1
7
PSB1
3R
ES10
0
1991 1997 2000
Figure 7-6: Biological characteristics at the Øst Frigg field, 2000 and previous surveys.
The distribution of taxa in geometrical classes at each station is shown in Figure 7-7. Station PSA20 has one taxon in class 9 (256 – 511 individuals) while the rest of the stations have taxa in class 8 and lower (< 256 individuals). These results do not indicate any faunal disturbance at the stations included in the present survey.
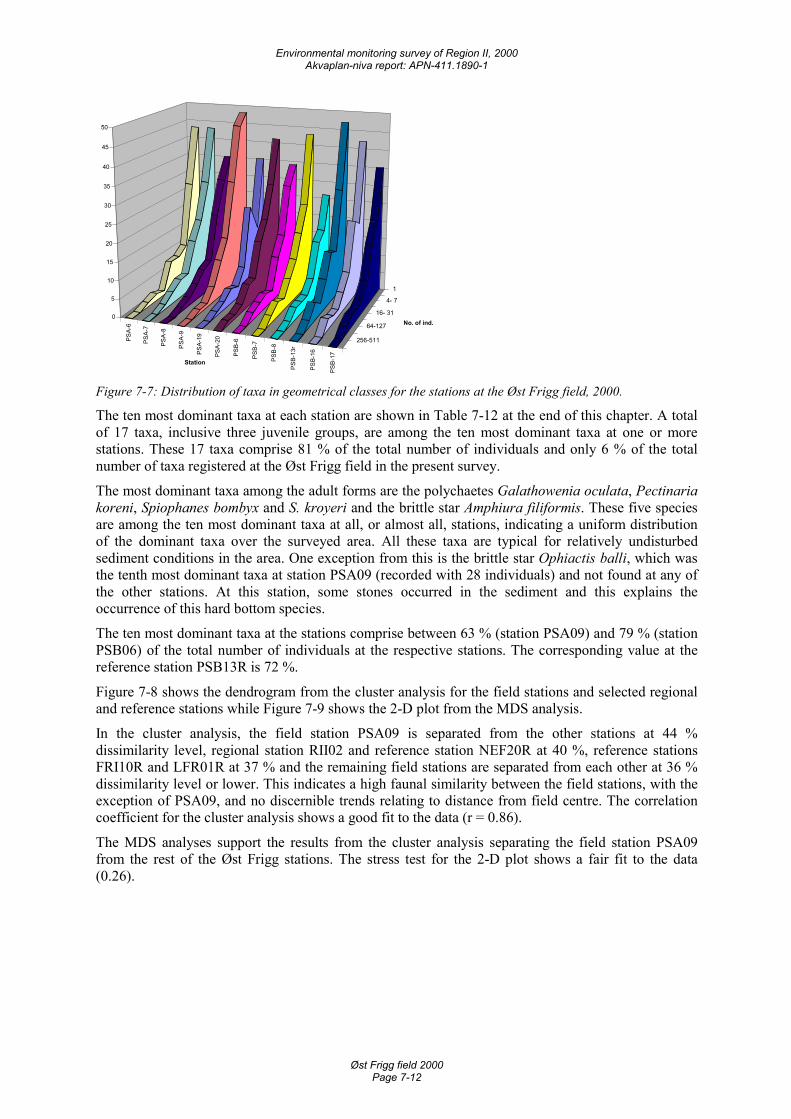
Environmental monitoring survey of Region II, 2000 Akvaplan-niva report: APN-411.1890-1
Øst Frigg field 2000 Page 7-12
1
4- 7
16- 31
64-127
256-511PSA-
6
PSA-
7
PSA-
8
PSA-
9
PSA-
19
PSA-
20
PSB-
6
PSB-
7
PSB-
8
PSB-
13r
PSB-
16
PSB-
17
0
5
10
15
20
25
30
35
40
45
50
No. of ind.
Station
Figure 7-7: Distribution of taxa in geometrical classes for the stations at the Øst Frigg field, 2000.
The ten most dominant taxa at each station are shown in Table 7-12 at the end of this chapter. A total of 17 taxa, inclusive three juvenile groups, are among the ten most dominant taxa at one or more stations. These 17 taxa comprise 81 % of the total number of individuals and only 6 % of the total number of taxa registered at the Øst Frigg field in the present survey.
The most dominant taxa among the adult forms are the polychaetes Galathowenia oculata, Pectinaria koreni, Spiophanes bombyx and S. kroyeri and the brittle star Amphiura filiformis. These five species are among the ten most dominant taxa at all, or almost all, stations, indicating a uniform distribution of the dominant taxa over the surveyed area. All these taxa are typical for relatively undisturbed sediment conditions in the area. One exception from this is the brittle star Ophiactis balli, which was the tenth most dominant taxa at station PSA09 (recorded with 28 individuals) and not found at any of the other stations. At this station, some stones occurred in the sediment and this explains the occurrence of this hard bottom species.
The ten most dominant taxa at the stations comprise between 63 % (station PSA09) and 79 % (station PSB06) of the total number of individuals at the respective stations. The corresponding value at the reference station PSB13R is 72 %.
Figure 7-8 shows the dendrogram from the cluster analysis for the field stations and selected regional and reference stations while Figure 7-9 shows the 2-D plot from the MDS analysis.
In the cluster analysis, the field station PSA09 is separated from the other stations at 44 % dissimilarity level, regional station RII02 and reference station NEF20R at 40 %, reference stations FRI10R and LFR01R at 37 % and the remaining field stations are separated from each other at 36 % dissimilarity level or lower. This indicates a high faunal similarity between the field stations, with the exception of PSA09, and no discernible trends relating to distance from field centre. The correlation coefficient for the cluster analysis shows a good fit to the data (r = 0.86).
The MDS analyses support the results from the cluster analysis separating the field station PSA09 from the rest of the Øst Frigg stations. The stress test for the 2-D plot shows a fair fit to the data (0.26).
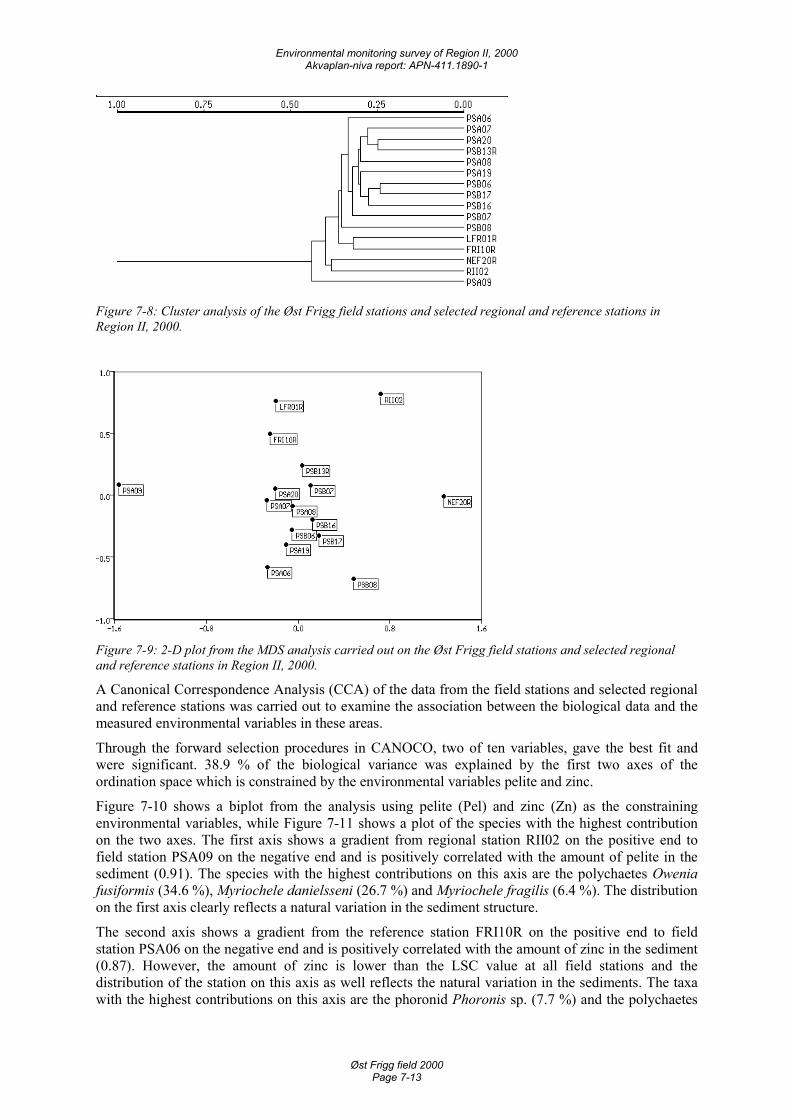
Environmental monitoring survey of Region II, 2000 Akvaplan-niva report: APN-411.1890-1
Øst Frigg field 2000 Page 7-13
Figure 7-8: Cluster analysis of the Øst Frigg field stations and selected regional and reference stations in Region II, 2000.
Figure 7-9: 2-D plot from the MDS analysis carried out on the Øst Frigg field stations and selected regional and reference stations in Region II, 2000.
A Canonical Correspondence Analysis (CCA) of the data from the field stations and selected regional and reference stations was carried out to examine the association between the biological data and the measured environmental variables in these areas.
Through the forward selection procedures in CANOCO, two of ten variables, gave the best fit and were significant. 38.9 % of the biological variance was explained by the first two axes of the ordination space which is constrained by the environmental variables pelite and zinc.
Figure 7-10 shows a biplot from the analysis using pelite (Pel) and zinc (Zn) as the constraining environmental variables, while Figure 7-11 shows a plot of the species with the highest contribution on the two axes. The first axis shows a gradient from regional station RII02 on the positive end to field station PSA09 on the negative end and is positively correlated with the amount of pelite in the sediment (0.91). The species with the highest contributions on this axis are the polychaetes Owenia fusiformis (34.6 %), Myriochele danielsseni (26.7 %) and Myriochele fragilis (6.4 %). The distribution on the first axis clearly reflects a natural variation in the sediment structure.
The second axis shows a gradient from the reference station FRI10R on the positive end to field station PSA06 on the negative end and is positively correlated with the amount of zinc in the sediment (0.87). However, the amount of zinc is lower than the LSC value at all field stations and the distribution of the station on this axis as well reflects the natural variation in the sediments. The taxa with the highest contributions on this axis are the phoronid Phoronis sp. (7.7 %) and the polychaetes
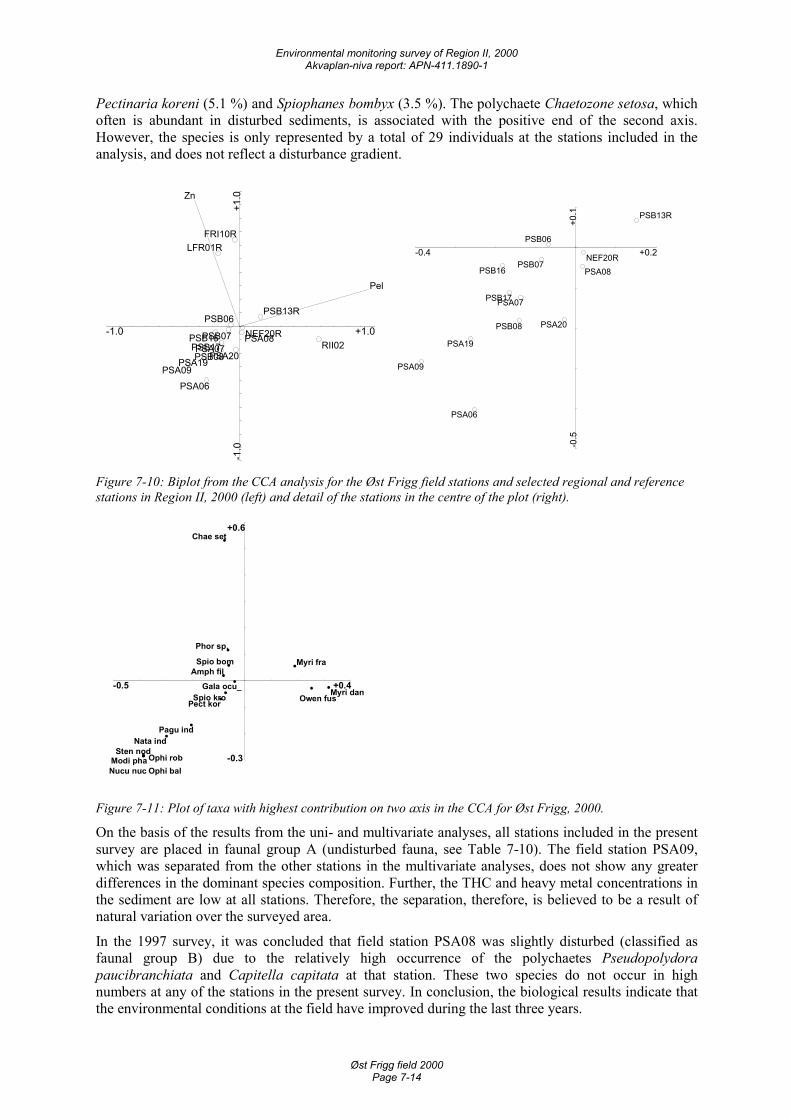
Environmental monitoring survey of Region II, 2000 Akvaplan-niva report: APN-411.1890-1
Øst Frigg field 2000 Page 7-14
Pectinaria koreni (5.1 %) and Spiophanes bombyx (3.5 %). The polychaete Chaetozone setosa, which often is abundant in disturbed sediments, is associated with the positive end of the second axis. However, the species is only represented by a total of 29 individuals at the stations included in the analysis, and does not reflect a disturbance gradient.
-1.0 +1.0
-1.0
+1.0
Pel
Zn
RII02
PSA09PSA19
PSA06
PSB16PSB17
LFR01R
PSB13R
PSB08PSA07
PSB07
PSB06
FRI10R
PSA20
NEF20RPSA08�
-0.4 +0.2
-0.5
+0.1
PSA09
PSA19
PSA06
PSB16
PSB17
PSB13R
PSB08
PSA07
PSB07
PSB06
PSA20
NEF20RPSA08�
Figure 7-10: Biplot from the CCA analysis for the Øst Frigg field stations and selected regional and reference stations in Region II, 2000 (left) and detail of the stations in the centre of the plot (right).
-0.5 +0.4
-0.3
+0.6
Modi pha Ophi robSten nod
Nucu nuc Ophi bal
Myri dan
Nata ind
Owen fus
Pagu ind
Myri fra
Pect kor
Amph fil
Chae set
Spio kro
Phor sp.
Spio bom
Gala ocu_
Figure 7-11: Plot of taxa with highest contribution on two axis in the CCA for Øst Frigg, 2000.
On the basis of the results from the uni- and multivariate analyses, all stations included in the present survey are placed in faunal group A (undisturbed fauna, see Table 7-10). The field station PSA09, which was separated from the other stations in the multivariate analyses, does not show any greater differences in the dominant species composition. Further, the THC and heavy metal concentrations in the sediment are low at all stations. Therefore, the separation, therefore, is believed to be a result of natural variation over the surveyed area.
In the 1997 survey, it was concluded that field station PSA08 was slightly disturbed (classified as faunal group B) due to the relatively high occurrence of the polychaetes Pseudopolydora paucibranchiata and Capitella capitata at that station. These two species do not occur in high numbers at any of the stations in the present survey. In conclusion, the biological results indicate that the environmental conditions at the field have improved during the last three years.
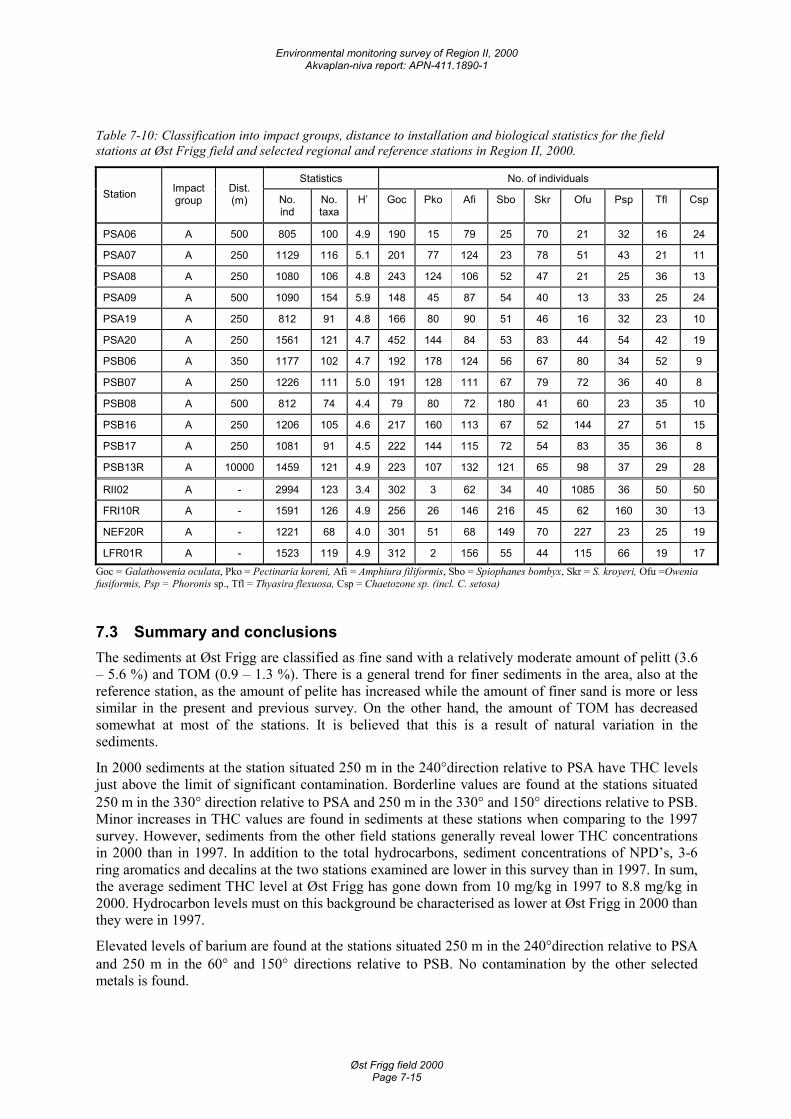
Environmental monitoring survey of Region II, 2000 Akvaplan-niva report: APN-411.1890-1
Øst Frigg field 2000 Page 7-15
Table 7-10: Classification into impact groups, distance to installation and biological statistics for the field stations at Øst Frigg field and selected regional and reference stations in Region II, 2000.
Statistics No. of individuals Station Impact
group Dist. (m) No.
ind No. taxa
H’ Goc Pko Afi Sbo Skr Ofu Psp Tfl Csp
PSA06 A 500 805 100 4.9 190 15 79 25 70 21 32 16 24
PSA07 A 250 1129 116 5.1 201 77 124 23 78 51 43 21 11
PSA08 A 250 1080 106 4.8 243 124 106 52 47 21 25 36 13
PSA09 A 500 1090 154 5.9 148 45 87 54 40 13 33 25 24
PSA19 A 250 812 91 4.8 166 80 90 51 46 16 32 23 10
PSA20 A 250 1561 121 4.7 452 144 84 53 83 44 54 42 19
PSB06 A 350 1177 102 4.7 192 178 124 56 67 80 34 52 9
PSB07 A 250 1226 111 5.0 191 128 111 67 79 72 36 40 8
PSB08 A 500 812 74 4.4 79 80 72 180 41 60 23 35 10
PSB16 A 250 1206 105 4.6 217 160 113 67 52 144 27 51 15
PSB17 A 250 1081 91 4.5 222 144 115 72 54 83 35 36 8
PSB13R A 10000 1459 121 4.9 223 107 132 121 65 98 37 29 28
RII02 A - 2994 123 3.4 302 3 62 34 40 1085 36 50 50
FRI10R A - 1591 126 4.9 256 26 146 216 45 62 160 30 13
NEF20R A - 1221 68 4.0 301 51 68 149 70 227 23 25 19
LFR01R A - 1523 119 4.9 312 2 156 55 44 115 66 19 17 Goc = Galathowenia oculata, Pko = Pectinaria koreni, Afi = Amphiura filiformis, Sbo = Spiophanes bombyx, Skr = S. kroyeri, Ofu =Owenia fusiformis, Psp = Phoronis sp., Tfl = Thyasira flexuosa, Csp = Chaetozone sp. (incl. C. setosa)
7.3 Summary and conclusions The sediments at Øst Frigg are classified as fine sand with a relatively moderate amount of pelitt (3.6 – 5.6 %) and TOM (0.9 – 1.3 %). There is a general trend for finer sediments in the area, also at the reference station, as the amount of pelite has increased while the amount of finer sand is more or less similar in the present and previous survey. On the other hand, the amount of TOM has decreased somewhat at most of the stations. It is believed that this is a result of natural variation in the sediments.
In 2000 sediments at the station situated 250 m in the 240°direction relative to PSA have THC levels just above the limit of significant contamination. Borderline values are found at the stations situated 250 m in the 330° direction relative to PSA and 250 m in the 330° and 150° directions relative to PSB. Minor increases in THC values are found in sediments at these stations when comparing to the 1997 survey. However, sediments from the other field stations generally reveal lower THC concentrations in 2000 than in 1997. In addition to the total hydrocarbons, sediment concentrations of NPD’s, 3-6 ring aromatics and decalins at the two stations examined are lower in this survey than in 1997. In sum, the average sediment THC level at Øst Frigg has gone down from 10 mg/kg in 1997 to 8.8 mg/kg in 2000. Hydrocarbon levels must on this background be characterised as lower at Øst Frigg in 2000 than they were in 1997.
Elevated levels of barium are found at the stations situated 250 m in the 240°direction relative to PSA and 250 m in the 60° and 150° directions relative to PSB. No contamination by the other selected metals is found.
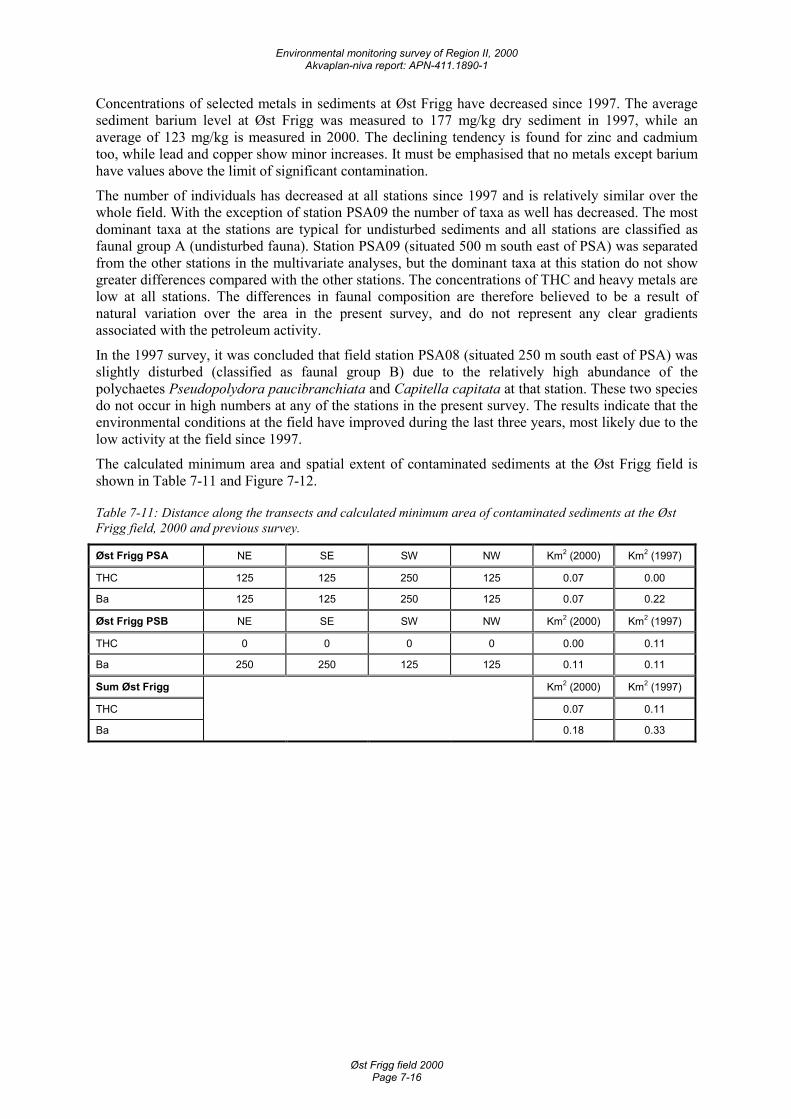
Environmental monitoring survey of Region II, 2000 Akvaplan-niva report: APN-411.1890-1
Øst Frigg field 2000 Page 7-16
Concentrations of selected metals in sediments at Øst Frigg have decreased since 1997. The average sediment barium level at Øst Frigg was measured to 177 mg/kg dry sediment in 1997, while an average of 123 mg/kg is measured in 2000. The declining tendency is found for zinc and cadmium too, while lead and copper show minor increases. It must be emphasised that no metals except barium have values above the limit of significant contamination.
The number of individuals has decreased at all stations since 1997 and is relatively similar over the whole field. With the exception of station PSA09 the number of taxa as well has decreased. The most dominant taxa at the stations are typical for undisturbed sediments and all stations are classified as faunal group A (undisturbed fauna). Station PSA09 (situated 500 m south east of PSA) was separated from the other stations in the multivariate analyses, but the dominant taxa at this station do not show greater differences compared with the other stations. The concentrations of THC and heavy metals are low at all stations. The differences in faunal composition are therefore believed to be a result of natural variation over the area in the present survey, and do not represent any clear gradients associated with the petroleum activity.
In the 1997 survey, it was concluded that field station PSA08 (situated 250 m south east of PSA) was slightly disturbed (classified as faunal group B) due to the relatively high abundance of the polychaetes Pseudopolydora paucibranchiata and Capitella capitata at that station. These two species do not occur in high numbers at any of the stations in the present survey. The results indicate that the environmental conditions at the field have improved during the last three years, most likely due to the low activity at the field since 1997.
The calculated minimum area and spatial extent of contaminated sediments at the Øst Frigg field is shown in Table 7-11 and Figure 7-12.
Table 7-11: Distance along the transects and calculated minimum area of contaminated sediments at the Øst Frigg field, 2000 and previous survey.
Øst Frigg PSA NE SE SW NW Km2 (2000) Km2 (1997)
THC 125 125 250 125 0.07 0.00
Ba 125 125 250 125 0.07 0.22
Øst Frigg PSB NE SE SW NW Km2 (2000) Km2 (1997)
THC 0 0 0 0 0.00 0.11
Ba 250 250 125 125 0.11 0.11
Sum Øst Frigg Km2 (2000) Km2 (1997)
THC 0.07 0.11
Ba 0.18 0.33

Environmental monitoring survey of Region II, 2000 Akvaplan-niva report: APN-411.1890-1
Øst Frigg field 2000 Page 7-17
Ú
Ú
#
#
#
#
#
#
#
#
#
#
#
THC mg/kg tørt sediment# < 10 (LSC RegII)# 10 - 19# 20 - 49
# 50 - 199
# > 200
Ú
Ú
#
#
#
#
#
#
#
#
#
#
#
Ba mg/kg tørt sediment# < 100 (LSC RegII)# 100 - 499# 500 - 999
# 1000 - 2999
# > 3000
Figure 7-12: Distribution of the amounts of THC and barium at the Øst Frigg field, 2000.
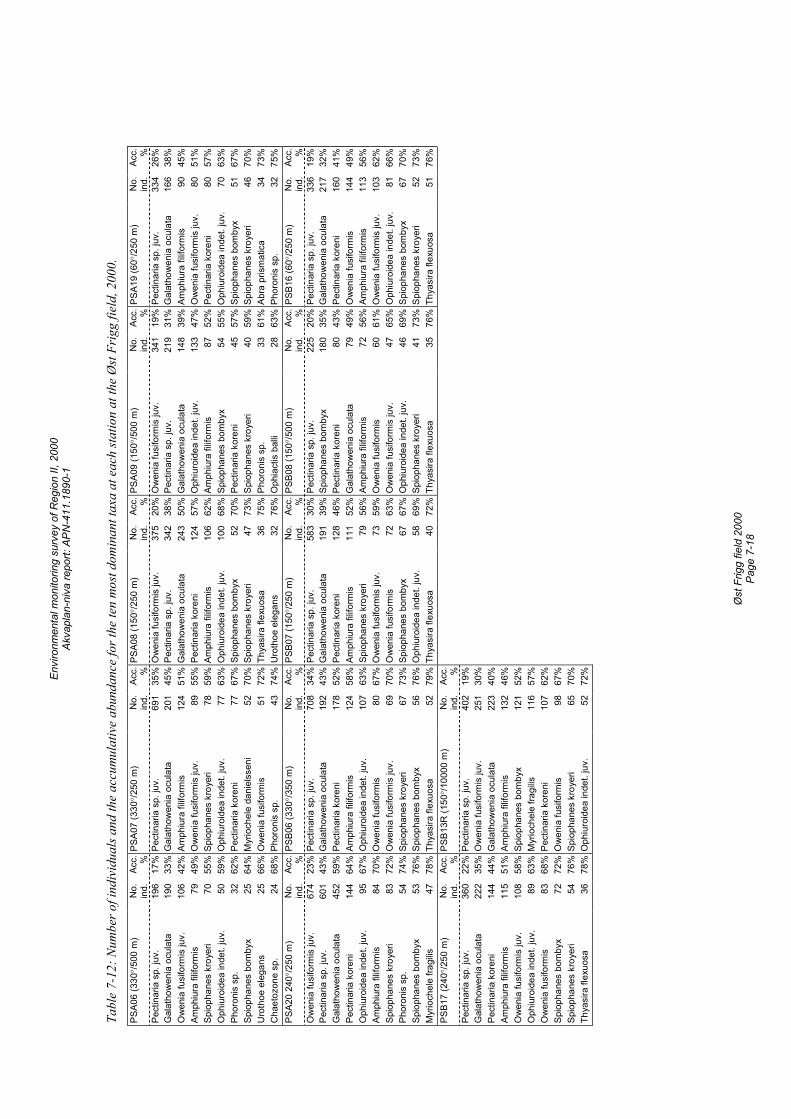
Envi
ronm
enta
l mon
itorin
g su
rvey
of R
egio
n II,
200
0 Ak
vapl
an-n
iva
repo
rt: A
PN-4
11.1
890-
1
Ø
st F
rigg
field
200
0 Pa
ge 7
-18
Tabl
e 7-
12: N
umbe
r of i
ndiv
idua
ls an
d th
e ac
cum
ulat
ive
abun
danc
e fo
r the
ten
mos
t dom
inan
t tax
a at
eac
h sta
tion
at th
e Ø
st Fr
igg
field
, 200
0.
PSA0
6 (3
30°/
500
m)
No.
in
d.
Acc.
%
PSA0
7 (3
30°/
250
m)
No.
ind.
Acc. %
PSA0
8 (1
50°/
250
m)
No.
ind.
Acc.
%
PSA0
9 (1
50°/
500
m)
No.
ind.
Acc. %
PSA1
9 (6
0°/2
50 m
) N
o.in
d.Ac
c. %Pe
ctin
aria
sp.
juv.
19
6 17
% P
ectin
aria
sp.
juv.
69
135
%O
wen
ia fu
sifo
rmis
juv.
37
520
% O
wen
ia fu
sifo
rmis
juv.
34
119
%Pe
ctin
aria
sp.
juv.
33
426
%G
alat
how
enia
ocu
lata
19
0 33
% G
alat
how
enia
ocu
lata
20
145
%Pe
ctin
aria
sp.
juv.
34
238
% P
ectin
aria
sp.
juv.
21
931
%G
alat
how
enia
ocu
lata
16
638
%O
wen
ia fu
sifo
rmis
juv.
10
6 42
% A
mph
iura
filif
orm
is
124
51%
Gal
atho
wen
ia o
cula
ta
243
50%
Gal
atho
wen
ia o
cula
ta
148
39%
Amph
iura
filif
orm
is
9045
%Am
phiu
ra fi
lifor
mis
79
49
% O
wen
ia fu
sifo
rmis
juv.
89
55%
Pect
inar
ia k
oren
i 12
457
% O
phiu
roid
ea in
det.
juv.
13
347
%O
wen
ia fu
sifo
rmis
juv.
80
51%
Spio
phan
es k
roye
ri 70
55
% S
piop
hane
s kr
oyer
i 78
59%
Amph
iura
filif
orm
is
106
62%
Am
phiu
ra fi
lifor
mis
87
52%
Pect
inar
ia k
oren
i 80
57%
Oph
iuro
idea
inde
t. ju
v.
50
59%
Oph
iuro
idea
inde
t. ju
v.
7763
%O
phiu
roid
ea in
det.
juv.
10
068
% S
piop
hane
s bo
mby
x 54
55%
Oph
iuro
idea
inde
t. ju
v.
7063
%Ph
oron
is s
p.
32
62%
Pec
tinar
ia k
oren
i 77
67%
Spio
phan
es b
omby
x 52
70%
Pec
tinar
ia k
oren
i 45
57%
Spio
phan
es b
omby
x 51
67%
Spio
phan
es b
omby
x 25
64
% M
yrio
chel
e da
niel
ssen
i 52
70%
Spio
phan
es k
roye
ri 47
73%
Spi
opha
nes
kroy
eri
4059
%Sp
ioph
anes
kro
yeri
4670
%U
roth
oe e
lega
ns
25
66%
Ow
enia
fusi
form
is
5172
%Th
yasi
ra fl
exuo
sa
3675
% P
horo
nis
sp.
3361
%Ab
ra p
rism
atic
a 34
73%
Cha
etoz
one
sp.
24
68%
Pho
roni
s sp
. 43
74%
Uro
thoe
ele
gans
32
76%
Oph
iact
is b
alli
2863
%Ph
oron
is s
p.
3275
%PS
A20
240°
/250
m)
No.
in
d.
Acc.
%
PSB0
6 (3
30°/
350
m)
No.
ind.
Acc. %
PSB0
7 (1
50°/
250
m)
No.
ind.
Acc.
%
PSB0
8 (1
50°/
500
m)
No.
ind.
Acc. %
PSB1
6 (6
0°/2
50 m
) N
o.in
d.Ac
c. %O
wen
ia fu
sifo
rmis
juv.
67
4 23
% P
ectin
aria
sp.
juv.
70
834
%Pe
ctin
aria
sp.
juv.
58
330
% P
ectin
aria
sp.
juv.
22
520
%Pe
ctin
aria
sp.
juv.
33
619
%Pe
ctin
aria
sp.
juv.
60
1 43
% G
alat
how
enia
ocu
lata
19
243
%G
alat
how
enia
ocu
lata
19
139
% S
piop
hane
s bo
mby
x 18
035
%G
alat
how
enia
ocu
lata
21
732
%G
alat
how
enia
ocu
lata
45
2 59
% P
ectin
aria
kor
eni
178
52%
Pect
inar
ia k
oren
i 12
846
% P
ectin
aria
kor
eni
8043
%Pe
ctin
aria
kor
eni
160
41%
Pect
inar
ia k
oren
i 14
4 64
% A
mph
iura
filif
orm
is
124
58%
Amph
iura
filif
orm
is
111
52%
Gal
atho
wen
ia o
cula
ta
7949
%O
wen
ia fu
sifo
rmis
14
449
%O
phiu
roid
ea in
det.
juv.
95
67
% O
phiu
roid
ea in
det.
juv.
10
763
%Sp
ioph
anes
kro
yeri
7956
% A
mph
iura
filif
orm
is
7256
%Am
phiu
ra fi
lifor
mis
11
356
%Am
phiu
ra fi
lifor
mis
84
70
% O
wen
ia fu
sifo
rmis
80
67%
Ow
enia
fusi
form
is ju
v.
7359
% O
wen
ia fu
sifo
rmis
60
61%
Ow
enia
fusi
form
is ju
v.
103
62%
Spio
phan
es k
roye
ri 83
72
% O
wen
ia fu
sifo
rmis
juv.
69
70%
Ow
enia
fusi
form
is
7263
% O
wen
ia fu
sifo
rmis
juv.
47
65%
Oph
iuro
idea
inde
t. ju
v.
8166
%Ph
oron
is s
p.
54
74%
Spi
opha
nes
kroy
eri
6773
%Sp
ioph
anes
bom
byx
6767
% O
phiu
roid
ea in
det.
juv.
46
69%
Spio
phan
es b
omby
x 67
70%
Spio
phan
es b
omby
x 53
76
% S
piop
hane
s bo
mby
x 56
76%
Oph
iuro
idea
inde
t. ju
v.
5869
% S
piop
hane
s kr
oyer
i 41
73%
Spio
phan
es k
roye
ri 52
73%
Myr
ioch
ele
fragi
lis
47
78%
Thy
asira
flex
uosa
52
79%
Thya
sira
flex
uosa
40
72%
Thy
asira
flex
uosa
35
76%
Thya
sira
flex
uosa
51
76%
PSB1
7 (2
40°/
250
m)
No.
in
d.
Acc.
%
PSB1
3R (1
50°/
1000
0 m
) N
o.in
d.Ac
c. %
Pect
inar
ia s
p. ju
v.
360
22%
Pec
tinar
ia s
p. ju
v.
402
19%
Gal
atho
wen
ia o
cula
ta
222
35%
Ow
enia
fusi
form
is ju
v.
251
30%
Pe
ctin
aria
kor
eni
144
44%
Gal
atho
wen
ia o
cula
ta
223
40%
Am
phiu
ra fi
lifor
mis
11
5 51
% A
mph
iura
filif
orm
is
132
46%
O
wen
ia fu
sifo
rmis
juv.
10
8 58
% S
piop
hane
s bo
mby
x 12
152
%
Oph
iuro
idea
inde
t. ju
v.
89
63%
Myr
ioch
ele
fragi
lis
116
57%
O
wen
ia fu
sifo
rmis
83
68
% P
ectin
aria
kor
eni
107
62%
Sp
ioph
anes
bom
byx
72
72%
Ow
enia
fusi
form
is
9867
%
Spio
phan
es k
roye
ri 54
76
% S
piop
hane
s kr
oyer
i 65
70%
Th
yasi
ra fl
exuo
sa
36
78%
Oph
iuro
idea
inde
t. ju
v.
5272
%
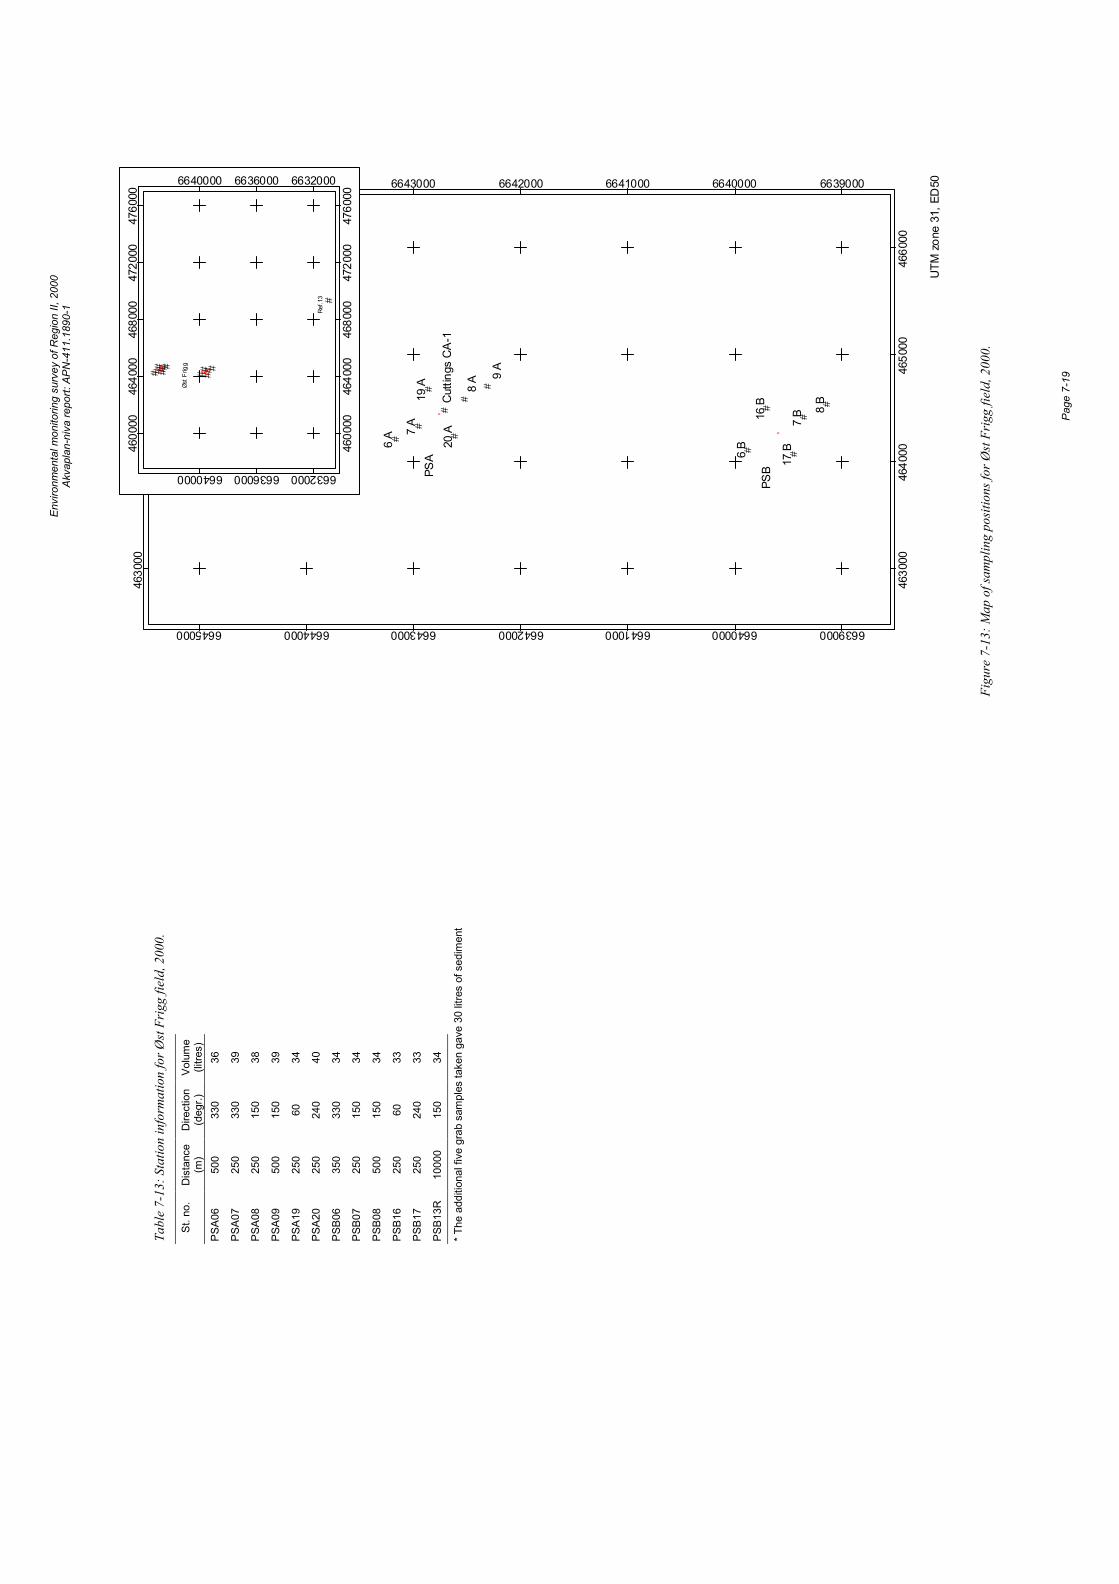
Envi
ronm
enta
l mon
itorin
g su
rvey
of R
egio
n II,
200
0 Ak
vapl
an-n
iva
repo
rt: A
PN-4
11.1
890-
1
Pa
ge 7
-19
#
#
#
##
##
#
#
##
#
'
'
PSA
PSB
6 A 7
A
8 A 9
A
6 B
7 B 8
B19 A
20 A
16 B
17 B
Cut
tings
CA
-1
4630
00
4630
00
4640
00
4640
00
4650
00
4650
00
4660
00
4660
00
6639000
6639000
6640000
6640000
6641000
6641000
6642000
6642000
6643000
6643000
6644000
6644000
6645000
6645000
UTM
zon
e 31
, ED
50
# ## ##
## # # ###
#
& &
Øst F
rigg
Ref.1
3
4600
00
4600
00
4640
00
4640
00
4680
00
4680
00
4720
00
4720
00
4760
00
4760
00
6632000
6632000
6636000
6636000
6640000
6640000
Figu
re 7
-13:
Map
of s
ampl
ing
posit
ions
for Ø
st Fr
igg
field
, 200
0.
Tabl
e 7-
13: S
tatio
n in
form
atio
n fo
r Øst
Frig
g fie
ld, 2
000.
St. n
o.
Dis
tanc
e (m
) D
irect
ion
(deg
r.)
Volu
me
(litre
s)
PSA0
6 50
0 33
0 36
PSA0
7 25
0 33
0 39
PSA0
8 25
0 15
0 38
PSA0
9 50
0 15
0 39
PSA1
9 25
0 60
34
PSA2
0 25
0 24
0 40
PSB0
6 35
0 33
0 34
PSB0
7 25
0 15
0 34
PSB0
8 50
0 15
0 34
PSB1
6 25
0 60
33
PSB1
7 25
0 24
0 33
PSB1
3R
1000
0 15
0 34
* The
add
ition
al fi
ve g
rab
sam
ples
take
n ga
ve 3
0 lit
res
of s
edim
ent

Envi
ronm
enta
l mon
itorin
g su
rvey
of R
egio
n II,
200
0 Ak
vapl
an-n
iva
repo
rt: A
PN-4
11.1
890-
1
Pa
ge 7
-20
Environmental monitoring survey of Region II, 2000 Akvaplan-niva report: APN-411.1890-1
Lille Frigg field 2000 Page 8-1
8 Lille Frigg field 8.1 Introduction The Lille Frigg field is located in block 25/2 in Region II. Production at the field started in 1994 and ceased in April 1999. The field is a sub-sea development situated north of the East Frigg field. All wells were drilled with water based mud. There has been no drilling activity at the field in the recent years. The wells were permanently plugged in June 2000 and the discharges given in Table 8-1 occurred during this operation.
In the monitoring survey at the field in 1997 no sediment from field stations at Lille Frigg were contaminated by hydrocarbons. On the other hand, sediments at all stations were contaminated by barium. Lead contamination was measured 250 m in direction 150° relative to C1. Slightly elevated levels of cadmium were measured 250 m in directions 60° and 240° relative to C2. The fauna was found to be slightly disturbed at some stations close to C1 and C2. Therefore, some additional stations were included in the present survey.
Information on the sampling stations is shown in Figure 8-12 and Table 8-13, both on the foldout page at the end of this chapter (page 8-19). In addition, samples from the cutting piles at the field were collected by use of a van Veen grab (biology) and box corer (chemistry). A separate report with these results will be produced.
Table 8-1: Summary of recent operational and accidental discharges at the Lille Frigg field (all discharges in tonnes).
1997 1998 1999 2000* Comments
Barite 0 0 0 140
Water-based drilling mud 0 0 0 375
Cementing chemicals 0 0 0 13
Accidental discharges 0 0 0 0.50 Hydraulic oil. * 1.st quarter.
8.2 Results and discussion
8.2.1 Physical characteristics The median phi value and the amounts (%) of pelite, fine sand and total organic material (TOM) in the sediment from the present and previous surveys are shown in Table 8-2 and Figure 8-1. Detailed data on sediment characteristics such as colour, smell and a full set of analytical data, including TOM content and grain size distribution (with standard deviation, evenness and kurtosis) can be found in the Appendix.
The sediments in the area are classified as fine sand with median phi values varying from 3.55 to 3.67. The amount of pelite in the sediment varies from 4.4 % (station LFR11) to 8.7 % (station LFR12), fine sand from 77.6 % (station LFR24) to 91.6 % (station LFR13) and the TOM varies from 0.95 % (station LFR03) to 1.63 % (station LFR12). The sediment was somewhat coarser at the reference station, where the pelite content was 5.5 %, fine sand 72.0 % and the TOM 1.08 %. At the field stations the pelite and TOM values are highest at stations north east of C1 (LFR12, LFR13) and east of C2 (LFR19).
The pelite content has increased at all stations since the previous survey in 1997, whereas the fine sand and TOM are more or less similar in the two surveys.
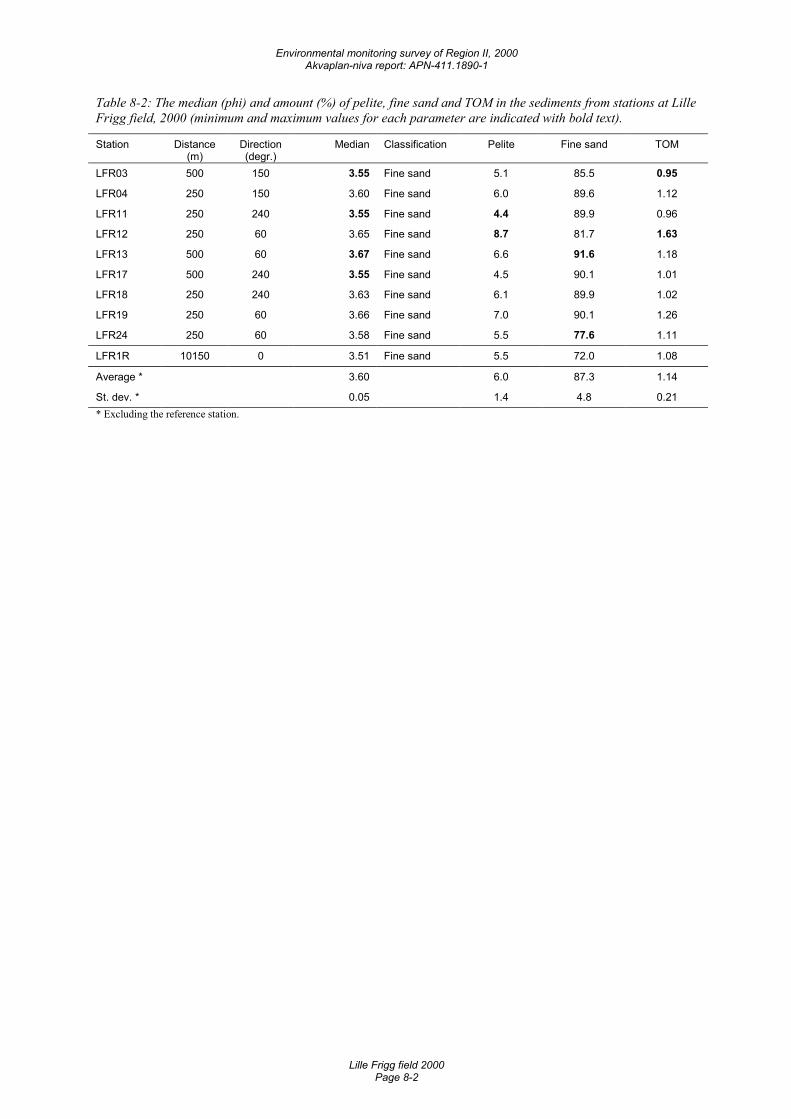
Environmental monitoring survey of Region II, 2000 Akvaplan-niva report: APN-411.1890-1
Lille Frigg field 2000 Page 8-2
Table 8-2: The median (phi) and amount (%) of pelite, fine sand and TOM in the sediments from stations at Lille Frigg field, 2000 (minimum and maximum values for each parameter are indicated with bold text).
Station Distance (m)
Direction (degr.)
Median Classification Pelite Fine sand TOM
LFR03 500 150 3.55 Fine sand 5.1 85.5 0.95
LFR04 250 150 3.60 Fine sand 6.0 89.6 1.12
LFR11 250 240 3.55 Fine sand 4.4 89.9 0.96
LFR12 250 60 3.65 Fine sand 8.7 81.7 1.63
LFR13 500 60 3.67 Fine sand 6.6 91.6 1.18
LFR17 500 240 3.55 Fine sand 4.5 90.1 1.01
LFR18 250 240 3.63 Fine sand 6.1 89.9 1.02
LFR19 250 60 3.66 Fine sand 7.0 90.1 1.26
LFR24 250 60 3.58 Fine sand 5.5 77.6 1.11
LFR1R 10150 0 3.51 Fine sand 5.5 72.0 1.08
Average * 3.60 6.0 87.3 1.14
St. dev. * 0.05 1.4 4.8 0.21 * Excluding the reference station.
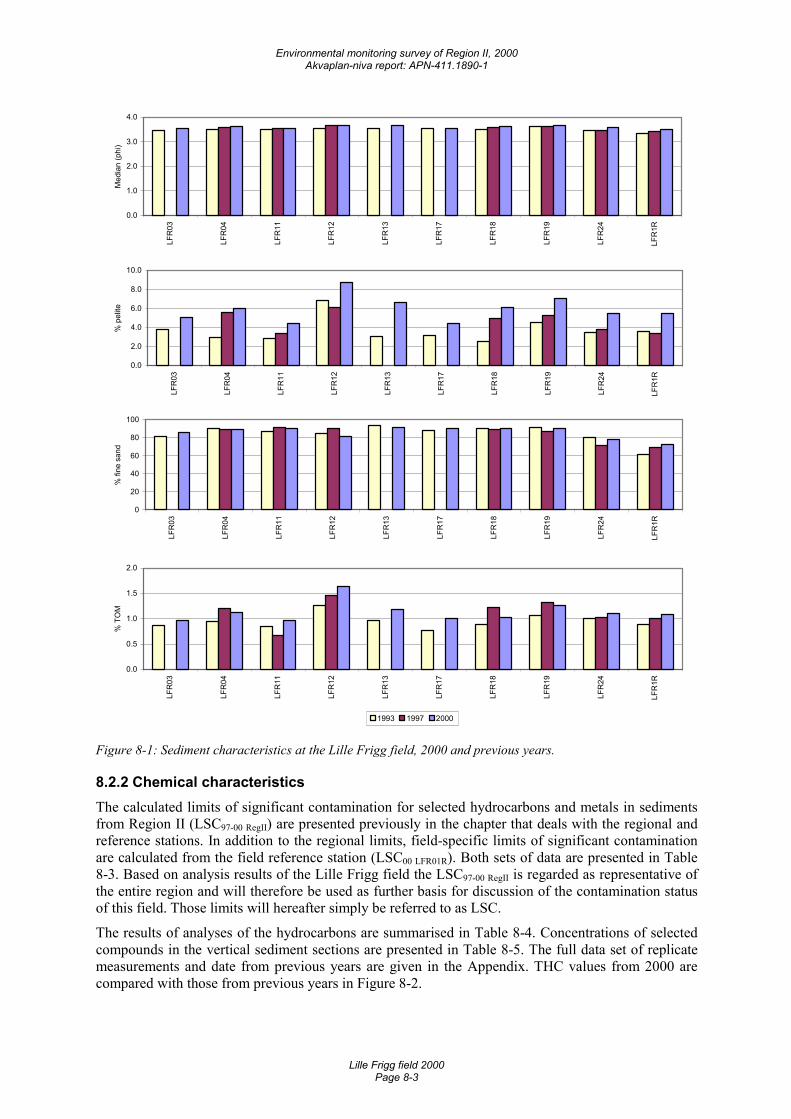
Environmental monitoring survey of Region II, 2000 Akvaplan-niva report: APN-411.1890-1
Lille Frigg field 2000 Page 8-3
0.0
1.0
2.0
3.0
4.0
LFR
03
LFR
04
LFR
11
LFR
12
LFR
13
LFR
17
LFR
18
LFR
19
LFR
24
LFR
1R
Med
ian
(phi
)
0.0
2.0
4.0
6.0
8.0
10.0
LFR
03
LFR
04
LFR
11
LFR
12
LFR
13
LFR
17
LFR
18
LFR
19
LFR
24
LFR
1R
% p
elite
0
20
40
60
80
100
LFR
03
LFR
04
LFR
11
LFR
12
LFR
13
LFR
17
LFR
18
LFR
19
LFR
24
LFR
1R
% fi
ne s
and
0.0
0.5
1.0
1.5
2.0
LFR
03
LFR
04
LFR
11
LFR
12
LFR
13
LFR
17
LFR
18
LFR
19
LFR
24
LFR
1R
% T
OM
1993 1997 2000
Figure 8-1: Sediment characteristics at the Lille Frigg field, 2000 and previous years.
8.2.2 Chemical characteristics The calculated limits of significant contamination for selected hydrocarbons and metals in sediments from Region II (LSC97-00 RegII) are presented previously in the chapter that deals with the regional and reference stations. In addition to the regional limits, field-specific limits of significant contamination are calculated from the field reference station (LSC00 LFR01R). Both sets of data are presented in Table 8-3. Based on analysis results of the Lille Frigg field the LSC97-00 RegII is regarded as representative of the entire region and will therefore be used as further basis for discussion of the contamination status of this field. Those limits will hereafter simply be referred to as LSC.
The results of analyses of the hydrocarbons are summarised in Table 8-4. Concentrations of selected compounds in the vertical sediment sections are presented in Table 8-5. The full data set of replicate measurements and date from previous years are given in the Appendix. THC values from 2000 are compared with those from previous years in Figure 8-2.
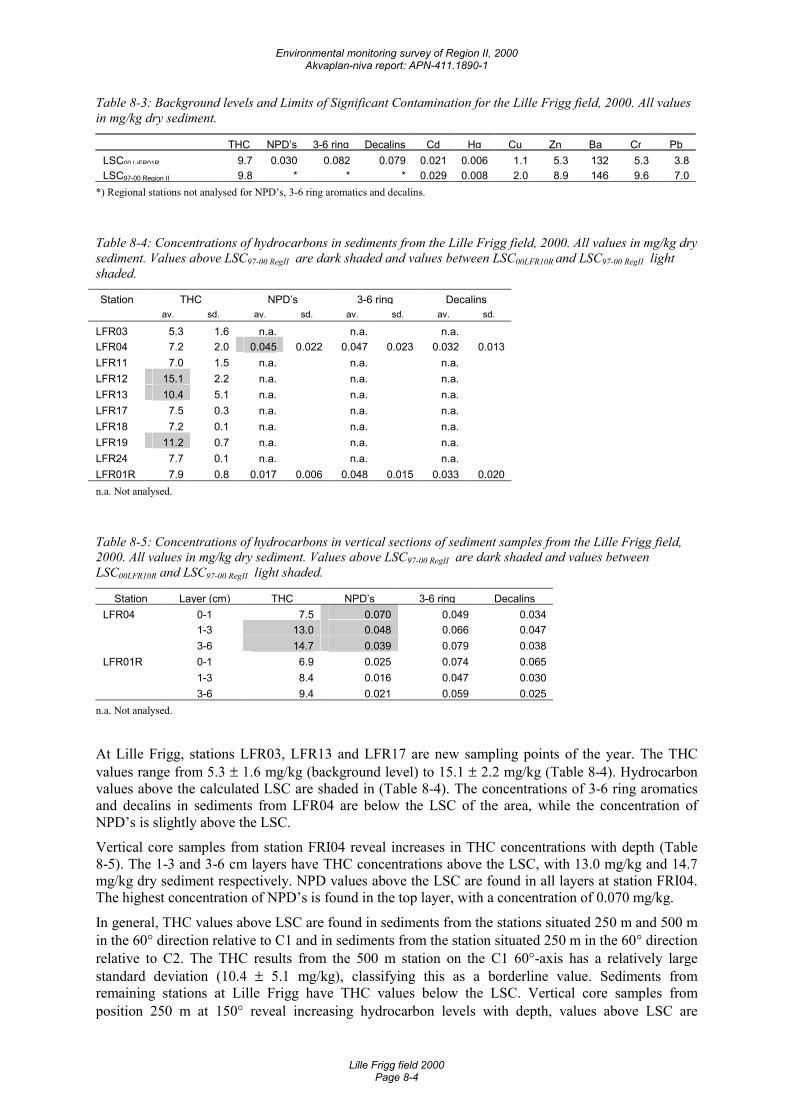
Environmental monitoring survey of Region II, 2000 Akvaplan-niva report: APN-411.1890-1
Lille Frigg field 2000 Page 8-4
Table 8-3: Background levels and Limits of Significant Contamination for the Lille Frigg field, 2000. All values in mg/kg dry sediment.
THC NPD’s 3-6 ring Decalins Cd Hg Cu Zn Ba Cr PbLSC00 LiFR01R 9.7 0.030 0.082 0.079 0.021 0.006 1.1 5.3 132 5.3 3.8LSC97-00 Region II 9.8 * * * 0.029 0.008 2.0 8.9 146 9.6 7.0
*) Regional stations not analysed for NPD’s, 3-6 ring aromatics and decalins.
Table 8-4: Concentrations of hydrocarbons in sediments from the Lille Frigg field, 2000. All values in mg/kg dry sediment. Values above LSC97-00 RegII are dark shaded and values between LSC00LFR10R and LSC97-00 RegII light shaded.
Station THC NPD’s 3-6 ring Decalins av. sd. av. sd. av. sd. av. sd.
LFR03 5.3 1.6 n.a. n.a. n.a.LFR04 7.2 2.0 0.045 0.022 0.047 0.023 0.032 0.013LFR11 7.0 1.5 n.a. n.a. n.a.LFR12 15.1 2.2 n.a. n.a. n.a.LFR13 10.4 5.1 n.a. n.a. n.a.LFR17 7.5 0.3 n.a. n.a. n.a.LFR18 7.2 0.1 n.a. n.a. n.a.LFR19 11.2 0.7 n.a. n.a. n.a.LFR24 7.7 0.1 n.a. n.a. n.a.LFR01R 7.9 0.8 0.017 0.006 0.048 0.015 0.033 0.020n.a. Not analysed.
Table 8-5: Concentrations of hydrocarbons in vertical sections of sediment samples from the Lille Frigg field, 2000. All values in mg/kg dry sediment. Values above LSC97-00 RegII are dark shaded and values between LSC00LFR10R and LSC97-00 RegII light shaded.
Station Layer (cm) THC NPD’s 3-6 ring DecalinsLFR04 0-1 7.5 0.070 0.049 0.034 1-3 13.0 0.048 0.066 0.047 3-6 14.7 0.039 0.079 0.038LFR01R 0-1 6.9 0.025 0.074 0.065 1-3 8.4 0.016 0.047 0.030 3-6 9.4 0.021 0.059 0.025
n.a. Not analysed.
At Lille Frigg, stations LFR03, LFR13 and LFR17 are new sampling points of the year. The THC values range from 5.3 ± 1.6 mg/kg (background level) to 15.1 ± 2.2 mg/kg (Table 8-4). Hydrocarbon values above the calculated LSC are shaded in (Table 8-4). The concentrations of 3-6 ring aromatics and decalins in sediments from LFR04 are below the LSC of the area, while the concentration of NPD’s is slightly above the LSC.
Vertical core samples from station FRI04 reveal increases in THC concentrations with depth (Table 8-5). The 1-3 and 3-6 cm layers have THC concentrations above the LSC, with 13.0 mg/kg and 14.7 mg/kg dry sediment respectively. NPD values above the LSC are found in all layers at station FRI04. The highest concentration of NPD’s is found in the top layer, with a concentration of 0.070 mg/kg.
In general, THC values above LSC are found in sediments from the stations situated 250 m and 500 m in the 60° direction relative to C1 and in sediments from the station situated 250 m in the 60° direction relative to C2. The THC results from the 500 m station on the C1 60°-axis has a relatively large standard deviation (10.4 ± 5.1 mg/kg), classifying this as a borderline value. Sediments from remaining stations at Lille Frigg have THC values below the LSC. Vertical core samples from position 250 m at 150° reveal increasing hydrocarbon levels with depth, values above LSC are
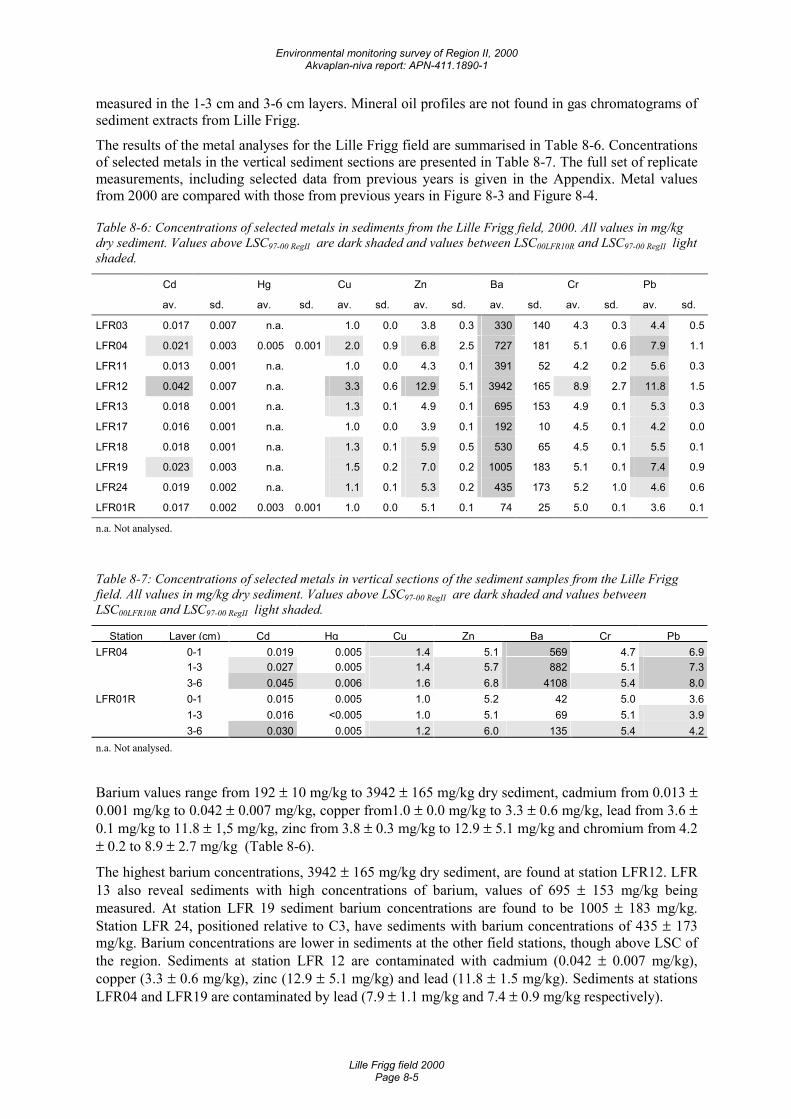
Environmental monitoring survey of Region II, 2000 Akvaplan-niva report: APN-411.1890-1
Lille Frigg field 2000 Page 8-5
measured in the 1-3 cm and 3-6 cm layers. Mineral oil profiles are not found in gas chromatograms of sediment extracts from Lille Frigg.
The results of the metal analyses for the Lille Frigg field are summarised in Table 8-6. Concentrations of selected metals in the vertical sediment sections are presented in Table 8-7. The full set of replicate measurements, including selected data from previous years is given in the Appendix. Metal values from 2000 are compared with those from previous years in Figure 8-3 and Figure 8-4.
Table 8-6: Concentrations of selected metals in sediments from the Lille Frigg field, 2000. All values in mg/kg dry sediment. Values above LSC97-00 RegII are dark shaded and values between LSC00LFR10R and LSC97-00 RegII light shaded.
Cd Hg Cu Zn Ba Cr Pb
av. sd. av. sd. av. sd. av. sd. av. sd. av. sd. av. sd.
LFR03 0.017 0.007 n.a. 1.0 0.0 3.8 0.3 330 140 4.3 0.3 4.4 0.5
LFR04 0.021 0.003 0.005 0.001 2.0 0.9 6.8 2.5 727 181 5.1 0.6 7.9 1.1
LFR11 0.013 0.001 n.a. 1.0 0.0 4.3 0.1 391 52 4.2 0.2 5.6 0.3
LFR12 0.042 0.007 n.a. 3.3 0.6 12.9 5.1 3942 165 8.9 2.7 11.8 1.5
LFR13 0.018 0.001 n.a. 1.3 0.1 4.9 0.1 695 153 4.9 0.1 5.3 0.3
LFR17 0.016 0.001 n.a. 1.0 0.0 3.9 0.1 192 10 4.5 0.1 4.2 0.0
LFR18 0.018 0.001 n.a. 1.3 0.1 5.9 0.5 530 65 4.5 0.1 5.5 0.1
LFR19 0.023 0.003 n.a. 1.5 0.2 7.0 0.2 1005 183 5.1 0.1 7.4 0.9
LFR24 0.019 0.002 n.a. 1.1 0.1 5.3 0.2 435 173 5.2 1.0 4.6 0.6
LFR01R 0.017 0.002 0.003 0.001 1.0 0.0 5.1 0.1 74 25 5.0 0.1 3.6 0.1
n.a. Not analysed.
Table 8-7: Concentrations of selected metals in vertical sections of the sediment samples from the Lille Frigg field. All values in mg/kg dry sediment. Values above LSC97-00 RegII are dark shaded and values between LSC00LFR10R and LSC97-00 RegII light shaded.
Station Layer (cm) Cd Hg Cu Zn Ba Cr PbLFR04 0-1 0.019 0.005 1.4 5.1 569 4.7 6.9 1-3 0.027 0.005 1.4 5.7 882 5.1 7.3 3-6 0.045 0.006 1.6 6.8 4108 5.4 8.0LFR01R 0-1 0.015 0.005 1.0 5.2 42 5.0 3.6 1-3 0.016 <0.005 1.0 5.1 69 5.1 3.9 3-6 0.030 0.005 1.2 6.0 135 5.4 4.2n.a. Not analysed.
Barium values range from 192 ± 10 mg/kg to 3942 ± 165 mg/kg dry sediment, cadmium from 0.013 ± 0.001 mg/kg to 0.042 ± 0.007 mg/kg, copper from1.0 ± 0.0 mg/kg to 3.3 ± 0.6 mg/kg, lead from 3.6 ± 0.1 mg/kg to 11.8 ± 1,5 mg/kg, zinc from 3.8 ± 0.3 mg/kg to 12.9 ± 5.1 mg/kg and chromium from 4.2 ± 0.2 to 8.9 ± 2.7 mg/kg (Table 8-6).
The highest barium concentrations, 3942 ± 165 mg/kg dry sediment, are found at station LFR12. LFR 13 also reveal sediments with high concentrations of barium, values of 695 ± 153 mg/kg being measured. At station LFR 19 sediment barium concentrations are found to be 1005 ± 183 mg/kg. Station LFR 24, positioned relative to C3, have sediments with barium concentrations of 435 ± 173 mg/kg. Barium concentrations are lower in sediments at the other field stations, though above LSC of the region. Sediments at station LFR 12 are contaminated with cadmium (0.042 ± 0.007 mg/kg), copper (3.3 ± 0.6 mg/kg), zinc (12.9 ± 5.1 mg/kg) and lead (11.8 ± 1.5 mg/kg). Sediments at stations LFR04 and LFR19 are contaminated by lead (7.9 ± 1.1 mg/kg and 7.4 ± 0.9 mg/kg respectively).
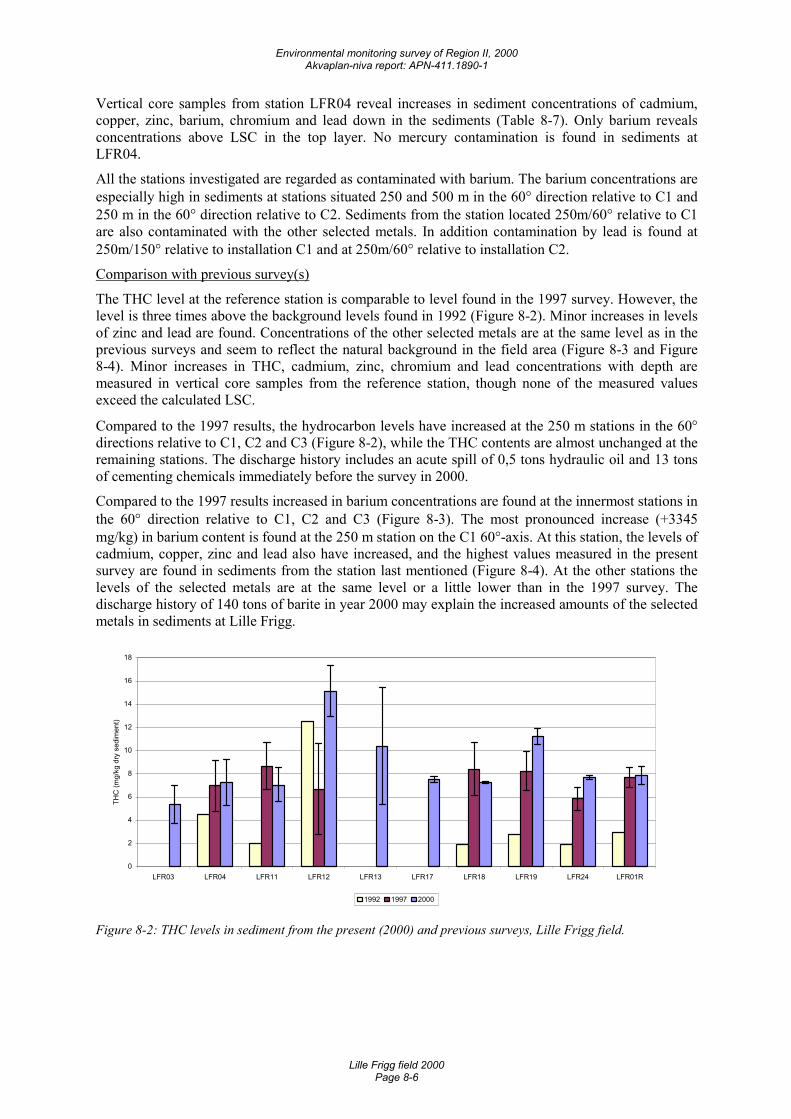
Environmental monitoring survey of Region II, 2000 Akvaplan-niva report: APN-411.1890-1
Lille Frigg field 2000 Page 8-6
Vertical core samples from station LFR04 reveal increases in sediment concentrations of cadmium, copper, zinc, barium, chromium and lead down in the sediments (Table 8-7). Only barium reveals concentrations above LSC in the top layer. No mercury contamination is found in sediments at LFR04.
All the stations investigated are regarded as contaminated with barium. The barium concentrations are especially high in sediments at stations situated 250 and 500 m in the 60° direction relative to C1 and 250 m in the 60° direction relative to C2. Sediments from the station located 250m/60° relative to C1 are also contaminated with the other selected metals. In addition contamination by lead is found at 250m/150° relative to installation C1 and at 250m/60° relative to installation C2.
Comparison with previous survey(s)
The THC level at the reference station is comparable to level found in the 1997 survey. However, the level is three times above the background levels found in 1992 (Figure 8-2). Minor increases in levels of zinc and lead are found. Concentrations of the other selected metals are at the same level as in the previous surveys and seem to reflect the natural background in the field area (Figure 8-3 and Figure 8-4). Minor increases in THC, cadmium, zinc, chromium and lead concentrations with depth are measured in vertical core samples from the reference station, though none of the measured values exceed the calculated LSC.
Compared to the 1997 results, the hydrocarbon levels have increased at the 250 m stations in the 60° directions relative to C1, C2 and C3 (Figure 8-2), while the THC contents are almost unchanged at the remaining stations. The discharge history includes an acute spill of 0,5 tons hydraulic oil and 13 tons of cementing chemicals immediately before the survey in 2000.
Compared to the 1997 results increased in barium concentrations are found at the innermost stations in the 60° direction relative to C1, C2 and C3 (Figure 8-3). The most pronounced increase (+3345 mg/kg) in barium content is found at the 250 m station on the C1 60°-axis. At this station, the levels of cadmium, copper, zinc and lead also have increased, and the highest values measured in the present survey are found in sediments from the station last mentioned (Figure 8-4). At the other stations the levels of the selected metals are at the same level or a little lower than in the 1997 survey. The discharge history of 140 tons of barite in year 2000 may explain the increased amounts of the selected metals in sediments at Lille Frigg.
0
2
4
6
8
10
12
14
16
18
LFR03 LFR04 LFR11 LFR12 LFR13 LFR17 LFR18 LFR19 LFR24 LFR01R
THC
(mg/
kg d
ry s
edim
ent)
1992 1997 2000
Figure 8-2: THC levels in sediment from the present (2000) and previous surveys, Lille Frigg field.
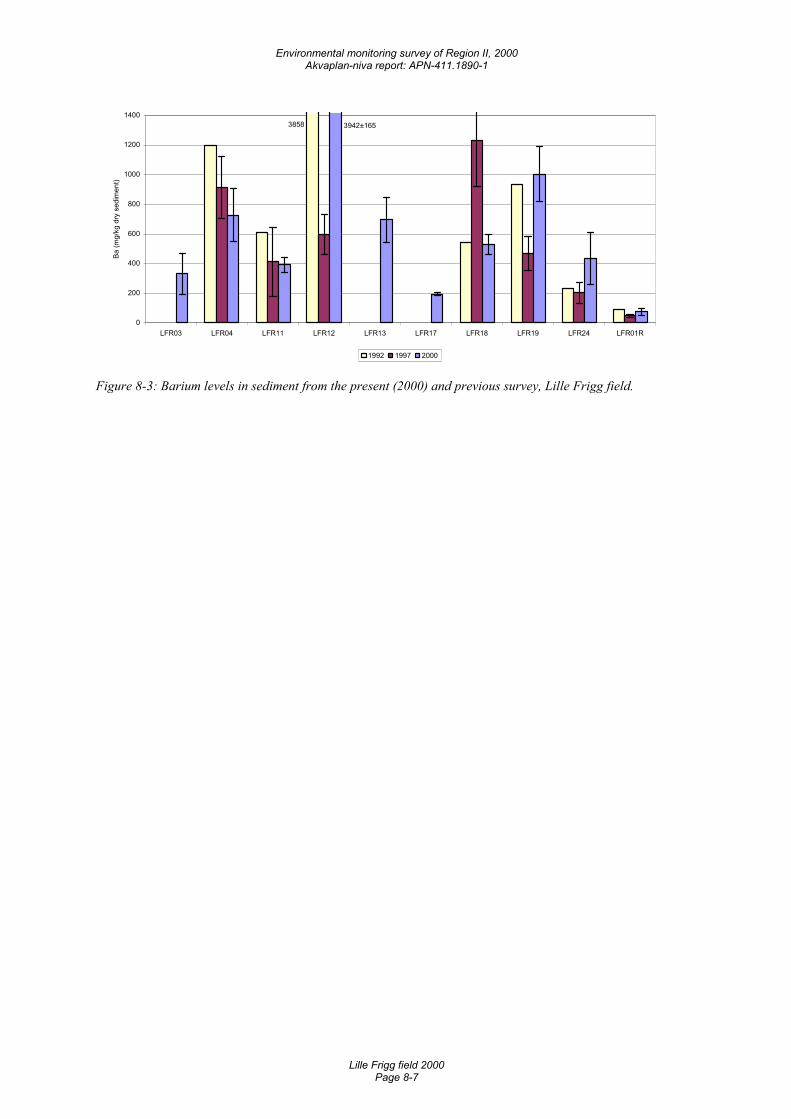
Environmental monitoring survey of Region II, 2000 Akvaplan-niva report: APN-411.1890-1
Lille Frigg field 2000 Page 8-7
3858 3942±165
0
200
400
600
800
1000
1200
1400
LFR03 LFR04 LFR11 LFR12 LFR13 LFR17 LFR18 LFR19 LFR24 LFR01R
Ba (m
g/kg
dry
sed
imen
t)
1992 1997 2000
Figure 8-3: Barium levels in sediment from the present (2000) and previous survey, Lille Frigg field.
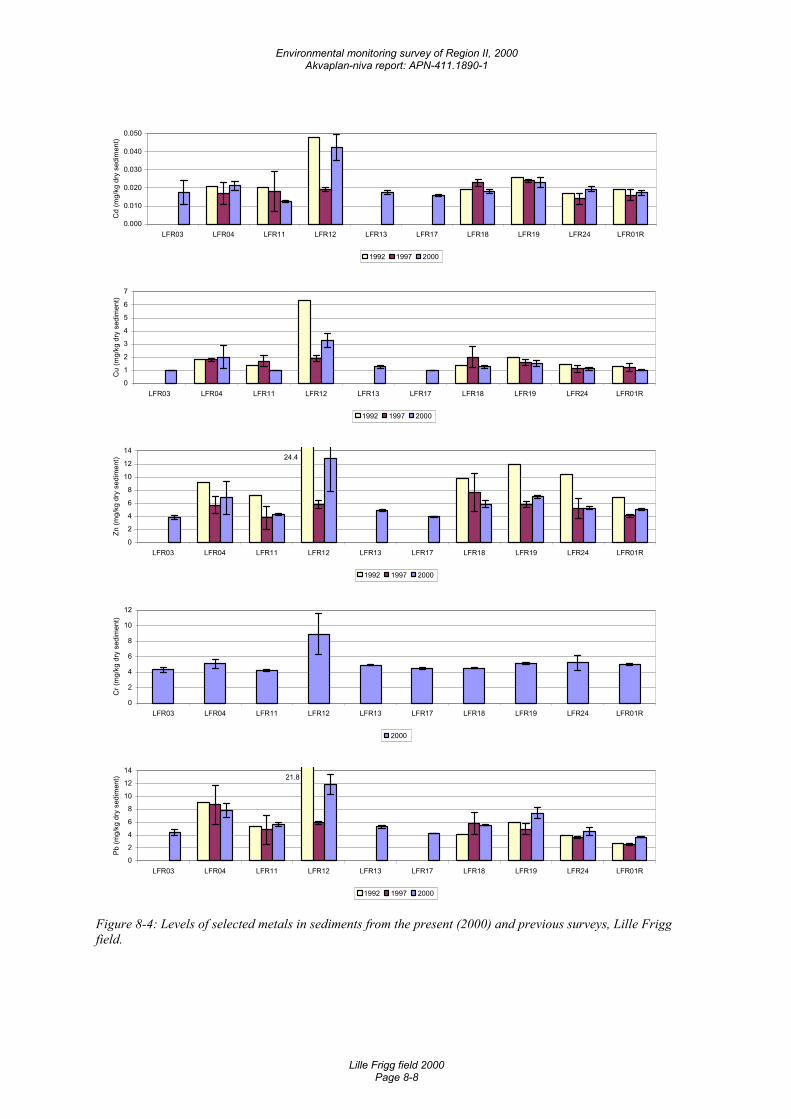
Environmental monitoring survey of Region II, 2000 Akvaplan-niva report: APN-411.1890-1
Lille Frigg field 2000 Page 8-8
0.000
0.010
0.020
0.030
0.040
0.050
LFR03 LFR04 LFR11 LFR12 LFR13 LFR17 LFR18 LFR19 LFR24 LFR01R
Cd
(mg/
kg d
ry s
edim
ent)
1992 1997 2000
0
1
2
3
4
5
6
7
LFR03 LFR04 LFR11 LFR12 LFR13 LFR17 LFR18 LFR19 LFR24 LFR01R
Cu
(mg/
kg d
ry s
edim
ent)
1992 1997 2000
24.4
0
2
4
6
8
10
12
14
LFR03 LFR04 LFR11 LFR12 LFR13 LFR17 LFR18 LFR19 LFR24 LFR01R
Zn (m
g/kg
dry
sed
imen
t)
1992 1997 2000
0
2
4
6
8
10
12
LFR03 LFR04 LFR11 LFR12 LFR13 LFR17 LFR18 LFR19 LFR24 LFR01R
Cr (
mg/
kg d
ry s
edim
ent)
2000
21.8
0
2
4
6
8
10
12
14
LFR03 LFR04 LFR11 LFR12 LFR13 LFR17 LFR18 LFR19 LFR24 LFR01R
Pb (m
g/kg
dry
sed
imen
t)
1992 1997 2000
Figure 8-4: Levels of selected metals in sediments from the present (2000) and previous surveys, Lille Frigg field.
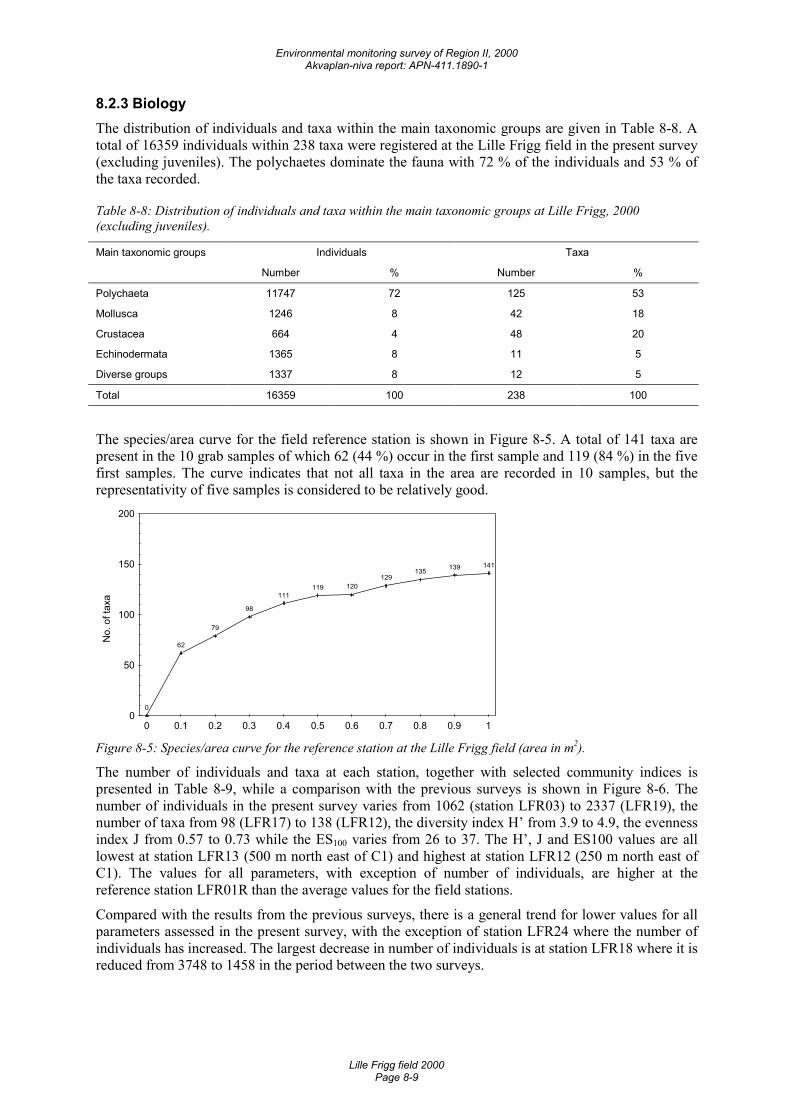
Environmental monitoring survey of Region II, 2000 Akvaplan-niva report: APN-411.1890-1
Lille Frigg field 2000 Page 8-9
8.2.3 Biology The distribution of individuals and taxa within the main taxonomic groups are given in Table 8-8. A total of 16359 individuals within 238 taxa were registered at the Lille Frigg field in the present survey (excluding juveniles). The polychaetes dominate the fauna with 72 % of the individuals and 53 % of the taxa recorded.
Table 8-8: Distribution of individuals and taxa within the main taxonomic groups at Lille Frigg, 2000 (excluding juveniles).
Main taxonomic groups Individuals Taxa
Number % Number %
Polychaeta 11747 72 125 53
Mollusca 1246 8 42 18
Crustacea 664 4 48 20
Echinodermata 1365 8 11 5
Diverse groups 1337 8 12 5
Total 16359 100 238 100
The species/area curve for the field reference station is shown in Figure 8-5. A total of 141 taxa are present in the 10 grab samples of which 62 (44 %) occur in the first sample and 119 (84 %) in the five first samples. The curve indicates that not all taxa in the area are recorded in 10 samples, but the representativity of five samples is considered to be relatively good.
No.
of t
axa
0
62
79
98
111119 120
129135 139 141
0
50
100
150
200
0 0.1 0.2 0.3 0.4 0.5 0.6 0.7 0.8 0.9 1 Figure 8-5: Species/area curve for the reference station at the Lille Frigg field (area in m2).
The number of individuals and taxa at each station, together with selected community indices is presented in Table 8-9, while a comparison with the previous surveys is shown in Figure 8-6. The number of individuals in the present survey varies from 1062 (station LFR03) to 2337 (LFR19), the number of taxa from 98 (LFR17) to 138 (LFR12), the diversity index H’ from 3.9 to 4.9, the evenness index J from 0.57 to 0.73 while the ES100 varies from 26 to 37. The H’, J and ES100 values are all lowest at station LFR13 (500 m north east of C1) and highest at station LFR12 (250 m north east of C1). The values for all parameters, with exception of number of individuals, are higher at the reference station LFR01R than the average values for the field stations.
Compared with the results from the previous surveys, there is a general trend for lower values for all parameters assessed in the present survey, with the exception of station LFR24 where the number of individuals has increased. The largest decrease in number of individuals is at station LFR18 where it is reduced from 3748 to 1458 in the period between the two surveys.
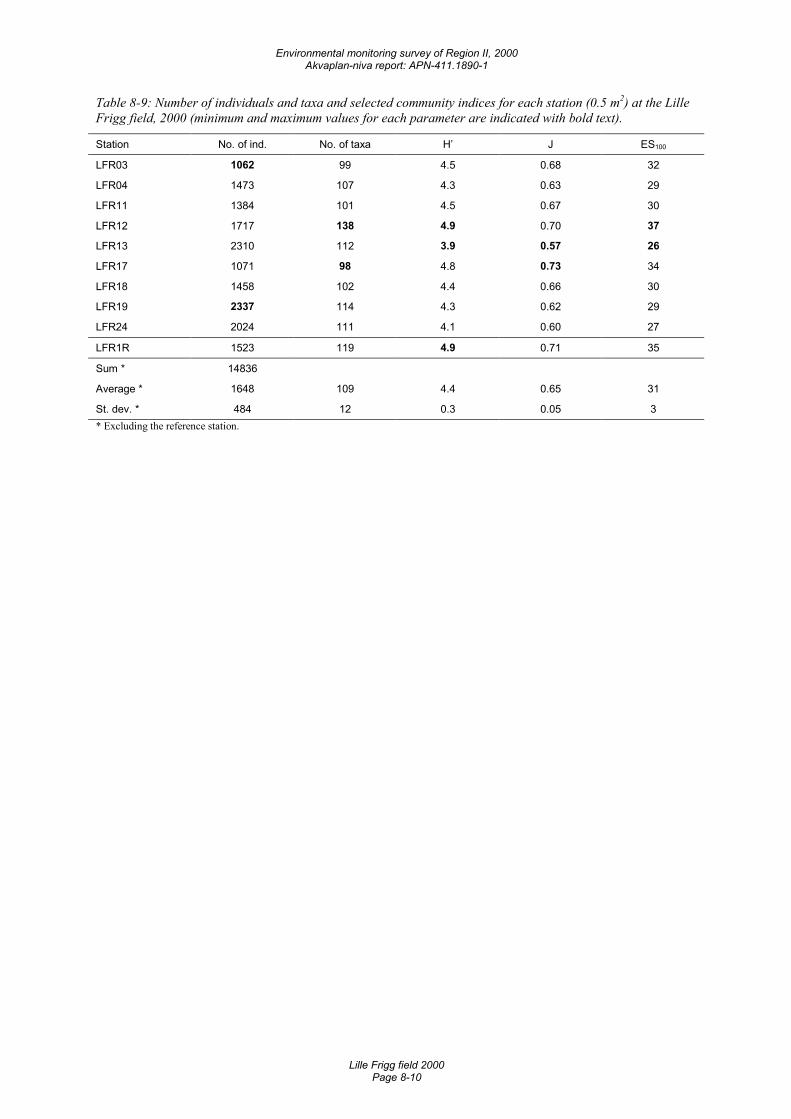
Environmental monitoring survey of Region II, 2000 Akvaplan-niva report: APN-411.1890-1
Lille Frigg field 2000 Page 8-10
Table 8-9: Number of individuals and taxa and selected community indices for each station (0.5 m2) at the Lille Frigg field, 2000 (minimum and maximum values for each parameter are indicated with bold text).
Station No. of ind. No. of taxa H’ J ES100
LFR03 1062 99 4.5 0.68 32
LFR04 1473 107 4.3 0.63 29
LFR11 1384 101 4.5 0.67 30
LFR12 1717 138 4.9 0.70 37
LFR13 2310 112 3.9 0.57 26
LFR17 1071 98 4.8 0.73 34
LFR18 1458 102 4.4 0.66 30
LFR19 2337 114 4.3 0.62 29
LFR24 2024 111 4.1 0.60 27
LFR1R 1523 119 4.9 0.71 35
Sum * 14836
Average * 1648 109 4.4 0.65 31
St. dev. * 484 12 0.3 0.05 3 * Excluding the reference station.
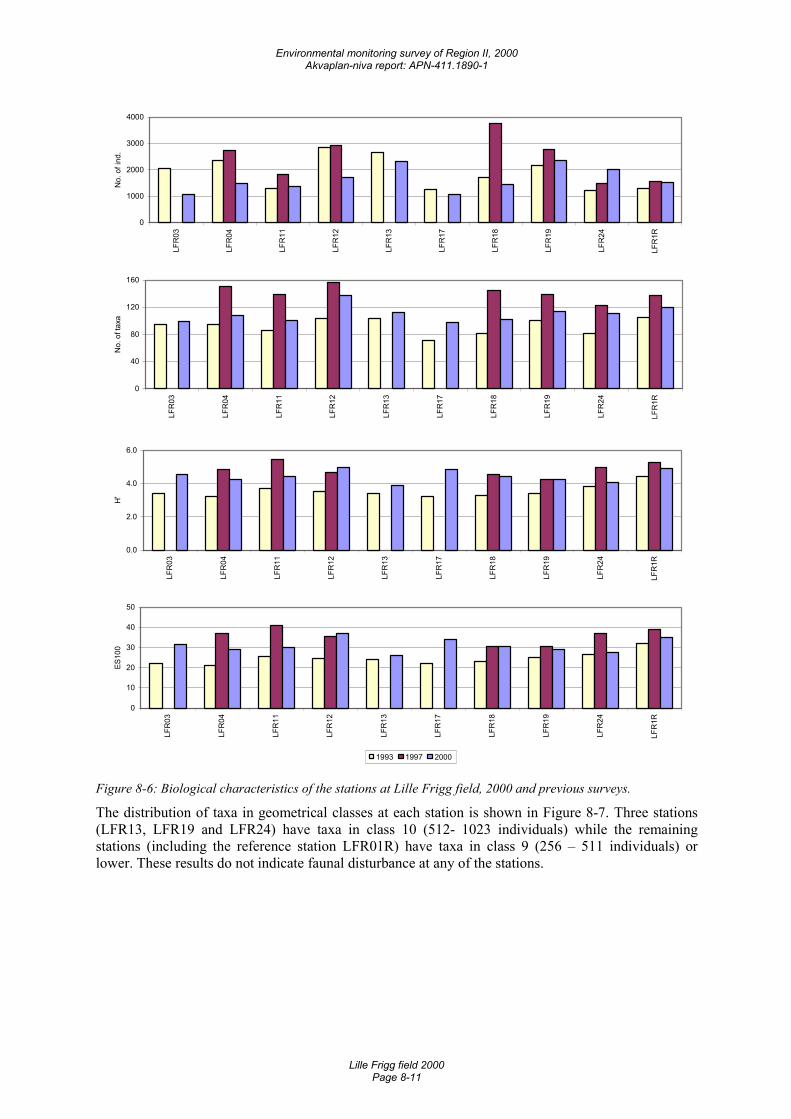
Environmental monitoring survey of Region II, 2000 Akvaplan-niva report: APN-411.1890-1
Lille Frigg field 2000 Page 8-11
0
1000
2000
3000
4000
LFR
03
LFR
04
LFR
11
LFR
12
LFR
13
LFR
17
LFR
18
LFR
19
LFR
24
LFR
1R
No.
of i
nd.
0
40
80
120
160
LFR
03
LFR
04
LFR
11
LFR
12
LFR
13
LFR
17
LFR
18
LFR
19
LFR
24
LFR
1R
No.
of t
axa
0.0
2.0
4.0
6.0
LFR
03
LFR
04
LFR
11
LFR
12
LFR
13
LFR
17
LFR
18
LFR
19
LFR
24
LFR
1R
H'
0
10
20
30
40
50
LFR
03
LFR
04
LFR
11
LFR
12
LFR
13
LFR
17
LFR
18
LFR
19
LFR
24
LFR
1R
ES10
0
1993 1997 2000
Figure 8-6: Biological characteristics of the stations at Lille Frigg field, 2000 and previous surveys.
The distribution of taxa in geometrical classes at each station is shown in Figure 8-7. Three stations (LFR13, LFR19 and LFR24) have taxa in class 10 (512- 1023 individuals) while the remaining stations (including the reference station LFR01R) have taxa in class 9 (256 – 511 individuals) or lower. These results do not indicate faunal disturbance at any of the stations.
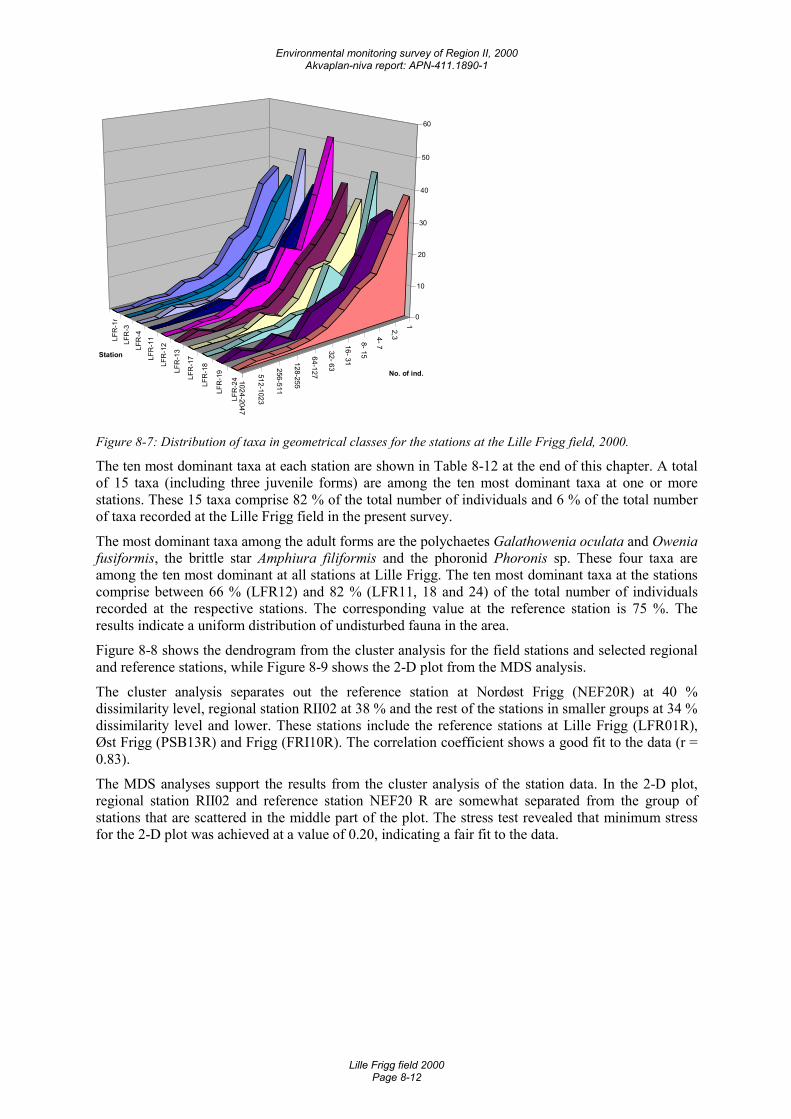
Environmental monitoring survey of Region II, 2000 Akvaplan-niva report: APN-411.1890-1
Lille Frigg field 2000 Page 8-12
1
2,3 4- 7
8- 15
16- 31
32- 63
64-127
128-255
256-511
512-1023
1024-2047
LFR
-1r
LFR
-3LF
R-4
LFR
-11
LFR
-12
LFR
-13
LFR
-17
LFR
-18
LFR
-19
LFR
-24
0
10
20
30
40
50
60
No. of ind.
Station
Figure 8-7: Distribution of taxa in geometrical classes for the stations at the Lille Frigg field, 2000.
The ten most dominant taxa at each station are shown in Table 8-12 at the end of this chapter. A total of 15 taxa (including three juvenile forms) are among the ten most dominant taxa at one or more stations. These 15 taxa comprise 82 % of the total number of individuals and 6 % of the total number of taxa recorded at the Lille Frigg field in the present survey.
The most dominant taxa among the adult forms are the polychaetes Galathowenia oculata and Owenia fusiformis, the brittle star Amphiura filiformis and the phoronid Phoronis sp. These four taxa are among the ten most dominant at all stations at Lille Frigg. The ten most dominant taxa at the stations comprise between 66 % (LFR12) and 82 % (LFR11, 18 and 24) of the total number of individuals recorded at the respective stations. The corresponding value at the reference station is 75 %. The results indicate a uniform distribution of undisturbed fauna in the area.
Figure 8-8 shows the dendrogram from the cluster analysis for the field stations and selected regional and reference stations, while Figure 8-9 shows the 2-D plot from the MDS analysis.
The cluster analysis separates out the reference station at Nordøst Frigg (NEF20R) at 40 % dissimilarity level, regional station RII02 at 38 % and the rest of the stations in smaller groups at 34 % dissimilarity level and lower. These stations include the reference stations at Lille Frigg (LFR01R), Øst Frigg (PSB13R) and Frigg (FRI10R). The correlation coefficient shows a good fit to the data (r = 0.83).
The MDS analyses support the results from the cluster analysis of the station data. In the 2-D plot, regional station RII02 and reference station NEF20 R are somewhat separated from the group of stations that are scattered in the middle part of the plot. The stress test revealed that minimum stress for the 2-D plot was achieved at a value of 0.20, indicating a fair fit to the data.
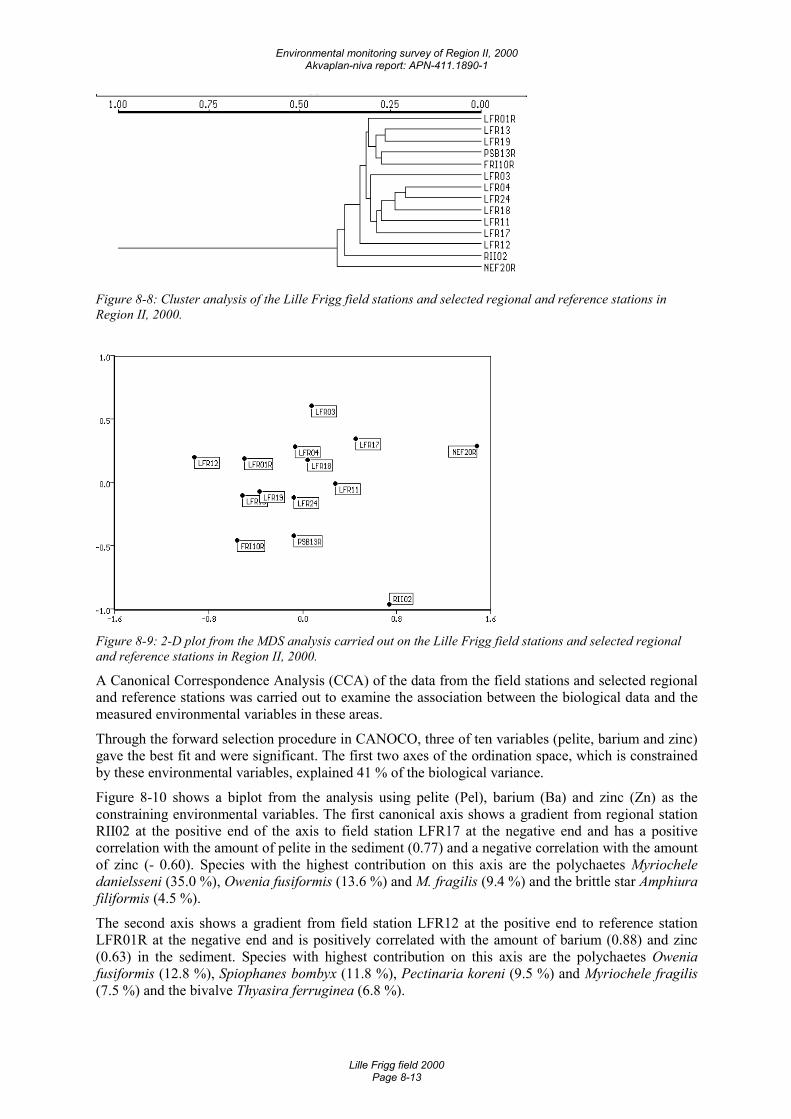
Environmental monitoring survey of Region II, 2000 Akvaplan-niva report: APN-411.1890-1
Lille Frigg field 2000 Page 8-13
Figure 8-8: Cluster analysis of the Lille Frigg field stations and selected regional and reference stations in Region II, 2000.
Figure 8-9: 2-D plot from the MDS analysis carried out on the Lille Frigg field stations and selected regional and reference stations in Region II, 2000.
A Canonical Correspondence Analysis (CCA) of the data from the field stations and selected regional and reference stations was carried out to examine the association between the biological data and the measured environmental variables in these areas.
Through the forward selection procedure in CANOCO, three of ten variables (pelite, barium and zinc) gave the best fit and were significant. The first two axes of the ordination space, which is constrained by these environmental variables, explained 41 % of the biological variance.
Figure 8-10 shows a biplot from the analysis using pelite (Pel), barium (Ba) and zinc (Zn) as the constraining environmental variables. The first canonical axis shows a gradient from regional station RII02 at the positive end of the axis to field station LFR17 at the negative end and has a positive correlation with the amount of pelite in the sediment (0.77) and a negative correlation with the amount of zinc (- 0.60). Species with the highest contribution on this axis are the polychaetes Myriochele danielsseni (35.0 %), Owenia fusiformis (13.6 %) and M. fragilis (9.4 %) and the brittle star Amphiura filiformis (4.5 %).
The second axis shows a gradient from field station LFR12 at the positive end to reference station LFR01R at the negative end and is positively correlated with the amount of barium (0.88) and zinc (0.63) in the sediment. Species with highest contribution on this axis are the polychaetes Owenia fusiformis (12.8 %), Spiophanes bombyx (11.8 %), Pectinaria koreni (9.5 %) and Myriochele fragilis (7.5 %) and the bivalve Thyasira ferruginea (6.8 %).
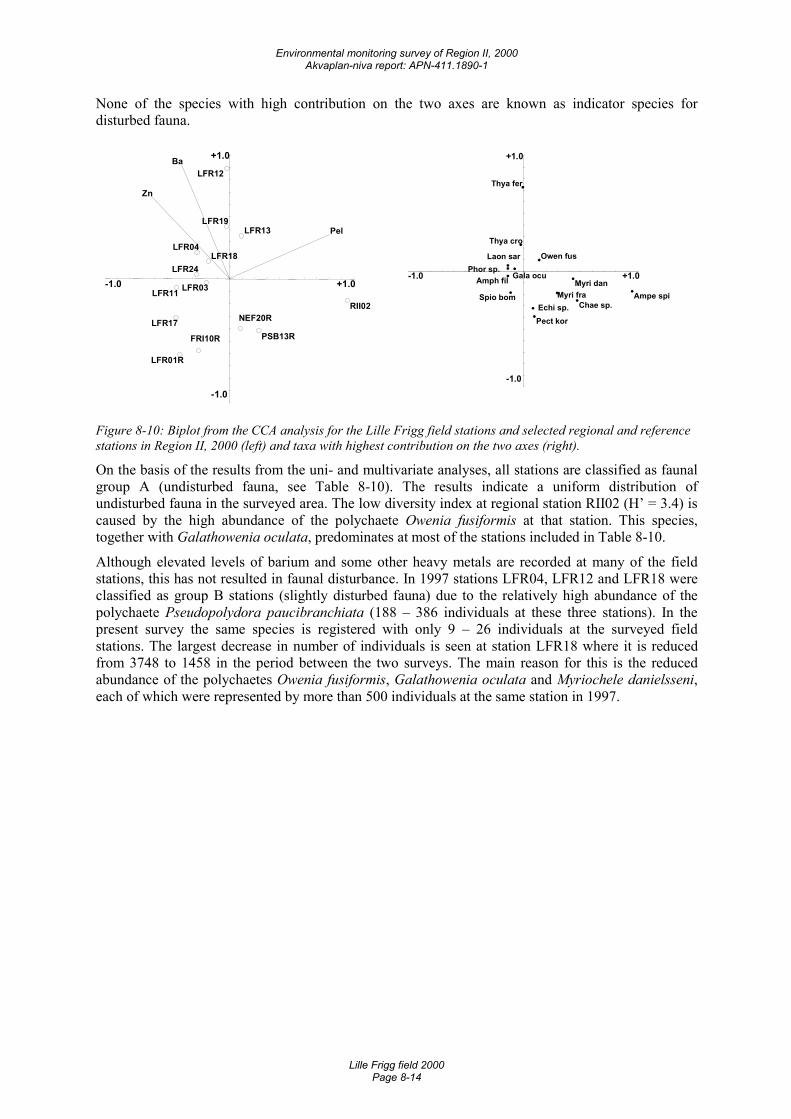
Environmental monitoring survey of Region II, 2000 Akvaplan-niva report: APN-411.1890-1
Lille Frigg field 2000 Page 8-14
None of the species with high contribution on the two axes are known as indicator species for disturbed fauna.
-1.0 +1.0
-1.0
+1.0
Pel
Zn
Ba
RII02
LFR17
LFR11
LFR01R
LFR24
LFR04
FRI10R PSB13R
LFR03
LFR18
LFR13
NEF20R
LFR19
LFR12
-1.0 +1.0
-1.0
+1.0
Ampe spiChae sp.
Myri danMyri fra
Owen fusPhor sp.
Amph fil
Laon sar
Spio bom
Pect korEchi sp.
Gala ocu
Thya cro
Thya fer
Figure 8-10: Biplot from the CCA analysis for the Lille Frigg field stations and selected regional and reference stations in Region II, 2000 (left) and taxa with highest contribution on the two axes (right).
On the basis of the results from the uni- and multivariate analyses, all stations are classified as faunal group A (undisturbed fauna, see Table 8-10). The results indicate a uniform distribution of undisturbed fauna in the surveyed area. The low diversity index at regional station RII02 (H’ = 3.4) is caused by the high abundance of the polychaete Owenia fusiformis at that station. This species, together with Galathowenia oculata, predominates at most of the stations included in Table 8-10.
Although elevated levels of barium and some other heavy metals are recorded at many of the field stations, this has not resulted in faunal disturbance. In 1997 stations LFR04, LFR12 and LFR18 were classified as group B stations (slightly disturbed fauna) due to the relatively high abundance of the polychaete Pseudopolydora paucibranchiata (188 – 386 individuals at these three stations). In the present survey the same species is registered with only 9 – 26 individuals at the surveyed field stations. The largest decrease in number of individuals is seen at station LFR18 where it is reduced from 3748 to 1458 in the period between the two surveys. The main reason for this is the reduced abundance of the polychaetes Owenia fusiformis, Galathowenia oculata and Myriochele danielsseni, each of which were represented by more than 500 individuals at the same station in 1997.
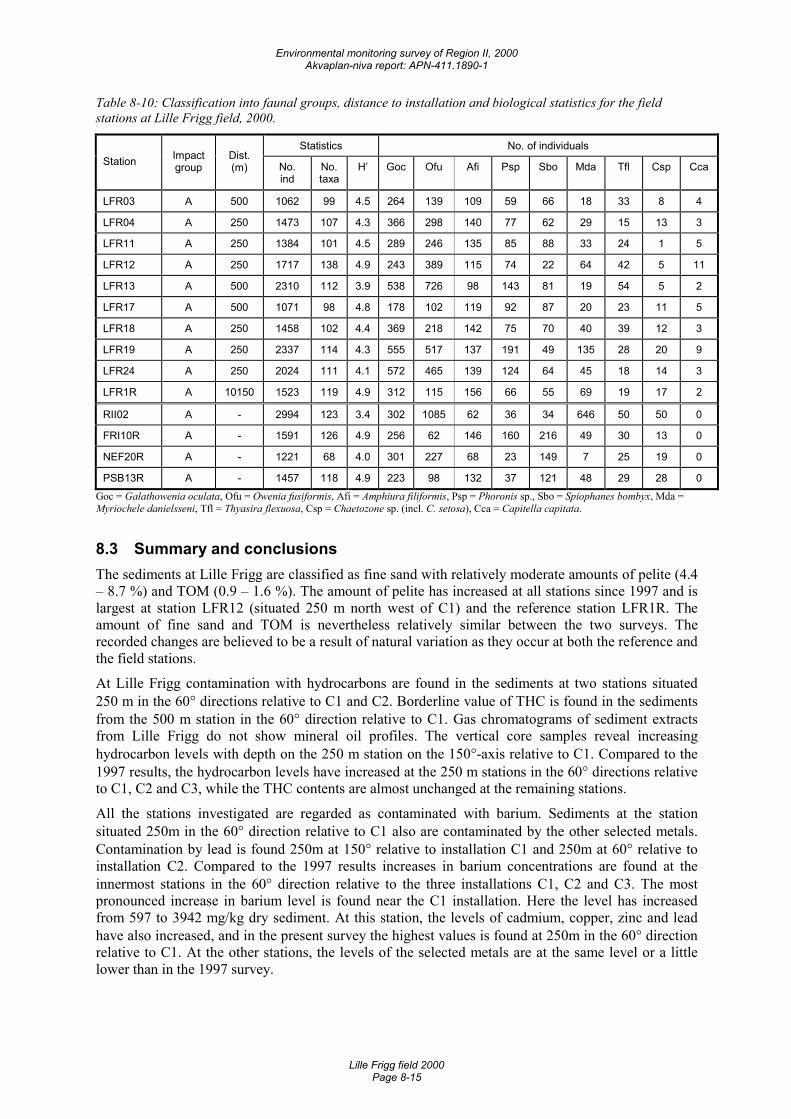
Environmental monitoring survey of Region II, 2000 Akvaplan-niva report: APN-411.1890-1
Lille Frigg field 2000 Page 8-15
Table 8-10: Classification into faunal groups, distance to installation and biological statistics for the field stations at Lille Frigg field, 2000.
Statistics No. of individuals Station Impact
group Dist. (m) No.
ind No. taxa
H’ Goc Ofu Afi Psp Sbo Mda Tfl Csp Cca
LFR03 A 500 1062 99 4.5 264 139 109 59 66 18 33 8 4
LFR04 A 250 1473 107 4.3 366 298 140 77 62 29 15 13 3
LFR11 A 250 1384 101 4.5 289 246 135 85 88 33 24 1 5
LFR12 A 250 1717 138 4.9 243 389 115 74 22 64 42 5 11
LFR13 A 500 2310 112 3.9 538 726 98 143 81 19 54 5 2
LFR17 A 500 1071 98 4.8 178 102 119 92 87 20 23 11 5
LFR18 A 250 1458 102 4.4 369 218 142 75 70 40 39 12 3
LFR19 A 250 2337 114 4.3 555 517 137 191 49 135 28 20 9
LFR24 A 250 2024 111 4.1 572 465 139 124 64 45 18 14 3
LFR1R A 10150 1523 119 4.9 312 115 156 66 55 69 19 17 2
RII02 A - 2994 123 3.4 302 1085 62 36 34 646 50 50 0
FRI10R A - 1591 126 4.9 256 62 146 160 216 49 30 13 0
NEF20R A - 1221 68 4.0 301 227 68 23 149 7 25 19 0
PSB13R A - 1457 118 4.9 223 98 132 37 121 48 29 28 0 Goc = Galathowenia oculata, Ofu = Owenia fusiformis, Afi = Amphiura filiformis, Psp = Phoronis sp., Sbo = Spiophanes bombyx, Mda = Myriochele danielsseni, Tfl = Thyasira flexuosa, Csp = Chaetozone sp. (incl. C. setosa), Cca = Capitella capitata.
8.3 Summary and conclusions The sediments at Lille Frigg are classified as fine sand with relatively moderate amounts of pelite (4.4 – 8.7 %) and TOM (0.9 – 1.6 %). The amount of pelite has increased at all stations since 1997 and is largest at station LFR12 (situated 250 m north west of C1) and the reference station LFR1R. The amount of fine sand and TOM is nevertheless relatively similar between the two surveys. The recorded changes are believed to be a result of natural variation as they occur at both the reference and the field stations.
At Lille Frigg contamination with hydrocarbons are found in the sediments at two stations situated 250 m in the 60° directions relative to C1 and C2. Borderline value of THC is found in the sediments from the 500 m station in the 60° direction relative to C1. Gas chromatograms of sediment extracts from Lille Frigg do not show mineral oil profiles. The vertical core samples reveal increasing hydrocarbon levels with depth on the 250 m station on the 150°-axis relative to C1. Compared to the 1997 results, the hydrocarbon levels have increased at the 250 m stations in the 60° directions relative to C1, C2 and C3, while the THC contents are almost unchanged at the remaining stations.
All the stations investigated are regarded as contaminated with barium. Sediments at the station situated 250m in the 60° direction relative to C1 also are contaminated by the other selected metals. Contamination by lead is found 250m at 150° relative to installation C1 and 250m at 60° relative to installation C2. Compared to the 1997 results increases in barium concentrations are found at the innermost stations in the 60° direction relative to the three installations C1, C2 and C3. The most pronounced increase in barium level is found near the C1 installation. Here the level has increased from 597 to 3942 mg/kg dry sediment. At this station, the levels of cadmium, copper, zinc and lead have also increased, and in the present survey the highest values is found at 250m in the 60° direction relative to C1. At the other stations, the levels of the selected metals are at the same level or a little lower than in the 1997 survey.
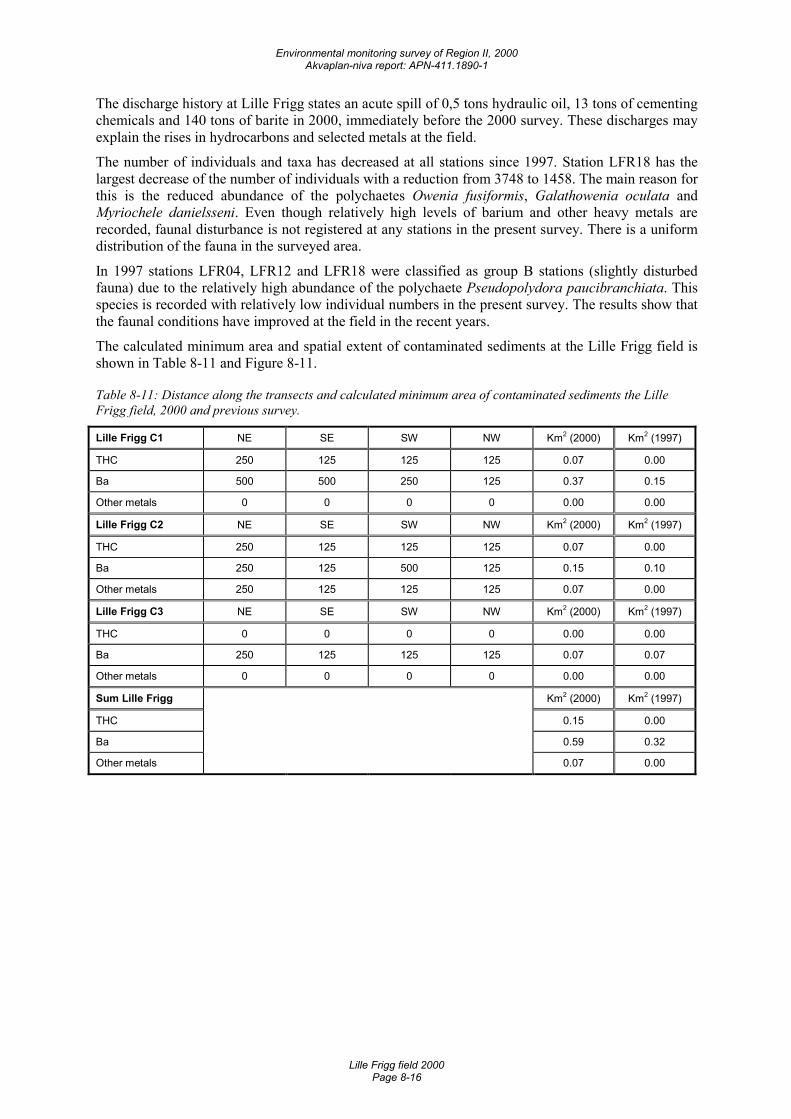
Environmental monitoring survey of Region II, 2000 Akvaplan-niva report: APN-411.1890-1
Lille Frigg field 2000 Page 8-16
The discharge history at Lille Frigg states an acute spill of 0,5 tons hydraulic oil, 13 tons of cementing chemicals and 140 tons of barite in 2000, immediately before the 2000 survey. These discharges may explain the rises in hydrocarbons and selected metals at the field.
The number of individuals and taxa has decreased at all stations since 1997. Station LFR18 has the largest decrease of the number of individuals with a reduction from 3748 to 1458. The main reason for this is the reduced abundance of the polychaetes Owenia fusiformis, Galathowenia oculata and Myriochele danielsseni. Even though relatively high levels of barium and other heavy metals are recorded, faunal disturbance is not registered at any stations in the present survey. There is a uniform distribution of the fauna in the surveyed area.
In 1997 stations LFR04, LFR12 and LFR18 were classified as group B stations (slightly disturbed fauna) due to the relatively high abundance of the polychaete Pseudopolydora paucibranchiata. This species is recorded with relatively low individual numbers in the present survey. The results show that the faunal conditions have improved at the field in the recent years.
The calculated minimum area and spatial extent of contaminated sediments at the Lille Frigg field is shown in Table 8-11 and Figure 8-11.
Table 8-11: Distance along the transects and calculated minimum area of contaminated sediments the Lille Frigg field, 2000 and previous survey.
Lille Frigg C1 NE SE SW NW Km2 (2000) Km2 (1997)
THC 250 125 125 125 0.07 0.00
Ba 500 500 250 125 0.37 0.15
Other metals 0 0 0 0 0.00 0.00
Lille Frigg C2 NE SE SW NW Km2 (2000) Km2 (1997)
THC 250 125 125 125 0.07 0.00
Ba 250 125 500 125 0.15 0.10
Other metals 250 125 125 125 0.07 0.00
Lille Frigg C3 NE SE SW NW Km2 (2000) Km2 (1997)
THC 0 0 0 0 0.00 0.00
Ba 250 125 125 125 0.07 0.07
Other metals 0 0 0 0 0.00 0.00
Sum Lille Frigg Km2 (2000) Km2 (1997)
THC 0.15 0.00
Ba 0.59 0.32
Other metals 0.07 0.00
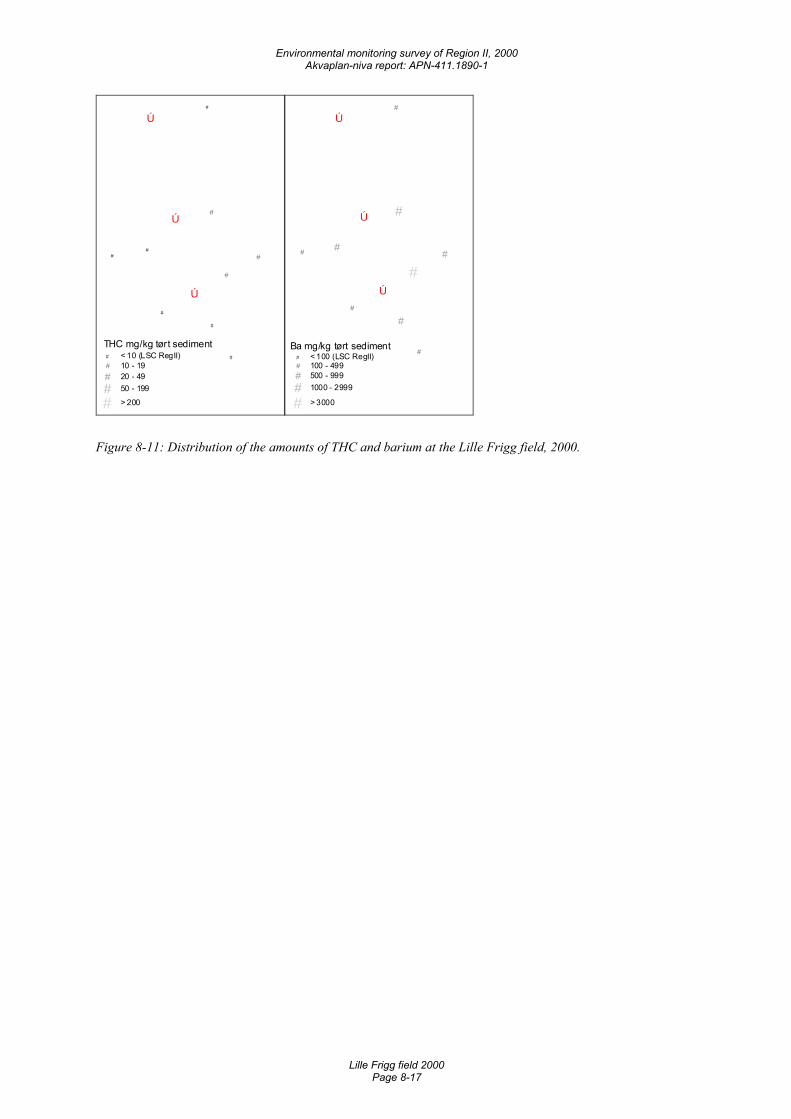
Environmental monitoring survey of Region II, 2000 Akvaplan-niva report: APN-411.1890-1
Lille Frigg field 2000 Page 8-17
Ú
Ú
Ú
#
#
#
#
###
#
#
THC mg/kg tørt sediment# < 10 (LSC RegII)# 10 - 19# 20 - 49
# 50 - 199
# > 200
Ú
Ú
Ú
#
#
#
#
###
#
#
Ba mg/kg tørt sediment# < 100 (LSC RegII)# 100 - 499# 500 - 999
# 1000 - 2999
# > 3000
Figure 8-11: Distribution of the amounts of THC and barium at the Lille Frigg field, 2000.
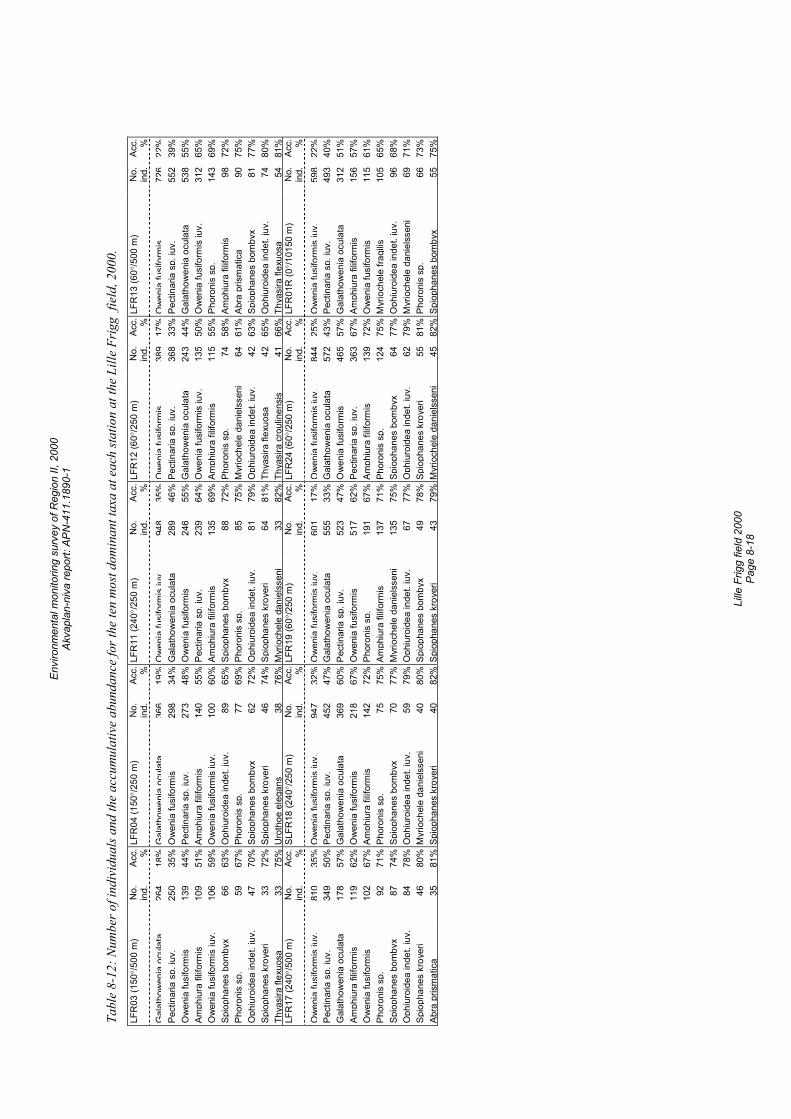
Envi
ronm
enta
l mon
itorin
g su
rvey
of R
egio
n II,
200
0 Ak
vapl
an-n
iva
repo
rt: A
PN-4
11.1
890-
1
Li
lle F
rigg
field
200
0 Pa
ge 8
-18
Tabl
e 8-
12: N
umbe
r of i
ndiv
idua
ls a
nd th
e ac
cum
ulat
ive
abun
danc
e fo
r the
ten
mos
t dom
inan
t tax
a at
eac
h sta
tion
at th
e Li
lle F
rigg
fiel
d, 2
000.
LF
R03
(150
°/50
0 m
) N
o.
ind.
Ac
c.
% LF
R04
(150
°/25
0 m
) N
o.
ind.
Acc.
%
LFR
11 (2
40°/
250
m)
No.
in
d.Ac
c.
% LF
R12
(60°
/250
m)
No.
in
d.Ac
c.
%LF
R13
(60°
/500
m)
No.
in
d.Ac
c.
%G
alat
how
enia
ocul
ata
264
18%
Gal
atho
wen
iaoc
ulat
a36
619
%O
wen
iafu
sifo
rmis
juv.
948
35%
Ow
enia
fusi
form
is38
917
%O
wen
iafu
sifo
rmis
726
22%
Pect
inar
ia s
p. ju
v.
250
35%
Ow
enia
fusi
form
is29
834
%G
alat
how
enia
ocu
lata
289
46%
Pec
tinar
ia s
p. ju
v.36
833
%Pe
ctin
aria
sp.
juv.
552
39%
Ow
enia
fusi
form
is
139
44%
Pec
tinar
ia s
p. ju
v.27
348
%O
wen
ia fu
sifo
rmis
246
55%
Gal
atho
wen
ia o
cula
ta24
344
%G
alat
how
enia
ocu
lata
538
55%
Amph
iura
filif
orm
is
109
51%
Am
phiu
ra fi
lifor
mis
140
55%
Pect
inar
ia s
p. ju
v.23
964
% O
wen
ia fu
sifo
rmis
juv.
135
50%
Ow
enia
fusi
form
is ju
v.31
265
%O
wen
ia fu
sifo
rmis
juv.
10
6 59
% O
wen
ia fu
sifo
rmis
juv.
100
60%
Amph
iura
filif
orm
is13
569
% A
mph
iura
filif
orm
is11
555
%Ph
oron
is s
p.14
369
%Sp
ioph
anes
bom
byx
66
63%
Oph
iuro
idea
inde
t. ju
v.89
65%
Spio
phan
es b
omby
x88
72%
Pho
roni
s sp
.74
58%
Amph
iura
filif
orm
is98
72%
Phor
onis
sp.
59
67
% P
horo
nis
sp.
7769
%Ph
oron
is s
p.85
75%
Myr
ioch
ele
dani
elss
eni
6461
%Ab
ra p
rism
atic
a90
75%
Oph
iuro
idea
inde
t. ju
v.
47
70%
Spi
opha
nes
bom
byx
6272
%O
phiu
roid
ea in
det.
juv.
8179
% O
phiu
roid
ea in
det.
juv.
4263
%Sp
ioph
anes
bom
byx
8177
%Sp
ioph
anes
kro
yeri
33
72%
Spi
opha
nes
kroy
eri
4674
%Sp
ioph
anes
kro
yeri
6481
% T
hyas
ira fl
exuo
sa42
65%
Oph
iuro
idea
inde
t. ju
v.74
80%
Thya
sira
flex
uosa
33
75
% U
roth
oe e
lega
ns38
76%
Myr
ioch
ele
dani
elss
eni
3382
% T
hyas
ira c
roul
inen
sis
4166
%Th
yasi
ra fl
exuo
sa54
81%
LFR
17 (2
40°/
500
m)
No.
in
d.
Acc.
%
SLFR
18 (2
40°/
250
m)
No.
in
d.Ac
c.
%LF
R19
(60°
/250
m)
No.
in
d.Ac
c.
% LF
R24
(60°
/250
m)
No.
in
d.Ac
c.
%LF
R01
R (0
°/101
50 m
) N
o.
ind.
Acc.
%
Ow
enia
fusi
form
isju
v.81
035
%O
wen
iafu
sifo
rmis
juv.
947
32%
Ow
enia
fusi
form
isju
v.60
117
%O
wen
iafu
sifo
rmis
juv.
844
25%
Ow
enia
fusi
form
isju
v.59
822
%Pe
ctin
aria
sp.
juv.
34
9 50
% P
ectin
aria
sp.
juv.
452
47%
Gal
atho
wen
ia o
cula
ta55
533
% G
alat
how
enia
ocu
lata
572
43%
Pect
inar
ia s
p. ju
v.49
340
%G
alat
how
enia
ocu
lata
17
8 57
% G
alat
how
enia
ocu
lata
369
60%
Pect
inar
ia s
p. ju
v.52
347
% O
wen
ia fu
sifo
rmis
465
57%
Gal
atho
wen
ia o
cula
ta31
251
%Am
phiu
ra fi
lifor
mis
11
9 62
% O
wen
ia fu
sifo
rmis
218
67%
Ow
enia
fusi
form
is51
762
% P
ectin
aria
sp.
juv.
363
67%
Amph
iura
filif
orm
is15
657
%O
wen
ia fu
sifo
rmis
10
2 67
% A
mph
iura
filif
orm
is14
272
%Ph
oron
is s
p.19
167
% A
mph
iura
filif
orm
is13
972
%O
wen
ia fu
sifo
rmis
115
61%
Phor
onis
sp.
92
71
% P
horo
nis
sp.
7575
%Am
phiu
ra fi
lifor
mis
137
71%
Pho
roni
s sp
.12
475
%M
yrio
chel
e fra
gilis
105
65%
Spio
phan
es b
omby
x 87
74
% S
piop
hane
s bo
mby
x70
77%
Myr
ioch
ele
dani
elss
eni
135
75%
Spi
opha
nes
bom
byx
6477
%O
phiu
roid
ea in
det.
juv.
9668
%O
phiu
roid
ea in
det.
juv.
84
78
% O
phiu
roid
ea in
det.
juv.
5979
%O
phiu
roid
ea in
det.
juv.
6777
% O
phiu
roid
ea in
det.
juv.
6279
%M
yrio
chel
e da
niel
ssen
i69
71%
Spio
phan
es k
roye
ri 46
80
% M
yrio
chel
e da
niel
ssen
i40
80%
Spio
phan
es b
omby
x49
78%
Spi
opha
nes
kroy
eri
5581
%Ph
oron
is s
p.66
73%
Abra
pris
mat
ica
35
81%
Spi
opha
nes
kroy
eri
4082
%Sp
ioph
anes
kro
yeri
4379
% M
yrio
chel
e da
niel
ssen
i45
82%
Spio
phan
es b
omby
x55
75%
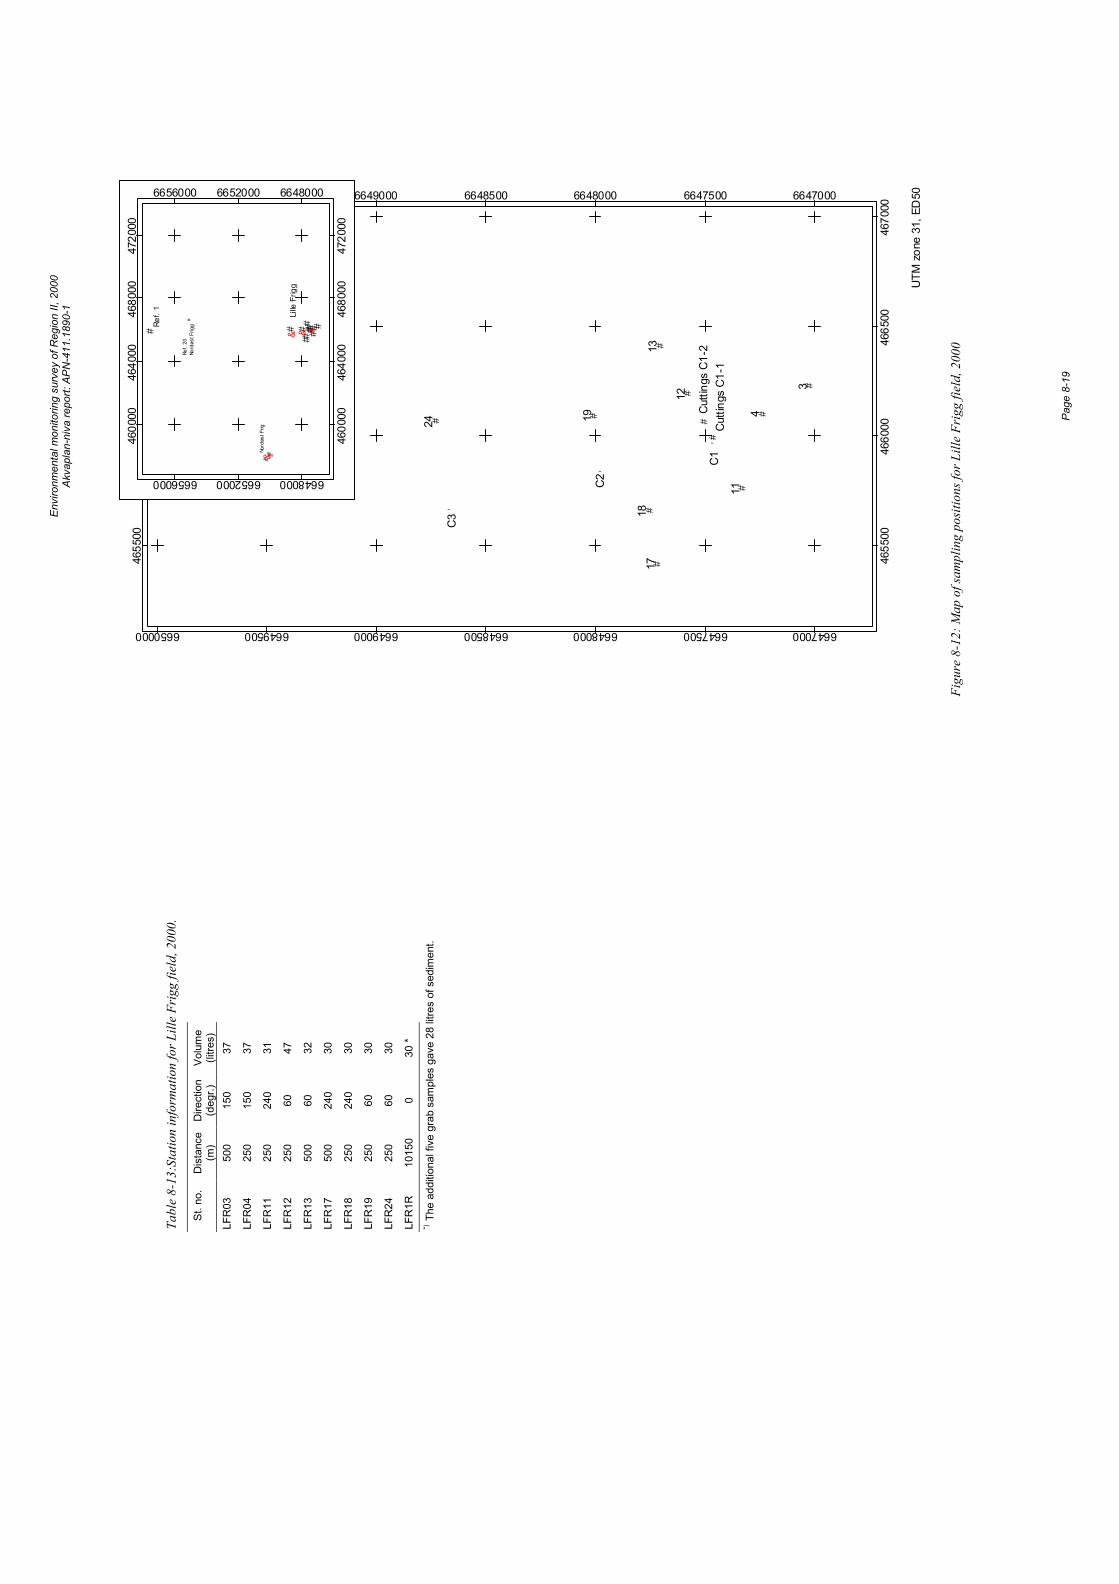
Envi
ronm
enta
l mon
itorin
g su
rvey
of R
egio
n II,
200
0 Ak
vapl
an-n
iva
repo
rt: A
PN-4
11.1
890-
1
Pa
ge 8
-19
#
#
#
#
#
##
##
##
'
'
'
3
4
11
12
1317
18
1924 Cut
tings
C1-
1C
uttin
gs C
1-2
C3
C2
C1
4655
00
4655
00
4660
00
4660
00
4665
00
4665
00
4670
00
4670
00
6647000
6647000
6647500
6647500
6648000
6648000
6648500
6648500
6649000
6649000
6649500
6649500
6650000
6650000
UTM
zon
e 31
, ED
50
#
# ##
#
#
###
## ###
####
&
&&&
Ref.
1
Lille
Frig
g
Nord
øst F
rig
Ref.
20No
rdøs
t Frig
g
4600
00
4600
00
4640
00
4640
00
4680
00
4680
00
4720
00
4720
00
6648000
6648000
6652000
6652000
6656000
6656000
Figu
re 8
-12:
Map
of s
ampl
ing
posi
tions
for L
ille
Frig
g fie
ld, 2
000
Tabl
e 8-
13:S
tatio
n in
form
atio
n fo
r Lill
e Fr
igg
field
, 200
0.
St. n
o.
Dis
tanc
e (m
) D
irect
ion
(deg
r.)
Volu
me
(litre
s)
LFR
03
500
150
37
LFR
04
250
150
37
LFR
11
250
240
31
LFR
12
250
60
47
LFR
13
500
60
32
LFR
17
500
240
30
LFR
18
250
240
30
LFR
19
250
60
30
LFR
24
250
60
30
LFR
1R
1015
0 0
30 *
*) Th
e ad
ditio
nal f
ive
grab
sam
ples
gav
e 28
litre
s of
sed
imen
t.

Envi
ronm
enta
l mon
itorin
g su
rvey
of R
egio
n II,
200
0 Ak
vapl
an-n
iva
repo
rt: A
PN-4
11.1
890-
1
Pa
ge 8
-20
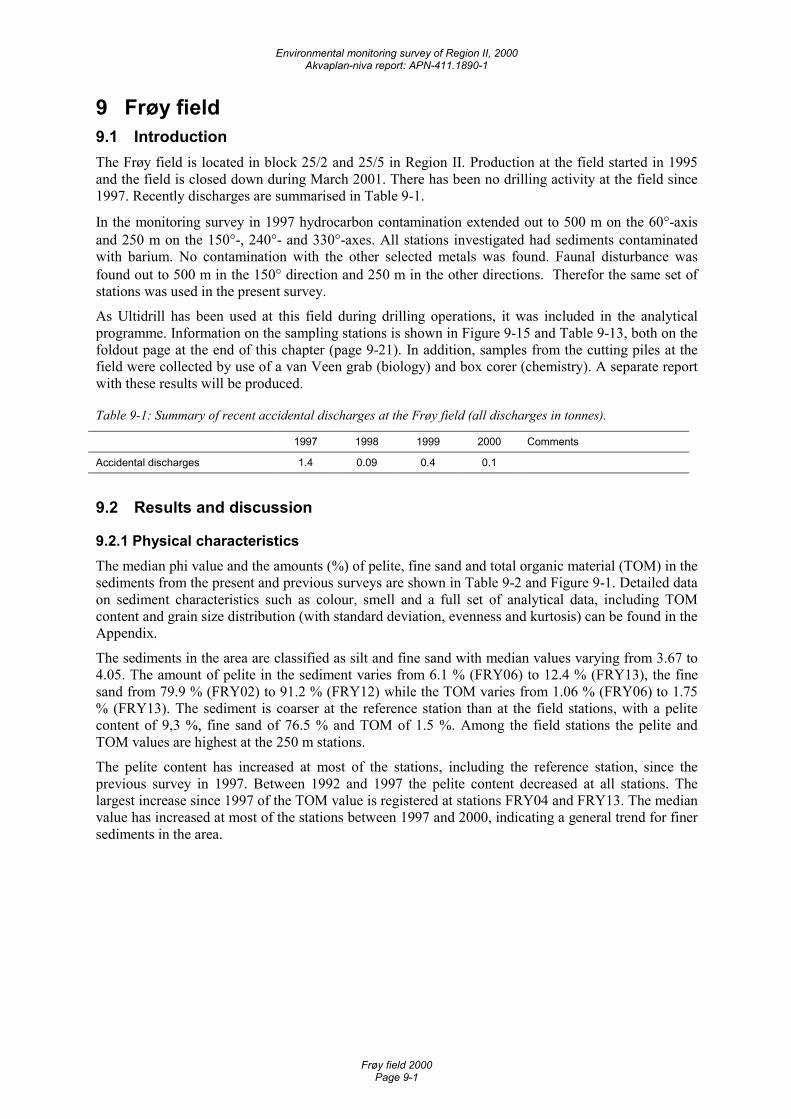
Environmental monitoring survey of Region II, 2000 Akvaplan-niva report: APN-411.1890-1
Frøy field 2000 Page 9-1
9 Frøy field 9.1 Introduction The Frøy field is located in block 25/2 and 25/5 in Region II. Production at the field started in 1995 and the field is closed down during March 2001. There has been no drilling activity at the field since 1997. Recently discharges are summarised in Table 9-1.
In the monitoring survey in 1997 hydrocarbon contamination extended out to 500 m on the 60°-axis and 250 m on the 150°-, 240°- and 330°-axes. All stations investigated had sediments contaminated with barium. No contamination with the other selected metals was found. Faunal disturbance was found out to 500 m in the 150° direction and 250 m in the other directions. Therefor the same set of stations was used in the present survey.
As Ultidrill has been used at this field during drilling operations, it was included in the analytical programme. Information on the sampling stations is shown in Figure 9-15 and Table 9-13, both on the foldout page at the end of this chapter (page 9-21). In addition, samples from the cutting piles at the field were collected by use of a van Veen grab (biology) and box corer (chemistry). A separate report with these results will be produced.
Table 9-1: Summary of recent accidental discharges at the Frøy field (all discharges in tonnes).
1997 1998 1999 2000 Comments
Accidental discharges 1.4 0.09 0.4 0.1
9.2 Results and discussion
9.2.1 Physical characteristics The median phi value and the amounts (%) of pelite, fine sand and total organic material (TOM) in the sediments from the present and previous surveys are shown in Table 9-2 and Figure 9-1. Detailed data on sediment characteristics such as colour, smell and a full set of analytical data, including TOM content and grain size distribution (with standard deviation, evenness and kurtosis) can be found in the Appendix.
The sediments in the area are classified as silt and fine sand with median values varying from 3.67 to 4.05. The amount of pelite in the sediment varies from 6.1 % (FRY06) to 12.4 % (FRY13), the fine sand from 79.9 % (FRY02) to 91.2 % (FRY12) while the TOM varies from 1.06 % (FRY06) to 1.75 % (FRY13). The sediment is coarser at the reference station than at the field stations, with a pelite content of 9,3 %, fine sand of 76.5 % and TOM of 1.5 %. Among the field stations the pelite and TOM values are highest at the 250 m stations.
The pelite content has increased at most of the stations, including the reference station, since the previous survey in 1997. Between 1992 and 1997 the pelite content decreased at all stations. The largest increase since 1997 of the TOM value is registered at stations FRY04 and FRY13. The median value has increased at most of the stations between 1997 and 2000, indicating a general trend for finer sediments in the area.
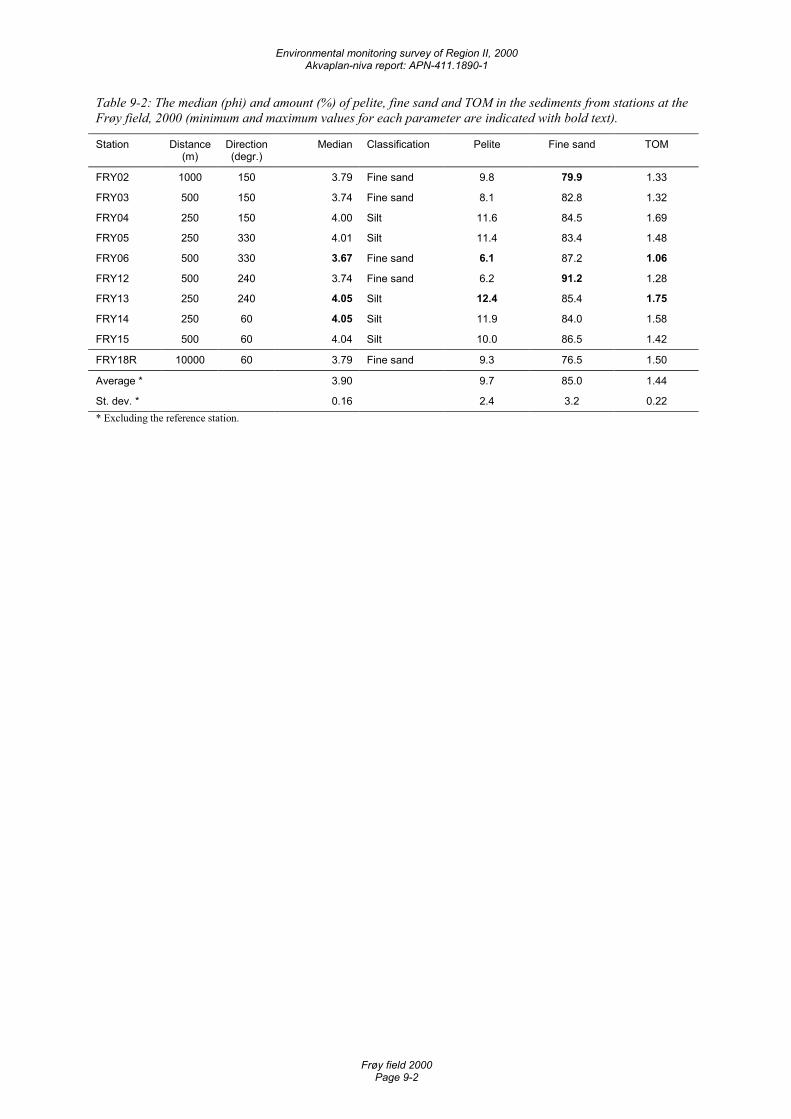
Environmental monitoring survey of Region II, 2000 Akvaplan-niva report: APN-411.1890-1
Frøy field 2000 Page 9-2
Table 9-2: The median (phi) and amount (%) of pelite, fine sand and TOM in the sediments from stations at the Frøy field, 2000 (minimum and maximum values for each parameter are indicated with bold text).
Station Distance (m)
Direction (degr.)
Median Classification Pelite Fine sand TOM
FRY02 1000 150 3.79 Fine sand 9.8 79.9 1.33
FRY03 500 150 3.74 Fine sand 8.1 82.8 1.32
FRY04 250 150 4.00 Silt 11.6 84.5 1.69
FRY05 250 330 4.01 Silt 11.4 83.4 1.48
FRY06 500 330 3.67 Fine sand 6.1 87.2 1.06
FRY12 500 240 3.74 Fine sand 6.2 91.2 1.28
FRY13 250 240 4.05 Silt 12.4 85.4 1.75
FRY14 250 60 4.05 Silt 11.9 84.0 1.58
FRY15 500 60 4.04 Silt 10.0 86.5 1.42
FRY18R 10000 60 3.79 Fine sand 9.3 76.5 1.50
Average * 3.90 9.7 85.0 1.44
St. dev. * 0.16 2.4 3.2 0.22 * Excluding the reference station.
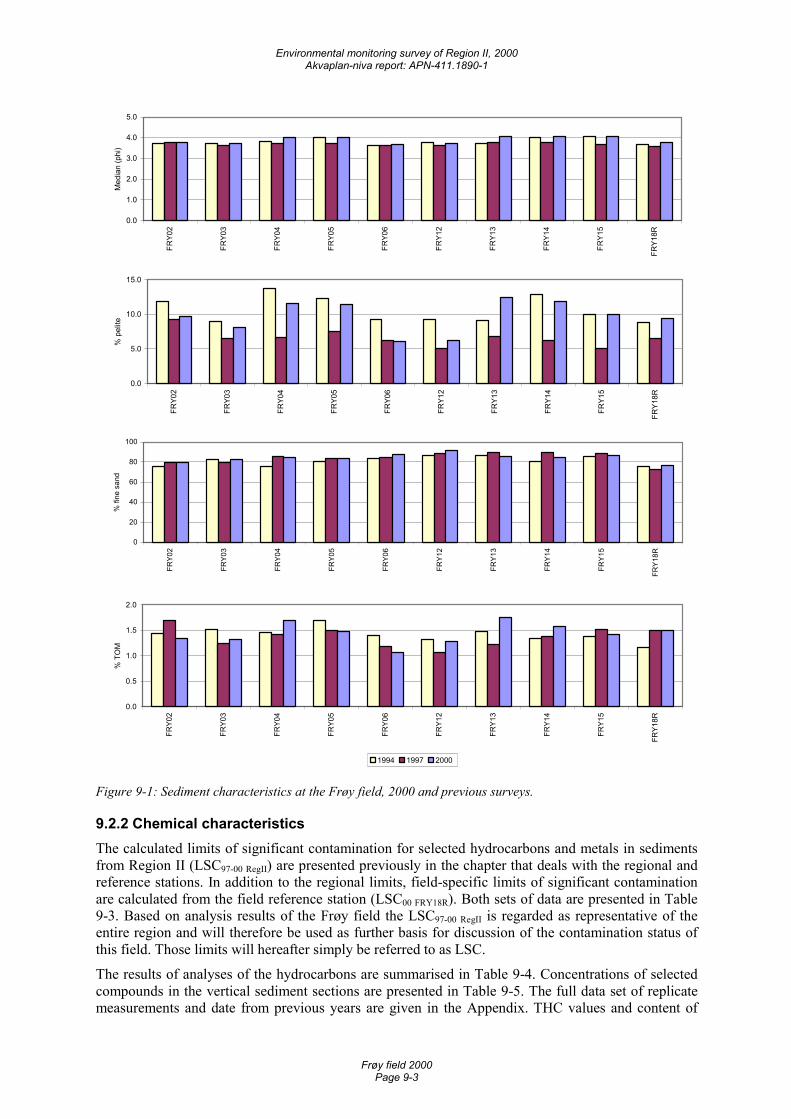
Environmental monitoring survey of Region II, 2000 Akvaplan-niva report: APN-411.1890-1
Frøy field 2000 Page 9-3
0.0
1.0
2.0
3.0
4.0
5.0
FRY0
2
FRY0
3
FRY0
4
FRY0
5
FRY0
6
FRY1
2
FRY1
3
FRY1
4
FRY1
5
FRY1
8R
Med
ian
(phi
)
0.0
5.0
10.0
15.0
FRY0
2
FRY0
3
FRY0
4
FRY0
5
FRY0
6
FRY1
2
FRY1
3
FRY1
4
FRY1
5
FRY1
8R
% p
elite
0
20
40
60
80
100
FRY0
2
FRY0
3
FRY0
4
FRY0
5
FRY0
6
FRY1
2
FRY1
3
FRY1
4
FRY1
5
FRY1
8R
% fi
ne s
and
0.0
0.5
1.0
1.5
2.0
FRY0
2
FRY0
3
FRY0
4
FRY0
5
FRY0
6
FRY1
2
FRY1
3
FRY1
4
FRY1
5
FRY1
8R
% T
OM
1994 1997 2000
Figure 9-1: Sediment characteristics at the Frøy field, 2000 and previous surveys.
9.2.2 Chemical characteristics The calculated limits of significant contamination for selected hydrocarbons and metals in sediments from Region II (LSC97-00 RegII) are presented previously in the chapter that deals with the regional and reference stations. In addition to the regional limits, field-specific limits of significant contamination are calculated from the field reference station (LSC00 FRY18R). Both sets of data are presented in Table 9-3. Based on analysis results of the Frøy field the LSC97-00 RegII is regarded as representative of the entire region and will therefore be used as further basis for discussion of the contamination status of this field. Those limits will hereafter simply be referred to as LSC.
The results of analyses of the hydrocarbons are summarised in Table 9-4. Concentrations of selected compounds in the vertical sediment sections are presented in Table 9-5. The full data set of replicate measurements and date from previous years are given in the Appendix. THC values and content of
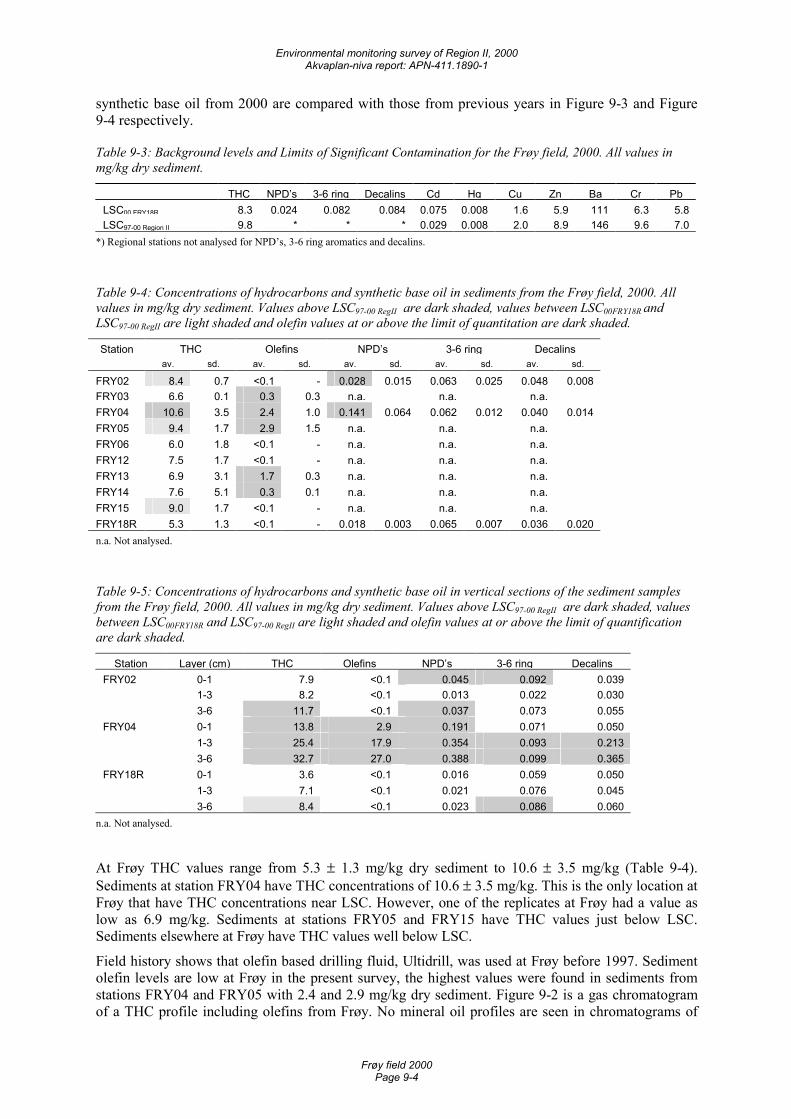
Environmental monitoring survey of Region II, 2000 Akvaplan-niva report: APN-411.1890-1
Frøy field 2000 Page 9-4
synthetic base oil from 2000 are compared with those from previous years in Figure 9-3 and Figure 9-4 respectively.
Table 9-3: Background levels and Limits of Significant Contamination for the Frøy field, 2000. All values in mg/kg dry sediment.
THC NPD’s 3-6 ring Decalins Cd Hg Cu Zn Ba Cr PbLSC00 FRY18R 8.3 0.024 0.082 0.084 0.075 0.008 1.6 5.9 111 6.3 5.8LSC97-00 Region II 9.8 * * * 0.029 0.008 2.0 8.9 146 9.6 7.0
*) Regional stations not analysed for NPD’s, 3-6 ring aromatics and decalins.
Table 9-4: Concentrations of hydrocarbons and synthetic base oil in sediments from the Frøy field, 2000. All values in mg/kg dry sediment. Values above LSC97-00 RegII are dark shaded, values between LSC00FRY18R and LSC97-00 RegII are light shaded and olefin values at or above the limit of quantitation are dark shaded.
Station THC Olefins NPD’s 3-6 ring Decalins av. sd. av. sd. av. sd. av. sd. av. sd.
FRY02 8.4 0.7 <0.1 - 0.028 0.015 0.063 0.025 0.048 0.008 FRY03 6.6 0.1 0.3 0.3 n.a. n.a. n.a. FRY04 10.6 3.5 2.4 1.0 0.141 0.064 0.062 0.012 0.040 0.014 FRY05 9.4 1.7 2.9 1.5 n.a. n.a. n.a. FRY06 6.0 1.8 <0.1 - n.a. n.a. n.a. FRY12 7.5 1.7 <0.1 - n.a. n.a. n.a. FRY13 6.9 3.1 1.7 0.3 n.a. n.a. n.a. FRY14 7.6 5.1 0.3 0.1 n.a. n.a. n.a. FRY15 9.0 1.7 <0.1 - n.a. n.a. n.a. FRY18R 5.3 1.3 <0.1 - 0.018 0.003 0.065 0.007 0.036 0.020 n.a. Not analysed.
Table 9-5: Concentrations of hydrocarbons and synthetic base oil in vertical sections of the sediment samples from the Frøy field, 2000. All values in mg/kg dry sediment. Values above LSC97-00 RegII are dark shaded, values between LSC00FRY18R and LSC97-00 RegII are light shaded and olefin values at or above the limit of quantification are dark shaded.
Station Layer (cm) THC Olefins NPD’s 3-6 ring Decalins FRY02 0-1 7.9 <0.1 0.045 0.092 0.039 1-3 8.2 <0.1 0.013 0.022 0.030 3-6 11.7 <0.1 0.037 0.073 0.055 FRY04 0-1 13.8 2.9 0.191 0.071 0.050 1-3 25.4 17.9 0.354 0.093 0.213 3-6 32.7 27.0 0.388 0.099 0.365 FRY18R 0-1 3.6 <0.1 0.016 0.059 0.050 1-3 7.1 <0.1 0.021 0.076 0.045 3-6 8.4 <0.1 0.023 0.086 0.060
n.a. Not analysed.
At Frøy THC values range from 5.3 ± 1.3 mg/kg dry sediment to 10.6 ± 3.5 mg/kg (Table 9-4). Sediments at station FRY04 have THC concentrations of 10.6 ± 3.5 mg/kg. This is the only location at Frøy that have THC concentrations near LSC. However, one of the replicates at Frøy had a value as low as 6.9 mg/kg. Sediments at stations FRY05 and FRY15 have THC values just below LSC. Sediments elsewhere at Frøy have THC values well below LSC.
Field history shows that olefin based drilling fluid, Ultidrill, was used at Frøy before 1997. Sediment olefin levels are low at Frøy in the present survey, the highest values were found in sediments from stations FRY04 and FRY05 with 2.4 and 2.9 mg/kg dry sediment. Figure 9-2 is a gas chromatogram of a THC profile including olefins from Frøy. No mineral oil profiles are seen in chromatograms of
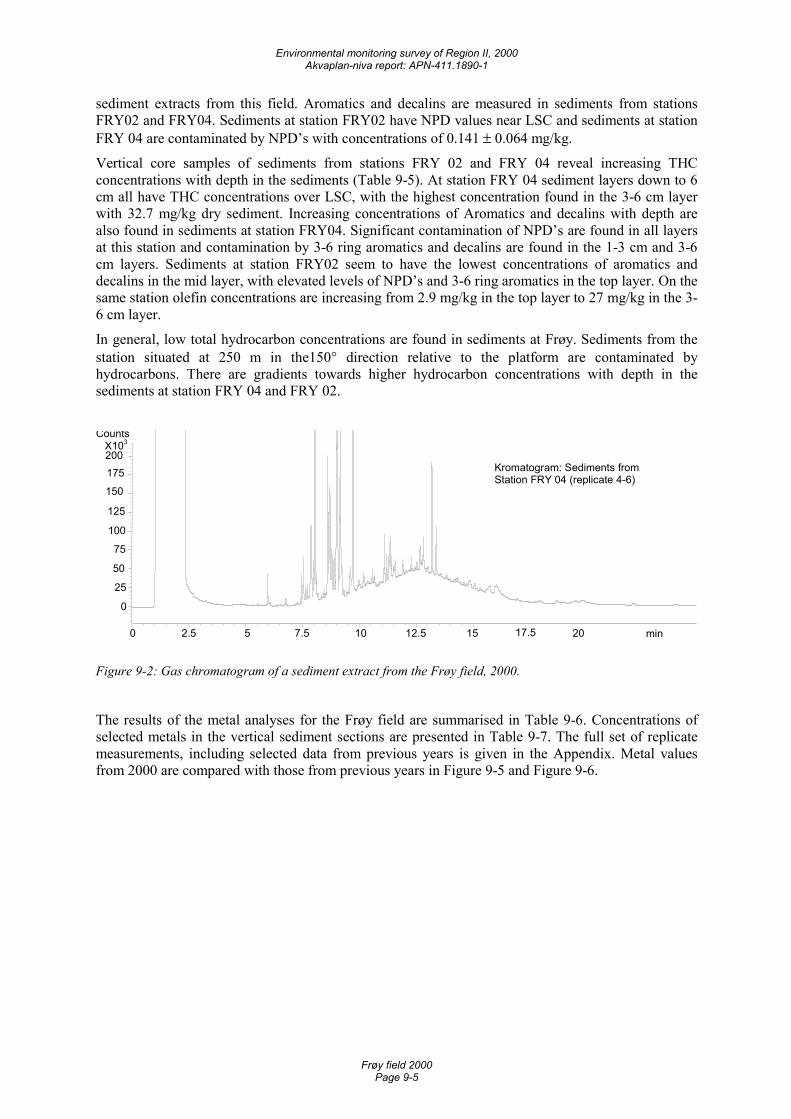
Environmental monitoring survey of Region II, 2000 Akvaplan-niva report: APN-411.1890-1
Frøy field 2000 Page 9-5
sediment extracts from this field. Aromatics and decalins are measured in sediments from stations FRY02 and FRY04. Sediments at station FRY02 have NPD values near LSC and sediments at station FRY 04 are contaminated by NPD’s with concentrations of 0.141 ± 0.064 mg/kg.
Vertical core samples of sediments from stations FRY 02 and FRY 04 reveal increasing THC concentrations with depth in the sediments (Table 9-5). At station FRY 04 sediment layers down to 6 cm all have THC concentrations over LSC, with the highest concentration found in the 3-6 cm layer with 32.7 mg/kg dry sediment. Increasing concentrations of Aromatics and decalins with depth are also found in sediments at station FRY04. Significant contamination of NPD’s are found in all layers at this station and contamination by 3-6 ring aromatics and decalins are found in the 1-3 cm and 3-6 cm layers. Sediments at station FRY02 seem to have the lowest concentrations of aromatics and decalins in the mid layer, with elevated levels of NPD’s and 3-6 ring aromatics in the top layer. On the same station olefin concentrations are increasing from 2.9 mg/kg in the top layer to 27 mg/kg in the 3-6 cm layer.
In general, low total hydrocarbon concentrations are found in sediments at Frøy. Sediments from the station situated at 250 m in the150° direction relative to the platform are contaminated by hydrocarbons. There are gradients towards higher hydrocarbon concentrations with depth in the sediments at station FRY 04 and FRY 02.
min 0 2.5 5 7.5 10 12.5 15 17.5 20
Counts X103
0
25
50
75
100
125
150
175 200
Kromatogram: Sediments from Station FRY 04 (replicate 4-6)
Figure 9-2: Gas chromatogram of a sediment extract from the Frøy field, 2000.
The results of the metal analyses for the Frøy field are summarised in Table 9-6. Concentrations of selected metals in the vertical sediment sections are presented in Table 9-7. The full set of replicate measurements, including selected data from previous years is given in the Appendix. Metal values from 2000 are compared with those from previous years in Figure 9-5 and Figure 9-6.
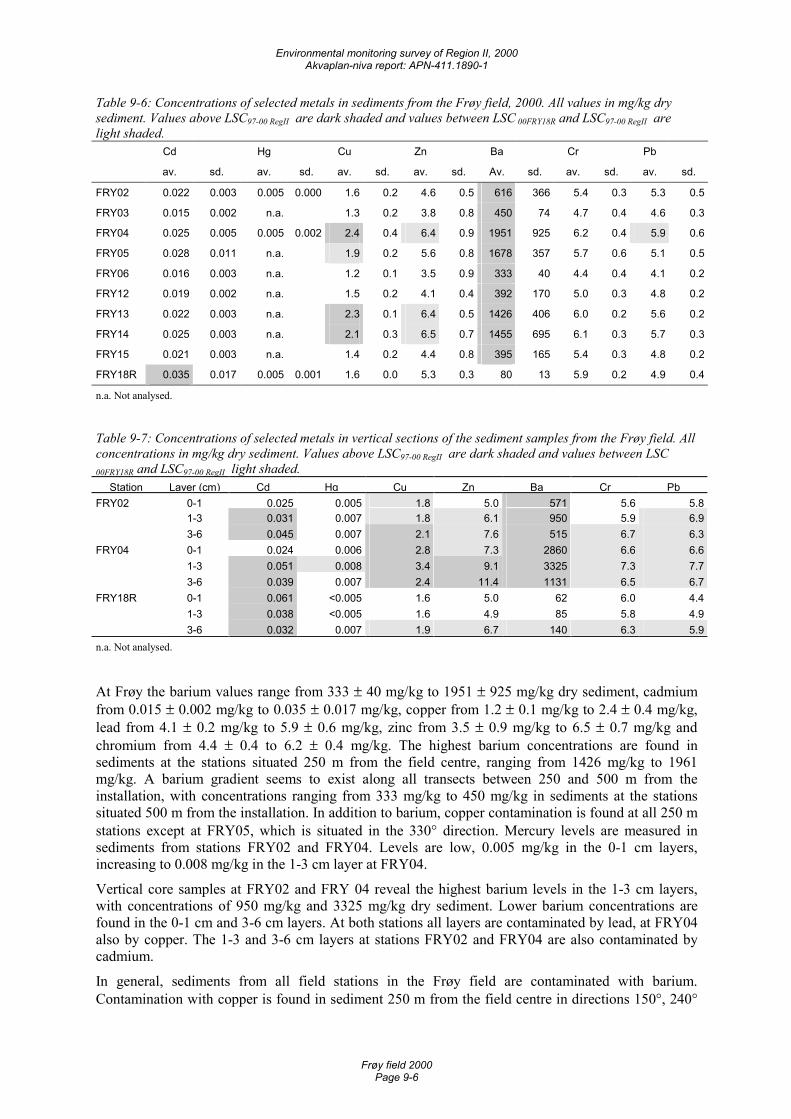
Environmental monitoring survey of Region II, 2000 Akvaplan-niva report: APN-411.1890-1
Frøy field 2000 Page 9-6
Table 9-6: Concentrations of selected metals in sediments from the Frøy field, 2000. All values in mg/kg dry sediment. Values above LSC97-00 RegII are dark shaded and values between LSC 00FRY18R and LSC97-00 RegII are light shaded.
Cd Hg Cu Zn Ba Cr Pb
av. sd. av. sd. av. sd. av. sd. Av. sd. av. sd. av. sd.
FRY02 0.022 0.003 0.005 0.000 1.6 0.2 4.6 0.5 616 366 5.4 0.3 5.3 0.5
FRY03 0.015 0.002 n.a. 1.3 0.2 3.8 0.8 450 74 4.7 0.4 4.6 0.3
FRY04 0.025 0.005 0.005 0.002 2.4 0.4 6.4 0.9 1951 925 6.2 0.4 5.9 0.6
FRY05 0.028 0.011 n.a. 1.9 0.2 5.6 0.8 1678 357 5.7 0.6 5.1 0.5
FRY06 0.016 0.003 n.a. 1.2 0.1 3.5 0.9 333 40 4.4 0.4 4.1 0.2
FRY12 0.019 0.002 n.a. 1.5 0.2 4.1 0.4 392 170 5.0 0.3 4.8 0.2
FRY13 0.022 0.003 n.a. 2.3 0.1 6.4 0.5 1426 406 6.0 0.2 5.6 0.2
FRY14 0.025 0.003 n.a. 2.1 0.3 6.5 0.7 1455 695 6.1 0.3 5.7 0.3
FRY15 0.021 0.003 n.a. 1.4 0.2 4.4 0.8 395 165 5.4 0.3 4.8 0.2
FRY18R 0.035 0.017 0.005 0.001 1.6 0.0 5.3 0.3 80 13 5.9 0.2 4.9 0.4
n.a. Not analysed.
Table 9-7: Concentrations of selected metals in vertical sections of the sediment samples from the Frøy field. All concentrations in mg/kg dry sediment. Values above LSC97-00 RegII are dark shaded and values between LSC
00FRY18R and LSC97-00 RegII light shaded. Station Layer (cm) Cd Hg Cu Zn Ba Cr Pb
FRY02 0-1 0.025 0.005 1.8 5.0 571 5.6 5.8 1-3 0.031 0.007 1.8 6.1 950 5.9 6.9 3-6 0.045 0.007 2.1 7.6 515 6.7 6.3FRY04 0-1 0.024 0.006 2.8 7.3 2860 6.6 6.6 1-3 0.051 0.008 3.4 9.1 3325 7.3 7.7 3-6 0.039 0.007 2.4 11.4 1131 6.5 6.7FRY18R 0-1 0.061 <0.005 1.6 5.0 62 6.0 4.4 1-3 0.038 <0.005 1.6 4.9 85 5.8 4.9 3-6 0.032 0.007 1.9 6.7 140 6.3 5.9n.a. Not analysed.
At Frøy the barium values range from 333 ± 40 mg/kg to 1951 ± 925 mg/kg dry sediment, cadmium from 0.015 ± 0.002 mg/kg to 0.035 ± 0.017 mg/kg, copper from 1.2 ± 0.1 mg/kg to 2.4 ± 0.4 mg/kg, lead from 4.1 ± 0.2 mg/kg to 5.9 ± 0.6 mg/kg, zinc from 3.5 ± 0.9 mg/kg to 6.5 ± 0.7 mg/kg and chromium from 4.4 ± 0.4 to 6.2 ± 0.4 mg/kg. The highest barium concentrations are found in sediments at the stations situated 250 m from the field centre, ranging from 1426 mg/kg to 1961 mg/kg. A barium gradient seems to exist along all transects between 250 and 500 m from the installation, with concentrations ranging from 333 mg/kg to 450 mg/kg in sediments at the stations situated 500 m from the installation. In addition to barium, copper contamination is found at all 250 m stations except at FRY05, which is situated in the 330° direction. Mercury levels are measured in sediments from stations FRY02 and FRY04. Levels are low, 0.005 mg/kg in the 0-1 cm layers, increasing to 0.008 mg/kg in the 1-3 cm layer at FRY04.
Vertical core samples at FRY02 and FRY 04 reveal the highest barium levels in the 1-3 cm layers, with concentrations of 950 mg/kg and 3325 mg/kg dry sediment. Lower barium concentrations are found in the 0-1 cm and 3-6 cm layers. At both stations all layers are contaminated by lead, at FRY04 also by copper. The 1-3 and 3-6 cm layers at stations FRY02 and FRY04 are also contaminated by cadmium.
In general, sediments from all field stations in the Frøy field are contaminated with barium. Contamination with copper is found in sediment 250 m from the field centre in directions 150°, 240°
Environmental monitoring survey of Region II, 2000 Akvaplan-niva report: APN-411.1890-1
Frøy field 2000 Page 9-7
and 60°. No contamination by the other selected metals is found. Vertical sediment samples reveal higher barium concentrations in 1-3 cm layers than in 0-1 and 3-6 cm layers.
Comparison with previous survey(s)
THC concentrations for 1997 are previously reported as the sum of mineral oil and olefins (Mannvik et al., 1998.) The THC values for 1997 presented in the histogram in Figure 9-3 are the recalculated THC values found by substraction of olefin-concentrations (adjusted for response factor) from the THC values reported in 1997. This year’s THC content in sediments at the reference station was comparable with concentrations found in 1997, both years being somewhat higher than background levels from 1992 (Figure 9-3). NPD’s and 3-6 ring aromatics concentrations are also similar to 1997 values, while the concentration of decalins is about half of what was found in 1997. No changes in levels of barium, copper, zinc and mercury are found, while sediments reveal minor increases in levels of lead (Figure 9-5, Figure 9-6). Relatively high concentrations of cadmium, 0.035 ± 0.17 mg/kg, are found at the reference station. Here, one of the replicates has a concentration of 0.061 mg/kg. This explains the rather high average sediment concentration of cadmium at this station. However, high cadmium levels are found in all sediment layers down to 6 cm in vertical core samples, with the highest concentration measured in the top layer.
Hydrocarbon levels are lower in sediments at Frøy in 2000 than they were in 1997 (Figure 9-3 and Figure 9-4). The field history reveals acute spills of 1.9 tons oil since 1997. However, both THC and olefin levels have fallen at virtually all field stations. One of the five stations that revealed sediment THC values over LSC in 1997, situated 250 m in the 150° direction relative to the platform, also have values above LSC in 2000. Results from vertical core samples support these findings, with increasing hydrocarbon concentrations with depth. Metal concentrations do not reveal the same declining tendency from 1997 to 2000 as do the hydrocarbons (Figure 9-5 and Figure 9-6). Increased barium concentrations are found in sediments at Frøy. At the station situated 250 m in the 150°direction the barium concentration has increased from 1048 mg/kg dry sediment to 1951 mg/kg. The highest barium concentrations were nevertheless found in the1-3 cm layers in vertical core samples and not in the top layer. Cadmium and lead also reveal slight increases. Copper and zinc concentrations seem to be similar to the concentrations found in the 1997 survey. Copper levels just above LSC are found in sediments at three stations in 2000. Chromium was not measured in 1997. Sediment levels of mercury are relatively unchanged. The field history gives no explanation of the increase in barium levels in the field. The tendency of increased barium concentrations in sediments is also found in the neighbour field Heimdal. Field history does not reveal discharges in this field either. The discrepancies of the results in 2000 and 1997 are too large to be explained only by laboratory errors, especially considering that the same laboratory performed the analyses on both occasions. The proportion of pelite in sediments at Frøy has increased from 6.5 % to 9.3 % at the reference station with a concomitant increase at the field stations.
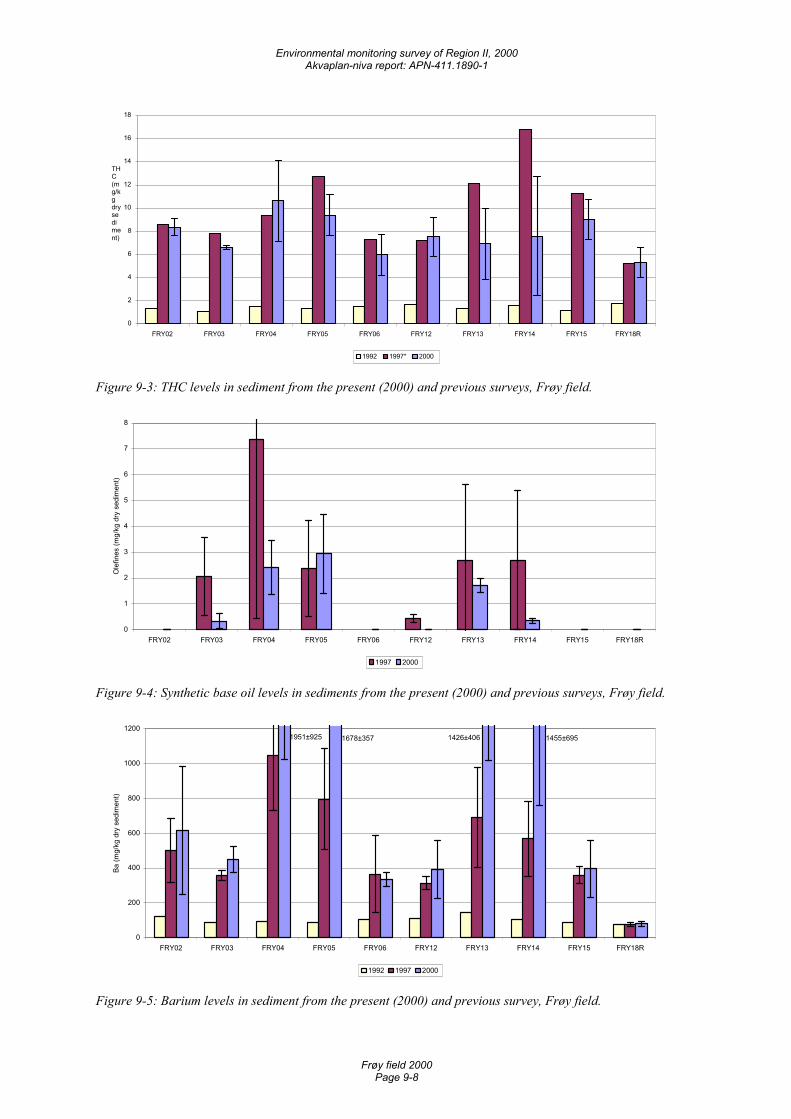
Environmental monitoring survey of Region II, 2000 Akvaplan-niva report: APN-411.1890-1
Frøy field 2000 Page 9-8
0
2
4
6
8
10
12
14
16
18
FRY02 FRY03 FRY04 FRY05 FRY06 FRY12 FRY13 FRY14 FRY15 FRY18R
THC(mg/kgdrysediment)
1992 1997* 2000
Figure 9-3: THC levels in sediment from the present (2000) and previous surveys, Frøy field.
0
1
2
3
4
5
6
7
8
FRY02 FRY03 FRY04 FRY05 FRY06 FRY12 FRY13 FRY14 FRY15 FRY18R
Ole
fines
(mg/
kg d
ry s
edim
ent)
1997 2000
Figure 9-4: Synthetic base oil levels in sediments from the present (2000) and previous surveys, Frøy field.
1455±6951426±4061678±3571951±925
0
200
400
600
800
1000
1200
FRY02 FRY03 FRY04 FRY05 FRY06 FRY12 FRY13 FRY14 FRY15 FRY18R
Ba (m
g/kg
dry
sed
imen
t)
1992 1997 2000
Figure 9-5: Barium levels in sediment from the present (2000) and previous survey, Frøy field.
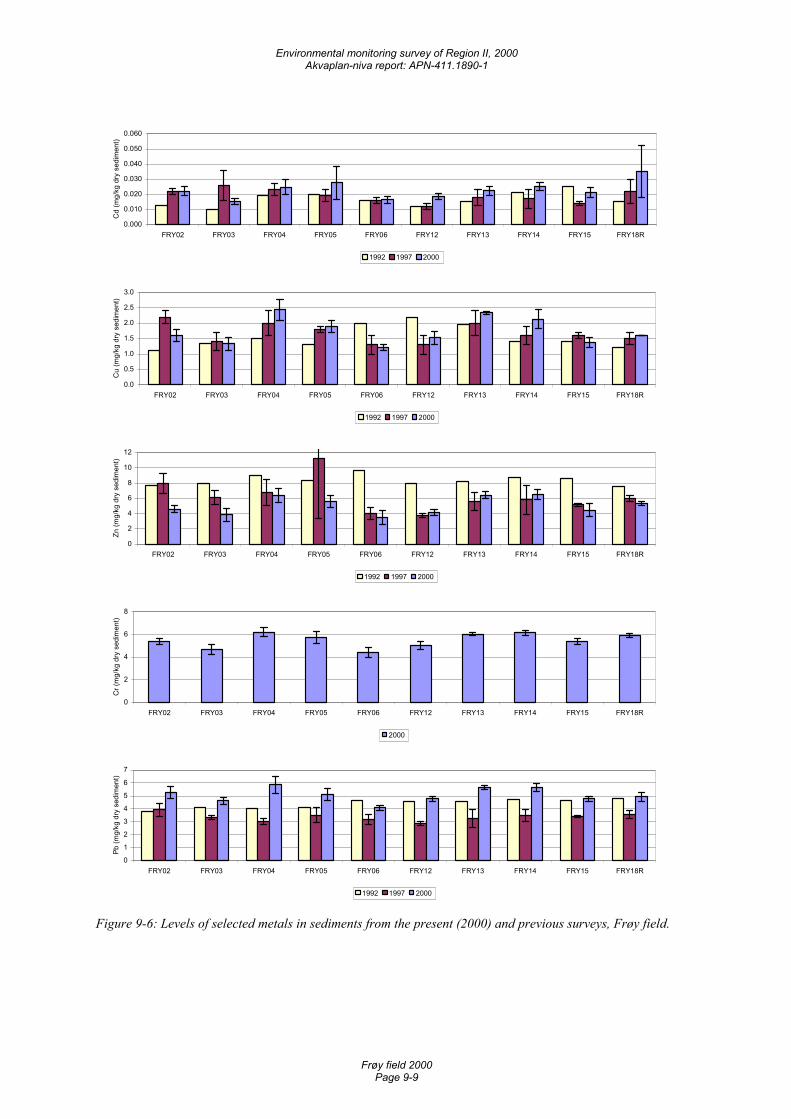
Environmental monitoring survey of Region II, 2000 Akvaplan-niva report: APN-411.1890-1
Frøy field 2000 Page 9-9
0.000
0.010
0.020
0.030
0.040
0.050
0.060
FRY02 FRY03 FRY04 FRY05 FRY06 FRY12 FRY13 FRY14 FRY15 FRY18R
Cd
(mg/
kg d
ry s
edim
ent)
1992 1997 2000
0.0
0.5
1.0
1.5
2.0
2.5
3.0
FRY02 FRY03 FRY04 FRY05 FRY06 FRY12 FRY13 FRY14 FRY15 FRY18R
Cu
(mg/
kg d
ry s
edim
ent)
1992 1997 2000
0
2
4
6
8
10
12
FRY02 FRY03 FRY04 FRY05 FRY06 FRY12 FRY13 FRY14 FRY15 FRY18R
Zn (m
g/kg
dry
sed
imen
t)
1992 1997 2000
0
2
4
6
8
FRY02 FRY03 FRY04 FRY05 FRY06 FRY12 FRY13 FRY14 FRY15 FRY18R
Cr (
mg/
kg d
ry s
edim
ent)
2000
0
1
2
3
4
5
6
7
FRY02 FRY03 FRY04 FRY05 FRY06 FRY12 FRY13 FRY14 FRY15 FRY18R
Pb (m
g/kg
dry
sed
imen
t)
1992 1997 2000
Figure 9-6: Levels of selected metals in sediments from the present (2000) and previous surveys, Frøy field.
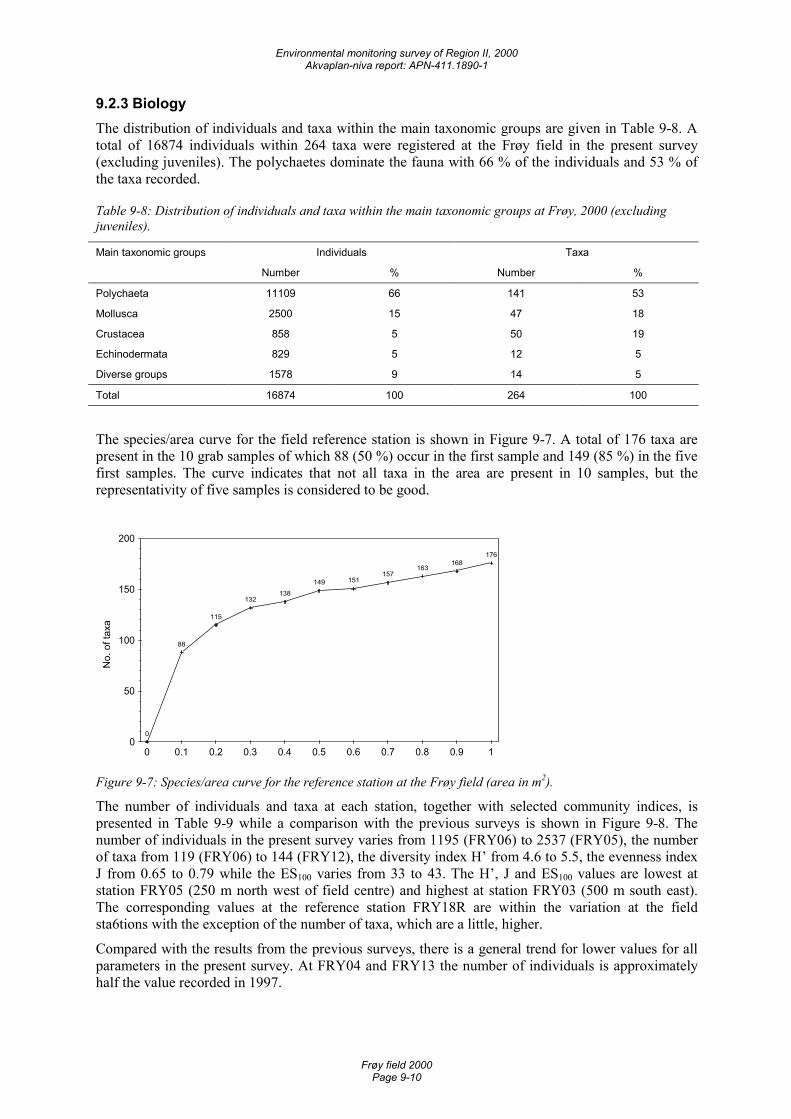
Environmental monitoring survey of Region II, 2000 Akvaplan-niva report: APN-411.1890-1
Frøy field 2000 Page 9-10
9.2.3 Biology The distribution of individuals and taxa within the main taxonomic groups are given in Table 9-8. A total of 16874 individuals within 264 taxa were registered at the Frøy field in the present survey (excluding juveniles). The polychaetes dominate the fauna with 66 % of the individuals and 53 % of the taxa recorded.
Table 9-8: Distribution of individuals and taxa within the main taxonomic groups at Frøy, 2000 (excluding juveniles).
Main taxonomic groups Individuals Taxa
Number % Number %
Polychaeta 11109 66 141 53
Mollusca 2500 15 47 18
Crustacea 858 5 50 19
Echinodermata 829 5 12 5
Diverse groups 1578 9 14 5
Total 16874 100 264 100
The species/area curve for the field reference station is shown in Figure 9-7. A total of 176 taxa are present in the 10 grab samples of which 88 (50 %) occur in the first sample and 149 (85 %) in the five first samples. The curve indicates that not all taxa in the area are present in 10 samples, but the representativity of five samples is considered to be good.
No.
of t
axa
0
88
115
132138
149 151157
163168
176
0
50
100
150
200
0 0.1 0.2 0.3 0.4 0.5 0.6 0.7 0.8 0.9 1
Figure 9-7: Species/area curve for the reference station at the Frøy field (area in m2).
The number of individuals and taxa at each station, together with selected community indices, is presented in Table 9-9 while a comparison with the previous surveys is shown in Figure 9-8. The number of individuals in the present survey varies from 1195 (FRY06) to 2537 (FRY05), the number of taxa from 119 (FRY06) to 144 (FRY12), the diversity index H’ from 4.6 to 5.5, the evenness index J from 0.65 to 0.79 while the ES100 varies from 33 to 43. The H’, J and ES100 values are lowest at station FRY05 (250 m north west of field centre) and highest at station FRY03 (500 m south east). The corresponding values at the reference station FRY18R are within the variation at the field sta6tions with the exception of the number of taxa, which are a little, higher.
Compared with the results from the previous surveys, there is a general trend for lower values for all parameters in the present survey. At FRY04 and FRY13 the number of individuals is approximately half the value recorded in 1997.
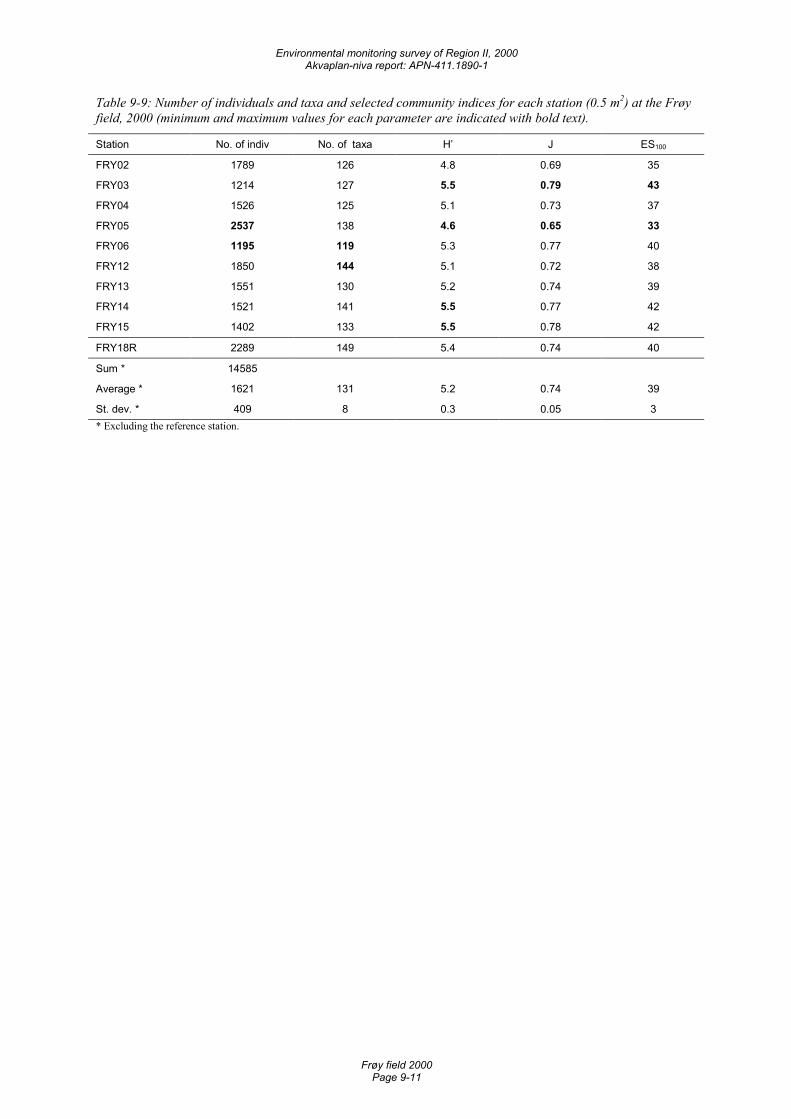
Environmental monitoring survey of Region II, 2000 Akvaplan-niva report: APN-411.1890-1
Frøy field 2000 Page 9-11
Table 9-9: Number of individuals and taxa and selected community indices for each station (0.5 m2) at the Frøy field, 2000 (minimum and maximum values for each parameter are indicated with bold text).
Station No. of indiv No. of taxa H’ J ES100
FRY02 1789 126 4.8 0.69 35
FRY03 1214 127 5.5 0.79 43
FRY04 1526 125 5.1 0.73 37
FRY05 2537 138 4.6 0.65 33
FRY06 1195 119 5.3 0.77 40
FRY12 1850 144 5.1 0.72 38
FRY13 1551 130 5.2 0.74 39
FRY14 1521 141 5.5 0.77 42
FRY15 1402 133 5.5 0.78 42
FRY18R 2289 149 5.4 0.74 40
Sum * 14585
Average * 1621 131 5.2 0.74 39
St. dev. * 409 8 0.3 0.05 3 * Excluding the reference station.
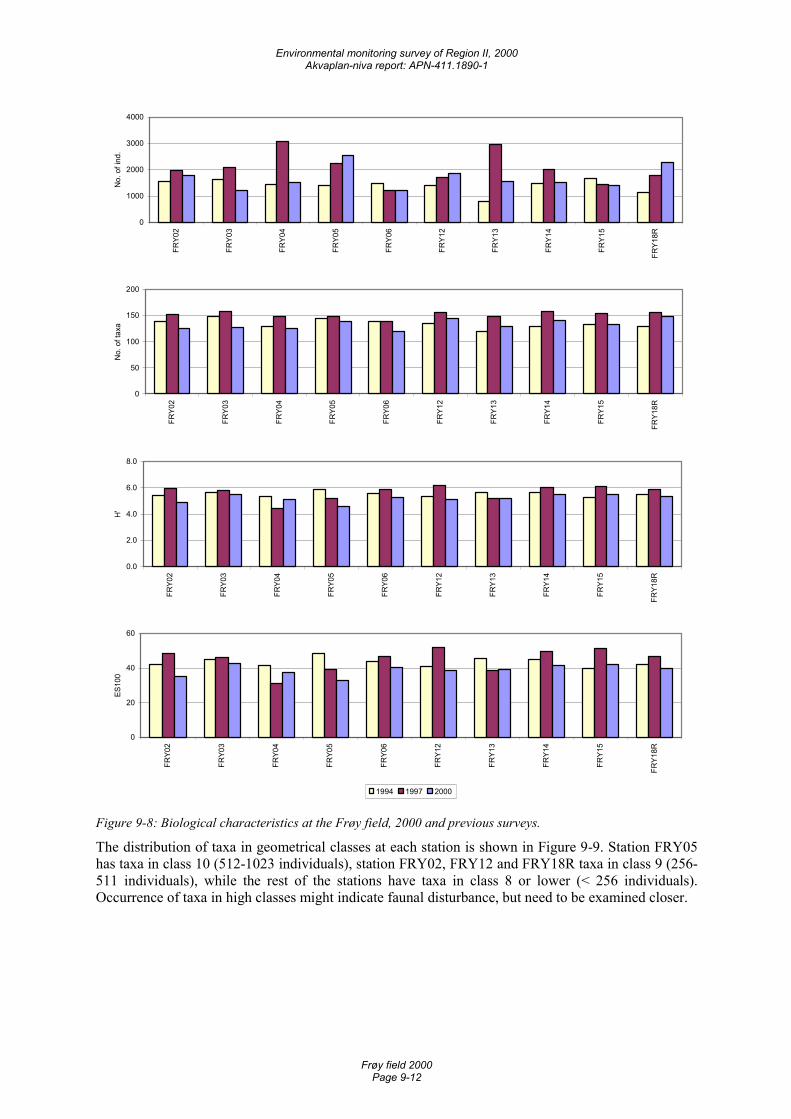
Environmental monitoring survey of Region II, 2000 Akvaplan-niva report: APN-411.1890-1
Frøy field 2000 Page 9-12
0
1000
2000
3000
4000
FRY0
2
FRY0
3
FRY0
4
FRY0
5
FRY0
6
FRY1
2
FRY1
3
FRY1
4
FRY1
5
FRY1
8R
No.
of i
nd.
0
50
100
150
200
FRY0
2
FRY0
3
FRY0
4
FRY0
5
FRY0
6
FRY1
2
FRY1
3
FRY1
4
FRY1
5
FRY1
8R
No.
of t
axa
0.0
2.0
4.0
6.0
8.0
FRY0
2
FRY0
3
FRY0
4
FRY0
5
FRY0
6
FRY1
2
FRY1
3
FRY1
4
FRY1
5
FRY1
8R
H'
0
20
40
60
FRY0
2
FRY0
3
FRY0
4
FRY0
5
FRY0
6
FRY1
2
FRY1
3
FRY1
4
FRY1
5
FRY1
8R
ES10
0
1994 1997 2000
Figure 9-8: Biological characteristics at the Frøy field, 2000 and previous surveys.
The distribution of taxa in geometrical classes at each station is shown in Figure 9-9. Station FRY05 has taxa in class 10 (512-1023 individuals), station FRY02, FRY12 and FRY18R taxa in class 9 (256-511 individuals), while the rest of the stations have taxa in class 8 or lower (< 256 individuals). Occurrence of taxa in high classes might indicate faunal disturbance, but need to be examined closer.
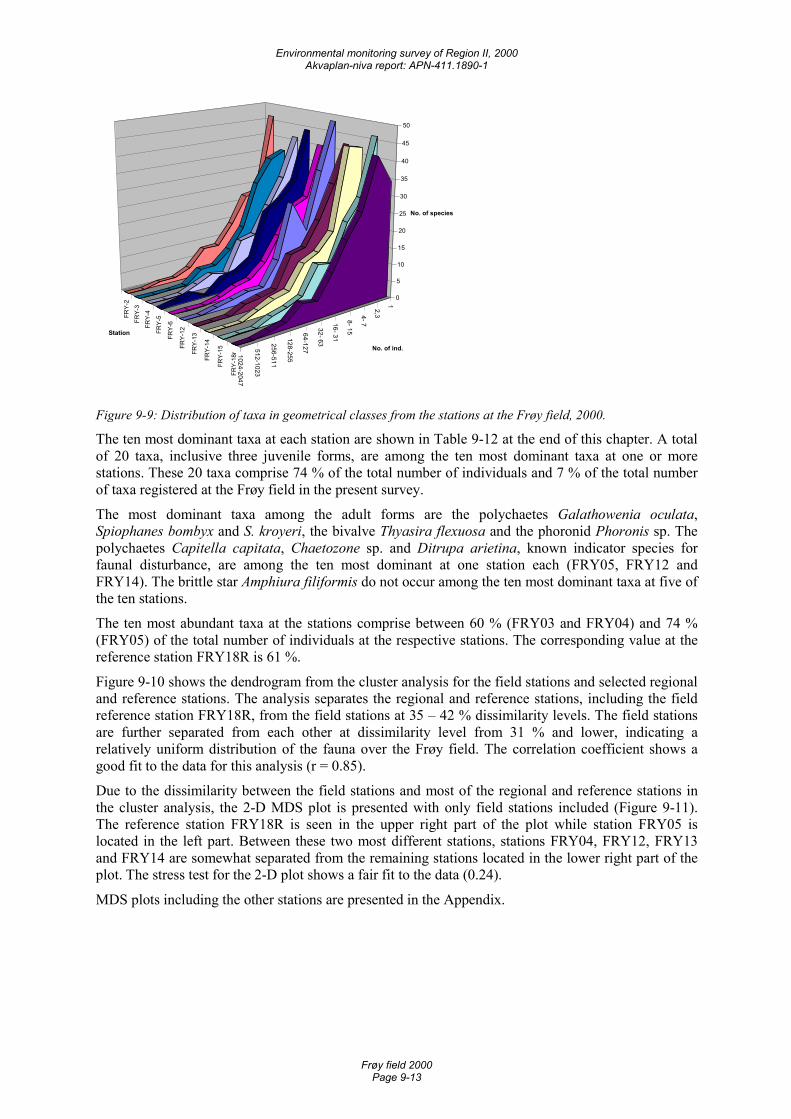
Environmental monitoring survey of Region II, 2000 Akvaplan-niva report: APN-411.1890-1
Frøy field 2000 Page 9-13
12,3 4- 7
8- 15
16- 31
32- 63
64-127
128-255
256-511
512-1023
1024-2047
FRY-
2FR
Y-3
FRY-
4
FRY-
5
FRY-
6
FRY-
12
FRY-
13
FRY-
14
FRY-
15
FRY-
18r
0
5
10
15
20
25
30
35
40
45
50
No. of species
No. of ind.
Station
Figure 9-9: Distribution of taxa in geometrical classes from the stations at the Frøy field, 2000.
The ten most dominant taxa at each station are shown in Table 9-12 at the end of this chapter. A total of 20 taxa, inclusive three juvenile forms, are among the ten most dominant taxa at one or more stations. These 20 taxa comprise 74 % of the total number of individuals and 7 % of the total number of taxa registered at the Frøy field in the present survey.
The most dominant taxa among the adult forms are the polychaetes Galathowenia oculata, Spiophanes bombyx and S. kroyeri, the bivalve Thyasira flexuosa and the phoronid Phoronis sp. The polychaetes Capitella capitata, Chaetozone sp. and Ditrupa arietina, known indicator species for faunal disturbance, are among the ten most dominant at one station each (FRY05, FRY12 and FRY14). The brittle star Amphiura filiformis do not occur among the ten most dominant taxa at five of the ten stations.
The ten most abundant taxa at the stations comprise between 60 % (FRY03 and FRY04) and 74 % (FRY05) of the total number of individuals at the respective stations. The corresponding value at the reference station FRY18R is 61 %.
Figure 9-10 shows the dendrogram from the cluster analysis for the field stations and selected regional and reference stations. The analysis separates the regional and reference stations, including the field reference station FRY18R, from the field stations at 35 – 42 % dissimilarity levels. The field stations are further separated from each other at dissimilarity level from 31 % and lower, indicating a relatively uniform distribution of the fauna over the Frøy field. The correlation coefficient shows a good fit to the data for this analysis (r = 0.85).
Due to the dissimilarity between the field stations and most of the regional and reference stations in the cluster analysis, the 2-D MDS plot is presented with only field stations included (Figure 9-11). The reference station FRY18R is seen in the upper right part of the plot while station FRY05 is located in the left part. Between these two most different stations, stations FRY04, FRY12, FRY13 and FRY14 are somewhat separated from the remaining stations located in the lower right part of the plot. The stress test for the 2-D plot shows a fair fit to the data (0.24).
MDS plots including the other stations are presented in the Appendix.
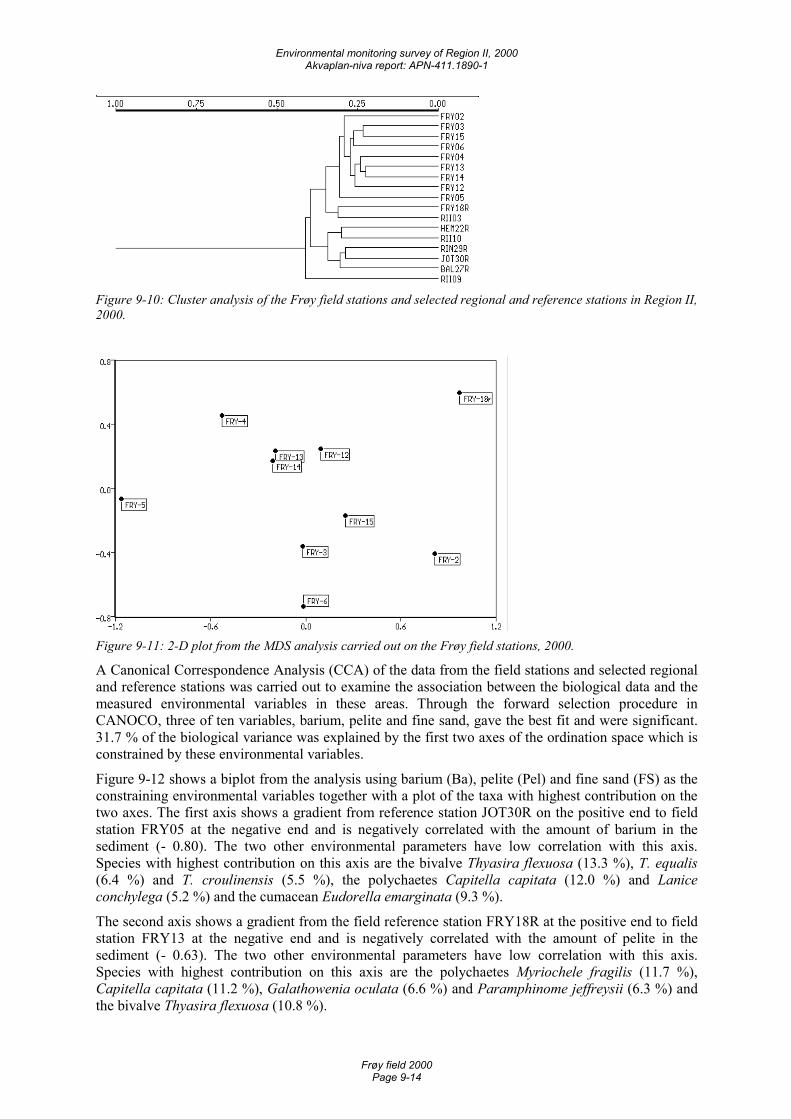
Environmental monitoring survey of Region II, 2000 Akvaplan-niva report: APN-411.1890-1
Frøy field 2000 Page 9-14
Figure 9-10: Cluster analysis of the Frøy field stations and selected regional and reference stations in Region II, 2000.
Figure 9-11: 2-D plot from the MDS analysis carried out on the Frøy field stations, 2000.
A Canonical Correspondence Analysis (CCA) of the data from the field stations and selected regional and reference stations was carried out to examine the association between the biological data and the measured environmental variables in these areas. Through the forward selection procedure in CANOCO, three of ten variables, barium, pelite and fine sand, gave the best fit and were significant. 31.7 % of the biological variance was explained by the first two axes of the ordination space which is constrained by these environmental variables.
Figure 9-12 shows a biplot from the analysis using barium (Ba), pelite (Pel) and fine sand (FS) as the constraining environmental variables together with a plot of the taxa with highest contribution on the two axes. The first axis shows a gradient from reference station JOT30R on the positive end to field station FRY05 at the negative end and is negatively correlated with the amount of barium in the sediment (- 0.80). The two other environmental parameters have low correlation with this axis. Species with highest contribution on this axis are the bivalve Thyasira flexuosa (13.3 %), T. equalis (6.4 %) and T. croulinensis (5.5 %), the polychaetes Capitella capitata (12.0 %) and Lanice conchylega (5.2 %) and the cumacean Eudorella emarginata (9.3 %).
The second axis shows a gradient from the field reference station FRY18R at the positive end to field station FRY13 at the negative end and is negatively correlated with the amount of pelite in the sediment (- 0.63). The two other environmental parameters have low correlation with this axis. Species with highest contribution on this axis are the polychaetes Myriochele fragilis (11.7 %), Capitella capitata (11.2 %), Galathowenia oculata (6.6 %) and Paramphinome jeffreysii (6.3 %) and the bivalve Thyasira flexuosa (10.8 %).
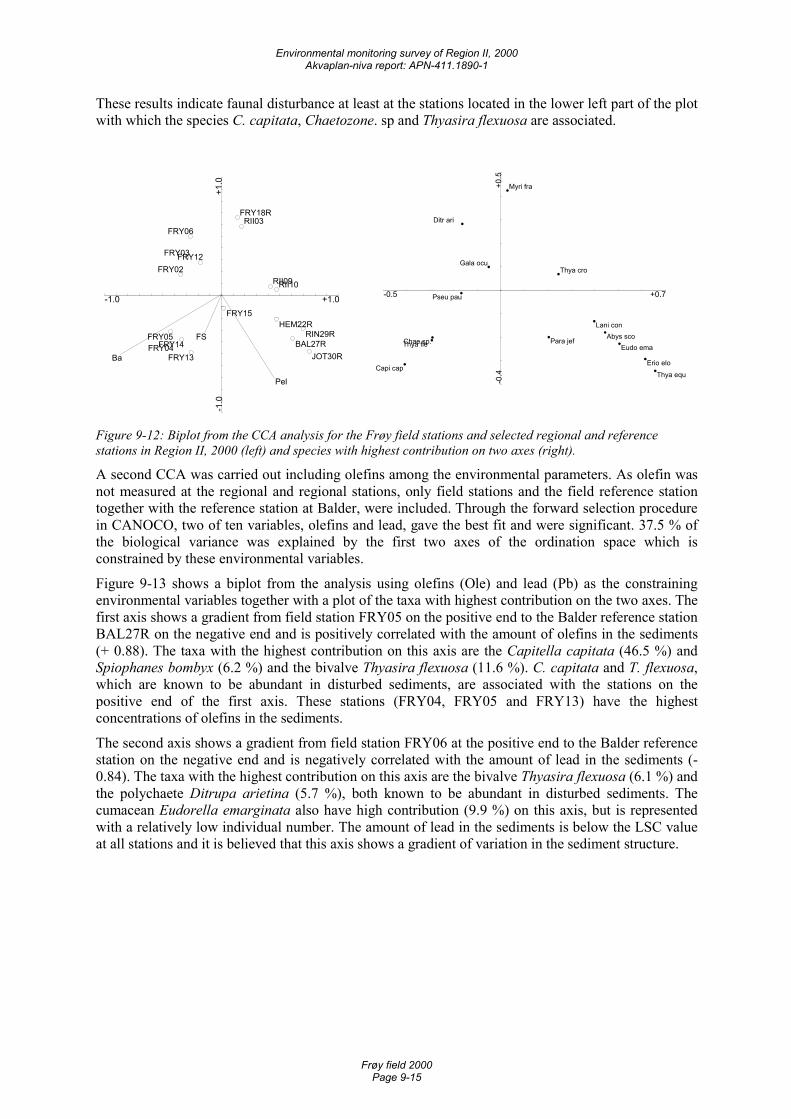
Environmental monitoring survey of Region II, 2000 Akvaplan-niva report: APN-411.1890-1
Frøy field 2000 Page 9-15
These results indicate faunal disturbance at least at the stations located in the lower left part of the plot with which the species C. capitata, Chaetozone. sp and Thyasira flexuosa are associated.
-1.0 +1.0
-1.0
+1.0
Ba
Pel
FS
JOT30R
RIN29RBAL27R
HEM22R
RII10
FRY05FRY04
RII09FRY02
FRY14
FRY03
FRY06
FRY13
FRY12
RII03FRY18R
FRY15�
-0.5 +0.7
-0.4
+0.5
Thya equErio elo
Eudo emaAbys sco
Capi cap
Lani con
Thya fleChae sp.
Thya cro
Para jef
Pseu pau
Ditr ari
Gala ocu
Myri fra�
Figure 9-12: Biplot from the CCA analysis for the Frøy field stations and selected regional and reference stations in Region II, 2000 (left) and species with highest contribution on two axes (right).
A second CCA was carried out including olefins among the environmental parameters. As olefin was not measured at the regional and regional stations, only field stations and the field reference station together with the reference station at Balder, were included. Through the forward selection procedure in CANOCO, two of ten variables, olefins and lead, gave the best fit and were significant. 37.5 % of the biological variance was explained by the first two axes of the ordination space which is constrained by these environmental variables.
Figure 9-13 shows a biplot from the analysis using olefins (Ole) and lead (Pb) as the constraining environmental variables together with a plot of the taxa with highest contribution on the two axes. The first axis shows a gradient from field station FRY05 on the positive end to the Balder reference station BAL27R on the negative end and is positively correlated with the amount of olefins in the sediments (+ 0.88). The taxa with the highest contribution on this axis are the Capitella capitata (46.5 %) and Spiophanes bombyx (6.2 %) and the bivalve Thyasira flexuosa (11.6 %). C. capitata and T. flexuosa, which are known to be abundant in disturbed sediments, are associated with the stations on the positive end of the first axis. These stations (FRY04, FRY05 and FRY13) have the highest concentrations of olefins in the sediments.
The second axis shows a gradient from field station FRY06 at the positive end to the Balder reference station on the negative end and is negatively correlated with the amount of lead in the sediments (- 0.84). The taxa with the highest contribution on this axis are the bivalve Thyasira flexuosa (6.1 %) and the polychaete Ditrupa arietina (5.7 %), both known to be abundant in disturbed sediments. The cumacean Eudorella emarginata also have high contribution (9.9 %) on this axis, but is represented with a relatively low individual number. The amount of lead in the sediments is below the LSC value at all stations and it is believed that this axis shows a gradient of variation in the sediment structure.
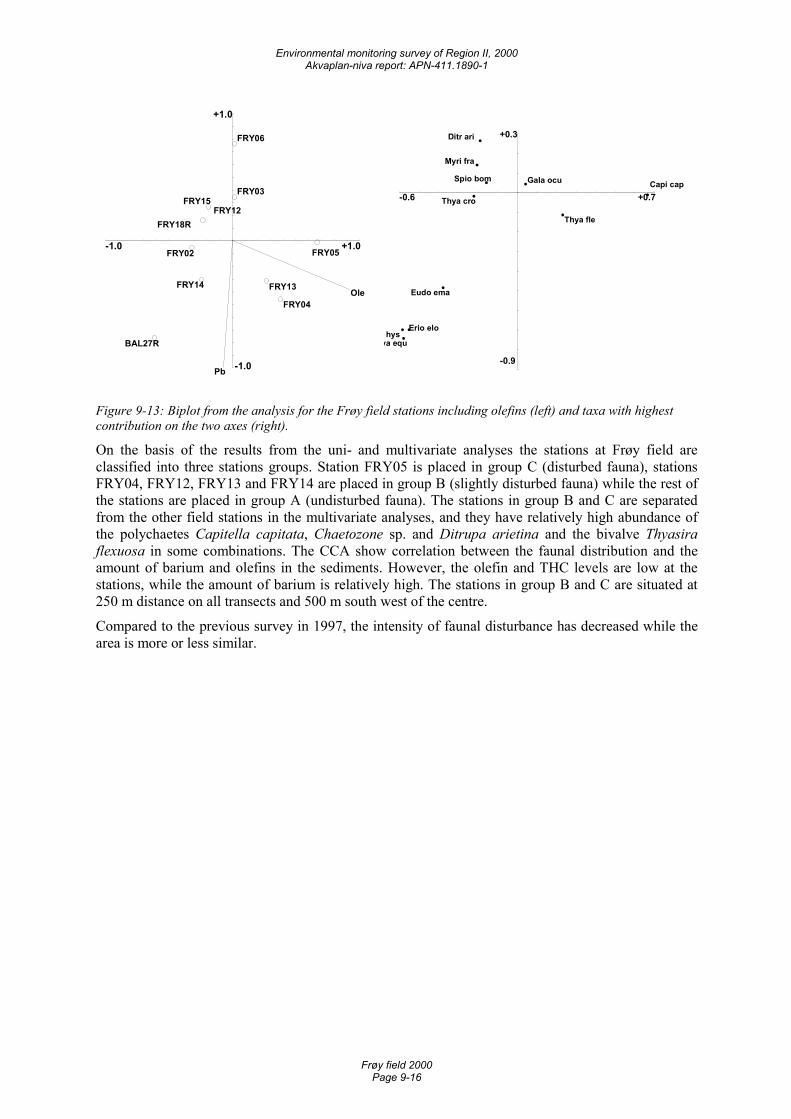
Environmental monitoring survey of Region II, 2000 Akvaplan-niva report: APN-411.1890-1
Frøy field 2000 Page 9-16
-1.0 +1.0
-1.0
+1.0
Ole
Pb
FRY05
BAL27R
FRY04
FRY02
FRY13FRY14
FRY18R
FRY15FRY12
FRY03
FRY06
-0.6 +0.7
-0.9
+0.3
Capi cap
hysya equ
Erio elo
Eudo ema
Thya fle
Thya cro
Myri fra
Ditr ari
Spio bom Gala ocu
Figure 9-13: Biplot from the analysis for the Frøy field stations including olefins (left) and taxa with highest contribution on the two axes (right).
On the basis of the results from the uni- and multivariate analyses the stations at Frøy field are classified into three stations groups. Station FRY05 is placed in group C (disturbed fauna), stations FRY04, FRY12, FRY13 and FRY14 are placed in group B (slightly disturbed fauna) while the rest of the stations are placed in group A (undisturbed fauna). The stations in group B and C are separated from the other field stations in the multivariate analyses, and they have relatively high abundance of the polychaetes Capitella capitata, Chaetozone sp. and Ditrupa arietina and the bivalve Thyasira flexuosa in some combinations. The CCA show correlation between the faunal distribution and the amount of barium and olefins in the sediments. However, the olefin and THC levels are low at the stations, while the amount of barium is relatively high. The stations in group B and C are situated at 250 m distance on all transects and 500 m south west of the centre.
Compared to the previous survey in 1997, the intensity of faunal disturbance has decreased while the area is more or less similar.
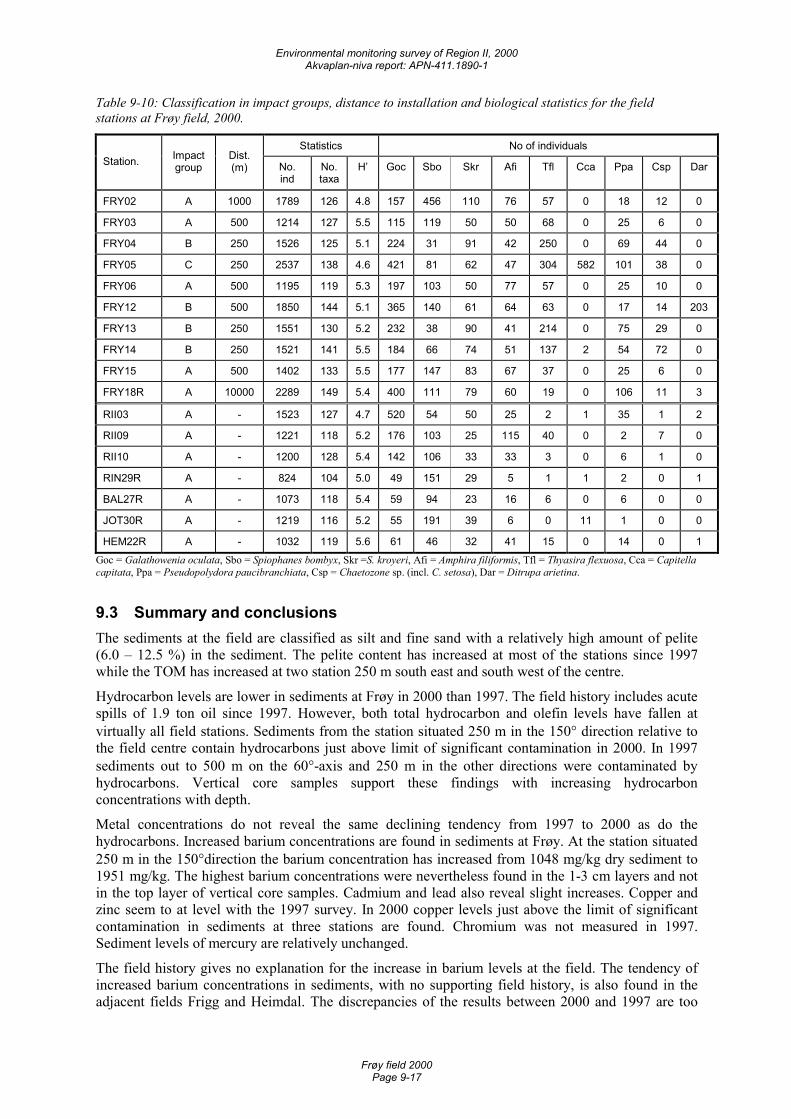
Environmental monitoring survey of Region II, 2000 Akvaplan-niva report: APN-411.1890-1
Frøy field 2000 Page 9-17
Table 9-10: Classification in impact groups, distance to installation and biological statistics for the field stations at Frøy field, 2000.
Statistics No of individuals Station. Impact
group Dist. (m) No.
ind No. taxa
H’ Goc Sbo Skr Afi Tfl Cca Ppa Csp Dar
FRY02 A 1000 1789 126 4.8 157 456 110 76 57 0 18 12 0
FRY03 A 500 1214 127 5.5 115 119 50 50 68 0 25 6 0
FRY04 B 250 1526 125 5.1 224 31 91 42 250 0 69 44 0
FRY05 C 250 2537 138 4.6 421 81 62 47 304 582 101 38 0
FRY06 A 500 1195 119 5.3 197 103 50 77 57 0 25 10 0
FRY12 B 500 1850 144 5.1 365 140 61 64 63 0 17 14 203
FRY13 B 250 1551 130 5.2 232 38 90 41 214 0 75 29 0
FRY14 B 250 1521 141 5.5 184 66 74 51 137 2 54 72 0
FRY15 A 500 1402 133 5.5 177 147 83 67 37 0 25 6 0
FRY18R A 10000 2289 149 5.4 400 111 79 60 19 0 106 11 3
RII03 A - 1523 127 4.7 520 54 50 25 2 1 35 1 2
RII09 A - 1221 118 5.2 176 103 25 115 40 0 2 7 0
RII10 A - 1200 128 5.4 142 106 33 33 3 0 6 1 0
RIN29R A - 824 104 5.0 49 151 29 5 1 1 2 0 1
BAL27R A - 1073 118 5.4 59 94 23 16 6 0 6 0 0
JOT30R A - 1219 116 5.2 55 191 39 6 0 11 1 0 0
HEM22R A - 1032 119 5.6 61 46 32 41 15 0 14 0 1 Goc = Galathowenia oculata, Sbo = Spiophanes bombyx, Skr =S. kroyeri, Afi = Amphira filiformis, Tfl = Thyasira flexuosa, Cca = Capitella capitata, Ppa = Pseudopolydora paucibranchiata, Csp = Chaetozone sp. (incl. C. setosa), Dar = Ditrupa arietina.
9.3 Summary and conclusions The sediments at the field are classified as silt and fine sand with a relatively high amount of pelite (6.0 – 12.5 %) in the sediment. The pelite content has increased at most of the stations since 1997 while the TOM has increased at two station 250 m south east and south west of the centre.
Hydrocarbon levels are lower in sediments at Frøy in 2000 than 1997. The field history includes acute spills of 1.9 ton oil since 1997. However, both total hydrocarbon and olefin levels have fallen at virtually all field stations. Sediments from the station situated 250 m in the 150° direction relative to the field centre contain hydrocarbons just above limit of significant contamination in 2000. In 1997 sediments out to 500 m on the 60°-axis and 250 m in the other directions were contaminated by hydrocarbons. Vertical core samples support these findings with increasing hydrocarbon concentrations with depth.
Metal concentrations do not reveal the same declining tendency from 1997 to 2000 as do the hydrocarbons. Increased barium concentrations are found in sediments at Frøy. At the station situated 250 m in the 150°direction the barium concentration has increased from 1048 mg/kg dry sediment to 1951 mg/kg. The highest barium concentrations were nevertheless found in the 1-3 cm layers and not in the top layer of vertical core samples. Cadmium and lead also reveal slight increases. Copper and zinc seem to at level with the 1997 survey. In 2000 copper levels just above the limit of significant contamination in sediments at three stations are found. Chromium was not measured in 1997. Sediment levels of mercury are relatively unchanged.
The field history gives no explanation for the increase in barium levels at the field. The tendency of increased barium concentrations in sediments, with no supporting field history, is also found in the adjacent fields Frigg and Heimdal. The discrepancies of the results between 2000 and 1997 are too
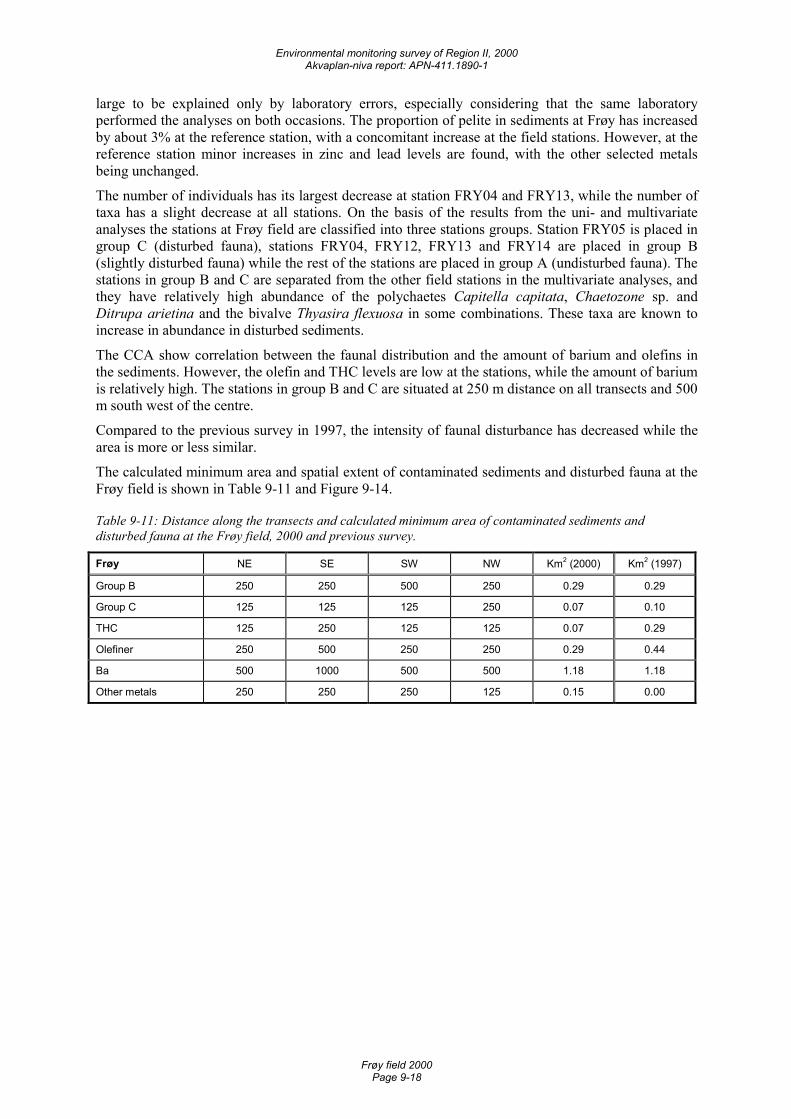
Environmental monitoring survey of Region II, 2000 Akvaplan-niva report: APN-411.1890-1
Frøy field 2000 Page 9-18
large to be explained only by laboratory errors, especially considering that the same laboratory performed the analyses on both occasions. The proportion of pelite in sediments at Frøy has increased by about 3% at the reference station, with a concomitant increase at the field stations. However, at the reference station minor increases in zinc and lead levels are found, with the other selected metals being unchanged.
The number of individuals has its largest decrease at station FRY04 and FRY13, while the number of taxa has a slight decrease at all stations. On the basis of the results from the uni- and multivariate analyses the stations at Frøy field are classified into three stations groups. Station FRY05 is placed in group C (disturbed fauna), stations FRY04, FRY12, FRY13 and FRY14 are placed in group B (slightly disturbed fauna) while the rest of the stations are placed in group A (undisturbed fauna). The stations in group B and C are separated from the other field stations in the multivariate analyses, and they have relatively high abundance of the polychaetes Capitella capitata, Chaetozone sp. and Ditrupa arietina and the bivalve Thyasira flexuosa in some combinations. These taxa are known to increase in abundance in disturbed sediments.
The CCA show correlation between the faunal distribution and the amount of barium and olefins in the sediments. However, the olefin and THC levels are low at the stations, while the amount of barium is relatively high. The stations in group B and C are situated at 250 m distance on all transects and 500 m south west of the centre.
Compared to the previous survey in 1997, the intensity of faunal disturbance has decreased while the area is more or less similar.
The calculated minimum area and spatial extent of contaminated sediments and disturbed fauna at the Frøy field is shown in Table 9-11 and Figure 9-14.
Table 9-11: Distance along the transects and calculated minimum area of contaminated sediments and disturbed fauna at the Frøy field, 2000 and previous survey.
Frøy NE SE SW NW Km2 (2000) Km2 (1997)
Group B 250 250 500 250 0.29 0.29
Group C 125 125 125 250 0.07 0.10
THC 125 250 125 125 0.07 0.29
Olefiner 250 500 250 250 0.29 0.44
Ba 500 1000 500 500 1.18 1.18
Other metals 250 250 250 125 0.15 0.00
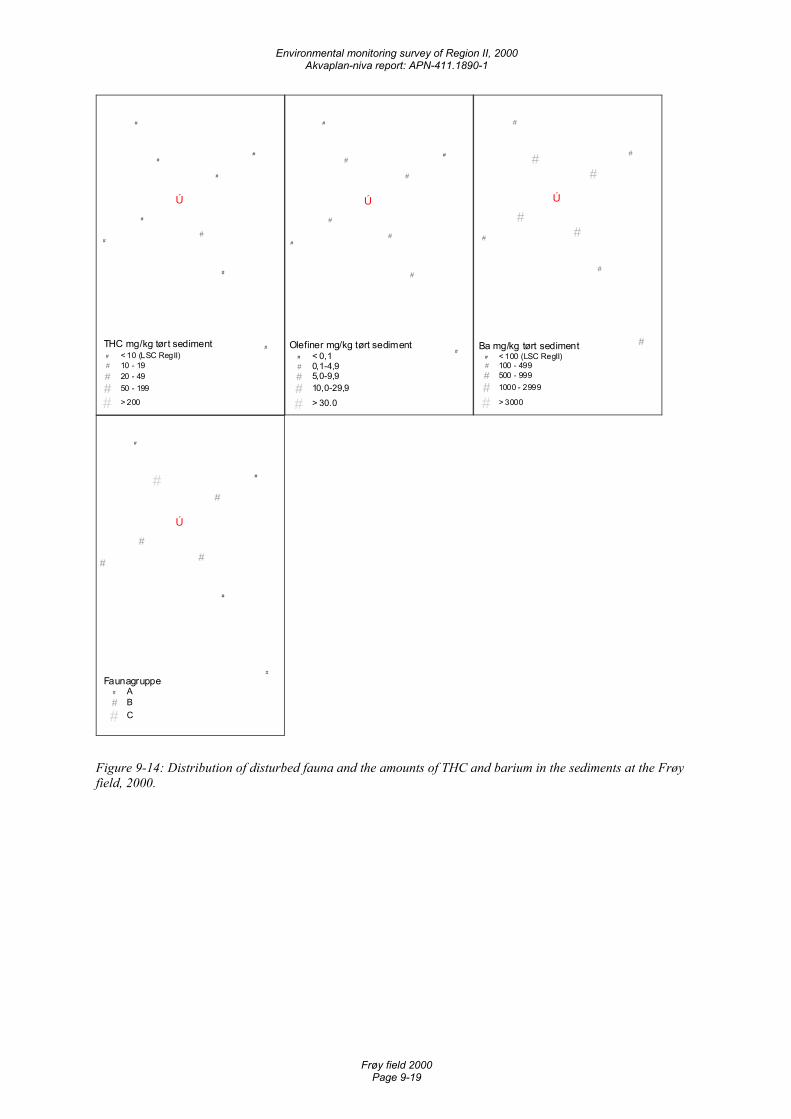
Environmental monitoring survey of Region II, 2000 Akvaplan-niva report: APN-411.1890-1
Frøy field 2000 Page 9-19
Ú
#
#
#
#
#
#
#
#
#
THC mg/kg tørt sediment# < 10 (LSC RegII)# 10 - 19# 20 - 49
# 50 - 199
# > 200
Ú
#
#
#
#
#
#
#
#
#
Olefiner mg/kg tørt sediment# < 0,1# 0,1-4,9# 5,0-9,9# 10,0-29,9
# > 30.0
Ú
#
#
#
#
#
#
#
#
#
Ba mg/kg tørt sediment# < 100 (LSC RegII)# 100 - 499# 500 - 999
# 1000 - 2999
# > 3000
Ú
#
#
#
#
#
#
#
#
#
Faunagruppe# A# B
# C
Figure 9-14: Distribution of disturbed fauna and the amounts of THC and barium in the sediments at the Frøy field, 2000.
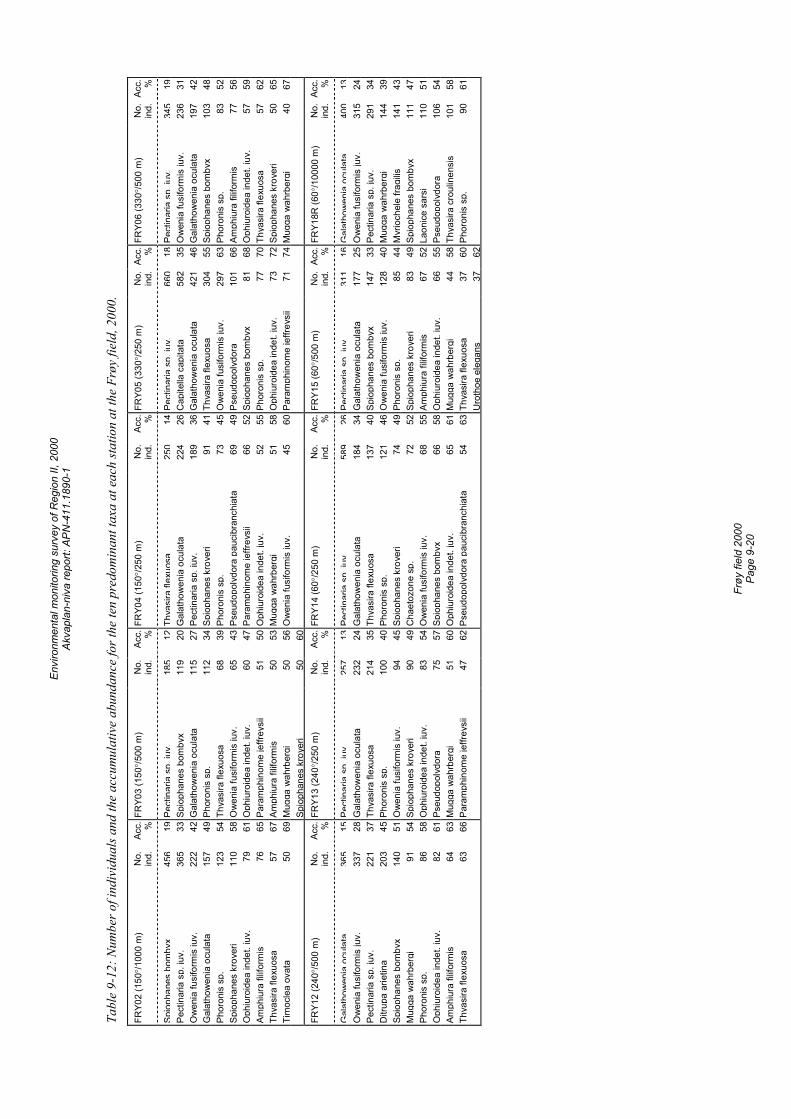
Envi
ronm
enta
l mon
itorin
g su
rvey
of R
egio
n II,
200
0 Ak
vapl
an-n
iva
repo
rt: A
PN-4
11.1
890-
1
Fr
øy fi
eld
2000
Pa
ge 9
-20
Tabl
e 9-
12: N
umbe
r of i
ndiv
idua
ls an
d th
e ac
cum
ulat
ive
abun
danc
e fo
r the
ten
pred
omin
ant t
axa
at e
ach
statio
n at
the
Frøy
fiel
d, 2
000.
FRY0
2 (1
50°/
1000
m)
No.
in
d.
Acc.
%
FRY0
3 (1
50°/
500
m)
No.
in
d.Ac
c.
%FR
Y04
(150
°/25
0 m
) N
o.
ind.
Acc.
%
FRY0
5 (3
30°/
250
m)
No.
in
d.Ac
c.
%FR
Y06
(330
°/50
0 m
) N
o.
ind.
Acc.
%
Spio
phan
esbo
mby
x45
619
Pect
inar
iasp
.juv
.18
512
Thya
sira
flexu
osa
250
14Pe
ctin
aria
sp.j
uv.
660
18Pe
ctin
aria
sp.j
uv.
345
19Pe
ctin
aria
sp.
juv.
36
5 33
Spi
opha
nes
bom
byx
119
20G
alat
how
enia
ocu
lata
224
26C
apite
lla c
apita
ta58
235
Ow
enia
fusi
form
is ju
v.23
6 31
O
wen
ia fu
sifo
rmis
juv.
22
2 42
Gal
atho
wen
ia o
cula
ta11
527
Pect
inar
ia s
p. ju
v.18
936
Gal
atho
wen
ia o
cula
ta42
146
Gal
atho
wen
ia o
cula
ta19
7 42
G
alat
how
enia
ocu
lata
15
7 49
Pho
roni
s sp
.11
234
Spio
phan
es k
roye
ri91
41Th
yasi
ra fl
exuo
sa30
455
Spio
phan
es b
omby
x10
3 48
Ph
oron
is s
p.
123
54 T
hyas
ira fl
exuo
sa68
39Ph
oron
is s
p.73
45O
wen
ia fu
sifo
rmis
juv.
297
63Ph
oron
is s
p.83
52
Sp
ioph
anes
kro
yeri
110
58 O
wen
ia fu
sifo
rmis
juv.
6543
Pseu
dopo
lydo
ra p
auci
bran
chia
ta
6949
Pseu
dopo
lydo
ra
101
66Am
phiu
ra fi
lifor
mis
77
56
Oph
iuro
idea
inde
t. ju
v.
79
61 O
phiu
roid
ea in
det.
juv.
6047
Para
mph
inom
e je
ffrey
sii
6652
Spio
phan
es b
omby
x81
68O
phiu
roid
ea in
det.
juv.
57
59
Amph
iura
filif
orm
is
76
65 P
aram
phin
ome
jeffr
eysi
i51
50O
phiu
roid
ea in
det.
juv.
5255
Phor
onis
sp.
7770
Thya
sira
flex
uosa
57
62
Thya
sira
flex
uosa
57
67
Am
phiu
ra fi
lifor
mis
5053
Mug
ga w
ahrb
ergi
5158
Oph
iuro
idea
inde
t. ju
v.73
72Sp
ioph
anes
kro
yeri
50
65
Tim
ocle
a ov
ata
50
69 M
ugga
wah
rber
gi50
56O
wen
ia fu
sifo
rmis
juv.
4560
Para
mph
inom
e je
ffrey
sii
7174
Mug
ga w
ahrb
ergi
40
67
Spi
opha
nes
kroy
eri
5060
FRY1
2 (2
40°/
500
m)
No.
in
d.
Acc.
%
FRY1
3 (2
40°/
250
m)
No.
in
d.Ac
c.
%FR
Y14
(60°
/250
m)
No.
in
d.Ac
c.
%FR
Y15
(60°
/500
m)
No.
in
d.Ac
c.
%FR
Y18R
(60°
/100
00 m
) N
o.
ind.
Acc.
%
Gal
atho
wen
iaoc
ulat
a36
515
Pect
inar
iasp
.juv
.25
713
Pect
inar
iasp
.juv
.58
926
Pect
inar
iasp
.juv
.31
116
Gal
atho
wen
iaoc
ulat
a40
013
Ow
enia
fusi
form
is ju
v.
337
28 G
alat
how
enia
ocu
lata
232
24G
alat
how
enia
ocu
lata
184
34G
alat
how
enia
ocu
lata
177
25O
wen
ia fu
sifo
rmis
juv.
315
24
Pect
inar
ia s
p. ju
v.
221
37 T
hyas
ira fl
exuo
sa21
435
Thya
sira
flex
uosa
137
40Sp
ioph
anes
bom
byx
147
33Pe
ctin
aria
sp.
juv.
291
34
Ditr
upa
arie
tina
203
45 P
horo
nis
sp.
100
40Ph
oron
is s
p.12
146
Ow
enia
fusi
form
is ju
v.12
840
Mug
ga w
ahrb
ergi
144
39
Spio
phan
es b
omby
x 14
0 51
Ow
enia
fusi
form
is ju
v.94
45Sp
ioph
anes
kro
yeri
7449
Phor
onis
sp.
8544
Myr
ioch
ele
fragi
lis14
1 43
M
ugga
wah
rber
gi
91
54 S
piop
hane
s kr
oyer
i90
49C
haet
ozon
e sp
.72
52Sp
ioph
anes
kro
yeri
8349
Spio
phan
es b
omby
x11
1 47
Ph
oron
is s
p.
86
58 O
phiu
roid
ea in
det.
juv.
8354
Ow
enia
fusi
form
is ju
v.68
55Am
phiu
ra fi
lifor
mis
6752
Laon
ice
sars
i11
0 51
O
phiu
roid
ea in
det.
juv.
82
61
Pse
udop
olyd
ora
7557
Spio
phan
es b
omby
x66
58O
phiu
roid
ea in
det.
juv.
6655
Pseu
dopo
lydo
ra
106
54
Amph
iura
filif
orm
is
64
63 M
ugga
wah
rber
gi51
60O
phiu
roid
ea in
det.
juv.
6561
Mug
ga w
ahrb
ergi
4458
Thya
sira
cro
ulin
ensi
s10
1 58
Th
yasi
ra fl
exuo
sa
63
66 P
aram
phin
ome
jeffr
eysi
i47
62Ps
eudo
poly
dora
pau
cibr
anch
iata
54
63Th
yasi
ra fl
exuo
sa37
60Ph
oron
is s
p.90
61
Uro
thoe
ele
gans
3762
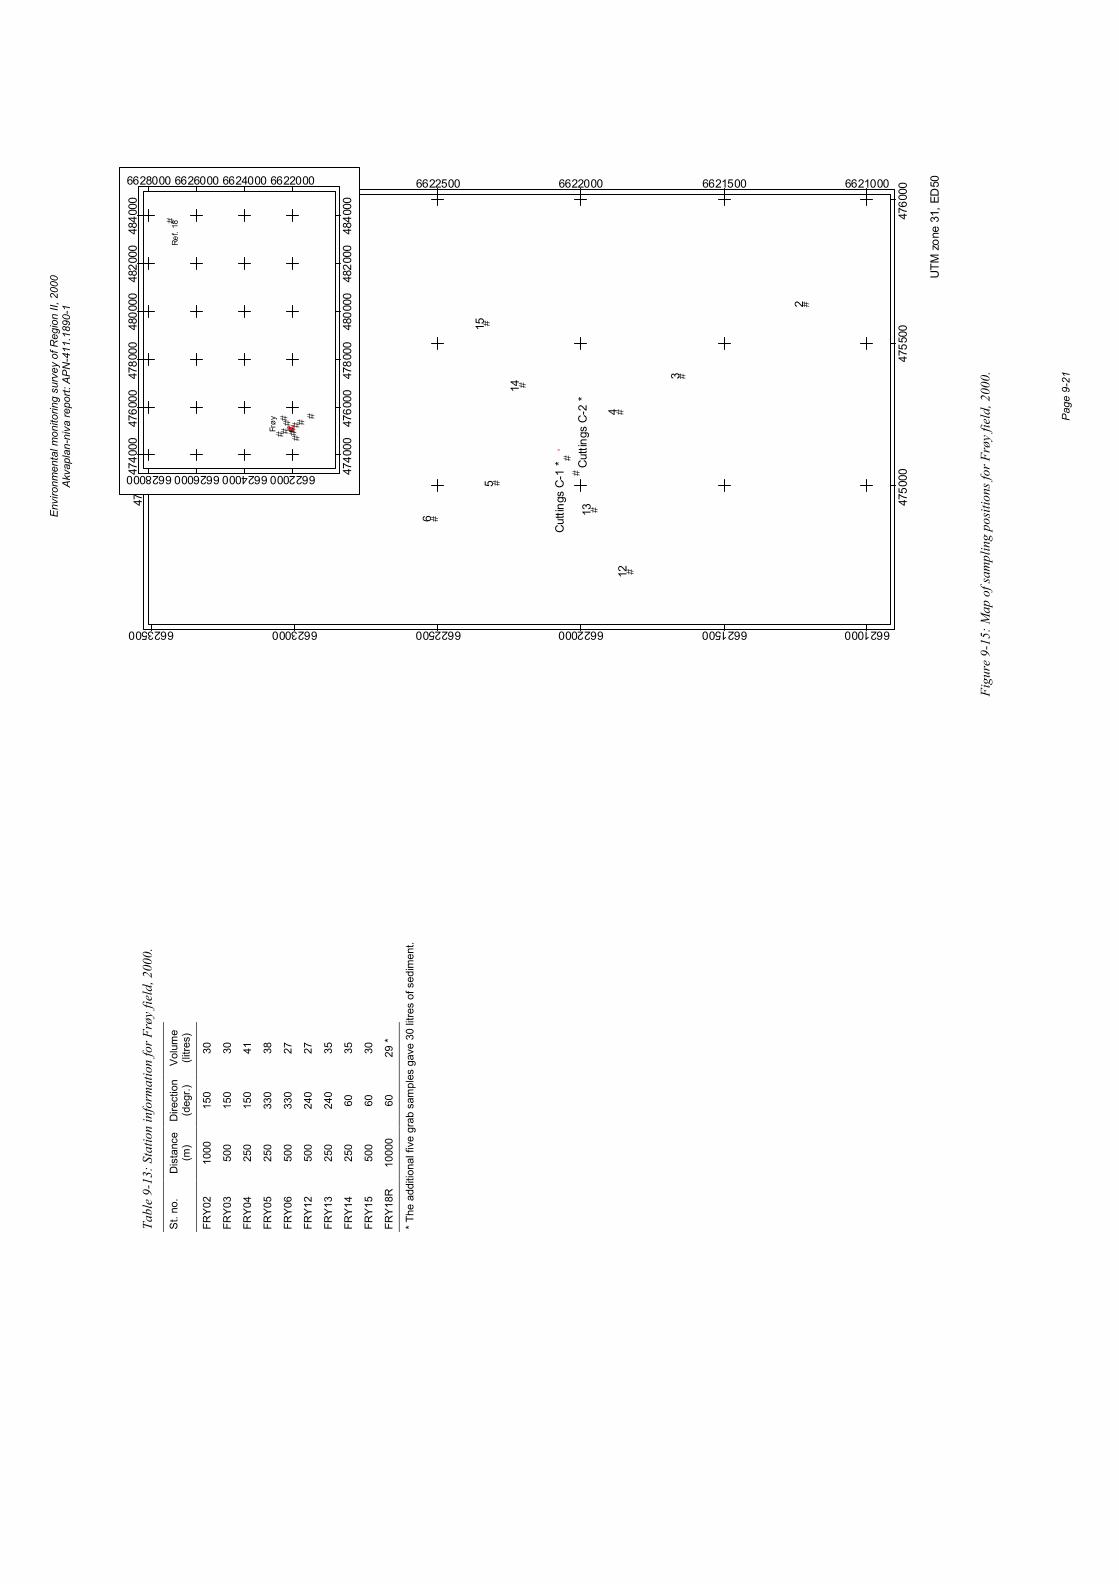
Envi
ronm
enta
l mon
itorin
g su
rvey
of R
egio
n II,
200
0 Ak
vapl
an-n
iva
repo
rt: A
PN-4
11.1
890-
1
Pa
ge 9
-21
#
#
#
#
#
#
#
#
#
##
'
2
3
4
5
6
12
13
14
15
Cut
tings
C-1
* Cut
tings
C-2
*
4750
00
4750
00
4755
00
4755
00
4760
00
4760
00
6621000
6621000
6621500
6621500
6622000
6622000
6622500
6622500
6623000
6623000
6623500
6623500
UTM
zon
e 31
, ED
50
###
## ##
##
#
# #&
Ref.
18
Frøy
4740
00
4740
00
4760
00
4760
00
4780
00
4780
00
4800
00
4800
00
4820
00
4820
00
4840
00
4840
00
6622000
6622000
6624000
6624000
6626000
6626000
6628000
6628000
Figu
re 9
-15:
Map
of s
ampl
ing
posit
ions
for F
røy
field
, 200
0.
Tabl
e 9-
13: S
tatio
n in
form
atio
n fo
r Frø
y fie
ld, 2
000.
St. n
o.
Dis
tanc
e (m
) D
irect
ion
(deg
r.)
Volu
me
(litre
s)
FRY0
2 10
00
150
30
FRY0
3 50
0 15
0 30
FRY0
4 25
0 15
0 41
FRY0
5 25
0 33
0 38
FRY0
6 50
0 33
0 27
FRY1
2 50
0 24
0 27
FRY1
3 25
0 24
0 35
FRY1
4 25
0 60
35
FRY1
5 50
0 60
30
FRY1
8R
1000
0 60
29
*
* The
add
ition
al fi
ve g
rab
sam
ples
gav
e 30
litre
s of
sed
imen
t.

Envi
ronm
enta
l mon
itorin
g su
rvey
of R
egio
n II,
200
0 Ak
vapl
an-n
iva
repo
rt: A
PN-4
11.1
890-
1
Pa
ge 9
-22
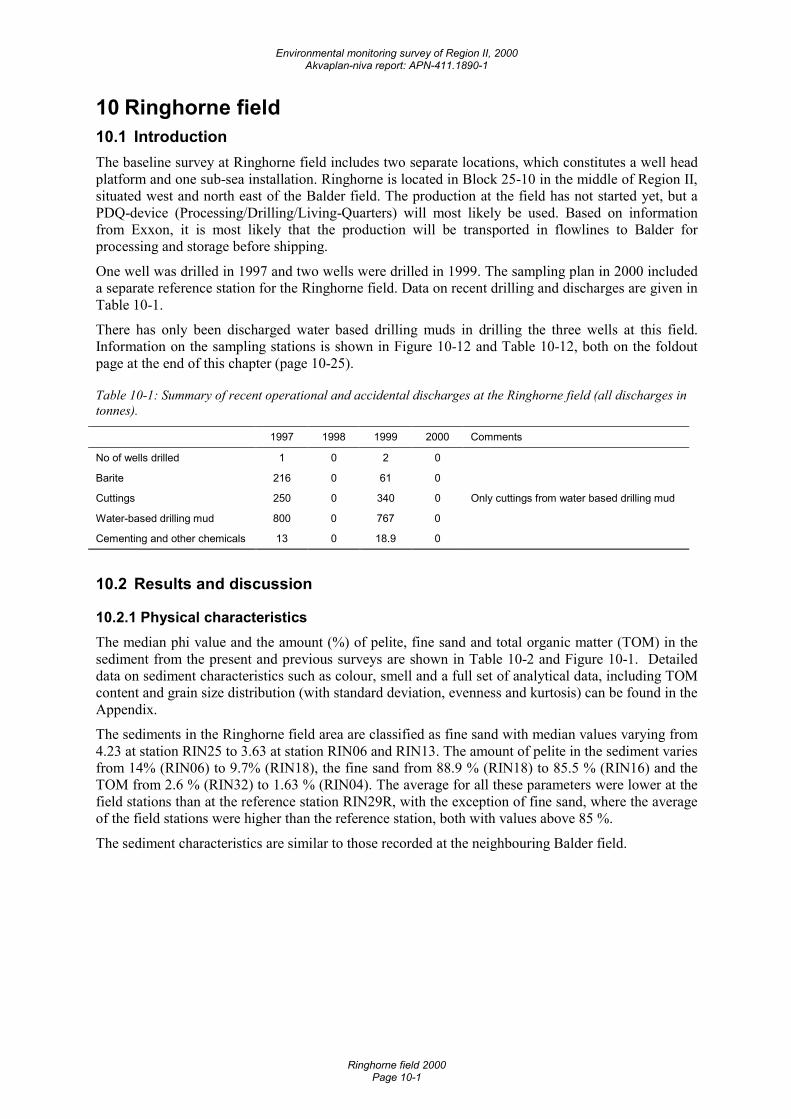
Environmental monitoring survey of Region II, 2000 Akvaplan-niva report: APN-411.1890-1
Ringhorne field 2000 Page 10-1
10 Ringhorne field 10.1 Introduction The baseline survey at Ringhorne field includes two separate locations, which constitutes a well head platform and one sub-sea installation. Ringhorne is located in Block 25-10 in the middle of Region II, situated west and north east of the Balder field. The production at the field has not started yet, but a PDQ-device (Processing/Drilling/Living-Quarters) will most likely be used. Based on information from Exxon, it is most likely that the production will be transported in flowlines to Balder for processing and storage before shipping.
One well was drilled in 1997 and two wells were drilled in 1999. The sampling plan in 2000 included a separate reference station for the Ringhorne field. Data on recent drilling and discharges are given in Table 10-1.
There has only been discharged water based drilling muds in drilling the three wells at this field. Information on the sampling stations is shown in Figure 10-12 and Table 10-12, both on the foldout page at the end of this chapter (page 10-25).
Table 10-1: Summary of recent operational and accidental discharges at the Ringhorne field (all discharges in tonnes).
1997 1998 1999 2000 Comments
No of wells drilled 1 0 2 0
Barite 216 0 61 0
Cuttings 250 0 340 0 Only cuttings from water based drilling mud
Water-based drilling mud 800 0 767 0
Cementing and other chemicals 13 0 18.9 0
10.2 Results and discussion
10.2.1 Physical characteristics The median phi value and the amount (%) of pelite, fine sand and total organic matter (TOM) in the sediment from the present and previous surveys are shown in Table 10-2 and Figure 10-1. Detailed data on sediment characteristics such as colour, smell and a full set of analytical data, including TOM content and grain size distribution (with standard deviation, evenness and kurtosis) can be found in the Appendix.
The sediments in the Ringhorne field area are classified as fine sand with median values varying from 4.23 at station RIN25 to 3.63 at station RIN06 and RIN13. The amount of pelite in the sediment varies from 14% (RIN06) to 9.7% (RIN18), the fine sand from 88.9 % (RIN18) to 85.5 % (RIN16) and the TOM from 2.6 % (RIN32) to 1.63 % (RIN04). The average for all these parameters were lower at the field stations than at the reference station RIN29R, with the exception of fine sand, where the average of the field stations were higher than the reference station, both with values above 85 %.
The sediment characteristics are similar to those recorded at the neighbouring Balder field.
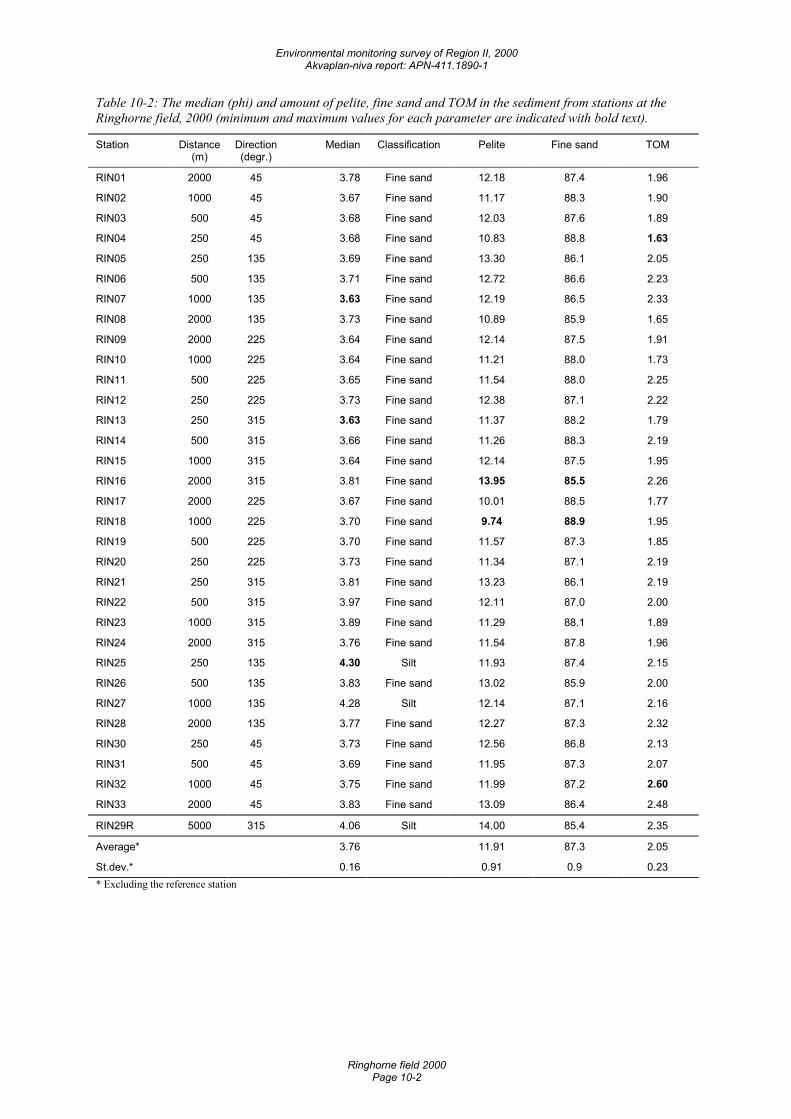
Environmental monitoring survey of Region II, 2000 Akvaplan-niva report: APN-411.1890-1
Ringhorne field 2000 Page 10-2
Table 10-2: The median (phi) and amount of pelite, fine sand and TOM in the sediment from stations at the Ringhorne field, 2000 (minimum and maximum values for each parameter are indicated with bold text).
Station Distance (m)
Direction (degr.)
Median Classification Pelite Fine sand TOM
RIN01 2000 45 3.78 Fine sand 12.18 87.4 1.96
RIN02 1000 45 3.67 Fine sand 11.17 88.3 1.90
RIN03 500 45 3.68 Fine sand 12.03 87.6 1.89
RIN04 250 45 3.68 Fine sand 10.83 88.8 1.63
RIN05 250 135 3.69 Fine sand 13.30 86.1 2.05
RIN06 500 135 3.71 Fine sand 12.72 86.6 2.23
RIN07 1000 135 3.63 Fine sand 12.19 86.5 2.33
RIN08 2000 135 3.73 Fine sand 10.89 85.9 1.65
RIN09 2000 225 3.64 Fine sand 12.14 87.5 1.91
RIN10 1000 225 3.64 Fine sand 11.21 88.0 1.73
RIN11 500 225 3.65 Fine sand 11.54 88.0 2.25
RIN12 250 225 3.73 Fine sand 12.38 87.1 2.22
RIN13 250 315 3.63 Fine sand 11.37 88.2 1.79
RIN14 500 315 3.66 Fine sand 11.26 88.3 2.19
RIN15 1000 315 3.64 Fine sand 12.14 87.5 1.95
RIN16 2000 315 3.81 Fine sand 13.95 85.5 2.26
RIN17 2000 225 3.67 Fine sand 10.01 88.5 1.77
RIN18 1000 225 3.70 Fine sand 9.74 88.9 1.95
RIN19 500 225 3.70 Fine sand 11.57 87.3 1.85
RIN20 250 225 3.73 Fine sand 11.34 87.1 2.19
RIN21 250 315 3.81 Fine sand 13.23 86.1 2.19
RIN22 500 315 3.97 Fine sand 12.11 87.0 2.00
RIN23 1000 315 3.89 Fine sand 11.29 88.1 1.89
RIN24 2000 315 3.76 Fine sand 11.54 87.8 1.96
RIN25 250 135 4.30 Silt 11.93 87.4 2.15
RIN26 500 135 3.83 Fine sand 13.02 85.9 2.00
RIN27 1000 135 4.28 Silt 12.14 87.1 2.16
RIN28 2000 135 3.77 Fine sand 12.27 87.3 2.32
RIN30 250 45 3.73 Fine sand 12.56 86.8 2.13
RIN31 500 45 3.69 Fine sand 11.95 87.3 2.07
RIN32 1000 45 3.75 Fine sand 11.99 87.2 2.60
RIN33 2000 45 3.83 Fine sand 13.09 86.4 2.48
RIN29R 5000 315 4.06 Silt 14.00 85.4 2.35
Average* 3.76 11.91 87.3 2.05
St.dev.* 0.16 0.91 0.9 0.23 * Excluding the reference station
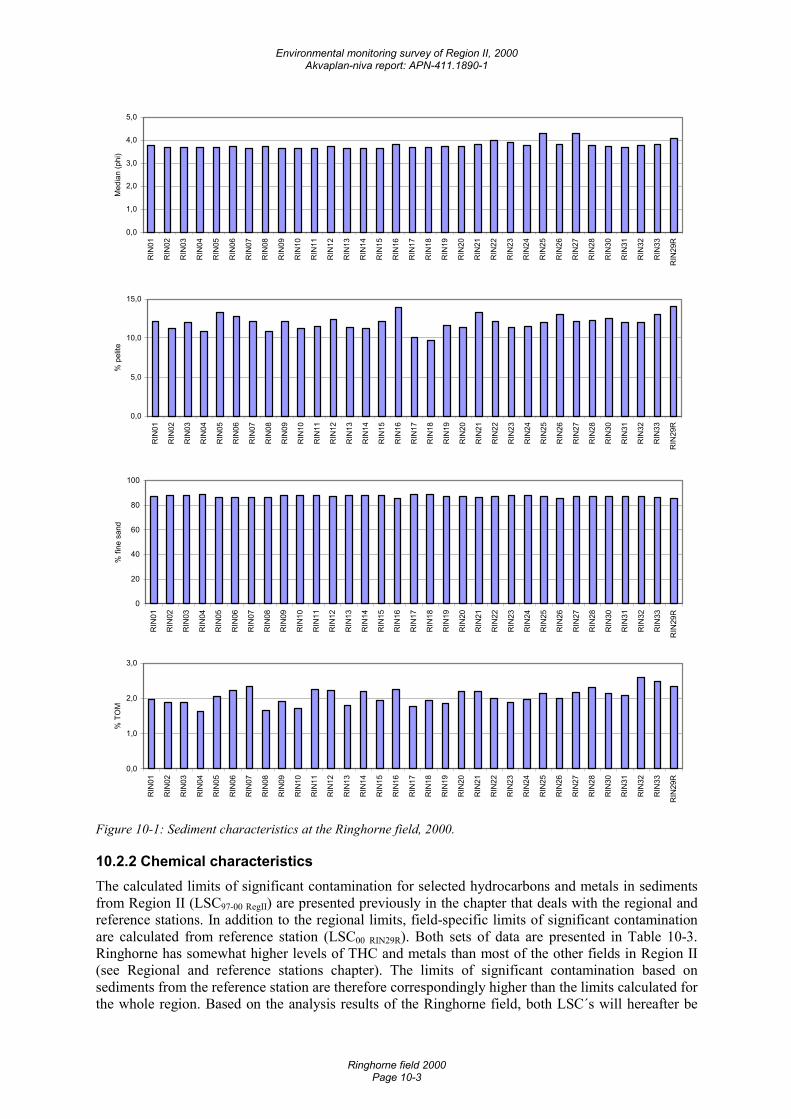
Environmental monitoring survey of Region II, 2000 Akvaplan-niva report: APN-411.1890-1
Ringhorne field 2000 Page 10-3
0,0
1,0
2,0
3,0
4,0
5,0
RIN
01
RIN
02
RIN
03
RIN
04
RIN
05
RIN
06
RIN
07
RIN
08
RIN
09
RIN
10
RIN
11
RIN
12
RIN
13
RIN
14
RIN
15
RIN
16
RIN
17
RIN
18
RIN
19
RIN
20
RIN
21
RIN
22
RIN
23
RIN
24
RIN
25
RIN
26
RIN
27
RIN
28
RIN
30
RIN
31
RIN
32
RIN
33
RIN
29R
Med
ian
(phi
)
0,0
5,0
10,0
15,0
RIN
01
RIN
02
RIN
03
RIN
04
RIN
05
RIN
06
RIN
07
RIN
08
RIN
09
RIN
10
RIN
11
RIN
12
RIN
13
RIN
14
RIN
15
RIN
16
RIN
17
RIN
18
RIN
19
RIN
20
RIN
21
RIN
22
RIN
23
RIN
24
RIN
25
RIN
26
RIN
27
RIN
28
RIN
30
RIN
31
RIN
32
RIN
33
RIN
29R
% p
elite
0
20
40
60
80
100
RIN
01
RIN
02
RIN
03
RIN
04
RIN
05
RIN
06
RIN
07
RIN
08
RIN
09
RIN
10
RIN
11
RIN
12
RIN
13
RIN
14
RIN
15
RIN
16
RIN
17
RIN
18
RIN
19
RIN
20
RIN
21
RIN
22
RIN
23
RIN
24
RIN
25
RIN
26
RIN
27
RIN
28
RIN
30
RIN
31
RIN
32
RIN
33
RIN
29R
% fi
ne s
and
0,0
1,0
2,0
3,0
RIN
01
RIN
02
RIN
03
RIN
04
RIN
05
RIN
06
RIN
07
RIN
08
RIN
09
RIN
10
RIN
11
RIN
12
RIN
13
RIN
14
RIN
15
RIN
16
RIN
17
RIN
18
RIN
19
RIN
20
RIN
21
RIN
22
RIN
23
RIN
24
RIN
25
RIN
26
RIN
27
RIN
28
RIN
30
RIN
31
RIN
32
RIN
33
RIN
29R
% T
OM
Figure 10-1: Sediment characteristics at the Ringhorne field, 2000.
10.2.2 Chemical characteristics The calculated limits of significant contamination for selected hydrocarbons and metals in sediments from Region II (LSC97-00 RegII) are presented previously in the chapter that deals with the regional and reference stations. In addition to the regional limits, field-specific limits of significant contamination are calculated from reference station (LSC00 RIN29R). Both sets of data are presented in Table 10-3. Ringhorne has somewhat higher levels of THC and metals than most of the other fields in Region II (see Regional and reference stations chapter). The limits of significant contamination based on sediments from the reference station are therefore correspondingly higher than the limits calculated for the whole region. Based on the analysis results of the Ringhorne field, both LSC´s will hereafter be
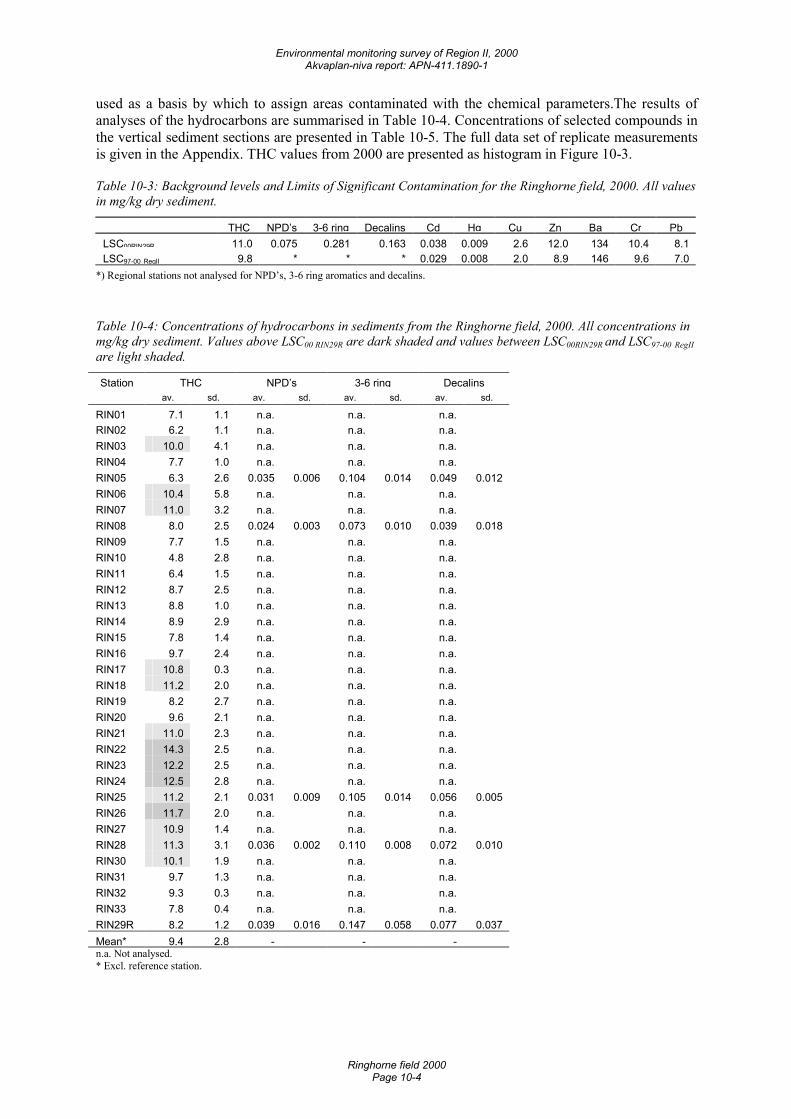
Environmental monitoring survey of Region II, 2000 Akvaplan-niva report: APN-411.1890-1
Ringhorne field 2000 Page 10-4
used as a basis by which to assign areas contaminated with the chemical parameters.The results of analyses of the hydrocarbons are summarised in Table 10-4. Concentrations of selected compounds in the vertical sediment sections are presented in Table 10-5. The full data set of replicate measurements is given in the Appendix. THC values from 2000 are presented as histogram in Figure 10-3.
Table 10-3: Background levels and Limits of Significant Contamination for the Ringhorne field, 2000. All values in mg/kg dry sediment.
THC NPD’s 3-6 ring Decalins Cd Hg Cu Zn Ba Cr PbLSC00RIN29R 11.0 0.075 0.281 0.163 0.038 0.009 2.6 12.0 134 10.4 8.1LSC97-00 RegII 9.8 * * * 0.029 0.008 2.0 8.9 146 9.6 7.0
*) Regional stations not analysed for NPD’s, 3-6 ring aromatics and decalins.
Table 10-4: Concentrations of hydrocarbons in sediments from the Ringhorne field, 2000. All concentrations in mg/kg dry sediment. Values above LSC00 RIN29R are dark shaded and values between LSC00RIN29R and LSC97-00 RegII are light shaded.
Station THC NPD’s 3-6 ring Decalins av. sd. av. sd. av. sd. av. sd.
RIN01 7.1 1.1 n.a. n.a. n.a.RIN02 6.2 1.1 n.a. n.a. n.a.RIN03 10.0 4.1 n.a. n.a. n.a.RIN04 7.7 1.0 n.a. n.a. n.a.RIN05 6.3 2.6 0.035 0.006 0.104 0.014 0.049 0.012RIN06 10.4 5.8 n.a. n.a. n.a.RIN07 11.0 3.2 n.a. n.a. n.a.RIN08 8.0 2.5 0.024 0.003 0.073 0.010 0.039 0.018RIN09 7.7 1.5 n.a. n.a. n.a.RIN10 4.8 2.8 n.a. n.a. n.a.RIN11 6.4 1.5 n.a. n.a. n.a.RIN12 8.7 2.5 n.a. n.a. n.a.RIN13 8.8 1.0 n.a. n.a. n.a.RIN14 8.9 2.9 n.a. n.a. n.a.RIN15 7.8 1.4 n.a. n.a. n.a.RIN16 9.7 2.4 n.a. n.a. n.a.RIN17 10.8 0.3 n.a. n.a. n.a.RIN18 11.2 2.0 n.a. n.a. n.a.RIN19 8.2 2.7 n.a. n.a. n.a.RIN20 9.6 2.1 n.a. n.a. n.a.RIN21 11.0 2.3 n.a. n.a. n.a.RIN22 14.3 2.5 n.a. n.a. n.a.RIN23 12.2 2.5 n.a. n.a. n.a.RIN24 12.5 2.8 n.a. n.a. n.a.RIN25 11.2 2.1 0.031 0.009 0.105 0.014 0.056 0.005RIN26 11.7 2.0 n.a. n.a. n.a.RIN27 10.9 1.4 n.a. n.a. n.a.RIN28 11.3 3.1 0.036 0.002 0.110 0.008 0.072 0.010RIN30 10.1 1.9 n.a. n.a. n.a.RIN31 9.7 1.3 n.a. n.a. n.a.RIN32 9.3 0.3 n.a. n.a. n.a.RIN33 7.8 0.4 n.a. n.a. n.a.RIN29R 8.2 1.2 0.039 0.016 0.147 0.058 0.077 0.037Mean* 9.4 2.8 - - -n.a. Not analysed. * Excl. reference station.
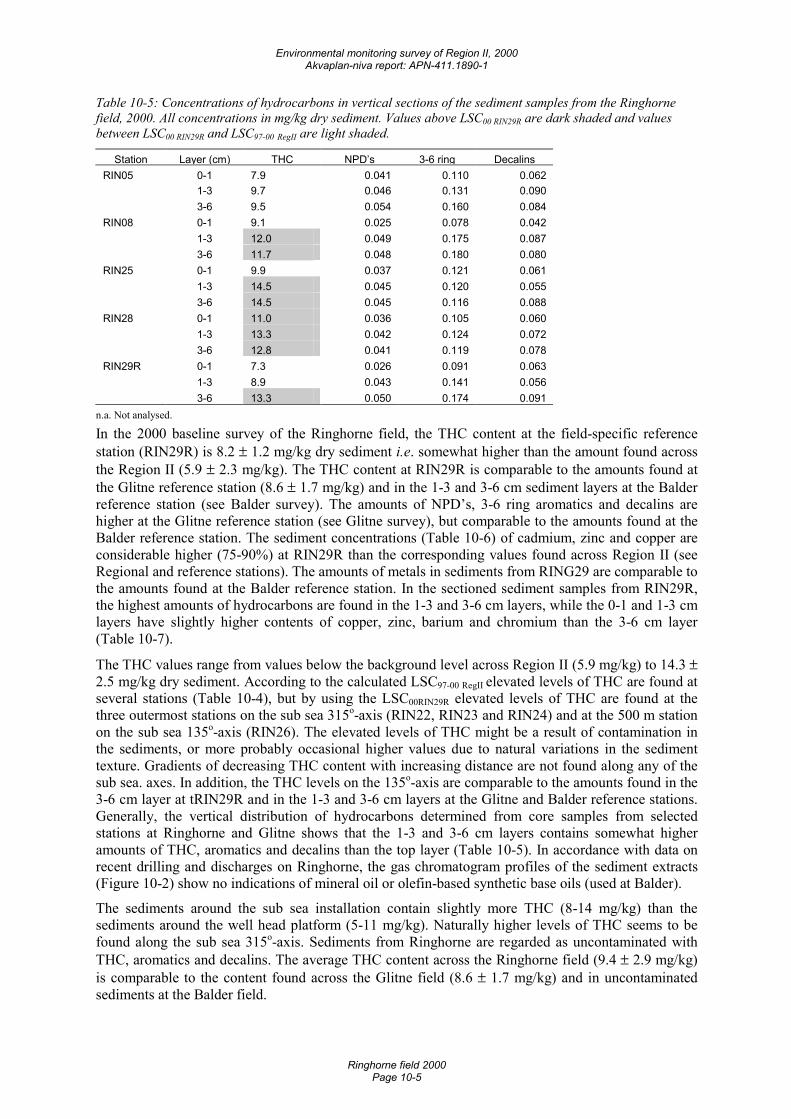
Environmental monitoring survey of Region II, 2000 Akvaplan-niva report: APN-411.1890-1
Ringhorne field 2000 Page 10-5
Table 10-5: Concentrations of hydrocarbons in vertical sections of the sediment samples from the Ringhorne field, 2000. All concentrations in mg/kg dry sediment. Values above LSC00 RIN29R are dark shaded and values between LSC00 RIN29R and LSC97-00 RegII are light shaded.
Station Layer (cm) THC NPD’s 3-6 ring DecalinsRIN05 0-1 7.9 0.041 0.110 0.062 1-3 9.7 0.046 0.131 0.090 3-6 9.5 0.054 0.160 0.084RIN08 0-1 9.1 0.025 0.078 0.042 1-3 12.0 0.049 0.175 0.087 3-6 11.7 0.048 0.180 0.080RIN25 0-1 9.9 0.037 0.121 0.061 1-3 14.5 0.045 0.120 0.055 3-6 14.5 0.045 0.116 0.088RIN28 0-1 11.0 0.036 0.105 0.060 1-3 13.3 0.042 0.124 0.072 3-6 12.8 0.041 0.119 0.078RIN29R 0-1 7.3 0.026 0.091 0.063 1-3 8.9 0.043 0.141 0.056 3-6 13.3 0.050 0.174 0.091
n.a. Not analysed.
In the 2000 baseline survey of the Ringhorne field, the THC content at the field-specific reference station (RIN29R) is 8.2 ± 1.2 mg/kg dry sediment i.e. somewhat higher than the amount found across the Region II (5.9 ± 2.3 mg/kg). The THC content at RIN29R is comparable to the amounts found at the Glitne reference station (8.6 ± 1.7 mg/kg) and in the 1-3 and 3-6 cm sediment layers at the Balder reference station (see Balder survey). The amounts of NPD’s, 3-6 ring aromatics and decalins are higher at the Glitne reference station (see Glitne survey), but comparable to the amounts found at the Balder reference station. The sediment concentrations (Table 10-6) of cadmium, zinc and copper are considerable higher (75-90%) at RIN29R than the corresponding values found across Region II (see Regional and reference stations). The amounts of metals in sediments from RING29 are comparable to the amounts found at the Balder reference station. In the sectioned sediment samples from RIN29R, the highest amounts of hydrocarbons are found in the 1-3 and 3-6 cm layers, while the 0-1 and 1-3 cm layers have slightly higher contents of copper, zinc, barium and chromium than the 3-6 cm layer (Table 10-7).
The THC values range from values below the background level across Region II (5.9 mg/kg) to 14.3 ± 2.5 mg/kg dry sediment. According to the calculated LSC97-00 RegII elevated levels of THC are found at several stations (Table 10-4), but by using the LSC00RIN29R elevated levels of THC are found at the three outermost stations on the sub sea 315o-axis (RIN22, RIN23 and RIN24) and at the 500 m station on the sub sea 135o-axis (RIN26). The elevated levels of THC might be a result of contamination in the sediments, or more probably occasional higher values due to natural variations in the sediment texture. Gradients of decreasing THC content with increasing distance are not found along any of the sub sea. axes. In addition, the THC levels on the 135o-axis are comparable to the amounts found in the 3-6 cm layer at tRIN29R and in the 1-3 and 3-6 cm layers at the Glitne and Balder reference stations. Generally, the vertical distribution of hydrocarbons determined from core samples from selected stations at Ringhorne and Glitne shows that the 1-3 and 3-6 cm layers contains somewhat higher amounts of THC, aromatics and decalins than the top layer (Table 10-5). In accordance with data on recent drilling and discharges on Ringhorne, the gas chromatogram profiles of the sediment extracts (Figure 10-2) show no indications of mineral oil or olefin-based synthetic base oils (used at Balder).
The sediments around the sub sea installation contain slightly more THC (8-14 mg/kg) than the sediments around the well head platform (5-11 mg/kg). Naturally higher levels of THC seems to be found along the sub sea 315o-axis. Sediments from Ringhorne are regarded as uncontaminated with THC, aromatics and decalins. The average THC content across the Ringhorne field (9.4 ± 2.9 mg/kg) is comparable to the content found across the Glitne field (8.6 ± 1.7 mg/kg) and in uncontaminated sediments at the Balder field.
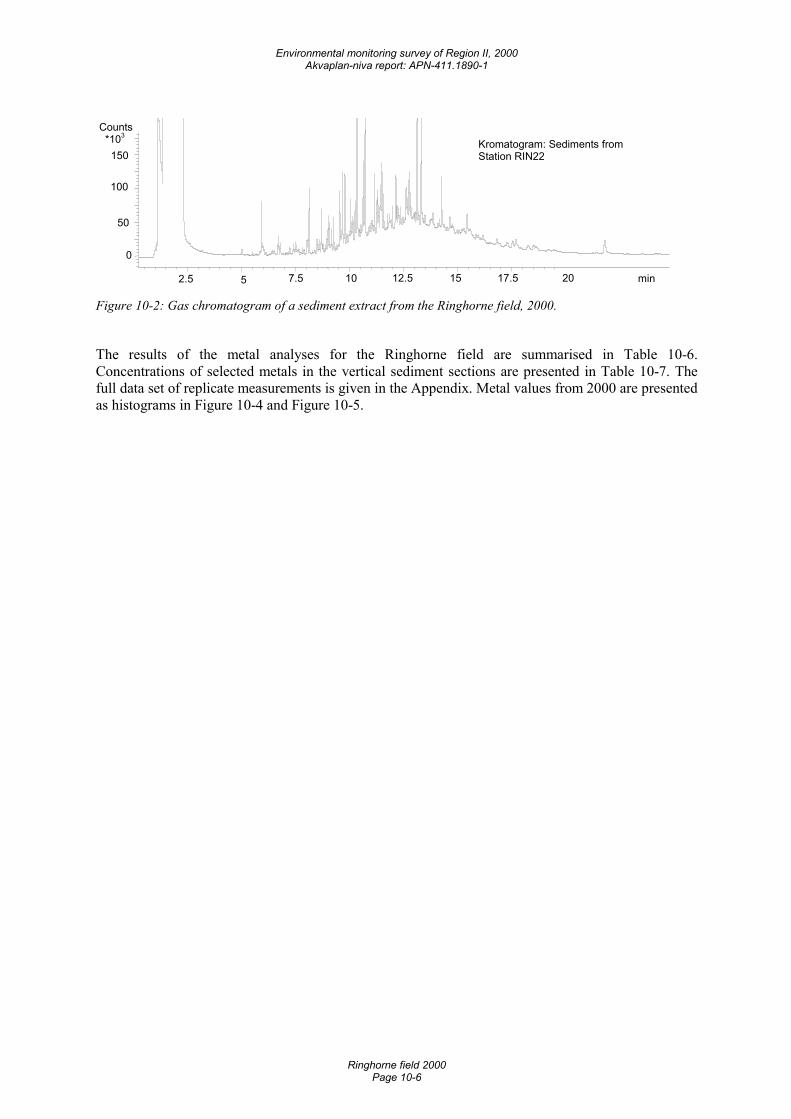
Environmental monitoring survey of Region II, 2000 Akvaplan-niva report: APN-411.1890-1
Ringhorne field 2000 Page 10-6
min2.5 5 7.5 10 12.5 15 17.5 20
Counts *103
0
50
100
150Kromatogram: Sediments fromStation RIN22
Figure 10-2: Gas chromatogram of a sediment extract from the Ringhorne field, 2000.
The results of the metal analyses for the Ringhorne field are summarised in Table 10-6. Concentrations of selected metals in the vertical sediment sections are presented in Table 10-7. The full data set of replicate measurements is given in the Appendix. Metal values from 2000 are presented as histograms in Figure 10-4 and Figure 10-5.
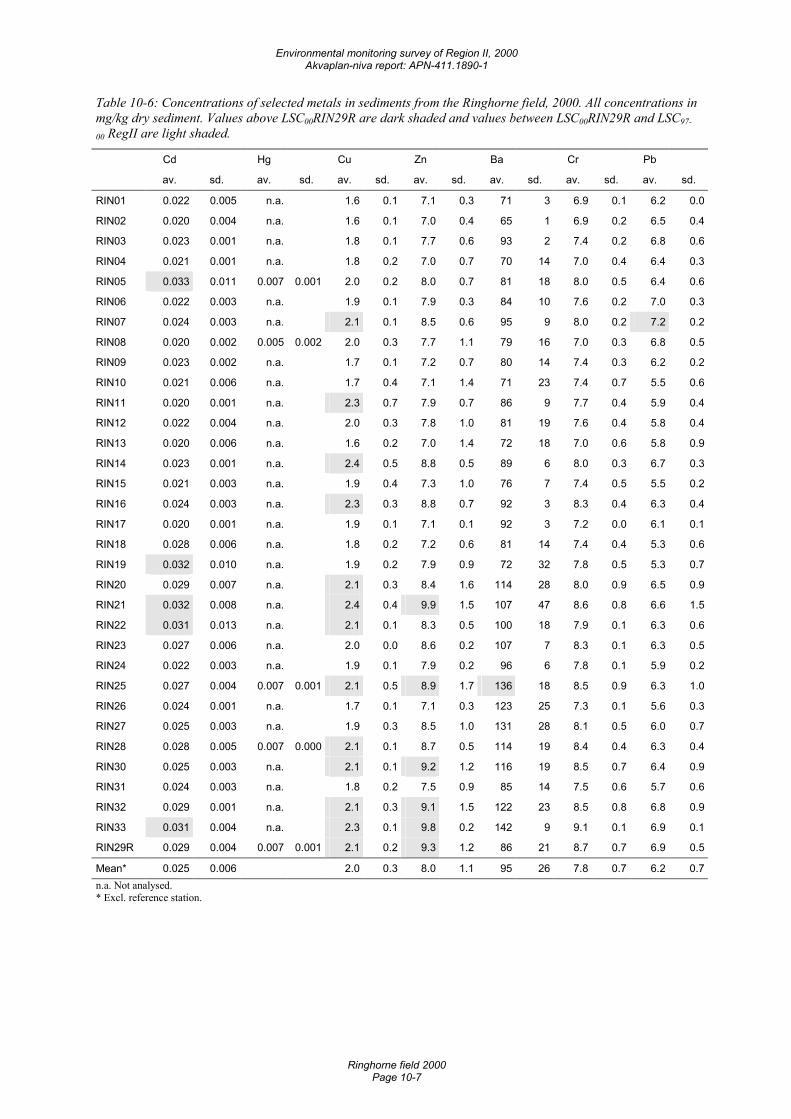
Environmental monitoring survey of Region II, 2000 Akvaplan-niva report: APN-411.1890-1
Ringhorne field 2000 Page 10-7
Table 10-6: Concentrations of selected metals in sediments from the Ringhorne field, 2000. All concentrations in mg/kg dry sediment. Values above LSC00RIN29R are dark shaded and values between LSC00RIN29R and LSC97-
00 RegII are light shaded.
Cd Hg Cu Zn Ba Cr Pb
av. sd. av. sd. av. sd. av. sd. av. sd. av. sd. av. sd.
RIN01 0.022 0.005 n.a. 1.6 0.1 7.1 0.3 71 3 6.9 0.1 6.2 0.0
RIN02 0.020 0.004 n.a. 1.6 0.1 7.0 0.4 65 1 6.9 0.2 6.5 0.4
RIN03 0.023 0.001 n.a. 1.8 0.1 7.7 0.6 93 2 7.4 0.2 6.8 0.6
RIN04 0.021 0.001 n.a. 1.8 0.2 7.0 0.7 70 14 7.0 0.4 6.4 0.3
RIN05 0.033 0.011 0.007 0.001 2.0 0.2 8.0 0.7 81 18 8.0 0.5 6.4 0.6
RIN06 0.022 0.003 n.a. 1.9 0.1 7.9 0.3 84 10 7.6 0.2 7.0 0.3
RIN07 0.024 0.003 n.a. 2.1 0.1 8.5 0.6 95 9 8.0 0.2 7.2 0.2
RIN08 0.020 0.002 0.005 0.002 2.0 0.3 7.7 1.1 79 16 7.0 0.3 6.8 0.5
RIN09 0.023 0.002 n.a. 1.7 0.1 7.2 0.7 80 14 7.4 0.3 6.2 0.2
RIN10 0.021 0.006 n.a. 1.7 0.4 7.1 1.4 71 23 7.4 0.7 5.5 0.6
RIN11 0.020 0.001 n.a. 2.3 0.7 7.9 0.7 86 9 7.7 0.4 5.9 0.4
RIN12 0.022 0.004 n.a. 2.0 0.3 7.8 1.0 81 19 7.6 0.4 5.8 0.4
RIN13 0.020 0.006 n.a. 1.6 0.2 7.0 1.4 72 18 7.0 0.6 5.8 0.9
RIN14 0.023 0.001 n.a. 2.4 0.5 8.8 0.5 89 6 8.0 0.3 6.7 0.3
RIN15 0.021 0.003 n.a. 1.9 0.4 7.3 1.0 76 7 7.4 0.5 5.5 0.2
RIN16 0.024 0.003 n.a. 2.3 0.3 8.8 0.7 92 3 8.3 0.4 6.3 0.4
RIN17 0.020 0.001 n.a. 1.9 0.1 7.1 0.1 92 3 7.2 0.0 6.1 0.1
RIN18 0.028 0.006 n.a. 1.8 0.2 7.2 0.6 81 14 7.4 0.4 5.3 0.6
RIN19 0.032 0.010 n.a. 1.9 0.2 7.9 0.9 72 32 7.8 0.5 5.3 0.7
RIN20 0.029 0.007 n.a. 2.1 0.3 8.4 1.6 114 28 8.0 0.9 6.5 0.9
RIN21 0.032 0.008 n.a. 2.4 0.4 9.9 1.5 107 47 8.6 0.8 6.6 1.5
RIN22 0.031 0.013 n.a. 2.1 0.1 8.3 0.5 100 18 7.9 0.1 6.3 0.6
RIN23 0.027 0.006 n.a. 2.0 0.0 8.6 0.2 107 7 8.3 0.1 6.3 0.5
RIN24 0.022 0.003 n.a. 1.9 0.1 7.9 0.2 96 6 7.8 0.1 5.9 0.2
RIN25 0.027 0.004 0.007 0.001 2.1 0.5 8.9 1.7 136 18 8.5 0.9 6.3 1.0
RIN26 0.024 0.001 n.a. 1.7 0.1 7.1 0.3 123 25 7.3 0.1 5.6 0.3
RIN27 0.025 0.003 n.a. 1.9 0.3 8.5 1.0 131 28 8.1 0.5 6.0 0.7
RIN28 0.028 0.005 0.007 0.000 2.1 0.1 8.7 0.5 114 19 8.4 0.4 6.3 0.4
RIN30 0.025 0.003 n.a. 2.1 0.1 9.2 1.2 116 19 8.5 0.7 6.4 0.9
RIN31 0.024 0.003 n.a. 1.8 0.2 7.5 0.9 85 14 7.5 0.6 5.7 0.6
RIN32 0.029 0.001 n.a. 2.1 0.3 9.1 1.5 122 23 8.5 0.8 6.8 0.9
RIN33 0.031 0.004 n.a. 2.3 0.1 9.8 0.2 142 9 9.1 0.1 6.9 0.1
RIN29R 0.029 0.004 0.007 0.001 2.1 0.2 9.3 1.2 86 21 8.7 0.7 6.9 0.5
Mean* 0.025 0.006 2.0 0.3 8.0 1.1 95 26 7.8 0.7 6.2 0.7n.a. Not analysed. * Excl. reference station.
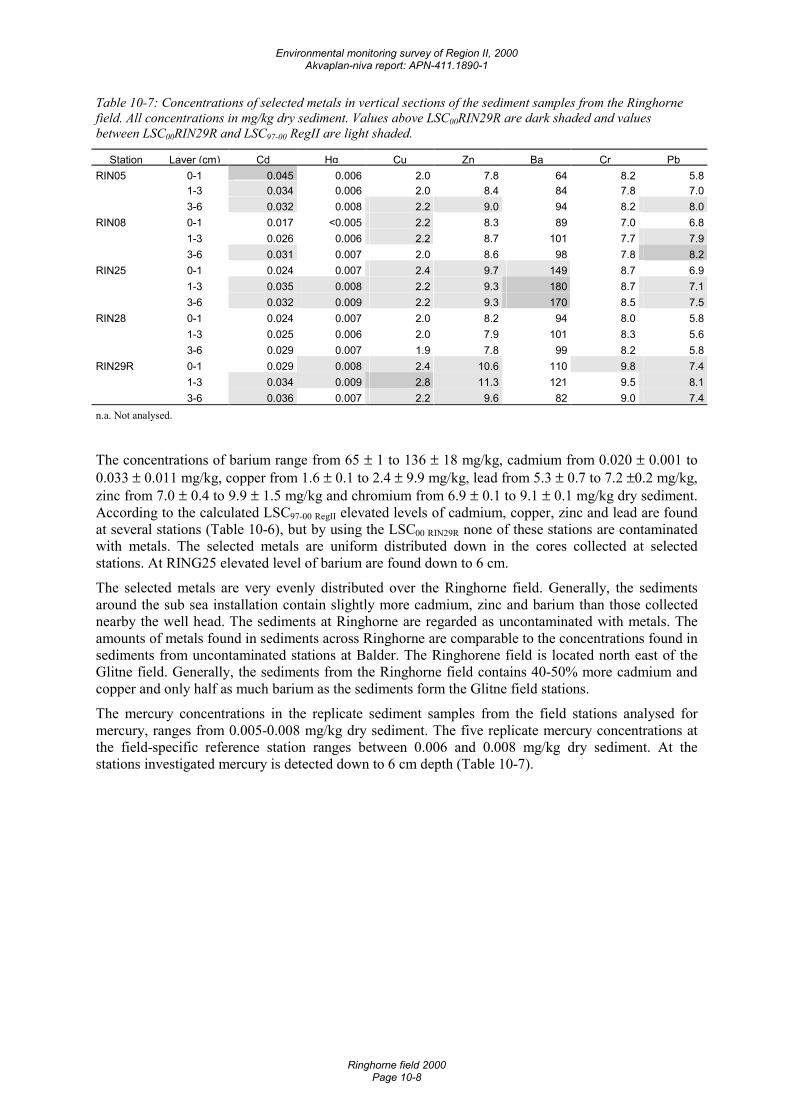
Environmental monitoring survey of Region II, 2000 Akvaplan-niva report: APN-411.1890-1
Ringhorne field 2000 Page 10-8
Table 10-7: Concentrations of selected metals in vertical sections of the sediment samples from the Ringhorne field. All concentrations in mg/kg dry sediment. Values above LSC00RIN29R are dark shaded and values between LSC00RIN29R and LSC97-00 RegII are light shaded.
Station Layer (cm) Cd Hg Cu Zn Ba Cr PbRIN05 0-1 0.045 0.006 2.0 7.8 64 8.2 5.8 1-3 0.034 0.006 2.0 8.4 84 7.8 7.0 3-6 0.032 0.008 2.2 9.0 94 8.2 8.0RIN08 0-1 0.017 <0.005 2.2 8.3 89 7.0 6.8 1-3 0.026 0.006 2.2 8.7 101 7.7 7.9 3-6 0.031 0.007 2.0 8.6 98 7.8 8.2RIN25 0-1 0.024 0.007 2.4 9.7 149 8.7 6.9 1-3 0.035 0.008 2.2 9.3 180 8.7 7.1 3-6 0.032 0.009 2.2 9.3 170 8.5 7.5RIN28 0-1 0.024 0.007 2.0 8.2 94 8.0 5.8 1-3 0.025 0.006 2.0 7.9 101 8.3 5.6 3-6 0.029 0.007 1.9 7.8 99 8.2 5.8RIN29R 0-1 0.029 0.008 2.4 10.6 110 9.8 7.4 1-3 0.034 0.009 2.8 11.3 121 9.5 8.1 3-6 0.036 0.007 2.2 9.6 82 9.0 7.4n.a. Not analysed.
The concentrations of barium range from 65 ± 1 to 136 ± 18 mg/kg, cadmium from 0.020 ± 0.001 to 0.033 ± 0.011 mg/kg, copper from 1.6 ± 0.1 to 2.4 ± 9.9 mg/kg, lead from 5.3 ± 0.7 to 7.2 ±0.2 mg/kg, zinc from 7.0 ± 0.4 to 9.9 ± 1.5 mg/kg and chromium from 6.9 ± 0.1 to 9.1 ± 0.1 mg/kg dry sediment. According to the calculated LSC97-00 RegII elevated levels of cadmium, copper, zinc and lead are found at several stations (Table 10-6), but by using the LSC00 RIN29R none of these stations are contaminated with metals. The selected metals are uniform distributed down in the cores collected at selected stations. At RING25 elevated level of barium are found down to 6 cm.
The selected metals are very evenly distributed over the Ringhorne field. Generally, the sediments around the sub sea installation contain slightly more cadmium, zinc and barium than those collected nearby the well head. The sediments at Ringhorne are regarded as uncontaminated with metals. The amounts of metals found in sediments across Ringhorne are comparable to the concentrations found in sediments from uncontaminated stations at Balder. The Ringhorene field is located north east of the Glitne field. Generally, the sediments from the Ringhorne field contains 40-50% more cadmium and copper and only half as much barium as the sediments form the Glitne field stations.
The mercury concentrations in the replicate sediment samples from the field stations analysed for mercury, ranges from 0.005-0.008 mg/kg dry sediment. The five replicate mercury concentrations at the field-specific reference station ranges between 0.006 and 0.008 mg/kg dry sediment. At the stations investigated mercury is detected down to 6 cm depth (Table 10-7).
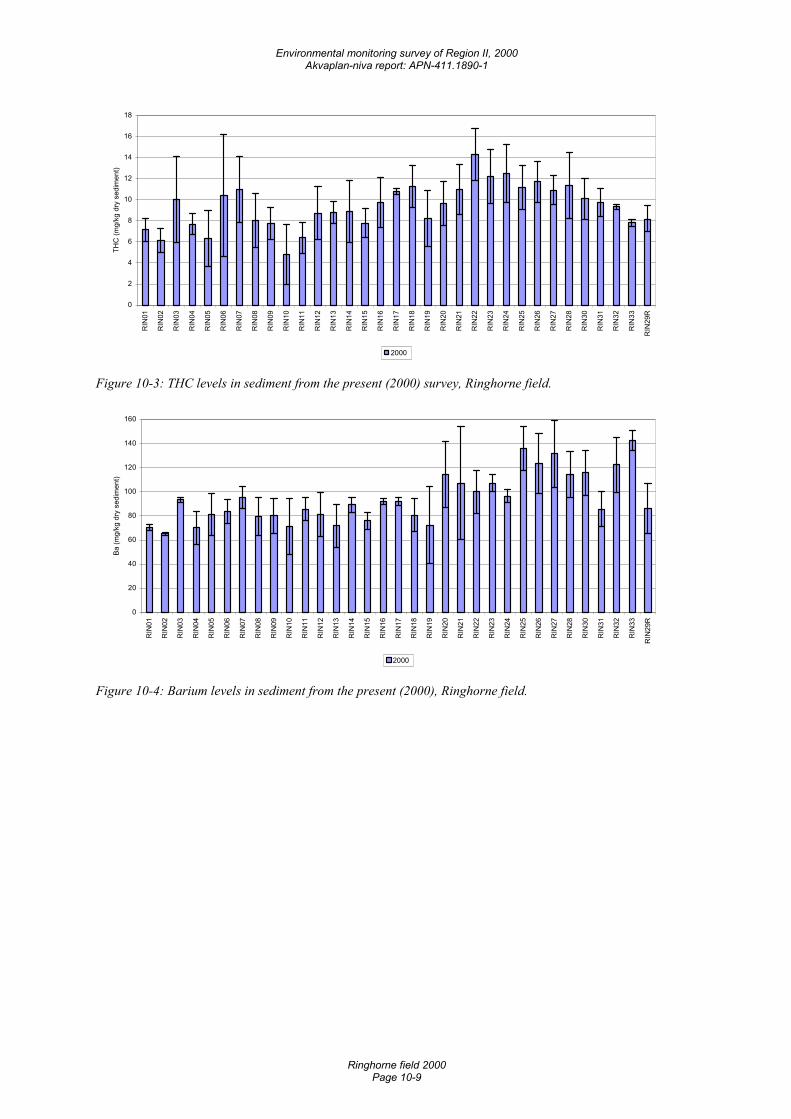
Environmental monitoring survey of Region II, 2000 Akvaplan-niva report: APN-411.1890-1
Ringhorne field 2000 Page 10-9
0
2
4
6
8
10
12
14
16
18
RIN
01
RIN
02
RIN
03
RIN
04
RIN
05
RIN
06
RIN
07
RIN
08
RIN
09
RIN
10
RIN
11
RIN
12
RIN
13
RIN
14
RIN
15
RIN
16
RIN
17
RIN
18
RIN
19
RIN
20
RIN
21
RIN
22
RIN
23
RIN
24
RIN
25
RIN
26
RIN
27
RIN
28
RIN
30
RIN
31
RIN
32
RIN
33
RIN
29R
THC
(mg/
kg d
ry s
edim
ent)
2000
Figure 10-3: THC levels in sediment from the present (2000) survey, Ringhorne field.
0
20
40
60
80
100
120
140
160
RIN
01
RIN
02
RIN
03
RIN
04
RIN
05
RIN
06
RIN
07
RIN
08
RIN
09
RIN
10
RIN
11
RIN
12
RIN
13
RIN
14
RIN
15
RIN
16
RIN
17
RIN
18
RIN
19
RIN
20
RIN
21
RIN
22
RIN
23
RIN
24
RIN
25
RIN
26
RIN
27
RIN
28
RIN
30
RIN
31
RIN
32
RIN
33
RIN
29R
Ba (m
g/kg
dry
sed
imen
t)
2000
Figure 10-4: Barium levels in sediment from the present (2000), Ringhorne field.
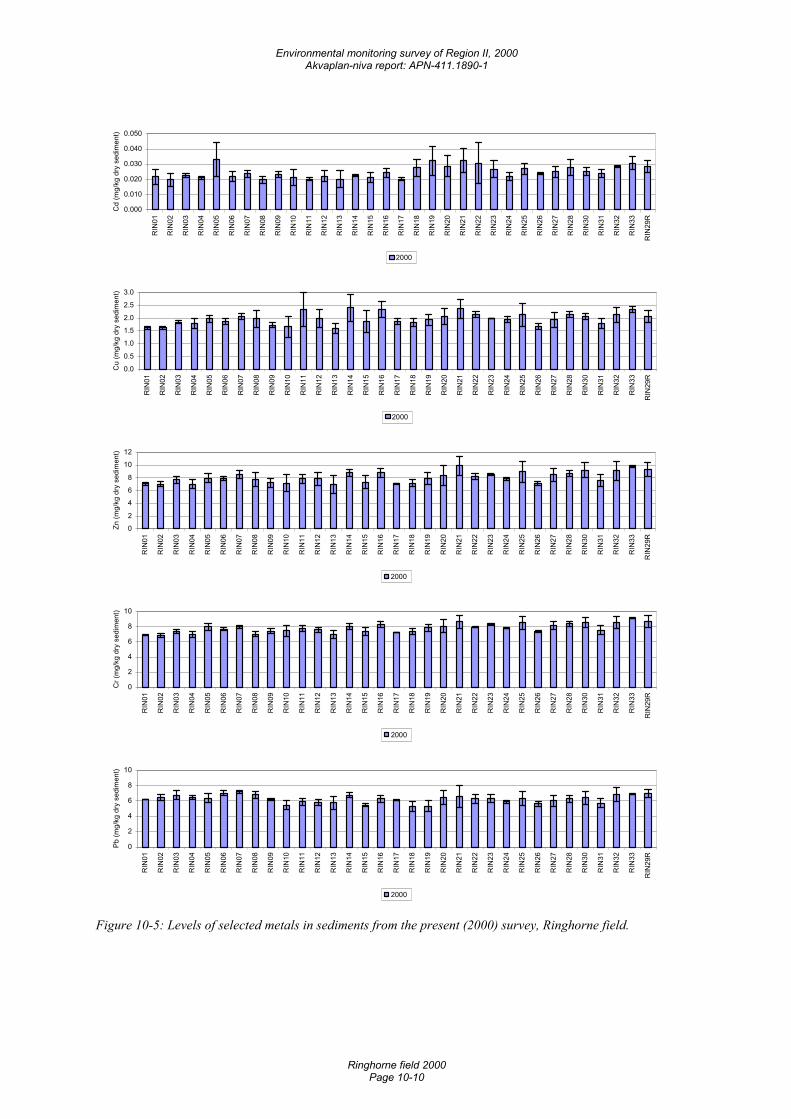
Environmental monitoring survey of Region II, 2000 Akvaplan-niva report: APN-411.1890-1
Ringhorne field 2000 Page 10-10
0.000
0.010
0.020
0.030
0.040
0.050
RIN
01
RIN
02
RIN
03
RIN
04
RIN
05
RIN
06
RIN
07
RIN
08
RIN
09
RIN
10
RIN
11
RIN
12
RIN
13
RIN
14
RIN
15
RIN
16
RIN
17
RIN
18
RIN
19
RIN
20
RIN
21
RIN
22
RIN
23
RIN
24
RIN
25
RIN
26
RIN
27
RIN
28
RIN
30
RIN
31
RIN
32
RIN
33
RIN
29R
Cd
(mg/
kg d
ry s
edim
ent)
2000
0.0
0.5
1.0
1.5
2.0
2.5
3.0
RIN
01
RIN
02
RIN
03
RIN
04
RIN
05
RIN
06
RIN
07
RIN
08
RIN
09
RIN
10
RIN
11
RIN
12
RIN
13
RIN
14
RIN
15
RIN
16
RIN
17
RIN
18
RIN
19
RIN
20
RIN
21
RIN
22
RIN
23
RIN
24
RIN
25
RIN
26
RIN
27
RIN
28
RIN
30
RIN
31
RIN
32
RIN
33
RIN
29R
Cu
(mg/
kg d
ry s
edim
ent)
2000
0
2
4
6
8
10
12
RIN
01
RIN
02
RIN
03
RIN
04
RIN
05
RIN
06
RIN
07
RIN
08
RIN
09
RIN
10
RIN
11
RIN
12
RIN
13
RIN
14
RIN
15
RIN
16
RIN
17
RIN
18
RIN
19
RIN
20
RIN
21
RIN
22
RIN
23
RIN
24
RIN
25
RIN
26
RIN
27
RIN
28
RIN
30
RIN
31
RIN
32
RIN
33
RIN
29R
Zn (m
g/kg
dry
sed
imen
t)
2000
0
2
4
6
8
10
RIN
01
RIN
02
RIN
03
RIN
04
RIN
05
RIN
06
RIN
07
RIN
08
RIN
09
RIN
10
RIN
11
RIN
12
RIN
13
RIN
14
RIN
15
RIN
16
RIN
17
RIN
18
RIN
19
RIN
20
RIN
21
RIN
22
RIN
23
RIN
24
RIN
25
RIN
26
RIN
27
RIN
28
RIN
30
RIN
31
RIN
32
RIN
33
RIN
29R
Cr (
mg/
kg d
ry s
edim
ent)
2000
0
2
4
6
8
10
RIN
01
RIN
02
RIN
03
RIN
04
RIN
05
RIN
06
RIN
07
RIN
08
RIN
09
RIN
10
RIN
11
RIN
12
RIN
13
RIN
14
RIN
15
RIN
16
RIN
17
RIN
18
RIN
19
RIN
20
RIN
21
RIN
22
RIN
23
RIN
24
RIN
25
RIN
26
RIN
27
RIN
28
RIN
30
RIN
31
RIN
32
RIN
33
RIN
29R
Pb (m
g/kg
dry
sed
imen
t)
2000
Figure 10-5: Levels of selected metals in sediments from the present (2000) survey, Ringhorne field.
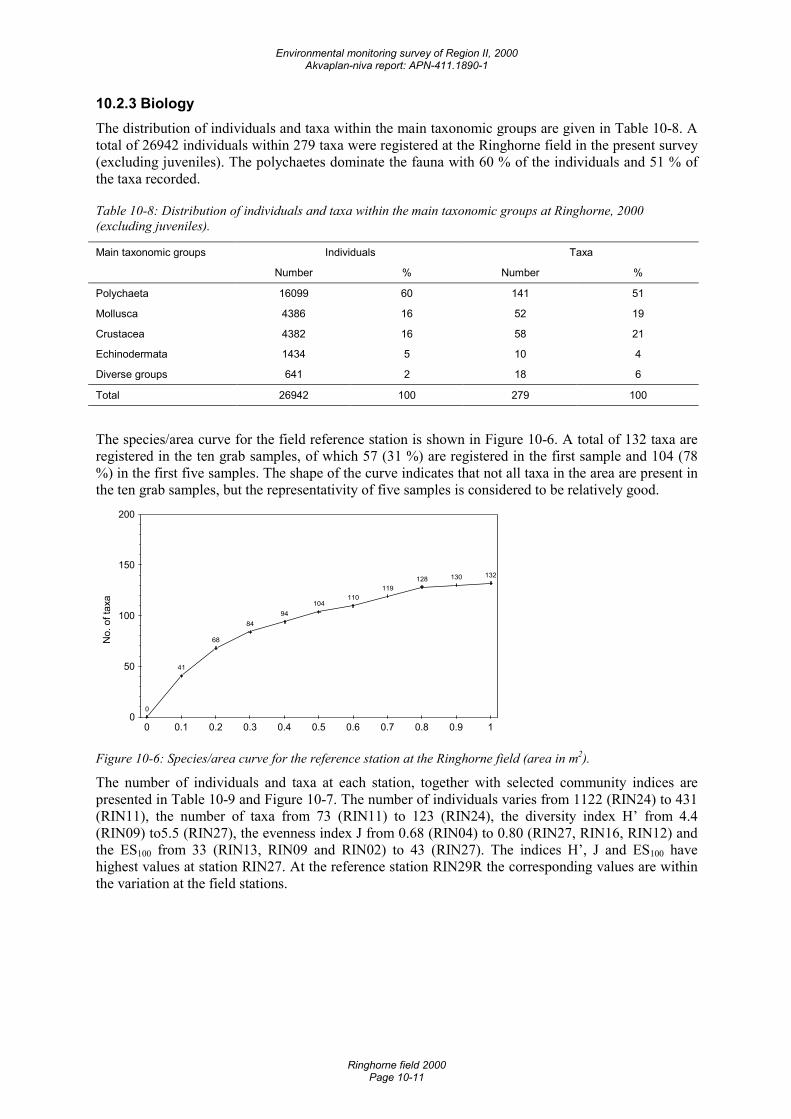
Environmental monitoring survey of Region II, 2000 Akvaplan-niva report: APN-411.1890-1
Ringhorne field 2000 Page 10-11
10.2.3 Biology The distribution of individuals and taxa within the main taxonomic groups are given in Table 10-8. A total of 26942 individuals within 279 taxa were registered at the Ringhorne field in the present survey (excluding juveniles). The polychaetes dominate the fauna with 60 % of the individuals and 51 % of the taxa recorded.
Table 10-8: Distribution of individuals and taxa within the main taxonomic groups at Ringhorne, 2000 (excluding juveniles).
Main taxonomic groups Individuals Taxa
Number % Number %
Polychaeta 16099 60 141 51
Mollusca 4386 16 52 19
Crustacea 4382 16 58 21
Echinodermata 1434 5 10 4
Diverse groups 641 2 18 6
Total 26942 100 279 100
The species/area curve for the field reference station is shown in Figure 10-6. A total of 132 taxa are registered in the ten grab samples, of which 57 (31 %) are registered in the first sample and 104 (78 %) in the first five samples. The shape of the curve indicates that not all taxa in the area are present in the ten grab samples, but the representativity of five samples is considered to be relatively good.
No.
of t
axa
0
41
68
8494
104110
119128 130 132
0
50
100
150
200
0 0.1 0.2 0.3 0.4 0.5 0.6 0.7 0.8 0.9 1
Figure 10-6: Species/area curve for the reference station at the Ringhorne field (area in m2).
The number of individuals and taxa at each station, together with selected community indices are presented in Table 10-9 and Figure 10-7. The number of individuals varies from 1122 (RIN24) to 431 (RIN11), the number of taxa from 73 (RIN11) to 123 (RIN24), the diversity index H’ from 4.4 (RIN09) to5.5 (RIN27), the evenness index J from 0.68 (RIN04) to 0.80 (RIN27, RIN16, RIN12) and the ES100 from 33 (RIN13, RIN09 and RIN02) to 43 (RIN27). The indices H’, J and ES100 have highest values at station RIN27. At the reference station RIN29R the corresponding values are within the variation at the field stations.
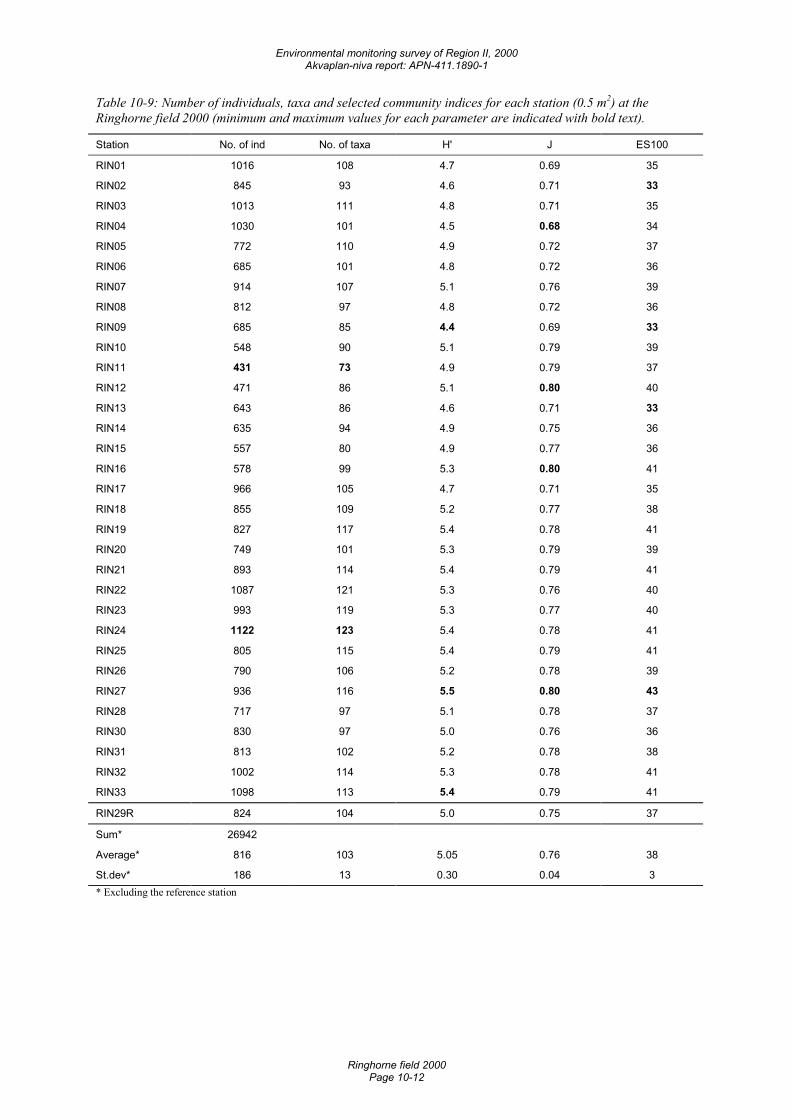
Environmental monitoring survey of Region II, 2000 Akvaplan-niva report: APN-411.1890-1
Ringhorne field 2000 Page 10-12
Table 10-9: Number of individuals, taxa and selected community indices for each station (0.5 m2) at the Ringhorne field 2000 (minimum and maximum values for each parameter are indicated with bold text).
Station No. of ind No. of taxa H' J ES100
RIN01 1016 108 4.7 0.69 35
RIN02 845 93 4.6 0.71 33
RIN03 1013 111 4.8 0.71 35
RIN04 1030 101 4.5 0.68 34
RIN05 772 110 4.9 0.72 37
RIN06 685 101 4.8 0.72 36
RIN07 914 107 5.1 0.76 39
RIN08 812 97 4.8 0.72 36
RIN09 685 85 4.4 0.69 33
RIN10 548 90 5.1 0.79 39
RIN11 431 73 4.9 0.79 37
RIN12 471 86 5.1 0.80 40
RIN13 643 86 4.6 0.71 33
RIN14 635 94 4.9 0.75 36
RIN15 557 80 4.9 0.77 36
RIN16 578 99 5.3 0.80 41
RIN17 966 105 4.7 0.71 35
RIN18 855 109 5.2 0.77 38
RIN19 827 117 5.4 0.78 41
RIN20 749 101 5.3 0.79 39
RIN21 893 114 5.4 0.79 41
RIN22 1087 121 5.3 0.76 40
RIN23 993 119 5.3 0.77 40
RIN24 1122 123 5.4 0.78 41
RIN25 805 115 5.4 0.79 41
RIN26 790 106 5.2 0.78 39
RIN27 936 116 5.5 0.80 43
RIN28 717 97 5.1 0.78 37
RIN30 830 97 5.0 0.76 36
RIN31 813 102 5.2 0.78 38
RIN32 1002 114 5.3 0.78 41
RIN33 1098 113 5.4 0.79 41
RIN29R 824 104 5.0 0.75 37
Sum* 26942
Average* 816 103 5.05 0.76 38
St.dev* 186 13 0.30 0.04 3 * Excluding the reference station
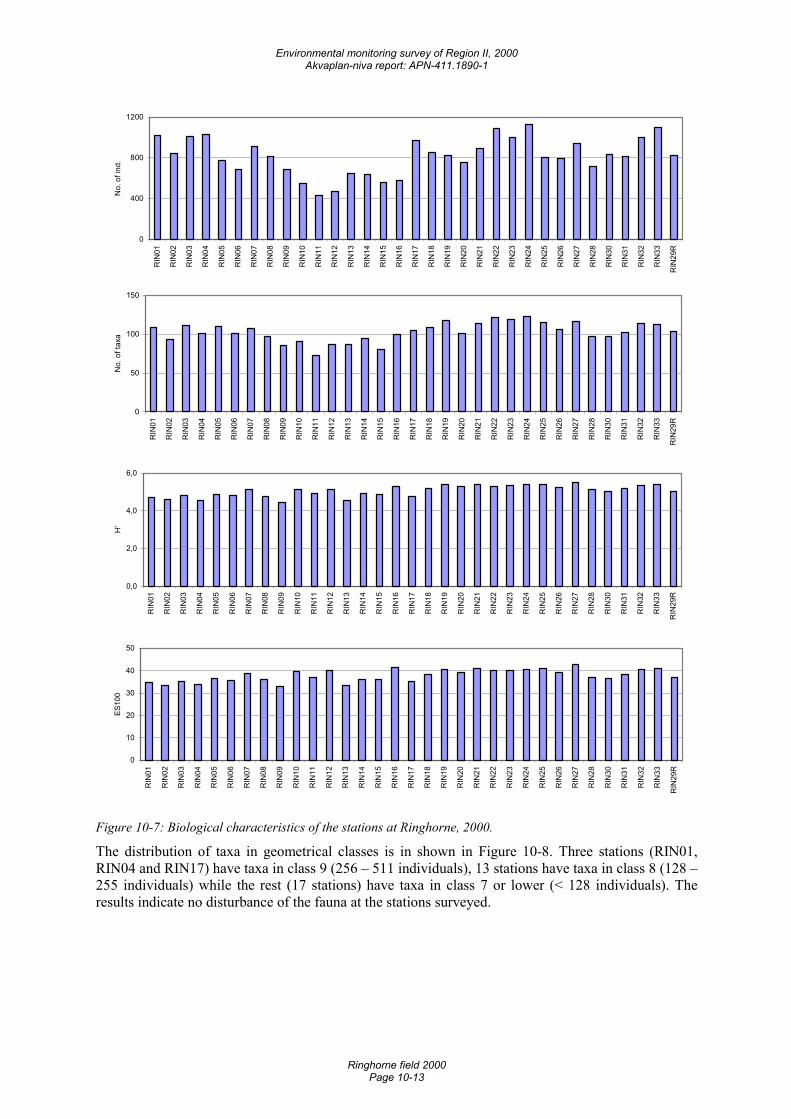
Environmental monitoring survey of Region II, 2000 Akvaplan-niva report: APN-411.1890-1
Ringhorne field 2000 Page 10-13
0
400
800
1200
RIN
01
RIN
02
RIN
03
RIN
04
RIN
05
RIN
06
RIN
07
RIN
08
RIN
09
RIN
10
RIN
11
RIN
12
RIN
13
RIN
14
RIN
15
RIN
16
RIN
17
RIN
18
RIN
19
RIN
20
RIN
21
RIN
22
RIN
23
RIN
24
RIN
25
RIN
26
RIN
27
RIN
28
RIN
30
RIN
31
RIN
32
RIN
33
RIN
29R
No.
of i
nd.
0
50
100
150
RIN
01
RIN
02
RIN
03
RIN
04
RIN
05
RIN
06
RIN
07
RIN
08
RIN
09
RIN
10
RIN
11
RIN
12
RIN
13
RIN
14
RIN
15
RIN
16
RIN
17
RIN
18
RIN
19
RIN
20
RIN
21
RIN
22
RIN
23
RIN
24
RIN
25
RIN
26
RIN
27
RIN
28
RIN
30
RIN
31
RIN
32
RIN
33
RIN
29R
No.
of t
axa
0,0
2,0
4,0
6,0
RIN
01
RIN
02
RIN
03
RIN
04
RIN
05
RIN
06
RIN
07
RIN
08
RIN
09
RIN
10
RIN
11
RIN
12
RIN
13
RIN
14
RIN
15
RIN
16
RIN
17
RIN
18
RIN
19
RIN
20
RIN
21
RIN
22
RIN
23
RIN
24
RIN
25
RIN
26
RIN
27
RIN
28
RIN
30
RIN
31
RIN
32
RIN
33
RIN
29R
H'
0
10
20
30
40
50
RIN
01
RIN
02
RIN
03
RIN
04
RIN
05
RIN
06
RIN
07
RIN
08
RIN
09
RIN
10
RIN
11
RIN
12
RIN
13
RIN
14
RIN
15
RIN
16
RIN
17
RIN
18
RIN
19
RIN
20
RIN
21
RIN
22
RIN
23
RIN
24
RIN
25
RIN
26
RIN
27
RIN
28
RIN
30
RIN
31
RIN
32
RIN
33
RIN
29R
ES10
0
Figure 10-7: Biological characteristics of the stations at Ringhorne, 2000.
The distribution of taxa in geometrical classes is in shown in Figure 10-8. Three stations (RIN01, RIN04 and RIN17) have taxa in class 9 (256 – 511 individuals), 13 stations have taxa in class 8 (128 – 255 individuals) while the rest (17 stations) have taxa in class 7 or lower (< 128 individuals). The results indicate no disturbance of the fauna at the stations surveyed.
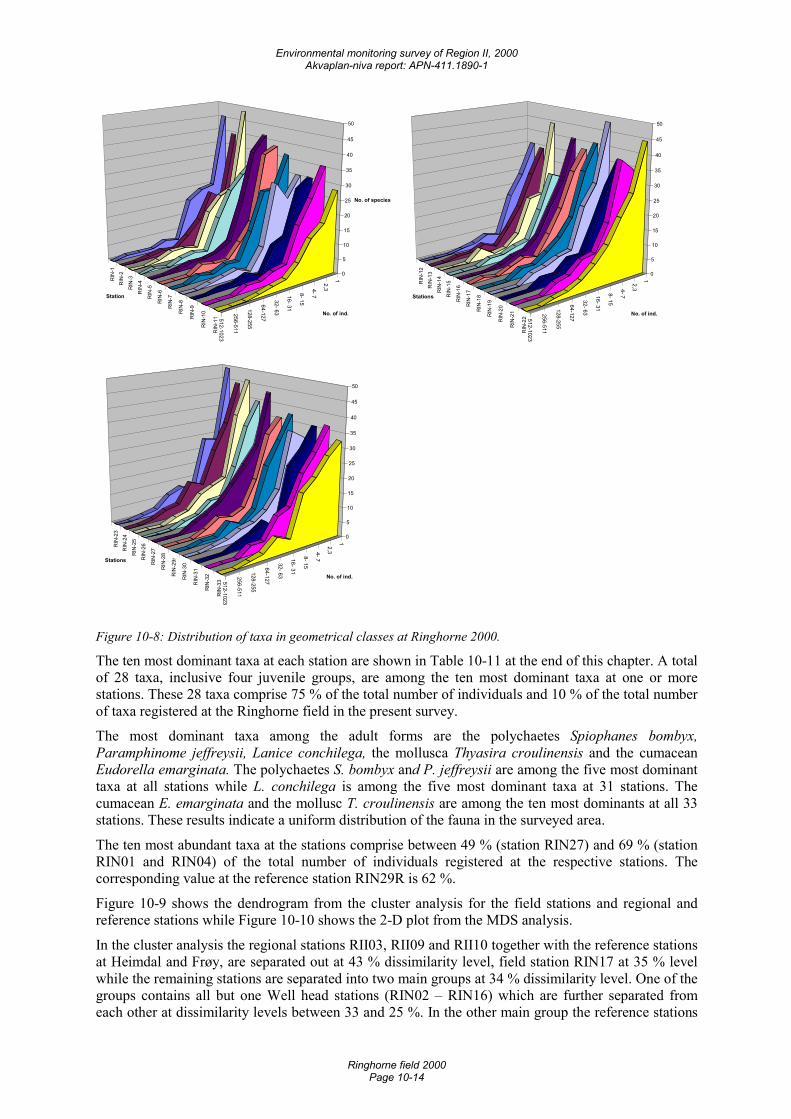
Environmental monitoring survey of Region II, 2000 Akvaplan-niva report: APN-411.1890-1
Ringhorne field 2000 Page 10-14
1
2,3 4- 7
8- 15
16- 31
32- 63
64-127
128-255
256-511
512-1023
RIN
-1R
IN-2
RIN
-3
RIN
-4
RIN
-5
RIN
-6
RIN
-7
RIN
-8
RIN
-9
RIN
-10
RIN
-11
0
5
10
15
20
25
30
35
40
45
50
No. of species
No. of ind.
Station
1
2,3 4- 7
8- 15
16- 31
32- 63
64-127
128-255
256-511
512-1023
RIN
-12
RIN
-13
RIN
-14
RIN
-15
RIN
-16
RIN
-17
RIN
-18
RIN
-19
RIN
-20
RIN
-21
RIN
-22
0
5
10
15
20
25
30
35
40
45
50
No. of ind.
Stations
1
2,3 4- 7
8- 15
16- 31
32- 63
64-127
128-255
256-511
512-1023
RIN
-23
RIN
-24
RIN
-25
RIN
-26
RIN
-27
RIN
-28
RIN
-29r
RIN
-30
RIN
-31
RIN
-32
RIN
-33
0
5
10
15
20
25
30
35
40
45
50
No. of ind.
Stations
Figure 10-8: Distribution of taxa in geometrical classes at Ringhorne 2000.
The ten most dominant taxa at each station are shown in Table 10-11 at the end of this chapter. A total of 28 taxa, inclusive four juvenile groups, are among the ten most dominant taxa at one or more stations. These 28 taxa comprise 75 % of the total number of individuals and 10 % of the total number of taxa registered at the Ringhorne field in the present survey.
The most dominant taxa among the adult forms are the polychaetes Spiophanes bombyx, Paramphinome jeffreysii, Lanice conchilega, the mollusca Thyasira croulinensis and the cumacean Eudorella emarginata. The polychaetes S. bombyx and P. jeffreysii are among the five most dominant taxa at all stations while L. conchilega is among the five most dominant taxa at 31 stations. The cumacean E. emarginata and the mollusc T. croulinensis are among the ten most dominants at all 33 stations. These results indicate a uniform distribution of the fauna in the surveyed area.
The ten most abundant taxa at the stations comprise between 49 % (station RIN27) and 69 % (station RIN01 and RIN04) of the total number of individuals registered at the respective stations. The corresponding value at the reference station RIN29R is 62 %.
Figure 10-9 shows the dendrogram from the cluster analysis for the field stations and regional and reference stations while Figure 10-10 shows the 2-D plot from the MDS analysis.
In the cluster analysis the regional stations RII03, RII09 and RII10 together with the reference stations at Heimdal and Frøy, are separated out at 43 % dissimilarity level, field station RIN17 at 35 % level while the remaining stations are separated into two main groups at 34 % dissimilarity level. One of the groups contains all but one Well head stations (RIN02 – RIN16) which are further separated from each other at dissimilarity levels between 33 and 25 %. In the other main group the reference stations
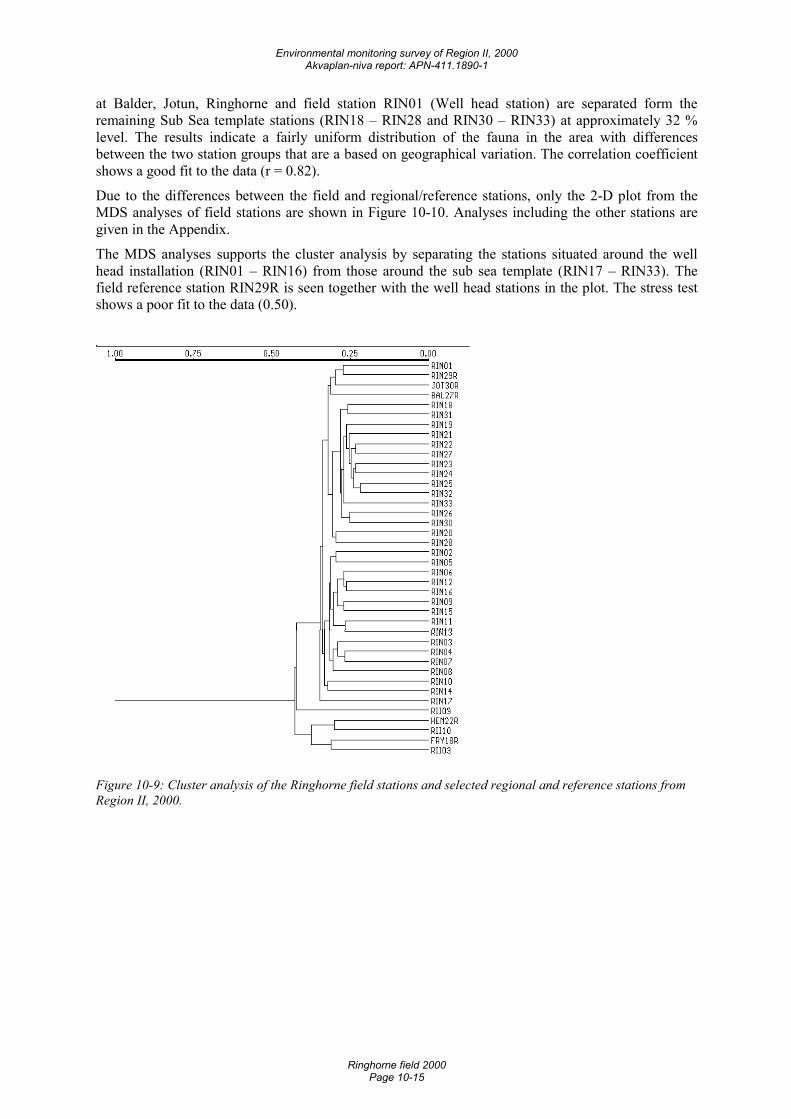
Environmental monitoring survey of Region II, 2000 Akvaplan-niva report: APN-411.1890-1
Ringhorne field 2000 Page 10-15
at Balder, Jotun, Ringhorne and field station RIN01 (Well head station) are separated form the remaining Sub Sea template stations (RIN18 – RIN28 and RIN30 – RIN33) at approximately 32 % level. The results indicate a fairly uniform distribution of the fauna in the area with differences between the two station groups that are a based on geographical variation. The correlation coefficient shows a good fit to the data (r = 0.82).
Due to the differences between the field and regional/reference stations, only the 2-D plot from the MDS analyses of field stations are shown in Figure 10-10. Analyses including the other stations are given in the Appendix.
The MDS analyses supports the cluster analysis by separating the stations situated around the well head installation (RIN01 – RIN16) from those around the sub sea template (RIN17 – RIN33). The field reference station RIN29R is seen together with the well head stations in the plot. The stress test shows a poor fit to the data (0.50).
Figure 10-9: Cluster analysis of the Ringhorne field stations and selected regional and reference stations from Region II, 2000.
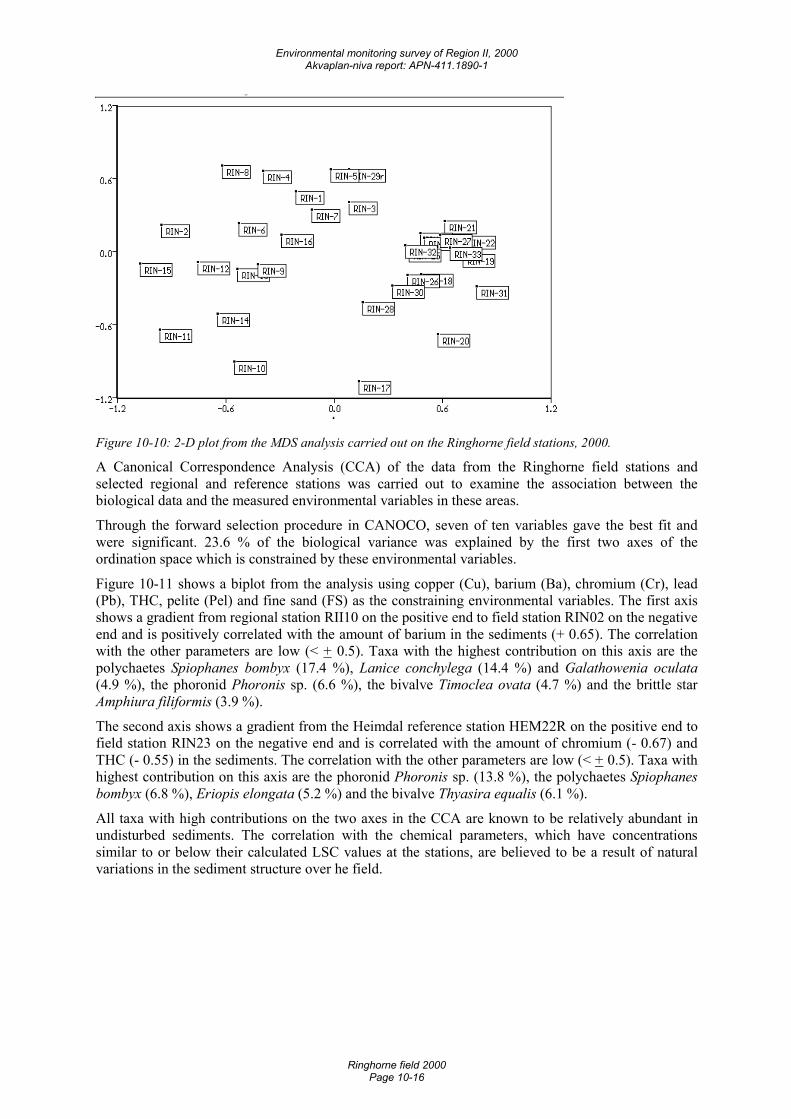
Environmental monitoring survey of Region II, 2000 Akvaplan-niva report: APN-411.1890-1
Ringhorne field 2000 Page 10-16
Figure 10-10: 2-D plot from the MDS analysis carried out on the Ringhorne field stations, 2000.
A Canonical Correspondence Analysis (CCA) of the data from the Ringhorne field stations and selected regional and reference stations was carried out to examine the association between the biological data and the measured environmental variables in these areas.
Through the forward selection procedure in CANOCO, seven of ten variables gave the best fit and were significant. 23.6 % of the biological variance was explained by the first two axes of the ordination space which is constrained by these environmental variables.
Figure 10-11 shows a biplot from the analysis using copper (Cu), barium (Ba), chromium (Cr), lead (Pb), THC, pelite (Pel) and fine sand (FS) as the constraining environmental variables. The first axis shows a gradient from regional station RII10 on the positive end to field station RIN02 on the negative end and is positively correlated with the amount of barium in the sediments (+ 0.65). The correlation with the other parameters are low (< + 0.5). Taxa with the highest contribution on this axis are the polychaetes Spiophanes bombyx (17.4 %), Lanice conchylega (14.4 %) and Galathowenia oculata (4.9 %), the phoronid Phoronis sp. (6.6 %), the bivalve Timoclea ovata (4.7 %) and the brittle star Amphiura filiformis (3.9 %).
The second axis shows a gradient from the Heimdal reference station HEM22R on the positive end to field station RIN23 on the negative end and is correlated with the amount of chromium (- 0.67) and THC (- 0.55) in the sediments. The correlation with the other parameters are low (< + 0.5). Taxa with highest contribution on this axis are the phoronid Phoronis sp. (13.8 %), the polychaetes Spiophanes bombyx (6.8 %), Eriopis elongata (5.2 %) and the bivalve Thyasira equalis (6.1 %).
All taxa with high contributions on the two axes in the CCA are known to be relatively abundant in undisturbed sediments. The correlation with the chemical parameters, which have concentrations similar to or below their calculated LSC values at the stations, are believed to be a result of natural variations in the sediment structure over he field.
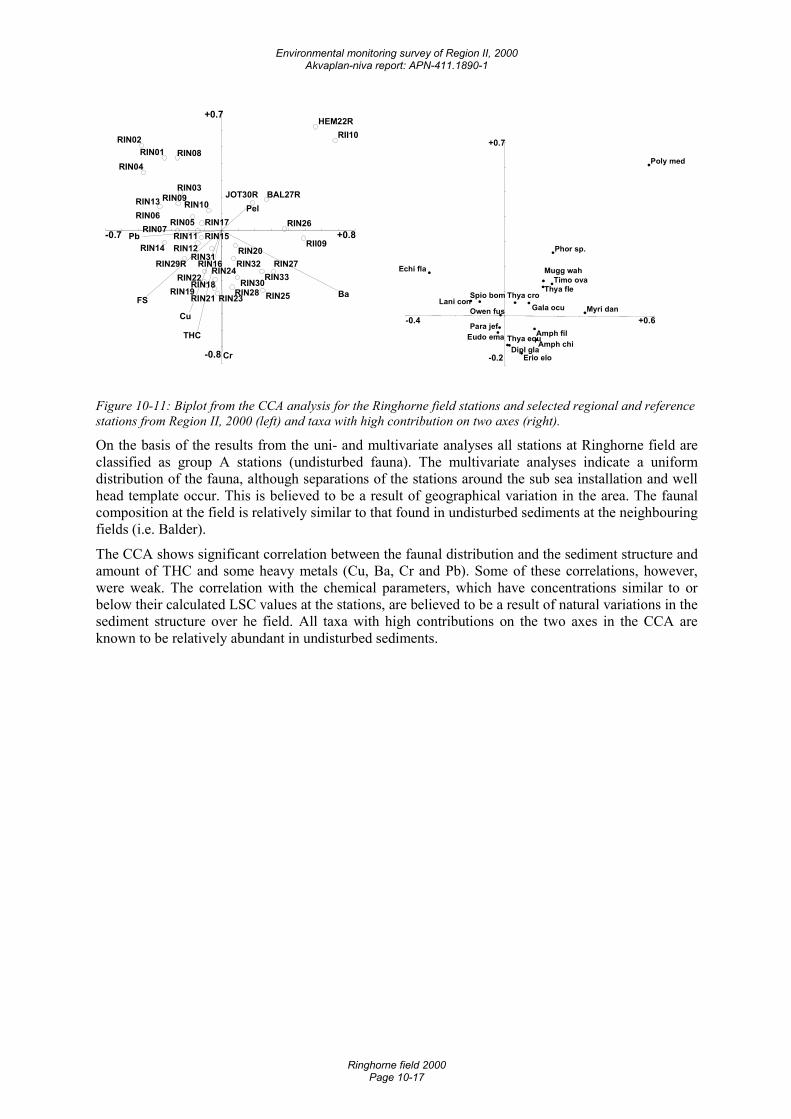
Environmental monitoring survey of Region II, 2000 Akvaplan-niva report: APN-411.1890-1
Ringhorne field 2000 Page 10-17
-0.7 +0.8
-0.8
+0.7
Ba
Pb
FS
Cu
Pel
THC
Cr
RII10HEM22R
RII09
RIN02
RIN04
RIN26RIN06
RIN01
RIN14
RIN27
BAL27R
RIN07
RIN08
RIN13
RIN25
RIN03
RIN33RIN29R
RIN09 JOT30R
RIN05
RIN12RIN11 RIN15
RIN17
RIN22RIN16
RIN30RIN19
RIN20
RIN10
RIN32
RIN28
RIN31
RIN18RIN21
RIN24
RIN23
-0.4 +0.6
-0.2
+0.7
Poly med
Myri dan
Echi fla
Phor sp.
Timo ovaMugg wah
Thya fleLani con
Amph chiAmph fil
Spio bomGala ocu
Erio elo
Thya cro
Eudo emaPara jef
Dipl gla
Owen fus
Thya equ
Figure 10-11: Biplot from the CCA analysis for the Ringhorne field stations and selected regional and reference stations from Region II, 2000 (left) and taxa with high contribution on two axes (right).
On the basis of the results from the uni- and multivariate analyses all stations at Ringhorne field are classified as group A stations (undisturbed fauna). The multivariate analyses indicate a uniform distribution of the fauna, although separations of the stations around the sub sea installation and well head template occur. This is believed to be a result of geographical variation in the area. The faunal composition at the field is relatively similar to that found in undisturbed sediments at the neighbouring fields (i.e. Balder).
The CCA shows significant correlation between the faunal distribution and the sediment structure and amount of THC and some heavy metals (Cu, Ba, Cr and Pb). Some of these correlations, however, were weak. The correlation with the chemical parameters, which have concentrations similar to or below their calculated LSC values at the stations, are believed to be a result of natural variations in the sediment structure over he field. All taxa with high contributions on the two axes in the CCA are known to be relatively abundant in undisturbed sediments.
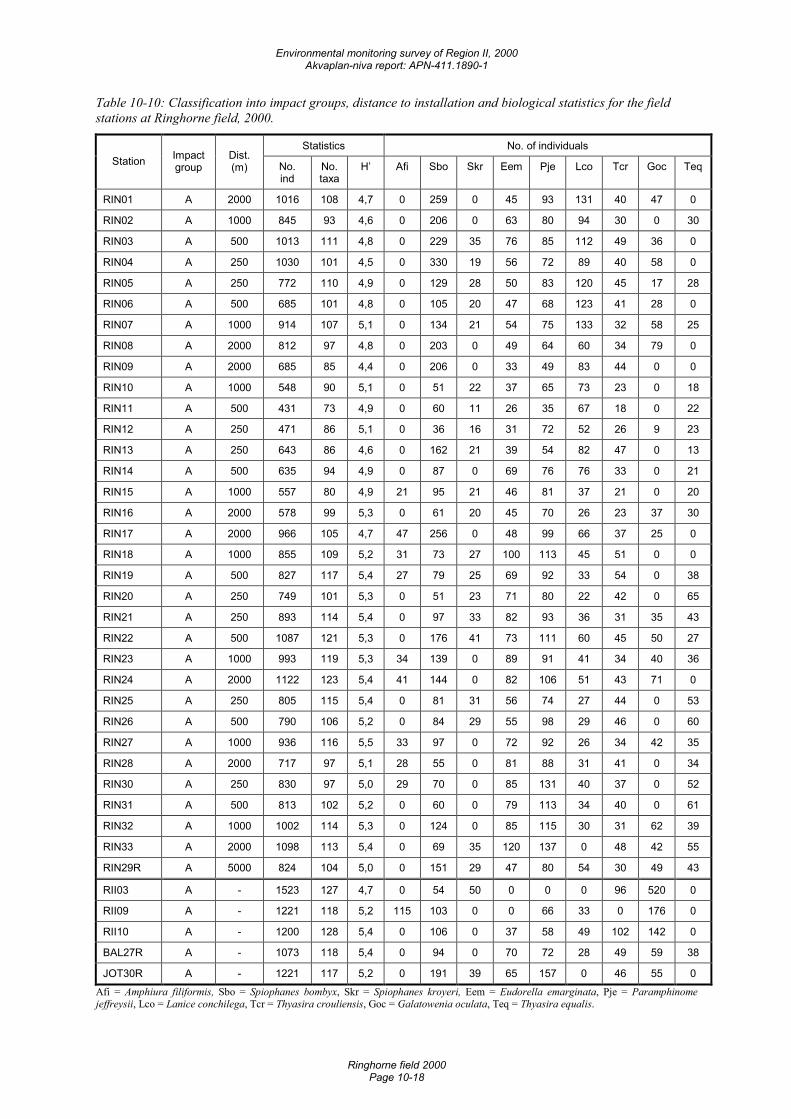
Environmental monitoring survey of Region II, 2000 Akvaplan-niva report: APN-411.1890-1
Ringhorne field 2000 Page 10-18
Table 10-10: Classification into impact groups, distance to installation and biological statistics for the field stations at Ringhorne field, 2000.
Statistics No. of individuals Station Impact
group Dist. (m) No.
ind No. taxa
H’ Afi Sbo Skr Eem Pje Lco Tcr Goc Teq
RIN01 A 2000 1016 108 4,7 0 259 0 45 93 131 40 47 0
RIN02 A 1000 845 93 4,6 0 206 0 63 80 94 30 0 30
RIN03 A 500 1013 111 4,8 0 229 35 76 85 112 49 36 0
RIN04 A 250 1030 101 4,5 0 330 19 56 72 89 40 58 0
RIN05 A 250 772 110 4,9 0 129 28 50 83 120 45 17 28
RIN06 A 500 685 101 4,8 0 105 20 47 68 123 41 28 0
RIN07 A 1000 914 107 5,1 0 134 21 54 75 133 32 58 25
RIN08 A 2000 812 97 4,8 0 203 0 49 64 60 34 79 0
RIN09 A 2000 685 85 4,4 0 206 0 33 49 83 44 0 0
RIN10 A 1000 548 90 5,1 0 51 22 37 65 73 23 0 18
RIN11 A 500 431 73 4,9 0 60 11 26 35 67 18 0 22
RIN12 A 250 471 86 5,1 0 36 16 31 72 52 26 9 23
RIN13 A 250 643 86 4,6 0 162 21 39 54 82 47 0 13
RIN14 A 500 635 94 4,9 0 87 0 69 76 76 33 0 21
RIN15 A 1000 557 80 4,9 21 95 21 46 81 37 21 0 20
RIN16 A 2000 578 99 5,3 0 61 20 45 70 26 23 37 30
RIN17 A 2000 966 105 4,7 47 256 0 48 99 66 37 25 0
RIN18 A 1000 855 109 5,2 31 73 27 100 113 45 51 0 0
RIN19 A 500 827 117 5,4 27 79 25 69 92 33 54 0 38
RIN20 A 250 749 101 5,3 0 51 23 71 80 22 42 0 65
RIN21 A 250 893 114 5,4 0 97 33 82 93 36 31 35 43
RIN22 A 500 1087 121 5,3 0 176 41 73 111 60 45 50 27
RIN23 A 1000 993 119 5,3 34 139 0 89 91 41 34 40 36
RIN24 A 2000 1122 123 5,4 41 144 0 82 106 51 43 71 0
RIN25 A 250 805 115 5,4 0 81 31 56 74 27 44 0 53
RIN26 A 500 790 106 5,2 0 84 29 55 98 29 46 0 60
RIN27 A 1000 936 116 5,5 33 97 0 72 92 26 34 42 35
RIN28 A 2000 717 97 5,1 28 55 0 81 88 31 41 0 34
RIN30 A 250 830 97 5,0 29 70 0 85 131 40 37 0 52
RIN31 A 500 813 102 5,2 0 60 0 79 113 34 40 0 61
RIN32 A 1000 1002 114 5,3 0 124 0 85 115 30 31 62 39
RIN33 A 2000 1098 113 5,4 0 69 35 120 137 0 48 42 55
RIN29R A 5000 824 104 5,0 0 151 29 47 80 54 30 49 43
RII03 A - 1523 127 4,7 0 54 50 0 0 0 96 520 0
RII09 A - 1221 118 5,2 115 103 0 0 66 33 0 176 0
RII10 A - 1200 128 5,4 0 106 0 37 58 49 102 142 0
BAL27R A - 1073 118 5,4 0 94 0 70 72 28 49 59 38
JOT30R A - 1221 117 5,2 0 191 39 65 157 0 46 55 0 Afi = Amphiura filiformis, Sbo = Spiophanes bombyx, Skr = Spiophanes kroyeri, Eem = Eudorella emarginata, Pje = Paramphinome jeffreysii, Lco = Lanice conchilega, Tcr = Thyasira crouliensis, Goc = Galatowenia oculata, Teq = Thyasira equalis.
Environmental monitoring survey of Region II, 2000 Akvaplan-niva report: APN-411.1890-1
Ringhorne field 2000 Page 10-19
10.3 Summary and conclusions The sediment at the Ringhorne field is classified as fine sand with relatively high amount of pelite (9 – 14 %) and TOM (1.5 – 2.5 %). The sediment is similar to that found at the neighbouring Balder field.
The sediments around the sub sea installation contain slightly more THC (8-14 mg/kg) than the sediments around the well head platform (5-11 mg/kg). Naturally higher levels of THC (11-14 mg/kg) seems to be found along the sub sea 315o-axis. The average THC content across the Ringhorne field (9.4 ± 2.9 mg/kg) is comparable to the content found across the Glitne field (8.6 ± 1.7 mg/kg), which is located south west of Ringhorne, and to the content in uncontaminated sediments at the Balder field. Ringhorne is regarded as uncontaminated with THC, aromatic hydrocarbons and decalins.
The selected metals are very evenly distributed over the Ringhorne field. The sediments around the sub sea installation contain generally slightly more cadmium, zinc and barium than those collected nearby the well head. The sediments are regarded as uncontaminated with metals. The amounts of metals found in sediments across Ringhorne are comparable to the concentrations found in sediments from uncontaminated stations at the neighbouring Balder field. Sediments from the Ringhorne field contain 40-50% more cadmium and copper and only half as much barium as sediments from Glitne.
A relatively high variation in the number of taxa and individuals are registered at the stations. However, the faunal composition at the field is relatively similar to that found in undisturbed sediments at the neighbouring fields (i.e. Balder). On the basis of the results from the uni- and multivariate analyses all stations at Ringhorne field are classified as group A stations (undisturbed fauna). The multivariate analyses indicate a uniform distribution of the fauna, although separations of the stations around the sub sea installation and well head template occur. This is believed to be a result of geographical variation in the area.
The CCA shows significant correlation between the faunal distribution and the sediment structure and amount of THC and some heavy metals (Cu, Ba, Cr and Pb). Some of these correlations, however, are weak. The correlation with the chemical parameters, which have concentrations similar to or below their calculated LSC values at the stations, are believed to be a result of natural variations in the sediment structure over he field. All taxa with high contributions on the two axes in the CCA are known to be relatively abundant in undisturbed sediments.
It is therefore concluded that the petroleum activity at the field so far has had no negative effects on the fauna.
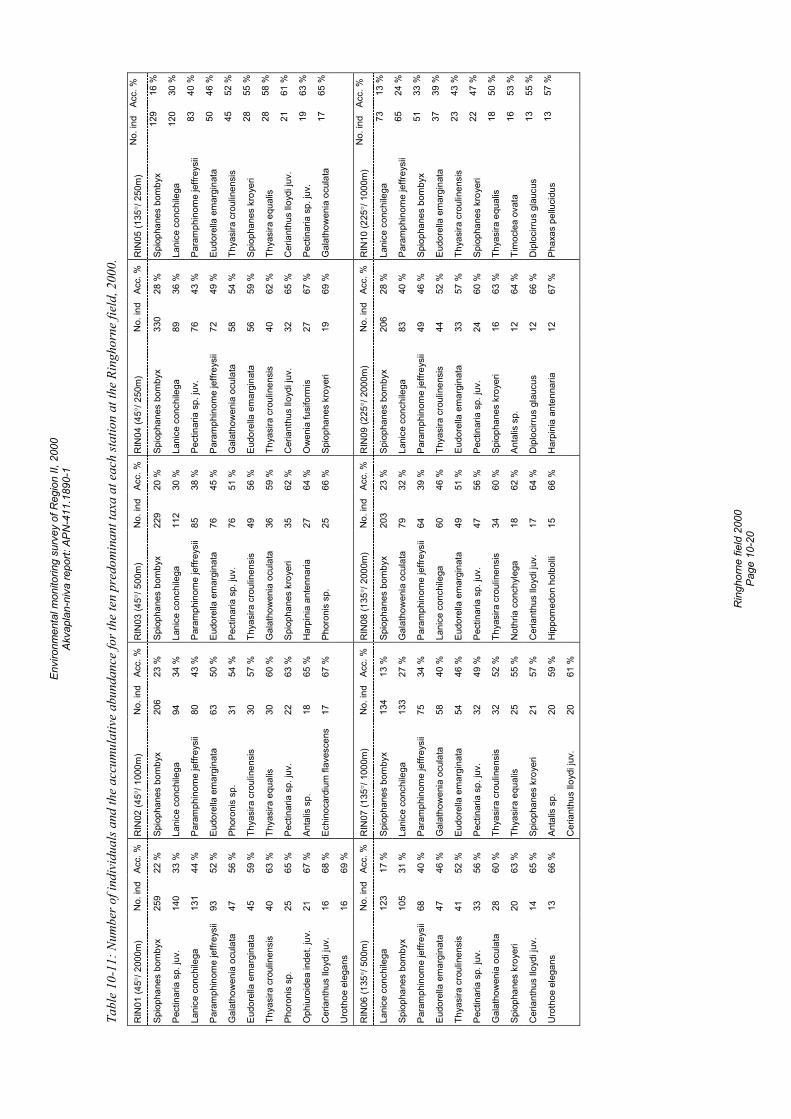
Envi
ronm
enta
l mon
itorin
g su
rvey
of R
egio
n II,
200
0 Ak
vapl
an-n
iva
repo
rt: A
PN-4
11.1
890-
1
R
ingh
orne
fiel
d 20
00
Page
10-
20
Tabl
e 10
-11:
Num
ber o
f ind
ivid
uals
and
the
accu
mul
ativ
e ab
unda
nce
for t
he te
n pr
edom
inan
t tax
a at
eac
h sta
tion
at th
e Ri
ngho
rne
field
, 200
0.
RIN
01 (4
5°/ 2
000m
) N
o. in
d Ac
c. %
R
IN02
(45°
/ 100
0m)
No.
ind
Acc.
%
RIN
03 (4
5°/ 5
00m
) N
o. in
d Ac
c. %
R
IN04
(45°
/ 250
m)
No.
ind
Acc.
%
RIN
05 (1
35°/
250m
) N
o. in
d Ac
c. %
Spio
phan
es b
omby
x 25
9 22
%
Spio
phan
es b
omby
x 20
6 23
%
Spio
phan
es b
omby
x 22
9 20
%
Spio
phan
es b
omby
x 33
0 28
%
Spio
phan
es b
omby
x 12
9 16
%
Pect
inar
ia s
p. ju
v.
140
33 %
La
nice
con
chile
ga
94
34 %
La
nice
con
chile
ga
112
30 %
La
nice
con
chile
ga
89
36 %
La
nice
con
chile
ga
120
30 %
Lani
ce c
onch
ilega
13
1 44
%
Para
mph
inom
e je
ffrey
sii
80
43 %
Pa
ram
phin
ome
jeffr
eysi
i 85
38
%
Pect
inar
ia s
p. ju
v.
76
43 %
Pa
ram
phin
ome
jeffr
eysi
i 83
40
%
Para
mph
inom
e je
ffrey
sii
93
52 %
Eu
dore
lla e
mar
gina
ta
63
50 %
Eu
dore
lla e
mar
gina
ta
76
45 %
Pa
ram
phin
ome
jeffr
eysi
i 72
49
%
Eudo
rella
em
argi
nata
50
46
%
Gal
atho
wen
ia o
cula
ta
47
56 %
Ph
oron
is s
p.
31
54 %
Pe
ctin
aria
sp.
juv.
76
51
%
Gal
atho
wen
ia o
cula
ta
58
54 %
Th
yasi
ra c
roul
inen
sis
45
52 %
Eudo
rella
em
argi
nata
45
59
%
Thya
sira
cro
ulin
ensi
s 30
57
%
Thya
sira
cro
ulin
ensi
s 49
56
%
Eudo
rella
em
argi
nata
56
59
%
Spio
phan
es k
roye
ri 28
55
%
Thya
sira
cro
ulin
ensi
s 40
63
%
Thya
sira
equ
alis
30
60
%
Gal
atho
wen
ia o
cula
ta
36
59 %
Th
yasi
ra c
roul
inen
sis
40
62 %
Th
yasi
ra e
qual
is
28
58 %
Phor
onis
sp.
25
65
%
Pect
inar
ia s
p. ju
v.
22
63 %
Sp
ioph
anes
kro
yeri
35
62 %
C
eria
nthu
s llo
ydi j
uv.
32
65 %
C
eria
nthu
s llo
ydi j
uv.
21
61 %
Oph
iuro
idea
inde
t. ju
v.
21
67 %
An
talis
sp.
18
65
%
Har
pini
a an
tenn
aria
27
64
%
Ow
enia
fusi
form
is
27
67 %
Pe
ctin
aria
sp.
juv.
19
63
%
Cer
iant
hus
lloyd
i juv
. 16
68
%
Echi
noca
rdiu
m fl
aves
cens
17
67
%
Phor
onis
sp.
25
66
%
Spio
phan
es k
roye
ri 19
69
%
Gal
atho
wen
ia o
cula
ta
17
65 %
Uro
thoe
ele
gans
16
69
%
RIN
06 (1
35°/
500m
) N
o. in
d Ac
c. %
R
IN07
(135
°/ 10
00m
) N
o. in
d Ac
c. %
R
IN08
(135
°/ 20
00m
) N
o. in
d Ac
c. %
R
IN09
(225
°/ 20
00m
) N
o. in
d Ac
c. %
R
IN10
(225
°/ 10
00m
) N
o. in
d Ac
c. %
Lani
ce c
onch
ilega
12
3 17
%
Spio
phan
es b
omby
x 13
4 13
%
Spio
phan
es b
omby
x 20
3 23
%
Spio
phan
es b
omby
x 20
6 28
%
Lani
ce c
onch
ilega
73
13
%
Spio
phan
es b
omby
x 10
5 31
%
Lani
ce c
onch
ilega
13
3 27
%
Gal
atho
wen
ia o
cula
ta
79
32 %
La
nice
con
chile
ga
83
40 %
Pa
ram
phin
ome
jeffr
eysi
i 65
24
%
Para
mph
inom
e je
ffrey
sii
68
40 %
Pa
ram
phin
ome
jeffr
eysi
i 75
34
%
Para
mph
inom
e je
ffrey
sii
64
39 %
Pa
ram
phin
ome
jeffr
eysi
i 49
46
%
Spio
phan
es b
omby
x 51
33
%
Eudo
rella
em
argi
nata
47
46
%
Gal
atho
wen
ia o
cula
ta
58
40 %
La
nice
con
chile
ga
60
46 %
Th
yasi
ra c
roul
inen
sis
44
52 %
Eu
dore
lla e
mar
gina
ta
37
39 %
Thya
sira
cro
ulin
ensi
s 41
52
%
Eudo
rella
em
argi
nata
54
46
%
Eudo
rella
em
argi
nata
49
51
%
Eudo
rella
em
argi
nata
33
57
%
Thya
sira
cro
ulin
ensi
s 23
43
%
Pect
inar
ia s
p. ju
v.
33
56 %
Pe
ctin
aria
sp.
juv.
32
49
%
Pect
inar
ia s
p. ju
v.
47
56 %
Pe
ctin
aria
sp.
juv.
24
60
%
Spio
phan
es k
roye
ri 22
47
%
Gal
atho
wen
ia o
cula
ta
28
60 %
Th
yasi
ra c
roul
inen
sis
32
52 %
Th
yasi
ra c
roul
inen
sis
34
60 %
Sp
ioph
anes
kro
yeri
16
63 %
Th
yasi
ra e
qual
is
18
50 %
Spio
phan
es k
roye
ri 20
63
%
Thya
sira
equ
alis
25
55
%
Not
hria
con
chyl
ega
18
62 %
An
talis
sp.
12
64
%
Tim
ocle
a ov
ata
16
53 %
Cer
iant
hus
lloyd
i juv
. 14
65
%
Spio
phan
es k
roye
ri 21
57
%
Cer
iant
hus
lloyd
i juv
. 17
64
%
Dip
loci
rrus
glau
cus
12
66 %
D
iplo
cirru
s gl
aucu
s 13
55
%
Uro
thoe
ele
gans
13
66
%
Anta
lis s
p.
20
59 %
H
ippo
med
on h
olbo
lli 15
66
%
Har
pini
a an
tenn
aria
12
67
%
Phax
as p
ellu
cidu
s 13
57
%
C
eria
nthu
s llo
ydi j
uv.
20
61 %
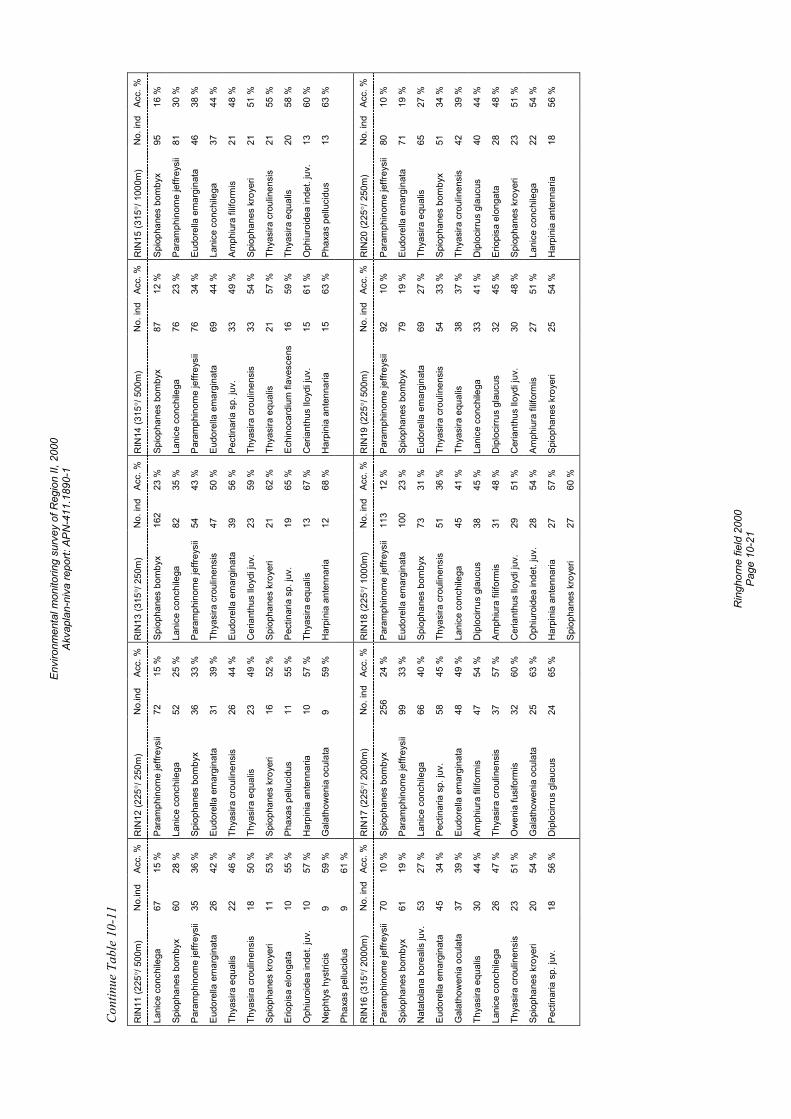
Envi
ronm
enta
l mon
itorin
g su
rvey
of R
egio
n II,
200
0 Ak
vapl
an-n
iva
repo
rt: A
PN-4
11.1
890-
1
R
ingh
orne
fiel
d 20
00
Page
10-
21
Cont
inue
Tab
le 1
0-11
RIN
11 (2
25°/
500m
) N
o.in
d Ac
c. %
R
IN12
(225
°/ 25
0m)
No.
ind
Acc.
%
RIN
13 (3
15°/
250m
) N
o. in
d Ac
c. %
R
IN14
(315
°/ 50
0m)
No.
ind
Acc.
%
RIN
15 (3
15°/
1000
m)
No.
ind
Acc.
%
Lani
ce c
onch
ilega
67
15
%
Para
mph
inom
e je
ffrey
sii
72
15 %
Sp
ioph
anes
bom
byx
162
23 %
Sp
ioph
anes
bom
byx
87
12 %
Sp
ioph
anes
bom
byx
95
16 %
Spio
phan
es b
omby
x 60
28
%
Lani
ce c
onch
ilega
52
25
%
Lani
ce c
onch
ilega
82
35
%
Lani
ce c
onch
ilega
76
23
%
Para
mph
inom
e je
ffrey
sii
81
30 %
Para
mph
inom
e je
ffrey
sii
35
36 %
Sp
ioph
anes
bom
byx
36
33 %
Pa
ram
phin
ome
jeffr
eysi
i 54
43
%
Para
mph
inom
e je
ffrey
sii
76
34 %
Eu
dore
lla e
mar
gina
ta
46
38 %
Eudo
rella
em
argi
nata
26
42
%
Eudo
rella
em
argi
nata
31
39
%
Thya
sira
cro
ulin
ensi
s 47
50
%
Eudo
rella
em
argi
nata
69
44
%
Lani
ce c
onch
ilega
37
44
%
Thya
sira
equ
alis
22
46
%
Thya
sira
cro
ulin
ensi
s 26
44
%
Eudo
rella
em
argi
nata
39
56
%
Pect
inar
ia s
p. ju
v.
33
49 %
Am
phiu
ra fi
lifor
mis
21
48
%
Thya
sira
cro
ulin
ensi
s 18
50
%
Thya
sira
equ
alis
23
49
%
Cer
iant
hus
lloyd
i juv
. 23
59
%
Thya
sira
cro
ulin
ensi
s 33
54
%
Spio
phan
es k
roye
ri 21
51
%
Spio
phan
es k
roye
ri 11
53
%
Spio
phan
es k
roye
ri 16
52
%
Spio
phan
es k
roye
ri 21
62
%
Thya
sira
equ
alis
21
57
%
Thya
sira
cro
ulin
ensi
s 21
55
%
Erio
pisa
elo
ngat
a 10
55
%
Phax
as p
ellu
cidu
s 11
55
%
Pect
inar
ia s
p. ju
v.
19
65 %
Ec
hino
card
ium
flav
esce
ns
16
59 %
Th
yasi
ra e
qual
is
20
58 %
Oph
iuro
idea
inde
t. ju
v.
10
57 %
H
arpi
nia
ante
nnar
ia
10
57 %
Th
yasi
ra e
qual
is
13
67 %
C
eria
nthu
s llo
ydi j
uv.
15
61 %
O
phiu
roid
ea in
det.
juv.
13
60
%
Nep
htys
hys
trici
s 9
59 %
G
alat
how
enia
ocu
lata
9
59 %
H
arpi
nia
ante
nnar
ia
12
68 %
H
arpi
nia
ante
nnar
ia
15
63 %
Ph
axas
pel
luci
dus
13
63 %
Phax
as p
ellu
cidu
s 9
61 %
RIN
16 (3
15°/
2000
m)
No.
ind
Acc.
%
RIN
17 (2
25°/
2000
m)
No.
ind
Acc.
%
RIN
18 (2
25°/
1000
m)
No.
ind
Acc.
%
RIN
19 (2
25°/
500m
) N
o. in
d Ac
c. %
R
IN20
(225
°/ 25
0m)
No.
ind
Acc.
%
Para
mph
inom
e je
ffrey
sii
70
10 %
Sp
ioph
anes
bom
byx
256
24 %
Pa
ram
phin
ome
jeffr
eysi
i 11
3 12
%
Para
mph
inom
e je
ffrey
sii
92
10 %
Pa
ram
phin
ome
jeffr
eysi
i 80
10
%
Spio
phan
es b
omby
x 61
19
%
Para
mph
inom
e je
ffrey
sii
99
33 %
Eu
dore
lla e
mar
gina
ta
100
23 %
Sp
ioph
anes
bom
byx
79
19 %
Eu
dore
lla e
mar
gina
ta
71
19 %
Nat
atol
ana
bore
alis
juv.
53
27
%
Lani
ce c
onch
ilega
66
40
%
Spio
phan
es b
omby
x 73
31
%
Eudo
rella
em
argi
nata
69
27
%
Thya
sira
equ
alis
65
27
%
Eudo
rella
em
argi
nata
45
34
%
Pect
inar
ia s
p. ju
v.
58
45 %
Th
yasi
ra c
roul
inen
sis
51
36 %
Th
yasi
ra c
roul
inen
sis
54
33 %
Sp
ioph
anes
bom
byx
51
34 %
Gal
atho
wen
ia o
cula
ta
37
39 %
Eu
dore
lla e
mar
gina
ta
48
49 %
La
nice
con
chile
ga
45
41 %
Th
yasi
ra e
qual
is
38
37 %
Th
yasi
ra c
roul
inen
sis
42
39 %
Thya
sira
equ
alis
30
44
%
Amph
iura
filif
orm
is
47
54 %
D
iplo
cirru
s gl
aucu
s 38
45
%
Lani
ce c
onch
ilega
33
41
%
Dip
loci
rrus
glau
cus
40
44 %
Lani
ce c
onch
ilega
26
47
%
Thya
sira
cro
ulin
ensi
s 37
57
%
Amph
iura
filif
orm
is
31
48 %
D
iplo
cirru
s gl
aucu
s 32
45
%
Erio
pisa
elo
ngat
a 28
48
%
Thya
sira
cro
ulin
ensi
s 23
51
%
Ow
enia
fusi
form
is
32
60 %
C
eria
nthu
s llo
ydi j
uv.
29
51 %
C
eria
nthu
s llo
ydi j
uv.
30
48 %
Sp
ioph
anes
kro
yeri
23
51 %
Spio
phan
es k
roye
ri 20
54
%
Gal
atho
wen
ia o
cula
ta
25
63 %
O
phiu
roid
ea in
det.
juv.
28
54
%
Amph
iura
filif
orm
is
27
51 %
La
nice
con
chile
ga
22
54 %
Pect
inar
ia s
p. ju
v.
18
56 %
D
iplo
cirru
s gl
aucu
s 24
65
%
Har
pini
a an
tenn
aria
27
57
%
Spio
phan
es k
roye
ri 25
54
%
Har
pini
a an
tenn
aria
18
56
%
Spio
phan
es k
roye
ri 27
60
%
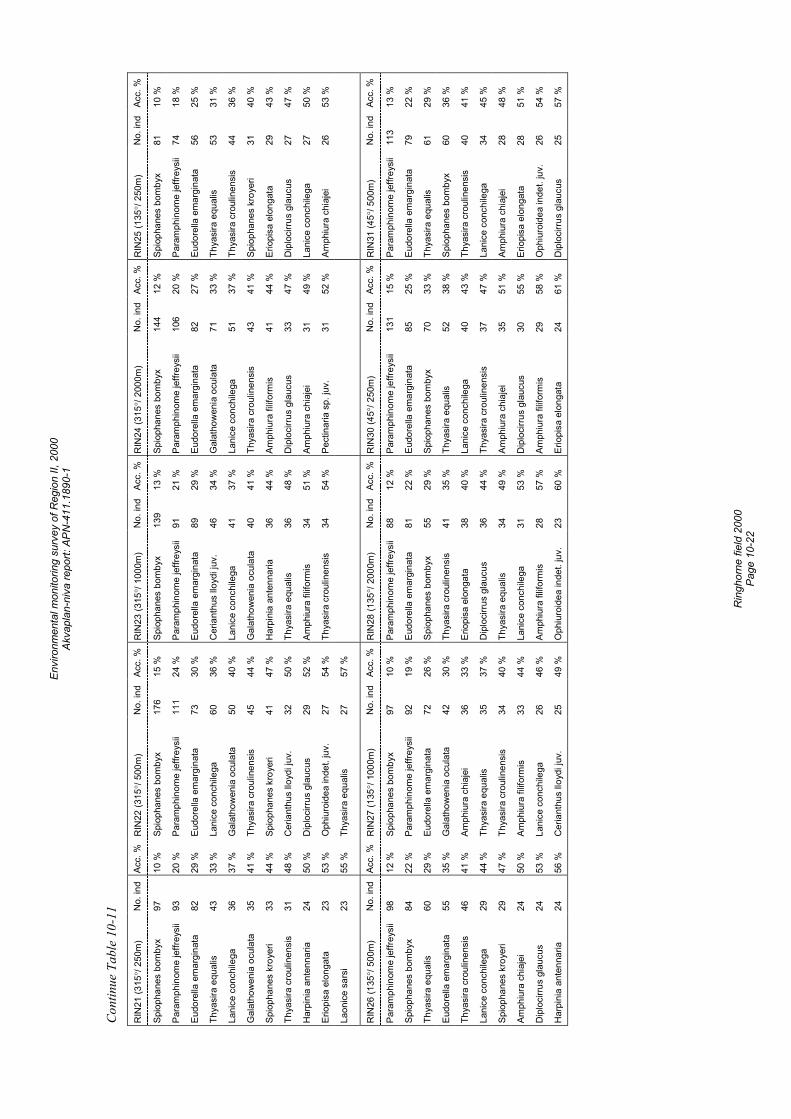
Envi
ronm
enta
l mon
itorin
g su
rvey
of R
egio
n II,
200
0 Ak
vapl
an-n
iva
repo
rt: A
PN-4
11.1
890-
1
R
ingh
orne
fiel
d 20
00
Page
10-
22
Cont
inue
Tab
le 1
0-11
RIN
21 (3
15°/
250m
) N
o. in
d Ac
c. %
R
IN22
(315
°/ 50
0m)
No.
ind
Acc.
%
RIN
23 (3
15°/
1000
m)
No.
ind
Acc.
%
RIN
24 (3
15°/
2000
m)
No.
ind
Acc.
%
RIN
25 (1
35°/
250m
) N
o. in
d Ac
c. %
Spio
phan
es b
omby
x 97
10
%
Spio
phan
es b
omby
x 17
6 15
%
Spio
phan
es b
omby
x 13
9 13
%
Spio
phan
es b
omby
x 14
4 12
%
Spio
phan
es b
omby
x 81
10
%
Para
mph
inom
e je
ffrey
sii
93
20 %
Pa
ram
phin
ome
jeffr
eysi
i 11
1 24
%
Para
mph
inom
e je
ffrey
sii
91
21 %
Pa
ram
phin
ome
jeffr
eysi
i 10
6 20
%
Para
mph
inom
e je
ffrey
sii
74
18 %
Eudo
rella
em
argi
nata
82
29
%
Eudo
rella
em
argi
nata
73
30
%
Eudo
rella
em
argi
nata
89
29
%
Eudo
rella
em
argi
nata
82
27
%
Eudo
rella
em
argi
nata
56
25
%
Thya
sira
equ
alis
43
33
%
Lani
ce c
onch
ilega
60
36
%
Cer
iant
hus
lloyd
i juv
. 46
34
%
Gal
atho
wen
ia o
cula
ta
71
33 %
Th
yasi
ra e
qual
is
53
31 %
Lani
ce c
onch
ilega
36
37
%
Gal
atho
wen
ia o
cula
ta
50
40 %
La
nice
con
chile
ga
41
37 %
La
nice
con
chile
ga
51
37 %
Th
yasi
ra c
roul
inen
sis
44
36 %
Gal
atho
wen
ia o
cula
ta
35
41 %
Th
yasi
ra c
roul
inen
sis
45
44 %
G
alat
how
enia
ocu
lata
40
41
%
Thya
sira
cro
ulin
ensi
s 43
41
%
Spio
phan
es k
roye
ri 31
40
%
Spio
phan
es k
roye
ri 33
44
%
Spio
phan
es k
roye
ri 41
47
%
Har
pini
a an
tenn
aria
36
44
%
Amph
iura
filif
orm
is
41
44 %
Er
iopi
sa e
long
ata
29
43 %
Thya
sira
cro
ulin
ensi
s 31
48
%
Cer
iant
hus
lloyd
i juv
. 32
50
%
Thya
sira
equ
alis
36
48
%
Dip
loci
rrus
glau
cus
33
47 %
D
iplo
cirru
s gl
aucu
s 27
47
%
Har
pini
a an
tenn
aria
24
50
%
Dip
loci
rrus
glau
cus
29
52 %
Am
phiu
ra fi
lifor
mis
34
51
%
Amph
iura
chi
ajei
31
49
%
Lani
ce c
onch
ilega
27
50
%
Erio
pisa
elo
ngat
a 23
53
%
Oph
iuro
idea
inde
t. ju
v.
27
54 %
Th
yasi
ra c
roul
inen
sis
34
54 %
Pe
ctin
aria
sp.
juv.
31
52
%
Amph
iura
chi
ajei
26
53
%
Laon
ice
sars
i 23
55
%
Thya
sira
equ
alis
27
57
%
RIN
26 (1
35°/
500m
) N
o. in
d Ac
c. %
R
IN27
(135
°/ 10
00m
) N
o. in
d Ac
c. %
R
IN28
(135
°/ 20
00m
) N
o. in
d Ac
c. %
R
IN30
(45°
/ 250
m)
No.
ind
Acc.
%
RIN
31 (4
5°/ 5
00m
) N
o. in
d Ac
c. %
Para
mph
inom
e je
ffrey
sii
98
12 %
Sp
ioph
anes
bom
byx
97
10 %
Pa
ram
phin
ome
jeffr
eysi
i 88
12
%
Para
mph
inom
e je
ffrey
sii
131
15 %
Pa
ram
phin
ome
jeffr
eysi
i 11
3 13
%
Spio
phan
es b
omby
x 84
22
%
Para
mph
inom
e je
ffrey
sii
92
19 %
Eu
dore
lla e
mar
gina
ta
81
22 %
Eu
dore
lla e
mar
gina
ta
85
25 %
Eu
dore
lla e
mar
gina
ta
79
22 %
Thya
sira
equ
alis
60
29
%
Eudo
rella
em
argi
nata
72
26
%
Spio
phan
es b
omby
x 55
29
%
Spio
phan
es b
omby
x 70
33
%
Thya
sira
equ
alis
61
29
%
Eudo
rella
em
argi
nata
55
35
%
Gal
atho
wen
ia o
cula
ta
42
30 %
Th
yasi
ra c
roul
inen
sis
41
35 %
Th
yasi
ra e
qual
is
52
38 %
Sp
ioph
anes
bom
byx
60
36 %
Thya
sira
cro
ulin
ensi
s 46
41
%
Amph
iura
chi
ajei
36
33
%
Erio
pisa
elo
ngat
a 38
40
%
Lani
ce c
onch
ilega
40
43
%
Thya
sira
cro
ulin
ensi
s 40
41
%
Lani
ce c
onch
ilega
29
44
%
Thya
sira
equ
alis
35
37
%
Dip
loci
rrus
glau
cus
36
44 %
Th
yasi
ra c
roul
inen
sis
37
47 %
La
nice
con
chile
ga
34
45 %
Spio
phan
es k
roye
ri 29
47
%
Thya
sira
cro
ulin
ensi
s 34
40
%
Thya
sira
equ
alis
34
49
%
Amph
iura
chi
ajei
35
51
%
Amph
iura
chi
ajei
28
48
%
Amph
iura
chi
ajei
24
50
%
Amph
iura
filif
orm
is
33
44 %
La
nice
con
chile
ga
31
53 %
D
iplo
cirru
s gl
aucu
s 30
55
%
Erio
pisa
elo
ngat
a 28
51
%
Dip
loci
rrus
glau
cus
24
53 %
La
nice
con
chile
ga
26
46 %
Am
phiu
ra fi
lifor
mis
28
57
%
Amph
iura
filif
orm
is
29
58 %
O
phiu
roid
ea in
det.
juv.
26
54
%
Har
pini
a an
tenn
aria
24
56
%
Cer
iant
hus
lloyd
i juv
. 25
49
%
Oph
iuro
idea
inde
t. ju
v.
23
60 %
Er
iopi
sa e
long
ata
24
61 %
D
iplo
cirru
s gl
aucu
s 25
57
%
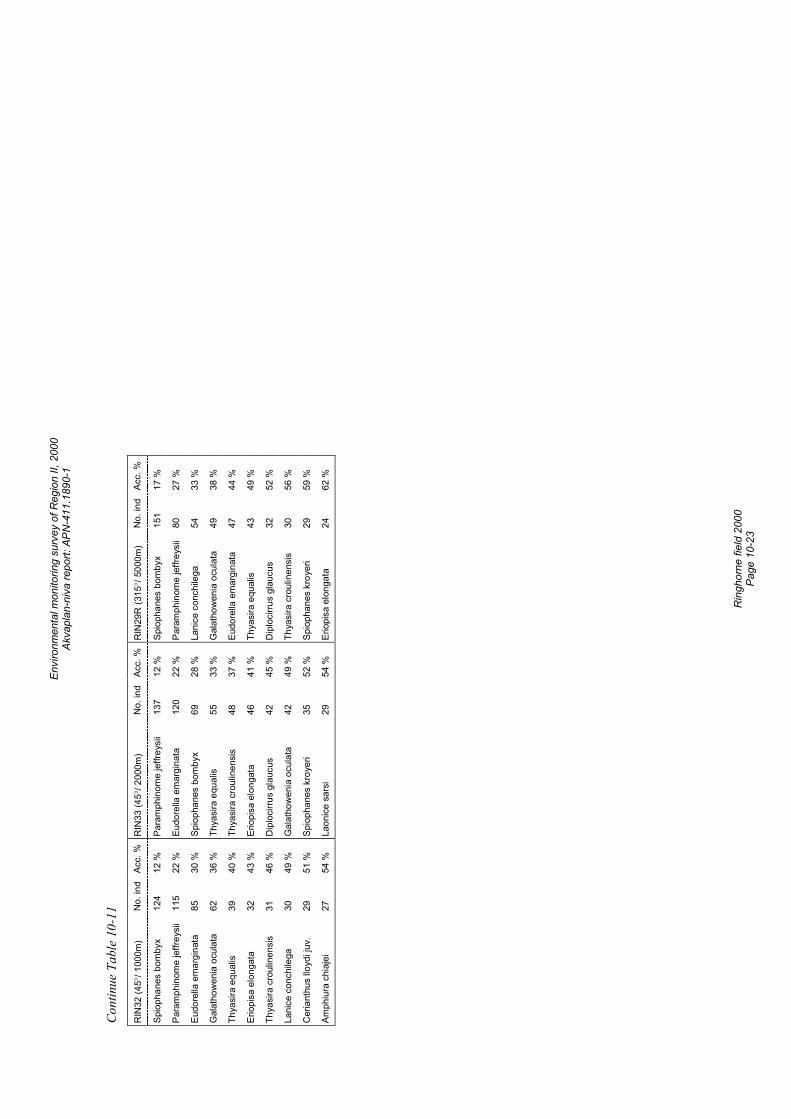
Envi
ronm
enta
l mon
itorin
g su
rvey
of R
egio
n II,
200
0 Ak
vapl
an-n
iva
repo
rt: A
PN-4
11.1
890-
1
R
ingh
orne
fiel
d 20
00
Page
10-
23
Cont
inue
Tab
le 1
0-11
RIN
32 (4
5°/ 1
000m
) N
o. in
d Ac
c. %
R
IN33
(45°
/ 200
0m)
No.
ind
Acc.
%
RIN
29R
(315
°/ 50
00m
) N
o. in
d Ac
c. %
Spio
phan
es b
omby
x 12
4 12
%
Para
mph
inom
e je
ffrey
sii
137
12 %
Sp
ioph
anes
bom
byx
151
17 %
Para
mph
inom
e je
ffrey
sii
115
22 %
Eu
dore
lla e
mar
gina
ta
120
22 %
Pa
ram
phin
ome
jeffr
eysi
i 80
27
%
Eudo
rella
em
argi
nata
85
30
%
Spio
phan
es b
omby
x 69
28
%
Lani
ce c
onch
ilega
54
33
%
Gal
atho
wen
ia o
cula
ta
62
36 %
Th
yasi
ra e
qual
is
55
33 %
G
alat
how
enia
ocu
lata
49
38
%
Thya
sira
equ
alis
39
40
%
Thya
sira
cro
ulin
ensi
s 48
37
%
Eudo
rella
em
argi
nata
47
44
%
Erio
pisa
elo
ngat
a 32
43
%
Erio
pisa
elo
ngat
a 46
41
%
Thya
sira
equ
alis
43
49
%
Thya
sira
cro
ulin
ensi
s 31
46
%
Dip
loci
rrus
glau
cus
42
45 %
D
iplo
cirru
s gl
aucu
s 32
52
%
Lani
ce c
onch
ilega
30
49
%
Gal
atho
wen
ia o
cula
ta
42
49 %
Th
yasi
ra c
roul
inen
sis
30
56 %
Cer
iant
hus
lloyd
i juv
. 29
51
%
Spio
phan
es k
roye
ri 35
52
%
Spio
phan
es k
roye
ri 29
59
%
Amph
iura
chi
ajei
27
54
%
Laon
ice
sars
i 29
54
%
Erio
pisa
elo
ngat
a 24
62
%
Envi
ronm
enta
l mon
itorin
g su
rvey
of R
egio
n II,
200
0 Ak
vapl
an-n
iva
repo
rt: A
PN-4
11.1
890-
1
R
ingh
orne
fiel
d 20
00
Page
10-
24
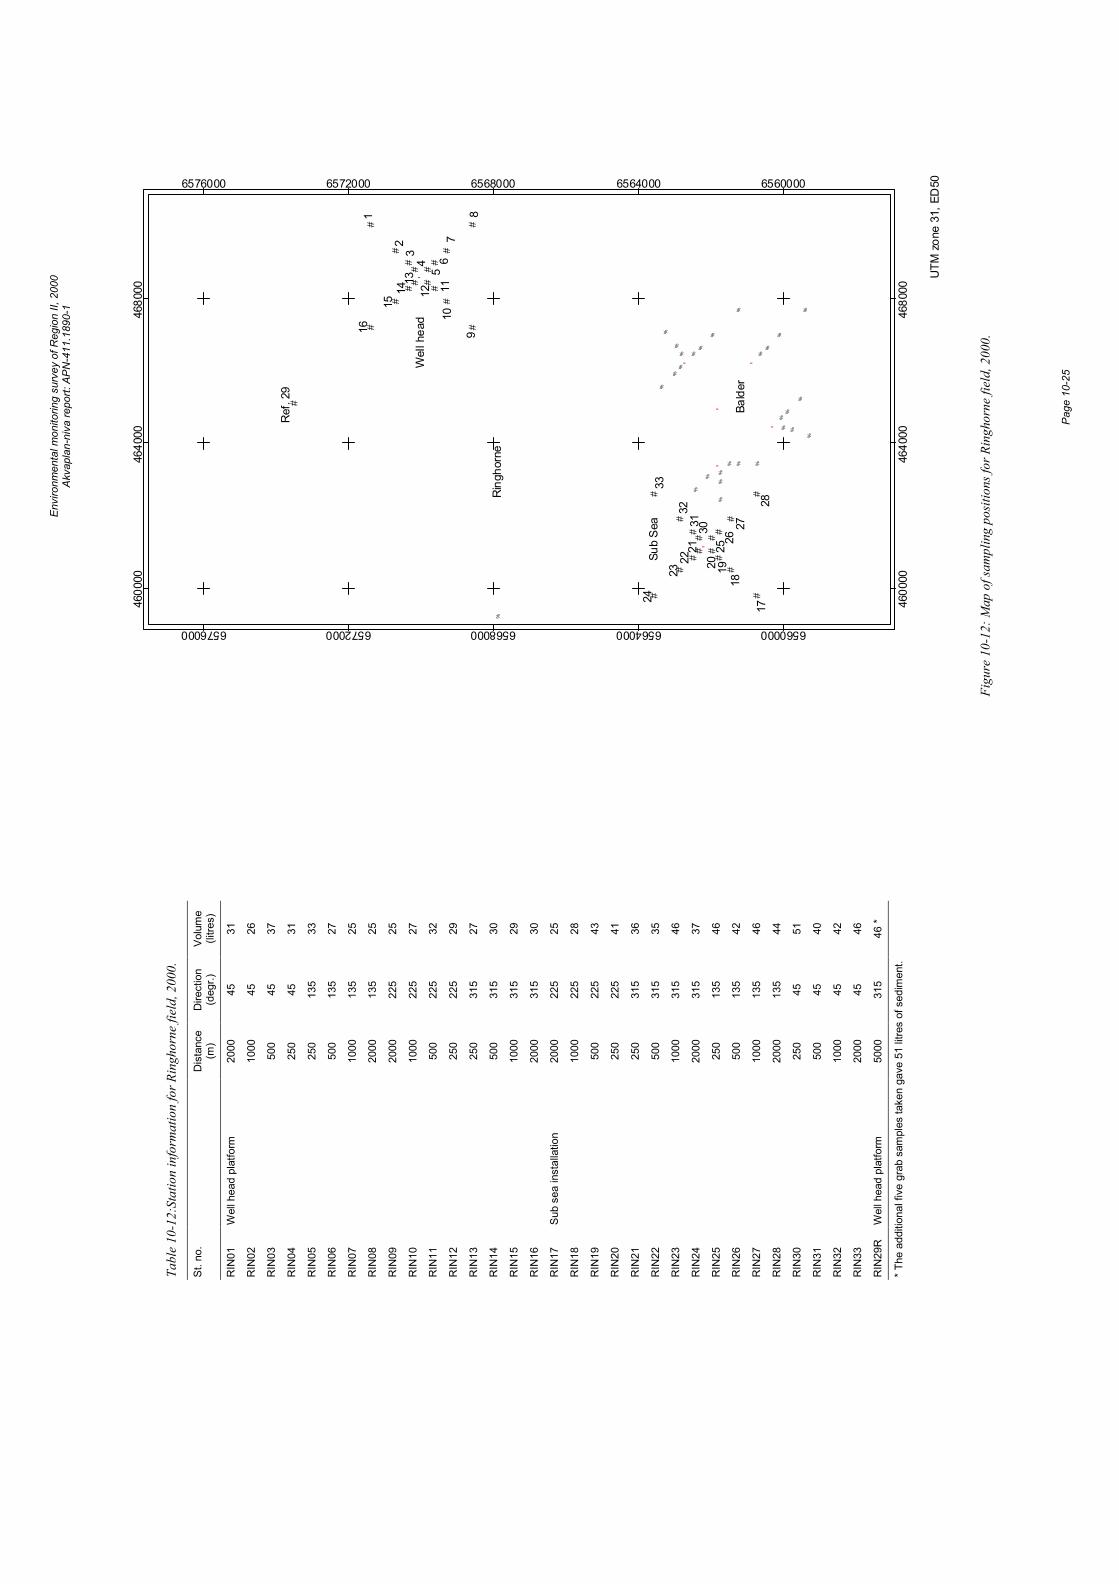
Envi
ronm
enta
l mon
itorin
g su
rvey
of R
egio
n II,
200
0 Ak
vapl
an-n
iva
repo
rt: A
PN-4
11.1
890-
1
Pa
ge 1
0-25
%%
%
%
%
%
%
% %
%
%%
%
%
%
%
%
%%
%
%%
%
% % %
%
%
%
#
#
## #
##
##
##
###
#
#
#
##
###
#
#
##
#
#
##
#
#
#
'
'
''
'
'
'
1
23
45
67
89
10111214
15
16
17
181920
2122
23
24
2526
27
28
3132
33
Ref
. 29
30
13W
ell h
ead
Sub
Sea
Rin
ghor
ne
Bald
er
UTM
zon
e 31
, ED
50
4600
00
4600
00
4640
00
4640
00
4680
00
4680
00
6560000
6560000
6564000
6564000
6568000
6568000
6572000
6572000
6576000
6576000
Figu
re 1
0-12
: Map
of s
ampl
ing
posit
ions
for R
ingh
orne
fiel
d, 2
000.
Tabl
e 10
-12:
Stat
ion
info
rmat
ion
for R
ingh
orne
fiel
d, 2
000.
St. n
o.
D
ista
nce
(m)
Dire
ctio
n (d
egr.)
Vo
lum
e (li
tres)
RIN
01
Wel
l hea
d pl
atfo
rm
2000
45
31
RIN
02
10
00
45
26
RIN
03
50
0 45
37
RIN
04
25
0 45
31
RIN
05
25
0 13
5 33
RIN
06
50
0 13
5 27
RIN
07
10
00
135
25
RIN
08
20
00
135
25
RIN
09
20
00
225
25
RIN
10
10
00
225
27
RIN
11
50
0 22
5 32
RIN
12
25
0 22
5 29
RIN
13
25
0 31
5 27
RIN
14
50
0 31
5 30
RIN
15
10
00
315
29
RIN
16
20
00
315
30
RIN
17
Sub
sea
inst
alla
tion
2000
22
5 25
RIN
18
10
00
225
28
RIN
19
50
0 22
5 43
RIN
20
25
0 22
5 41
RIN
21
25
0 31
5 36
RIN
22
50
0 31
5 35
RIN
23
10
00
315
46
RIN
24
20
00
315
37
RIN
25
25
0 13
5 46
RIN
26
50
0 13
5 42
RIN
27
10
00
135
46
RIN
28
20
00
135
44
RIN
30
25
0 45
51
RIN
31
50
0 45
40
RIN
32
10
00
45
42
RIN
33
20
00
45
46
RIN
29R
W
ell h
ead
plat
form
50
00
315
46 *
* The
add
ition
al fi
ve g
rab
sam
ples
take
n ga
ve 5
1 lit
res
of s
edim
ent.

Envi
ronm
enta
l mon
itorin
g su
rvey
of R
egio
n II,
200
0 Ak
vapl
an-n
iva
repo
rt: A
PN-4
11.1
890-
1
Pa
ge 1
0-26
Environmental monitoring survey of Region II, 2000 Akvaplan-niva report: APN-411.1890-1
Sigyn field 2000 Page 11-1
11 Sigyn field 11.1 Introduction The Sigyn field is located in Block 16-7 in the southern part of Region II, situated south of the Sleipner Øst field. In 1997 two wells were drilled, and data on discharges are given in Table 11-1.
This is a baseline survey for Sigyn. Information on the sampling stations is shown in Figure 11-11 and Table 11-12 both on the foldout page at the end of this chapter.
Table 11-1: Summary of recent operational and accidental discharges at the Sigyn field (all discharges in tonnes).
1997 1998 1999 2000 Comments
No of wells drilled 2 0 0 0
Barite 432 0 0 0
Cuttings 500 0 0 0 Only cuttings with water-based drilling mud was released
Water-based drilling mud 1600 0 0 0
Cementing and other chemicals 26 0 0 0
11.2 Results and discussion
11.2.1 Physical characteristics The median phi value and the amount (%) of pelite, fine sand and total organic matter (TOM) in the sediment from the present survey is shown in Table 11-2 and Figure 11-1. Detailed data on sediment characteristics such as colour, smell and a full set of analytical data, including TOM content and grain size distribution (with standard deviation, evenness and kurtosis) can be found in the Appendix.
The sediments in the Sigyn field area are classified as fine sand with median values varying from 3.45 at station SIG13 and SIG14 to 3.52 at station SIG09. The amount of pelite in the sediment varies from 1.72 % (SIG11) to 2.2 % (SIG09), the fine sand from 85.6 % (SIG02) to 91.2 % (SIG09) while the TOM varies from 0.64 % (SIG03) to 0.73 % (SIG08 and SIG16). The amount of pelite and fine sand is higher at the reference station SIG17R than at the field stations. The sediment is relatively uniform over the surveyed area.
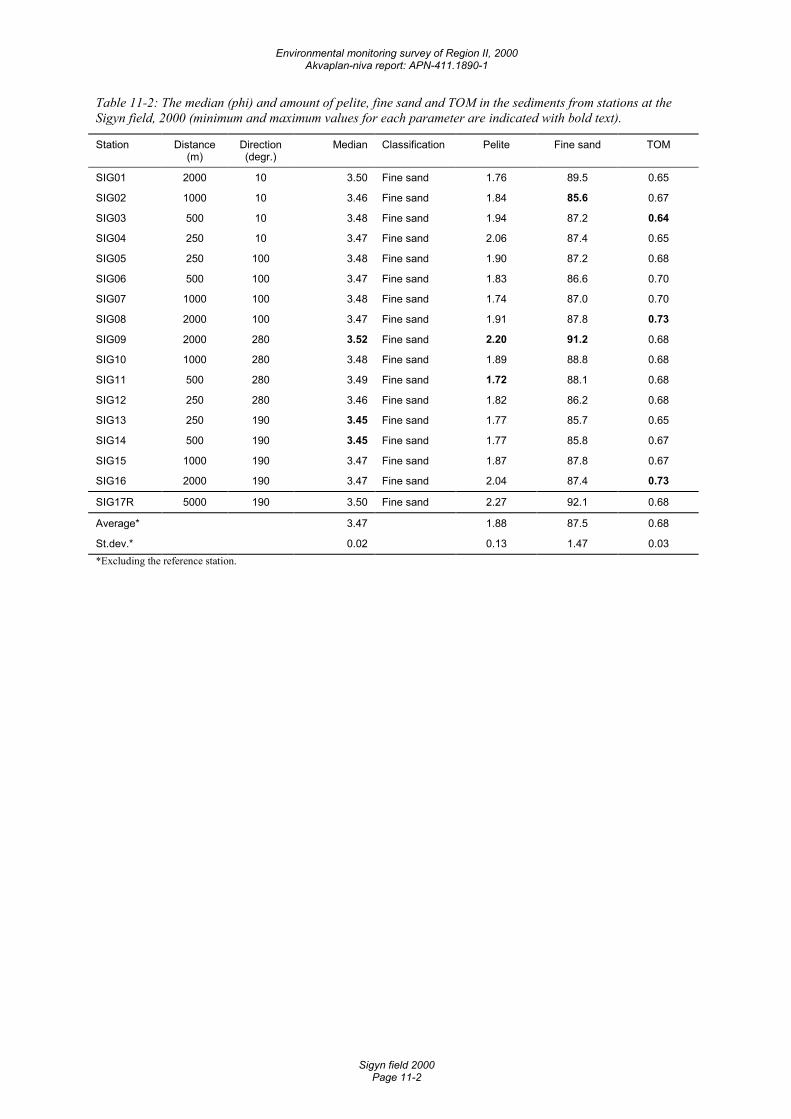
Environmental monitoring survey of Region II, 2000 Akvaplan-niva report: APN-411.1890-1
Sigyn field 2000 Page 11-2
Table 11-2: The median (phi) and amount of pelite, fine sand and TOM in the sediments from stations at the Sigyn field, 2000 (minimum and maximum values for each parameter are indicated with bold text).
Station Distance (m)
Direction (degr.)
Median Classification Pelite Fine sand TOM
SIG01 2000 10 3.50 Fine sand 1.76 89.5 0.65
SIG02 1000 10 3.46 Fine sand 1.84 85.6 0.67
SIG03 500 10 3.48 Fine sand 1.94 87.2 0.64
SIG04 250 10 3.47 Fine sand 2.06 87.4 0.65
SIG05 250 100 3.48 Fine sand 1.90 87.2 0.68
SIG06 500 100 3.47 Fine sand 1.83 86.6 0.70
SIG07 1000 100 3.48 Fine sand 1.74 87.0 0.70
SIG08 2000 100 3.47 Fine sand 1.91 87.8 0.73
SIG09 2000 280 3.52 Fine sand 2.20 91.2 0.68
SIG10 1000 280 3.48 Fine sand 1.89 88.8 0.68
SIG11 500 280 3.49 Fine sand 1.72 88.1 0.68
SIG12 250 280 3.46 Fine sand 1.82 86.2 0.68
SIG13 250 190 3.45 Fine sand 1.77 85.7 0.65
SIG14 500 190 3.45 Fine sand 1.77 85.8 0.67
SIG15 1000 190 3.47 Fine sand 1.87 87.8 0.67
SIG16 2000 190 3.47 Fine sand 2.04 87.4 0.73
SIG17R 5000 190 3.50 Fine sand 2.27 92.1 0.68
Average* 3.47 1.88 87.5 0.68
St.dev.* 0.02 0.13 1.47 0.03 *Excluding the reference station.
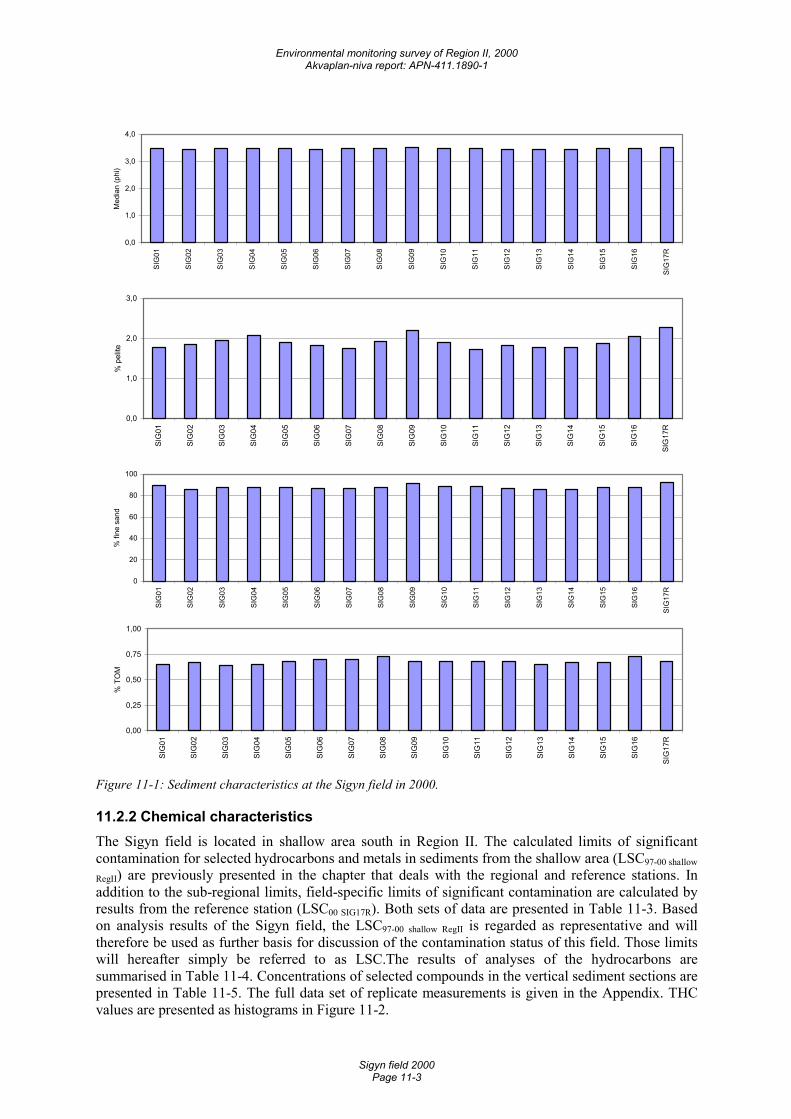
Environmental monitoring survey of Region II, 2000 Akvaplan-niva report: APN-411.1890-1
Sigyn field 2000 Page 11-3
0,0
1,0
2,0
3,0
4,0
SIG
01
SIG
02
SIG
03
SIG
04
SIG
05
SIG
06
SIG
07
SIG
08
SIG
09
SIG
10
SIG
11
SIG
12
SIG
13
SIG
14
SIG
15
SIG
16
SIG
17R
Med
ian
(phi
)
0,0
1,0
2,0
3,0
SIG
01
SIG
02
SIG
03
SIG
04
SIG
05
SIG
06
SIG
07
SIG
08
SIG
09
SIG
10
SIG
11
SIG
12
SIG
13
SIG
14
SIG
15
SIG
16
SIG
17R
% p
elite
0
20
40
60
80
100
SIG
01
SIG
02
SIG
03
SIG
04
SIG
05
SIG
06
SIG
07
SIG
08
SIG
09
SIG
10
SIG
11
SIG
12
SIG
13
SIG
14
SIG
15
SIG
16
SIG
17R
% fi
ne s
and
0,00
0,25
0,50
0,75
1,00
SIG
01
SIG
02
SIG
03
SIG
04
SIG
05
SIG
06
SIG
07
SIG
08
SIG
09
SIG
10
SIG
11
SIG
12
SIG
13
SIG
14
SIG
15
SIG
16
SIG
17R
% T
OM
Figure 11-1: Sediment characteristics at the Sigyn field in 2000.
11.2.2 Chemical characteristics The Sigyn field is located in shallow area south in Region II. The calculated limits of significant contamination for selected hydrocarbons and metals in sediments from the shallow area (LSC97-00 shallow
RegII) are previously presented in the chapter that deals with the regional and reference stations. In addition to the sub-regional limits, field-specific limits of significant contamination are calculated by results from the reference station (LSC00 SIG17R). Both sets of data are presented in Table 11-3. Based on analysis results of the Sigyn field, the LSC97-00 shallow RegII is regarded as representative and will therefore be used as further basis for discussion of the contamination status of this field. Those limits will hereafter simply be referred to as LSC.The results of analyses of the hydrocarbons are summarised in Table 11-4. Concentrations of selected compounds in the vertical sediment sections are presented in Table 11-5. The full data set of replicate measurements is given in the Appendix. THC values are presented as histograms in Figure 11-2.
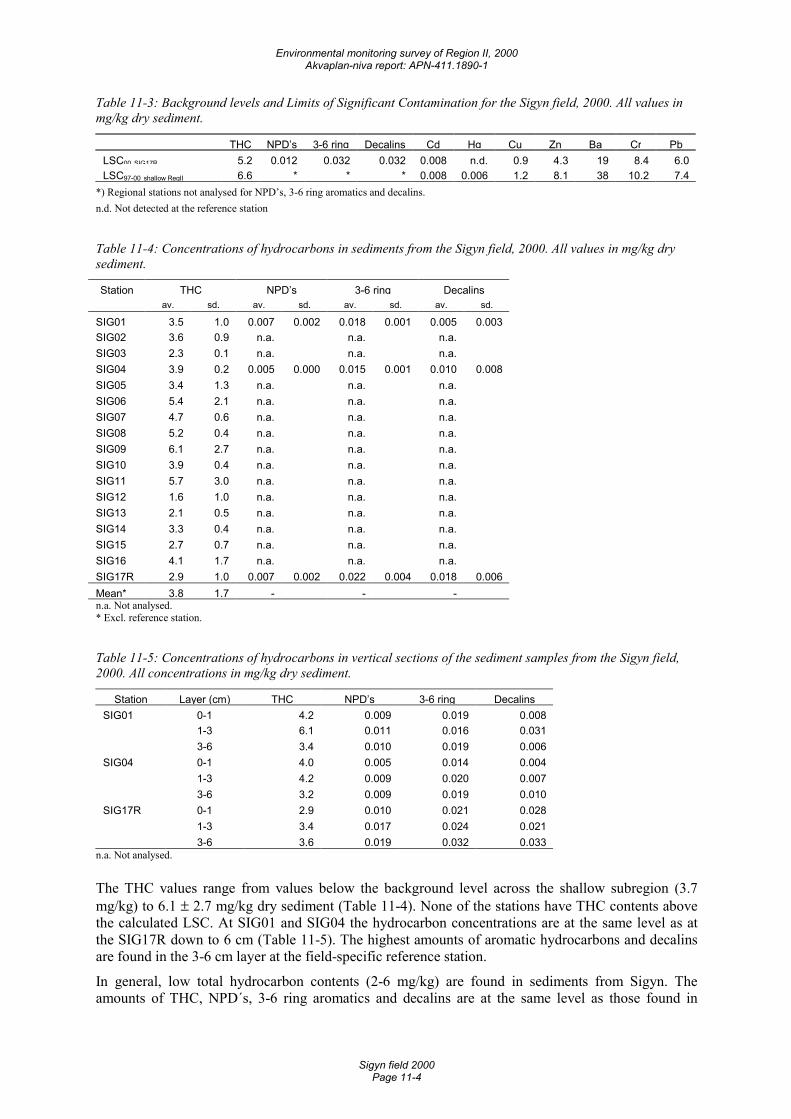
Environmental monitoring survey of Region II, 2000 Akvaplan-niva report: APN-411.1890-1
Sigyn field 2000 Page 11-4
Table 11-3: Background levels and Limits of Significant Contamination for the Sigyn field, 2000. All values in mg/kg dry sediment.
THC NPD’s 3-6 ring Decalins Cd Hg Cu Zn Ba Cr PbLSC00 SIG17R 5.2 0.012 0.032 0.032 0.008 n.d. 0.9 4.3 19 8.4 6.0LSC97-00 shallow RegII 6.6 * * * 0.008 0.006 1.2 8.1 38 10.2 7.4
*) Regional stations not analysed for NPD’s, 3-6 ring aromatics and decalins. n.d. Not detected at the reference station Table 11-4: Concentrations of hydrocarbons in sediments from the Sigyn field, 2000. All values in mg/kg dry sediment.
Station THC NPD’s 3-6 ring Decalins av. sd. av. sd. av. sd. av. sd.
SIG01 3.5 1.0 0.007 0.002 0.018 0.001 0.005 0.003SIG02 3.6 0.9 n.a. n.a. n.a.SIG03 2.3 0.1 n.a. n.a. n.a.SIG04 3.9 0.2 0.005 0.000 0.015 0.001 0.010 0.008SIG05 3.4 1.3 n.a. n.a. n.a.SIG06 5.4 2.1 n.a. n.a. n.a.SIG07 4.7 0.6 n.a. n.a. n.a.SIG08 5.2 0.4 n.a. n.a. n.a.SIG09 6.1 2.7 n.a. n.a. n.a.SIG10 3.9 0.4 n.a. n.a. n.a.SIG11 5.7 3.0 n.a. n.a. n.a.SIG12 1.6 1.0 n.a. n.a. n.a.SIG13 2.1 0.5 n.a. n.a. n.a.SIG14 3.3 0.4 n.a. n.a. n.a.SIG15 2.7 0.7 n.a. n.a. n.a.SIG16 4.1 1.7 n.a. n.a. n.a.SIG17R 2.9 1.0 0.007 0.002 0.022 0.004 0.018 0.006Mean* 3.8 1.7 - - -n.a. Not analysed. * Excl. reference station. Table 11-5: Concentrations of hydrocarbons in vertical sections of the sediment samples from the Sigyn field, 2000. All concentrations in mg/kg dry sediment.
Station Layer (cm) THC NPD’s 3-6 ring DecalinsSIG01 0-1 4.2 0.009 0.019 0.008 1-3 6.1 0.011 0.016 0.031 3-6 3.4 0.010 0.019 0.006SIG04 0-1 4.0 0.005 0.014 0.004 1-3 4.2 0.009 0.020 0.007 3-6 3.2 0.009 0.019 0.010SIG17R 0-1 2.9 0.010 0.021 0.028 1-3 3.4 0.017 0.024 0.021 3-6 3.6 0.019 0.032 0.033
n.a. Not analysed. The THC values range from values below the background level across the shallow subregion (3.7 mg/kg) to 6.1 ± 2.7 mg/kg dry sediment (Table 11-4). None of the stations have THC contents above the calculated LSC. At SIG01 and SIG04 the hydrocarbon concentrations are at the same level as at the SIG17R down to 6 cm (Table 11-5). The highest amounts of aromatic hydrocarbons and decalins are found in the 3-6 cm layer at the field-specific reference station.
In general, low total hydrocarbon contents (2-6 mg/kg) are found in sediments from Sigyn. The amounts of THC, NPD´s, 3-6 ring aromatics and decalins are at the same level as those found in
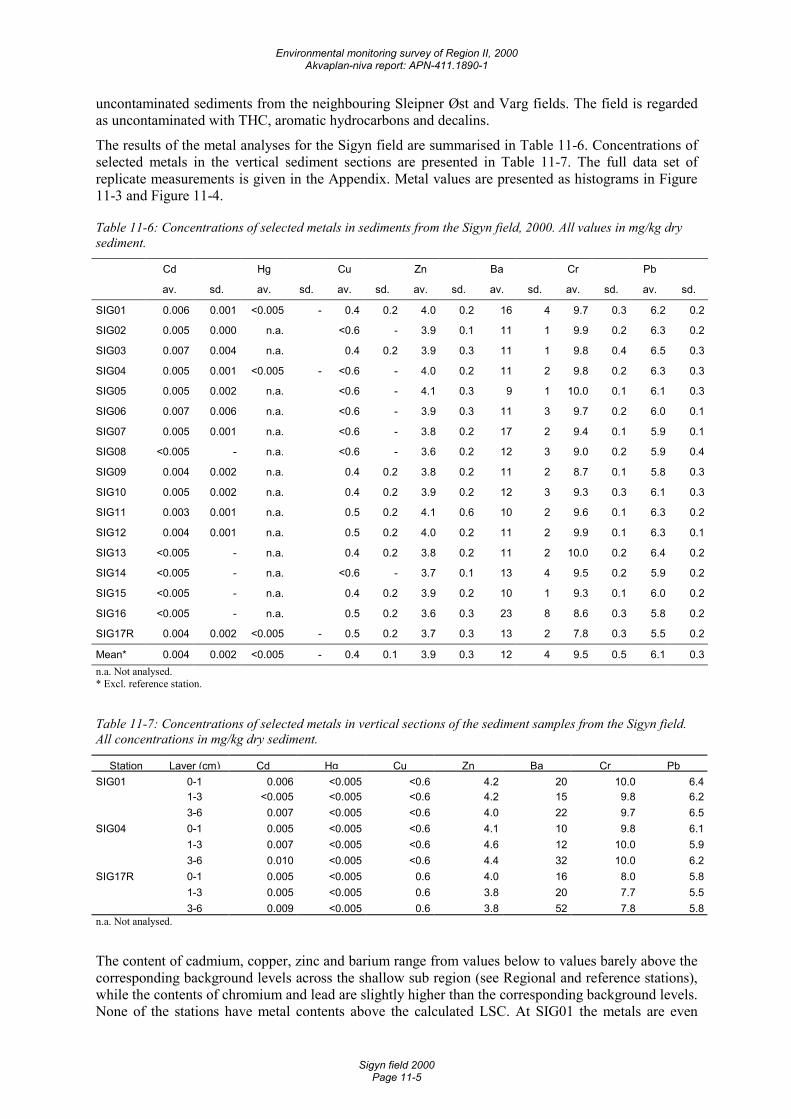
Environmental monitoring survey of Region II, 2000 Akvaplan-niva report: APN-411.1890-1
Sigyn field 2000 Page 11-5
uncontaminated sediments from the neighbouring Sleipner Øst and Varg fields. The field is regarded as uncontaminated with THC, aromatic hydrocarbons and decalins.
The results of the metal analyses for the Sigyn field are summarised in Table 11-6. Concentrations of selected metals in the vertical sediment sections are presented in Table 11-7. The full data set of replicate measurements is given in the Appendix. Metal values are presented as histograms in Figure 11-3 and Figure 11-4.
Table 11-6: Concentrations of selected metals in sediments from the Sigyn field, 2000. All values in mg/kg dry sediment.
Cd Hg Cu Zn Ba Cr Pb
av. sd. av. sd. av. sd. av. sd. av. sd. av. sd. av. sd.
SIG01 0.006 0.001 <0.005 - 0.4 0.2 4.0 0.2 16 4 9.7 0.3 6.2 0.2
SIG02 0.005 0.000 n.a. <0.6 - 3.9 0.1 11 1 9.9 0.2 6.3 0.2
SIG03 0.007 0.004 n.a. 0.4 0.2 3.9 0.3 11 1 9.8 0.4 6.5 0.3
SIG04 0.005 0.001 <0.005 - <0.6 - 4.0 0.2 11 2 9.8 0.2 6.3 0.3
SIG05 0.005 0.002 n.a. <0.6 - 4.1 0.3 9 1 10.0 0.1 6.1 0.3
SIG06 0.007 0.006 n.a. <0.6 - 3.9 0.3 11 3 9.7 0.2 6.0 0.1
SIG07 0.005 0.001 n.a. <0.6 - 3.8 0.2 17 2 9.4 0.1 5.9 0.1
SIG08 <0.005 - n.a. <0.6 - 3.6 0.2 12 3 9.0 0.2 5.9 0.4
SIG09 0.004 0.002 n.a. 0.4 0.2 3.8 0.2 11 2 8.7 0.1 5.8 0.3
SIG10 0.005 0.002 n.a. 0.4 0.2 3.9 0.2 12 3 9.3 0.3 6.1 0.3
SIG11 0.003 0.001 n.a. 0.5 0.2 4.1 0.6 10 2 9.6 0.1 6.3 0.2
SIG12 0.004 0.001 n.a. 0.5 0.2 4.0 0.2 11 2 9.9 0.1 6.3 0.1
SIG13 <0.005 - n.a. 0.4 0.2 3.8 0.2 11 2 10.0 0.2 6.4 0.2
SIG14 <0.005 - n.a. <0.6 - 3.7 0.1 13 4 9.5 0.2 5.9 0.2
SIG15 <0.005 - n.a. 0.4 0.2 3.9 0.2 10 1 9.3 0.1 6.0 0.2
SIG16 <0.005 - n.a. 0.5 0.2 3.6 0.3 23 8 8.6 0.3 5.8 0.2
SIG17R 0.004 0.002 <0.005 - 0.5 0.2 3.7 0.3 13 2 7.8 0.3 5.5 0.2
Mean* 0.004 0.002 <0.005 - 0.4 0.1 3.9 0.3 12 4 9.5 0.5 6.1 0.3n.a. Not analysed. * Excl. reference station. Table 11-7: Concentrations of selected metals in vertical sections of the sediment samples from the Sigyn field. All concentrations in mg/kg dry sediment.
Station Layer (cm) Cd Hg Cu Zn Ba Cr PbSIG01 0-1 0.006 <0.005 <0.6 4.2 20 10.0 6.4 1-3 <0.005 <0.005 <0.6 4.2 15 9.8 6.2 3-6 0.007 <0.005 <0.6 4.0 22 9.7 6.5SIG04 0-1 0.005 <0.005 <0.6 4.1 10 9.8 6.1 1-3 0.007 <0.005 <0.6 4.6 12 10.0 5.9 3-6 0.010 <0.005 <0.6 4.4 32 10.0 6.2SIG17R 0-1 0.005 <0.005 0.6 4.0 16 8.0 5.8 1-3 0.005 <0.005 0.6 3.8 20 7.7 5.5 3-6 0.009 <0.005 0.6 3.8 52 7.8 5.8n.a. Not analysed.
The content of cadmium, copper, zinc and barium range from values below to values barely above the corresponding background levels across the shallow sub region (see Regional and reference stations), while the contents of chromium and lead are slightly higher than the corresponding background levels. None of the stations have metal contents above the calculated LSC. At SIG01 the metals are even
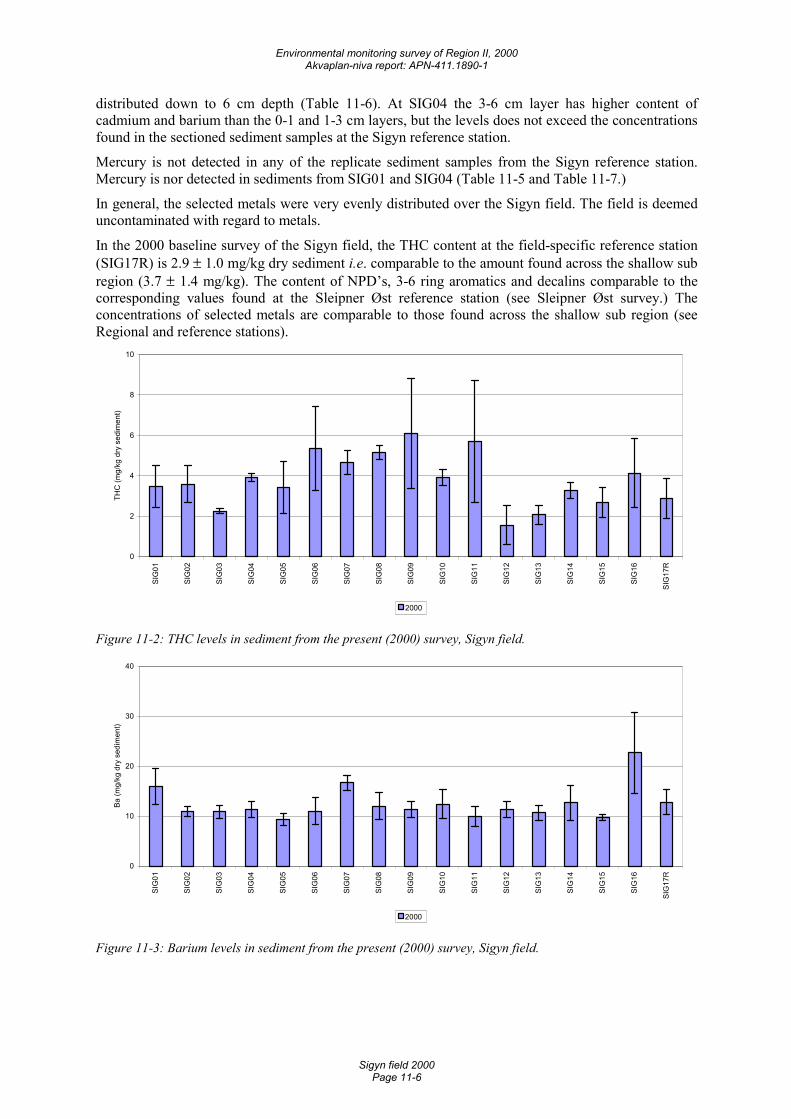
Environmental monitoring survey of Region II, 2000 Akvaplan-niva report: APN-411.1890-1
Sigyn field 2000 Page 11-6
distributed down to 6 cm depth (Table 11-6). At SIG04 the 3-6 cm layer has higher content of cadmium and barium than the 0-1 and 1-3 cm layers, but the levels does not exceed the concentrations found in the sectioned sediment samples at the Sigyn reference station.
Mercury is not detected in any of the replicate sediment samples from the Sigyn reference station. Mercury is nor detected in sediments from SIG01 and SIG04 (Table 11-5 and Table 11-7.)
In general, the selected metals were very evenly distributed over the Sigyn field. The field is deemed uncontaminated with regard to metals.
In the 2000 baseline survey of the Sigyn field, the THC content at the field-specific reference station (SIG17R) is 2.9 ± 1.0 mg/kg dry sediment i.e. comparable to the amount found across the shallow sub region (3.7 ± 1.4 mg/kg). The content of NPD’s, 3-6 ring aromatics and decalins comparable to the corresponding values found at the Sleipner Øst reference station (see Sleipner Øst survey.) The concentrations of selected metals are comparable to those found across the shallow sub region (see Regional and reference stations).
0
2
4
6
8
10
SIG
01
SIG
02
SIG
03
SIG
04
SIG
05
SIG
06
SIG
07
SIG
08
SIG
09
SIG
10
SIG
11
SIG
12
SIG
13
SIG
14
SIG
15
SIG
16
SIG
17R
THC
(mg/
kg d
ry s
edim
ent)
2000
Figure 11-2: THC levels in sediment from the present (2000) survey, Sigyn field.
0
10
20
30
40
SIG
01
SIG
02
SIG
03
SIG
04
SIG
05
SIG
06
SIG
07
SIG
08
SIG
09
SIG
10
SIG
11
SIG
12
SIG
13
SIG
14
SIG
15
SIG
16
SIG
17R
Ba (m
g/kg
dry
sed
imen
t)
2000
Figure 11-3: Barium levels in sediment from the present (2000) survey, Sigyn field.
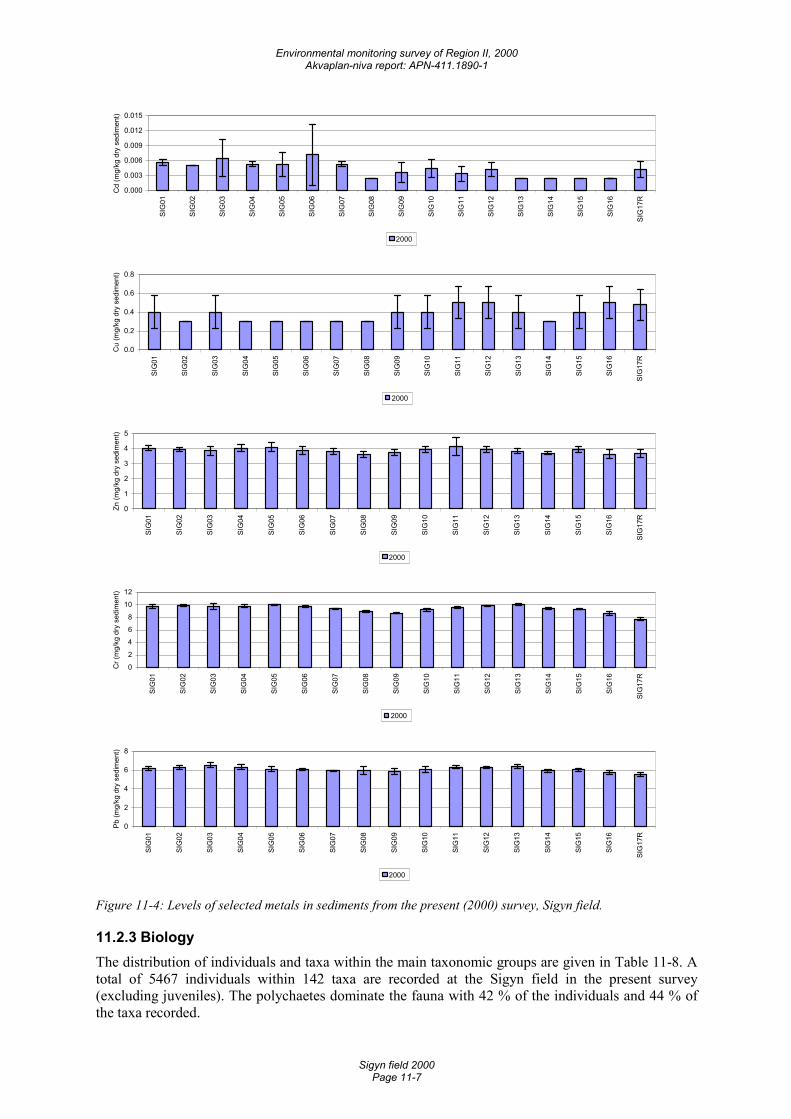
Environmental monitoring survey of Region II, 2000 Akvaplan-niva report: APN-411.1890-1
Sigyn field 2000 Page 11-7
0.000
0.003
0.006
0.009
0.012
0.015
SIG
01
SIG
02
SIG
03
SIG
04
SIG
05
SIG
06
SIG
07
SIG
08
SIG
09
SIG
10
SIG
11
SIG
12
SIG
13
SIG
14
SIG
15
SIG
16
SIG
17R
Cd
(mg/
kg d
ry s
edim
ent)
2000
0.0
0.2
0.4
0.6
0.8
SIG
01
SIG
02
SIG
03
SIG
04
SIG
05
SIG
06
SIG
07
SIG
08
SIG
09
SIG
10
SIG
11
SIG
12
SIG
13
SIG
14
SIG
15
SIG
16
SIG
17R
Cu
(mg/
kg d
ry s
edim
ent)
2000
0
1
2
3
4
5
SIG
01
SIG
02
SIG
03
SIG
04
SIG
05
SIG
06
SIG
07
SIG
08
SIG
09
SIG
10
SIG
11
SIG
12
SIG
13
SIG
14
SIG
15
SIG
16
SIG
17R
Zn (m
g/kg
dry
sed
imen
t)
2000
0
2
4
6
8
10
12
SIG
01
SIG
02
SIG
03
SIG
04
SIG
05
SIG
06
SIG
07
SIG
08
SIG
09
SIG
10
SIG
11
SIG
12
SIG
13
SIG
14
SIG
15
SIG
16
SIG
17R
Cr (
mg/
kg d
ry s
edim
ent)
2000
0
2
4
6
8
SIG
01
SIG
02
SIG
03
SIG
04
SIG
05
SIG
06
SIG
07
SIG
08
SIG
09
SIG
10
SIG
11
SIG
12
SIG
13
SIG
14
SIG
15
SIG
16
SIG
17R
Pb (m
g/kg
dry
sed
imen
t)
2000
Figure 11-4: Levels of selected metals in sediments from the present (2000) survey, Sigyn field.
11.2.3 Biology The distribution of individuals and taxa within the main taxonomic groups are given in Table 11-8. A total of 5467 individuals within 142 taxa are recorded at the Sigyn field in the present survey (excluding juveniles). The polychaetes dominate the fauna with 42 % of the individuals and 44 % of the taxa recorded.
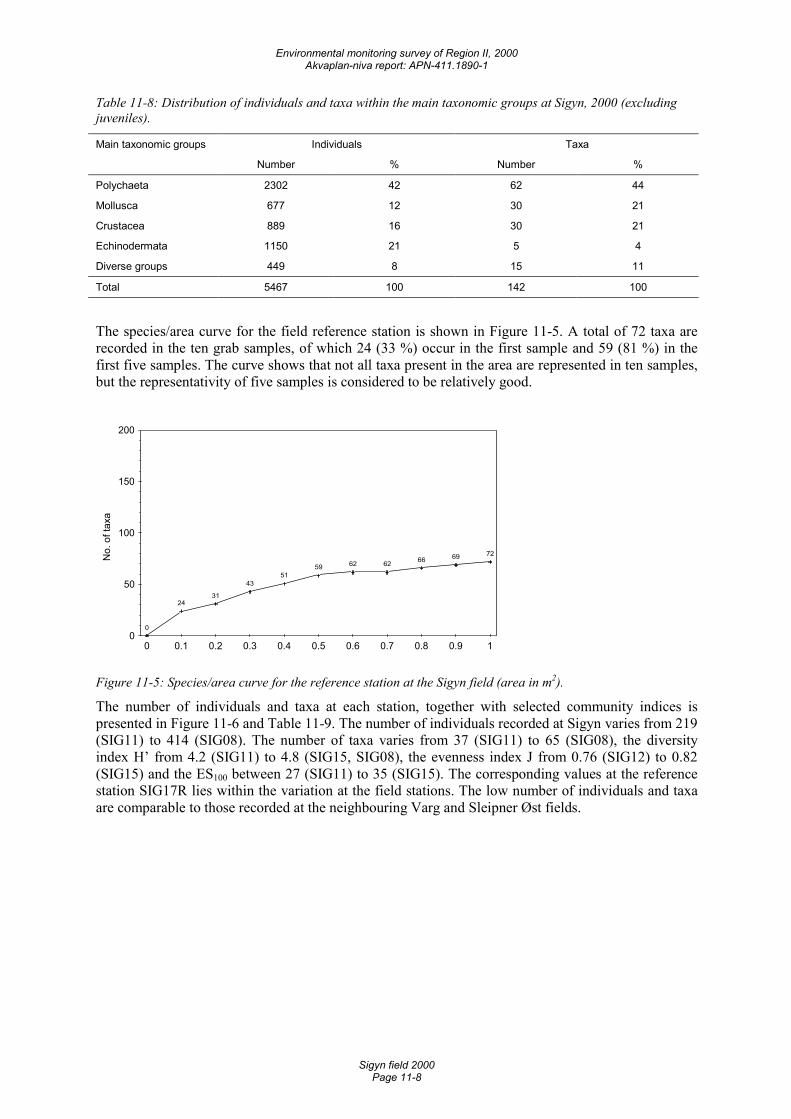
Environmental monitoring survey of Region II, 2000 Akvaplan-niva report: APN-411.1890-1
Sigyn field 2000 Page 11-8
Table 11-8: Distribution of individuals and taxa within the main taxonomic groups at Sigyn, 2000 (excluding juveniles).
Main taxonomic groups Individuals Taxa
Number % Number %
Polychaeta 2302 42 62 44
Mollusca 677 12 30 21
Crustacea 889 16 30 21
Echinodermata 1150 21 5 4
Diverse groups 449 8 15 11
Total 5467 100 142 100
The species/area curve for the field reference station is shown in Figure 11-5. A total of 72 taxa are recorded in the ten grab samples, of which 24 (33 %) occur in the first sample and 59 (81 %) in the first five samples. The curve shows that not all taxa present in the area are represented in ten samples, but the representativity of five samples is considered to be relatively good.
No.
of t
axa
0
2431
4351
59 62 62 66 69 72
0
50
100
150
200
0 0.1 0.2 0.3 0.4 0.5 0.6 0.7 0.8 0.9 1
Figure 11-5: Species/area curve for the reference station at the Sigyn field (area in m2).
The number of individuals and taxa at each station, together with selected community indices is presented in Figure 11-6 and Table 11-9. The number of individuals recorded at Sigyn varies from 219 (SIG11) to 414 (SIG08). The number of taxa varies from 37 (SIG11) to 65 (SIG08), the diversity index H’ from 4.2 (SIG11) to 4.8 (SIG15, SIG08), the evenness index J from 0.76 (SIG12) to 0.82 (SIG15) and the ES100 between 27 (SIG11) to 35 (SIG15). The corresponding values at the reference station SIG17R lies within the variation at the field stations. The low number of individuals and taxa are comparable to those recorded at the neighbouring Varg and Sleipner Øst fields.
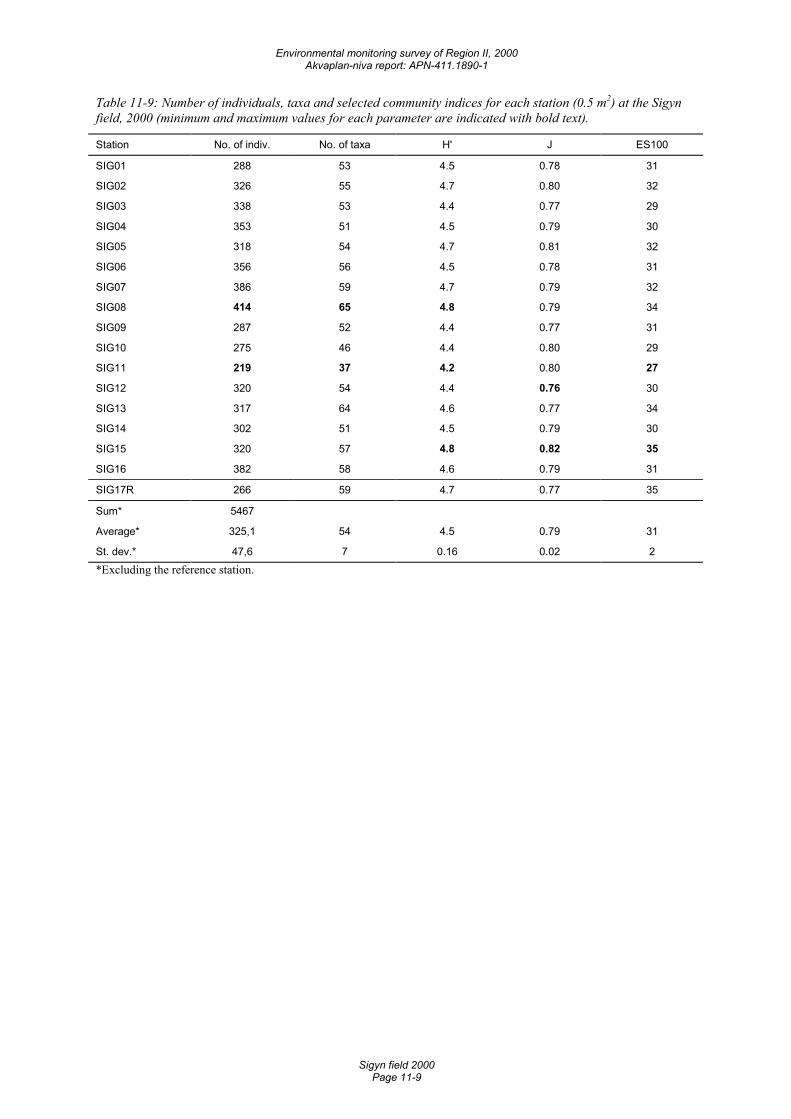
Environmental monitoring survey of Region II, 2000 Akvaplan-niva report: APN-411.1890-1
Sigyn field 2000 Page 11-9
Table 11-9: Number of individuals, taxa and selected community indices for each station (0.5 m2) at the Sigyn field, 2000 (minimum and maximum values for each parameter are indicated with bold text).
Station No. of indiv. No. of taxa H' J ES100
SIG01 288 53 4.5 0.78 31
SIG02 326 55 4.7 0.80 32
SIG03 338 53 4.4 0.77 29
SIG04 353 51 4.5 0.79 30
SIG05 318 54 4.7 0.81 32
SIG06 356 56 4.5 0.78 31
SIG07 386 59 4.7 0.79 32
SIG08 414 65 4.8 0.79 34
SIG09 287 52 4.4 0.77 31
SIG10 275 46 4.4 0.80 29
SIG11 219 37 4.2 0.80 27
SIG12 320 54 4.4 0.76 30
SIG13 317 64 4.6 0.77 34
SIG14 302 51 4.5 0.79 30
SIG15 320 57 4.8 0.82 35
SIG16 382 58 4.6 0.79 31
SIG17R 266 59 4.7 0.77 35
Sum* 5467
Average* 325,1 54 4.5 0.79 31
St. dev.* 47,6 7 0.16 0.02 2
*Excluding the reference station.
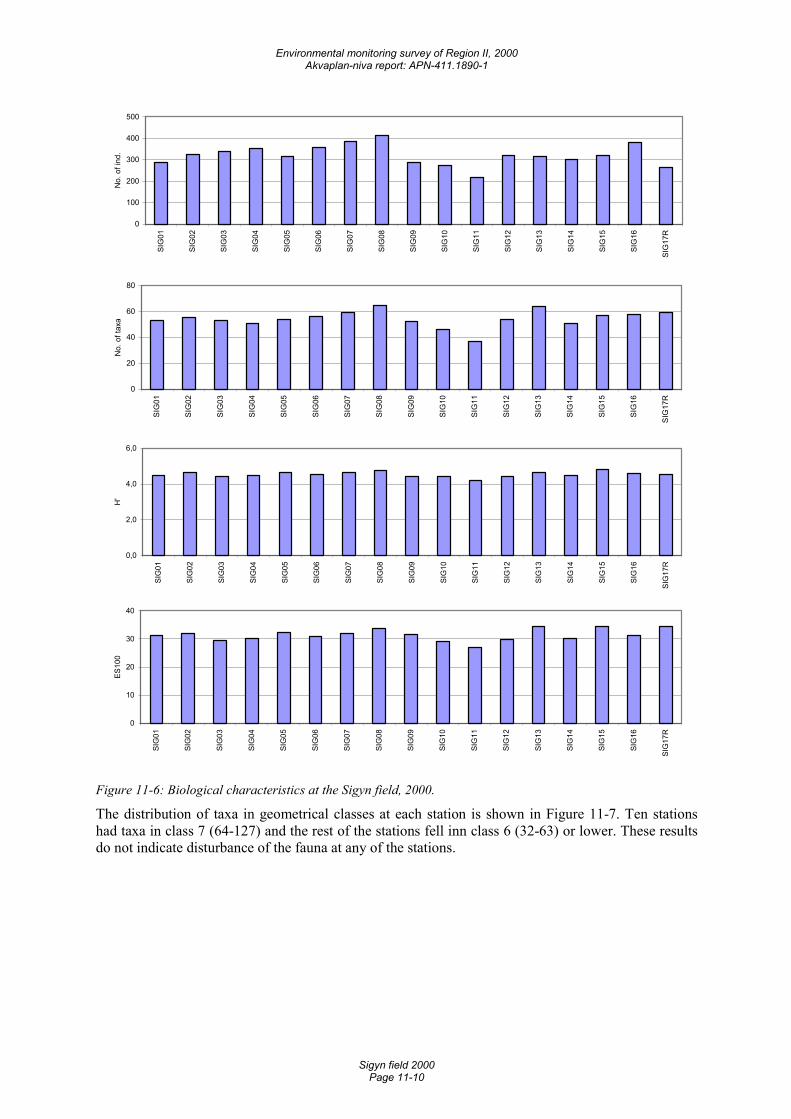
Environmental monitoring survey of Region II, 2000 Akvaplan-niva report: APN-411.1890-1
Sigyn field 2000 Page 11-10
0
100
200
300
400
500
SIG
01
SIG
02
SIG
03
SIG
04
SIG
05
SIG
06
SIG
07
SIG
08
SIG
09
SIG
10
SIG
11
SIG
12
SIG
13
SIG
14
SIG
15
SIG
16
SIG
17R
No.
of i
nd.
0
20
40
60
80
SIG
01
SIG
02
SIG
03
SIG
04
SIG
05
SIG
06
SIG
07
SIG
08
SIG
09
SIG
10
SIG
11
SIG
12
SIG
13
SIG
14
SIG
15
SIG
16
SIG
17R
No.
of t
axa
0,0
2,0
4,0
6,0
SIG
01
SIG
02
SIG
03
SIG
04
SIG
05
SIG
06
SIG
07
SIG
08
SIG
09
SIG
10
SIG
11
SIG
12
SIG
13
SIG
14
SIG
15
SIG
16
SIG
17R
H'
0
10
20
30
40
SIG
01
SIG
02
SIG
03
SIG
04
SIG
05
SIG
06
SIG
07
SIG
08
SIG
09
SIG
10
SIG
11
SIG
12
SIG
13
SIG
14
SIG
15
SIG
16
SIG
17R
ES10
0
Figure 11-6: Biological characteristics at the Sigyn field, 2000.
The distribution of taxa in geometrical classes at each station is shown in Figure 11-7. Ten stations had taxa in class 7 (64-127) and the rest of the stations fell inn class 6 (32-63) or lower. These results do not indicate disturbance of the fauna at any of the stations.
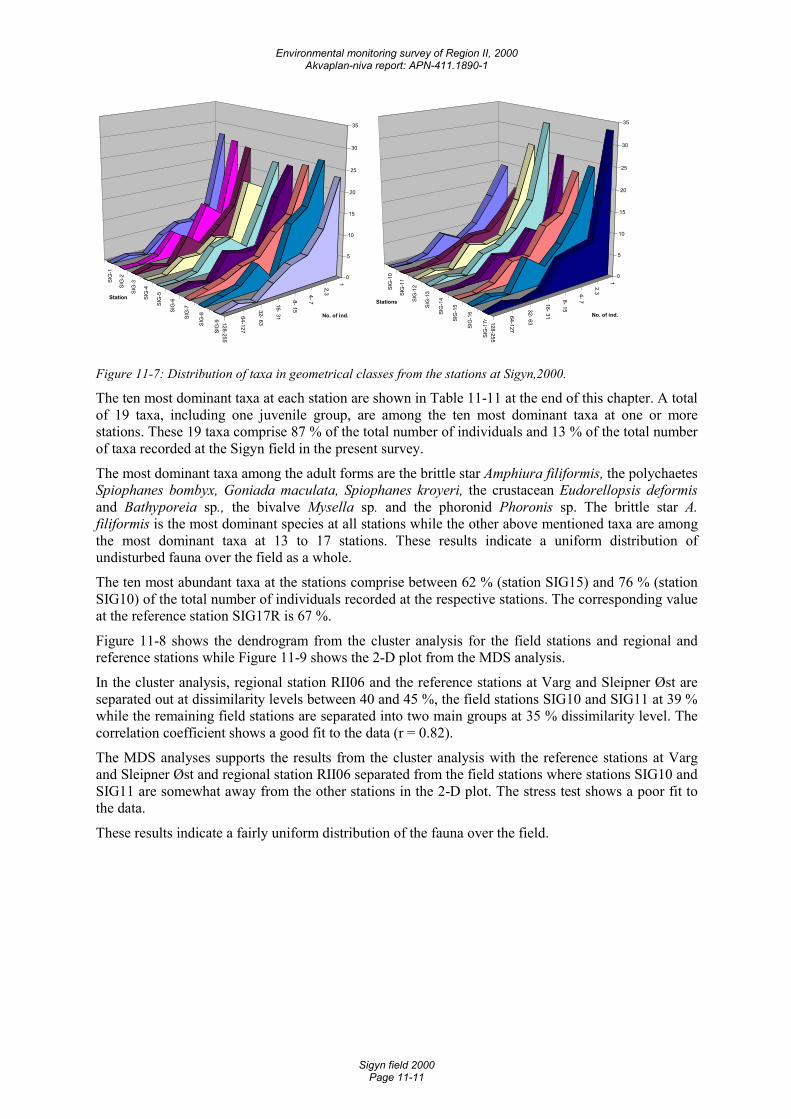
Environmental monitoring survey of Region II, 2000 Akvaplan-niva report: APN-411.1890-1
Sigyn field 2000 Page 11-11
1
2,3 4- 7 8- 15
16- 31
32- 63
64-127
128-255
SIG
-1
SIG
-2
SIG
-3
SIG
-4
SIG
-5
SIG
-6
SIG
-7
SIG
-8
SIG
-9
0
5
10
15
20
25
30
35
No. of ind.
Station
1
2,3 4- 7 8- 15
16- 31
32- 63
64-127
128-255
SIG
-10
SIG
-11
SIG
-12
SIG
-13
SIG
-14
SIG
-15
SIG
-16
SIG
-17r
0
5
10
15
20
25
30
35
No. of ind.
Stations
Figure 11-7: Distribution of taxa in geometrical classes from the stations at Sigyn,2000.
The ten most dominant taxa at each station are shown in Table 11-11 at the end of this chapter. A total of 19 taxa, including one juvenile group, are among the ten most dominant taxa at one or more stations. These 19 taxa comprise 87 % of the total number of individuals and 13 % of the total number of taxa recorded at the Sigyn field in the present survey.
The most dominant taxa among the adult forms are the brittle star Amphiura filiformis, the polychaetes Spiophanes bombyx, Goniada maculata, Spiophanes kroyeri, the crustacean Eudorellopsis deformis and Bathyporeia sp., the bivalve Mysella sp. and the phoronid Phoronis sp. The brittle star A. filiformis is the most dominant species at all stations while the other above mentioned taxa are among the most dominant taxa at 13 to 17 stations. These results indicate a uniform distribution of undisturbed fauna over the field as a whole.
The ten most abundant taxa at the stations comprise between 62 % (station SIG15) and 76 % (station SIG10) of the total number of individuals recorded at the respective stations. The corresponding value at the reference station SIG17R is 67 %.
Figure 11-8 shows the dendrogram from the cluster analysis for the field stations and regional and reference stations while Figure 11-9 shows the 2-D plot from the MDS analysis.
In the cluster analysis, regional station RII06 and the reference stations at Varg and Sleipner Øst are separated out at dissimilarity levels between 40 and 45 %, the field stations SIG10 and SIG11 at 39 % while the remaining field stations are separated into two main groups at 35 % dissimilarity level. The correlation coefficient shows a good fit to the data (r = 0.82).
The MDS analyses supports the results from the cluster analysis with the reference stations at Varg and Sleipner Øst and regional station RII06 separated from the field stations where stations SIG10 and SIG11 are somewhat away from the other stations in the 2-D plot. The stress test shows a poor fit to the data.
These results indicate a fairly uniform distribution of the fauna over the field.
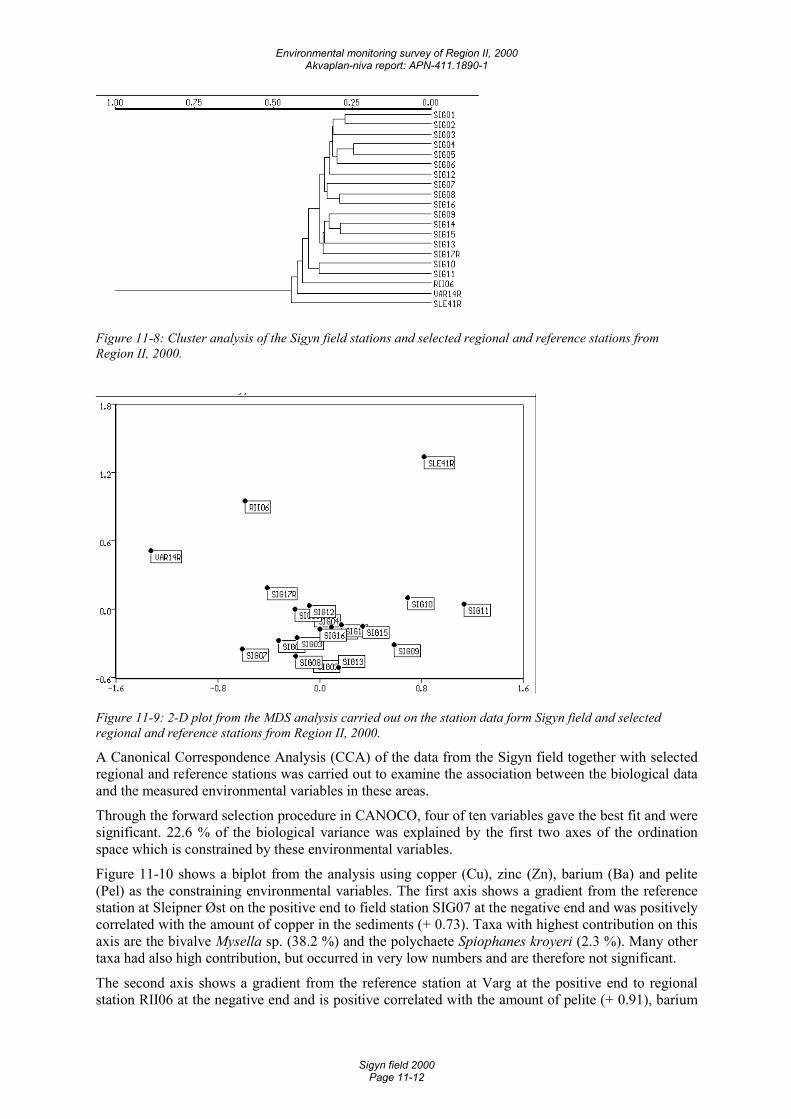
Environmental monitoring survey of Region II, 2000 Akvaplan-niva report: APN-411.1890-1
Sigyn field 2000 Page 11-12
Figure 11-8: Cluster analysis of the Sigyn field stations and selected regional and reference stations from Region II, 2000.
Figure 11-9: 2-D plot from the MDS analysis carried out on the station data form Sigyn field and selected regional and reference stations from Region II, 2000.
A Canonical Correspondence Analysis (CCA) of the data from the Sigyn field together with selected regional and reference stations was carried out to examine the association between the biological data and the measured environmental variables in these areas.
Through the forward selection procedure in CANOCO, four of ten variables gave the best fit and were significant. 22.6 % of the biological variance was explained by the first two axes of the ordination space which is constrained by these environmental variables.
Figure 11-10 shows a biplot from the analysis using copper (Cu), zinc (Zn), barium (Ba) and pelite (Pel) as the constraining environmental variables. The first axis shows a gradient from the reference station at Sleipner Øst on the positive end to field station SIG07 at the negative end and was positively correlated with the amount of copper in the sediments (+ 0.73). Taxa with highest contribution on this axis are the bivalve Mysella sp. (38.2 %) and the polychaete Spiophanes kroyeri (2.3 %). Many other taxa had also high contribution, but occurred in very low numbers and are therefore not significant.
The second axis shows a gradient from the reference station at Varg at the positive end to regional station RII06 at the negative end and is positive correlated with the amount of pelite (+ 0.91), barium
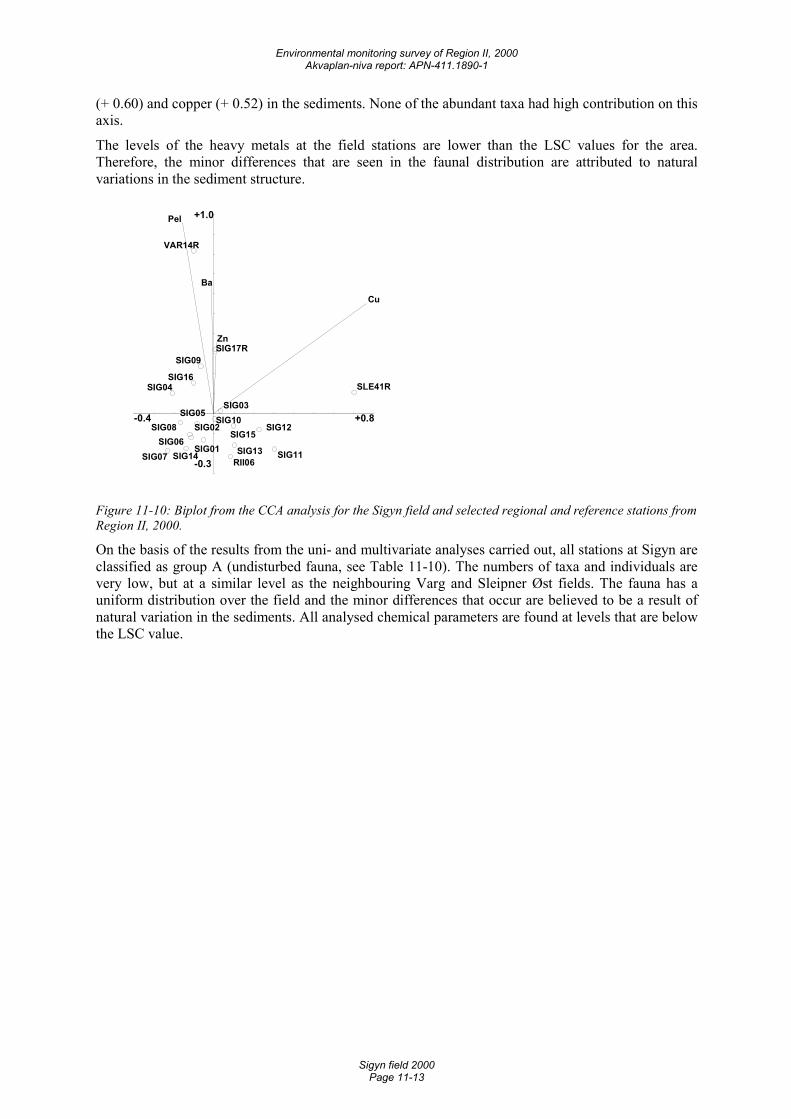
Environmental monitoring survey of Region II, 2000 Akvaplan-niva report: APN-411.1890-1
Sigyn field 2000 Page 11-13
(+ 0.60) and copper (+ 0.52) in the sediments. None of the abundant taxa had high contribution on this axis.
The levels of the heavy metals at the field stations are lower than the LSC values for the area. Therefore, the minor differences that are seen in the faunal distribution are attributed to natural variations in the sediment structure.
-0.4 +0.8
-0.3
+1.0
Cu
Pel
Ba
Zn
SLE41R
SIG11SIG07
SIG12
SIG04
SIG08
SIG14
SIG02SIG06
SIG16
SIG13
VAR14R
SIG15
SIG05
RII06
SIG09
SIG01
SIG03
SIG17R
SIG10
Figure 11-10: Biplot from the CCA analysis for the Sigyn field and selected regional and reference stations from Region II, 2000.
On the basis of the results from the uni- and multivariate analyses carried out, all stations at Sigyn are classified as group A (undisturbed fauna, see Table 11-10). The numbers of taxa and individuals are very low, but at a similar level as the neighbouring Varg and Sleipner Øst fields. The fauna has a uniform distribution over the field and the minor differences that occur are believed to be a result of natural variation in the sediments. All analysed chemical parameters are found at levels that are below the LSC value.
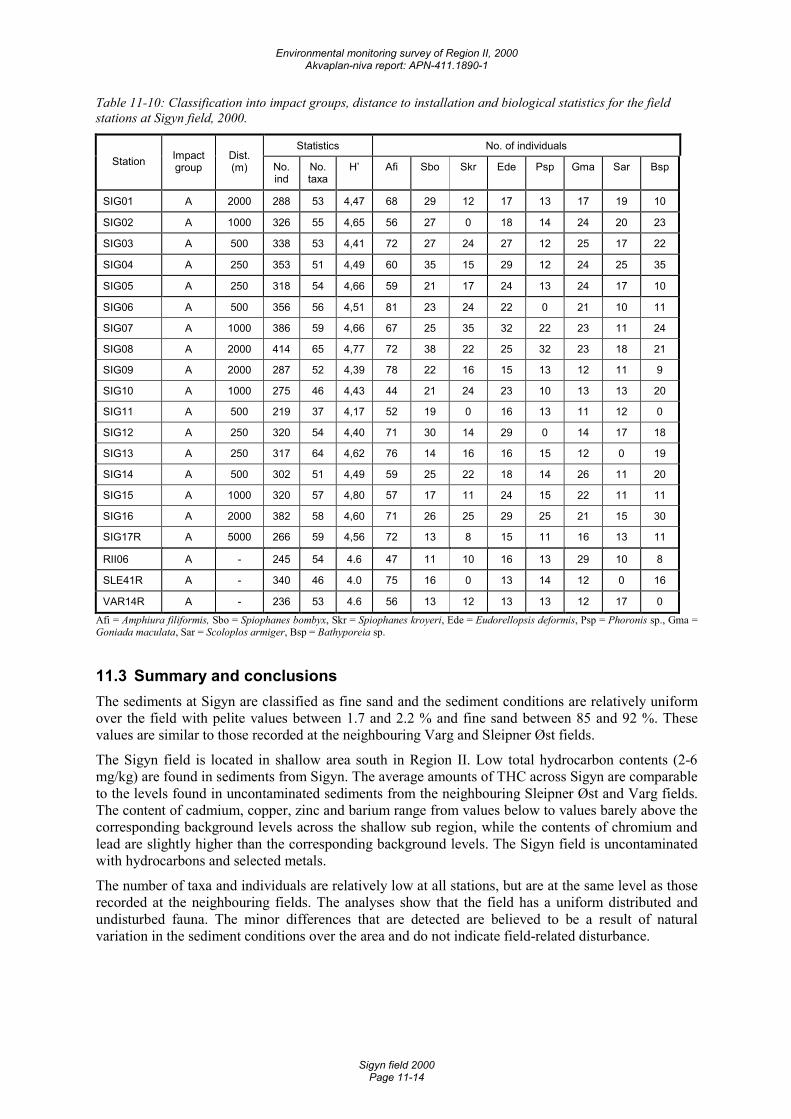
Environmental monitoring survey of Region II, 2000 Akvaplan-niva report: APN-411.1890-1
Sigyn field 2000 Page 11-14
Table 11-10: Classification into impact groups, distance to installation and biological statistics for the field stations at Sigyn field, 2000.
Statistics No. of individuals Station Impact
group Dist. (m) No.
ind No. taxa
H’ Afi Sbo Skr Ede Psp Gma Sar Bsp
SIG01 A 2000 288 53 4,47 68 29 12 17 13 17 19 10
SIG02 A 1000 326 55 4,65 56 27 0 18 14 24 20 23
SIG03 A 500 338 53 4,41 72 27 24 27 12 25 17 22
SIG04 A 250 353 51 4,49 60 35 15 29 12 24 25 35
SIG05 A 250 318 54 4,66 59 21 17 24 13 24 17 10
SIG06 A 500 356 56 4,51 81 23 24 22 0 21 10 11
SIG07 A 1000 386 59 4,66 67 25 35 32 22 23 11 24
SIG08 A 2000 414 65 4,77 72 38 22 25 32 23 18 21
SIG09 A 2000 287 52 4,39 78 22 16 15 13 12 11 9
SIG10 A 1000 275 46 4,43 44 21 24 23 10 13 13 20
SIG11 A 500 219 37 4,17 52 19 0 16 13 11 12 0
SIG12 A 250 320 54 4,40 71 30 14 29 0 14 17 18
SIG13 A 250 317 64 4,62 76 14 16 16 15 12 0 19
SIG14 A 500 302 51 4,49 59 25 22 18 14 26 11 20
SIG15 A 1000 320 57 4,80 57 17 11 24 15 22 11 11
SIG16 A 2000 382 58 4,60 71 26 25 29 25 21 15 30
SIG17R A 5000 266 59 4,56 72 13 8 15 11 16 13 11
RII06 A - 245 54 4.6 47 11 10 16 13 29 10 8
SLE41R A - 340 46 4.0 75 16 0 13 14 12 0 16
VAR14R A - 236 53 4.6 56 13 12 13 13 12 17 0 Afi = Amphiura filiformis, Sbo = Spiophanes bombyx, Skr = Spiophanes kroyeri, Ede = Eudorellopsis deformis, Psp = Phoronis sp., Gma = Goniada maculata, Sar = Scoloplos armiger, Bsp = Bathyporeia sp.
11.3 Summary and conclusions The sediments at Sigyn are classified as fine sand and the sediment conditions are relatively uniform over the field with pelite values between 1.7 and 2.2 % and fine sand between 85 and 92 %. These values are similar to those recorded at the neighbouring Varg and Sleipner Øst fields.
The Sigyn field is located in shallow area south in Region II. Low total hydrocarbon contents (2-6 mg/kg) are found in sediments from Sigyn. The average amounts of THC across Sigyn are comparable to the levels found in uncontaminated sediments from the neighbouring Sleipner Øst and Varg fields. The content of cadmium, copper, zinc and barium range from values below to values barely above the corresponding background levels across the shallow sub region, while the contents of chromium and lead are slightly higher than the corresponding background levels. The Sigyn field is uncontaminated with hydrocarbons and selected metals.
The number of taxa and individuals are relatively low at all stations, but are at the same level as those recorded at the neighbouring fields. The analyses show that the field has a uniform distributed and undisturbed fauna. The minor differences that are detected are believed to be a result of natural variation in the sediment conditions over the area and do not indicate field-related disturbance.
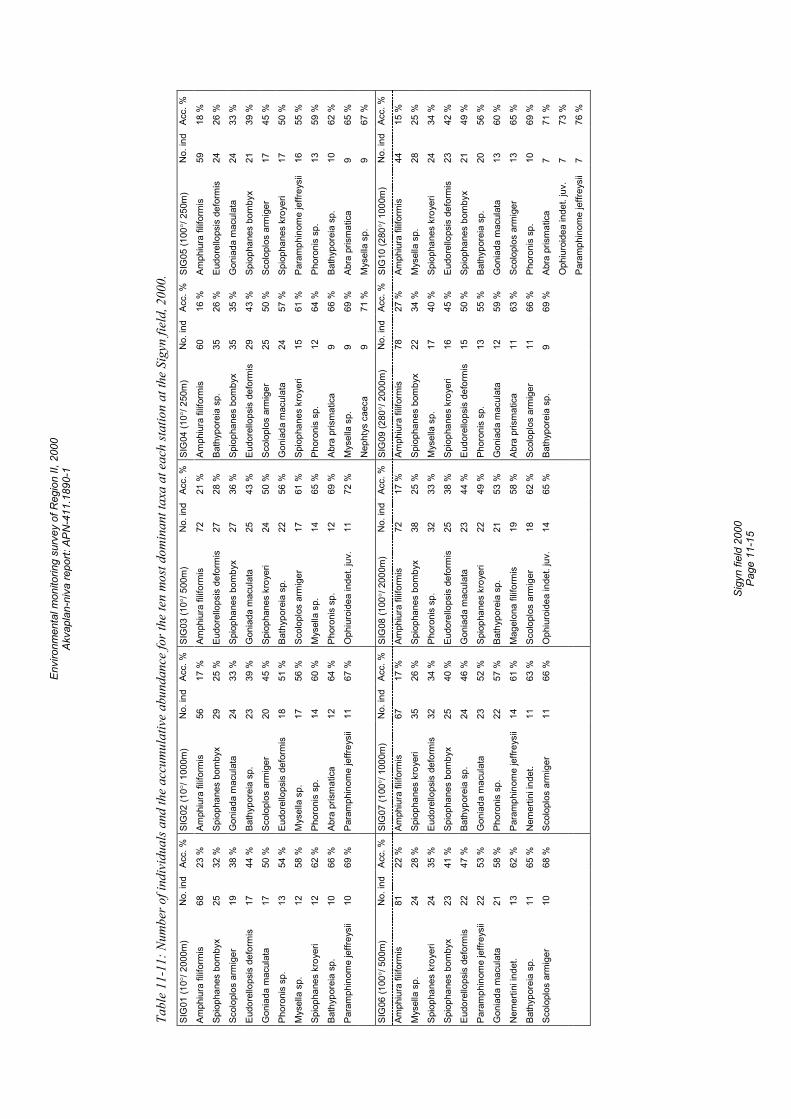
Envi
ronm
enta
l mon
itorin
g su
rvey
of R
egio
n II,
200
0 Ak
vapl
an-n
iva
repo
rt: A
PN-4
11.1
890-
1
Si
gyn
field
200
0 Pa
ge 1
1-15
Tabl
e 11
-11:
Num
ber o
f ind
ivid
uals
and
the
accu
mul
ativ
e ab
unda
nce
for t
he te
n m
ost d
omin
ant t
axa
at e
ach
statio
n at
the
Sigy
n fie
ld, 2
000.
SI
G01
(10°
/ 200
0m)
No.
ind
Acc.
%
SIG
02 (1
0°/ 1
000m
) N
o. in
d Ac
c. %
SI
G03
(10°
/ 500
m)
No.
ind
Acc.
%
SIG
04 (1
0°/ 2
50m
) N
o. in
d Ac
c. %
SI
G05
(100
°/ 25
0m)
No.
ind
Acc.
%
Amph
iura
filif
orm
is
68
23 %
Am
phiu
ra fi
lifor
mis
56
17
%
Amph
iura
filif
orm
is
72
21 %
Am
phiu
ra fi
lifor
mis
60
16
%
Amph
iura
filif
orm
is
59
18 %
Spio
phan
es b
omby
x 25
32
%
Spio
phan
es b
omby
x 29
25
%
Eudo
rello
psis
def
orm
is
27
28 %
Ba
thyp
orei
a sp
. 35
26
%
Eudo
rello
psis
def
orm
is
24
26 %
Scol
oplo
s ar
mig
er
19
38 %
G
onia
da m
acul
ata
24
33 %
Sp
ioph
anes
bom
byx
27
36 %
Sp
ioph
anes
bom
byx
35
35 %
G
onia
da m
acul
ata
24
33 %
Eudo
rello
psis
def
orm
is
17
44 %
Ba
thyp
orei
a sp
. 23
39
%
Gon
iada
mac
ulat
a 25
43
%
Eudo
rello
psis
def
orm
is
29
43 %
Sp
ioph
anes
bom
byx
21
39 %
Gon
iada
mac
ulat
a 17
50
%
Scol
oplo
s ar
mig
er
20
45 %
Sp
ioph
anes
kro
yeri
24
50 %
Sc
olop
los
arm
iger
25
50
%
Scol
oplo
s ar
mig
er
17
45 %
Phor
onis
sp.
13
54
%
Eudo
rello
psis
def
orm
is
18
51 %
Ba
thyp
orei
a sp
. 22
56
%
Gon
iada
mac
ulat
a 24
57
%
Spio
phan
es k
roye
ri 17
50
%
Mys
ella
sp.
12
58
%
Mys
ella
sp.
17
56
%
Scol
oplo
s ar
mig
er
17
61 %
Sp
ioph
anes
kro
yeri
15
61 %
Pa
ram
phin
ome
jeffr
eysi
i 16
55
%
Spio
phan
es k
roye
ri 12
62
%
Phor
onis
sp.
14
60
%
Mys
ella
sp.
14
65
%
Phor
onis
sp.
12
64
%
Phor
onis
sp.
13
59
%
Bath
ypor
eia
sp.
10
66 %
Ab
ra p
rism
atic
a 12
64
%
Phor
onis
sp.
12
69
%
Abra
pris
mat
ica
9 66
%
Bath
ypor
eia
sp.
10
62 %
Para
mph
inom
e je
ffrey
sii
10
69 %
Pa
ram
phin
ome
jeffr
eysi
i 11
67
%
Oph
iuro
idea
inde
t. ju
v.
11
72 %
M
ysel
la s
p.
9 69
%
Abra
pris
mat
ica
9 65
%
N
epht
ys c
aeca
9
71 %
M
ysel
la s
p.
9 67
%
SIG
06 (1
00°/
500m
) N
o. in
d Ac
c. %
SI
G07
(100
°/ 10
00m
) N
o. in
d Ac
c. %
SI
G08
(100
°/ 20
00m
) N
o. in
d Ac
c. %
SI
G09
(280
°/ 20
00m
) N
o. in
d Ac
c. %
SI
G10
(280
°/ 10
00m
) N
o. in
d Ac
c. %
Amph
iura
filif
orm
is
81
22 %
Am
phiu
ra fi
lifor
mis
67
17
%
Amph
iura
filif
orm
is
72
17 %
Am
phiu
ra fi
lifor
mis
78
27
%
Amph
iura
filif
orm
is
44
15 %
Mys
ella
sp.
24
28
%
Spio
phan
es k
roye
ri 35
26
%
Spio
phan
es b
omby
x 38
25
%
Spio
phan
es b
omby
x 22
34
%
Mys
ella
sp.
28
25
%
Spio
phan
es k
roye
ri 24
35
%
Eudo
rello
psis
def
orm
is
32
34 %
Ph
oron
is s
p.
32
33 %
M
ysel
la s
p.
17
40 %
Sp
ioph
anes
kro
yeri
24
34 %
Spio
phan
es b
omby
x 23
41
%
Spio
phan
es b
omby
x 25
40
%
Eudo
rello
psis
def
orm
is
25
38 %
Sp
ioph
anes
kro
yeri
16
45 %
Eu
dore
llops
is d
efor
mis
23
42
%
Eudo
rello
psis
def
orm
is
22
47 %
Ba
thyp
orei
a sp
. 24
46
%
Gon
iada
mac
ulat
a 23
44
%
Eudo
rello
psis
def
orm
is
15
50 %
Sp
ioph
anes
bom
byx
21
49 %
Para
mph
inom
e je
ffrey
sii
22
53 %
G
onia
da m
acul
ata
23
52 %
Sp
ioph
anes
kro
yeri
22
49 %
Ph
oron
is s
p.
13
55 %
Ba
thyp
orei
a sp
. 20
56
%
Gon
iada
mac
ulat
a 21
58
%
Phor
onis
sp.
22
57
%
Bath
ypor
eia
sp.
21
53 %
G
onia
da m
acul
ata
12
59 %
G
onia
da m
acul
ata
13
60 %
Nem
ertin
i ind
et.
13
62 %
Pa
ram
phin
ome
jeffr
eysi
i 14
61
%
Mag
elon
a fil
iform
is
19
58 %
Ab
ra p
rism
atic
a 11
63
%
Scol
oplo
s ar
mig
er
13
65 %
Bath
ypor
eia
sp.
11
65 %
N
emer
tini i
ndet
. 11
63
%
Scol
oplo
s ar
mig
er
18
62 %
Sc
olop
los
arm
iger
11
66
%
Phor
onis
sp.
10
69
%
Scol
oplo
s ar
mig
er
10
68 %
Sc
olop
los
arm
iger
11
66
%
Oph
iuro
idea
inde
t. ju
v.
14
65 %
Ba
thyp
orei
a sp
. 9
69 %
Ab
ra p
rism
atic
a 7
71 %
Oph
iuro
idea
inde
t. ju
v.
7 73
%
Para
mph
inom
e je
ffrey
sii
7 76
%
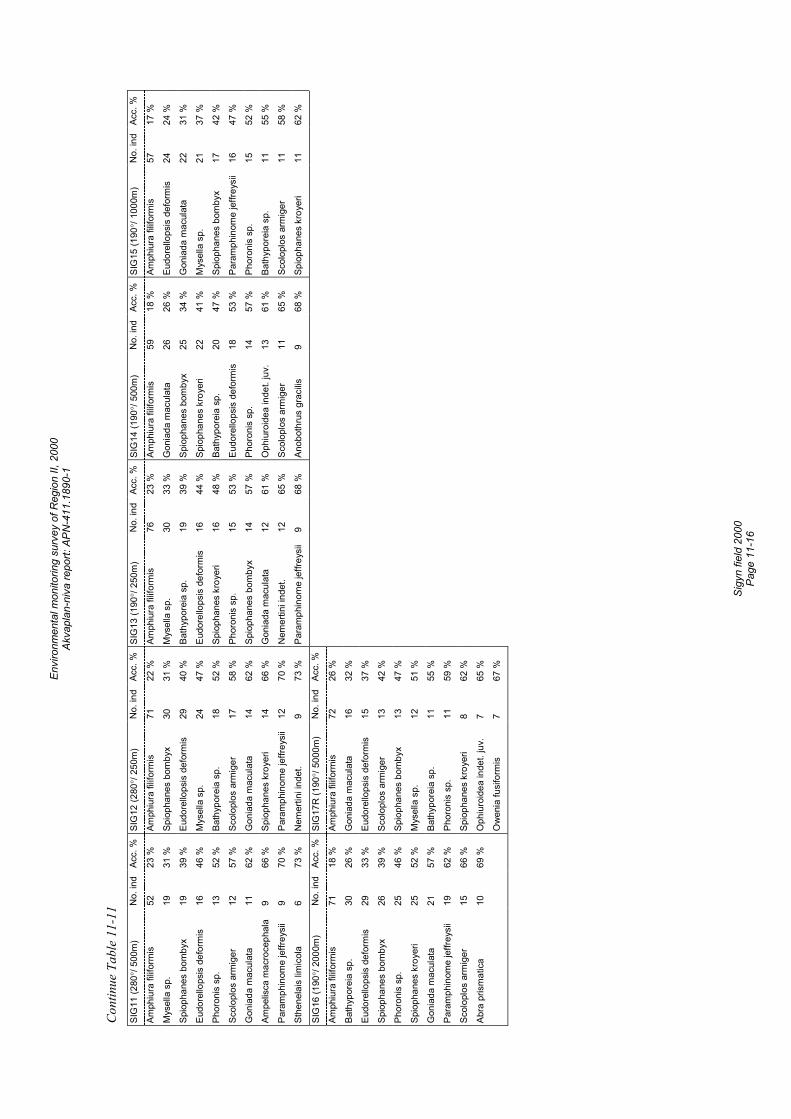
Envi
ronm
enta
l mon
itorin
g su
rvey
of R
egio
n II,
200
0 Ak
vapl
an-n
iva
repo
rt: A
PN-4
11.1
890-
1
Si
gyn
field
200
0 Pa
ge 1
1-16
Cont
inue
Tab
le 1
1-11
SI
G11
(280
°/ 50
0m)
No.
ind
Acc.
%
SIG
12 (2
80°/
250m
) N
o. in
d Ac
c. %
SI
G13
(190
°/ 25
0m)
No.
ind
Acc.
%
SIG
14 (1
90°/
500m
) N
o. in
d Ac
c. %
SI
G15
(190
°/ 10
00m
) N
o. in
d Ac
c. %
Amph
iura
filif
orm
is
52
23 %
Am
phiu
ra fi
lifor
mis
71
22
%
Amph
iura
filif
orm
is
76
23 %
Am
phiu
ra fi
lifor
mis
59
18
%
Amph
iura
filif
orm
is
57
17 %
Mys
ella
sp.
19
31
%
Spio
phan
es b
omby
x 30
31
%
Mys
ella
sp.
30
33
%
Gon
iada
mac
ulat
a 26
26
%
Eudo
rello
psis
def
orm
is
24
24 %
Spio
phan
es b
omby
x 19
39
%
Eudo
rello
psis
def
orm
is
29
40 %
Ba
thyp
orei
a sp
. 19
39
%
Spio
phan
es b
omby
x 25
34
%
Gon
iada
mac
ulat
a 22
31
%
Eudo
rello
psis
def
orm
is
16
46 %
M
ysel
la s
p.
24
47 %
Eu
dore
llops
is d
efor
mis
16
44
%
Spio
phan
es k
roye
ri 22
41
%
Mys
ella
sp.
21
37
%
Phor
onis
sp.
13
52
%
Bath
ypor
eia
sp.
18
52 %
Sp
ioph
anes
kro
yeri
16
48 %
Ba
thyp
orei
a sp
. 20
47
%
Spio
phan
es b
omby
x 17
42
%
Scol
oplo
s ar
mig
er
12
57 %
Sc
olop
los
arm
iger
17
58
%
Phor
onis
sp.
15
53
%
Eudo
rello
psis
def
orm
is
18
53 %
Pa
ram
phin
ome
jeffr
eysi
i 16
47
%
Gon
iada
mac
ulat
a 11
62
%
Gon
iada
mac
ulat
a 14
62
%
Spio
phan
es b
omby
x 14
57
%
Phor
onis
sp.
14
57
%
Phor
onis
sp.
15
52
%
Ampe
lisca
mac
roce
phal
a 9
66 %
Sp
ioph
anes
kro
yeri
14
66 %
G
onia
da m
acul
ata
12
61 %
O
phiu
roid
ea in
det.
juv.
13
61
%
Bath
ypor
eia
sp.
11
55 %
Para
mph
inom
e je
ffrey
sii
9 70
%
Para
mph
inom
e je
ffrey
sii
12
70 %
N
emer
tini i
ndet
. 12
65
%
Scol
oplo
s ar
mig
er
11
65 %
Sc
olop
los
arm
iger
11
58
%
Sthe
nela
is li
mic
ola
6 73
%
Nem
ertin
i ind
et.
9 73
%
Para
mph
inom
e je
ffrey
sii
9 68
%
Anob
othr
us g
raci
lis
9 68
%
Spio
phan
es k
roye
ri 11
62
%
SIG
16 (1
90°/
2000
m)
No.
ind
Acc.
%
SIG
17R
(190
°/ 50
00m
) N
o. in
d Ac
c. %
Amph
iura
filif
orm
is
71
18 %
Am
phiu
ra fi
lifor
mis
72
26
%
Bath
ypor
eia
sp.
30
26 %
G
onia
da m
acul
ata
16
32 %
Eudo
rello
psis
def
orm
is
29
33 %
Eu
dore
llops
is d
efor
mis
15
37
%
Spio
phan
es b
omby
x 26
39
%
Scol
oplo
s ar
mig
er
13
42 %
Phor
onis
sp.
25
46
%
Spio
phan
es b
omby
x 13
47
%
Spio
phan
es k
roye
ri 25
52
%
Mys
ella
sp.
12
51
%
Gon
iada
mac
ulat
a 21
57
%
Bath
ypor
eia
sp.
11
55 %
Para
mph
inom
e je
ffrey
sii
19
62 %
Ph
oron
is s
p.
11
59 %
Scol
oplo
s ar
mig
er
15
66 %
Sp
ioph
anes
kro
yeri
8 62
%
Abra
pris
mat
ica
10
69 %
O
phiu
roid
ea in
det.
juv.
7
65 %
O
wen
ia fu
sifo
rmis
7
67 %
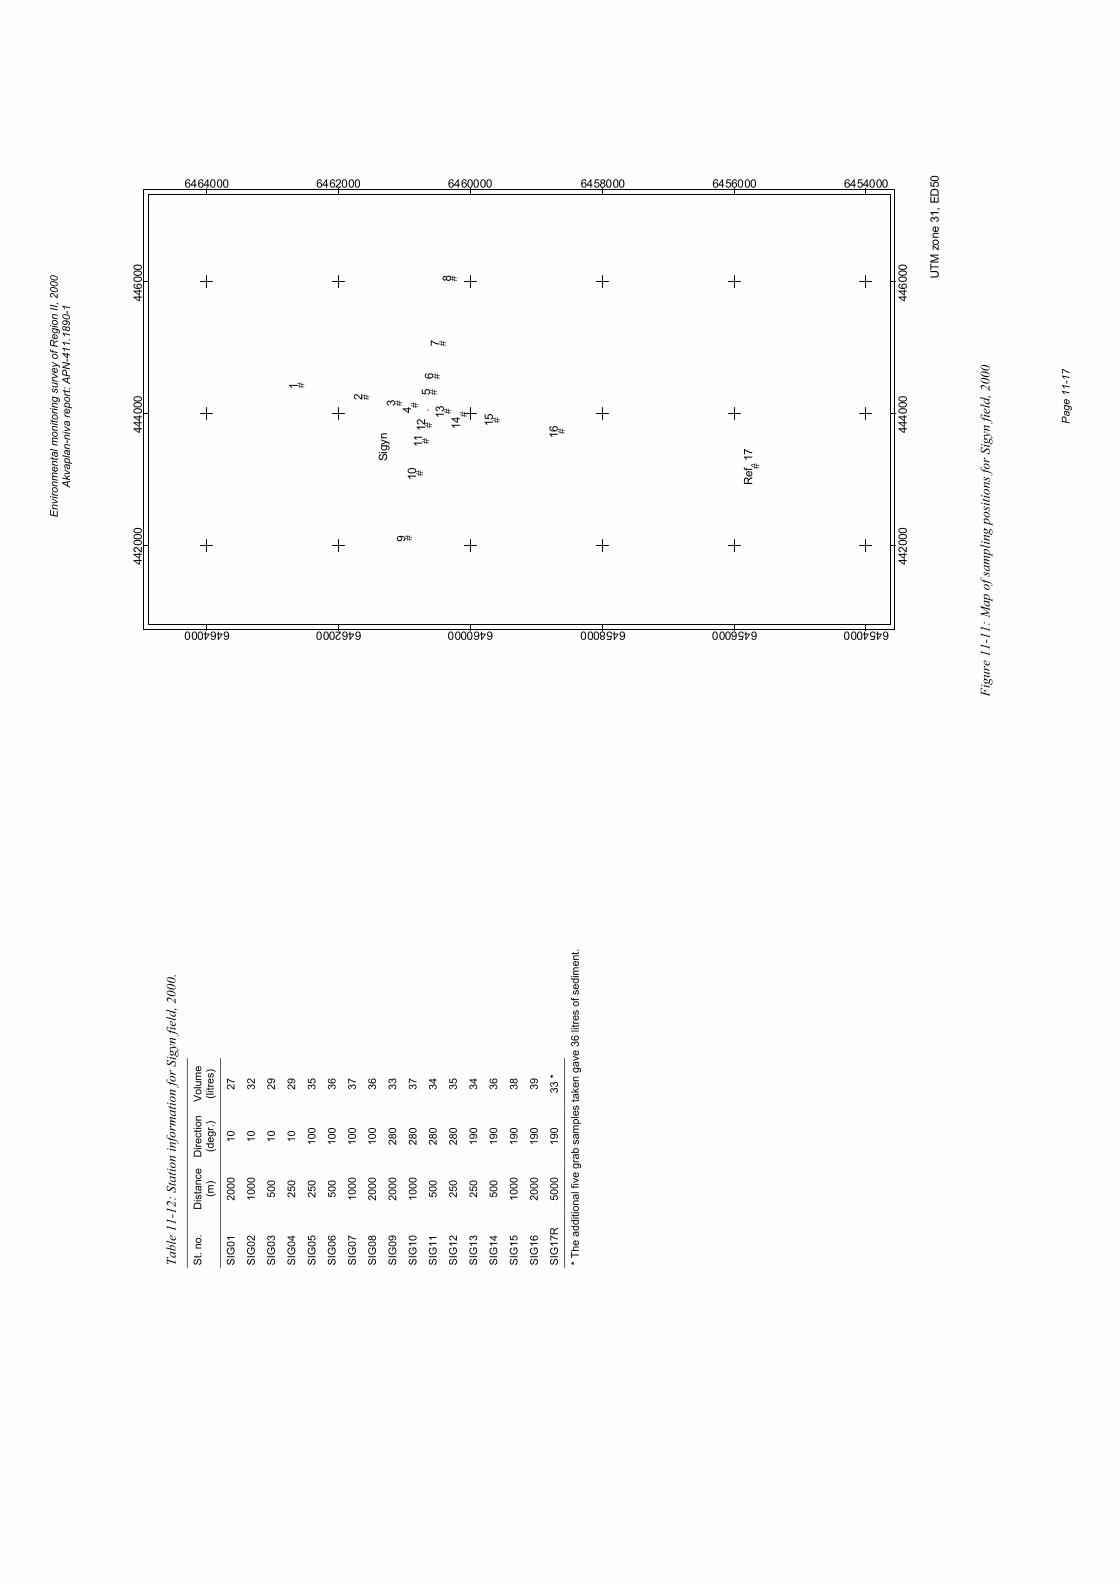
Envi
ronm
enta
l mon
itorin
g su
rvey
of R
egio
n II,
200
0 Ak
vapl
an-n
iva
repo
rt: A
PN-4
11.1
890-
1
Pa
ge 1
1-17
#
#
# #
##
##
##
##
# #
#
#
#
'
1
2 3 45
67
8
910
1112
1314 15
16
Ref
. 17Sigy
n
UTM
zon
e 31
, ED
50
4420
00
4420
00
4440
00
4440
00
4460
00
4460
00
6454000
6454000
6456000
6456000
6458000
6458000
6460000
6460000
6462000
6462000
6464000
6464000
Figu
re 1
1-11
: Map
of s
ampl
ing
posit
ions
for S
igyn
fiel
d, 2
000
Tabl
e 11
-12:
Sta
tion
info
rmat
ion
for S
igyn
fiel
d, 2
000.
St. n
o.
Dis
tanc
e (m
) D
irect
ion
(deg
r.)
Volu
me
(litre
s)
SIG
01
2000
10
27
SIG
02
1000
10
32
SIG
03
500
10
29
SIG
04
250
10
29
SIG
05
250
100
35
SIG
06
500
100
36
SIG
07
1000
10
0 37
SIG
08
2000
10
0 36
SIG
09
2000
28
0 33
SIG
10
1000
28
0 37
SIG
11
500
280
34
SIG
12
250
280
35
SIG
13
250
190
34
SIG
14
500
190
36
SIG
15
1000
19
0 38
SIG
16
2000
19
0 39
SIG
17R
50
00
190
33 *
* The
add
ition
al fi
ve g
rab
sam
ples
take
n ga
ve 3
6 lit
res
of s
edim
ent.

Envi
ronm
enta
l mon
itorin
g su
rvey
of R
egio
n II,
200
0 Ak
vapl
an-n
iva
repo
rt: A
PN-4
11.1
890-
1
Pa
ge 1
1-18
Environmental monitoring survey of Region II, 2000 Akvaplan-niva report: APN-411.1890-1
Balder field 2000 Page 12-1
12 Balder field 12.1 Introduction The Balder field is located in Block 25/11 of the Norwegian sector in the North Sea. Production drilling at the field started in May 1996, and was completed in December 1998. The production ship on the field, Balder FPU, is connected to four sub sea installations (A, B, C and D). During the previous surveys in 1996 and 1997, the same installations were named D, C, B and A, respectively. Data on recent drilling and discharges are given in Table 12-1.
At this field baseline and monitoring surveys have been carried out in 1996 (Jensen et al., 1997) and in 1997 (Mannvik et al., 1998). In 1997 the survey did show contamination of hydrocarbons plus olefins at the stations placed on the well templates C and A, while the 250-500 m stations on the same axis were contaminated with barium. Well template D had contamination of hydrocarbons out to 500 m and for barium extends out to 1000 m. From well template B the area contaminated with hydrocarbons and barium extended out to 500 m on the 198° axis and out to 1000 m on the 135° axis. In 1997 the fauna was found to be slightly disturbed at eight stations situated 250 – 500 m from the centres (stations 9, 16, 22, 33, 37, 42, 45 and 46).
Information on the sampling stations is shown in Figure 12-17 and Table 12-13, both on the foldout page at the end of this chapter (page 12-29).
Table 12-1: Summary of recent wells drilled and operational and accidental discharges at the Balder field, (all discharges in tonnes).
1997 1998 1999 2000 Comments
No of wells drilled 4 3 0 0
Barite 2059 1643 0 0
Cuttings 2682 2797 0 0
Base oil (with cuttings)** 70 0 0 0 ** AncoTecB (Poly-α-olefins C14/C16)
Water-based drilling mud 3786 3187 0 0
Cementing and other chemicals 16,13 1,55 0 0
Completion chemicals 1791,59 46,73 0 0
Oil in produced water 0 0 0 3,95* *=21 ppm × 188223 Sm3
12.2 Results and discussion
12.2.1 Physical characteristics The median phi value and the amount (%) of pelite, fine sand and total organic material (TOM) in the sediment from the present and previous surveys are shown in Table 12-2 and Figure 12-1. Detailed data on sediment characteristics such as colour, smell and a full set of analytical data, including TOM content and grain size distribution (with standard deviation, evenness and kurtosis) can be found in the Appendix.
The sediments in the area are classified as fine sand with median values varying from 3.69 at station BAL12 to 4.15 at station BAL24. The amount of pelite in the sediment varies from 6.86 % (BAL39) to 14.08 % (BAL05), the fine sand from 82.9 (BAL12) to 92.5 % (BAL39) while the TOM varies between 1.72 % (BAL37) to 2.67 % (BAL04). The pelite content is higher at the reference station BAL27R than at the field stations.
The TOM value has decreased remarkably from the previous survey at stations BAL03, BAL04, BAL33 and BAL42, situated in the vicinity of template D and A. On the other hand the TOM has increased at the reference station.
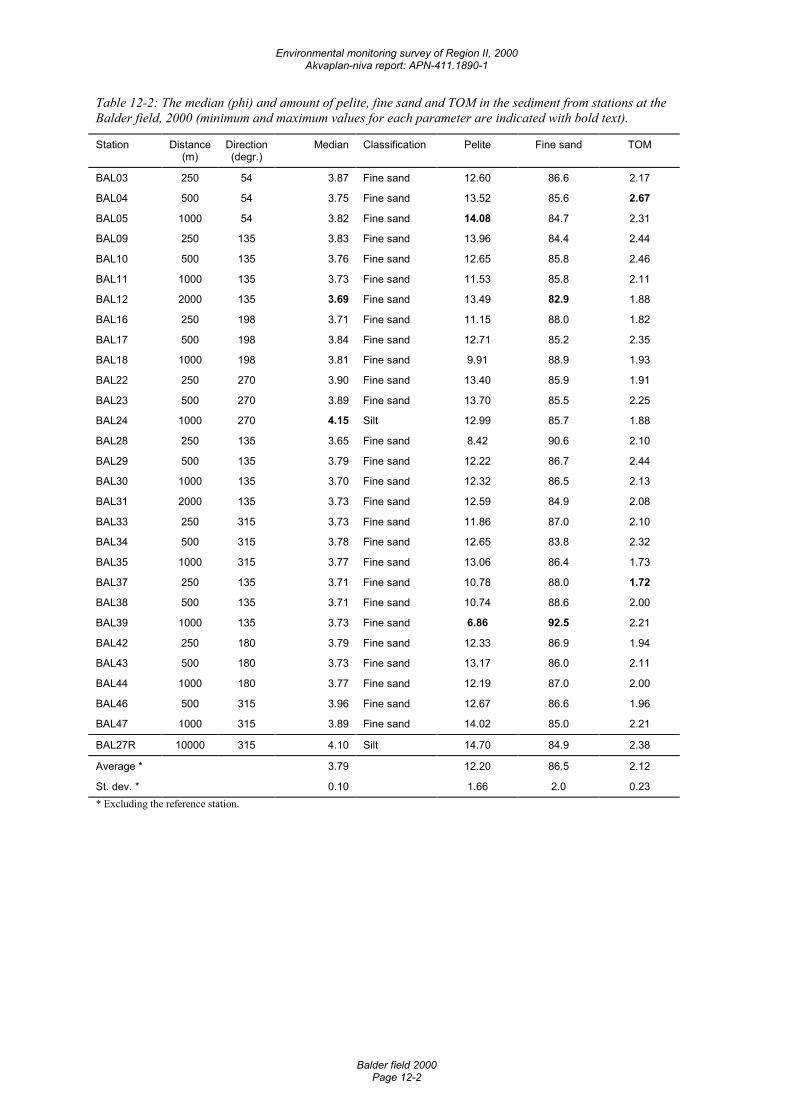
Environmental monitoring survey of Region II, 2000 Akvaplan-niva report: APN-411.1890-1
Balder field 2000 Page 12-2
Table 12-2: The median (phi) and amount of pelite, fine sand and TOM in the sediment from stations at the Balder field, 2000 (minimum and maximum values for each parameter are indicated with bold text).
Station Distance (m)
Direction (degr.)
Median Classification Pelite Fine sand TOM
BAL03 250 54 3.87 Fine sand 12.60 86.6 2.17
BAL04 500 54 3.75 Fine sand 13.52 85.6 2.67
BAL05 1000 54 3.82 Fine sand 14.08 84.7 2.31
BAL09 250 135 3.83 Fine sand 13.96 84.4 2.44
BAL10 500 135 3.76 Fine sand 12.65 85.8 2.46
BAL11 1000 135 3.73 Fine sand 11.53 85.8 2.11
BAL12 2000 135 3.69 Fine sand 13.49 82.9 1.88
BAL16 250 198 3.71 Fine sand 11.15 88.0 1.82
BAL17 500 198 3.84 Fine sand 12.71 85.2 2.35
BAL18 1000 198 3.81 Fine sand 9.91 88.9 1.93
BAL22 250 270 3.90 Fine sand 13.40 85.9 1.91
BAL23 500 270 3.89 Fine sand 13.70 85.5 2.25
BAL24 1000 270 4.15 Silt 12.99 85.7 1.88
BAL28 250 135 3.65 Fine sand 8.42 90.6 2.10
BAL29 500 135 3.79 Fine sand 12.22 86.7 2.44
BAL30 1000 135 3.70 Fine sand 12.32 86.5 2.13
BAL31 2000 135 3.73 Fine sand 12.59 84.9 2.08
BAL33 250 315 3.73 Fine sand 11.86 87.0 2.10
BAL34 500 315 3.78 Fine sand 12.65 83.8 2.32
BAL35 1000 315 3.77 Fine sand 13.06 86.4 1.73
BAL37 250 135 3.71 Fine sand 10.78 88.0 1.72
BAL38 500 135 3.71 Fine sand 10.74 88.6 2.00
BAL39 1000 135 3.73 Fine sand 6.86 92.5 2.21
BAL42 250 180 3.79 Fine sand 12.33 86.9 1.94
BAL43 500 180 3.73 Fine sand 13.17 86.0 2.11
BAL44 1000 180 3.77 Fine sand 12.19 87.0 2.00
BAL46 500 315 3.96 Fine sand 12.67 86.6 1.96
BAL47 1000 315 3.89 Fine sand 14.02 85.0 2.21
BAL27R 10000 315 4.10 Silt 14.70 84.9 2.38
Average * 3.79 12.20 86.5 2.12
St. dev. * 0.10 1.66 2.0 0.23 * Excluding the reference station.
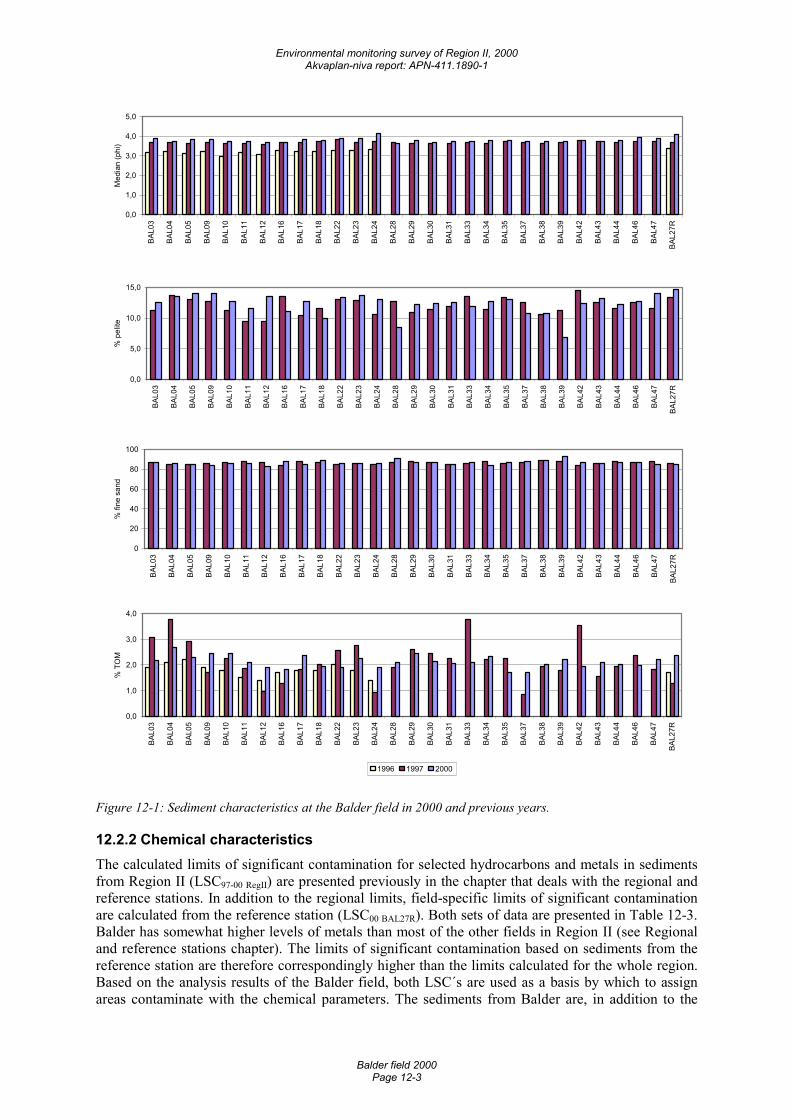
Environmental monitoring survey of Region II, 2000 Akvaplan-niva report: APN-411.1890-1
Balder field 2000 Page 12-3
0,0
1,0
2,0
3,0
4,0
5,0
BAL0
3
BAL0
4
BAL0
5
BAL0
9
BAL1
0
BAL1
1
BAL1
2
BAL1
6
BAL1
7
BAL1
8
BAL2
2
BAL2
3
BAL2
4
BAL2
8
BAL2
9
BAL3
0
BAL3
1
BAL3
3
BAL3
4
BAL3
5
BAL3
7
BAL3
8
BAL3
9
BAL4
2
BAL4
3
BAL4
4
BAL4
6
BAL4
7
BAL2
7R
Med
ian
(phi
)
0,0
5,0
10,0
15,0
BAL0
3
BAL0
4
BAL0
5
BAL0
9
BAL1
0
BAL1
1
BAL1
2
BAL1
6
BAL1
7
BAL1
8
BAL2
2
BAL2
3
BAL2
4
BAL2
8
BAL2
9
BAL3
0
BAL3
1
BAL3
3
BAL3
4
BAL3
5
BAL3
7
BAL3
8
BAL3
9
BAL4
2
BAL4
3
BAL4
4
BAL4
6
BAL4
7
BAL2
7R
% p
elite
0
20
40
60
80
100
BAL0
3
BAL0
4
BAL0
5
BAL0
9
BAL1
0
BAL1
1
BAL1
2
BAL1
6
BAL1
7
BAL1
8
BAL2
2
BAL2
3
BAL2
4
BAL2
8
BAL2
9
BAL3
0
BAL3
1
BAL3
3
BAL3
4
BAL3
5
BAL3
7
BAL3
8
BAL3
9
BAL4
2
BAL4
3
BAL4
4
BAL4
6
BAL4
7
BAL2
7R
% fi
ne s
and
0,0
1,0
2,0
3,0
4,0
BAL0
3
BAL0
4
BAL0
5
BAL0
9
BAL1
0
BAL1
1
BAL1
2
BAL1
6
BAL1
7
BAL1
8
BAL2
2
BAL2
3
BAL2
4
BAL2
8
BAL2
9
BAL3
0
BAL3
1
BAL3
3
BAL3
4
BAL3
5
BAL3
7
BAL3
8
BAL3
9
BAL4
2
BAL4
3
BAL4
4
BAL4
6
BAL4
7
BAL2
7R
% T
OM
1996 1997 2000
Figure 12-1: Sediment characteristics at the Balder field in 2000 and previous years.
12.2.2 Chemical characteristics The calculated limits of significant contamination for selected hydrocarbons and metals in sediments from Region II (LSC97-00 RegII) are presented previously in the chapter that deals with the regional and reference stations. In addition to the regional limits, field-specific limits of significant contamination are calculated from the reference station (LSC00 BAL27R). Both sets of data are presented in Table 12-3. Balder has somewhat higher levels of metals than most of the other fields in Region II (see Regional and reference stations chapter). The limits of significant contamination based on sediments from the reference station are therefore correspondingly higher than the limits calculated for the whole region. Based on the analysis results of the Balder field, both LSC´s are used as a basis by which to assign areas contaminate with the chemical parameters. The sediments from Balder are, in addition to the
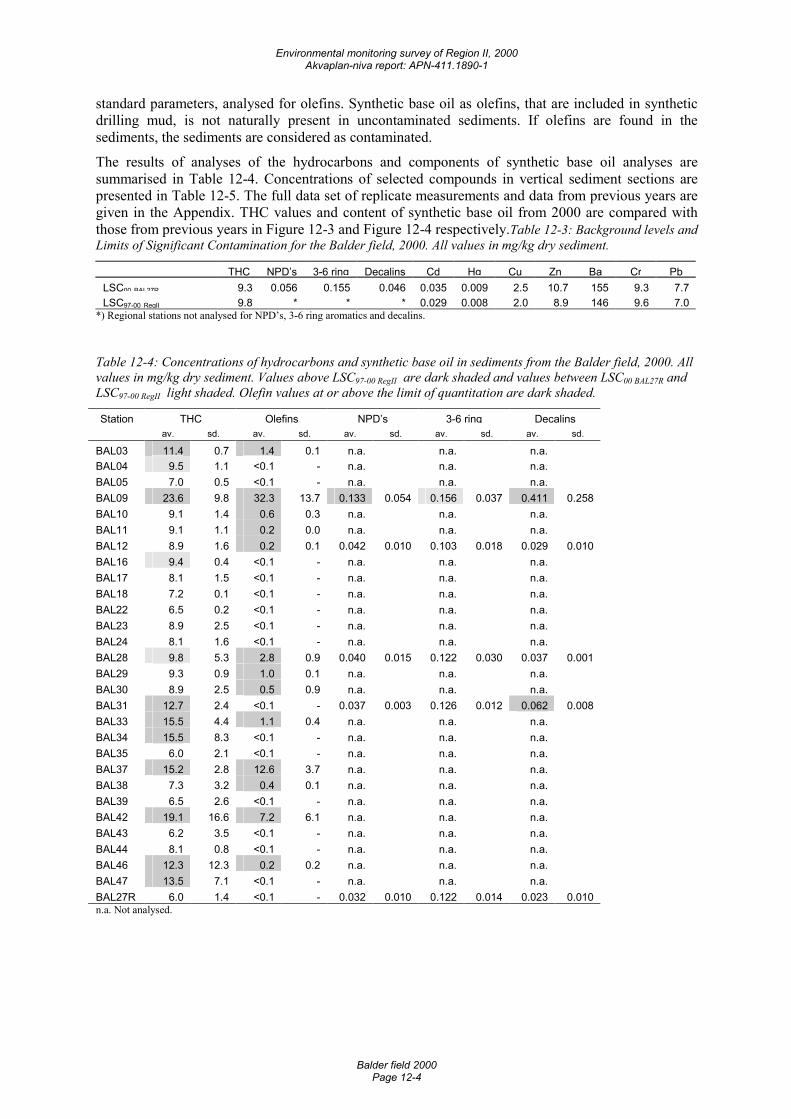
Environmental monitoring survey of Region II, 2000 Akvaplan-niva report: APN-411.1890-1
Balder field 2000 Page 12-4
standard parameters, analysed for olefins. Synthetic base oil as olefins, that are included in synthetic drilling mud, is not naturally present in uncontaminated sediments. If olefins are found in the sediments, the sediments are considered as contaminated.
The results of analyses of the hydrocarbons and components of synthetic base oil analyses are summarised in Table 12-4. Concentrations of selected compounds in vertical sediment sections are presented in Table 12-5. The full data set of replicate measurements and data from previous years are given in the Appendix. THC values and content of synthetic base oil from 2000 are compared with those from previous years in Figure 12-3 and Figure 12-4 respectively.Table 12-3: Background levels and Limits of Significant Contamination for the Balder field, 2000. All values in mg/kg dry sediment.
THC NPD’s 3-6 ring Decalins Cd Hg Cu Zn Ba Cr PbLSC00 BAL27R 9.3 0.056 0.155 0.046 0.035 0.009 2.5 10.7 155 9.3 7.7LSC97-00 RegII 9.8 * * * 0.029 0.008 2.0 8.9 146 9.6 7.0
*) Regional stations not analysed for NPD’s, 3-6 ring aromatics and decalins.
Table 12-4: Concentrations of hydrocarbons and synthetic base oil in sediments from the Balder field, 2000. All values in mg/kg dry sediment. Values above LSC97-00 RegII are dark shaded and values between LSC00 BAL27R and LSC97-00 RegII light shaded. Olefin values at or above the limit of quantitation are dark shaded.
Station THC Olefins NPD’s 3-6 ring Decalins av. sd. av. sd. av. sd. av. sd. av. sd.
BAL03 11.4 0.7 1.4 0.1 n.a. n.a. n.a. BAL04 9.5 1.1 <0.1 - n.a. n.a. n.a. BAL05 7.0 0.5 <0.1 - n.a. n.a. n.a. BAL09 23.6 9.8 32.3 13.7 0.133 0.054 0.156 0.037 0.411 0.258 BAL10 9.1 1.4 0.6 0.3 n.a. n.a. n.a. BAL11 9.1 1.1 0.2 0.0 n.a. n.a. n.a. BAL12 8.9 1.6 0.2 0.1 0.042 0.010 0.103 0.018 0.029 0.010 BAL16 9.4 0.4 <0.1 - n.a. n.a. n.a. BAL17 8.1 1.5 <0.1 - n.a. n.a. n.a. BAL18 7.2 0.1 <0.1 - n.a. n.a. n.a. BAL22 6.5 0.2 <0.1 - n.a. n.a. n.a. BAL23 8.9 2.5 <0.1 - n.a. n.a. n.a. BAL24 8.1 1.6 <0.1 - n.a. n.a. n.a. BAL28 9.8 5.3 2.8 0.9 0.040 0.015 0.122 0.030 0.037 0.001 BAL29 9.3 0.9 1.0 0.1 n.a. n.a. n.a. BAL30 8.9 2.5 0.5 0.9 n.a. n.a. n.a. BAL31 12.7 2.4 <0.1 - 0.037 0.003 0.126 0.012 0.062 0.008 BAL33 15.5 4.4 1.1 0.4 n.a. n.a. n.a. BAL34 15.5 8.3 <0.1 - n.a. n.a. n.a. BAL35 6.0 2.1 <0.1 - n.a. n.a. n.a. BAL37 15.2 2.8 12.6 3.7 n.a. n.a. n.a. BAL38 7.3 3.2 0.4 0.1 n.a. n.a. n.a. BAL39 6.5 2.6 <0.1 - n.a. n.a. n.a. BAL42 19.1 16.6 7.2 6.1 n.a. n.a. n.a. BAL43 6.2 3.5 <0.1 - n.a. n.a. n.a. BAL44 8.1 0.8 <0.1 - n.a. n.a. n.a. BAL46 12.3 12.3 0.2 0.2 n.a. n.a. n.a. BAL47 13.5 7.1 <0.1 - n.a. n.a. n.a. BAL27R 6.0 1.4 <0.1 - 0.032 0.010 0.122 0.014 0.023 0.010 n.a. Not analysed.
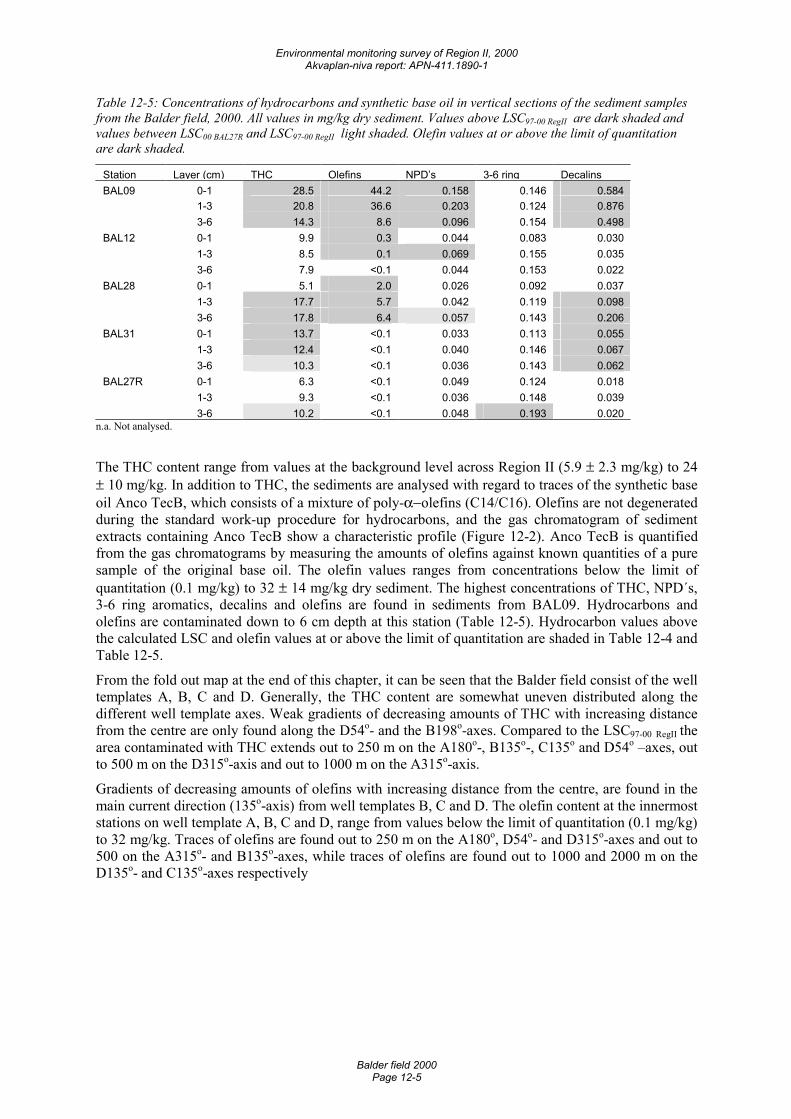
Environmental monitoring survey of Region II, 2000 Akvaplan-niva report: APN-411.1890-1
Balder field 2000 Page 12-5
Table 12-5: Concentrations of hydrocarbons and synthetic base oil in vertical sections of the sediment samples from the Balder field, 2000. All values in mg/kg dry sediment. Values above LSC97-00 RegII are dark shaded and values between LSC00 BAL27R and LSC97-00 RegII light shaded. Olefin values at or above the limit of quantitation are dark shaded.
Station Layer (cm) THC Olefins NPD’s 3-6 ring Decalins BAL09 0-1 28.5 44.2 0.158 0.146 0.584 1-3 20.8 36.6 0.203 0.124 0.876 3-6 14.3 8.6 0.096 0.154 0.498 BAL12 0-1 9.9 0.3 0.044 0.083 0.030 1-3 8.5 0.1 0.069 0.155 0.035 3-6 7.9 <0.1 0.044 0.153 0.022 BAL28 0-1 5.1 2.0 0.026 0.092 0.037 1-3 17.7 5.7 0.042 0.119 0.098 3-6 17.8 6.4 0.057 0.143 0.206 BAL31 0-1 13.7 <0.1 0.033 0.113 0.055 1-3 12.4 <0.1 0.040 0.146 0.067 3-6 10.3 <0.1 0.036 0.143 0.062 BAL27R 0-1 6.3 <0.1 0.049 0.124 0.018 1-3 9.3 <0.1 0.036 0.148 0.039 3-6 10.2 <0.1 0.048 0.193 0.020
n.a. Not analysed.
The THC content range from values at the background level across Region II (5.9 ± 2.3 mg/kg) to 24 ± 10 mg/kg. In addition to THC, the sediments are analysed with regard to traces of the synthetic base oil Anco TecB, which consists of a mixture of poly-α−olefins (C14/C16). Olefins are not degenerated during the standard work-up procedure for hydrocarbons, and the gas chromatogram of sediment extracts containing Anco TecB show a characteristic profile (Figure 12-2). Anco TecB is quantified from the gas chromatograms by measuring the amounts of olefins against known quantities of a pure sample of the original base oil. The olefin values ranges from concentrations below the limit of quantitation (0.1 mg/kg) to 32 ± 14 mg/kg dry sediment. The highest concentrations of THC, NPD´s, 3-6 ring aromatics, decalins and olefins are found in sediments from BAL09. Hydrocarbons and olefins are contaminated down to 6 cm depth at this station (Table 12-5). Hydrocarbon values above the calculated LSC and olefin values at or above the limit of quantitation are shaded in Table 12-4 and Table 12-5.
From the fold out map at the end of this chapter, it can be seen that the Balder field consist of the well templates A, B, C and D. Generally, the THC content are somewhat uneven distributed along the different well template axes. Weak gradients of decreasing amounts of THC with increasing distance from the centre are only found along the D54o- and the B198o-axes. Compared to the LSC97-00 RegII the area contaminated with THC extends out to 250 m on the A180o-, B135o-, C135o and D54o –axes, out to 500 m on the D315o-axis and out to 1000 m on the A315o-axis.
Gradients of decreasing amounts of olefins with increasing distance from the centre, are found in the main current direction (135o-axis) from well templates B, C and D. The olefin content at the innermost stations on well template A, B, C and D, range from values below the limit of quantitation (0.1 mg/kg) to 32 mg/kg. Traces of olefins are found out to 250 m on the A180o, D54o- and D315o-axes and out to 500 on the A315o- and B135o-axes, while traces of olefins are found out to 1000 and 2000 m on the D135o- and C135o-axes respectively
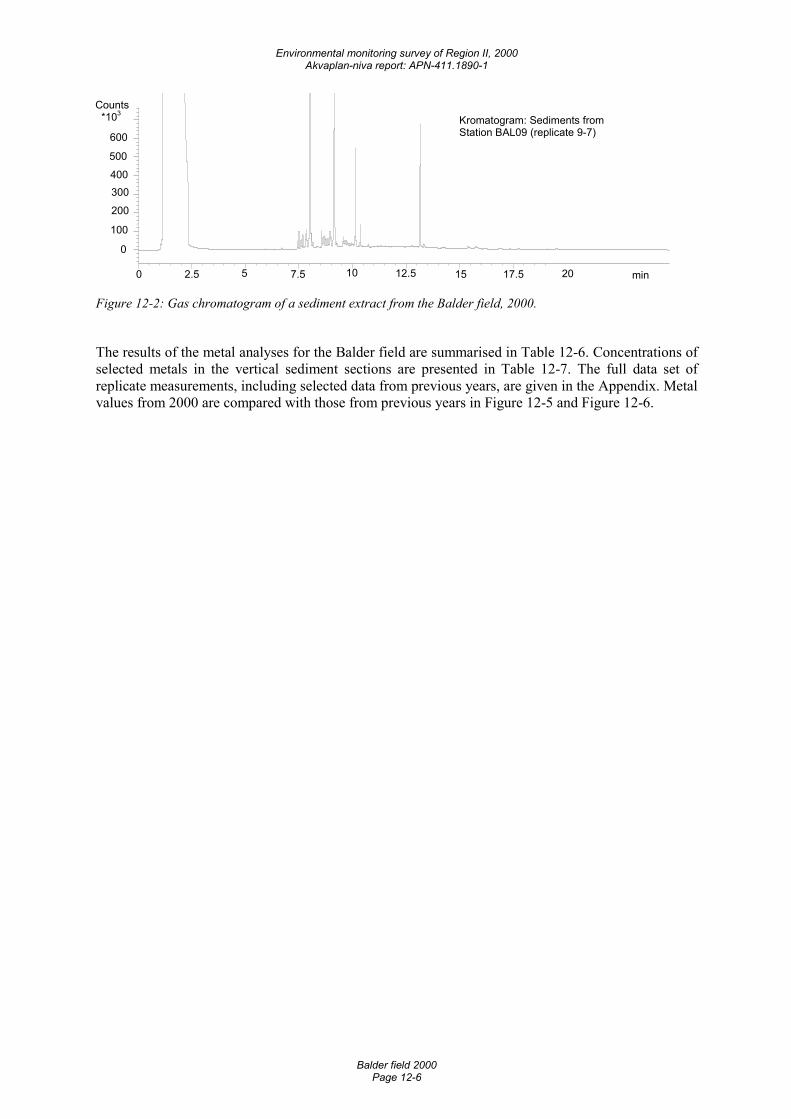
Environmental monitoring survey of Region II, 2000 Akvaplan-niva report: APN-411.1890-1
Balder field 2000 Page 12-6
min0 2.5 5 7.5 10 12.5 15 17.5 20
Counts *103
0
100
200
300 400
500
600Kromatogram: Sediments fromStation BAL09 (replicate 9-7)
Figure 12-2: Gas chromatogram of a sediment extract from the Balder field, 2000.
The results of the metal analyses for the Balder field are summarised in Table 12-6. Concentrations of selected metals in the vertical sediment sections are presented in Table 12-7. The full data set of replicate measurements, including selected data from previous years, are given in the Appendix. Metal values from 2000 are compared with those from previous years in Figure 12-5 and Figure 12-6.
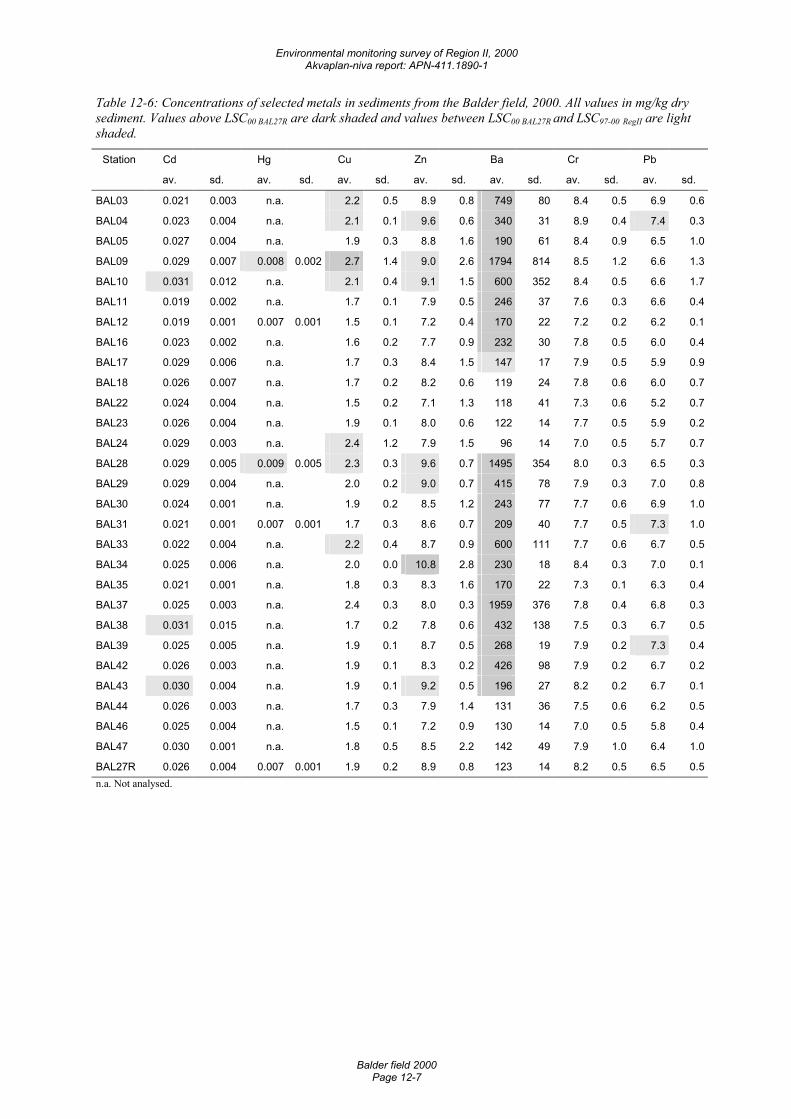
Environmental monitoring survey of Region II, 2000 Akvaplan-niva report: APN-411.1890-1
Balder field 2000 Page 12-7
Table 12-6: Concentrations of selected metals in sediments from the Balder field, 2000. All values in mg/kg dry sediment. Values above LSC00 BAL27R are dark shaded and values between LSC00 BAL27R and LSC97-00 RegII are light shaded.
Station Cd Hg Cu Zn Ba Cr Pb
av. sd. av. sd. av. sd. av. sd. av. sd. av. sd. av. sd.
BAL03 0.021 0.003 n.a. 2.2 0.5 8.9 0.8 749 80 8.4 0.5 6.9 0.6
BAL04 0.023 0.004 n.a. 2.1 0.1 9.6 0.6 340 31 8.9 0.4 7.4 0.3
BAL05 0.027 0.004 n.a. 1.9 0.3 8.8 1.6 190 61 8.4 0.9 6.5 1.0
BAL09 0.029 0.007 0.008 0.002 2.7 1.4 9.0 2.6 1794 814 8.5 1.2 6.6 1.3
BAL10 0.031 0.012 n.a. 2.1 0.4 9.1 1.5 600 352 8.4 0.5 6.6 1.7
BAL11 0.019 0.002 n.a. 1.7 0.1 7.9 0.5 246 37 7.6 0.3 6.6 0.4
BAL12 0.019 0.001 0.007 0.001 1.5 0.1 7.2 0.4 170 22 7.2 0.2 6.2 0.1
BAL16 0.023 0.002 n.a. 1.6 0.2 7.7 0.9 232 30 7.8 0.5 6.0 0.4
BAL17 0.029 0.006 n.a. 1.7 0.3 8.4 1.5 147 17 7.9 0.5 5.9 0.9
BAL18 0.026 0.007 n.a. 1.7 0.2 8.2 0.6 119 24 7.8 0.6 6.0 0.7
BAL22 0.024 0.004 n.a. 1.5 0.2 7.1 1.3 118 41 7.3 0.6 5.2 0.7
BAL23 0.026 0.004 n.a. 1.9 0.1 8.0 0.6 122 14 7.7 0.5 5.9 0.2
BAL24 0.029 0.003 n.a. 2.4 1.2 7.9 1.5 96 14 7.0 0.5 5.7 0.7
BAL28 0.029 0.005 0.009 0.005 2.3 0.3 9.6 0.7 1495 354 8.0 0.3 6.5 0.3
BAL29 0.029 0.004 n.a. 2.0 0.2 9.0 0.7 415 78 7.9 0.3 7.0 0.8
BAL30 0.024 0.001 n.a. 1.9 0.2 8.5 1.2 243 77 7.7 0.6 6.9 1.0
BAL31 0.021 0.001 0.007 0.001 1.7 0.3 8.6 0.7 209 40 7.7 0.5 7.3 1.0
BAL33 0.022 0.004 n.a. 2.2 0.4 8.7 0.9 600 111 7.7 0.6 6.7 0.5
BAL34 0.025 0.006 n.a. 2.0 0.0 10.8 2.8 230 18 8.4 0.3 7.0 0.1
BAL35 0.021 0.001 n.a. 1.8 0.3 8.3 1.6 170 22 7.3 0.1 6.3 0.4
BAL37 0.025 0.003 n.a. 2.4 0.3 8.0 0.3 1959 376 7.8 0.4 6.8 0.3
BAL38 0.031 0.015 n.a. 1.7 0.2 7.8 0.6 432 138 7.5 0.3 6.7 0.5
BAL39 0.025 0.005 n.a. 1.9 0.1 8.7 0.5 268 19 7.9 0.2 7.3 0.4
BAL42 0.026 0.003 n.a. 1.9 0.1 8.3 0.2 426 98 7.9 0.2 6.7 0.2
BAL43 0.030 0.004 n.a. 1.9 0.1 9.2 0.5 196 27 8.2 0.2 6.7 0.1
BAL44 0.026 0.003 n.a. 1.7 0.3 7.9 1.4 131 36 7.5 0.6 6.2 0.5
BAL46 0.025 0.004 n.a. 1.5 0.1 7.2 0.9 130 14 7.0 0.5 5.8 0.4
BAL47 0.030 0.001 n.a. 1.8 0.5 8.5 2.2 142 49 7.9 1.0 6.4 1.0
BAL27R 0.026 0.004 0.007 0.001 1.9 0.2 8.9 0.8 123 14 8.2 0.5 6.5 0.5n.a. Not analysed.
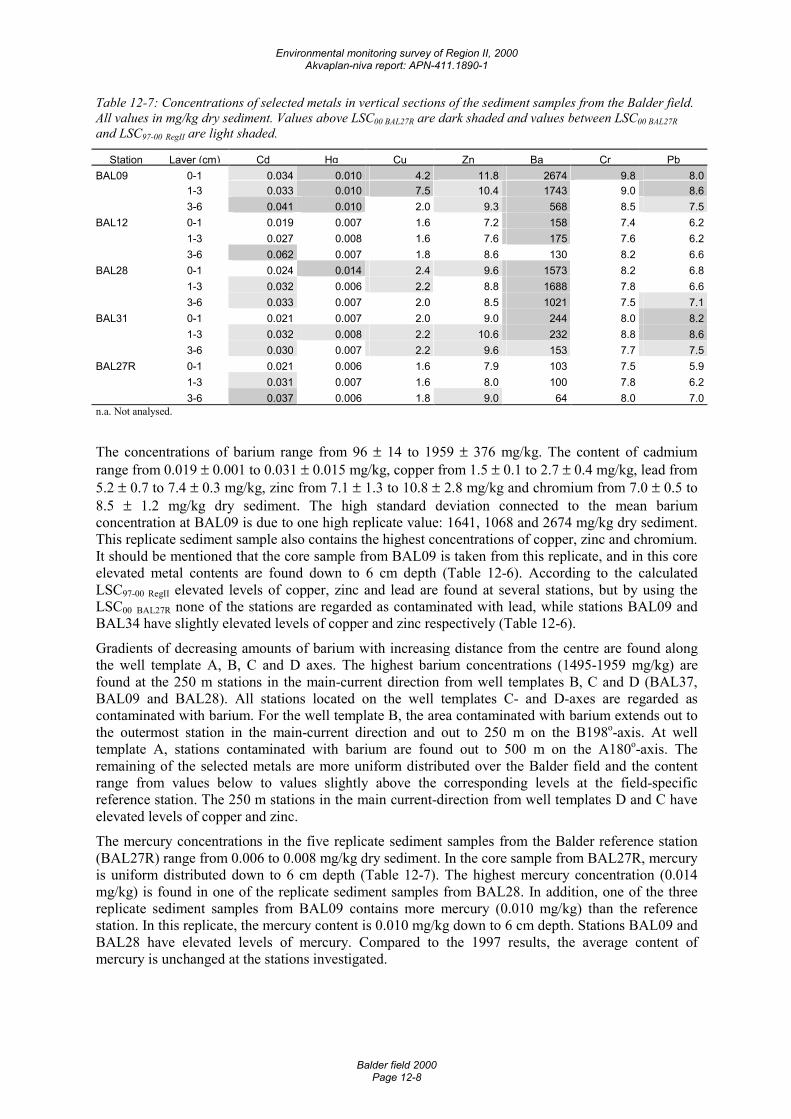
Environmental monitoring survey of Region II, 2000 Akvaplan-niva report: APN-411.1890-1
Balder field 2000 Page 12-8
Table 12-7: Concentrations of selected metals in vertical sections of the sediment samples from the Balder field. All values in mg/kg dry sediment. Values above LSC00 BAL27R are dark shaded and values between LSC00 BAL27R and LSC97-00 RegII are light shaded.
Station Layer (cm) Cd Hg Cu Zn Ba Cr PbBAL09 0-1 0.034 0.010 4.2 11.8 2674 9.8 8.0 1-3 0.033 0.010 7.5 10.4 1743 9.0 8.6 3-6 0.041 0.010 2.0 9.3 568 8.5 7.5BAL12 0-1 0.019 0.007 1.6 7.2 158 7.4 6.2 1-3 0.027 0.008 1.6 7.6 175 7.6 6.2 3-6 0.062 0.007 1.8 8.6 130 8.2 6.6BAL28 0-1 0.024 0.014 2.4 9.6 1573 8.2 6.8 1-3 0.032 0.006 2.2 8.8 1688 7.8 6.6 3-6 0.033 0.007 2.0 8.5 1021 7.5 7.1BAL31 0-1 0.021 0.007 2.0 9.0 244 8.0 8.2 1-3 0.032 0.008 2.2 10.6 232 8.8 8.6 3-6 0.030 0.007 2.2 9.6 153 7.7 7.5BAL27R 0-1 0.021 0.006 1.6 7.9 103 7.5 5.9 1-3 0.031 0.007 1.6 8.0 100 7.8 6.2 3-6 0.037 0.006 1.8 9.0 64 8.0 7.0n.a. Not analysed.
The concentrations of barium range from 96 ± 14 to 1959 ± 376 mg/kg. The content of cadmium range from 0.019 ± 0.001 to 0.031 ± 0.015 mg/kg, copper from 1.5 ± 0.1 to 2.7 ± 0.4 mg/kg, lead from 5.2 ± 0.7 to 7.4 ± 0.3 mg/kg, zinc from 7.1 ± 1.3 to 10.8 ± 2.8 mg/kg and chromium from 7.0 ± 0.5 to 8.5 ± 1.2 mg/kg dry sediment. The high standard deviation connected to the mean barium concentration at BAL09 is due to one high replicate value: 1641, 1068 and 2674 mg/kg dry sediment. This replicate sediment sample also contains the highest concentrations of copper, zinc and chromium. It should be mentioned that the core sample from BAL09 is taken from this replicate, and in this core elevated metal contents are found down to 6 cm depth (Table 12-6). According to the calculated LSC97-00 RegII elevated levels of copper, zinc and lead are found at several stations, but by using the LSC00 BAL27R none of the stations are regarded as contaminated with lead, while stations BAL09 and BAL34 have slightly elevated levels of copper and zinc respectively (Table 12-6).
Gradients of decreasing amounts of barium with increasing distance from the centre are found along the well template A, B, C and D axes. The highest barium concentrations (1495-1959 mg/kg) are found at the 250 m stations in the main-current direction from well templates B, C and D (BAL37, BAL09 and BAL28). All stations located on the well templates C- and D-axes are regarded as contaminated with barium. For the well template B, the area contaminated with barium extends out to the outermost station in the main-current direction and out to 250 m on the B198o-axis. At well template A, stations contaminated with barium are found out to 500 m on the A180o-axis. The remaining of the selected metals are more uniform distributed over the Balder field and the content range from values below to values slightly above the corresponding levels at the field-specific reference station. The 250 m stations in the main current-direction from well templates D and C have elevated levels of copper and zinc.
The mercury concentrations in the five replicate sediment samples from the Balder reference station (BAL27R) range from 0.006 to 0.008 mg/kg dry sediment. In the core sample from BAL27R, mercury is uniform distributed down to 6 cm depth (Table 12-7). The highest mercury concentration (0.014 mg/kg) is found in one of the replicate sediment samples from BAL28. In addition, one of the three replicate sediment samples from BAL09 contains more mercury (0.010 mg/kg) than the reference station. In this replicate, the mercury content is 0.010 mg/kg down to 6 cm depth. Stations BAL09 and BAL28 have elevated levels of mercury. Compared to the 1997 results, the average content of mercury is unchanged at the stations investigated.
Environmental monitoring survey of Region II, 2000 Akvaplan-niva report: APN-411.1890-1
Balder field 2000 Page 12-9
Comparison with previous survey(s)
In the present survey, the THC content at the Balder reference station (BAL27R) is 6.0 ± 1.4 mg/kg dry sediment. This value is comparable to the amount (6.9 ± 1.6 mg/kg) found in the 1996 baseline survey (Jensen et al., 1997.) In the present survey, analysis of a sediment core from BAL27R show increasing amounts of THC with depth (Table 12-5) and the amount found in the 3-6 cm layer is comparable to the content (12 mg/kg) found in the two top layers in 1997 (Mannvik et al., 1998). The amounts of NPD’s and 3-6 ring aromatics are almost unchanged since 1997 (1997 values: 0.039 ± 0.002, 0.127 ± 0.001 mg/kg respectively) while the amount of decalins has decreased from 0.125 ± 0.058 mg/kg to 0.023 ± 0.010 mg/kg. The sediments from the reference station contain almost the same level of cadmium, copper, barium and zinc as in the previous survey, while the content of lead has increased from 5.1 ± 0.3 to 6.5 ± 0.5 mg/kg dry sediment. Vertical sediment sections were not analysed for metals in 1997.
THC concentrations for 1997 are previously reported as the sum of mineral oil and olefins (Mannvik et al., 1998.) The THC values for 1997 presented in the histogram in Figure 12-3 are the recalculated THC values found by substraction of olefin-concentrations (adjusted for response factor) from the THC values reported in 1997. It should be mentioned that it is difficult to distinguish between olefins and THC at stations with high amounts of olefins. By comparing the recalculated 1997 THC values with the 1997 LSC for Region II (7.6 mg/kg), the area contaminated with THC in 1997 extended out to 500 m on the A315o-, B198o-, C135o- and D54o-axes and out to 1000 m on the A180o- and B135o-axes.
By comparing this year’s THC values with the recalculated 1997 THC results, the THC content at the well templates A, B and C axes are almost unchanged or reduced. The largest reductions are seen at the 250 and 500 m stations on the A180o- and B135o-axis axes (BAL42, BAL43, BAL37 and BAL38) and at the 250 m station on the C135o-axis (BAL09) where the THC contents have decreased with 13-14 mg/kg. At the well template D315o-axis the THC content has increased (7-10 mg/kg) at the two innermost stations (BAL33 and BAL34), while the THC contents are almost unchanged or slightly reduced at the remaining stations on the well template D-axes.
In the 1997 survey, the innermost and outermost stations on the 135o-axis from well templates C (BAL09 and BAL12) and D (BAL28 and BAL31) were investigated for NPD´s, 3-6 ring aromatics and decalins. The amounts of NPD´s, 3-6 ring aromatics and decalins have clearly decreased at BAL09. In 1997, the concentrations of NPD´s, 3-6 ring aromatics and decalins at BAL09 were 0.435 ± 0.267, 0,259 ± 0.029 and 1.644 ± 0.996 mg/kg dry sediment respectively. In the present survey, the amounts of decalins found at BAL12 and BAL28 are one third and one halve the concentrations found in 1997, while the amounts of NPD´s and 3-6 ring aromatics are almost unchanged.
Compared to the 1997 olefin results, the contents of olefins have decreased at all stations (Figure 12-4). The largest decreases (365-465 mg/kg) are seen at the innermost stations on the well templates B and C axes (BAL09, BAL16 and BAL37). In addition, the olefin contents have decreased with 130-240 mg/kg at the innermost stations on the well templates A270o- and A180o-axes (BAL22 and BAL42) and at the two innermost stations on the D315o-axis (BAL33 and BAL34.)
Since 1997, the barium content has increased at the innermost stations on the B135o-, D135o- and D54o-axes and at the two innermost stations on the C135o-axis. The largest increase is seen at BAL09, where the amount of barium has increased with 1020 mg/kg dry sediment. Decreasing amounts of barium down the sediment core from BAL09 (Table 12-7) support this finding. At the remaining stations the amount of barium is unchanged or reduced. The largest reductions (1330–1820 mg/kg) in barium contents are seen at the innermost stations on the A180o-, A270o-, B198o- and D315o-axes. At these stations, reduced barium content is accompanied of reduced cadmium, copper, zinc and lead contents and the stations in question are regarded as uncontaminated with these metals in the present survey. At the remaining stations the content cadmium and lead are unchanged or only slightly increased, while the content of copper and zinc are unchanged or reduced (Figure 12-6.)
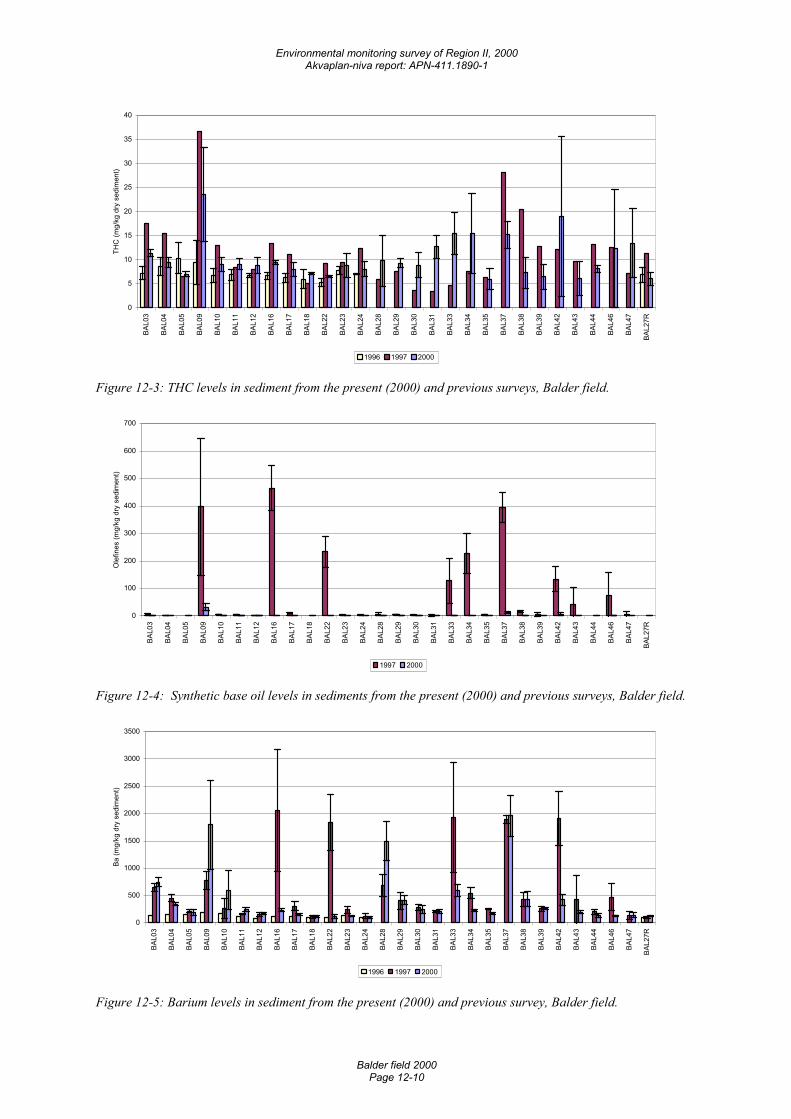
Environmental monitoring survey of Region II, 2000 Akvaplan-niva report: APN-411.1890-1
Balder field 2000 Page 12-10
0
5
10
15
20
25
30
35
40
BAL0
3
BAL0
4
BAL0
5
BAL0
9
BAL1
0
BAL1
1
BAL1
2
BAL1
6
BAL1
7
BAL1
8
BAL2
2
BAL2
3
BAL2
4
BAL2
8
BAL2
9
BAL3
0
BAL3
1
BAL3
3
BAL3
4
BAL3
5
BAL3
7
BAL3
8
BAL3
9
BAL4
2
BAL4
3
BAL4
4
BAL4
6
BAL4
7
BAL2
7R
THC
(mg/
kg d
ry s
edim
ent)
1996 1997 2000
Figure 12-3: THC levels in sediment from the present (2000) and previous surveys, Balder field.
0
100
200
300
400
500
600
700
BAL0
3
BAL0
4
BAL0
5
BAL0
9
BAL1
0
BAL1
1
BAL1
2
BAL1
6
BAL1
7
BAL1
8
BAL2
2
BAL2
3
BAL2
4
BAL2
8
BAL2
9
BAL3
0
BAL3
1
BAL3
3
BAL3
4
BAL3
5
BAL3
7
BAL3
8
BAL3
9
BAL4
2
BAL4
3
BAL4
4
BAL4
6
BAL4
7
BAL2
7R
Ole
fines
(mg/
kg d
ry s
edim
ent)
1997 2000
Figure 12-4: Synthetic base oil levels in sediments from the present (2000) and previous surveys, Balder field.
0
500
1000
1500
2000
2500
3000
3500
BAL0
3
BAL0
4
BAL0
5
BAL0
9
BAL1
0
BAL1
1
BAL1
2
BAL1
6
BAL1
7
BAL1
8
BAL2
2
BAL2
3
BAL2
4
BAL2
8
BAL2
9
BAL3
0
BAL3
1
BAL3
3
BAL3
4
BAL3
5
BAL3
7
BAL3
8
BAL3
9
BAL4
2
BAL4
3
BAL4
4
BAL4
6
BAL4
7
BAL2
7R
Ba (m
g/kg
dry
sed
imen
t)
1996 1997 2000
Figure 12-5: Barium levels in sediment from the present (2000) and previous survey, Balder field.
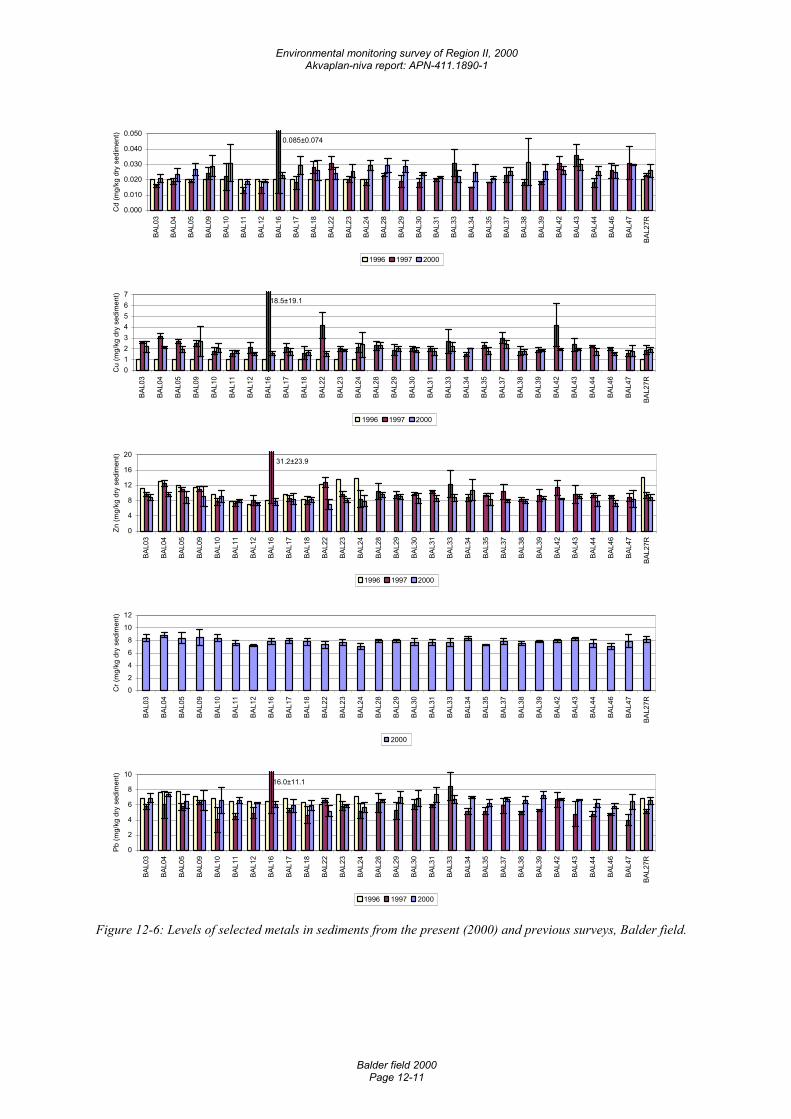
Environmental monitoring survey of Region II, 2000 Akvaplan-niva report: APN-411.1890-1
Balder field 2000 Page 12-11
0.085±0.074
0.000
0.010
0.020
0.030
0.040
0.050
BAL0
3
BAL0
4
BAL0
5
BAL0
9
BAL1
0
BAL1
1
BAL1
2
BAL1
6
BAL1
7
BAL1
8
BAL2
2
BAL2
3
BAL2
4
BAL2
8
BAL2
9
BAL3
0
BAL3
1
BAL3
3
BAL3
4
BAL3
5
BAL3
7
BAL3
8
BAL3
9
BAL4
2
BAL4
3
BAL4
4
BAL4
6
BAL4
7
BAL2
7R
Cd
(mg/
kg d
ry s
edim
ent)
1996 1997 2000
18.5±19.1
01234567
BAL0
3
BAL0
4
BAL0
5
BAL0
9
BAL1
0
BAL1
1
BAL1
2
BAL1
6
BAL1
7
BAL1
8
BAL2
2
BAL2
3
BAL2
4
BAL2
8
BAL2
9
BAL3
0
BAL3
1
BAL3
3
BAL3
4
BAL3
5
BAL3
7
BAL3
8
BAL3
9
BAL4
2
BAL4
3
BAL4
4
BAL4
6
BAL4
7
BAL2
7R
Cu
(mg/
kg d
ry s
edim
ent)
1996 1997 2000
31.2±23.9
0
4
8
12
16
20
BAL0
3
BAL0
4
BAL0
5
BAL0
9
BAL1
0
BAL1
1
BAL1
2
BAL1
6
BAL1
7
BAL1
8
BAL2
2
BAL2
3
BAL2
4
BAL2
8
BAL2
9
BAL3
0
BAL3
1
BAL3
3
BAL3
4
BAL3
5
BAL3
7
BAL3
8
BAL3
9
BAL4
2
BAL4
3
BAL4
4
BAL4
6
BAL4
7
BAL2
7R
Zn (m
g/kg
dry
sed
imen
t)
1996 1997 2000
0
2
4
6
8
10
12
BAL0
3
BAL0
4
BAL0
5
BAL0
9
BAL1
0
BAL1
1
BAL1
2
BAL1
6
BAL1
7
BAL1
8
BAL2
2
BAL2
3
BAL2
4
BAL2
8
BAL2
9
BAL3
0
BAL3
1
BAL3
3
BAL3
4
BAL3
5
BAL3
7
BAL3
8
BAL3
9
BAL4
2
BAL4
3
BAL4
4
BAL4
6
BAL4
7
BAL2
7R
Cr (
mg/
kg d
ry s
edim
ent)
2000
16.0±11.1
0
2
4
6
8
10
BAL0
3
BAL0
4
BAL0
5
BAL0
9
BAL1
0
BAL1
1
BAL1
2
BAL1
6
BAL1
7
BAL1
8
BAL2
2
BAL2
3
BAL2
4
BAL2
8
BAL2
9
BAL3
0
BAL3
1
BAL3
3
BAL3
4
BAL3
5
BAL3
7
BAL3
8
BAL3
9
BAL4
2
BAL4
3
BAL4
4
BAL4
6
BAL4
7
BAL2
7R
Pb (m
g/kg
dry
sed
imen
t)
1996 1997 2000
Figure 12-6: Levels of selected metals in sediments from the present (2000) and previous surveys, Balder field.
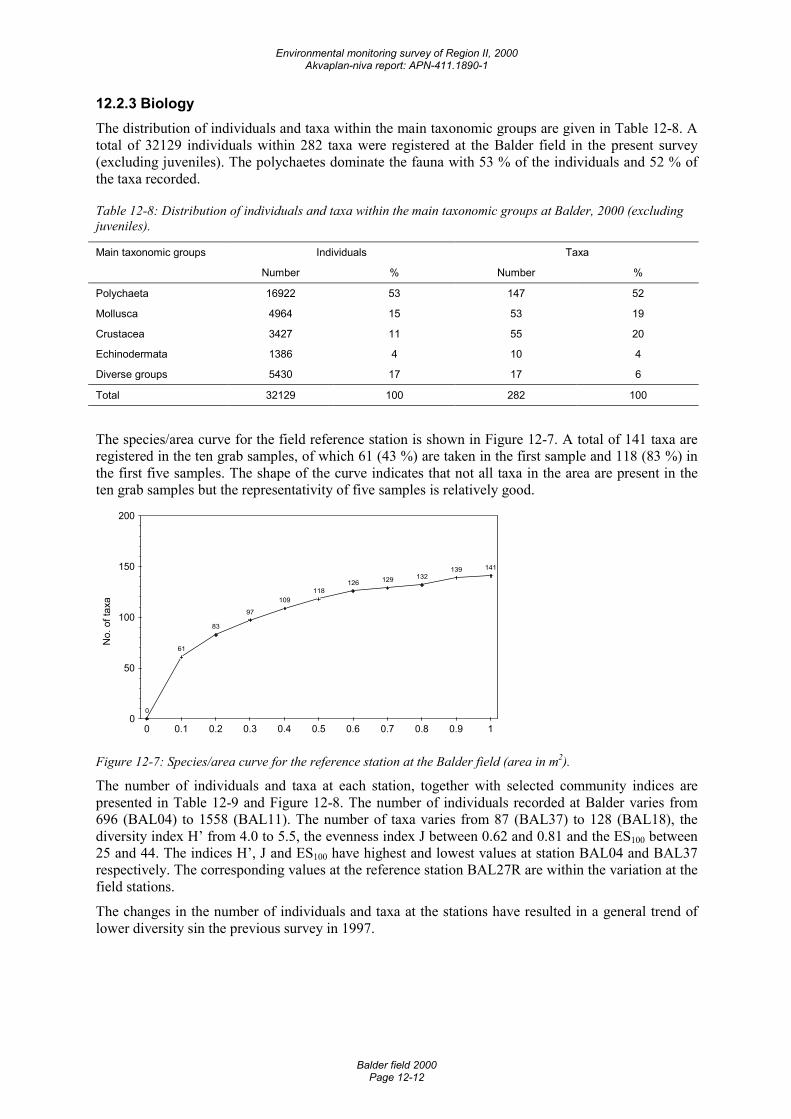
Environmental monitoring survey of Region II, 2000 Akvaplan-niva report: APN-411.1890-1
Balder field 2000 Page 12-12
12.2.3 Biology The distribution of individuals and taxa within the main taxonomic groups are given in Table 12-8. A total of 32129 individuals within 282 taxa were registered at the Balder field in the present survey (excluding juveniles). The polychaetes dominate the fauna with 53 % of the individuals and 52 % of the taxa recorded.
Table 12-8: Distribution of individuals and taxa within the main taxonomic groups at Balder, 2000 (excluding juveniles).
Main taxonomic groups Individuals Taxa
Number % Number %
Polychaeta 16922 53 147 52
Mollusca 4964 15 53 19
Crustacea 3427 11 55 20
Echinodermata 1386 4 10 4
Diverse groups 5430 17 17 6
Total 32129 100 282 100
The species/area curve for the field reference station is shown in Figure 12-7. A total of 141 taxa are registered in the ten grab samples, of which 61 (43 %) are taken in the first sample and 118 (83 %) in the first five samples. The shape of the curve indicates that not all taxa in the area are present in the ten grab samples but the representativity of five samples is relatively good.
No.
of t
axa
0
61
83
97
109118
126 129 132139 141
0
50
100
150
200
0 0.1 0.2 0.3 0.4 0.5 0.6 0.7 0.8 0.9 1
Figure 12-7: Species/area curve for the reference station at the Balder field (area in m2).
The number of individuals and taxa at each station, together with selected community indices are presented in Table 12-9 and Figure 12-8. The number of individuals recorded at Balder varies from 696 (BAL04) to 1558 (BAL11). The number of taxa varies from 87 (BAL37) to 128 (BAL18), the diversity index H’ from 4.0 to 5.5, the evenness index J between 0.62 and 0.81 and the ES100 between 25 and 44. The indices H’, J and ES100 have highest and lowest values at station BAL04 and BAL37 respectively. The corresponding values at the reference station BAL27R are within the variation at the field stations.
The changes in the number of individuals and taxa at the stations have resulted in a general trend of lower diversity sin the previous survey in 1997.
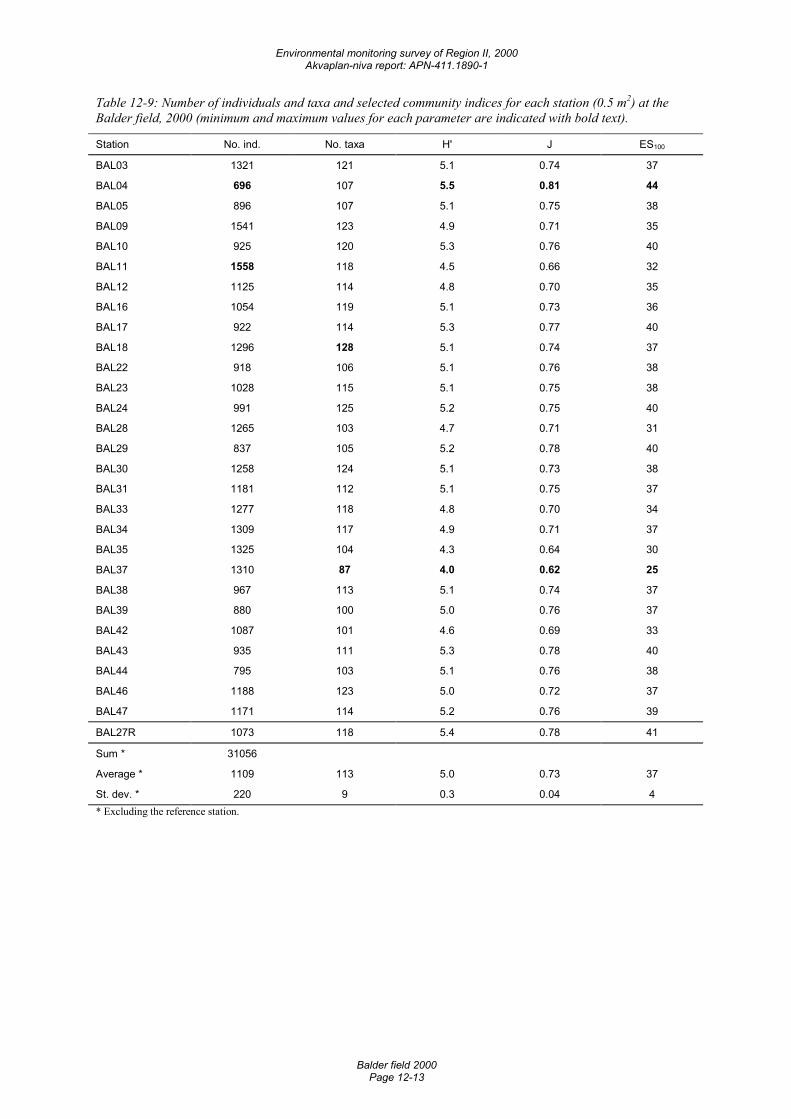
Environmental monitoring survey of Region II, 2000 Akvaplan-niva report: APN-411.1890-1
Balder field 2000 Page 12-13
Table 12-9: Number of individuals and taxa and selected community indices for each station (0.5 m2) at the Balder field, 2000 (minimum and maximum values for each parameter are indicated with bold text).
Station No. ind. No. taxa H' J ES100
BAL03 1321 121 5.1 0.74 37
BAL04 696 107 5.5 0.81 44
BAL05 896 107 5.1 0.75 38
BAL09 1541 123 4.9 0.71 35
BAL10 925 120 5.3 0.76 40
BAL11 1558 118 4.5 0.66 32
BAL12 1125 114 4.8 0.70 35
BAL16 1054 119 5.1 0.73 36
BAL17 922 114 5.3 0.77 40
BAL18 1296 128 5.1 0.74 37
BAL22 918 106 5.1 0.76 38
BAL23 1028 115 5.1 0.75 38
BAL24 991 125 5.2 0.75 40
BAL28 1265 103 4.7 0.71 31
BAL29 837 105 5.2 0.78 40
BAL30 1258 124 5.1 0.73 38
BAL31 1181 112 5.1 0.75 37
BAL33 1277 118 4.8 0.70 34
BAL34 1309 117 4.9 0.71 37
BAL35 1325 104 4.3 0.64 30
BAL37 1310 87 4.0 0.62 25
BAL38 967 113 5.1 0.74 37
BAL39 880 100 5.0 0.76 37
BAL42 1087 101 4.6 0.69 33
BAL43 935 111 5.3 0.78 40
BAL44 795 103 5.1 0.76 38
BAL46 1188 123 5.0 0.72 37
BAL47 1171 114 5.2 0.76 39
BAL27R 1073 118 5.4 0.78 41
Sum * 31056
Average * 1109 113 5.0 0.73 37
St. dev. * 220 9 0.3 0.04 4 * Excluding the reference station.
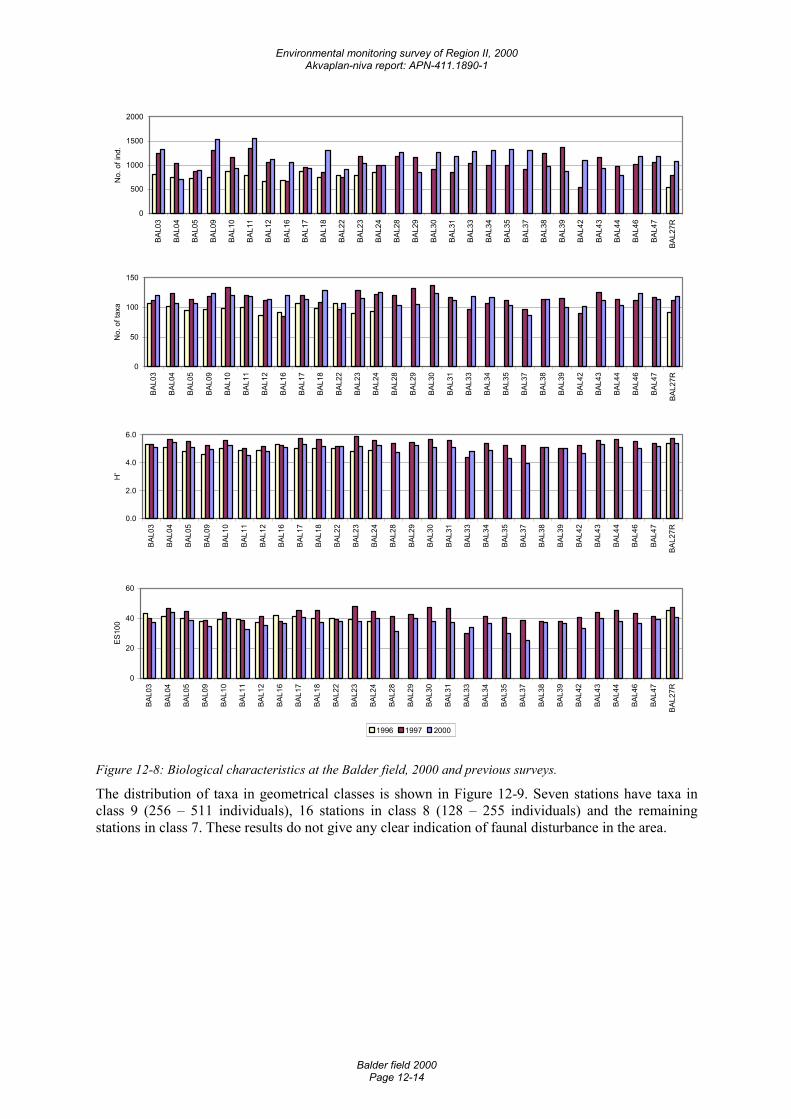
Environmental monitoring survey of Region II, 2000 Akvaplan-niva report: APN-411.1890-1
Balder field 2000 Page 12-14
0
500
1000
1500
2000
BAL0
3
BAL0
4
BAL0
5
BAL0
9
BAL1
0
BAL1
1
BAL1
2
BAL1
6
BAL1
7
BAL1
8
BAL2
2
BAL2
3
BAL2
4
BAL2
8
BAL2
9
BAL3
0
BAL3
1
BAL3
3
BAL3
4
BAL3
5
BAL3
7
BAL3
8
BAL3
9
BAL4
2
BAL4
3
BAL4
4
BAL4
6
BAL4
7
BAL2
7R
No.
of i
nd.
0
50
100
150
BAL0
3
BAL0
4
BAL0
5
BAL0
9
BAL1
0
BAL1
1
BAL1
2
BAL1
6
BAL1
7
BAL1
8
BAL2
2
BAL2
3
BAL2
4
BAL2
8
BAL2
9
BAL3
0
BAL3
1
BAL3
3
BAL3
4
BAL3
5
BAL3
7
BAL3
8
BAL3
9
BAL4
2
BAL4
3
BAL4
4
BAL4
6
BAL4
7
BAL2
7R
No.
of t
axa
0.0
2.0
4.0
6.0
BAL0
3
BAL0
4
BAL0
5
BAL0
9
BAL1
0
BAL1
1
BAL1
2
BAL1
6
BAL1
7
BAL1
8
BAL2
2
BAL2
3
BAL2
4
BAL2
8
BAL2
9
BAL3
0
BAL3
1
BAL3
3
BAL3
4
BAL3
5
BAL3
7
BAL3
8
BAL3
9
BAL4
2
BAL4
3
BAL4
4
BAL4
6
BAL4
7
BAL2
7R
H'
0
20
40
60
BAL0
3
BAL0
4
BAL0
5
BAL0
9
BAL1
0
BAL1
1
BAL1
2
BAL1
6
BAL1
7
BAL1
8
BAL2
2
BAL2
3
BAL2
4
BAL2
8
BAL2
9
BAL3
0
BAL3
1
BAL3
3
BAL3
4
BAL3
5
BAL3
7
BAL3
8
BAL3
9
BAL4
2
BAL4
3
BAL4
4
BAL4
6
BAL4
7
BAL2
7R
ES10
0
1996 1997 2000
Figure 12-8: Biological characteristics at the Balder field, 2000 and previous surveys.
The distribution of taxa in geometrical classes is shown in Figure 12-9. Seven stations have taxa in class 9 (256 – 511 individuals), 16 stations in class 8 (128 – 255 individuals) and the remaining stations in class 7. These results do not give any clear indication of faunal disturbance in the area.
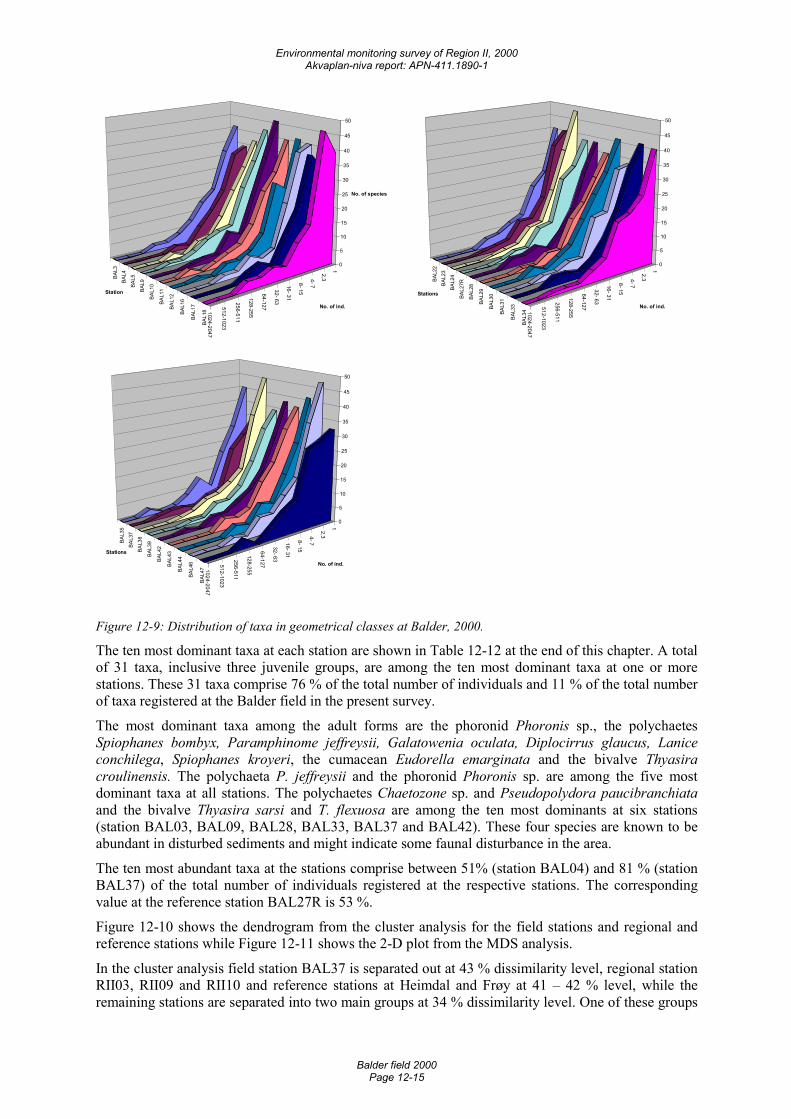
Environmental monitoring survey of Region II, 2000 Akvaplan-niva report: APN-411.1890-1
Balder field 2000 Page 12-15
12,3 4- 7
8- 15
16- 31
32- 63
64-127
128-255
256-511
512-1023
1024-2047
BAL3
BAL4
BAL5
BAL9
BAL1
0
BAL1
1
BAL1
2
BAL1
6
BAL1
7
BAL1
8
0
5
10
15
20
25
30
35
40
45
50
No. of species
No. of ind.
Station
12,3 4- 7
8- 15
16- 31
32- 63
64-127
128-255
256-511
512-1023
1024-2047
BAL2
2BA
L23
BAL2
4
BAL2
7R
BAL2
8
BAL2
9
BAL3
0
BAL3
1
BAL3
3
BAL3
4
0
5
10
15
20
25
30
35
40
45
50
No. of ind.
Stations
1
2,3 4- 7
8- 15
16- 31
32- 63
64-127
128-255
256-511
512-1023
1024-2047
BAL3
5BA
L37
BAL3
8
BAL3
9
BAL4
2
BAL4
3
BAL4
4
BAL4
6
BAL4
7
0
5
10
15
20
25
30
35
40
45
50
No. of ind.
Stations
Figure 12-9: Distribution of taxa in geometrical classes at Balder, 2000.
The ten most dominant taxa at each station are shown in Table 12-12 at the end of this chapter. A total of 31 taxa, inclusive three juvenile groups, are among the ten most dominant taxa at one or more stations. These 31 taxa comprise 76 % of the total number of individuals and 11 % of the total number of taxa registered at the Balder field in the present survey.
The most dominant taxa among the adult forms are the phoronid Phoronis sp., the polychaetes Spiophanes bombyx, Paramphinome jeffreysii, Galatowenia oculata, Diplocirrus glaucus, Lanice conchilega, Spiophanes kroyeri, the cumacean Eudorella emarginata and the bivalve Thyasira croulinensis. The polychaeta P. jeffreysii and the phoronid Phoronis sp. are among the five most dominant taxa at all stations. The polychaetes Chaetozone sp. and Pseudopolydora paucibranchiata and the bivalve Thyasira sarsi and T. flexuosa are among the ten most dominants at six stations (station BAL03, BAL09, BAL28, BAL33, BAL37 and BAL42). These four species are known to be abundant in disturbed sediments and might indicate some faunal disturbance in the area.
The ten most abundant taxa at the stations comprise between 51% (station BAL04) and 81 % (station BAL37) of the total number of individuals registered at the respective stations. The corresponding value at the reference station BAL27R is 53 %.
Figure 12-10 shows the dendrogram from the cluster analysis for the field stations and regional and reference stations while Figure 12-11 shows the 2-D plot from the MDS analysis.
In the cluster analysis field station BAL37 is separated out at 43 % dissimilarity level, regional station RII03, RII09 and RII10 and reference stations at Heimdal and Frøy at 41 – 42 % level, while the remaining stations are separated into two main groups at 34 % dissimilarity level. One of these groups
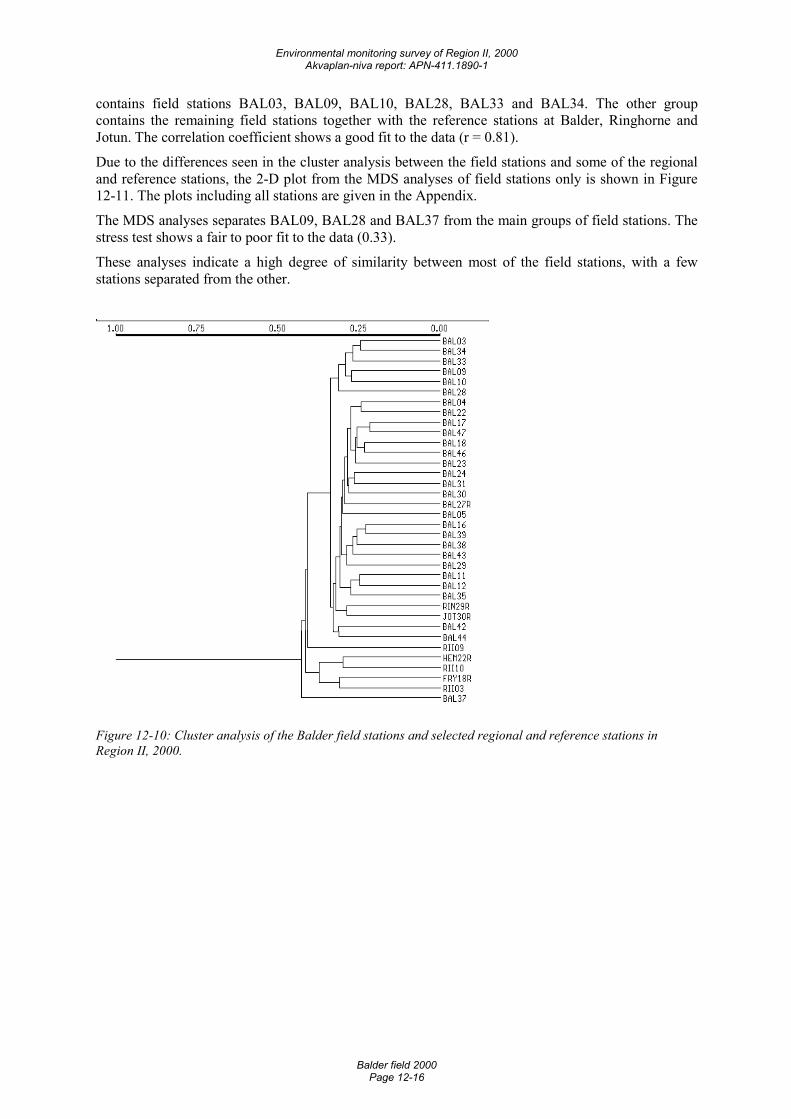
Environmental monitoring survey of Region II, 2000 Akvaplan-niva report: APN-411.1890-1
Balder field 2000 Page 12-16
contains field stations BAL03, BAL09, BAL10, BAL28, BAL33 and BAL34. The other group contains the remaining field stations together with the reference stations at Balder, Ringhorne and Jotun. The correlation coefficient shows a good fit to the data (r = 0.81).
Due to the differences seen in the cluster analysis between the field stations and some of the regional and reference stations, the 2-D plot from the MDS analyses of field stations only is shown in Figure 12-11. The plots including all stations are given in the Appendix.
The MDS analyses separates BAL09, BAL28 and BAL37 from the main groups of field stations. The stress test shows a fair to poor fit to the data (0.33).
These analyses indicate a high degree of similarity between most of the field stations, with a few stations separated from the other.
Figure 12-10: Cluster analysis of the Balder field stations and selected regional and reference stations in Region II, 2000.
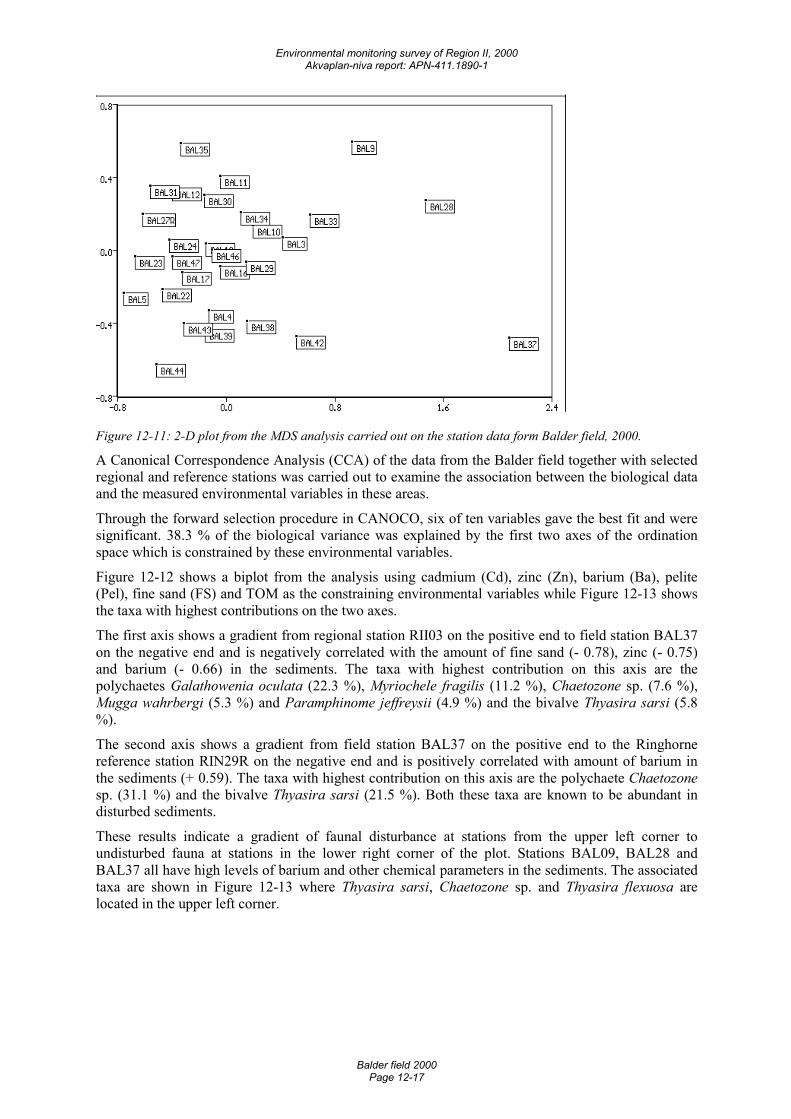
Environmental monitoring survey of Region II, 2000 Akvaplan-niva report: APN-411.1890-1
Balder field 2000 Page 12-17
Figure 12-11: 2-D plot from the MDS analysis carried out on the station data form Balder field, 2000.
A Canonical Correspondence Analysis (CCA) of the data from the Balder field together with selected regional and reference stations was carried out to examine the association between the biological data and the measured environmental variables in these areas.
Through the forward selection procedure in CANOCO, six of ten variables gave the best fit and were significant. 38.3 % of the biological variance was explained by the first two axes of the ordination space which is constrained by these environmental variables.
Figure 12-12 shows a biplot from the analysis using cadmium (Cd), zinc (Zn), barium (Ba), pelite (Pel), fine sand (FS) and TOM as the constraining environmental variables while Figure 12-13 shows the taxa with highest contributions on the two axes.
The first axis shows a gradient from regional station RII03 on the positive end to field station BAL37 on the negative end and is negatively correlated with the amount of fine sand (- 0.78), zinc (- 0.75) and barium (- 0.66) in the sediments. The taxa with highest contribution on this axis are the polychaetes Galathowenia oculata (22.3 %), Myriochele fragilis (11.2 %), Chaetozone sp. (7.6 %), Mugga wahrbergi (5.3 %) and Paramphinome jeffreysii (4.9 %) and the bivalve Thyasira sarsi (5.8 %).
The second axis shows a gradient from field station BAL37 on the positive end to the Ringhorne reference station RIN29R on the negative end and is positively correlated with amount of barium in the sediments (+ 0.59). The taxa with highest contribution on this axis are the polychaete Chaetozone sp. (31.1 %) and the bivalve Thyasira sarsi (21.5 %). Both these taxa are known to be abundant in disturbed sediments.
These results indicate a gradient of faunal disturbance at stations from the upper left corner to undisturbed fauna at stations in the lower right corner of the plot. Stations BAL09, BAL28 and BAL37 all have high levels of barium and other chemical parameters in the sediments. The associated taxa are shown in Figure 12-13 where Thyasira sarsi, Chaetozone sp. and Thyasira flexuosa are located in the upper left corner.
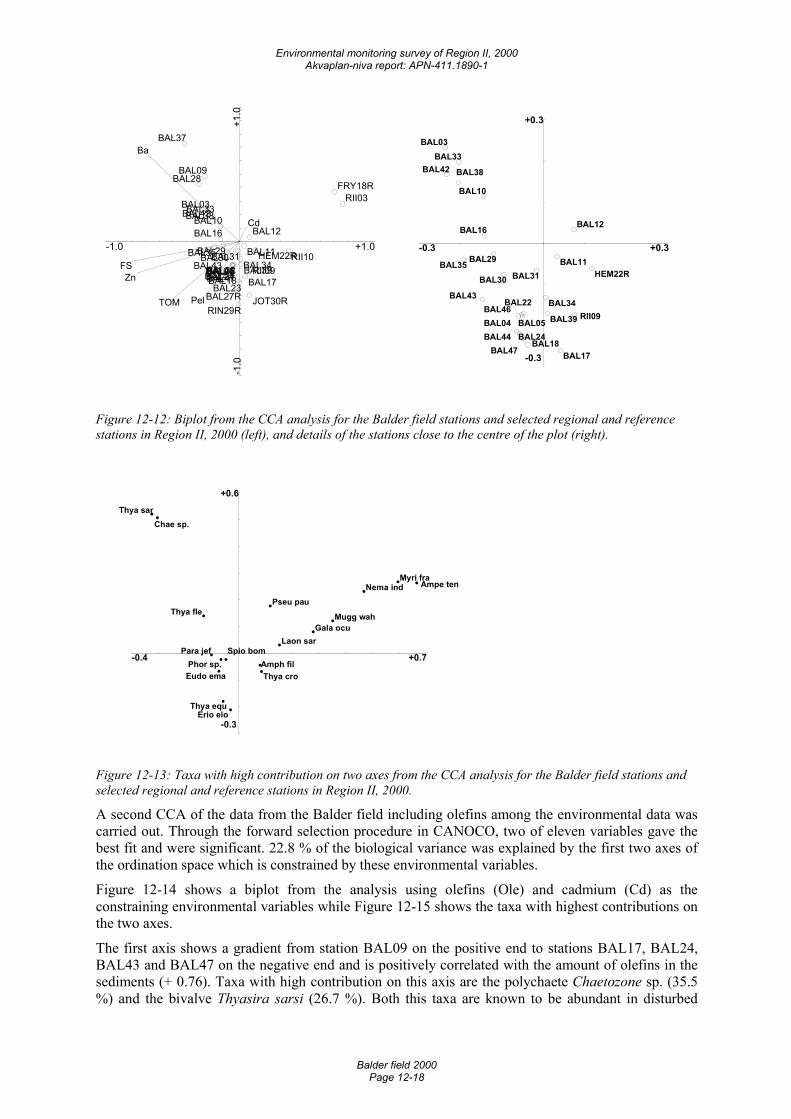
Environmental monitoring survey of Region II, 2000 Akvaplan-niva report: APN-411.1890-1
Balder field 2000 Page 12-18
-1.0 +1.0-1
.0+1
.0
FSZn
Ba
TOM Pel
Cd
RII03FRY18R
BAL37
RII10
BAL28BAL09
BAL03BAL42BAL38BAL33
BAL35BAL43
BAL10BAL16
BAL29 HEM22RBAL30RII09
BAL12
JOT30R
BAL44BAL04BAL24BAL46BAL05BAL47BAL22
BAL17BAL18
BAL11
BAL27R
BAL31BAL39
RIN29R
BAL34
BAL23�
-0.3 +0.3
-0.3
+0.3
BAL03
BAL42 BAL38
BAL33
BAL35
BAL43
BAL10
BAL16
BAL29HEM22RBAL30
RII09
BAL12
BAL44BAL04
BAL24
BAL46BAL05
BAL47
BAL22
BAL17BAL18
BAL11BAL31
BAL39
BAL34
Figure 12-12: Biplot from the CCA analysis for the Balder field stations and selected regional and reference stations in Region II, 2000 (left), and details of the stations close to the centre of the plot (right).
-0.4 +0.7
-0.3
+0.6
Ampe tenMyri fra
Nema ind
Mugg wah
Thya sarChae sp.
Gala ocuLaon sar
Thya flePseu pau
Para jef
Thya croAmph fil
Eudo emaPhor sp.
Thya equ
Spio bom
Erio elo
Figure 12-13: Taxa with high contribution on two axes from the CCA analysis for the Balder field stations and selected regional and reference stations in Region II, 2000.
A second CCA of the data from the Balder field including olefins among the environmental data was carried out. Through the forward selection procedure in CANOCO, two of eleven variables gave the best fit and were significant. 22.8 % of the biological variance was explained by the first two axes of the ordination space which is constrained by these environmental variables.
Figure 12-14 shows a biplot from the analysis using olefins (Ole) and cadmium (Cd) as the constraining environmental variables while Figure 12-15 shows the taxa with highest contributions on the two axes.
The first axis shows a gradient from station BAL09 on the positive end to stations BAL17, BAL24, BAL43 and BAL47 on the negative end and is positively correlated with the amount of olefins in the sediments (+ 0.76). Taxa with high contribution on this axis are the polychaete Chaetozone sp. (35.5 %) and the bivalve Thyasira sarsi (26.7 %). Both this taxa are known to be abundant in disturbed
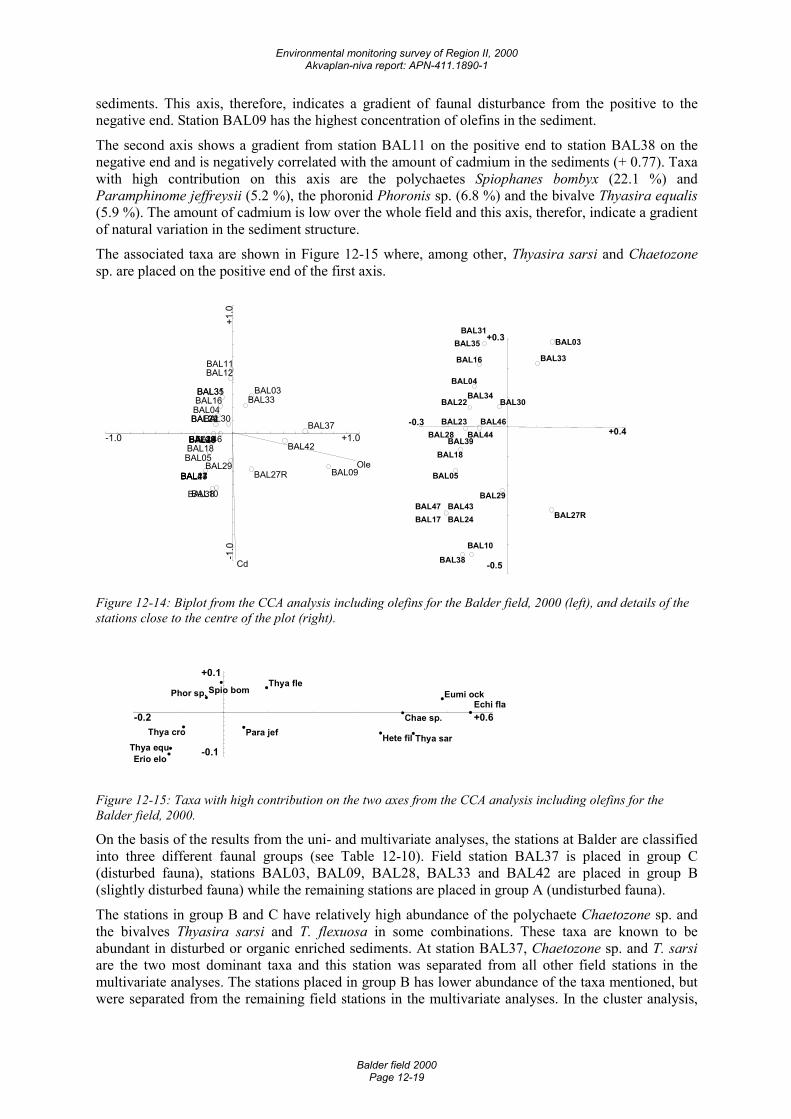
Environmental monitoring survey of Region II, 2000 Akvaplan-niva report: APN-411.1890-1
Balder field 2000 Page 12-19
sediments. This axis, therefore, indicates a gradient of faunal disturbance from the positive to the negative end. Station BAL09 has the highest concentration of olefins in the sediment.
The second axis shows a gradient from station BAL11 on the positive end to station BAL38 on the negative end and is negatively correlated with the amount of cadmium in the sediments (+ 0.77). Taxa with high contribution on this axis are the polychaetes Spiophanes bombyx (22.1 %) and Paramphinome jeffreysii (5.2 %), the phoronid Phoronis sp. (6.8 %) and the bivalve Thyasira equalis (5.9 %). The amount of cadmium is low over the whole field and this axis, therefor, indicate a gradient of natural variation in the sediment structure.
The associated taxa are shown in Figure 12-15 where, among other, Thyasira sarsi and Chaetozone sp. are placed on the positive end of the first axis.
-1.0 +1.0
-1.0
+1.0
Ole
Cd
BAL09
BAL37
BAL42
BAL17BAL43BAL24BAL47
BAL05BAL18
BAL03
BAL38
BAL27R
BAL44BAL39BAL23BAL28
BAL22BAL34
BAL10
BAL04BAL33BAL16
BAL46
BAL35BAL31
BAL30
BAL29
BAL12BAL11�
-0.3+0.4
-0.5
+0.3
BAL17BAL43BAL24
BAL47
BAL05
BAL18
BAL38
BAL27R
BAL28BAL39
BAL44BAL23
BAL22BAL34
BAL10
BAL04
BAL33BAL16
BAL46
BAL30
BAL29
BAL03BAL35BAL31
Figure 12-14: Biplot from the CCA analysis including olefins for the Balder field, 2000 (left), and details of the stations close to the centre of the plot (right).
-0.2 +0.6
-0.1
+0.1
Echi flaEumi ock
Thya sar
Chae sp.
Hete fil
Erio eloThya equ
Thya fle
Thya cro Para jef
Phor sp. Spio bom
Figure 12-15: Taxa with high contribution on the two axes from the CCA analysis including olefins for the Balder field, 2000.
On the basis of the results from the uni- and multivariate analyses, the stations at Balder are classified into three different faunal groups (see Table 12-10). Field station BAL37 is placed in group C (disturbed fauna), stations BAL03, BAL09, BAL28, BAL33 and BAL42 are placed in group B (slightly disturbed fauna) while the remaining stations are placed in group A (undisturbed fauna).
The stations in group B and C have relatively high abundance of the polychaete Chaetozone sp. and the bivalves Thyasira sarsi and T. flexuosa in some combinations. These taxa are known to be abundant in disturbed or organic enriched sediments. At station BAL37, Chaetozone sp. and T. sarsi are the two most dominant taxa and this station was separated from all other field stations in the multivariate analyses. The stations placed in group B has lower abundance of the taxa mentioned, but were separated from the remaining field stations in the multivariate analyses. In the cluster analysis,
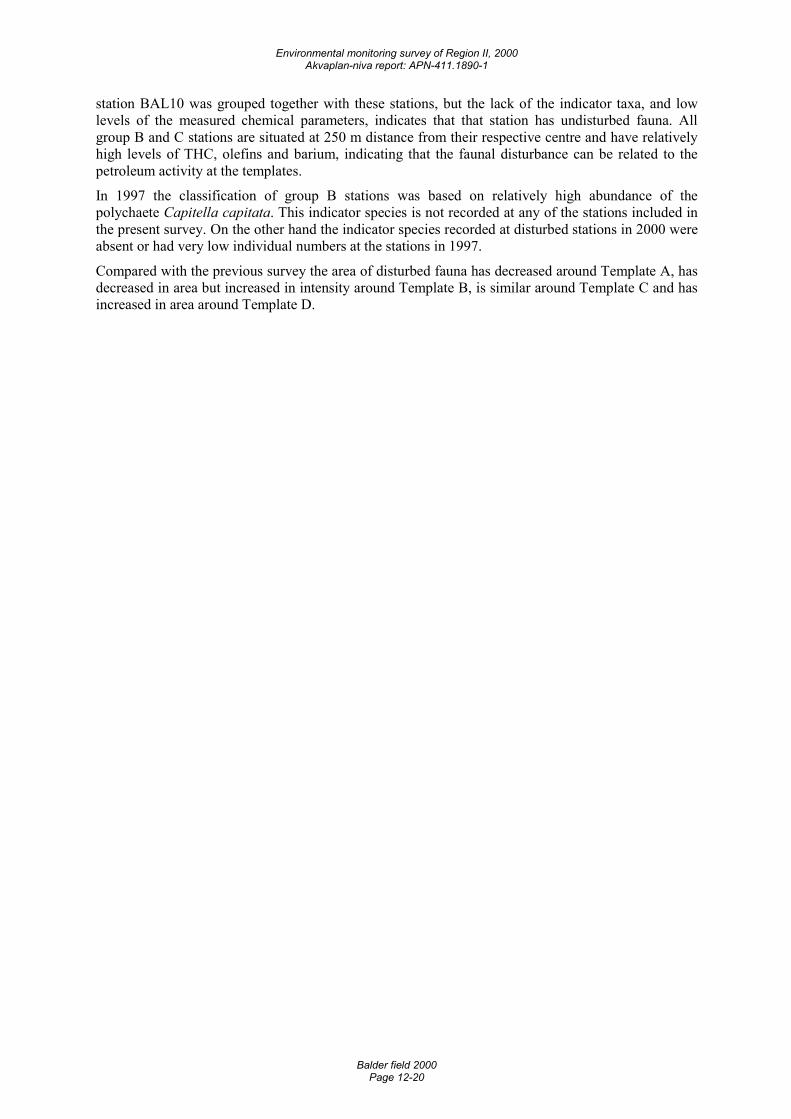
Environmental monitoring survey of Region II, 2000 Akvaplan-niva report: APN-411.1890-1
Balder field 2000 Page 12-20
station BAL10 was grouped together with these stations, but the lack of the indicator taxa, and low levels of the measured chemical parameters, indicates that that station has undisturbed fauna. All group B and C stations are situated at 250 m distance from their respective centre and have relatively high levels of THC, olefins and barium, indicating that the faunal disturbance can be related to the petroleum activity at the templates.
In 1997 the classification of group B stations was based on relatively high abundance of the polychaete Capitella capitata. This indicator species is not recorded at any of the stations included in the present survey. On the other hand the indicator species recorded at disturbed stations in 2000 were absent or had very low individual numbers at the stations in 1997.
Compared with the previous survey the area of disturbed fauna has decreased around Template A, has decreased in area but increased in intensity around Template B, is similar around Template C and has increased in area around Template D.
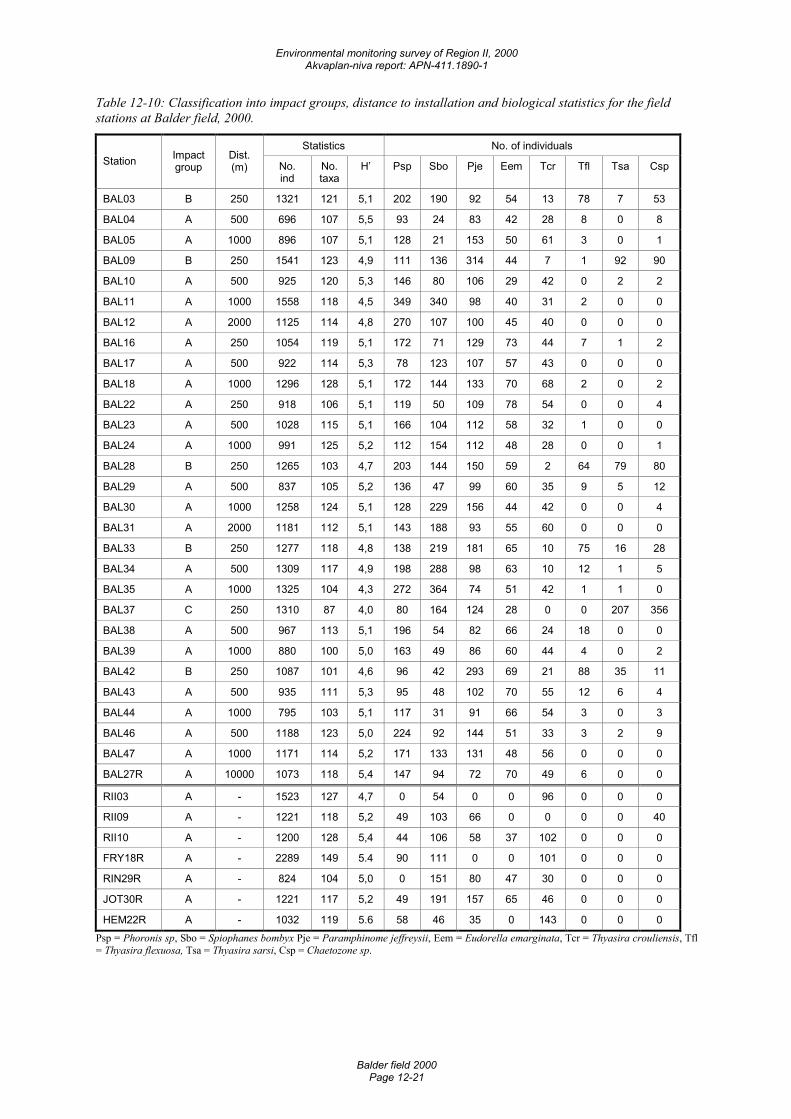
Environmental monitoring survey of Region II, 2000 Akvaplan-niva report: APN-411.1890-1
Balder field 2000 Page 12-21
Table 12-10: Classification into impact groups, distance to installation and biological statistics for the field stations at Balder field, 2000.
Statistics No. of individuals Station Impact
group Dist. (m) No.
ind No. taxa
H’ Psp Sbo Pje Eem Tcr Tfl Tsa Csp
BAL03 B 250 1321 121 5,1 202 190 92 54 13 78 7 53
BAL04 A 500 696 107 5,5 93 24 83 42 28 8 0 8
BAL05 A 1000 896 107 5,1 128 21 153 50 61 3 0 1
BAL09 B 250 1541 123 4,9 111 136 314 44 7 1 92 90
BAL10 A 500 925 120 5,3 146 80 106 29 42 0 2 2
BAL11 A 1000 1558 118 4,5 349 340 98 40 31 2 0 0
BAL12 A 2000 1125 114 4,8 270 107 100 45 40 0 0 0
BAL16 A 250 1054 119 5,1 172 71 129 73 44 7 1 2
BAL17 A 500 922 114 5,3 78 123 107 57 43 0 0 0
BAL18 A 1000 1296 128 5,1 172 144 133 70 68 2 0 2
BAL22 A 250 918 106 5,1 119 50 109 78 54 0 0 4
BAL23 A 500 1028 115 5,1 166 104 112 58 32 1 0 0
BAL24 A 1000 991 125 5,2 112 154 112 48 28 0 0 1
BAL28 B 250 1265 103 4,7 203 144 150 59 2 64 79 80
BAL29 A 500 837 105 5,2 136 47 99 60 35 9 5 12
BAL30 A 1000 1258 124 5,1 128 229 156 44 42 0 0 4
BAL31 A 2000 1181 112 5,1 143 188 93 55 60 0 0 0
BAL33 B 250 1277 118 4,8 138 219 181 65 10 75 16 28
BAL34 A 500 1309 117 4,9 198 288 98 63 10 12 1 5
BAL35 A 1000 1325 104 4,3 272 364 74 51 42 1 1 0
BAL37 C 250 1310 87 4,0 80 164 124 28 0 0 207 356
BAL38 A 500 967 113 5,1 196 54 82 66 24 18 0 0
BAL39 A 1000 880 100 5,0 163 49 86 60 44 4 0 2
BAL42 B 250 1087 101 4,6 96 42 293 69 21 88 35 11
BAL43 A 500 935 111 5,3 95 48 102 70 55 12 6 4
BAL44 A 1000 795 103 5,1 117 31 91 66 54 3 0 3
BAL46 A 500 1188 123 5,0 224 92 144 51 33 3 2 9
BAL47 A 1000 1171 114 5,2 171 133 131 48 56 0 0 0
BAL27R A 10000 1073 118 5,4 147 94 72 70 49 6 0 0
RII03 A - 1523 127 4,7 0 54 0 0 96 0 0 0
RII09 A - 1221 118 5,2 49 103 66 0 0 0 0 40
RII10 A - 1200 128 5,4 44 106 58 37 102 0 0 0
FRY18R A - 2289 149 5.4 90 111 0 0 101 0 0 0
RIN29R A - 824 104 5,0 0 151 80 47 30 0 0 0
JOT30R A - 1221 117 5,2 49 191 157 65 46 0 0 0
HEM22R A - 1032 119 5.6 58 46 35 0 143 0 0 0 Psp = Phoronis sp, Sbo = Spiophanes bombyx Pje = Paramphinome jeffreysii, Eem = Eudorella emarginata, Tcr = Thyasira crouliensis, Tfl = Thyasira flexuosa, Tsa = Thyasira sarsi, Csp = Chaetozone sp.
Environmental monitoring survey of Region II, 2000 Akvaplan-niva report: APN-411.1890-1
Balder field 2000 Page 12-22
12.3 Summary and conclusions The sediment at the Balder field is classified as fine sand with relatively high amount of pelite (6.9 – 14.1 %) and TOM (1.7 – 2.7 %). The sediment structure is similar to that found on the neighbouring Ringhorne field. The TOM value has decreased remarkably from the previous survey at stations BAL03, BAL04, BAL33 and BAL42, situated in the vicinity of template D and A. On the other hand the TOM has increased at the reference station.
The highest concentrations of THC (24 ± 10 mg/kg), olefins (32 ± 14 mg/kg) and barium (1794 ± 814 mg/kg) are found in sediments from BAL09. Hydrocarbons, olefins and metals are contaminated at least down to 6 cm depth at this station.
The general picture of the Balder field is that the 250-500 m stations are contaminated with THC and olefins. The only exceptions are found for olefins in the main-current direction from well templates C and D, where traces of olefins are found out to 2000 and 1000 m respectively. The A270o- and B198o-axes are uncontaminated with THC and olefins. All stations located around well templates C and D are regarded as contaminated with barium. From well template B, the area contaminated with barium extends out to the outermost station in the main-current direction and out to 250 m on the B198o-axis. From well template A, stations contaminated with barium are found out to 500 m on the A180o-axis.
By comparing this year’s THC values with the recalculated 1997 THC results, the THC content at the well templates A, B, C and D axes are almost unchanged or reduced. The only exceptions are found at the two innermost stations on the D315o-axis where the THC content has increased somewhat. Compared to the 1997 olefin results, the contents of olefins have decreased at all stations. The largest reductions in olefin content (365-465 mg/kg) are seen at the stations with the highest content of olefins in 1997. The barium content has increased at the innermost stations on the B135o-, D135o- and D54o-axes and the two innermost stations on the C135o-axis. At the remaining stations the amount of barium is unchanged or reduced.
A relatively high variation in the number of individuals and taxa are registered at the stations. However, the faunal compositions in undisturbed sediments are relatively similar to that found at the neighbouring Ringhorne field. The stations at Balder are classified into three different faunal groups: station BAL37 is placed in group C (disturbed fauna), stations BAL03, BAL09, BAL28, BAL33 and BAL42 are placed in group B (slightly disturbed fauna) while the remaining stations are placed in group A (undisturbed fauna).
The stations in group B and C have relatively high abundance of the polychaete Chaetozone sp. and the bivalves Thyasira sarsi and T. flexuosa in some combinations. These taxa are known to be abundant in disturbed or organic enriched sediments. At station BAL37, Chaetozone sp. and T. sarsi are the two most dominant taxa and this station was separated from all other field stations in the multivariate analyses. The stations placed in group B has lower abundance of the taxa mentioned, but were separated from the remaining field stations in the multivariate analyses. In the cluster analysis, station BAL10 was grouped together with these stations, but the lack of the indicator taxa, and low levels of the measured chemical parameters, indicates that that station has undisturbed fauna. All group B and C stations are situated at 250 m distance from their respective centre and have relatively high levels of THC, olefins and barium, indicating that the faunal disturbance can be related to the petroleum activity at the templates.
In 1997 the classification of group B stations was based on relatively high abundance of the polychaete Capitella capitata. This indicator species is not recorded at any of the stations included in the present survey. On the other hand the indicator species recorded at disturbed stations in 2000 were absent or had very low individual numbers at the stations in 1997.
Compared with the previous survey the area of disturbed fauna has decreased around Template A, has decreased in area but increased in intensity around Template B, is similar around Template C and has increased in area around Template D.
The calculated minimum area and spatial extent of contaminated sediments at the Balder field is shown in Table 12-11 and Figure 12-16.
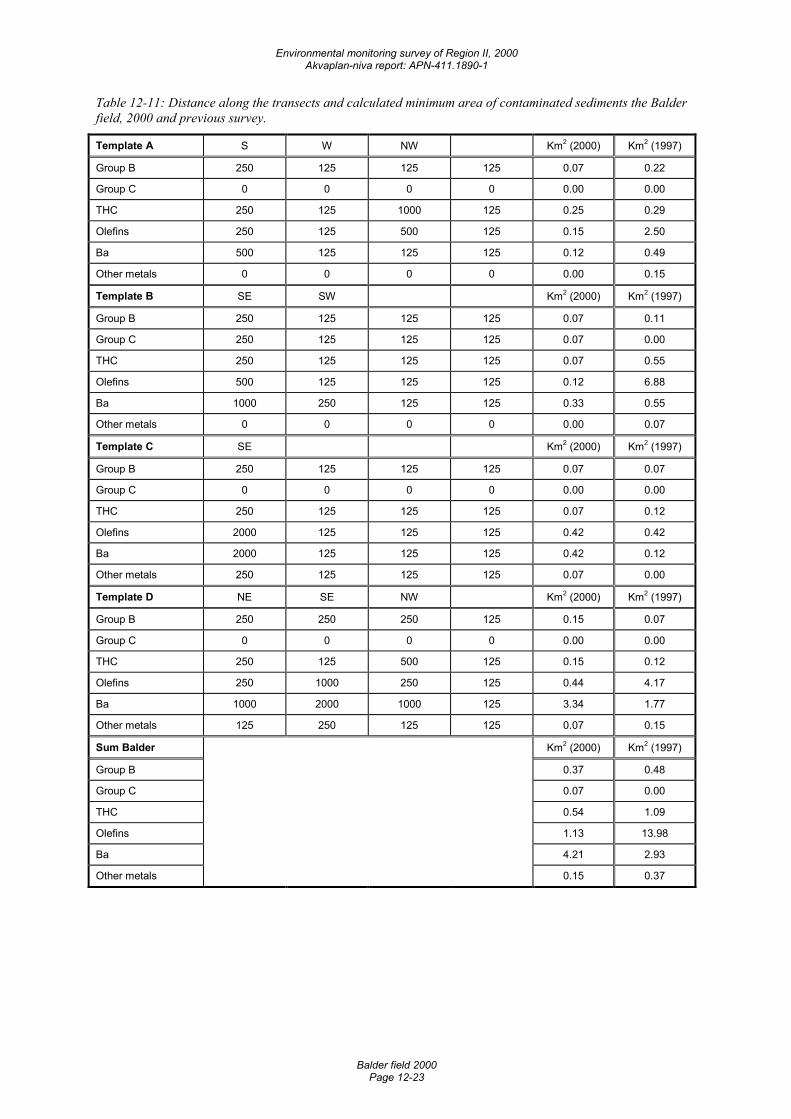
Environmental monitoring survey of Region II, 2000 Akvaplan-niva report: APN-411.1890-1
Balder field 2000 Page 12-23
Table 12-11: Distance along the transects and calculated minimum area of contaminated sediments the Balder field, 2000 and previous survey.
Template A S W NW Km2 (2000) Km2 (1997)
Group B 250 125 125 125 0.07 0.22
Group C 0 0 0 0 0.00 0.00
THC 250 125 1000 125 0.25 0.29
Olefins 250 125 500 125 0.15 2.50
Ba 500 125 125 125 0.12 0.49
Other metals 0 0 0 0 0.00 0.15
Template B SE SW Km2 (2000) Km2 (1997)
Group B 250 125 125 125 0.07 0.11
Group C 250 125 125 125 0.07 0.00
THC 250 125 125 125 0.07 0.55
Olefins 500 125 125 125 0.12 6.88
Ba 1000 250 125 125 0.33 0.55
Other metals 0 0 0 0 0.00 0.07
Template C SE Km2 (2000) Km2 (1997)
Group B 250 125 125 125 0.07 0.07
Group C 0 0 0 0 0.00 0.00
THC 250 125 125 125 0.07 0.12
Olefins 2000 125 125 125 0.42 0.42
Ba 2000 125 125 125 0.42 0.12
Other metals 250 125 125 125 0.07 0.00
Template D NE SE NW Km2 (2000) Km2 (1997)
Group B 250 250 250 125 0.15 0.07
Group C 0 0 0 0 0.00 0.00
THC 250 125 500 125 0.15 0.12
Olefins 250 1000 250 125 0.44 4.17
Ba 1000 2000 1000 125 3.34 1.77
Other metals 125 250 125 125 0.07 0.15
Sum Balder Km2 (2000) Km2 (1997)
Group B 0.37 0.48
Group C 0.07 0.00
THC 0.54 1.09
Olefins 1.13 13.98
Ba 4.21 2.93
Other metals 0.15 0.37
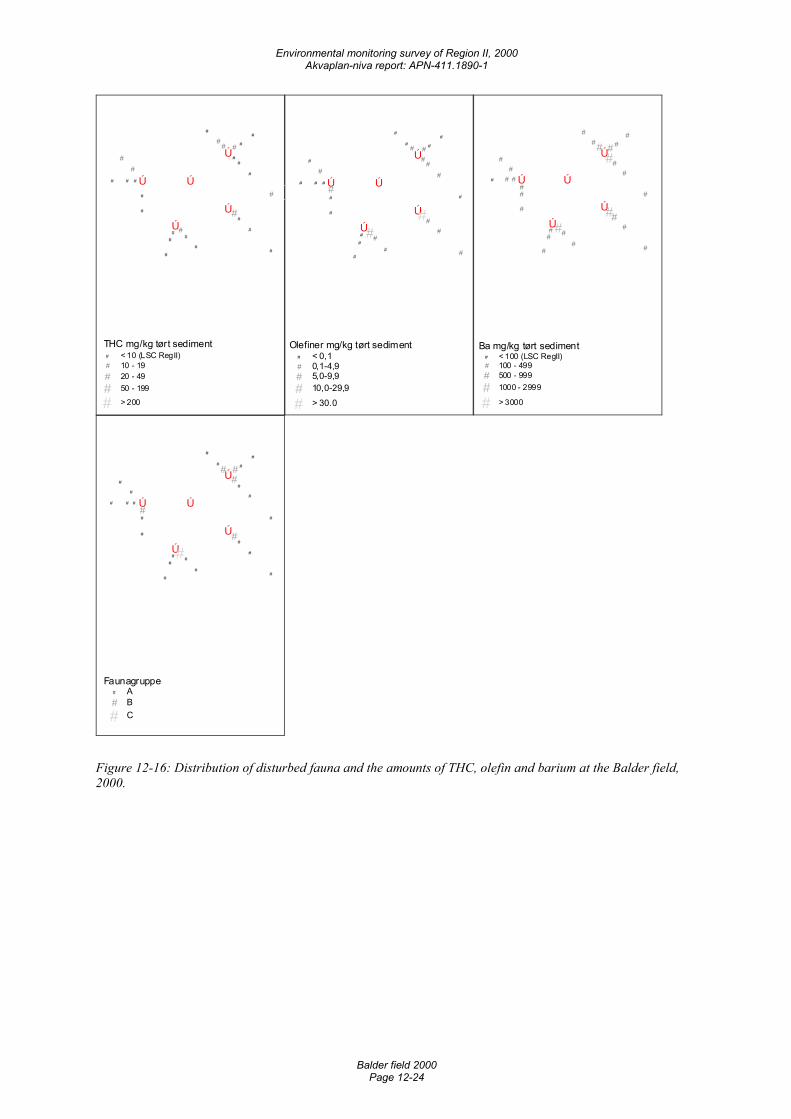
Environmental monitoring survey of Region II, 2000 Akvaplan-niva report: APN-411.1890-1
Balder field 2000 Page 12-24
Ú
Ú
Ú
Ú
Ú
##
#
##
#
#
#
#
#
###
##
#
#
##
#
##
#
#
#
#
#
#
#
THC mg/kg tørt sediment# < 10 (LSC RegII)# 10 - 19# 20 - 49
# 50 - 199
# > 200
Ú
Ú
Ú
Ú
Ú
##
#
##
#
#
#
#
#
###
##
#
#
##
#
##
#
##
#
#
#
Olefiner mg/kg tørt sediment# < 0,1# 0,1-4,9# 5,0-9,9# 10,0-29,9
# > 30.0
Ú
Ú
Ú
Ú
Ú
##
#
###
#
##
#
###
##
#
#
##
#
##
#
##
#
#
#
#
#
#
#
Ba mg/kg tørt sediment# < 100 (LSC RegII)# 100 - 499# 500 - 999
# 1000 - 2999
# > 3000
Ú
Ú
Ú
Ú
Ú
##
#
##
#
#
#
#
#
###
##
#
#
##
#
##
#
##
#
#
#
Faunagruppe# A# B
# C
Figure 12-16: Distribution of disturbed fauna and the amounts of THC, olefin and barium at the Balder field, 2000.
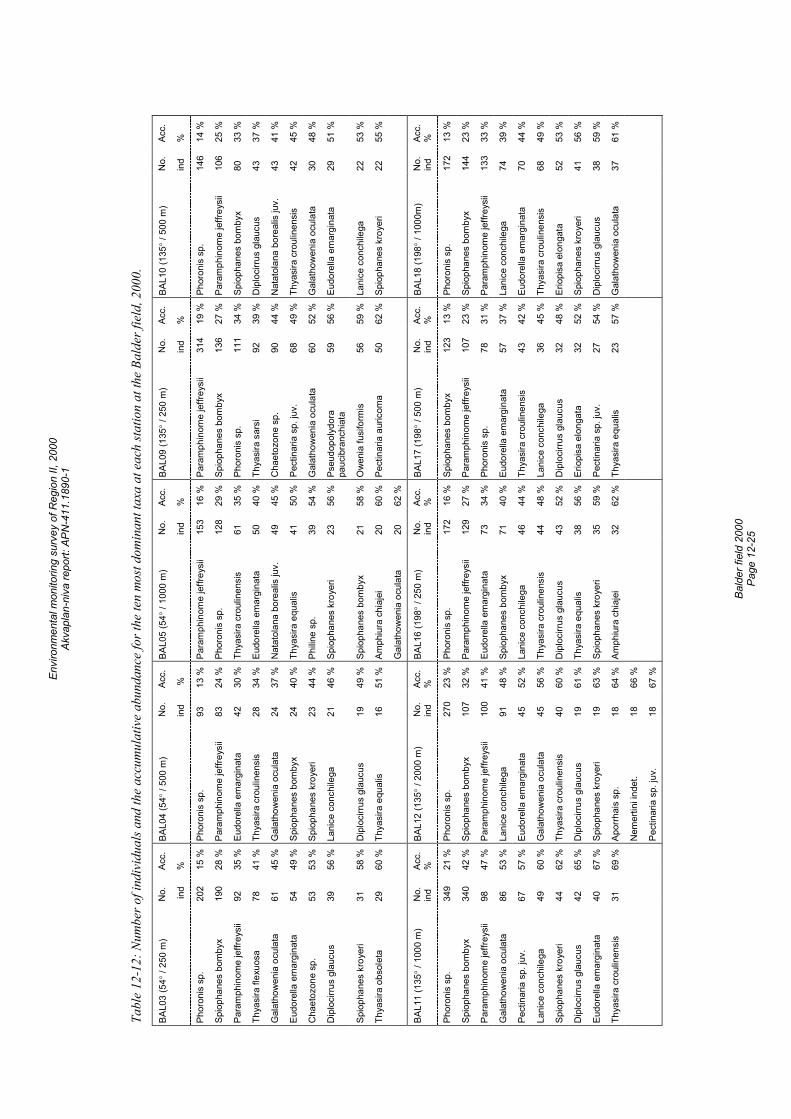
Envi
ronm
enta
l mon
itorin
g su
rvey
of R
egio
n II,
200
0 Ak
vapl
an-n
iva
repo
rt: A
PN-4
11.1
890-
1
Ba
lder
fiel
d 20
00
Page
12-
25
Tabl
e 12
-12:
Num
ber o
f ind
ivid
uals
and
the
accu
mul
ativ
e ab
unda
nce
for t
he te
n m
ost d
omin
ant t
axa
at e
ach
statio
n at
the
Bald
er fi
eld,
200
0.
BAL0
3 (5
4° /
250
m)
No.
ind
Acc.
%
BAL0
4 (5
4° /
500
m)
No.
ind
Acc.
%
BAL0
5 (5
4° /
1000
m)
No.
ind
Acc.
%
BAL0
9 (1
35°
/ 250
m)
No.
ind
Acc.
%
BAL1
0 (1
35°
/ 500
m)
No.
ind
Acc.
%
Phor
onis
sp.
20
2 15
%
Phor
onis
sp.
93
13
%
Para
mph
inom
e je
ffrey
sii
153
16 %
Pa
ram
phin
ome
jeffr
eysi
i 31
4 19
%
Phor
onis
sp.
14
6 14
%
Spio
phan
es b
omby
x 19
0 28
%
Para
mph
inom
e je
ffrey
sii
83
24 %
Ph
oron
is s
p.
128
29 %
Sp
ioph
anes
bom
byx
136
27 %
Pa
ram
phin
ome
jeffr
eysi
i 10
6 25
%
Para
mph
inom
e je
ffrey
sii
92
35 %
Eu
dore
lla e
mar
gina
ta
42
30 %
Th
yasi
ra c
roul
inen
sis
61
35 %
Ph
oron
is s
p.
111
34 %
Sp
ioph
anes
bom
byx
80
33 %
Thya
sira
flex
uosa
78
41
%
Thya
sira
cro
ulin
ensi
s 28
34
%
Eudo
rella
em
argi
nata
50
40
%
Thya
sira
sar
si
92
39 %
D
iplo
cirru
s gl
aucu
s 43
37
%
Gal
atho
wen
ia o
cula
ta
61
45 %
G
alat
how
enia
ocu
lata
24
37
%
Nat
atol
ana
bore
alis
juv.
49
45
%
Cha
etoz
one
sp.
90
44 %
N
atat
olan
a bo
real
is ju
v.
43
41 %
Eudo
rella
em
argi
nata
54
49
%
Spio
phan
es b
omby
x 24
40
%
Thya
sira
equ
alis
41
50
%
Pect
inar
ia s
p. ju
v.
68
49 %
Th
yasi
ra c
roul
inen
sis
42
45 %
Cha
etoz
one
sp.
53
53 %
Sp
ioph
anes
kro
yeri
23
44 %
Ph
iline
sp.
39
54 %
G
alat
how
enia
ocu
lata
60
52
%
Gal
atho
wen
ia o
cula
ta
30
48 %
Dip
loci
rrus
glau
cus
39
56 %
La
nice
con
chile
ga
21
46 %
Sp
ioph
anes
kro
yeri
23
56 %
Ps
eudo
poly
dora
pa
ucib
ranc
hiat
a 59
56
%
Eudo
rella
em
argi
nata
29
51
%
Spio
phan
es k
roye
ri 31
58
%
Dip
loci
rrus
glau
cus
19
49 %
Sp
ioph
anes
bom
byx
21
58 %
O
wen
ia fu
sifo
rmis
56
59
%
Lani
ce c
onch
ilega
22
53
%
Thya
sira
obs
olet
a 29
60
%
Thya
sira
equ
alis
16
51
%
Amph
iura
chi
ajei
20
60
%
Pect
inar
ia a
uric
oma
50
62 %
Sp
ioph
anes
kro
yeri
22
55 %
Gal
atho
wen
ia o
cula
ta
20
62 %
BAL1
1 (1
35°
/ 100
0 m
) N
o.
ind
Acc.
%
BA
L12
(135
° / 2
000
m)
No.
in
d Ac
c.
%
BAL1
6 (1
98°
/ 250
m)
No.
in
d Ac
c.
%
BAL1
7 (1
98°
/ 500
m)
No.
in
d Ac
c.
%
BAL1
8 (1
98°
/ 100
0m)
No.
in
d Ac
c.
%
Phor
onis
sp.
34
9 21
%
Phor
onis
sp.
27
0 23
%
Phor
onis
sp.
17
2 16
%
Spio
phan
es b
omby
x 12
3 13
%
Phor
onis
sp.
17
2 13
%
Spio
phan
es b
omby
x 34
0 42
%
Spio
phan
es b
omby
x 10
7 32
%
Para
mph
inom
e je
ffrey
sii
129
27 %
Pa
ram
phin
ome
jeffr
eysi
i 10
7 23
%
Spio
phan
es b
omby
x 14
4 23
%
Para
mph
inom
e je
ffrey
sii
98
47 %
Pa
ram
phin
ome
jeffr
eysi
i 10
0 41
%
Eudo
rella
em
argi
nata
73
34
%
Phor
onis
sp.
78
31
%
Para
mph
inom
e je
ffrey
sii
133
33 %
Gal
atho
wen
ia o
cula
ta
86
53 %
La
nice
con
chile
ga
91
48 %
Sp
ioph
anes
bom
byx
71
40 %
Eu
dore
lla e
mar
gina
ta
57
37 %
La
nice
con
chile
ga
74
39 %
Pect
inar
ia s
p. ju
v.
67
57 %
Eu
dore
lla e
mar
gina
ta
45
52 %
La
nice
con
chile
ga
46
44 %
Th
yasi
ra c
roul
inen
sis
43
42 %
Eu
dore
lla e
mar
gina
ta
70
44 %
Lani
ce c
onch
ilega
49
60
%
Gal
atho
wen
ia o
cula
ta
45
56 %
Th
yasi
ra c
roul
inen
sis
44
48 %
La
nice
con
chile
ga
36
45 %
Th
yasi
ra c
roul
inen
sis
68
49 %
Spio
phan
es k
roye
ri 44
62
%
Thya
sira
cro
ulin
ensi
s 40
60
%
Dip
loci
rrus
glau
cus
43
52 %
D
iplo
cirru
s gl
aucu
s 32
48
%
Erio
pisa
elo
ngat
a 52
53
%
Dip
loci
rrus
glau
cus
42
65 %
D
iplo
cirru
s gl
aucu
s 19
61
%
Thya
sira
equ
alis
38
56
%
Erio
pisa
elo
ngat
a 32
52
%
Spio
phan
es k
roye
ri 41
56
%
Eudo
rella
em
argi
nata
40
67
%
Spio
phan
es k
roye
ri 19
63
%
Spio
phan
es k
roye
ri 35
59
%
Pect
inar
ia s
p. ju
v.
27
54 %
D
iplo
cirru
s gl
aucu
s 38
59
%
Thya
sira
cro
ulin
ensi
s 31
69
%
Apor
rhai
s sp
. 18
64
%
Amph
iura
chi
ajei
32
62
%
Thya
sira
equ
alis
23
57
%
Gal
atho
wen
ia o
cula
ta
37
61 %
N
emer
tini i
ndet
. 18
66
%
Pe
ctin
aria
sp.
juv.
18
67
%
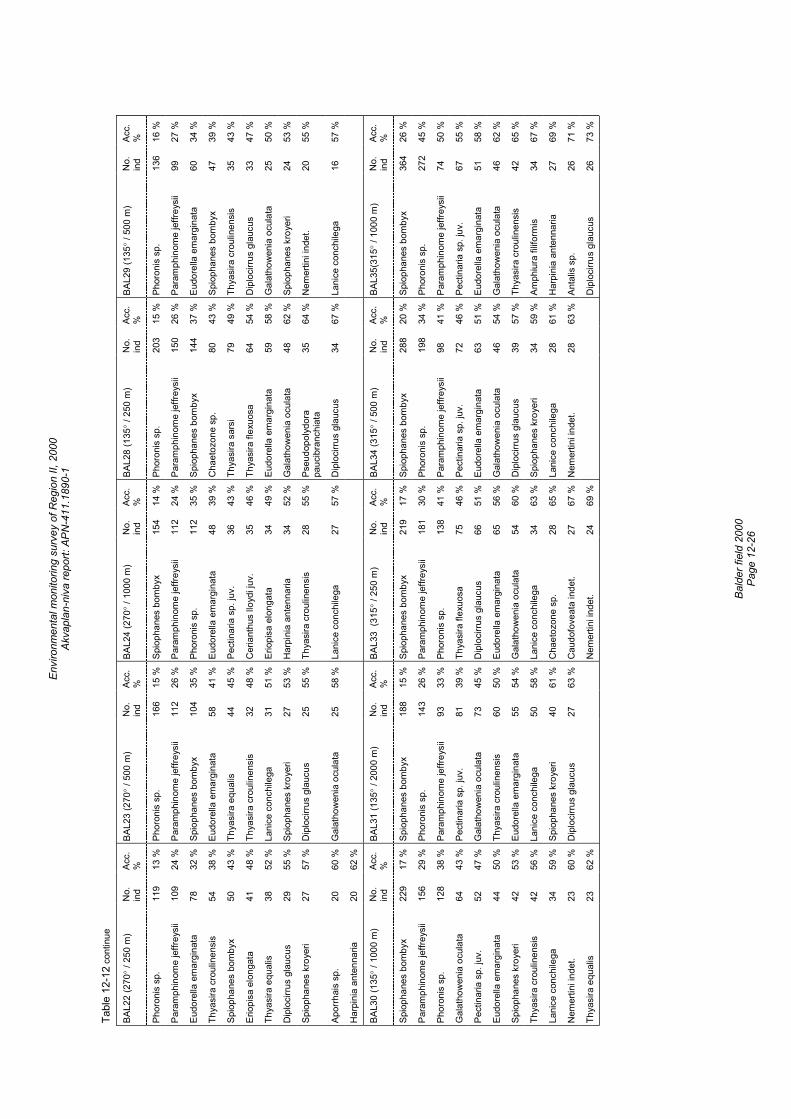
Envi
ronm
enta
l mon
itorin
g su
rvey
of R
egio
n II,
200
0 Ak
vapl
an-n
iva
repo
rt: A
PN-4
11.1
890-
1
Ba
lder
fiel
d 20
00
Page
12-
26
Tabl
e 12
-12
cont
inue
BAL2
2 (2
70°
/ 250
m)
No.
in
d Ac
c.
%
BAL2
3 (2
70°
/ 500
m)
No.
in
d Ac
c.
%
BAL2
4 (2
70°
/ 100
0 m
) N
o.
ind
Acc.
%
BA
L28
(135
° / 2
50 m
) N
o.
ind
Acc.
%
BA
L29
(135
° / 5
00 m
) N
o.
ind
Acc.
%
Phor
onis
sp.
11
9 13
%
Phor
onis
sp.
16
6 15
%
Spio
phan
es b
omby
x 15
4 14
%
Phor
onis
sp.
20
3 15
%
Phor
onis
sp.
13
6 16
%
Para
mph
inom
e je
ffrey
sii
109
24 %
Pa
ram
phin
ome
jeffr
eysi
i 11
2 26
%
Para
mph
inom
e je
ffrey
sii
112
24 %
Pa
ram
phin
ome
jeffr
eysi
i 15
0 26
%
Para
mph
inom
e je
ffrey
sii
99
27 %
Eudo
rella
em
argi
nata
78
32
%
Spio
phan
es b
omby
x 10
4 35
%
Phor
onis
sp.
11
2 35
%
Spio
phan
es b
omby
x 14
4 37
%
Eudo
rella
em
argi
nata
60
34
%
Thya
sira
cro
ulin
ensi
s 54
38
%
Eudo
rella
em
argi
nata
58
41
%
Eudo
rella
em
argi
nata
48
39
%
Cha
etoz
one
sp.
80
43 %
Sp
ioph
anes
bom
byx
47
39 %
Spio
phan
es b
omby
x 50
43
%
Thya
sira
equ
alis
44
45
%
Pect
inar
ia s
p. ju
v.
36
43 %
Th
yasi
ra s
arsi
79
49
%
Thya
sira
cro
ulin
ensi
s 35
43
%
Erio
pisa
elo
ngat
a 41
48
%
Thya
sira
cro
ulin
ensi
s 32
48
%
Cer
iant
hus
lloyd
i juv
. 35
46
%
Thya
sira
flex
uosa
64
54
%
Dip
loci
rrus
glau
cus
33
47 %
Thya
sira
equ
alis
38
52
%
Lani
ce c
onch
ilega
31
51
%
Erio
pisa
elo
ngat
a 34
49
%
Eudo
rella
em
argi
nata
59
58
%
Gal
atho
wen
ia o
cula
ta
25
50 %
Dip
loci
rrus
glau
cus
29
55 %
Sp
ioph
anes
kro
yeri
27
53 %
H
arpi
nia
ante
nnar
ia
34
52 %
G
alat
how
enia
ocu
lata
48
62
%
Spio
phan
es k
roye
ri 24
53
%
Spio
phan
es k
roye
ri 27
57
%
Dip
loci
rrus
glau
cus
25
55 %
Th
yasi
ra c
roul
inen
sis
28
55 %
Ps
eudo
poly
dora
pa
ucib
ranc
hiat
a 35
64
%
Nem
ertin
i ind
et.
20
55 %
Apor
rhai
s sp
. 20
60
%
Gal
atho
wen
ia o
cula
ta
25
58 %
La
nice
con
chile
ga
27
57 %
D
iplo
cirru
s gl
aucu
s 34
67
%
Lani
ce c
onch
ilega
16
57
%
Har
pini
a an
tenn
aria
20
62
%
BAL3
0 (1
35°
/ 100
0 m
) N
o.
ind
Acc.
%
BA
L31
(135
° / 2
000
m)
No.
in
d Ac
c.
%
BAL3
3 (3
15° /
250
m)
No.
in
d Ac
c.
%
BAL3
4 (3
15°
/ 500
m)
No.
in
d Ac
c.
%
BAL3
5(31
5° /
1000
m)
No.
in
d Ac
c.
%
Spio
phan
es b
omby
x 22
9 17
%
Spio
phan
es b
omby
x 18
8 15
%
Spio
phan
es b
omby
x 21
9 17
%
Spio
phan
es b
omby
x 28
8 20
%
Spio
phan
es b
omby
x 36
4 26
%
Para
mph
inom
e je
ffrey
sii
156
29 %
Ph
oron
is s
p.
143
26 %
Pa
ram
phin
ome
jeffr
eysi
i 18
1 30
%
Phor
onis
sp.
19
8 34
%
Phor
onis
sp.
27
2 45
%
Phor
onis
sp.
12
8 38
%
Para
mph
inom
e je
ffrey
sii
93
33 %
Ph
oron
is s
p.
138
41 %
Pa
ram
phin
ome
jeffr
eysi
i 98
41
%
Para
mph
inom
e je
ffrey
sii
74
50 %
Gal
atho
wen
ia o
cula
ta
64
43 %
Pe
ctin
aria
sp.
juv.
81
39
%
Thya
sira
flex
uosa
75
46
%
Pect
inar
ia s
p. ju
v.
72
46 %
Pe
ctin
aria
sp.
juv.
67
55
%
Pect
inar
ia s
p. ju
v.
52
47 %
G
alat
how
enia
ocu
lata
73
45
%
Dip
loci
rrus
glau
cus
66
51 %
Eu
dore
lla e
mar
gina
ta
63
51 %
Eu
dore
lla e
mar
gina
ta
51
58 %
Eudo
rella
em
argi
nata
44
50
%
Thya
sira
cro
ulin
ensi
s 60
50
%
Eudo
rella
em
argi
nata
65
56
%
Gal
atho
wen
ia o
cula
ta
46
54 %
G
alat
how
enia
ocu
lata
46
62
%
Spio
phan
es k
roye
ri 42
53
%
Eudo
rella
em
argi
nata
55
54
%
Gal
atho
wen
ia o
cula
ta
54
60 %
D
iplo
cirru
s gl
aucu
s 39
57
%
Thya
sira
cro
ulin
ensi
s 42
65
%
Thya
sira
cro
ulin
ensi
s 42
56
%
Lani
ce c
onch
ilega
50
58
%
Lani
ce c
onch
ilega
34
63
%
Spio
phan
es k
roye
ri 34
59
%
Amph
iura
filif
orm
is
34
67 %
Lani
ce c
onch
ilega
34
59
%
Spio
phan
es k
roye
ri 40
61
%
Cha
etoz
one
sp.
28
65 %
La
nice
con
chile
ga
28
61 %
H
arpi
nia
ante
nnar
ia
27
69 %
Nem
ertin
i ind
et.
23
60 %
D
iplo
cirru
s gl
aucu
s 27
63
%
Cau
dofo
veat
a in
det.
27
67 %
N
emer
tini i
ndet
. 28
63
%
Anta
lis s
p.
26
71 %
Thya
sira
equ
alis
23
62
%
N
emer
tini i
ndet
. 24
69
%
D
iplo
cirru
s gl
aucu
s 26
73
%
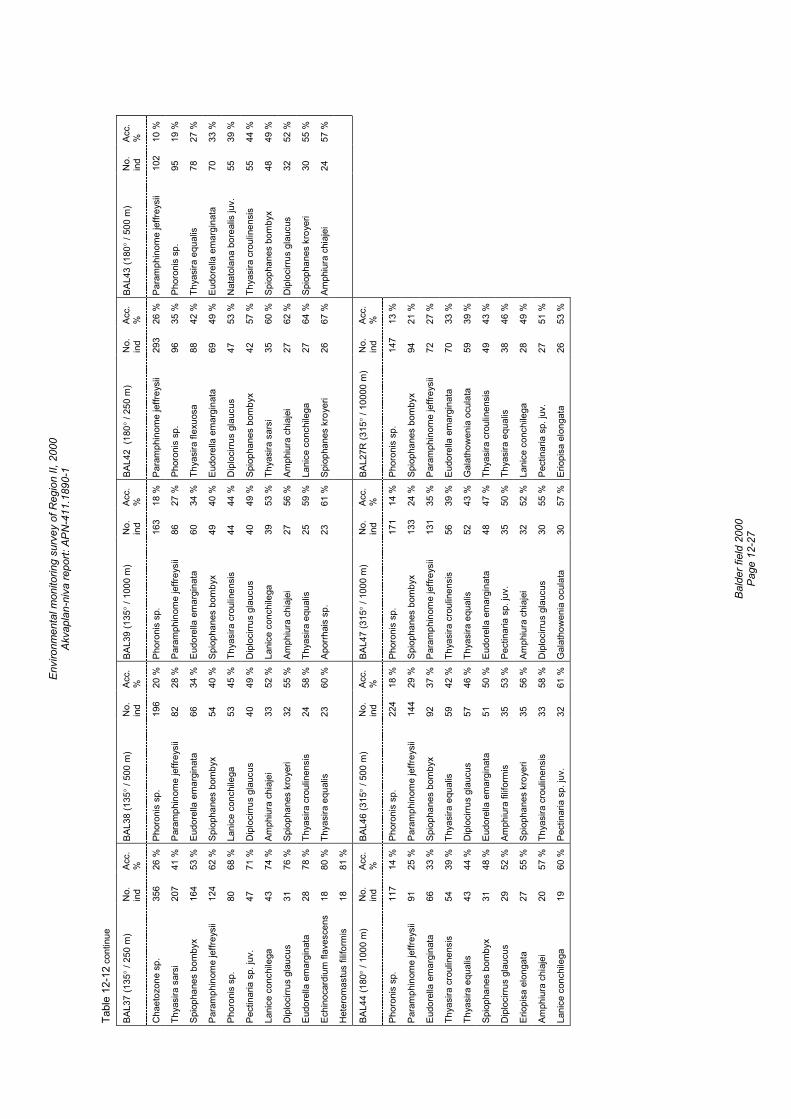
Envi
ronm
enta
l mon
itorin
g su
rvey
of R
egio
n II,
200
0 Ak
vapl
an-n
iva
repo
rt: A
PN-4
11.1
890-
1
Ba
lder
fiel
d 20
00
Page
12-
27
Tabl
e 12
-12
cont
inue
BAL3
7 (1
35°
/ 250
m)
No.
in
d Ac
c.
%
BAL3
8 (1
35°
/ 500
m)
No.
in
d Ac
c.
%
BAL3
9 (1
35°
/ 100
0 m
) N
o.
ind
Acc.
%
BA
L42
(180
° / 2
50 m
) N
o.
ind
Acc.
%
BA
L43
(180
° / 5
00 m
) N
o.
ind
Acc.
%
Cha
etoz
one
sp.
356
26 %
Ph
oron
is s
p.
196
20 %
Ph
oron
is s
p.
163
18 %
Pa
ram
phin
ome
jeffr
eysi
i 29
3 26
%
Para
mph
inom
e je
ffrey
sii
102
10 %
Thya
sira
sar
si
207
41 %
Pa
ram
phin
ome
jeffr
eysi
i 82
28
%
Para
mph
inom
e je
ffrey
sii
86
27 %
Ph
oron
is s
p.
96
35 %
Ph
oron
is s
p.
95
19 %
Spio
phan
es b
omby
x 16
4 53
%
Eudo
rella
em
argi
nata
66
34
%
Eudo
rella
em
argi
nata
60
34
%
Thya
sira
flex
uosa
88
42
%
Thya
sira
equ
alis
78
27
%
Para
mph
inom
e je
ffrey
sii
124
62 %
Sp
ioph
anes
bom
byx
54
40 %
Sp
ioph
anes
bom
byx
49
40 %
Eu
dore
lla e
mar
gina
ta
69
49 %
Eu
dore
lla e
mar
gina
ta
70
33 %
Phor
onis
sp.
80
68
%
Lani
ce c
onch
ilega
53
45
%
Thya
sira
cro
ulin
ensi
s 44
44
%
Dip
loci
rrus
glau
cus
47
53 %
N
atat
olan
a bo
real
is ju
v.
55
39 %
Pect
inar
ia s
p. ju
v.
47
71 %
D
iplo
cirru
s gl
aucu
s 40
49
%
Dip
loci
rrus
glau
cus
40
49 %
Sp
ioph
anes
bom
byx
42
57 %
Th
yasi
ra c
roul
inen
sis
55
44 %
Lani
ce c
onch
ilega
43
74
%
Amph
iura
chi
ajei
33
52
%
Lani
ce c
onch
ilega
39
53
%
Thya
sira
sar
si
35
60 %
Sp
ioph
anes
bom
byx
48
49 %
Dip
loci
rrus
glau
cus
31
76 %
Sp
ioph
anes
kro
yeri
32
55 %
Am
phiu
ra c
hiaj
ei
27
56 %
Am
phiu
ra c
hiaj
ei
27
62 %
D
iplo
cirru
s gl
aucu
s 32
52
%
Eudo
rella
em
argi
nata
28
78
%
Thya
sira
cro
ulin
ensi
s 24
58
%
Thya
sira
equ
alis
25
59
%
Lani
ce c
onch
ilega
27
64
%
Spio
phan
es k
roye
ri 30
55
%
Echi
noca
rdiu
m fl
aves
cens
18
80
%
Thya
sira
equ
alis
23
60
%
Apor
rhai
s sp
. 23
61
%
Spio
phan
es k
roye
ri 26
67
%
Amph
iura
chi
ajei
24
57
%
Het
erom
astu
s fil
iform
is
18
81 %
BAL4
4 (1
80°
/ 100
0 m
) N
o.
ind
Acc.
%
BA
L46
(315
° / 5
00 m
) N
o.
ind
Acc.
%
BA
L47
(315
° / 1
000
m)
No.
in
d Ac
c.
%
BAL2
7R (3
15° /
100
00 m
) N
o.
ind
Acc.
%
Phor
onis
sp.
11
7 14
%
Phor
onis
sp.
22
4 18
%
Phor
onis
sp.
17
1 14
%
Phor
onis
sp.
14
7 13
%
Para
mph
inom
e je
ffrey
sii
91
25 %
Pa
ram
phin
ome
jeffr
eysi
i 14
4 29
%
Spio
phan
es b
omby
x 13
3 24
%
Spio
phan
es b
omby
x 94
21
%
Eudo
rella
em
argi
nata
66
33
%
Spio
phan
es b
omby
x 92
37
%
Para
mph
inom
e je
ffrey
sii
131
35 %
Pa
ram
phin
ome
jeffr
eysi
i 72
27
%
Thya
sira
cro
ulin
ensi
s 54
39
%
Thya
sira
equ
alis
59
42
%
Thya
sira
cro
ulin
ensi
s 56
39
%
Eudo
rella
em
argi
nata
70
33
%
Thya
sira
equ
alis
43
44
%
Dip
loci
rrus
glau
cus
57
46 %
Th
yasi
ra e
qual
is
52
43 %
G
alat
how
enia
ocu
lata
59
39
%
Spio
phan
es b
omby
x 31
48
%
Eudo
rella
em
argi
nata
51
50
%
Eudo
rella
em
argi
nata
48
47
%
Thya
sira
cro
ulin
ensi
s 49
43
%
Dip
loci
rrus
glau
cus
29
52 %
Am
phiu
ra fi
lifor
mis
35
53
%
Pect
inar
ia s
p. ju
v.
35
50 %
Th
yasi
ra e
qual
is
38
46 %
Erio
pisa
elo
ngat
a 27
55
%
Spio
phan
es k
roye
ri 35
56
%
Amph
iura
chi
ajei
32
52
%
Lani
ce c
onch
ilega
28
49
%
Amph
iura
chi
ajei
20
57
%
Thya
sira
cro
ulin
ensi
s 33
58
%
Dip
loci
rrus
glau
cus
30
55 %
Pe
ctin
aria
sp.
juv.
27
51
%
Lani
ce c
onch
ilega
19
60
%
Pect
inar
ia s
p. ju
v.
32
61 %
G
alat
how
enia
ocu
lata
30
57
%
Erio
pisa
elo
ngat
a 26
53
%
Envi
ronm
enta
l mon
itorin
g su
rvey
of R
egio
n II,
200
0 Ak
vapl
an-n
iva
repo
rt: A
PN-4
11.1
890-
1
Ba
lder
fiel
d 20
00
Page
12-
28
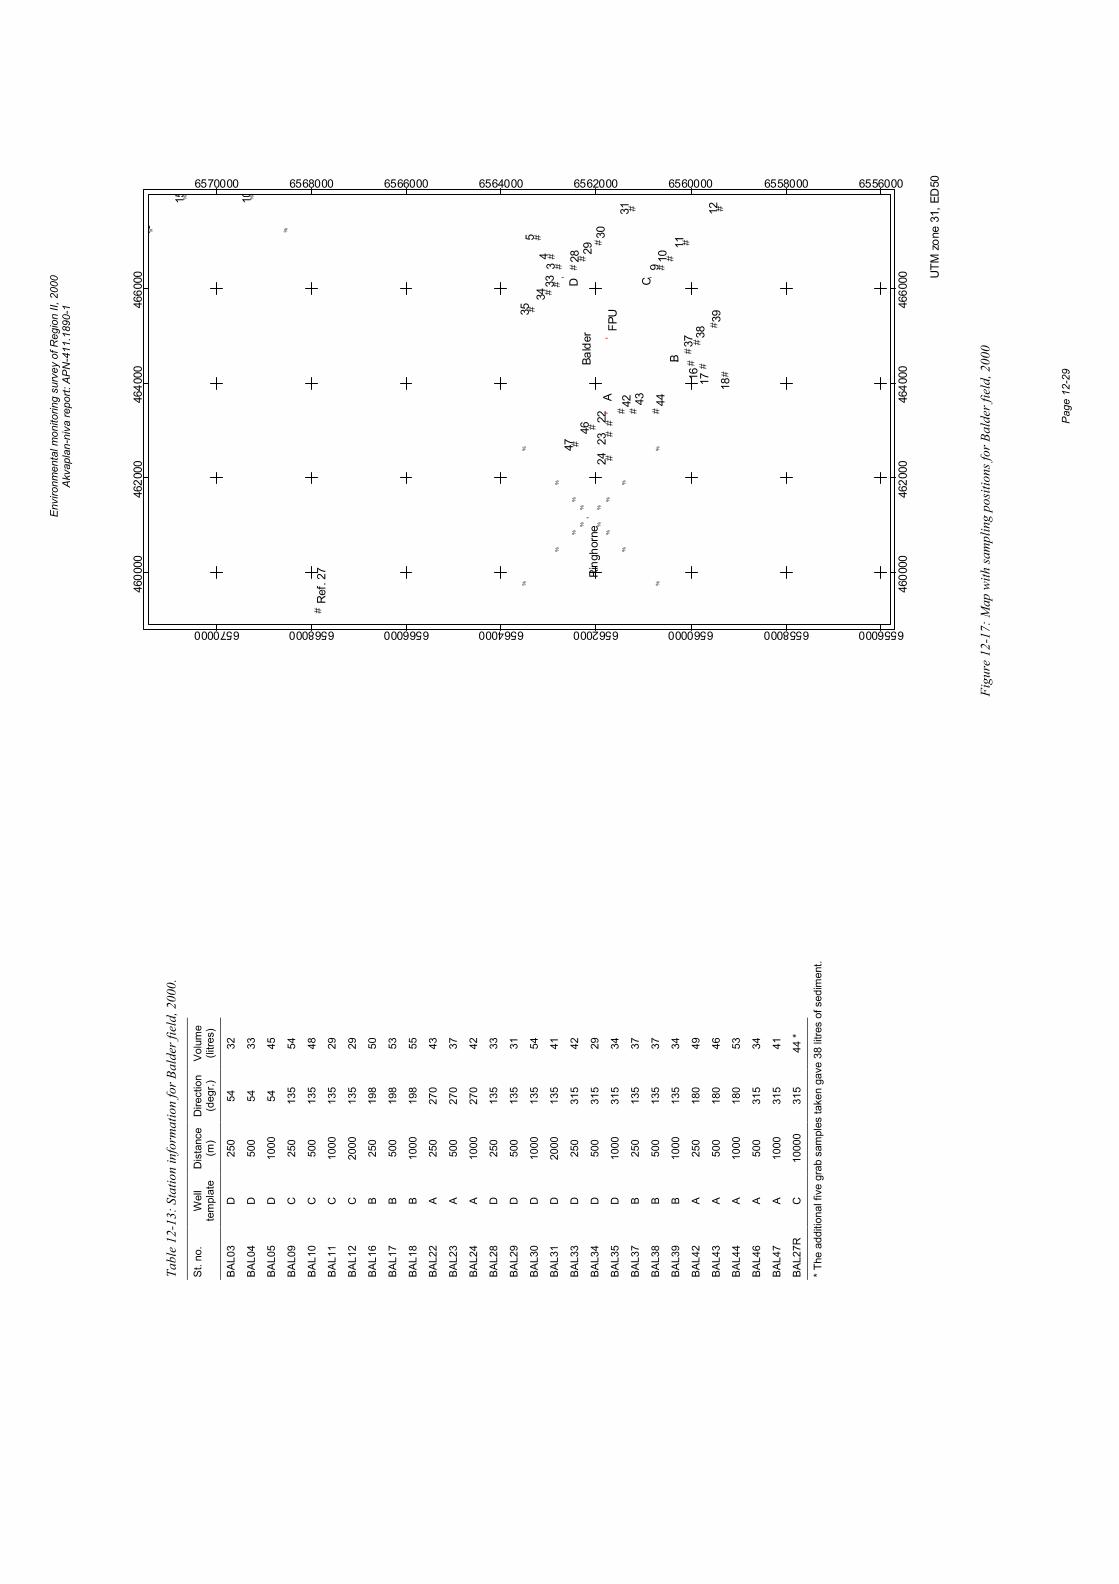
Envi
ronm
enta
l mon
itorin
g su
rvey
of R
egio
n II,
200
0 Ak
vapl
an-n
iva
repo
rt: A
PN-4
11.1
890-
1
Pa
ge 1
2-29
##
#
##
#
#
# #
#
##
#
##
#
#
##
#
##
#
# # #
#
#
#
%
%%
%
%
%
%
%%
%
%
%
%
%
%
%
%
%
%
%
'
'
''
'
'
34
5
910
11
12
16 17 18
2223
24
2829
30
31
3334
35
3738
39
42 43 44
4647
1015
16
Ref
. 27
FPU
D C
B
A
Bald
erR
ingh
orne
UTM
zon
e 31
, ED
50
4600
00
4600
00
4620
00
4620
00
4640
00
4640
00
4660
00
4660
00
6556000
6556000
6558000
6558000
6560000
6560000
6562000
6562000
6564000
6564000
6566000
6566000
6568000
6568000
6570000
6570000
Figu
re 1
2-17
: Map
with
sam
plin
g po
sitio
ns fo
r Bal
der f
ield
, 200
0
Tabl
e 12
-13:
Sta
tion
info
rmat
ion
for B
alde
r fie
ld, 2
000.
St. n
o.
Wel
l te
mpl
ate
Dis
tanc
e (m
) D
irect
ion
(deg
r.)
Volu
me
(litre
s)
BAL0
3 D
25
0 54
32
BAL0
4 D
50
0 54
33
BAL0
5 D
10
00
54
45
BAL0
9 C
25
0 13
5 54
BAL1
0 C
50
0 13
5 48
BAL1
1 C
10
00
135
29
BAL1
2 C
20
00
135
29
BAL1
6 B
250
198
50
BAL1
7 B
500
198
53
BAL1
8 B
1000
19
8 55
BAL2
2 A
250
270
43
BAL2
3 A
500
270
37
BAL2
4 A
1000
27
0 42
BAL2
8 D
25
0 13
5 33
BAL2
9 D
50
0 13
5 31
BAL3
0 D
10
00
135
54
BAL3
1 D
20
00
135
41
BAL3
3 D
25
0 31
5 42
BAL3
4 D
50
0 31
5 29
BAL3
5 D
10
00
315
34
BAL3
7 B
250
135
37
BAL3
8 B
500
135
37
BAL3
9 B
1000
13
5 34
BAL4
2 A
250
180
49
BAL4
3 A
500
180
46
BAL4
4 A
1000
18
0 53
BAL4
6 A
500
315
34
BAL4
7 A
1000
31
5 41
BAL2
7R
C
1000
0 31
5 44
*
* The
add
ition
al fi
ve g
rab
sam
ples
take
n ga
ve 3
8 lit
res
of s
edim
ent.

Envi
ronm
enta
l mon
itorin
g su
rvey
of R
egio
n II,
200
0 Ak
vapl
an-n
iva
repo
rt: A
PN-4
11.1
890-
1
Pa
ge 1
2-30
Environmental monitoring survey of Region II, 2000 Akvaplan-niva report: APN-411.1890-1
Jotun field 2000 Page 13-1
13 Jotun field 13.1 Introduction The Jotun field is located in Block 25/7 and 25/8 in the middle part of Region II, situated north of the Ringhorne and Balder field. Since 1970 there has been drilled 9 exploration wells, all with water based drilling mud, in the Jotun field, - six wells were drilled after 1992. Production drilling started in March 1999.
The centre positions have been changed since the baseline survey carried out in 1996 (approximately 400 m NNW) and new transects and station positions are established around Jotun B. The reference station is at the same position as in 1996. There are two installations at the Jotun field, Jotun A (production ship) and Jotun B (well head platform). Data on recent drilling and discharges are given in Table 13-1.
In 1996, sediments at Jotun revealed low hydrocarbon levels that were comparable with levels found in earlier baseline studies of the area (Jensen et al. 1997). However, according to the North Sea Quality Status Report of 1993 these levels were a little elevated compared to the average hydrocarbon level of the North Sea. Also the levels of selected metals were in general low at Jotun in 1996, except from elevated barium levels in sediments at two stations in the periphery relative to Jotun B. The fauna was found to be undisturbed.
Information on the sampling stations is shown in Figure 13-13 and Table 13-13, both on the foldout page at the end of this chapter (page 13-21).
Table 13-1: Summary of recent wells drilled and operational and accidental discharges at the Jotun field (discharges in tonnes).
1999 2000 Comments
No of wells drilled 5 5
Barite 834 850 Barite in water based mud (WBM)
Cuttings 1694 1700 Cuttings with WBM
Water-based drilling mud 7463 7450 Only WBM discharge to sea
Cementing and other chemicals 8,26 8,25 Reinjected
Oil in produced water 25,1* *= 31,2 ppm × 805960 Sm3
Accidental discharges 0 30 litres Oil based mud
13.2 Results and discussion
13.2.1 Physical characteristics The median phi value and the amount (%) of pelite, fine sand and total organic material (TOM) in the sediment from the present and previous surveys shown in Table 13-2 and Figure 13-1. Detailed data on sediment characteristics such as colour, smell and a full set of analytical data, including TOM content and grain size distribution (with standard deviation, evenness and kurtosis) can be found in the Appendix.
The sediments in the Jotun field are classified as silt with median values varying from 4.23 (JOT08) to 4.45 (JOT09). The amount of pelite in the sediment varies from 17.6 % (JOT01) to 21.6 % (JOT15), the fine sand from 78.0 % (JOT15) to 81.1 % (JOT01) while the TOM varies from 2.1 % (JOT09) to 2.9 % (JOT10). The corresponding values at the reference station JOT30R are within the variation at the field stations.
The pelite and TOM values are somewhat higher than those found at the neighbouring Heimdal and Ringhorne fields. The TOM values are somewhat higher than those found in the baseline survey in 1996.
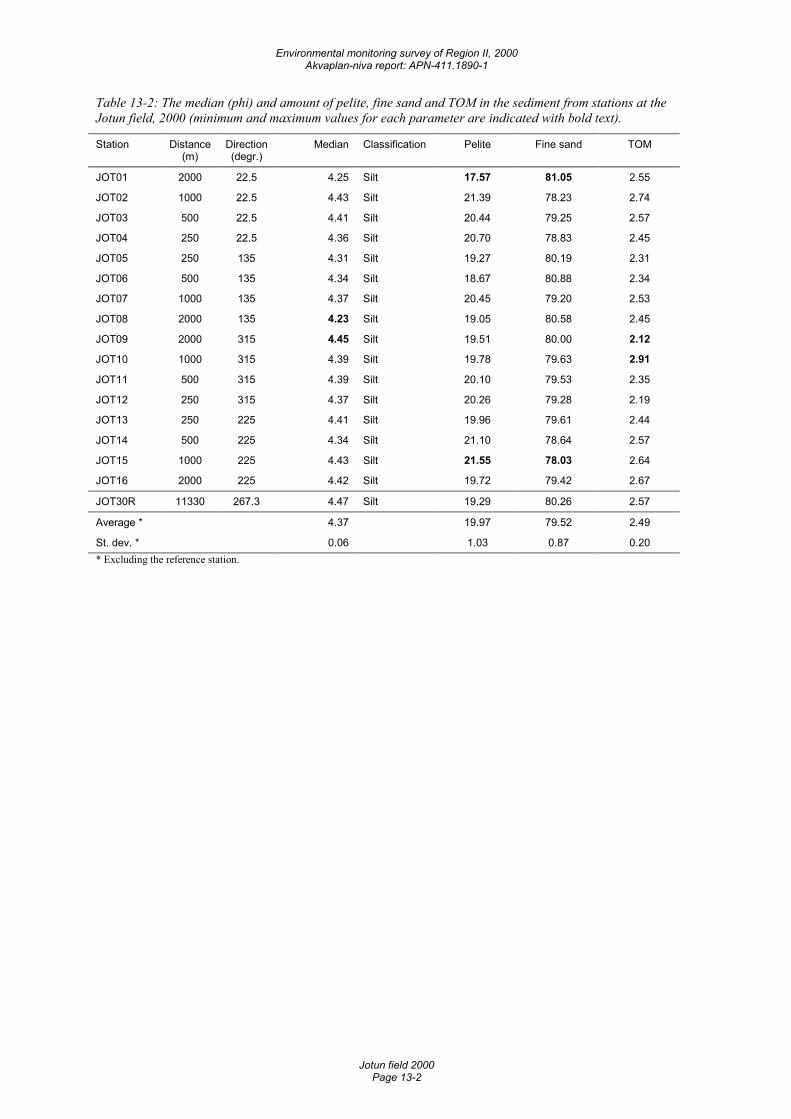
Environmental monitoring survey of Region II, 2000 Akvaplan-niva report: APN-411.1890-1
Jotun field 2000 Page 13-2
Table 13-2: The median (phi) and amount of pelite, fine sand and TOM in the sediment from stations at the Jotun field, 2000 (minimum and maximum values for each parameter are indicated with bold text).
Station Distance (m)
Direction (degr.)
Median Classification Pelite Fine sand TOM
JOT01 2000 22.5 4.25 Silt 17.57 81.05 2.55
JOT02 1000 22.5 4.43 Silt 21.39 78.23 2.74
JOT03 500 22.5 4.41 Silt 20.44 79.25 2.57
JOT04 250 22.5 4.36 Silt 20.70 78.83 2.45
JOT05 250 135 4.31 Silt 19.27 80.19 2.31
JOT06 500 135 4.34 Silt 18.67 80.88 2.34
JOT07 1000 135 4.37 Silt 20.45 79.20 2.53
JOT08 2000 135 4.23 Silt 19.05 80.58 2.45
JOT09 2000 315 4.45 Silt 19.51 80.00 2.12
JOT10 1000 315 4.39 Silt 19.78 79.63 2.91
JOT11 500 315 4.39 Silt 20.10 79.53 2.35
JOT12 250 315 4.37 Silt 20.26 79.28 2.19
JOT13 250 225 4.41 Silt 19.96 79.61 2.44
JOT14 500 225 4.34 Silt 21.10 78.64 2.57
JOT15 1000 225 4.43 Silt 21.55 78.03 2.64
JOT16 2000 225 4.42 Silt 19.72 79.42 2.67
JOT30R 11330 267.3 4.47 Silt 19.29 80.26 2.57
Average * 4.37 19.97 79.52 2.49
St. dev. * 0.06 1.03 0.87 0.20 * Excluding the reference station.
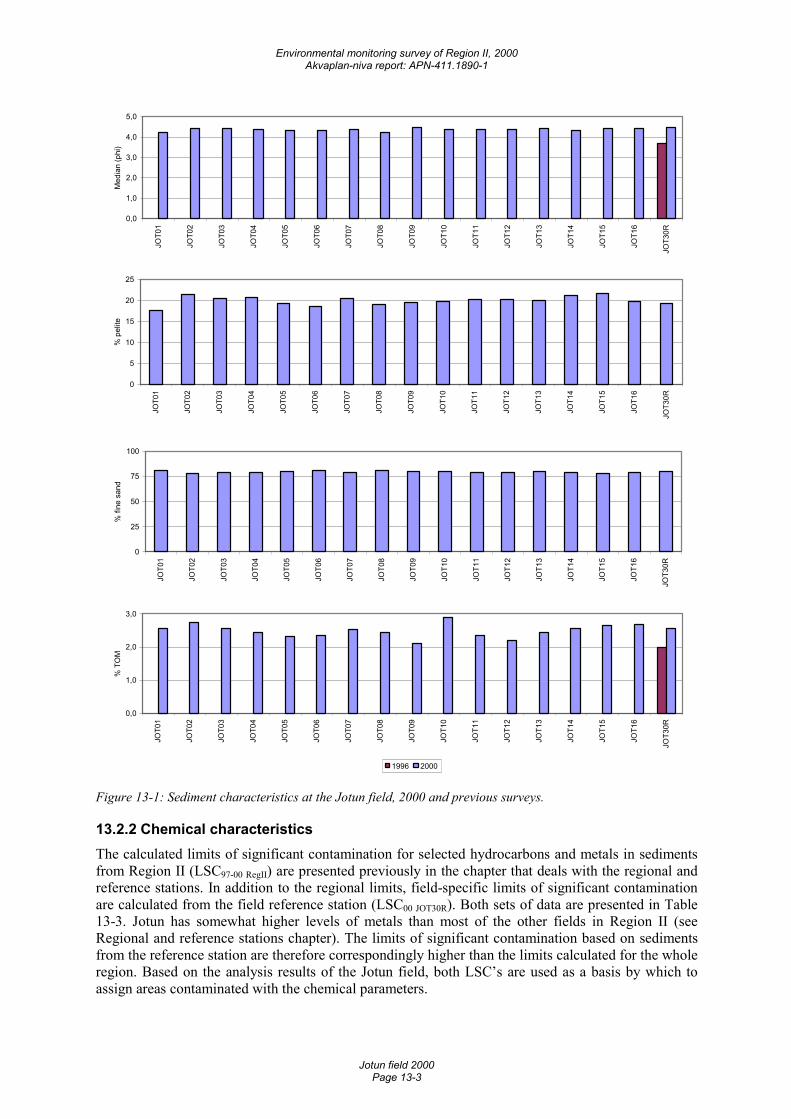
Environmental monitoring survey of Region II, 2000 Akvaplan-niva report: APN-411.1890-1
Jotun field 2000 Page 13-3
0,0
1,0
2,0
3,0
4,0
5,0
JOT0
1
JOT0
2
JOT0
3
JOT0
4
JOT0
5
JOT0
6
JOT0
7
JOT0
8
JOT0
9
JOT1
0
JOT1
1
JOT1
2
JOT1
3
JOT1
4
JOT1
5
JOT1
6
JOT3
0R
Med
ian
(phi
)
0
5
10
15
20
25
JOT0
1
JOT0
2
JOT0
3
JOT0
4
JOT0
5
JOT0
6
JOT0
7
JOT0
8
JOT0
9
JOT1
0
JOT1
1
JOT1
2
JOT1
3
JOT1
4
JOT1
5
JOT1
6
JOT3
0R
% p
elite
0
25
50
75
100
JOT0
1
JOT0
2
JOT0
3
JOT0
4
JOT0
5
JOT0
6
JOT0
7
JOT0
8
JOT0
9
JOT1
0
JOT1
1
JOT1
2
JOT1
3
JOT1
4
JOT1
5
JOT1
6
JOT3
0R
% fi
ne s
and
0,0
1,0
2,0
3,0
JOT0
1
JOT0
2
JOT0
3
JOT0
4
JOT0
5
JOT0
6
JOT0
7
JOT0
8
JOT0
9
JOT1
0
JOT1
1
JOT1
2
JOT1
3
JOT1
4
JOT1
5
JOT1
6
JOT3
0R
% T
OM
1996 2000
Figure 13-1: Sediment characteristics at the Jotun field, 2000 and previous surveys.
13.2.2 Chemical characteristics The calculated limits of significant contamination for selected hydrocarbons and metals in sediments from Region II (LSC97-00 RegII) are presented previously in the chapter that deals with the regional and reference stations. In addition to the regional limits, field-specific limits of significant contamination are calculated from the field reference station (LSC00 JOT30R). Both sets of data are presented in Table 13-3. Jotun has somewhat higher levels of metals than most of the other fields in Region II (see Regional and reference stations chapter). The limits of significant contamination based on sediments from the reference station are therefore correspondingly higher than the limits calculated for the whole region. Based on the analysis results of the Jotun field, both LSC’s are used as a basis by which to assign areas contaminated with the chemical parameters.
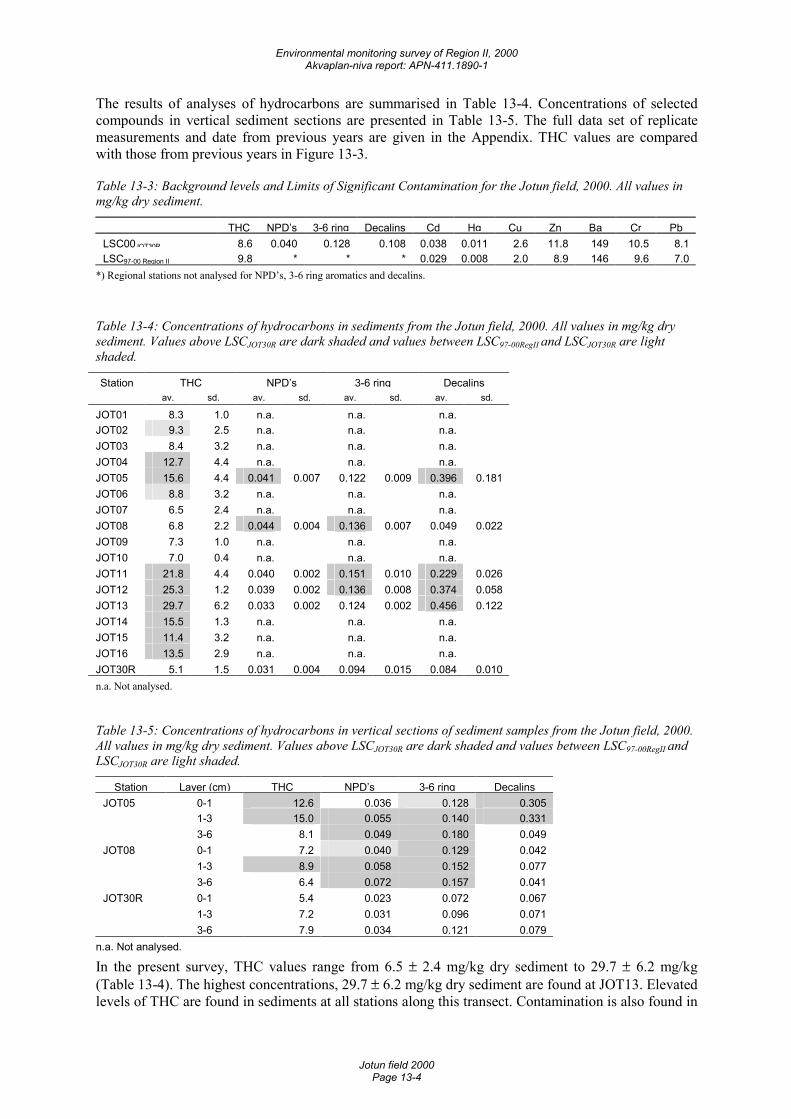
Environmental monitoring survey of Region II, 2000 Akvaplan-niva report: APN-411.1890-1
Jotun field 2000 Page 13-4
The results of analyses of hydrocarbons are summarised in Table 13-4. Concentrations of selected compounds in vertical sediment sections are presented in Table 13-5. The full data set of replicate measurements and date from previous years are given in the Appendix. THC values are compared with those from previous years in Figure 13-3.
Table 13-3: Background levels and Limits of Significant Contamination for the Jotun field, 2000. All values in mg/kg dry sediment.
THC NPD’s 3-6 ring Decalins Cd Hg Cu Zn Ba Cr PbLSC00JOT30R 8.6 0.040 0.128 0.108 0.038 0.011 2.6 11.8 149 10.5 8.1LSC97-00 Region II 9.8 * * * 0.029 0.008 2.0 8.9 146 9.6 7.0
*) Regional stations not analysed for NPD’s, 3-6 ring aromatics and decalins.
Table 13-4: Concentrations of hydrocarbons in sediments from the Jotun field, 2000. All values in mg/kg dry sediment. Values above LSCJOT30R are dark shaded and values between LSC97-00RegII and LSCJOT30R are light shaded.
Station THC NPD’s 3-6 ring Decalins av. sd. av. sd. av. sd. av. sd.
JOT01 8.3 1.0 n.a. n.a. n.a.JOT02 9.3 2.5 n.a. n.a. n.a.JOT03 8.4 3.2 n.a. n.a. n.a.JOT04 12.7 4.4 n.a. n.a. n.a.JOT05 15.6 4.4 0.041 0.007 0.122 0.009 0.396 0.181JOT06 8.8 3.2 n.a. n.a. n.a.JOT07 6.5 2.4 n.a. n.a. n.a.JOT08 6.8 2.2 0.044 0.004 0.136 0.007 0.049 0.022JOT09 7.3 1.0 n.a. n.a. n.a.JOT10 7.0 0.4 n.a. n.a. n.a.JOT11 21.8 4.4 0.040 0.002 0.151 0.010 0.229 0.026JOT12 25.3 1.2 0.039 0.002 0.136 0.008 0.374 0.058JOT13 29.7 6.2 0.033 0.002 0.124 0.002 0.456 0.122JOT14 15.5 1.3 n.a. n.a. n.a.JOT15 11.4 3.2 n.a. n.a. n.a.JOT16 13.5 2.9 n.a. n.a. n.a.JOT30R 5.1 1.5 0.031 0.004 0.094 0.015 0.084 0.010n.a. Not analysed.
Table 13-5: Concentrations of hydrocarbons in vertical sections of sediment samples from the Jotun field, 2000. All values in mg/kg dry sediment. Values above LSCJOT30R are dark shaded and values between LSC97-00RegII and LSCJOT30R are light shaded.
Station Layer (cm) THC NPD’s 3-6 ring DecalinsJOT05 0-1 12.6 0.036 0.128 0.305 1-3 15.0 0.055 0.140 0.331 3-6 8.1 0.049 0.180 0.049JOT08 0-1 7.2 0.040 0.129 0.042 1-3 8.9 0.058 0.152 0.077 3-6 6.4 0.072 0.157 0.041JOT30R 0-1 5.4 0.023 0.072 0.067 1-3 7.2 0.031 0.096 0.071 3-6 7.9 0.034 0.121 0.079
n.a. Not analysed.
In the present survey, THC values range from 6.5 ± 2.4 mg/kg dry sediment to 29.7 ± 6.2 mg/kg (Table 13-4). The highest concentrations, 29.7 ± 6.2 mg/kg dry sediment are found at JOT13. Elevated levels of THC are found in sediments at all stations along this transect. Contamination is also found in
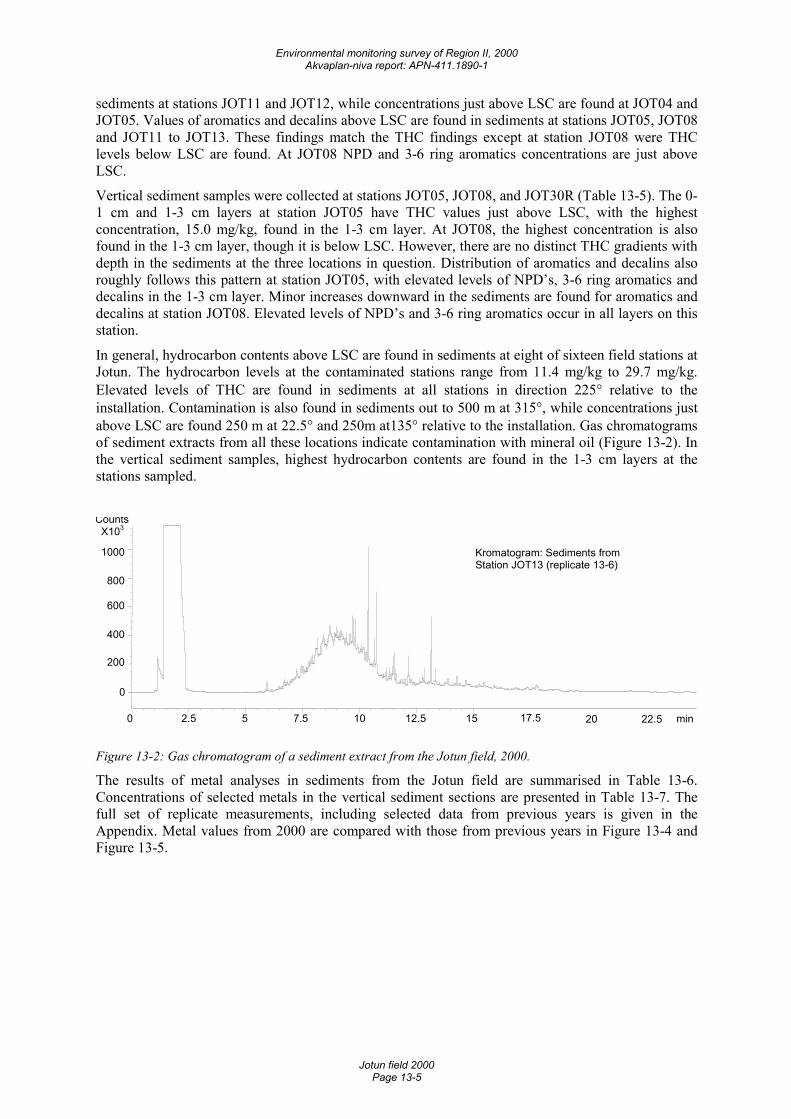
Environmental monitoring survey of Region II, 2000 Akvaplan-niva report: APN-411.1890-1
Jotun field 2000 Page 13-5
sediments at stations JOT11 and JOT12, while concentrations just above LSC are found at JOT04 and JOT05. Values of aromatics and decalins above LSC are found in sediments at stations JOT05, JOT08 and JOT11 to JOT13. These findings match the THC findings except at station JOT08 were THC levels below LSC are found. At JOT08 NPD and 3-6 ring aromatics concentrations are just above LSC.
Vertical sediment samples were collected at stations JOT05, JOT08, and JOT30R (Table 13-5). The 0-1 cm and 1-3 cm layers at station JOT05 have THC values just above LSC, with the highest concentration, 15.0 mg/kg, found in the 1-3 cm layer. At JOT08, the highest concentration is also found in the 1-3 cm layer, though it is below LSC. However, there are no distinct THC gradients with depth in the sediments at the three locations in question. Distribution of aromatics and decalins also roughly follows this pattern at station JOT05, with elevated levels of NPD’s, 3-6 ring aromatics and decalins in the 1-3 cm layer. Minor increases downward in the sediments are found for aromatics and decalins at station JOT08. Elevated levels of NPD’s and 3-6 ring aromatics occur in all layers on this station.
In general, hydrocarbon contents above LSC are found in sediments at eight of sixteen field stations at Jotun. The hydrocarbon levels at the contaminated stations range from 11.4 mg/kg to 29.7 mg/kg. Elevated levels of THC are found in sediments at all stations in direction 225° relative to the installation. Contamination is also found in sediments out to 500 m at 315°, while concentrations just above LSC are found 250 m at 22.5° and 250m at135° relative to the installation. Gas chromatograms of sediment extracts from all these locations indicate contamination with mineral oil (Figure 13-2). In the vertical sediment samples, highest hydrocarbon contents are found in the 1-3 cm layers at the stations sampled.
min 0 2.5 5 7.5 10 12.5 15 17.5 20 22.5
Counts X103
0
200
400
600
800
1000 Kromatogram: Sediments from Station JOT13 (replicate 13-6)
Figure 13-2: Gas chromatogram of a sediment extract from the Jotun field, 2000.
The results of metal analyses in sediments from the Jotun field are summarised in Table 13-6. Concentrations of selected metals in the vertical sediment sections are presented in Table 13-7. The full set of replicate measurements, including selected data from previous years is given in the Appendix. Metal values from 2000 are compared with those from previous years in Figure 13-4 and Figure 13-5.
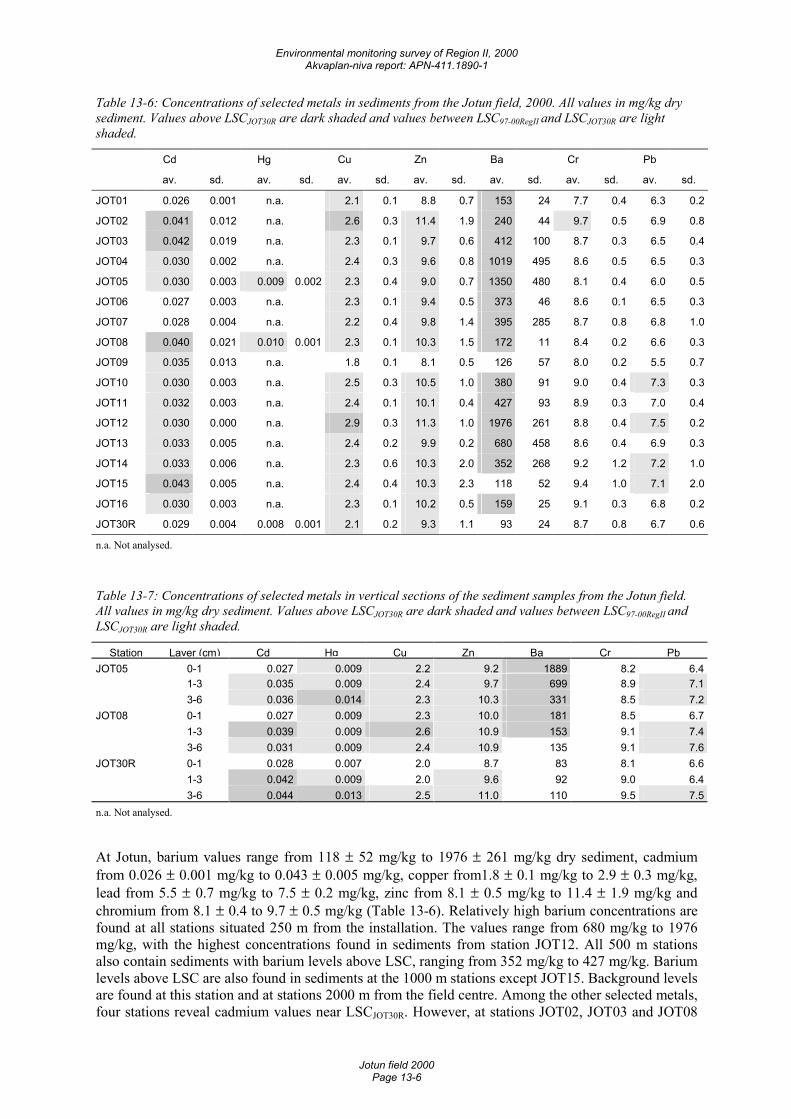
Environmental monitoring survey of Region II, 2000 Akvaplan-niva report: APN-411.1890-1
Jotun field 2000 Page 13-6
Table 13-6: Concentrations of selected metals in sediments from the Jotun field, 2000. All values in mg/kg dry sediment. Values above LSCJOT30R are dark shaded and values between LSC97-00RegII and LSCJOT30R are light shaded.
Cd Hg Cu Zn Ba Cr Pb
av. sd. av. sd. av. sd. av. sd. av. sd. av. sd. av. sd.
JOT01 0.026 0.001 n.a. 2.1 0.1 8.8 0.7 153 24 7.7 0.4 6.3 0.2
JOT02 0.041 0.012 n.a. 2.6 0.3 11.4 1.9 240 44 9.7 0.5 6.9 0.8
JOT03 0.042 0.019 n.a. 2.3 0.1 9.7 0.6 412 100 8.7 0.3 6.5 0.4
JOT04 0.030 0.002 n.a. 2.4 0.3 9.6 0.8 1019 495 8.6 0.5 6.5 0.3
JOT05 0.030 0.003 0.009 0.002 2.3 0.4 9.0 0.7 1350 480 8.1 0.4 6.0 0.5
JOT06 0.027 0.003 n.a. 2.3 0.1 9.4 0.5 373 46 8.6 0.1 6.5 0.3
JOT07 0.028 0.004 n.a. 2.2 0.4 9.8 1.4 395 285 8.7 0.8 6.8 1.0
JOT08 0.040 0.021 0.010 0.001 2.3 0.1 10.3 1.5 172 11 8.4 0.2 6.6 0.3
JOT09 0.035 0.013 n.a. 1.8 0.1 8.1 0.5 126 57 8.0 0.2 5.5 0.7
JOT10 0.030 0.003 n.a. 2.5 0.3 10.5 1.0 380 91 9.0 0.4 7.3 0.3
JOT11 0.032 0.003 n.a. 2.4 0.1 10.1 0.4 427 93 8.9 0.3 7.0 0.4
JOT12 0.030 0.000 n.a. 2.9 0.3 11.3 1.0 1976 261 8.8 0.4 7.5 0.2
JOT13 0.033 0.005 n.a. 2.4 0.2 9.9 0.2 680 458 8.6 0.4 6.9 0.3
JOT14 0.033 0.006 n.a. 2.3 0.6 10.3 2.0 352 268 9.2 1.2 7.2 1.0
JOT15 0.043 0.005 n.a. 2.4 0.4 10.3 2.3 118 52 9.4 1.0 7.1 2.0
JOT16 0.030 0.003 n.a. 2.3 0.1 10.2 0.5 159 25 9.1 0.3 6.8 0.2
JOT30R 0.029 0.004 0.008 0.001 2.1 0.2 9.3 1.1 93 24 8.7 0.8 6.7 0.6
n.a. Not analysed.
Table 13-7: Concentrations of selected metals in vertical sections of the sediment samples from the Jotun field. All values in mg/kg dry sediment. Values above LSCJOT30R are dark shaded and values between LSC97-00RegII and LSCJOT30R are light shaded.
Station Layer (cm) Cd Hg Cu Zn Ba Cr PbJOT05 0-1 0.027 0.009 2.2 9.2 1889 8.2 6.4 1-3 0.035 0.009 2.4 9.7 699 8.9 7.1 3-6 0.036 0.014 2.3 10.3 331 8.5 7.2JOT08 0-1 0.027 0.009 2.3 10.0 181 8.5 6.7 1-3 0.039 0.009 2.6 10.9 153 9.1 7.4 3-6 0.031 0.009 2.4 10.9 135 9.1 7.6JOT30R 0-1 0.028 0.007 2.0 8.7 83 8.1 6.6 1-3 0.042 0.009 2.0 9.6 92 9.0 6.4 3-6 0.044 0.013 2.5 11.0 110 9.5 7.5n.a. Not analysed.
At Jotun, barium values range from 118 ± 52 mg/kg to 1976 ± 261 mg/kg dry sediment, cadmium from 0.026 ± 0.001 mg/kg to 0.043 ± 0.005 mg/kg, copper from1.8 ± 0.1 mg/kg to 2.9 ± 0.3 mg/kg, lead from 5.5 ± 0.7 mg/kg to 7.5 ± 0.2 mg/kg, zinc from 8.1 ± 0.5 mg/kg to 11.4 ± 1.9 mg/kg and chromium from 8.1 ± 0.4 to 9.7 ± 0.5 mg/kg (Table 13-6). Relatively high barium concentrations are found at all stations situated 250 m from the installation. The values range from 680 mg/kg to 1976 mg/kg, with the highest concentrations found in sediments from station JOT12. All 500 m stations also contain sediments with barium levels above LSC, ranging from 352 mg/kg to 427 mg/kg. Barium levels above LSC are also found in sediments at the 1000 m stations except JOT15. Background levels are found at this station and at stations 2000 m from the field centre. Among the other selected metals, four stations reveal cadmium values near LSCJOT30R. However, at stations JOT02, JOT03 and JOT08
Environmental monitoring survey of Region II, 2000 Akvaplan-niva report: APN-411.1890-1
Jotun field 2000 Page 13-7
one of three replicates contain high concentration of cadmium, resulting in a high standard deviation. At JOT15 cadmium levels are just above LSC, 0.043 ± 0.005 mg/kg, and so are the copper concentrations at station JOT12 with 0.029 ± 0.003 mg/kg. None of the sediments can be described as contaminated by chromium or lead, all though chromium has values near LSC at JOT02. Mercury is measured in sediments from stations JOT05, JOT08 and JOT30R. Concentrations range from 0.008 to 0.010 mg/kg, all values being in the grey zone between the field specific and regional LSC.
Vertical sediment samples at stations JOT 05, JOT08 and JOT30R reveal the highest concentrations of barium in the top layer, decreasing downwards in the sediments (Table 13-7). Slight increases in cadmium, zinc, chromium and lead concentrations are found with increasing depth in the sediment. Also for mercury increases are seen downward in the sediments with contamination in the 3-6 cm layers at stations JOT05 and JOT30R.
In general, thirteen of sixteen field stations at Jotun contain barium concentrations above LSC. Most stations have cadmium, copper and zinc values above the regional LSC, though under the field- specific LSC. Lead concentrations over the regional LSC, but under the field-specific LSC are found in sediments at five stations. All mercury concentrations are also in level between regional and field- specific LSC.
Comparison with previous survey(s)
The centre position has been changed approximately 400 m NNW since the baseline survey in 1996, but position of the reference station remains unchanged. New transects and station positions were established in 2000. Virtually no changes in sediment levels of THC, barium, lead and copper are found, while concentrations of cadmium have increased from 0.021 ± 0.008 mg/kg to 0.029 ± 0.004 mg/kg dry sediment. Zinc concentrations have decreased from 15.4 ± 2.0 mg/kg to 9.3 ± 1.1 mg/kg.
The baseline survey of Jotun was performed in 1996. The area was described as generally low in hydrocarbons, although the natural background levels were described as higher than the average for the North Sea. A direct comparison between the baseline survey and this year’s survey is impossible because of new sampling positions, but the tendencies in the field seem clear. In the present survey contamination with hydrocarbons is found in sediments at stations situated 250 m from the field centre, extending to 500 m/315° and 2000 m/225°. Chromatograms of sediment extracts from these stations indicate contamination by mineral oil. The field history includes discharges of 25.1 tons oil in produced water in addition to a minor accidental discharge of oil-based mud. This may explain the mineral oil profiles found in chromatograms. In addition, ten wells have been drilled at Jotun with discharges of 3394 tons of cuttings including 1684 tons of barite, 14913 tons of water based drilling mud and 16.51 tons of cementing-/other chemicals.
In the baseline survey only two stations in the periphery of the field centre revealed elevated sediment levels of barium. In 2000 only three stations have sediments with barium levels under LSC (Figure 13-4). Relatively high barium values are found in sediments at the stations situated 250 m from the field centre, the highest concentrations found in the 315° direction. Distribution patterns for the other selected metals seem to follow barium, but only a few stations reveal sediments with elevated levels of these metals (Figure 13-5).
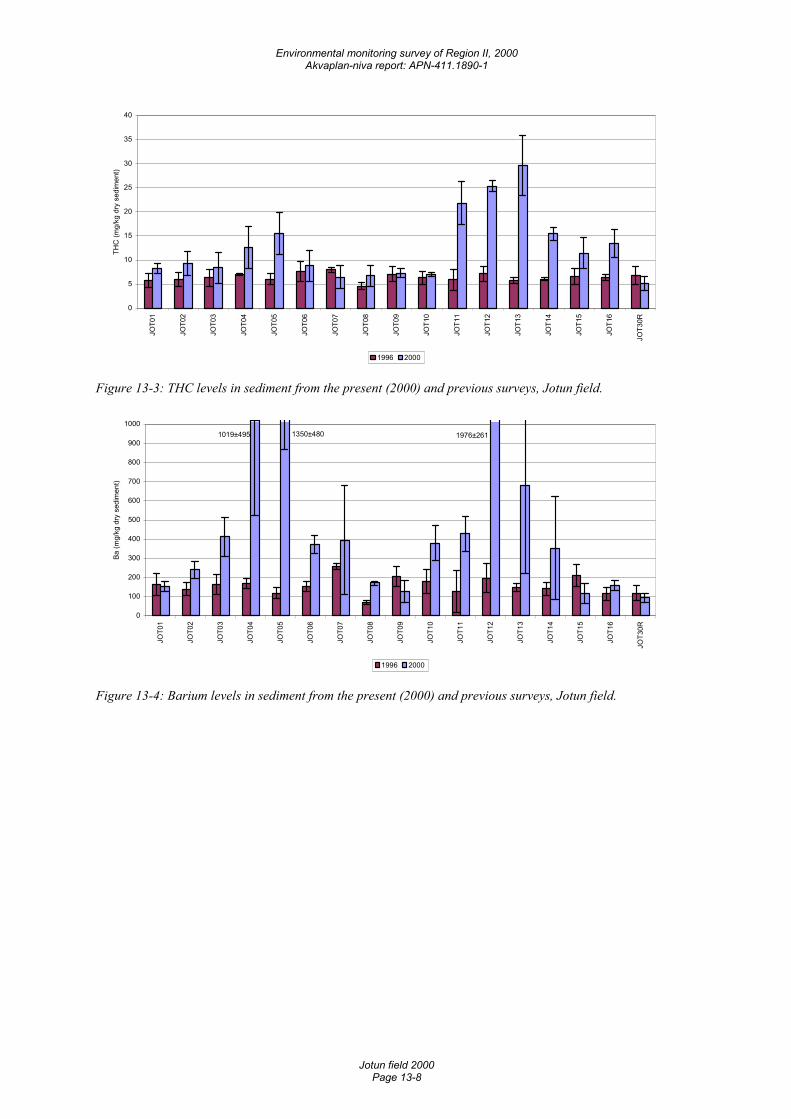
Environmental monitoring survey of Region II, 2000 Akvaplan-niva report: APN-411.1890-1
Jotun field 2000 Page 13-8
0
5
10
15
20
25
30
35
40
JOT0
1
JOT0
2
JOT0
3
JOT0
4
JOT0
5
JOT0
6
JOT0
7
JOT0
8
JOT0
9
JOT1
0
JOT1
1
JOT1
2
JOT1
3
JOT1
4
JOT1
5
JOT1
6
JOT3
0R
THC
(mg/
kg d
ry s
edim
ent)
1996 2000
Figure 13-3: THC levels in sediment from the present (2000) and previous surveys, Jotun field.
1019±495 1350±480 1976±261
0
100
200
300
400
500
600
700
800
900
1000
JOT0
1
JOT0
2
JOT0
3
JOT0
4
JOT0
5
JOT0
6
JOT0
7
JOT0
8
JOT0
9
JOT1
0
JOT1
1
JOT1
2
JOT1
3
JOT1
4
JOT1
5
JOT1
6
JOT3
0R
Ba (m
g/kg
dry
sed
imen
t)
1996 2000
Figure 13-4: Barium levels in sediment from the present (2000) and previous surveys, Jotun field.
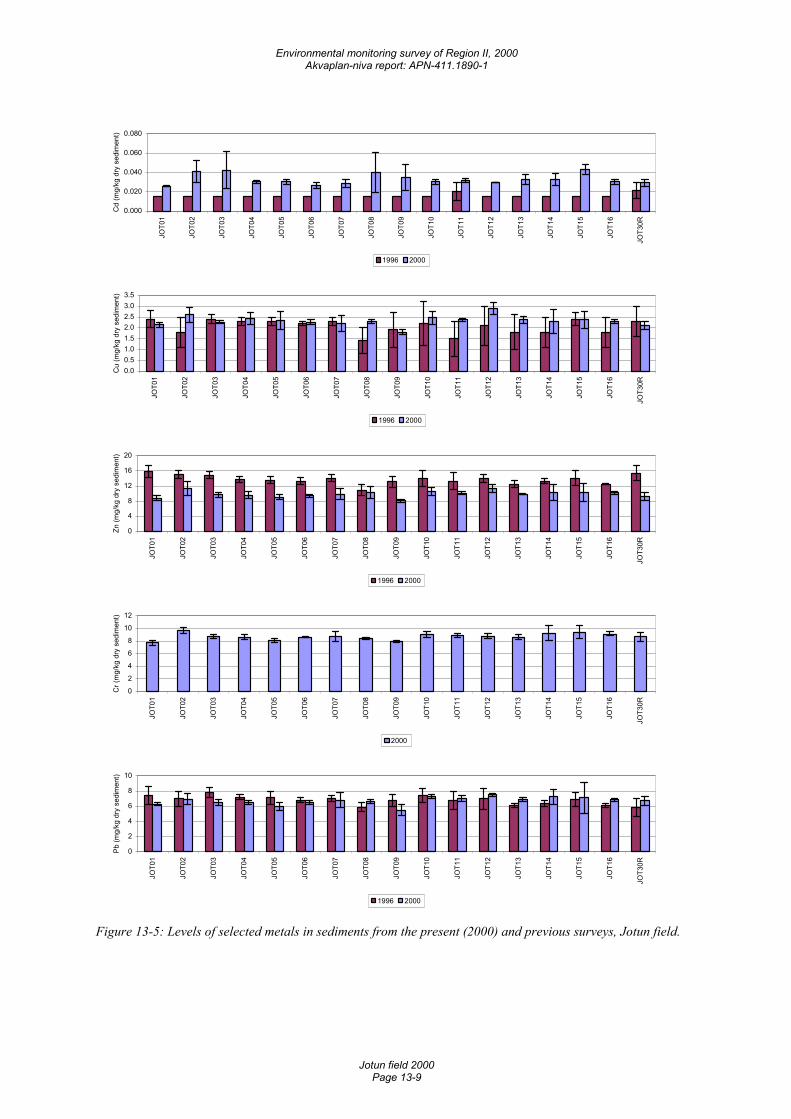
Environmental monitoring survey of Region II, 2000 Akvaplan-niva report: APN-411.1890-1
Jotun field 2000 Page 13-9
0.000
0.020
0.040
0.060
0.080
JOT0
1
JOT0
2
JOT0
3
JOT0
4
JOT0
5
JOT0
6
JOT0
7
JOT0
8
JOT0
9
JOT1
0
JOT1
1
JOT1
2
JOT1
3
JOT1
4
JOT1
5
JOT1
6
JOT3
0R
Cd
(mg/
kg d
ry s
edim
ent)
1996 2000
0.00.51.01.52.02.53.03.5
JOT0
1
JOT0
2
JOT0
3
JOT0
4
JOT0
5
JOT0
6
JOT0
7
JOT0
8
JOT0
9
JOT1
0
JOT1
1
JOT1
2
JOT1
3
JOT1
4
JOT1
5
JOT1
6
JOT3
0R
Cu
(mg/
kg d
ry s
edim
ent)
1996 2000
0
4
8
12
16
20
JOT0
1
JOT0
2
JOT0
3
JOT0
4
JOT0
5
JOT0
6
JOT0
7
JOT0
8
JOT0
9
JOT1
0
JOT1
1
JOT1
2
JOT1
3
JOT1
4
JOT1
5
JOT1
6
JOT3
0R
Zn (m
g/kg
dry
sed
imen
t)
1996 2000
0
2
4
6
8
10
12
JOT0
1
JOT0
2
JOT0
3
JOT0
4
JOT0
5
JOT0
6
JOT0
7
JOT0
8
JOT0
9
JOT1
0
JOT1
1
JOT1
2
JOT1
3
JOT1
4
JOT1
5
JOT1
6
JOT3
0R
Cr (
mg/
kg d
ry s
edim
ent)
2000
0
2
4
6
8
10
JOT0
1
JOT0
2
JOT0
3
JOT0
4
JOT0
5
JOT0
6
JOT0
7
JOT0
8
JOT0
9
JOT1
0
JOT1
1
JOT1
2
JOT1
3
JOT1
4
JOT1
5
JOT1
6
JOT3
0R
Pb (m
g/kg
dry
sed
imen
t)
1996 2000
Figure 13-5: Levels of selected metals in sediments from the present (2000) and previous surveys, Jotun field.
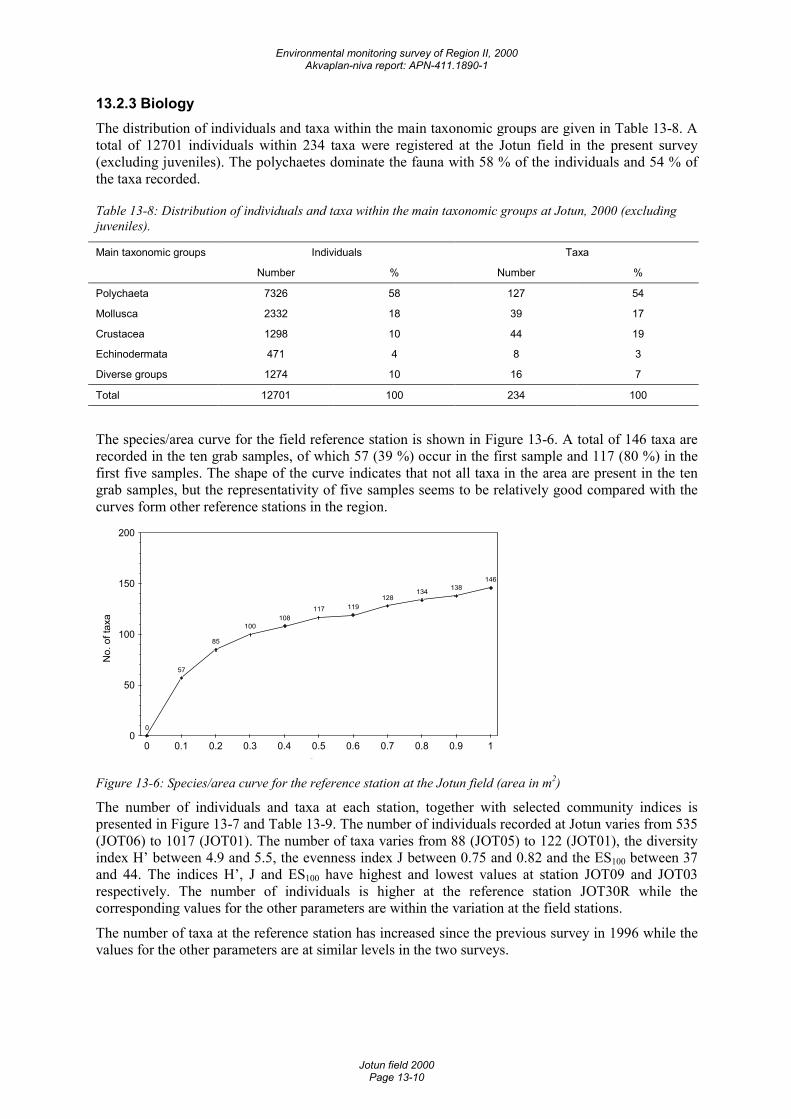
Environmental monitoring survey of Region II, 2000 Akvaplan-niva report: APN-411.1890-1
Jotun field 2000 Page 13-10
13.2.3 Biology The distribution of individuals and taxa within the main taxonomic groups are given in Table 13-8. A total of 12701 individuals within 234 taxa were registered at the Jotun field in the present survey (excluding juveniles). The polychaetes dominate the fauna with 58 % of the individuals and 54 % of the taxa recorded.
Table 13-8: Distribution of individuals and taxa within the main taxonomic groups at Jotun, 2000 (excluding juveniles).
Main taxonomic groups Individuals Taxa
Number % Number %
Polychaeta 7326 58 127 54
Mollusca 2332 18 39 17
Crustacea 1298 10 44 19
Echinodermata 471 4 8 3
Diverse groups 1274 10 16 7
Total 12701 100 234 100
The species/area curve for the field reference station is shown in Figure 13-6. A total of 146 taxa are recorded in the ten grab samples, of which 57 (39 %) occur in the first sample and 117 (80 %) in the first five samples. The shape of the curve indicates that not all taxa in the area are present in the ten grab samples, but the representativity of five samples seems to be relatively good compared with the curves form other reference stations in the region.
No.
of t
axa
0
57
85
100108
117 119128
134 138146
0
50
100
150
200
0 0.1 0.2 0.3 0.4 0.5 0.6 0.7 0.8 0.9 12
Figure 13-6: Species/area curve for the reference station at the Jotun field (area in m2)
The number of individuals and taxa at each station, together with selected community indices is presented in Figure 13-7 and Table 13-9. The number of individuals recorded at Jotun varies from 535 (JOT06) to 1017 (JOT01). The number of taxa varies from 88 (JOT05) to 122 (JOT01), the diversity index H’ between 4.9 and 5.5, the evenness index J between 0.75 and 0.82 and the ES100 between 37 and 44. The indices H’, J and ES100 have highest and lowest values at station JOT09 and JOT03 respectively. The number of individuals is higher at the reference station JOT30R while the corresponding values for the other parameters are within the variation at the field stations.
The number of taxa at the reference station has increased since the previous survey in 1996 while the values for the other parameters are at similar levels in the two surveys.
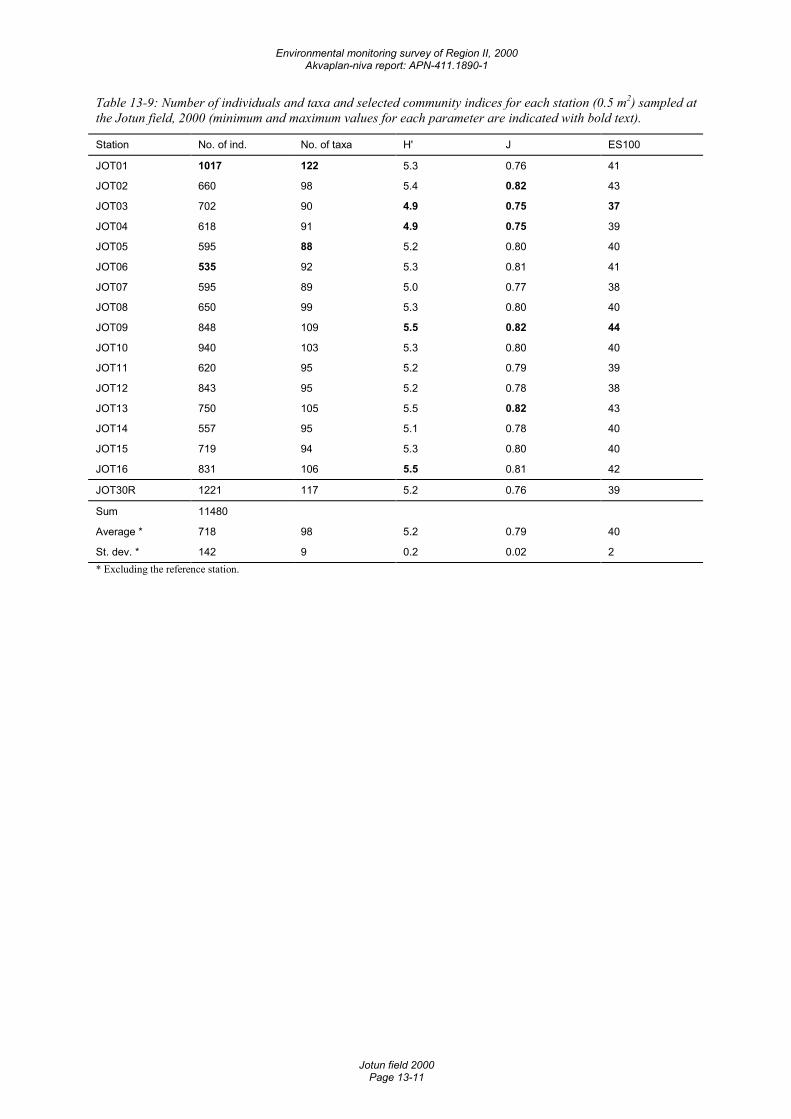
Environmental monitoring survey of Region II, 2000 Akvaplan-niva report: APN-411.1890-1
Jotun field 2000 Page 13-11
Table 13-9: Number of individuals and taxa and selected community indices for each station (0.5 m2) sampled at the Jotun field, 2000 (minimum and maximum values for each parameter are indicated with bold text).
Station No. of ind. No. of taxa H' J ES100
JOT01 1017 122 5.3 0.76 41
JOT02 660 98 5.4 0.82 43
JOT03 702 90 4.9 0.75 37
JOT04 618 91 4.9 0.75 39
JOT05 595 88 5.2 0.80 40
JOT06 535 92 5.3 0.81 41
JOT07 595 89 5.0 0.77 38
JOT08 650 99 5.3 0.80 40
JOT09 848 109 5.5 0.82 44
JOT10 940 103 5.3 0.80 40
JOT11 620 95 5.2 0.79 39
JOT12 843 95 5.2 0.78 38
JOT13 750 105 5.5 0.82 43
JOT14 557 95 5.1 0.78 40
JOT15 719 94 5.3 0.80 40
JOT16 831 106 5.5 0.81 42
JOT30R 1221 117 5.2 0.76 39
Sum 11480
Average * 718 98 5.2 0.79 40
St. dev. * 142 9 0.2 0.02 2 * Excluding the reference station.
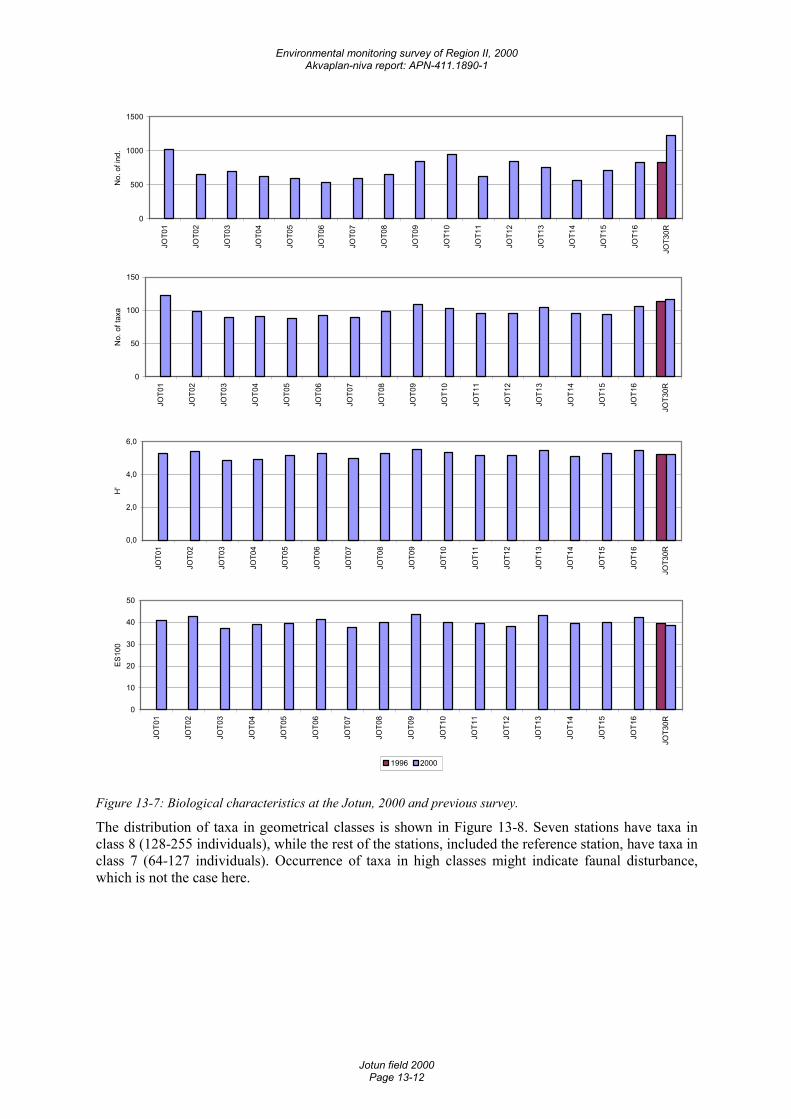
Environmental monitoring survey of Region II, 2000 Akvaplan-niva report: APN-411.1890-1
Jotun field 2000 Page 13-12
0
500
1000
1500
JOT0
1
JOT0
2
JOT0
3
JOT0
4
JOT0
5
JOT0
6
JOT0
7
JOT0
8
JOT0
9
JOT1
0
JOT1
1
JOT1
2
JOT1
3
JOT1
4
JOT1
5
JOT1
6
JOT3
0R
No.
of i
nd.
0
50
100
150
JOT0
1
JOT0
2
JOT0
3
JOT0
4
JOT0
5
JOT0
6
JOT0
7
JOT0
8
JOT0
9
JOT1
0
JOT1
1
JOT1
2
JOT1
3
JOT1
4
JOT1
5
JOT1
6
JOT3
0R
No.
of t
axa
0,0
2,0
4,0
6,0
JOT0
1
JOT0
2
JOT0
3
JOT0
4
JOT0
5
JOT0
6
JOT0
7
JOT0
8
JOT0
9
JOT1
0
JOT1
1
JOT1
2
JOT1
3
JOT1
4
JOT1
5
JOT1
6
JOT3
0R
H'
0
10
20
30
40
50
JOT0
1
JOT0
2
JOT0
3
JOT0
4
JOT0
5
JOT0
6
JOT0
7
JOT0
8
JOT0
9
JOT1
0
JOT1
1
JOT1
2
JOT1
3
JOT1
4
JOT1
5
JOT1
6
JOT3
0R
ES10
0
1996 2000
Figure 13-7: Biological characteristics at the Jotun, 2000 and previous survey.
The distribution of taxa in geometrical classes is shown in Figure 13-8. Seven stations have taxa in class 8 (128-255 individuals), while the rest of the stations, included the reference station, have taxa in class 7 (64-127 individuals). Occurrence of taxa in high classes might indicate faunal disturbance, which is not the case here.
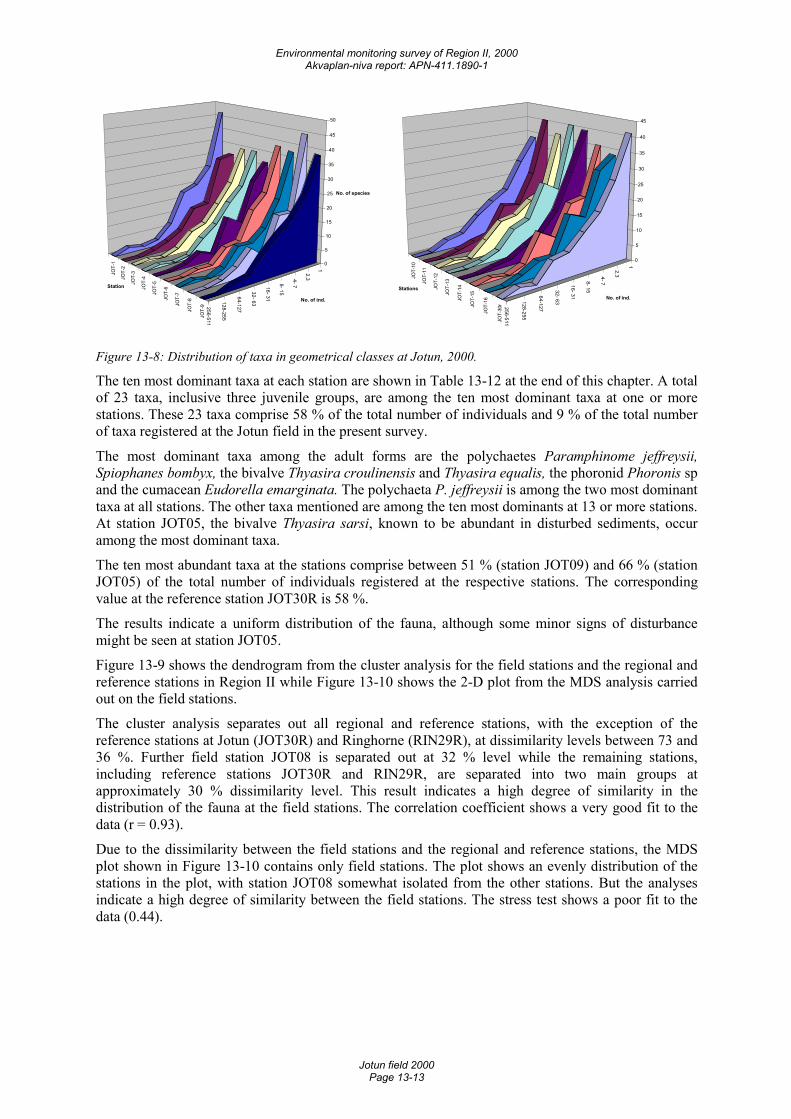
Environmental monitoring survey of Region II, 2000 Akvaplan-niva report: APN-411.1890-1
Jotun field 2000 Page 13-13
1
2,3 4- 7 8- 15
16- 31
32- 63
64-127
128-255
256-511
JOT-
1
JOT-
2
JOT-
3
JOT-
4
JOT-
5
JOT-
6
JOT-
7
JOT-
8
JOT-
9
0
5
10
15
20
25
30
35
40
45
50
No. of species
No. of ind.
Station
1
2,3 4- 7 8- 15
16- 31
32- 63
64-127
128-255
256-511
JOT-
10
JOT-
11
JOT-
12
JOT-
13
JOT-
14
JOT-
15
JOT-
16
JOT-
30r
0
5
10
15
20
25
30
35
40
45
No. of ind.
Stations
Figure 13-8: Distribution of taxa in geometrical classes at Jotun, 2000.
The ten most dominant taxa at each station are shown in Table 13-12 at the end of this chapter. A total of 23 taxa, inclusive three juvenile groups, are among the ten most dominant taxa at one or more stations. These 23 taxa comprise 58 % of the total number of individuals and 9 % of the total number of taxa registered at the Jotun field in the present survey.
The most dominant taxa among the adult forms are the polychaetes Paramphinome jeffreysii, Spiophanes bombyx, the bivalve Thyasira croulinensis and Thyasira equalis, the phoronid Phoronis sp and the cumacean Eudorella emarginata. The polychaeta P. jeffreysii is among the two most dominant taxa at all stations. The other taxa mentioned are among the ten most dominants at 13 or more stations. At station JOT05, the bivalve Thyasira sarsi, known to be abundant in disturbed sediments, occur among the most dominant taxa.
The ten most abundant taxa at the stations comprise between 51 % (station JOT09) and 66 % (station JOT05) of the total number of individuals registered at the respective stations. The corresponding value at the reference station JOT30R is 58 %.
The results indicate a uniform distribution of the fauna, although some minor signs of disturbance might be seen at station JOT05.
Figure 13-9 shows the dendrogram from the cluster analysis for the field stations and the regional and reference stations in Region II while Figure 13-10 shows the 2-D plot from the MDS analysis carried out on the field stations.
The cluster analysis separates out all regional and reference stations, with the exception of the reference stations at Jotun (JOT30R) and Ringhorne (RIN29R), at dissimilarity levels between 73 and 36 %. Further field station JOT08 is separated out at 32 % level while the remaining stations, including reference stations JOT30R and RIN29R, are separated into two main groups at approximately 30 % dissimilarity level. This result indicates a high degree of similarity in the distribution of the fauna at the field stations. The correlation coefficient shows a very good fit to the data (r = 0.93).
Due to the dissimilarity between the field stations and the regional and reference stations, the MDS plot shown in Figure 13-10 contains only field stations. The plot shows an evenly distribution of the stations in the plot, with station JOT08 somewhat isolated from the other stations. But the analyses indicate a high degree of similarity between the field stations. The stress test shows a poor fit to the data (0.44).
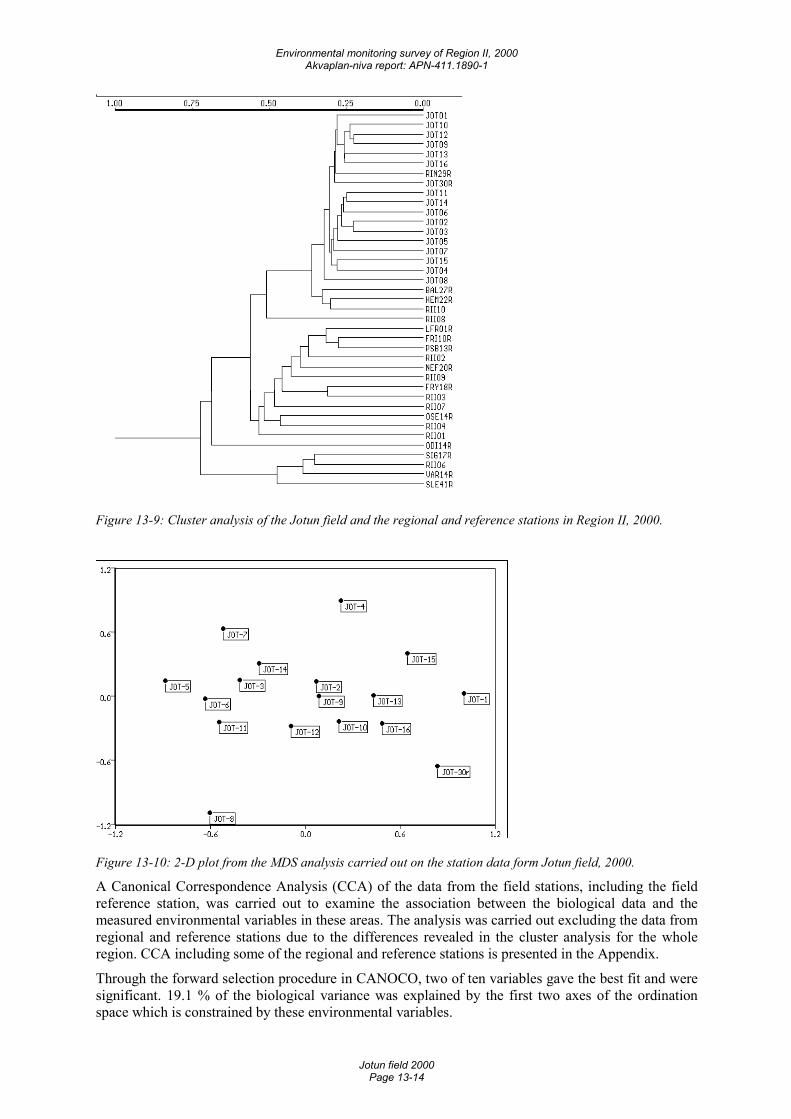
Environmental monitoring survey of Region II, 2000 Akvaplan-niva report: APN-411.1890-1
Jotun field 2000 Page 13-14
Figure 13-9: Cluster analysis of the Jotun field and the regional and reference stations in Region II, 2000.
Figure 13-10: 2-D plot from the MDS analysis carried out on the station data form Jotun field, 2000.
A Canonical Correspondence Analysis (CCA) of the data from the field stations, including the field reference station, was carried out to examine the association between the biological data and the measured environmental variables in these areas. The analysis was carried out excluding the data from regional and reference stations due to the differences revealed in the cluster analysis for the whole region. CCA including some of the regional and reference stations is presented in the Appendix.
Through the forward selection procedure in CANOCO, two of ten variables gave the best fit and were significant. 19.1 % of the biological variance was explained by the first two axes of the ordination space which is constrained by these environmental variables.
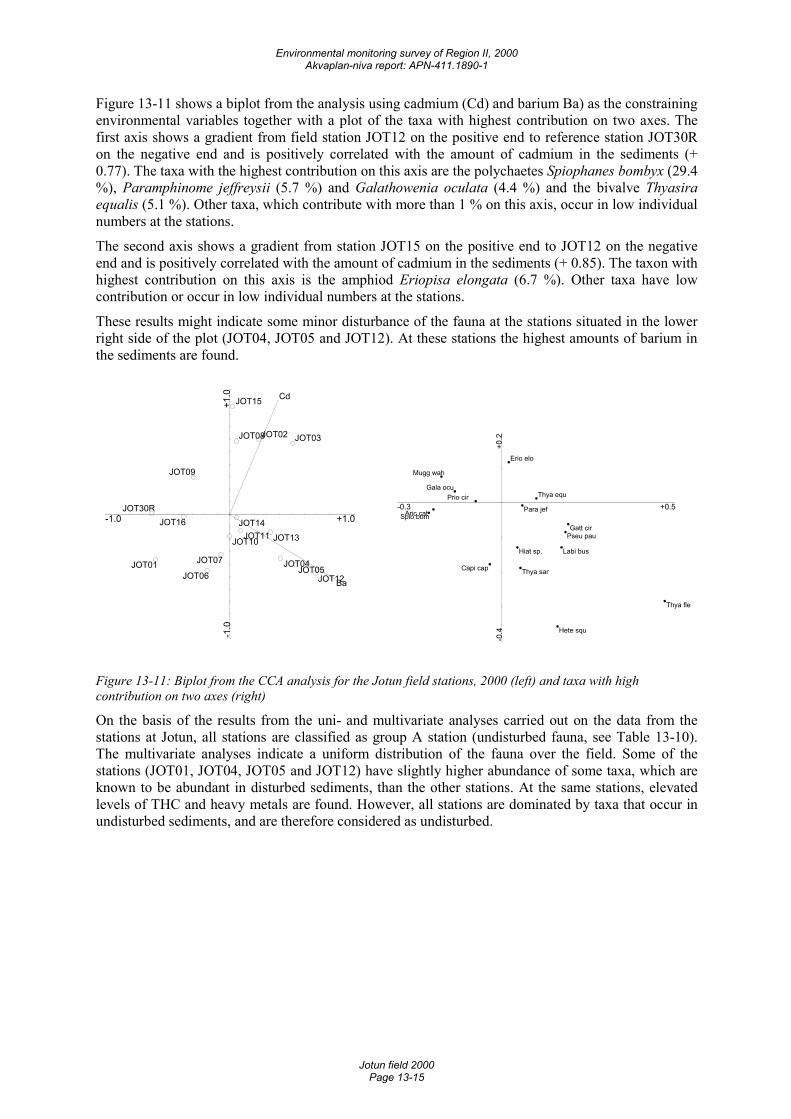
Environmental monitoring survey of Region II, 2000 Akvaplan-niva report: APN-411.1890-1
Jotun field 2000 Page 13-15
Figure 13-11 shows a biplot from the analysis using cadmium (Cd) and barium Ba) as the constraining environmental variables together with a plot of the taxa with highest contribution on two axes. The first axis shows a gradient from field station JOT12 on the positive end to reference station JOT30R on the negative end and is positively correlated with the amount of cadmium in the sediments (+ 0.77). The taxa with the highest contribution on this axis are the polychaetes Spiophanes bombyx (29.4 %), Paramphinome jeffreysii (5.7 %) and Galathowenia oculata (4.4 %) and the bivalve Thyasira equalis (5.1 %). Other taxa, which contribute with more than 1 % on this axis, occur in low individual numbers at the stations.
The second axis shows a gradient from station JOT15 on the positive end to JOT12 on the negative end and is positively correlated with the amount of cadmium in the sediments (+ 0.85). The taxon with highest contribution on this axis is the amphiod Eriopisa elongata (6.7 %). Other taxa have low contribution or occur in low individual numbers at the stations.
These results might indicate some minor disturbance of the fauna at the stations situated in the lower right side of the plot (JOT04, JOT05 and JOT12). At these stations the highest amounts of barium in the sediments are found.
-1.0 +1.0
-1.0
+1.0
Ba
Cd
JOT12
JOT30R
JOT01 JOT05
JOT03
JOT04
JOT16
JOT13
JOT09
JOT02
JOT06
JOT11
JOT07
JOT14
JOT08
JOT15
JOT10�
-0.3 +0.5-0
.4+0
.2
Thya fle
Spio bomAric cat
Gatt cirPseu pau
Labi bus
Mugg wah
Hete squ
Gala ocuThya equPrio cir
Para jef
Thya sar
Hiat sp.
Capi cap
Erio elo�
Figure 13-11: Biplot from the CCA analysis for the Jotun field stations, 2000 (left) and taxa with high contribution on two axes (right)
On the basis of the results from the uni- and multivariate analyses carried out on the data from the stations at Jotun, all stations are classified as group A station (undisturbed fauna, see Table 13-10). The multivariate analyses indicate a uniform distribution of the fauna over the field. Some of the stations (JOT01, JOT04, JOT05 and JOT12) have slightly higher abundance of some taxa, which are known to be abundant in disturbed sediments, than the other stations. At the same stations, elevated levels of THC and heavy metals are found. However, all stations are dominated by taxa that occur in undisturbed sediments, and are therefore considered as undisturbed.
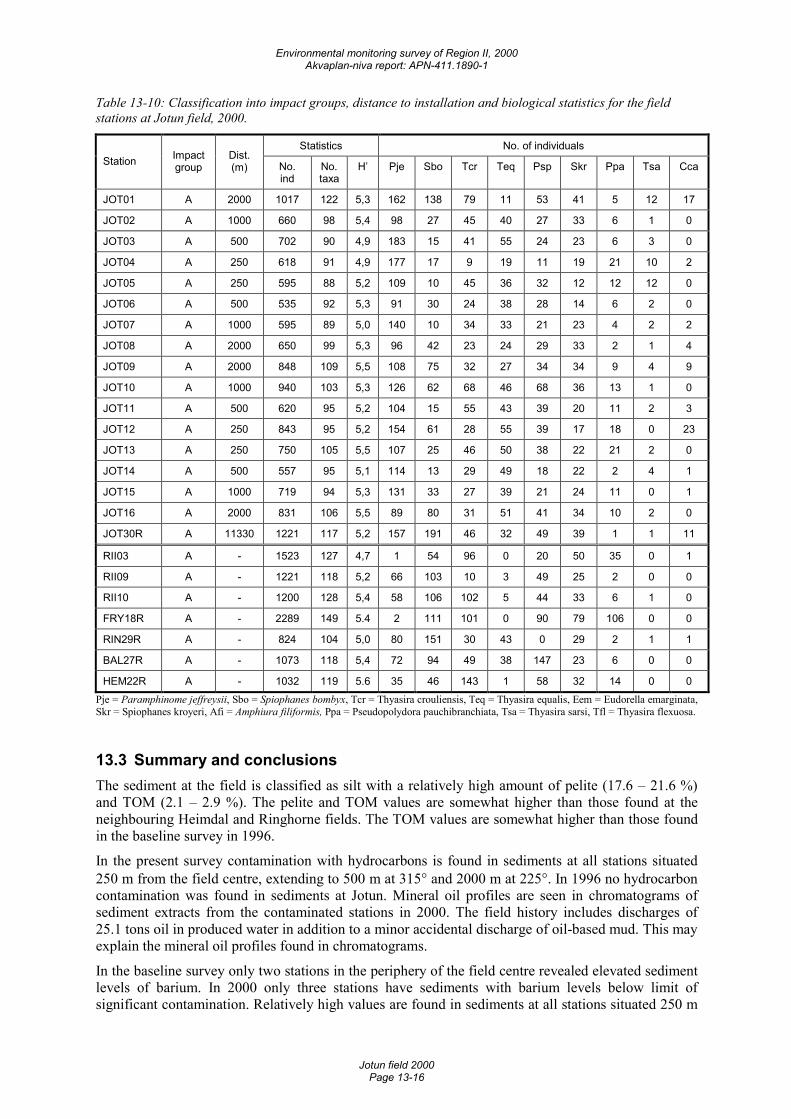
Environmental monitoring survey of Region II, 2000 Akvaplan-niva report: APN-411.1890-1
Jotun field 2000 Page 13-16
Table 13-10: Classification into impact groups, distance to installation and biological statistics for the field stations at Jotun field, 2000.
Statistics No. of individuals Station Impact
group Dist. (m) No.
ind No. taxa
H’ Pje Sbo Tcr Teq Psp Skr Ppa Tsa Cca
JOT01 A 2000 1017 122 5,3 162 138 79 11 53 41 5 12 17
JOT02 A 1000 660 98 5,4 98 27 45 40 27 33 6 1 0
JOT03 A 500 702 90 4,9 183 15 41 55 24 23 6 3 0
JOT04 A 250 618 91 4,9 177 17 9 19 11 19 21 10 2
JOT05 A 250 595 88 5,2 109 10 45 36 32 12 12 12 0
JOT06 A 500 535 92 5,3 91 30 24 38 28 14 6 2 0
JOT07 A 1000 595 89 5,0 140 10 34 33 21 23 4 2 2
JOT08 A 2000 650 99 5,3 96 42 23 24 29 33 2 1 4
JOT09 A 2000 848 109 5,5 108 75 32 27 34 34 9 4 9
JOT10 A 1000 940 103 5,3 126 62 68 46 68 36 13 1 0
JOT11 A 500 620 95 5,2 104 15 55 43 39 20 11 2 3
JOT12 A 250 843 95 5,2 154 61 28 55 39 17 18 0 23
JOT13 A 250 750 105 5,5 107 25 46 50 38 22 21 2 0
JOT14 A 500 557 95 5,1 114 13 29 49 18 22 2 4 1
JOT15 A 1000 719 94 5,3 131 33 27 39 21 24 11 0 1
JOT16 A 2000 831 106 5,5 89 80 31 51 41 34 10 2 0
JOT30R A 11330 1221 117 5,2 157 191 46 32 49 39 1 1 11
RII03 A - 1523 127 4,7 1 54 96 0 20 50 35 0 1
RII09 A - 1221 118 5,2 66 103 10 3 49 25 2 0 0
RII10 A - 1200 128 5,4 58 106 102 5 44 33 6 1 0
FRY18R A - 2289 149 5.4 2 111 101 0 90 79 106 0 0
RIN29R A - 824 104 5,0 80 151 30 43 0 29 2 1 1
BAL27R A - 1073 118 5,4 72 94 49 38 147 23 6 0 0
HEM22R A - 1032 119 5.6 35 46 143 1 58 32 14 0 0 Pje = Paramphinome jeffreysii, Sbo = Spiophanes bombyx, Tcr = Thyasira crouliensis, Teq = Thyasira equalis, Eem = Eudorella emarginata, Skr = Spiophanes kroyeri, Afi = Amphiura filiformis, Ppa = Pseudopolydora pauchibranchiata, Tsa = Thyasira sarsi, Tfl = Thyasira flexuosa.
13.3 Summary and conclusions The sediment at the field is classified as silt with a relatively high amount of pelite (17.6 – 21.6 %) and TOM (2.1 – 2.9 %). The pelite and TOM values are somewhat higher than those found at the neighbouring Heimdal and Ringhorne fields. The TOM values are somewhat higher than those found in the baseline survey in 1996.
In the present survey contamination with hydrocarbons is found in sediments at all stations situated 250 m from the field centre, extending to 500 m at 315° and 2000 m at 225°. In 1996 no hydrocarbon contamination was found in sediments at Jotun. Mineral oil profiles are seen in chromatograms of sediment extracts from the contaminated stations in 2000. The field history includes discharges of 25.1 tons oil in produced water in addition to a minor accidental discharge of oil-based mud. This may explain the mineral oil profiles found in chromatograms.
In the baseline survey only two stations in the periphery of the field centre revealed elevated sediment levels of barium. In 2000 only three stations have sediments with barium levels below limit of significant contamination. Relatively high values are found in sediments at all stations situated 250 m
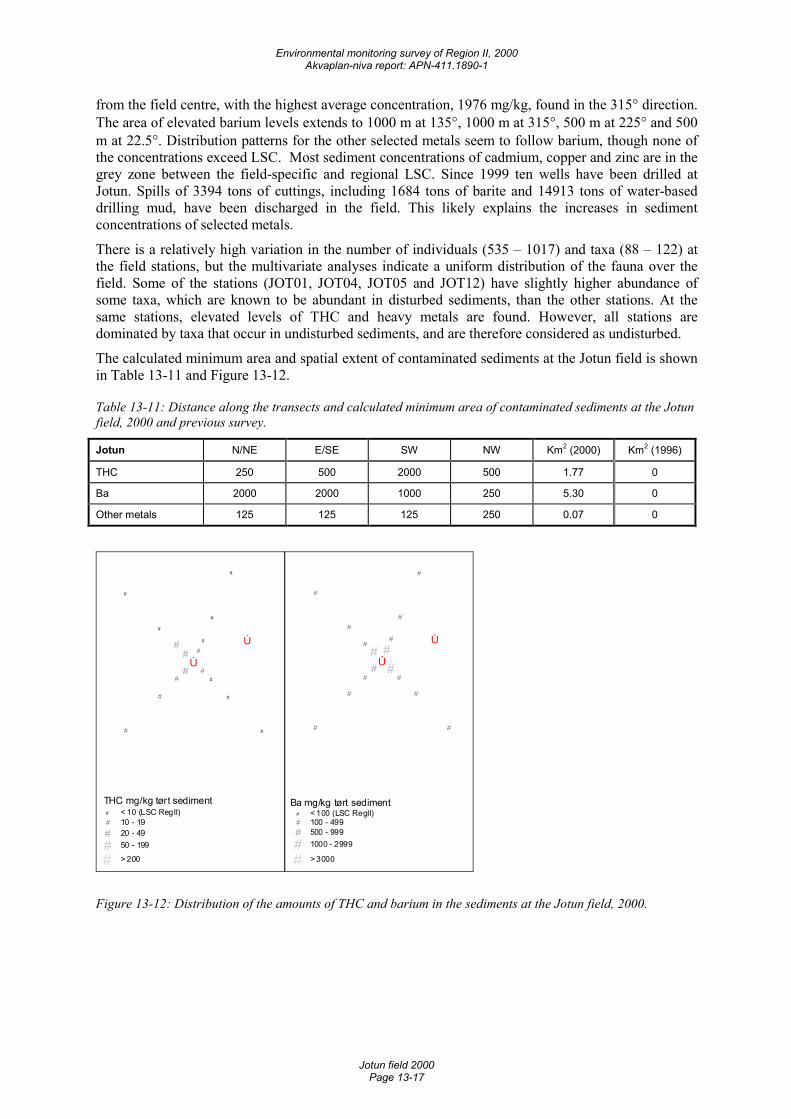
Environmental monitoring survey of Region II, 2000 Akvaplan-niva report: APN-411.1890-1
Jotun field 2000 Page 13-17
from the field centre, with the highest average concentration, 1976 mg/kg, found in the 315° direction. The area of elevated barium levels extends to 1000 m at 135°, 1000 m at 315°, 500 m at 225° and 500 m at 22.5°. Distribution patterns for the other selected metals seem to follow barium, though none of the concentrations exceed LSC. Most sediment concentrations of cadmium, copper and zinc are in the grey zone between the field-specific and regional LSC. Since 1999 ten wells have been drilled at Jotun. Spills of 3394 tons of cuttings, including 1684 tons of barite and 14913 tons of water-based drilling mud, have been discharged in the field. This likely explains the increases in sediment concentrations of selected metals.
There is a relatively high variation in the number of individuals (535 – 1017) and taxa (88 – 122) at the field stations, but the multivariate analyses indicate a uniform distribution of the fauna over the field. Some of the stations (JOT01, JOT04, JOT05 and JOT12) have slightly higher abundance of some taxa, which are known to be abundant in disturbed sediments, than the other stations. At the same stations, elevated levels of THC and heavy metals are found. However, all stations are dominated by taxa that occur in undisturbed sediments, and are therefore considered as undisturbed.
The calculated minimum area and spatial extent of contaminated sediments at the Jotun field is shown in Table 13-11 and Figure 13-12.
Table 13-11: Distance along the transects and calculated minimum area of contaminated sediments at the Jotun field, 2000 and previous survey.
Jotun N/NE E/SE SW NW Km2 (2000) Km2 (1996)
THC 250 500 2000 500 1.77 0
Ba 2000 2000 1000 250 5.30 0
Other metals 125 125 125 250 0.07 0
Ú
Ú
#
#
#
#
##
#
#
#
#
##
##
#
#
THC mg/kg tørt sediment# < 10 (LSC RegII)# 10 - 19# 20 - 49
# 50 - 199
# > 200
Ú
Ú
#
#
#
#
##
#
#
#
#
#
##
#
#
#
Ba mg/kg tørt sediment# < 100 (LSC RegII)# 100 - 499# 500 - 999
# 1000 - 2999
# > 3000
Figure 13-12: Distribution of the amounts of THC and barium in the sediments at the Jotun field, 2000.
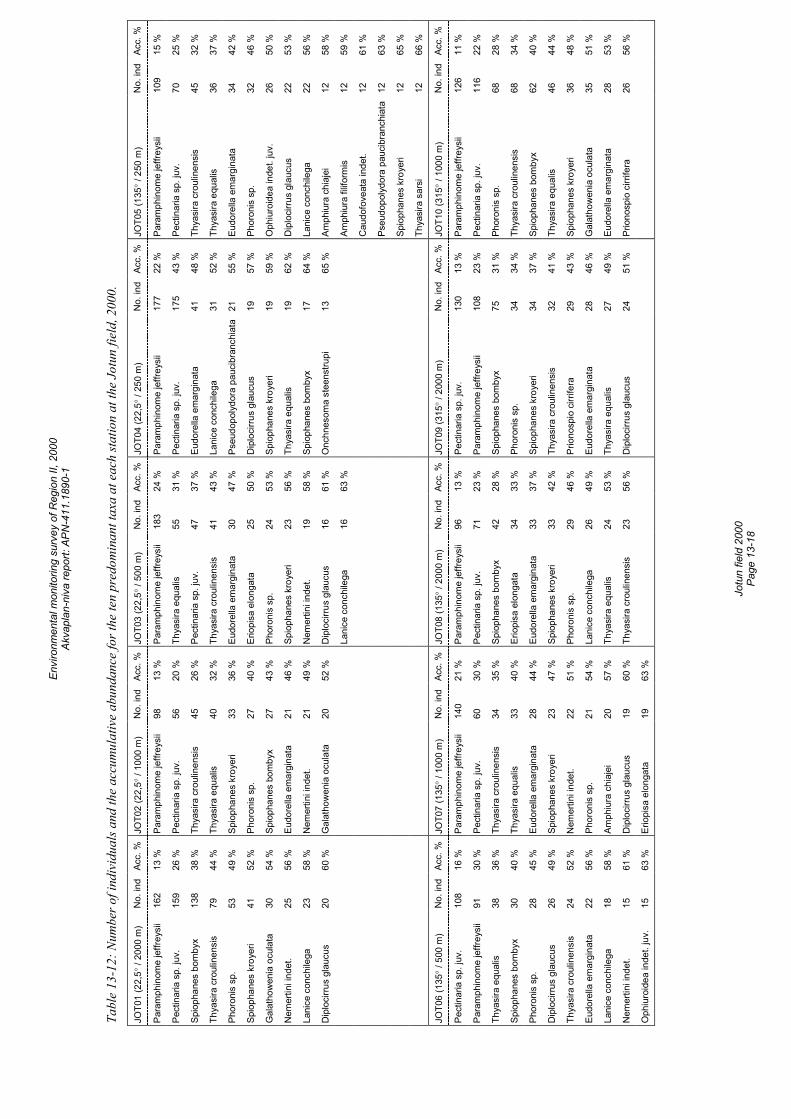
Envi
ronm
enta
l mon
itorin
g su
rvey
of R
egio
n II,
200
0 Ak
vapl
an-n
iva
repo
rt: A
PN-4
11.1
890-
1
Jo
tun
field
200
0 Pa
ge 1
3-18
Tabl
e 13
-12:
Num
ber o
f ind
ivid
uals
and
the
accu
mul
ativ
e ab
unda
nce
for t
he te
n pr
edom
inan
t tax
a at
eac
h sta
tion
at th
e Jo
tun
field
, 200
0.
JOT0
1 (2
2,5°
/ 20
00 m
) N
o. in
d Ac
c. %
JO
T02
(22,
5° /
1000
m)
No.
ind
Acc.
%
JOT0
3 (2
2,5°
/ 50
0 m
) N
o. in
d Ac
c. %
JO
T04
(22,
5° /
250
m)
No.
ind
Acc.
%
JOT0
5 (1
35°
/ 250
m)
No.
ind
Acc.
%
Para
mph
inom
e je
ffrey
sii
162
13 %
Pa
ram
phin
ome
jeffr
eysi
i 98
13
%
Para
mph
inom
e je
ffrey
sii
183
24 %
Pa
ram
phin
ome
jeffr
eysi
i 17
7 22
%
Para
mph
inom
e je
ffrey
sii
109
15 %
Pect
inar
ia s
p. ju
v.
159
26 %
Pe
ctin
aria
sp.
juv.
56
20
%
Thya
sira
equ
alis
55
31
%
Pect
inar
ia s
p. ju
v.
175
43 %
Pe
ctin
aria
sp.
juv.
70
25
%
Spio
phan
es b
omby
x 13
8 38
%
Thya
sira
cro
ulin
ensi
s 45
26
%
Pect
inar
ia s
p. ju
v.
47
37 %
Eu
dore
lla e
mar
gina
ta
41
48 %
Th
yasi
ra c
roul
inen
sis
45
32 %
Thya
sira
cro
ulin
ensi
s 79
44
%
Thya
sira
equ
alis
40
32
%
Thya
sira
cro
ulin
ensi
s 41
43
%
Lani
ce c
onch
ilega
31
52
%
Thya
sira
equ
alis
36
37
%
Phor
onis
sp.
53
49
%
Spio
phan
es k
roye
ri 33
36
%
Eudo
rella
em
argi
nata
30
47
%
Pseu
dopo
lydo
ra p
auci
bran
chia
ta
21
55 %
Eu
dore
lla e
mar
gina
ta
34
42 %
Spio
phan
es k
roye
ri 41
52
%
Phor
onis
sp.
27
40
%
Erio
pisa
elo
ngat
a 25
50
%
Dip
loci
rrus
glau
cus
19
57 %
Ph
oron
is s
p.
32
46 %
Gal
atho
wen
ia o
cula
ta
30
54 %
Sp
ioph
anes
bom
byx
27
43 %
Ph
oron
is s
p.
24
53 %
Sp
ioph
anes
kro
yeri
19
59 %
O
phiu
roid
ea in
det.
juv.
26
50
%
Nem
ertin
i ind
et.
25
56 %
Eu
dore
lla e
mar
gina
ta
21
46 %
Sp
ioph
anes
kro
yeri
23
56 %
Th
yasi
ra e
qual
is
19
62 %
D
iplo
cirru
s gl
aucu
s 22
53
%
Lani
ce c
onch
ilega
23
58
%
Nem
ertin
i ind
et.
21
49 %
N
emer
tini i
ndet
. 19
58
%
Spio
phan
es b
omby
x 17
64
%
Lani
ce c
onch
ilega
22
56
%
Dip
loci
rrus
glau
cus
20
60 %
G
alat
how
enia
ocu
lata
20
52
%
Dip
loci
rrus
glau
cus
16
61 %
O
nchn
esom
a st
eens
trupi
13
65
%
Amph
iura
chi
ajei
12
58
%
Lani
ce c
onch
ilega
16
63
%
Am
phiu
ra fi
lifor
mis
12
59
%
Cau
dofo
veat
a in
det.
12
61 %
Pseu
dopo
lydo
ra p
auci
bran
chia
ta
12
63 %
Spio
phan
es k
roye
ri 12
65
%
Thya
sira
sar
si
12
66 %
JOT0
6 (1
35°
/ 500
m)
No.
ind
Acc.
%
JOT0
7 (1
35°
/ 100
0 m
) N
o. in
d Ac
c. %
JO
T08
(135
° / 2
000
m)
No.
ind
Acc.
%
JOT0
9 (3
15°
/ 200
0 m
) N
o. in
d Ac
c. %
JO
T10
(315
° / 1
000
m)
No.
ind
Acc.
%
Pect
inar
ia s
p. ju
v.
108
16 %
Pa
ram
phin
ome
jeffr
eysi
i 14
0 21
%
Para
mph
inom
e je
ffrey
sii
96
13 %
Pe
ctin
aria
sp.
juv.
13
0 13
%
Para
mph
inom
e je
ffrey
sii
126
11 %
Para
mph
inom
e je
ffrey
sii
91
30 %
Pe
ctin
aria
sp.
juv.
60
30
%
Pect
inar
ia s
p. ju
v.
71
23 %
Pa
ram
phin
ome
jeffr
eysi
i 10
8 23
%
Pect
inar
ia s
p. ju
v.
116
22 %
Thya
sira
equ
alis
38
36
%
Thya
sira
cro
ulin
ensi
s 34
35
%
Spio
phan
es b
omby
x 42
28
%
Spio
phan
es b
omby
x 75
31
%
Phor
onis
sp.
68
28
%
Spio
phan
es b
omby
x 30
40
%
Thya
sira
equ
alis
33
40
%
Erio
pisa
elo
ngat
a 34
33
%
Phor
onis
sp.
34
34
%
Thya
sira
cro
ulin
ensi
s 68
34
%
Phor
onis
sp.
28
45
%
Eudo
rella
em
argi
nata
28
44
%
Eudo
rella
em
argi
nata
33
37
%
Spio
phan
es k
roye
ri 34
37
%
Spio
phan
es b
omby
x 62
40
%
Dip
loci
rrus
glau
cus
26
49 %
Sp
ioph
anes
kro
yeri
23
47 %
Sp
ioph
anes
kro
yeri
33
42 %
Th
yasi
ra c
roul
inen
sis
32
41 %
Th
yasi
ra e
qual
is
46
44 %
Thya
sira
cro
ulin
ensi
s 24
52
%
Nem
ertin
i ind
et.
22
51 %
Ph
oron
is s
p.
29
46 %
Pr
iono
spio
cirr
ifera
29
43
%
Spio
phan
es k
roye
ri 36
48
%
Eudo
rella
em
argi
nata
22
56
%
Phor
onis
sp.
21
54
%
Lani
ce c
onch
ilega
26
49
%
Eudo
rella
em
argi
nata
28
46
%
Gal
atho
wen
ia o
cula
ta
35
51 %
Lani
ce c
onch
ilega
18
58
%
Amph
iura
chi
ajei
20
57
%
Thya
sira
equ
alis
24
53
%
Thya
sira
equ
alis
27
49
%
Eudo
rella
em
argi
nata
28
53
%
Nem
ertin
i ind
et.
15
61 %
D
iplo
cirru
s gl
aucu
s 19
60
%
Thya
sira
cro
ulin
ensi
s 23
56
%
Dip
loci
rrus
glau
cus
24
51 %
Pr
iono
spio
cirr
ifera
26
56
%
Oph
iuro
idea
inde
t. ju
v.
15
63 %
Er
iopi
sa e
long
ata
19
63 %
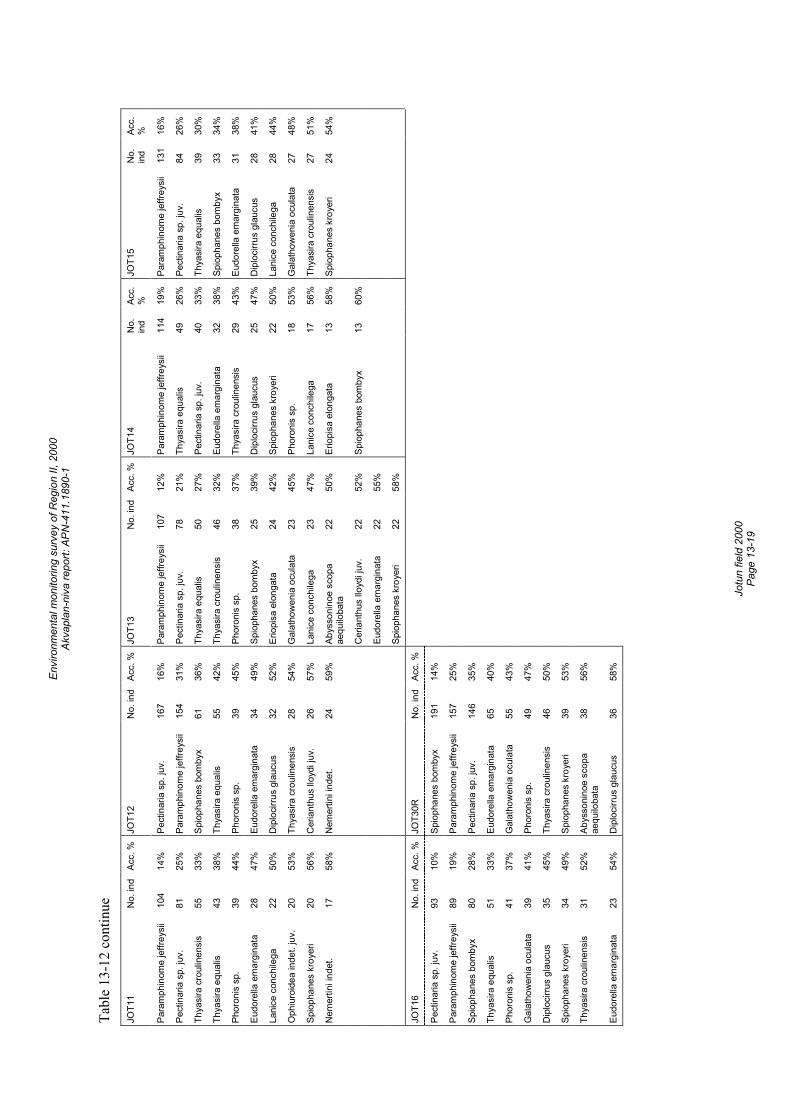
Envi
ronm
enta
l mon
itorin
g su
rvey
of R
egio
n II,
200
0 Ak
vapl
an-n
iva
repo
rt: A
PN-4
11.1
890-
1
Jo
tun
field
200
0 Pa
ge 1
3-19
Tabl
e 13
-12
cont
inue
JOT1
1 N
o. in
d Ac
c. %
JO
T12
No.
ind
Acc.
%
JOT1
3 N
o. in
d Ac
c. %
JO
T14
No.
in
d Ac
c.
%
JOT1
5 N
o.
ind
Acc.
%
Para
mph
inom
e je
ffrey
sii
104
14%
Pe
ctin
aria
sp.
juv.
16
7 16
%
Para
mph
inom
e je
ffrey
sii
107
12%
Pa
ram
phin
ome
jeffr
eysi
i 11
4 19
%
Para
mph
inom
e je
ffrey
sii
131
16%
Pect
inar
ia s
p. ju
v.
81
25%
Pa
ram
phin
ome
jeffr
eysi
i 15
4 31
%
Pect
inar
ia s
p. ju
v.
78
21%
Th
yasi
ra e
qual
is
49
26%
Pe
ctin
aria
sp.
juv.
84
26
%
Thya
sira
cro
ulin
ensi
s 55
33
%
Spio
phan
es b
omby
x 61
36
%
Thya
sira
equ
alis
50
27
%
Pect
inar
ia s
p. ju
v.
40
33%
Th
yasi
ra e
qual
is
39
30%
Thya
sira
equ
alis
43
38
%
Thya
sira
equ
alis
55
42
%
Thya
sira
cro
ulin
ensi
s 46
32
%
Eudo
rella
em
argi
nata
32
38
%
Spio
phan
es b
omby
x 33
34
%
Phor
onis
sp.
39
44
%
Phor
onis
sp.
39
45
%
Phor
onis
sp.
38
37
%
Thya
sira
cro
ulin
ensi
s 29
43
%
Eudo
rella
em
argi
nata
31
38
%
Eudo
rella
em
argi
nata
28
47
%
Eudo
rella
em
argi
nata
34
49
%
Spio
phan
es b
omby
x 25
39
%
Dip
loci
rrus
glau
cus
25
47%
D
iplo
cirru
s gl
aucu
s 28
41
%
Lani
ce c
onch
ilega
22
50
%
Dip
loci
rrus
glau
cus
32
52%
Er
iopi
sa e
long
ata
24
42%
Sp
ioph
anes
kro
yeri
22
50%
La
nice
con
chile
ga
28
44%
Oph
iuro
idea
inde
t. ju
v.
20
53%
Th
yasi
ra c
roul
inen
sis
28
54%
G
alat
how
enia
ocu
lata
23
45
%
Phor
onis
sp.
18
53
%
Gal
atho
wen
ia o
cula
ta
27
48%
Spio
phan
es k
roye
ri 20
56
%
Cer
iant
hus
lloyd
i juv
. 26
57
%
Lani
ce c
onch
ilega
23
47
%
Lani
ce c
onch
ilega
17
56
%
Thya
sira
cro
ulin
ensi
s 27
51
%
Nem
ertin
i ind
et.
17
58%
N
emer
tini i
ndet
. 24
59
%
Abys
soni
noe
scop
a ae
quilo
bata
22
50
%
Erio
pisa
elo
ngat
a 13
58
%
Spio
phan
es k
roye
ri 24
54
%
Cer
iant
hus
lloyd
i juv
. 22
52
%
Spio
phan
es b
omby
x 13
60
%
Eudo
rella
em
argi
nata
22
55
%
Spio
phan
es k
roye
ri 22
58
%
JOT1
6 N
o. in
d Ac
c. %
JO
T30R
N
o. in
d Ac
c. %
Pect
inar
ia s
p. ju
v.
93
10%
Sp
ioph
anes
bom
byx
191
14%
Para
mph
inom
e je
ffrey
sii
89
19%
Pa
ram
phin
ome
jeffr
eysi
i 15
7 25
%
Spio
phan
es b
omby
x 80
28
%
Pect
inar
ia s
p. ju
v.
146
35%
Thya
sira
equ
alis
51
33
%
Eudo
rella
em
argi
nata
65
40
%
Phor
onis
sp.
41
37
%
Gal
atho
wen
ia o
cula
ta
55
43%
Gal
atho
wen
ia o
cula
ta
39
41%
Ph
oron
is s
p.
49
47%
Dip
loci
rrus
glau
cus
35
45%
Th
yasi
ra c
roul
inen
sis
46
50%
Spio
phan
es k
roye
ri 34
49
%
Spio
phan
es k
roye
ri 39
53
%
Thya
sira
cro
ulin
ensi
s 31
52
%
Abys
soni
noe
scop
a ae
quilo
bata
38
56
%
Eudo
rella
em
argi
nata
23
54
%
Dip
loci
rrus
glau
cus
36
58%
Envi
ronm
enta
l mon
itorin
g su
rvey
of R
egio
n II,
200
0 Ak
vapl
an-n
iva
repo
rt: A
PN-4
11.1
890-
1
Jo
tun
field
200
0 Pa
ge 1
3-20
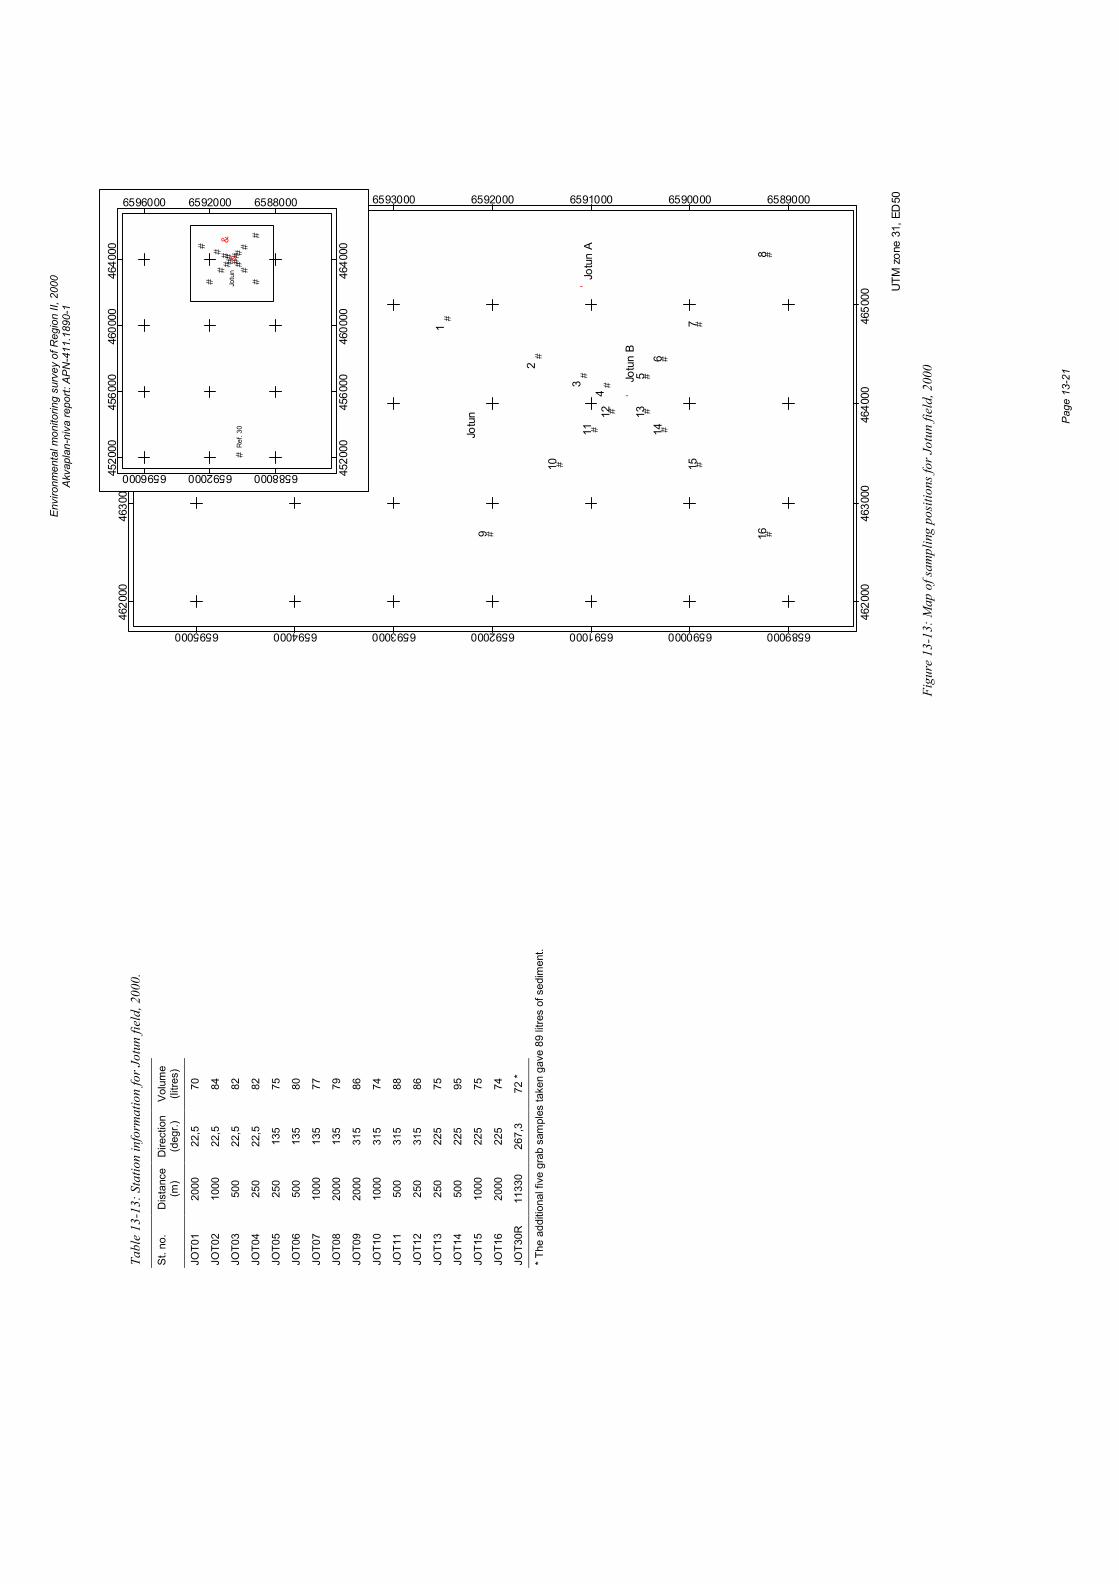
Envi
ronm
enta
l mon
itorin
g su
rvey
of R
egio
n II,
200
0 Ak
vapl
an-n
iva
repo
rt: A
PN-4
11.1
890-
1
Pa
ge 1
3-21
#
#
#
#
#
#
#
#
#
#
#
# #
#
#
#
'
'5
6
7
8
9
10
1112 13
14
15
16
1
2
3
4
Jotu
n
Jotu
n A
Jotu
n B
4620
00
4620
00
4630
00
4630
00
4640
00
4640
00
4650
00
4650
00
6589000
6589000
6590000
6590000
6591000
6591000
6592000
6592000
6593000
6593000
6594000
6594000
6595000
6595000
UTM
zon
e 31
, ED
50
#
# # # # ##
#
##
# # # ##
#
#
&&
Ref
. 30
Jotu
n
4520
00
4520
00
4560
00
4560
00
4600
00
4600
00
4640
00
4640
00
6588000
6588000
6592000
6592000
6596000
6596000
Figu
re 1
3-13
: Map
of s
ampl
ing
posit
ions
for J
otun
fiel
d, 2
000
Tabl
e 13
-13:
Sta
tion
info
rmat
ion
for J
otun
fiel
d, 2
000.
St. n
o.
Dis
tanc
e (m
) D
irect
ion
(deg
r.)
Volu
me
(litre
s)
JOT0
1 20
00
22,5
70
JOT0
2 10
00
22,5
84
JOT0
3 50
0 22
,5
82
JOT0
4 25
0 22
,5
82
JOT0
5 25
0 13
5 75
JOT0
6 50
0 13
5 80
JOT0
7 10
00
135
77
JOT0
8 20
00
135
79
JOT0
9 20
00
315
86
JOT1
0 10
00
315
74
JOT1
1 50
0 31
5 88
JOT1
2 25
0 31
5 86
JOT1
3 25
0 22
5 75
JOT1
4 50
0 22
5 95
JOT1
5 10
00
225
75
JOT1
6 20
00
225
74
JOT3
0R
1133
0 26
7,3
72 *
* The
add
ition
al fi
ve g
rab
sam
ples
take
n ga
ve 8
9 lit
res
of s
edim
ent.

Envi
ronm
enta
l mon
itorin
g su
rvey
of R
egio
n II,
200
0 Ak
vapl
an-n
iva
repo
rt: A
PN-4
11.1
890-
1
Pa
ge 1
3-22
Environmental monitoring survey of Region II, 2000 Akvaplan-niva report: APN-411.1890-1
Odin field 2000 Page 14-1
14 Odin field 14.1 Introduction The Odin field is located in Block 30-10 in the northern part of Region II, situated approximately 22 km north east of the Frigg area. Odin was a gas production platform. Drilling at Odin ended 18 years ago when only water based mud was used. Production of at the field ended in 1994 and the installation was removed in 1997. During this operation, physical disturbance of the sediments occurred. The present survey is the second survey after removal of the installation.
At this field monitoring surveys have been carried out in 1991 (Holte et al., 1992) and 1997 (Mannvik et al., 1998). In 1997 the monitoring survey was carried out only a few months after the installation was removed. Sediments at Odin were significantly contaminated by hydrocarbons at the 100 m stations on the 160°, 250° and 340°- axes. Cadmium, copper, zinc and lead contaminated sediments at the same stations, while only the 100 m station in the 340° direction had sediments with elevated barium levels. The fauna was found to be disturbed at the 100 m stations in the previous survey.
Information on the sampling stations is shown in Figure 14-13 and Table 14-12, both on the foldout page at the end of this chapter (page 14-19).
14.2 Results and discussion
14.2.1 Physical characteristics The median phi value and the amount (%) of pelite, fine sand and total organic material (TOM) in the sediment from the present and previous surveys shown in Table 14-1 and Figure 14-1. Detailed data on sediment characteristics such as colour, smell and a full set of analytical data, including TOM content and grain size distribution (with standard deviation, evenness and kurtosis) can be found in the Appendix.
The sediments at the Odin field are classified as fine sand with median values varying from 3.28 (ODI06) to 3.50 (ODI12). The amount of pelite in the sediment varies from 1.99 % (ODI01) to 3.09 % (ODI02), the fine sand from 65.0 % (ODI06) to 88.7 % (ODI12) while the TOM varies from 0.68 % (ODI06) to 0.92 % (ODI07). The reference station ODI14R is significantly different from the field stations in sediment structure, with classification as medium sand, and the amount of fine sand is only 5.2 %.
The pelite content has increased at field station ODI02, while the TOM value has decreased at the field station ODI05 since 1997. The large differences seen at the reference station is believed to be a result of sampling at different positions in the two surveys. Apparently the position used in the present survey is wrong.
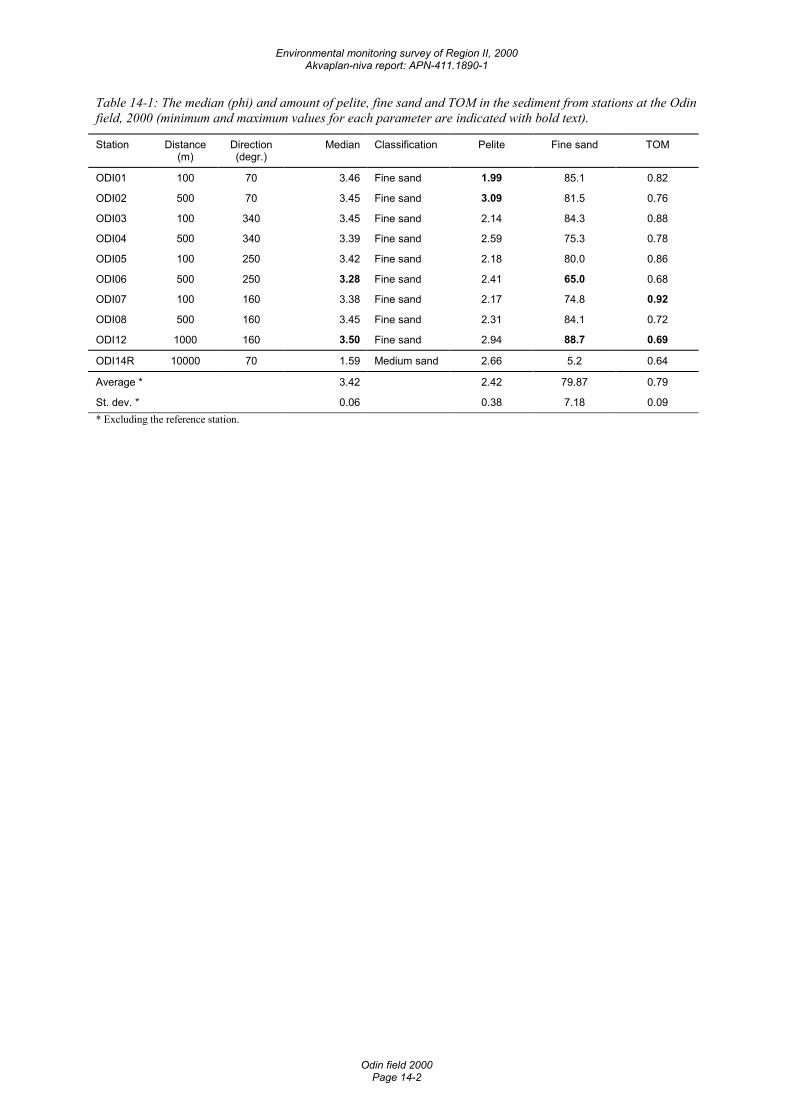
Environmental monitoring survey of Region II, 2000 Akvaplan-niva report: APN-411.1890-1
Odin field 2000 Page 14-2
Table 14-1: The median (phi) and amount of pelite, fine sand and TOM in the sediment from stations at the Odin field, 2000 (minimum and maximum values for each parameter are indicated with bold text).
Station Distance (m)
Direction (degr.)
Median Classification Pelite Fine sand TOM
ODI01 100 70 3.46 Fine sand 1.99 85.1 0.82
ODI02 500 70 3.45 Fine sand 3.09 81.5 0.76
ODI03 100 340 3.45 Fine sand 2.14 84.3 0.88
ODI04 500 340 3.39 Fine sand 2.59 75.3 0.78
ODI05 100 250 3.42 Fine sand 2.18 80.0 0.86
ODI06 500 250 3.28 Fine sand 2.41 65.0 0.68
ODI07 100 160 3.38 Fine sand 2.17 74.8 0.92
ODI08 500 160 3.45 Fine sand 2.31 84.1 0.72
ODI12 1000 160 3.50 Fine sand 2.94 88.7 0.69
ODI14R 10000 70 1.59 Medium sand 2.66 5.2 0.64
Average * 3.42 2.42 79.87 0.79
St. dev. * 0.06 0.38 7.18 0.09 * Excluding the reference station.
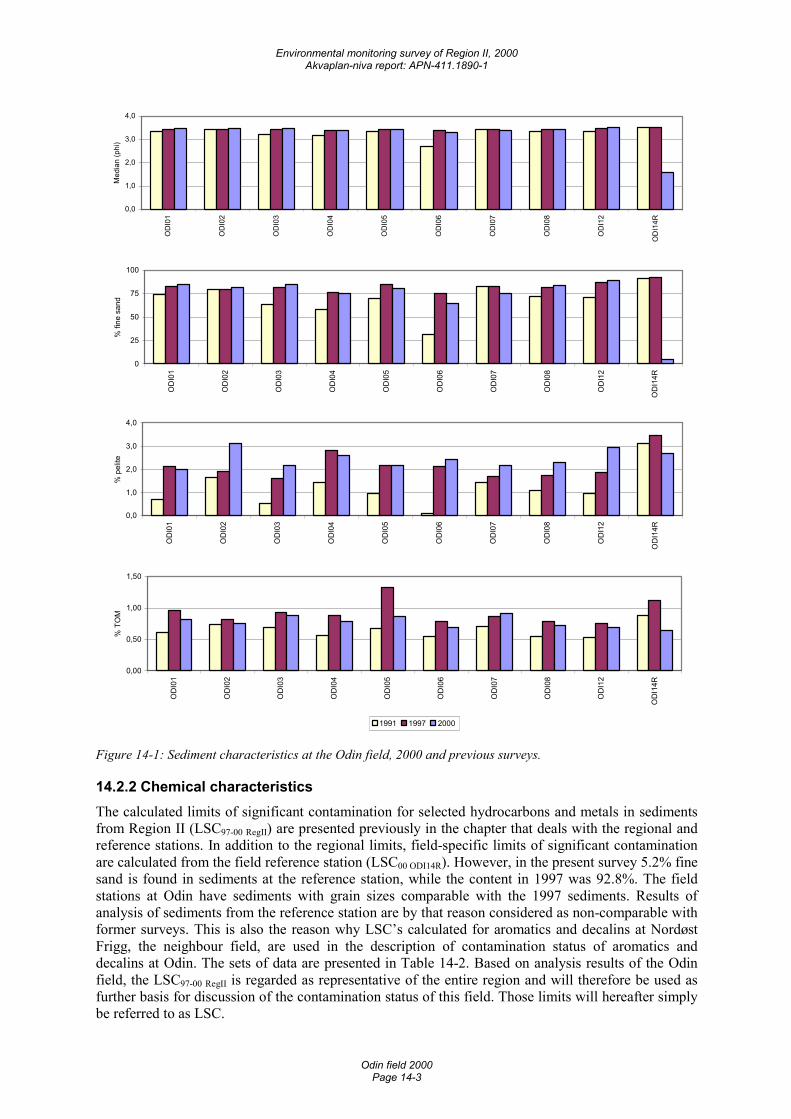
Environmental monitoring survey of Region II, 2000 Akvaplan-niva report: APN-411.1890-1
Odin field 2000 Page 14-3
0,0
1,0
2,0
3,0
4,0
OD
I01
OD
I02
OD
I03
OD
I04
OD
I05
OD
I06
OD
I07
OD
I08
OD
I12
OD
I14R
Med
ian
(phi
)
0
25
50
75
100
OD
I01
OD
I02
OD
I03
OD
I04
OD
I05
OD
I06
OD
I07
OD
I08
OD
I12
OD
I14R
% fi
ne s
and
0,0
1,0
2,0
3,0
4,0
OD
I01
OD
I02
OD
I03
OD
I04
OD
I05
OD
I06
OD
I07
OD
I08
OD
I12
OD
I14R
% p
elite
0,00
0,50
1,00
1,50
OD
I01
OD
I02
OD
I03
OD
I04
OD
I05
OD
I06
OD
I07
OD
I08
OD
I12
OD
I14R
% T
OM
1991 1997 2000
Figure 14-1: Sediment characteristics at the Odin field, 2000 and previous surveys.
14.2.2 Chemical characteristics The calculated limits of significant contamination for selected hydrocarbons and metals in sediments from Region II (LSC97-00 RegII) are presented previously in the chapter that deals with the regional and reference stations. In addition to the regional limits, field-specific limits of significant contamination are calculated from the field reference station (LSC00 ODI14R). However, in the present survey 5.2% fine sand is found in sediments at the reference station, while the content in 1997 was 92.8%. The field stations at Odin have sediments with grain sizes comparable with the 1997 sediments. Results of analysis of sediments from the reference station are by that reason considered as non-comparable with former surveys. This is also the reason why LSC’s calculated for aromatics and decalins at Nordøst Frigg, the neighbour field, are used in the description of contamination status of aromatics and decalins at Odin. The sets of data are presented in Table 14-2. Based on analysis results of the Odin field, the LSC97-00 RegII is regarded as representative of the entire region and will therefore be used as further basis for discussion of the contamination status of this field. Those limits will hereafter simply be referred to as LSC.
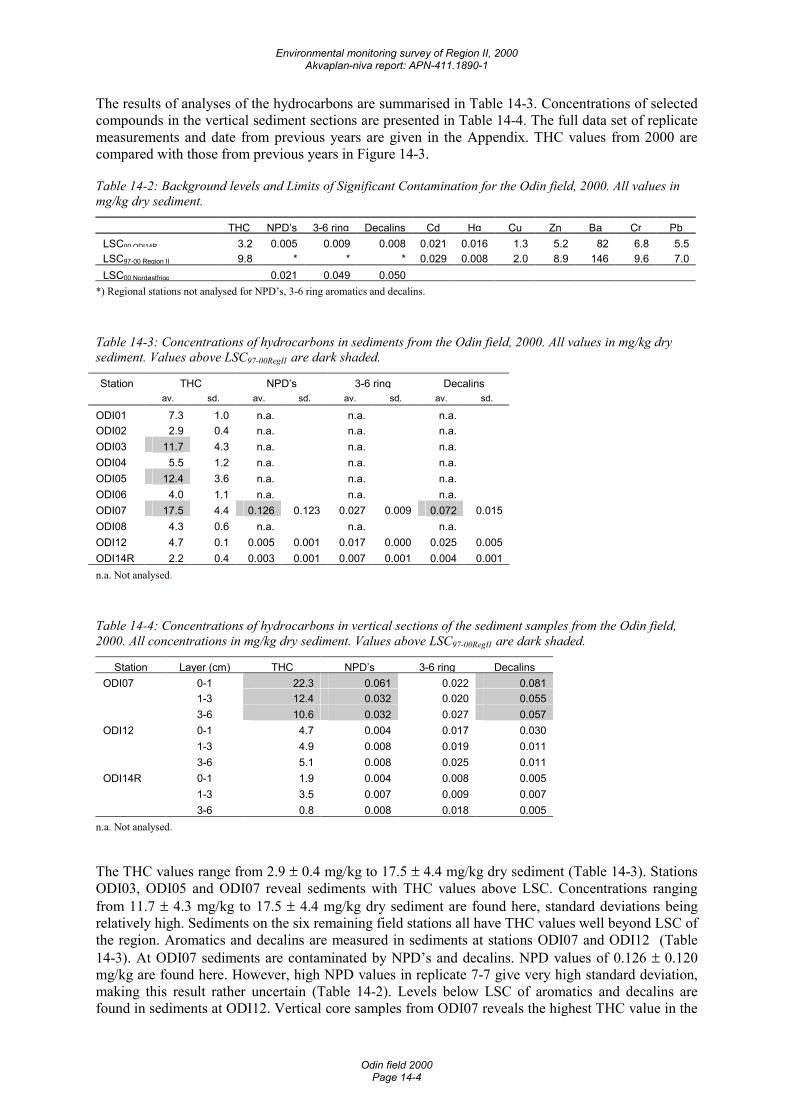
Environmental monitoring survey of Region II, 2000 Akvaplan-niva report: APN-411.1890-1
Odin field 2000 Page 14-4
The results of analyses of the hydrocarbons are summarised in Table 14-3. Concentrations of selected compounds in the vertical sediment sections are presented in Table 14-4. The full data set of replicate measurements and date from previous years are given in the Appendix. THC values from 2000 are compared with those from previous years in Figure 14-3.
Table 14-2: Background levels and Limits of Significant Contamination for the Odin field, 2000. All values in mg/kg dry sediment.
THC NPD’s 3-6 ring Decalins Cd Hg Cu Zn Ba Cr PbLSC00 ODI14R 3.2 0.005 0.009 0.008 0.021 0.016 1.3 5.2 82 6.8 5.5LSC97-00 Region II 9.8 * * * 0.029 0.008 2.0 8.9 146 9.6 7.0LSC00 Nordøstfrigg 0.021 0.049 0.050
*) Regional stations not analysed for NPD’s, 3-6 ring aromatics and decalins.
Table 14-3: Concentrations of hydrocarbons in sediments from the Odin field, 2000. All values in mg/kg dry sediment. Values above LSC97-00RegII are dark shaded.
Station THC NPD’s 3-6 ring Decalins av. sd. av. sd. av. sd. av. sd.
ODI01 7.3 1.0 n.a. n.a. n.a.ODI02 2.9 0.4 n.a. n.a. n.a.ODI03 11.7 4.3 n.a. n.a. n.a.ODI04 5.5 1.2 n.a. n.a. n.a.ODI05 12.4 3.6 n.a. n.a. n.a.ODI06 4.0 1.1 n.a. n.a. n.a.ODI07 17.5 4.4 0.126 0.123 0.027 0.009 0.072 0.015ODI08 4.3 0.6 n.a. n.a. n.a.ODI12 4.7 0.1 0.005 0.001 0.017 0.000 0.025 0.005ODI14R 2.2 0.4 0.003 0.001 0.007 0.001 0.004 0.001n.a. Not analysed.
Table 14-4: Concentrations of hydrocarbons in vertical sections of the sediment samples from the Odin field, 2000. All concentrations in mg/kg dry sediment. Values above LSC97-00RegII are dark shaded.
Station Layer (cm) THC NPD’s 3-6 ring DecalinsODI07 0-1 22.3 0.061 0.022 0.081 1-3 12.4 0.032 0.020 0.055 3-6 10.6 0.032 0.027 0.057ODI12 0-1 4.7 0.004 0.017 0.030 1-3 4.9 0.008 0.019 0.011 3-6 5.1 0.008 0.025 0.011ODI14R 0-1 1.9 0.004 0.008 0.005 1-3 3.5 0.007 0.009 0.007 3-6 0.8 0.008 0.018 0.005
n.a. Not analysed.
The THC values range from 2.9 ± 0.4 mg/kg to 17.5 ± 4.4 mg/kg dry sediment (Table 14-3). Stations ODI03, ODI05 and ODI07 reveal sediments with THC values above LSC. Concentrations ranging from 11.7 ± 4.3 mg/kg to 17.5 ± 4.4 mg/kg dry sediment are found here, standard deviations being relatively high. Sediments on the six remaining field stations all have THC values well beyond LSC of the region. Aromatics and decalins are measured in sediments at stations ODI07 and ODI12 (Table 14-3). At ODI07 sediments are contaminated by NPD’s and decalins. NPD values of 0.126 ± 0.120 mg/kg are found here. However, high NPD values in replicate 7-7 give very high standard deviation, making this result rather uncertain (Table 14-2). Levels below LSC of aromatics and decalins are found in sediments at ODI12. Vertical core samples from ODI07 reveals the highest THC value in the
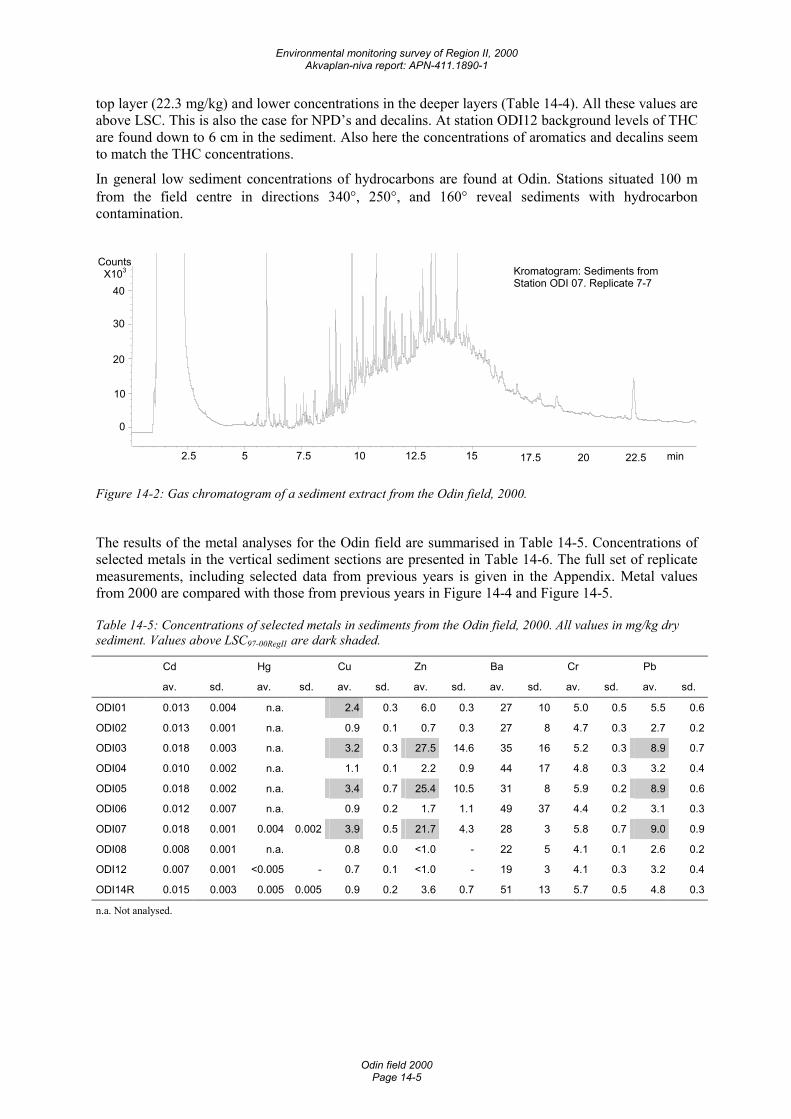
Environmental monitoring survey of Region II, 2000 Akvaplan-niva report: APN-411.1890-1
Odin field 2000 Page 14-5
top layer (22.3 mg/kg) and lower concentrations in the deeper layers (Table 14-4). All these values are above LSC. This is also the case for NPD’s and decalins. At station ODI12 background levels of THC are found down to 6 cm in the sediment. Also here the concentrations of aromatics and decalins seem to match the THC concentrations.
In general low sediment concentrations of hydrocarbons are found at Odin. Stations situated 100 m from the field centre in directions 340°, 250°, and 160° reveal sediments with hydrocarbon contamination.
min 2.5 5 7.5 10 12.5 15 17.5 20 22.5
Counts X103
0
10
20
30
40
Kromatogram: Sediments from Station ODI 07. Replicate 7-7
Figure 14-2: Gas chromatogram of a sediment extract from the Odin field, 2000.
The results of the metal analyses for the Odin field are summarised in Table 14-5. Concentrations of selected metals in the vertical sediment sections are presented in Table 14-6. The full set of replicate measurements, including selected data from previous years is given in the Appendix. Metal values from 2000 are compared with those from previous years in Figure 14-4 and Figure 14-5.
Table 14-5: Concentrations of selected metals in sediments from the Odin field, 2000. All values in mg/kg dry sediment. Values above LSC97-00RegII are dark shaded.
Cd Hg Cu Zn Ba Cr Pb
av. sd. av. sd. av. sd. av. sd. av. sd. av. sd. av. sd.
ODI01 0.013 0.004 n.a. 2.4 0.3 6.0 0.3 27 10 5.0 0.5 5.5 0.6
ODI02 0.013 0.001 n.a. 0.9 0.1 0.7 0.3 27 8 4.7 0.3 2.7 0.2
ODI03 0.018 0.003 n.a. 3.2 0.3 27.5 14.6 35 16 5.2 0.3 8.9 0.7
ODI04 0.010 0.002 n.a. 1.1 0.1 2.2 0.9 44 17 4.8 0.3 3.2 0.4
ODI05 0.018 0.002 n.a. 3.4 0.7 25.4 10.5 31 8 5.9 0.2 8.9 0.6
ODI06 0.012 0.007 n.a. 0.9 0.2 1.7 1.1 49 37 4.4 0.2 3.1 0.3
ODI07 0.018 0.001 0.004 0.002 3.9 0.5 21.7 4.3 28 3 5.8 0.7 9.0 0.9
ODI08 0.008 0.001 n.a. 0.8 0.0 <1.0 - 22 5 4.1 0.1 2.6 0.2
ODI12 0.007 0.001 <0.005 - 0.7 0.1 <1.0 - 19 3 4.1 0.3 3.2 0.4
ODI14R 0.015 0.003 0.005 0.005 0.9 0.2 3.6 0.7 51 13 5.7 0.5 4.8 0.3
n.a. Not analysed.
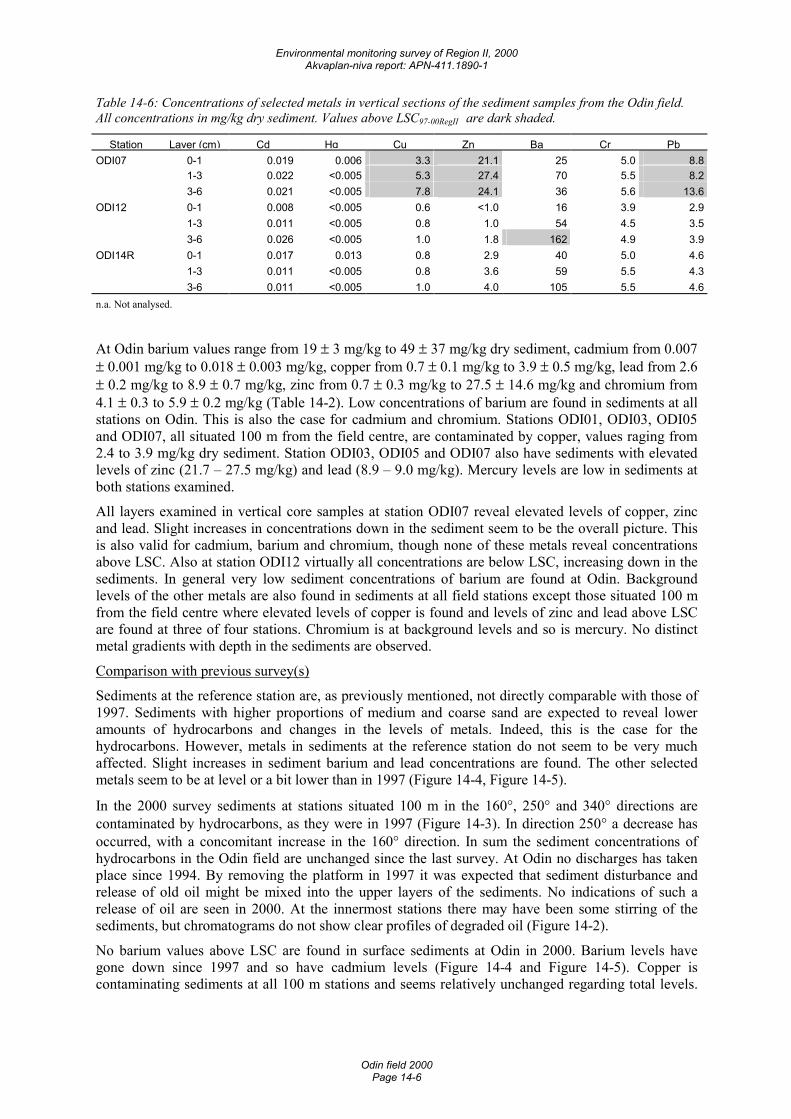
Environmental monitoring survey of Region II, 2000 Akvaplan-niva report: APN-411.1890-1
Odin field 2000 Page 14-6
Table 14-6: Concentrations of selected metals in vertical sections of the sediment samples from the Odin field. All concentrations in mg/kg dry sediment. Values above LSC97-00RegII are dark shaded.
Station Layer (cm) Cd Hg Cu Zn Ba Cr PbODI07 0-1 0.019 0.006 3.3 21.1 25 5.0 8.8 1-3 0.022 <0.005 5.3 27.4 70 5.5 8.2 3-6 0.021 <0.005 7.8 24.1 36 5.6 13.6ODI12 0-1 0.008 <0.005 0.6 <1.0 16 3.9 2.9 1-3 0.011 <0.005 0.8 1.0 54 4.5 3.5 3-6 0.026 <0.005 1.0 1.8 162 4.9 3.9ODI14R 0-1 0.017 0.013 0.8 2.9 40 5.0 4.6 1-3 0.011 <0.005 0.8 3.6 59 5.5 4.3 3-6 0.011 <0.005 1.0 4.0 105 5.5 4.6n.a. Not analysed.
At Odin barium values range from 19 ± 3 mg/kg to 49 ± 37 mg/kg dry sediment, cadmium from 0.007 ± 0.001 mg/kg to 0.018 ± 0.003 mg/kg, copper from 0.7 ± 0.1 mg/kg to 3.9 ± 0.5 mg/kg, lead from 2.6 ± 0.2 mg/kg to 8.9 ± 0.7 mg/kg, zinc from 0.7 ± 0.3 mg/kg to 27.5 ± 14.6 mg/kg and chromium from 4.1 ± 0.3 to 5.9 ± 0.2 mg/kg (Table 14-2). Low concentrations of barium are found in sediments at all stations on Odin. This is also the case for cadmium and chromium. Stations ODI01, ODI03, ODI05 and ODI07, all situated 100 m from the field centre, are contaminated by copper, values raging from 2.4 to 3.9 mg/kg dry sediment. Station ODI03, ODI05 and ODI07 also have sediments with elevated levels of zinc (21.7 – 27.5 mg/kg) and lead (8.9 – 9.0 mg/kg). Mercury levels are low in sediments at both stations examined.
All layers examined in vertical core samples at station ODI07 reveal elevated levels of copper, zinc and lead. Slight increases in concentrations down in the sediment seem to be the overall picture. This is also valid for cadmium, barium and chromium, though none of these metals reveal concentrations above LSC. Also at station ODI12 virtually all concentrations are below LSC, increasing down in the sediments. In general very low sediment concentrations of barium are found at Odin. Background levels of the other metals are also found in sediments at all field stations except those situated 100 m from the field centre where elevated levels of copper is found and levels of zinc and lead above LSC are found at three of four stations. Chromium is at background levels and so is mercury. No distinct metal gradients with depth in the sediments are observed.
Comparison with previous survey(s)
Sediments at the reference station are, as previously mentioned, not directly comparable with those of 1997. Sediments with higher proportions of medium and coarse sand are expected to reveal lower amounts of hydrocarbons and changes in the levels of metals. Indeed, this is the case for the hydrocarbons. However, metals in sediments at the reference station do not seem to be very much affected. Slight increases in sediment barium and lead concentrations are found. The other selected metals seem to be at level or a bit lower than in 1997 (Figure 14-4, Figure 14-5).
In the 2000 survey sediments at stations situated 100 m in the 160°, 250° and 340° directions are contaminated by hydrocarbons, as they were in 1997 (Figure 14-3). In direction 250° a decrease has occurred, with a concomitant increase in the 160° direction. In sum the sediment concentrations of hydrocarbons in the Odin field are unchanged since the last survey. At Odin no discharges has taken place since 1994. By removing the platform in 1997 it was expected that sediment disturbance and release of old oil might be mixed into the upper layers of the sediments. No indications of such a release of oil are seen in 2000. At the innermost stations there may have been some stirring of the sediments, but chromatograms do not show clear profiles of degraded oil (Figure 14-2).
No barium values above LSC are found in surface sediments at Odin in 2000. Barium levels have gone down since 1997 and so have cadmium levels (Figure 14-4 and Figure 14-5). Copper is contaminating sediments at all 100 m stations and seems relatively unchanged regarding total levels.
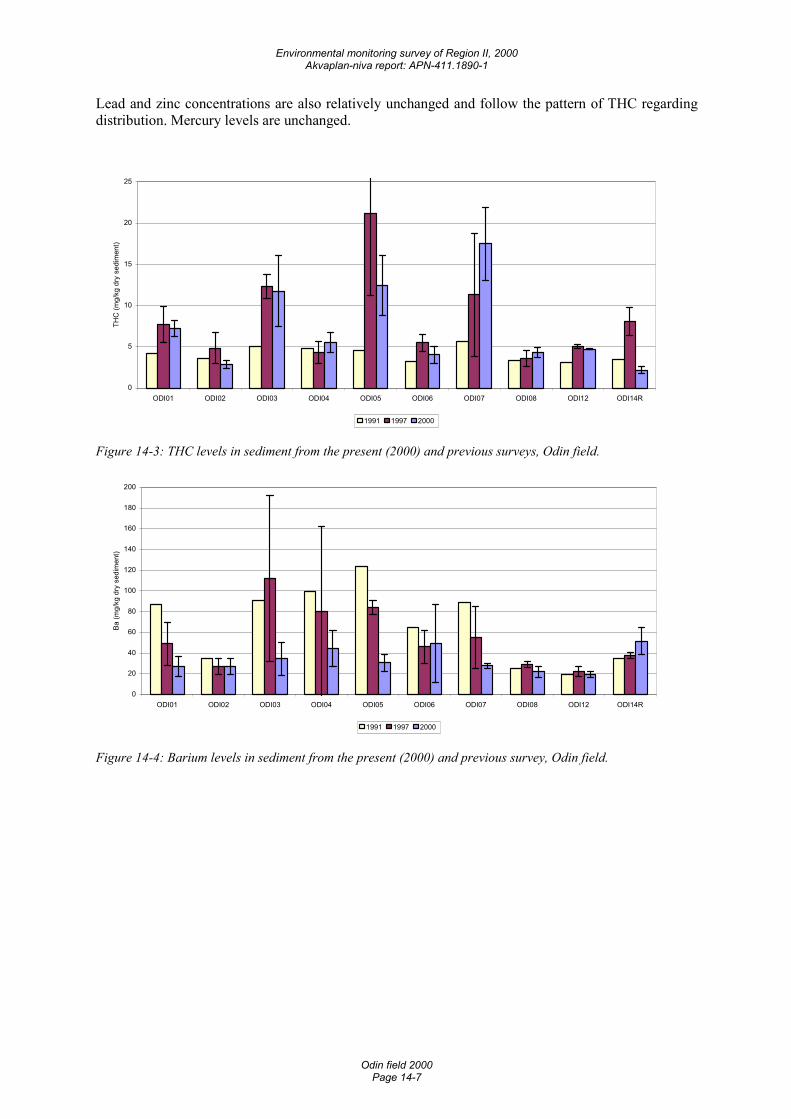
Environmental monitoring survey of Region II, 2000 Akvaplan-niva report: APN-411.1890-1
Odin field 2000 Page 14-7
Lead and zinc concentrations are also relatively unchanged and follow the pattern of THC regarding distribution. Mercury levels are unchanged.
0
5
10
15
20
25
ODI01 ODI02 ODI03 ODI04 ODI05 ODI06 ODI07 ODI08 ODI12 ODI14R
THC
(mg/
kg d
ry s
edim
ent)
1991 1997 2000
Figure 14-3: THC levels in sediment from the present (2000) and previous surveys, Odin field.
0
20
40
60
80
100
120
140
160
180
200
ODI01 ODI02 ODI03 ODI04 ODI05 ODI06 ODI07 ODI08 ODI12 ODI14R
Ba (m
g/kg
dry
sed
imen
t)
1991 1997 2000
Figure 14-4: Barium levels in sediment from the present (2000) and previous survey, Odin field.
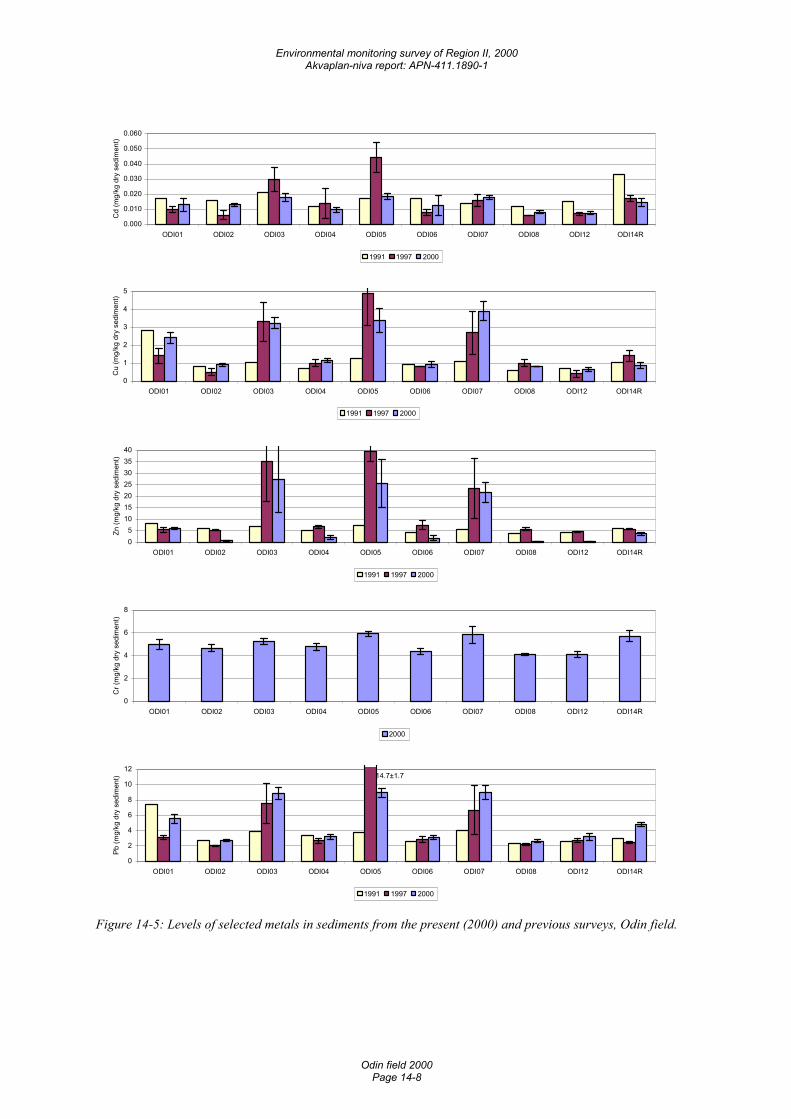
Environmental monitoring survey of Region II, 2000 Akvaplan-niva report: APN-411.1890-1
Odin field 2000 Page 14-8
0.000
0.010
0.020
0.030
0.040
0.050
0.060
ODI01 ODI02 ODI03 ODI04 ODI05 ODI06 ODI07 ODI08 ODI12 ODI14R
Cd
(mg/
kg d
ry s
edim
ent)
1991 1997 2000
0
1
2
3
4
5
ODI01 ODI02 ODI03 ODI04 ODI05 ODI06 ODI07 ODI08 ODI12 ODI14R
Cu
(mg/
kg d
ry s
edim
ent)
1991 1997 2000
05
10152025303540
ODI01 ODI02 ODI03 ODI04 ODI05 ODI06 ODI07 ODI08 ODI12 ODI14R
Zn (m
g/kg
dry
sed
imen
t)
1991 1997 2000
0
2
4
6
8
ODI01 ODI02 ODI03 ODI04 ODI05 ODI06 ODI07 ODI08 ODI12 ODI14R
Cr (
mg/
kg d
ry s
edim
ent)
2000
14.7±1.7
0
2
4
6
8
10
12
ODI01 ODI02 ODI03 ODI04 ODI05 ODI06 ODI07 ODI08 ODI12 ODI14R
Pb (m
g/kg
dry
sed
imen
t)
1991 1997 2000
Figure 14-5: Levels of selected metals in sediments from the present (2000) and previous surveys, Odin field.
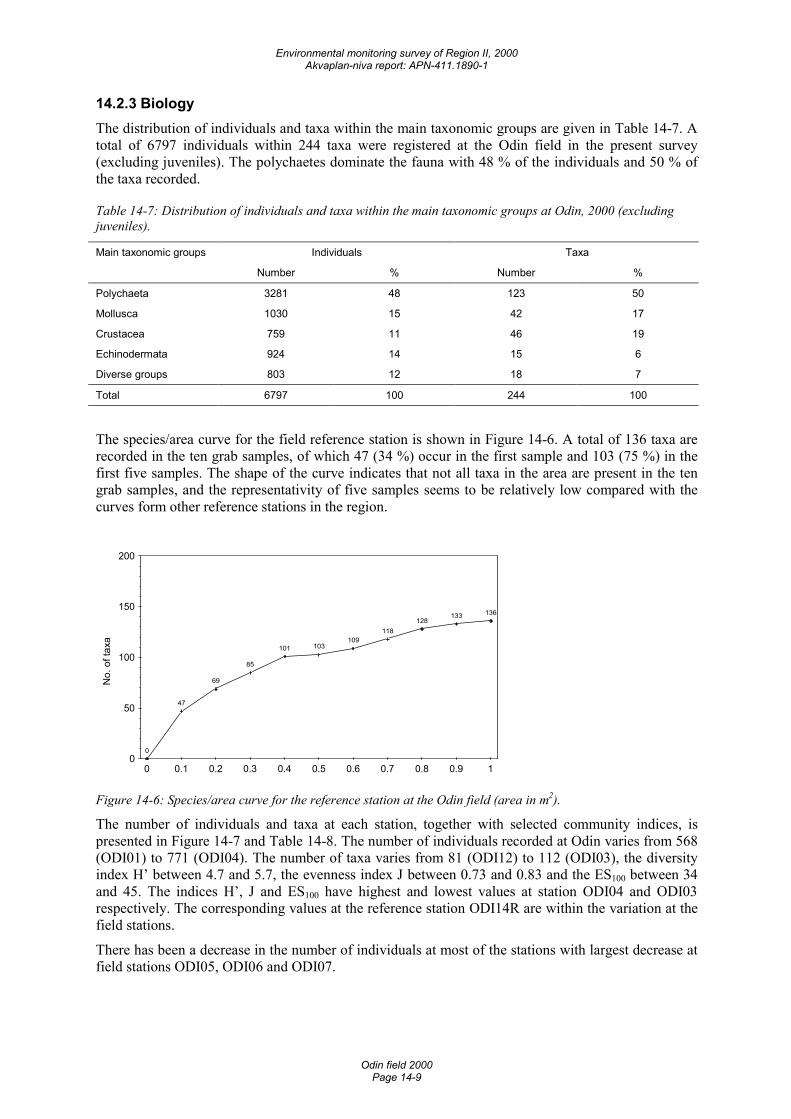
Environmental monitoring survey of Region II, 2000 Akvaplan-niva report: APN-411.1890-1
Odin field 2000 Page 14-9
14.2.3 Biology The distribution of individuals and taxa within the main taxonomic groups are given in Table 14-7. A total of 6797 individuals within 244 taxa were registered at the Odin field in the present survey (excluding juveniles). The polychaetes dominate the fauna with 48 % of the individuals and 50 % of the taxa recorded.
Table 14-7: Distribution of individuals and taxa within the main taxonomic groups at Odin, 2000 (excluding juveniles).
Main taxonomic groups Individuals Taxa
Number % Number %
Polychaeta 3281 48 123 50
Mollusca 1030 15 42 17
Crustacea 759 11 46 19
Echinodermata 924 14 15 6
Diverse groups 803 12 18 7
Total 6797 100 244 100
The species/area curve for the field reference station is shown in Figure 14-6. A total of 136 taxa are recorded in the ten grab samples, of which 47 (34 %) occur in the first sample and 103 (75 %) in the first five samples. The shape of the curve indicates that not all taxa in the area are present in the ten grab samples, and the representativity of five samples seems to be relatively low compared with the curves form other reference stations in the region.
No.
of t
axa
0
47
69
85
101 103109
118128
133 136
0
50
100
150
200
0 0.1 0.2 0.3 0.4 0.5 0.6 0.7 0.8 0.9 1
Figure 14-6: Species/area curve for the reference station at the Odin field (area in m2).
The number of individuals and taxa at each station, together with selected community indices, is presented in Figure 14-7 and Table 14-8. The number of individuals recorded at Odin varies from 568 (ODI01) to 771 (ODI04). The number of taxa varies from 81 (ODI12) to 112 (ODI03), the diversity index H’ between 4.7 and 5.7, the evenness index J between 0.73 and 0.83 and the ES100 between 34 and 45. The indices H’, J and ES100 have highest and lowest values at station ODI04 and ODI03 respectively. The corresponding values at the reference station ODI14R are within the variation at the field stations.
There has been a decrease in the number of individuals at most of the stations with largest decrease at field stations ODI05, ODI06 and ODI07.
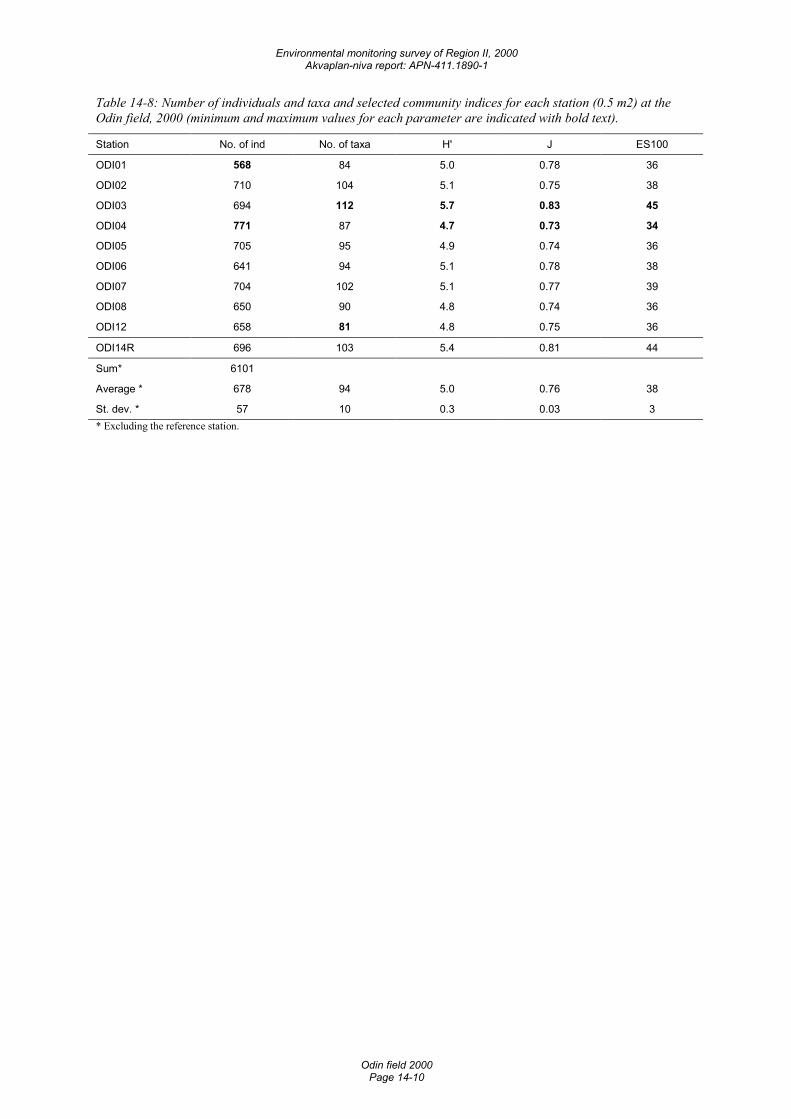
Environmental monitoring survey of Region II, 2000 Akvaplan-niva report: APN-411.1890-1
Odin field 2000 Page 14-10
Table 14-8: Number of individuals and taxa and selected community indices for each station (0.5 m2) at the Odin field, 2000 (minimum and maximum values for each parameter are indicated with bold text).
Station No. of ind No. of taxa H' J ES100
ODI01 568 84 5.0 0.78 36
ODI02 710 104 5.1 0.75 38
ODI03 694 112 5.7 0.83 45
ODI04 771 87 4.7 0.73 34
ODI05 705 95 4.9 0.74 36
ODI06 641 94 5.1 0.78 38
ODI07 704 102 5.1 0.77 39
ODI08 650 90 4.8 0.74 36
ODI12 658 81 4.8 0.75 36
ODI14R 696 103 5.4 0.81 44
Sum* 6101
Average * 678 94 5.0 0.76 38
St. dev. * 57 10 0.3 0.03 3 * Excluding the reference station.
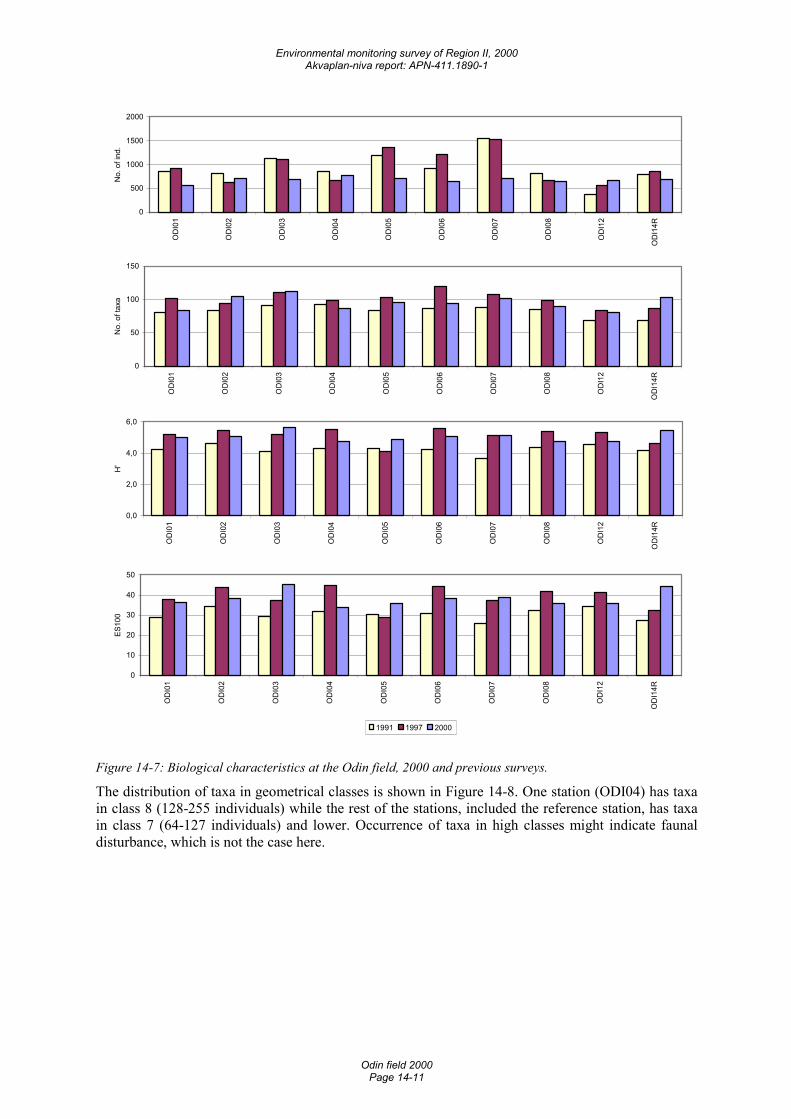
Environmental monitoring survey of Region II, 2000 Akvaplan-niva report: APN-411.1890-1
Odin field 2000 Page 14-11
0
500
1000
1500
2000
OD
I01
OD
I02
OD
I03
OD
I04
OD
I05
OD
I06
OD
I07
OD
I08
OD
I12
OD
I14R
No.
of i
nd.
0
50
100
150
OD
I01
OD
I02
OD
I03
OD
I04
OD
I05
OD
I06
OD
I07
OD
I08
OD
I12
OD
I14R
No.
of t
axa
0,0
2,0
4,0
6,0
OD
I01
OD
I02
OD
I03
OD
I04
OD
I05
OD
I06
OD
I07
OD
I08
OD
I12
OD
I14R
H'
0
10
20
30
40
50
OD
I01
OD
I02
OD
I03
OD
I04
OD
I05
OD
I06
OD
I07
OD
I08
OD
I12
OD
I14R
ES10
0
1991 1997 2000
Figure 14-7: Biological characteristics at the Odin field, 2000 and previous surveys.
The distribution of taxa in geometrical classes is shown in Figure 14-8. One station (ODI04) has taxa in class 8 (128-255 individuals) while the rest of the stations, included the reference station, has taxa in class 7 (64-127 individuals) and lower. Occurrence of taxa in high classes might indicate faunal disturbance, which is not the case here.
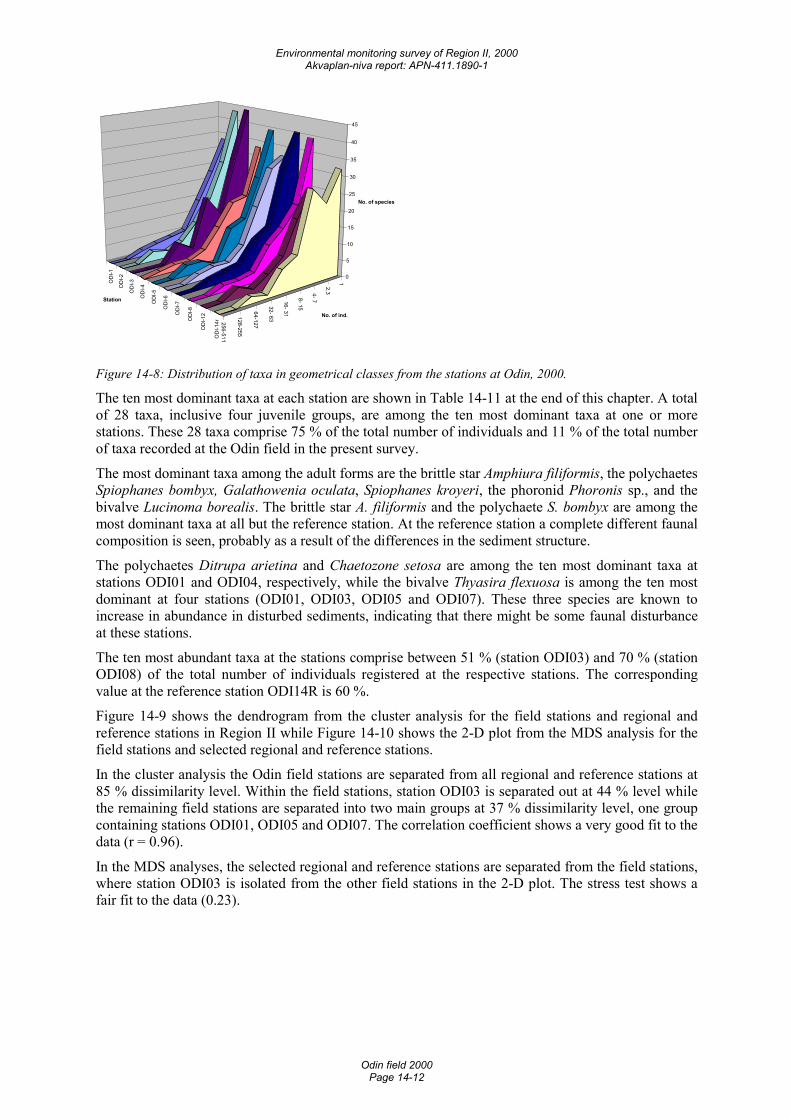
Environmental monitoring survey of Region II, 2000 Akvaplan-niva report: APN-411.1890-1
Odin field 2000 Page 14-12
1
2,3 4- 7 8- 15
16- 31
32- 63
64-127
128-255
256-511
OD
I-1
OD
I-2
OD
I-3
OD
I-4
OD
I-5
OD
I-6
OD
I-7
OD
I-8
OD
I-12
OD
I-14r
0
5
10
15
20
25
30
35
40
45
No. of species
No. of ind.
Station
Figure 14-8: Distribution of taxa in geometrical classes from the stations at Odin, 2000.
The ten most dominant taxa at each station are shown in Table 14-11 at the end of this chapter. A total of 28 taxa, inclusive four juvenile groups, are among the ten most dominant taxa at one or more stations. These 28 taxa comprise 75 % of the total number of individuals and 11 % of the total number of taxa recorded at the Odin field in the present survey.
The most dominant taxa among the adult forms are the brittle star Amphiura filiformis, the polychaetes Spiophanes bombyx, Galathowenia oculata, Spiophanes kroyeri, the phoronid Phoronis sp., and the bivalve Lucinoma borealis. The brittle star A. filiformis and the polychaete S. bombyx are among the most dominant taxa at all but the reference station. At the reference station a complete different faunal composition is seen, probably as a result of the differences in the sediment structure.
The polychaetes Ditrupa arietina and Chaetozone setosa are among the ten most dominant taxa at stations ODI01 and ODI04, respectively, while the bivalve Thyasira flexuosa is among the ten most dominant at four stations (ODI01, ODI03, ODI05 and ODI07). These three species are known to increase in abundance in disturbed sediments, indicating that there might be some faunal disturbance at these stations.
The ten most abundant taxa at the stations comprise between 51 % (station ODI03) and 70 % (station ODI08) of the total number of individuals registered at the respective stations. The corresponding value at the reference station ODI14R is 60 %.
Figure 14-9 shows the dendrogram from the cluster analysis for the field stations and regional and reference stations in Region II while Figure 14-10 shows the 2-D plot from the MDS analysis for the field stations and selected regional and reference stations.
In the cluster analysis the Odin field stations are separated from all regional and reference stations at 85 % dissimilarity level. Within the field stations, station ODI03 is separated out at 44 % level while the remaining field stations are separated into two main groups at 37 % dissimilarity level, one group containing stations ODI01, ODI05 and ODI07. The correlation coefficient shows a very good fit to the data (r = 0.96).
In the MDS analyses, the selected regional and reference stations are separated from the field stations, where station ODI03 is isolated from the other field stations in the 2-D plot. The stress test shows a fair fit to the data (0.23).
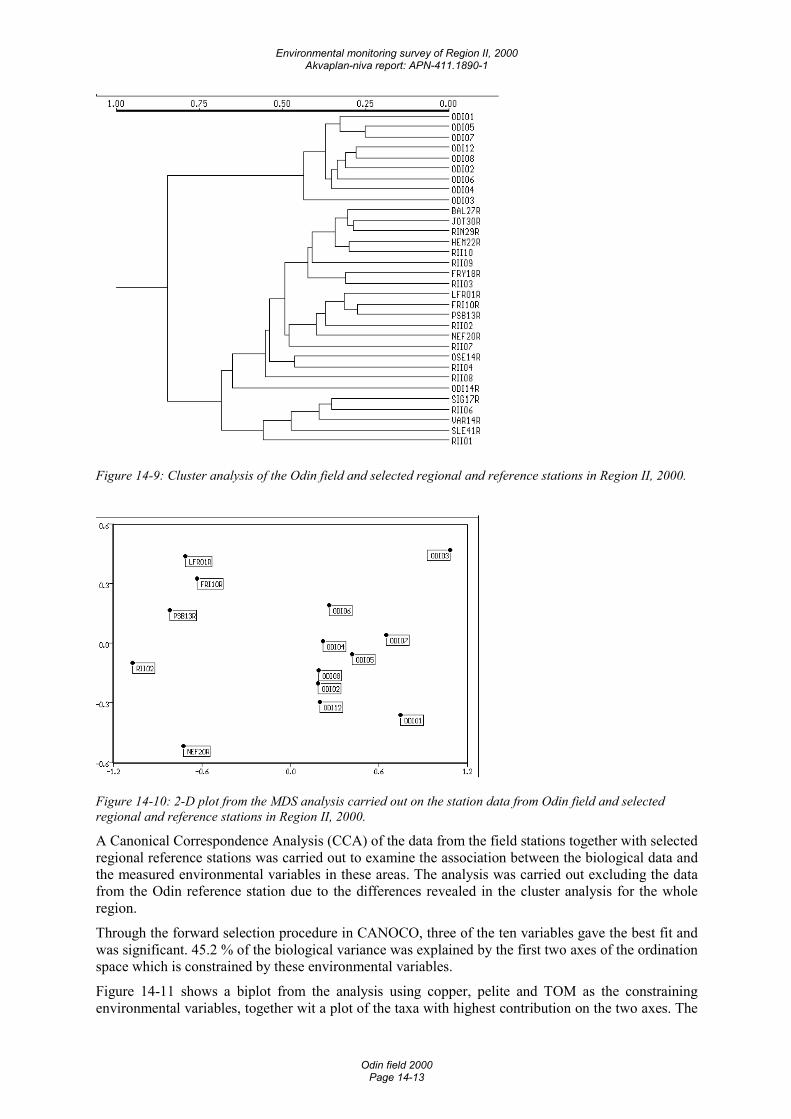
Environmental monitoring survey of Region II, 2000 Akvaplan-niva report: APN-411.1890-1
Odin field 2000 Page 14-13
Figure 14-9: Cluster analysis of the Odin field and selected regional and reference stations in Region II, 2000.
Figure 14-10: 2-D plot from the MDS analysis carried out on the station data from Odin field and selected regional and reference stations in Region II, 2000.
A Canonical Correspondence Analysis (CCA) of the data from the field stations together with selected regional reference stations was carried out to examine the association between the biological data and the measured environmental variables in these areas. The analysis was carried out excluding the data from the Odin reference station due to the differences revealed in the cluster analysis for the whole region.
Through the forward selection procedure in CANOCO, three of the ten variables gave the best fit and was significant. 45.2 % of the biological variance was explained by the first two axes of the ordination space which is constrained by these environmental variables.
Figure 14-11 shows a biplot from the analysis using copper, pelite and TOM as the constraining environmental variables, together wit a plot of the taxa with highest contribution on the two axes. The
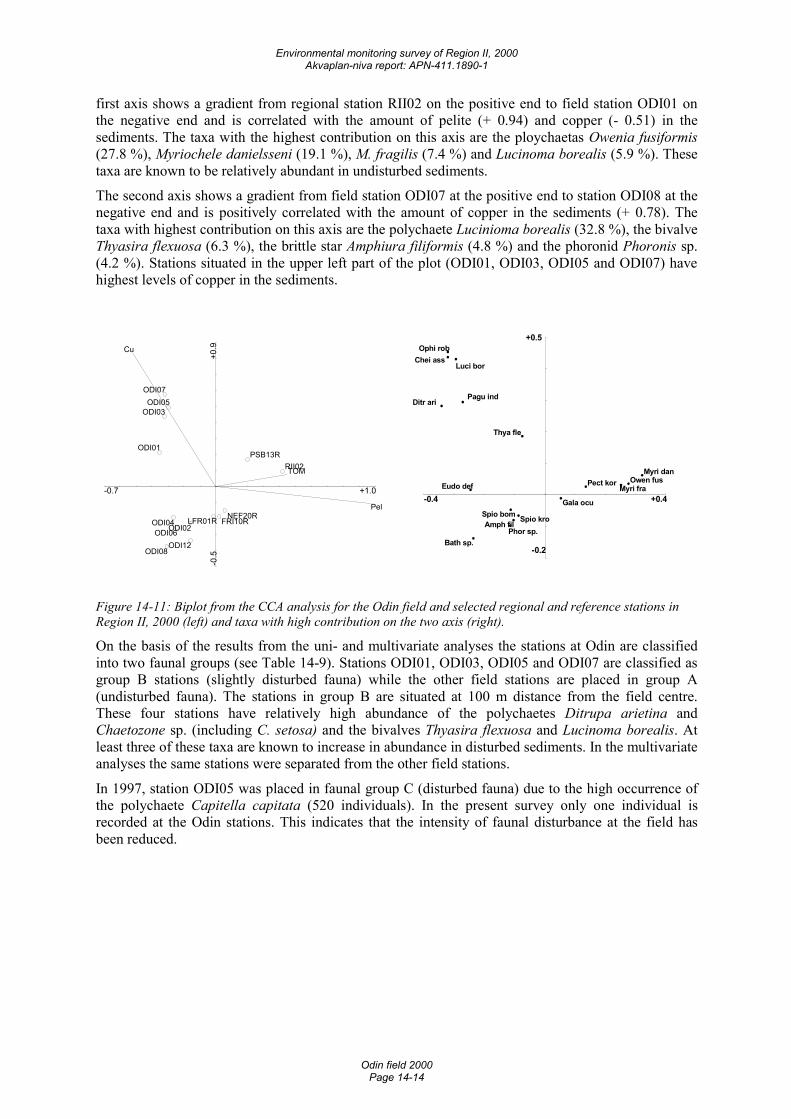
Environmental monitoring survey of Region II, 2000 Akvaplan-niva report: APN-411.1890-1
Odin field 2000 Page 14-14
first axis shows a gradient from regional station RII02 on the positive end to field station ODI01 on the negative end and is correlated with the amount of pelite (+ 0.94) and copper (- 0.51) in the sediments. The taxa with the highest contribution on this axis are the ploychaetas Owenia fusiformis (27.8 %), Myriochele danielsseni (19.1 %), M. fragilis (7.4 %) and Lucinoma borealis (5.9 %). These taxa are known to be relatively abundant in undisturbed sediments.
The second axis shows a gradient from field station ODI07 at the positive end to station ODI08 at the negative end and is positively correlated with the amount of copper in the sediments (+ 0.78). The taxa with highest contribution on this axis are the polychaete Lucinioma borealis (32.8 %), the bivalve Thyasira flexuosa (6.3 %), the brittle star Amphiura filiformis (4.8 %) and the phoronid Phoronis sp. (4.2 %). Stations situated in the upper left part of the plot (ODI01, ODI03, ODI05 and ODI07) have highest levels of copper in the sediments.
-0.7 +1.0
-0.5
+0.9
Pel
Cu
TOMRII02
ODI01
ODI03
ODI07
ODI08
ODI05
ODI04ODI06
PSB13R
ODI12
ODI02NEF20R
FRI10RLFR01R�
-0.4 +0.4
-0.2
+0.5
Ditr ari
Myri dan
Chei assOphi rob
Luci bor
Owen fus
Pagu ind
Myri fraEudo def
Bath sp.
Pect kor
Phor sp.
Spio bomAmph fil Spio kro
Thya fle
Gala ocu
Figure 14-11: Biplot from the CCA analysis for the Odin field and selected regional and reference stations in Region II, 2000 (left) and taxa with high contribution on the two axis (right).
On the basis of the results from the uni- and multivariate analyses the stations at Odin are classified into two faunal groups (see Table 14-9). Stations ODI01, ODI03, ODI05 and ODI07 are classified as group B stations (slightly disturbed fauna) while the other field stations are placed in group A (undisturbed fauna). The stations in group B are situated at 100 m distance from the field centre. These four stations have relatively high abundance of the polychaetes Ditrupa arietina and Chaetozone sp. (including C. setosa) and the bivalves Thyasira flexuosa and Lucinoma borealis. At least three of these taxa are known to increase in abundance in disturbed sediments. In the multivariate analyses the same stations were separated from the other field stations.
In 1997, station ODI05 was placed in faunal group C (disturbed fauna) due to the high occurrence of the polychaete Capitella capitata (520 individuals). In the present survey only one individual is recorded at the Odin stations. This indicates that the intensity of faunal disturbance at the field has been reduced.
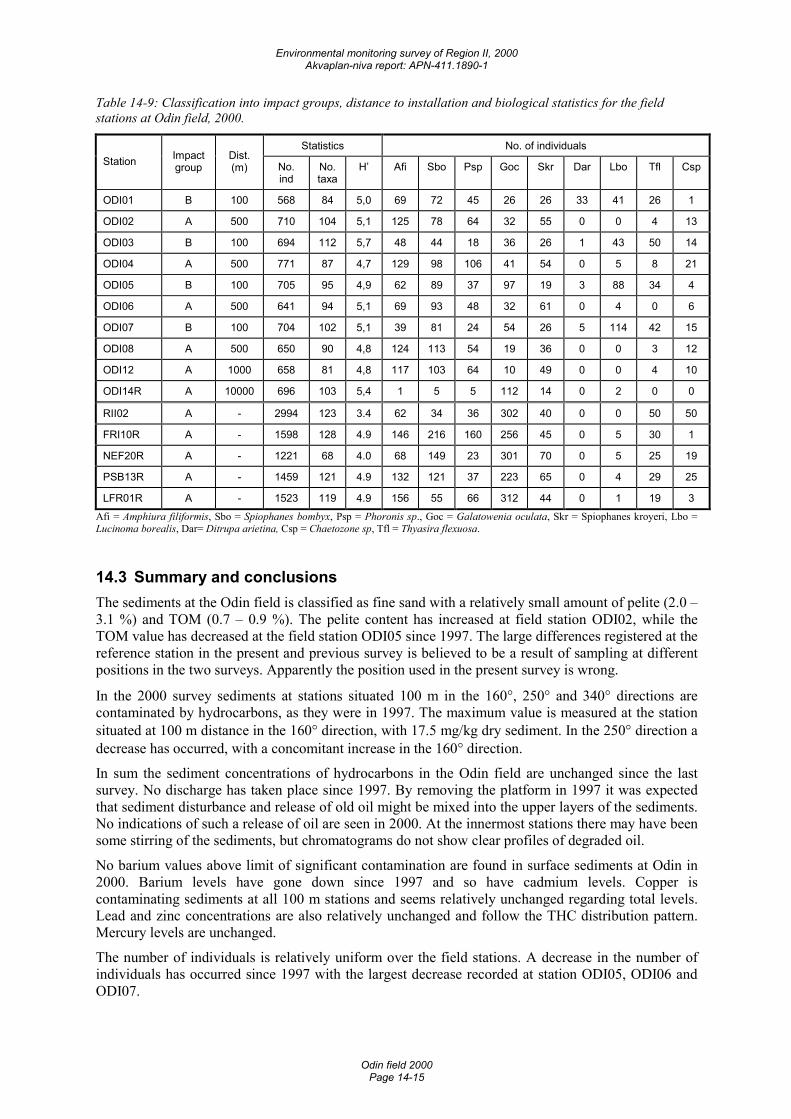
Environmental monitoring survey of Region II, 2000 Akvaplan-niva report: APN-411.1890-1
Odin field 2000 Page 14-15
Table 14-9: Classification into impact groups, distance to installation and biological statistics for the field stations at Odin field, 2000.
Statistics No. of individuals Station Impact
group Dist. (m) No.
ind No. taxa
H’ Afi Sbo Psp Goc Skr Dar Lbo Tfl Csp
ODI01 B 100 568 84 5,0 69 72 45 26 26 33 41 26 1
ODI02 A 500 710 104 5,1 125 78 64 32 55 0 0 4 13
ODI03 B 100 694 112 5,7 48 44 18 36 26 1 43 50 14
ODI04 A 500 771 87 4,7 129 98 106 41 54 0 5 8 21
ODI05 B 100 705 95 4,9 62 89 37 97 19 3 88 34 4
ODI06 A 500 641 94 5,1 69 93 48 32 61 0 4 0 6
ODI07 B 100 704 102 5,1 39 81 24 54 26 5 114 42 15
ODI08 A 500 650 90 4,8 124 113 54 19 36 0 0 3 12
ODI12 A 1000 658 81 4,8 117 103 64 10 49 0 0 4 10
ODI14R A 10000 696 103 5,4 1 5 5 112 14 0 2 0 0
RII02 A - 2994 123 3.4 62 34 36 302 40 0 0 50 50
FRI10R A - 1598 128 4.9 146 216 160 256 45 0 5 30 1
NEF20R A - 1221 68 4.0 68 149 23 301 70 0 5 25 19
PSB13R A - 1459 121 4.9 132 121 37 223 65 0 4 29 25
LFR01R A - 1523 119 4.9 156 55 66 312 44 0 1 19 3 Afi = Amphiura filiformis, Sbo = Spiophanes bombyx, Psp = Phoronis sp., Goc = Galatowenia oculata, Skr = Spiophanes kroyeri, Lbo = Lucinoma borealis, Dar= Ditrupa arietina, Csp = Chaetozone sp, Tfl = Thyasira flexuosa.
14.3 Summary and conclusions The sediments at the Odin field is classified as fine sand with a relatively small amount of pelite (2.0 – 3.1 %) and TOM (0.7 – 0.9 %). The pelite content has increased at field station ODI02, while the TOM value has decreased at the field station ODI05 since 1997. The large differences registered at the reference station in the present and previous survey is believed to be a result of sampling at different positions in the two surveys. Apparently the position used in the present survey is wrong.
In the 2000 survey sediments at stations situated 100 m in the 160°, 250° and 340° directions are contaminated by hydrocarbons, as they were in 1997. The maximum value is measured at the station situated at 100 m distance in the 160° direction, with 17.5 mg/kg dry sediment. In the 250° direction a decrease has occurred, with a concomitant increase in the 160° direction.
In sum the sediment concentrations of hydrocarbons in the Odin field are unchanged since the last survey. No discharge has taken place since 1997. By removing the platform in 1997 it was expected that sediment disturbance and release of old oil might be mixed into the upper layers of the sediments. No indications of such a release of oil are seen in 2000. At the innermost stations there may have been some stirring of the sediments, but chromatograms do not show clear profiles of degraded oil.
No barium values above limit of significant contamination are found in surface sediments at Odin in 2000. Barium levels have gone down since 1997 and so have cadmium levels. Copper is contaminating sediments at all 100 m stations and seems relatively unchanged regarding total levels. Lead and zinc concentrations are also relatively unchanged and follow the THC distribution pattern. Mercury levels are unchanged.
The number of individuals is relatively uniform over the field stations. A decrease in the number of individuals has occurred since 1997 with the largest decrease recorded at station ODI05, ODI06 and ODI07.
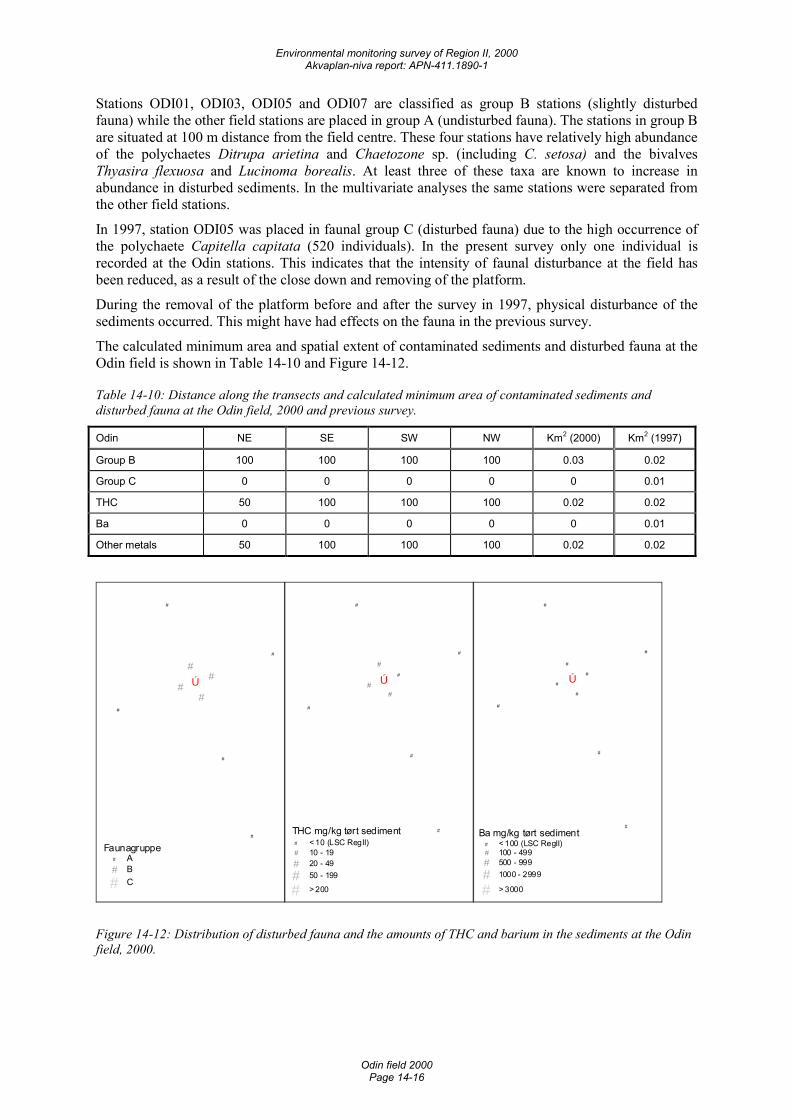
Environmental monitoring survey of Region II, 2000 Akvaplan-niva report: APN-411.1890-1
Odin field 2000 Page 14-16
Stations ODI01, ODI03, ODI05 and ODI07 are classified as group B stations (slightly disturbed fauna) while the other field stations are placed in group A (undisturbed fauna). The stations in group B are situated at 100 m distance from the field centre. These four stations have relatively high abundance of the polychaetes Ditrupa arietina and Chaetozone sp. (including C. setosa) and the bivalves Thyasira flexuosa and Lucinoma borealis. At least three of these taxa are known to increase in abundance in disturbed sediments. In the multivariate analyses the same stations were separated from the other field stations.
In 1997, station ODI05 was placed in faunal group C (disturbed fauna) due to the high occurrence of the polychaete Capitella capitata (520 individuals). In the present survey only one individual is recorded at the Odin stations. This indicates that the intensity of faunal disturbance at the field has been reduced, as a result of the close down and removing of the platform.
During the removal of the platform before and after the survey in 1997, physical disturbance of the sediments occurred. This might have had effects on the fauna in the previous survey.
The calculated minimum area and spatial extent of contaminated sediments and disturbed fauna at the Odin field is shown in Table 14-10 and Figure 14-12.
Table 14-10: Distance along the transects and calculated minimum area of contaminated sediments and disturbed fauna at the Odin field, 2000 and previous survey.
Odin NE SE SW NW Km2 (2000) Km2 (1997)
Group B 100 100 100 100 0.03 0.02
Group C 0 0 0 0 0 0.01
THC 50 100 100 100 0.02 0.02
Ba 0 0 0 0 0 0.01
Other metals 50 100 100 100 0.02 0.02
Ú#
#
#
#
#
#
#
#
#
Faunagruppe# A# B
# C
Ú#
#
#
#
#
#
#
#
#THC mg/kg tørt sediment# < 10 (LSC RegII)# 10 - 19# 20 - 49
# 50 - 199
# > 200
Ú#
#
#
#
#
#
#
#
#
Ba mg/kg tørt sediment# < 100 (LSC RegII)# 100 - 499# 500 - 999
# 1000 - 2999
# > 3000
Figure 14-12: Distribution of disturbed fauna and the amounts of THC and barium in the sediments at the Odin field, 2000.
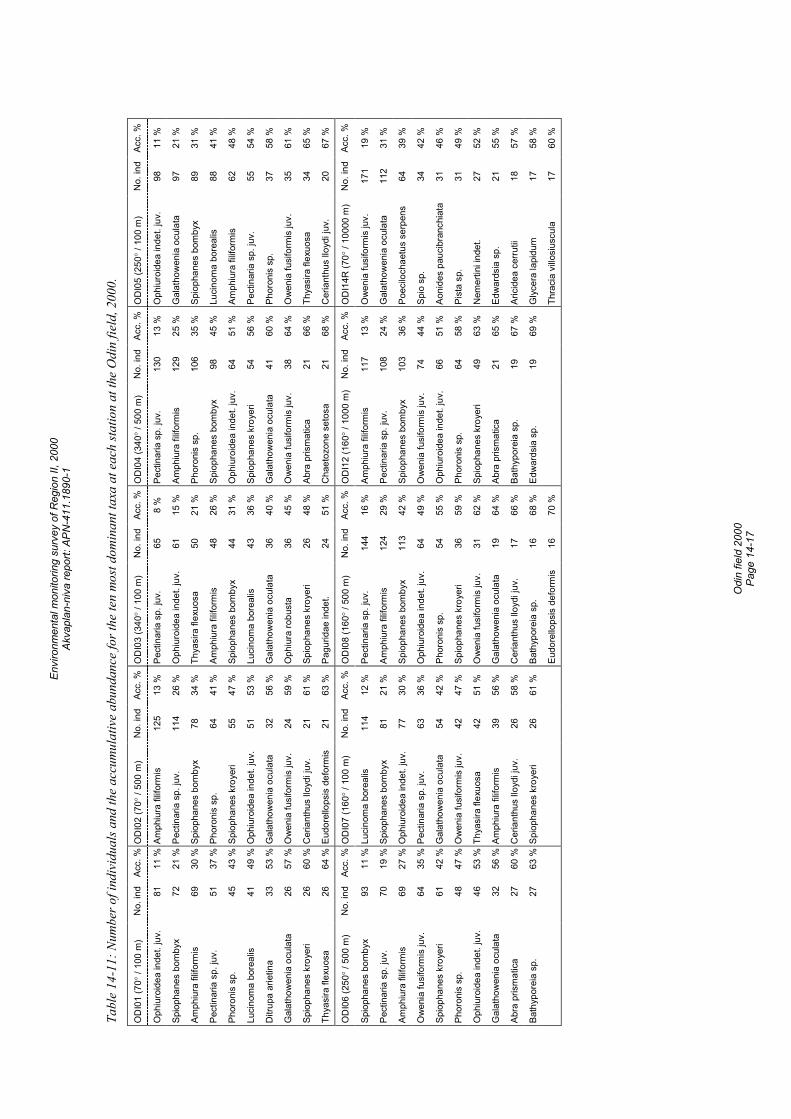
Envi
ronm
enta
l mon
itorin
g su
rvey
of R
egio
n II,
200
0 Ak
vapl
an-n
iva
repo
rt: A
PN-4
11.1
890-
1
O
din
field
200
0 Pa
ge 1
4-17
Tabl
e 14
-11:
Num
ber o
f ind
ivid
uals
and
the
accu
mul
ativ
e ab
unda
nce
for t
he te
n m
ost d
omin
ant t
axa
at e
ach
statio
n at
the
Odi
n fie
ld, 2
000.
OD
I01
(70°
/ 10
0 m
) N
o. in
d Ac
c. %
OD
I02
(70°
/ 50
0 m
) N
o. in
dAc
c. %
OD
I03
(340
° / 1
00 m
) N
o. in
dAc
c. %
O
DI0
4 (3
40° /
500
m)
No.
ind
Acc.
%O
DI0
5 (2
50° /
100
m)
No.
ind
Acc.
%
Oph
iuro
idea
inde
t. ju
v.
81
11 %
Am
phiu
ra fi
lifor
mis
12
5 13
%
Pect
inar
ia s
p. ju
v.
65
8 %
Pe
ctin
aria
sp.
juv.
13
0 13
%
Oph
iuro
idea
inde
t. ju
v.
98
11 %
Spio
phan
es b
omby
x 72
21
% P
ectin
aria
sp.
juv.
11
4 26
%
Oph
iuro
idea
inde
t. ju
v.
61
15 %
Am
phiu
ra fi
lifor
mis
12
9 25
%
Gal
atho
wen
ia o
cula
ta
97
21 %
Amph
iura
filif
orm
is
69
30 %
Spi
opha
nes
bom
byx
78
34 %
Th
yasi
ra fl
exuo
sa
50
21 %
Ph
oron
is s
p.
106
35 %
Sp
ioph
anes
bom
byx
89
31 %
Pect
inar
ia s
p. ju
v.
51
37 %
Pho
roni
s sp
. 64
41
%
Amph
iura
filif
orm
is
48
26 %
Sp
ioph
anes
bom
byx
98
45 %
Lu
cino
ma
bore
alis
88
41
%
Phor
onis
sp.
45
43
% S
piop
hane
s kr
oyer
i 55
47
%
Spio
phan
es b
omby
x 44
31
%
Oph
iuro
idea
inde
t. ju
v.
64
51 %
Am
phiu
ra fi
lifor
mis
62
48
%
Luci
nom
a bo
real
is
41
49 %
Oph
iuro
idea
inde
t. ju
v.
51
53 %
Lu
cino
ma
bore
alis
43
36
%
Spio
phan
es k
roye
ri 54
56
%
Pect
inar
ia s
p. ju
v.
55
54 %
Ditr
upa
arie
tina
33
53 %
Gal
atho
wen
ia o
cula
ta
32
56 %
G
alat
how
enia
ocu
lata
36
40
%
Gal
atho
wen
ia o
cula
ta
41
60 %
Ph
oron
is s
p.
37
58 %
Gal
atho
wen
ia o
cula
ta
26
57 %
Ow
enia
fusi
form
is ju
v.
24
59 %
O
phiu
ra ro
bust
a 36
45
%
Ow
enia
fusi
form
is ju
v.
38
64 %
O
wen
ia fu
sifo
rmis
juv.
35
61
%
Spio
phan
es k
roye
ri 26
60
% C
eria
nthu
s llo
ydi j
uv.
21
61 %
Sp
ioph
anes
kro
yeri
26
48 %
Ab
ra p
rism
atic
a 21
66
%
Thya
sira
flex
uosa
34
65
%
Thya
sira
flex
uosa
26
64
% E
udor
ello
psis
def
orm
is
21
63 %
Pa
gurid
ae in
det.
24
51 %
C
haet
ozon
e se
tosa
21
68
%
Cer
iant
hus
lloyd
i juv
. 20
67
%
OD
I06
(250
° / 5
00 m
) N
o. in
d Ac
c. %
OD
I07
(160
° / 1
00 m
) N
o. in
dAc
c. %
OD
I08
(160
° / 5
00 m
) N
o. in
dAc
c. %
O
DI1
2 (1
60° /
100
0 m
) N
o. in
dAc
c. %
OD
I14R
(70°
/ 10
000
m)
No.
ind
Acc.
%
Spio
phan
es b
omby
x 93
11
% L
ucin
oma
bore
alis
11
4 12
%
Pect
inar
ia s
p. ju
v.
144
16 %
Am
phiu
ra fi
lifor
mis
11
7 13
%
Ow
enia
fusi
form
is ju
v.
171
19 %
Pect
inar
ia s
p. ju
v.
70
19 %
Spi
opha
nes
bom
byx
81
21 %
Am
phiu
ra fi
lifor
mis
12
4 29
%
Pect
inar
ia s
p. ju
v.
108
24 %
G
alat
how
enia
ocu
lata
11
2 31
%
Amph
iura
filif
orm
is
69
27 %
Oph
iuro
idea
inde
t. ju
v.
77
30 %
Sp
ioph
anes
bom
byx
113
42 %
Sp
ioph
anes
bom
byx
103
36 %
Po
ecilo
chae
tus
serp
ens
64
39 %
Ow
enia
fusi
form
is ju
v.
64
35 %
Pec
tinar
ia s
p. ju
v.
63
36 %
O
phiu
roid
ea in
det.
juv.
64
49
%
Ow
enia
fusi
form
is ju
v.
74
44 %
Sp
io s
p.
34
42 %
Spio
phan
es k
roye
ri 61
42
% G
alat
how
enia
ocu
lata
54
42
%
Phor
onis
sp.
54
55
%
Oph
iuro
idea
inde
t. ju
v.
66
51 %
Ao
nide
s pa
ucib
ranc
hiat
a 31
46
%
Phor
onis
sp.
48
47
% O
wen
ia fu
sifo
rmis
juv.
42
47
%
Spio
phan
es k
roye
ri 36
59
%
Phor
onis
sp.
64
58
%
Pist
a sp
. 31
49
%
Oph
iuro
idea
inde
t. ju
v.
46
53 %
Thy
asira
flex
uosa
42
51
%
Ow
enia
fusi
form
is ju
v.
31
62 %
Sp
ioph
anes
kro
yeri
49
63 %
N
emer
tini i
ndet
. 27
52
%
Gal
atho
wen
ia o
cula
ta
32
56 %
Am
phiu
ra fi
lifor
mis
39
56
%
Gal
atho
wen
ia o
cula
ta
19
64 %
Ab
ra p
rism
atic
a 21
65
%
Edw
ards
ia s
p.
21
55 %
Abra
pris
mat
ica
27
60 %
Cer
iant
hus
lloyd
i juv
. 26
58
%
Cer
iant
hus
lloyd
i juv
. 17
66
%
Bath
ypor
eia
sp.
19
67 %
Ar
icid
ea c
erru
tii
18
57 %
Bath
ypor
eia
sp.
27
63 %
Spi
opha
nes
kroy
eri
26
61 %
Ba
thyp
orei
a sp
. 16
68
%
Edw
ards
ia s
p.
19
69 %
G
lyce
ra la
pidu
m
17
58 %
Eu
dore
llops
is d
efor
mis
16
70
%
Th
raci
a vi
llosi
uscu
la
17
60 %
Envi
ronm
enta
l mon
itorin
g su
rvey
of R
egio
n II,
200
0 Ak
vapl
an-n
iva
repo
rt: A
PN-4
11.1
890-
1
O
din
field
200
0 Pa
ge 1
4-18
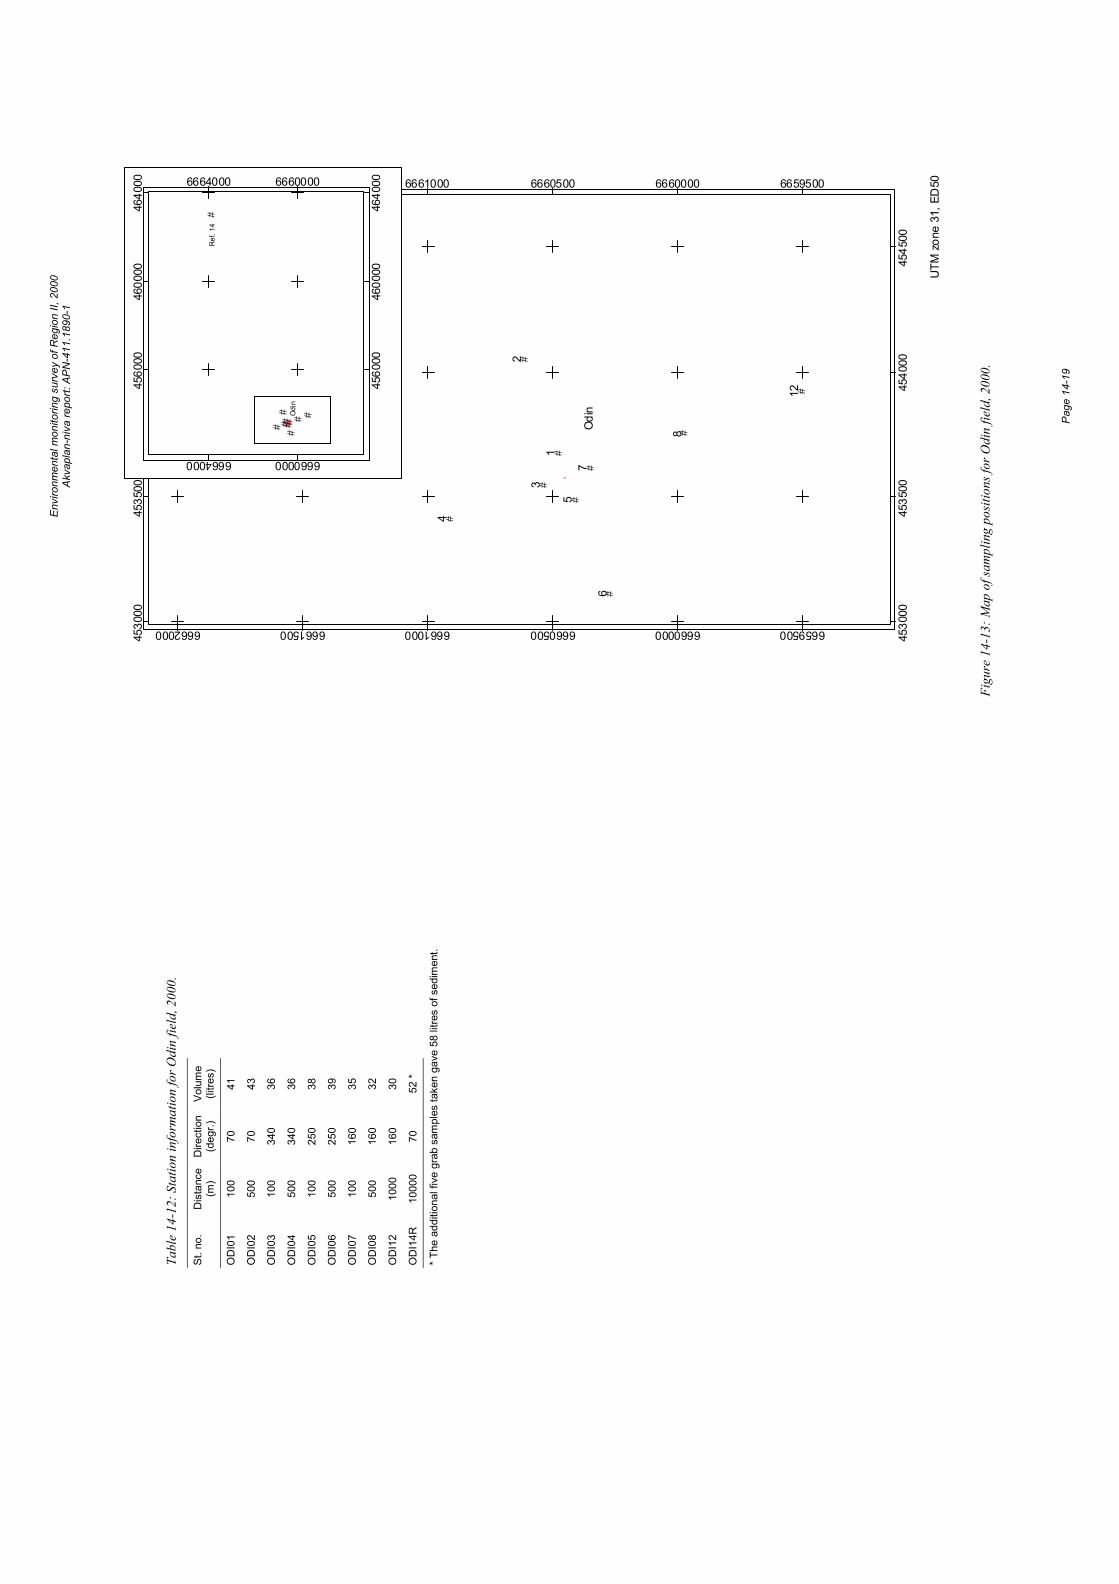
Envi
ronm
enta
l mon
itorin
g su
rvey
of R
egio
n II,
200
0 Ak
vapl
an-n
iva
repo
rt: A
PN-4
11.1
890-
1
Pa
ge 1
4-19
#
#
#
#
#
#
#
#
#
'
1
23
4
5
6
7
8
12
Odi
n
4530
00
4530
00
4535
00
4535
00
4540
00
4540
00
4545
00
4545
00
6659500
6659500
6660000
6660000
6660500
6660500
6661000
6661000
6661500
6661500
6662000
6662000
UTM
zon
e 31
, ED
50
##
## ##
# # #
#
&
Ref
. 14
Odi
n
4560
00
4560
00
4600
00
4600
00
4640
00
4640
00
6660000
6660000
6664000
6664000
Figu
re 1
4-13
: Map
of s
ampl
ing
posit
ions
for O
din
field
, 200
0.
Tabl
e 14
-12:
Sta
tion
info
rmat
ion
for O
din
field
, 200
0.
St. n
o.
Dis
tanc
e (m
) D
irect
ion
(deg
r.)
Volu
me
(litre
s)
OD
I01
100
70
41
OD
I02
500
70
43
OD
I03
100
340
36
OD
I04
500
340
36
OD
I05
100
250
38
OD
I06
500
250
39
OD
I07
100
160
35
OD
I08
500
160
32
OD
I12
1000
16
0 30
OD
I14R
10
000
70
52 *
* The
add
ition
al fi
ve g
rab
sam
ples
take
n ga
ve 5
8 lit
res
of s
edim
ent.

Envi
ronm
enta
l mon
itorin
g su
rvey
of R
egio
n II,
200
0 Ak
vapl
an-n
iva
repo
rt: A
PN-4
11.1
890-
1
Pa
ge 1
4-20
Environmental monitoring survey of Region II, 2000 Akvaplan-niva report: APN-411.1890-1
Varg field 2000 Page 15-1
15 Varg field 15.1 Introduction The Varg field is located in block 15/12 in Region II. Production at the field started in 1998. Data on recent drilling and discharges are given in Table 15-1. Only water based mud and cuttings have been discharged during these operations.
In the baseline survey at the field in 1997 the fauna was found to be undisturbed while the area significantly contaminated with THC extended out to 1000 m/ 20o and out to 500 m 200o-, 245o- and 335o. Elevated levels of barium were found at the 250 m stations on the 20o– and 200o–axes. The 500 m stations on the 245o- and 335o-axes are excluded in the present survey.
Information on the sampling stations is shown in Figure 15-13 and Table 15-13, both on the foldout page at the end of this chapter (page 15-19).
Table 15-1: Summary of recent wells drilled and operational and accidental discharges at the Varg field (all discharges in tonnes).
1997 1998 1999 2000 Comments
No of wells drilled 1 4 5 0
Barite * * 174 0 * Not available
Cuttings 1615 3510 2671 0
Oil-based drilling mud - * * 0 * Used but shipped onshore, possible discharge of 4862 t mud/cuttings (OBM) in 1999
Water-based drilling mud 1810 6726 7106 0
Cementing chemicals 160 * 53 36 0 * Estimated value.
Completion chemicals - 4 5 0
Oil in produced water - - 1 0.45305* 1st quarter
Accidental discharges - 0.250m3 * 0.329m3 0.0425 * Diesel discharged on sea surface.
15.2 Results and discussion
15.2.1 Physical characteristics The median phi value and the amount (%) of pelite, fine sand and total organic material (TOM) in the sediment from the present and previous surveys is shown in Table 15-2 and Figure 15-1. Detailed data on sediment characteristics such as colour, smell and a full set of analytical data, including TOM content and grain size distribution (with standard deviation, evenness and kurtosis) can be found in the Appendix.
The sediment at the Varg field is classified as fine sand with median values from 3.39 (VAR02) to 2.67 (VAR01). The amount of pelite in the sediment varies from 1.34% (VAR05) to 2.68 % (VAR03), the fine sand from 25.33 % (VAR01) to 74.94 % (VAR02) while the TOM varies from 0.64 % (VAR05, VAR08) to 0.94 % (VAR03). The corresponding values at the reference station VAR14R are higher, with the exception of TOM, at the field stations.
Compared with the 1997 survey, there has been an increase in pelite at all stations, and the largest increase is at station VAR03, VAR04 and the reference station VAR14R. The largest increase of fine sand is seen at VAR04 and TOM at VAR03, VAR09 and VAR11, while these values are more or less similar between the surveys at the other stations.
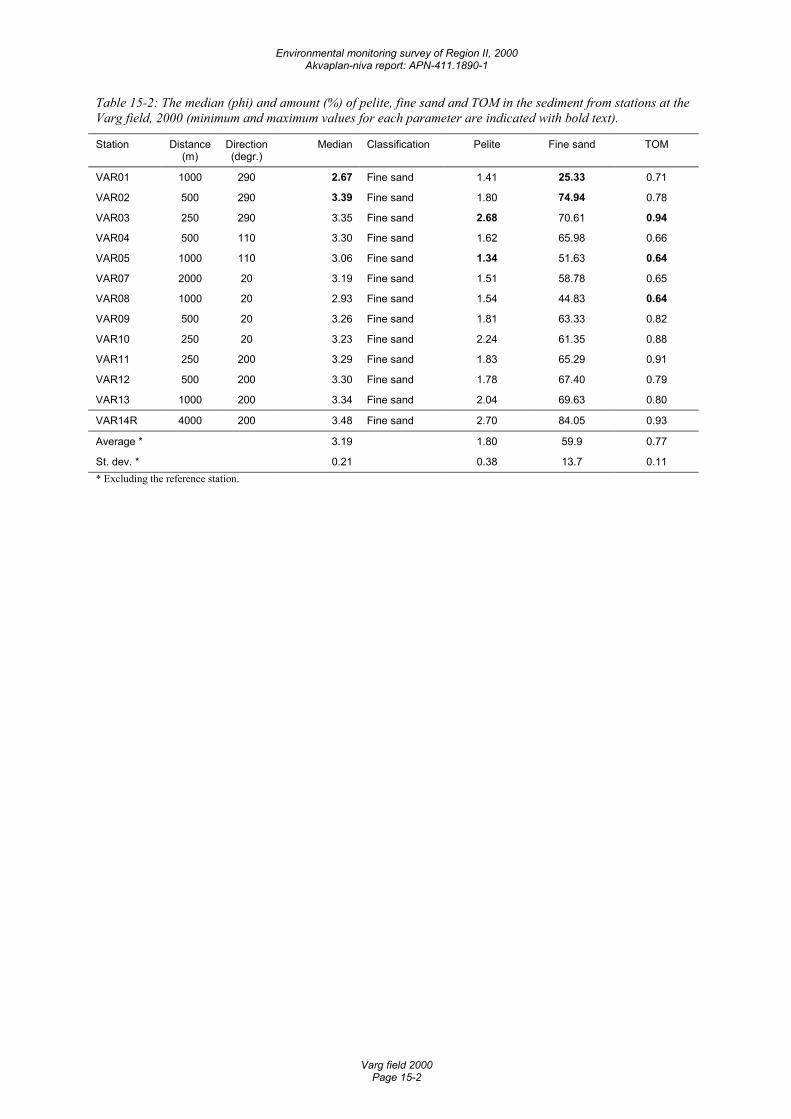
Environmental monitoring survey of Region II, 2000 Akvaplan-niva report: APN-411.1890-1
Varg field 2000 Page 15-2
Table 15-2: The median (phi) and amount (%) of pelite, fine sand and TOM in the sediment from stations at the Varg field, 2000 (minimum and maximum values for each parameter are indicated with bold text).
Station Distance (m)
Direction (degr.)
Median Classification Pelite Fine sand TOM
VAR01 1000 290 2.67 Fine sand 1.41 25.33 0.71
VAR02 500 290 3.39 Fine sand 1.80 74.94 0.78
VAR03 250 290 3.35 Fine sand 2.68 70.61 0.94
VAR04 500 110 3.30 Fine sand 1.62 65.98 0.66
VAR05 1000 110 3.06 Fine sand 1.34 51.63 0.64
VAR07 2000 20 3.19 Fine sand 1.51 58.78 0.65
VAR08 1000 20 2.93 Fine sand 1.54 44.83 0.64
VAR09 500 20 3.26 Fine sand 1.81 63.33 0.82
VAR10 250 20 3.23 Fine sand 2.24 61.35 0.88
VAR11 250 200 3.29 Fine sand 1.83 65.29 0.91
VAR12 500 200 3.30 Fine sand 1.78 67.40 0.79
VAR13 1000 200 3.34 Fine sand 2.04 69.63 0.80
VAR14R 4000 200 3.48 Fine sand 2.70 84.05 0.93
Average * 3.19 1.80 59.9 0.77
St. dev. * 0.21 0.38 13.7 0.11 * Excluding the reference station.
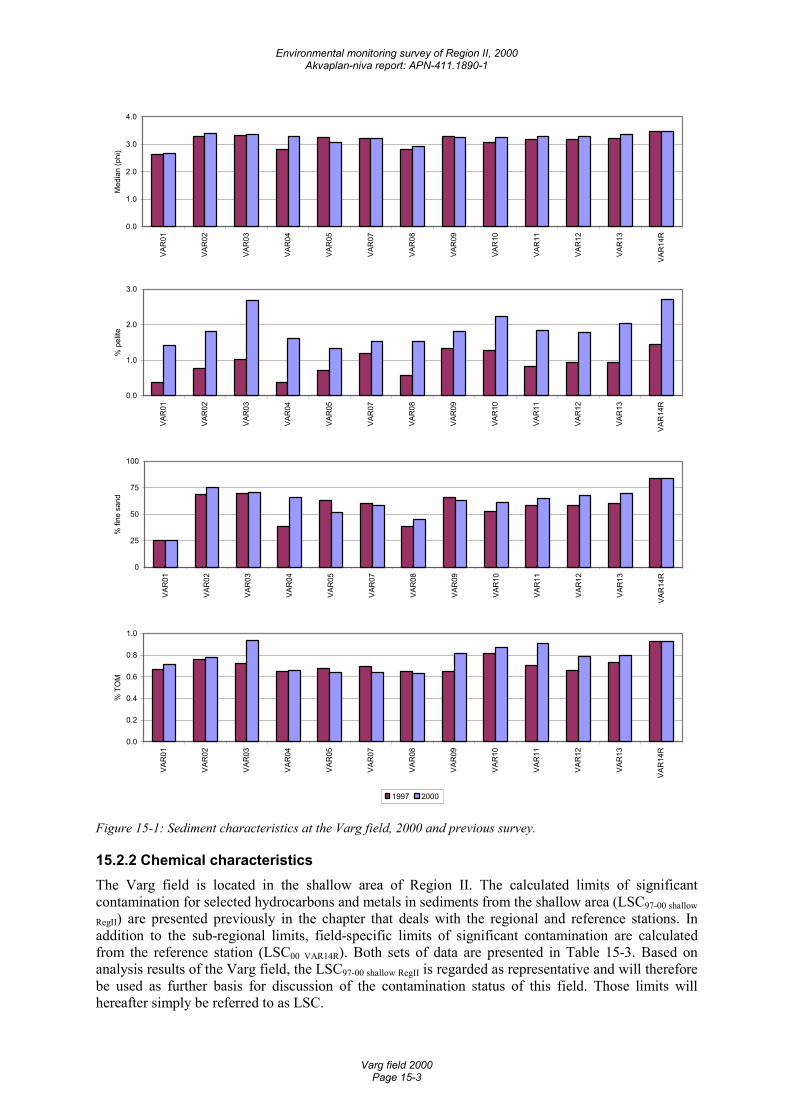
Environmental monitoring survey of Region II, 2000 Akvaplan-niva report: APN-411.1890-1
Varg field 2000 Page 15-3
0.0
1.0
2.0
3.0
4.0
VAR
01
VAR
02
VAR
03
VAR
04
VAR
05
VAR
07
VAR
08
VAR
09
VAR
10
VAR
11
VAR
12
VAR
13
VAR
14R
Med
ian
(phi
)
0.0
1.0
2.0
3.0
VAR
01
VAR
02
VAR
03
VAR
04
VAR
05
VAR
07
VAR
08
VAR
09
VAR
10
VAR
11
VAR
12
VAR
13
VAR
14R
% p
elite
0
25
50
75
100
VAR
01
VAR
02
VAR
03
VAR
04
VAR
05
VAR
07
VAR
08
VAR
09
VAR
10
VAR
11
VAR
12
VAR
13
VAR
14R
% fi
ne s
and
0.0
0.2
0.4
0.6
0.8
1.0
VAR
01
VAR
02
VAR
03
VAR
04
VAR
05
VAR
07
VAR
08
VAR
09
VAR
10
VAR
11
VAR
12
VAR
13
VAR
14R
% T
OM
1997 2000
Figure 15-1: Sediment characteristics at the Varg field, 2000 and previous survey.
15.2.2 Chemical characteristics The Varg field is located in the shallow area of Region II. The calculated limits of significant contamination for selected hydrocarbons and metals in sediments from the shallow area (LSC97-00 shallow
RegII) are presented previously in the chapter that deals with the regional and reference stations. In addition to the sub-regional limits, field-specific limits of significant contamination are calculated from the reference station (LSC00 VAR14R). Both sets of data are presented in Table 15-3. Based on analysis results of the Varg field, the LSC97-00 shallow RegII is regarded as representative and will therefore be used as further basis for discussion of the contamination status of this field. Those limits will hereafter simply be referred to as LSC.
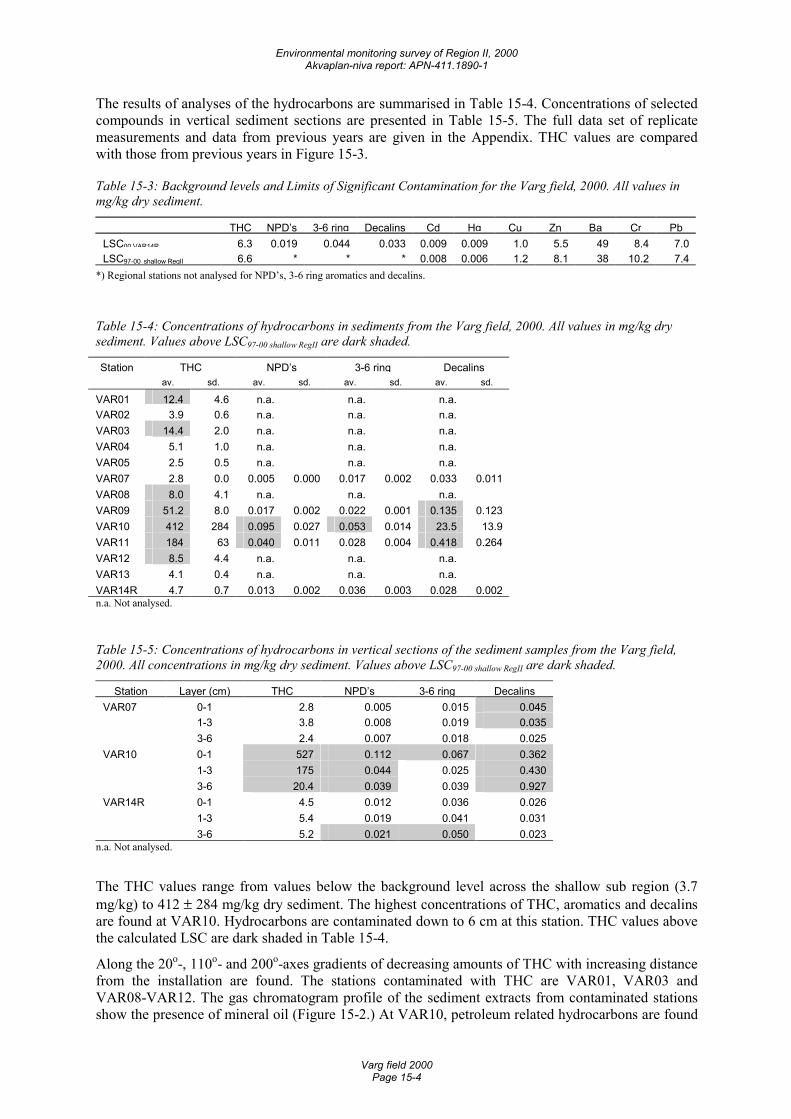
Environmental monitoring survey of Region II, 2000 Akvaplan-niva report: APN-411.1890-1
Varg field 2000 Page 15-4
The results of analyses of the hydrocarbons are summarised in Table 15-4. Concentrations of selected compounds in vertical sediment sections are presented in Table 15-5. The full data set of replicate measurements and data from previous years are given in the Appendix. THC values are compared with those from previous years in Figure 15-3.
Table 15-3: Background levels and Limits of Significant Contamination for the Varg field, 2000. All values in mg/kg dry sediment.
THC NPD’s 3-6 ring Decalins Cd Hg Cu Zn Ba Cr PbLSC00 VAR14R 6.3 0.019 0.044 0.033 0.009 0.009 1.0 5.5 49 8.4 7.0LSC97-00 shallow RegII 6.6 * * * 0.008 0.006 1.2 8.1 38 10.2 7.4
*) Regional stations not analysed for NPD’s, 3-6 ring aromatics and decalins.
Table 15-4: Concentrations of hydrocarbons in sediments from the Varg field, 2000. All values in mg/kg dry sediment. Values above LSC97-00 shallow RegII are dark shaded.
Station THC NPD’s 3-6 ring Decalins av. sd. av. sd. av. sd. av. sd.
VAR01 12.4 4.6 n.a. n.a. n.a.VAR02 3.9 0.6 n.a. n.a. n.a.VAR03 14.4 2.0 n.a. n.a. n.a.VAR04 5.1 1.0 n.a. n.a. n.a.VAR05 2.5 0.5 n.a. n.a. n.a.VAR07 2.8 0.0 0.005 0.000 0.017 0.002 0.033 0.011VAR08 8.0 4.1 n.a. n.a. n.a.VAR09 51.2 8.0 0.017 0.002 0.022 0.001 0.135 0.123VAR10 412 284 0.095 0.027 0.053 0.014 23.5 13.9VAR11 184 63 0.040 0.011 0.028 0.004 0.418 0.264VAR12 8.5 4.4 n.a. n.a. n.a.VAR13 4.1 0.4 n.a. n.a. n.a.VAR14R 4.7 0.7 0.013 0.002 0.036 0.003 0.028 0.002n.a. Not analysed.
Table 15-5: Concentrations of hydrocarbons in vertical sections of the sediment samples from the Varg field, 2000. All concentrations in mg/kg dry sediment. Values above LSC97-00 shallow RegII are dark shaded.
Station Layer (cm) THC NPD’s 3-6 ring DecalinsVAR07 0-1 2.8 0.005 0.015 0.045 1-3 3.8 0.008 0.019 0.035 3-6 2.4 0.007 0.018 0.025VAR10 0-1 527 0.112 0.067 0.362 1-3 175 0.044 0.025 0.430 3-6 20.4 0.039 0.039 0.927VAR14R 0-1 4.5 0.012 0.036 0.026 1-3 5.4 0.019 0.041 0.031 3-6 5.2 0.021 0.050 0.023
n.a. Not analysed. The THC values range from values below the background level across the shallow sub region (3.7 mg/kg) to 412 ± 284 mg/kg dry sediment. The highest concentrations of THC, aromatics and decalins are found at VAR10. Hydrocarbons are contaminated down to 6 cm at this station. THC values above the calculated LSC are dark shaded in Table 15-4.
Along the 20ο-, 110ο- and 200ο-axes gradients of decreasing amounts of THC with increasing distance from the installation are found. The stations contaminated with THC are VAR01, VAR03 and VAR08-VAR12. The gas chromatogram profile of the sediment extracts from contaminated stations show the presence of mineral oil (Figure 15-2.) At VAR10, petroleum related hydrocarbons are found
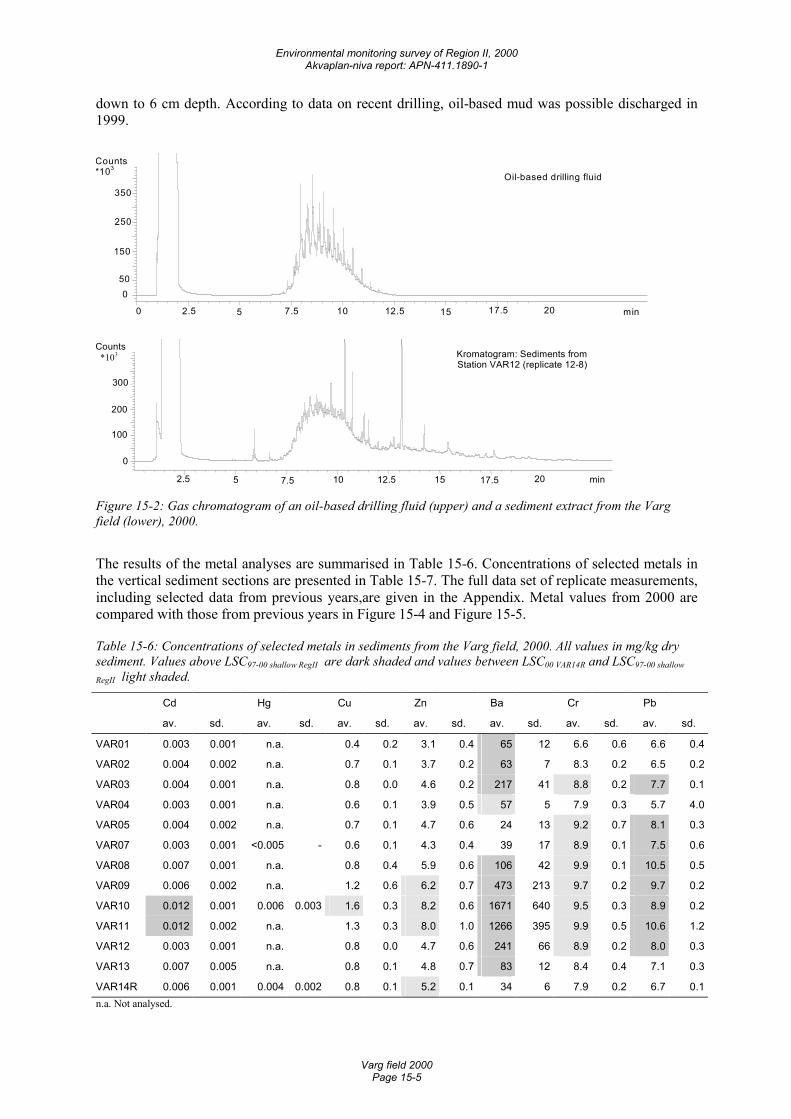
Environmental monitoring survey of Region II, 2000 Akvaplan-niva report: APN-411.1890-1
Varg field 2000 Page 15-5
down to 6 cm depth. According to data on recent drilling, oil-based mud was possible discharged in 1999.
min 0 2.5 5 7.5 10 12.5 15 17.5 20
Counts*103
0 50
150
250
350
Oil-based drilling fluid
min2.5 5 7.5 10 12.5 15 17.5 20
Counts *103
0
100
200
300
Kromatogram: Sediments fromStation VAR12 (replicate 12-8)
Figure 15-2: Gas chromatogram of an oil-based drilling fluid (upper) and a sediment extract from the Varg field (lower), 2000.
The results of the metal analyses are summarised in Table 15-6. Concentrations of selected metals in the vertical sediment sections are presented in Table 15-7. The full data set of replicate measurements, including selected data from previous years,are given in the Appendix. Metal values from 2000 are compared with those from previous years in Figure 15-4 and Figure 15-5.
Table 15-6: Concentrations of selected metals in sediments from the Varg field, 2000. All values in mg/kg dry sediment. Values above LSC97-00 shallow RegII are dark shaded and values between LSC00 VAR14R and LSC97-00 shallow
RegII light shaded.
Cd Hg Cu Zn Ba Cr Pb
av. sd. av. sd. av. sd. av. sd. av. sd. av. sd. av. sd.
VAR01 0.003 0.001 n.a. 0.4 0.2 3.1 0.4 65 12 6.6 0.6 6.6 0.4
VAR02 0.004 0.002 n.a. 0.7 0.1 3.7 0.2 63 7 8.3 0.2 6.5 0.2
VAR03 0.004 0.001 n.a. 0.8 0.0 4.6 0.2 217 41 8.8 0.2 7.7 0.1
VAR04 0.003 0.001 n.a. 0.6 0.1 3.9 0.5 57 5 7.9 0.3 5.7 4.0
VAR05 0.004 0.002 n.a. 0.7 0.1 4.7 0.6 24 13 9.2 0.7 8.1 0.3
VAR07 0.003 0.001 <0.005 - 0.6 0.1 4.3 0.4 39 17 8.9 0.1 7.5 0.6
VAR08 0.007 0.001 n.a. 0.8 0.4 5.9 0.6 106 42 9.9 0.1 10.5 0.5
VAR09 0.006 0.002 n.a. 1.2 0.6 6.2 0.7 473 213 9.7 0.2 9.7 0.2
VAR10 0.012 0.001 0.006 0.003 1.6 0.3 8.2 0.6 1671 640 9.5 0.3 8.9 0.2
VAR11 0.012 0.002 n.a. 1.3 0.3 8.0 1.0 1266 395 9.9 0.5 10.6 1.2
VAR12 0.003 0.001 n.a. 0.8 0.0 4.7 0.6 241 66 8.9 0.2 8.0 0.3
VAR13 0.007 0.005 n.a. 0.8 0.1 4.8 0.7 83 12 8.4 0.4 7.1 0.3
VAR14R 0.006 0.001 0.004 0.002 0.8 0.1 5.2 0.1 34 6 7.9 0.2 6.7 0.1n.a. Not analysed.
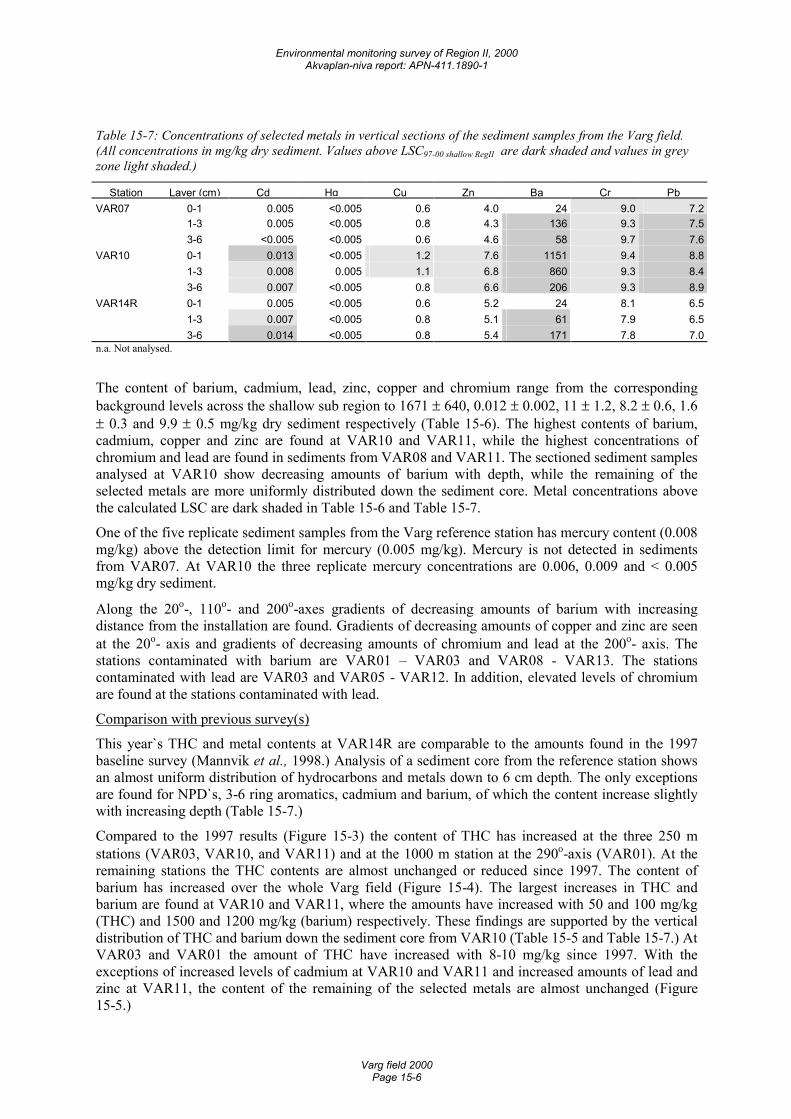
Environmental monitoring survey of Region II, 2000 Akvaplan-niva report: APN-411.1890-1
Varg field 2000 Page 15-6
Table 15-7: Concentrations of selected metals in vertical sections of the sediment samples from the Varg field. (All concentrations in mg/kg dry sediment. Values above LSC97-00 shallow RegII are dark shaded and values in grey zone light shaded.)
Station Layer (cm) Cd Hg Cu Zn Ba Cr PbVAR07 0-1 0.005 <0.005 0.6 4.0 24 9.0 7.2 1-3 0.005 <0.005 0.8 4.3 136 9.3 7.5 3-6 <0.005 <0.005 0.6 4.6 58 9.7 7.6VAR10 0-1 0.013 <0.005 1.2 7.6 1151 9.4 8.8 1-3 0.008 0.005 1.1 6.8 860 9.3 8.4 3-6 0.007 <0.005 0.8 6.6 206 9.3 8.9VAR14R 0-1 0.005 <0.005 0.6 5.2 24 8.1 6.5 1-3 0.007 <0.005 0.8 5.1 61 7.9 6.5 3-6 0.014 <0.005 0.8 5.4 171 7.8 7.0n.a. Not analysed.
The content of barium, cadmium, lead, zinc, copper and chromium range from the corresponding background levels across the shallow sub region to 1671 ± 640, 0.012 ± 0.002, 11 ± 1.2, 8.2 ± 0.6, 1.6 ± 0.3 and 9.9 ± 0.5 mg/kg dry sediment respectively (Table 15-6). The highest contents of barium, cadmium, copper and zinc are found at VAR10 and VAR11, while the highest concentrations of chromium and lead are found in sediments from VAR08 and VAR11. The sectioned sediment samples analysed at VAR10 show decreasing amounts of barium with depth, while the remaining of the selected metals are more uniformly distributed down the sediment core. Metal concentrations above the calculated LSC are dark shaded in Table 15-6 and Table 15-7.
One of the five replicate sediment samples from the Varg reference station has mercury content (0.008 mg/kg) above the detection limit for mercury (0.005 mg/kg). Mercury is not detected in sediments from VAR07. At VAR10 the three replicate mercury concentrations are 0.006, 0.009 and < 0.005 mg/kg dry sediment.
Along the 20ο-, 110ο- and 200ο-axes gradients of decreasing amounts of barium with increasing distance from the installation are found. Gradients of decreasing amounts of copper and zinc are seen at the 20ο- axis and gradients of decreasing amounts of chromium and lead at the 200ο- axis. The stations contaminated with barium are VAR01 – VAR03 and VAR08 - VAR13. The stations contaminated with lead are VAR03 and VAR05 - VAR12. In addition, elevated levels of chromium are found at the stations contaminated with lead.
Comparison with previous survey(s)
This year`s THC and metal contents at VAR14R are comparable to the amounts found in the 1997 baseline survey (Mannvik et al., 1998.) Analysis of a sediment core from the reference station shows an almost uniform distribution of hydrocarbons and metals down to 6 cm depth. The only exceptions are found for NPD`s, 3-6 ring aromatics, cadmium and barium, of which the content increase slightly with increasing depth (Table 15-7.)
Compared to the 1997 results (Figure 15-3) the content of THC has increased at the three 250 m stations (VAR03, VAR10, and VAR11) and at the 1000 m station at the 290ο-axis (VAR01). At the remaining stations the THC contents are almost unchanged or reduced since 1997. The content of barium has increased over the whole Varg field (Figure 15-4). The largest increases in THC and barium are found at VAR10 and VAR11, where the amounts have increased with 50 and 100 mg/kg (THC) and 1500 and 1200 mg/kg (barium) respectively. These findings are supported by the vertical distribution of THC and barium down the sediment core from VAR10 (Table 15-5 and Table 15-7.) At VAR03 and VAR01 the amount of THC have increased with 8-10 mg/kg since 1997. With the exceptions of increased levels of cadmium at VAR10 and VAR11 and increased amounts of lead and zinc at VAR11, the content of the remaining of the selected metals are almost unchanged (Figure 15-5.)
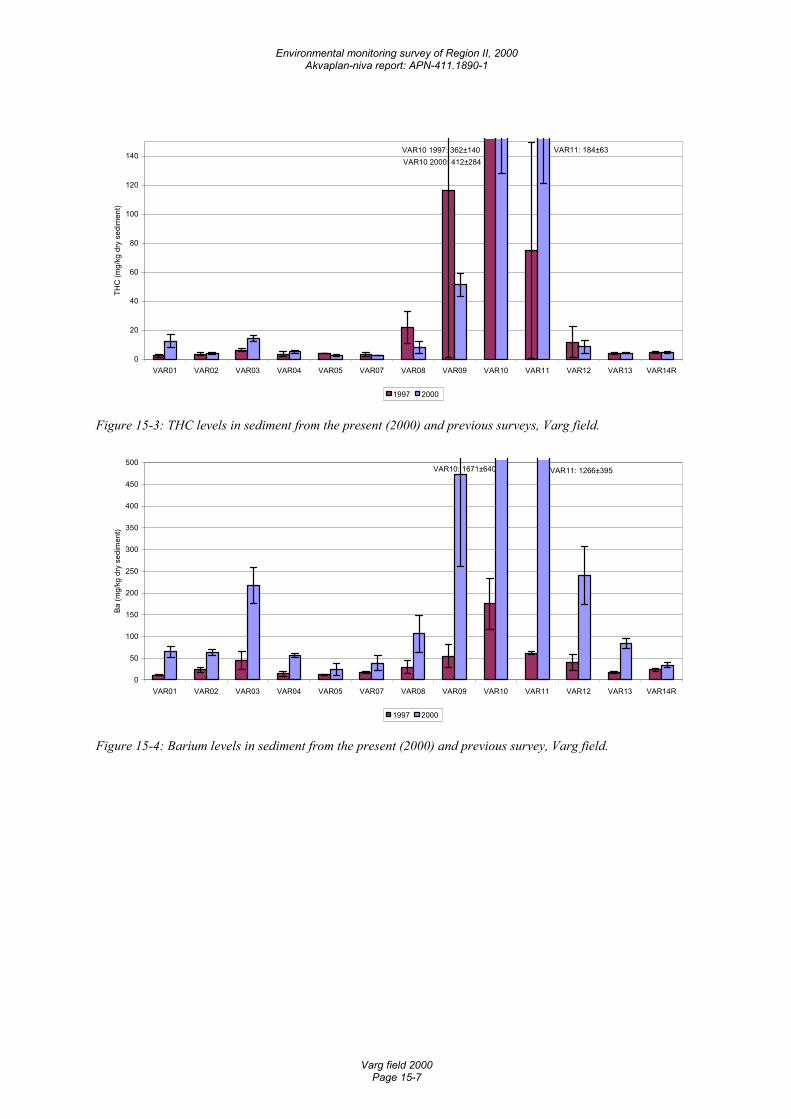
Environmental monitoring survey of Region II, 2000 Akvaplan-niva report: APN-411.1890-1
Varg field 2000 Page 15-7
VAR10 1997: 362±140VAR10 2000: 412±284
VAR11: 184±63
0
20
40
60
80
100
120
140
VAR01 VAR02 VAR03 VAR04 VAR05 VAR07 VAR08 VAR09 VAR10 VAR11 VAR12 VAR13 VAR14R
THC
(mg/
kg d
ry s
edim
ent)
1997 2000
Figure 15-3: THC levels in sediment from the present (2000) and previous surveys, Varg field.
VAR10: 1671±640 VAR11: 1266±395
0
50
100
150
200
250
300
350
400
450
500
VAR01 VAR02 VAR03 VAR04 VAR05 VAR07 VAR08 VAR09 VAR10 VAR11 VAR12 VAR13 VAR14R
Ba (m
g/kg
dry
sed
imen
t)
1997 2000
Figure 15-4: Barium levels in sediment from the present (2000) and previous survey, Varg field.
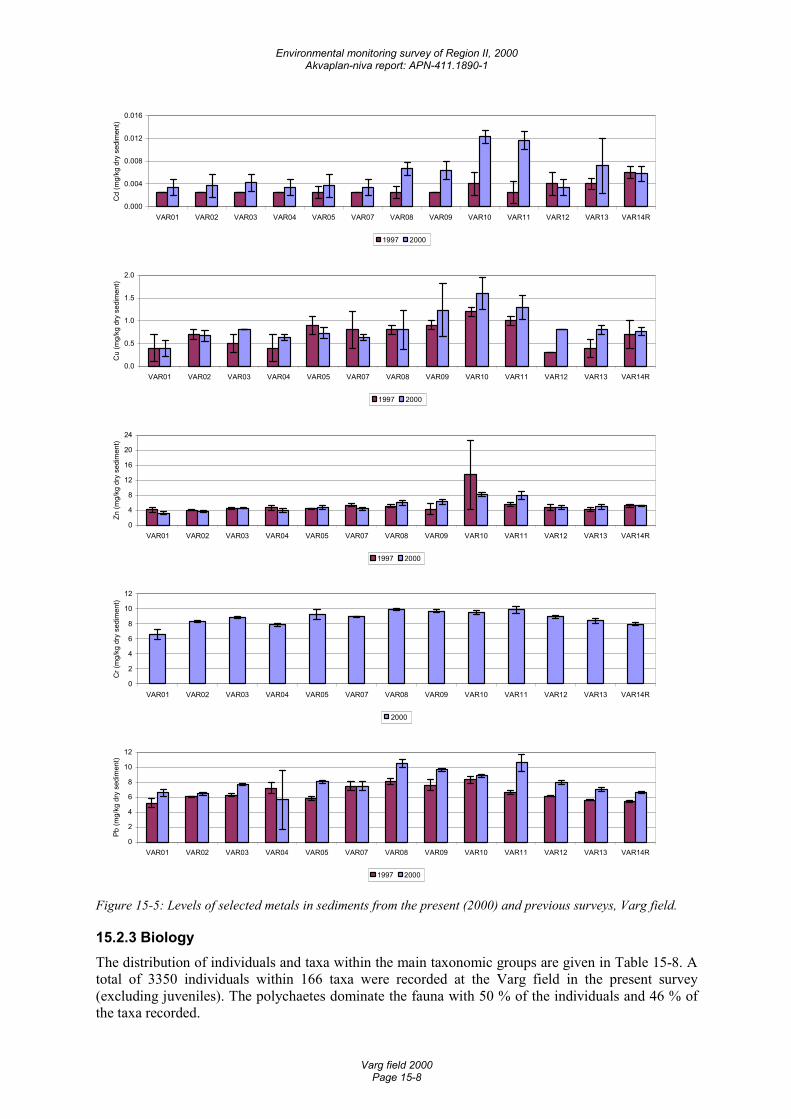
Environmental monitoring survey of Region II, 2000 Akvaplan-niva report: APN-411.1890-1
Varg field 2000 Page 15-8
0.000
0.004
0.008
0.012
0.016
VAR01 VAR02 VAR03 VAR04 VAR05 VAR07 VAR08 VAR09 VAR10 VAR11 VAR12 VAR13 VAR14R
Cd
(mg/
kg d
ry s
edim
ent)
1997 2000
0.0
0.5
1.0
1.5
2.0
VAR01 VAR02 VAR03 VAR04 VAR05 VAR07 VAR08 VAR09 VAR10 VAR11 VAR12 VAR13 VAR14R
Cu
(mg/
kg d
ry s
edim
ent)
1997 2000
0
4
8
12
16
20
24
VAR01 VAR02 VAR03 VAR04 VAR05 VAR07 VAR08 VAR09 VAR10 VAR11 VAR12 VAR13 VAR14R
Zn (m
g/kg
dry
sed
imen
t)
1997 2000
0
2
4
6
8
10
12
VAR01 VAR02 VAR03 VAR04 VAR05 VAR07 VAR08 VAR09 VAR10 VAR11 VAR12 VAR13 VAR14R
Cr (
mg/
kg d
ry s
edim
ent)
2000
0
2
4
6
8
10
12
VAR01 VAR02 VAR03 VAR04 VAR05 VAR07 VAR08 VAR09 VAR10 VAR11 VAR12 VAR13 VAR14R
Pb (m
g/kg
dry
sed
imen
t)
1997 2000
Figure 15-5: Levels of selected metals in sediments from the present (2000) and previous surveys, Varg field.
15.2.3 Biology The distribution of individuals and taxa within the main taxonomic groups are given in Table 15-8. A total of 3350 individuals within 166 taxa were recorded at the Varg field in the present survey (excluding juveniles). The polychaetes dominate the fauna with 50 % of the individuals and 46 % of the taxa recorded.
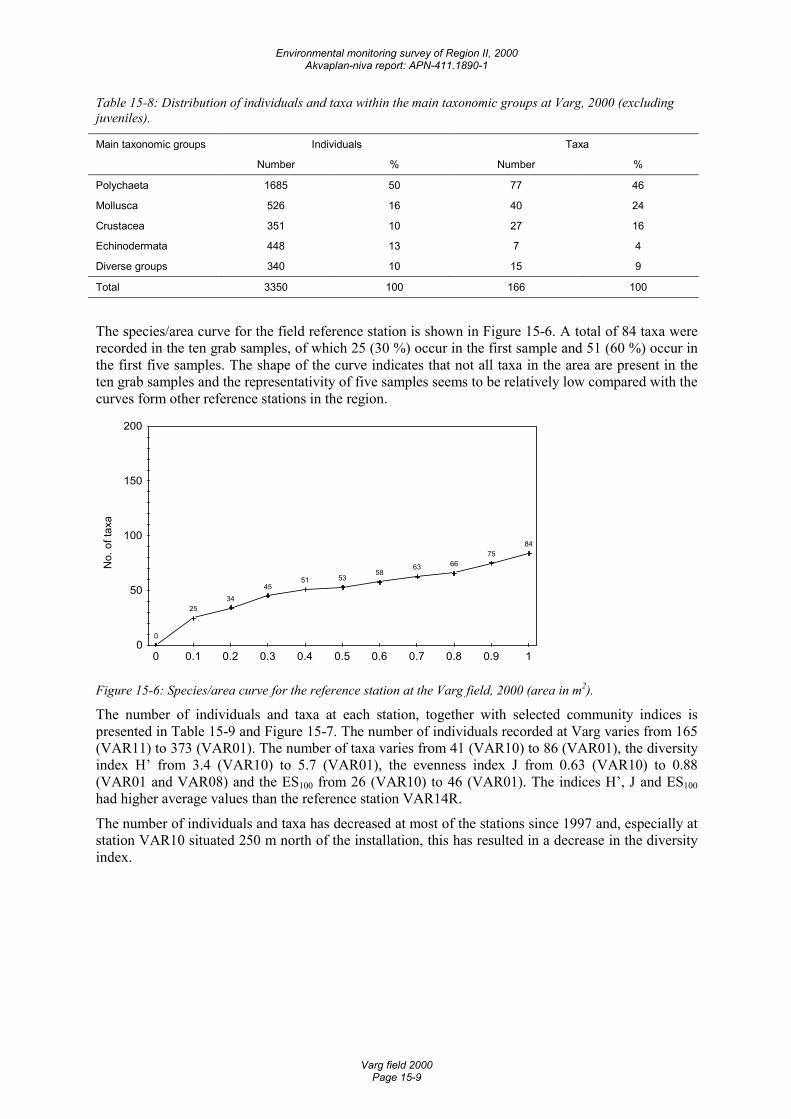
Environmental monitoring survey of Region II, 2000 Akvaplan-niva report: APN-411.1890-1
Varg field 2000 Page 15-9
Table 15-8: Distribution of individuals and taxa within the main taxonomic groups at Varg, 2000 (excluding juveniles).
Main taxonomic groups Individuals Taxa
Number % Number %
Polychaeta 1685 50 77 46
Mollusca 526 16 40 24
Crustacea 351 10 27 16
Echinodermata 448 13 7 4
Diverse groups 340 10 15 9
Total 3350 100 166 100
The species/area curve for the field reference station is shown in Figure 15-6. A total of 84 taxa were recorded in the ten grab samples, of which 25 (30 %) occur in the first sample and 51 (60 %) occur in the first five samples. The shape of the curve indicates that not all taxa in the area are present in the ten grab samples and the representativity of five samples seems to be relatively low compared with the curves form other reference stations in the region.
No.
of t
axa
0
2534
4551 53
5863 66
7584
0
50
100
150
200
0 0.1 0.2 0.3 0.4 0.5 0.6 0.7 0.8 0.9 1
Figure 15-6: Species/area curve for the reference station at the Varg field, 2000 (area in m2).
The number of individuals and taxa at each station, together with selected community indices is presented in Table 15-9 and Figure 15-7. The number of individuals recorded at Varg varies from 165 (VAR11) to 373 (VAR01). The number of taxa varies from 41 (VAR10) to 86 (VAR01), the diversity index H’ from 3.4 (VAR10) to 5.7 (VAR01), the evenness index J from 0.63 (VAR10) to 0.88 (VAR01 and VAR08) and the ES100 from 26 (VAR10) to 46 (VAR01). The indices H’, J and ES100 had higher average values than the reference station VAR14R.
The number of individuals and taxa has decreased at most of the stations since 1997 and, especially at station VAR10 situated 250 m north of the installation, this has resulted in a decrease in the diversity index.
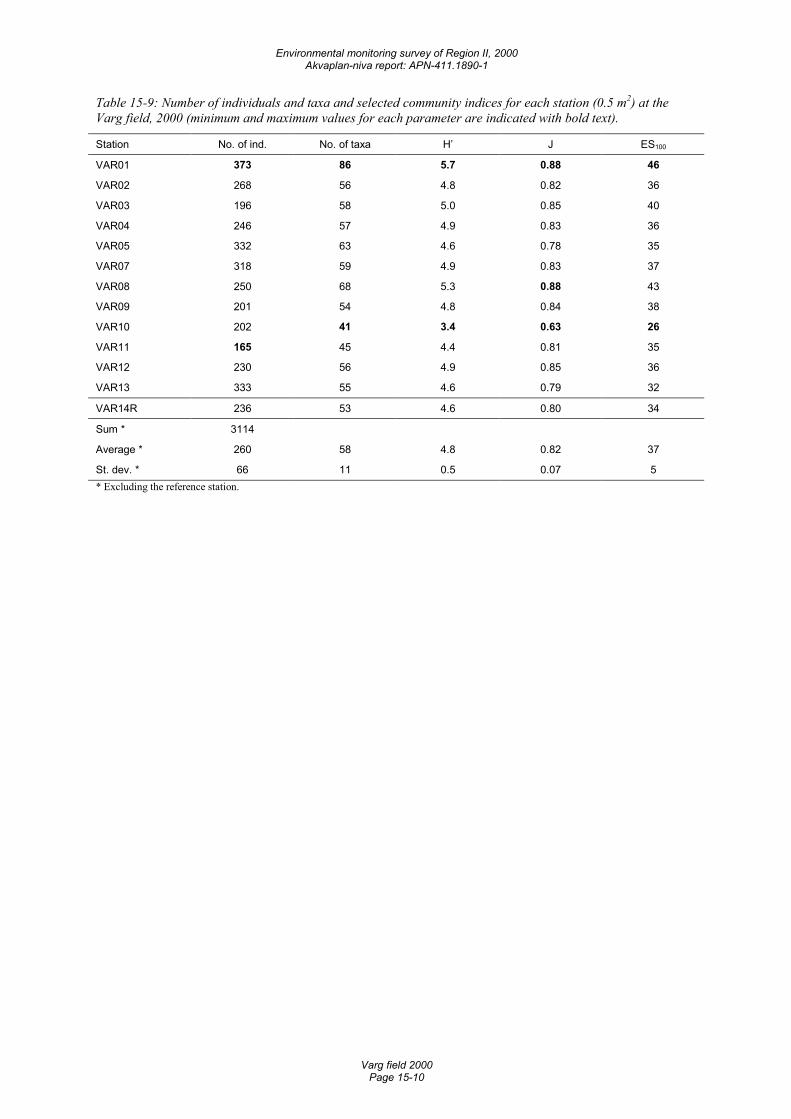
Environmental monitoring survey of Region II, 2000 Akvaplan-niva report: APN-411.1890-1
Varg field 2000 Page 15-10
Table 15-9: Number of individuals and taxa and selected community indices for each station (0.5 m2) at the Varg field, 2000 (minimum and maximum values for each parameter are indicated with bold text).
Station No. of ind. No. of taxa H’ J ES100
VAR01 373 86 5.7 0.88 46
VAR02 268 56 4.8 0.82 36
VAR03 196 58 5.0 0.85 40
VAR04 246 57 4.9 0.83 36
VAR05 332 63 4.6 0.78 35
VAR07 318 59 4.9 0.83 37
VAR08 250 68 5.3 0.88 43
VAR09 201 54 4.8 0.84 38
VAR10 202 41 3.4 0.63 26
VAR11 165 45 4.4 0.81 35
VAR12 230 56 4.9 0.85 36
VAR13 333 55 4.6 0.79 32
VAR14R 236 53 4.6 0.80 34
Sum * 3114
Average * 260 58 4.8 0.82 37
St. dev. * 66 11 0.5 0.07 5 * Excluding the reference station.
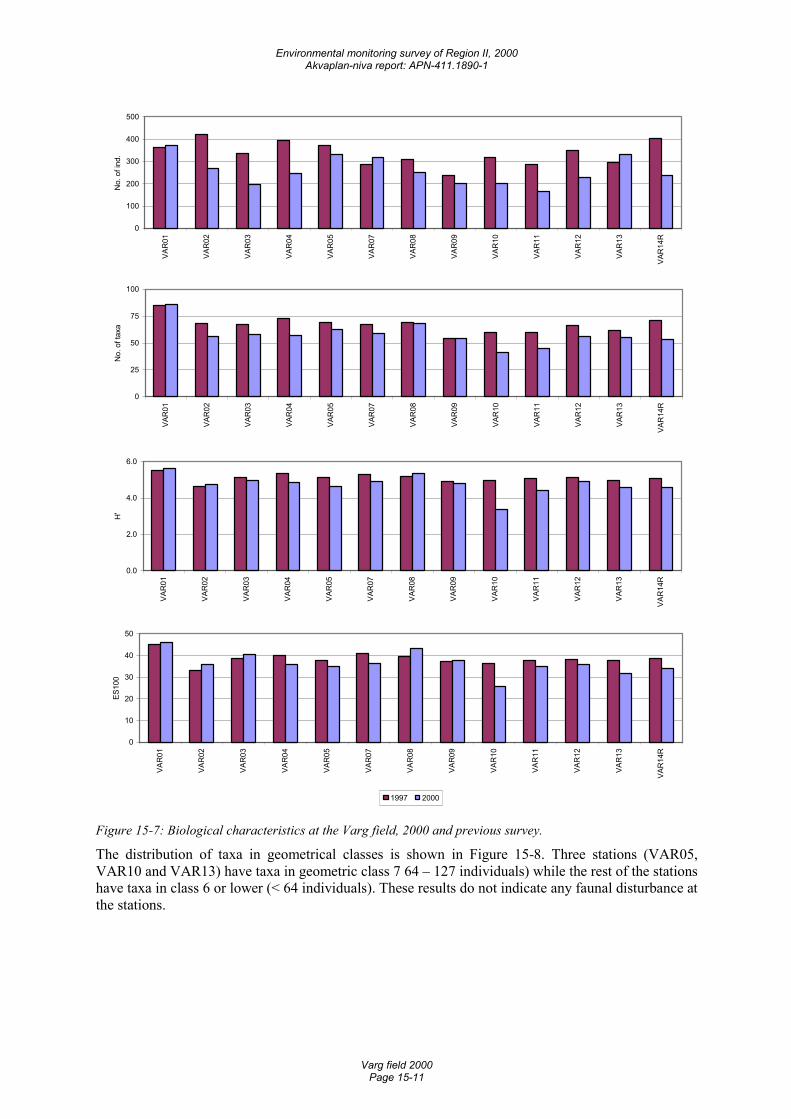
Environmental monitoring survey of Region II, 2000 Akvaplan-niva report: APN-411.1890-1
Varg field 2000 Page 15-11
0
100
200
300
400
500
VAR
01
VAR
02
VAR
03
VAR
04
VAR
05
VAR
07
VAR
08
VAR
09
VAR
10
VAR
11
VAR
12
VAR
13
VAR
14R
No.
of i
nd.
0
25
50
75
100
VAR
01
VAR
02
VAR
03
VAR
04
VAR
05
VAR
07
VAR
08
VAR
09
VAR
10
VAR
11
VAR
12
VAR
13
VAR
14R
No.
of t
axa
0.0
2.0
4.0
6.0
VAR
01
VAR
02
VAR
03
VAR
04
VAR
05
VAR
07
VAR
08
VAR
09
VAR
10
VAR
11
VAR
12
VAR
13
VAR
14R
H'
0
10
20
30
40
50
VAR
01
VAR
02
VAR
03
VAR
04
VAR
05
VAR
07
VAR
08
VAR
09
VAR
10
VAR
11
VAR
12
VAR
13
VAR
14R
ES10
0
1997 2000
Figure 15-7: Biological characteristics at the Varg field, 2000 and previous survey.
The distribution of taxa in geometrical classes is shown in Figure 15-8. Three stations (VAR05, VAR10 and VAR13) have taxa in geometric class 7 64 – 127 individuals) while the rest of the stations have taxa in class 6 or lower (< 64 individuals). These results do not indicate any faunal disturbance at the stations.
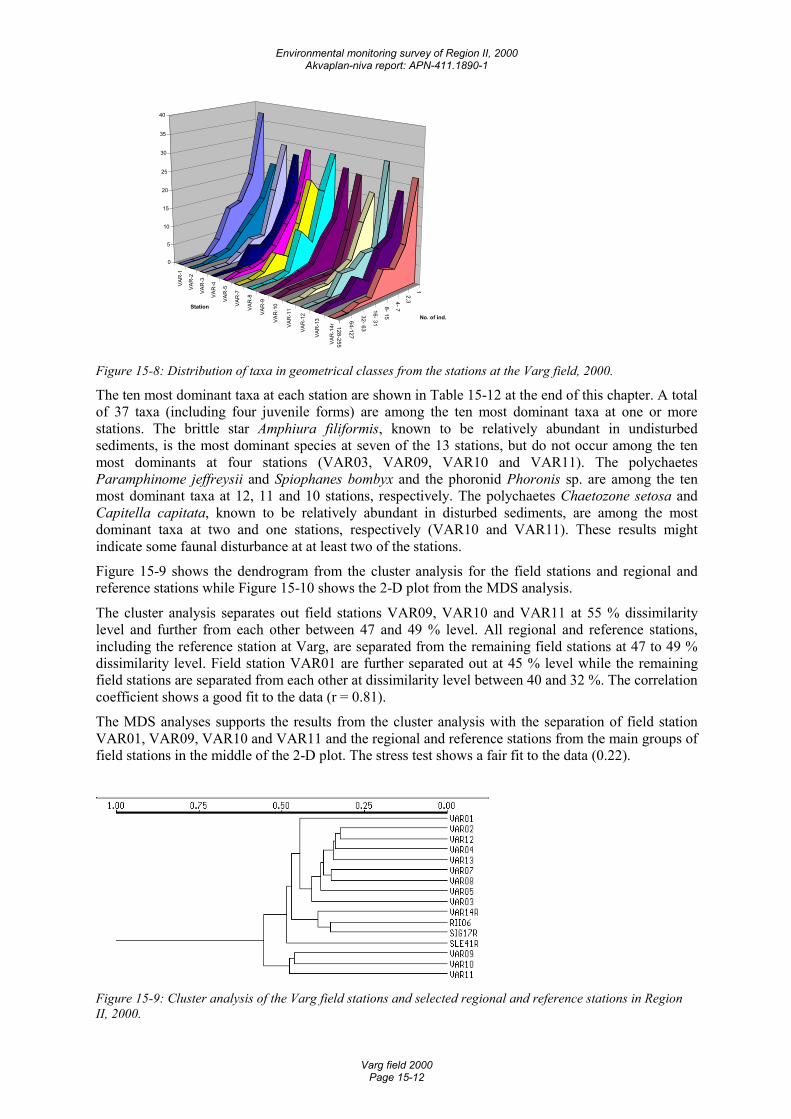
Environmental monitoring survey of Region II, 2000 Akvaplan-niva report: APN-411.1890-1
Varg field 2000 Page 15-12
1
2,3 4- 7 8- 15
16- 31
32- 63
64-127
128-255
VAR
-1
VAR
-2
VAR
-3
VAR
-4
VAR
-5
VAR
-7
VAR
-8
VAR
-9
VAR
-10
VAR
-11
VAR
-12
VAR
-13
VAR
-14r
0
5
10
15
20
25
30
35
40
No. of ind.
Station
Figure 15-8: Distribution of taxa in geometrical classes from the stations at the Varg field, 2000.
The ten most dominant taxa at each station are shown in Table 15-12 at the end of this chapter. A total of 37 taxa (including four juvenile forms) are among the ten most dominant taxa at one or more stations. The brittle star Amphiura filiformis, known to be relatively abundant in undisturbed sediments, is the most dominant species at seven of the 13 stations, but do not occur among the ten most dominants at four stations (VAR03, VAR09, VAR10 and VAR11). The polychaetes Paramphinome jeffreysii and Spiophanes bombyx and the phoronid Phoronis sp. are among the ten most dominant taxa at 12, 11 and 10 stations, respectively. The polychaetes Chaetozone setosa and Capitella capitata, known to be relatively abundant in disturbed sediments, are among the most dominant taxa at two and one stations, respectively (VAR10 and VAR11). These results might indicate some faunal disturbance at at least two of the stations.
Figure 15-9 shows the dendrogram from the cluster analysis for the field stations and regional and reference stations while Figure 15-10 shows the 2-D plot from the MDS analysis.
The cluster analysis separates out field stations VAR09, VAR10 and VAR11 at 55 % dissimilarity level and further from each other between 47 and 49 % level. All regional and reference stations, including the reference station at Varg, are separated from the remaining field stations at 47 to 49 % dissimilarity level. Field station VAR01 are further separated out at 45 % level while the remaining field stations are separated from each other at dissimilarity level between 40 and 32 %. The correlation coefficient shows a good fit to the data (r = 0.81).
The MDS analyses supports the results from the cluster analysis with the separation of field station VAR01, VAR09, VAR10 and VAR11 and the regional and reference stations from the main groups of field stations in the middle of the 2-D plot. The stress test shows a fair fit to the data (0.22).
Figure 15-9: Cluster analysis of the Varg field stations and selected regional and reference stations in Region II, 2000.
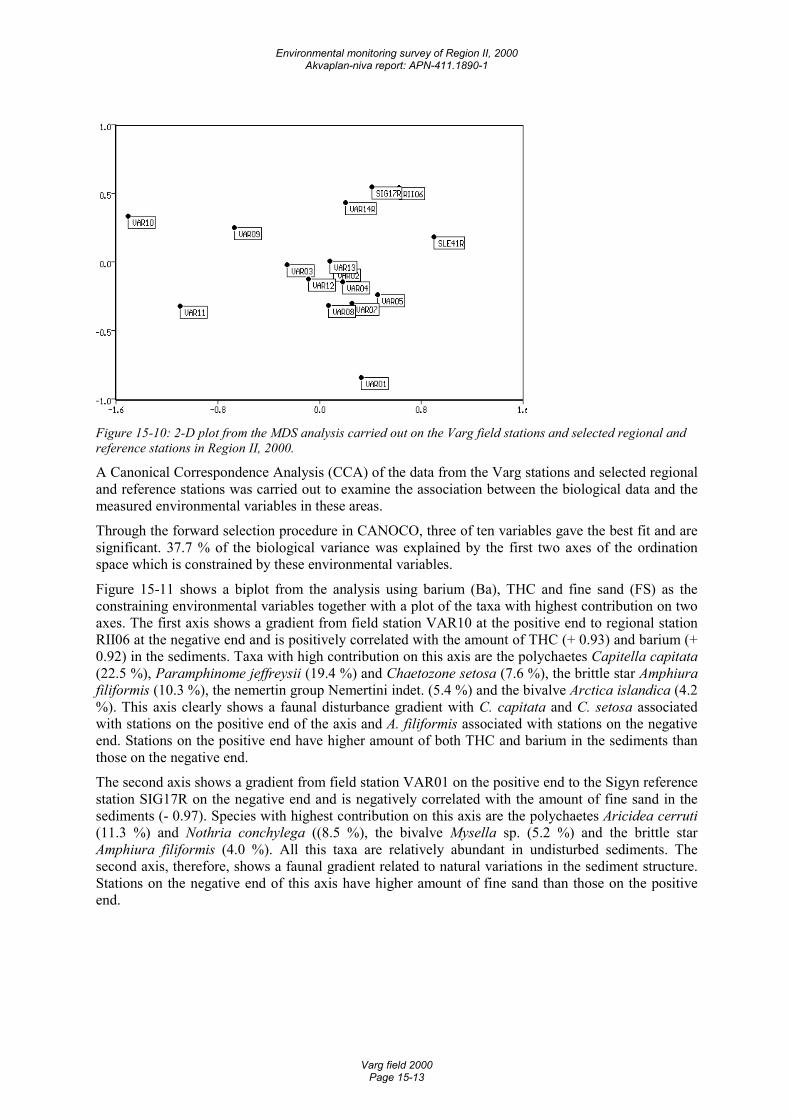
Environmental monitoring survey of Region II, 2000 Akvaplan-niva report: APN-411.1890-1
Varg field 2000 Page 15-13
Figure 15-10: 2-D plot from the MDS analysis carried out on the Varg field stations and selected regional and reference stations in Region II, 2000.
A Canonical Correspondence Analysis (CCA) of the data from the Varg stations and selected regional and reference stations was carried out to examine the association between the biological data and the measured environmental variables in these areas.
Through the forward selection procedure in CANOCO, three of ten variables gave the best fit and are significant. 37.7 % of the biological variance was explained by the first two axes of the ordination space which is constrained by these environmental variables.
Figure 15-11 shows a biplot from the analysis using barium (Ba), THC and fine sand (FS) as the constraining environmental variables together with a plot of the taxa with highest contribution on two axes. The first axis shows a gradient from field station VAR10 at the positive end to regional station RII06 at the negative end and is positively correlated with the amount of THC (+ 0.93) and barium (+ 0.92) in the sediments. Taxa with high contribution on this axis are the polychaetes Capitella capitata (22.5 %), Paramphinome jeffreysii (19.4 %) and Chaetozone setosa (7.6 %), the brittle star Amphiura filiformis (10.3 %), the nemertin group Nemertini indet. (5.4 %) and the bivalve Arctica islandica (4.2 %). This axis clearly shows a faunal disturbance gradient with C. capitata and C. setosa associated with stations on the positive end of the axis and A. filiformis associated with stations on the negative end. Stations on the positive end have higher amount of both THC and barium in the sediments than those on the negative end.
The second axis shows a gradient from field station VAR01 on the positive end to the Sigyn reference station SIG17R on the negative end and is negatively correlated with the amount of fine sand in the sediments (- 0.97). Species with highest contribution on this axis are the polychaetes Aricidea cerruti (11.3 %) and Nothria conchylega ((8.5 %), the bivalve Mysella sp. (5.2 %) and the brittle star Amphiura filiformis (4.0 %). All this taxa are relatively abundant in undisturbed sediments. The second axis, therefore, shows a faunal gradient related to natural variations in the sediment structure. Stations on the negative end of this axis have higher amount of fine sand than those on the positive end.
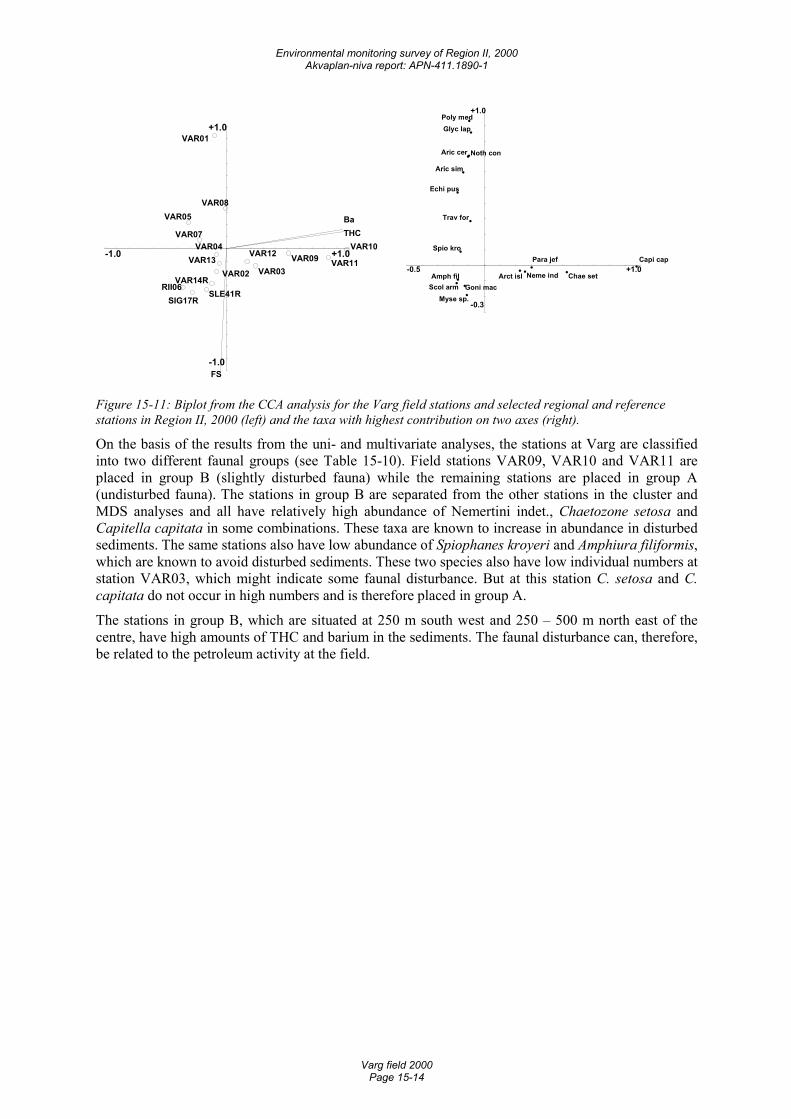
Environmental monitoring survey of Region II, 2000 Akvaplan-niva report: APN-411.1890-1
Varg field 2000 Page 15-14
-1.0 +1.0
-1.0
+1.0
THCBa
FS
VAR10
VAR11VAR09
RII06
VAR05
SIG17R
VAR03
VAR07
VAR12
SLE41RVAR14R
VAR01
VAR02
VAR04VAR13
VAR08
-0.5 +1.0
-0.3
+1.0
Capi cap
Chae set
Para jef
Neme indArct islScol arm
Echi pus
Amph fil
Spio kro
Aric sim
Goni macMyse sp.
Noth conAric cer
Poly med
Trav for
Glyc lap
Figure 15-11: Biplot from the CCA analysis for the Varg field stations and selected regional and reference stations in Region II, 2000 (left) and the taxa with highest contribution on two axes (right).
On the basis of the results from the uni- and multivariate analyses, the stations at Varg are classified into two different faunal groups (see Table 15-10). Field stations VAR09, VAR10 and VAR11 are placed in group B (slightly disturbed fauna) while the remaining stations are placed in group A (undisturbed fauna). The stations in group B are separated from the other stations in the cluster and MDS analyses and all have relatively high abundance of Nemertini indet., Chaetozone setosa and Capitella capitata in some combinations. These taxa are known to increase in abundance in disturbed sediments. The same stations also have low abundance of Spiophanes kroyeri and Amphiura filiformis, which are known to avoid disturbed sediments. These two species also have low individual numbers at station VAR03, which might indicate some faunal disturbance. But at this station C. setosa and C. capitata do not occur in high numbers and is therefore placed in group A.
The stations in group B, which are situated at 250 m south west and 250 – 500 m north east of the centre, have high amounts of THC and barium in the sediments. The faunal disturbance can, therefore, be related to the petroleum activity at the field.
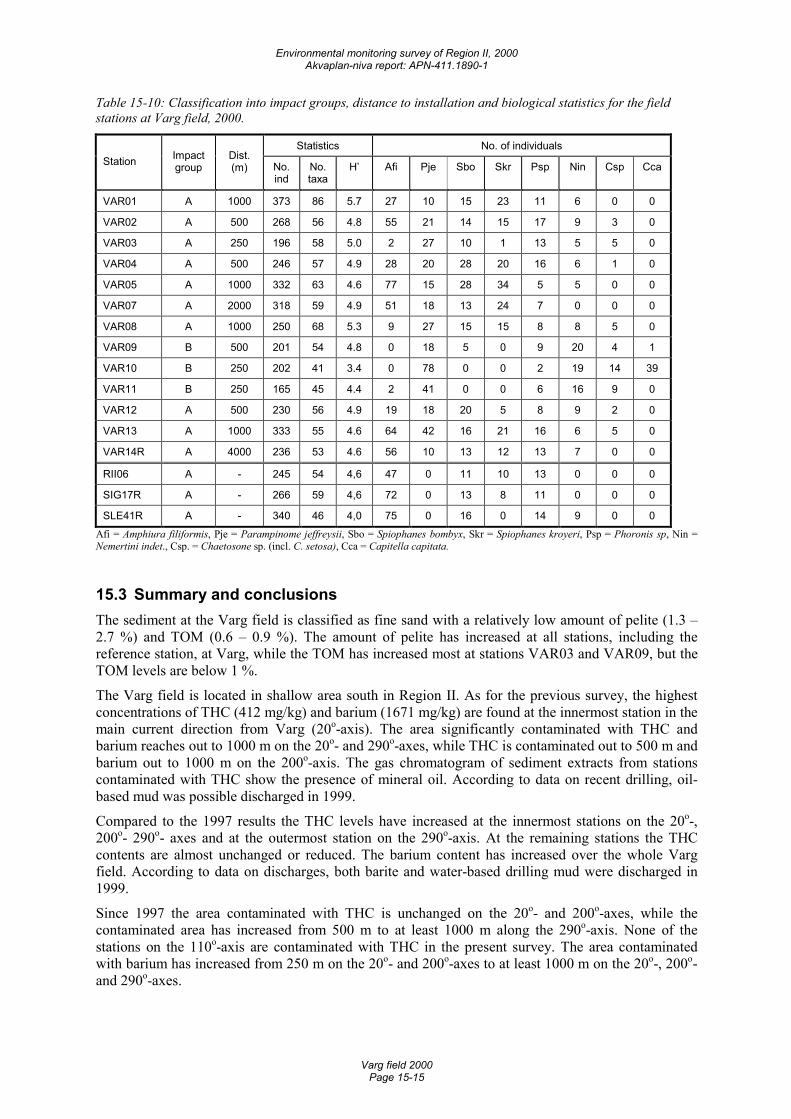
Environmental monitoring survey of Region II, 2000 Akvaplan-niva report: APN-411.1890-1
Varg field 2000 Page 15-15
Table 15-10: Classification into impact groups, distance to installation and biological statistics for the field stations at Varg field, 2000.
Statistics No. of individuals Station Impact
group Dist. (m) No.
ind No. taxa
H’ Afi Pje Sbo Skr Psp Nin Csp Cca
VAR01 A 1000 373 86 5.7 27 10 15 23 11 6 0 0
VAR02 A 500 268 56 4.8 55 21 14 15 17 9 3 0
VAR03 A 250 196 58 5.0 2 27 10 1 13 5 5 0
VAR04 A 500 246 57 4.9 28 20 28 20 16 6 1 0
VAR05 A 1000 332 63 4.6 77 15 28 34 5 5 0 0
VAR07 A 2000 318 59 4.9 51 18 13 24 7 0 0 0
VAR08 A 1000 250 68 5.3 9 27 15 15 8 8 5 0
VAR09 B 500 201 54 4.8 0 18 5 0 9 20 4 1
VAR10 B 250 202 41 3.4 0 78 0 0 2 19 14 39
VAR11 B 250 165 45 4.4 2 41 0 0 6 16 9 0
VAR12 A 500 230 56 4.9 19 18 20 5 8 9 2 0
VAR13 A 1000 333 55 4.6 64 42 16 21 16 6 5 0
VAR14R A 4000 236 53 4.6 56 10 13 12 13 7 0 0
RII06 A - 245 54 4,6 47 0 11 10 13 0 0 0
SIG17R A - 266 59 4,6 72 0 13 8 11 0 0 0
SLE41R A - 340 46 4,0 75 0 16 0 14 9 0 0 Afi = Amphiura filiformis, Pje = Parampinome jeffreysii, Sbo = Spiophanes bombyx, Skr = Spiophanes kroyeri, Psp = Phoronis sp, Nin = Nemertini indet., Csp. = Chaetosone sp. (incl. C. setosa), Cca = Capitella capitata.
15.3 Summary and conclusions The sediment at the Varg field is classified as fine sand with a relatively low amount of pelite (1.3 – 2.7 %) and TOM (0.6 – 0.9 %). The amount of pelite has increased at all stations, including the reference station, at Varg, while the TOM has increased most at stations VAR03 and VAR09, but the TOM levels are below 1 %.
The Varg field is located in shallow area south in Region II. As for the previous survey, the highest concentrations of THC (412 mg/kg) and barium (1671 mg/kg) are found at the innermost station in the main current direction from Varg (20o-axis). The area significantly contaminated with THC and barium reaches out to 1000 m on the 20o- and 290o-axes, while THC is contaminated out to 500 m and barium out to 1000 m on the 200o-axis. The gas chromatogram of sediment extracts from stations contaminated with THC show the presence of mineral oil. According to data on recent drilling, oil-based mud was possible discharged in 1999.
Compared to the 1997 results the THC levels have increased at the innermost stations on the 20o-, 200o- 290o- axes and at the outermost station on the 290o-axis. At the remaining stations the THC contents are almost unchanged or reduced. The barium content has increased over the whole Varg field. According to data on discharges, both barite and water-based drilling mud were discharged in 1999.
Since 1997 the area contaminated with THC is unchanged on the 20o- and 200o-axes, while the contaminated area has increased from 500 m to at least 1000 m along the 290o-axis. None of the stations on the 110o-axis are contaminated with THC in the present survey. The area contaminated with barium has increased from 250 m on the 20o- and 200o-axes to at least 1000 m on the 20o-, 200o- and 290o-axes.
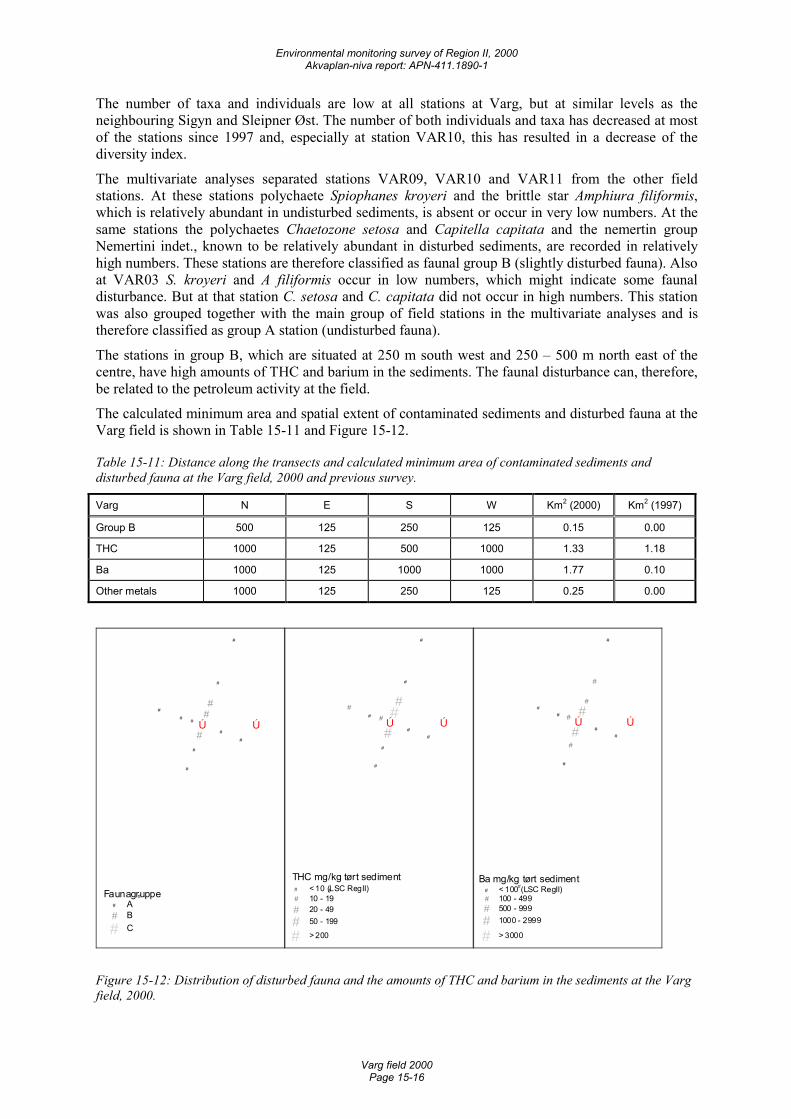
Environmental monitoring survey of Region II, 2000 Akvaplan-niva report: APN-411.1890-1
Varg field 2000 Page 15-16
The number of taxa and individuals are low at all stations at Varg, but at similar levels as the neighbouring Sigyn and Sleipner Øst. The number of both individuals and taxa has decreased at most of the stations since 1997 and, especially at station VAR10, this has resulted in a decrease of the diversity index.
The multivariate analyses separated stations VAR09, VAR10 and VAR11 from the other field stations. At these stations polychaete Spiophanes kroyeri and the brittle star Amphiura filiformis, which is relatively abundant in undisturbed sediments, is absent or occur in very low numbers. At the same stations the polychaetes Chaetozone setosa and Capitella capitata and the nemertin group Nemertini indet., known to be relatively abundant in disturbed sediments, are recorded in relatively high numbers. These stations are therefore classified as faunal group B (slightly disturbed fauna). Also at VAR03 S. kroyeri and A filiformis occur in low numbers, which might indicate some faunal disturbance. But at that station C. setosa and C. capitata did not occur in high numbers. This station was also grouped together with the main group of field stations in the multivariate analyses and is therefore classified as group A station (undisturbed fauna).
The stations in group B, which are situated at 250 m south west and 250 – 500 m north east of the centre, have high amounts of THC and barium in the sediments. The faunal disturbance can, therefore, be related to the petroleum activity at the field.
The calculated minimum area and spatial extent of contaminated sediments and disturbed fauna at the Varg field is shown in Table 15-11 and Figure 15-12.
Table 15-11: Distance along the transects and calculated minimum area of contaminated sediments and disturbed fauna at the Varg field, 2000 and previous survey.
Varg N E S W Km2 (2000) Km2 (1997)
Group B 500 125 250 125 0.15 0.00
THC 1000 125 500 1000 1.33 1.18
Ba 1000 125 1000 1000 1.77 0.10
Other metals 1000 125 250 125 0.25 0.00
Ú Ú
#
##
#
#
#
#
##
#
#
#
#Faunagruppe# A# B
# C
Ú Ú
## #
#
#
#
#
##
##
#
#
THC mg/kg tørt sediment# < 10 (LSC RegII)# 10 - 19# 20 - 49
# 50 - 199
# > 200
Ú Ú
#
# #
#
#
#
#
#
#
##
#
#Ba mg/kg tørt sediment
# < 100 (LSC RegII)# 100 - 499# 500 - 999
# 1000 - 2999
# > 3000
Figure 15-12: Distribution of disturbed fauna and the amounts of THC and barium in the sediments at the Varg field, 2000.
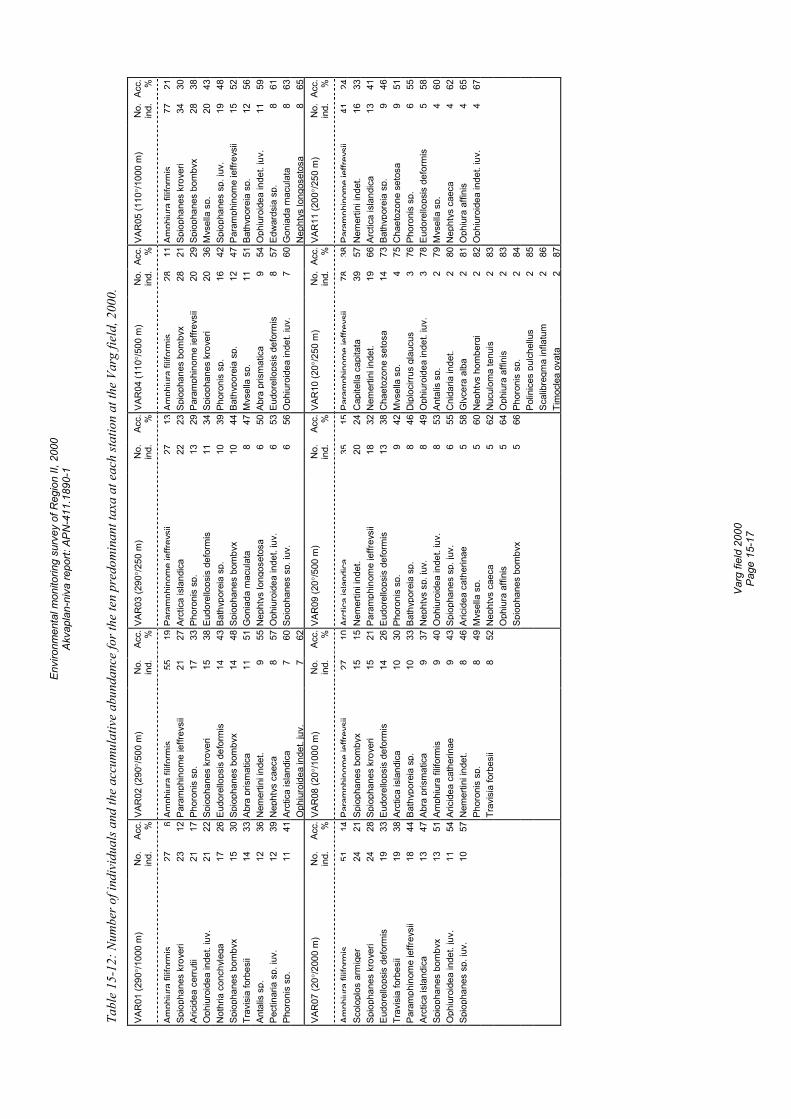
Envi
ronm
enta
l mon
itorin
g su
rvey
of R
egio
n II,
200
0 Ak
vapl
an-n
iva
repo
rt: A
PN-4
11.1
890-
1
Va
rg fi
eld
2000
Pa
ge 1
5-17
Tabl
e 15
-12:
Num
ber o
f ind
ivid
uals
and
the
accu
mul
ativ
e ab
unda
nce
for t
he te
n pr
edom
inan
t tax
a at
eac
h sta
tion
at th
e Va
rg fi
eld,
200
0.
VAR
01 (2
90°/
1000
m)
No.
in
d.
Acc.
%
VAR
02 (2
90°/
500
m)
No.
in
d.Ac
c.
%VA
R03
(290
°/25
0 m
) N
o.
ind.
Acc.
%
VAR
04 (1
10°/
500
m)
No.
in
d.Ac
c.
%VA
R05
(110
°/10
00 m
) N
o.
ind.
Acc.
%
Amph
iura
filifo
rmis
276
Amph
iura
filifo
rmis
5519
Para
mph
inom
eje
ffrey
sii
2713
Amph
iura
filifo
rmis
2811
Amph
iura
filifo
rmis
7721
Spio
phan
es k
roye
ri 23
12
Par
amph
inom
e je
ffrey
sii
2127
Arct
ica
isla
ndic
a22
23Sp
ioph
anes
bom
byx
2821
Spio
phan
es k
roye
ri34
30
Ar
icid
ea c
erru
tii
21
17 P
horo
nis
sp.
1733
Phor
onis
sp.
1329
Para
mph
inom
e je
ffrey
sii
2029
Spio
phan
es b
omby
x28
38
O
phiu
roid
ea in
det.
juv.
21
22
Spi
opha
nes
kroy
eri
1538
Eudo
rello
psis
def
orm
is11
34Sp
ioph
anes
kro
yeri
2036
Mys
ella
sp.
20
43
Not
hria
con
chyl
ega
17
26 E
udor
ello
psis
def
orm
is14
43Ba
thyp
orei
a sp
.10
39Ph
oron
is s
p.16
42Sp
ioph
anes
sp.
juv.
19
48
Spio
phan
es b
omby
x 15
30
Spi
opha
nes
bom
byx
1448
Spio
phan
es b
omby
x10
44Ba
thyp
orei
a sp
.12
47Pa
ram
phin
ome
jeffr
eysi
i15
52
Tr
avis
ia fo
rbes
ii 14
33
Abr
a pr
ism
atic
a11
51G
onia
da m
acul
ata
847
Mys
ella
sp.
1151
Bath
ypor
eia
sp.
12
56
Anta
lis s
p.
12
36 N
emer
tini i
ndet
.9
55N
epht
ys lo
ngos
etos
a6
50Ab
ra p
rism
atic
a9
54O
phiu
roid
ea in
det.
juv.
11
59
Pect
inar
ia s
p. ju
v.
12
39 N
epht
ys c
aeca
857
Oph
iuro
idea
inde
t. ju
v.6
53Eu
dore
llops
is d
efor
mis
857
Edw
ards
ia s
p.8
61
Phor
onis
sp.
11
41
Arc
tica
isla
ndic
a7
60Sp
ioph
anes
sp.
juv.
656
Oph
iuro
idea
inde
t. ju
v.7
60G
onia
da m
acul
ata
8 63
O
phiu
roid
ea in
det.
juv.
762
Nep
htys
long
oset
osa
8 65
VA
R07
(20°
/200
0 m
) N
o.
ind.
Ac
c.
% VA
R08
(20°
/100
0 m
) N
o.
ind.
Acc.
%
VAR
09 (2
0°/5
00 m
) N
o.in
d.Ac
c.
%VA
R10
(20°
/250
m)
No.
in
d.Ac
c.
%VA
R11
(200
°/25
0 m
) N
o.
ind.
Acc.
%
Amph
iura
filifo
rmis
5114
Para
mph
inom
eje
ffrey
sii
2710
Arct
ica
isla
ndic
a35
15Pa
ram
phin
ome
jeffr
eysi
i78
38Pa
ram
phin
ome
jeffr
eysi
i41
24Sc
olop
los
arm
iger
24
21
Spi
opha
nes
bom
byx
1515
Nem
ertin
i ind
et.
2024
Cap
itella
cap
itata
3957
Nem
ertin
i ind
et.
16
33
Spio
phan
es k
roye
ri 24
28
Spi
opha
nes
kroy
eri
1521
Para
mph
inom
e je
ffrey
sii
1832
Nem
ertin
i ind
et.
1966
Arct
ica
isla
ndic
a13
41
Eu
dore
llops
is d
efor
mis
19
33
Eud
orel
lops
is d
efor
mis
1426
Eudo
rello
psis
def
orm
is13
38C
haet
ozon
e se
tosa
1473
Bath
ypor
eia
sp.
9 46
Tr
avis
ia fo
rbes
ii 19
38
Arc
tica
isla
ndic
a10
30Ph
oron
is s
p.9
42M
ysel
la s
p.4
75C
haet
ozon
e se
tosa
9 51
Pa
ram
phin
ome
jeffr
eysi
i 18
44
Bat
hypo
reia
sp.
1033
Bath
ypor
eia
sp.
846
Dip
loci
rrus
glau
cus
376
Phor
onis
sp.
6 55
Ar
ctic
a is
land
ica
13
47 A
bra
pris
mat
ica
937
Nep
htys
sp.
juv.
849
Oph
iuro
idea
inde
t. ju
v.3
78Eu
dore
llops
is d
efor
mis
5 58
Sp
ioph
anes
bom
byx
13
51 A
mph
iura
filif
orm
is9
40O
phiu
roid
ea in
det.
juv.
853
Anta
lis s
p.2
79M
ysel
la s
p.4
60
Oph
iuro
idea
inde
t. ju
v.
11
54 A
ricid
ea c
athe
rinae
943
Spio
phan
es s
p. ju
v.6
55C
nida
ria in
det.
280
Nep
htys
cae
ca4
62
Spio
phan
es s
p. ju
v.
10
57 N
emer
tini i
ndet
.8
46Ar
icid
ea c
athe
rinae
558
Gly
cera
alb
a2
81O
phiu
ra a
ffini
s4
65
Pho
roni
s sp
.8
49M
ysel
la s
p.5
60N
epht
ys h
ombe
rgi
282
Oph
iuro
idea
inde
t. ju
v.4
67
Tra
visi
a fo
rbes
ii8
52N
epht
ys c
aeca
562
Nuc
ulom
a te
nuis
283
O
phiu
ra a
ffini
s5
64O
phiu
ra a
ffini
s2
83
Spio
phan
es b
omby
x5
66Ph
oron
is s
p.2
84
Polin
ices
pul
chel
lus
285
Sc
alib
regm
a in
flatu
m2
86
Tim
ocle
a ov
ata
287
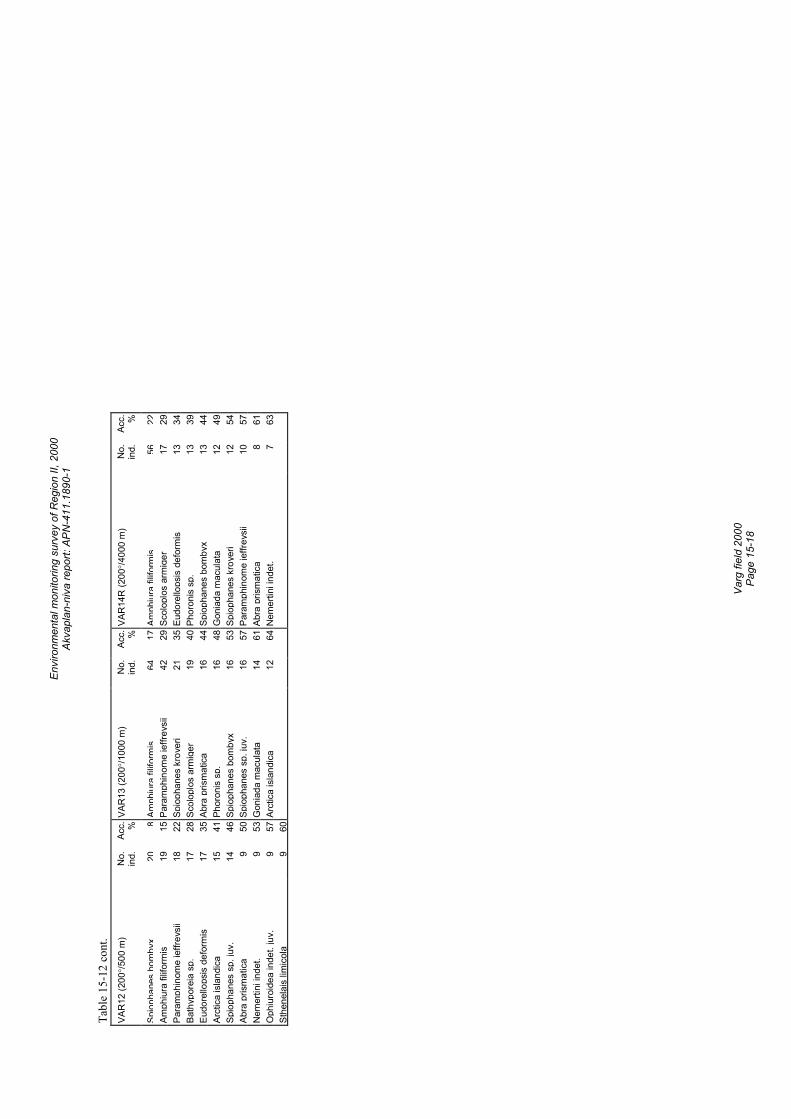
Envi
ronm
enta
l mon
itorin
g su
rvey
of R
egio
n II,
200
0 Ak
vapl
an-n
iva
repo
rt: A
PN-4
11.1
890-
1
Va
rg fi
eld
2000
Pa
ge 1
5-18
Tabl
e 15
-12
cont
.
VA
R12
(200
°/50
0 m
) N
o.
ind.
Ac
c.
% VA
R13
(200
°/10
00 m
) N
o.
ind.
Acc.
%
VAR
14R
(200
°/40
00 m
) N
o.
ind.
Acc.
%
Spio
phan
esbo
mby
x20
8Am
phiu
rafil
iform
is64
17Am
phiu
rafil
iform
is56
22Am
phiu
ra fi
lifor
mis
19
15
Par
amph
inom
e je
ffrey
sii
4229
Scol
oplo
s ar
mig
er17
29
Pa
ram
phin
ome
jeffr
eysi
i 18
22
Spi
opha
nes
kroy
eri
2135
Eudo
rello
psis
def
orm
is13
34
Ba
thyp
orei
a sp
. 17
28
Sco
lopl
os a
rmig
er19
40Ph
oron
is s
p.13
39
Eu
dore
llops
is d
efor
mis
17
35
Abr
a pr
ism
atic
a16
44Sp
ioph
anes
bom
byx
1344
Arct
ica
isla
ndic
a 15
41
Pho
roni
s sp
.16
48G
onia
da m
acul
ata
1249
Spio
phan
es s
p. ju
v.
14
46 S
piop
hane
s bo
mby
x16
53Sp
ioph
anes
kro
yeri
1254
Abra
pris
mat
ica
9 50
Spi
opha
nes
sp. j
uv.
1657
Para
mph
inom
e je
ffrey
sii
1057
Nem
ertin
i ind
et.
9 53
Gon
iada
mac
ulat
a14
61Ab
ra p
rism
atic
a8
61
O
phiu
roid
ea in
det.
juv.
9
57 A
rctic
a is
land
ica
1264
Nem
ertin
i ind
et.
763
Sthe
nela
is li
mic
ola
9 60
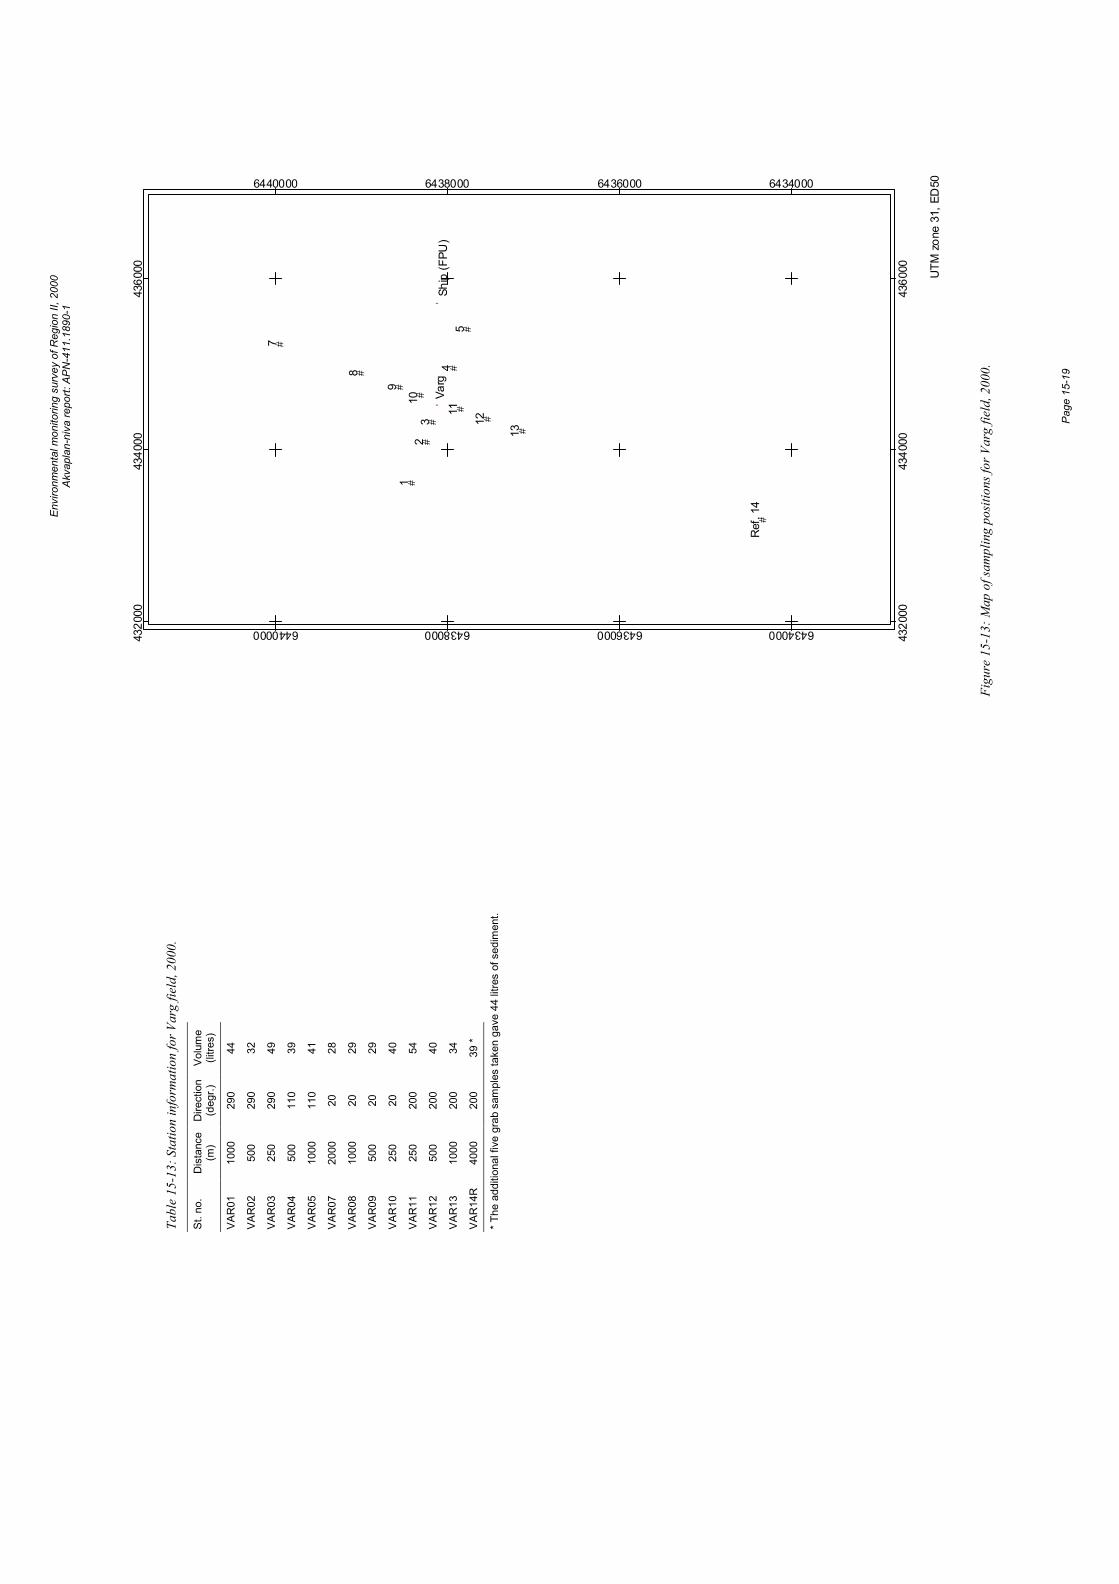
Envi
ronm
enta
l mon
itorin
g su
rvey
of R
egio
n II,
200
0 Ak
vapl
an-n
iva
repo
rt: A
PN-4
11.1
890-
1
Pa
ge 1
5-19
#
##
#
#
#
#
#
#
#
#
#
#
''
12
3
45
7
8
9
10
11
12
13
Ref
. 14
Ship
(FPU
)Va
rg
UTM
zon
e 31
, ED
50
4320
00
4320
00
4340
00
4340
00
4360
00
4360
00
6434000
6434000
6436000
6436000
6438000
6438000
6440000
6440000
Figu
re 1
5-13
: Map
of s
ampl
ing
posit
ions
for V
arg
field
, 200
0.
Tabl
e 15
-13:
Sta
tion
info
rmat
ion
for V
arg
field
, 200
0.
St. n
o.
Dis
tanc
e (m
) D
irect
ion
(deg
r.)
Volu
me
(litre
s)
VAR
01
1000
29
0 44
VAR
02
500
290
32
VAR
03
250
290
49
VAR
04
500
110
39
VAR
05
1000
11
0 41
VAR
07
2000
20
28
VAR
08
1000
20
29
VAR
09
500
20
29
VAR
10
250
20
40
VAR
11
250
200
54
VAR
12
500
200
40
VAR
13
1000
20
0 34
VAR
14R
40
00
200
39 *
* The
add
ition
al fi
ve g
rab
sam
ples
take
n ga
ve 4
4 lit
res
of s
edim
ent.

Envi
ronm
enta
l mon
itorin
g su
rvey
of R
egio
n II,
200
0 Ak
vapl
an-n
iva
repo
rt: A
PN-4
11.1
890-
1
Pa
ge 1
5-20
Environmental monitoring survey of Region II, 2000 Akvaplan-niva report: APN-411.1890-1
Heimdal field 2000 Page 16-1
16 Heimdal field 16.1 Introduction The Heimdal field is located in block 25/4 in Region II. Data on recent drilling and discharges are shown in Table 16-1.
In the monitoring survey at the field in 1997, sediments at all stations were contaminated by hydrocarbons. Barium, zinc, cadmium and copper values above LSC were found at all stations too. Elevated levels of lead were found at the 250 m stations in the 324° and 180° directions. The fauna was disturbed at the 250 m stations. Additional stations were therefor included in the present survey.
Information on the sampling stations is shown in Figure 16-12 and Table 16-14, both on the foldout page at the end of this chapter (page 16-19).
Table 16-1: Summary of recent wells drilled and operational and accidental discharges at the Heimdal field (all discharges in tonnes).
1997 1998 1999 2000 Comments
Accidental discharges 0 0 0,06m3 0
16.2 Results and discussion
16.2.1 Physical characteristics The median phi value and the amounts (%) of pelite, fine sand and total organic material (TOM) in the sediment from the present and previous surveys are shown in Table 16-2 and Figure 16-1. Detailed data on sediment characteristics such as colour, smell and a full set of analytical data, including TOM content and grain size distribution (with standard deviation, evenness and kurtosis) can be found in the Appendix.
The sediments at the Heimdal field are classified as fine sand and silt with median values RANGING from 3.71 (HEM15) to 4.21 (HEM18). The amount of pelite in the sediment varies from 7.9 % (HEM02) to 14.2 % (HEM18), the fine sand from 71.4 % (HEM15) to 84.2 % (HEM04) while the TOM varies from 1.31 % (HEM02) to 1.90 % (HEM18). The pelite and TOM values are higher at the reference station HEM22R than at the field stations.
There is a general trend of finer sediments at the stations compared with the results from 1997. The largest increase in the pelite content has occurred at three field stations (HEM03, HEM18 and HEM19) and the reference station HEM22R and the largest increase in TOM has occurred at station HEM18.
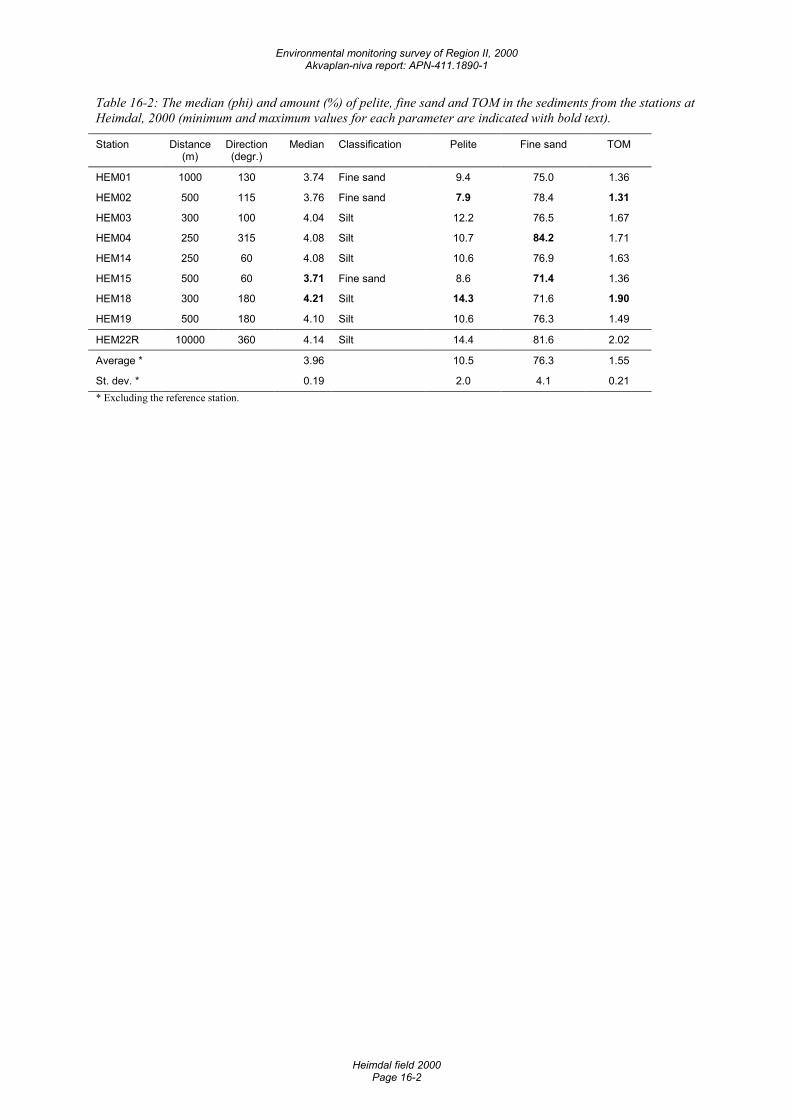
Environmental monitoring survey of Region II, 2000 Akvaplan-niva report: APN-411.1890-1
Heimdal field 2000 Page 16-2
Table 16-2: The median (phi) and amount (%) of pelite, fine sand and TOM in the sediments from the stations at Heimdal, 2000 (minimum and maximum values for each parameter are indicated with bold text).
Station Distance (m)
Direction (degr.)
Median Classification Pelite Fine sand TOM
HEM01 1000 130 3.74 Fine sand 9.4 75.0 1.36
HEM02 500 115 3.76 Fine sand 7.9 78.4 1.31
HEM03 300 100 4.04 Silt 12.2 76.5 1.67
HEM04 250 315 4.08 Silt 10.7 84.2 1.71
HEM14 250 60 4.08 Silt 10.6 76.9 1.63
HEM15 500 60 3.71 Fine sand 8.6 71.4 1.36
HEM18 300 180 4.21 Silt 14.3 71.6 1.90
HEM19 500 180 4.10 Silt 10.6 76.3 1.49
HEM22R 10000 360 4.14 Silt 14.4 81.6 2.02
Average * 3.96 10.5 76.3 1.55
St. dev. * 0.19 2.0 4.1 0.21 * Excluding the reference station.
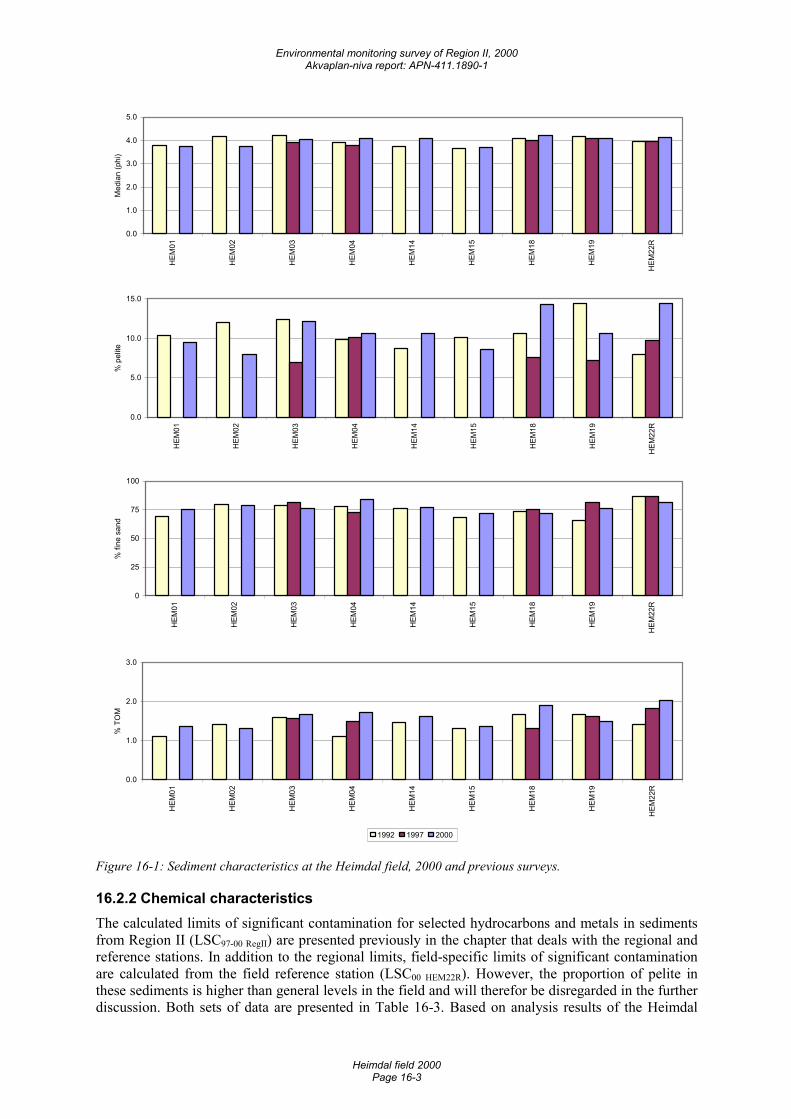
Environmental monitoring survey of Region II, 2000 Akvaplan-niva report: APN-411.1890-1
Heimdal field 2000 Page 16-3
0.0
1.0
2.0
3.0
4.0
5.0
HEM
01
HEM
02
HEM
03
HEM
04
HEM
14
HEM
15
HEM
18
HEM
19
HEM
22R
Med
ian
(phi
)
0.0
5.0
10.0
15.0
HEM
01
HEM
02
HEM
03
HEM
04
HEM
14
HEM
15
HEM
18
HEM
19
HEM
22R
% p
elite
0
25
50
75
100
HEM
01
HEM
02
HEM
03
HEM
04
HEM
14
HEM
15
HEM
18
HEM
19
HEM
22R
% fi
ne s
and
0.0
1.0
2.0
3.0
HEM
01
HEM
02
HEM
03
HEM
04
HEM
14
HEM
15
HEM
18
HEM
19
HEM
22R
% T
OM
1992 1997 2000
Figure 16-1: Sediment characteristics at the Heimdal field, 2000 and previous surveys.
16.2.2 Chemical characteristics The calculated limits of significant contamination for selected hydrocarbons and metals in sediments from Region II (LSC97-00 RegII) are presented previously in the chapter that deals with the regional and reference stations. In addition to the regional limits, field-specific limits of significant contamination are calculated from the field reference station (LSC00 HEM22R). However, the proportion of pelite in these sediments is higher than general levels in the field and will therefor be disregarded in the further discussion. Both sets of data are presented in Table 16-3. Based on analysis results of the Heimdal
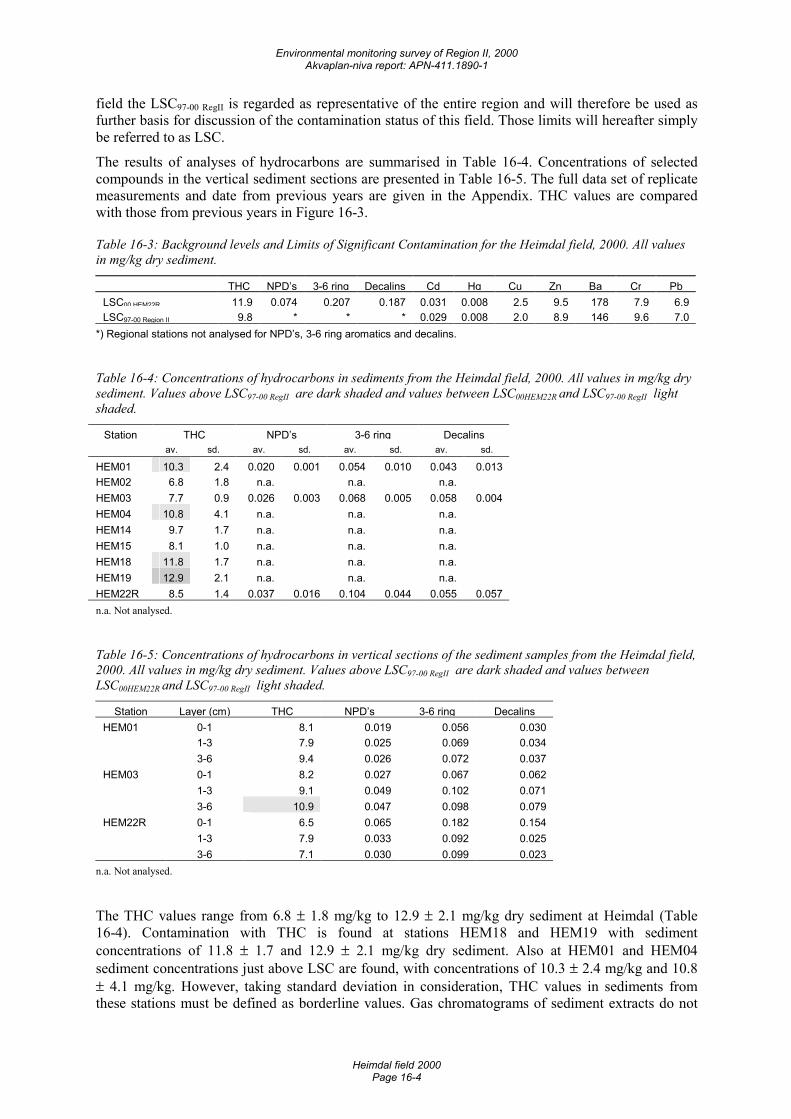
Environmental monitoring survey of Region II, 2000 Akvaplan-niva report: APN-411.1890-1
Heimdal field 2000 Page 16-4
field the LSC97-00 RegII is regarded as representative of the entire region and will therefore be used as further basis for discussion of the contamination status of this field. Those limits will hereafter simply be referred to as LSC.
The results of analyses of hydrocarbons are summarised in Table 16-4. Concentrations of selected compounds in the vertical sediment sections are presented in Table 16-5. The full data set of replicate measurements and date from previous years are given in the Appendix. THC values are compared with those from previous years in Figure 16-3.
Table 16-3: Background levels and Limits of Significant Contamination for the Heimdal field, 2000. All values in mg/kg dry sediment.
THC NPD’s 3-6 ring Decalins Cd Hg Cu Zn Ba Cr PbLSC00 HEM22R 11.9 0.074 0.207 0.187 0.031 0.008 2.5 9.5 178 7.9 6.9LSC97-00 Region II 9.8 * * * 0.029 0.008 2.0 8.9 146 9.6 7.0
*) Regional stations not analysed for NPD’s, 3-6 ring aromatics and decalins.
Table 16-4: Concentrations of hydrocarbons in sediments from the Heimdal field, 2000. All values in mg/kg dry sediment. Values above LSC97-00 RegII are dark shaded and values between LSC00HEM22R and LSC97-00 RegII light shaded.
Station THC NPD’s 3-6 ring Decalins av. sd. av. sd. av. sd. av. sd.
HEM01 10.3 2.4 0.020 0.001 0.054 0.010 0.043 0.013HEM02 6.8 1.8 n.a. n.a. n.a.HEM03 7.7 0.9 0.026 0.003 0.068 0.005 0.058 0.004HEM04 10.8 4.1 n.a. n.a. n.a.HEM14 9.7 1.7 n.a. n.a. n.a.HEM15 8.1 1.0 n.a. n.a. n.a.HEM18 11.8 1.7 n.a. n.a. n.a.HEM19 12.9 2.1 n.a. n.a. n.a.HEM22R 8.5 1.4 0.037 0.016 0.104 0.044 0.055 0.057n.a. Not analysed.
Table 16-5: Concentrations of hydrocarbons in vertical sections of the sediment samples from the Heimdal field, 2000. All values in mg/kg dry sediment. Values above LSC97-00 RegII are dark shaded and values between LSC00HEM22R and LSC97-00 RegII light shaded.
Station Layer (cm) THC NPD’s 3-6 ring DecalinsHEM01 0-1 8.1 0.019 0.056 0.030 1-3 7.9 0.025 0.069 0.034 3-6 9.4 0.026 0.072 0.037HEM03 0-1 8.2 0.027 0.067 0.062 1-3 9.1 0.049 0.102 0.071 3-6 10.9 0.047 0.098 0.079HEM22R 0-1 6.5 0.065 0.182 0.154 1-3 7.9 0.033 0.092 0.025 3-6 7.1 0.030 0.099 0.023
n.a. Not analysed.
The THC values range from 6.8 ± 1.8 mg/kg to 12.9 ± 2.1 mg/kg dry sediment at Heimdal (Table 16-4). Contamination with THC is found at stations HEM18 and HEM19 with sediment concentrations of 11.8 ± 1.7 and 12.9 ± 2.1 mg/kg dry sediment. Also at HEM01 and HEM04 sediment concentrations just above LSC are found, with concentrations of 10.3 ± 2.4 mg/kg and 10.8 ± 4.1 mg/kg. However, taking standard deviation in consideration, THC values in sediments from these stations must be defined as borderline values. Gas chromatograms of sediment extracts do not
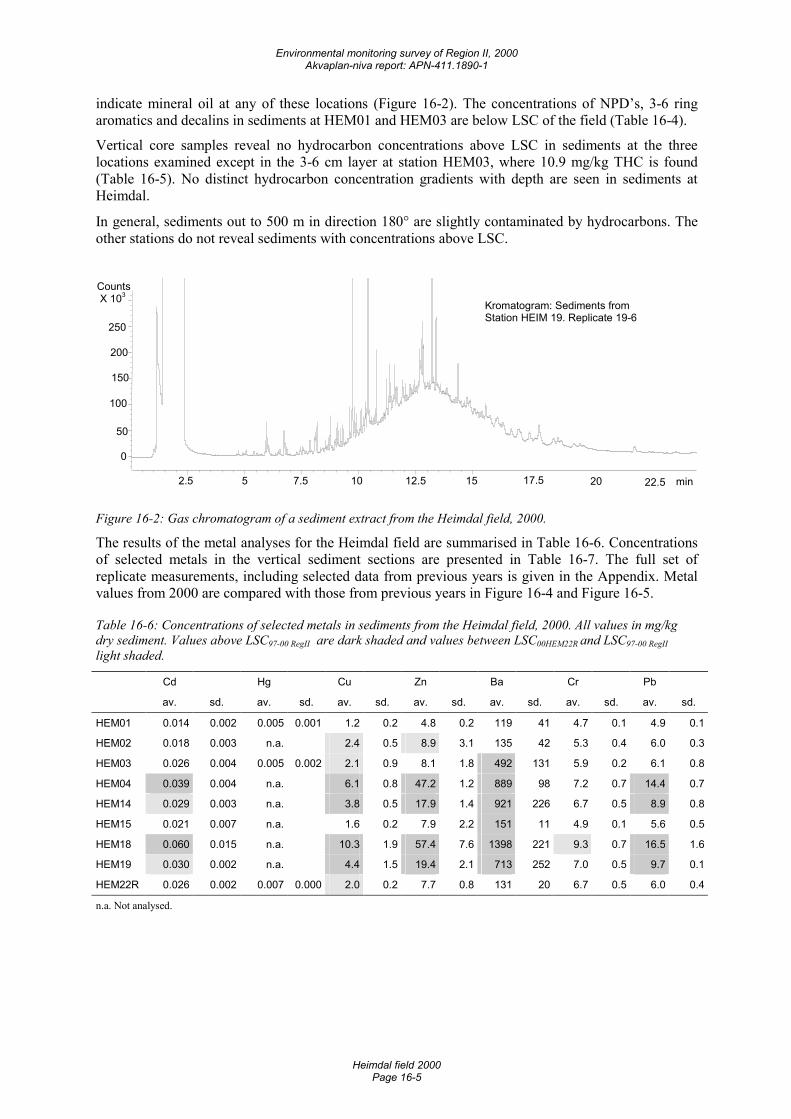
Environmental monitoring survey of Region II, 2000 Akvaplan-niva report: APN-411.1890-1
Heimdal field 2000 Page 16-5
indicate mineral oil at any of these locations (Figure 16-2). The concentrations of NPD’s, 3-6 ring aromatics and decalins in sediments at HEM01 and HEM03 are below LSC of the field (Table 16-4).
Vertical core samples reveal no hydrocarbon concentrations above LSC in sediments at the three locations examined except in the 3-6 cm layer at station HEM03, where 10.9 mg/kg THC is found (Table 16-5). No distinct hydrocarbon concentration gradients with depth are seen in sediments at Heimdal.
In general, sediments out to 500 m in direction 180° are slightly contaminated by hydrocarbons. The other stations do not reveal sediments with concentrations above LSC.
min 2.5 5 7.5 10 12.5 15 17.5 20 22.5
Counts X 103
0
50
100
150
200
250
Kromatogram: Sediments from Station HEIM 19. Replicate 19-6
Figure 16-2: Gas chromatogram of a sediment extract from the Heimdal field, 2000.
The results of the metal analyses for the Heimdal field are summarised in Table 16-6. Concentrations of selected metals in the vertical sediment sections are presented in Table 16-7. The full set of replicate measurements, including selected data from previous years is given in the Appendix. Metal values from 2000 are compared with those from previous years in Figure 16-4 and Figure 16-5.
Table 16-6: Concentrations of selected metals in sediments from the Heimdal field, 2000. All values in mg/kg dry sediment. Values above LSC97-00 RegII are dark shaded and values between LSC00HEM22R and LSC97-00 RegII light shaded.
Cd Hg Cu Zn Ba Cr Pb
av. sd. av. sd. av. sd. av. sd. av. sd. av. sd. av. sd.
HEM01 0.014 0.002 0.005 0.001 1.2 0.2 4.8 0.2 119 41 4.7 0.1 4.9 0.1
HEM02 0.018 0.003 n.a. 2.4 0.5 8.9 3.1 135 42 5.3 0.4 6.0 0.3
HEM03 0.026 0.004 0.005 0.002 2.1 0.9 8.1 1.8 492 131 5.9 0.2 6.1 0.8
HEM04 0.039 0.004 n.a. 6.1 0.8 47.2 1.2 889 98 7.2 0.7 14.4 0.7
HEM14 0.029 0.003 n.a. 3.8 0.5 17.9 1.4 921 226 6.7 0.5 8.9 0.8
HEM15 0.021 0.007 n.a. 1.6 0.2 7.9 2.2 151 11 4.9 0.1 5.6 0.5
HEM18 0.060 0.015 n.a. 10.3 1.9 57.4 7.6 1398 221 9.3 0.7 16.5 1.6
HEM19 0.030 0.002 n.a. 4.4 1.5 19.4 2.1 713 252 7.0 0.5 9.7 0.1
HEM22R 0.026 0.002 0.007 0.000 2.0 0.2 7.7 0.8 131 20 6.7 0.5 6.0 0.4
n.a. Not analysed.
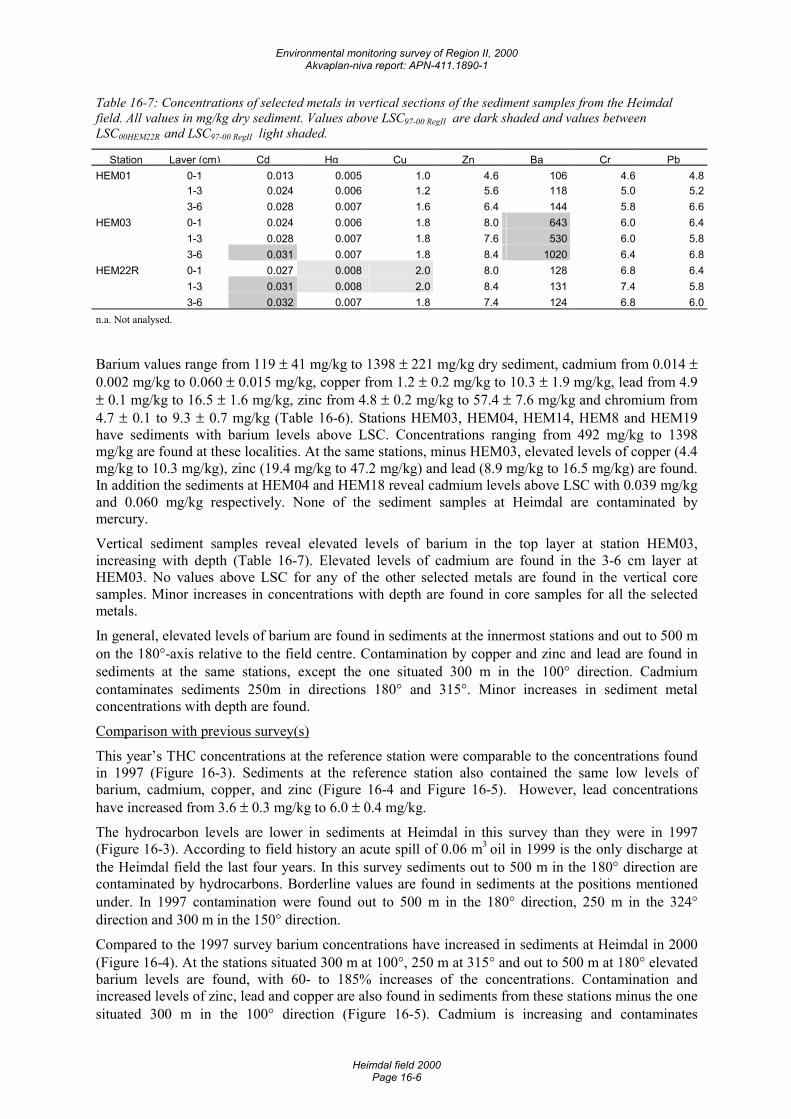
Environmental monitoring survey of Region II, 2000 Akvaplan-niva report: APN-411.1890-1
Heimdal field 2000 Page 16-6
Table 16-7: Concentrations of selected metals in vertical sections of the sediment samples from the Heimdal field. All values in mg/kg dry sediment. Values above LSC97-00 RegII are dark shaded and values between LSC00HEM22R and LSC97-00 RegII light shaded.
Station Layer (cm) Cd Hg Cu Zn Ba Cr PbHEM01 0-1 0.013 0.005 1.0 4.6 106 4.6 4.8 1-3 0.024 0.006 1.2 5.6 118 5.0 5.2 3-6 0.028 0.007 1.6 6.4 144 5.8 6.6HEM03 0-1 0.024 0.006 1.8 8.0 643 6.0 6.4 1-3 0.028 0.007 1.8 7.6 530 6.0 5.8 3-6 0.031 0.007 1.8 8.4 1020 6.4 6.8HEM22R 0-1 0.027 0.008 2.0 8.0 128 6.8 6.4 1-3 0.031 0.008 2.0 8.4 131 7.4 5.8 3-6 0.032 0.007 1.8 7.4 124 6.8 6.0n.a. Not analysed.
Barium values range from 119 ± 41 mg/kg to 1398 ± 221 mg/kg dry sediment, cadmium from 0.014 ± 0.002 mg/kg to 0.060 ± 0.015 mg/kg, copper from 1.2 ± 0.2 mg/kg to 10.3 ± 1.9 mg/kg, lead from 4.9 ± 0.1 mg/kg to 16.5 ± 1.6 mg/kg, zinc from 4.8 ± 0.2 mg/kg to 57.4 ± 7.6 mg/kg and chromium from 4.7 ± 0.1 to 9.3 ± 0.7 mg/kg (Table 16-6). Stations HEM03, HEM04, HEM14, HEM8 and HEM19 have sediments with barium levels above LSC. Concentrations ranging from 492 mg/kg to 1398 mg/kg are found at these localities. At the same stations, minus HEM03, elevated levels of copper (4.4 mg/kg to 10.3 mg/kg), zinc (19.4 mg/kg to 47.2 mg/kg) and lead (8.9 mg/kg to 16.5 mg/kg) are found. In addition the sediments at HEM04 and HEM18 reveal cadmium levels above LSC with 0.039 mg/kg and 0.060 mg/kg respectively. None of the sediment samples at Heimdal are contaminated by mercury.
Vertical sediment samples reveal elevated levels of barium in the top layer at station HEM03, increasing with depth (Table 16-7). Elevated levels of cadmium are found in the 3-6 cm layer at HEM03. No values above LSC for any of the other selected metals are found in the vertical core samples. Minor increases in concentrations with depth are found in core samples for all the selected metals.
In general, elevated levels of barium are found in sediments at the innermost stations and out to 500 m on the 180°-axis relative to the field centre. Contamination by copper and zinc and lead are found in sediments at the same stations, except the one situated 300 m in the 100° direction. Cadmium contaminates sediments 250m in directions 180° and 315°. Minor increases in sediment metal concentrations with depth are found.
Comparison with previous survey(s)
This year’s THC concentrations at the reference station were comparable to the concentrations found in 1997 (Figure 16-3). Sediments at the reference station also contained the same low levels of barium, cadmium, copper, and zinc (Figure 16-4 and Figure 16-5). However, lead concentrations have increased from 3.6 ± 0.3 mg/kg to 6.0 ± 0.4 mg/kg.
The hydrocarbon levels are lower in sediments at Heimdal in this survey than they were in 1997 (Figure 16-3). According to field history an acute spill of 0.06 m3 oil in 1999 is the only discharge at the Heimdal field the last four years. In this survey sediments out to 500 m in the 180° direction are contaminated by hydrocarbons. Borderline values are found in sediments at the positions mentioned under. In 1997 contamination were found out to 500 m in the 180° direction, 250 m in the 324° direction and 300 m in the 150° direction.
Compared to the 1997 survey barium concentrations have increased in sediments at Heimdal in 2000 (Figure 16-4). At the stations situated 300 m at 100°, 250 m at 315° and out to 500 m at 180° elevated barium levels are found, with 60- to 185% increases of the concentrations. Contamination and increased levels of zinc, lead and copper are also found in sediments from these stations minus the one situated 300 m in the 100° direction (Figure 16-5). Cadmium is increasing and contaminates
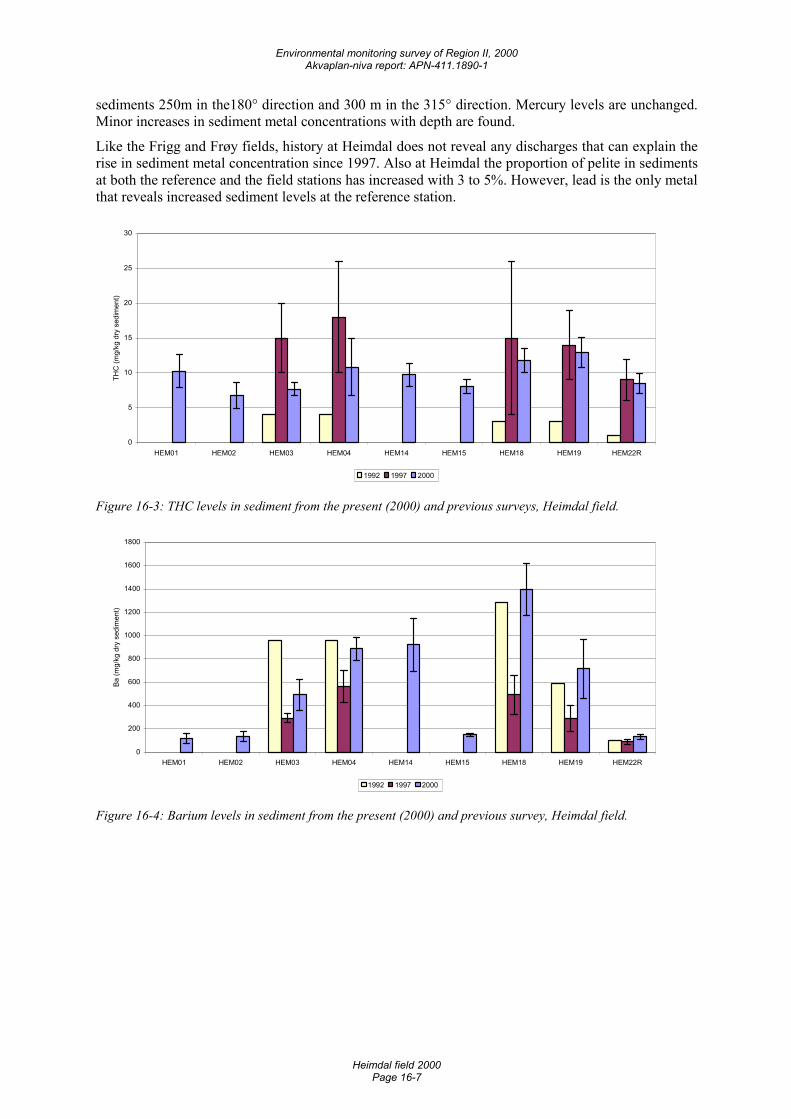
Environmental monitoring survey of Region II, 2000 Akvaplan-niva report: APN-411.1890-1
Heimdal field 2000 Page 16-7
sediments 250m in the180° direction and 300 m in the 315° direction. Mercury levels are unchanged. Minor increases in sediment metal concentrations with depth are found.
Like the Frigg and Frøy fields, history at Heimdal does not reveal any discharges that can explain the rise in sediment metal concentration since 1997. Also at Heimdal the proportion of pelite in sediments at both the reference and the field stations has increased with 3 to 5%. However, lead is the only metal that reveals increased sediment levels at the reference station.
0
5
10
15
20
25
30
HEM01 HEM02 HEM03 HEM04 HEM14 HEM15 HEM18 HEM19 HEM22R
THC
(mg/
kg d
ry s
edim
ent)
1992 1997 2000
Figure 16-3: THC levels in sediment from the present (2000) and previous surveys, Heimdal field.
0
200
400
600
800
1000
1200
1400
1600
1800
HEM01 HEM02 HEM03 HEM04 HEM14 HEM15 HEM18 HEM19 HEM22R
Ba (m
g/kg
dry
sed
imen
t)
1992 1997 2000
Figure 16-4: Barium levels in sediment from the present (2000) and previous survey, Heimdal field.
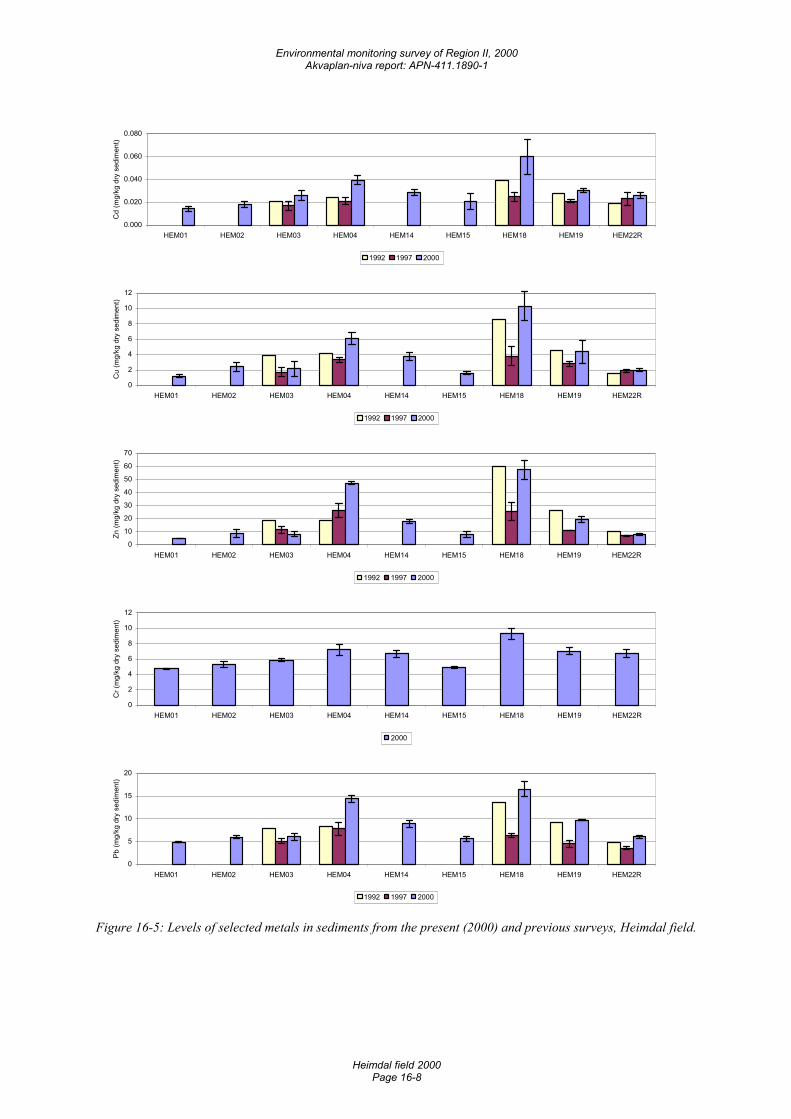
Environmental monitoring survey of Region II, 2000 Akvaplan-niva report: APN-411.1890-1
Heimdal field 2000 Page 16-8
0.000
0.020
0.040
0.060
0.080
HEM01 HEM02 HEM03 HEM04 HEM14 HEM15 HEM18 HEM19 HEM22R
Cd
(mg/
kg d
ry s
edim
ent)
1992 1997 2000
0
2
4
6
8
10
12
HEM01 HEM02 HEM03 HEM04 HEM14 HEM15 HEM18 HEM19 HEM22R
Cu
(mg/
kg d
ry s
edim
ent)
1992 1997 2000
0
10
20
30
40
50
60
70
HEM01 HEM02 HEM03 HEM04 HEM14 HEM15 HEM18 HEM19 HEM22R
Zn (m
g/kg
dry
sed
imen
t)
1992 1997 2000
0
2
4
6
8
10
12
HEM01 HEM02 HEM03 HEM04 HEM14 HEM15 HEM18 HEM19 HEM22R
Cr (
mg/
kg d
ry s
edim
ent)
2000
0
5
10
15
20
HEM01 HEM02 HEM03 HEM04 HEM14 HEM15 HEM18 HEM19 HEM22R
Pb (m
g/kg
dry
sed
imen
t)
1992 1997 2000
Figure 16-5: Levels of selected metals in sediments from the present (2000) and previous surveys, Heimdal field.
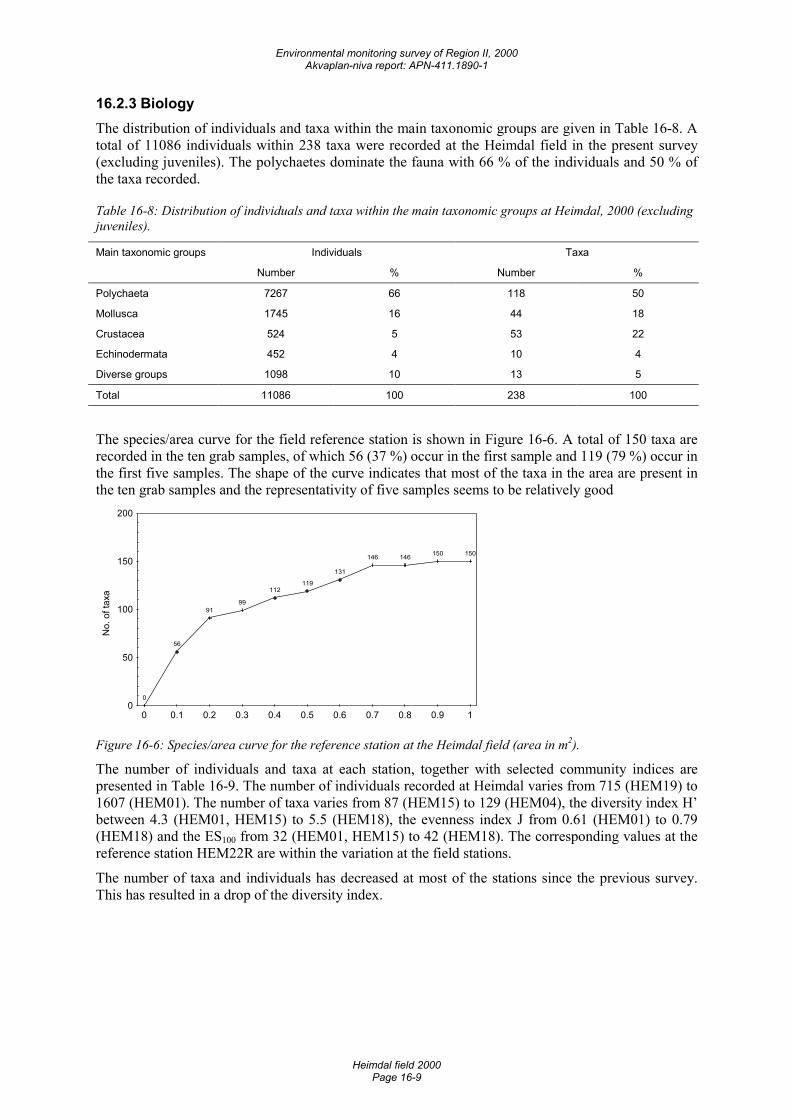
Environmental monitoring survey of Region II, 2000 Akvaplan-niva report: APN-411.1890-1
Heimdal field 2000 Page 16-9
16.2.3 Biology The distribution of individuals and taxa within the main taxonomic groups are given in Table 16-8. A total of 11086 individuals within 238 taxa were recorded at the Heimdal field in the present survey (excluding juveniles). The polychaetes dominate the fauna with 66 % of the individuals and 50 % of the taxa recorded.
Table 16-8: Distribution of individuals and taxa within the main taxonomic groups at Heimdal, 2000 (excluding juveniles).
Main taxonomic groups Individuals Taxa
Number % Number %
Polychaeta 7267 66 118 50
Mollusca 1745 16 44 18
Crustacea 524 5 53 22
Echinodermata 452 4 10 4
Diverse groups 1098 10 13 5
Total 11086 100 238 100
The species/area curve for the field reference station is shown in Figure 16-6. A total of 150 taxa are recorded in the ten grab samples, of which 56 (37 %) occur in the first sample and 119 (79 %) occur in the first five samples. The shape of the curve indicates that most of the taxa in the area are present in the ten grab samples and the representativity of five samples seems to be relatively good
No.
of t
axa
0
56
9199
112119
131
146 146 150 150
0
50
100
150
200
0 0.1 0.2 0.3 0.4 0.5 0.6 0.7 0.8 0.9 1
Figure 16-6: Species/area curve for the reference station at the Heimdal field (area in m2).
The number of individuals and taxa at each station, together with selected community indices are presented in Table 16-9. The number of individuals recorded at Heimdal varies from 715 (HEM19) to 1607 (HEM01). The number of taxa varies from 87 (HEM15) to 129 (HEM04), the diversity index H’ between 4.3 (HEM01, HEM15) to 5.5 (HEM18), the evenness index J from 0.61 (HEM01) to 0.79 (HEM18) and the ES100 from 32 (HEM01, HEM15) to 42 (HEM18). The corresponding values at the reference station HEM22R are within the variation at the field stations.
The number of taxa and individuals has decreased at most of the stations since the previous survey. This has resulted in a drop of the diversity index.
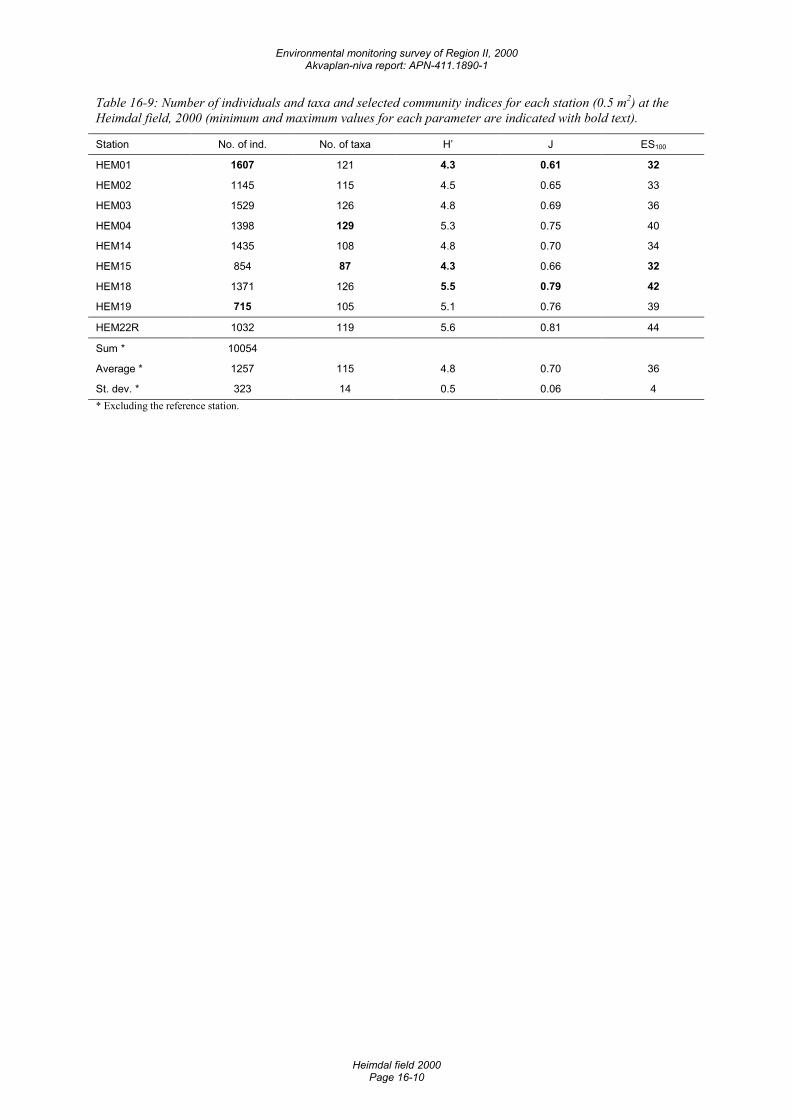
Environmental monitoring survey of Region II, 2000 Akvaplan-niva report: APN-411.1890-1
Heimdal field 2000 Page 16-10
Table 16-9: Number of individuals and taxa and selected community indices for each station (0.5 m2) at the Heimdal field, 2000 (minimum and maximum values for each parameter are indicated with bold text).
Station No. of ind. No. of taxa H’ J ES100
HEM01 1607 121 4.3 0.61 32
HEM02 1145 115 4.5 0.65 33
HEM03 1529 126 4.8 0.69 36
HEM04 1398 129 5.3 0.75 40
HEM14 1435 108 4.8 0.70 34
HEM15 854 87 4.3 0.66 32
HEM18 1371 126 5.5 0.79 42
HEM19 715 105 5.1 0.76 39
HEM22R 1032 119 5.6 0.81 44
Sum * 10054
Average * 1257 115 4.8 0.70 36
St. dev. * 323 14 0.5 0.06 4 * Excluding the reference station.
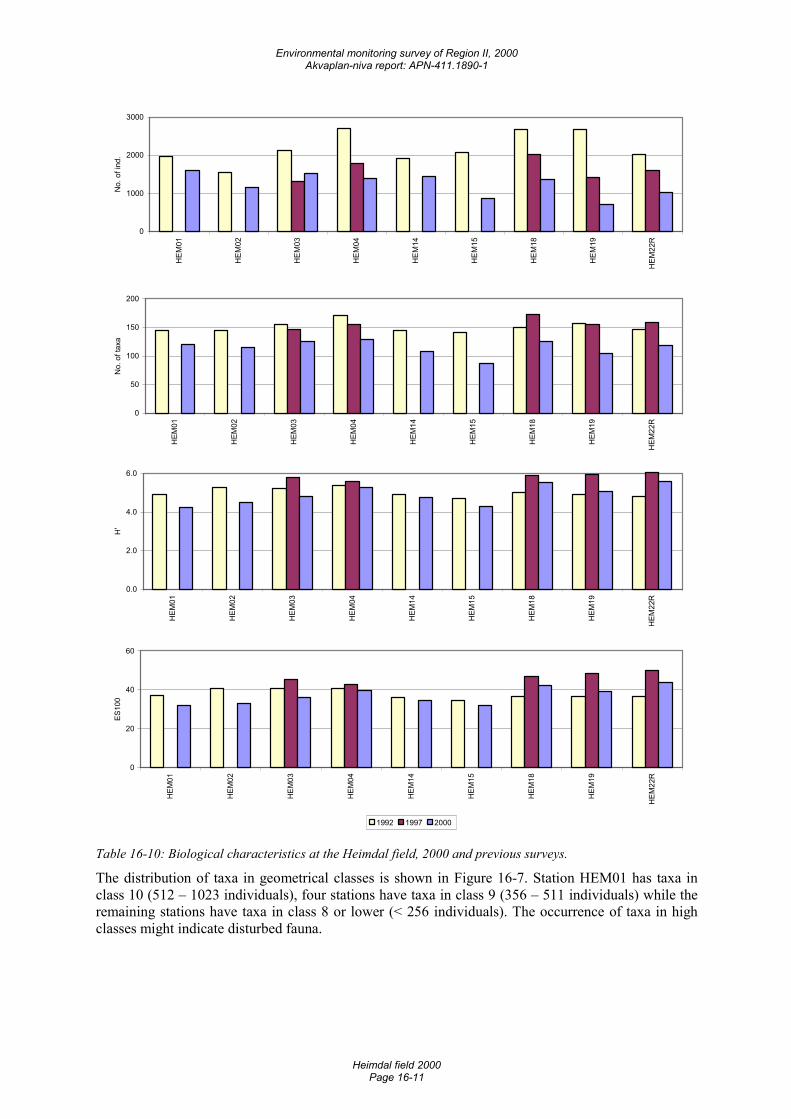
Environmental monitoring survey of Region II, 2000 Akvaplan-niva report: APN-411.1890-1
Heimdal field 2000 Page 16-11
0
1000
2000
3000
HEM
01
HEM
02
HEM
03
HEM
04
HEM
14
HEM
15
HEM
18
HEM
19
HEM
22R
No.
of i
nd.
0
50
100
150
200
HEM
01
HEM
02
HEM
03
HEM
04
HEM
14
HEM
15
HEM
18
HEM
19
HEM
22R
No.
of t
axa
0.0
2.0
4.0
6.0
HEM
01
HEM
02
HEM
03
HEM
04
HEM
14
HEM
15
HEM
18
HEM
19
HEM
22R
H'
0
20
40
60
HEM
01
HEM
02
HEM
03
HEM
04
HEM
14
HEM
15
HEM
18
HEM
19
HEM
22R
ES10
0
1992 1997 2000
Table 16-10: Biological characteristics at the Heimdal field, 2000 and previous surveys.
The distribution of taxa in geometrical classes is shown in Figure 16-7. Station HEM01 has taxa in class 10 (512 – 1023 individuals), four stations have taxa in class 9 (356 – 511 individuals) while the remaining stations have taxa in class 8 or lower (< 256 individuals). The occurrence of taxa in high classes might indicate disturbed fauna.
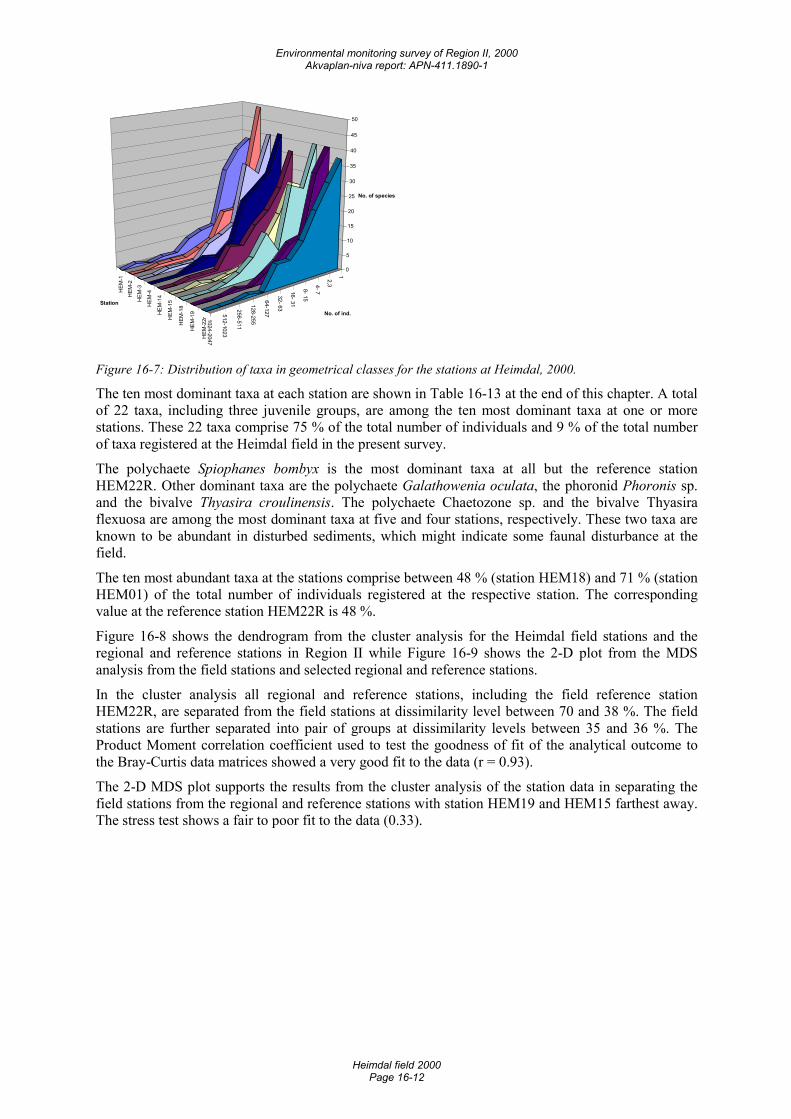
Environmental monitoring survey of Region II, 2000 Akvaplan-niva report: APN-411.1890-1
Heimdal field 2000 Page 16-12
1
2,3 4- 7
8- 15
16- 31
32- 63
64-127
128-255
256-511
512-1023
1024-2047
HEM
-1H
EM-2
HEM
-3
HEM
-4
HEM
-14
HEM
-15
HEM
-18
HEM
-19
HEM
-22r
0
5
10
15
20
25
30
35
40
45
50
No. of species
No. of ind.
Station
Figure 16-7: Distribution of taxa in geometrical classes for the stations at Heimdal, 2000.
The ten most dominant taxa at each station are shown in Table 16-13 at the end of this chapter. A total of 22 taxa, including three juvenile groups, are among the ten most dominant taxa at one or more stations. These 22 taxa comprise 75 % of the total number of individuals and 9 % of the total number of taxa registered at the Heimdal field in the present survey.
The polychaete Spiophanes bombyx is the most dominant taxa at all but the reference station HEM22R. Other dominant taxa are the polychaete Galathowenia oculata, the phoronid Phoronis sp. and the bivalve Thyasira croulinensis. The polychaete Chaetozone sp. and the bivalve Thyasira flexuosa are among the most dominant taxa at five and four stations, respectively. These two taxa are known to be abundant in disturbed sediments, which might indicate some faunal disturbance at the field.
The ten most abundant taxa at the stations comprise between 48 % (station HEM18) and 71 % (station HEM01) of the total number of individuals registered at the respective station. The corresponding value at the reference station HEM22R is 48 %.
Figure 16-8 shows the dendrogram from the cluster analysis for the Heimdal field stations and the regional and reference stations in Region II while Figure 16-9 shows the 2-D plot from the MDS analysis from the field stations and selected regional and reference stations.
In the cluster analysis all regional and reference stations, including the field reference station HEM22R, are separated from the field stations at dissimilarity level between 70 and 38 %. The field stations are further separated into pair of groups at dissimilarity levels between 35 and 36 %. The Product Moment correlation coefficient used to test the goodness of fit of the analytical outcome to the Bray-Curtis data matrices showed a very good fit to the data (r = 0.93).
The 2-D MDS plot supports the results from the cluster analysis of the station data in separating the field stations from the regional and reference stations with station HEM19 and HEM15 farthest away. The stress test shows a fair to poor fit to the data (0.33).
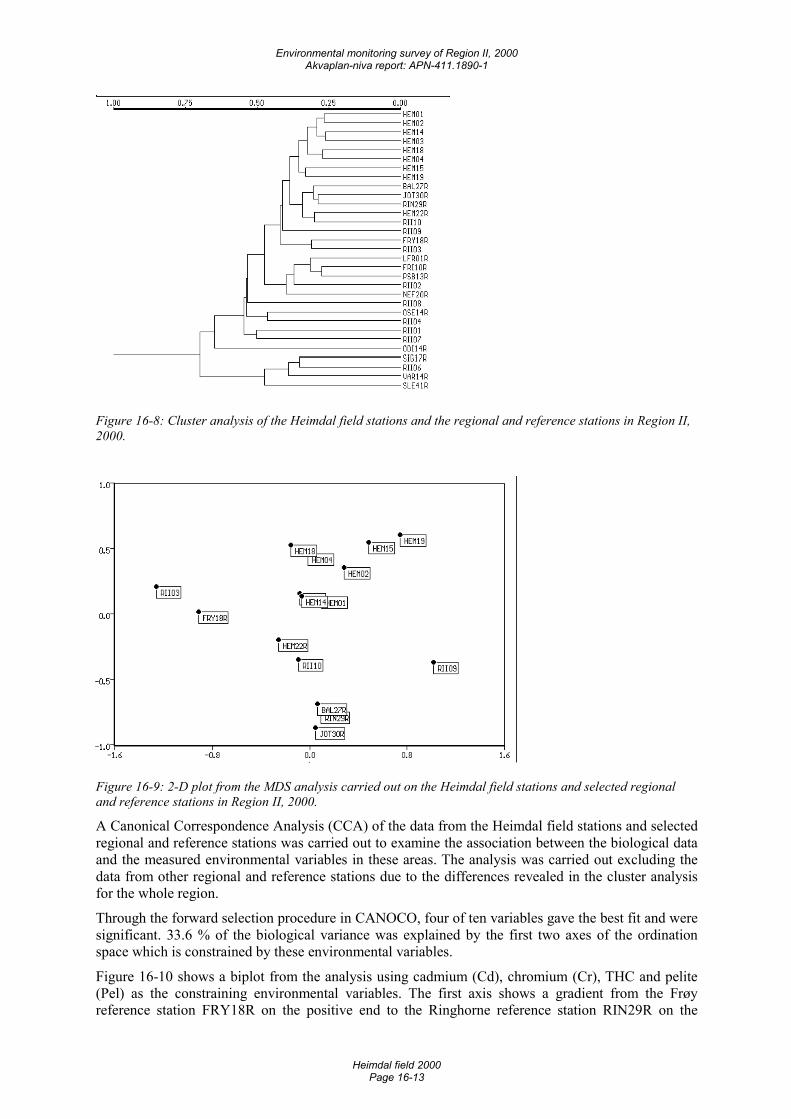
Environmental monitoring survey of Region II, 2000 Akvaplan-niva report: APN-411.1890-1
Heimdal field 2000 Page 16-13
Figure 16-8: Cluster analysis of the Heimdal field stations and the regional and reference stations in Region II, 2000.
Figure 16-9: 2-D plot from the MDS analysis carried out on the Heimdal field stations and selected regional and reference stations in Region II, 2000.
A Canonical Correspondence Analysis (CCA) of the data from the Heimdal field stations and selected regional and reference stations was carried out to examine the association between the biological data and the measured environmental variables in these areas. The analysis was carried out excluding the data from other regional and reference stations due to the differences revealed in the cluster analysis for the whole region.
Through the forward selection procedure in CANOCO, four of ten variables gave the best fit and were significant. 33.6 % of the biological variance was explained by the first two axes of the ordination space which is constrained by these environmental variables.
Figure 16-10 shows a biplot from the analysis using cadmium (Cd), chromium (Cr), THC and pelite (Pel) as the constraining environmental variables. The first axis shows a gradient from the Frøy reference station FRY18R on the positive end to the Ringhorne reference station RIN29R on the
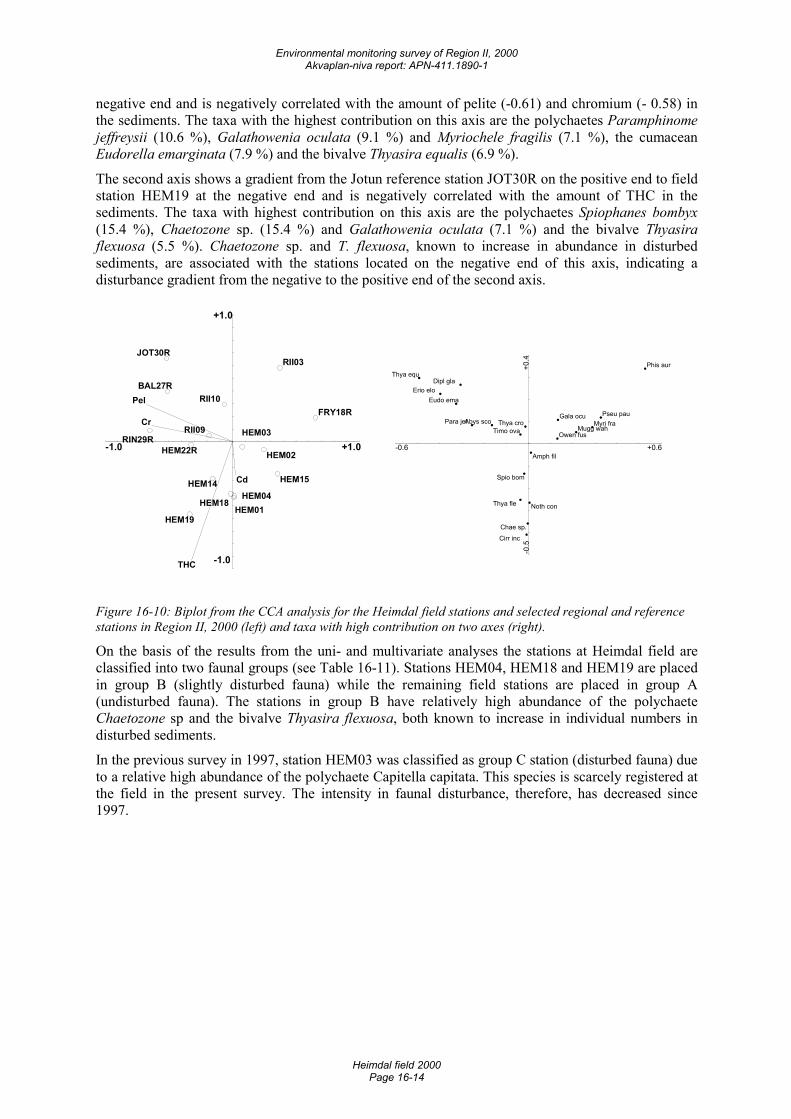
Environmental monitoring survey of Region II, 2000 Akvaplan-niva report: APN-411.1890-1
Heimdal field 2000 Page 16-14
negative end and is negatively correlated with the amount of pelite (-0.61) and chromium (- 0.58) in the sediments. The taxa with the highest contribution on this axis are the polychaetes Paramphinome jeffreysii (10.6 %), Galathowenia oculata (9.1 %) and Myriochele fragilis (7.1 %), the cumacean Eudorella emarginata (7.9 %) and the bivalve Thyasira equalis (6.9 %).
The second axis shows a gradient from the Jotun reference station JOT30R on the positive end to field station HEM19 at the negative end and is negatively correlated with the amount of THC in the sediments. The taxa with highest contribution on this axis are the polychaetes Spiophanes bombyx (15.4 %), Chaetozone sp. (15.4 %) and Galathowenia oculata (7.1 %) and the bivalve Thyasira flexuosa (5.5 %). Chaetozone sp. and T. flexuosa, known to increase in abundance in disturbed sediments, are associated with the stations located on the negative end of this axis, indicating a disturbance gradient from the negative to the positive end of the second axis.
-1.0 +1.0
-1.0
+1.0
Pel
Cr
THC
Cd
FRY18R
RIN29R
JOT30R
BAL27R
RII03
HEM15
HEM19
HEM22R HEM02
RII09
HEM14
HEM03
RII10
HEM04HEM01
HEM18
-0.6 +0.6
-0.5
+0.4
Phis aurThya equ
Erio elo
Pseu pau
Eudo ema
Dipl gla
Myri fraPara jefMugg wah
Abys scoGala ocu
Owen fus
Thya fle
Timo ova
Spio bom
Thya cro
Amph fil
Cirr inc
Noth con
Chae sp.�
Figure 16-10: Biplot from the CCA analysis for the Heimdal field stations and selected regional and reference stations in Region II, 2000 (left) and taxa with high contribution on two axes (right).
On the basis of the results from the uni- and multivariate analyses the stations at Heimdal field are classified into two faunal groups (see Table 16-11). Stations HEM04, HEM18 and HEM19 are placed in group B (slightly disturbed fauna) while the remaining field stations are placed in group A (undisturbed fauna). The stations in group B have relatively high abundance of the polychaete Chaetozone sp and the bivalve Thyasira flexuosa, both known to increase in individual numbers in disturbed sediments.
In the previous survey in 1997, station HEM03 was classified as group C station (disturbed fauna) due to a relative high abundance of the polychaete Capitella capitata. This species is scarcely registered at the field in the present survey. The intensity in faunal disturbance, therefore, has decreased since 1997.
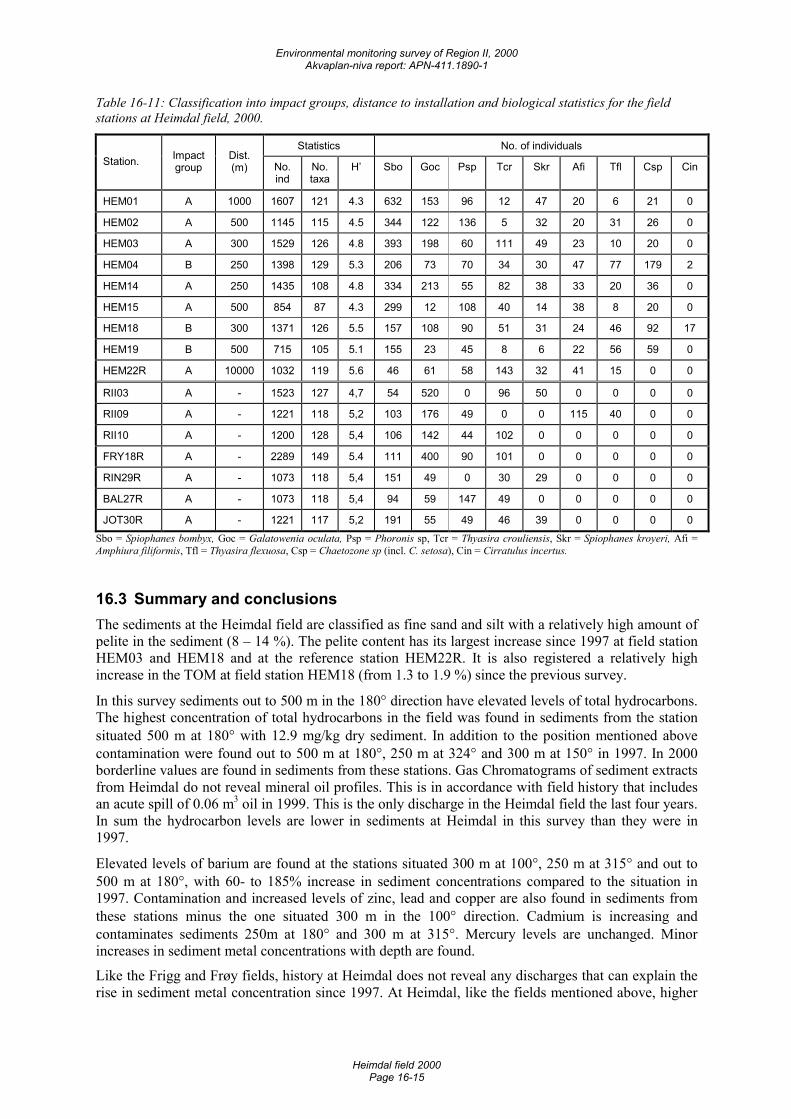
Environmental monitoring survey of Region II, 2000 Akvaplan-niva report: APN-411.1890-1
Heimdal field 2000 Page 16-15
Table 16-11: Classification into impact groups, distance to installation and biological statistics for the field stations at Heimdal field, 2000.
Statistics No. of individuals Station. Impact
group Dist. (m) No.
ind No. taxa
H’ Sbo Goc Psp Tcr Skr Afi Tfl Csp Cin
HEM01 A 1000 1607 121 4.3 632 153 96 12 47 20 6 21 0
HEM02 A 500 1145 115 4.5 344 122 136 5 32 20 31 26 0
HEM03 A 300 1529 126 4.8 393 198 60 111 49 23 10 20 0
HEM04 B 250 1398 129 5.3 206 73 70 34 30 47 77 179 2
HEM14 A 250 1435 108 4.8 334 213 55 82 38 33 20 36 0
HEM15 A 500 854 87 4.3 299 12 108 40 14 38 8 20 0
HEM18 B 300 1371 126 5.5 157 108 90 51 31 24 46 92 17
HEM19 B 500 715 105 5.1 155 23 45 8 6 22 56 59 0
HEM22R A 10000 1032 119 5.6 46 61 58 143 32 41 15 0 0
RII03 A - 1523 127 4,7 54 520 0 96 50 0 0 0 0
RII09 A - 1221 118 5,2 103 176 49 0 0 115 40 0 0
RII10 A - 1200 128 5,4 106 142 44 102 0 0 0 0 0
FRY18R A - 2289 149 5.4 111 400 90 101 0 0 0 0 0
RIN29R A - 1073 118 5,4 151 49 0 30 29 0 0 0 0
BAL27R A - 1073 118 5,4 94 59 147 49 0 0 0 0 0
JOT30R A - 1221 117 5,2 191 55 49 46 39 0 0 0 0 Sbo = Spiophanes bombyx, Goc = Galatowenia oculata, Psp = Phoronis sp, Tcr = Thyasira crouliensis, Skr = Spiophanes kroyeri, Afi = Amphiura filiformis, Tfl = Thyasira flexuosa, Csp = Chaetozone sp (incl. C. setosa), Cin = Cirratulus incertus.
16.3 Summary and conclusions The sediments at the Heimdal field are classified as fine sand and silt with a relatively high amount of pelite in the sediment (8 – 14 %). The pelite content has its largest increase since 1997 at field station HEM03 and HEM18 and at the reference station HEM22R. It is also registered a relatively high increase in the TOM at field station HEM18 (from 1.3 to 1.9 %) since the previous survey.
In this survey sediments out to 500 m in the 180° direction have elevated levels of total hydrocarbons. The highest concentration of total hydrocarbons in the field was found in sediments from the station situated 500 m at 180° with 12.9 mg/kg dry sediment. In addition to the position mentioned above contamination were found out to 500 m at 180°, 250 m at 324° and 300 m at 150° in 1997. In 2000 borderline values are found in sediments from these stations. Gas Chromatograms of sediment extracts from Heimdal do not reveal mineral oil profiles. This is in accordance with field history that includes an acute spill of 0.06 m3 oil in 1999. This is the only discharge in the Heimdal field the last four years. In sum the hydrocarbon levels are lower in sediments at Heimdal in this survey than they were in 1997.
Elevated levels of barium are found at the stations situated 300 m at 100°, 250 m at 315° and out to 500 m at 180°, with 60- to 185% increase in sediment concentrations compared to the situation in 1997. Contamination and increased levels of zinc, lead and copper are also found in sediments from these stations minus the one situated 300 m in the 100° direction. Cadmium is increasing and contaminates sediments 250m at 180° and 300 m at 315°. Mercury levels are unchanged. Minor increases in sediment metal concentrations with depth are found.
Like the Frigg and Frøy fields, history at Heimdal does not reveal any discharges that can explain the rise in sediment metal concentration since 1997. At Heimdal, like the fields mentioned above, higher
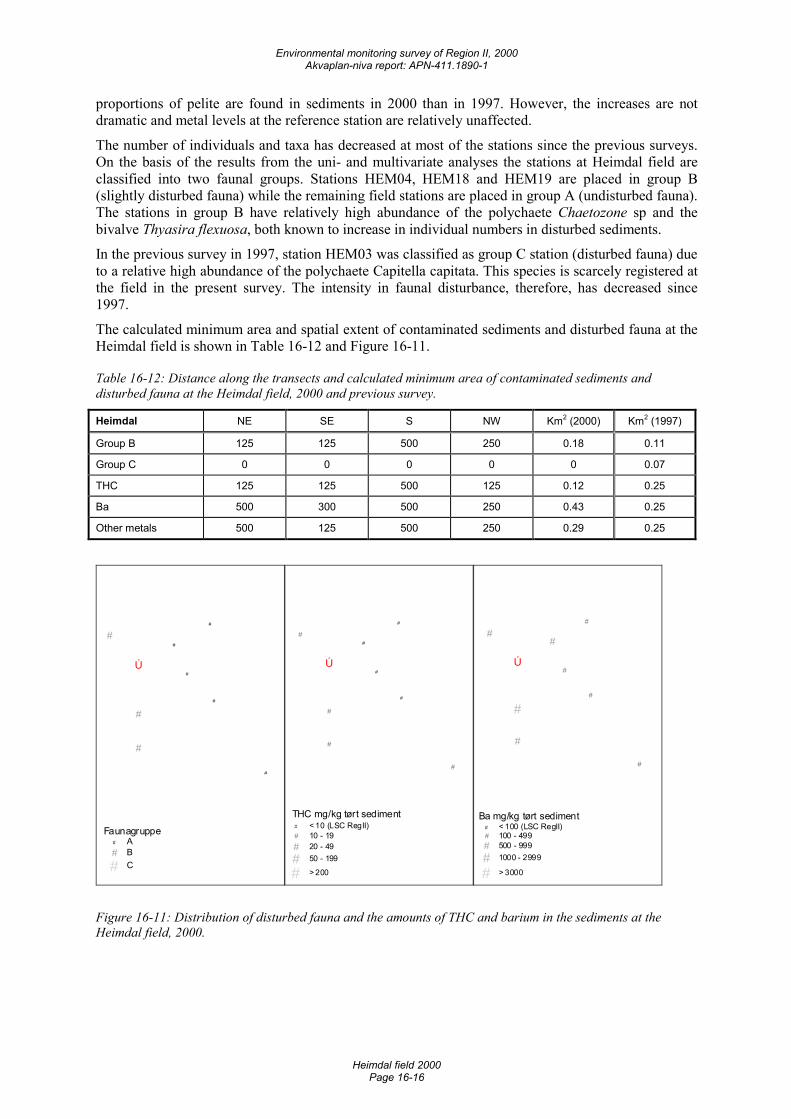
Environmental monitoring survey of Region II, 2000 Akvaplan-niva report: APN-411.1890-1
Heimdal field 2000 Page 16-16
proportions of pelite are found in sediments in 2000 than in 1997. However, the increases are not dramatic and metal levels at the reference station are relatively unaffected.
The number of individuals and taxa has decreased at most of the stations since the previous surveys. On the basis of the results from the uni- and multivariate analyses the stations at Heimdal field are classified into two faunal groups. Stations HEM04, HEM18 and HEM19 are placed in group B (slightly disturbed fauna) while the remaining field stations are placed in group A (undisturbed fauna). The stations in group B have relatively high abundance of the polychaete Chaetozone sp and the bivalve Thyasira flexuosa, both known to increase in individual numbers in disturbed sediments.
In the previous survey in 1997, station HEM03 was classified as group C station (disturbed fauna) due to a relative high abundance of the polychaete Capitella capitata. This species is scarcely registered at the field in the present survey. The intensity in faunal disturbance, therefore, has decreased since 1997.
The calculated minimum area and spatial extent of contaminated sediments and disturbed fauna at the Heimdal field is shown in Table 16-12 and Figure 16-11.
Table 16-12: Distance along the transects and calculated minimum area of contaminated sediments and disturbed fauna at the Heimdal field, 2000 and previous survey.
Heimdal NE SE S NW Km2 (2000) Km2 (1997)
Group B 125 125 500 250 0.18 0.11
Group C 0 0 0 0 0 0.07
THC 125 125 500 125 0.12 0.25
Ba 500 300 500 250 0.43 0.25
Other metals 500 125 500 250 0.29 0.25
Ú
#
#
#
##
#
#
#
Faunagruppe# A# B
# C
Ú
#
#
#
##
#
#
#
THC mg/kg tørt sediment# < 10 (LSC RegII)# 10 - 19# 20 - 49
# 50 - 199
# > 200
Ú
#
#
#
##
#
#
#
Ba mg/kg tørt sediment# < 100 (LSC RegII)# 100 - 499# 500 - 999
# 1000 - 2999
# > 3000
Figure 16-11: Distribution of disturbed fauna and the amounts of THC and barium in the sediments at the Heimdal field, 2000.
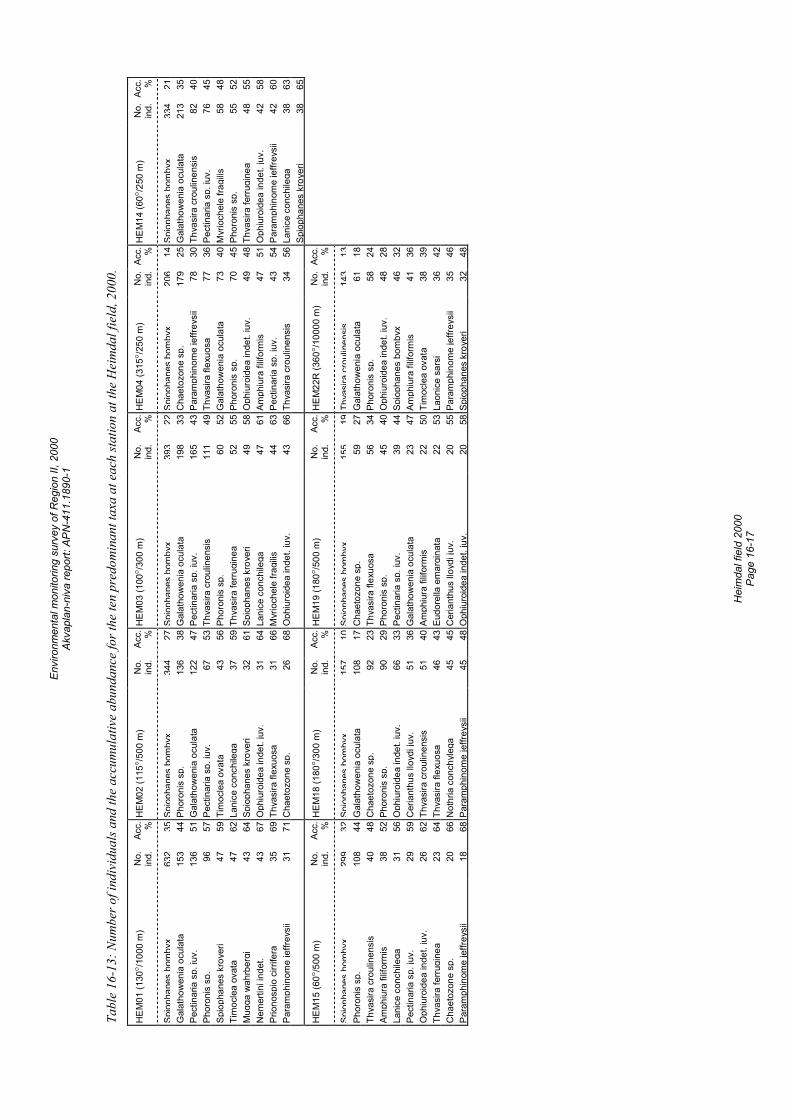
Envi
ronm
enta
l mon
itorin
g su
rvey
of R
egio
n II,
200
0 Ak
vapl
an-n
iva
repo
rt: A
PN-4
11.1
890-
1
H
eim
dal f
ield
200
0 Pa
ge 1
6-17
Tabl
e 16
-13:
Num
ber o
f ind
ivid
uals
and
the
accu
mul
ativ
e ab
unda
nce
for t
he te
n pr
edom
inan
t tax
a at
eac
h sta
tion
at th
e H
eim
dal f
ield
, 200
0.
HE
M01
(130
°/10
00 m
) N
o.
ind.
Ac
c.
% H
EM
02 (1
15°/
500
m)
No.
in
d.Ac
c.
%H
EM
03 (1
00°/
300
m)
No.
in
d.Ac
c.
%H
EM
04 (3
15°/
250
m)
No.
in
d.Ac
c.
%H
EM
14 (6
0°/2
50 m
) N
o.
ind.
Acc.
%
Spio
phan
esbo
mby
x63
235
Spio
phan
esbo
mby
x34
427
Spio
phan
esbo
mby
x39
322
Spio
phan
esbo
mby
x20
614
Spio
phan
esbo
mby
x33
421
Gal
atho
wen
ia o
cula
ta
153
44 P
horo
nis
sp.
136
38G
alat
how
enia
ocu
lata
198
33C
haet
ozon
e sp
.17
925
Gal
atho
wen
ia o
cula
ta21
3 35
Pe
ctin
aria
sp.
juv.
13
6 51
Gal
atho
wen
ia o
cula
ta12
247
Pect
inar
ia s
p. ju
v.16
543
Para
mph
inom
e je
ffrey
sii
7830
Thya
sira
cro
ulin
ensi
s82
40
Ph
oron
is s
p.
96
57 P
ectin
aria
sp.
juv.
6753
Thya
sira
cro
ulin
ensi
s11
149
Thya
sira
flex
uosa
7736
Pect
inar
ia s
p. ju
v.76
45
Sp
ioph
anes
kro
yeri
47
59 T
imoc
lea
ovat
a43
56Ph
oron
is s
p.60
52G
alat
how
enia
ocu
lata
7340
Myr
ioch
ele
fragi
lis58
48
Ti
moc
lea
ovat
a 47
62
Lan
ice
conc
hile
ga37
59Th
yasi
ra fe
rrugi
nea
5255
Phor
onis
sp.
7045
Phor
onis
sp.
55
52
Mug
ga w
ahrb
ergi
43
64
Spi
opha
nes
kroy
eri
3261
Spio
phan
eskr
oyer
i49
58O
phiu
roid
ea in
det.
juv.
4948
Thya
sira
ferru
gine
a48
55
N
emer
tini i
ndet
. 43
67
Oph
iuro
idea
inde
t. ju
v.31
64La
nice
con
chile
ga47
61Am
phiu
ra fi
lifor
mis
4751
Oph
iuro
idea
inde
t. ju
v.42
58
Pr
iono
spio
cirr
ifera
35
69
Thy
asira
flex
uosa
3166
Myr
ioch
ele
fragi
lis44
63Pe
ctin
aria
sp.
juv.
4354
Para
mph
inom
e je
ffrey
sii
42
60
Para
mph
inom
e je
ffrey
sii
31
71 C
haet
ozon
e sp
.26
68O
phiu
roid
ea in
det.
juv.
4366
Thya
sira
cro
ulin
ensi
s34
56La
nice
con
chile
ga38
63
Spio
phan
es k
roye
ri38
65
HE
M15
(60°
/500
m)
No.
in
d.
Acc.
%
HE
M18
(180
°/30
0 m
) N
o.
ind.
Acc.
%
HE
M19
(180
°/50
0 m
) N
o.
ind.
Acc.
%
HE
M22
R (3
60°/1
0000
m)
No.
in
d.Ac
c.
%
Spio
phan
esbo
mby
x29
932
Spio
phan
esbo
mby
x15
710
Spio
phan
esbo
mby
x15
519
Thya
sira
crou
linen
sis
143
13Ph
oron
is s
p.
108
44 G
alat
how
enia
ocu
lata
108
17C
haet
ozon
e sp
.59
27G
alat
how
enia
ocu
lata
6118
Thya
sira
cro
ulin
ensi
s 40
48
Cha
etoz
one
sp.
9223
Thya
sira
flex
uosa
5634
Phor
onis
sp.
5824
Amph
iura
filif
orm
is
38
52 P
horo
nis
sp.
9029
Phor
onis
sp.
4540
Oph
iuro
idea
inde
t. ju
v.48
28
La
nice
con
chile
ga
31
56 O
phiu
roid
ea in
det.
juv.
6633
Pect
inar
ia s
p. ju
v.39
44Sp
ioph
anes
bom
byx
4632
Pect
inar
ia s
p. ju
v.
29
59 C
eria
nthu
s llo
ydi j
uv.
5136
Gal
atho
wen
ia o
cula
ta23
47Am
phiu
ra fi
lifor
mis
4136
Oph
iuro
idea
inde
t. ju
v.
26
62 T
hyas
ira c
roul
inen
sis
5140
Amph
iura
filif
orm
is22
50Ti
moc
lea
ovat
a38
39
Th
yasi
ra fe
rrugi
nea
23
64 T
hyas
ira fl
exuo
sa46
43Eu
dore
lla e
mar
gina
ta22
53La
onic
e sa
rsi
3642
Cha
etoz
one
sp.
20
66 N
othr
ia c
onch
yleg
a45
45C
eria
nthu
s llo
ydi j
uv.
2055
Para
mph
inom
e je
ffrey
sii
3546
Para
mph
inom
e je
ffrey
sii
18
68 P
aram
phin
ome
jeffr
eysi
i45
48O
phiu
roid
ea in
det.
juv.
2058
Spio
phan
es k
roye
ri32
48
Envi
ronm
enta
l mon
itorin
g su
rvey
of R
egio
n II,
200
0 Ak
vapl
an-n
iva
repo
rt: A
PN-4
11.1
890-
1
H
eim
dal f
ield
200
0 Pa
ge 1
6-18
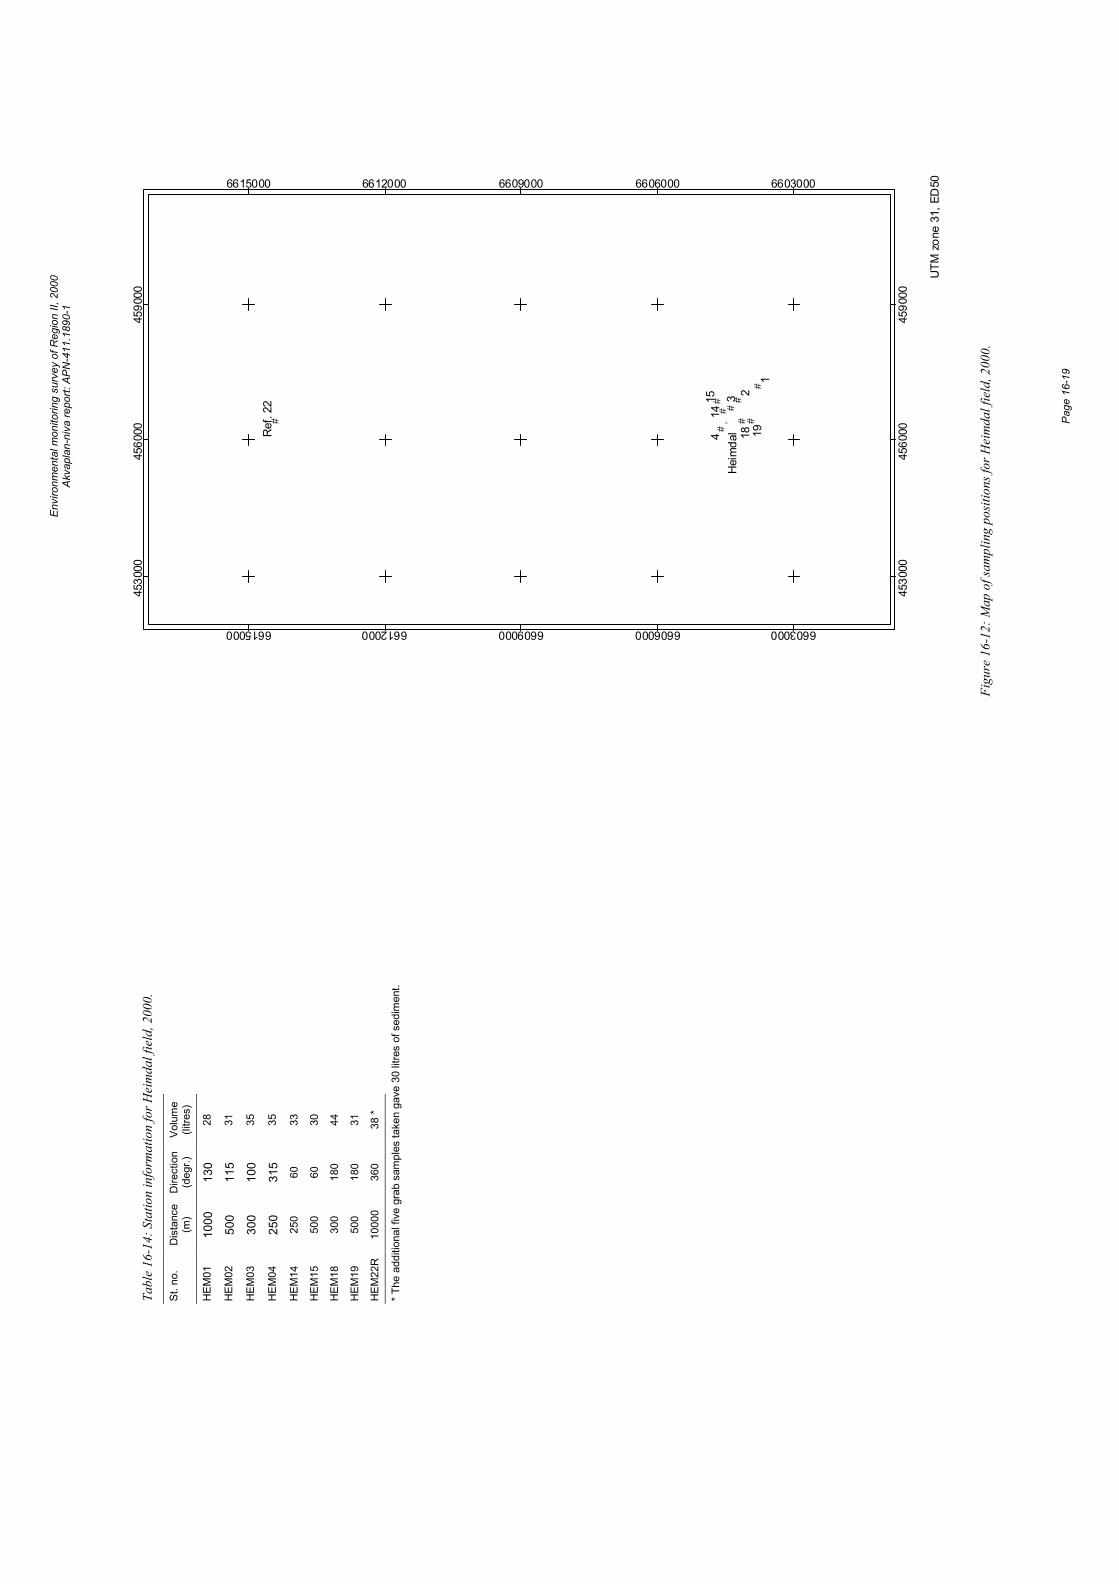
Envi
ronm
enta
l mon
itorin
g su
rvey
of R
egio
n II,
200
0 Ak
vapl
an-n
iva
repo
rt: A
PN-4
11.1
890-
1
Pa
ge 1
6-19
#
##
##
#
# ## '
1
234
1415
18 19Ref
. 22
Hei
mda
l
UTM
zon
e 31
, ED
50
4530
00
4530
00
4560
00
4560
00
4590
00
4590
00
6603000
6603000
6606000
6606000
6609000
6609000
6612000
6612000
6615000
6615000
Figu
re 1
6-12
: Map
of s
ampl
ing
posit
ions
for H
eim
dal f
ield
, 200
0.
Tabl
e 16
-14:
Sta
tion
info
rmat
ion
for H
eim
dal f
ield
, 200
0.
St. n
o.
Dis
tanc
e (m
) D
irect
ion
(deg
r.)
Volu
me
(litre
s)
HEM
01
1000
13
0 28
HEM
02
500
115
31
HEM
03
300
100
35
HEM
04
250
315
35
HEM
14
250
60
33
HEM
15
500
60
30
HEM
18
300
180
44
HEM
19
500
180
31
HEM
22R
10
000
360
38 *
* The
add
ition
al fi
ve g
rab
sam
ples
take
n ga
ve 3
0 lit
res
of s
edim
ent.

Envi
ronm
enta
l mon
itorin
g su
rvey
of R
egio
n II,
200
0 Ak
vapl
an-n
iva
repo
rt: A
PN-4
11.1
890-
1
Pa
ge 1
6-20
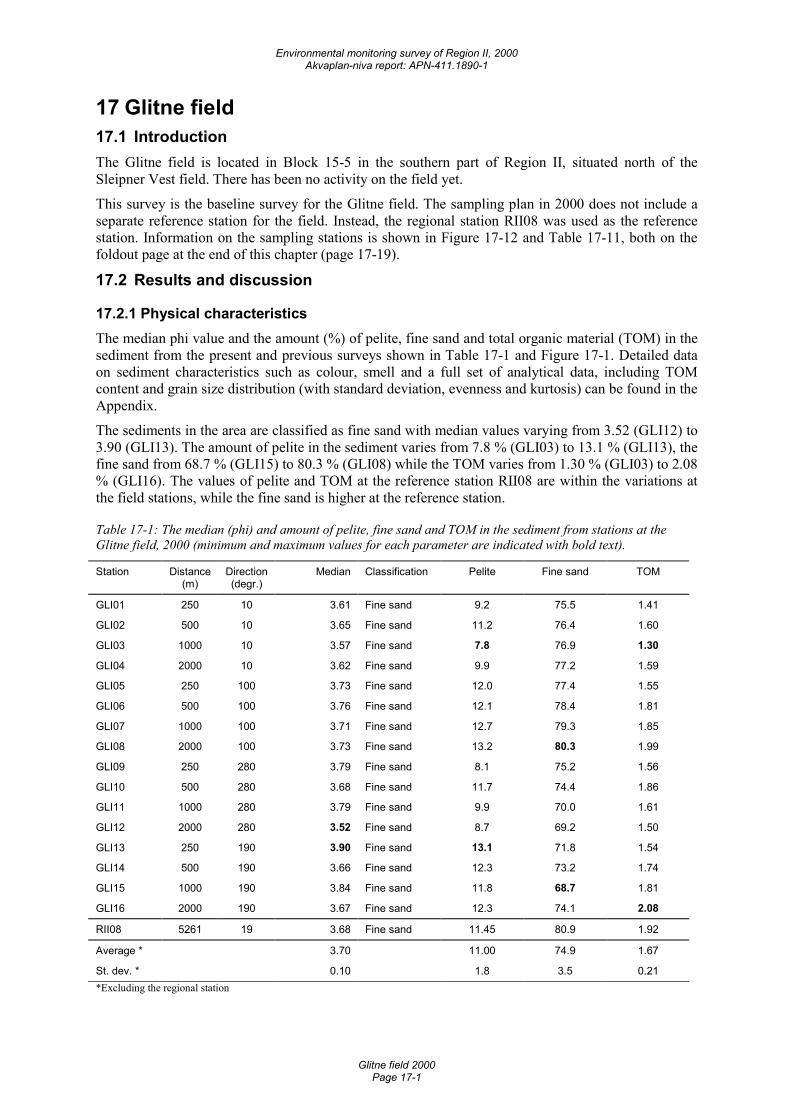
Environmental monitoring survey of Region II, 2000 Akvaplan-niva report: APN-411.1890-1
Glitne field 2000 Page 17-1
17 Glitne field 17.1 Introduction The Glitne field is located in Block 15-5 in the southern part of Region II, situated north of the Sleipner Vest field. There has been no activity on the field yet.
This survey is the baseline survey for the Glitne field. The sampling plan in 2000 does not include a separate reference station for the field. Instead, the regional station RII08 was used as the reference station. Information on the sampling stations is shown in Figure 17-12 and Table 17-11, both on the foldout page at the end of this chapter (page 17-19).
17.2 Results and discussion
17.2.1 Physical characteristics The median phi value and the amount (%) of pelite, fine sand and total organic material (TOM) in the sediment from the present and previous surveys shown in Table 17-1 and Figure 17-1. Detailed data on sediment characteristics such as colour, smell and a full set of analytical data, including TOM content and grain size distribution (with standard deviation, evenness and kurtosis) can be found in the Appendix.
The sediments in the area are classified as fine sand with median values varying from 3.52 (GLI12) to 3.90 (GLI13). The amount of pelite in the sediment varies from 7.8 % (GLI03) to 13.1 % (GLI13), the fine sand from 68.7 % (GLI15) to 80.3 % (GLI08) while the TOM varies from 1.30 % (GLI03) to 2.08 % (GLI16). The values of pelite and TOM at the reference station RII08 are within the variations at the field stations, while the fine sand is higher at the reference station.
Table 17-1: The median (phi) and amount of pelite, fine sand and TOM in the sediment from stations at the Glitne field, 2000 (minimum and maximum values for each parameter are indicated with bold text).
Station Distance (m)
Direction (degr.)
Median Classification Pelite Fine sand TOM
GLI01 250 10 3.61 Fine sand 9.2 75.5 1.41
GLI02 500 10 3.65 Fine sand 11.2 76.4 1.60
GLI03 1000 10 3.57 Fine sand 7.8 76.9 1.30
GLI04 2000 10 3.62 Fine sand 9.9 77.2 1.59
GLI05 250 100 3.73 Fine sand 12.0 77.4 1.55
GLI06 500 100 3.76 Fine sand 12.1 78.4 1.81
GLI07 1000 100 3.71 Fine sand 12.7 79.3 1.85
GLI08 2000 100 3.73 Fine sand 13.2 80.3 1.99
GLI09 250 280 3.79 Fine sand 8.1 75.2 1.56
GLI10 500 280 3.68 Fine sand 11.7 74.4 1.86
GLI11 1000 280 3.79 Fine sand 9.9 70.0 1.61
GLI12 2000 280 3.52 Fine sand 8.7 69.2 1.50
GLI13 250 190 3.90 Fine sand 13.1 71.8 1.54
GLI14 500 190 3.66 Fine sand 12.3 73.2 1.74
GLI15 1000 190 3.84 Fine sand 11.8 68.7 1.81
GLI16 2000 190 3.67 Fine sand 12.3 74.1 2.08
RII08 5261 19 3.68 Fine sand 11.45 80.9 1.92
Average * 3.70 11.00 74.9 1.67
St. dev. * 0.10 1.8 3.5 0.21 *Excluding the regional station
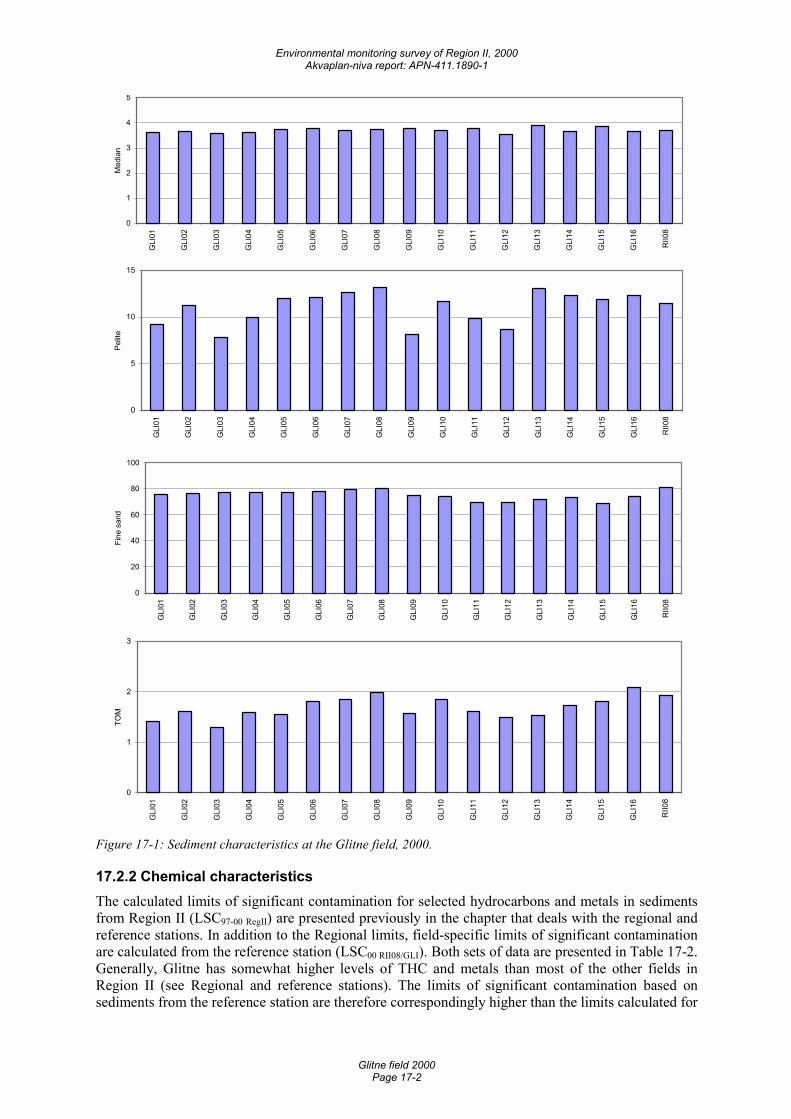
Environmental monitoring survey of Region II, 2000 Akvaplan-niva report: APN-411.1890-1
Glitne field 2000 Page 17-2
0
1
2
3
4
5
GLI
01
GLI
02
GLI
03
GLI
04
GLI
05
GLI
06
GLI
07
GLI
08
GLI
09
GLI
10
GLI
11
GLI
12
GLI
13
GLI
14
GLI
15
GLI
16
RII0
8
Med
ian
0
5
10
15
GLI
01
GLI
02
GLI
03
GLI
04
GLI
05
GLI
06
GLI
07
GLI
08
GLI
09
GLI
10
GLI
11
GLI
12
GLI
13
GLI
14
GLI
15
GLI
16
RII0
8
Pelit
e
0
20
40
60
80
100
GLI
01
GLI
02
GLI
03
GLI
04
GLI
05
GLI
06
GLI
07
GLI
08
GLI
09
GLI
10
GLI
11
GLI
12
GLI
13
GLI
14
GLI
15
GLI
16
RII0
8
Fine
san
d
0
1
2
3
GLI
01
GLI
02
GLI
03
GLI
04
GLI
05
GLI
06
GLI
07
GLI
08
GLI
09
GLI
10
GLI
11
GLI
12
GLI
13
GLI
14
GLI
15
GLI
16
RII0
8
TOM
Figure 17-1: Sediment characteristics at the Glitne field, 2000.
17.2.2 Chemical characteristics The calculated limits of significant contamination for selected hydrocarbons and metals in sediments from Region II (LSC97-00 RegII) are presented previously in the chapter that deals with the regional and reference stations. In addition to the Regional limits, field-specific limits of significant contamination are calculated from the reference station (LSC00 RII08/GLI). Both sets of data are presented in Table 17-2. Generally, Glitne has somewhat higher levels of THC and metals than most of the other fields in Region II (see Regional and reference stations). The limits of significant contamination based on sediments from the reference station are therefore correspondingly higher than the limits calculated for
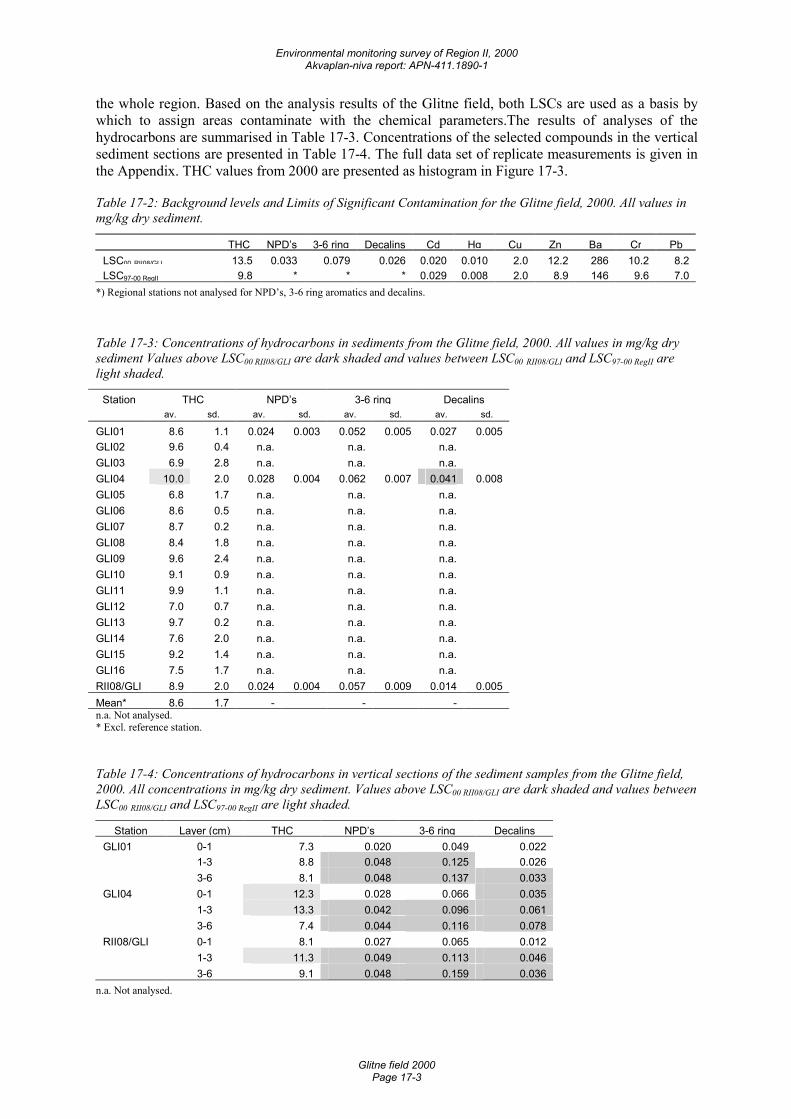
Environmental monitoring survey of Region II, 2000 Akvaplan-niva report: APN-411.1890-1
Glitne field 2000 Page 17-3
the whole region. Based on the analysis results of the Glitne field, both LSCs are used as a basis by which to assign areas contaminate with the chemical parameters.The results of analyses of the hydrocarbons are summarised in Table 17-3. Concentrations of the selected compounds in the vertical sediment sections are presented in Table 17-4. The full data set of replicate measurements is given in the Appendix. THC values from 2000 are presented as histogram in Figure 17-3.
Table 17-2: Background levels and Limits of Significant Contamination for the Glitne field, 2000. All values in mg/kg dry sediment.
THC NPD’s 3-6 ring Decalins Cd Hg Cu Zn Ba Cr PbLSC00 RII08/GLI 13.5 0.033 0.079 0.026 0.020 0.010 2.0 12.2 286 10.2 8.2LSC97-00 RegII 9.8 * * * 0.029 0.008 2.0 8.9 146 9.6 7.0
*) Regional stations not analysed for NPD’s, 3-6 ring aromatics and decalins.
Table 17-3: Concentrations of hydrocarbons in sediments from the Glitne field, 2000. All values in mg/kg dry sediment Values above LSC00 RII08/GLI are dark shaded and values between LSC00 RII08/GLI and LSC97-00 RegII are light shaded.
Station THC NPD’s 3-6 ring Decalins av. sd. av. sd. av. sd. av. sd.
GLI01 8.6 1.1 0.024 0.003 0.052 0.005 0.027 0.005GLI02 9.6 0.4 n.a. n.a. n.a.GLI03 6.9 2.8 n.a. n.a. n.a.GLI04 10.0 2.0 0.028 0.004 0.062 0.007 0.041 0.008GLI05 6.8 1.7 n.a. n.a. n.a.GLI06 8.6 0.5 n.a. n.a. n.a.GLI07 8.7 0.2 n.a. n.a. n.a.GLI08 8.4 1.8 n.a. n.a. n.a.GLI09 9.6 2.4 n.a. n.a. n.a.GLI10 9.1 0.9 n.a. n.a. n.a.GLI11 9.9 1.1 n.a. n.a. n.a.GLI12 7.0 0.7 n.a. n.a. n.a.GLI13 9.7 0.2 n.a. n.a. n.a.GLI14 7.6 2.0 n.a. n.a. n.a.GLI15 9.2 1.4 n.a. n.a. n.a.GLI16 7.5 1.7 n.a. n.a. n.a.RII08/GLI 8.9 2.0 0.024 0.004 0.057 0.009 0.014 0.005Mean* 8.6 1.7 - - -n.a. Not analysed. * Excl. reference station.
Table 17-4: Concentrations of hydrocarbons in vertical sections of the sediment samples from the Glitne field, 2000. All concentrations in mg/kg dry sediment. Values above LSC00 RII08/GLI are dark shaded and values between LSC00 RII08/GLI and LSC97-00 RegII are light shaded.
Station Layer (cm) THC NPD’s 3-6 ring DecalinsGLI01 0-1 7.3 0.020 0.049 0.022 1-3 8.8 0.048 0.125 0.026 3-6 8.1 0.048 0.137 0.033GLI04 0-1 12.3 0.028 0.066 0.035 1-3 13.3 0.042 0.096 0.061 3-6 7.4 0.044 0.116 0.078RII08/GLI 0-1 8.1 0.027 0.065 0.012 1-3 11.3 0.049 0.113 0.046 3-6 9.1 0.048 0.159 0.036
n.a. Not analysed.
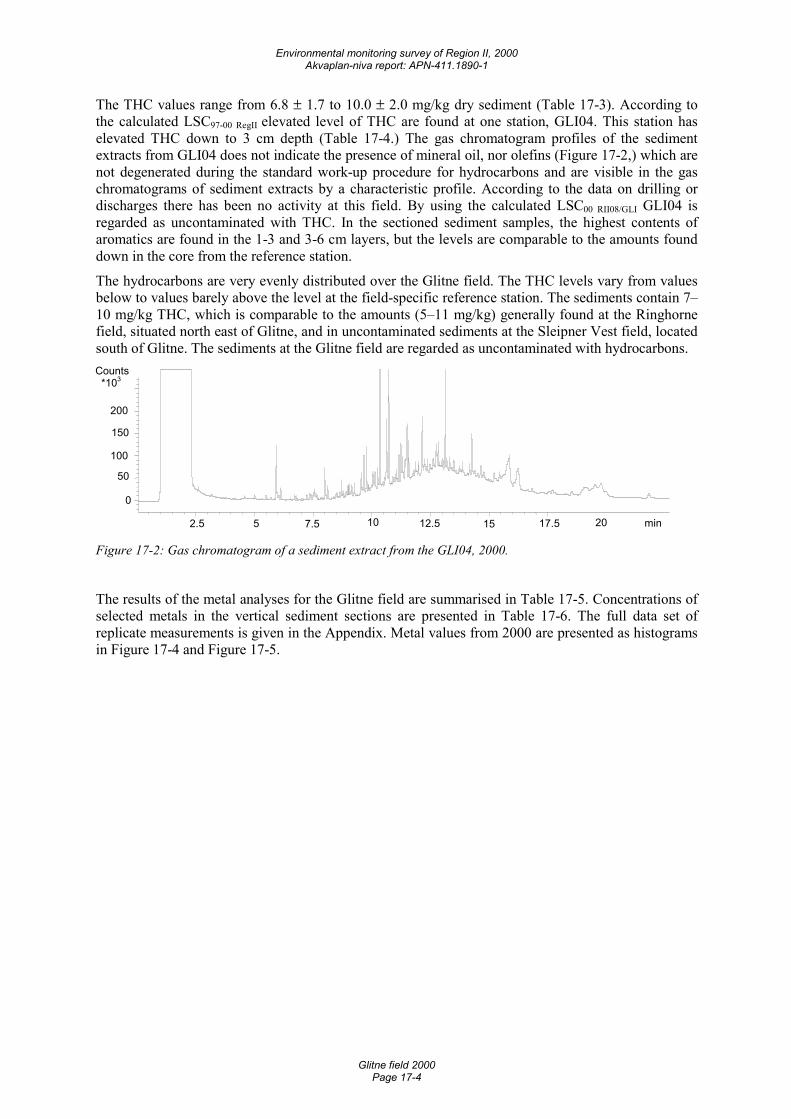
Environmental monitoring survey of Region II, 2000 Akvaplan-niva report: APN-411.1890-1
Glitne field 2000 Page 17-4
The THC values range from 6.8 ± 1.7 to 10.0 ± 2.0 mg/kg dry sediment (Table 17-3). According to the calculated LSC97-00 RegII elevated level of THC are found at one station, GLI04. This station has elevated THC down to 3 cm depth (Table 17-4.) The gas chromatogram profiles of the sediment extracts from GLI04 does not indicate the presence of mineral oil, nor olefins (Figure 17-2,) which are not degenerated during the standard work-up procedure for hydrocarbons and are visible in the gas chromatograms of sediment extracts by a characteristic profile. According to the data on drilling or discharges there has been no activity at this field. By using the calculated LSC00 RII08/GLI GLI04 is regarded as uncontaminated with THC. In the sectioned sediment samples, the highest contents of aromatics are found in the 1-3 and 3-6 cm layers, but the levels are comparable to the amounts found down in the core from the reference station.
The hydrocarbons are very evenly distributed over the Glitne field. The THC levels vary from values below to values barely above the level at the field-specific reference station. The sediments contain 7–10 mg/kg THC, which is comparable to the amounts (5–11 mg/kg) generally found at the Ringhorne field, situated north east of Glitne, and in uncontaminated sediments at the Sleipner Vest field, located south of Glitne. The sediments at the Glitne field are regarded as uncontaminated with hydrocarbons.
min2.5 5 7.5 10 12.5 15 17.5 20
Counts *103
0
50
100
150
200
Figure 17-2: Gas chromatogram of a sediment extract from the GLI04, 2000.
The results of the metal analyses for the Glitne field are summarised in Table 17-5. Concentrations of selected metals in the vertical sediment sections are presented in Table 17-6. The full data set of replicate measurements is given in the Appendix. Metal values from 2000 are presented as histograms in Figure 17-4 and Figure 17-5.
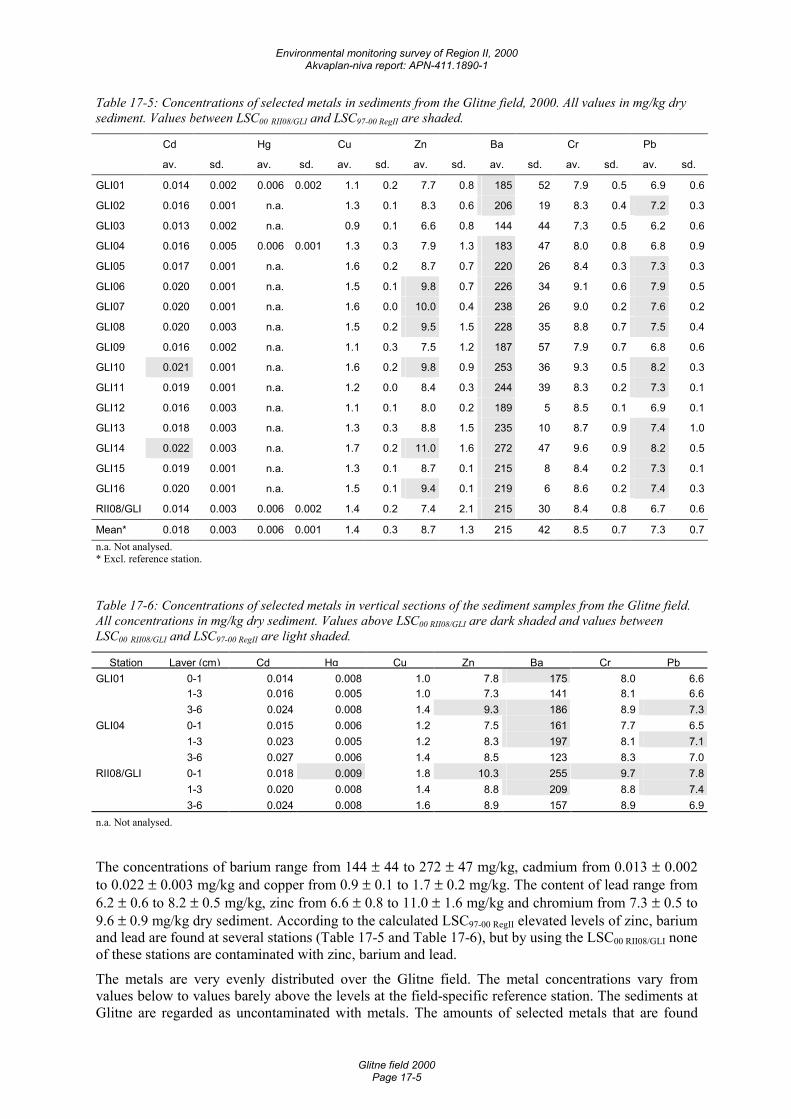
Environmental monitoring survey of Region II, 2000 Akvaplan-niva report: APN-411.1890-1
Glitne field 2000 Page 17-5
Table 17-5: Concentrations of selected metals in sediments from the Glitne field, 2000. All values in mg/kg dry sediment. Values between LSC00 RII08/GLI and LSC97-00 RegII are shaded.
Cd Hg Cu Zn Ba Cr Pb
av. sd. av. sd. av. sd. av. sd. av. sd. av. sd. av. sd.
GLI01 0.014 0.002 0.006 0.002 1.1 0.2 7.7 0.8 185 52 7.9 0.5 6.9 0.6
GLI02 0.016 0.001 n.a. 1.3 0.1 8.3 0.6 206 19 8.3 0.4 7.2 0.3
GLI03 0.013 0.002 n.a. 0.9 0.1 6.6 0.8 144 44 7.3 0.5 6.2 0.6
GLI04 0.016 0.005 0.006 0.001 1.3 0.3 7.9 1.3 183 47 8.0 0.8 6.8 0.9
GLI05 0.017 0.001 n.a. 1.6 0.2 8.7 0.7 220 26 8.4 0.3 7.3 0.3
GLI06 0.020 0.001 n.a. 1.5 0.1 9.8 0.7 226 34 9.1 0.6 7.9 0.5
GLI07 0.020 0.001 n.a. 1.6 0.0 10.0 0.4 238 26 9.0 0.2 7.6 0.2
GLI08 0.020 0.003 n.a. 1.5 0.2 9.5 1.5 228 35 8.8 0.7 7.5 0.4
GLI09 0.016 0.002 n.a. 1.1 0.3 7.5 1.2 187 57 7.9 0.7 6.8 0.6
GLI10 0.021 0.001 n.a. 1.6 0.2 9.8 0.9 253 36 9.3 0.5 8.2 0.3
GLI11 0.019 0.001 n.a. 1.2 0.0 8.4 0.3 244 39 8.3 0.2 7.3 0.1
GLI12 0.016 0.003 n.a. 1.1 0.1 8.0 0.2 189 5 8.5 0.1 6.9 0.1
GLI13 0.018 0.003 n.a. 1.3 0.3 8.8 1.5 235 10 8.7 0.9 7.4 1.0
GLI14 0.022 0.003 n.a. 1.7 0.2 11.0 1.6 272 47 9.6 0.9 8.2 0.5
GLI15 0.019 0.001 n.a. 1.3 0.1 8.7 0.1 215 8 8.4 0.2 7.3 0.1
GLI16 0.020 0.001 n.a. 1.5 0.1 9.4 0.1 219 6 8.6 0.2 7.4 0.3
RII08/GLI 0.014 0.003 0.006 0.002 1.4 0.2 7.4 2.1 215 30 8.4 0.8 6.7 0.6
Mean* 0.018 0.003 0.006 0.001 1.4 0.3 8.7 1.3 215 42 8.5 0.7 7.3 0.7n.a. Not analysed. * Excl. reference station.
Table 17-6: Concentrations of selected metals in vertical sections of the sediment samples from the Glitne field. All concentrations in mg/kg dry sediment. Values above LSC00 RII08/GLI are dark shaded and values between LSC00 RII08/GLI and LSC97-00 RegII are light shaded.
Station Layer (cm) Cd Hg Cu Zn Ba Cr PbGLI01 0-1 0.014 0.008 1.0 7.8 175 8.0 6.6 1-3 0.016 0.005 1.0 7.3 141 8.1 6.6 3-6 0.024 0.008 1.4 9.3 186 8.9 7.3GLI04 0-1 0.015 0.006 1.2 7.5 161 7.7 6.5 1-3 0.023 0.005 1.2 8.3 197 8.1 7.1 3-6 0.027 0.006 1.4 8.5 123 8.3 7.0RII08/GLI 0-1 0.018 0.009 1.8 10.3 255 9.7 7.8 1-3 0.020 0.008 1.4 8.8 209 8.8 7.4 3-6 0.024 0.008 1.6 8.9 157 8.9 6.9n.a. Not analysed.
The concentrations of barium range from 144 ± 44 to 272 ± 47 mg/kg, cadmium from 0.013 ± 0.002 to 0.022 ± 0.003 mg/kg and copper from 0.9 ± 0.1 to 1.7 ± 0.2 mg/kg. The content of lead range from 6.2 ± 0.6 to 8.2 ± 0.5 mg/kg, zinc from 6.6 ± 0.8 to 11.0 ± 1.6 mg/kg and chromium from 7.3 ± 0.5 to 9.6 ± 0.9 mg/kg dry sediment. According to the calculated LSC97-00 RegII elevated levels of zinc, barium and lead are found at several stations (Table 17-5 and Table 17-6), but by using the LSC00 RII08/GLI none of these stations are contaminated with zinc, barium and lead.
The metals are very evenly distributed over the Glitne field. The metal concentrations vary from values below to values barely above the levels at the field-specific reference station. The sediments at Glitne are regarded as uncontaminated with metals. The amounts of selected metals that are found
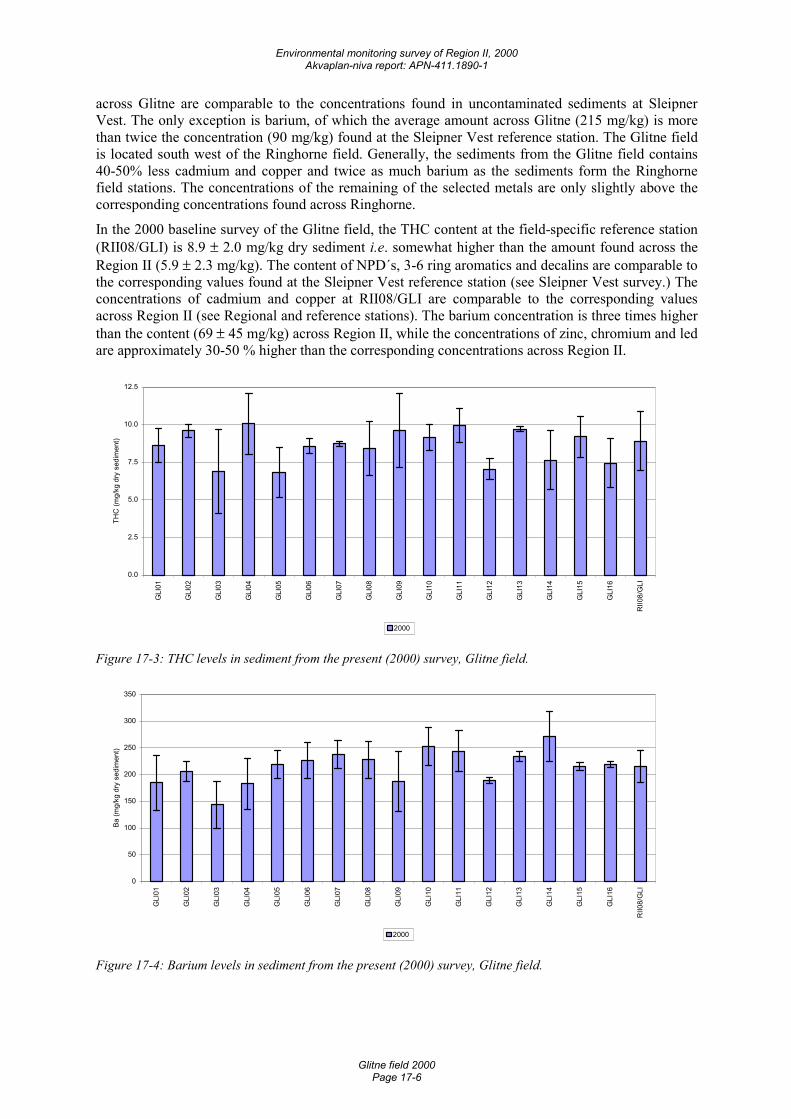
Environmental monitoring survey of Region II, 2000 Akvaplan-niva report: APN-411.1890-1
Glitne field 2000 Page 17-6
across Glitne are comparable to the concentrations found in uncontaminated sediments at Sleipner Vest. The only exception is barium, of which the average amount across Glitne (215 mg/kg) is more than twice the concentration (90 mg/kg) found at the Sleipner Vest reference station. The Glitne field is located south west of the Ringhorne field. Generally, the sediments from the Glitne field contains 40-50% less cadmium and copper and twice as much barium as the sediments form the Ringhorne field stations. The concentrations of the remaining of the selected metals are only slightly above the corresponding concentrations found across Ringhorne.
In the 2000 baseline survey of the Glitne field, the THC content at the field-specific reference station (RII08/GLI) is 8.9 ± 2.0 mg/kg dry sediment i.e. somewhat higher than the amount found across the Region II (5.9 ± 2.3 mg/kg). The content of NPD´s, 3-6 ring aromatics and decalins are comparable to the corresponding values found at the Sleipner Vest reference station (see Sleipner Vest survey.) The concentrations of cadmium and copper at RII08/GLI are comparable to the corresponding values across Region II (see Regional and reference stations). The barium concentration is three times higher than the content (69 ± 45 mg/kg) across Region II, while the concentrations of zinc, chromium and led are approximately 30-50 % higher than the corresponding concentrations across Region II.
0.0
2.5
5.0
7.5
10.0
12.5
GLI
01
GLI
02
GLI
03
GLI
04
GLI
05
GLI
06
GLI
07
GLI
08
GLI
09
GLI
10
GLI
11
GLI
12
GLI
13
GLI
14
GLI
15
GLI
16
RII0
8/G
LI
THC
(mg/
kg d
ry s
edim
ent)
2000
Figure 17-3: THC levels in sediment from the present (2000) survey, Glitne field.
0
50
100
150
200
250
300
350
GLI
01
GLI
02
GLI
03
GLI
04
GLI
05
GLI
06
GLI
07
GLI
08
GLI
09
GLI
10
GLI
11
GLI
12
GLI
13
GLI
14
GLI
15
GLI
16
RII0
8/G
LI
Ba (m
g/kg
dry
sed
imen
t)
2000
Figure 17-4: Barium levels in sediment from the present (2000) survey, Glitne field.
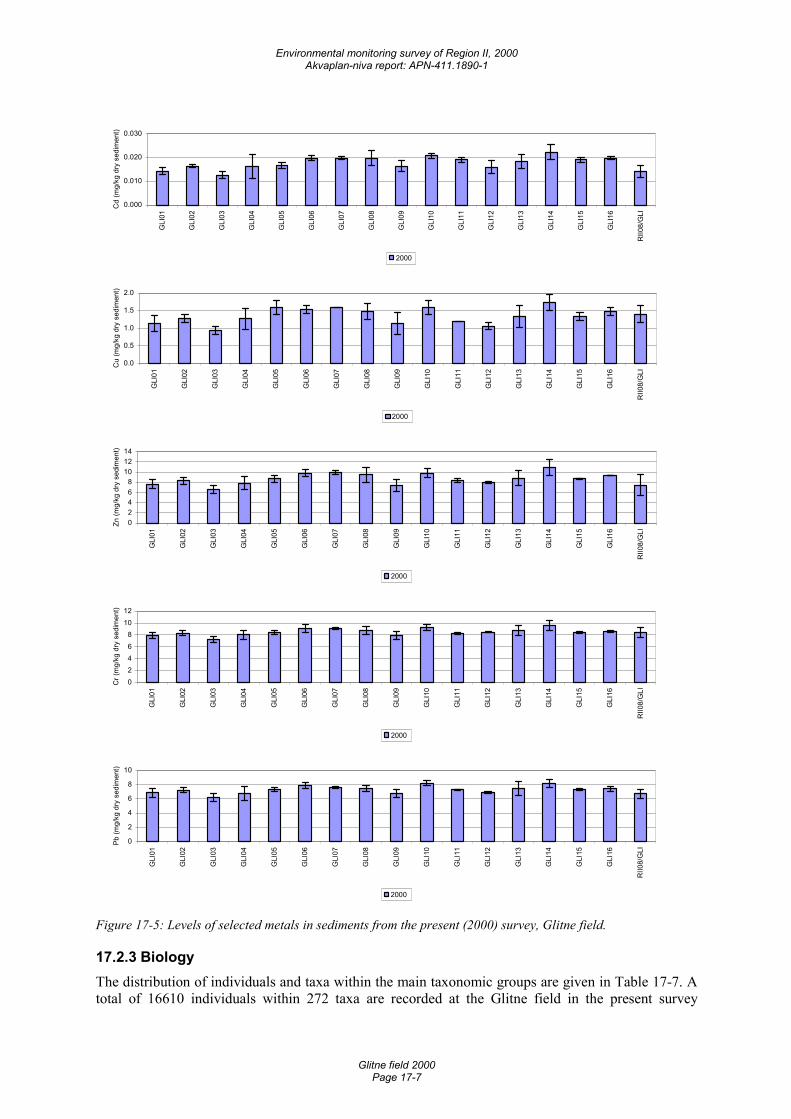
Environmental monitoring survey of Region II, 2000 Akvaplan-niva report: APN-411.1890-1
Glitne field 2000 Page 17-7
0.000
0.010
0.020
0.030
GLI
01
GLI
02
GLI
03
GLI
04
GLI
05
GLI
06
GLI
07
GLI
08
GLI
09
GLI
10
GLI
11
GLI
12
GLI
13
GLI
14
GLI
15
GLI
16
RII0
8/G
LI
Cd
(mg/
kg d
ry s
edim
ent)
2000
0.0
0.5
1.0
1.5
2.0
GLI
01
GLI
02
GLI
03
GLI
04
GLI
05
GLI
06
GLI
07
GLI
08
GLI
09
GLI
10
GLI
11
GLI
12
GLI
13
GLI
14
GLI
15
GLI
16
RII0
8/G
LI
Cu
(mg/
kg d
ry s
edim
ent)
2000
02468
101214
GLI
01
GLI
02
GLI
03
GLI
04
GLI
05
GLI
06
GLI
07
GLI
08
GLI
09
GLI
10
GLI
11
GLI
12
GLI
13
GLI
14
GLI
15
GLI
16
RII0
8/G
LI
Zn (m
g/kg
dry
sed
imen
t)
2000
02468
1012
GLI
01
GLI
02
GLI
03
GLI
04
GLI
05
GLI
06
GLI
07
GLI
08
GLI
09
GLI
10
GLI
11
GLI
12
GLI
13
GLI
14
GLI
15
GLI
16
RII0
8/G
LI
Cr (
mg/
kg d
ry s
edim
ent)
2000
0
2
4
6
8
10
GLI
01
GLI
02
GLI
03
GLI
04
GLI
05
GLI
06
GLI
07
GLI
08
GLI
09
GLI
10
GLI
11
GLI
12
GLI
13
GLI
14
GLI
15
GLI
16
RII0
8/G
LI
Pb (m
g/kg
dry
sed
imen
t)
2000
Figure 17-5: Levels of selected metals in sediments from the present (2000) survey, Glitne field.
17.2.3 Biology The distribution of individuals and taxa within the main taxonomic groups are given in Table 17-7. A total of 16610 individuals within 272 taxa are recorded at the Glitne field in the present survey
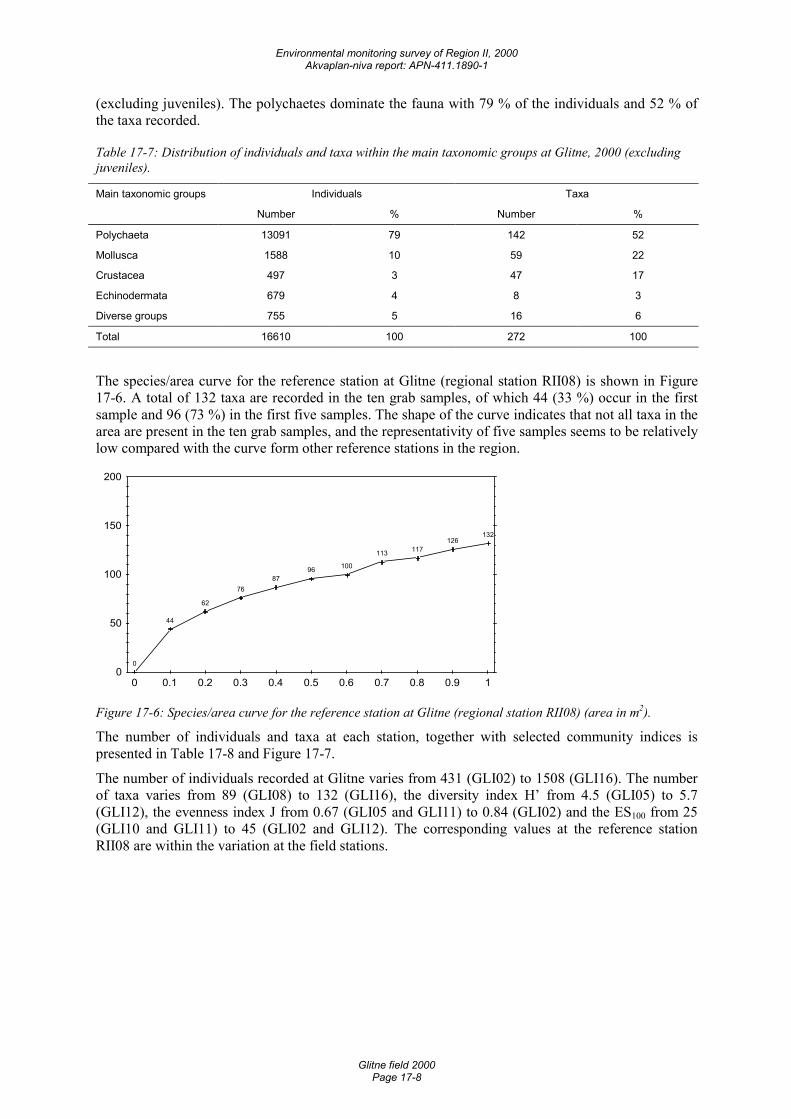
Environmental monitoring survey of Region II, 2000 Akvaplan-niva report: APN-411.1890-1
Glitne field 2000 Page 17-8
(excluding juveniles). The polychaetes dominate the fauna with 79 % of the individuals and 52 % of the taxa recorded.
Table 17-7: Distribution of individuals and taxa within the main taxonomic groups at Glitne, 2000 (excluding juveniles).
Main taxonomic groups Individuals Taxa
Number % Number %
Polychaeta 13091 79 142 52
Mollusca 1588 10 59 22
Crustacea 497 3 47 17
Echinodermata 679 4 8 3
Diverse groups 755 5 16 6
Total 16610 100 272 100
The species/area curve for the reference station at Glitne (regional station RII08) is shown in Figure 17-6. A total of 132 taxa are recorded in the ten grab samples, of which 44 (33 %) occur in the first sample and 96 (73 %) in the first five samples. The shape of the curve indicates that not all taxa in the area are present in the ten grab samples, and the representativity of five samples seems to be relatively low compared with the curve form other reference stations in the region.
g
0
44
62
7687
96 100
113 117126
132
0
50
100
150
200
0 0.1 0.2 0.3 0.4 0.5 0.6 0.7 0.8 0.9 1
Figure 17-6: Species/area curve for the reference station at Glitne (regional station RII08) (area in m2).
The number of individuals and taxa at each station, together with selected community indices is presented in Table 17-8 and Figure 17-7.
The number of individuals recorded at Glitne varies from 431 (GLI02) to 1508 (GLI16). The number of taxa varies from 89 (GLI08) to 132 (GLI16), the diversity index H’ from 4.5 (GLI05) to 5.7 (GLI12), the evenness index J from 0.67 (GLI05 and GLI11) to 0.84 (GLI02) and the ES100 from 25 (GLI10 and GLI11) to 45 (GLI02 and GLI12). The corresponding values at the reference station RII08 are within the variation at the field stations.
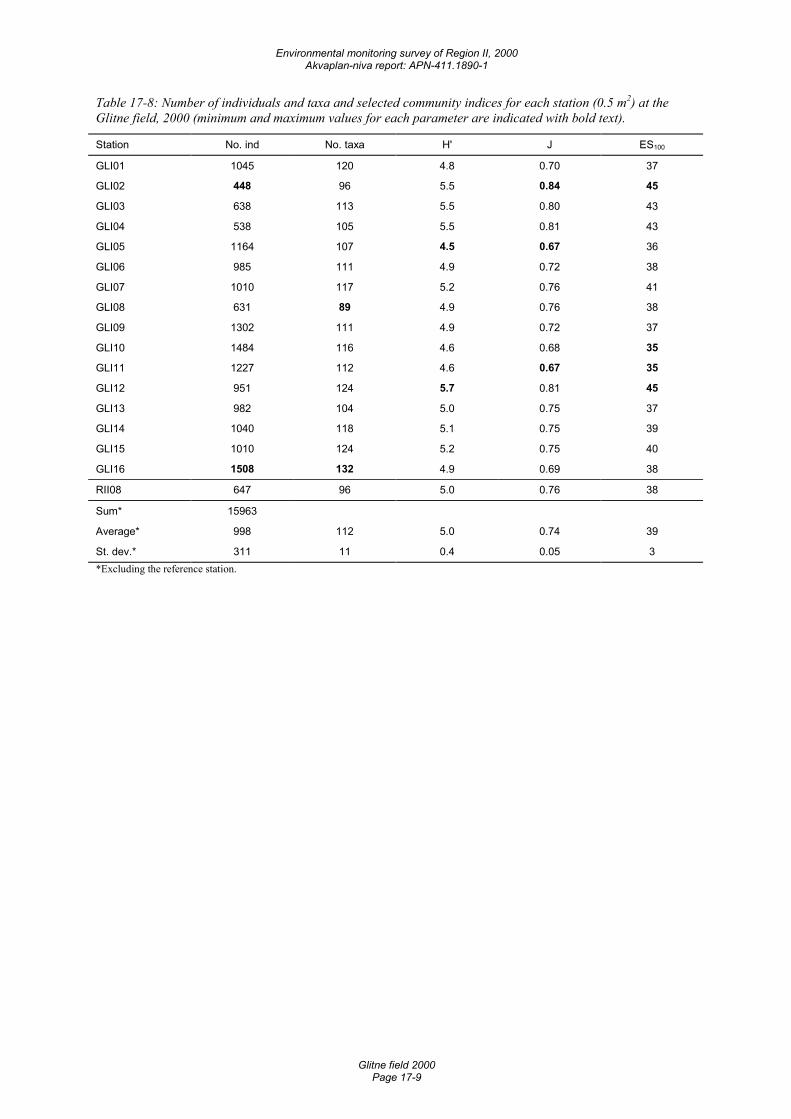
Environmental monitoring survey of Region II, 2000 Akvaplan-niva report: APN-411.1890-1
Glitne field 2000 Page 17-9
Table 17-8: Number of individuals and taxa and selected community indices for each station (0.5 m2) at the Glitne field, 2000 (minimum and maximum values for each parameter are indicated with bold text).
Station No. ind No. taxa H' J ES100
GLI01 1045 120 4.8 0.70 37
GLI02 448 96 5.5 0.84 45
GLI03 638 113 5.5 0.80 43
GLI04 538 105 5.5 0.81 43
GLI05 1164 107 4.5 0.67 36
GLI06 985 111 4.9 0.72 38
GLI07 1010 117 5.2 0.76 41
GLI08 631 89 4.9 0.76 38
GLI09 1302 111 4.9 0.72 37
GLI10 1484 116 4.6 0.68 35
GLI11 1227 112 4.6 0.67 35
GLI12 951 124 5.7 0.81 45
GLI13 982 104 5.0 0.75 37
GLI14 1040 118 5.1 0.75 39
GLI15 1010 124 5.2 0.75 40
GLI16 1508 132 4.9 0.69 38
RII08 647 96 5.0 0.76 38
Sum* 15963
Average* 998 112 5.0 0.74 39
St. dev.* 311 11 0.4 0.05 3 *Excluding the reference station.
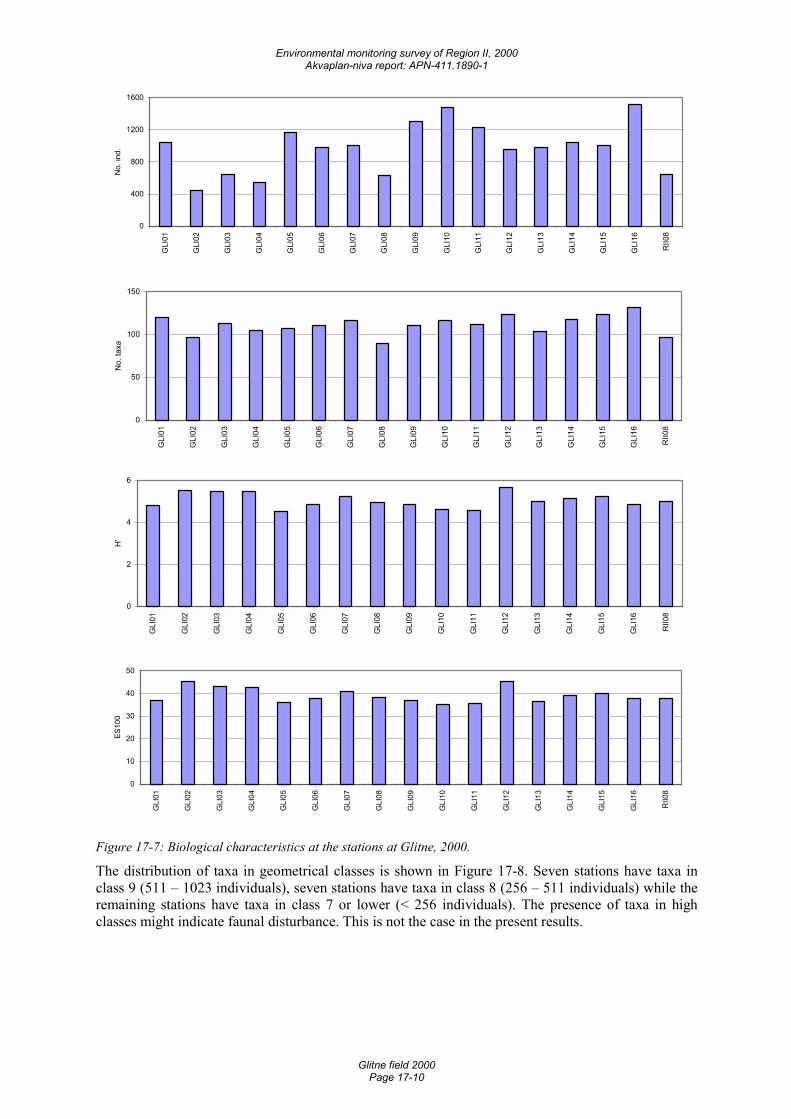
Environmental monitoring survey of Region II, 2000 Akvaplan-niva report: APN-411.1890-1
Glitne field 2000 Page 17-10
0
400
800
1200
1600
GLI
01
GLI
02
GLI
03
GLI
04
GLI
05
GLI
06
GLI
07
GLI
08
GLI
09
GLI
10
GLI
11
GLI
12
GLI
13
GLI
14
GLI
15
GLI
16
RII0
8
No.
ind.
0
50
100
150
GLI
01
GLI
02
GLI
03
GLI
04
GLI
05
GLI
06
GLI
07
GLI
08
GLI
09
GLI
10
GLI
11
GLI
12
GLI
13
GLI
14
GLI
15
GLI
16
RII0
8
No.
taxa
0
2
4
6
GLI
01
GLI
02
GLI
03
GLI
04
GLI
05
GLI
06
GLI
07
GLI
08
GLI
09
GLI
10
GLI
11
GLI
12
GLI
13
GLI
14
GLI
15
GLI
16
RII0
8
H'
0
10
20
30
40
50
GLI
01
GLI
02
GLI
03
GLI
04
GLI
05
GLI
06
GLI
07
GLI
08
GLI
09
GLI
10
GLI
11
GLI
12
GLI
13
GLI
14
GLI
15
GLI
16
RII0
8
ES10
0
Figure 17-7: Biological characteristics at the stations at Glitne, 2000.
The distribution of taxa in geometrical classes is shown in Figure 17-8. Seven stations have taxa in class 9 (511 – 1023 individuals), seven stations have taxa in class 8 (256 – 511 individuals) while the remaining stations have taxa in class 7 or lower (< 256 individuals). The presence of taxa in high classes might indicate faunal disturbance. This is not the case in the present results.
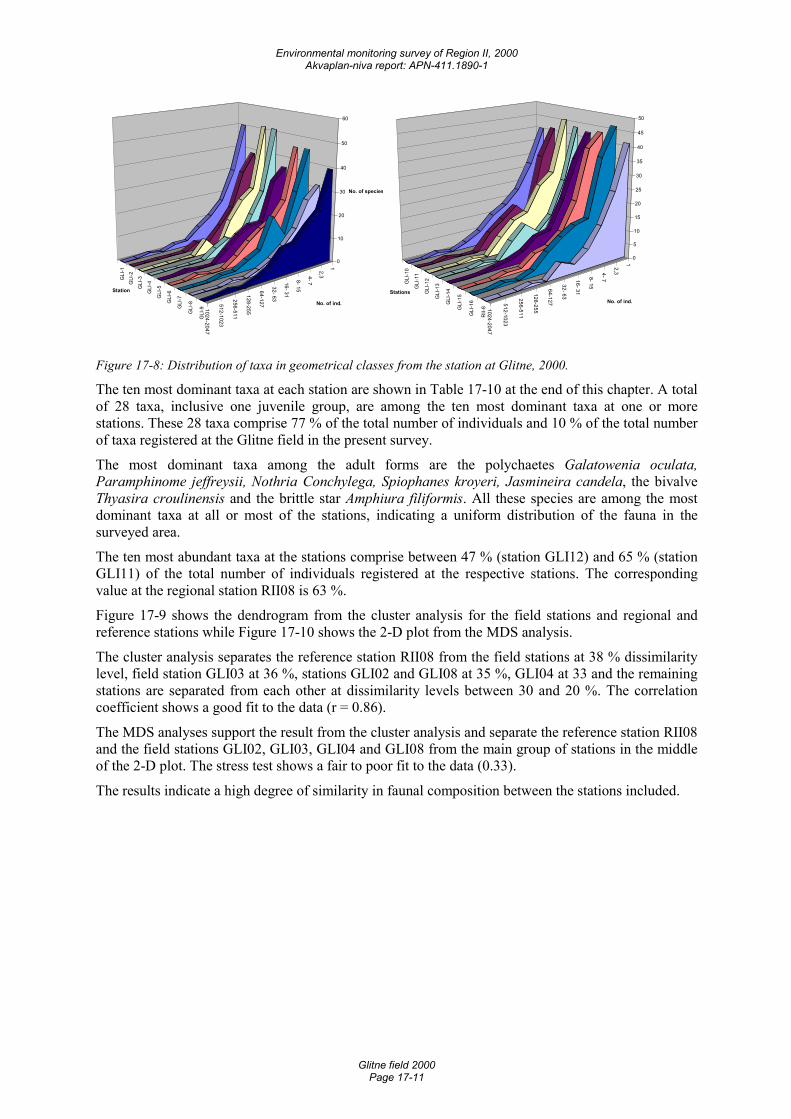
Environmental monitoring survey of Region II, 2000 Akvaplan-niva report: APN-411.1890-1
Glitne field 2000 Page 17-11
1
2,3 4- 7
8- 15
16- 31
32- 63
64-127
128-255
256-511
512-1023
1024-2047
GLI
-1G
LI-2
GLI
-3
GLI
-4
GLI
-5
GLI
-6
GLI
-7
GLI
-8
GLI
-9
0
10
20
30
40
50
60
No. of species
No. of ind.
Station
1
2,3 4- 7 8- 15
16- 31
32- 63
64-127
128-255
256-511
512-1023
1024-2047
GLI
-10
GLI
-11
GLI
-12
GLI
-13
GLI
-14
GLI
-15
GLI
-16
RII-
8
0
5
10
15
20
25
30
35
40
45
50
No. of ind.
Stations
Figure 17-8: Distribution of taxa in geometrical classes from the station at Glitne, 2000.
The ten most dominant taxa at each station are shown in Table 17-10 at the end of this chapter. A total of 28 taxa, inclusive one juvenile group, are among the ten most dominant taxa at one or more stations. These 28 taxa comprise 77 % of the total number of individuals and 10 % of the total number of taxa registered at the Glitne field in the present survey.
The most dominant taxa among the adult forms are the polychaetes Galatowenia oculata, Paramphinome jeffreysii, Nothria Conchylega, Spiophanes kroyeri, Jasmineira candela, the bivalve Thyasira croulinensis and the brittle star Amphiura filiformis. All these species are among the most dominant taxa at all or most of the stations, indicating a uniform distribution of the fauna in the surveyed area.
The ten most abundant taxa at the stations comprise between 47 % (station GLI12) and 65 % (station GLI11) of the total number of individuals registered at the respective stations. The corresponding value at the regional station RII08 is 63 %.
Figure 17-9 shows the dendrogram from the cluster analysis for the field stations and regional and reference stations while Figure 17-10 shows the 2-D plot from the MDS analysis.
The cluster analysis separates the reference station RII08 from the field stations at 38 % dissimilarity level, field station GLI03 at 36 %, stations GLI02 and GLI08 at 35 %, GLI04 at 33 and the remaining stations are separated from each other at dissimilarity levels between 30 and 20 %. The correlation coefficient shows a good fit to the data (r = 0.86).
The MDS analyses support the result from the cluster analysis and separate the reference station RII08 and the field stations GLI02, GLI03, GLI04 and GLI08 from the main group of stations in the middle of the 2-D plot. The stress test shows a fair to poor fit to the data (0.33).
The results indicate a high degree of similarity in faunal composition between the stations included.
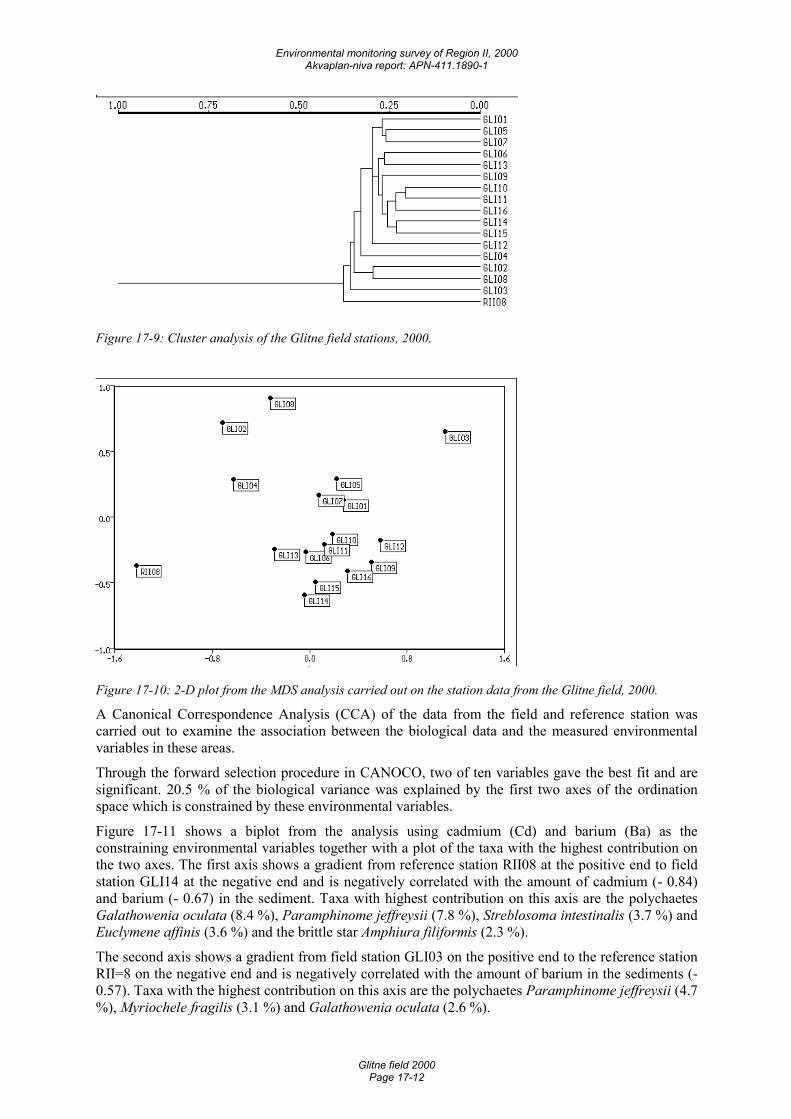
Environmental monitoring survey of Region II, 2000 Akvaplan-niva report: APN-411.1890-1
Glitne field 2000 Page 17-12
Figure 17-9: Cluster analysis of the Glitne field stations, 2000.
Figure 17-10: 2-D plot from the MDS analysis carried out on the station data from the Glitne field, 2000.
A Canonical Correspondence Analysis (CCA) of the data from the field and reference station was carried out to examine the association between the biological data and the measured environmental variables in these areas.
Through the forward selection procedure in CANOCO, two of ten variables gave the best fit and are significant. 20.5 % of the biological variance was explained by the first two axes of the ordination space which is constrained by these environmental variables.
Figure 17-11 shows a biplot from the analysis using cadmium (Cd) and barium (Ba) as the constraining environmental variables together with a plot of the taxa with the highest contribution on the two axes. The first axis shows a gradient from reference station RII08 at the positive end to field station GLI14 at the negative end and is negatively correlated with the amount of cadmium (- 0.84) and barium (- 0.67) in the sediment. Taxa with highest contribution on this axis are the polychaetes Galathowenia oculata (8.4 %), Paramphinome jeffreysii (7.8 %), Streblosoma intestinalis (3.7 %) and Euclymene affinis (3.6 %) and the brittle star Amphiura filiformis (2.3 %).
The second axis shows a gradient from field station GLI03 on the positive end to the reference station RII=8 on the negative end and is negatively correlated with the amount of barium in the sediments (- 0.57). Taxa with the highest contribution on this axis are the polychaetes Paramphinome jeffreysii (4.7 %), Myriochele fragilis (3.1 %) and Galathowenia oculata (2.6 %).
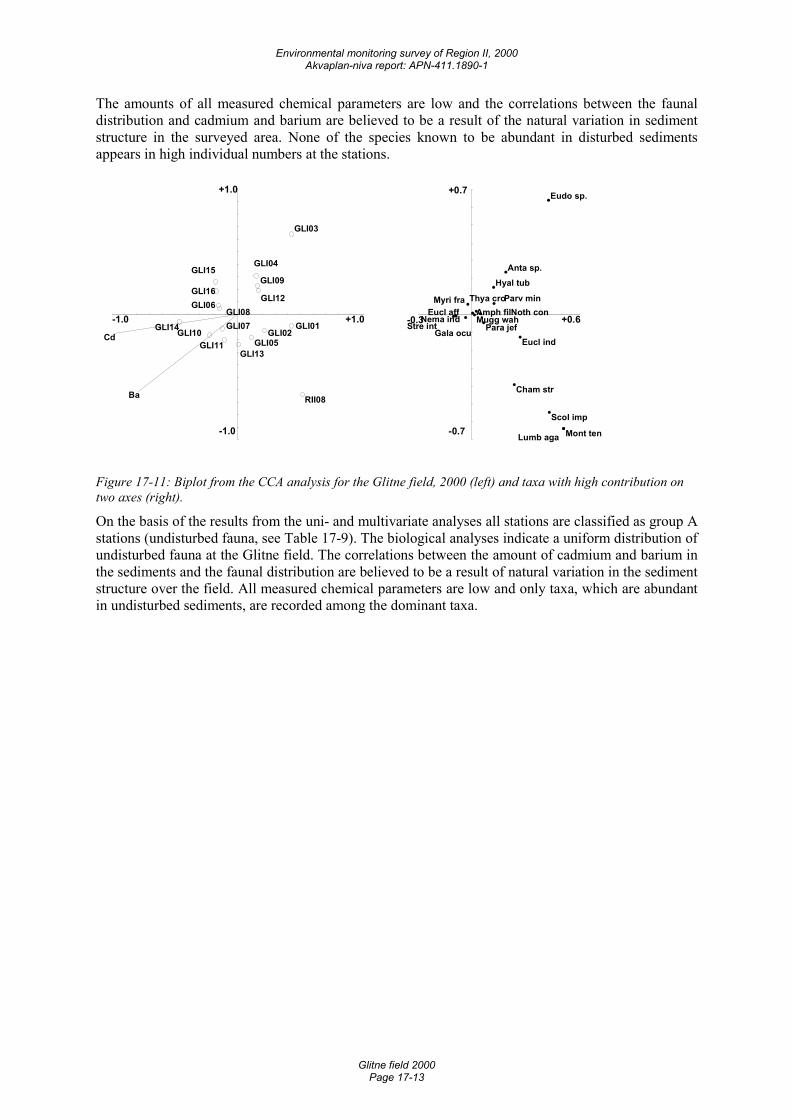
Environmental monitoring survey of Region II, 2000 Akvaplan-niva report: APN-411.1890-1
Glitne field 2000 Page 17-13
The amounts of all measured chemical parameters are low and the correlations between the faunal distribution and cadmium and barium are believed to be a result of the natural variation in sediment structure in the surveyed area. None of the species known to be abundant in disturbed sediments appears in high individual numbers at the stations.
-1.0 +1.0
-1.0
+1.0
Cd
Ba RII08
GLI14 GLI01
GLI03
GLI10 GLI02
GLI15
GLI16GLI12
GLI09
GLI06
GLI04
GLI08GLI07
GLI05GLI11GLI13
-0.3 +0.6
-0.7
+0.7
Mont tenLumb aga
Scol imp
Eudo sp.
Eucl ind
Cham str
Anta sp.
Parv min
Hyal tub
Nema indStre int
Eucl affPara jef
Amph fil
Gala ocu
Thya croMyri fra
Mugg wahNoth con
Figure 17-11: Biplot from the CCA analysis for the Glitne field, 2000 (left) and taxa with high contribution on two axes (right).
On the basis of the results from the uni- and multivariate analyses all stations are classified as group A stations (undisturbed fauna, see Table 17-9). The biological analyses indicate a uniform distribution of undisturbed fauna at the Glitne field. The correlations between the amount of cadmium and barium in the sediments and the faunal distribution are believed to be a result of natural variation in the sediment structure over the field. All measured chemical parameters are low and only taxa, which are abundant in undisturbed sediments, are recorded among the dominant taxa.
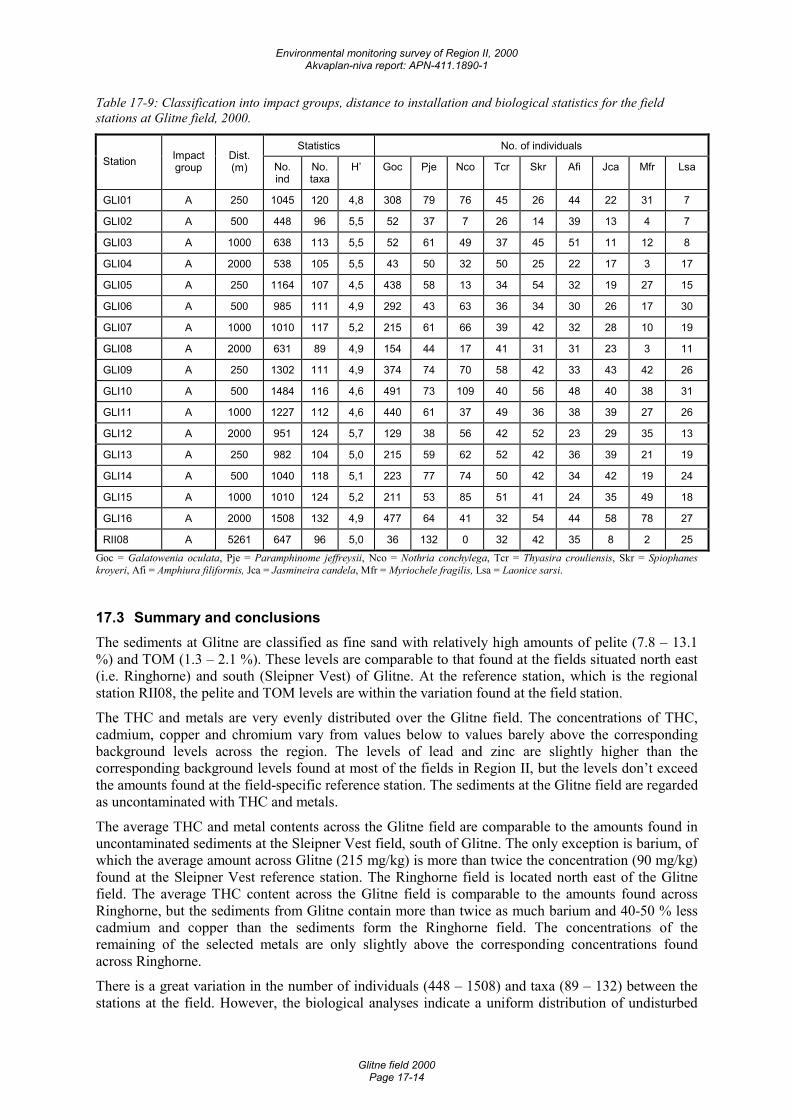
Environmental monitoring survey of Region II, 2000 Akvaplan-niva report: APN-411.1890-1
Glitne field 2000 Page 17-14
Table 17-9: Classification into impact groups, distance to installation and biological statistics for the field stations at Glitne field, 2000.
Statistics No. of individuals Station Impact
group Dist. (m) No.
ind No. taxa
H’ Goc Pje Nco Tcr Skr Afi Jca Mfr Lsa
GLI01 A 250 1045 120 4,8 308 79 76 45 26 44 22 31 7
GLI02 A 500 448 96 5,5 52 37 7 26 14 39 13 4 7
GLI03 A 1000 638 113 5,5 52 61 49 37 45 51 11 12 8
GLI04 A 2000 538 105 5,5 43 50 32 50 25 22 17 3 17
GLI05 A 250 1164 107 4,5 438 58 13 34 54 32 19 27 15
GLI06 A 500 985 111 4,9 292 43 63 36 34 30 26 17 30
GLI07 A 1000 1010 117 5,2 215 61 66 39 42 32 28 10 19
GLI08 A 2000 631 89 4,9 154 44 17 41 31 31 23 3 11
GLI09 A 250 1302 111 4,9 374 74 70 58 42 33 43 42 26
GLI10 A 500 1484 116 4,6 491 73 109 40 56 48 40 38 31
GLI11 A 1000 1227 112 4,6 440 61 37 49 36 38 39 27 26
GLI12 A 2000 951 124 5,7 129 38 56 42 52 23 29 35 13
GLI13 A 250 982 104 5,0 215 59 62 52 42 36 39 21 19
GLI14 A 500 1040 118 5,1 223 77 74 50 42 34 42 19 24
GLI15 A 1000 1010 124 5,2 211 53 85 51 41 24 35 49 18
GLI16 A 2000 1508 132 4,9 477 64 41 32 54 44 58 78 27
RII08 A 5261 647 96 5,0 36 132 0 32 42 35 8 2 25 Goc = Galatowenia oculata, Pje = Paramphinome jeffreysii, Nco = Nothria conchylega, Tcr = Thyasira crouliensis, Skr = Spiophanes kroyeri, Afi = Amphiura filiformis, Jca = Jasmineira candela, Mfr = Myriochele fragilis, Lsa = Laonice sarsi.
17.3 Summary and conclusions The sediments at Glitne are classified as fine sand with relatively high amounts of pelite (7.8 – 13.1 %) and TOM (1.3 – 2.1 %). These levels are comparable to that found at the fields situated north east (i.e. Ringhorne) and south (Sleipner Vest) of Glitne. At the reference station, which is the regional station RII08, the pelite and TOM levels are within the variation found at the field station.
The THC and metals are very evenly distributed over the Glitne field. The concentrations of THC, cadmium, copper and chromium vary from values below to values barely above the corresponding background levels across the region. The levels of lead and zinc are slightly higher than the corresponding background levels found at most of the fields in Region II, but the levels don’t exceed the amounts found at the field-specific reference station. The sediments at the Glitne field are regarded as uncontaminated with THC and metals.
The average THC and metal contents across the Glitne field are comparable to the amounts found in uncontaminated sediments at the Sleipner Vest field, south of Glitne. The only exception is barium, of which the average amount across Glitne (215 mg/kg) is more than twice the concentration (90 mg/kg) found at the Sleipner Vest reference station. The Ringhorne field is located north east of the Glitne field. The average THC content across the Glitne field is comparable to the amounts found across Ringhorne, but the sediments from Glitne contain more than twice as much barium and 40-50 % less cadmium and copper than the sediments form the Ringhorne field. The concentrations of the remaining of the selected metals are only slightly above the corresponding concentrations found across Ringhorne.
There is a great variation in the number of individuals (448 – 1508) and taxa (89 – 132) between the stations at the field. However, the biological analyses indicate a uniform distribution of undisturbed
Environmental monitoring survey of Region II, 2000 Akvaplan-niva report: APN-411.1890-1
Glitne field 2000 Page 17-15
fauna at the Glitne field. The correlations between the amount of cadmium and barium in the sediments and the faunal distribution are believed to be a result of natural variation in the sediment structure over the field. All measured chemical parameters are low and only taxa, which are abundant in undisturbed sediments, are recorded among the dominant taxa. It is concluded that the fauna is undisturbed at all stations at the field.
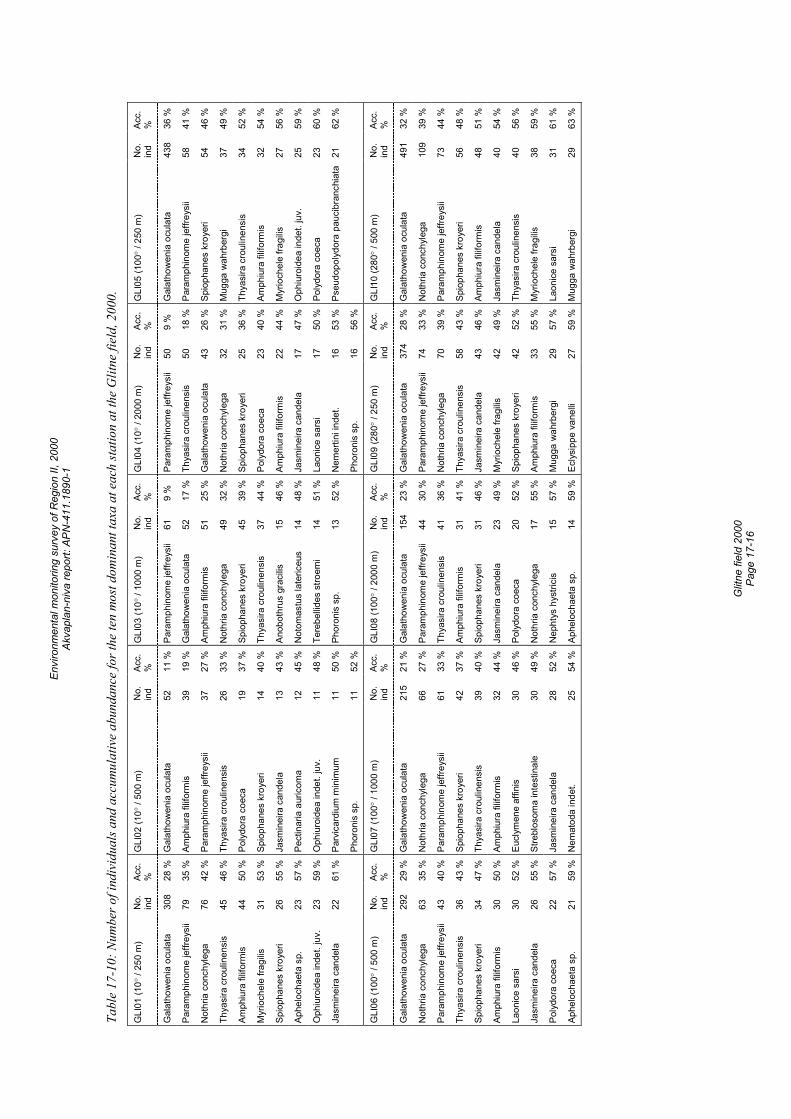
Envi
ronm
enta
l mon
itorin
g su
rvey
of R
egio
n II,
200
0 Ak
vapl
an-n
iva
repo
rt: A
PN-4
11.1
890-
1
G
litne
fiel
d 20
00
Page
17-
16
Tabl
e 17
-10:
Num
ber o
f ind
ivid
uals
and
acc
umul
ativ
e ab
unda
nce
for t
he te
n m
ost d
omin
ant t
axa
at e
ach
statio
n at
the
Glit
ne fi
eld,
200
0.
GLI
01 (1
0° /
250
m)
No.
in
d Ac
c.%
G
LI02
(10°
/ 50
0 m
) N
o.
ind
Acc.
%
GLI
03 (1
0° /
1000
m)
No.
in
d Ac
c.%
G
LI04
(10°
/ 20
00 m
) N
o.
ind
Acc.
%
GLI
05 (1
00°
/ 250
m)
No.
in
d Ac
c.
%
Gal
atho
wen
ia o
cula
ta
308
28 %
G
alat
how
enia
ocu
lata
52
11
%
Para
mph
inom
e je
ffrey
sii
61
9 %
Pa
ram
phin
ome
jeffr
eysi
i 50
9
%
Gal
atho
wen
ia o
cula
ta
438
36 %
Para
mph
inom
e je
ffrey
sii
79
35 %
Am
phiu
ra fi
lifor
mis
39
19
%
Gal
atho
wen
ia o
cula
ta
52
17 %
Th
yasi
ra c
roul
inen
sis
50
18 %
Pa
ram
phin
ome
jeffr
eysi
i 58
41
%
Not
hria
con
chyl
ega
76
42 %
Pa
ram
phin
ome
jeffr
eysi
i 37
27
%
Amph
iura
filif
orm
is
51
25 %
G
alat
how
enia
ocu
lata
43
26
%
Spio
phan
es k
roye
ri 54
46
%
Thya
sira
cro
ulin
ensi
s 45
46
%
Thya
sira
cro
ulin
ensi
s 26
33
%
Not
hria
con
chyl
ega
49
32 %
N
othr
ia c
onch
yleg
a 32
31
%
Mug
ga w
ahrb
ergi
37
49
%
Amph
iura
filif
orm
is
44
50 %
Po
lydo
ra c
oeca
19
37
%
Spio
phan
es k
roye
ri 45
39
%
Spio
phan
es k
roye
ri 25
36
%
Thya
sira
cro
ulin
ensi
s 34
52
%
Myr
ioch
ele
fragi
lis
31
53 %
Sp
ioph
anes
kro
yeri
14
40 %
Th
yasi
ra c
roul
inen
sis
37
44 %
Po
lydo
ra c
oeca
23
40
%
Amph
iura
filif
orm
is
32
54 %
Spio
phan
es k
roye
ri 26
55
%
Jasm
inei
ra c
ande
la
13
43 %
An
obot
hrus
gra
cilis
15
46
%
Amph
iura
filif
orm
is
22
44 %
M
yrio
chel
e fra
gilis
27
56
%
Aphe
loch
aeta
sp.
23
57
%
Pect
inar
ia a
uric
oma
12
45 %
N
otom
astu
s la
teric
eus
14
48 %
Ja
smin
eira
can
dela
17
47
%
Oph
iuro
idea
inde
t. ju
v.
25
59 %
Oph
iuro
idea
inde
t. ju
v.
23
59 %
O
phiu
roid
ea in
det.
juv.
11
48
%
Tere
bellid
es s
troem
i 14
51
%
Laon
ice
sars
i 17
50
%
Poly
dora
coe
ca
23
60 %
Jasm
inei
ra c
ande
la
22
61 %
Pa
rvic
ardi
um m
inim
um
11
50 %
Ph
oron
is s
p.
13
52 %
N
emer
tini i
ndet
. 16
53
%
Pseu
dopo
lydo
ra p
auci
bran
chia
ta
21
62 %
Ph
oron
is s
p.
11
52 %
Phor
onis
sp.
16
56
%
GLI
06 (1
00°
/ 500
m)
No.
in
d Ac
c.
%
GLI
07 (1
00°
/ 100
0 m
) N
o.
ind
Acc.
%
G
LI08
(100
° / 2
000
m)
No.
in
d Ac
c.
%
GLI
09 (2
80°
/ 250
m)
No.
in
d Ac
c.
%
GLI
10 (2
80°
/ 500
m)
No.
in
d Ac
c.
%
Gal
atho
wen
ia o
cula
ta
292
29 %
G
alat
how
enia
ocu
lata
21
5 21
%
Gal
atho
wen
ia o
cula
ta
154
23 %
G
alat
how
enia
ocu
lata
37
4 28
%
Gal
atho
wen
ia o
cula
ta
491
32 %
Not
hria
con
chyl
ega
63
35 %
N
othr
ia c
onch
yleg
a 66
27
%
Para
mph
inom
e je
ffrey
sii
44
30 %
Pa
ram
phin
ome
jeffr
eysi
i 74
33
%
Not
hria
con
chyl
ega
109
39 %
Para
mph
inom
e je
ffrey
sii
43
40 %
Pa
ram
phin
ome
jeffr
eysi
i 61
33
%
Thya
sira
cro
ulin
ensi
s 41
36
%
Not
hria
con
chyl
ega
70
39 %
Pa
ram
phin
ome
jeffr
eysi
i 73
44
%
Thya
sira
cro
ulin
ensi
s 36
43
%
Spio
phan
es k
roye
ri 42
37
%
Amph
iura
filif
orm
is
31
41 %
Th
yasi
ra c
roul
inen
sis
58
43 %
Sp
ioph
anes
kro
yeri
56
48 %
Spio
phan
es k
roye
ri 34
47
%
Thya
sira
cro
ulin
ensi
s 39
40
%
Spio
phan
es k
roye
ri 31
46
%
Jasm
inei
ra c
ande
la
43
46 %
Am
phiu
ra fi
lifor
mis
48
51
%
Amph
iura
filif
orm
is
30
50 %
Am
phiu
ra fi
lifor
mis
32
44
%
Jasm
inei
ra c
ande
la
23
49 %
M
yrio
chel
e fra
gilis
42
49
%
Jasm
inei
ra c
ande
la
40
54 %
Laon
ice
sars
i 30
52
%
Eucl
ymen
e af
finis
30
46
%
Poly
dora
coe
ca
20
52 %
Sp
ioph
anes
kro
yeri
42
52 %
Th
yasi
ra c
roul
inen
sis
40
56 %
Jasm
inei
ra c
ande
la
26
55 %
St
rebl
osom
a in
test
inal
e 30
49
%
Not
hria
con
chyl
ega
17
55 %
Am
phiu
ra fi
lifor
mis
33
55
%
Myr
ioch
ele
fragi
lis
38
59 %
Poly
dora
coe
ca
22
57 %
Ja
smin
eira
can
dela
28
52
%
Nep
htys
hys
trici
s 15
57
%
Mug
ga w
ahrb
ergi
29
57
%
Laon
ice
sars
i 31
61
%
Aphe
loch
aeta
sp.
21
59
%
Nem
atod
a in
det.
25
54 %
Ap
helo
chae
ta s
p.
14
59 %
Ec
lysi
ppe
vane
lli 27
59
%
Mug
ga w
ahrb
ergi
29
63
%
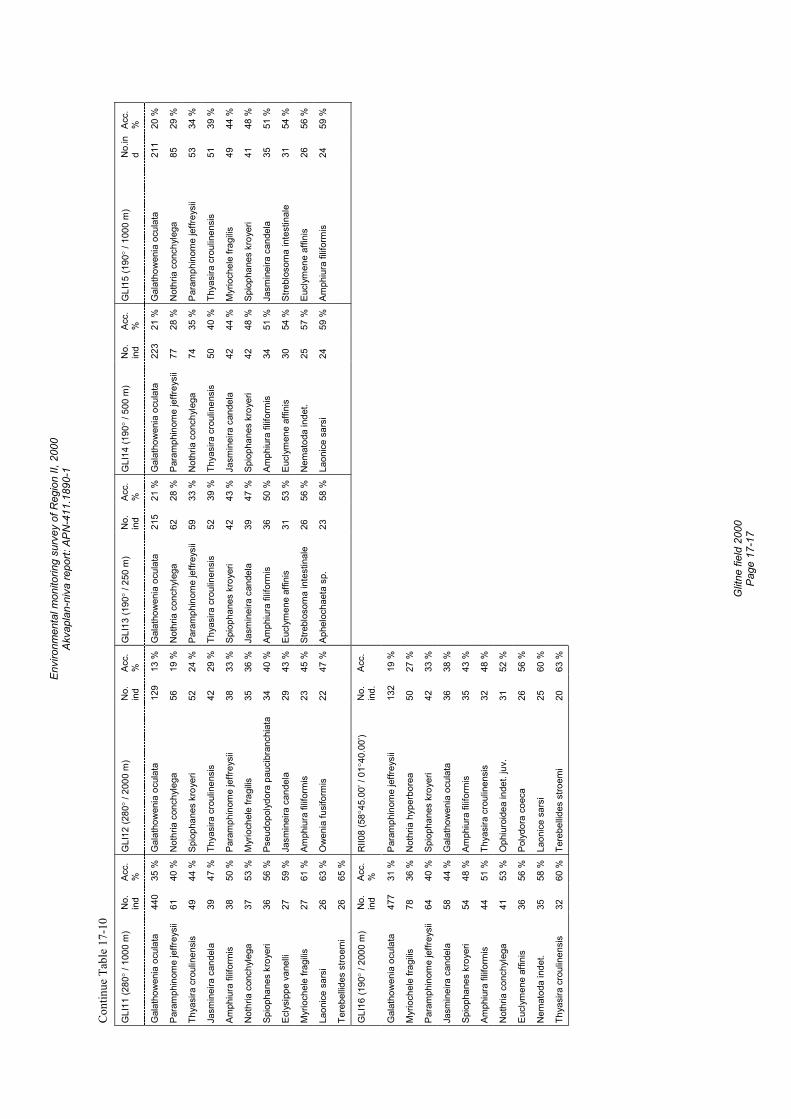
Envi
ronm
enta
l mon
itorin
g su
rvey
of R
egio
n II,
200
0 Ak
vapl
an-n
iva
repo
rt: A
PN-4
11.1
890-
1
G
litne
fiel
d 20
00
Page
17-
17
Con
tinue
Tab
le 1
7-10
GLI
11 (2
80°
/ 100
0 m
) N
o.
ind
Acc.
%
G
LI12
(280
° / 2
000
m)
No.
in
d Ac
c.
%
GLI
13 (1
90°
/ 250
m)
No.
in
d Ac
c.
%
GLI
14 (1
90°
/ 500
m)
No.
in
d Ac
c.
%
GLI
15 (1
90°
/ 100
0 m
) N
o.in
d Ac
c.
%
Gal
atho
wen
ia o
cula
ta
440
35 %
G
alat
how
enia
ocu
lata
12
9 13
%
Gal
atho
wen
ia o
cula
ta
215
21 %
G
alat
how
enia
ocu
lata
22
3 21
%
Gal
atho
wen
ia o
cula
ta
211
20 %
Para
mph
inom
e je
ffrey
sii
61
40 %
N
othr
ia c
onch
yleg
a 56
19
%
Not
hria
con
chyl
ega
62
28 %
Pa
ram
phin
ome
jeffr
eysi
i 77
28
%
Not
hria
con
chyl
ega
85
29 %
Thya
sira
cro
ulin
ensi
s 49
44
%
Spio
phan
es k
roye
ri 52
24
%
Para
mph
inom
e je
ffrey
sii
59
33 %
N
othr
ia c
onch
yleg
a 74
35
%
Para
mph
inom
e je
ffrey
sii
53
34 %
Jasm
inei
ra c
ande
la
39
47 %
Th
yasi
ra c
roul
inen
sis
42
29 %
Th
yasi
ra c
roul
inen
sis
52
39 %
Th
yasi
ra c
roul
inen
sis
50
40 %
Th
yasi
ra c
roul
inen
sis
51
39 %
Amph
iura
filif
orm
is
38
50 %
Pa
ram
phin
ome
jeffr
eysi
i 38
33
%
Spio
phan
es k
roye
ri 42
43
%
Jasm
inei
ra c
ande
la
42
44 %
M
yrio
chel
e fra
gilis
49
44
%
Not
hria
con
chyl
ega
37
53 %
M
yrio
chel
e fra
gilis
35
36
%
Jasm
inei
ra c
ande
la
39
47 %
Sp
ioph
anes
kro
yeri
42
48 %
Sp
ioph
anes
kro
yeri
41
48 %
Spio
phan
es k
roye
ri 36
56
%
Pseu
dopo
lydo
ra p
auci
bran
chia
ta
34
40 %
Am
phiu
ra fi
lifor
mis
36
50
%
Amph
iura
filif
orm
is
34
51 %
Ja
smin
eira
can
dela
35
51
%
Ecly
sipp
e va
nelli
27
59 %
Ja
smin
eira
can
dela
29
43
%
Eucl
ymen
e af
finis
31
53
%
Eucl
ymen
e af
finis
30
54
%
Stre
blos
oma
inte
stin
ale
31
54 %
Myr
ioch
ele
fragi
lis
27
61 %
Am
phiu
ra fi
lifor
mis
23
45
%
Stre
blos
oma
inte
stin
ale
26
56 %
N
emat
oda
inde
t. 25
57
%
Eucl
ymen
e af
finis
26
56
%
Laon
ice
sars
i 26
63
%
Ow
enia
fusi
form
is
22
47 %
Ap
helo
chae
ta s
p.
23
58 %
La
onic
e sa
rsi
24
59 %
Am
phiu
ra fi
lifor
mis
24
59
%
Tere
bellid
es s
troem
i 26
65
%
GLI
16 (1
90°
/ 200
0 m
) N
o.
ind
Acc.
%
R
II08
(58°
45.0
0’ /
01°4
0.00
’) N
o.
ind.
Ac
c.
Gal
atho
wen
ia o
cula
ta
477
31 %
Pa
ram
phin
ome
jeffr
eysi
i 13
2 19
%
Myr
ioch
ele
fragi
lis
78
36 %
N
othr
ia h
yper
bore
a 50
27
%
Para
mph
inom
e je
ffrey
sii
64
40 %
Sp
ioph
anes
kro
yeri
42
33 %
Jasm
inei
ra c
ande
la
58
44 %
G
alat
how
enia
ocu
lata
36
38
%
Spio
phan
es k
roye
ri 54
48
%
Amph
iura
filif
orm
is
35
43 %
Amph
iura
filif
orm
is
44
51 %
Th
yasi
ra c
roul
inen
sis
32
48 %
Not
hria
con
chyl
ega
41
53 %
O
phiu
roid
ea in
det.
juv.
31
52
%
Eucl
ymen
e af
finis
36
56
%
Poly
dora
coe
ca
26
56 %
Nem
atod
a in
det.
35
58 %
La
onic
e sa
rsi
25
60 %
Thya
sira
cro
ulin
ensi
s 32
60
%
Tere
bellid
es s
troem
i 20
63
%
Envi
ronm
enta
l mon
itorin
g su
rvey
of R
egio
n II,
200
0 Ak
vapl
an-n
iva
repo
rt: A
PN-4
11.1
890-
1
G
litne
fiel
d 20
00
Page
17-
18
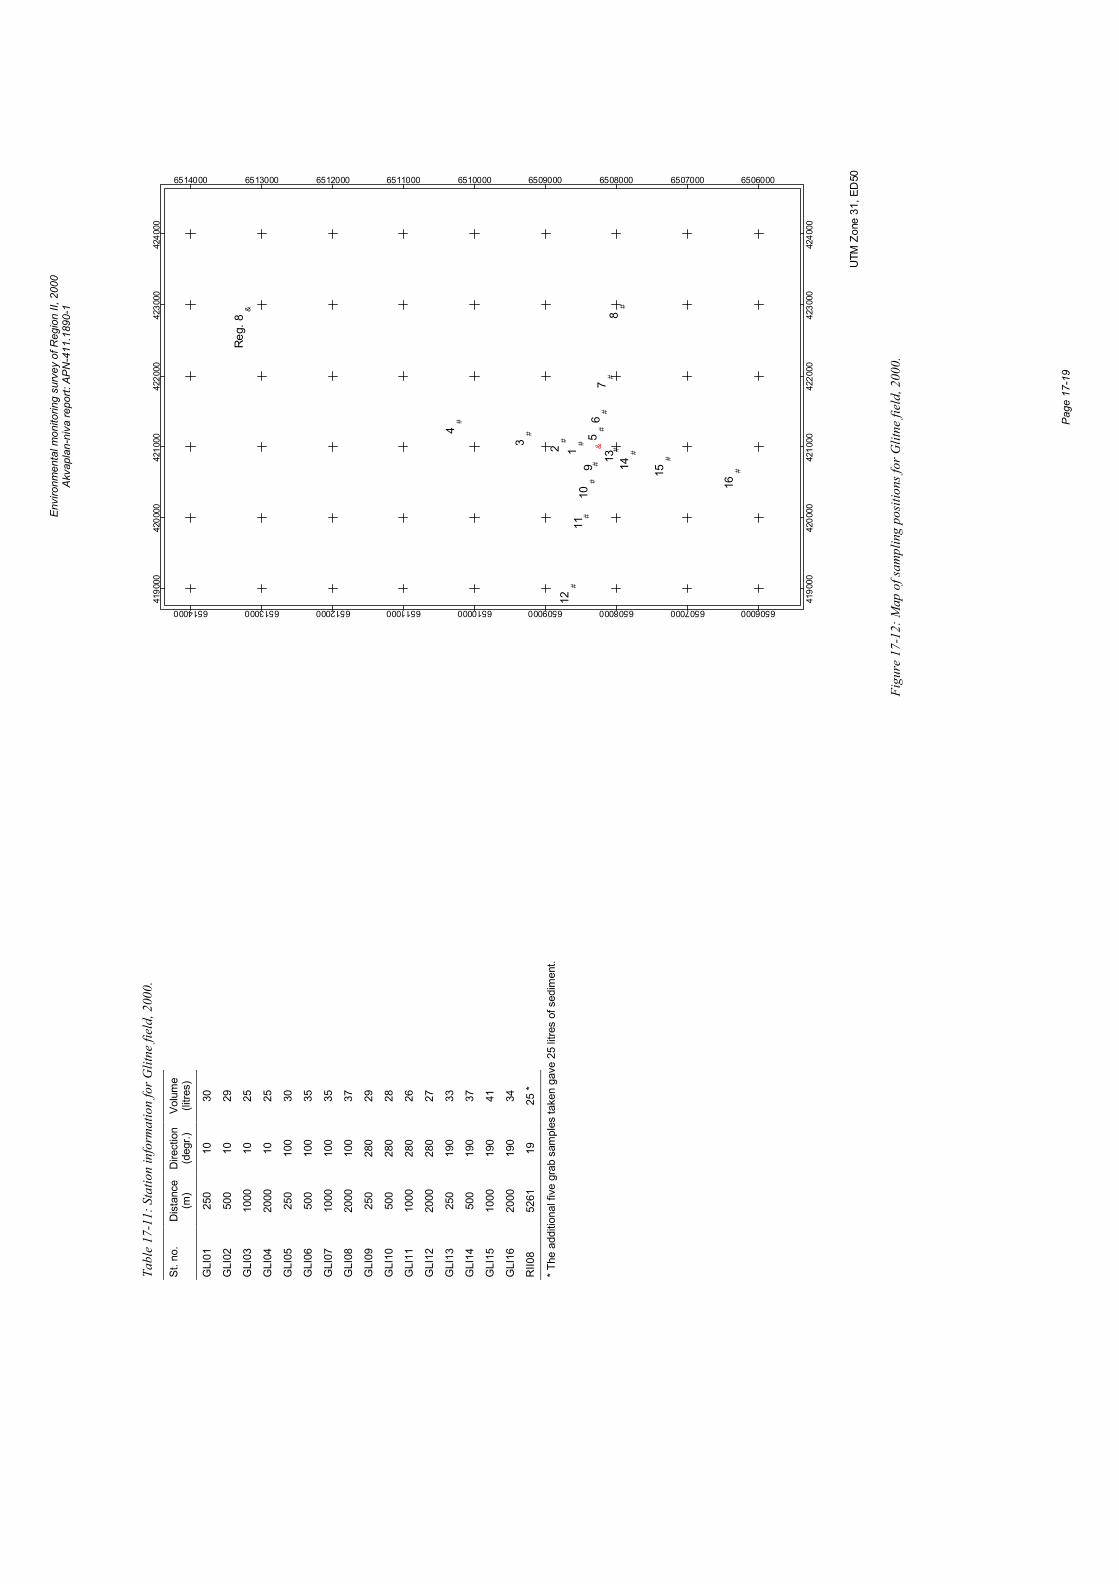
Envi
ronm
enta
l mon
itorin
g su
rvey
of R
egio
n II,
200
0 Ak
vapl
an-n
iva
repo
rt: A
PN-4
11.1
890-
1
Pa
ge 1
7-19
UTM
Zon
e 31
, ED
50
&
##
#
#
##
#
#
##
#
#
# #
#
#
&
Reg.
8
3 2 1
56
78
911
1012
13 14 15
16
4
4190
00
4190
00
4200
00
4200
00
4210
00
4210
00
4220
00
4220
00
4230
00
4230
00
4240
00
4240
00
6506000
6506000
6507000
6507000
6508000
6508000
6509000
6509000
6510000
6510000
6511000
6511000
6512000
6512000
6513000
6513000
6514000
6514000
Figu
re 1
7-12
: Map
of s
ampl
ing
posit
ions
for G
litne
fiel
d, 2
000.
Tabl
e 17
-11:
Sta
tion
info
rmat
ion
for G
litne
fiel
d, 2
000.
St. n
o.
Dis
tanc
e (m
) D
irect
ion
(deg
r.)
Volu
me
(litre
s)
GLI
01
250
10
30
GLI
02
500
10
29
GLI
03
1000
10
25
GLI
04
2000
10
25
GLI
05
250
100
30
GLI
06
500
100
35
GLI
07
1000
10
0 35
GLI
08
2000
10
0 37
GLI
09
250
280
29
GLI
10
500
280
28
GLI
11
1000
28
0 26
GLI
12
2000
28
0 27
GLI
13
250
190
33
GLI
14
500
190
37
GLI
15
1000
19
0 41
GLI
16
2000
19
0 34
RII0
8 52
61
19
25 *
* The
add
ition
al fi
ve g
rab
sam
ples
take
n ga
ve 2
5 lit
res
of s
edim
ent.

Envi
ronm
enta
l mon
itorin
g su
rvey
of R
egio
n II,
200
0 Ak
vapl
an-n
iva
repo
rt: A
PN-4
11.1
890-
1
Pa
ge 1
7-20
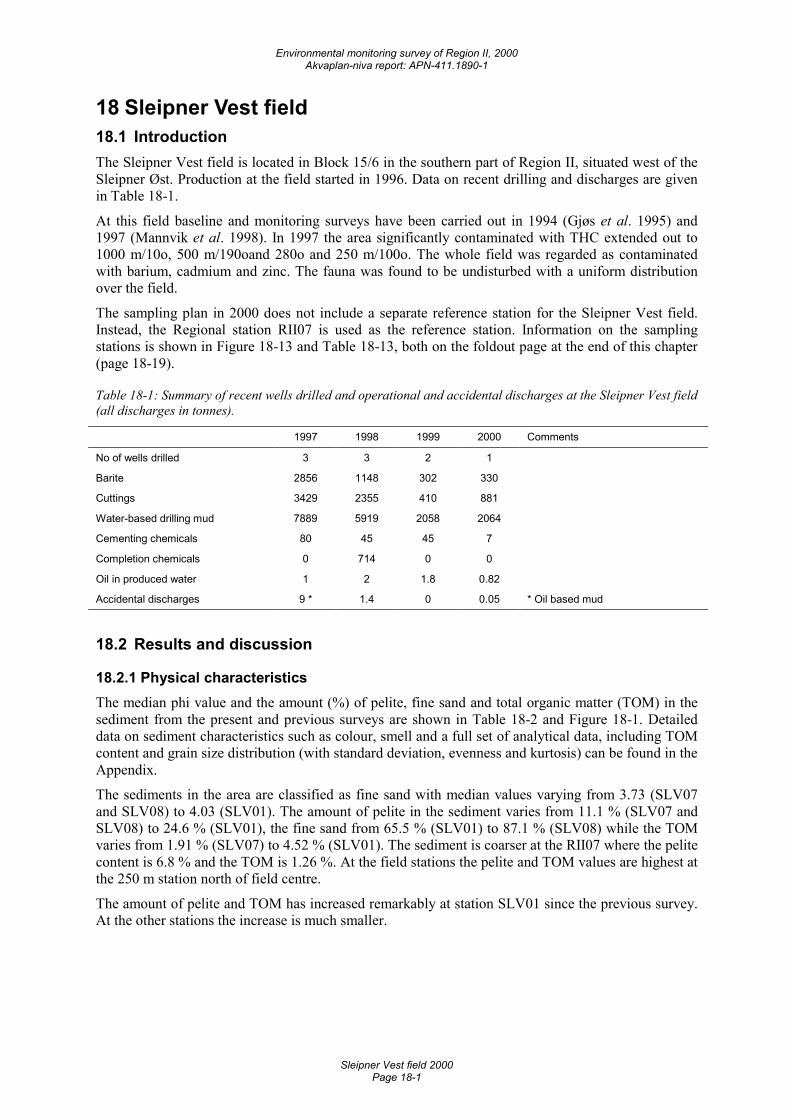
Environmental monitoring survey of Region II, 2000 Akvaplan-niva report: APN-411.1890-1
Sleipner Vest field 2000 Page 18-1
18 Sleipner Vest field 18.1 Introduction The Sleipner Vest field is located in Block 15/6 in the southern part of Region II, situated west of the Sleipner Øst. Production at the field started in 1996. Data on recent drilling and discharges are given in Table 18-1.
At this field baseline and monitoring surveys have been carried out in 1994 (Gjøs et al. 1995) and 1997 (Mannvik et al. 1998). In 1997 the area significantly contaminated with THC extended out to 1000 m/10o, 500 m/190oand 280o and 250 m/100o. The whole field was regarded as contaminated with barium, cadmium and zinc. The fauna was found to be undisturbed with a uniform distribution over the field.
The sampling plan in 2000 does not include a separate reference station for the Sleipner Vest field. Instead, the Regional station RII07 is used as the reference station. Information on the sampling stations is shown in Figure 18-13 and Table 18-13, both on the foldout page at the end of this chapter (page 18-19).
Table 18-1: Summary of recent wells drilled and operational and accidental discharges at the Sleipner Vest field (all discharges in tonnes).
1997 1998 1999 2000 Comments
No of wells drilled 3 3 2 1
Barite 2856 1148 302 330
Cuttings 3429 2355 410 881
Water-based drilling mud 7889 5919 2058 2064
Cementing chemicals 80 45 45 7
Completion chemicals 0 714 0 0
Oil in produced water 1 2 1.8 0.82
Accidental discharges 9 * 1.4 0 0.05 * Oil based mud
18.2 Results and discussion
18.2.1 Physical characteristics The median phi value and the amount (%) of pelite, fine sand and total organic matter (TOM) in the sediment from the present and previous surveys are shown in Table 18-2 and Figure 18-1. Detailed data on sediment characteristics such as colour, smell and a full set of analytical data, including TOM content and grain size distribution (with standard deviation, evenness and kurtosis) can be found in the Appendix.
The sediments in the area are classified as fine sand with median values varying from 3.73 (SLV07 and SLV08) to 4.03 (SLV01). The amount of pelite in the sediment varies from 11.1 % (SLV07 and SLV08) to 24.6 % (SLV01), the fine sand from 65.5 % (SLV01) to 87.1 % (SLV08) while the TOM varies from 1.91 % (SLV07) to 4.52 % (SLV01). The sediment is coarser at the RII07 where the pelite content is 6.8 % and the TOM is 1.26 %. At the field stations the pelite and TOM values are highest at the 250 m station north of field centre.
The amount of pelite and TOM has increased remarkably at station SLV01 since the previous survey. At the other stations the increase is much smaller.
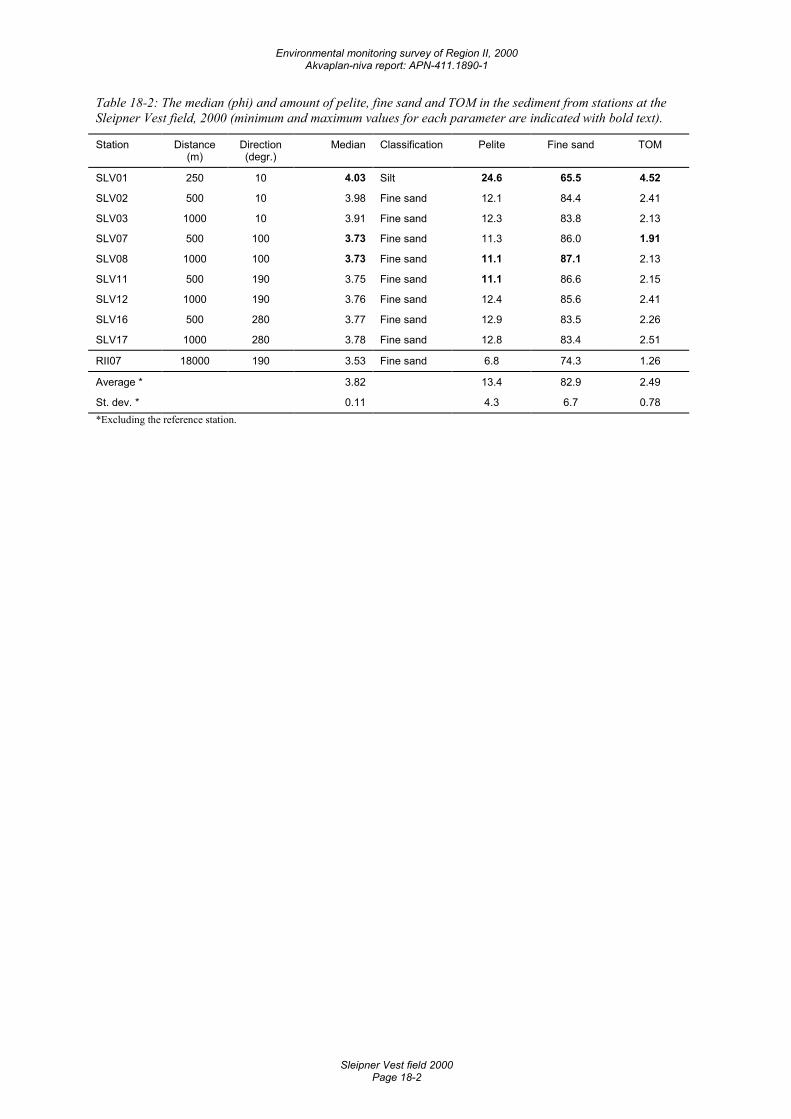
Environmental monitoring survey of Region II, 2000 Akvaplan-niva report: APN-411.1890-1
Sleipner Vest field 2000 Page 18-2
Table 18-2: The median (phi) and amount of pelite, fine sand and TOM in the sediment from stations at the Sleipner Vest field, 2000 (minimum and maximum values for each parameter are indicated with bold text).
Station Distance (m)
Direction (degr.)
Median Classification Pelite Fine sand TOM
SLV01 250 10 4.03 Silt 24.6 65.5 4.52
SLV02 500 10 3.98 Fine sand 12.1 84.4 2.41
SLV03 1000 10 3.91 Fine sand 12.3 83.8 2.13
SLV07 500 100 3.73 Fine sand 11.3 86.0 1.91
SLV08 1000 100 3.73 Fine sand 11.1 87.1 2.13
SLV11 500 190 3.75 Fine sand 11.1 86.6 2.15
SLV12 1000 190 3.76 Fine sand 12.4 85.6 2.41
SLV16 500 280 3.77 Fine sand 12.9 83.5 2.26
SLV17 1000 280 3.78 Fine sand 12.8 83.4 2.51
RII07 18000 190 3.53 Fine sand 6.8 74.3 1.26
Average * 3.82 13.4 82.9 2.49
St. dev. * 0.11 4.3 6.7 0.78 *Excluding the reference station.
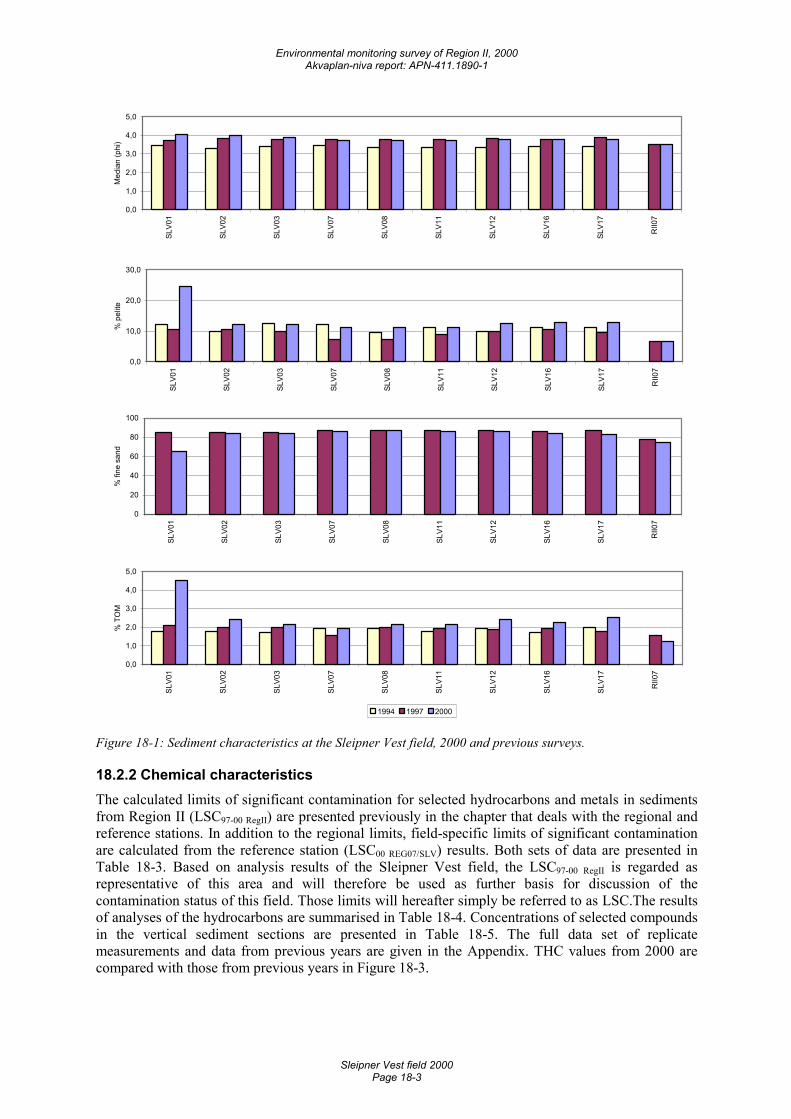
Environmental monitoring survey of Region II, 2000 Akvaplan-niva report: APN-411.1890-1
Sleipner Vest field 2000 Page 18-3
0,0
1,0
2,0
3,0
4,0
5,0
SLV0
1
SLV0
2
SLV0
3
SLV0
7
SLV0
8
SLV1
1
SLV1
2
SLV1
6
SLV1
7
RII0
7
Med
ian
(phi
)
0,0
10,0
20,0
30,0
SLV0
1
SLV0
2
SLV0
3
SLV0
7
SLV0
8
SLV1
1
SLV1
2
SLV1
6
SLV1
7
RII0
7
% p
elite
0
20
40
60
80
100
SLV0
1
SLV0
2
SLV0
3
SLV0
7
SLV0
8
SLV1
1
SLV1
2
SLV1
6
SLV1
7
RII0
7
% fi
ne s
and
0,0
1,0
2,0
3,0
4,0
5,0
SLV0
1
SLV0
2
SLV0
3
SLV0
7
SLV0
8
SLV1
1
SLV1
2
SLV1
6
SLV1
7
RII0
7
% T
OM
1994 1997 2000
Figure 18-1: Sediment characteristics at the Sleipner Vest field, 2000 and previous surveys.
18.2.2 Chemical characteristics The calculated limits of significant contamination for selected hydrocarbons and metals in sediments from Region II (LSC97-00 RegII) are presented previously in the chapter that deals with the regional and reference stations. In addition to the regional limits, field-specific limits of significant contamination are calculated from the reference station (LSC00 REG07/SLV) results. Both sets of data are presented in Table 18-3. Based on analysis results of the Sleipner Vest field, the LSC97-00 RegII is regarded as representative of this area and will therefore be used as further basis for discussion of the contamination status of this field. Those limits will hereafter simply be referred to as LSC.The results of analyses of the hydrocarbons are summarised in Table 18-4. Concentrations of selected compounds in the vertical sediment sections are presented in Table 18-5. The full data set of replicate measurements and data from previous years are given in the Appendix. THC values from 2000 are compared with those from previous years in Figure 18-3.
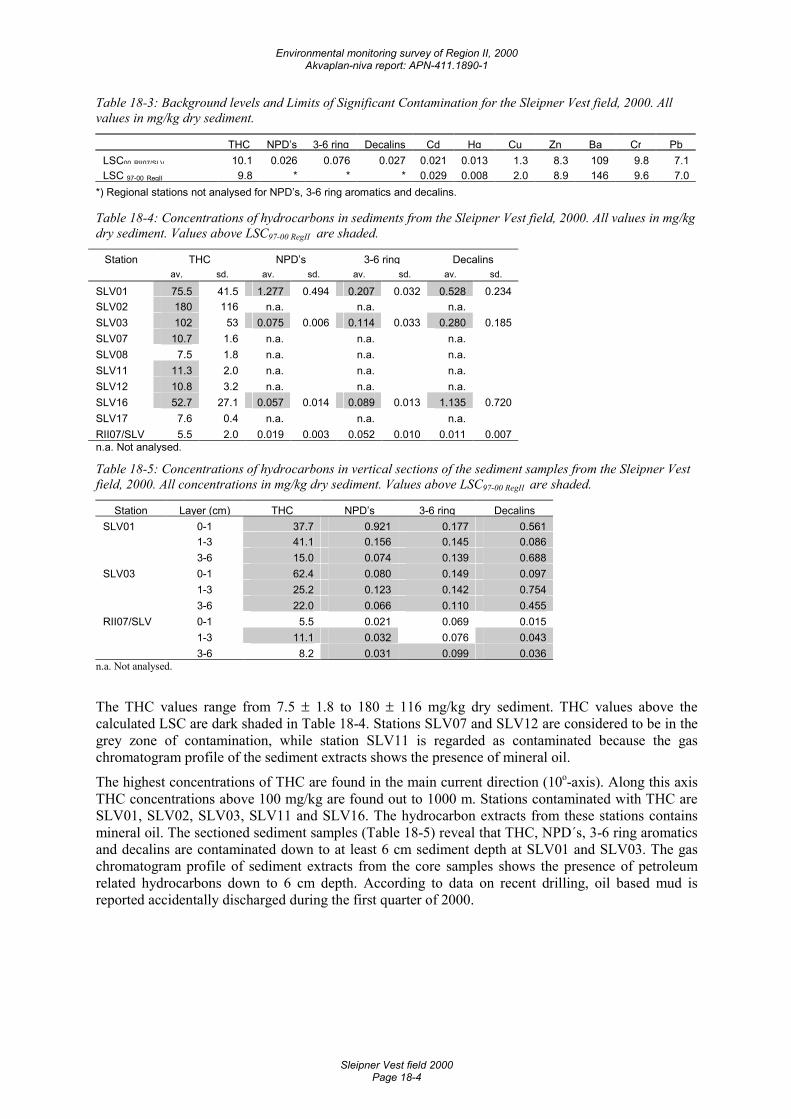
Environmental monitoring survey of Region II, 2000 Akvaplan-niva report: APN-411.1890-1
Sleipner Vest field 2000 Page 18-4
Table 18-3: Background levels and Limits of Significant Contamination for the Sleipner Vest field, 2000. All values in mg/kg dry sediment.
THC NPD’s 3-6 ring Decalins Cd Hg Cu Zn Ba Cr PbLSC00 RII07/SLV 10.1 0.026 0.076 0.027 0.021 0.013 1.3 8.3 109 9.8 7.1LSC 97-00 RegII 9.8 * * * 0.029 0.008 2.0 8.9 146 9.6 7.0
*) Regional stations not analysed for NPD’s, 3-6 ring aromatics and decalins.
Table 18-4: Concentrations of hydrocarbons in sediments from the Sleipner Vest field, 2000. All values in mg/kg dry sediment. Values above LSC97-00 RegII are shaded.
Station THC NPD’s 3-6 ring Decalins av. sd. av. sd. av. sd. av. sd.
SLV01 75.5 41.5 1.277 0.494 0.207 0.032 0.528 0.234SLV02 180 116 n.a. n.a. n.a.SLV03 102 53 0.075 0.006 0.114 0.033 0.280 0.185SLV07 10.7 1.6 n.a. n.a. n.a.SLV08 7.5 1.8 n.a. n.a. n.a.SLV11 11.3 2.0 n.a. n.a. n.a.SLV12 10.8 3.2 n.a. n.a. n.a.SLV16 52.7 27.1 0.057 0.014 0.089 0.013 1.135 0.720SLV17 7.6 0.4 n.a. n.a. n.a.RII07/SLV 5.5 2.0 0.019 0.003 0.052 0.010 0.011 0.007n.a. Not analysed.
Table 18-5: Concentrations of hydrocarbons in vertical sections of the sediment samples from the Sleipner Vest field, 2000. All concentrations in mg/kg dry sediment. Values above LSC97-00 RegII are shaded.
Station Layer (cm) THC NPD’s 3-6 ring DecalinsSLV01 0-1 37.7 0.921 0.177 0.561 1-3 41.1 0.156 0.145 0.086 3-6 15.0 0.074 0.139 0.688SLV03 0-1 62.4 0.080 0.149 0.097 1-3 25.2 0.123 0.142 0.754 3-6 22.0 0.066 0.110 0.455RII07/SLV 0-1 5.5 0.021 0.069 0.015 1-3 11.1 0.032 0.076 0.043 3-6 8.2 0.031 0.099 0.036
n.a. Not analysed.
The THC values range from 7.5 ± 1.8 to 180 ± 116 mg/kg dry sediment. THC values above the calculated LSC are dark shaded in Table 18-4. Stations SLV07 and SLV12 are considered to be in the grey zone of contamination, while station SLV11 is regarded as contaminated because the gas chromatogram profile of the sediment extracts shows the presence of mineral oil.
The highest concentrations of THC are found in the main current direction (10o-axis). Along this axis THC concentrations above 100 mg/kg are found out to 1000 m. Stations contaminated with THC are SLV01, SLV02, SLV03, SLV11 and SLV16. The hydrocarbon extracts from these stations contains mineral oil. The sectioned sediment samples (Table 18-5) reveal that THC, NPD´s, 3-6 ring aromatics and decalins are contaminated down to at least 6 cm sediment depth at SLV01 and SLV03. The gas chromatogram profile of sediment extracts from the core samples shows the presence of petroleum related hydrocarbons down to 6 cm depth. According to data on recent drilling, oil based mud is reported accidentally discharged during the first quarter of 2000.
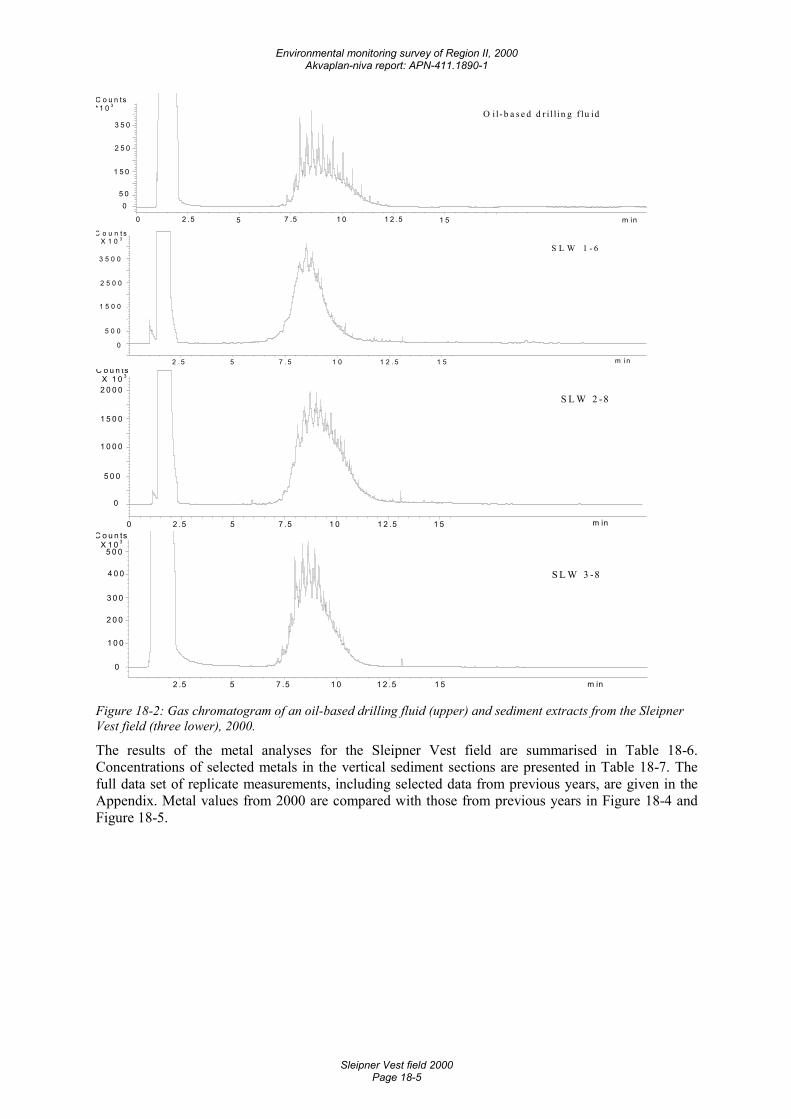
Environmental monitoring survey of Region II, 2000 Akvaplan-niva report: APN-411.1890-1
Sleipner Vest field 2000 Page 18-5
m in 0 2 .5 5 7 .5 1 0 1 2 .5 1 5
C o u n ts* 1 0 3
0 5 0
1 5 0
2 5 0
3 5 0O il- b a s e d d r i l l in g f lu id
m in 2 . 5 5 7 . 5 1 0 1 2 . 5 1 5
C o u n t s X 1 0 3
0
5 0 0
1 5 0 0
2 5 0 0
3 5 0 0S L W 1 - 6
m in 0 2 .5 5 7 .5 1 0 1 2 .5 1 5
C o u n ts X 1 0 3
0
5 0 0
1 0 0 0
1 5 0 0
2 0 0 0S L W 2 -8
m in 2 .5 5 7 .5 1 0 1 2 .5 1 5
C o u n ts X 1 0 3
0
1 0 0
2 0 0
3 0 0
4 0 0
5 0 0
S L W 3 -8
Figure 18-2: Gas chromatogram of an oil-based drilling fluid (upper) and sediment extracts from the Sleipner Vest field (three lower), 2000.
The results of the metal analyses for the Sleipner Vest field are summarised in Table 18-6. Concentrations of selected metals in the vertical sediment sections are presented in Table 18-7. The full data set of replicate measurements, including selected data from previous years, are given in the Appendix. Metal values from 2000 are compared with those from previous years in Figure 18-4 and Figure 18-5.
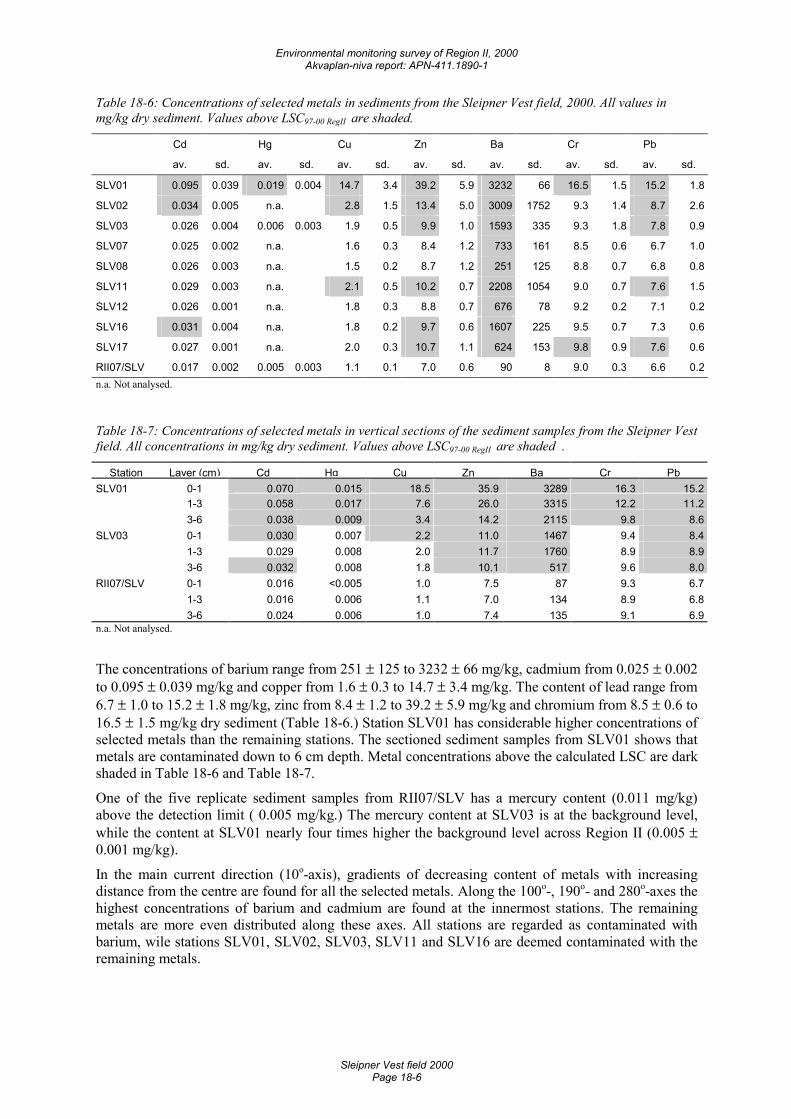
Environmental monitoring survey of Region II, 2000 Akvaplan-niva report: APN-411.1890-1
Sleipner Vest field 2000 Page 18-6
Table 18-6: Concentrations of selected metals in sediments from the Sleipner Vest field, 2000. All values in mg/kg dry sediment. Values above LSC97-00 RegII are shaded.
Cd Hg Cu Zn Ba Cr Pb
av. sd. av. sd. av. sd. av. sd. av. sd. av. sd. av. sd.
SLV01 0.095 0.039 0.019 0.004 14.7 3.4 39.2 5.9 3232 66 16.5 1.5 15.2 1.8
SLV02 0.034 0.005 n.a. 2.8 1.5 13.4 5.0 3009 1752 9.3 1.4 8.7 2.6
SLV03 0.026 0.004 0.006 0.003 1.9 0.5 9.9 1.0 1593 335 9.3 1.8 7.8 0.9
SLV07 0.025 0.002 n.a. 1.6 0.3 8.4 1.2 733 161 8.5 0.6 6.7 1.0
SLV08 0.026 0.003 n.a. 1.5 0.2 8.7 1.2 251 125 8.8 0.7 6.8 0.8
SLV11 0.029 0.003 n.a. 2.1 0.5 10.2 0.7 2208 1054 9.0 0.7 7.6 1.5
SLV12 0.026 0.001 n.a. 1.8 0.3 8.8 0.7 676 78 9.2 0.2 7.1 0.2
SLV16 0.031 0.004 n.a. 1.8 0.2 9.7 0.6 1607 225 9.5 0.7 7.3 0.6
SLV17 0.027 0.001 n.a. 2.0 0.3 10.7 1.1 624 153 9.8 0.9 7.6 0.6
RII07/SLV 0.017 0.002 0.005 0.003 1.1 0.1 7.0 0.6 90 8 9.0 0.3 6.6 0.2n.a. Not analysed.
Table 18-7: Concentrations of selected metals in vertical sections of the sediment samples from the Sleipner Vest field. All concentrations in mg/kg dry sediment. Values above LSC97-00 RegII are shaded .
Station Layer (cm) Cd Hg Cu Zn Ba Cr PbSLV01 0-1 0.070 0.015 18.5 35.9 3289 16.3 15.2 1-3 0.058 0.017 7.6 26.0 3315 12.2 11.2 3-6 0.038 0.009 3.4 14.2 2115 9.8 8.6SLV03 0-1 0.030 0.007 2.2 11.0 1467 9.4 8.4 1-3 0.029 0.008 2.0 11.7 1760 8.9 8.9 3-6 0.032 0.008 1.8 10.1 517 9.6 8.0RII07/SLV 0-1 0.016 <0.005 1.0 7.5 87 9.3 6.7 1-3 0.016 0.006 1.1 7.0 134 8.9 6.8 3-6 0.024 0.006 1.0 7.4 135 9.1 6.9n.a. Not analysed.
The concentrations of barium range from 251 ± 125 to 3232 ± 66 mg/kg, cadmium from 0.025 ± 0.002 to 0.095 ± 0.039 mg/kg and copper from 1.6 ± 0.3 to 14.7 ± 3.4 mg/kg. The content of lead range from 6.7 ± 1.0 to 15.2 ± 1.8 mg/kg, zinc from 8.4 ± 1.2 to 39.2 ± 5.9 mg/kg and chromium from 8.5 ± 0.6 to 16.5 ± 1.5 mg/kg dry sediment (Table 18-6.) Station SLV01 has considerable higher concentrations of selected metals than the remaining stations. The sectioned sediment samples from SLV01 shows that metals are contaminated down to 6 cm depth. Metal concentrations above the calculated LSC are dark shaded in Table 18-6 and Table 18-7.
One of the five replicate sediment samples from RII07/SLV has a mercury content (0.011 mg/kg) above the detection limit ( 0.005 mg/kg.) The mercury content at SLV03 is at the background level, while the content at SLV01 nearly four times higher the background level across Region II (0.005 ± 0.001 mg/kg).
In the main current direction (10o-axis), gradients of decreasing content of metals with increasing distance from the centre are found for all the selected metals. Along the 100o-, 190o- and 280o-axes the highest concentrations of barium and cadmium are found at the innermost stations. The remaining metals are more even distributed along these axes. All stations are regarded as contaminated with barium, wile stations SLV01, SLV02, SLV03, SLV11 and SLV16 are deemed contaminated with the remaining metals.
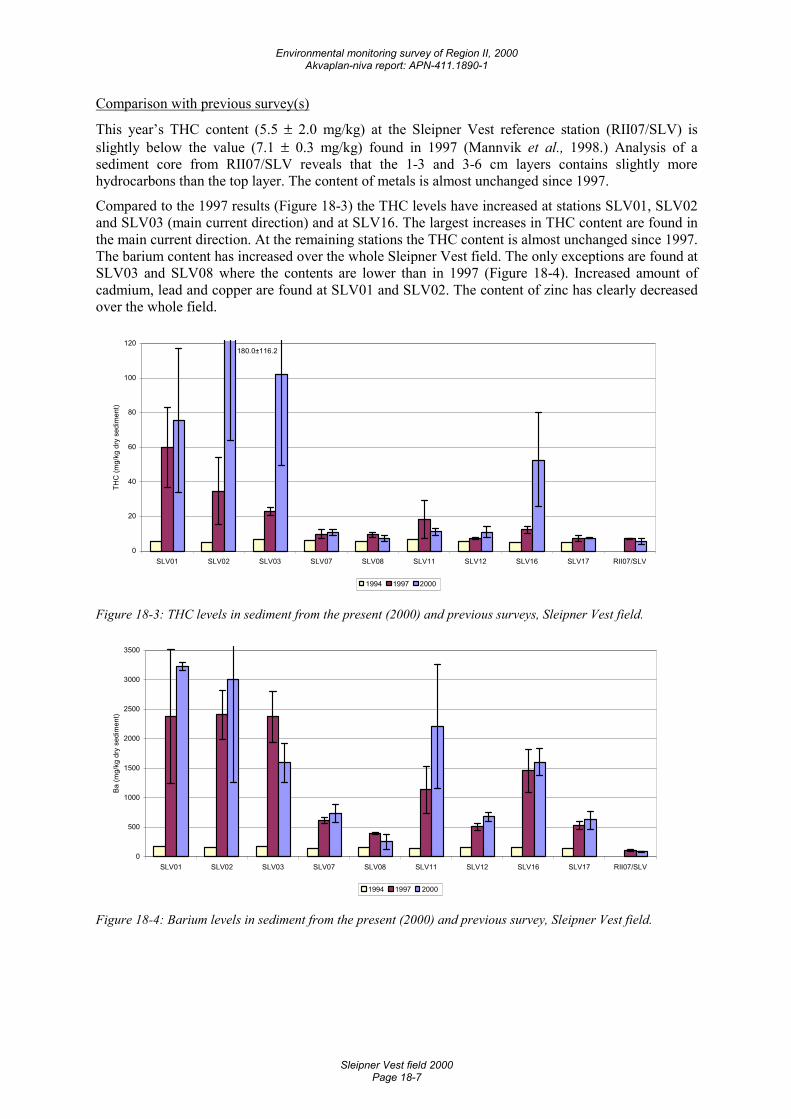
Environmental monitoring survey of Region II, 2000 Akvaplan-niva report: APN-411.1890-1
Sleipner Vest field 2000 Page 18-7
Comparison with previous survey(s)
This year’s THC content (5.5 ± 2.0 mg/kg) at the Sleipner Vest reference station (RII07/SLV) is slightly below the value (7.1 ± 0.3 mg/kg) found in 1997 (Mannvik et al., 1998.) Analysis of a sediment core from RII07/SLV reveals that the 1-3 and 3-6 cm layers contains slightly more hydrocarbons than the top layer. The content of metals is almost unchanged since 1997.
Compared to the 1997 results (Figure 18-3) the THC levels have increased at stations SLV01, SLV02 and SLV03 (main current direction) and at SLV16. The largest increases in THC content are found in the main current direction. At the remaining stations the THC content is almost unchanged since 1997. The barium content has increased over the whole Sleipner Vest field. The only exceptions are found at SLV03 and SLV08 where the contents are lower than in 1997 (Figure 18-4). Increased amount of cadmium, lead and copper are found at SLV01 and SLV02. The content of zinc has clearly decreased over the whole field.
180.0±116.2
0
20
40
60
80
100
120
SLV01 SLV02 SLV03 SLV07 SLV08 SLV11 SLV12 SLV16 SLV17 RII07/SLV
THC
(mg/
kg d
ry s
edim
ent)
1994 1997 2000
Figure 18-3: THC levels in sediment from the present (2000) and previous surveys, Sleipner Vest field.
0
500
1000
1500
2000
2500
3000
3500
SLV01 SLV02 SLV03 SLV07 SLV08 SLV11 SLV12 SLV16 SLV17 RII07/SLV
Ba (m
g/kg
dry
sed
imen
t)
1994 1997 2000
Figure 18-4: Barium levels in sediment from the present (2000) and previous survey, Sleipner Vest field.
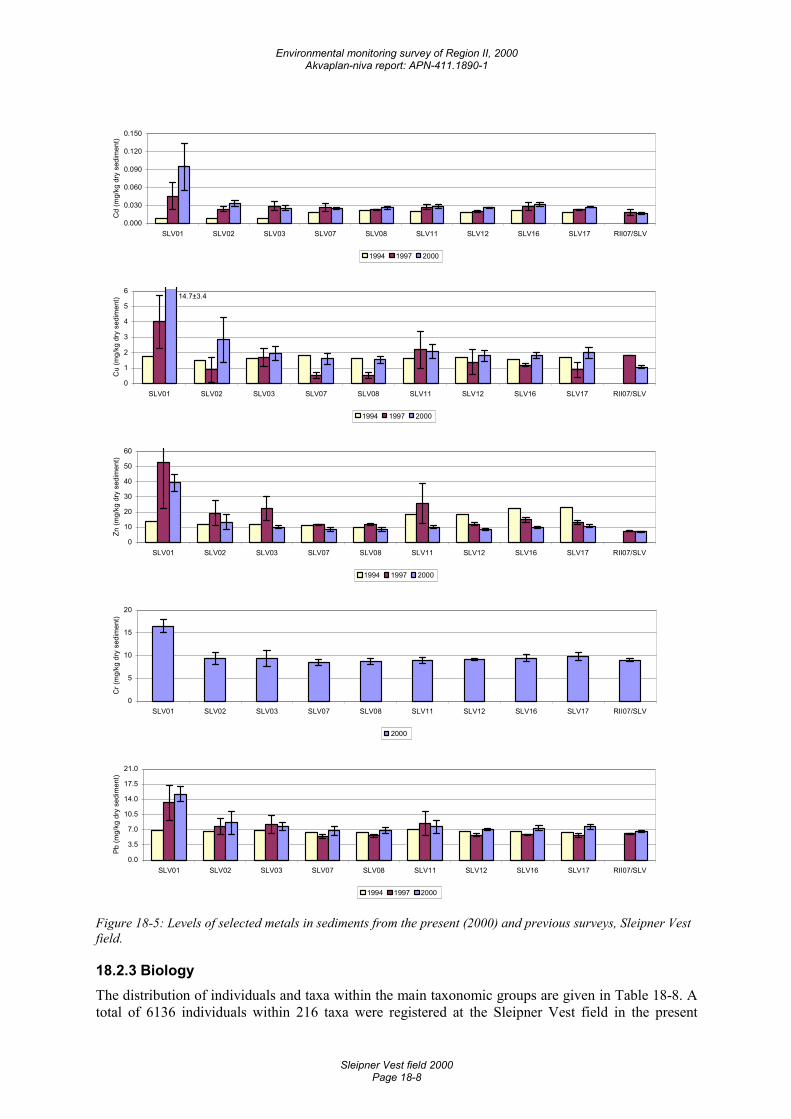
Environmental monitoring survey of Region II, 2000 Akvaplan-niva report: APN-411.1890-1
Sleipner Vest field 2000 Page 18-8
0.000
0.030
0.060
0.090
0.120
0.150
SLV01 SLV02 SLV03 SLV07 SLV08 SLV11 SLV12 SLV16 SLV17 RII07/SLV
Cd
(mg/
kg d
ry s
edim
ent)
1994 1997 2000
14.7±3.4
0
1
2
3
4
5
6
SLV01 SLV02 SLV03 SLV07 SLV08 SLV11 SLV12 SLV16 SLV17 RII07/SLV
Cu
(mg/
kg d
ry s
edim
ent)
1994 1997 2000
0
10
20
30
40
50
60
SLV01 SLV02 SLV03 SLV07 SLV08 SLV11 SLV12 SLV16 SLV17 RII07/SLV
Zn (m
g/kg
dry
sed
imen
t)
1994 1997 2000
0
5
10
15
20
SLV01 SLV02 SLV03 SLV07 SLV08 SLV11 SLV12 SLV16 SLV17 RII07/SLV
Cr (
mg/
kg d
ry s
edim
ent)
2000
0.0
3.5
7.0
10.5
14.0
17.5
21.0
SLV01 SLV02 SLV03 SLV07 SLV08 SLV11 SLV12 SLV16 SLV17 RII07/SLV
Pb (m
g/kg
dry
sed
imen
t)
1994 1997 2000
Figure 18-5: Levels of selected metals in sediments from the present (2000) and previous surveys, Sleipner Vest field.
18.2.3 Biology The distribution of individuals and taxa within the main taxonomic groups are given in Table 18-8. A total of 6136 individuals within 216 taxa were registered at the Sleipner Vest field in the present
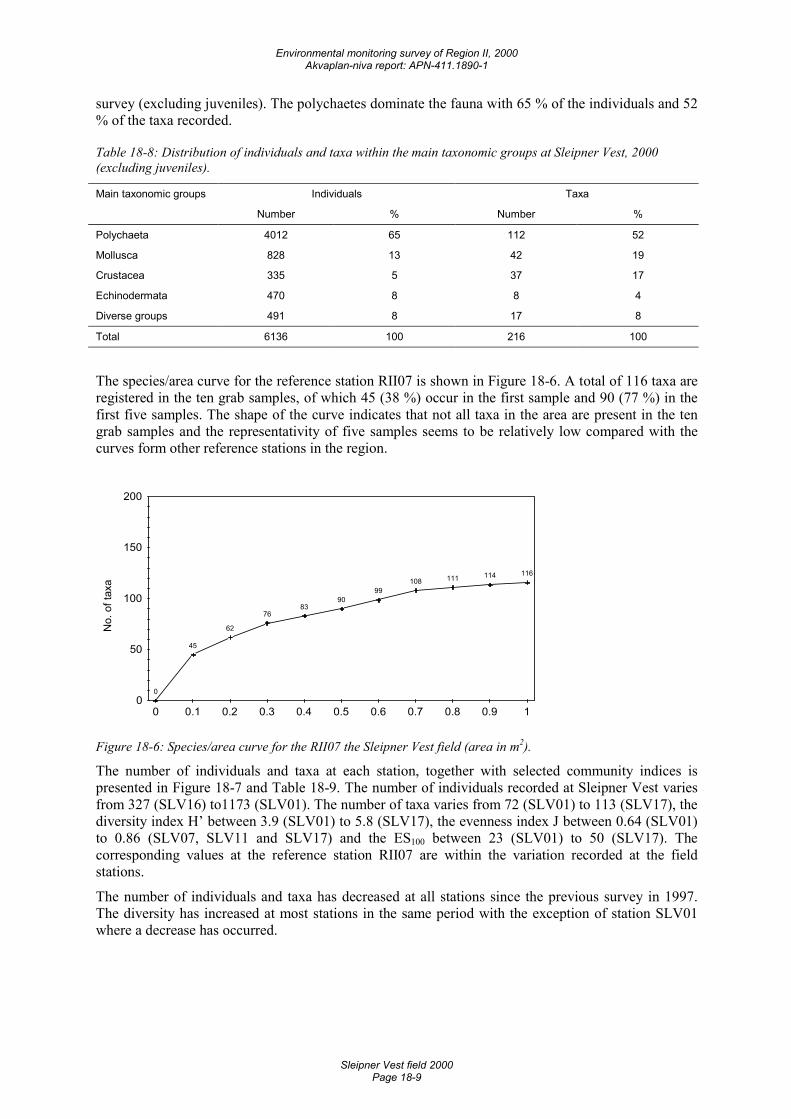
Environmental monitoring survey of Region II, 2000 Akvaplan-niva report: APN-411.1890-1
Sleipner Vest field 2000 Page 18-9
survey (excluding juveniles). The polychaetes dominate the fauna with 65 % of the individuals and 52 % of the taxa recorded.
Table 18-8: Distribution of individuals and taxa within the main taxonomic groups at Sleipner Vest, 2000 (excluding juveniles).
Main taxonomic groups Individuals Taxa
Number % Number %
Polychaeta 4012 65 112 52
Mollusca 828 13 42 19
Crustacea 335 5 37 17
Echinodermata 470 8 8 4
Diverse groups 491 8 17 8
Total 6136 100 216 100
The species/area curve for the reference station RII07 is shown in Figure 18-6. A total of 116 taxa are registered in the ten grab samples, of which 45 (38 %) occur in the first sample and 90 (77 %) in the first five samples. The shape of the curve indicates that not all taxa in the area are present in the ten grab samples and the representativity of five samples seems to be relatively low compared with the curves form other reference stations in the region.
No.
of t
axa
0
45
62
7683
9099
108 111 114 116
0
50
100
150
200
0 0.1 0.2 0.3 0.4 0.5 0.6 0.7 0.8 0.9 1
Figure 18-6: Species/area curve for the RII07 the Sleipner Vest field (area in m2).
The number of individuals and taxa at each station, together with selected community indices is presented in Figure 18-7 and Table 18-9. The number of individuals recorded at Sleipner Vest varies from 327 (SLV16) to1173 (SLV01). The number of taxa varies from 72 (SLV01) to 113 (SLV17), the diversity index H’ between 3.9 (SLV01) to 5.8 (SLV17), the evenness index J between 0.64 (SLV01) to 0.86 (SLV07, SLV11 and SLV17) and the ES100 between 23 (SLV01) to 50 (SLV17). The corresponding values at the reference station RII07 are within the variation recorded at the field stations.
The number of individuals and taxa has decreased at all stations since the previous survey in 1997. The diversity has increased at most stations in the same period with the exception of station SLV01 where a decrease has occurred.
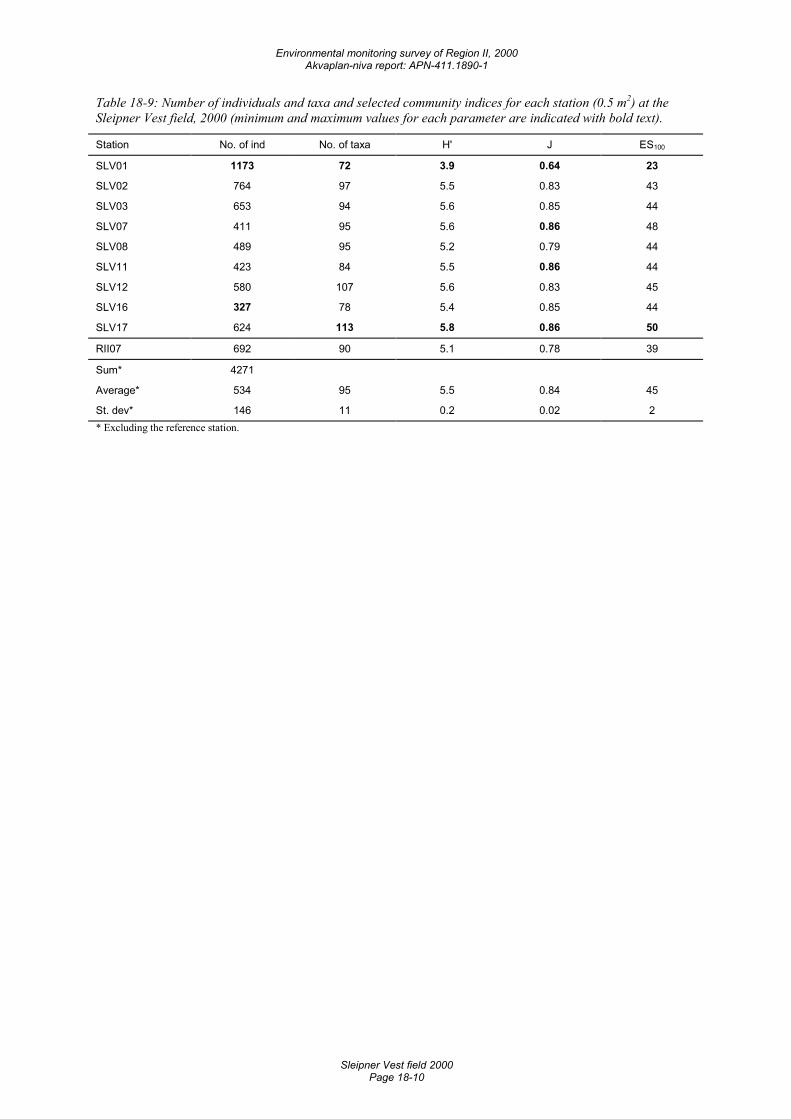
Environmental monitoring survey of Region II, 2000 Akvaplan-niva report: APN-411.1890-1
Sleipner Vest field 2000 Page 18-10
Table 18-9: Number of individuals and taxa and selected community indices for each station (0.5 m2) at the Sleipner Vest field, 2000 (minimum and maximum values for each parameter are indicated with bold text).
Station No. of ind No. of taxa H' J ES100
SLV01 1173 72 3.9 0.64 23
SLV02 764 97 5.5 0.83 43
SLV03 653 94 5.6 0.85 44
SLV07 411 95 5.6 0.86 48
SLV08 489 95 5.2 0.79 44
SLV11 423 84 5.5 0.86 44
SLV12 580 107 5.6 0.83 45
SLV16 327 78 5.4 0.85 44
SLV17 624 113 5.8 0.86 50
RII07 692 90 5.1 0.78 39
Sum* 4271
Average* 534 95 5.5 0.84 45
St. dev* 146 11 0.2 0.02 2 * Excluding the reference station.
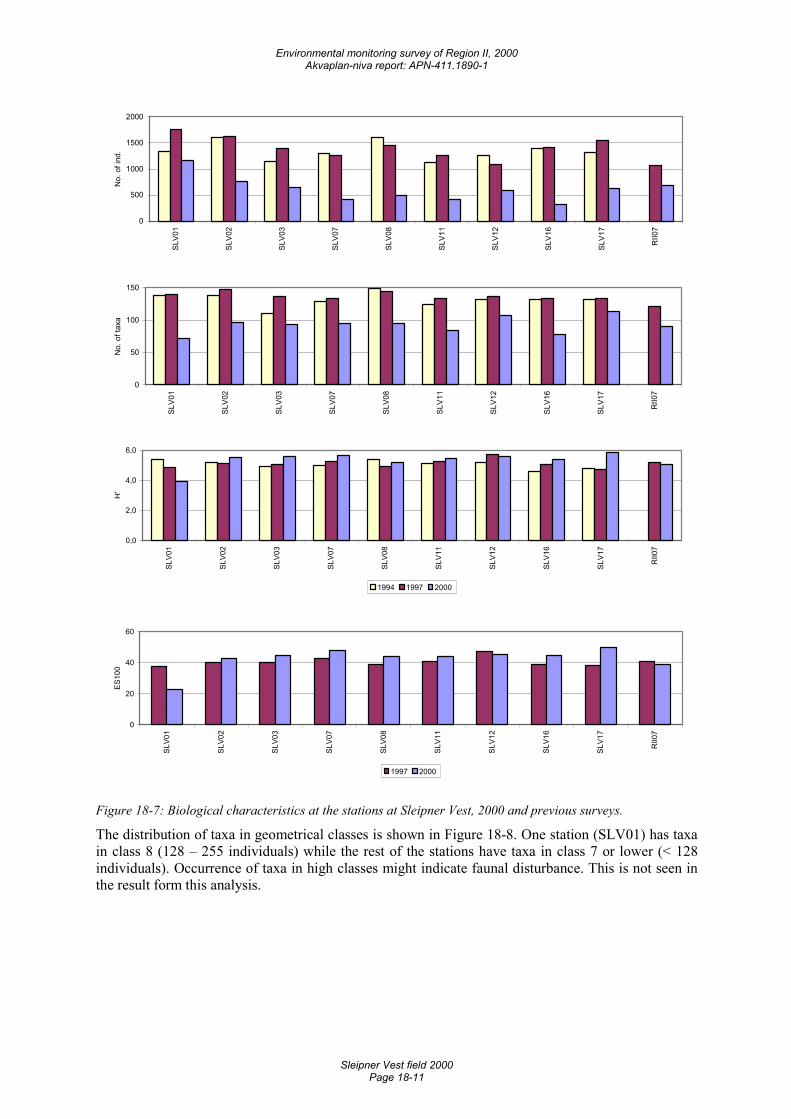
Environmental monitoring survey of Region II, 2000 Akvaplan-niva report: APN-411.1890-1
Sleipner Vest field 2000 Page 18-11
0
500
1000
1500
2000
SLV0
1
SLV0
2
SLV0
3
SLV0
7
SLV0
8
SLV1
1
SLV1
2
SLV1
6
SLV1
7
RII0
7
No.
of i
nd.
0
50
100
150
SLV0
1
SLV0
2
SLV0
3
SLV0
7
SLV0
8
SLV1
1
SLV1
2
SLV1
6
SLV1
7
RII0
7
No.
of t
axa
0,0
2,0
4,0
6,0
SLV0
1
SLV0
2
SLV0
3
SLV0
7
SLV0
8
SLV1
1
SLV1
2
SLV1
6
SLV1
7
RII0
7
H'
1994 1997 2000
0
20
40
60
SLV0
1
SLV0
2
SLV0
3
SLV0
7
SLV0
8
SLV1
1
SLV1
2
SLV1
6
SLV1
7
RII0
7
ES10
0
1997 2000
Figure 18-7: Biological characteristics at the stations at Sleipner Vest, 2000 and previous surveys.
The distribution of taxa in geometrical classes is shown in Figure 18-8. One station (SLV01) has taxa in class 8 (128 – 255 individuals) while the rest of the stations have taxa in class 7 or lower (< 128 individuals). Occurrence of taxa in high classes might indicate faunal disturbance. This is not seen in the result form this analysis.
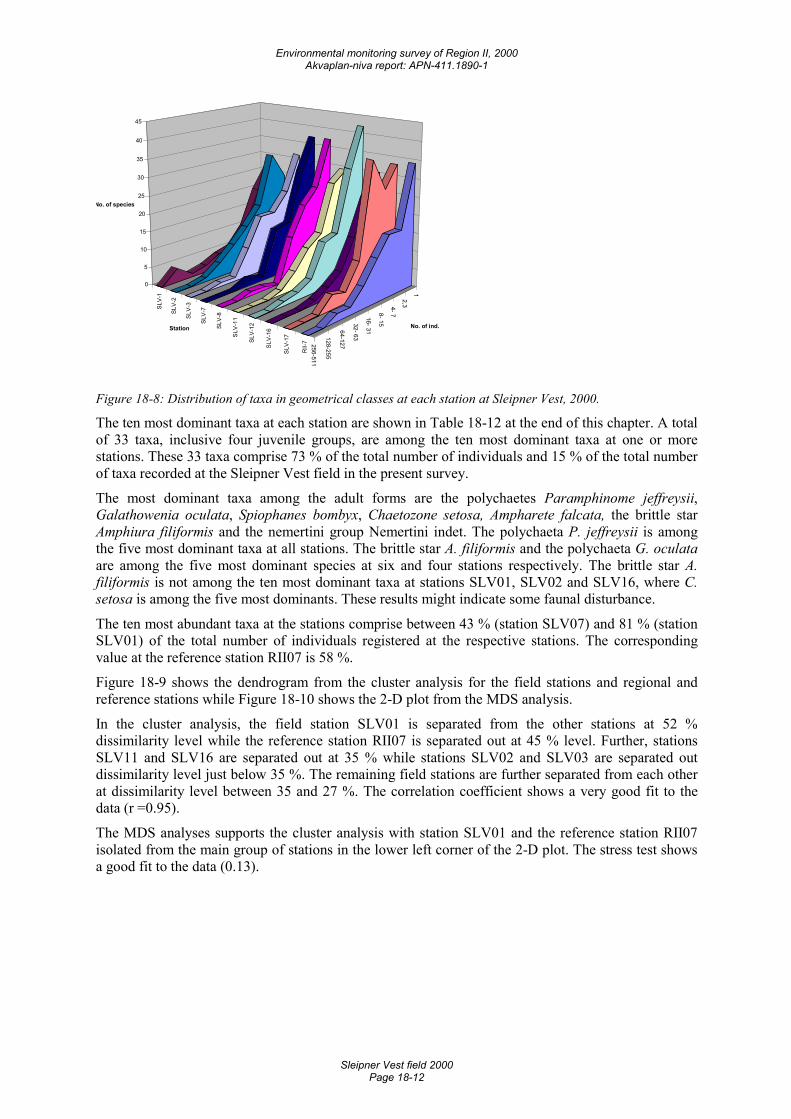
Environmental monitoring survey of Region II, 2000 Akvaplan-niva report: APN-411.1890-1
Sleipner Vest field 2000 Page 18-12
1
2,3 4- 7 8- 15
16- 31
32- 63
64-127
128-255
256-511
SLV-
1
SLV-
2
SLV-
3
SLV-
7
SLV-
8
SLV-
11
SLV-
12
SLV-
16
SLV-
17
RII-
7
0
5
10
15
20
25
30
35
40
45
No. of species
No. of ind.Station
Figure 18-8: Distribution of taxa in geometrical classes at each station at Sleipner Vest, 2000.
The ten most dominant taxa at each station are shown in Table 18-12 at the end of this chapter. A total of 33 taxa, inclusive four juvenile groups, are among the ten most dominant taxa at one or more stations. These 33 taxa comprise 73 % of the total number of individuals and 15 % of the total number of taxa recorded at the Sleipner Vest field in the present survey.
The most dominant taxa among the adult forms are the polychaetes Paramphinome jeffreysii, Galathowenia oculata, Spiophanes bombyx, Chaetozone setosa, Ampharete falcata, the brittle star Amphiura filiformis and the nemertini group Nemertini indet. The polychaeta P. jeffreysii is among the five most dominant taxa at all stations. The brittle star A. filiformis and the polychaeta G. oculata are among the five most dominant species at six and four stations respectively. The brittle star A. filiformis is not among the ten most dominant taxa at stations SLV01, SLV02 and SLV16, where C. setosa is among the five most dominants. These results might indicate some faunal disturbance.
The ten most abundant taxa at the stations comprise between 43 % (station SLV07) and 81 % (station SLV01) of the total number of individuals registered at the respective stations. The corresponding value at the reference station RII07 is 58 %.
Figure 18-9 shows the dendrogram from the cluster analysis for the field stations and regional and reference stations while Figure 18-10 shows the 2-D plot from the MDS analysis.
In the cluster analysis, the field station SLV01 is separated from the other stations at 52 % dissimilarity level while the reference station RII07 is separated out at 45 % level. Further, stations SLV11 and SLV16 are separated out at 35 % while stations SLV02 and SLV03 are separated out dissimilarity level just below 35 %. The remaining field stations are further separated from each other at dissimilarity level between 35 and 27 %. The correlation coefficient shows a very good fit to the data (r =0.95).
The MDS analyses supports the cluster analysis with station SLV01 and the reference station RII07 isolated from the main group of stations in the lower left corner of the 2-D plot. The stress test shows a good fit to the data (0.13).
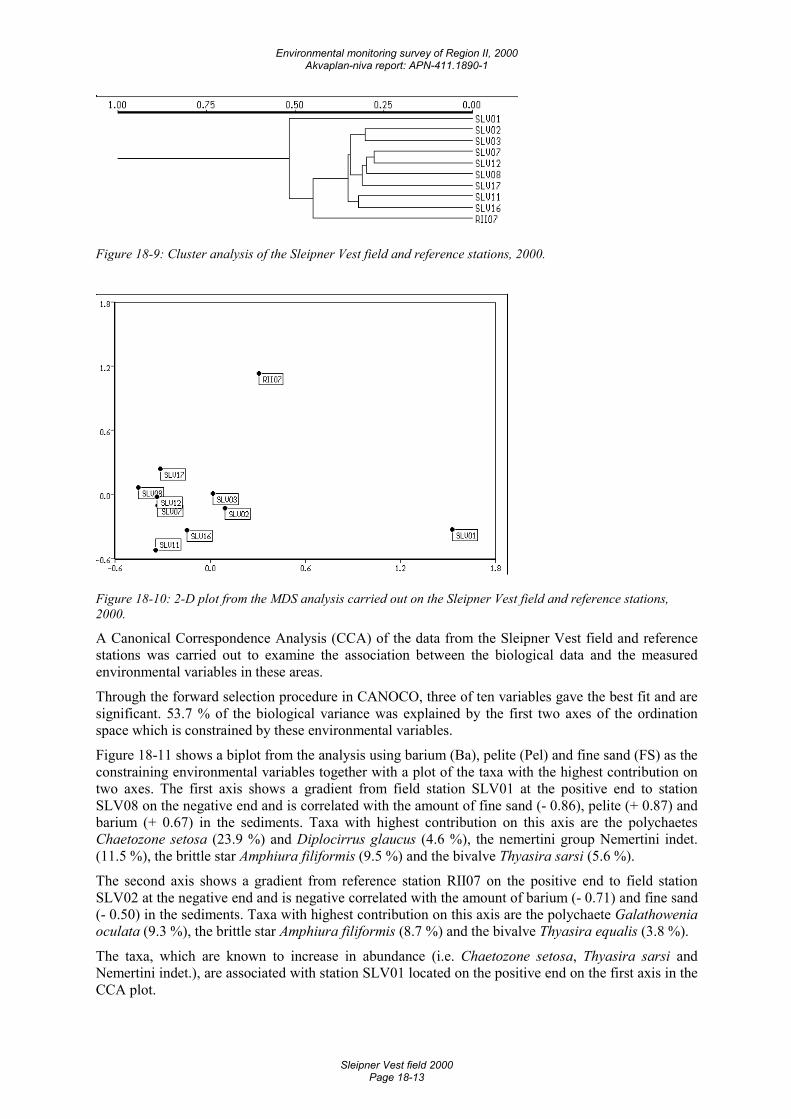
Environmental monitoring survey of Region II, 2000 Akvaplan-niva report: APN-411.1890-1
Sleipner Vest field 2000 Page 18-13
Figure 18-9: Cluster analysis of the Sleipner Vest field and reference stations, 2000.
Figure 18-10: 2-D plot from the MDS analysis carried out on the Sleipner Vest field and reference stations, 2000.
A Canonical Correspondence Analysis (CCA) of the data from the Sleipner Vest field and reference stations was carried out to examine the association between the biological data and the measured environmental variables in these areas.
Through the forward selection procedure in CANOCO, three of ten variables gave the best fit and are significant. 53.7 % of the biological variance was explained by the first two axes of the ordination space which is constrained by these environmental variables.
Figure 18-11 shows a biplot from the analysis using barium (Ba), pelite (Pel) and fine sand (FS) as the constraining environmental variables together with a plot of the taxa with the highest contribution on two axes. The first axis shows a gradient from field station SLV01 at the positive end to station SLV08 on the negative end and is correlated with the amount of fine sand (- 0.86), pelite (+ 0.87) and barium (+ 0.67) in the sediments. Taxa with highest contribution on this axis are the polychaetes Chaetozone setosa (23.9 %) and Diplocirrus glaucus (4.6 %), the nemertini group Nemertini indet. (11.5 %), the brittle star Amphiura filiformis (9.5 %) and the bivalve Thyasira sarsi (5.6 %).
The second axis shows a gradient from reference station RII07 on the positive end to field station SLV02 at the negative end and is negative correlated with the amount of barium (- 0.71) and fine sand (- 0.50) in the sediments. Taxa with highest contribution on this axis are the polychaete Galathowenia oculata (9.3 %), the brittle star Amphiura filiformis (8.7 %) and the bivalve Thyasira equalis (3.8 %).
The taxa, which are known to increase in abundance (i.e. Chaetozone setosa, Thyasira sarsi and Nemertini indet.), are associated with station SLV01 located on the positive end on the first axis in the CCA plot.
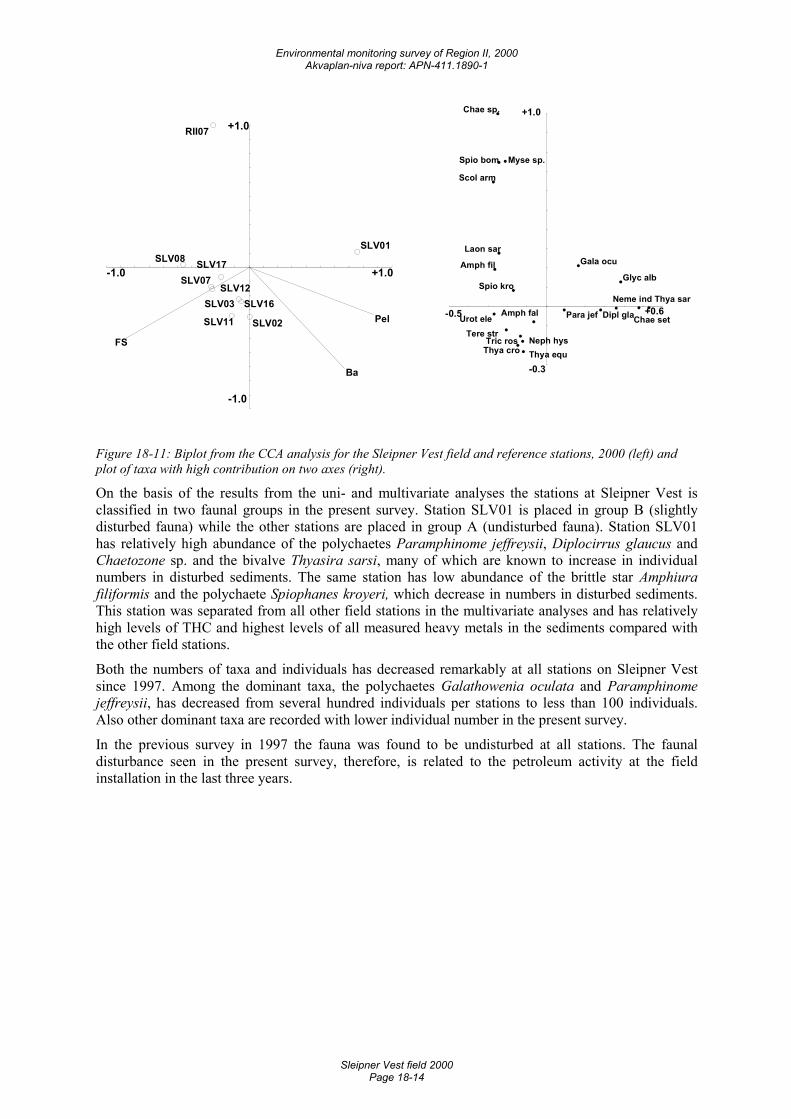
Environmental monitoring survey of Region II, 2000 Akvaplan-niva report: APN-411.1890-1
Sleipner Vest field 2000 Page 18-14
-1.0 +1.0
-1.0
+1.0
Pel
FS
Ba
SLV01SLV08
SLV07SLV12
SLV17
SLV11
SLV03 SLV16
SLV02
RII07
-0.5 +0.6
-0.3
+1.0
Thya sar
Chae set
Glyc alb
Neme ind
Dipl gla
Scol arm
Urot ele
Amph fil
Chae sp.
Spio bom
Laon sar
Myse sp.
Tere str
Spio kro
Gala ocu
Thya croTric ros Neph hys
Thya equ
Para jefAmph fal
Figure 18-11: Biplot from the CCA analysis for the Sleipner Vest field and reference stations, 2000 (left) and plot of taxa with high contribution on two axes (right).
On the basis of the results from the uni- and multivariate analyses the stations at Sleipner Vest is classified in two faunal groups in the present survey. Station SLV01 is placed in group B (slightly disturbed fauna) while the other stations are placed in group A (undisturbed fauna). Station SLV01 has relatively high abundance of the polychaetes Paramphinome jeffreysii, Diplocirrus glaucus and Chaetozone sp. and the bivalve Thyasira sarsi, many of which are known to increase in individual numbers in disturbed sediments. The same station has low abundance of the brittle star Amphiura filiformis and the polychaete Spiophanes kroyeri, which decrease in numbers in disturbed sediments. This station was separated from all other field stations in the multivariate analyses and has relatively high levels of THC and highest levels of all measured heavy metals in the sediments compared with the other field stations.
Both the numbers of taxa and individuals has decreased remarkably at all stations on Sleipner Vest since 1997. Among the dominant taxa, the polychaetes Galathowenia oculata and Paramphinome jeffreysii, has decreased from several hundred individuals per stations to less than 100 individuals. Also other dominant taxa are recorded with lower individual number in the present survey.
In the previous survey in 1997 the fauna was found to be undisturbed at all stations. The faunal disturbance seen in the present survey, therefore, is related to the petroleum activity at the field installation in the last three years.
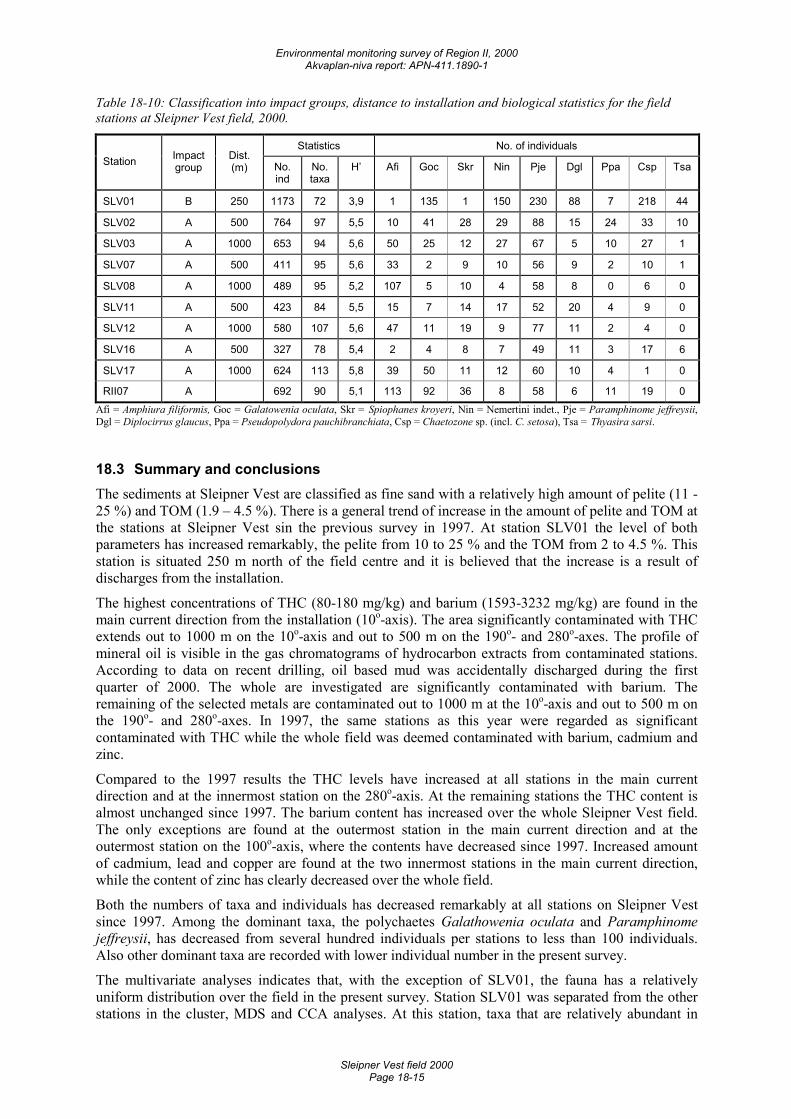
Environmental monitoring survey of Region II, 2000 Akvaplan-niva report: APN-411.1890-1
Sleipner Vest field 2000 Page 18-15
Table 18-10: Classification into impact groups, distance to installation and biological statistics for the field stations at Sleipner Vest field, 2000.
Statistics No. of individuals Station Impact
group Dist. (m) No.
ind No. taxa
H’ Afi Goc Skr Nin Pje Dgl Ppa Csp Tsa
SLV01 B 250 1173 72 3,9 1 135 1 150 230 88 7 218 44
SLV02 A 500 764 97 5,5 10 41 28 29 88 15 24 33 10
SLV03 A 1000 653 94 5,6 50 25 12 27 67 5 10 27 1
SLV07 A 500 411 95 5,6 33 2 9 10 56 9 2 10 1
SLV08 A 1000 489 95 5,2 107 5 10 4 58 8 0 6 0
SLV11 A 500 423 84 5,5 15 7 14 17 52 20 4 9 0
SLV12 A 1000 580 107 5,6 47 11 19 9 77 11 2 4 0
SLV16 A 500 327 78 5,4 2 4 8 7 49 11 3 17 6
SLV17 A 1000 624 113 5,8 39 50 11 12 60 10 4 1 0
RII07 A 692 90 5,1 113 92 36 8 58 6 11 19 0 Afi = Amphiura filiformis, Goc = Galatowenia oculata, Skr = Spiophanes kroyeri, Nin = Nemertini indet., Pje = Paramphinome jeffreysii, Dgl = Diplocirrus glaucus, Ppa = Pseudopolydora pauchibranchiata, Csp = Chaetozone sp. (incl. C. setosa), Tsa = Thyasira sarsi.
18.3 Summary and conclusions The sediments at Sleipner Vest are classified as fine sand with a relatively high amount of pelite (11 - 25 %) and TOM (1.9 – 4.5 %). There is a general trend of increase in the amount of pelite and TOM at the stations at Sleipner Vest sin the previous survey in 1997. At station SLV01 the level of both parameters has increased remarkably, the pelite from 10 to 25 % and the TOM from 2 to 4.5 %. This station is situated 250 m north of the field centre and it is believed that the increase is a result of discharges from the installation.
The highest concentrations of THC (80-180 mg/kg) and barium (1593-3232 mg/kg) are found in the main current direction from the installation (10o-axis). The area significantly contaminated with THC extends out to 1000 m on the 10o-axis and out to 500 m on the 190o- and 280o-axes. The profile of mineral oil is visible in the gas chromatograms of hydrocarbon extracts from contaminated stations. According to data on recent drilling, oil based mud was accidentally discharged during the first quarter of 2000. The whole are investigated are significantly contaminated with barium. The remaining of the selected metals are contaminated out to 1000 m at the 10o-axis and out to 500 m on the 190o- and 280o-axes. In 1997, the same stations as this year were regarded as significant contaminated with THC while the whole field was deemed contaminated with barium, cadmium and zinc.
Compared to the 1997 results the THC levels have increased at all stations in the main current direction and at the innermost station on the 280o-axis. At the remaining stations the THC content is almost unchanged since 1997. The barium content has increased over the whole Sleipner Vest field. The only exceptions are found at the outermost station in the main current direction and at the outermost station on the 100o-axis, where the contents have decreased since 1997. Increased amount of cadmium, lead and copper are found at the two innermost stations in the main current direction, while the content of zinc has clearly decreased over the whole field.
Both the numbers of taxa and individuals has decreased remarkably at all stations on Sleipner Vest since 1997. Among the dominant taxa, the polychaetes Galathowenia oculata and Paramphinome jeffreysii, has decreased from several hundred individuals per stations to less than 100 individuals. Also other dominant taxa are recorded with lower individual number in the present survey.
The multivariate analyses indicates that, with the exception of SLV01, the fauna has a relatively uniform distribution over the field in the present survey. Station SLV01 was separated from the other stations in the cluster, MDS and CCA analyses. At this station, taxa that are relatively abundant in
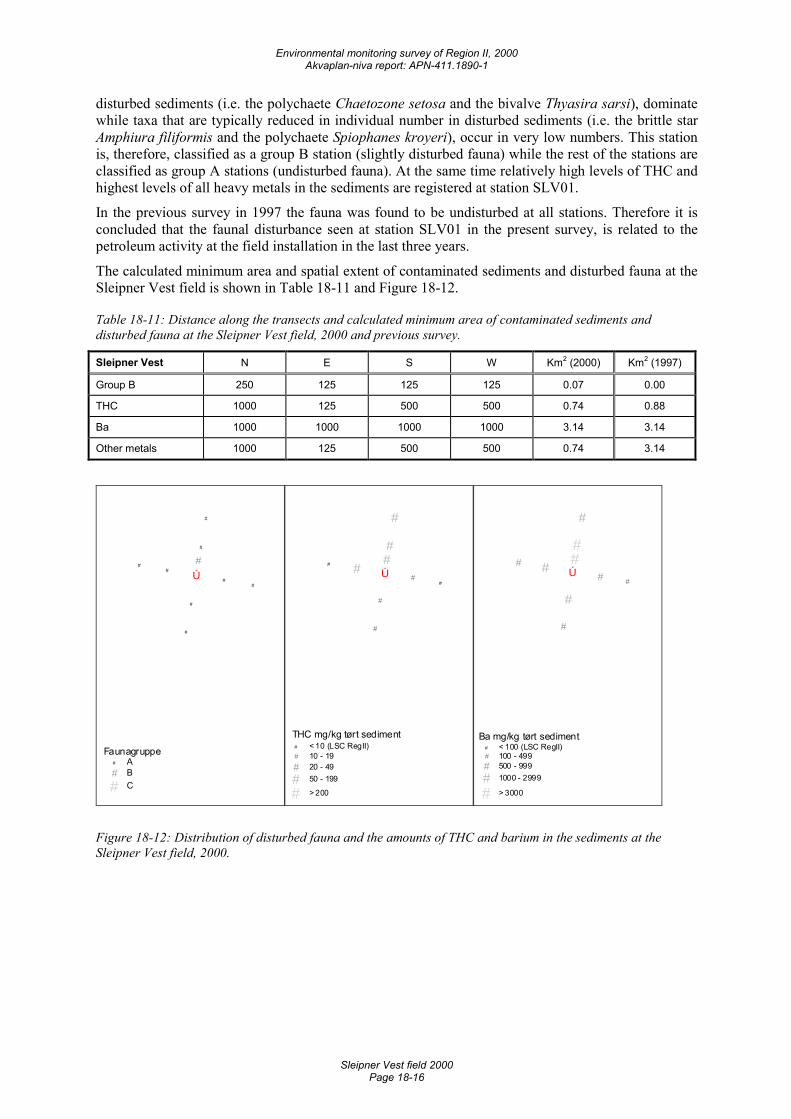
Environmental monitoring survey of Region II, 2000 Akvaplan-niva report: APN-411.1890-1
Sleipner Vest field 2000 Page 18-16
disturbed sediments (i.e. the polychaete Chaetozone setosa and the bivalve Thyasira sarsi), dominate while taxa that are typically reduced in individual number in disturbed sediments (i.e. the brittle star Amphiura filiformis and the polychaete Spiophanes kroyeri), occur in very low numbers. This station is, therefore, classified as a group B station (slightly disturbed fauna) while the rest of the stations are classified as group A stations (undisturbed fauna). At the same time relatively high levels of THC and highest levels of all heavy metals in the sediments are registered at station SLV01.
In the previous survey in 1997 the fauna was found to be undisturbed at all stations. Therefore it is concluded that the faunal disturbance seen at station SLV01 in the present survey, is related to the petroleum activity at the field installation in the last three years.
The calculated minimum area and spatial extent of contaminated sediments and disturbed fauna at the Sleipner Vest field is shown in Table 18-11 and Figure 18-12.
Table 18-11: Distance along the transects and calculated minimum area of contaminated sediments and disturbed fauna at the Sleipner Vest field, 2000 and previous survey.
Sleipner Vest N E S W Km2 (2000) Km2 (1997)
Group B 250 125 125 125 0.07 0.00
THC 1000 125 500 500 0.74 0.88
Ba 1000 1000 1000 1000 3.14 3.14
Other metals 1000 125 500 500 0.74 3.14
Ú
#
#
#
##
#
#
##
Faunagruppe# A# B
# C
Ú##
#
##
#
#
##
THC mg/kg tørt sediment# < 10 (LSC RegII)# 10 - 19# 20 - 49
# 50 - 199
# > 200
Ú##
#
##
#
#
##
Ba mg/kg tørt sediment# < 100 (LSC RegII)# 100 - 499# 500 - 999
# 1000 - 2999
# > 3000
Figure 18-12: Distribution of disturbed fauna and the amounts of THC and barium in the sediments at the Sleipner Vest field, 2000.
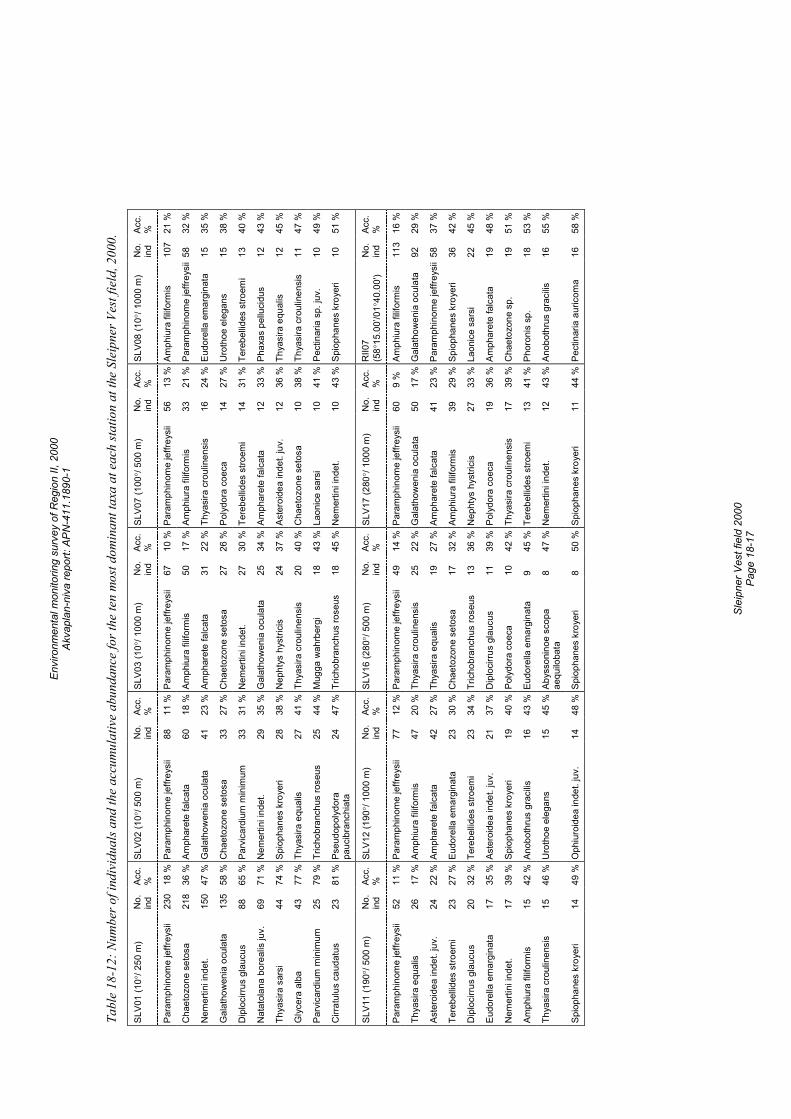
Envi
ronm
enta
l mon
itorin
g su
rvey
of R
egio
n II,
200
0 Ak
vapl
an-n
iva
repo
rt: A
PN-4
11.1
890-
1
Sl
eipn
er V
est f
ield
200
0 Pa
ge 1
8-17
Tabl
e 18
-12:
Num
ber o
f ind
ivid
uals
and
the
accu
mul
ativ
e ab
unda
nce
for t
he te
n m
ost d
omin
ant t
axa
at e
ach
statio
n at
the
Slei
pner
Ves
t fie
ld, 2
000.
SLV0
1 (1
0°/ 2
50 m
) N
o.
ind
Acc.
%
SL
V02
(10°
/ 500
m)
No.
in
d Ac
c.
%
SLV0
3 (1
0°/ 1
000
m)
No.
in
d Ac
c.
%
SLV0
7 (1
00°/
500
m)
No.
in
d Ac
c.
%
SLV0
8 (1
0°/ 1
000
m)
No.
in
d Ac
c.
%
Para
mph
inom
e je
ffrey
sii
230
18 %
Par
amph
inom
e je
ffrey
sii
88
11 %
Para
mph
inom
e je
ffrey
sii
67
10 %
Para
mph
inom
e je
ffrey
sii
56
13 %
Amph
iura
filif
orm
is
107
21 %
Cha
etoz
one
seto
sa
218
36 %
Am
phar
ete
falc
ata
60
18 %
Amph
iura
filif
orm
is
50
17 %
Amph
iura
filif
orm
is
33
21 %
Para
mph
inom
e je
ffrey
sii
58
32 %
Nem
ertin
i ind
et.
150
47 %
Gal
atho
wen
ia o
cula
ta
41
23 %
Amph
aret
e fa
lcat
a 31
22
%Th
yasi
ra c
roul
inen
sis
16
24 %
Eudo
rella
em
argi
nata
15
35
%
Gal
atho
wen
ia o
cula
ta
135
58 %
Cha
etoz
one
seto
sa
33
27 %
Cha
etoz
one
seto
sa
27
26 %
Poly
dora
coe
ca
14
27 %
Uro
thoe
ele
gans
15
38
%
Dip
loci
rrus
glau
cus
88
65 %
Par
vica
rdiu
m m
inim
um
33
31 %
Nem
ertin
i ind
et.
27
30 %
Tere
bellid
es s
troem
i 14
31
%Te
rebe
llides
stro
emi
13
40 %
Nat
atol
ana
bore
alis
juv.
69
71
% N
emer
tini i
ndet
. 29
35
%G
alat
how
enia
ocu
lata
25
34
%Am
phar
ete
falc
ata
12
33 %
Phax
as p
ellu
cidu
s 12
43
%
Thya
sira
sar
si
44
74 %
Spi
opha
nes
kroy
eri
28
38 %
Nep
htys
hys
trici
s 24
37
%As
tero
idea
inde
t. ju
v.
12
36 %
Thya
sira
equ
alis
12
45
%
Gly
cera
alb
a 43
77
% T
hyas
ira e
qual
is
27
41 %
Thya
sira
cro
ulin
ensi
s 20
40
%C
haet
ozon
e se
tosa
10
38
%Th
yasi
ra c
roul
inen
sis
11
47 %
Parv
icar
dium
min
imum
25
79
% T
richo
bran
chus
rose
us
25
44 %
Mug
ga w
ahrb
ergi
18
43
%La
onic
e sa
rsi
10
41 %
Pect
inar
ia s
p. ju
v.
10
49 %
Cirr
atul
us c
auda
tus
23
81 %
Pse
udop
olyd
ora
pauc
ibra
nchi
ata
24
47 %
Tric
hobr
anch
us ro
seus
18
45
%N
emer
tini i
ndet
. 10
43
%Sp
ioph
anes
kro
yeri
10
51 %
SLV1
1 (1
90°/
500
m)
No.
in
d Ac
c.%
SL
V12
(190
°/ 1
000
m)
No.
in
d Ac
c.%
SL
V16
(280
°/ 5
00 m
) N
o.
ind
Acc.
%
SL
V17
(280
°/ 1
000
m)
No.
in
d Ac
c.
%
RII0
7 (5
8°15
.00’
/01°
40.0
0')
No.
in
d Ac
c.
%
Para
mph
inom
e je
ffrey
sii
52
11 %
Par
amph
inom
e je
ffrey
sii
77
12 %
Para
mph
inom
e je
ffrey
sii
49
14 %
Para
mph
inom
e je
ffrey
sii
60
9 %
Am
phiu
ra fi
lifor
mis
11
3 16
%
Thya
sira
equ
alis
26
17
% A
mph
iura
filif
orm
is
47
20 %
Thya
sira
cro
ulin
ensi
s 25
22
%G
alat
how
enia
ocu
lata
50
17
%G
alat
how
enia
ocu
lata
92
29
%
Aste
roid
ea in
det.
juv.
24
22
% A
mph
aret
e fa
lcat
a 42
27
%Th
yasi
ra e
qual
is
19
27 %
Amph
aret
e fa
lcat
a 41
23
%Pa
ram
phin
ome
jeffr
eysi
i58
37
%
Tere
bellid
es s
troem
i 23
27
% E
udor
ella
em
argi
nata
23
30
%C
haet
ozon
e se
tosa
17
32
%Am
phiu
ra fi
lifor
mis
39
29
%Sp
ioph
anes
kro
yeri
36
42 %
Dip
loci
rrus
glau
cus
20
32 %
Ter
ebel
lides
stro
emi
23
34 %
Tric
hobr
anch
us ro
seus
13
36
%N
epht
ys h
ystri
cis
27
33 %
Laon
ice
sars
i 22
45
%
Eudo
rella
em
argi
nata
17
35
% A
ster
oide
a in
det.
juv.
21
37
%D
iplo
cirru
s gl
aucu
s 11
39
%Po
lydo
ra c
oeca
19
36
%Am
phar
ete
falc
ata
19
48 %
Nem
ertin
i ind
et.
17
39 %
Spi
opha
nes
kroy
eri
19
40 %
Poly
dora
coe
ca
10
42 %
Thya
sira
cro
ulin
ensi
s 17
39
%C
haet
ozon
e sp
. 19
51
%
Amph
iura
filif
orm
is
15
42 %
Ano
both
rus
grac
ilis
16
43 %
Eudo
rella
em
argi
nata
9
45 %
Tere
bellid
es s
troem
i 13
41
%Ph
oron
is s
p.
18
53 %
Thya
sira
cro
ulin
ensi
s 15
46
% U
roth
oe e
lega
ns
15
45 %
Abys
soni
noe
scop
a ae
quilo
bata
8
47 %
Nem
ertin
i ind
et.
12
43 %
Anob
othr
us g
raci
lis
16
55 %
Spio
phan
es k
roye
ri 14
49
% O
phiu
roid
ea in
det.
juv.
14
48
%Sp
ioph
anes
kro
yeri
8 50
%Sp
ioph
anes
kro
yeri
11
44 %
Pect
inar
ia a
uric
oma
16
58 %
Envi
ronm
enta
l mon
itorin
g su
rvey
of R
egio
n II,
200
0 Ak
vapl
an-n
iva
repo
rt: A
PN-4
11.1
890-
1
Sl
eipn
er V
est f
ield
200
0 Pa
ge 1
8-18
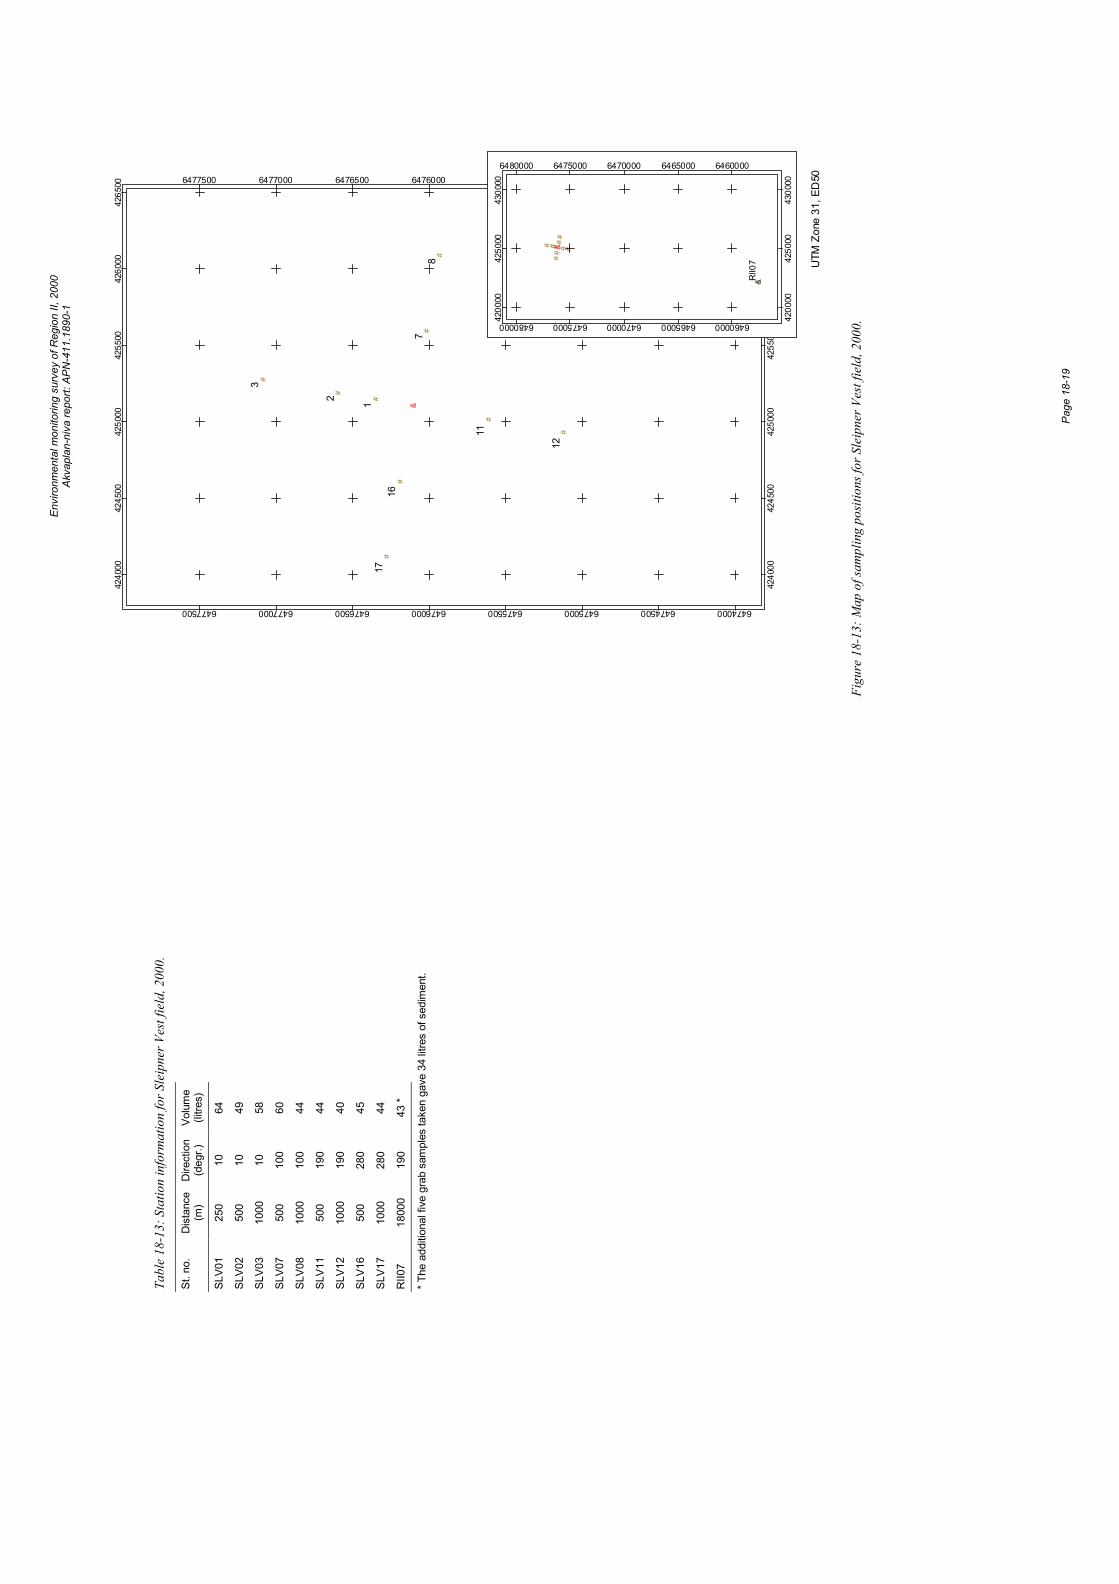
Envi
ronm
enta
l mon
itorin
g su
rvey
of R
egio
n II,
200
0 Ak
vapl
an-n
iva
repo
rt: A
PN-4
11.1
890-
1
Pa
ge 1
8-19
UTM
Zon
e 31
, ED
50
#
#
#
#
#
#
#
#
#
&
3
2 1
78
11
12
1617
4240
00
4240
00
4245
00
4245
00
4250
00
4250
00
4255
00
4255
00
4260
00
4260
00
4265
00
4265
00
6474000
6474000
6474500
6474500
6475000
6475000
6475500
6475500
6476000
6476000
6476500
6476500
6477000
6477000
6477500
6477500
&
### ##
# ###
#
&
4200
00
4200
00
4250
00
4250
00
4300
00
4300
00
6460000
6460000
6465000
6465000
6470000
6470000
6475000
6475000
6480000
6480000
RII0
7
Figu
re 1
8-13
: Map
of s
ampl
ing
posit
ions
for S
leip
ner V
est f
ield
, 200
0.
Tabl
e 18
-13:
Sta
tion
info
rmat
ion
for S
leip
ner V
est f
ield
, 200
0.
St. n
o.
Dis
tanc
e (m
) D
irect
ion
(deg
r.)
Volu
me
(litre
s)
SLV0
1 25
0 10
64
SLV0
2 50
0 10
49
SLV0
3 10
00
10
58
SLV0
7 50
0 10
0 60
SLV0
8 10
00
100
44
SLV1
1 50
0 19
0 44
SLV1
2 10
00
190
40
SLV1
6 50
0 28
0 45
SLV1
7 10
00
280
44
RII0
7 18
000
190
43 *
* The
add
ition
al fi
ve g
rab
sam
ples
take
n ga
ve 3
4 lit
res
of s
edim
ent.

Envi
ronm
enta
l mon
itorin
g su
rvey
of R
egio
n II,
200
0 Ak
vapl
an-n
iva
repo
rt: A
PN-4
11.1
890-
1
Pa
ge 1
8-20
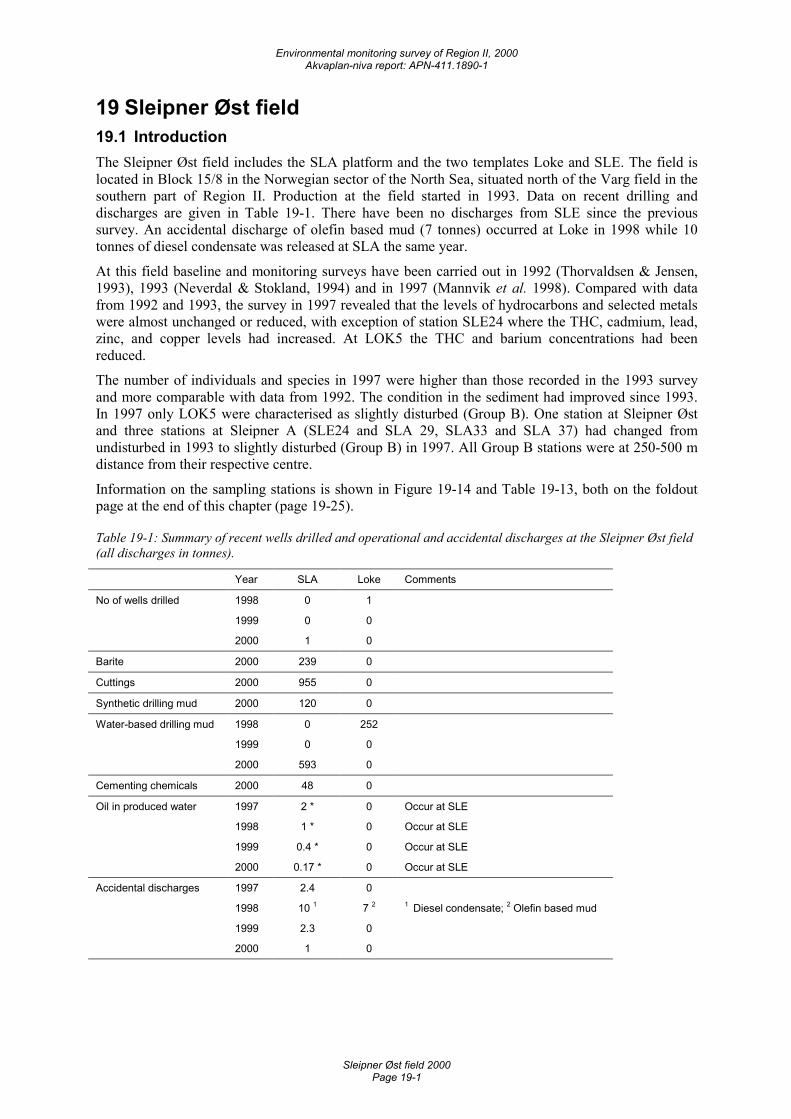
Environmental monitoring survey of Region II, 2000 Akvaplan-niva report: APN-411.1890-1
Sleipner Øst field 2000 Page 19-1
19 Sleipner Øst field 19.1 Introduction The Sleipner Øst field includes the SLA platform and the two templates Loke and SLE. The field is located in Block 15/8 in the Norwegian sector of the North Sea, situated north of the Varg field in the southern part of Region II. Production at the field started in 1993. Data on recent drilling and discharges are given in Table 19-1. There have been no discharges from SLE since the previous survey. An accidental discharge of olefin based mud (7 tonnes) occurred at Loke in 1998 while 10 tonnes of diesel condensate was released at SLA the same year.
At this field baseline and monitoring surveys have been carried out in 1992 (Thorvaldsen & Jensen, 1993), 1993 (Neverdal & Stokland, 1994) and in 1997 (Mannvik et al. 1998). Compared with data from 1992 and 1993, the survey in 1997 revealed that the levels of hydrocarbons and selected metals were almost unchanged or reduced, with exception of station SLE24 where the THC, cadmium, lead, zinc, and copper levels had increased. At LOK5 the THC and barium concentrations had been reduced.
The number of individuals and species in 1997 were higher than those recorded in the 1993 survey and more comparable with data from 1992. The condition in the sediment had improved since 1993. In 1997 only LOK5 were characterised as slightly disturbed (Group B). One station at Sleipner Øst and three stations at Sleipner A (SLE24 and SLA 29, SLA33 and SLA 37) had changed from undisturbed in 1993 to slightly disturbed (Group B) in 1997. All Group B stations were at 250-500 m distance from their respective centre.
Information on the sampling stations is shown in Figure 19-14 and Table 19-13, both on the foldout page at the end of this chapter (page 19-25).
Table 19-1: Summary of recent wells drilled and operational and accidental discharges at the Sleipner Øst field (all discharges in tonnes).
Year SLA Loke Comments
No of wells drilled 1998 0 1
1999 0 0
2000 1 0
Barite 2000 239 0
Cuttings 2000 955 0
Synthetic drilling mud 2000 120 0
Water-based drilling mud 1998 0 252
1999 0 0
2000 593 0
Cementing chemicals 2000 48 0
Oil in produced water 1997 2 * 0 Occur at SLE
1998 1 * 0 Occur at SLE
1999 0.4 * 0 Occur at SLE
2000 0.17 * 0 Occur at SLE
Accidental discharges 1997 2.4 0
1998 10 1 7 2 1 Diesel condensate; 2 Olefin based mud
1999 2.3 0
2000 1 0
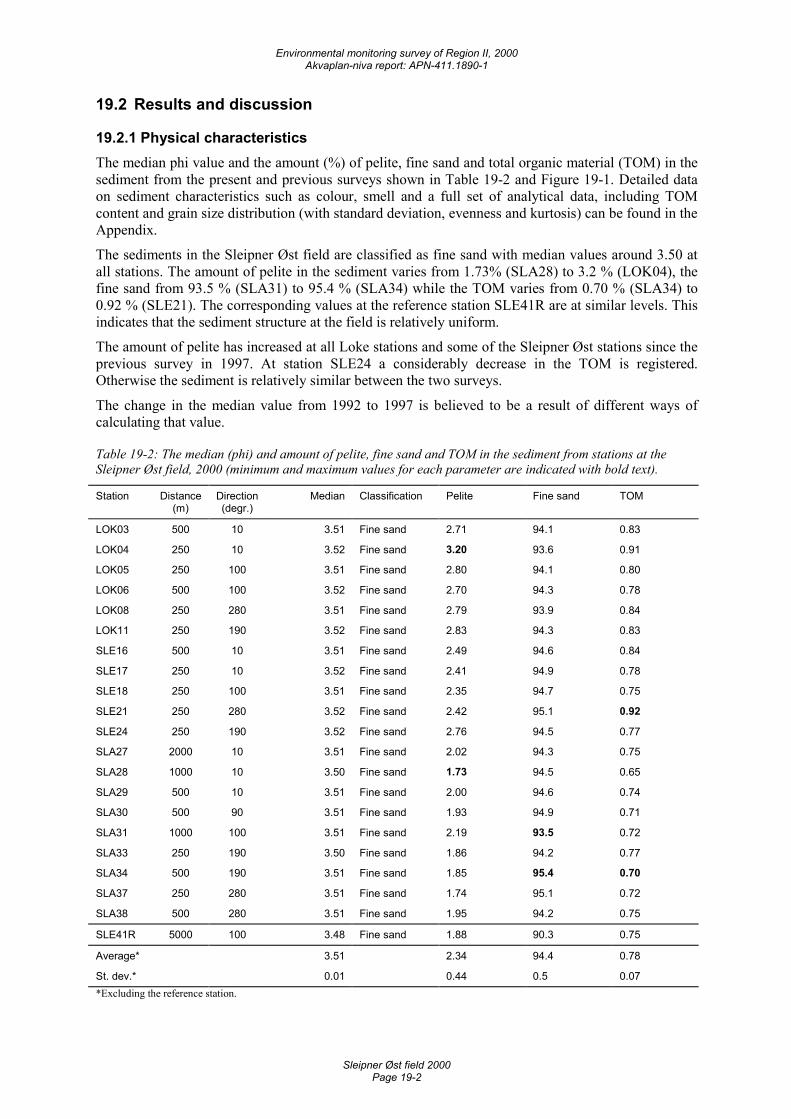
Environmental monitoring survey of Region II, 2000 Akvaplan-niva report: APN-411.1890-1
Sleipner Øst field 2000 Page 19-2
19.2 Results and discussion
19.2.1 Physical characteristics The median phi value and the amount (%) of pelite, fine sand and total organic material (TOM) in the sediment from the present and previous surveys shown in Table 19-2 and Figure 19-1. Detailed data on sediment characteristics such as colour, smell and a full set of analytical data, including TOM content and grain size distribution (with standard deviation, evenness and kurtosis) can be found in the Appendix.
The sediments in the Sleipner Øst field are classified as fine sand with median values around 3.50 at all stations. The amount of pelite in the sediment varies from 1.73% (SLA28) to 3.2 % (LOK04), the fine sand from 93.5 % (SLA31) to 95.4 % (SLA34) while the TOM varies from 0.70 % (SLA34) to 0.92 % (SLE21). The corresponding values at the reference station SLE41R are at similar levels. This indicates that the sediment structure at the field is relatively uniform.
The amount of pelite has increased at all Loke stations and some of the Sleipner Øst stations since the previous survey in 1997. At station SLE24 a considerably decrease in the TOM is registered. Otherwise the sediment is relatively similar between the two surveys.
The change in the median value from 1992 to 1997 is believed to be a result of different ways of calculating that value.
Table 19-2: The median (phi) and amount of pelite, fine sand and TOM in the sediment from stations at the Sleipner Øst field, 2000 (minimum and maximum values for each parameter are indicated with bold text).
Station Distance (m)
Direction (degr.)
Median Classification Pelite Fine sand TOM
LOK03 500 10 3.51 Fine sand 2.71 94.1 0.83
LOK04 250 10 3.52 Fine sand 3.20 93.6 0.91
LOK05 250 100 3.51 Fine sand 2.80 94.1 0.80
LOK06 500 100 3.52 Fine sand 2.70 94.3 0.78
LOK08 250 280 3.51 Fine sand 2.79 93.9 0.84
LOK11 250 190 3.52 Fine sand 2.83 94.3 0.83
SLE16 500 10 3.51 Fine sand 2.49 94.6 0.84
SLE17 250 10 3.52 Fine sand 2.41 94.9 0.78
SLE18 250 100 3.51 Fine sand 2.35 94.7 0.75
SLE21 250 280 3.52 Fine sand 2.42 95.1 0.92
SLE24 250 190 3.52 Fine sand 2.76 94.5 0.77
SLA27 2000 10 3.51 Fine sand 2.02 94.3 0.75
SLA28 1000 10 3.50 Fine sand 1.73 94.5 0.65
SLA29 500 10 3.51 Fine sand 2.00 94.6 0.74
SLA30 500 90 3.51 Fine sand 1.93 94.9 0.71
SLA31 1000 100 3.51 Fine sand 2.19 93.5 0.72
SLA33 250 190 3.50 Fine sand 1.86 94.2 0.77
SLA34 500 190 3.51 Fine sand 1.85 95.4 0.70
SLA37 250 280 3.51 Fine sand 1.74 95.1 0.72
SLA38 500 280 3.51 Fine sand 1.95 94.2 0.75
SLE41R 5000 100 3.48 Fine sand 1.88 90.3 0.75
Average* 3.51 2.34 94.4 0.78
St. dev.* 0.01 0.44 0.5 0.07 *Excluding the reference station.
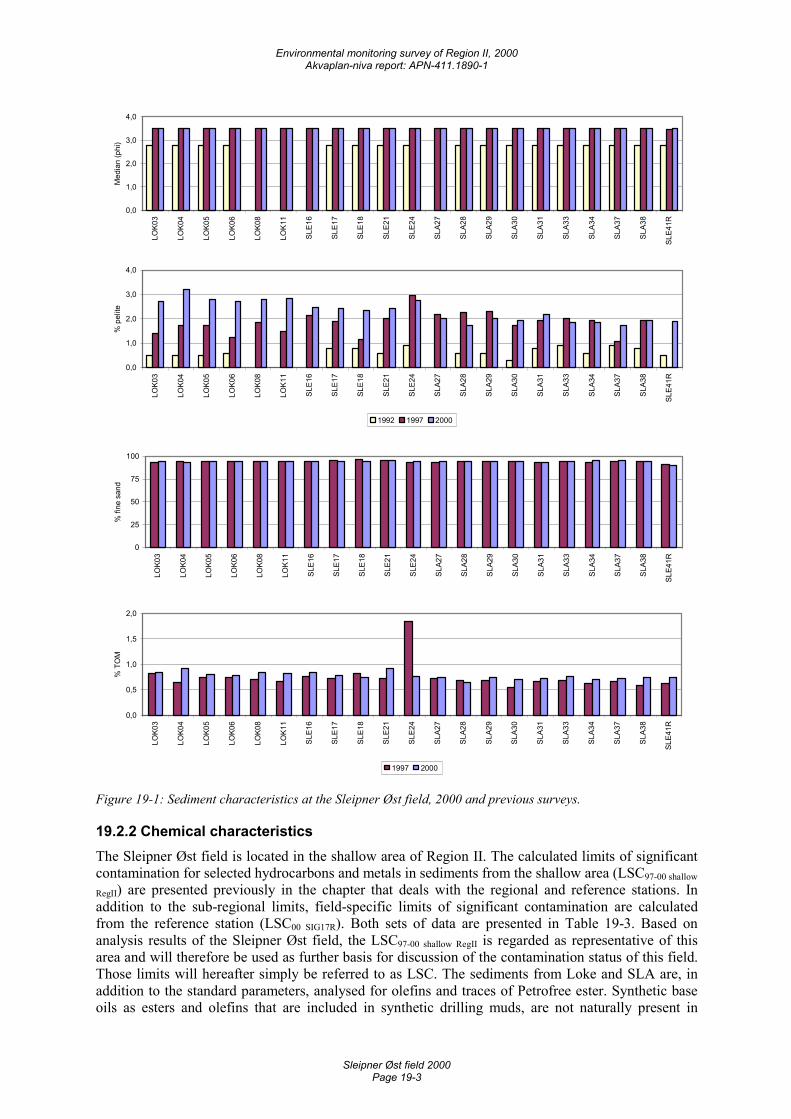
Environmental monitoring survey of Region II, 2000 Akvaplan-niva report: APN-411.1890-1
Sleipner Øst field 2000 Page 19-3
0,0
1,0
2,0
3,0
4,0
LOK0
3
LOK0
4
LOK0
5
LOK0
6
LOK0
8
LOK1
1
SLE1
6
SLE1
7
SLE1
8
SLE2
1
SLE2
4
SLA2
7
SLA2
8
SLA2
9
SLA3
0
SLA3
1
SLA3
3
SLA3
4
SLA3
7
SLA3
8
SLE4
1R
Med
ian
(phi
)
0,0
1,0
2,0
3,0
4,0
LOK0
3
LOK0
4
LOK0
5
LOK0
6
LOK0
8
LOK1
1
SLE1
6
SLE1
7
SLE1
8
SLE2
1
SLE2
4
SLA2
7
SLA2
8
SLA2
9
SLA3
0
SLA3
1
SLA3
3
SLA3
4
SLA3
7
SLA3
8
SLE4
1R
% p
elite
1992 1997 2000
0
25
50
75
100
LOK0
3
LOK0
4
LOK0
5
LOK0
6
LOK0
8
LOK1
1
SLE1
6
SLE1
7
SLE1
8
SLE2
1
SLE2
4
SLA2
7
SLA2
8
SLA2
9
SLA3
0
SLA3
1
SLA3
3
SLA3
4
SLA3
7
SLA3
8
SLE4
1R
% fi
ne s
and
0,0
0,5
1,0
1,5
2,0
LOK0
3
LOK0
4
LOK0
5
LOK0
6
LOK0
8
LOK1
1
SLE1
6
SLE1
7
SLE1
8
SLE2
1
SLE2
4
SLA2
7
SLA2
8
SLA2
9
SLA3
0
SLA3
1
SLA3
3
SLA3
4
SLA3
7
SLA3
8
SLE4
1R
% T
OM
1997 2000
Figure 19-1: Sediment characteristics at the Sleipner Øst field, 2000 and previous surveys.
19.2.2 Chemical characteristics The Sleipner Øst field is located in the shallow area of Region II. The calculated limits of significant contamination for selected hydrocarbons and metals in sediments from the shallow area (LSC97-00 shallow
RegII) are presented previously in the chapter that deals with the regional and reference stations. In addition to the sub-regional limits, field-specific limits of significant contamination are calculated from the reference station (LSC00 SIG17R). Both sets of data are presented in Table 19-3. Based on analysis results of the Sleipner Øst field, the LSC97-00 shallow RegII is regarded as representative of this area and will therefore be used as further basis for discussion of the contamination status of this field. Those limits will hereafter simply be referred to as LSC. The sediments from Loke and SLA are, in addition to the standard parameters, analysed for olefins and traces of Petrofree ester. Synthetic base oils as esters and olefins that are included in synthetic drilling muds, are not naturally present in
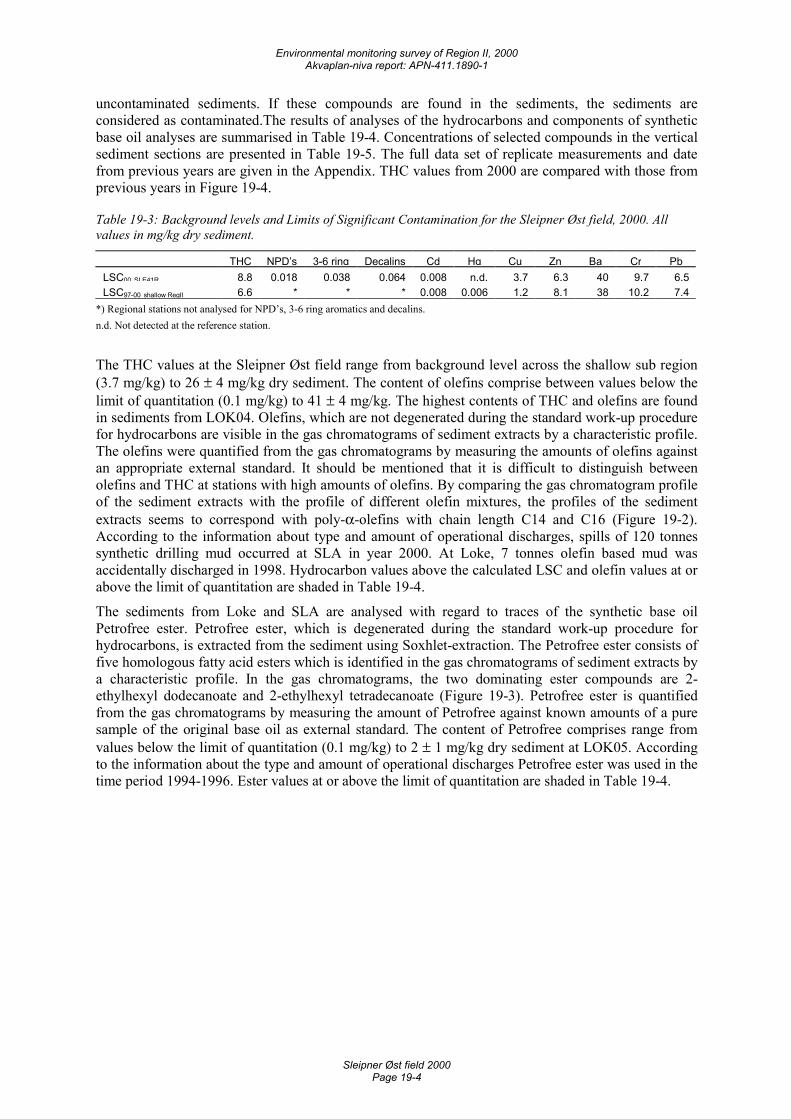
Environmental monitoring survey of Region II, 2000 Akvaplan-niva report: APN-411.1890-1
Sleipner Øst field 2000 Page 19-4
uncontaminated sediments. If these compounds are found in the sediments, the sediments are considered as contaminated.The results of analyses of the hydrocarbons and components of synthetic base oil analyses are summarised in Table 19-4. Concentrations of selected compounds in the vertical sediment sections are presented in Table 19-5. The full data set of replicate measurements and date from previous years are given in the Appendix. THC values from 2000 are compared with those from previous years in Figure 19-4.
Table 19-3: Background levels and Limits of Significant Contamination for the Sleipner Øst field, 2000. All values in mg/kg dry sediment.
THC NPD’s 3-6 ring Decalins Cd Hg Cu Zn Ba Cr PbLSC00 SLE41R 8.8 0.018 0.038 0.064 0.008 n.d. 3.7 6.3 40 9.7 6.5LSC97-00 shallow RegII 6.6 * * * 0.008 0.006 1.2 8.1 38 10.2 7.4
*) Regional stations not analysed for NPD’s, 3-6 ring aromatics and decalins. n.d. Not detected at the reference station.
The THC values at the Sleipner Øst field range from background level across the shallow sub region (3.7 mg/kg) to 26 ± 4 mg/kg dry sediment. The content of olefins comprise between values below the limit of quantitation (0.1 mg/kg) to 41 ± 4 mg/kg. The highest contents of THC and olefins are found in sediments from LOK04. Olefins, which are not degenerated during the standard work-up procedure for hydrocarbons are visible in the gas chromatograms of sediment extracts by a characteristic profile. The olefins were quantified from the gas chromatograms by measuring the amounts of olefins against an appropriate external standard. It should be mentioned that it is difficult to distinguish between olefins and THC at stations with high amounts of olefins. By comparing the gas chromatogram profile of the sediment extracts with the profile of different olefin mixtures, the profiles of the sediment extracts seems to correspond with poly-α-olefins with chain length C14 and C16 (Figure 19-2). According to the information about type and amount of operational discharges, spills of 120 tonnes synthetic drilling mud occurred at SLA in year 2000. At Loke, 7 tonnes olefin based mud was accidentally discharged in 1998. Hydrocarbon values above the calculated LSC and olefin values at or above the limit of quantitation are shaded in Table 19-4.
The sediments from Loke and SLA are analysed with regard to traces of the synthetic base oil Petrofree ester. Petrofree ester, which is degenerated during the standard work-up procedure for hydrocarbons, is extracted from the sediment using Soxhlet-extraction. The Petrofree ester consists of five homologous fatty acid esters which is identified in the gas chromatograms of sediment extracts by a characteristic profile. In the gas chromatograms, the two dominating ester compounds are 2-ethylhexyl dodecanoate and 2-ethylhexyl tetradecanoate (Figure 19-3). Petrofree ester is quantified from the gas chromatograms by measuring the amount of Petrofree against known amounts of a pure sample of the original base oil as external standard. The content of Petrofree comprises range from values below the limit of quantitation (0.1 mg/kg) to 2 ± 1 mg/kg dry sediment at LOK05. According to the information about the type and amount of operational discharges Petrofree ester was used in the time period 1994-1996. Ester values at or above the limit of quantitation are shaded in Table 19-4.
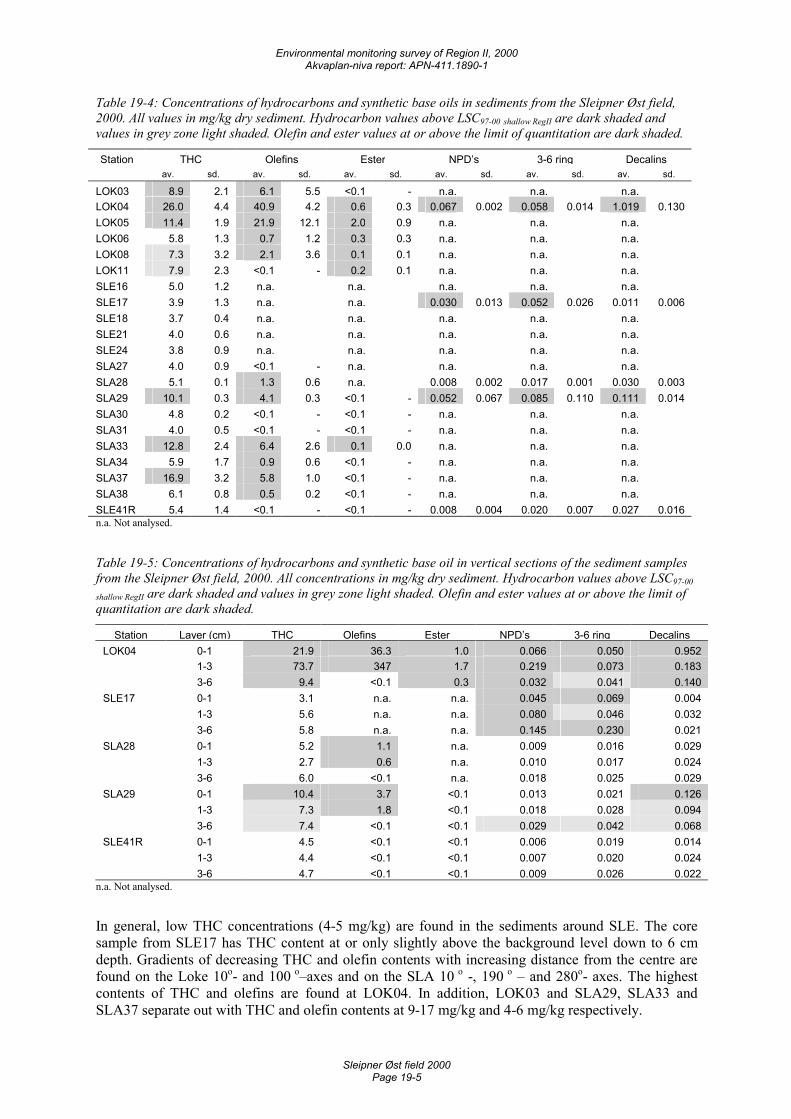
Environmental monitoring survey of Region II, 2000 Akvaplan-niva report: APN-411.1890-1
Sleipner Øst field 2000 Page 19-5
Table 19-4: Concentrations of hydrocarbons and synthetic base oils in sediments from the Sleipner Øst field, 2000. All values in mg/kg dry sediment. Hydrocarbon values above LSC97-00 shallow RegII are dark shaded and values in grey zone light shaded. Olefin and ester values at or above the limit of quantitation are dark shaded.
Station THC Olefins Ester NPD’s 3-6 ring Decalins av. sd. av. sd. av. sd. av. sd. av. sd. av. sd.
LOK03 8.9 2.1 6.1 5.5 <0.1 - n.a. n.a. n.a. LOK04 26.0 4.4 40.9 4.2 0.6 0.3 0.067 0.002 0.058 0.014 1.019 0.130LOK05 11.4 1.9 21.9 12.1 2.0 0.9 n.a. n.a. n.a. LOK06 5.8 1.3 0.7 1.2 0.3 0.3 n.a. n.a. n.a. LOK08 7.3 3.2 2.1 3.6 0.1 0.1 n.a. n.a. n.a. LOK11 7.9 2.3 <0.1 - 0.2 0.1 n.a. n.a. n.a. SLE16 5.0 1.2 n.a. n.a. n.a. n.a. n.a. SLE17 3.9 1.3 n.a. n.a. 0.030 0.013 0.052 0.026 0.011 0.006SLE18 3.7 0.4 n.a. n.a. n.a. n.a. n.a. SLE21 4.0 0.6 n.a. n.a. n.a. n.a. n.a. SLE24 3.8 0.9 n.a. n.a. n.a. n.a. n.a. SLA27 4.0 0.9 <0.1 - n.a. n.a. n.a. n.a. SLA28 5.1 0.1 1.3 0.6 n.a. 0.008 0.002 0.017 0.001 0.030 0.003SLA29 10.1 0.3 4.1 0.3 <0.1 - 0.052 0.067 0.085 0.110 0.111 0.014SLA30 4.8 0.2 <0.1 - <0.1 - n.a. n.a. n.a. SLA31 4.0 0.5 <0.1 - <0.1 - n.a. n.a. n.a. SLA33 12.8 2.4 6.4 2.6 0.1 0.0 n.a. n.a. n.a. SLA34 5.9 1.7 0.9 0.6 <0.1 - n.a. n.a. n.a. SLA37 16.9 3.2 5.8 1.0 <0.1 - n.a. n.a. n.a. SLA38 6.1 0.8 0.5 0.2 <0.1 - n.a. n.a. n.a. SLE41R 5.4 1.4 <0.1 - <0.1 - 0.008 0.004 0.020 0.007 0.027 0.016n.a. Not analysed. Table 19-5: Concentrations of hydrocarbons and synthetic base oil in vertical sections of the sediment samples from the Sleipner Øst field, 2000. All concentrations in mg/kg dry sediment. Hydrocarbon values above LSC97-00 shallow RegII are dark shaded and values in grey zone light shaded. Olefin and ester values at or above the limit of quantitation are dark shaded.
Station Layer (cm) THC Olefins Ester NPD’s 3-6 ring DecalinsLOK04 0-1 21.9 36.3 1.0 0.066 0.050 0.952 1-3 73.7 347 1.7 0.219 0.073 0.183 3-6 9.4 <0.1 0.3 0.032 0.041 0.140SLE17 0-1 3.1 n.a. n.a. 0.045 0.069 0.004 1-3 5.6 n.a. n.a. 0.080 0.046 0.032 3-6 5.8 n.a. n.a. 0.145 0.230 0.021SLA28 0-1 5.2 1.1 n.a. 0.009 0.016 0.029 1-3 2.7 0.6 n.a. 0.010 0.017 0.024 3-6 6.0 <0.1 n.a. 0.018 0.025 0.029SLA29 0-1 10.4 3.7 <0.1 0.013 0.021 0.126 1-3 7.3 1.8 <0.1 0.018 0.028 0.094 3-6 7.4 <0.1 <0.1 0.029 0.042 0.068SLE41R 0-1 4.5 <0.1 <0.1 0.006 0.019 0.014 1-3 4.4 <0.1 <0.1 0.007 0.020 0.024 3-6 4.7 <0.1 <0.1 0.009 0.026 0.022
n.a. Not analysed.
In general, low THC concentrations (4-5 mg/kg) are found in the sediments around SLE. The core sample from SLE17 has THC content at or only slightly above the background level down to 6 cm depth. Gradients of decreasing THC and olefin contents with increasing distance from the centre are found on the Loke 10o- and 100 o–axes and on the SLA 10 o -, 190 o – and 280o- axes. The highest contents of THC and olefins are found at LOK04. In addition, LOK03 and SLA29, SLA33 and SLA37 separate out with THC and olefin contents at 9-17 mg/kg and 4-6 mg/kg respectively.
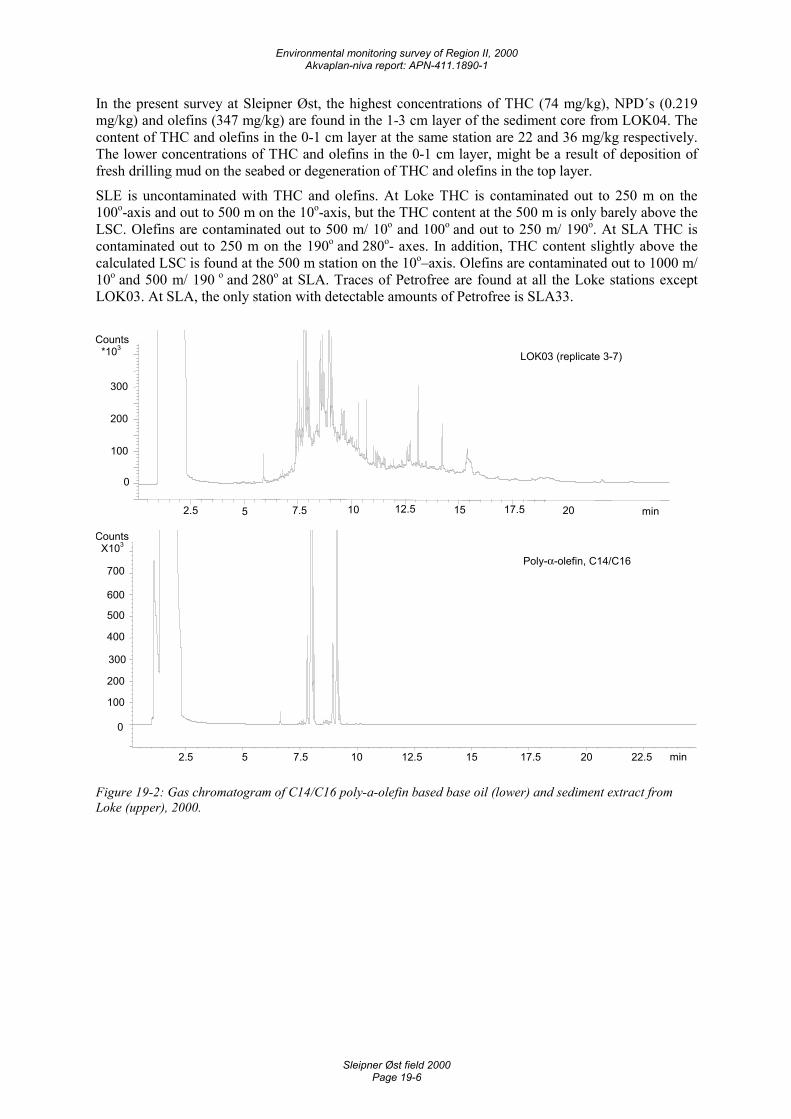
Environmental monitoring survey of Region II, 2000 Akvaplan-niva report: APN-411.1890-1
Sleipner Øst field 2000 Page 19-6
In the present survey at Sleipner Øst, the highest concentrations of THC (74 mg/kg), NPD´s (0.219 mg/kg) and olefins (347 mg/kg) are found in the 1-3 cm layer of the sediment core from LOK04. The content of THC and olefins in the 0-1 cm layer at the same station are 22 and 36 mg/kg respectively. The lower concentrations of THC and olefins in the 0-1 cm layer, might be a result of deposition of fresh drilling mud on the seabed or degeneration of THC and olefins in the top layer.
SLE is uncontaminated with THC and olefins. At Loke THC is contaminated out to 250 m on the 100o-axis and out to 500 m on the 10o-axis, but the THC content at the 500 m is only barely above the LSC. Olefins are contaminated out to 500 m/ 10o and 100o and out to 250 m/ 190o. At SLA THC is contaminated out to 250 m on the 190o and 280o- axes. In addition, THC content slightly above the calculated LSC is found at the 500 m station on the 10o–axis. Olefins are contaminated out to 1000 m/ 10o and 500 m/ 190 o and 280o at SLA. Traces of Petrofree are found at all the Loke stations except LOK03. At SLA, the only station with detectable amounts of Petrofree is SLA33.
min2.5 5 7.5 10 12.5 15 17.5 20
Counts *103
0
100
200
300
LOK03 (replicate 3-7)
min 2.5 5 7.5 10 12.5 15 17.5 20 22.5
Counts X103
0
100
200
300
400
500
600
700 Poly-α-olefin, C14/C16
Figure 19-2: Gas chromatogram of C14/C16 poly-a-olefin based base oil (lower) and sediment extract from Loke (upper), 2000.
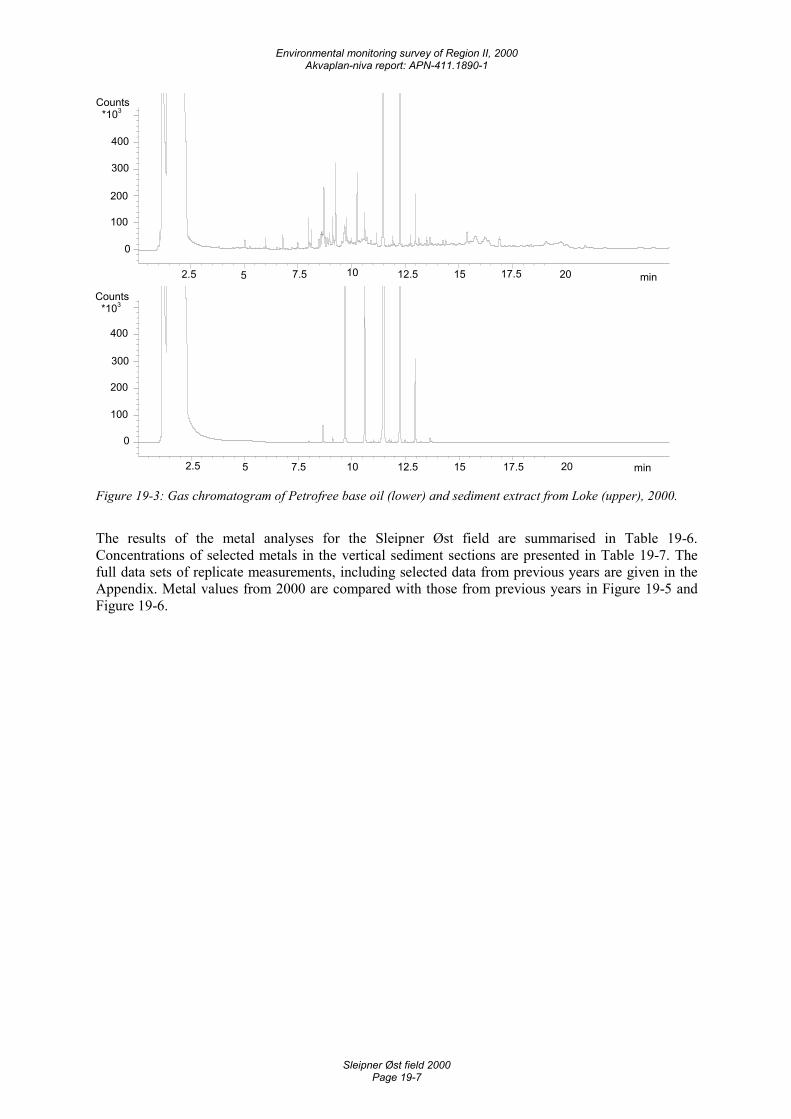
Environmental monitoring survey of Region II, 2000 Akvaplan-niva report: APN-411.1890-1
Sleipner Øst field 2000 Page 19-7
min2.5 5 7.5 10 12.5 15 17.5 20
Counts *103
0
100
200
300
400
min2.5 5 7.5 10 12.5 15 17.5 20
Counts *103
0
100
200
300
400
Figure 19-3: Gas chromatogram of Petrofree base oil (lower) and sediment extract from Loke (upper), 2000.
The results of the metal analyses for the Sleipner Øst field are summarised in Table 19-6. Concentrations of selected metals in the vertical sediment sections are presented in Table 19-7. The full data sets of replicate measurements, including selected data from previous years are given in the Appendix. Metal values from 2000 are compared with those from previous years in Figure 19-5 and Figure 19-6.
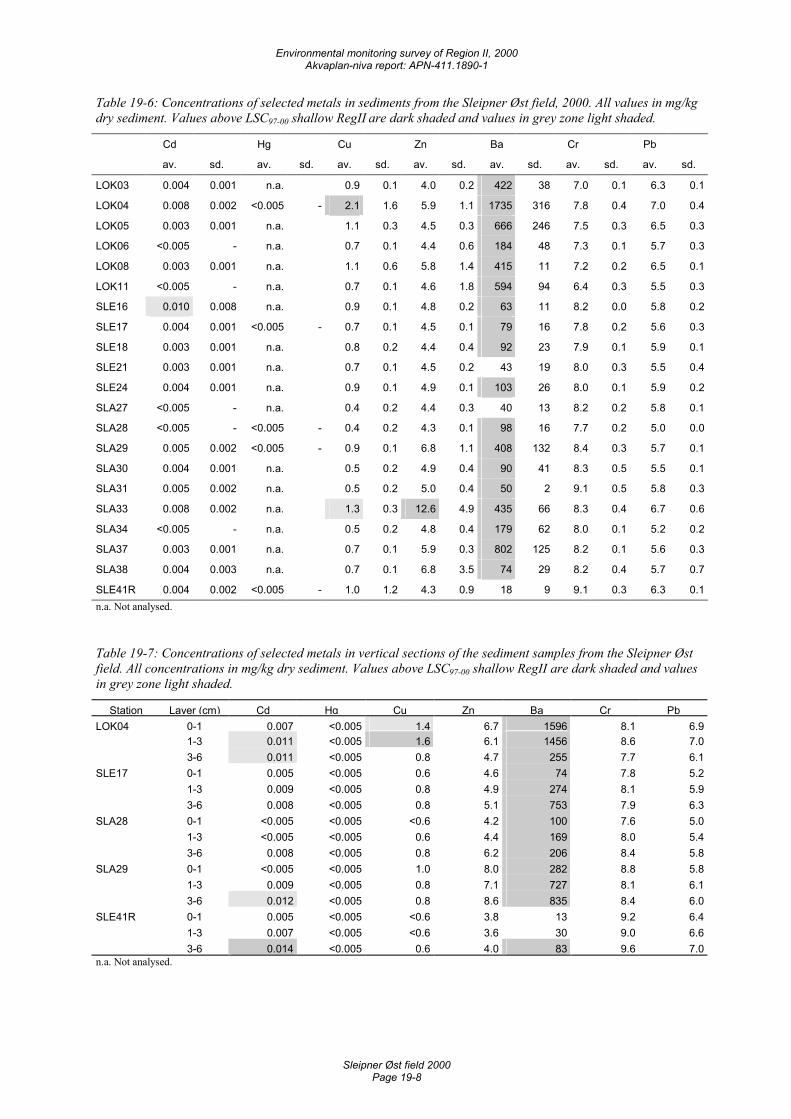
Environmental monitoring survey of Region II, 2000 Akvaplan-niva report: APN-411.1890-1
Sleipner Øst field 2000 Page 19-8
Table 19-6: Concentrations of selected metals in sediments from the Sleipner Øst field, 2000. All values in mg/kg dry sediment. Values above LSC97-00 shallow RegII are dark shaded and values in grey zone light shaded.
Cd Hg Cu Zn Ba Cr Pb
av. sd. av. sd. av. sd. av. sd. av. sd. av. sd. av. sd.
LOK03 0.004 0.001 n.a. 0.9 0.1 4.0 0.2 422 38 7.0 0.1 6.3 0.1
LOK04 0.008 0.002 <0.005 - 2.1 1.6 5.9 1.1 1735 316 7.8 0.4 7.0 0.4
LOK05 0.003 0.001 n.a. 1.1 0.3 4.5 0.3 666 246 7.5 0.3 6.5 0.3
LOK06 <0.005 - n.a. 0.7 0.1 4.4 0.6 184 48 7.3 0.1 5.7 0.3
LOK08 0.003 0.001 n.a. 1.1 0.6 5.8 1.4 415 11 7.2 0.2 6.5 0.1
LOK11 <0.005 - n.a. 0.7 0.1 4.6 1.8 594 94 6.4 0.3 5.5 0.3
SLE16 0.010 0.008 n.a. 0.9 0.1 4.8 0.2 63 11 8.2 0.0 5.8 0.2
SLE17 0.004 0.001 <0.005 - 0.7 0.1 4.5 0.1 79 16 7.8 0.2 5.6 0.3
SLE18 0.003 0.001 n.a. 0.8 0.2 4.4 0.4 92 23 7.9 0.1 5.9 0.1
SLE21 0.003 0.001 n.a. 0.7 0.1 4.5 0.2 43 19 8.0 0.3 5.5 0.4
SLE24 0.004 0.001 n.a. 0.9 0.1 4.9 0.1 103 26 8.0 0.1 5.9 0.2
SLA27 <0.005 - n.a. 0.4 0.2 4.4 0.3 40 13 8.2 0.2 5.8 0.1
SLA28 <0.005 - <0.005 - 0.4 0.2 4.3 0.1 98 16 7.7 0.2 5.0 0.0
SLA29 0.005 0.002 <0.005 - 0.9 0.1 6.8 1.1 408 132 8.4 0.3 5.7 0.1
SLA30 0.004 0.001 n.a. 0.5 0.2 4.9 0.4 90 41 8.3 0.5 5.5 0.1
SLA31 0.005 0.002 n.a. 0.5 0.2 5.0 0.4 50 2 9.1 0.5 5.8 0.3
SLA33 0.008 0.002 n.a. 1.3 0.3 12.6 4.9 435 66 8.3 0.4 6.7 0.6
SLA34 <0.005 - n.a. 0.5 0.2 4.8 0.4 179 62 8.0 0.1 5.2 0.2
SLA37 0.003 0.001 n.a. 0.7 0.1 5.9 0.3 802 125 8.2 0.1 5.6 0.3
SLA38 0.004 0.003 n.a. 0.7 0.1 6.8 3.5 74 29 8.2 0.4 5.7 0.7
SLE41R 0.004 0.002 <0.005 - 1.0 1.2 4.3 0.9 18 9 9.1 0.3 6.3 0.1n.a. Not analysed.
Table 19-7: Concentrations of selected metals in vertical sections of the sediment samples from the Sleipner Øst field. All concentrations in mg/kg dry sediment. Values above LSC97-00 shallow RegII are dark shaded and values in grey zone light shaded.
Station Layer (cm) Cd Hg Cu Zn Ba Cr PbLOK04 0-1 0.007 <0.005 1.4 6.7 1596 8.1 6.9 1-3 0.011 <0.005 1.6 6.1 1456 8.6 7.0 3-6 0.011 <0.005 0.8 4.7 255 7.7 6.1SLE17 0-1 0.005 <0.005 0.6 4.6 74 7.8 5.2 1-3 0.009 <0.005 0.8 4.9 274 8.1 5.9 3-6 0.008 <0.005 0.8 5.1 753 7.9 6.3SLA28 0-1 <0.005 <0.005 <0.6 4.2 100 7.6 5.0 1-3 <0.005 <0.005 0.6 4.4 169 8.0 5.4 3-6 0.008 <0.005 0.8 6.2 206 8.4 5.8SLA29 0-1 <0.005 <0.005 1.0 8.0 282 8.8 5.8 1-3 0.009 <0.005 0.8 7.1 727 8.1 6.1 3-6 0.012 <0.005 0.8 8.6 835 8.4 6.0SLE41R 0-1 0.005 <0.005 <0.6 3.8 13 9.2 6.4 1-3 0.007 <0.005 <0.6 3.6 30 9.0 6.6 3-6 0.014 <0.005 0.6 4.0 83 9.6 7.0n.a. Not analysed.
Environmental monitoring survey of Region II, 2000 Akvaplan-niva report: APN-411.1890-1
Sleipner Øst field 2000 Page 19-9
The content of barium, cadmium, lead, zinc, copper and chromium range from values below or barely above the corresponding background levels across the shallow sub region to 1735 ± 316, 0.010 ± 0.008, 7.0 ± 0.4, 12.6 ± 4.9, 2.1 ± 1.6 and 9.1 ± 0.5 mg/kg dry sediment respectively. The highest concentrations of barium, copper, and lead are found at the station with the highest amount of THC and olefins (LOK04). In addition LOK03, LOK05, LOK08, LOK11 and SLA29, SLA33 and SLA37 separate out with barium content at 400-800 mg/kg. At SLA28 and SLA29 the content of barium increase with increasing depth. Metal concentrations above the calculated LSC are shaded in Table 19-6 and Table 19-7.
Mercury is not detected in any of the sediment samples from the field stations, nor in the sediments from the field-specific reference station.
At SLE the barium content ranges from 40-103 mg/kg. The barium content increased down the sediment core from SLE17 and the 3-6 cm layer contains 10 times more barium than the 0-1 cm layer. Along the four axes at SLA gradients of decreasing barium content with increasing distance from the centres are found. At Loke the highest concentrations of barium are found at the innermost stations. All stations at Sleipner Øst, except SLE21 and SLA 27, are contaminated with barium. With the exception of copper at LOK04 and zinc at SLA33, the remaining of the selected metals are very evenly distributed over the field.
Comparison with previous survey(s)
This year’s THC, NPD´s, 3-6 ring aromatics, decalins and metal contents at SLE41R are comparable to the amounts found in 1997 (Mannvik et al., 1998). Analyses of a sediment core from the reference station reveal a uniform distribution of hydrocarbons down to 6 cm depth (Table 19-5), while the content of barium and cadmium increased with increasing depth (Table 19-7). Vertical sediment sections were not analysed for metals in 1997.
Compared to the 1997 results (Figure 19-4) the THC level at most of the Sleipner Øst stations are unchanged or only slightly increased (3-4 mg/kg), while the content of barium is unchanged or reduced. The only exceptions to the overall trend are found for LOK03, LOK04, LOK08 and SLA37 where both THC and barium have increased and for SLE24 where both THC and barium have decreased considerable since 1997. The largest increases in THC and barium contents are found at LOK04, where the contents have increased with 21 mg/kg (THC) and 1350 mg/kg (barium). At SLA37, the THC content has increases with 14 mg/kg and barium with 475 mg/kg. At LOK03 and LOK08 the THC contents have increased with 5 mg/kg of and barium with 250-300 mg/kg. The contents of the remaining of the selected metals are almost unchanged compared to 1997. The only exception is found for SLA24 where the content of cadmium, copper and zinc are only half the 1997 values.
As for the previous survey, the highest concentration of Petrofree ester is found at LOK05, but the amount has decreased from 13 ± 14 mg/kg in 1997 to 2 ± 0.9 mg/kg in 2000. The amounts of Petrofree are considerable reduced since the previous survey, but at Loke traces of Petrofree are found at the same stations as in 1997. Ester is only detected at one station at SLA (SLA33), while traces of Petrofree was found all six SLA stations investigated for ester in 1997.
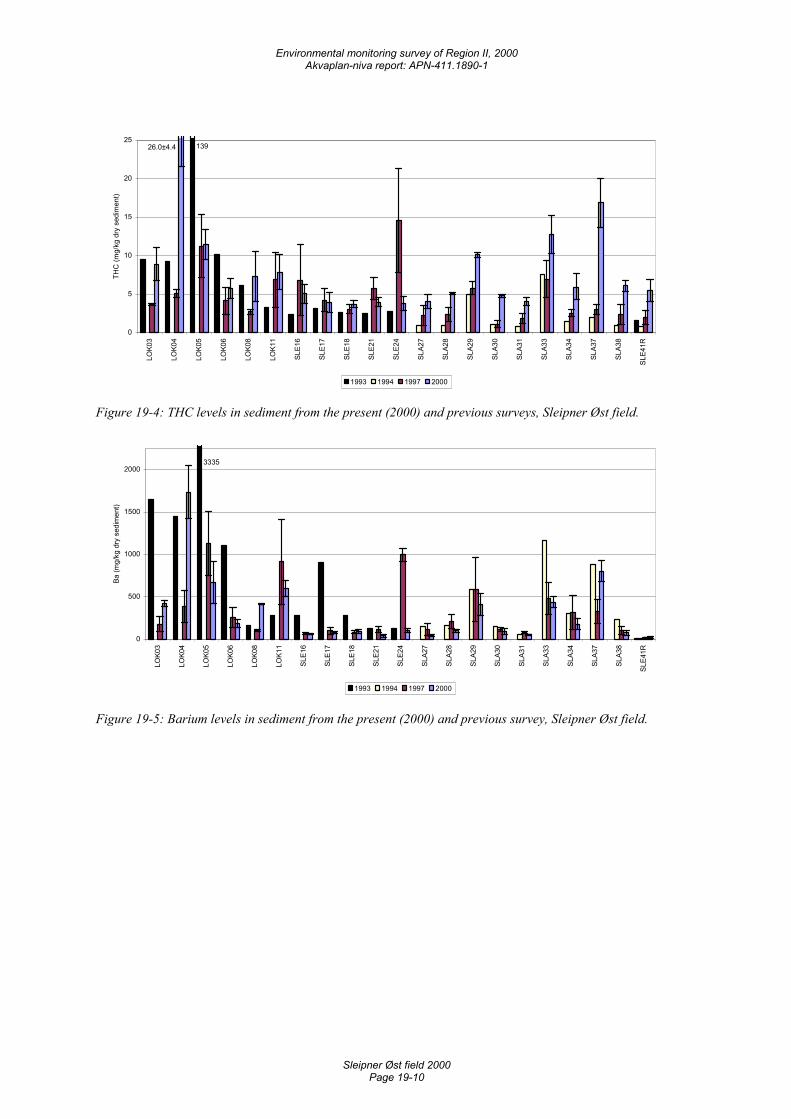
Environmental monitoring survey of Region II, 2000 Akvaplan-niva report: APN-411.1890-1
Sleipner Øst field 2000 Page 19-10
13926.0±4.4
0
5
10
15
20
25LO
K03
LOK0
4
LOK0
5
LOK0
6
LOK0
8
LOK1
1
SLE1
6
SLE1
7
SLE1
8
SLE2
1
SLE2
4
SLA2
7
SLA2
8
SLA2
9
SLA3
0
SLA3
1
SLA3
3
SLA3
4
SLA3
7
SLA3
8
SLE4
1R
THC
(mg/
kg d
ry s
edim
ent)
1993 1994 1997 2000
Figure 19-4: THC levels in sediment from the present (2000) and previous surveys, Sleipner Øst field.
3335
0
500
1000
1500
2000
LOK0
3
LOK0
4
LOK0
5
LOK0
6
LOK0
8
LOK1
1
SLE1
6
SLE1
7
SLE1
8
SLE2
1
SLE2
4
SLA2
7
SLA2
8
SLA2
9
SLA3
0
SLA3
1
SLA3
3
SLA3
4
SLA3
7
SLA3
8
SLE4
1R
Ba (m
g/kg
dry
sed
imen
t)
1993 1994 1997 2000
Figure 19-5: Barium levels in sediment from the present (2000) and previous survey, Sleipner Øst field.
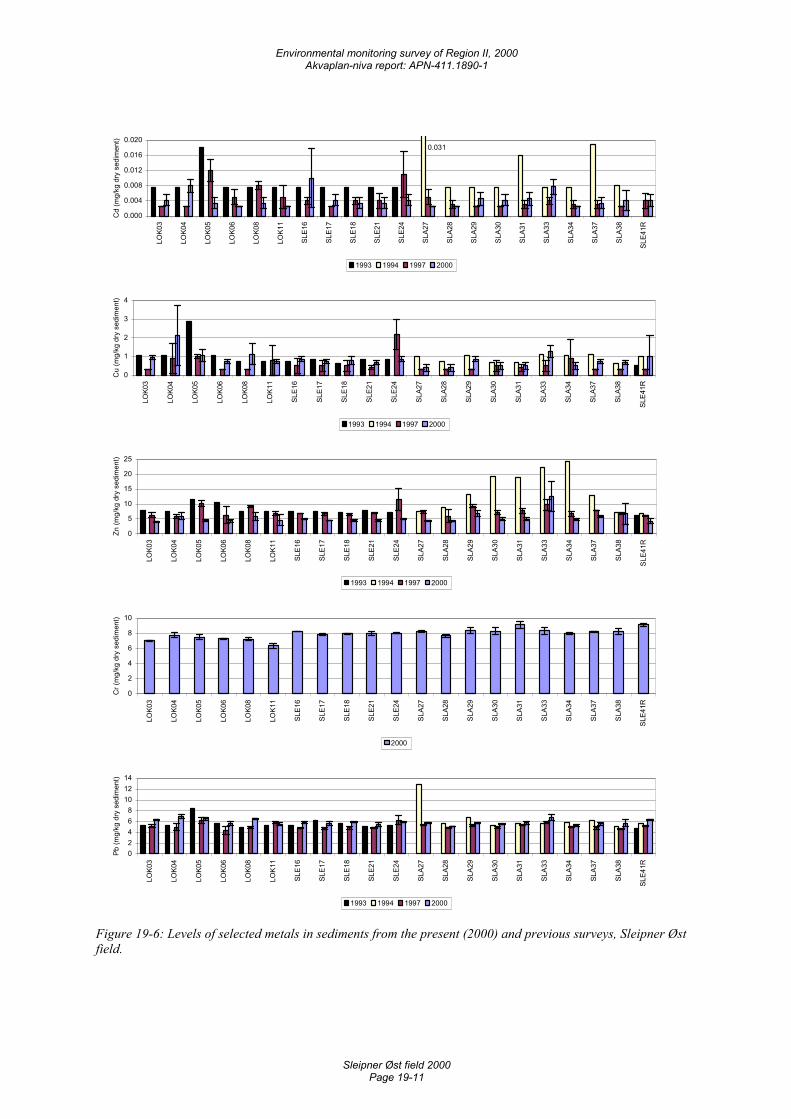
Environmental monitoring survey of Region II, 2000 Akvaplan-niva report: APN-411.1890-1
Sleipner Øst field 2000 Page 19-11
0.031
0.000
0.004
0.008
0.012
0.016
0.020
LOK0
3
LOK0
4
LOK0
5
LOK0
6
LOK0
8
LOK1
1
SLE1
6
SLE1
7
SLE1
8
SLE2
1
SLE2
4
SLA2
7
SLA2
8
SLA2
9
SLA3
0
SLA3
1
SLA3
3
SLA3
4
SLA3
7
SLA3
8
SLE4
1R
Cd
(mg/
kg d
ry s
edim
ent)
1993 1994 1997 2000
0
1
2
3
4
LOK0
3
LOK0
4
LOK0
5
LOK0
6
LOK0
8
LOK1
1
SLE1
6
SLE1
7
SLE1
8
SLE2
1
SLE2
4
SLA2
7
SLA2
8
SLA2
9
SLA3
0
SLA3
1
SLA3
3
SLA3
4
SLA3
7
SLA3
8
SLE4
1R
Cu
(mg/
kg d
ry s
edim
ent)
1993 1994 1997 2000
0
5
10
15
20
25
LOK0
3
LOK0
4
LOK0
5
LOK0
6
LOK0
8
LOK1
1
SLE1
6
SLE1
7
SLE1
8
SLE2
1
SLE2
4
SLA2
7
SLA2
8
SLA2
9
SLA3
0
SLA3
1
SLA3
3
SLA3
4
SLA3
7
SLA3
8
SLE4
1R
Zn (m
g/kg
dry
sed
imen
t)
1993 1994 1997 2000
0
2
4
6
8
10
LOK0
3
LOK0
4
LOK0
5
LOK0
6
LOK0
8
LOK1
1
SLE1
6
SLE1
7
SLE1
8
SLE2
1
SLE2
4
SLA2
7
SLA2
8
SLA2
9
SLA3
0
SLA3
1
SLA3
3
SLA3
4
SLA3
7
SLA3
8
SLE4
1R
Cr (
mg/
kg d
ry s
edim
ent)
2000
02468
101214
LOK0
3
LOK0
4
LOK0
5
LOK0
6
LOK0
8
LOK1
1
SLE1
6
SLE1
7
SLE1
8
SLE2
1
SLE2
4
SLA2
7
SLA2
8
SLA2
9
SLA3
0
SLA3
1
SLA3
3
SLA3
4
SLA3
7
SLA3
8
SLE4
1R
Pb (m
g/kg
dry
sed
imen
t)
1993 1994 1997 2000
Figure 19-6: Levels of selected metals in sediments from the present (2000) and previous surveys, Sleipner Øst field.
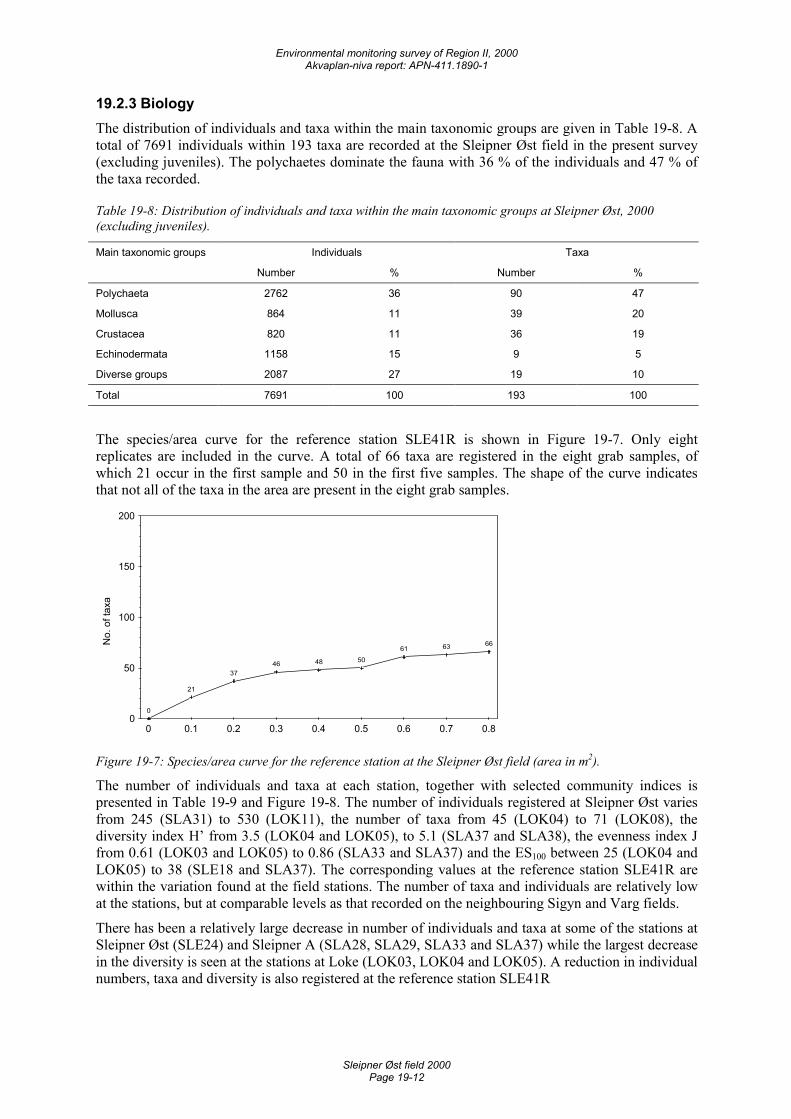
Environmental monitoring survey of Region II, 2000 Akvaplan-niva report: APN-411.1890-1
Sleipner Øst field 2000 Page 19-12
19.2.3 Biology The distribution of individuals and taxa within the main taxonomic groups are given in Table 19-8. A total of 7691 individuals within 193 taxa are recorded at the Sleipner Øst field in the present survey (excluding juveniles). The polychaetes dominate the fauna with 36 % of the individuals and 47 % of the taxa recorded.
Table 19-8: Distribution of individuals and taxa within the main taxonomic groups at Sleipner Øst, 2000 (excluding juveniles).
Main taxonomic groups Individuals Taxa
Number % Number %
Polychaeta 2762 36 90 47
Mollusca 864 11 39 20
Crustacea 820 11 36 19
Echinodermata 1158 15 9 5
Diverse groups 2087 27 19 10
Total 7691 100 193 100
The species/area curve for the reference station SLE41R is shown in Figure 19-7. Only eight replicates are included in the curve. A total of 66 taxa are registered in the eight grab samples, of which 21 occur in the first sample and 50 in the first five samples. The shape of the curve indicates that not all of the taxa in the area are present in the eight grab samples.
No.
of t
axa
0
21
3746 48 50
61 63 66
0
50
100
150
200
0 0.1 0.2 0.3 0.4 0.5 0.6 0.7 0.8
Figure 19-7: Species/area curve for the reference station at the Sleipner Øst field (area in m2).
The number of individuals and taxa at each station, together with selected community indices is presented in Table 19-9 and Figure 19-8. The number of individuals registered at Sleipner Øst varies from 245 (SLA31) to 530 (LOK11), the number of taxa from 45 (LOK04) to 71 (LOK08), the diversity index H’ from 3.5 (LOK04 and LOK05), to 5.1 (SLA37 and SLA38), the evenness index J from 0.61 (LOK03 and LOK05) to 0.86 (SLA33 and SLA37) and the ES100 between 25 (LOK04 and LOK05) to 38 (SLE18 and SLA37). The corresponding values at the reference station SLE41R are within the variation found at the field stations. The number of taxa and individuals are relatively low at the stations, but at comparable levels as that recorded on the neighbouring Sigyn and Varg fields.
There has been a relatively large decrease in number of individuals and taxa at some of the stations at Sleipner Øst (SLE24) and Sleipner A (SLA28, SLA29, SLA33 and SLA37) while the largest decrease in the diversity is seen at the stations at Loke (LOK03, LOK04 and LOK05). A reduction in individual numbers, taxa and diversity is also registered at the reference station SLE41R
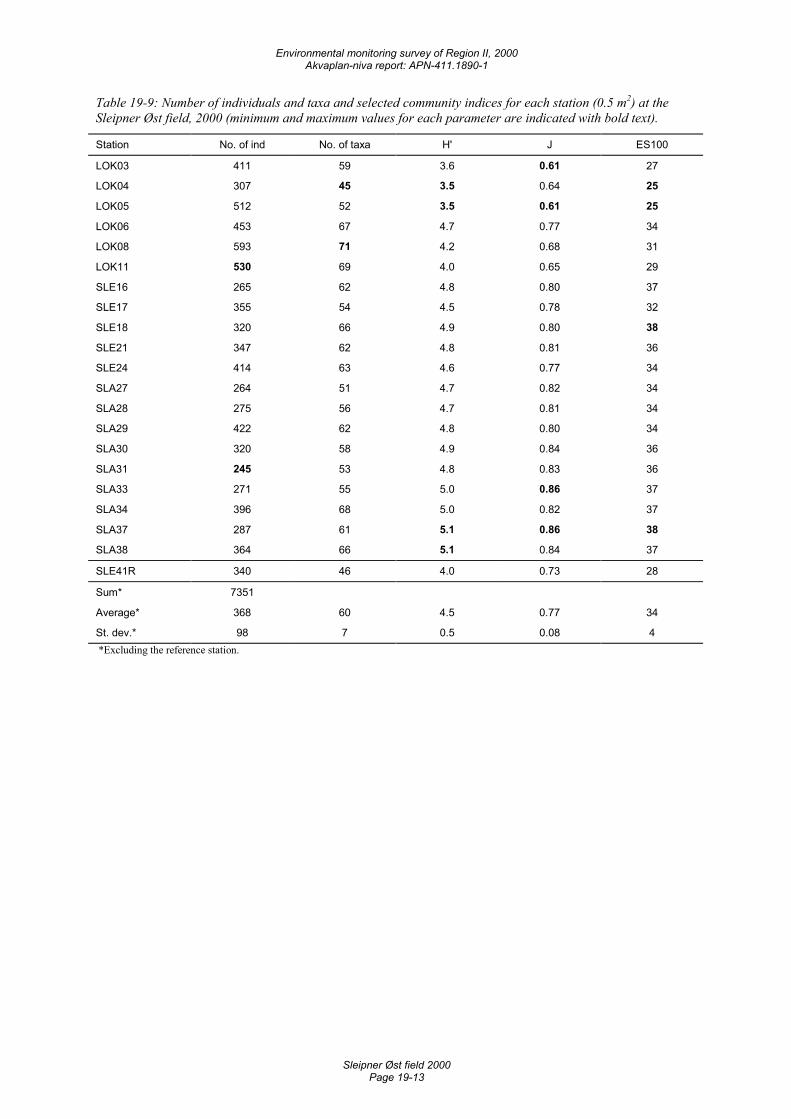
Environmental monitoring survey of Region II, 2000 Akvaplan-niva report: APN-411.1890-1
Sleipner Øst field 2000 Page 19-13
Table 19-9: Number of individuals and taxa and selected community indices for each station (0.5 m2) at the Sleipner Øst field, 2000 (minimum and maximum values for each parameter are indicated with bold text).
Station No. of ind No. of taxa H' J ES100
LOK03 411 59 3.6 0.61 27
LOK04 307 45 3.5 0.64 25
LOK05 512 52 3.5 0.61 25
LOK06 453 67 4.7 0.77 34
LOK08 593 71 4.2 0.68 31
LOK11 530 69 4.0 0.65 29
SLE16 265 62 4.8 0.80 37
SLE17 355 54 4.5 0.78 32
SLE18 320 66 4.9 0.80 38
SLE21 347 62 4.8 0.81 36
SLE24 414 63 4.6 0.77 34
SLA27 264 51 4.7 0.82 34
SLA28 275 56 4.7 0.81 34
SLA29 422 62 4.8 0.80 34
SLA30 320 58 4.9 0.84 36
SLA31 245 53 4.8 0.83 36
SLA33 271 55 5.0 0.86 37
SLA34 396 68 5.0 0.82 37
SLA37 287 61 5.1 0.86 38
SLA38 364 66 5.1 0.84 37
SLE41R 340 46 4.0 0.73 28
Sum* 7351
Average* 368 60 4.5 0.77 34
St. dev.* 98 7 0.5 0.08 4 *Excluding the reference station.
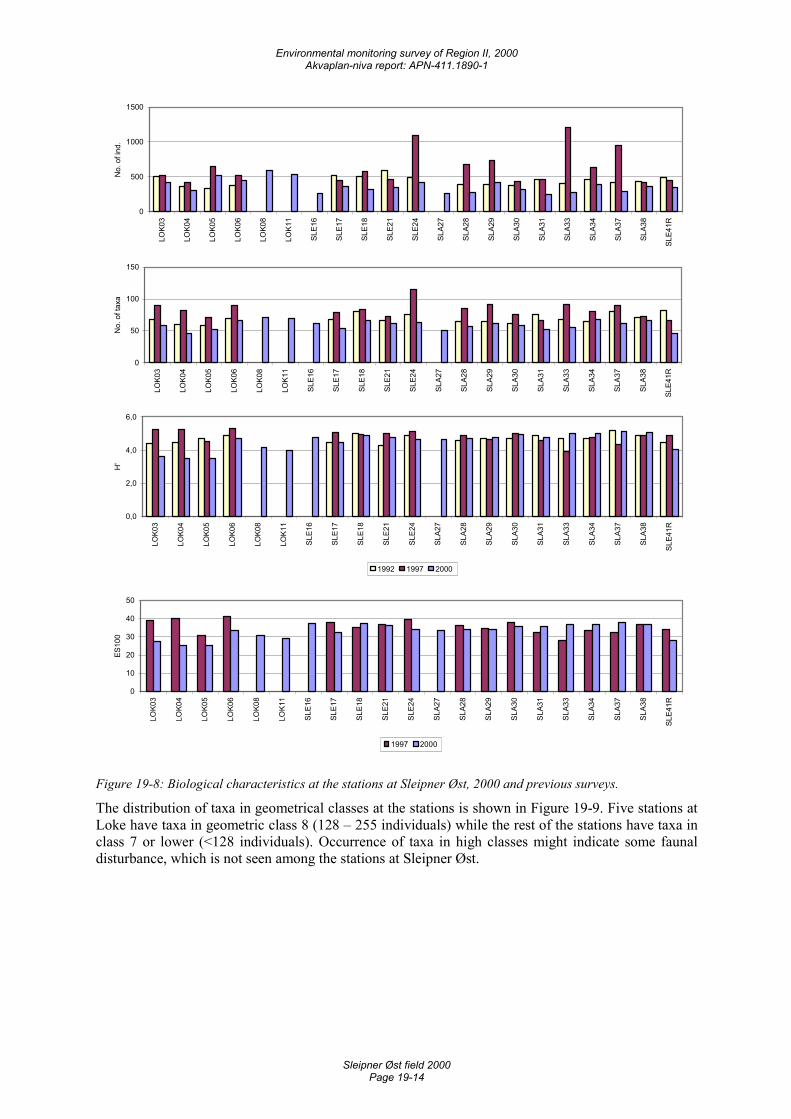
Environmental monitoring survey of Region II, 2000 Akvaplan-niva report: APN-411.1890-1
Sleipner Øst field 2000 Page 19-14
0
500
1000
1500
LOK0
3
LOK0
4
LOK0
5
LOK0
6
LOK0
8
LOK1
1
SLE1
6
SLE1
7
SLE1
8
SLE2
1
SLE2
4
SLA2
7
SLA2
8
SLA2
9
SLA3
0
SLA3
1
SLA3
3
SLA3
4
SLA3
7
SLA3
8
SLE4
1R
No.
of i
nd.
0
50
100
150
LOK0
3
LOK0
4
LOK0
5
LOK0
6
LOK0
8
LOK1
1
SLE1
6
SLE1
7
SLE1
8
SLE2
1
SLE2
4
SLA2
7
SLA2
8
SLA2
9
SLA3
0
SLA3
1
SLA3
3
SLA3
4
SLA3
7
SLA3
8
SLE4
1R
No.
of t
axa
0,0
2,0
4,0
6,0
LOK0
3
LOK0
4
LOK0
5
LOK0
6
LOK0
8
LOK1
1
SLE1
6
SLE1
7
SLE1
8
SLE2
1
SLE2
4
SLA2
7
SLA2
8
SLA2
9
SLA3
0
SLA3
1
SLA3
3
SLA3
4
SLA3
7
SLA3
8
SLE4
1R
H'
1992 1997 2000
0
10
20
30
40
50
LOK0
3
LOK0
4
LOK0
5
LOK0
6
LOK0
8
LOK1
1
SLE1
6
SLE1
7
SLE1
8
SLE2
1
SLE2
4
SLA2
7
SLA2
8
SLA2
9
SLA3
0
SLA3
1
SLA3
3
SLA3
4
SLA3
7
SLA3
8
SLE4
1R
ES10
0
1997 2000
Figure 19-8: Biological characteristics at the stations at Sleipner Øst, 2000 and previous surveys.
The distribution of taxa in geometrical classes at the stations is shown in Figure 19-9. Five stations at Loke have taxa in geometric class 8 (128 – 255 individuals) while the rest of the stations have taxa in class 7 or lower (<128 individuals). Occurrence of taxa in high classes might indicate some faunal disturbance, which is not seen among the stations at Sleipner Øst.
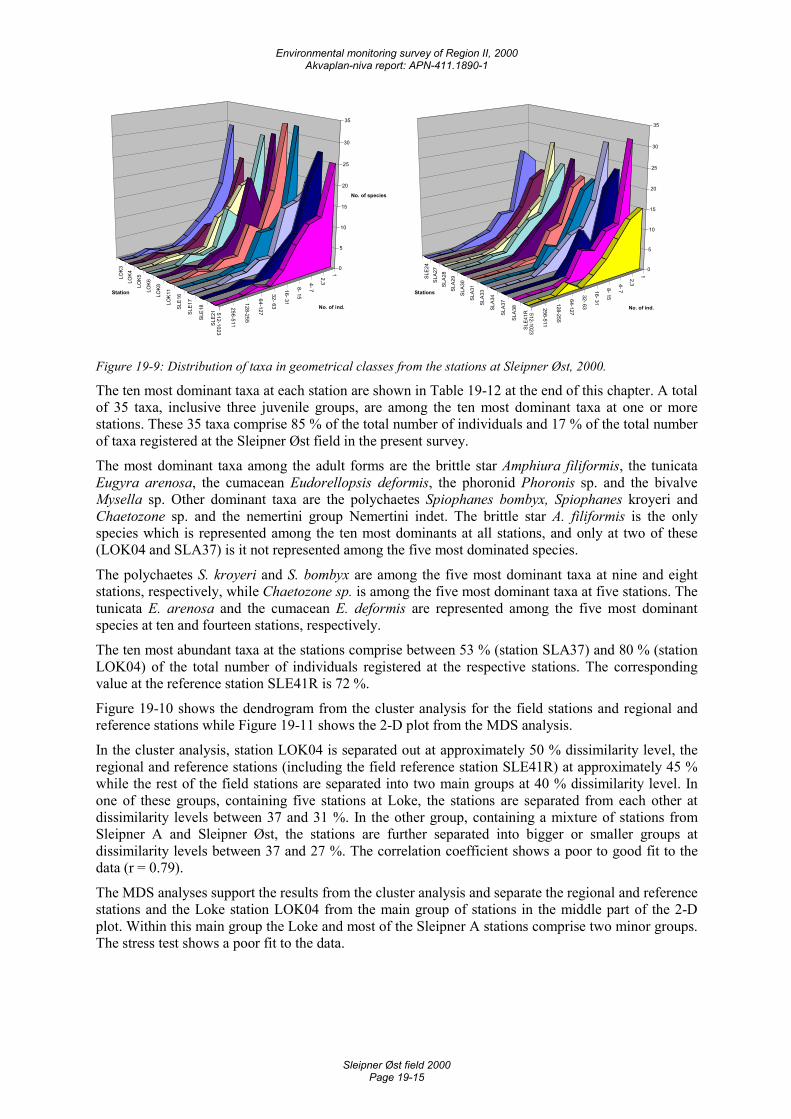
Environmental monitoring survey of Region II, 2000 Akvaplan-niva report: APN-411.1890-1
Sleipner Øst field 2000 Page 19-15
1
2,3 4- 7
8- 15
16- 31
32- 63
64-127
128-255
256-511
512-1023
LOK3
LOK4
LOK5
LOK6
LOK8
LOK1
1
SLE1
6
SLE1
7
SLE1
8
SLE2
1
0
5
10
15
20
25
30
35
No. of species
No. of ind.
Station
1
2,3 4- 7 8- 15
16- 31
32- 63
64-127
128-255
256-511
512-1023
SLE
24S
LA27
SLA
28
SLA
29
SLA
30
SLA
31
SLA
33
SLA
34
SLA
37
SLA
38
SLE
41R
0
5
10
15
20
25
30
35
No. of ind.
Stations
Figure 19-9: Distribution of taxa in geometrical classes from the stations at Sleipner Øst, 2000.
The ten most dominant taxa at each station are shown in Table 19-12 at the end of this chapter. A total of 35 taxa, inclusive three juvenile groups, are among the ten most dominant taxa at one or more stations. These 35 taxa comprise 85 % of the total number of individuals and 17 % of the total number of taxa registered at the Sleipner Øst field in the present survey.
The most dominant taxa among the adult forms are the brittle star Amphiura filiformis, the tunicata Eugyra arenosa, the cumacean Eudorellopsis deformis, the phoronid Phoronis sp. and the bivalve Mysella sp. Other dominant taxa are the polychaetes Spiophanes bombyx, Spiophanes kroyeri and Chaetozone sp. and the nemertini group Nemertini indet. The brittle star A. filiformis is the only species which is represented among the ten most dominants at all stations, and only at two of these (LOK04 and SLA37) is it not represented among the five most dominated species.
The polychaetes S. kroyeri and S. bombyx are among the five most dominant taxa at nine and eight stations, respectively, while Chaetozone sp. is among the five most dominant taxa at five stations. The tunicata E. arenosa and the cumacean E. deformis are represented among the five most dominant species at ten and fourteen stations, respectively.
The ten most abundant taxa at the stations comprise between 53 % (station SLA37) and 80 % (station LOK04) of the total number of individuals registered at the respective stations. The corresponding value at the reference station SLE41R is 72 %.
Figure 19-10 shows the dendrogram from the cluster analysis for the field stations and regional and reference stations while Figure 19-11 shows the 2-D plot from the MDS analysis.
In the cluster analysis, station LOK04 is separated out at approximately 50 % dissimilarity level, the regional and reference stations (including the field reference station SLE41R) at approximately 45 % while the rest of the field stations are separated into two main groups at 40 % dissimilarity level. In one of these groups, containing five stations at Loke, the stations are separated from each other at dissimilarity levels between 37 and 31 %. In the other group, containing a mixture of stations from Sleipner A and Sleipner Øst, the stations are further separated into bigger or smaller groups at dissimilarity levels between 37 and 27 %. The correlation coefficient shows a poor to good fit to the data (r = 0.79).
The MDS analyses support the results from the cluster analysis and separate the regional and reference stations and the Loke station LOK04 from the main group of stations in the middle part of the 2-D plot. Within this main group the Loke and most of the Sleipner A stations comprise two minor groups. The stress test shows a poor fit to the data.
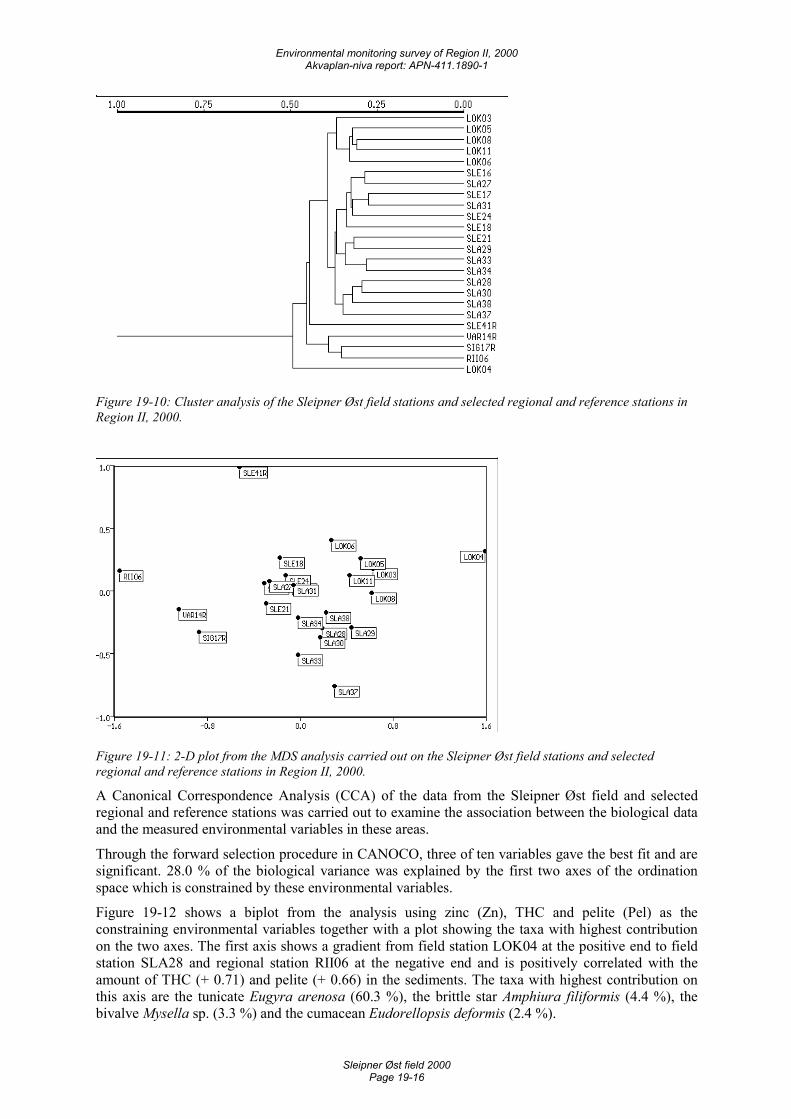
Environmental monitoring survey of Region II, 2000 Akvaplan-niva report: APN-411.1890-1
Sleipner Øst field 2000 Page 19-16
Figure 19-10: Cluster analysis of the Sleipner Øst field stations and selected regional and reference stations in Region II, 2000.
Figure 19-11: 2-D plot from the MDS analysis carried out on the Sleipner Øst field stations and selected regional and reference stations in Region II, 2000.
A Canonical Correspondence Analysis (CCA) of the data from the Sleipner Øst field and selected regional and reference stations was carried out to examine the association between the biological data and the measured environmental variables in these areas.
Through the forward selection procedure in CANOCO, three of ten variables gave the best fit and are significant. 28.0 % of the biological variance was explained by the first two axes of the ordination space which is constrained by these environmental variables.
Figure 19-12 shows a biplot from the analysis using zinc (Zn), THC and pelite (Pel) as the constraining environmental variables together with a plot showing the taxa with highest contribution on the two axes. The first axis shows a gradient from field station LOK04 at the positive end to field station SLA28 and regional station RII06 at the negative end and is positively correlated with the amount of THC (+ 0.71) and pelite (+ 0.66) in the sediments. The taxa with highest contribution on this axis are the tunicate Eugyra arenosa (60.3 %), the brittle star Amphiura filiformis (4.4 %), the bivalve Mysella sp. (3.3 %) and the cumacean Eudorellopsis deformis (2.4 %).
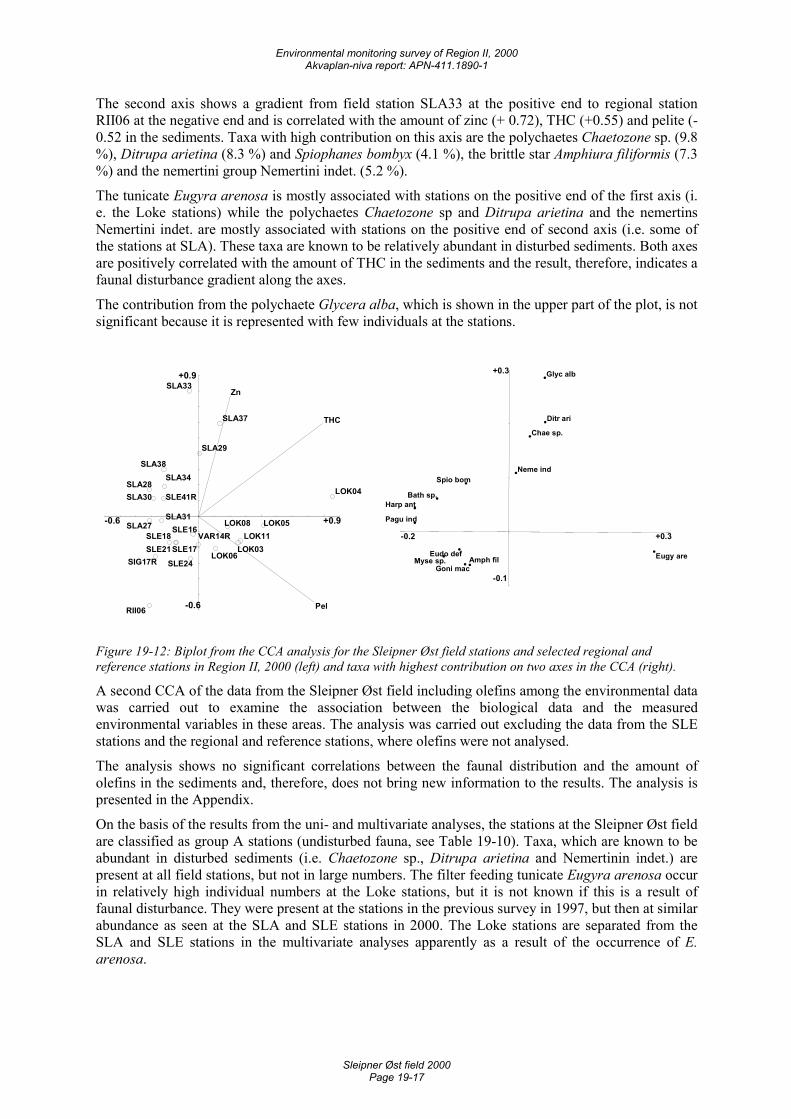
Environmental monitoring survey of Region II, 2000 Akvaplan-niva report: APN-411.1890-1
Sleipner Øst field 2000 Page 19-17
The second axis shows a gradient from field station SLA33 at the positive end to regional station RII06 at the negative end and is correlated with the amount of zinc (+ 0.72), THC (+0.55) and pelite (- 0.52 in the sediments. Taxa with high contribution on this axis are the polychaetes Chaetozone sp. (9.8 %), Ditrupa arietina (8.3 %) and Spiophanes bombyx (4.1 %), the brittle star Amphiura filiformis (7.3 %) and the nemertini group Nemertini indet. (5.2 %).
The tunicate Eugyra arenosa is mostly associated with stations on the positive end of the first axis (i. e. the Loke stations) while the polychaetes Chaetozone sp and Ditrupa arietina and the nemertins Nemertini indet. are mostly associated with stations on the positive end of second axis (i.e. some of the stations at SLA). These taxa are known to be relatively abundant in disturbed sediments. Both axes are positively correlated with the amount of THC in the sediments and the result, therefore, indicates a faunal disturbance gradient along the axes.
The contribution from the polychaete Glycera alba, which is shown in the upper part of the plot, is not significant because it is represented with few individuals at the stations.
-0.6 +0.9
-0.6
+0.9
THC
Pel
Zn
LOK04
LOK05
RII06
SLA28
SLA27
SLA30
SIG17R
LOK11LOK03
SLA31
SLE41R
SLA38SLA34
LOK08SLE18
SLE17SLE21
SLA37
LOK06
SLA33
SLE24
SLE16
SLA29
VAR14R -0.2 +0.3
-0.1
+0.3
Eugy are
Pagu ind
Harp antBath sp.
Myse sp.Eudo def
Goni mac
Spio bom
Amph fil
Ditr ari
Glyc alb
Chae sp.
Neme ind
Figure 19-12: Biplot from the CCA analysis for the Sleipner Øst field stations and selected regional and reference stations in Region II, 2000 (left) and taxa with highest contribution on two axes in the CCA (right).
A second CCA of the data from the Sleipner Øst field including olefins among the environmental data was carried out to examine the association between the biological data and the measured environmental variables in these areas. The analysis was carried out excluding the data from the SLE stations and the regional and reference stations, where olefins were not analysed.
The analysis shows no significant correlations between the faunal distribution and the amount of olefins in the sediments and, therefore, does not bring new information to the results. The analysis is presented in the Appendix.
On the basis of the results from the uni- and multivariate analyses, the stations at the Sleipner Øst field are classified as group A stations (undisturbed fauna, see Table 19-10). Taxa, which are known to be abundant in disturbed sediments (i.e. Chaetozone sp., Ditrupa arietina and Nemertinin indet.) are present at all field stations, but not in large numbers. The filter feeding tunicate Eugyra arenosa occur in relatively high individual numbers at the Loke stations, but it is not known if this is a result of faunal disturbance. They were present at the stations in the previous survey in 1997, but then at similar abundance as seen at the SLA and SLE stations in 2000. The Loke stations are separated from the SLA and SLE stations in the multivariate analyses apparently as a result of the occurrence of E. arenosa.
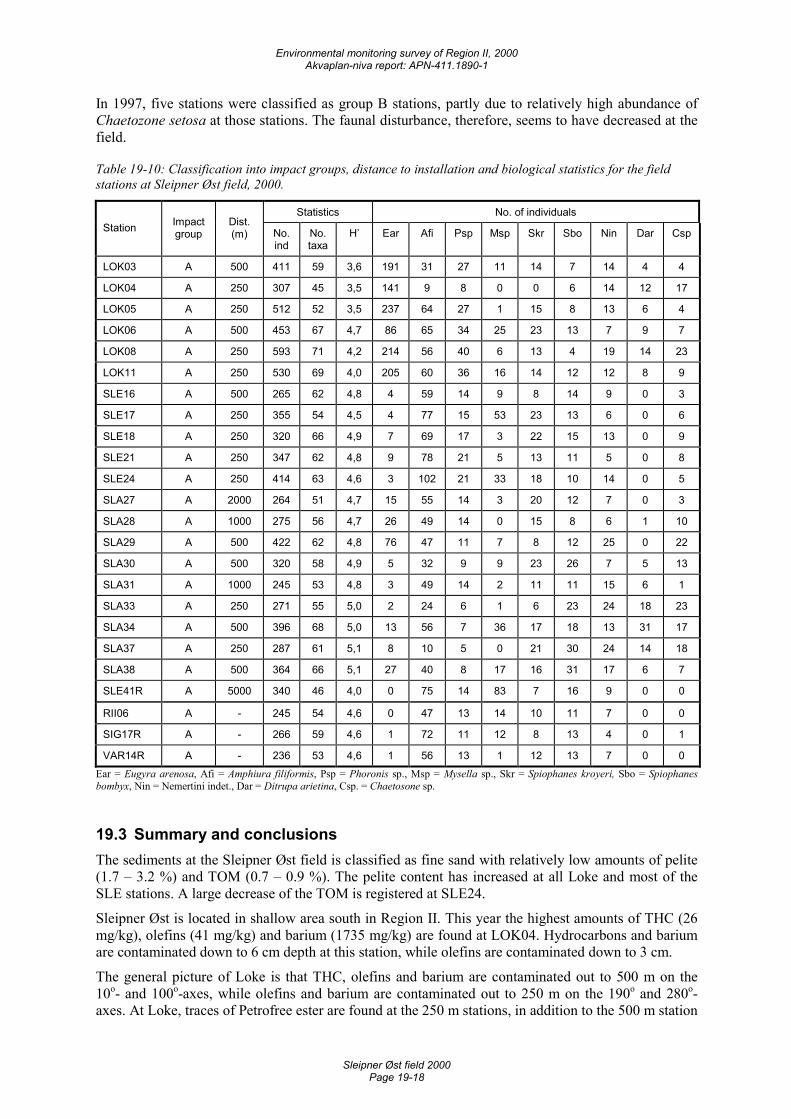
Environmental monitoring survey of Region II, 2000 Akvaplan-niva report: APN-411.1890-1
Sleipner Øst field 2000 Page 19-18
In 1997, five stations were classified as group B stations, partly due to relatively high abundance of Chaetozone setosa at those stations. The faunal disturbance, therefore, seems to have decreased at the field.
Table 19-10: Classification into impact groups, distance to installation and biological statistics for the field stations at Sleipner Øst field, 2000.
Statistics No. of individuals Station Impact
group Dist. (m) No.
ind No. taxa
H’ Ear Afi Psp Msp Skr Sbo Nin Dar Csp
LOK03 A 500 411 59 3,6 191 31 27 11 14 7 14 4 4
LOK04 A 250 307 45 3,5 141 9 8 0 0 6 14 12 17
LOK05 A 250 512 52 3,5 237 64 27 1 15 8 13 6 4
LOK06 A 500 453 67 4,7 86 65 34 25 23 13 7 9 7
LOK08 A 250 593 71 4,2 214 56 40 6 13 4 19 14 23
LOK11 A 250 530 69 4,0 205 60 36 16 14 12 12 8 9
SLE16 A 500 265 62 4,8 4 59 14 9 8 14 9 0 3
SLE17 A 250 355 54 4,5 4 77 15 53 23 13 6 0 6
SLE18 A 250 320 66 4,9 7 69 17 3 22 15 13 0 9
SLE21 A 250 347 62 4,8 9 78 21 5 13 11 5 0 8
SLE24 A 250 414 63 4,6 3 102 21 33 18 10 14 0 5
SLA27 A 2000 264 51 4,7 15 55 14 3 20 12 7 0 3
SLA28 A 1000 275 56 4,7 26 49 14 0 15 8 6 1 10
SLA29 A 500 422 62 4,8 76 47 11 7 8 12 25 0 22
SLA30 A 500 320 58 4,9 5 32 9 9 23 26 7 5 13
SLA31 A 1000 245 53 4,8 3 49 14 2 11 11 15 6 1
SLA33 A 250 271 55 5,0 2 24 6 1 6 23 24 18 23
SLA34 A 500 396 68 5,0 13 56 7 36 17 18 13 31 17
SLA37 A 250 287 61 5,1 8 10 5 0 21 30 24 14 18
SLA38 A 500 364 66 5,1 27 40 8 17 16 31 17 6 7
SLE41R A 5000 340 46 4,0 0 75 14 83 7 16 9 0 0
RII06 A - 245 54 4,6 0 47 13 14 10 11 7 0 0
SIG17R A - 266 59 4,6 1 72 11 12 8 13 4 0 1
VAR14R A - 236 53 4,6 1 56 13 1 12 13 7 0 0 Ear = Eugyra arenosa, Afi = Amphiura filiformis, Psp = Phoronis sp., Msp = Mysella sp., Skr = Spiophanes kroyeri, Sbo = Spiophanes bombyx, Nin = Nemertini indet., Dar = Ditrupa arietina, Csp. = Chaetosone sp.
19.3 Summary and conclusions The sediments at the Sleipner Øst field is classified as fine sand with relatively low amounts of pelite (1.7 – 3.2 %) and TOM (0.7 – 0.9 %). The pelite content has increased at all Loke and most of the SLE stations. A large decrease of the TOM is registered at SLE24.
Sleipner Øst is located in shallow area south in Region II. This year the highest amounts of THC (26 mg/kg), olefins (41 mg/kg) and barium (1735 mg/kg) are found at LOK04. Hydrocarbons and barium are contaminated down to 6 cm depth at this station, while olefins are contaminated down to 3 cm.
The general picture of Loke is that THC, olefins and barium are contaminated out to 500 m on the 10o- and 100o-axes, while olefins and barium are contaminated out to 250 m on the 190o and 280o-axes. At Loke, traces of Petrofree ester are found at the 250 m stations, in addition to the 500 m station
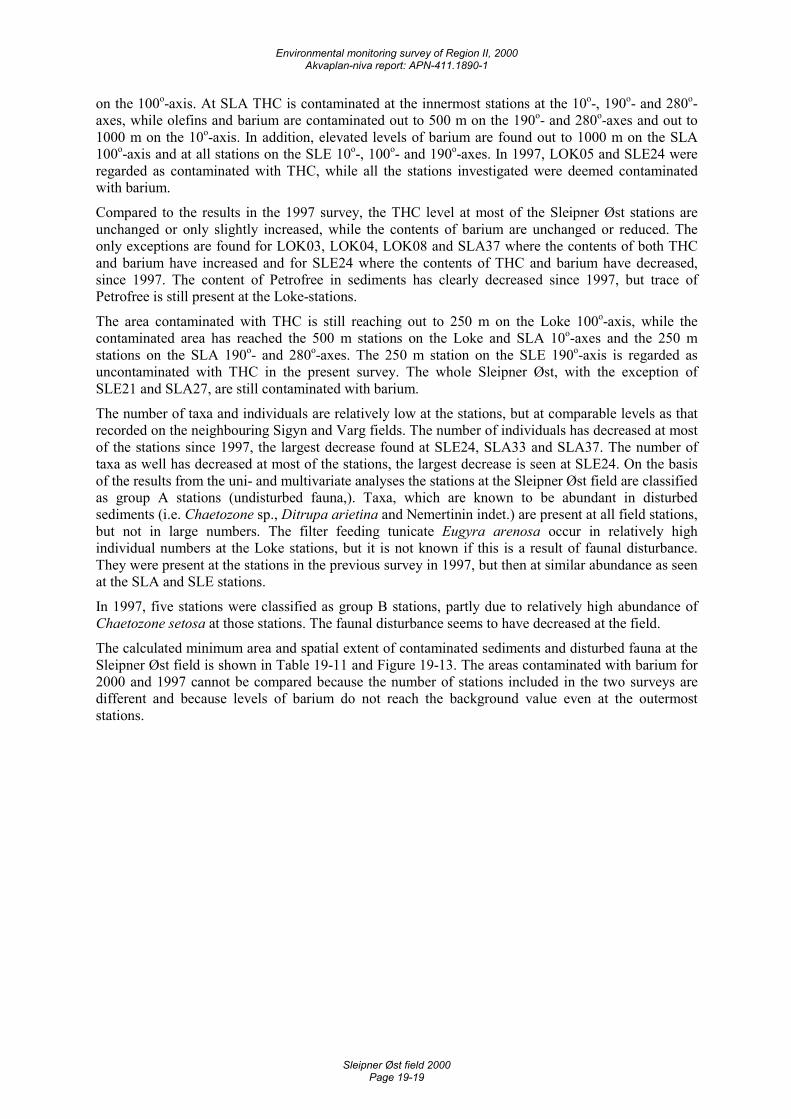
Environmental monitoring survey of Region II, 2000 Akvaplan-niva report: APN-411.1890-1
Sleipner Øst field 2000 Page 19-19
on the 100o-axis. At SLA THC is contaminated at the innermost stations at the 10o-, 190o- and 280o-axes, while olefins and barium are contaminated out to 500 m on the 190o- and 280o-axes and out to 1000 m on the 10o-axis. In addition, elevated levels of barium are found out to 1000 m on the SLA 100o-axis and at all stations on the SLE 10o-, 100o- and 190o-axes. In 1997, LOK05 and SLE24 were regarded as contaminated with THC, while all the stations investigated were deemed contaminated with barium.
Compared to the results in the 1997 survey, the THC level at most of the Sleipner Øst stations are unchanged or only slightly increased, while the contents of barium are unchanged or reduced. The only exceptions are found for LOK03, LOK04, LOK08 and SLA37 where the contents of both THC and barium have increased and for SLE24 where the contents of THC and barium have decreased, since 1997. The content of Petrofree in sediments has clearly decreased since 1997, but trace of Petrofree is still present at the Loke-stations.
The area contaminated with THC is still reaching out to 250 m on the Loke 100o-axis, while the contaminated area has reached the 500 m stations on the Loke and SLA 10o-axes and the 250 m stations on the SLA 190o- and 280o-axes. The 250 m station on the SLE 190o-axis is regarded as uncontaminated with THC in the present survey. The whole Sleipner Øst, with the exception of SLE21 and SLA27, are still contaminated with barium.
The number of taxa and individuals are relatively low at the stations, but at comparable levels as that recorded on the neighbouring Sigyn and Varg fields. The number of individuals has decreased at most of the stations since 1997, the largest decrease found at SLE24, SLA33 and SLA37. The number of taxa as well has decreased at most of the stations, the largest decrease is seen at SLE24. On the basis of the results from the uni- and multivariate analyses the stations at the Sleipner Øst field are classified as group A stations (undisturbed fauna,). Taxa, which are known to be abundant in disturbed sediments (i.e. Chaetozone sp., Ditrupa arietina and Nemertinin indet.) are present at all field stations, but not in large numbers. The filter feeding tunicate Eugyra arenosa occur in relatively high individual numbers at the Loke stations, but it is not known if this is a result of faunal disturbance. They were present at the stations in the previous survey in 1997, but then at similar abundance as seen at the SLA and SLE stations.
In 1997, five stations were classified as group B stations, partly due to relatively high abundance of Chaetozone setosa at those stations. The faunal disturbance seems to have decreased at the field.
The calculated minimum area and spatial extent of contaminated sediments and disturbed fauna at the Sleipner Øst field is shown in Table 19-11 and Figure 19-13. The areas contaminated with barium for 2000 and 1997 cannot be compared because the number of stations included in the two surveys are different and because levels of barium do not reach the background value even at the outermost stations.
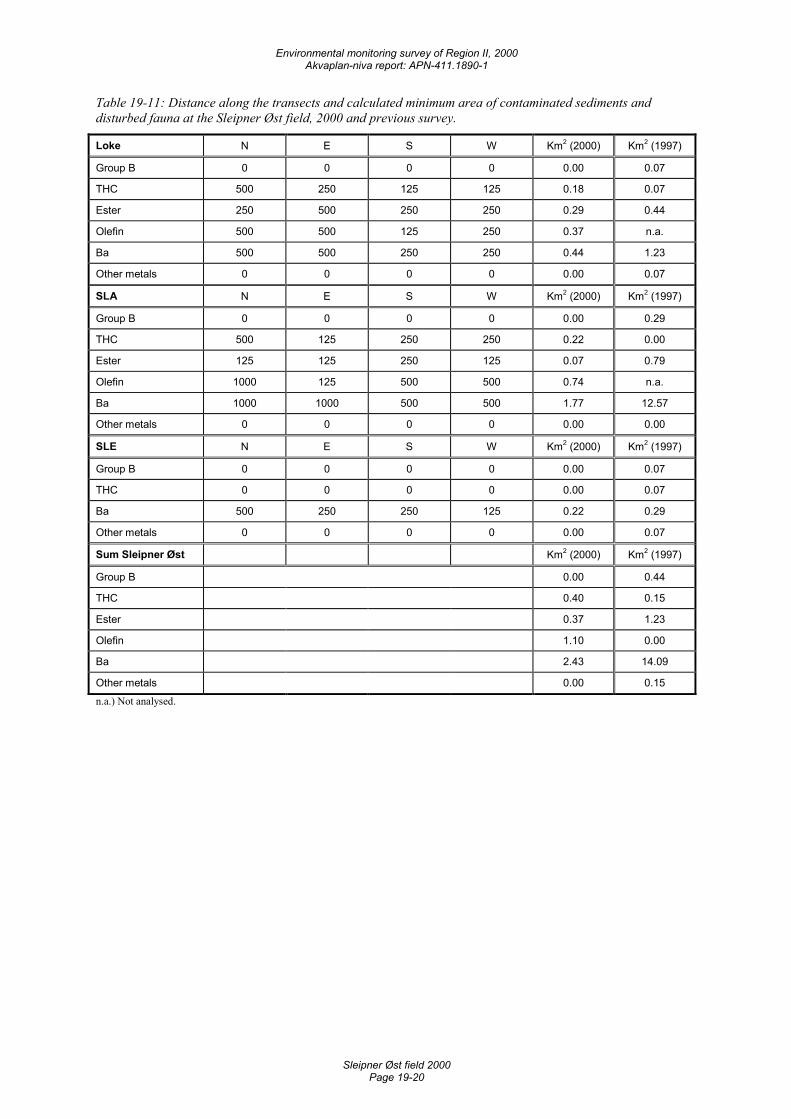
Environmental monitoring survey of Region II, 2000 Akvaplan-niva report: APN-411.1890-1
Sleipner Øst field 2000 Page 19-20
Table 19-11: Distance along the transects and calculated minimum area of contaminated sediments and disturbed fauna at the Sleipner Øst field, 2000 and previous survey.
Loke N E S W Km2 (2000) Km2 (1997)
Group B 0 0 0 0 0.00 0.07
THC 500 250 125 125 0.18 0.07
Ester 250 500 250 250 0.29 0.44
Olefin 500 500 125 250 0.37 n.a.
Ba 500 500 250 250 0.44 1.23
Other metals 0 0 0 0 0.00 0.07
SLA N E S W Km2 (2000) Km2 (1997)
Group B 0 0 0 0 0.00 0.29
THC 500 125 250 250 0.22 0.00
Ester 125 125 250 125 0.07 0.79
Olefin 1000 125 500 500 0.74 n.a.
Ba 1000 1000 500 500 1.77 12.57
Other metals 0 0 0 0 0.00 0.00
SLE N E S W Km2 (2000) Km2 (1997)
Group B 0 0 0 0 0.00 0.07
THC 0 0 0 0 0.00 0.07
Ba 500 250 250 125 0.22 0.29
Other metals 0 0 0 0 0.00 0.07
Sum Sleipner Øst Km2 (2000) Km2 (1997)
Group B 0.00 0.44
THC 0.40 0.15
Ester 0.37 1.23
Olefin 1.10 0.00
Ba 2.43 14.09
Other metals 0.00 0.15 n.a.) Not analysed.
Environmental monitoring survey of Region II, 2000 Akvaplan-niva report: APN-411.1890-1
Sleipner Øst field 2000 Page 19-21
Ú
Ú
Ú
#
## #
#
#
#
#
#
###
#
##
##
##
#
##
####
#
#
#
###
#
##
##
##
#
THC mg/kg tørt sediment# < 10 (LSC RegII)# 10 - 19# 20 - 49
# 50 - 199
# > 200
Ú
Ú
Ú
######
#
#
#
###
#
##
Olefiner mg/kg tørt sediment# < 0,1# 0,1-4,9# 5,0-9,9# 10,0-29,9
# > 30.0
Ú
Ú
Ú
##
###
#
#
#
#
###
#
##
##
##
#
Ba mg/kg tørt sediment# < 100 (LSC RegII)# 100 - 499# 500 - 999
# 1000 - 2999
# > 3000
Figure 19-13: Distribution of faunal groups and amounts of THC, olefin and barium at the Sleipner Øst Field, 2000.
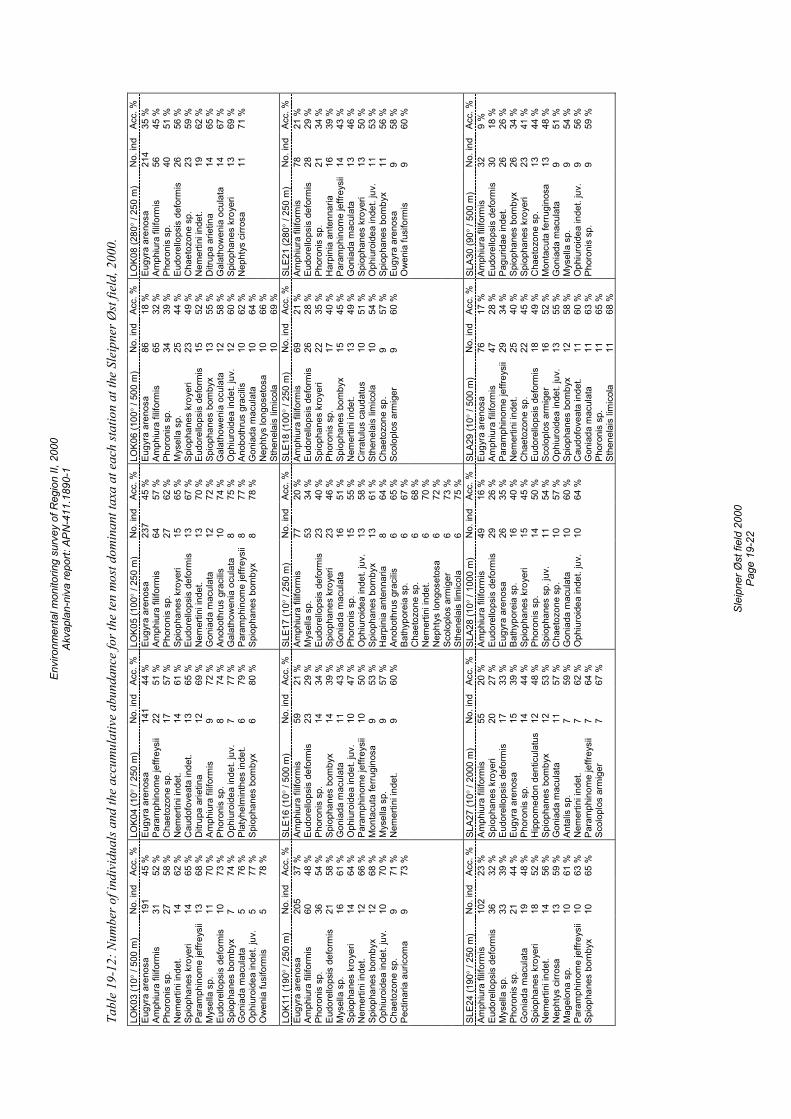
Envi
ronm
enta
l mon
itorin
g su
rvey
of R
egio
n II,
200
0 Ak
vapl
an-n
iva
repo
rt: A
PN-4
11.1
890-
1
Sl
eipn
er Ø
st fi
eld
2000
Pa
ge 1
9-22
Tabl
e 19
-12:
Num
ber o
f ind
ivid
uals
and
the
accu
mul
ativ
e ab
unda
nce
for t
he te
n m
ost d
omin
ant t
axa
at e
ach
statio
n at
the
Slei
pner
Øst
fiel
d, 2
000.
LO
K03
(10°
/ 50
0 m
) N
o. in
d Ac
c. %
LO
K04
(10°
/ 25
0 m
) N
o. in
d Ac
c. %
LO
K05
(100
° / 2
50 m
) N
o. in
d Ac
c. %
LO
K06
(100
° / 5
00 m
) N
o. in
d Ac
c. %
LO
K08
(280
° / 2
50 m
) N
o. in
d Ac
c. %
Eu
gyra
are
nosa
19
1 45
%
Eugy
ra a
reno
sa
141
44 %
Eu
gyra
are
nosa
23
7 45
%
Eugy
ra a
reno
sa
86
18 %
Eu
gyra
are
nosa
21
4 35
%
Amph
iura
filif
orm
is
31
52 %
Pa
ram
phin
ome
jeffr
eysi
i 22
51
%
Amph
iura
filif
orm
is
64
57 %
Am
phiu
ra fi
lifor
mis
65
32
%
Amph
iura
filif
orm
is
56
45 %
Ph
oron
is s
p.
27
58 %
C
haet
ozon
e sp
. 17
57
%
Phor
onis
sp.
27
62
%
Phor
onis
sp.
34
39
%
Phor
onis
sp.
40
51
%
Nem
ertin
i ind
et.
14
62 %
N
emer
tini i
ndet
. 14
61
%
Spio
phan
es k
roye
ri 15
65
%
Mys
ella
sp.
25
44
%
Eudo
rello
psis
def
orm
is
26
56 %
Sp
ioph
anes
kro
yeri
14
65 %
C
audo
fove
ata
inde
t. 13
65
%
Eudo
rello
psis
def
orm
is
13
67 %
Sp
ioph
anes
kro
yeri
23
49 %
C
haet
ozon
e sp
. 23
59
%
Para
mph
inom
e je
ffrey
sii
13
68 %
D
itrup
a ar
ietin
a 12
69
%
Nem
ertin
i ind
et.
13
70 %
Eu
dore
llops
is d
efor
mis
15
52
%
Nem
ertin
i ind
et.
19
62 %
M
ysel
la s
p.
11
70 %
Am
phiu
ra fi
lifor
mis
9
72 %
G
onia
da m
acul
ata
12
72 %
Sp
ioph
anes
bom
byx
13
55 %
D
itrup
a ar
ietin
a 14
65
%
Eudo
rello
psis
def
orm
is
10
73 %
Ph
oron
is s
p.
8 74
%
Anob
othr
us g
raci
lis
10
74 %
G
alat
how
enia
ocu
lata
12
58
%
Gal
atho
wen
ia o
cula
ta
14
67 %
Sp
ioph
anes
bom
byx
7 74
%
Oph
iuro
idea
inde
t. ju
v.
7 77
%
Gal
atho
wen
ia o
cula
ta
8 75
%
Oph
iuro
idea
inde
t. ju
v.
12
60 %
Sp
ioph
anes
kro
yeri
13
69 %
G
onia
da m
acul
ata
5 76
%
Plat
yhel
min
thes
inde
t. 6
79 %
Pa
ram
phin
ome
jeffr
eysi
i 8
77 %
An
obot
hrus
gra
cilis
10
62
%
Nep
htys
cirr
osa
11
71 %
O
phiu
roid
ea in
det.
juv.
5
77 %
Sp
ioph
anes
bom
byx
6 80
%
Spio
phan
es b
omby
x 8
78 %
G
onia
da m
acul
ata
10
64 %
Ow
enia
fusi
form
is
5 78
%
Nep
htys
long
oset
osa
10
66 %
St
hene
lais
lim
icol
a 10
69
%
LO
K11
(190
° / 2
50 m
) N
o. in
d Ac
c. %
SL
E16
(10°
/ 50
0 m
) N
o. in
d Ac
c. %
SL
E17
(10°
/ 25
0 m
) N
o. in
d Ac
c. %
SL
E18
(100
° / 2
50 m
) N
o. in
d Ac
c. %
SL
E21
(280
° / 2
50 m
) N
o. in
d Ac
c. %
Eu
gyra
are
nosa
20
5 37
%
Amph
iura
filif
orm
is
59
21 %
Am
phiu
ra fi
lifor
mis
77
20
%
Amph
iura
filif
orm
is
69
21 %
Am
phiu
ra fi
lifor
mis
78
21
%
Amph
iura
filif
orm
is
60
48 %
Eu
dore
llops
is d
efor
mis
23
29
%
Mys
ella
sp.
53
34
%
Eudo
rello
psis
def
orm
is
26
28 %
Eu
dore
llops
is d
efor
mis
28
29
%
Phor
onis
sp.
36
54
%
Phor
onis
sp.
14
34
%
Eudo
rello
psis
def
orm
is
23
40 %
Sp
ioph
anes
kro
yeri
22
35 %
Ph
oron
is s
p.
21
34 %
Eu
dore
llops
is d
efor
mis
21
58
%
Spio
phan
es b
omby
x 14
39
%
Spio
phan
es k
roye
ri 23
46
%
Phor
onis
sp.
17
40
%
Har
pini
a an
tenn
aria
16
39
%
Mys
ella
sp.
16
61
%
Gon
iada
mac
ulat
a 11
43
%
Gon
iada
mac
ulat
a 16
51
%
Spio
phan
es b
omby
x 15
45
%
Para
mph
inom
e je
ffrey
sii
14
43 %
Sp
ioph
anes
kro
yeri
14
64 %
O
phiu
roid
ea in
det.
juv.
10
47
%
Phor
onis
sp.
15
55
%
Nem
ertin
i ind
et.
13
49 %
G
onia
da m
acul
ata
13
46 %
N
emer
tini i
ndet
. 12
66
%
Para
mph
inom
e je
ffrey
sii
10
50 %
O
phiu
roid
ea in
det.
juv.
13
58
%
Cirr
atul
us c
auda
tus
10
51 %
Sp
ioph
anes
kro
yeri
13
50 %
Sp
ioph
anes
bom
byx
12
68 %
M
onta
cuta
ferru
gino
sa
9 53
%
Spio
phan
es b
omby
x 13
61
%
Sthe
nela
is li
mic
ola
10
54 %
O
phiu
roid
ea in
det.
juv.
11
53
%
Oph
iuro
idea
inde
t. ju
v.
10
70 %
M
ysel
la s
p.
9 57
%
Har
pini
a an
tenn
aria
8
64 %
C
haet
ozon
e sp
. 9
57 %
Sp
ioph
anes
bom
byx
11
56 %
C
haet
ozon
e sp
. 9
71 %
N
emer
tini i
ndet
. 9
60 %
An
obot
hrus
gra
cilis
6
65 %
Sc
olop
los
arm
iger
9
60 %
Eu
gyra
are
nosa
9
58 %
Pe
ctin
aria
aur
icom
a 9
73 %
Bath
ypor
eia
sp.
6 67
%
O
wen
ia fu
sifo
rmis
9
60 %
C
haet
ozon
e sp
. 6
68 %
N
emer
tini i
ndet
. 6
70 %
N
epht
ys lo
ngos
etos
a 6
72 %
Sc
olop
los
arm
iger
6
73 %
St
hene
lais
lim
icol
a 6
75 %
SL
E24
(190
° / 2
50 m
) N
o. in
d Ac
c. %
SL
A27
(10°
/ 20
00 m
) N
o. in
d Ac
c. %
SL
A28
(10°
/ 10
00 m
) N
o. in
d Ac
c. %
SL
A29
(10°
/ 50
0 m
) N
o. in
d Ac
c. %
SL
A30
(90°
/ 50
0 m
) N
o. in
d Ac
c. %
Am
phiu
ra fi
lifor
mis
10
2 23
%
Amph
iura
filif
orm
is
55
20 %
Am
phiu
ra fi
lifor
mis
49
16
%
Eugy
ra a
reno
sa
76
17 %
Am
phiu
ra fi
lifor
mis
32
9
%
Eudo
rello
psis
def
orm
is
36
32 %
Sp
ioph
anes
kro
yeri
20
27 %
Eu
dore
llops
is d
efor
mis
29
26
%
Amph
iura
filif
orm
is
47
28 %
Eu
dore
llops
is d
efor
mis
30
18
%
Mys
ella
sp.
33
39
%
Eudo
rello
psis
def
orm
is
17
33 %
Eu
gyra
are
nosa
26
35
%
Para
mph
inom
e je
ffrey
sii
29
34 %
Pa
gurid
ae in
det.
26
26 %
Ph
oron
is s
p.
21
44 %
Eu
gyra
are
nosa
15
39
%
Bath
ypor
eia
sp.
16
40 %
N
emer
tini i
ndet
. 25
40
%
Spio
phan
es b
omby
x 26
34
%
Gon
iada
mac
ulat
a 19
48
%
Phor
onis
sp.
14
44
%
Spio
phan
es k
roye
ri 15
45
%
Cha
etoz
one
sp.
22
45 %
Sp
ioph
anes
kro
yeri
23
41 %
Sp
ioph
anes
kro
yeri
18
52 %
H
ippo
med
on d
entic
ulat
us
12
48 %
Ph
oron
is s
p.
14
50 %
Eu
dore
llops
is d
efor
mis
18
49
%
Cha
etoz
one
sp.
13
44 %
N
emer
tini i
ndet
. 14
56
%
Spio
phan
es b
omby
x 12
53
%
Spio
phan
es s
p. ju
v.
11
54 %
Sc
olop
los
arm
iger
16
52
%
Mon
tacu
ta fe
rrugi
nosa
13
48
%
Nep
htys
cirr
osa
13
59 %
G
onia
da m
acul
ata
11
57 %
C
haet
ozon
e sp
. 10
57
%
Oph
iuro
idea
inde
t. ju
v.
13
55 %
G
onia
da m
acul
ata
9 51
%
Mag
elon
a sp
. 10
61
%
Anta
lis s
p.
7 59
%
Gon
iada
mac
ulat
a 10
60
%
Spio
phan
es b
omby
x 12
58
%
Mys
ella
sp.
9
54 %
Pa
ram
phin
ome
jeffr
eysi
i 10
63
%
Nem
ertin
i ind
et.
7 62
%
Oph
iuro
idea
inde
t. ju
v.
10
64 %
C
audo
fove
ata
inde
t. 11
60
%
Oph
iuro
idea
inde
t. ju
v.
9 56
%
Spio
phan
es b
omby
x 10
65
%
Para
mph
inom
e je
ffrey
sii
7 64
%
G
onia
da m
acul
ata
11
63 %
Ph
oron
is s
p.
9 59
%
Sc
olop
los
arm
iger
7
67 %
Phor
onis
sp.
11
65
%
Sthe
nela
is li
mic
ola
11
68 %
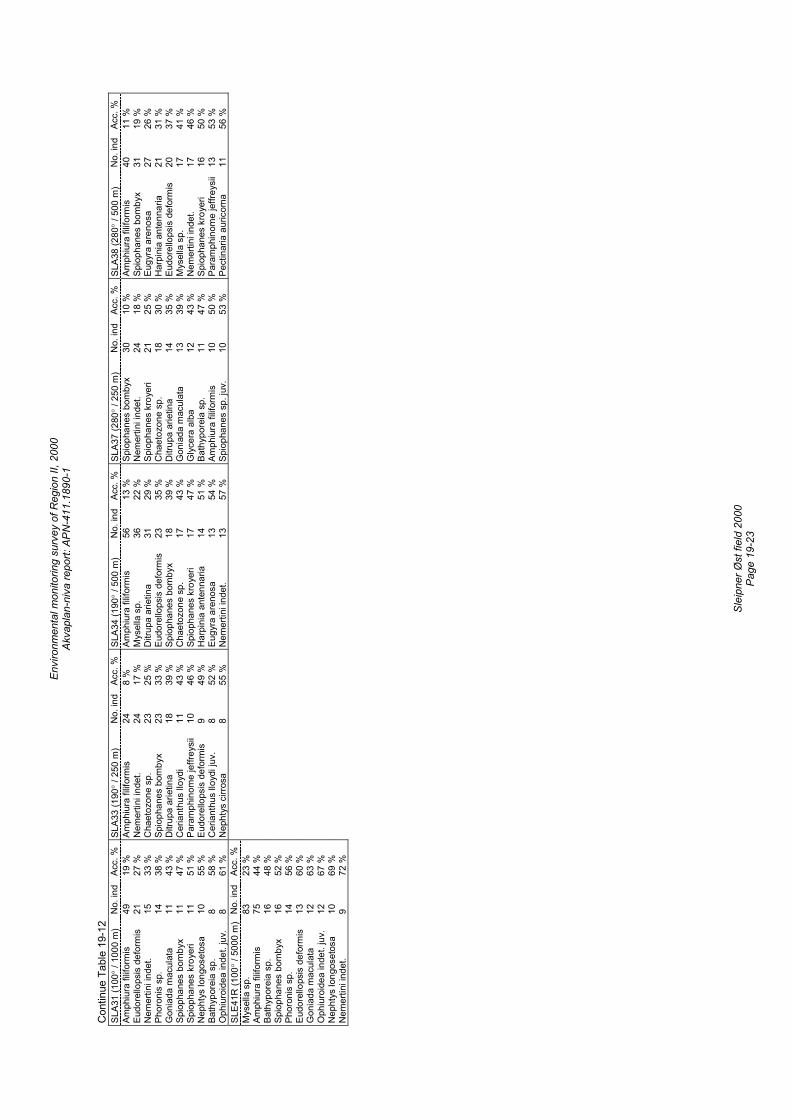
Envi
ronm
enta
l mon
itorin
g su
rvey
of R
egio
n II,
200
0 Ak
vapl
an-n
iva
repo
rt: A
PN-4
11.1
890-
1
Sl
eipn
er Ø
st fi
eld
2000
Pa
ge 1
9-23
Con
tinue
Tab
le 1
9-12
SLA3
1 (1
00°
/ 100
0 m
) N
o. in
d Ac
c. %
SL
A33
(190
° / 2
50 m
) N
o. in
d Ac
c. %
SL
A34
(190
° / 5
00 m
) N
o. in
d Ac
c. %
SL
A37
(280
° / 2
50 m
) N
o. in
d Ac
c. %
SL
A38
(280
° / 5
00 m
) N
o. in
d Ac
c. %
Am
phiu
ra fi
lifor
mis
49
19
%
Amph
iura
filif
orm
is
24
8 %
Am
phiu
ra fi
lifor
mis
56
13
%
Spio
phan
es b
omby
x 30
10
%
Amph
iura
filif
orm
is
40
11 %
Eu
dore
llops
is d
efor
mis
21
27
%
Nem
ertin
i ind
et.
24
17 %
M
ysel
la s
p.
36
22 %
N
emer
tini i
ndet
. 24
18
%
Spio
phan
es b
omby
x 31
19
%
Nem
ertin
i ind
et.
15
33 %
C
haet
ozon
e sp
. 23
25
%
Ditr
upa
arie
tina
31
29 %
Sp
ioph
anes
kro
yeri
21
25 %
Eu
gyra
are
nosa
27
26
%
Phor
onis
sp.
14
38
%
Spio
phan
es b
omby
x 23
33
%
Eudo
rello
psis
def
orm
is
23
35 %
C
haet
ozon
e sp
. 18
30
%
Har
pini
a an
tenn
aria
21
31
%
Gon
iada
mac
ulat
a 11
43
%
Ditr
upa
arie
tina
18
39 %
Sp
ioph
anes
bom
byx
18
39 %
D
itrup
a ar
ietin
a 14
35
%
Eudo
rello
psis
def
orm
is
20
37 %
Sp
ioph
anes
bom
byx
11
47 %
C
eria
nthu
s llo
ydi
11
43 %
C
haet
ozon
e sp
. 17
43
%
Gon
iada
mac
ulat
a 13
39
%
Mys
ella
sp.
17
41
%
Spio
phan
es k
roye
ri 11
51
%
Para
mph
inom
e je
ffrey
sii
10
46 %
Sp
ioph
anes
kro
yeri
17
47 %
G
lyce
ra a
lba
12
43 %
N
emer
tini i
ndet
. 17
46
%
Nep
htys
long
oset
osa
10
55 %
Eu
dore
llops
is d
efor
mis
9
49 %
H
arpi
nia
ante
nnar
ia
14
51 %
Ba
thyp
orei
a sp
. 11
47
%
Spio
phan
es k
roye
ri 16
50
%
Bath
ypor
eia
sp.
8 58
%
Cer
iant
hus
lloyd
i juv
. 8
52 %
Eu
gyra
are
nosa
13
54
%
Amph
iura
filif
orm
is
10
50 %
Pa
ram
phin
ome
jeffr
eysi
i 13
53
%
Oph
iuro
idea
inde
t. ju
v.
8 61
%
Nep
htys
cirr
osa
8 55
%
Nem
ertin
i ind
et.
13
57 %
Sp
ioph
anes
sp.
juv.
10
53
%
Pect
inar
ia a
uric
oma
11
56 %
SL
E41R
(100
° / 5
000
m)
No.
ind
Acc.
%
Mys
ella
sp.
83
23
%
Amph
iura
filif
orm
is
75
44 %
Ba
thyp
orei
a sp
. 16
48
%
Spio
phan
es b
omby
x 16
52
%
Phor
onis
sp.
14
56
%
Eudo
rello
psis
def
orm
is
13
60 %
G
onia
da m
acul
ata
12
63 %
O
phiu
roid
ea in
det.
juv.
12
67
%
Nep
htys
long
oset
osa
10
69 %
N
emer
tini i
ndet
. 9
72 %
Envi
ronm
enta
l mon
itorin
g su
rvey
of R
egio
n II,
200
0 Ak
vapl
an-n
iva
repo
rt: A
PN-4
11.1
890-
1
Sl
eipn
er Ø
st fi
eld
2000
Pa
ge 1
9-24
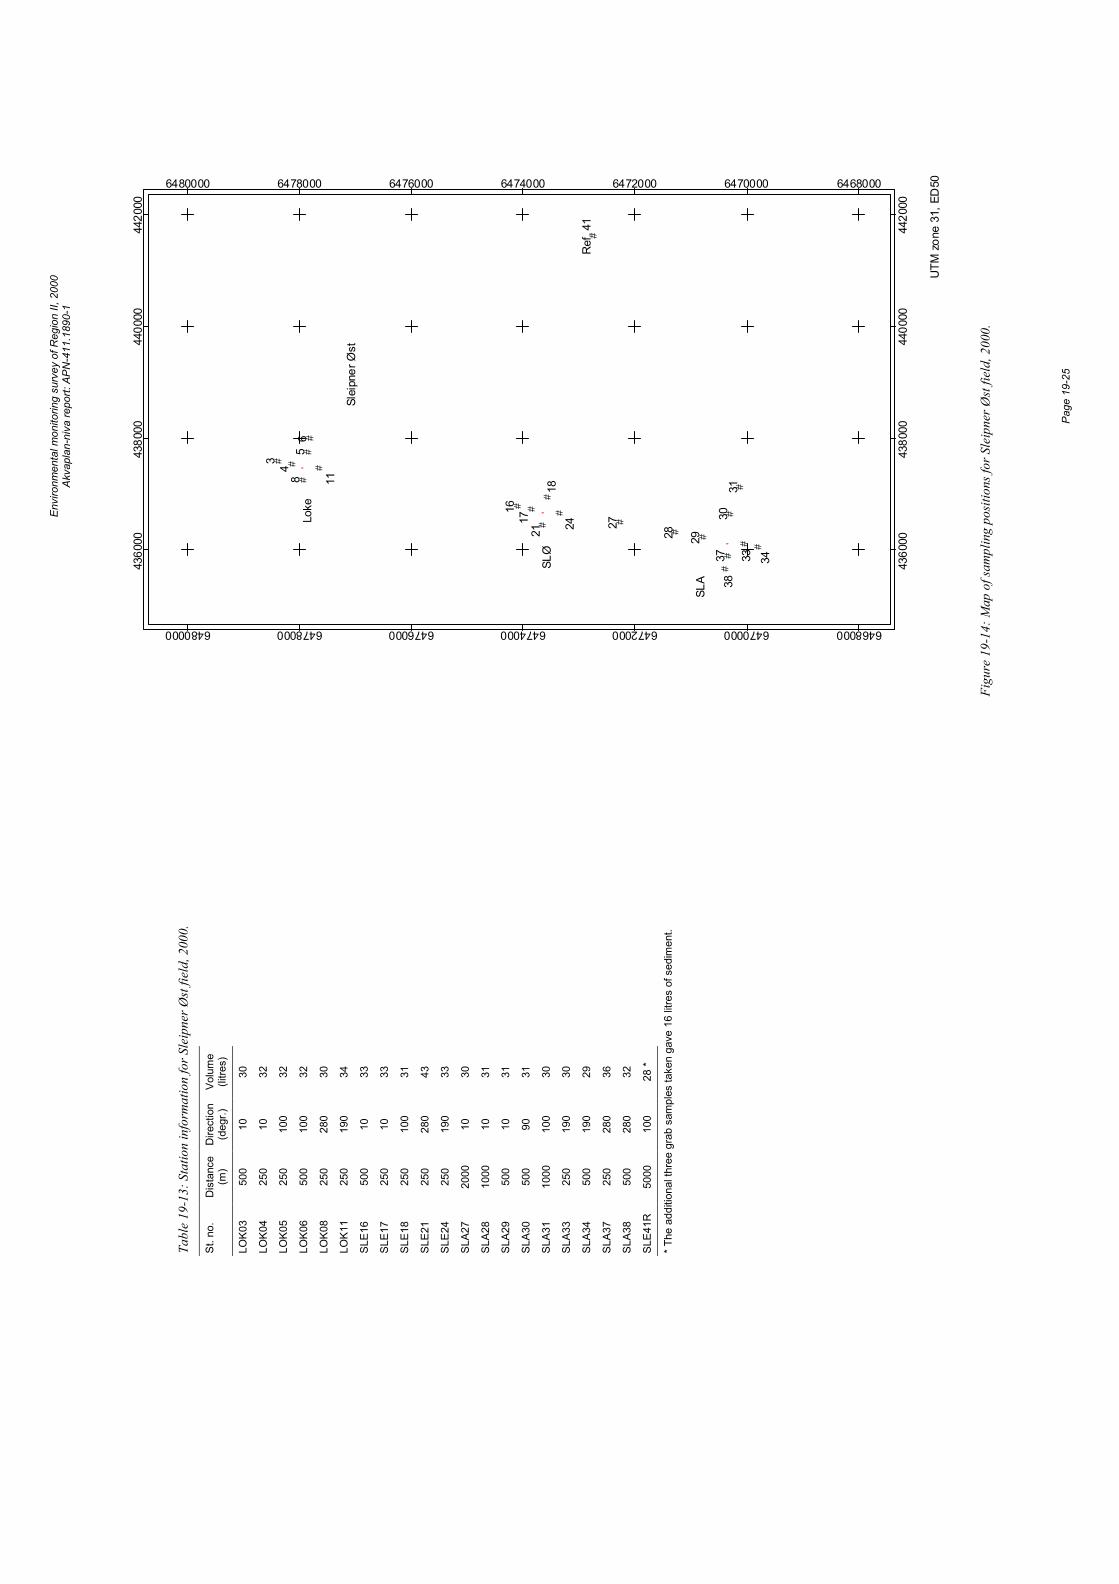
Envi
ronm
enta
l mon
itorin
g su
rvey
of R
egio
n II,
200
0 Ak
vapl
an-n
iva
repo
rt: A
PN-4
11.1
890-
1
Pa
ge 1
9-25
# #
##
#
#
# #
##
#
#
#
#
##
# #
##
#
'
'
'34
56
8 11
1617
1821 24 27
28 29
3031
33 343738
Ref
. 41
Slei
pner
Øst
Loke
SLØ
SLA
UTM
zon
e 31
, ED
50
4360
00
4360
00
4380
00
4380
00
4400
00
4400
00
4420
00
4420
00
6468000
6468000
6470000
6470000
6472000
6472000
6474000
6474000
6476000
6476000
6478000
6478000
6480000
6480000
Figu
re 1
9-14
: Map
of s
ampl
ing
posit
ions
for S
leip
ner Ø
st fie
ld, 2
000.
Tabl
e 19
-13:
Sta
tion
info
rmat
ion
for S
leip
ner Ø
st fie
ld, 2
000.
St. n
o.
Dis
tanc
e (m
) D
irect
ion
(deg
r.)
Volu
me
(litre
s)
LOK0
3 50
0 10
30
LOK0
4 25
0 10
32
LOK0
5 25
0 10
0 32
LOK0
6 50
0 10
0 32
LOK0
8 25
0 28
0 30
LOK1
1 25
0 19
0 34
SLE1
6 50
0 10
33
SLE1
7 25
0 10
33
SLE1
8 25
0 10
0 31
SLE2
1 25
0 28
0 43
SLE2
4 25
0 19
0 33
SLA2
7 20
00
10
30
SLA2
8 10
00
10
31
SLA2
9 50
0 10
31
SLA3
0 50
0 90
31
SLA3
1 10
00
100
30
SLA3
3 25
0 19
0 30
SLA3
4 50
0 19
0 29
SLA3
7 25
0 28
0 36
SLA3
8 50
0 28
0 32
SLE4
1R
5000
10
0 28
*
* The
add
ition
al th
ree
grab
sam
ples
take
n ga
ve 1
6 lit
res
of s
edim
ent.

Envi
ronm
enta
l mon
itorin
g su
rvey
of R
egio
n II,
200
0 Ak
vapl
an-n
iva
repo
rt: A
PN-4
11.1
890-
1
Pa
ge 1
9-26
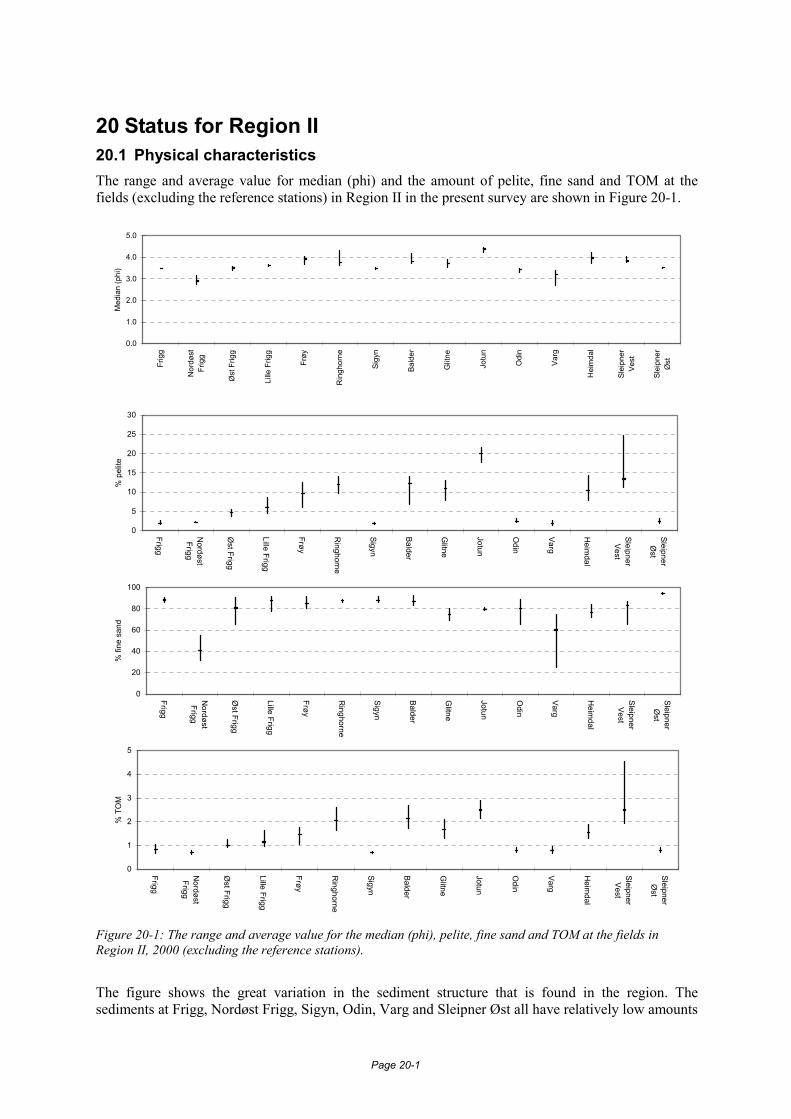
Page 20-1
20 Status for Region II 20.1 Physical characteristics The range and average value for median (phi) and the amount of pelite, fine sand and TOM at the fields (excluding the reference stations) in Region II in the present survey are shown in Figure 20-1.
0.0
1.0
2.0
3.0
4.0
5.0
Frig
g
Nor
døst
Frig
g
Øst
Frig
g
Lille
Frig
g
Frøy
Rin
ghor
ne
Sigy
n
Bald
er
Glit
ne
Jotu
n
Odi
n
Varg
Hei
mda
l
Slei
pner
Vest
Slei
pner
Øst
Med
ian
(phi
)
0
5
10
15
20
25
30
Frigg
NordøstFrigg
Øst Frigg
Lille Frigg
Frøy
Ringhorne
Sigyn
Balder
Glitne
Jotun
Odin
Varg
Heim
dal
SleipnerVest
SleipnerØ
st
% p
elite
0
20
40
60
80
100
Frigg
NordøstFrigg
Øst Frigg
Lille Frigg
Frøy
Ringhorne
Sigyn
Balder
Glitne
Jotun
Odin
Varg
Heim
dal
SleipnerVest
SleipnerØ
st
% fi
ne s
and
0
1
2
3
4
5
Frigg
NordøstFrigg
Øst Frigg
Lille Frigg
Frøy
Ringhorne
Sigyn
Balder
Glitne
Jotun
Odin
Varg
Heim
dal
SleipnerVest
SleipnerØ
st
% T
OM
Figure 20-1: The range and average value for the median (phi), pelite, fine sand and TOM at the fields in Region II, 2000 (excluding the reference stations).
The figure shows the great variation in the sediment structure that is found in the region. The sediments at Frigg, Nordøst Frigg, Sigyn, Odin, Varg and Sleipner Øst all have relatively low amounts
Page 20-2
of pelite (< 5 %) and TOM (< 1 %) while the highest values are found at Jotun (> 15 and 2 %, respectively). The average value of fine sand is, for most of the field, around 80 % or higher, with the exceptions of Nordøst Frigg and Varg where the average is 40 and 60 %, respectively.
The relatively wide range and low average values of the pelite and TOM content at Sleipner Vest is caused by one station (station SLV01 located 250 m north of the centre) having high values compared to the other field stations. At this station the amount of pelite and TOM has increased remarkably since 1997, indicating input to the sediment through discharges from the platform.
There is a general trend of finer sediments in the present survey compared to the survey carried out in 1997.
20.2 Chemical characteristics Different natural background levels of chemical parameters in different areas reflect variations in sediment characteristics across Region II. In general, the highest amounts of THC and metals are found at the regional/ reference stations with high contents of pelite and TOM. These stations are located in the central part of the region. The lowest amounts of THC, metals, pelite and TOM are found in shallow area south in the region (Sleipner Øst, Varg and Sigyn area). Multivariate analyses of the background material clarified the need for a sub-division into a shallow sub-region to take in account naturally lower levels of THC and metals in this area.
Region II consists of new and old fields. The oldest fields included in the present survey are Frigg, Nordøst Frigg, Heimdal and Øst Frigg where production started in 1977, 1983, 1985 and 1988, respectively. There has been no drilling activity at these fields since the previous survey in 1997. At Øst Frigg the wells were permanently plugged in 1999. Spills of barite occurred accidentally during this operation. The Odin platform was removed partially in 1994 and 1997. The year 2000 baseline programme includes the Sigyn, Ringhorne and Glitne fields. Drilling at the remaining fields started during the 1990´s and at these fields, drilling is still carried out. The only exceptions are Frøy and Lille Frigg, with no drilling activity in recent years. At Lille Frigg spills of barite and hydraulic oil occurred accidentally during the permanent plugging of the wells in June 2000.
With regard to the different field histories, different environmental influences in different areas of Region II are expected. A graphic presentation of the ranges in sediment contents of olefins and selected metals, except barium, are given in Figure 20-3 and Figure 20-4. Each column extends from the lowest and highest measured value over the field stations. The mean content of a parameter across the field is also marked. Because of the variation in the sediment structure, the number of stations and the station distance from the field centre, the average contents of THC and metals across fields cannot be directly compared. Maximum, minimum and average THC and barium values recorded in 2000 are compared with those from previous years in Figure 20-2.
In the present survey, the highest amount of THC (412 mg/kg dry sediment) is found in sediments from the 250 m station in the main current direction (20o-axis) from Varg. The THC content at the 250 m station in the opposite direction (200o-axis) is 184 mg/kg dry sediment. Despite high concentrations of THC at the 250 m stations at Varg, the level of THC decreases appreciably with increasing distance from the field centre and reaches background levels at the outermost stations. In the main current direction from Sleipner Vest (10o-axis), sediment THC concentrations at 100 mg/kg are found out to 1000 m. Two of the fields, Jotun and Sleipner Øst, have maximum THC concentrations between 20 and 30 mg/kg on at least one of the innermost stations. The sediment extracts from stations contaminated with TCH at Jotun, Varg and Sleipner Vest show the presence of mineral oil. According to data on recent drilling accidental discharges of oil-based mud have been reported at these fields, however the discharge at Jotun is only minor. The THC content at the fields included in the year 2000 baseline programme ranges from 2-6 mg/kg at Sigyn in the shallow sub-region, to 7-10 mg/kg at Glitne and 6-13 mg/kg dry sediment at Ringhorne. Glitne and Ringhorne are located in the central part of the region where naturally higher background levels of THC and metals are found. The maximum THC contents at the remaining of the fields comprise between 10 to 20 mg/kg. The largest area
Page 20-3
contaminated with THC is found at Jotun, where the sediments are contaminated with THC out to 2000 m south west, 500 m north west and east/south east and 250 m north/north east of the installation
The highest amounts of barium are found at the innermost stations north to north east of Lille Frigg (3942 mg/kg) and Sleipner Vest (3232 mg/kg). Maximum barium concentrations from 1400 to 2000 mg/kg are found on at least one of the innermost stations at Frøy, Balder, Jotun, Varg, Heimdal and Sleipner Øst. The barium content at fields included in the 2000 baseline programme range from 9-23 mg/kg at Sigyn in shallow area, to 65-142 mg/kg at Ringhorne and 144-272 mg/kg at Glitne, both in the central part of the region. In addition, low barium contents are found in sediments from Frigg, Nordøst Frigg and Øst Frigg (20-300 mg/kg). The largest area contaminated with barium is found at Jotun, where sediments are contaminated with barium out to 2000 m north/north east and east/south east, 1000 m south west and 250 m north west of the installation.
The highest sediment concentrations of cadmium (0.095 mg/kg), copper (14.7 mg/kg) and chromium (16.5 mg/kg) are found at the 250 m station in the main-current direction from Sleipner Vest (10o-axis). The highest sediment values of zinc (133 mg/kg) and lead (31 mg/kg) are found at the 200 m station on the 350o-axis of Frigg TCP2.
Different types of synthetic drilling muds based on esters and olefins have been reported used and discharged at some fields in Region II. Olefin-based drilling muds have been used and discharged prior to 1997 at Balder and Frøy. In the present survey, sediments from these two fields are analysed for traces of olefins. At Frøy, olefins have almost disappeared from the sediments, but traces are still present at the innermost stations (0.3-3 mg/kg dry sediment). The general picture of Balder is that the 250-500 m stations contain olefins (0.1-32 mg/kg). Traces of olefins are still detected (0.2 mg/kg) at the outermost station (2000 m) in the main current direction from well template C. One explanation for the differences in olefin content at Balder and Frøy might be that discharges at Balder (1996: 300 tonnes, 1997: 70 tonnes) are more recent than at Frøy (1995: 400 tonnes, 1996: 100 tonnes). At Sleipner Øst, Petrofree ester was discharged during the time period from 1994 to 1996. The amount of Petrofree ester has decreased considerably since 1997, but traces (0.1-2 mg/kg) are still present at the Loke stations. Because of reported discharges of olefins at Loke and SLA, sediments from the seabed around these locations were analysed for traces of poly-α-olefins. The highest amounts of olefins, 41 and 22 mg/kg dry sediment, are found at the 250 m stations on the Loke 10o- and 100o-axes. At the remaining station, the olefin content range from values below 0.001 mg/kg to 6 mg/kg.
Comparison with previous survey(s) in Region II
By comparing the maximum, minimum and average THC contents over the same field stations in the present and previous survey (Figure 20-2), it can be concluded that the THC levels are almost unchanged or reduced at fields with no drilling activity in recent years (Frigg, Nordøst Frigg, Øst Frigg, Heimdal, Odin and Frøy). At these fields, the changes in barium contents are less obvious. At Nordøst Frigg and Odin, the contents of barium in sediments are almost unchanged or reduced compared to the 1997 results. Increased maximum and average barium contents are found at the Frigg, Frøy and Heimdal fields, even though there have been reports of discharges that can explain these increases. There has been no drilling activity at Øst Frigg and Lille Frigg in recent years, but accidentally spills of occurred during the permanent plugging of the wells. At Lille Frigg, the maximum amount of THC has increased from 9 to 15 mg/kg dry sediment and the maximum amount of barium has increased from 1232 to 3942 mg/kg respectively. Generally, increased contents of THC and barium at the innermost stations north east of C1, C2 and C3 might be explained by the accidentally discharges of 0.5 tonnes hydraulic oil and 140 tonnes barite during the permanent plugging of the wells immediately before the year 2000 survey. At Øst Frigg lower maximum, minimum and average THC and barium concentrations are found in the present survey, despite reported discharges of 81 tonnes barite and 804 tonnes water-based drilling mud during the permanent plugging of the wells in 1999.
At the Balder field, the maximum concentration of THC has decreased from 37 to 24 mg/kg, while the average THC content is unchanged compared to 1997. The area contaminated with THC has switched from south and south east of well templates A, B and C, to north west of well-templates A and D. The average content of barium has decreased slightly across the Balder field, however increased barium
Page 20-4
concentrations are found at the innermost stations in the main-current direction from well templates B, C and D. According to the data on discharges, barite was discharged at Balder in 1998.
The maximum and average content of THC and barium have increased at the Varg, Sleipner Vest and Jotun fields. At Varg, the area contaminated with THC is unchanged north east and south west of the centre, while the affected area has increased north west and decreased south east of the centre. The area contaminated with barium has increased from 250 m north east and south east of the installation in 1997 to at least 1000 m north west, north east and south west of the installation in year 2000. At Sleipner Vest, the areas contaminated with barium and THC are unchanged, the only exception is found at the 100o-axis with no contamination of THC this year. At Jotun, the centre position has been moved approximately 400 m north to north west since the baseline survey in 1996. The content of THC was described as generally low in 1996, while elevated levels of barium were found at two stations in the periphery of the field centre. Direct comparison of THC and barium levels is not possible, but generally the amounts of THC and barium have increased in the area.
At Sleipner Øst, the maximum concentrations of THC has increased from 15 to 26 mg/kg and barium from 1130 to 1735 mg/kg, while the minimum and average contents are almost unchanged since the previous survey in 1997. The area contaminated with THC is still reaching out to 250 m on the Loke 100o-axis, while the contaminated area has reached the 500 m stations on the Loke and SLA 10o-axes and the 250 m stations on the SLA 190o- and 280o-axes. The 250 m station on the SLE 190o-axis is regarded as uncontaminated with THC in the present survey. The Sleipner Øst stations regarded as contaminated with barium in the present survey were also deemed contaminated in 1997.
The calculated minimum area and total area of contamination with chemical parameters in the present and previous surveys in Region II is shown in Table 20-2 and Table 20-3. The total area contaminated with THC in Region II has increased from 4.15 km2 in the previous survey to 5.27 km2 in the present survey, while the total area contaminated synthetic base-oils has decreased from 15.67 km2 in 1997 to 2.89 km2 in year 2000. The total area contaminated with other metals is unchanged since 1997. The total areas contaminated with barium in year 2000 (17.87 km2) and year 1997 (22.81 km2) can not be compared because the number of stations included in the different field surveys might be different and because the levels of contaminants do not always reach background values even at the outermost stations. These circumstances are clearly reflected by the areas contaminated with barium at Sleipner Øst. In the 1997 survey, elevated levels of barium were generally found out to 1000 and 2000 m at the Loke and SLA axes, while only stations out to 500 and 1000 m at most of these axes are included in the present survey.
The THC level at one of the innermost station at Frigg has increased with 3 mg/kg dry sediment since 1997 and the THC level has just exceeded the LSC in the present survey. However the result is increased area contaminated with THC since 1997.
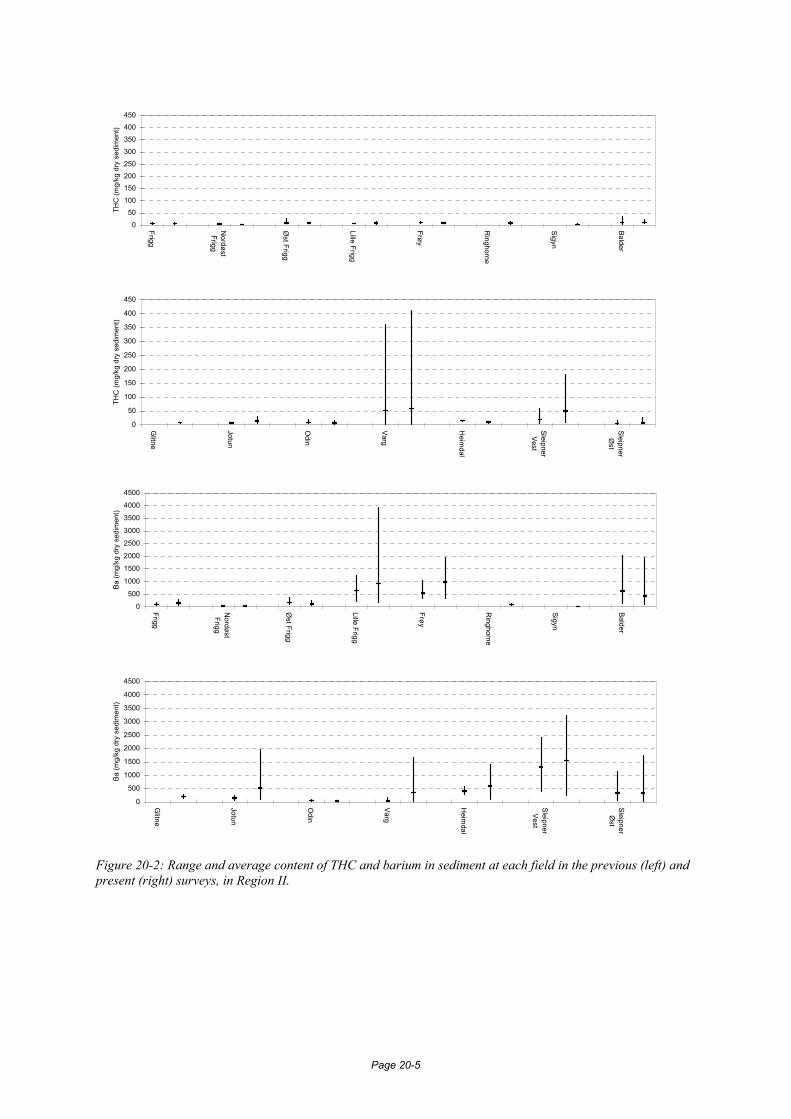
Page 20-5
0
50100
150200250
300
350400450
Frigg
NordøstFrigg
Øst Frigg
Lille Frigg
Frøy
Ringhorne
Sigyn
Balder
THC
(mg/
kg d
ry s
edim
ent)
0
50
100
150
200
250
300
350
400
450
Glitne
Jotun
Odin
Varg
Heim
dal
SleipnerVest
SleipnerØ
st
THC
(mg/
kg d
ry s
edim
ent)
0
500
1000
1500
2000
2500
3000
3500
4000
4500
Frigg
NordøstFrigg
Øst Frigg
Lille Frigg
Frøy
Ringhorne
Sigyn
Balder
Ba (m
g/kg
dry
sed
imen
t)
0
500
1000
1500
2000
2500
3000
3500
4000
4500
Glitne
Jotun
Odin
Varg
Heim
dal
SleipnerVest
SleipnerØ
st
Ba (m
g/kg
dry
sed
imen
t)
Figure 20-2: Range and average content of THC and barium in sediment at each field in the previous (left) and present (right) surveys, in Region II.
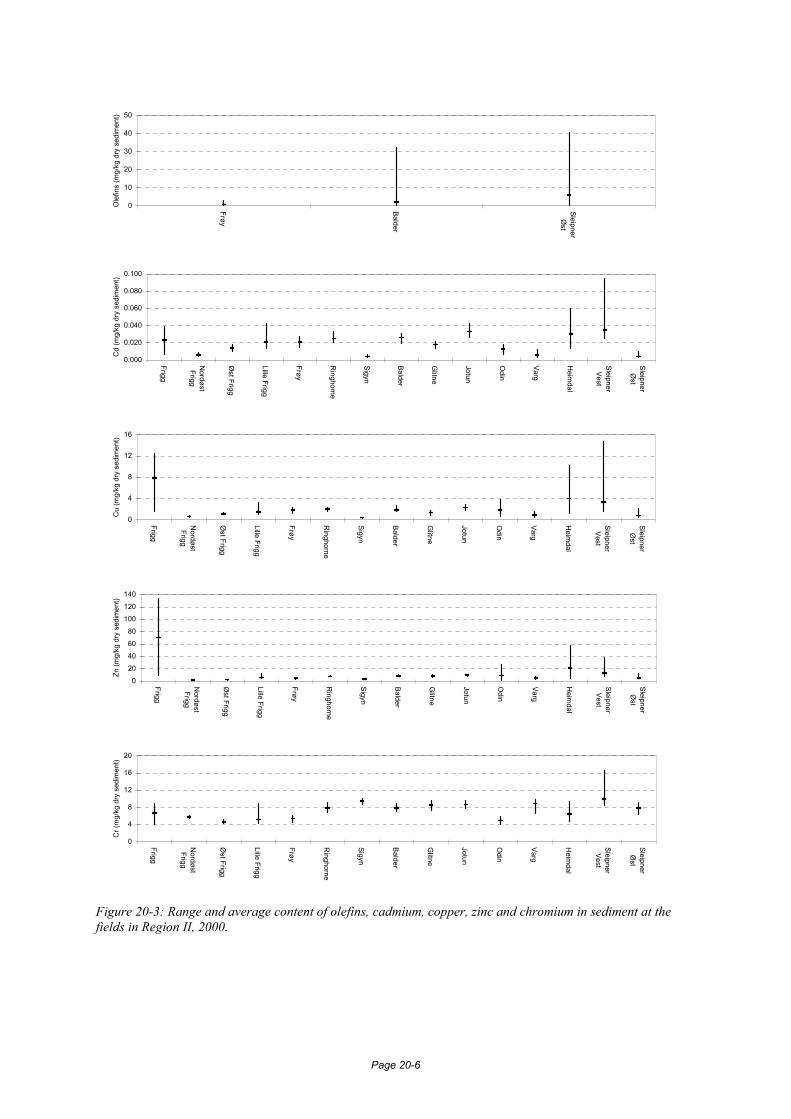
Page 20-6
0
10
20
30
40
50
Frøy
Balder
SleipnerØ
st
Ole
fins
(mg/
kg d
ry s
edim
ent)
0.000
0.020
0.040
0.060
0.080
0.100
Frigg
NordøstFrigg
Øst Frigg
Lille Frigg
Frøy
Ringhorne
Sigyn
Balder
Glitne
Jotun
Odin
Varg
Heim
dal
SleipnerVest
SleipnerØ
st
Cd
(mg/
kg d
ry s
edim
ent)
0
4
8
12
16
Frigg
NordøstFrigg
Øst Frigg
Lille Frigg
Frøy
Ringhorne
Sigyn
Balder
Glitne
Jotun
Odin
Varg
Heim
dal
SleipnerVest
SleipnerØ
st
Cu
(mg/
kg d
ry s
edim
ent)
0
20
40
60
80
100
120
140
Frigg
NordøstFrigg
Øst Frigg
Lille Frigg
Frøy
Ringhorne
Sigyn
Balder
Glitne
Jotun
Odin
Varg
Heim
dal
SleipnerVest
SleipnerØ
st
Zn (m
g/kg
dry
sed
imen
t)
0
4
8
12
16
20
Frigg
NordøstFrigg
Øst Frigg
Lille Frigg
Frøy
Ringhorne
Sigyn
Balder
Glitne
Jotun
Odin
Varg
Heim
dal
SleipnerVest
SleipnerØ
st
Cr (
mg/
kg d
ry s
edim
ent)
Figure 20-3: Range and average content of olefins, cadmium, copper, zinc and chromium in sediment at the fields in Region II, 2000.
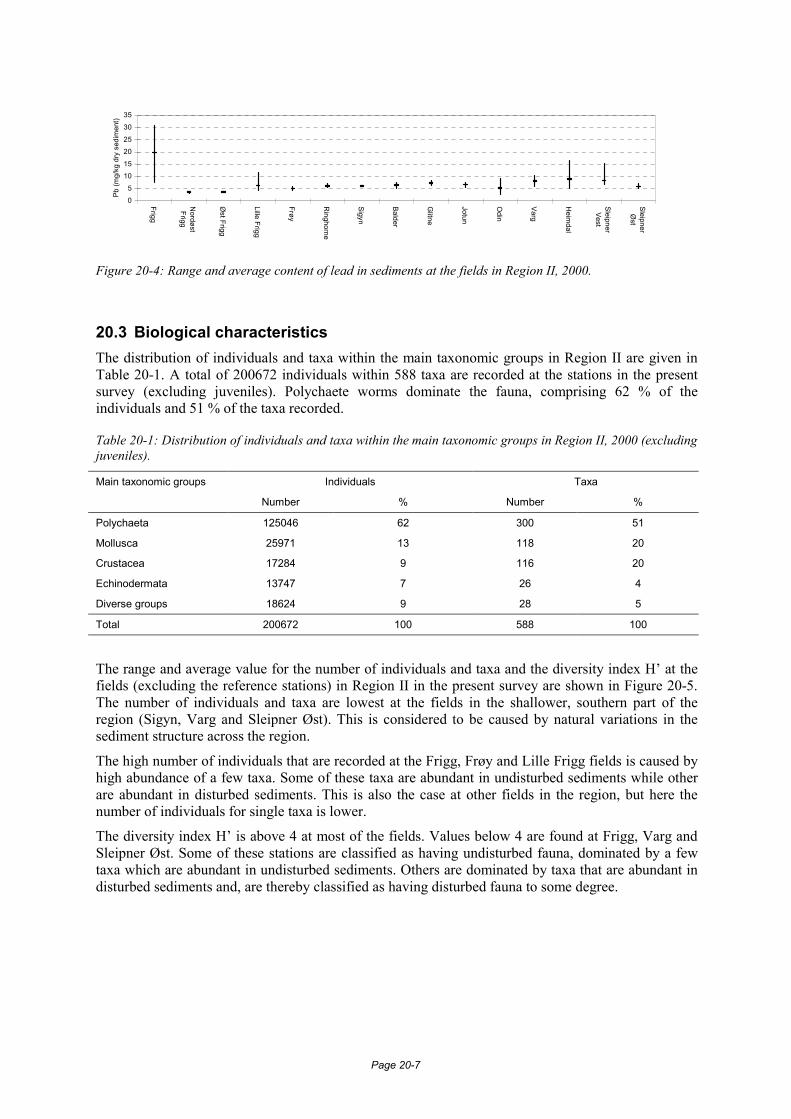
Page 20-7
05
1015
2025
30
35
Frigg
NordøstFrigg
Øst Frigg
Lille Frigg
Frøy
Ringhorne
Sigyn
Balder
Glitne
Jotun
Odin
Varg
Heim
dal
SleipnerVest
SleipnerØ
st
Pb (m
g/kg
dry
sed
imen
t)
Figure 20-4: Range and average content of lead in sediments at the fields in Region II, 2000.
20.3 Biological characteristics The distribution of individuals and taxa within the main taxonomic groups in Region II are given in Table 20-1. A total of 200672 individuals within 588 taxa are recorded at the stations in the present survey (excluding juveniles). Polychaete worms dominate the fauna, comprising 62 % of the individuals and 51 % of the taxa recorded.
Table 20-1: Distribution of individuals and taxa within the main taxonomic groups in Region II, 2000 (excluding juveniles).
Main taxonomic groups Individuals Taxa
Number % Number %
Polychaeta 125046 62 300 51
Mollusca 25971 13 118 20
Crustacea 17284 9 116 20
Echinodermata 13747 7 26 4
Diverse groups 18624 9 28 5
Total 200672 100 588 100
The range and average value for the number of individuals and taxa and the diversity index H’ at the fields (excluding the reference stations) in Region II in the present survey are shown in Figure 20-5. The number of individuals and taxa are lowest at the fields in the shallower, southern part of the region (Sigyn, Varg and Sleipner Øst). This is considered to be caused by natural variations in the sediment structure across the region.
The high number of individuals that are recorded at the Frigg, Frøy and Lille Frigg fields is caused by high abundance of a few taxa. Some of these taxa are abundant in undisturbed sediments while other are abundant in disturbed sediments. This is also the case at other fields in the region, but here the number of individuals for single taxa is lower.
The diversity index H’ is above 4 at most of the fields. Values below 4 are found at Frigg, Varg and Sleipner Øst. Some of these stations are classified as having undisturbed fauna, dominated by a few taxa which are abundant in undisturbed sediments. Others are dominated by taxa that are abundant in disturbed sediments and, are thereby classified as having disturbed fauna to some degree.
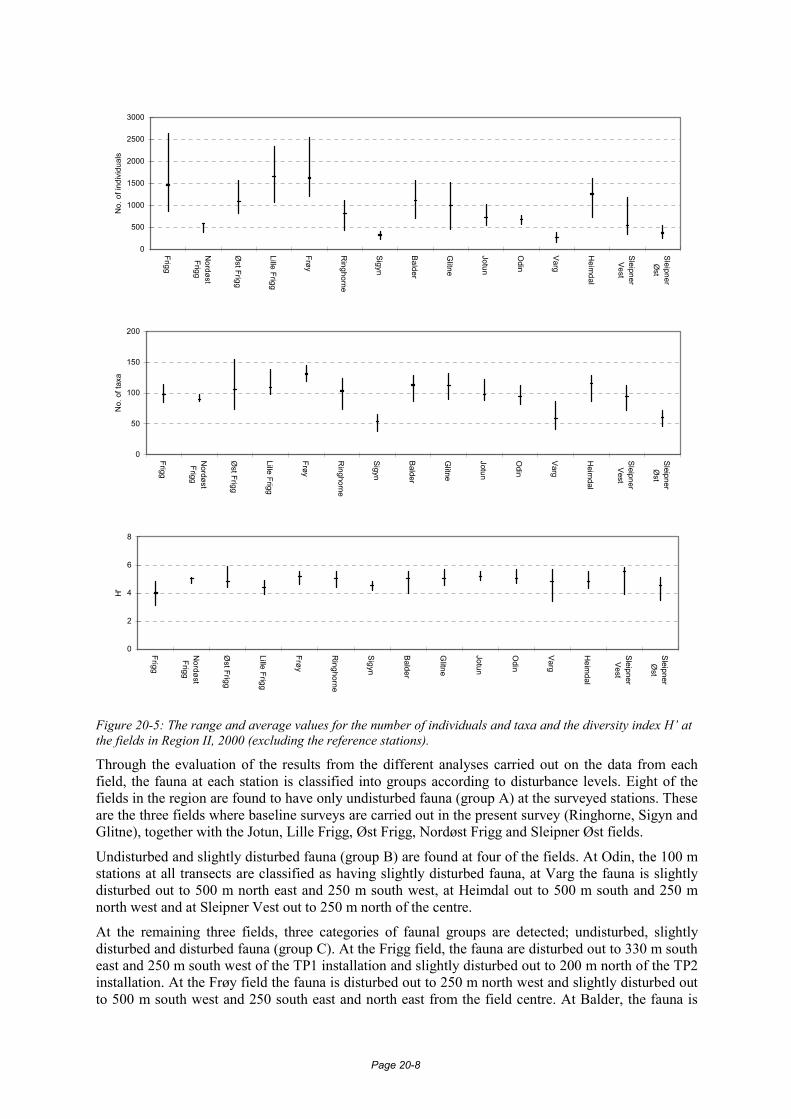
Page 20-8
0
500
1000
1500
2000
2500
3000
Frigg
NordøstFrigg
Øst Frigg
Lille Frigg
Frøy
Ringhorne
Sigyn
Balder
Glitne
Jotun
Odin
Varg
Heim
dal
SleipnerVest
SleipnerØ
st
No.
of i
ndiv
idua
ls
0
50
100
150
200
Frigg
NordøstFrigg
Øst Frigg
Lille Frigg
Frøy
Ringhorne
Sigyn
Balder
Glitne
Jotun
Odin
Varg
Heim
dal
SleipnerVest
SleipnerØ
st
No.
of t
axa
0
2
4
6
8
Frigg
NordøstFrigg
Øst Frigg
Lille Frigg
Frøy
Ringhorne
Sigyn
Balder
Glitne
Jotun
Odin
Varg
Heim
dal
SleipnerVest
SleipnerØ
st
H'
Figure 20-5: The range and average values for the number of individuals and taxa and the diversity index H’ at the fields in Region II, 2000 (excluding the reference stations).
Through the evaluation of the results from the different analyses carried out on the data from each field, the fauna at each station is classified into groups according to disturbance levels. Eight of the fields in the region are found to have only undisturbed fauna (group A) at the surveyed stations. These are the three fields where baseline surveys are carried out in the present survey (Ringhorne, Sigyn and Glitne), together with the Jotun, Lille Frigg, Øst Frigg, Nordøst Frigg and Sleipner Øst fields.
Undisturbed and slightly disturbed fauna (group B) are found at four of the fields. At Odin, the 100 m stations at all transects are classified as having slightly disturbed fauna, at Varg the fauna is slightly disturbed out to 500 m north east and 250 m south west, at Heimdal out to 500 m south and 250 m north west and at Sleipner Vest out to 250 m north of the centre.
At the remaining three fields, three categories of faunal groups are detected; undisturbed, slightly disturbed and disturbed fauna (group C). At the Frigg field, the fauna are disturbed out to 330 m south east and 250 m south west of the TP1 installation and slightly disturbed out to 200 m north of the TP2 installation. At the Frøy field the fauna is disturbed out to 250 m north west and slightly disturbed out to 500 m south west and 250 south east and north east from the field centre. At Balder, the fauna is
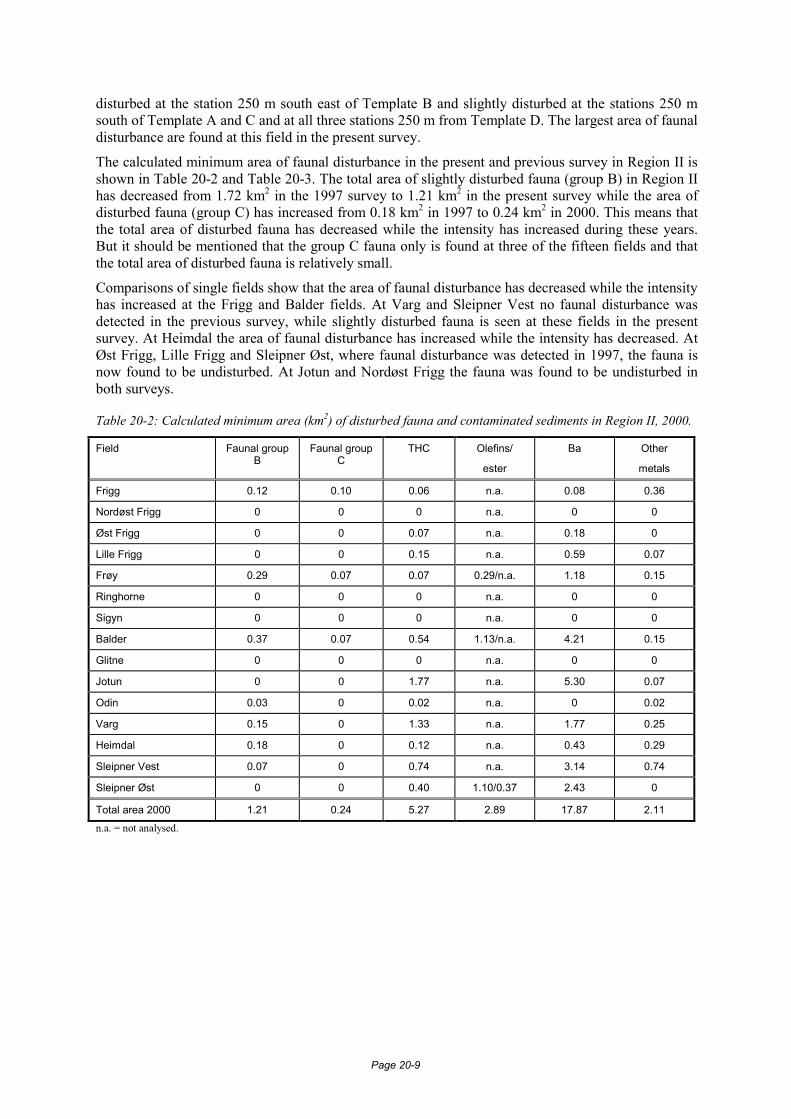
Page 20-9
disturbed at the station 250 m south east of Template B and slightly disturbed at the stations 250 m south of Template A and C and at all three stations 250 m from Template D. The largest area of faunal disturbance are found at this field in the present survey.
The calculated minimum area of faunal disturbance in the present and previous survey in Region II is shown in Table 20-2 and Table 20-3. The total area of slightly disturbed fauna (group B) in Region II has decreased from 1.72 km2 in the 1997 survey to 1.21 km2 in the present survey while the area of disturbed fauna (group C) has increased from 0.18 km2 in 1997 to 0.24 km2 in 2000. This means that the total area of disturbed fauna has decreased while the intensity has increased during these years. But it should be mentioned that the group C fauna only is found at three of the fifteen fields and that the total area of disturbed fauna is relatively small.
Comparisons of single fields show that the area of faunal disturbance has decreased while the intensity has increased at the Frigg and Balder fields. At Varg and Sleipner Vest no faunal disturbance was detected in the previous survey, while slightly disturbed fauna is seen at these fields in the present survey. At Heimdal the area of faunal disturbance has increased while the intensity has decreased. At Øst Frigg, Lille Frigg and Sleipner Øst, where faunal disturbance was detected in 1997, the fauna is now found to be undisturbed. At Jotun and Nordøst Frigg the fauna was found to be undisturbed in both surveys.
Table 20-2: Calculated minimum area (km2) of disturbed fauna and contaminated sediments in Region II, 2000.
Field Faunal group B
Faunal group C
THC Olefins/
ester
Ba Other
metals
Frigg 0.12 0.10 0.06 n.a. 0.08 0.36
Nordøst Frigg 0 0 0 n.a. 0 0
Øst Frigg 0 0 0.07 n.a. 0.18 0
Lille Frigg 0 0 0.15 n.a. 0.59 0.07
Frøy 0.29 0.07 0.07 0.29/n.a. 1.18 0.15
Ringhorne 0 0 0 n.a. 0 0
Sigyn 0 0 0 n.a. 0 0
Balder 0.37 0.07 0.54 1.13/n.a. 4.21 0.15
Glitne 0 0 0 n.a. 0 0
Jotun 0 0 1.77 n.a. 5.30 0.07
Odin 0.03 0 0.02 n.a. 0 0.02
Varg 0.15 0 1.33 n.a. 1.77 0.25
Heimdal 0.18 0 0.12 n.a. 0.43 0.29
Sleipner Vest 0.07 0 0.74 n.a. 3.14 0.74
Sleipner Øst 0 0 0.40 1.10/0.37 2.43 0
Total area 2000 1.21 0.24 5.27 2.89 17.87 2.11 n.a. = not analysed.
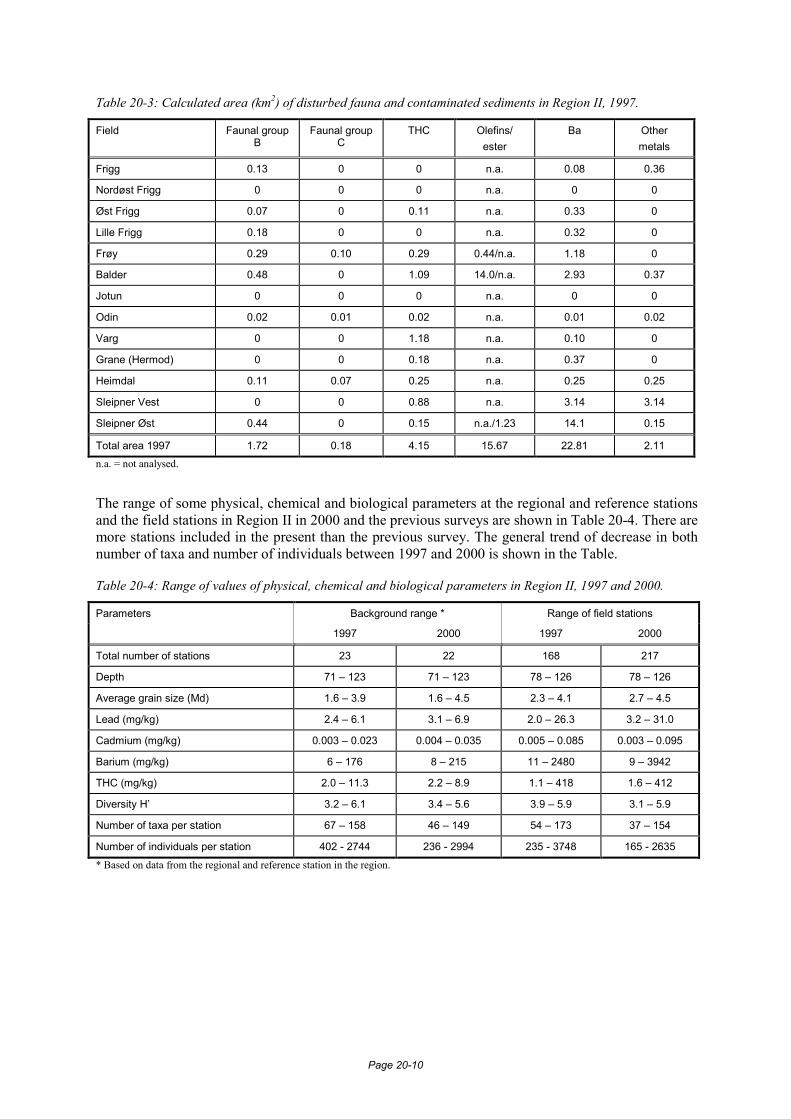
Page 20-10
Table 20-3: Calculated area (km2) of disturbed fauna and contaminated sediments in Region II, 1997.
Field Faunal group B
Faunal group C
THC Olefins/ ester
Ba Other metals
Frigg 0.13 0 0 n.a. 0.08 0.36
Nordøst Frigg 0 0 0 n.a. 0 0
Øst Frigg 0.07 0 0.11 n.a. 0.33 0
Lille Frigg 0.18 0 0 n.a. 0.32 0
Frøy 0.29 0.10 0.29 0.44/n.a. 1.18 0
Balder 0.48 0 1.09 14.0/n.a. 2.93 0.37
Jotun 0 0 0 n.a. 0 0
Odin 0.02 0.01 0.02 n.a. 0.01 0.02
Varg 0 0 1.18 n.a. 0.10 0
Grane (Hermod) 0 0 0.18 n.a. 0.37 0
Heimdal 0.11 0.07 0.25 n.a. 0.25 0.25
Sleipner Vest 0 0 0.88 n.a. 3.14 3.14
Sleipner Øst 0.44 0 0.15 n.a./1.23 14.1 0.15
Total area 1997 1.72 0.18 4.15 15.67 22.81 2.11 n.a. = not analysed.
The range of some physical, chemical and biological parameters at the regional and reference stations and the field stations in Region II in 2000 and the previous surveys are shown in Table 20-4. There are more stations included in the present than the previous survey. The general trend of decrease in both number of taxa and number of individuals between 1997 and 2000 is shown in the Table.
Table 20-4: Range of values of physical, chemical and biological parameters in Region II, 1997 and 2000.
Parameters Background range * Range of field stations
1997 2000 1997 2000
Total number of stations 23 22 168 217
Depth 71 – 123 71 – 123 78 – 126 78 – 126
Average grain size (Md) 1.6 – 3.9 1.6 – 4.5 2.3 – 4.1 2.7 – 4.5
Lead (mg/kg) 2.4 – 6.1 3.1 – 6.9 2.0 – 26.3 3.2 – 31.0
Cadmium (mg/kg) 0.003 – 0.023 0.004 – 0.035 0.005 – 0.085 0.003 – 0.095
Barium (mg/kg) 6 – 176 8 – 215 11 – 2480 9 – 3942
THC (mg/kg) 2.0 – 11.3 2.2 – 8.9 1.1 – 418 1.6 – 412
Diversity H’ 3.2 – 6.1 3.4 – 5.6 3.9 – 5.9 3.1 – 5.9
Number of taxa per station 67 – 158 46 – 149 54 – 173 37 – 154
Number of individuals per station 402 - 2744 236 - 2994 235 - 3748 165 - 2635 * Based on data from the regional and reference station in the region.
Page 21-1
21 References BRAY, J.R. & J.T. CURTIS, 1957. An ordination of the upland forest communities of Southern Wisconsin. Ecol. Monogr., 27:325-349.
BUCHANAN, J.B., 1984. Sediment analysis. In: Holme N.S.. and McIntyre (Eds), Methods for the study of marine benthos. Second edition. IBP Handbook 16. Blackwell Scientific Publications, Oxford, UK. pp 41-65.
BYERS, S.C., E.L. MILLS & P.L. STEWART, 1978. A comparison of methods of determining organic carbon in marine sediments, with suggestion for a standard method. Hydrobiologia, 58(1):43-47.
GJØS, N., J. SMITH & G. HOBBS, 1995. Miljøundersøkelse på Sleipner Vest 1994. SINTEF report no. STF27 F94056. 120 pp.
HOLTE, B., PEARSON, H.-P. MANNVIK & K. HANSEN, 1992a. Environmental monitoring survey of the Odin field, June 1991. Akvaplan-niva A/S report no. 91238-01-01, 115pp + Appendix.
JENSEN, T., A.G. MELBY, S.M. BAKKE & S.A. NØLAND, 1997. Miljøundersøkelse Balder, Jotun, Hanz og Draupne, 1996. DNV report no. 96-3694, 111 pp + Appendix.
LORING, D. H., 1990. Lithium- a New Approach for the Granulometric Normalization of Treace Metal Data. Marine Chemistry 29 (1990) 155-168.
MANNVIK, H.-P., T.H. PEARSON, M. CARROL, A. PETTERSEN, K.L GABRIELSEN & R. PALERUD, 1998. Environmental Monitoring Survey Region II 1997. Akvaplan-niva AS, report no 411.97.1224-1. 250 pp + Appendix (CD-ROM).
MCARTHUR, R.H. & J.W. MCARTHUR, 1961. On bird species diversity. Ecology, 42:594-598.
NEVERDAL, G. & Ø. STOKLAND, 1994. Miljøundersøkelsen av det marine miljø på Sleipner/Loke 1993. IKU report 94.047. 273 pp.
NILSSEN, I., 1999. Miljøovervåking av petroleumsvirksomheten på norsk sektor; Prosedyrer. SFT Retningslinjer 99:01, 123 pp.
NIVA notat O-99218. Bjerkeng, B. 2000 Miljøovervåkning på norsk sokkel - sammenligning av konsentrasjoner I sediment mot bakgrunnsnivåer. Begrepet “Limits of Significant Contamination” (LSC) 13.04.2000.36 pp.
NS4770; Vannundersøkelse – Bestemmelse av metaller ved atomabsorpsjonsspektrofotometri I flamme – Generelle prinsipper og retningslinjer (1994).
PIELOU, E.C., 1966. The measurement of diversity in different types of biological collections. J. Theor. Biol., 13:131-144.
SRM 1941a; Standard Reference Material 1941a, Organics in Marine Sediment, Certificate of Analysis, National Institute of Standards & Technology (1994). R. E. Gills, Chief of Standard Reference Materials Program, Gaithersburg MD 20899.
THORVALDSEN, B. & T. JENSEN, 1993. Grunnlagsundersøkelse av det marine miljø på Sleipner/Loke 1992; Fysisk, kjemisk og biologisk karakterisering av overflatesedimenter. IKU report no. 93.006. 245 pp.
Page 22-1
22 List of abbreviations AAS Atomic Absorption Spectrometry Al Aluminum Ba Barium BV Blind values CCA Canonical correspondence analysis Cd Cadmium Cu Copper CVAAS Cold vapour atomic absorption spectrometry d Sediment particle size (φ) DL Detection limit EI/SIM Electronic Ionosation/Single Ion Monitoring ES100 Expected number of species in a 100 specimen sample Fe Iron GC/FID Gas chromatography with flame ionization detector GC/MS Gas chromatography with mass selective detector H’ Shannon-Wiener diversity HC Hydrocarbon He Helium Hg Mercury ICP-AES Inductive coupled plasma atomic emission spectrometry J Pielou’s measure of evenness Kφ Sediment kurtosis LOD Limit of detection LOQ Limit of quantification LSC Limit of significant contamination Mdφ Median particle size MDS Multidimensional scaling M2 Mean particle diameter (graphic mean) NPD Naphthalene, Phenathrene/Anthracene, Dibenzothiophene and their C1-C3 homologues NS Norwegian Standard PAH Polycyclic Aromatic Hydrocarbons, includes NPDs and 3-6 ring aromatics psi Pressure unit (pounds per square inch) Pb Lead SD Standard deviation Skφ Sediment skewness SFT Statens Forurensningstilsyn (Norwegian State Pollution Control Authority) Stφ Sediment sorting index THC Total Hydrocarbon Content TOM Total Organic Material UPGMA Unweighted Pair Group Method Aritmethric Average Zn Zinc
Page 23-1
23 List of Figures Figure 2-1: Location of Region II. .......................................................................................................................2-1 Figure 3-1: Location of the fields and regional stations included in the survey in Region II, 2000.....................3-3 Figure 4-1: Sediment characteristics at the regional and reference stations in Region II, 2000 and the
previous survey...........................................................................................................................................4-3 Figure 4-2: PCA plot based on the chemical data from the regional and reference stations form Region II,
2000............................................................................................................................................................4-7 Figure 4-3: PCA plot based on the chemical data from the regional and reference stations from Region II,
1997-2000...................................................................................................................................................4-7 Figure 4-4: THC levels in sediment from regional and reference stations from the present (2000) and
previous surveys in Region II.....................................................................................................................4-8 Figure 4-5:Barium levels in sediment from regional and reference stations from the present (2000) and
previous surveys in Region II.....................................................................................................................4-8 Figure 4-6: Cadmium levels in sediment from regional and reference stations from the present (2000) and
previous surveys in Region II.....................................................................................................................4-8 Figure 4-7 : Copper levels in sediment from regional and reference stations from the present (2000) and
previous surveys in Region II.....................................................................................................................4-9 Figure 4-8: Zinc levels in sediment from regional and reference stations from the present (2000) and previous
surveys in Region II. ..................................................................................................................................4-9 Figure 4-9: Chrome levels in sediment from regional and reference stations from the present (2000) and
previous surveys in Region II.....................................................................................................................4-9 Figure 4-10: Lead levels in sediment from regional and reference stations from the present (2000) and
previous surveys in Region II.....................................................................................................................4-9 Figure 4-11: Scatter plot of concentrations of some selected metals in sediments against the concentration of
lithium at the regional stations in Region II, 2000. ..................................................................................4-11 Figure 4-12: Biological characteristics from the regional and reference stations in Region II, 2000 and the
previous survey.........................................................................................................................................4-15 Figure 4-13: Distribution of taxa in geometrical classes for the regional stations in Region II, 2000. ..............4-16 Figure 4-14: Cluster analysis of the regional and reference stations in Region II, 2000....................................4-17 Figure 4-15: 2-D plot form the MDS analysis carried out on the data from the regional and reference stations
in Region II, 2000.....................................................................................................................................4-17 Figure 4-16: Biplot from the CCA analysis for the regional and reference stations in Region II, 2000. ...........4-18 Figure 4-17: Map of sampling positions for the regional stations and the fields in Region II, 2000. ................4-23 Figure 5-1: Sediment characteristics at the Frigg field, 2000 and previous surveys. ...........................................5-3 Figure 5-2: Gas chromatogram of a sediment extract from the Frigg field, 2000................................................5-5 Figure 5-3: THC levels in sediment from the present (2000) and previous surveys, Frigg field. ........................5-7 Figure 5-4: Barium levels in sediment from the present (2000) and previous survey, Frigg field.......................5-7 Figure 5-5: Levels of selected metals in sediments from the present (2000) and previous surveys, Frigg field..5-8 Figure 5-6: Species/area curve for the reference station at the Frigg field (area in m2). ......................................5-9 Figure 5-7: Biological characteristics of the stations at Frigg, 2000 and previous surveys. ..............................5-11 Figure 5-8: Distribution of taxa in geometrical classes from the stations at Frigg, 2000...................................5-12 Figure 5-9: Cluster analysis of the Frigg field stations and selected regional and reference stations from
Region II, 2000.........................................................................................................................................5-13 Figure 5-10: 2-D plot from the MDS analysis carried out on the station data form the Frigg field and selected
regional and reference stations from Region II, 2000. .............................................................................5-13 Figure 5-11: Biplot from the CCA analysis for the Frigg field and selected regional and reference stations
from Region II, 2000 (left) and species with highest contribution on two axis (right).............................5-14 Figure 5-12: Distribution of faunal groups and amounts of THC and barium at the Frigg field, 2000..............5-17 Figure 5-13: Map of sampling positions for Frigg field, 2000...........................................................................5-19 Figure 6-1: Sediment characteristics at the Nordøst Frigg field, 2000 and previous surveys. .............................6-2 Figure 6-2: THC levels in sediment from the present (2000) and previous surveys, Nordøst Frigg field. ..........6-5 Figure 6-3: Barium levels in sediment from the present (2000) and previous survey, Nordøst Frigg field. ........6-5 Figure 6-4: Levels of selected metals in sediments from the present (2000) and previous surveys, Nordøst
Frigg field. ..................................................................................................................................................6-6 Figure 6-5: Species/area curve for the reference station at the Nordøst Frigg field, 2000 (area in m2). ..............6-7 Figure 6-6: Biological characteristics at the Nordøst Frigg field, 2000 and previous surveys.............................6-8 Figure 6-7: Distribution of taxa in geometrical classes for the stations at the Nordøst Frigg field, 2000............6-9 Figure 6-8: Cluster analysis of the Nordøst Frigg field stations and selected regional and reference stations in
Region II, 2000.........................................................................................................................................6-10
Page 23-2
Figure 6-9: 2-D plot from the MDS analysis carried out on Nordøst Frigg field stations, 2000........................6-10 Figure 6-10: Biplot from the CCA analysis for the Nordøst Frigg field stations and selected regional and
reference stations in Region II, 2000 (left) and species with highest contribution on the two axes (right)........................................................................................................................................................6-11
Figure 6-11: Map of sampling positions for Nordøst Frigg field, 2000 .............................................................6-15 Figure 7-1: Sediment characteristics at the Øst Frigg field, 2000 and previous surveys. ....................................7-3 Figure 7-2: THC levels in sediment from the present (2000) and previous surveys, Øst Frigg field...................7-7 Figure 7-3: Barium levels in sediment from the present (2000) and previous survey, Øst Frigg field. ...............7-7 Figure 7-4: Levels of selected metals in sediments from the present (2000) and previous surveys, Øst Frigg
field. ...........................................................................................................................................................7-8 Figure 7-5: Species/area curve for the reference station at the Øst Frigg field, 2000 (area in m2).......................7-9 Figure 7-6: Biological characteristics at the Øst Frigg field, 2000 and previous surveys. .................................7-11 Figure 7-7: Distribution of taxa in geometrical classes for the stations at the Øst Frigg field, 2000. ................7-12 Figure 7-8: Cluster analysis of the Øst Frigg field stations and selected regional and reference stations in
Region II, 2000.........................................................................................................................................7-13 Figure 7-9: 2-D plot from the MDS analysis carried out on the Øst Frigg field stations and selected regional
and reference stations in Region II, 2000. ................................................................................................7-13 Figure 7-10: Biplot from the CCA analysis for the Øst Frigg field stations and selected regional and
reference stations in Region II, 2000 (left) and detail of the stations in the centre of the plot (right). .....7-14 Figure 7-11: Plot of taxa with highest contribution on two axis in the CCA for Øst Frigg, 2000. ....................7-14 Figure 7-12: Distribution of the amounts of THC and barium at the Øst Frigg field, 2000...............................7-17 Figure 7-13: Map of sampling positions for Øst Frigg field, 2000. ...................................................................7-19 Figure 8-1: Sediment characteristics at the Lille Frigg field, 2000 and previous years. ......................................8-3 Figure 8-2: THC levels in sediment from the present (2000) and previous surveys, Lille Frigg field.................8-6 Figure 8-3: Barium levels in sediment from the present (2000) and previous survey, Lille Frigg field. .............8-7 Figure 8-4: Levels of selected metals in sediments from the present (2000) and previous surveys, Lille Frigg
field. ...........................................................................................................................................................8-8 Figure 8-5: Species/area curve for the reference station at the Lille Frigg field (area in m2). .............................8-9 Figure 8-6: Biological characteristics of the stations at Lille Frigg field, 2000 and previous surveys...............8-11 Figure 8-7: Distribution of taxa in geometrical classes for the stations at the Lille Frigg field, 2000. ..............8-12 Figure 8-8: Cluster analysis of the Lille Frigg field stations and selected regional and reference stations in
Region II, 2000.........................................................................................................................................8-13 Figure 8-9: 2-D plot from the MDS analysis carried out on the Lille Frigg field stations and selected regional
and reference stations in Region II, 2000. ................................................................................................8-13 Figure 8-10: Biplot from the CCA analysis for the Lille Frigg field stations and selected regional and
reference stations in Region II, 2000 (left) and taxa with highest contribution on the two axes (right)...8-14 Figure 8-11: Distribution of the amounts of THC and barium at the Lille Frigg field, 2000.............................8-17 Figure 8-12: Map of sampling positions for Lille Frigg field, 2000 ..................................................................8-19 Figure 9-1: Sediment characteristics at the Frøy field, 2000 and previous surveys. ............................................9-3 Figure 9-2: Gas chromatogram of a sediment extract from the Frøy field, 2000.................................................9-5 Figure 9-3: THC levels in sediment from the present (2000) and previous surveys, Frøy field. .........................9-8 Figure 9-4: Synthetic base oil levels in sediments from the present (2000) and previous surveys, Frøy field. ...9-8 Figure 9-5: Barium levels in sediment from the present (2000) and previous survey, Frøy field........................9-8 Figure 9-6: Levels of selected metals in sediments from the present (2000) and previous surveys, Frøy field...9-9 Figure 9-7: Species/area curve for the reference station at the Frøy field (area in m2). .....................................9-10 Figure 9-8: Biological characteristics at the Frøy field, 2000 and previous surveys..........................................9-12 Figure 9-9: Distribution of taxa in geometrical classes from the stations at the Frøy field, 2000......................9-13 Figure 9-10: Cluster analysis of the Frøy field stations and selected regional and reference stations in Region
II, 2000. ....................................................................................................................................................9-14 Figure 9-11: 2-D plot from the MDS analysis carried out on the Frøy field stations, 2000...............................9-14 Figure 9-12: Biplot from the CCA analysis for the Frøy field stations and selected regional and reference
stations in Region II, 2000 (left) and species with highest contribution on two axes (right). ..................9-15 Figure 9-13: Biplot from the analysis for the Frøy field stations including olefins (left) and taxa with highest
contribution on the two axes (right). ........................................................................................................9-16 Figure 9-14: Distribution of disturbed fauna and the amounts of THC and barium in the sediments at the Frøy
field, 2000.................................................................................................................................................9-19 Figure 9-15: Map of sampling positions for Frøy field, 2000............................................................................9-21 Figure 10-1: Sediment characteristics at the Ringhorne field, 2000. .................................................................10-3 Figure 10-2: Gas chromatogram of a sediment extract from the Ringhorne field, 2000....................................10-6 Figure 10-3: THC levels in sediment from the present (2000) survey, Ringhorne field. ...................................10-9
Page 23-3
Figure 10-4: Barium levels in sediment from the present (2000), Ringhorne field. ..........................................10-9 Figure 10-5: Levels of selected metals in sediments from the present (2000) survey, Ringhorne field...........10-10 Figure 10-6: Species/area curve for the reference station at the Ringhorne field (area in m2).........................10-11 Figure 10-7: Biological characteristics of the stations at Ringhorne, 2000......................................................10-13 Figure 10-8: Distribution of taxa in geometrical classes at Ringhorne 2000. ..................................................10-14 Figure 10-9: Cluster analysis of the Ringhorne field stations and selected regional and reference stations
from Region II, 2000. .............................................................................................................................10-15 Figure 10-10: 2-D plot from the MDS analysis carried out on the Ringhorne field stations, 2000. ................10-16 Figure 10-11: Biplot from the CCA analysis for the Ringhorne field stations and selected regional and
reference stations from Region II, 2000 (left) and taxa with high contribution on two axes (right). .....10-17 Figure 10-12: Map of sampling positions for Ringhorne field, 2000...............................................................10-25 Figure 11-1: Sediment characteristics at the Sigyn field in 2000.......................................................................11-3 Figure 11-2: THC levels in sediment from the present (2000) survey, Sigyn field. ..........................................11-6 Figure 11-3: Barium levels in sediment from the present (2000) survey, Sigyn field. ......................................11-6 Figure 11-4: Levels of selected metals in sediments from the present (2000) survey, Sigyn field. ...................11-7 Figure 11-5: Species/area curve for the reference station at the Sigyn field (area in m2). .................................11-8 Figure 11-6: Biological characteristics at the Sigyn field, 2000. .....................................................................11-10 Figure 11-7: Distribution of taxa in geometrical classes from the stations at Sigyn,2000. ..............................11-11 Figure 11-8: Cluster analysis of the Sigyn field stations and selected regional and reference stations from
Region II, 2000.......................................................................................................................................11-12 Figure 11-9: 2-D plot from the MDS analysis carried out on the station data form Sigyn field and selected
regional and reference stations from Region II, 2000. ...........................................................................11-12 Figure 11-10: Biplot from the CCA analysis for the Sigyn field and selected regional and reference stations
from Region II, 2000. .............................................................................................................................11-13 Figure 11-11: Map of sampling positions for Sigyn field, 2000 ......................................................................11-17 Figure 12-1: Sediment characteristics at the Balder field in 2000 and previous years.......................................12-3 Figure 12-2: Gas chromatogram of a sediment extract from the Balder field, 2000..........................................12-6 Figure 12-3: THC levels in sediment from the present (2000) and previous surveys, Balder field. ................12-10 Figure 12-4: Synthetic base oil levels in sediments from the present (2000) and previous surveys, Balder
field. .......................................................................................................................................................12-10 Figure 12-5: Barium levels in sediment from the present (2000) and previous survey, Balder field...............12-10 Figure 12-6: Levels of selected metals in sediments from the present (2000) and previous surveys, Balder
field. .......................................................................................................................................................12-11 Figure 12-7: Species/area curve for the reference station at the Balder field (area in m2). ..............................12-12 Figure 12-8: Biological characteristics at the Balder field, 2000 and previous surveys. .................................12-14 Figure 12-9: Distribution of taxa in geometrical classes at Balder, 2000. .......................................................12-15 Figure 12-10: Cluster analysis of the Balder field stations and selected regional and reference stations in
Region II, 2000.......................................................................................................................................12-16 Figure 12-11: 2-D plot from the MDS analysis carried out on the station data form Balder field, 2000.........12-17 Figure 12-12: Biplot from the CCA analysis for the Balder field stations and selected regional and reference
stations in Region II, 2000 (left), and details of the stations close to the centre of the plot (right). .......12-18 Figure 12-13: Taxa with high contribution on two axes from the CCA analysis for the Balder field stations
and selected regional and reference stations in Region II, 2000.............................................................12-18 Figure 12-14: Biplot from the CCA analysis including olefins for the Balder field, 2000 (left), and details of
the stations close to the centre of the plot (right)....................................................................................12-19 Figure 12-15: Taxa with high contribution on the two axes from the CCA analysis including olefins for the
Balder field, 2000. ..................................................................................................................................12-19 Figure 12-16: Distribution of disturbed fauna and the amounts of THC, olefin and barium at the Balder field,
2000........................................................................................................................................................12-24 Figure 12-17: Map with sampling positions for Balder field, 2000 .................................................................12-29 Figure 13-1: Sediment characteristics at the Jotun field, 2000 and previous surveys. .......................................13-3 Figure 13-2: Gas chromatogram of a sediment extract from the Jotun field, 2000............................................13-5 Figure 13-3: THC levels in sediment from the present (2000) and previous surveys, Jotun field. ....................13-8 Figure 13-4: Barium levels in sediment from the present (2000) and previous surveys, Jotun field. ................13-8 Figure 13-5: Levels of selected metals in sediments from the present (2000) and previous surveys, Jotun
field. .........................................................................................................................................................13-9 Figure 13-6: Species/area curve for the reference station at the Jotun field (area in m2) .................................13-10 Figure 13-7: Biological characteristics at the Jotun, 2000 and previous survey. .............................................13-12 Figure 13-8: Distribution of taxa in geometrical classes at Jotun, 2000. .........................................................13-13 Figure 13-9: Cluster analysis of the Jotun field and the regional and reference stations in Region II, 2000. ..13-14
Page 23-4
Figure 13-10: 2-D plot from the MDS analysis carried out on the station data form Jotun field, 2000...........13-14 Figure 13-11: Biplot from the CCA analysis for the Jotun field stations, 2000 (left) and taxa with high
contribution on two axes (right) .............................................................................................................13-15 Figure 13-12: Distribution of the amounts of THC and barium in the sediments at the Jotun field, 2000. .....13-17 Figure 13-13: Map of sampling positions for Jotun field, 2000.......................................................................13-21 Figure 14-1: Sediment characteristics at the Odin field, 2000 and previous surveys.........................................14-3 Figure 14-2: Gas chromatogram of a sediment extract from the Odin field, 2000. ...........................................14-5 Figure 14-3: THC levels in sediment from the present (2000) and previous surveys, Odin field......................14-7 Figure 14-4: Barium levels in sediment from the present (2000) and previous survey, Odin field. ..................14-7 Figure 14-5: Levels of selected metals in sediments from the present (2000) and previous surveys, Odin field.14-8 Figure 14-6: Species/area curve for the reference station at the Odin field (area in m2)....................................14-9 Figure 14-7: Biological characteristics at the Odin field, 2000 and previous surveys. ....................................14-11 Figure 14-8: Distribution of taxa in geometrical classes from the stations at Odin, 2000. ..............................14-12 Figure 14-9: Cluster analysis of the Odin field and selected regional and reference stations in Region II,
2000........................................................................................................................................................14-13 Figure 14-10: 2-D plot from the MDS analysis carried out on the station data from Odin field and selected
regional and reference stations in Region II, 2000. ................................................................................14-13 Figure 14-11: Biplot from the CCA analysis for the Odin field and selected regional and reference stations in
Region II, 2000 (left) and taxa with high contribution on the two axis (right).......................................14-14 Figure 14-12: Distribution of disturbed fauna and the amounts of THC and barium in the sediments at the
Odin field, 2000......................................................................................................................................14-16 Figure 14-13: Map of sampling positions for Odin field, 2000. ......................................................................14-19 Figure 15-1: Sediment characteristics at the Varg field, 2000 and previous survey. .........................................15-3 Figure 15-2: Gas chromatogram of an oil-based drilling fluid (upper) and a sediment extract from the Varg
field (lower), 2000....................................................................................................................................15-5 Figure 15-3: THC levels in sediment from the present (2000) and previous surveys, Varg field......................15-7 Figure 15-4: Barium levels in sediment from the present (2000) and previous survey, Varg field. ..................15-7 Figure 15-5: Levels of selected metals in sediments from the present (2000) and previous surveys, Varg field.15-8 Figure 15-6: Species/area curve for the reference station at the Varg field, 2000 (area in m2)..........................15-9 Figure 15-7: Biological characteristics at the Varg field, 2000 and previous survey.......................................15-11 Figure 15-8: Distribution of taxa in geometrical classes from the stations at the Varg field, 2000. ................15-12 Figure 15-9: Cluster analysis of the Varg field stations and selected regional and reference stations in Region
II, 2000. ..................................................................................................................................................15-12 Figure 15-10: 2-D plot from the MDS analysis carried out on the Varg field stations and selected regional
and reference stations in Region II, 2000. ..............................................................................................15-13 Figure 15-11: Biplot from the CCA analysis for the Varg field stations and selected regional and reference
stations in Region II, 2000 (left) and the taxa with highest contribution on two axes (right).................15-14 Figure 15-12: Distribution of disturbed fauna and the amounts of THC and barium in the sediments at the
Varg field, 2000......................................................................................................................................15-16 Figure 15-13: Map of sampling positions for Varg field, 2000. ......................................................................15-19 Figure 16-1: Sediment characteristics at the Heimdal field, 2000 and previous surveys. ..................................16-3 Figure 16-2: Gas chromatogram of a sediment extract from the Heimdal field, 2000.......................................16-5 Figure 16-3: THC levels in sediment from the present (2000) and previous surveys, Heimdal field. ...............16-7 Figure 16-4: Barium levels in sediment from the present (2000) and previous survey, Heimdal field..............16-7 Figure 16-5: Levels of selected metals in sediments from the present (2000) and previous surveys, Heimdal
field. .........................................................................................................................................................16-8 Figure 16-6: Species/area curve for the reference station at the Heimdal field (area in m2). .............................16-9 Figure 16-7: Distribution of taxa in geometrical classes for the stations at Heimdal, 2000.............................16-12 Figure 16-8: Cluster analysis of the Heimdal field stations and the regional and reference stations in Region
II, 2000. ..................................................................................................................................................16-13 Figure 16-9: 2-D plot from the MDS analysis carried out on the Heimdal field stations and selected regional
and reference stations in Region II, 2000. ..............................................................................................16-13 Figure 16-10: Biplot from the CCA analysis for the Heimdal field stations and selected regional and
reference stations in Region II, 2000 (left) and taxa with high contribution on two axes (right). ..........16-14 Figure 16-11: Distribution of disturbed fauna and the amounts of THC and barium in the sediments at the
Heimdal field, 2000................................................................................................................................16-16 Figure 16-12: Map of sampling positions for Heimdal field, 2000..................................................................16-19 Figure 17-1: Sediment characteristics at the Glitne field, 2000. ........................................................................17-2 Figure 17-2: Gas chromatogram of a sediment extract from the GLI04, 2000. .................................................17-4 Figure 17-3: THC levels in sediment from the present (2000) survey, Glitne field...........................................17-6
Page 23-5
Figure 17-4: Barium levels in sediment from the present (2000) survey, Glitne field.......................................17-6 Figure 17-5: Levels of selected metals in sediments from the present (2000) survey, Glitne field. ..................17-7 Figure 17-6: Species/area curve for the reference station at Glitne (regional station RII08) (area in m2). ........17-8 Figure 17-7: Biological characteristics at the stations at Glitne, 2000.............................................................17-10 Figure 17-8: Distribution of taxa in geometrical classes from the station at Glitne, 2000...............................17-11 Figure 17-9: Cluster analysis of the Glitne field stations, 2000. ......................................................................17-12 Figure 17-10: 2-D plot from the MDS analysis carried out on the station data from the Glitne field, 2000....17-12 Figure 17-11: Biplot from the CCA analysis for the Glitne field, 2000 (left) and taxa with high contribution
on two axes (right)..................................................................................................................................17-13 Figure 17-12: Map of sampling positions for Glitne field, 2000. ....................................................................17-19 Figure 18-1: Sediment characteristics at the Sleipner Vest field, 2000 and previous surveys. ..........................18-3 Figure 18-2: Gas chromatogram of an oil-based drilling fluid (upper) and sediment extracts from the Sleipner
Vest field (three lower), 2000...................................................................................................................18-5 Figure 18-3: THC levels in sediment from the present (2000) and previous surveys, Sleipner Vest field. .......18-7 Figure 18-4: Barium levels in sediment from the present (2000) and previous survey, Sleipner Vest field......18-7 Figure 18-5: Levels of selected metals in sediments from the present (2000) and previous surveys, Sleipner
Vest field. .................................................................................................................................................18-8 Figure 18-6: Species/area curve for the RII07 the Sleipner Vest field (area in m2). ..........................................18-9 Figure 18-7: Biological characteristics at the stations at Sleipner Vest, 2000 and previous surveys...............18-11 Figure 18-8: Distribution of taxa in geometrical classes at each station at Sleipner Vest, 2000......................18-12 Figure 18-9: Cluster analysis of the Sleipner Vest field and reference stations, 2000. ....................................18-13 Figure 18-10: 2-D plot from the MDS analysis carried out on the Sleipner Vest field and reference stations,
2000........................................................................................................................................................18-13 Figure 18-11: Biplot from the CCA analysis for the Sleipner Vest field and reference stations, 2000 (left) and
plot of taxa with high contribution on two axes (right). .........................................................................18-14 Figure 18-12: Distribution of disturbed fauna and the amounts of THC and barium in the sediments at the
Sleipner Vest field, 2000. .......................................................................................................................18-16 Figure 18-13: Map of sampling positions for Sleipner Vest field, 2000..........................................................18-19 Figure 19-1: Sediment characteristics at the Sleipner Øst field, 2000 and previous surveys. ............................19-3 Figure 19-2: Gas chromatogram of C14/C16 poly-a-olefin based base oil (lower) and sediment extract from
Loke (upper), 2000. ..................................................................................................................................19-6 Figure 19-3: Gas chromatogram of Petrofree base oil (lower) and sediment extract from Loke (upper), 2000.19-7 Figure 19-4: THC levels in sediment from the present (2000) and previous surveys, Sleipner Øst field. .......19-10 Figure 19-5: Barium levels in sediment from the present (2000) and previous survey, Sleipner Øst field......19-10 Figure 19-6: Levels of selected metals in sediments from the present (2000) and previous surveys, Sleipner
Øst field. .................................................................................................................................................19-11 Figure 19-7: Species/area curve for the reference station at the Sleipner Øst field (area in m2)......................19-12 Figure 19-8: Biological characteristics at the stations at Sleipner Øst, 2000 and previous surveys.................19-14 Figure 19-9: Distribution of taxa in geometrical classes from the stations at Sleipner Øst, 2000....................19-15 Figure 19-10: Cluster analysis of the Sleipner Øst field stations and selected regional and reference stations
in Region II, 2000...................................................................................................................................19-16 Figure 19-11: 2-D plot from the MDS analysis carried out on the Sleipner Øst field stations and selected
regional and reference stations in Region II, 2000. ................................................................................19-16 Figure 19-12: Biplot from the CCA analysis for the Sleipner Øst field stations and selected regional and
reference stations in Region II, 2000 (left) and taxa with highest contribution on two axes in the CCA (right)......................................................................................................................................................19-17
Figure 19-13: Distribution of faunal groups and amounts of THC, olefin and barium at the Sleipner Øst Field, 2000..............................................................................................................................................19-21
Figure 19-14: Map of sampling positions for Sleipner Øst field, 2000............................................................19-25 Figure 20-1: The range and average value for the median (phi), pelite, fine sand and TOM at the fields in
Region II, 2000 (excluding the reference stations)...................................................................................20-1 Figure 20-2: Range and average content of THC and barium in sediment at each field in the previous (left)
and present (right) surveys, in Region II. .................................................................................................20-5 Figure 20-3: Range and average content of olefins, cadmium, copper, zinc and chromium in sediment at the
fields in Region II, 2000...........................................................................................................................20-6 Figure 20-4: Range and average content of lead in sediments at the fields in Region II, 2000. ........................20-7 Figure 20-5: The range and average values for the number of individuals and taxa and the diversity index H’
at the fields in Region II, 2000 (excluding the reference stations). ..........................................................20-8
Page 24-6
24 List of Tables Table 4-1: The median (phi and amount (%) of pelite, fine sand and TOM in the sediments at the regional
and reference stations in Region II, 2000 (minimum and maximum values are indicated with bold text).4-2 Table 4-2: Minimum- and maximum concentrations of hydrocarbons and selected metals in sediments from
reference and regional stations in Region II, 2000. All values in mg/kg dry sediment. .............................4-4 Table 4-3: The concentrations of THC and metals in sediments from the regional and reference stations in
Rregion II, 2000. All values in mg/kg dry sediment. .................................................................................4-5 Table 4-4: Background levels (mean ± st.dev.) and calculated Limits of Significant Contamination (LSC) of
sediments in Region II and the shallow subregion, 2000. All values in mg/kg dry sediment. ...................4-6 Table 4-5: The average concentrations of metals found by analysis of three replicate sediment samples at the
regional stations in Region II, 2000, after digestion with nitric acid (NS 4770) and HF/ aqua regia. All values in mg/kg dry sediment. ..................................................................................................................4-12
Table 4-6: Distribution of taxa and individuals within the main taxonomic groups at the regional and reference stations in Region II, 2000........................................................................................................4-13
Table 4-7: Number of individuals and taxa and selected community indices for each station (0.5 m2) sampled at the regional and reference stations, 2000. (Minimum and maximum values are indicated with bold text.) .........................................................................................................................................................4-14
Table 4-8: Biological statistics for the regional and reference stations in Region II, 2000 (the species occurrence among top 10 at the stations are marked with bold figures)...................................................4-19
Table 4-9: Number of individuals and the accumulative abundance for the most predominant taxa at each regional and reference station in Region II, 2000.....................................................................................4-21
Table 4-10: Station information for the regional station in Region II, 2000......................................................4-23 Table 5-1: Summary of recent operational and accidental discharges at the Frigg field (all discharges in
tonnes). .......................................................................................................................................................5-1 Table 5-2: The median (phi) and amount of pelite, fine sand and TOM in the sediments from stations at the
Frigg field, 2000 (minimum and maximum values for each parameter are indicated with bold text). .......5-2 Table 5-3: Background levels and Limits of Significant Contamination for the Frigg field, 2000. All values in
mg/kg dry sediment. ...................................................................................................................................5-4 Table 5-4: Concentrations of hydrocarbons in sediments from the Frigg field, 2000. All values in mg/kg dry
sediment. Values above LSC97-00 RegII are dark shaded and values between LSCFRI10R and LSC97-00 RegII light shaded. ...............................................................................................................................................5-4
Table 5-5: Concentrations of hydrocarbons in vertical sections of sediment samples from the Frigg field, 2000. All values in mg/kg dry sediment. Values above LSC97-00 RegII are dark shaded and values between LSCFRI10R and LSC97-00 RegII light shaded. ....................................................................................5-4
Table 5-6: Concentrations of selected metals in sediments from the Frigg field, 2000. All values in mg/kg dry sediment. Values above LSC97-00 RegII are dark shaded and values between LSCFRI10R and LSC97-00 RegII light shaded. ...............................................................................................................................................5-5
Table 5-7: Concentrations of selected metals in vertical sections of the sediment samples from the Frigg field. All values in mg/kg dry sediment. Values above LSC97-00 RegII are dark shaded and values between LSCFRI10R and LSC97-00 RegII light shaded. ....................................................................................5-5
Table 5-8: Distribution of individuals and taxa within the main taxonomic groups at Frigg, 2000 (excluding juveniles). ...................................................................................................................................................5-9
Table 5-9: Number of individuals and taxa and selected community indices for each station (0.5 m2) at the Frigg field, 2000 (minimum and maximum values for each parameter are indicated with bold text). .....5-10
Table 5-10: Classification in impact groups, distance to installation and biological statistics for the field stations at Frigg field, 2000. .....................................................................................................................5-15
Table 5-11: Distance along the transects and calculated minimum area of contaminated sediments and disturbed fauna at the Frigg field, 2000 and previous survey...................................................................5-17
Table 5-12: Number of individuals and the accumulative abundance for the ten most dominant taxa at each station at the Frigg field, 2000..................................................................................................................5-18
Table 5-13: Station information for Frigg field, 2000........................................................................................5-19 Table 6-1: The median (phi) and amount (%) of pelite, fine sand and TOM in the sediment from stations at
the Nordøst Frigg field, 2000 (minimum and maximum values for each parameter are indicated with bold text). ...................................................................................................................................................6-1
Table 6-2: Background levels and Limits of Significant Contamination for the Nordøst Frigg field, 2000. All values in mg/kg dry sediment. ....................................................................................................................6-3
Table 6-3: Concentrations of hydrocarbons in sediments from the Nordøst Frigg field, 2000. All values in mg/kg dry sediment. Values above LSC97-00 RegII are dark shaded and values between LSC00NEF20R and LSC97-00 RegII light shaded...........................................................................................................................6-3
Page 24-7
Table 6-4: Concentrations of hydrocarbons in vertical sections of sediment samples from the Nordøst Frigg field, 2000. All values in mg/kg dry sediment. Values above LSC97-00 RegII are dark shaded and values between LSC00NEF20R and LSC97-00 RegII light shaded..................................................................................6-3
Table 6-5: Concentrations of selected metals in sediments from the Nordøst Frigg field, 2000. All values in mg/kg dry sediment. Values above LSC97-00 RegII are dark shaded and values between LSC00NEF20R and LSC97-00 RegII light shaded...........................................................................................................................6-4
Table 6-6: Concentrations of selected metals in vertical sections of the sediment samples from the Nordøst Frigg field. All values in mg/kg dry sediment. Values above LSC97-00 RegII are dark shaded and values between LSC00NEF20R and LSC97-00 RegII light shaded..................................................................................6-4
Table 6-7: Distribution of individuals and taxa within the main taxonomic groups at Nordøst Frigg, 2000 (excluding juveniles). .................................................................................................................................6-7
Table 6-8: Number of individuals and taxa and selected community indices for each station (0.5 m2) at the Nordøst Frigg field, 2000 (minimum and maximum values for each parameter are indicated with bold text). ...........................................................................................................................................................6-8
Table 6-9: Classification into impact groups, distance to installation and biological statistics for the field stations at Nordøst Frigg field and selected regional and reference stations in Region II, 2000. .............6-12
Table 6-10: Number of individuals and the accumulative abundance for the ten most dominant taxa at each station at the Nordøst Frigg field, 2000. ...................................................................................................6-13
Table 6-11: Station information for Nordøst Frigg field, 2000..........................................................................6-15 Table 7-1: Summary of recent operational and accidental discharges at the Øst Frigg field (all discharges in
tonnes). .......................................................................................................................................................7-1 Table 7-2: The median (phi) and amount (%) of pelite, fine sand and TOM in the sediment from stations at
the Øst Frigg field, 2000 (minimum and maximum values for each parameter are indicated with bold text). ...........................................................................................................................................................7-2
Table 7-3: Background levels and Limits of Significant Contamination for the Øst Frigg field, 2000. All values in mg/kg dry sediment. ....................................................................................................................7-4
Table 7-4: Concentrations of hydrocarbons in sediments from the Øst Frigg field, 2000. All values in mg/kg dry sediment. Values above LSC97-00 RegII are dark shaded and values between LSC00PSB13R and LSC97-
00 RegII light shaded. ....................................................................................................................................7-4 Table 7-5: Concentrations of hydrocarbons in vertical sections of the sediment samples from the Øst Frigg
field, 2000. All values in mg/kg dry sediment. Values above LSC97-00 RegII are dark shaded and values between LSC00PSB13R and LSC97-00 RegII light shaded. .................................................................................7-4
Table 7-6: Concentrations of selected metals in sediments from the Øst Frigg field, 2000. All values in mg/kg dry sediment. Values above LSC97-00 RegII are dark shaded and values between LSC00PSB13R and LSC97-00 RegII light shaded...........................................................................................................................7-5
Table 7-7: Concentrations of selected metals in vertical sections of the sediment samples from the Øst Frigg field. All values in mg/kg dry sediment. Values above LSC97-00 RegII are dark shaded and values between LSC 00PSB13R and LSC97-00 RegII light shaded. ................................................................................7-6
Table 7-8: Distribution of individuals and taxa within the main taxonomic groups at Øst Frigg, 2000 (excluding juveniles). .................................................................................................................................7-9
Table 7-9: Number of individuals and taxa and selected community indices for each station (0.5 m2) at the Øst Frigg field, 2000 (minimum and maximum values for each parameter are indicated with bold text).7-10
Table 7-10: Classification into impact groups, distance to installation and biological statistics for the field stations at Øst Frigg field and selected regional and reference stations in Region II, 2000. ....................7-15
Table 7-11: Distance along the transects and calculated minimum area of contaminated sediments at the Øst Frigg field, 2000 and previous survey. .....................................................................................................7-16
Table 7-12: Number of individuals and the accumulative abundance for the ten most dominant taxa at each station at the Øst Frigg field, 2000. ..........................................................................................................7-18
Table 7-13: Station information for Øst Frigg field, 2000. ................................................................................7-19 Table 8-1: Summary of recent operational and accidental discharges at the Lille Frigg field (all discharges in
tonnes). .......................................................................................................................................................8-1 Table 8-2: The median (phi) and amount (%) of pelite, fine sand and TOM in the sediments from stations at
Lille Frigg field, 2000 (minimum and maximum values for each parameter are indicated with bold text). ...........................................................................................................................................................8-2
Table 8-3: Background levels and Limits of Significant Contamination for the Lille Frigg field, 2000. All values in mg/kg dry sediment. ....................................................................................................................8-4
Table 8-4: Concentrations of hydrocarbons in sediments from the Lille Frigg field, 2000. All values in mg/kg dry sediment. Values above LSC97-00 RegII are dark shaded and values between LSC00LFR10R and LSC97-
00 RegII light shaded. ....................................................................................................................................8-4
Page 24-8
Table 8-5: Concentrations of hydrocarbons in vertical sections of sediment samples from the Lille Frigg field, 2000. All values in mg/kg dry sediment. Values above LSC97-00 RegII are dark shaded and values between LSC00LFR10R and LSC97-00 RegII light shaded..................................................................................8-4
Table 8-6: Concentrations of selected metals in sediments from the Lille Frigg field, 2000. All values in mg/kg dry sediment. Values above LSC97-00 RegII are dark shaded and values between LSC00LFR10R and LSC97-00 RegII light shaded...........................................................................................................................8-5
Table 8-7: Concentrations of selected metals in vertical sections of the sediment samples from the Lille Frigg field. All values in mg/kg dry sediment. Values above LSC97-00 RegII are dark shaded and values between LSC00LFR10R and LSC97-00 RegII light shaded..................................................................................8-5
Table 8-8: Distribution of individuals and taxa within the main taxonomic groups at Lille Frigg, 2000 (excluding juveniles). .................................................................................................................................8-9
Table 8-9: Number of individuals and taxa and selected community indices for each station (0.5 m2) at the Lille Frigg field, 2000 (minimum and maximum values for each parameter are indicated with bold text). .........................................................................................................................................................8-10
Table 8-10: Classification into faunal groups, distance to installation and biological statistics for the field stations at Lille Frigg field, 2000..............................................................................................................8-15
Table 8-11: Distance along the transects and calculated minimum area of contaminated sediments the Lille Frigg field, 2000 and previous survey. .....................................................................................................8-16
Table 8-12: Number of individuals and the accumulative abundance for the ten most dominant taxa at each station at the Lille Frigg field, 2000. .......................................................................................................8-18
Table 8-13:Station information for Lille Frigg field, 2000. ...............................................................................8-19 Table 9-1: Summary of recent accidental discharges at the Frøy field (all discharges in tonnes). ......................9-1 Table 9-2: The median (phi) and amount (%) of pelite, fine sand and TOM in the sediments from stations at
the Frøy field, 2000 (minimum and maximum values for each parameter are indicated with bold text). ..9-2 Table 9-3: Background levels and Limits of Significant Contamination for the Frøy field, 2000. All values in
mg/kg dry sediment. ...................................................................................................................................9-4 Table 9-4: Concentrations of hydrocarbons and synthetic base oil in sediments from the Frøy field, 2000. All
values in mg/kg dry sediment. Values above LSC97-00 RegII are dark shaded, values between LSC00FRY18R and LSC97-00 RegII are light shaded and olefin values at or above the limit of quantitation are dark shaded.................................................................................................................................................9-4
Table 9-5: Concentrations of hydrocarbons and synthetic base oil in vertical sections of the sediment samples from the Frøy field, 2000. All values in mg/kg dry sediment. Values above LSC97-00 RegII are dark shaded, values between LSC00FRY18R and LSC97-00 RegII are light shaded and olefin values at or above the limit of quantification are dark shaded. ......................................................................................................9-4
Table 9-6: Concentrations of selected metals in sediments from the Frøy field, 2000. All values in mg/kg dry sediment. Values above LSC97-00 RegII are dark shaded and values between LSC 00FRY18R and LSC97-00
RegII are light shaded. .................................................................................................................................9-6 Table 9-7: Concentrations of selected metals in vertical sections of the sediment samples from the Frøy field.
All concentrations in mg/kg dry sediment. Values above LSC97-00 RegII are dark shaded and values between LSC 00FRY18R and LSC97-00 RegII light shaded. .................................................................................9-6
Table 9-8: Distribution of individuals and taxa within the main taxonomic groups at Frøy, 2000 (excluding juveniles). .................................................................................................................................................9-10
Table 9-9: Number of individuals and taxa and selected community indices for each station (0.5 m2) at the Frøy field, 2000 (minimum and maximum values for each parameter are indicated with bold text). ......9-11
Table 9-10: Classification in impact groups, distance to installation and biological statistics for the field stations at Frøy field, 2000. ......................................................................................................................9-17
Table 9-11: Distance along the transects and calculated minimum area of contaminated sediments and disturbed fauna at the Frøy field, 2000 and previous survey. ...................................................................9-18
Table 9-12: Number of individuals and the accumulative abundance for the ten predominant taxa at each station at the Frøy field, 2000...................................................................................................................9-20
Table 9-13: Station information for Frøy field, 2000.........................................................................................9-21 Table 10-1: Summary of recent operational and accidental discharges at the Ringhorne field (all discharges
in tonnes). .................................................................................................................................................10-1 Table 10-2: The median (phi) and amount of pelite, fine sand and TOM in the sediment from stations at the
Ringhorne field, 2000 (minimum and maximum values for each parameter are indicated with bold text). .........................................................................................................................................................10-2
Table 10-3: Background levels and Limits of Significant Contamination for the Ringhorne field, 2000. All values in mg/kg dry sediment. ..................................................................................................................10-4
Page 24-9
Table 10-4: Concentrations of hydrocarbons in sediments from the Ringhorne field, 2000. All concentrations in mg/kg dry sediment. Values above LSC00 RIN29R are dark shaded and values between LSC00RIN29R and LSC97-00 RegII are light shaded. ..................................................................................................................10-4
Table 10-5: Concentrations of hydrocarbons in vertical sections of the sediment samples from the Ringhorne field, 2000. All concentrations in mg/kg dry sediment. Values above LSC00 RIN29R are dark shaded and values between LSC00 RIN29R and LSC97-00 RegII are light shaded. ..............................................................10-5
Table 10-6: Concentrations of selected metals in sediments from the Ringhorne field, 2000. All concentrations in mg/kg dry sediment. Values above LSC00RIN29R are dark shaded and values between LSC00RIN29R and LSC97-00 RegII are light shaded. ..................................................................10-7
Table 10-7: Concentrations of selected metals in vertical sections of the sediment samples from the Ringhorne field. All concentrations in mg/kg dry sediment. Values above LSC00RIN29R are dark shaded and values between LSC00RIN29R and LSC97-00 RegII are light shaded. ....................................10-8
Table 10-8: Distribution of individuals and taxa within the main taxonomic groups at Ringhorne, 2000 (excluding juveniles). .............................................................................................................................10-11
Table 10-9: Number of individuals, taxa and selected community indices for each station (0.5 m2) at the Ringhorne field 2000 (minimum and maximum values for each parameter are indicated with bold text).10-12
Table 10-10: Classification into impact groups, distance to installation and biological statistics for the field stations at Ringhorne field, 2000............................................................................................................10-18
Table 10-11: Number of individuals and the accumulative abundance for the ten predominant taxa at each station at the Ringhorne field, 2000........................................................................................................10-20
Table 10-12:Station information for Ringhorne field, 2000. ...........................................................................10-25 Table 11-1: Summary of recent operational and accidental discharges at the Sigyn field (all discharges in
tonnes). .....................................................................................................................................................11-1 Table 11-2: The median (phi) and amount of pelite, fine sand and TOM in the sediments from stations at the
Sigyn field, 2000 (minimum and maximum values for each parameter are indicated with bold text). ....11-2 Table 11-3: Background levels and Limits of Significant Contamination for the Sigyn field, 2000. All values
in mg/kg dry sediment. .............................................................................................................................11-4 Table 11-4: Concentrations of hydrocarbons in sediments from the Sigyn field, 2000. All values in mg/kg dry
sediment. ..................................................................................................................................................11-4 Table 11-5: Concentrations of hydrocarbons in vertical sections of the sediment samples from the Sigyn
field, 2000. All concentrations in mg/kg dry sediment.............................................................................11-4 Table 11-6: Concentrations of selected metals in sediments from the Sigyn field, 2000. All values in mg/kg
dry sediment. ............................................................................................................................................11-5 Table 11-7: Concentrations of selected metals in vertical sections of the sediment samples from the Sigyn
field. All concentrations in mg/kg dry sediment. .....................................................................................11-5 Table 11-8: Distribution of individuals and taxa within the main taxonomic groups at Sigyn, 2000 (excluding
juveniles). .................................................................................................................................................11-8 Table 11-9: Number of individuals, taxa and selected community indices for each station (0.5 m2) at the
Sigyn field, 2000 (minimum and maximum values for each parameter are indicated with bold text). ....11-9 Table 11-10: Classification into impact groups, distance to installation and biological statistics for the field
stations at Sigyn field, 2000. ..................................................................................................................11-14 Table 11-11: Number of individuals and the accumulative abundance for the ten most dominant taxa at each
station at the Sigyn field, 2000. ..............................................................................................................11-15 Table 11-12: Station information for Sigyn field, 2000. ..................................................................................11-17 Table 12-1: Summary of recent wells drilled and operational and accidental discharges at the Balder field,
(all discharges in tonnes). .........................................................................................................................12-1 Table 12-2: The median (phi) and amount of pelite, fine sand and TOM in the sediment from stations at the
Balder field, 2000 (minimum and maximum values for each parameter are indicated with bold text)....12-2 Table 12-3: Background levels and Limits of Significant Contamination for the Balder field, 2000. All values
in mg/kg dry sediment. .............................................................................................................................12-4 Table 12-4: Concentrations of hydrocarbons and synthetic base oil in sediments from the Balder field, 2000.
All values in mg/kg dry sediment. Values above LSC97-00 RegII are dark shaded and values between LSC00 BAL27R and LSC97-00 RegII light shaded. Olefin values at or above the limit of quantitation are dark shaded.......................................................................................................................................................12-4
Table 12-5: Concentrations of hydrocarbons and synthetic base oil in vertical sections of the sediment samples from the Balder field, 2000. All values in mg/kg dry sediment. Values above LSC97-00 RegII are dark shaded and values between LSC00 BAL27R and LSC97-00 RegII light shaded. Olefin values at or above the limit of quantitation are dark shaded. .................................................................................................12-5
Page 24-10
Table 12-6: Concentrations of selected metals in sediments from the Balder field, 2000. All values in mg/kg dry sediment. Values above LSC00 BAL27R are dark shaded and values between LSC00 BAL27R and LSC97-
00 RegII are light shaded. .............................................................................................................................12-7 Table 12-7: Concentrations of selected metals in vertical sections of the sediment samples from the Balder
field. All values in mg/kg dry sediment. Values above LSC00 BAL27R are dark shaded and values between LSC00 BAL27R and LSC97-00 RegII are light shaded. ........................................................................12-8
Table 12-8: Distribution of individuals and taxa within the main taxonomic groups at Balder, 2000 (excluding juveniles). .............................................................................................................................12-12
Table 12-9: Number of individuals and taxa and selected community indices for each station (0.5 m2) at the Balder field, 2000 (minimum and maximum values for each parameter are indicated with bold text)..12-13
Table 12-10: Classification into impact groups, distance to installation and biological statistics for the field stations at Balder field, 2000. .................................................................................................................12-21
Table 12-11: Distance along the transects and calculated minimum area of contaminated sediments the Balder field, 2000 and previous survey. .................................................................................................12-23
Table 12-12: Number of individuals and the accumulative abundance for the ten most dominant taxa at each station at the Balder field, 2000..............................................................................................................12-25
Table 12-13: Station information for Balder field, 2000..................................................................................12-29 Table 13-1: Summary of recent wells drilled and operational and accidental discharges at the Jotun field
(discharges in tonnes). ..............................................................................................................................13-1 Table 13-2: The median (phi) and amount of pelite, fine sand and TOM in the sediment from stations at the
Jotun field, 2000 (minimum and maximum values for each parameter are indicated with bold text). .....13-2 Table 13-3: Background levels and Limits of Significant Contamination for the Jotun field, 2000. All values
in mg/kg dry sediment. .............................................................................................................................13-4 Table 13-4: Concentrations of hydrocarbons in sediments from the Jotun field, 2000. All values in mg/kg dry
sediment. Values above LSCJOT30R are dark shaded and values between LSC97-00RegII and LSCJOT30R are light shaded. .............................................................................................................................................13-4
Table 13-5: Concentrations of hydrocarbons in vertical sections of sediment samples from the Jotun field, 2000. All values in mg/kg dry sediment. Values above LSCJOT30R are dark shaded and values between LSC97-00RegII and LSCJOT30R are light shaded. ............................................................................................13-4
Table 13-6: Concentrations of selected metals in sediments from the Jotun field, 2000. All values in mg/kg dry sediment. Values above LSCJOT30R are dark shaded and values between LSC97-00RegII and LSCJOT30R are light shaded.........................................................................................................................................13-6
Table 13-7: Concentrations of selected metals in vertical sections of the sediment samples from the Jotun field. All values in mg/kg dry sediment. Values above LSCJOT30R are dark shaded and values between LSC97-00RegII and LSCJOT30R are light shaded. ............................................................................................13-6
Table 13-8: Distribution of individuals and taxa within the main taxonomic groups at Jotun, 2000 (excluding juveniles). ...............................................................................................................................................13-10
Table 13-9: Number of individuals and taxa and selected community indices for each station (0.5 m2) sampled at the Jotun field, 2000 (minimum and maximum values for each parameter are indicated with bold text). ...............................................................................................................................................13-11
Table 13-10: Classification into impact groups, distance to installation and biological statistics for the field stations at Jotun field, 2000. ...................................................................................................................13-16
Table 13-11: Distance along the transects and calculated minimum area of contaminated sediments at the Jotun field, 2000 and previous survey. ...................................................................................................13-17
Table 13-12: Number of individuals and the accumulative abundance for the ten predominant taxa at each station at the Jotun field, 2000................................................................................................................13-18
Table 13-13: Station information for Jotun field, 2000....................................................................................13-21 Table 14-1: The median (phi) and amount of pelite, fine sand and TOM in the sediment from stations at the
Odin field, 2000 (minimum and maximum values for each parameter are indicated with bold text).......14-2 Table 14-2: Background levels and Limits of Significant Contamination for the Odin field, 2000. All values
in mg/kg dry sediment. .............................................................................................................................14-4 Table 14-3: Concentrations of hydrocarbons in sediments from the Odin field, 2000. All values in mg/kg dry
sediment. Values above LSC97-00RegII are dark shaded..............................................................................14-4 Table 14-4: Concentrations of hydrocarbons in vertical sections of the sediment samples from the Odin field,
2000. All concentrations in mg/kg dry sediment. Values above LSC97-00RegII are dark shaded. ...............14-4 Table 14-5: Concentrations of selected metals in sediments from the Odin field, 2000. All values in mg/kg
dry sediment. Values above LSC97-00RegII are dark shaded. ......................................................................14-5 Table 14-6: Concentrations of selected metals in vertical sections of the sediment samples from the Odin
field. All concentrations in mg/kg dry sediment. Values above LSC97-00RegII are dark shaded................14-6
Page 24-11
Table 14-7: Distribution of individuals and taxa within the main taxonomic groups at Odin, 2000 (excluding juveniles). .................................................................................................................................................14-9
Table 14-8: Number of individuals and taxa and selected community indices for each station (0.5 m2) at the Odin field, 2000 (minimum and maximum values for each parameter are indicated with bold text).....14-10
Table 14-9: Classification into impact groups, distance to installation and biological statistics for the field stations at Odin field, 2000.....................................................................................................................14-15
Table 14-10: Distance along the transects and calculated minimum area of contaminated sediments and disturbed fauna at the Odin field, 2000 and previous survey. ................................................................14-16
Table 14-11: Number of individuals and the accumulative abundance for the ten most dominant taxa at each station at the Odin field, 2000. ...............................................................................................................14-17
Table 14-12: Station information for Odin field, 2000. ...................................................................................14-19 Table 15-1: Summary of recent wells drilled and operational and accidental discharges at the Varg field (all
discharges in tonnes). ...............................................................................................................................15-1 Table 15-2: The median (phi) and amount (%) of pelite, fine sand and TOM in the sediment from stations at
the Varg field, 2000 (minimum and maximum values for each parameter are indicated with bold text).15-2 Table 15-3: Background levels and Limits of Significant Contamination for the Varg field, 2000. All values
in mg/kg dry sediment. .............................................................................................................................15-4 Table 15-4: Concentrations of hydrocarbons in sediments from the Varg field, 2000. All values in mg/kg dry
sediment. Values above LSC97-00 shallow RegII are dark shaded.....................................................................15-4 Table 15-5: Concentrations of hydrocarbons in vertical sections of the sediment samples from the Varg field,
2000. All concentrations in mg/kg dry sediment. Values above LSC97-00 shallow RegII are dark shaded. ......15-4 Table 15-6: Concentrations of selected metals in sediments from the Varg field, 2000. All values in mg/kg
dry sediment. Values above LSC97-00 shallow RegII are dark shaded and values between LSC00 VAR14R and LSC97-00 shallow RegII light shaded. ...............................................................................................................15-5
Table 15-7: Concentrations of selected metals in vertical sections of the sediment samples from the Varg field. (All concentrations in mg/kg dry sediment. Values above LSC97-00 shallow RegII are dark shaded and values in grey zone light shaded.) ............................................................................................................15-6
Table 15-8: Distribution of individuals and taxa within the main taxonomic groups at Varg, 2000 (excluding juveniles). .................................................................................................................................................15-9
Table 15-9: Number of individuals and taxa and selected community indices for each station (0.5 m2) at the Varg field, 2000 (minimum and maximum values for each parameter are indicated with bold text).....15-10
Table 15-10: Classification into impact groups, distance to installation and biological statistics for the field stations at Varg field, 2000.....................................................................................................................15-15
Table 15-11: Distance along the transects and calculated minimum area of contaminated sediments and disturbed fauna at the Varg field, 2000 and previous survey. ................................................................15-16
Table 15-12: Number of individuals and the accumulative abundance for the ten predominant taxa at each station at the Varg field, 2000. ...............................................................................................................15-17
Table 15-13: Station information for Varg field, 2000. ...................................................................................15-19 Table 16-1: Summary of recent wells drilled and operational and accidental discharges at the Heimdal field
(all discharges in tonnes). .........................................................................................................................16-1 Table 16-2: The median (phi) and amount (%) of pelite, fine sand and TOM in the sediments from the
stations at Heimdal, 2000 (minimum and maximum values for each parameter are indicated with bold text). .........................................................................................................................................................16-2
Table 16-3: Background levels and Limits of Significant Contamination for the Heimdal field, 2000. All values in mg/kg dry sediment. ..................................................................................................................16-4
Table 16-4: Concentrations of hydrocarbons in sediments from the Heimdal field, 2000. All values in mg/kg dry sediment. Values above LSC97-00 RegII are dark shaded and values between LSC00HEM22R and LSC97-
00 RegII light shaded. ..................................................................................................................................16-4 Table 16-5: Concentrations of hydrocarbons in vertical sections of the sediment samples from the Heimdal
field, 2000. All values in mg/kg dry sediment. Values above LSC97-00 RegII are dark shaded and values between LSC00HEM22R and LSC97-00 RegII light shaded. ..............................................................................16-4
Table 16-6: Concentrations of selected metals in sediments from the Heimdal field, 2000. All values in mg/kg dry sediment. Values above LSC97-00 RegII are dark shaded and values between LSC00HEM22R and LSC97-00 RegII light shaded.........................................................................................................................16-5
Table 16-7: Concentrations of selected metals in vertical sections of the sediment samples from the Heimdal field. All values in mg/kg dry sediment. Values above LSC97-00 RegII are dark shaded and values between LSC00HEM22R and LSC97-00 RegII light shaded...............................................................................16-6
Table 16-8: Distribution of individuals and taxa within the main taxonomic groups at Heimdal, 2000 (excluding juveniles). ...............................................................................................................................16-9
Page 24-12
Table 16-9: Number of individuals and taxa and selected community indices for each station (0.5 m2) at the Heimdal field, 2000 (minimum and maximum values for each parameter are indicated with bold text).16-10
Table 16-10: Biological characteristics at the Heimdal field, 2000 and previous surveys...............................16-11 Table 16-11: Classification into impact groups, distance to installation and biological statistics for the field
stations at Heimdal field, 2000. ..............................................................................................................16-15 Table 16-12: Distance along the transects and calculated minimum area of contaminated sediments and
disturbed fauna at the Heimdal field, 2000 and previous survey............................................................16-16 Table 16-13: Number of individuals and the accumulative abundance for the ten predominant taxa at each
station at the Heimdal field, 2000...........................................................................................................16-17 Table 16-14: Station information for Heimdal field, 2000...............................................................................16-19 Table 17-1: The median (phi) and amount of pelite, fine sand and TOM in the sediment from stations at the
Glitne field, 2000 (minimum and maximum values for each parameter are indicated with bold text).....17-1 Table 17-2: Background levels and Limits of Significant Contamination for the Glitne field, 2000. All values
in mg/kg dry sediment. .............................................................................................................................17-3 Table 17-3: Concentrations of hydrocarbons in sediments from the Glitne field, 2000. All values in mg/kg
dry sediment Values above LSC00 RII08/GLI are dark shaded and values between LSC00 RII08/GLI and LSC97-00 RegII are light shaded....................................................................................................................17-3
Table 17-4: Concentrations of hydrocarbons in vertical sections of the sediment samples from the Glitne field, 2000. All concentrations in mg/kg dry sediment. Values above LSC00 RII08/GLI are dark shaded and values between LSC00 RII08/GLI and LSC97-00 RegII are light shaded.............................................................17-3
Table 17-5: Concentrations of selected metals in sediments from the Glitne field, 2000. All values in mg/kg dry sediment. Values between LSC00 RII08/GLI and LSC97-00 RegII are shaded..............................................17-5
Table 17-6: Concentrations of selected metals in vertical sections of the sediment samples from the Glitne field. All concentrations in mg/kg dry sediment. Values above LSC00 RII08/GLI are dark shaded and values between LSC00 RII08/GLI and LSC97-00 RegII are light shaded.............................................................17-5
Table 17-7: Distribution of individuals and taxa within the main taxonomic groups at Glitne, 2000 (excluding juveniles). .................................................................................................................................................17-8
Table 17-8: Number of individuals and taxa and selected community indices for each station (0.5 m2) at the Glitne field, 2000 (minimum and maximum values for each parameter are indicated with bold text).....17-9
Table 17-9: Classification into impact groups, distance to installation and biological statistics for the field stations at Glitne field, 2000...................................................................................................................17-14
Table 17-10: Number of individuals and accumulative abundance for the ten most dominant taxa at each station at the Glitne field, 2000. .............................................................................................................17-16
Table 17-11: Station information for Glitne field, 2000. .................................................................................17-19 Table 18-1: Summary of recent wells drilled and operational and accidental discharges at the Sleipner Vest
field (all discharges in tonnes)..................................................................................................................18-1 Table 18-2: The median (phi) and amount of pelite, fine sand and TOM in the sediment from stations at the
Sleipner Vest field, 2000 (minimum and maximum values for each parameter are indicated with bold text). .........................................................................................................................................................18-2
Table 18-3: Background levels and Limits of Significant Contamination for the Sleipner Vest field, 2000. All values in mg/kg dry sediment. ..................................................................................................................18-4
Table 18-4: Concentrations of hydrocarbons in sediments from the Sleipner Vest field, 2000. All values in mg/kg dry sediment. Values above LSC97-00 RegII are shaded. ..................................................................18-4
Table 18-5: Concentrations of hydrocarbons in vertical sections of the sediment samples from the Sleipner Vest field, 2000. All concentrations in mg/kg dry sediment. Values above LSC97-00 RegII are shaded......18-4
Table 18-6: Concentrations of selected metals in sediments from the Sleipner Vest field, 2000. All values in mg/kg dry sediment. Values above LSC97-00 RegII are shaded. ..................................................................18-6
Table 18-7: Concentrations of selected metals in vertical sections of the sediment samples from the Sleipner Vest field. All concentrations in mg/kg dry sediment. Values above LSC97-00 RegII are shaded . ............18-6
Table 18-8: Distribution of individuals and taxa within the main taxonomic groups at Sleipner Vest, 2000 (excluding juveniles). ...............................................................................................................................18-9
Table 18-9: Number of individuals and taxa and selected community indices for each station (0.5 m2) at the Sleipner Vest field, 2000 (minimum and maximum values for each parameter are indicated with bold text). .......................................................................................................................................................18-10
Table 18-10: Classification into impact groups, distance to installation and biological statistics for the field stations at Sleipner Vest field, 2000. ......................................................................................................18-15
Table 18-11: Distance along the transects and calculated minimum area of contaminated sediments and disturbed fauna at the Sleipner Vest field, 2000 and previous survey. ...................................................18-16
Table 18-12: Number of individuals and the accumulative abundance for the ten most dominant taxa at each station at the Sleipner Vest field, 2000...................................................................................................18-17
Page 24-13
Table 18-13: Station information for Sleipner Vest field, 2000.......................................................................18-19 Table 19-1: Summary of recent wells drilled and operational and accidental discharges at the Sleipner Øst
field (all discharges in tonnes)..................................................................................................................19-1 Table 19-2: The median (phi) and amount of pelite, fine sand and TOM in the sediment from stations at the
Sleipner Øst field, 2000 (minimum and maximum values for each parameter are indicated with bold text). .........................................................................................................................................................19-2
Table 19-3: Background levels and Limits of Significant Contamination for the Sleipner Øst field, 2000. All values in mg/kg dry sediment. ..................................................................................................................19-4
Table 19-4: Concentrations of hydrocarbons and synthetic base oils in sediments from the Sleipner Øst field, 2000. All values in mg/kg dry sediment. Hydrocarbon values above LSC97-00 shallow RegII are dark shaded and values in grey zone light shaded. Olefin and ester values at or above the limit of quantitation are dark shaded...............................................................................................................................................19-5
Table 19-5: Concentrations of hydrocarbons and synthetic base oil in vertical sections of the sediment samples from the Sleipner Øst field, 2000. All concentrations in mg/kg dry sediment. Hydrocarbon values above LSC97-00 shallow RegII are dark shaded and values in grey zone light shaded. Olefin and ester values at or above the limit of quantitation are dark shaded.....................................................................19-5
Table 19-6: Concentrations of selected metals in sediments from the Sleipner Øst field, 2000. All values in mg/kg dry sediment. Values above LSC97-00 shallow RegII are dark shaded and values in grey zone light shaded. .............................................................................................................................................19-8
Table 19-7: Concentrations of selected metals in vertical sections of the sediment samples from the Sleipner Øst field. All concentrations in mg/kg dry sediment. Values above LSC97-00 shallow RegII are dark shaded and values in grey zone light shaded. ...........................................................................................19-8
Table 19-8: Distribution of individuals and taxa within the main taxonomic groups at Sleipner Øst, 2000 (excluding juveniles). .............................................................................................................................19-12
Table 19-9: Number of individuals and taxa and selected community indices for each station (0.5 m2) at the Sleipner Øst field, 2000 (minimum and maximum values for each parameter are indicated with bold text). .......................................................................................................................................................19-13
Table 19-10: Classification into impact groups, distance to installation and biological statistics for the field stations at Sleipner Øst field, 2000.........................................................................................................19-18
Table 19-11: Distance along the transects and calculated minimum area of contaminated sediments and disturbed fauna at the Sleipner Øst field, 2000 and previous survey......................................................19-20
Table 19-12: Number of individuals and the accumulative abundance for the ten most dominant taxa at each station at the Sleipner Øst field, 2000.....................................................................................................19-22
Table 19-13: Station information for Sleipner Øst field, 2000. .......................................................................19-25 Table 20-1: Distribution of individuals and taxa within the main taxonomic groups in Region II, 2000
(excluding juveniles). ...............................................................................................................................20-7 Table 20-2: Calculated minimum area (km2) of disturbed fauna and contaminated sediments in Region II,
2000..........................................................................................................................................................20-9 Table 20-3: Calculated area (km2) of disturbed fauna and contaminated sediments in Region II, 1997..........20-10 Table 20-4: Range of values of physical, chemical and biological parameters in Region II, 1997 and 2000..20-10