environmental noise tools and testing env env charles greene product manager brüel & kjaer...
TRANSCRIPT

1
Env
Charles Greene
Product Manager
Brüel & Kjaer
Environmental Noise Tools and Testing
www.bksv.com, 2
Introduction
Charles Greene B.Eng, MIOAProduct Manager, Environmental Measurements Group
- 14 years with Brüel & Kjær
- Electronic Engineering from Westminster Uni
- Live and work in Denmark
- 2 years with ABB Process Automation
I’ve been married 10 years. My wife, Becky, is in Pharmaceutical business development. Son, Thomas, 4, is in to everything.

2
www.bksv.com, 3
Introduction
www.bksv.com, 4
The Story of Brüel & Kjær
The early start 1939
Brüel & Kjær’s firstAudio Frequency
Analyzer
Brüel & Kjær
green
Per V. Brüel Viggo Kjær
Brüel & KjærLevel Recorder
3
www.bksv.com, 5
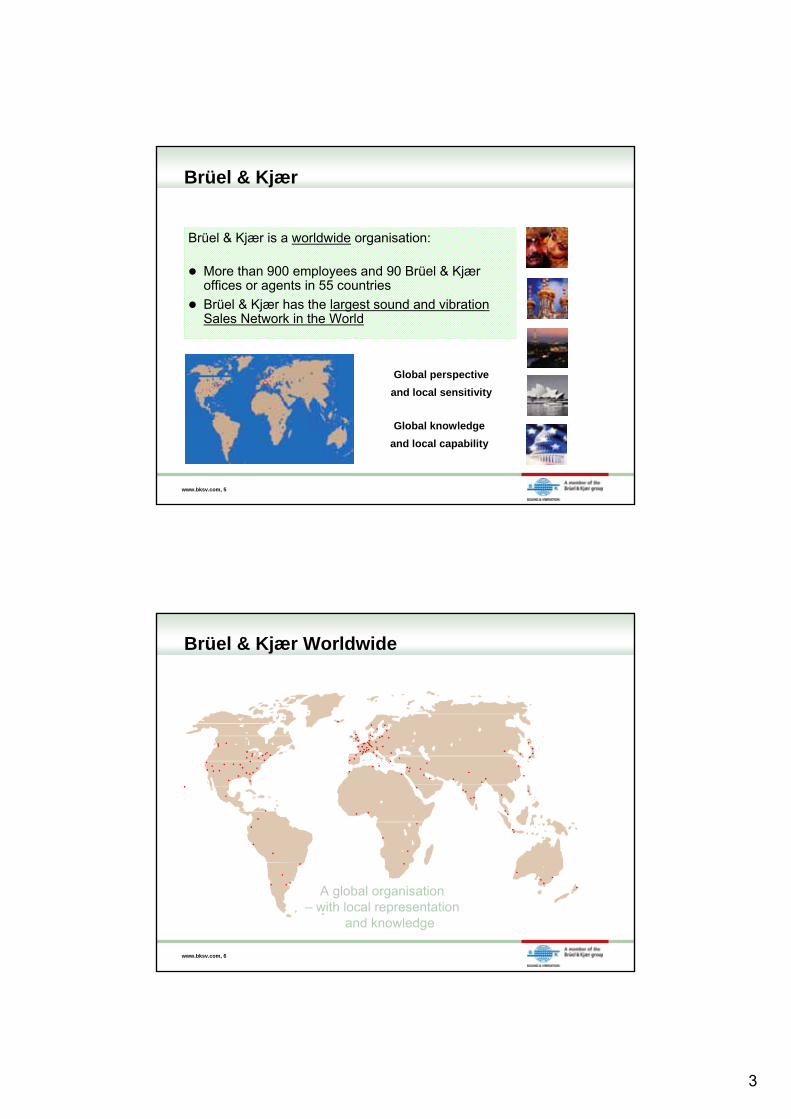
Brüel & Kjær
Brüel & Kjær is a worldwide organisation:
More than 900 employees and 90 Brüel & Kjæroffices or agents in 55 countries
Brüel & Kjær has the largest sound and vibration Sales Network in the World
Global perspective
and local sensitivity
Global knowledge
and local capability
www.bksv.com, 6
Brüel & Kjær Worldwide
A global organisation – with local representation
and knowledge

4
www.bksv.com, 7
Knowledge is for Sharing
Bruel & Kjær University offers:
Seminars and courses – for all levels of experience
Hands-on product training
Networking
Brüel & Kjær University – The global knowledge andcompetence centre within the world of sound and vibration.
Develop new sound and vibration technology
Attract and collect new sound and vibration knowledge
Distribute new sound and vibration knowledge
www.bksv.com, 8
Web-ex training – On line
……… at www.bksv.co.uk

5
Env
Charles Greene
Product Manager
Brüel & Kjaer
Environmental Noise Tools and Testing
www.bksv.com, 10
The World of Sound and Vibration Measurement
Industrial Environmental

6
www.bksv.com, 11
Introduction to Fundamental Acoustics and Environmental Parameters– Why is it important to consider environmental noise?– What is sound?– Pressure vs. Pressure Level, Power vs. Power Level, and their relationship– Noise sources and how we characterize them– Adding and averaging noise sources– Frequency and weighting
Environmental Noise Parameters– Environmental noise metrics (Demo)
– Weather considerations
– Case study of industrial noise source
Measuring Environmental Noise– Environmental noise measurement equipment (Demo)
– Where and how to measure environmental noise
– Sources and receptors
Building Acoustics– Room Acoustics
– Isolation between spaces
Environmental Noise Management– Environmental Capacity
– Barriers
– Noise modeling and mapping techniques
– Acoustic assessment report
Audiometer Calibration Instruments
Advanced Techniques– FFT, intensity, etc. (Demo)
Summary – Tips for a Good Environmental Engineer
Outline Programme
www.bksv.com, 12
Noise can be …
7
www.bksv.com, 13
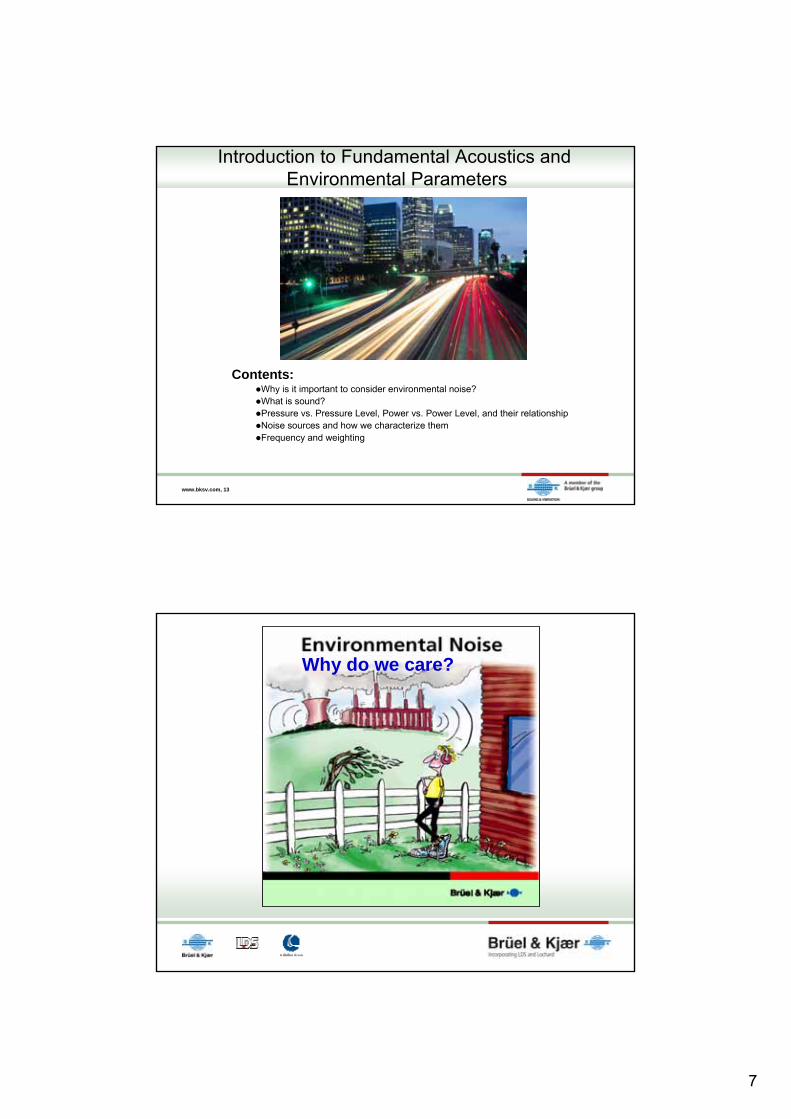
Introduction to Fundamental Acoustics and Environmental Parameters
Contents:Why is it important to consider environmental noise?What is sound?Pressure vs. Pressure Level, Power vs. Power Level, and their relationshipNoise sources and how we characterize themFrequency and weighting
Why do we care?
8
www.bksv.com, 15
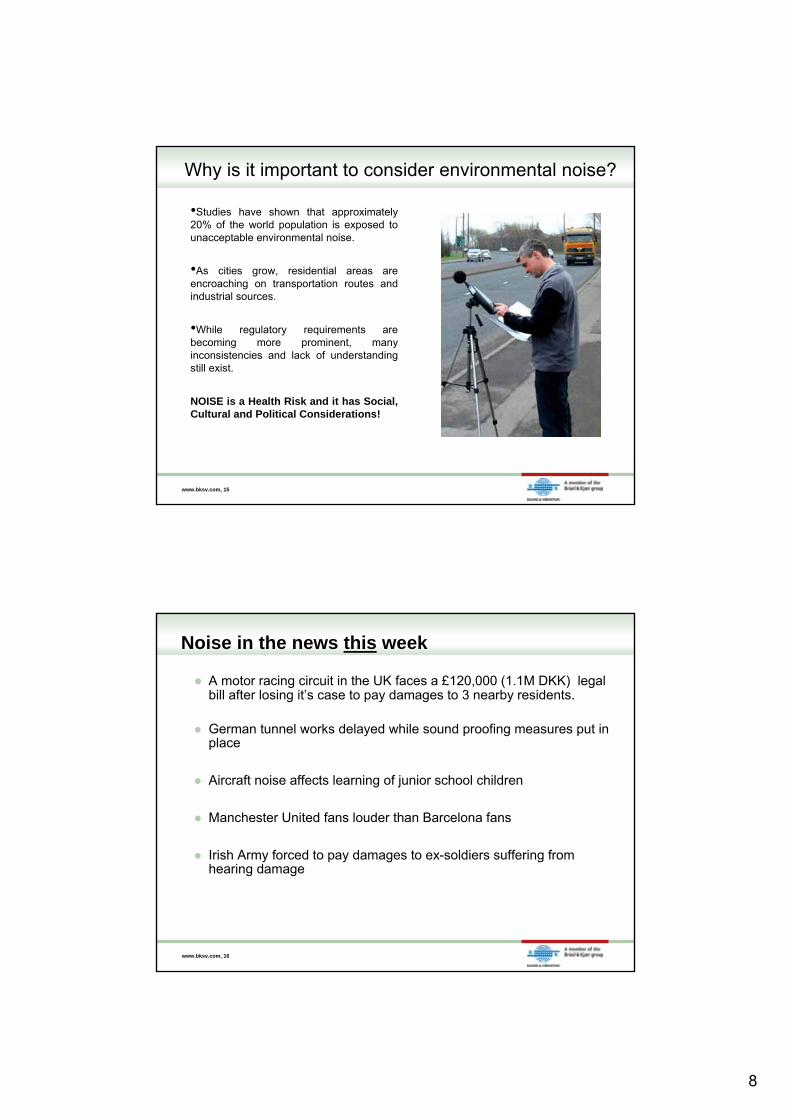
Why is it important to consider environmental noise?
•Studies have shown that approximately 20% of the world population is exposed to unacceptable environmental noise.
•As cities grow, residential areas are encroaching on transportation routes and industrial sources.
•While regulatory requirements are becoming more prominent, many inconsistencies and lack of understanding still exist.
NOISE is a Health Risk and it has Social, Cultural and Political Considerations!
www.bksv.com, 16
Noise in the news this week
A motor racing circuit in the UK faces a £120,000 (1.1M DKK) legal bill after losing it’s case to pay damages to 3 nearby residents.
German tunnel works delayed while sound proofing measures put inplace
Aircraft noise affects learning of junior school children
Manchester United fans louder than Barcelona fans
Irish Army forced to pay damages to ex-soldiers suffering from hearing damage
9
www.bksv.com, 17
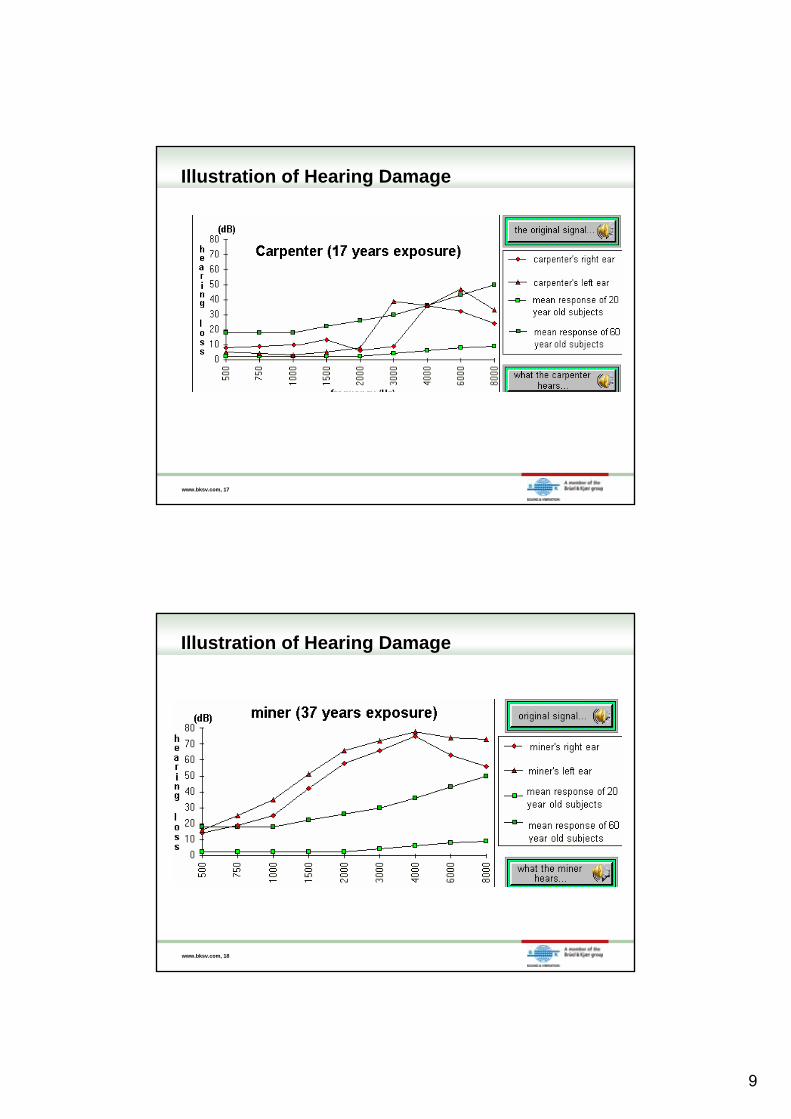
Illustration of Hearing Damage
www.bksv.com, 18
Illustration of Hearing Damage
10
www.bksv.com, 19
Why is it important to consider environmental noise?
The role of the environmental acoustician includes:•Conducting noise measurements in the field
•Predicting and/or calculating noise exposure at receptors
•Determining compliance of regulatory guidelines, expert witness
•Designing acoustic abatement
•Addressing annoyance complaints from the public
•City planning for new development and noise mapping of urban areas
www.bksv.com, 20
What is sound?
What is the definition of sound?
• Sound is the propagation of a disturbance through a medium. For air, sound propagates at the speed of sound or approximately 340 m/s (1100 Ft/sec) at STP.
• Noise is generally considered to be any unwanted sound.
• Environmental Noise is generally referred to as unwanted sound produced by human activities which interfere with communication, work, rest, recreation and sleep.
How would you define noise?
11
www.bksv.com, 21
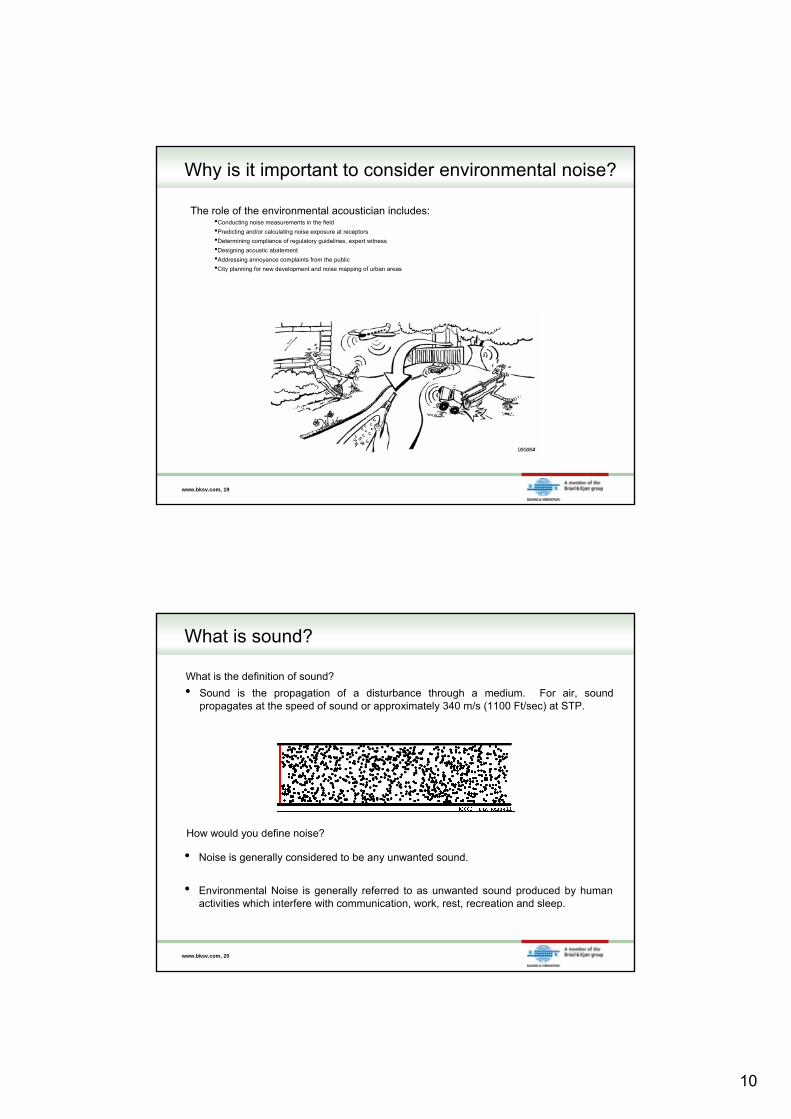
Pressure vs. Pressure Level, Power vs. Power Level,and their relationship
• Magnitude of sound pressure affecting the ear varies from 2x10⁻⁵ Pa at the threshold to 200 Pa at instantaneous damage.
• To account for this, we use a log scale to describe sound pressure level (SPL).
• Units of decibel or dB
• Expands to:
(1 Pa = 94dB)
)P/log(20 r efPSPL Where Pref = 2x10⁻⁵ Pa
(the threshold of hearing)
][94)log(20 dBPLp
www.bksv.com, 22
Pressure vs. Pressure Level, Power vs. Power Level,and their relationship
Sound Power, P[Watts]
• The rate per unit time at which airborne sound energy is radiate by a source.
• Is independent of the acoustic environment in which a source is located.
• Is an excellent parameter for quantifying the characteristics of a source.
• Again, we use a log scale to also describe sound power level.
• Also has units of decibel or dB (this can lead to confusion)
• Expands to:
)/log(10 refWWLw where Wref = 10-12
][120)log(10 dBWLw

12
www.bksv.com, 23
Pressure vs. Pressure Level, Power vs. Power Level,and their relationship
Temperature t [°C]
Power P [W]
ElectricalHeater
Analogy
Pressure p [N/m2 = Pa]
SoundSource
Lp [dB]
Power P [W]
www.bksv.com, 24
Pressure vs. Pressure Level, Power vs. Power Level,and their relationship
The relationship between sound power and sound pressure for spherical radiation is:
where ρc = 408 Rayl
We would like to develop a relationship between SPL and Lw.
Rearranging:
Rearranging:
Multiply by 10log:
Gives:
Simplifies to: [email protected](28.2cm)
13
www.bksv.com, 25
Pressure vs. Pressure Level, Power vs. Power Level,and their relationship
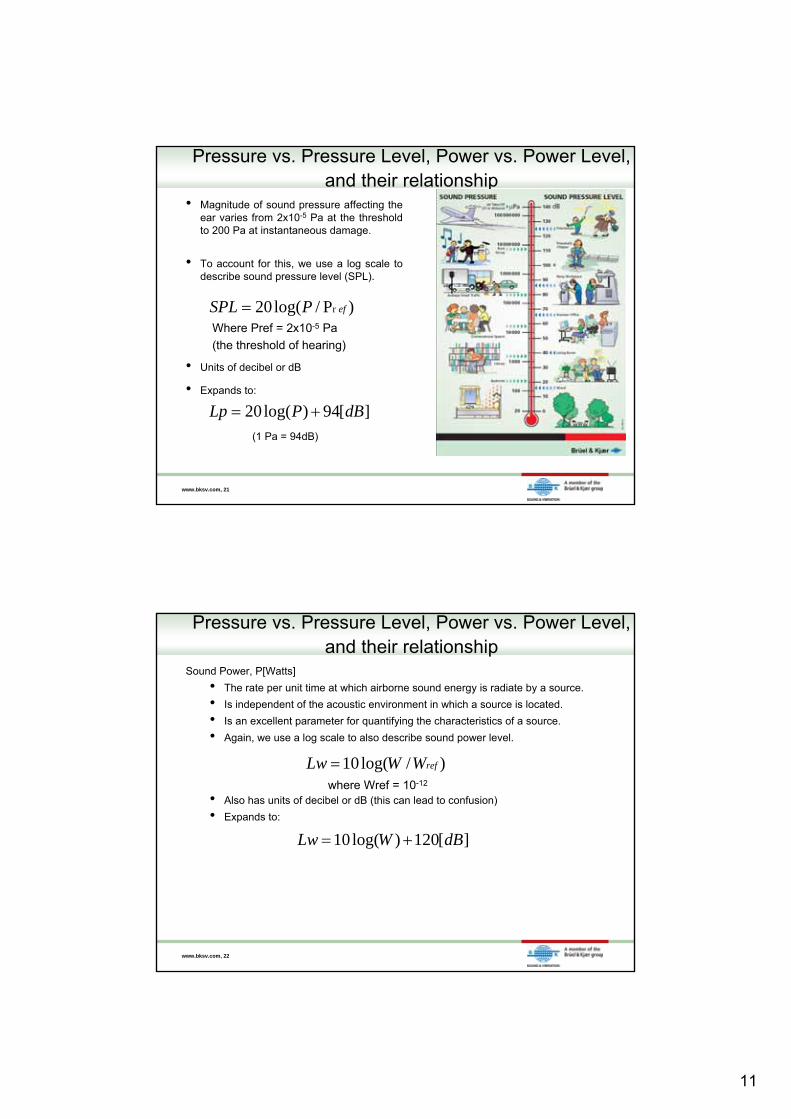
Lw is unique to the source, allowing this relationship, in terms of Lp and r:
To be further related the source at two different distances r by:
www.bksv.com, 26
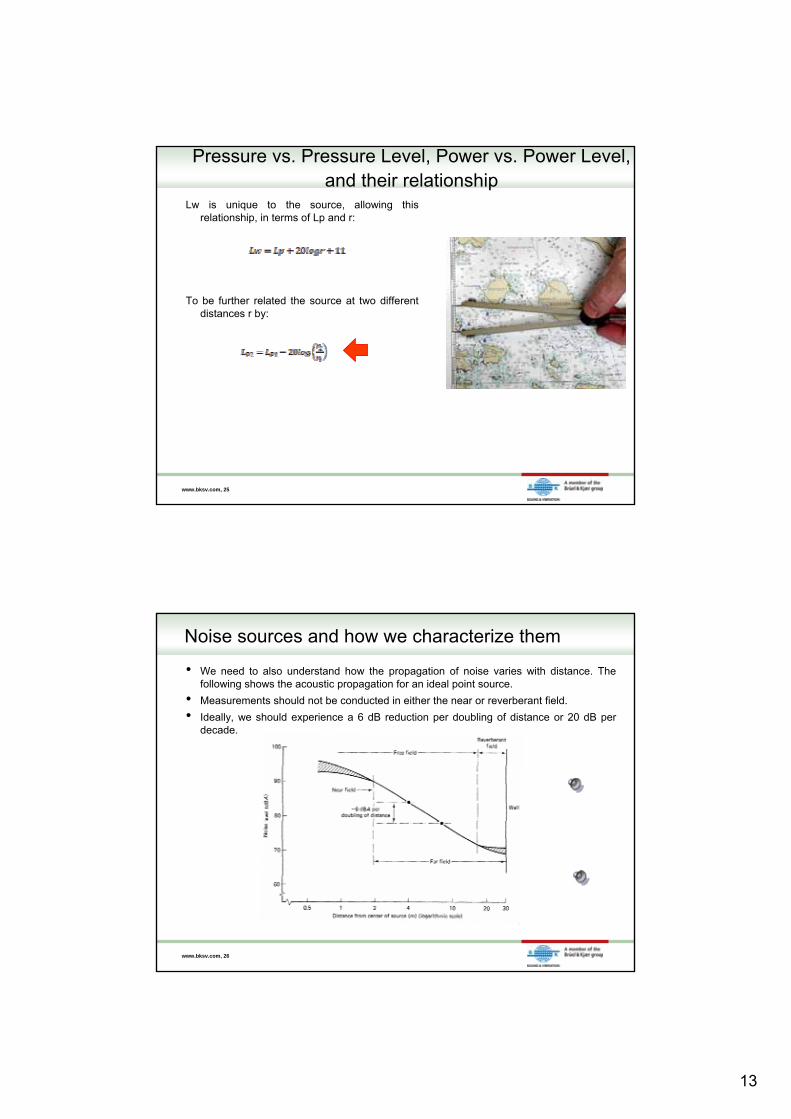
Noise sources and how we characterize them
• We need to also understand how the propagation of noise varies with distance. The following shows the acoustic propagation for an ideal point source.
• Measurements should not be conducted in either the near or reverberant field.
• Ideally, we should experience a 6 dB reduction per doubling of distance or 20 dB per decade.
14
www.bksv.com, 27
Noise sources and how we characterize them
r: Lp
2r: Lp 6 dB
r: Lp
2r: Lp 3 dB
r: Lp 2r: Lp
Plane source
Point source
Line source
www.bksv.com, 28
Adding and averaging noise sources
Aside
For
we can arrange to get:
15
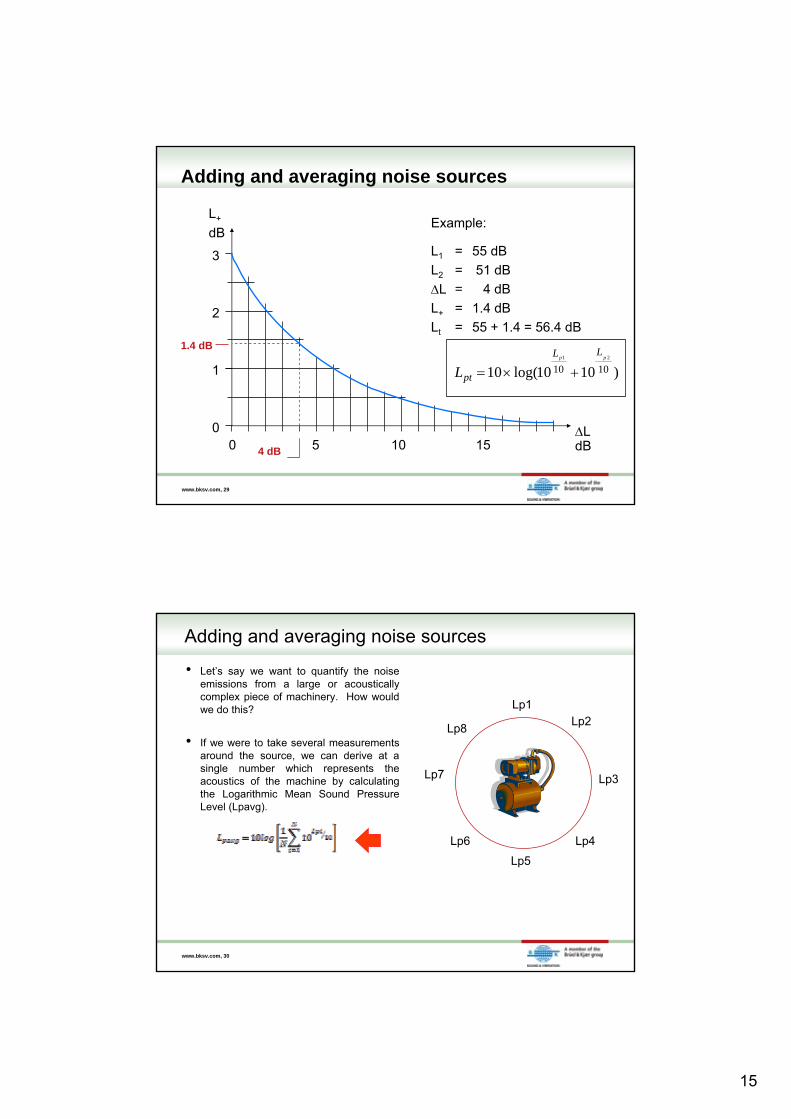
www.bksv.com, 29
Adding and averaging noise sources
Example:L+
dB
3
2
1
00 5 10 15
LdB
L1
L2
L
L+
Lt
55 dB
51 dB
4 dB
1.4 dB
55 + 1.4 = 56.4 dB
=
=
=
=
=
4 dB
1.4 dB
)1010log(10 101021 pp
LL
ptL
www.bksv.com, 30
Adding and averaging noise sources
• Let’s say we want to quantify the noise emissions from a large or acoustically complex piece of machinery. How would we do this?
• If we were to take several measurements around the source, we can derive at a single number which represents the acoustics of the machine by calculating the Logarithmic Mean Sound Pressure Level (Lpavg).
Lp8
Lp7
Lp6
Lp5
Lp4
Lp3
Lp2Lp1
16
www.bksv.com, 31
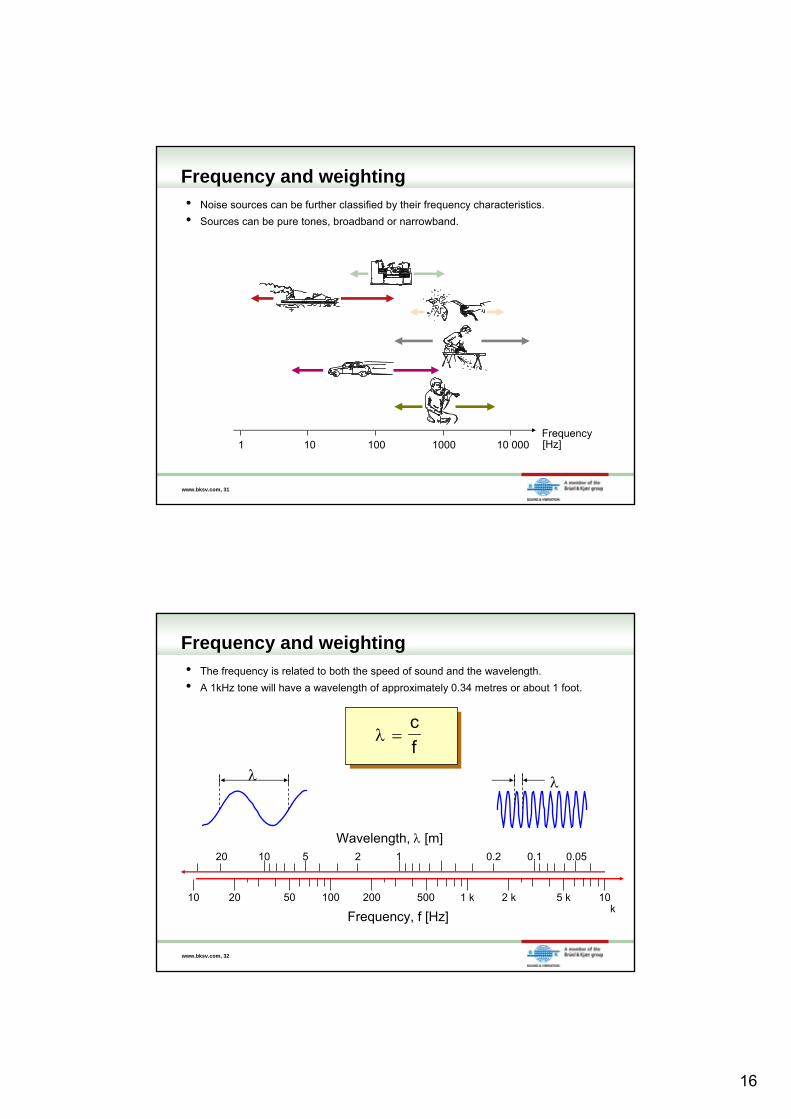
[Hz]1 10 100 1000 10 000Frequency
Frequency and weighting• Noise sources can be further classified by their frequency characteristics.
• Sources can be pure tones, broadband or narrowband.
www.bksv.com, 32
c
f
20 10 5 2 1 0.2 0.1 0.05
10 20 50 100 200 500 1 k 2 k 5 k 10 k
Frequency, f [Hz]
Wavelength, [m]
Frequency and weighting• The frequency is related to both the speed of sound and the wavelength.
• A 1kHz tone will have a wavelength of approximately 0.34 metres or about 1 foot.
17
www.bksv.com, 33
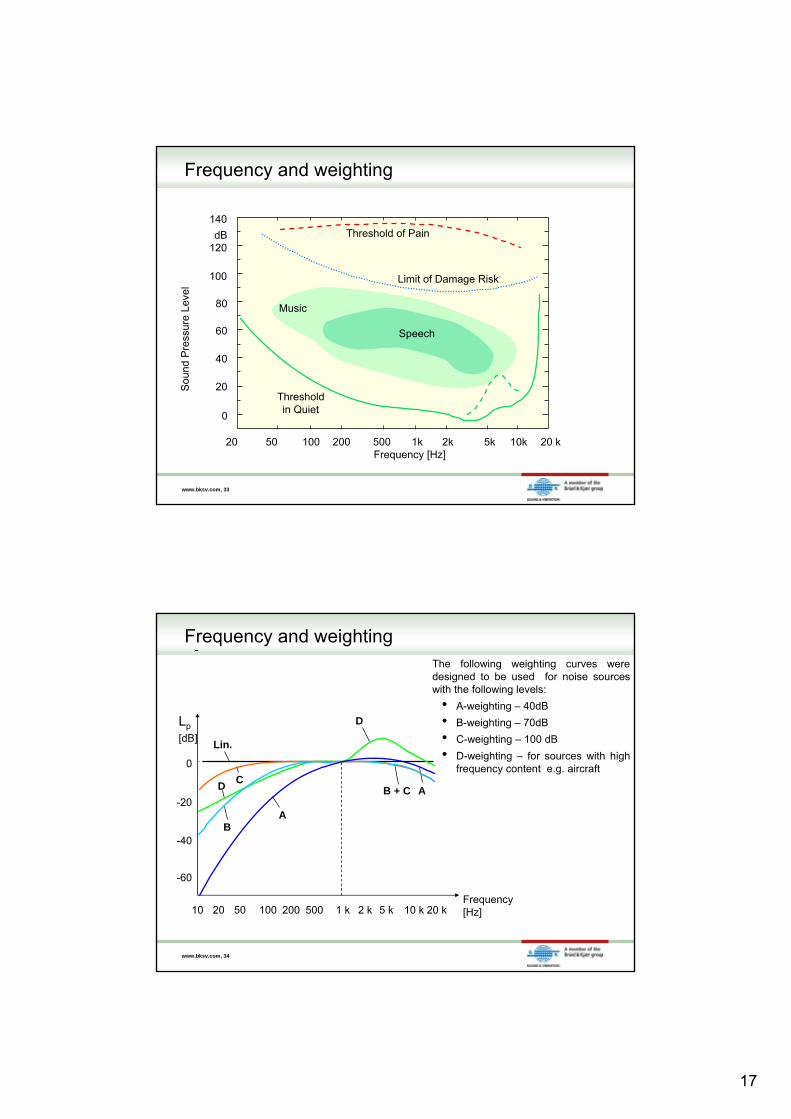
Frequency and weighting
140
dB120
100
80
60
40
20
0
20 50 100 200 500 1k 2k 5k 10k 20 kFrequency [Hz]
Sou
nd P
ress
ure
Leve
l
Thresholdin Quiet
Limit of Damage Risk
Threshold of Pain
Speech
Music
www.bksv.com, 34
Frequency and weighting
0
-20
-40
10 100 1 k 10 k
Lp
[dB]
AB
CD AB + C
D
Lin.
Frequency[Hz]
-60
20 k2 k 5 k200 50020 50
The following weighting curves were designed to be used for noise sources with the following levels:
• A-weighting – 40dB
• B-weighting – 70dB
• C-weighting – 100 dB
• D-weighting – for sources with high frequency content e.g. aircraft
18
www.bksv.com, 35
Let’s take a tour – Basic Sound Level Measurement
www.bksv.com, 36
Break

19
www.bksv.com, 37
Environmental Noise Parameters
Contents:Environmental noise metrics (Demo)
Weather considerations
Case study of industrial noise source
www.bksv.com, 38
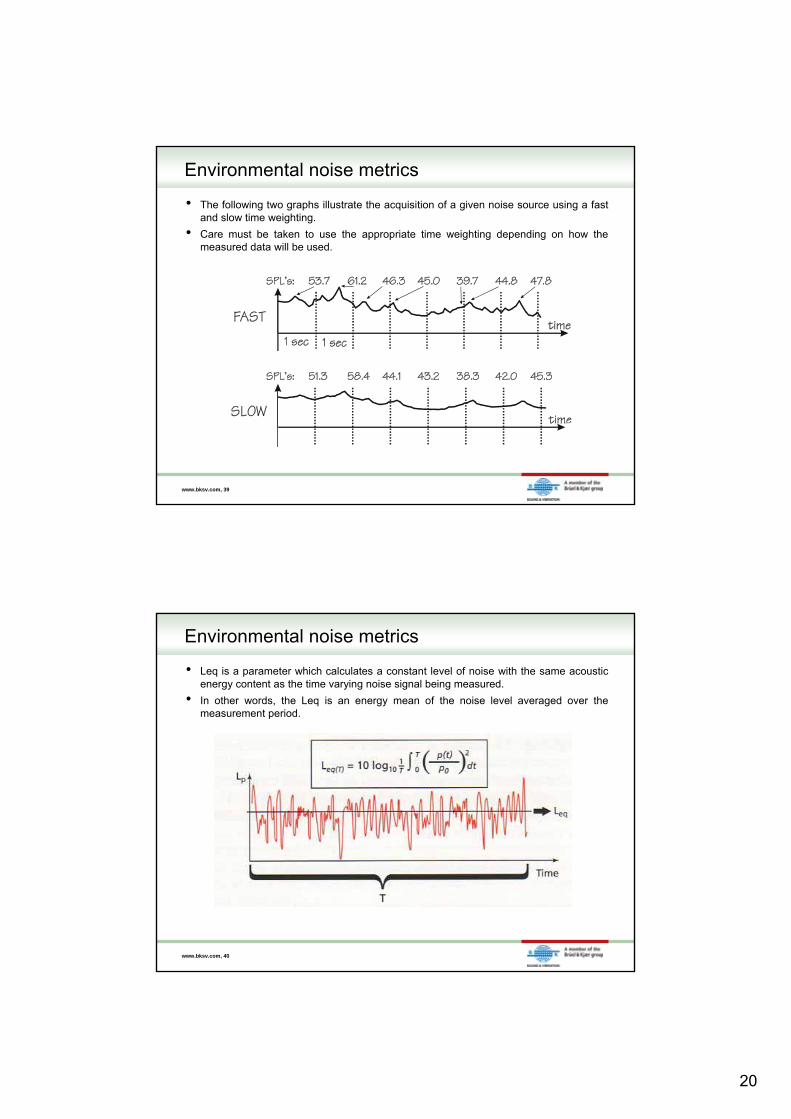
Environmental noise metrics
• Sound level meters can acquire data using various standardized response times.
• Fast, slow and impulse time weightings are used to provide important information of fluctuating noise levels.
• An environmental engineer must be aware of requirements for the use of specific time weightings. e.g. impulsive time weighting must be used for stamping press noise.
TimeSlow (1 s)
Fast (125 ms)Impulse (35 ms)
LpImpulse (1.5 )
Slow (1 s)Fast (125 ms)
20
www.bksv.com, 39
Environmental noise metrics
• The following two graphs illustrate the acquisition of a given noise source using a fast and slow time weighting.
• Care must be taken to use the appropriate time weighting depending on how the measured data will be used.
www.bksv.com, 40
Environmental noise metrics
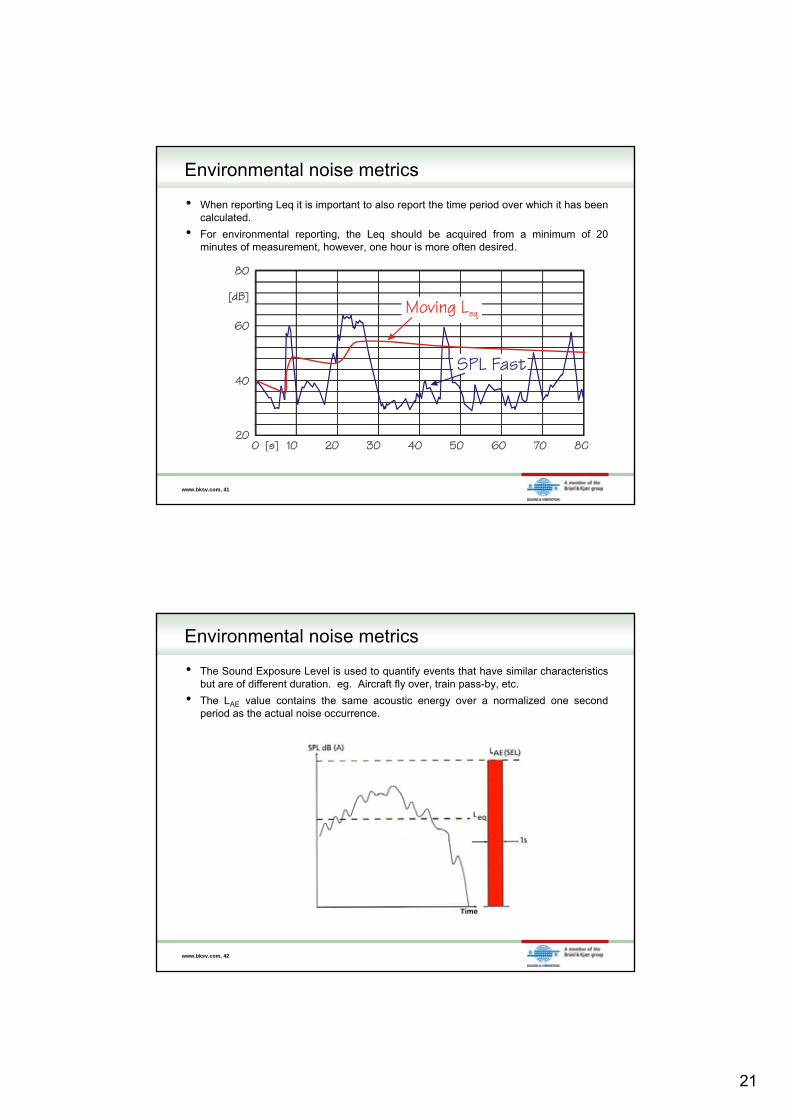
• Leq is a parameter which calculates a constant level of noise with the same acoustic energy content as the time varying noise signal being measured.
• In other words, the Leq is an energy mean of the noise level averaged over the measurement period.
21
www.bksv.com, 41
Environmental noise metrics
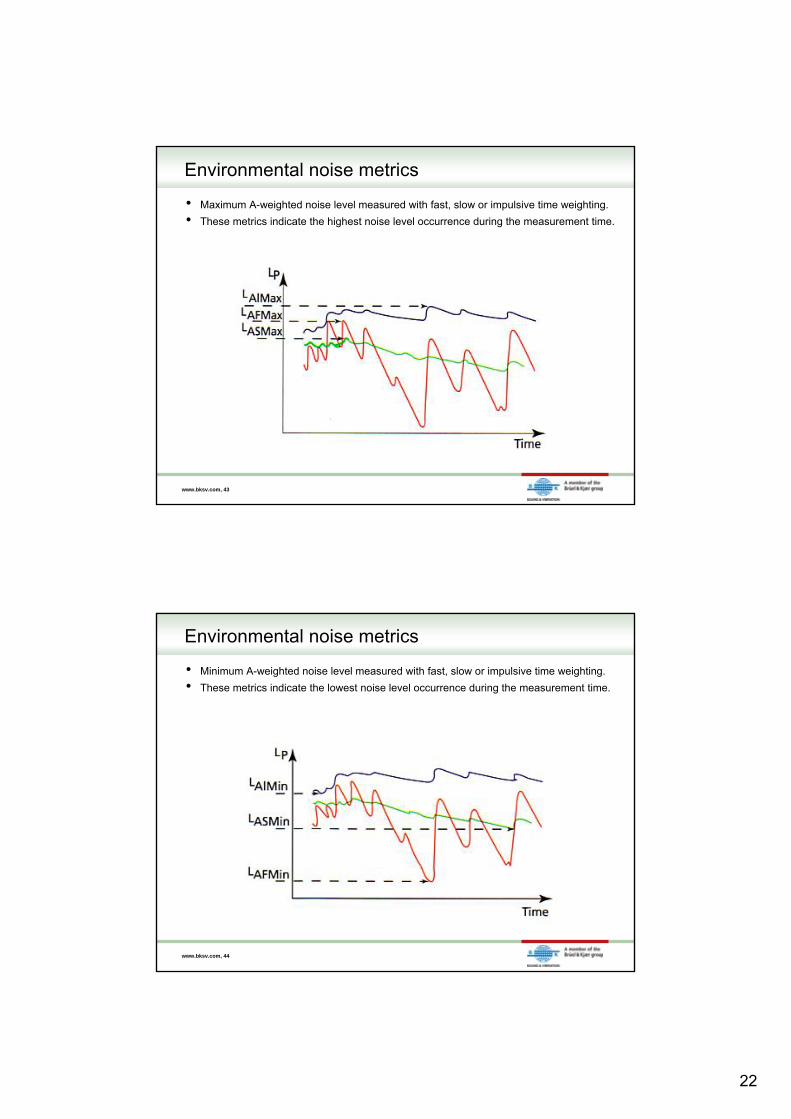
• When reporting Leq it is important to also report the time period over which it has been calculated.
• For environmental reporting, the Leq should be acquired from a minimum of 20 minutes of measurement, however, one hour is more often desired.
www.bksv.com, 42
Environmental noise metrics
• The Sound Exposure Level is used to quantify events that have similar characteristics but are of different duration. eg. Aircraft fly over, train pass-by, etc.
• The LAE value contains the same acoustic energy over a normalized one second period as the actual noise occurrence.
22
www.bksv.com, 43
Environmental noise metrics
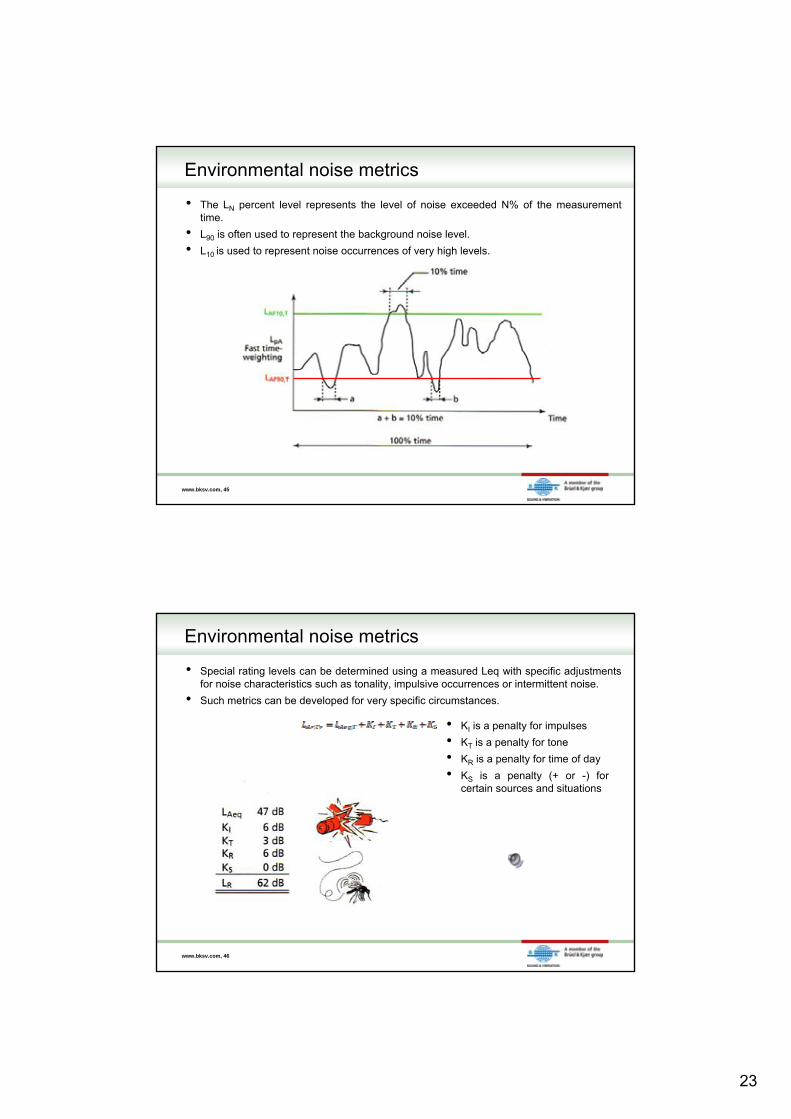
• Maximum A-weighted noise level measured with fast, slow or impulsive time weighting.
• These metrics indicate the highest noise level occurrence during the measurement time.
www.bksv.com, 44
Environmental noise metrics
• Minimum A-weighted noise level measured with fast, slow or impulsive time weighting.
• These metrics indicate the lowest noise level occurrence during the measurement time.
23
www.bksv.com, 45
Environmental noise metrics
• The LN percent level represents the level of noise exceeded N% of the measurement time.
• L90 is often used to represent the background noise level.
• L10 is used to represent noise occurrences of very high levels.
www.bksv.com, 46
Environmental noise metrics
• Special rating levels can be determined using a measured Leq with specific adjustments for noise characteristics such as tonality, impulsive occurrences or intermittent noise.
• Such metrics can be developed for very specific circumstances.
• KI is a penalty for impulses
• KT is a penalty for tone
• KR is a penalty for time of day
• KS is a penalty (+ or -) for certain sources and situations
24
www.bksv.com, 47
Environmental noise metrics
• For environmental noise evaluation for residential planning and development, some agencies require the reporting of LDN or CNEL instead of Leq.
• Day-Night average sound level (LDN) is a 24 hour Leq with a 10 dB penalty applied between 22:00 hours and 07:00 hours to account for increased nighttime annoyance.
• Community Noise Equivalent Level (CNEL) applies a penalty (5 dB) for evening time (19:00 to 22:00) as well as the 10 dB night time penalty.
www.bksv.com, 48
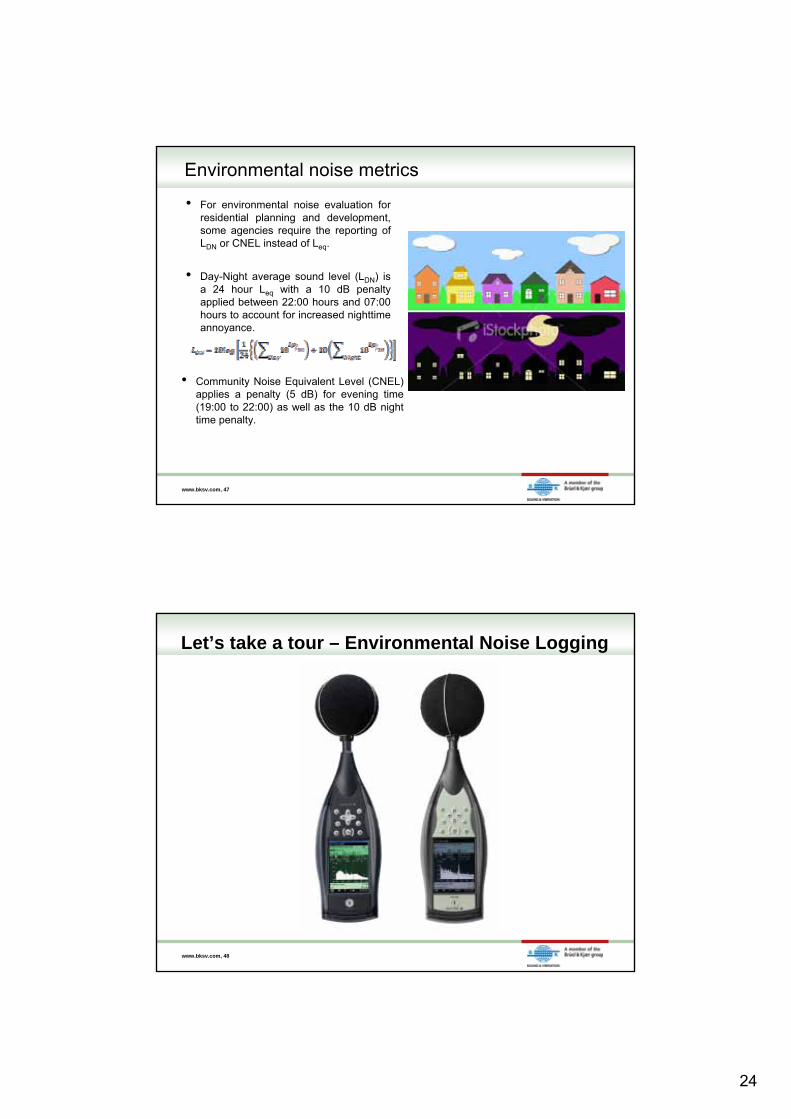
Let’s take a tour – Environmental Noise Logging
25
www.bksv.com, 49
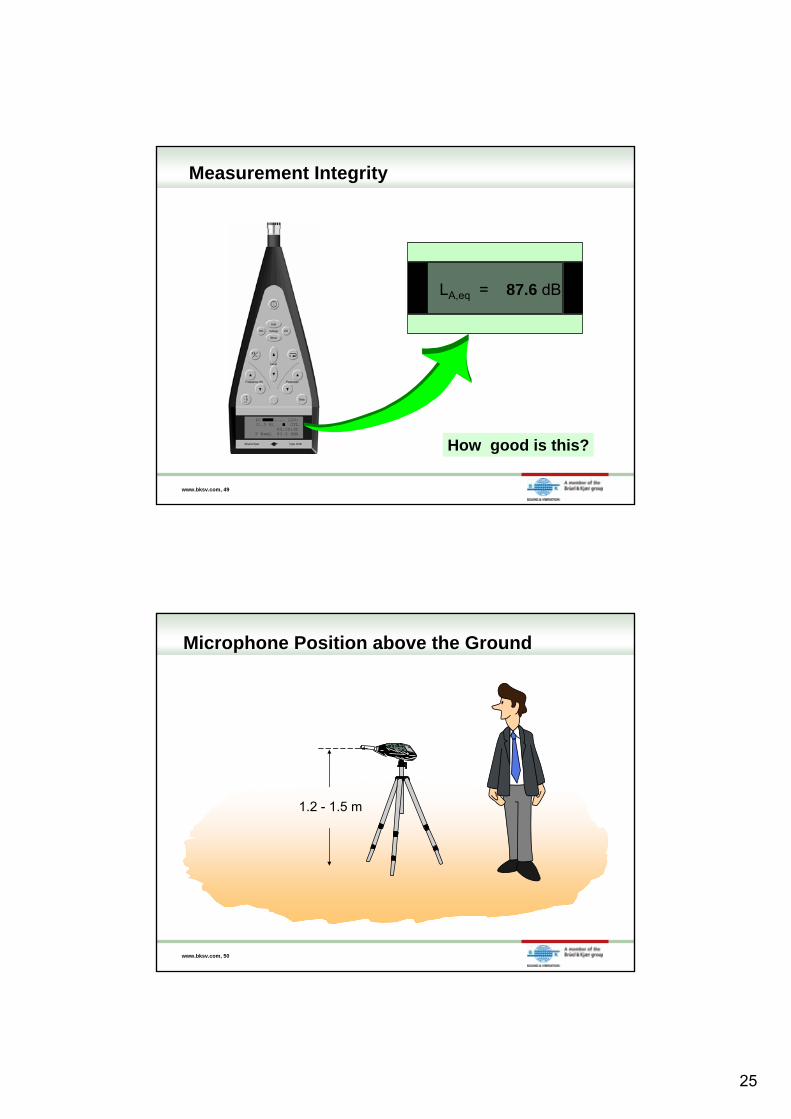
Measurement Integrity
LA,eq = 87.6 dB
How good is this?
www.bksv.com, 50
1.2 - 1.5 m
Microphone Position above the Ground
26
www.bksv.com, 51
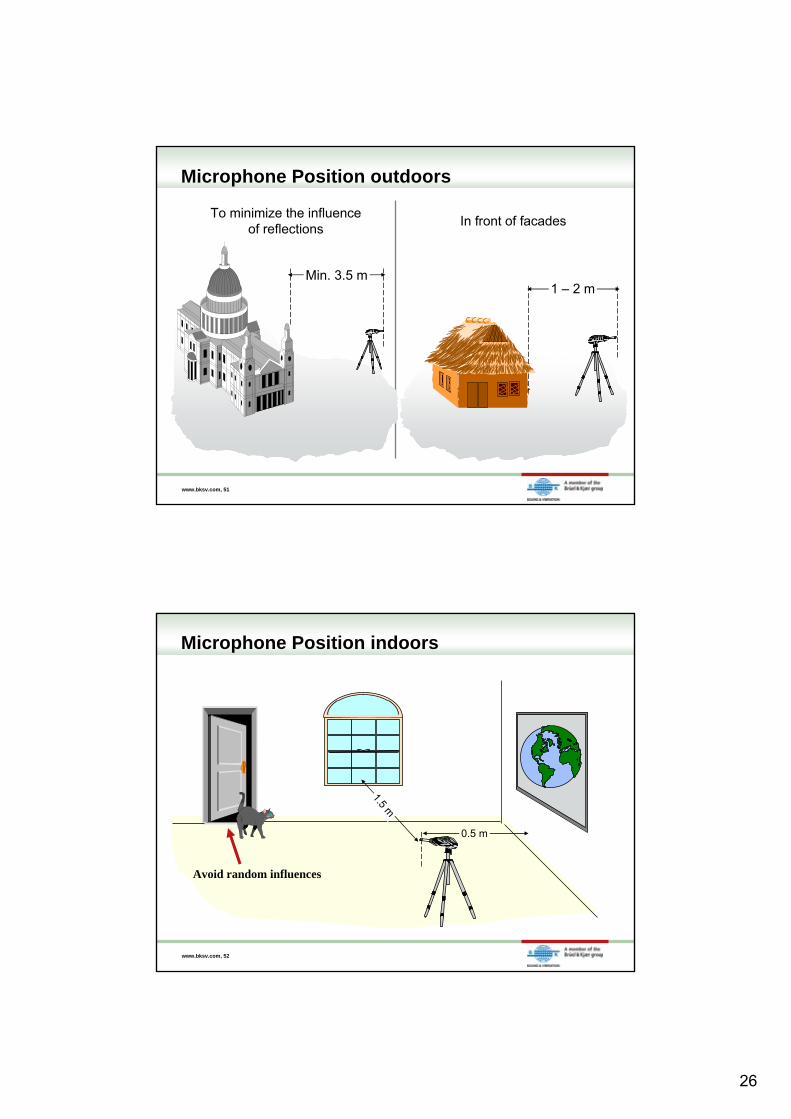
Microphone Position outdoors
Min. 3.5 m1 – 2 m
- -
To minimize the influence of reflections
In front of facades
www.bksv.com, 52
Microphone Position indoors
0.5 m
1.5 m
Avoid random influences
27
www.bksv.com, 53
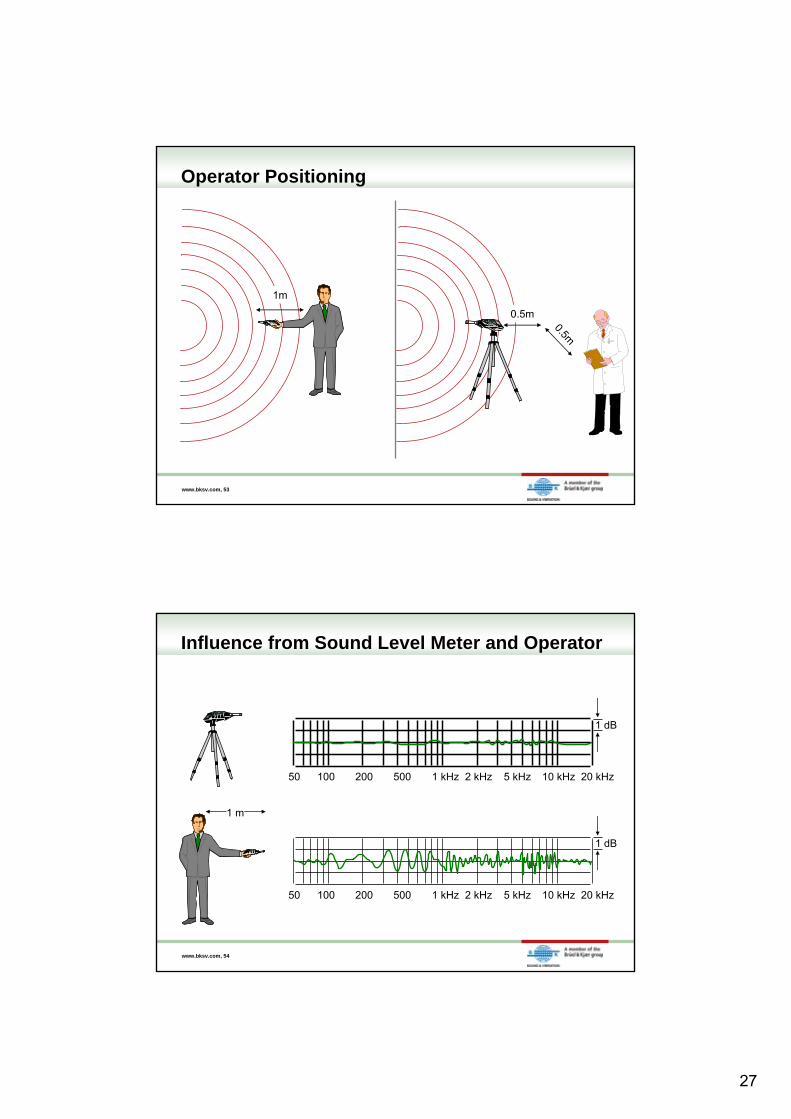
Operator Positioning
0.5m
0.5m
1m
www.bksv.com, 54
Influence from Sound Level Meter and Operator
1 dB
100 1 kHz 10 kHz
100 1 kHz 10 kHz200 500 2 kHz 5 kHz 20 kHz50
200 500 2 kHz 5 kHz 20 kHz50
1 dB
1 m
28
www.bksv.com, 55
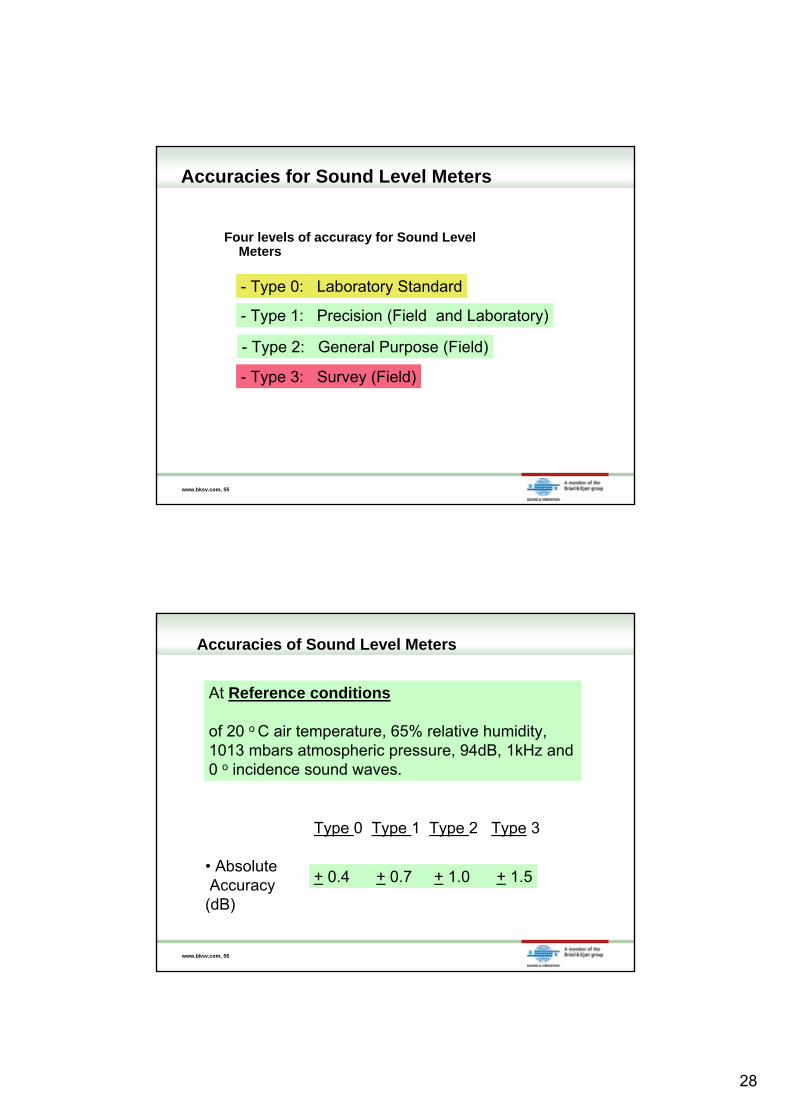
Accuracies for Sound Level Meters
Four levels of accuracy for Sound Level Meters
- Type 0: Laboratory Standard
- Type 1: Precision (Field and Laboratory)
- Type 2: General Purpose (Field)
- Type 3: Survey (Field)
www.bksv.com, 56
Accuracies of Sound Level Meters
At Reference conditions
of 20 o C air temperature, 65% relative humidity, 1013 mbars atmospheric pressure, 94dB, 1kHz and 0 o incidence sound waves.
• AbsoluteAccuracy
(dB)
Type 0 Type 1 Type 2 Type 3
+ 0.4 + 0.7 + 1.0 + 1.5

29
www.bksv.com, 57
• Practical Accuracies ( Non reference conditions)
- calculated from allowed tolerances for warm-up, directionaleffects, frequency weightings, range control, time weighting,ambient pressure, humidity, temperature, calibrator.
Type 0 Type 1 Type 2 Type 3 • Practical
Accuracies (dB) + 1.5 + 2 + 3 + 5
Accuracies of Sound Level Meters
www.bksv.com, 58
Extract from IEC 651
5.1. The total spread of the change in sensitivity of the equipment within an angle of + or - 30 degrees from the reference direction shall not exceed the values given in Table II.
These values are for normal use with the observer not disturbing the sound field.
Table II
Frequency (Hz) Type 0 Type1 Type2 Type3
31.5 - 1000 0.5 1 2 41000 - 2000 0.5 1 2 42000 - 4000 1 1.5 4 84000 - 8000 2 2.5 9 12
Accuracies of Sound Level Meters
30
www.bksv.com, 59
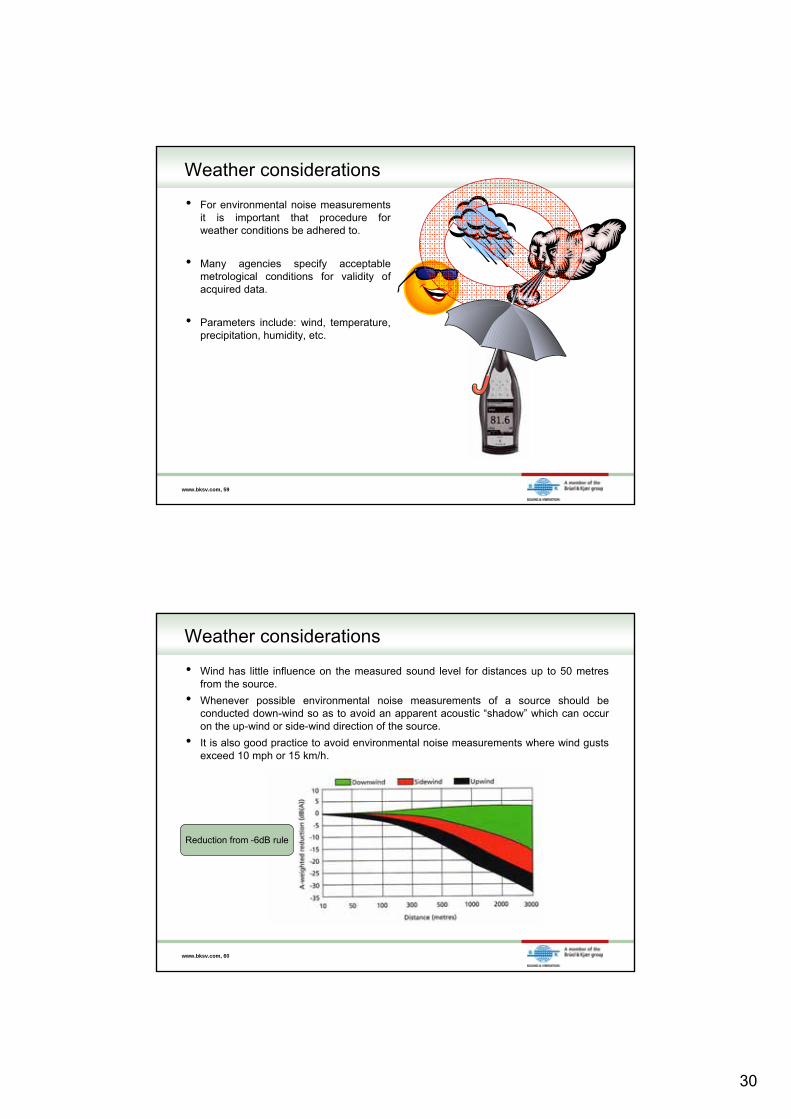
Weather considerations
• For environmental noise measurements it is important that procedure for weather conditions be adhered to.
• Many agencies specify acceptable metrological conditions for validity of acquired data.
• Parameters include: wind, temperature, precipitation, humidity, etc.
www.bksv.com, 60
Weather considerations
• Wind has little influence on the measured sound level for distances up to 50 metresfrom the source.
• Whenever possible environmental noise measurements of a source should be conducted down-wind so as to avoid an apparent acoustic “shadow” which can occur on the up-wind or side-wind direction of the source.
• It is also good practice to avoid environmental noise measurements where wind gusts exceed 10 mph or 15 km/h.
Reduction from -6dB rule
31
www.bksv.com, 61
Weather considerations
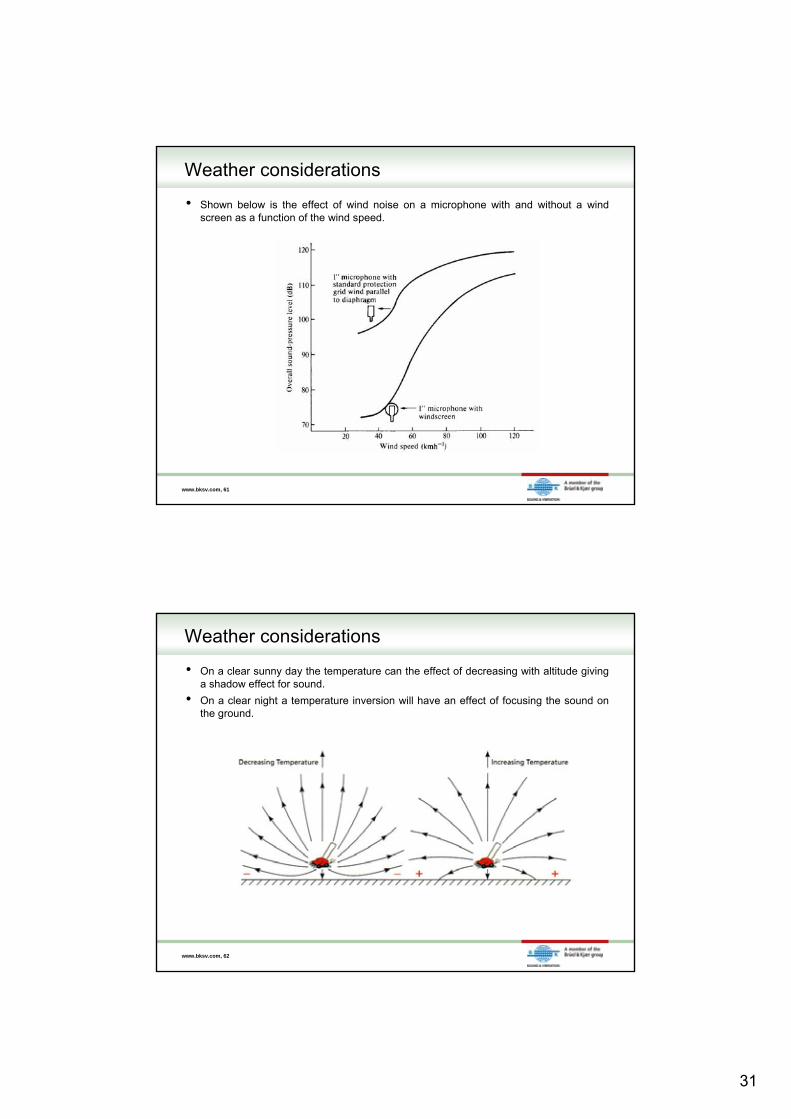
• Shown below is the effect of wind noise on a microphone with and without a wind screen as a function of the wind speed.
www.bksv.com, 62
Weather considerations
• On a clear sunny day the temperature can the effect of decreasing with altitude giving a shadow effect for sound.
• On a clear night a temperature inversion will have an effect of focusing the sound on the ground.
32
www.bksv.com, 63
Weather considerations
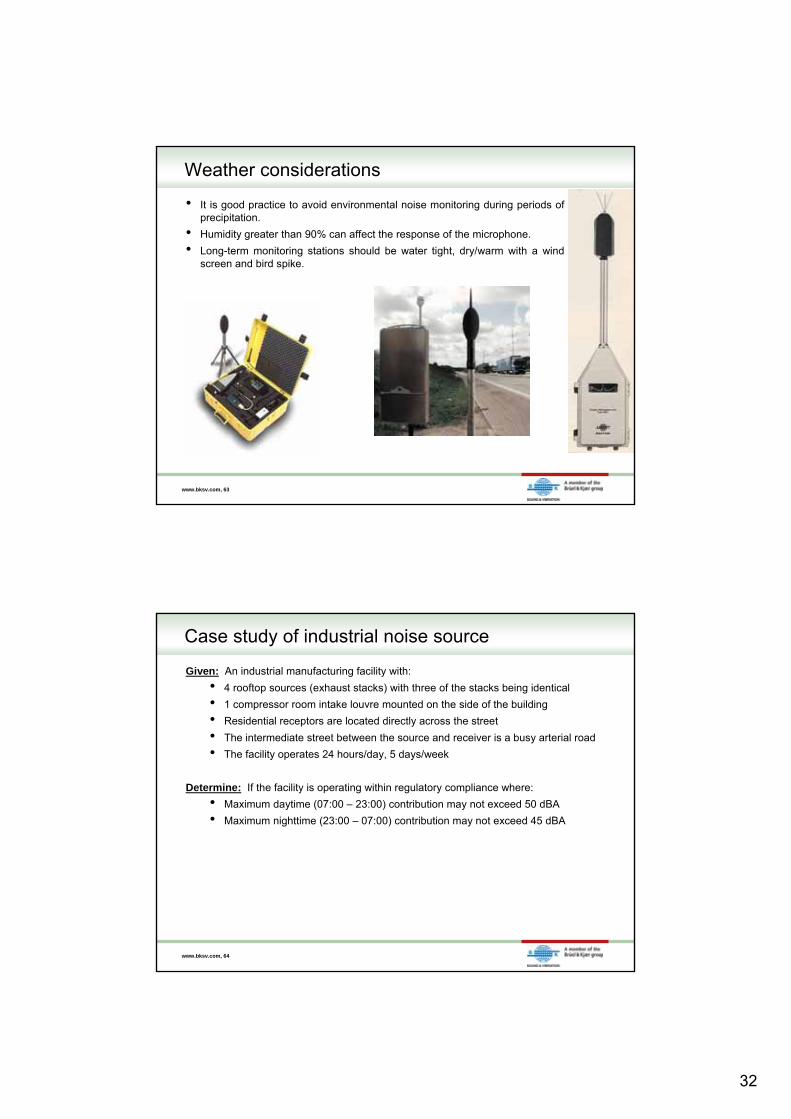
• It is good practice to avoid environmental noise monitoring during periods of precipitation.
• Humidity greater than 90% can affect the response of the microphone.
• Long-term monitoring stations should be water tight, dry/warm with a wind screen and bird spike.
www.bksv.com, 64
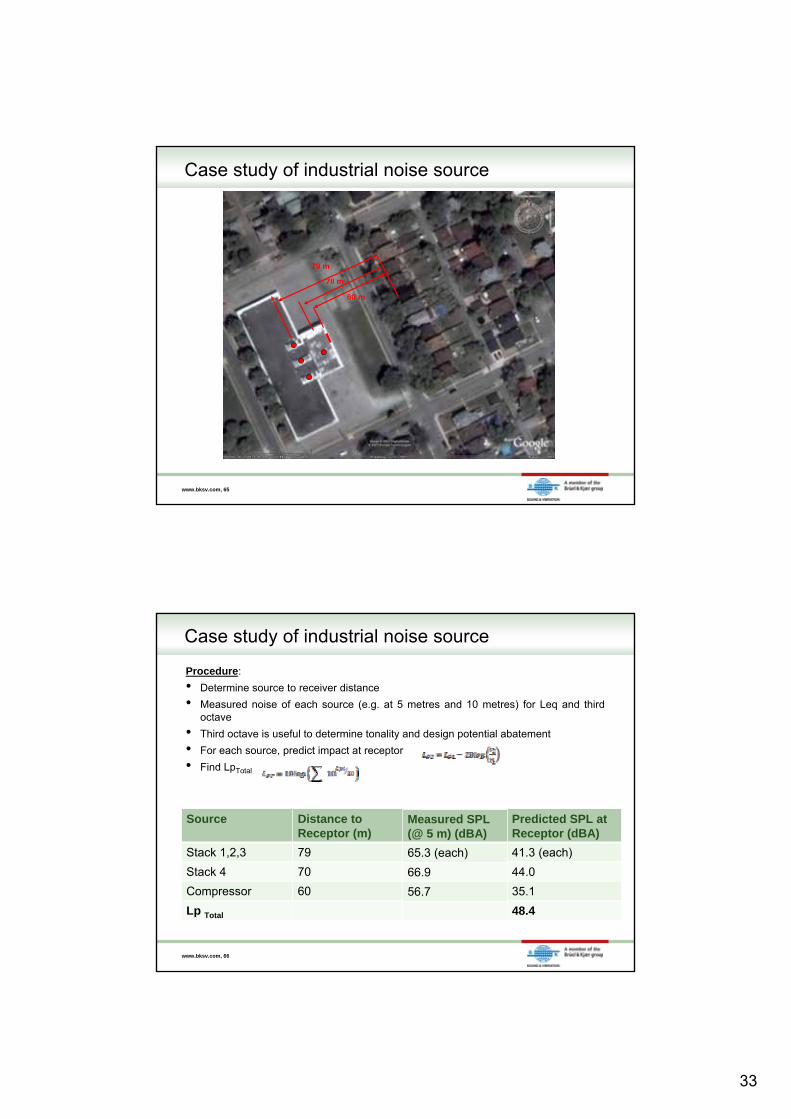
Case study of industrial noise source
Given: An industrial manufacturing facility with:
• 4 rooftop sources (exhaust stacks) with three of the stacks being identical
• 1 compressor room intake louvre mounted on the side of the building
• Residential receptors are located directly across the street
• The intermediate street between the source and receiver is a busy arterial road
• The facility operates 24 hours/day, 5 days/week
Determine: If the facility is operating within regulatory compliance where:
• Maximum daytime (07:00 – 23:00) contribution may not exceed 50 dBA
• Maximum nighttime (23:00 – 07:00) contribution may not exceed 45 dBA
33
www.bksv.com, 65
Case study of industrial noise source
79 m
70 m
60 m
www.bksv.com, 66
Case study of industrial noise source
Procedure:
• Determine source to receiver distance
• Measured noise of each source (e.g. at 5 metres and 10 metres) for Leq and third octave
• Third octave is useful to determine tonality and design potential abatement
• For each source, predict impact at receptor
• Find LpTotal
Source Distance to Receptor (m)
Stack 1,2,3 79
Stack 4 70
Compressor 60
Lp Total
Measured SPL (@ 5 m) (dBA)
65.3 (each)
66.9
56.7
Predicted SPL at Receptor (dBA)
41.3 (each)
44.0
35.1
48.4
34
www.bksv.com, 67
Case study of industrial noise source
www.bksv.com, 68
Case study of industrial noise source
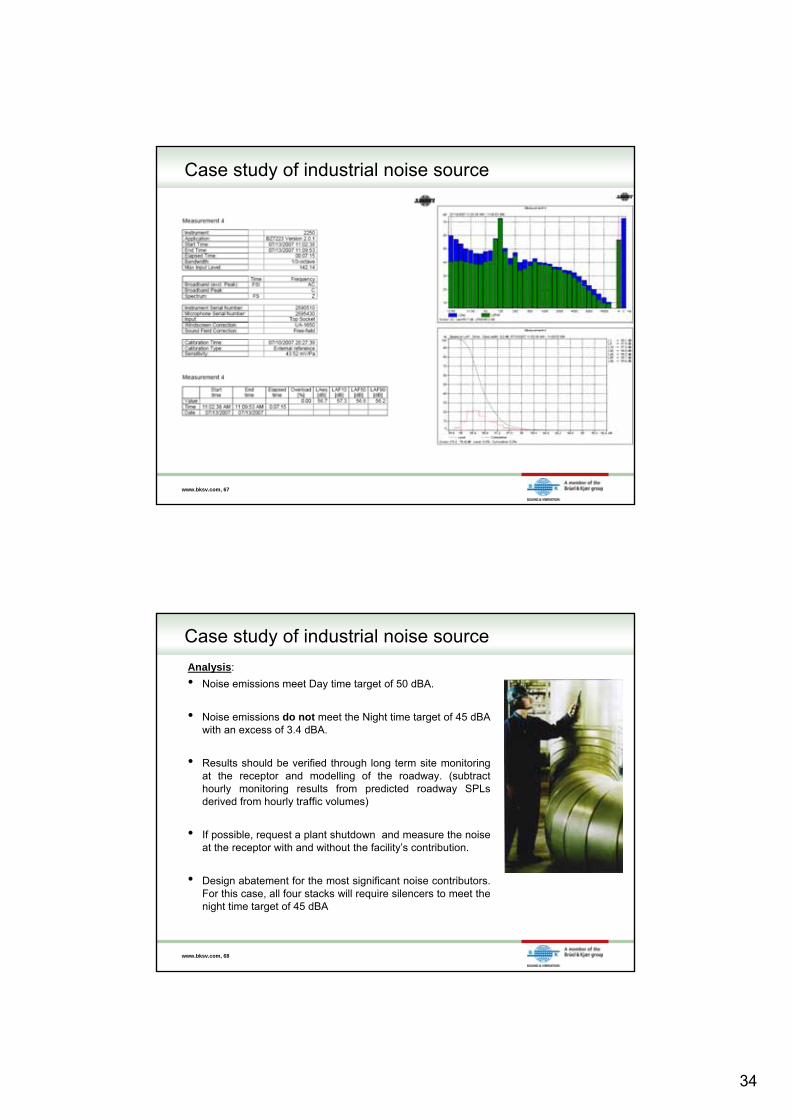
Analysis:
• Noise emissions meet Day time target of 50 dBA.
• Noise emissions do not meet the Night time target of 45 dBAwith an excess of 3.4 dBA.
• Results should be verified through long term site monitoring at the receptor and modelling of the roadway. (subtract hourly monitoring results from predicted roadway SPLsderived from hourly traffic volumes)
• If possible, request a plant shutdown and measure the noise at the receptor with and without the facility’s contribution.
• Design abatement for the most significant noise contributors. For this case, all four stacks will require silencers to meet the night time target of 45 dBA

35
www.bksv.com, 69
Lunch Break