environmental optical sensors for auvs and other compact ...stf.ucsd.edu/presentations/2008/2008-01...
TRANSCRIPT

Environmental Optical Sensors for AUVs and
Other Compact Platforms
Michael TwardowskiWET Labs, Inc., Narragansett, RI
www.wetlabs.com
Collaborators
Casey Moore, Ron Zaneveld, Andrew Barnard, and Scott FreemanWET Labs, Inc.; Philomath, OR and Narragansett, RI
Oscar SchofieldRutgers University; New Brunwick, NJ
Jim SullivanUniversity of Rhode Island; Narragansett, RI

Nepheloidlayer
Phytoplankton,CDOM, detritus, sediment
Science driver: Distribution and dynamics of biogeochemical properties in the ocean over unprecedented space and time scales
Optical Sensors on Compact Platforms: Science Applications
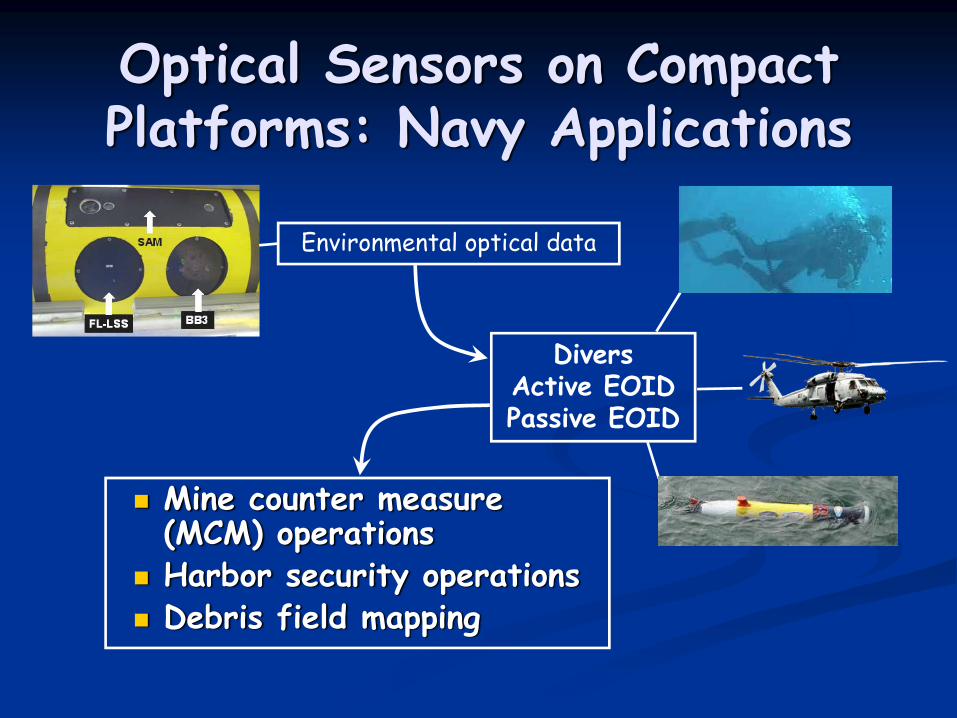
Optical Sensors on Compact Platforms: Navy Applications
Mine counter measure (MCM) operations Harbor security operationsDebris field mapping
Environmental optical data
DiversActive EOIDPassive EOID

Towed detection system
MIREM April 2005
Applied Problem: What can the towed system see in the optically complex coastal ocean?
Navy MIREM Training Exercise

“Environmental Optical Data”
c = a + b
LIGH
TIN
TEN
SITY
DISTANCE THROUGH WATER
attenuation (c) – the rate of light loss through water from the processes of scattering (b) and absorption (a)
exp (- c · distance)
distribution of scattered light
incident ray of light
bb
0°
90°
Volume scatteringfunction
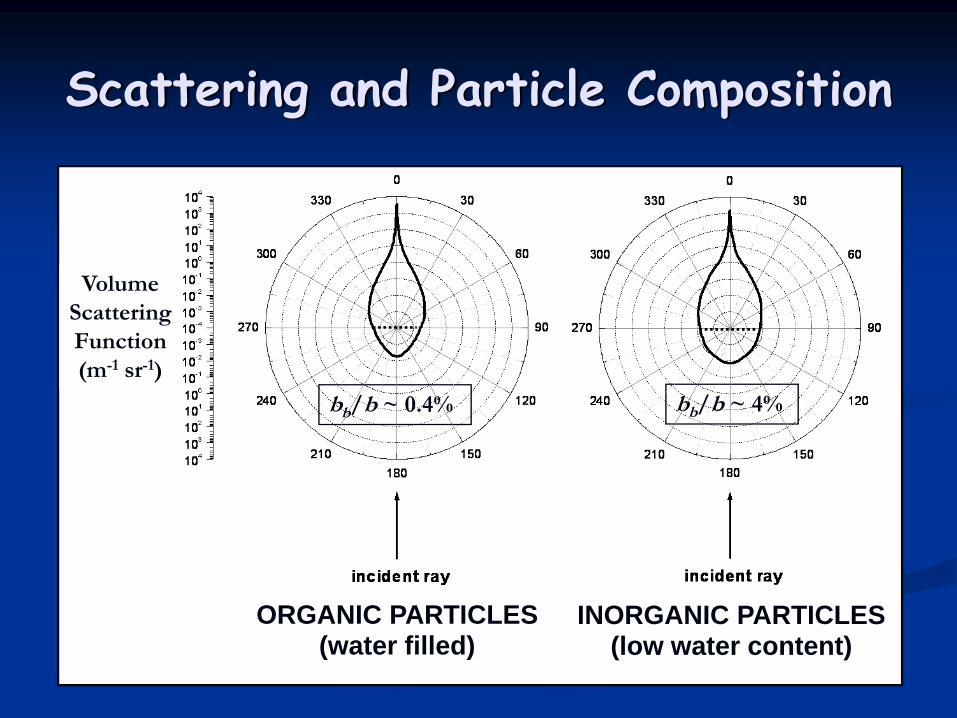
Scattering and Particle Composition
bb/b ~ 0.4% bb/b ~ 4%
ORGANIC PARTICLES(water filled)
INORGANIC PARTICLES(low water content)
VolumeScatteringFunction(m-1 sr-1)
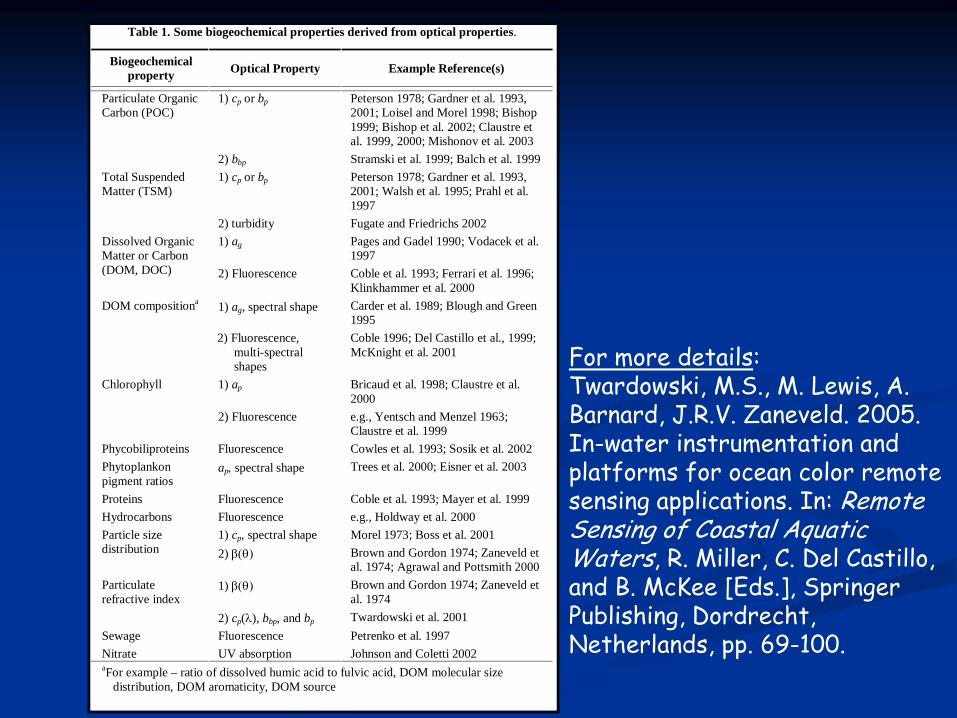
Table 1. Some biogeochemical properties derived from optical properties.
Biogeochemical property Optical Property Example Reference(s)
1) cp or bp Peterson 1978; Gardner et al. 1993, 2001; Loisel and Morel 1998; Bishop 1999; Bishop et al. 2002; Claustre et al. 1999, 2000; Mishonov et al. 2003
Particulate Organic Carbon (POC)
2) bbp Stramski et al. 1999; Balch et al. 1999 1) cp or bp Peterson 1978; Gardner et al. 1993,
2001; Walsh et al. 1995; Prahl et al. 1997
Total Suspended Matter (TSM)
2) turbidity Fugate and Friedrichs 2002 1) ag Pages and Gadel 1990; Vodacek et al.
1997 Dissolved Organic Matter or Carbon (DOM, DOC) 2) Fluorescence Coble et al. 1993; Ferrari et al. 1996;
Klinkhammer et al. 2000 1) ag, spectral shape Carder et al. 1989; Blough and Green
1995 DOM compositiona
2) Fluorescence, multi-spectral shapes
Coble 1996; Del Castillo et al., 1999; McKnight et al. 2001
1) ap Bricaud et al. 1998; Claustre et al. 2000
Chlorophyll
2) Fluorescence e.g., Yentsch and Menzel 1963; Claustre et al. 1999
Phycobiliproteins Fluorescence Cowles et al. 1993; Sosik et al. 2002 Phytoplankon pigment ratios
ap, spectral shape Trees et al. 2000; Eisner et al. 2003
Proteins Fluorescence Coble et al. 1993; Mayer et al. 1999 Hydrocarbons Fluorescence e.g., Holdway et al. 2000
1) cp, spectral shape Morel 1973; Boss et al. 2001 Particle size distribution 2) β(θ) Brown and Gordon 1974; Zaneveld et
al. 1974; Agrawal and Pottsmith 2000 1) β(θ) Brown and Gordon 1974; Zaneveld et
al. 1974 Particulate refractive index
2) cp(λ), bbp, and bp Twardowski et al. 2001 Sewage Fluorescence Petrenko et al. 1997 Nitrate UV absorption Johnson and Coletti 2002 aFor example – ratio of dissolved humic acid to fulvic acid, DOM molecular size
distribution, DOM aromaticity, DOM source
For more details:Twardowski, M.S., M. Lewis, A. Barnard, J.R.V. Zaneveld. 2005. In-water instrumentation and platforms for ocean color remote sensing applications. In: Remote Sensing of Coastal Aquatic Waters, R. Miller, C. Del Castillo, and B. McKee [Eds.], Springer Publishing, Dordrecht, Netherlands, pp. 69-100.

Visibility and Attenuation
Zaneveld and Pegau (2003)
proportionality (~4.8) determined by contrast threshold of human eye
accuracy better than 10%
backscattering is NOT a good visibility proxy
c1)m(visibility ∝
experimentaldata

COTS beam attenuation meter
WET Labs c-star
50 cm

(c, a, and b)
(c)
Problems: size, hydrodynamics, power, maintenance…

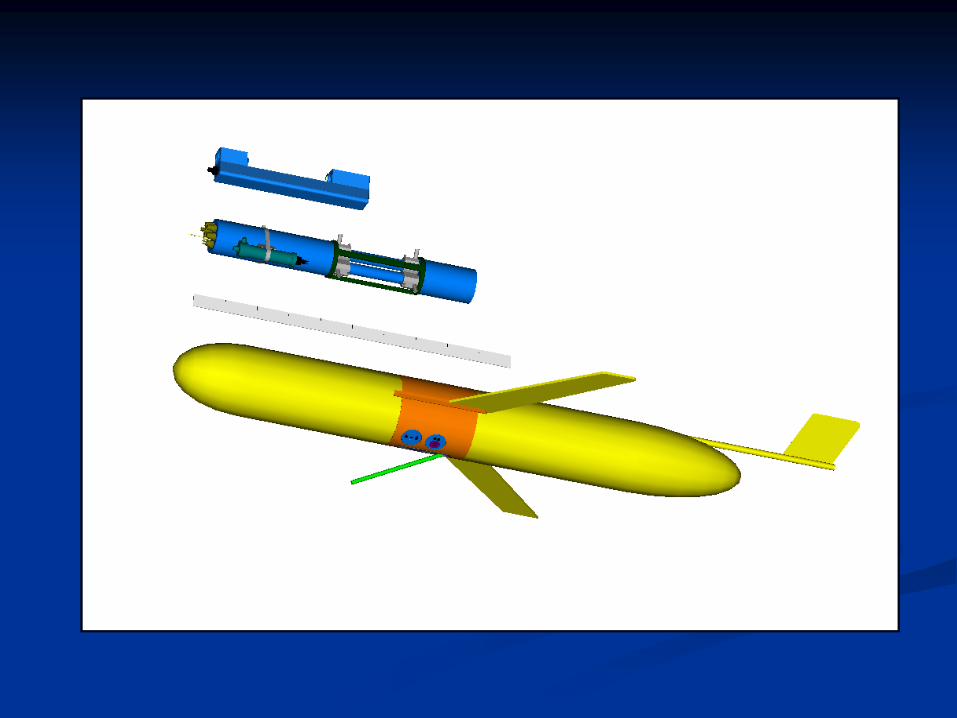

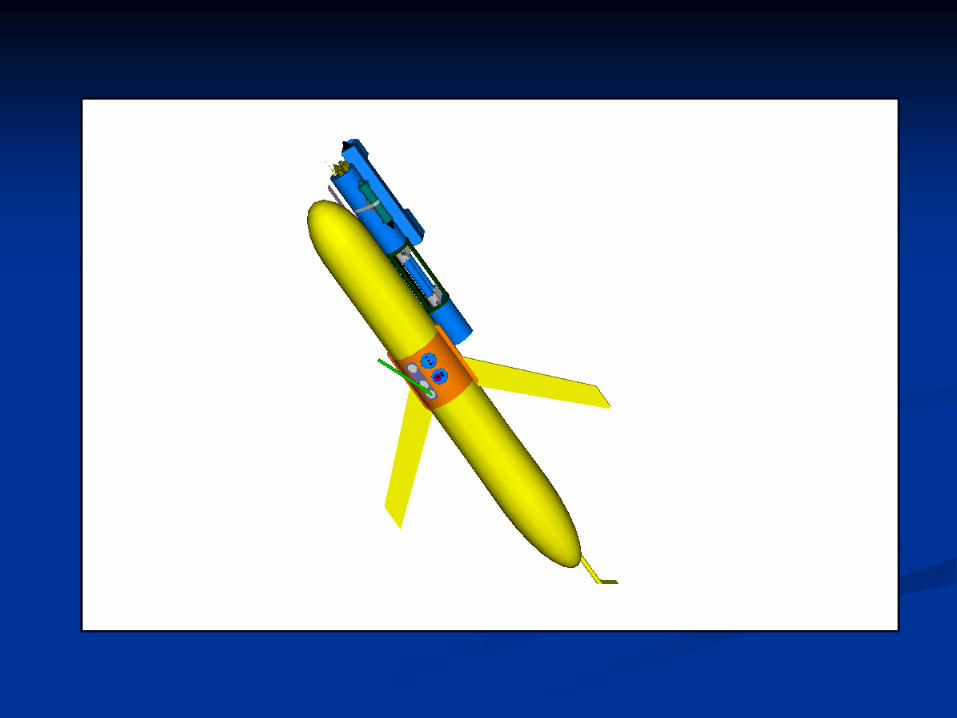
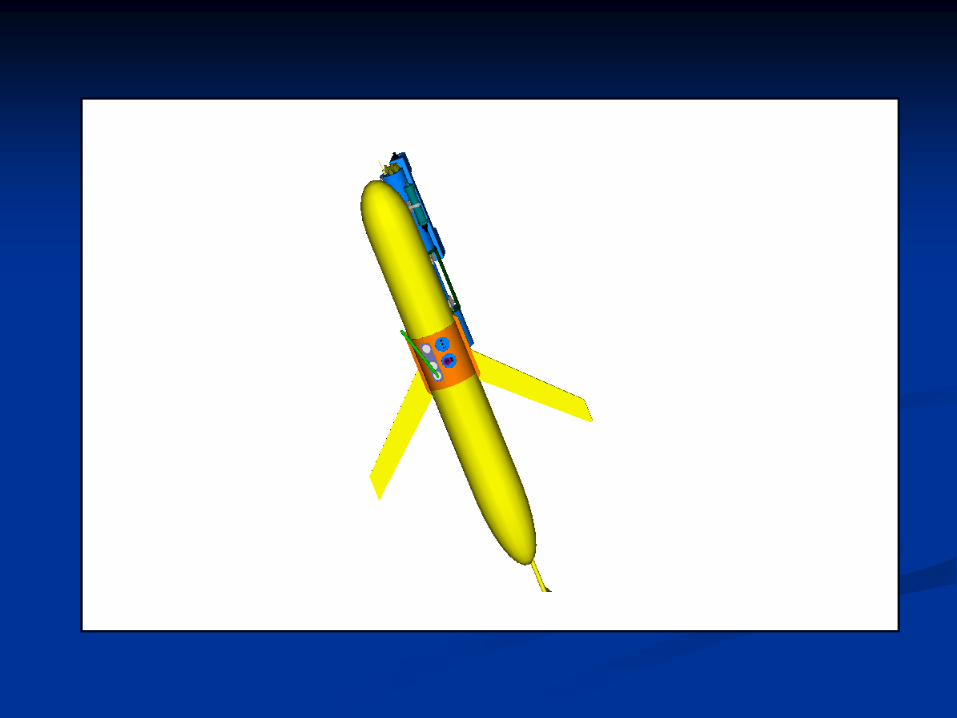
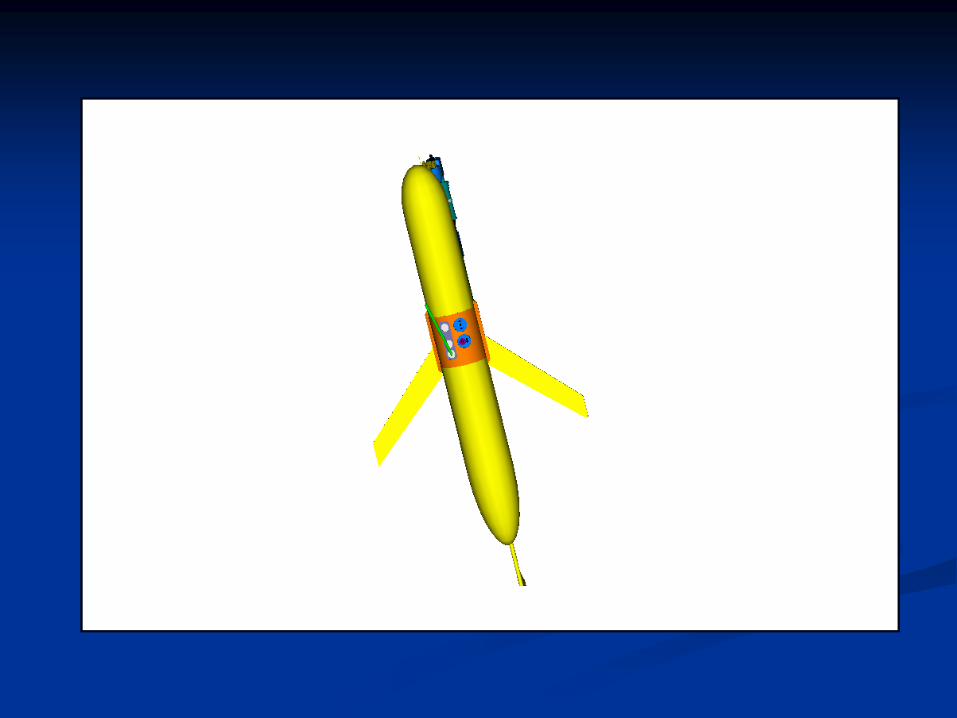


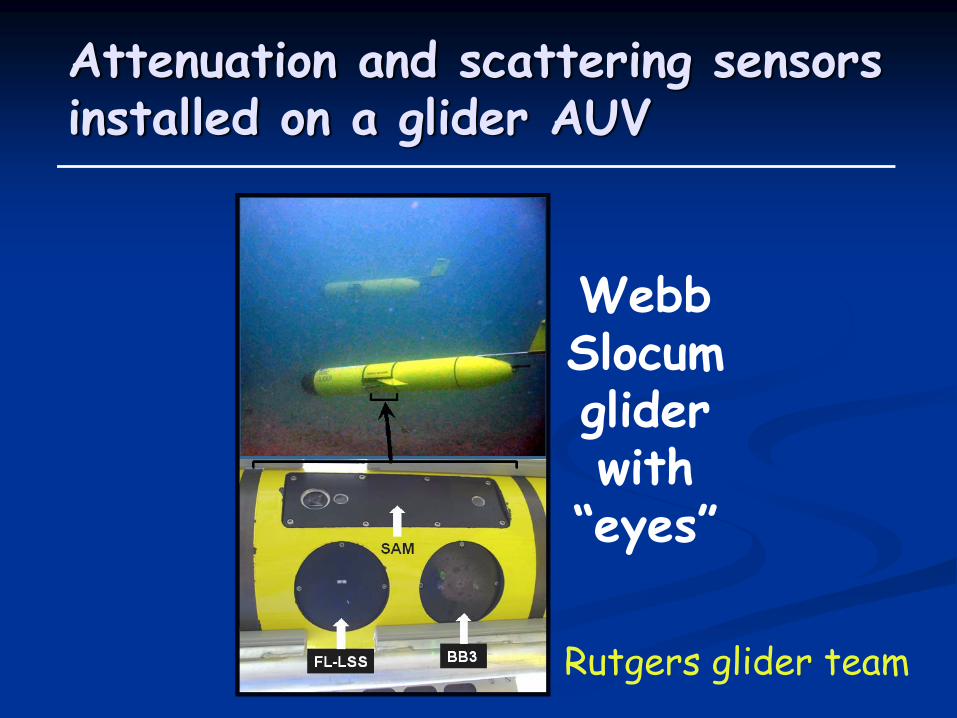
Attenuation and scattering sensors installed on a glider AUV
Webb Slocum glider with
“eyes”
Rutgers glider team

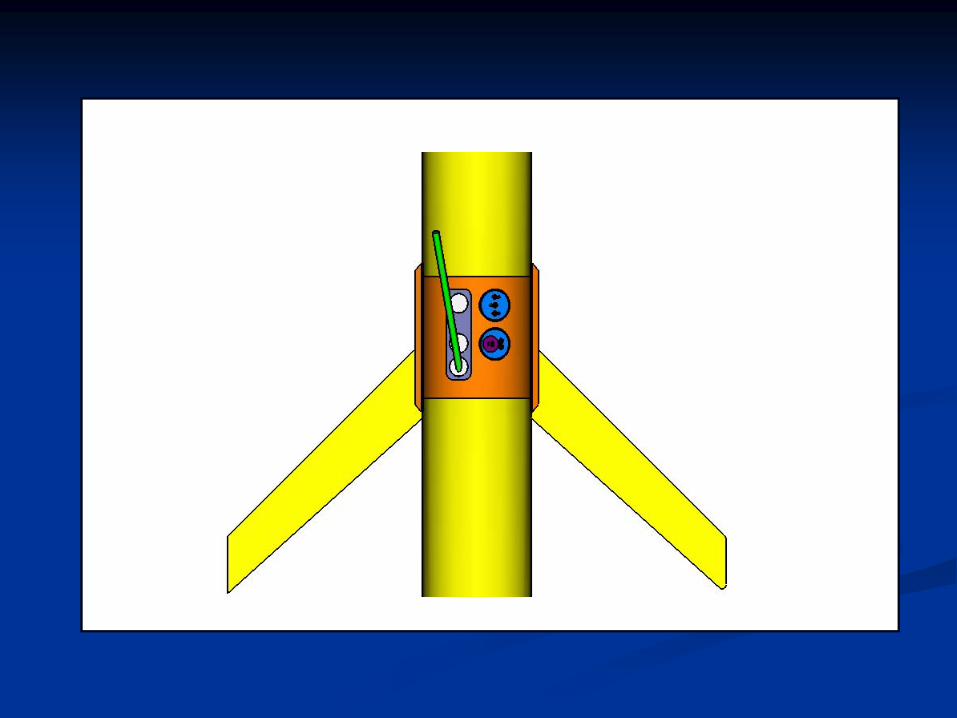
“SAM”: Attenuation Sensor

SAM: How it Works
O)l(lIIPc
D
Dc +⎥
⎦
⎤⎢⎣
⎡−⎟⎟
⎠
⎞⎜⎜⎝
⎛= −1
122
1ln
SAM = “Scattering and Attenuation Meter”
Principle: 2 measurements of scattering are made at the same angle, but over different pathlengths
l1 = r1 + r2l2 = r3 + r4
PROBLEM: To measure attenuation accurately in the ocean, long pathlengths are required.
How do you do that with a compact sensor?

Comparison with conventional attenuation measurements
Long Island Sound 2004
59,290 data points, no binning

Visibility and Attenuation in San Diego Harbor
visibility (m)
SAM c (1/m)
a b
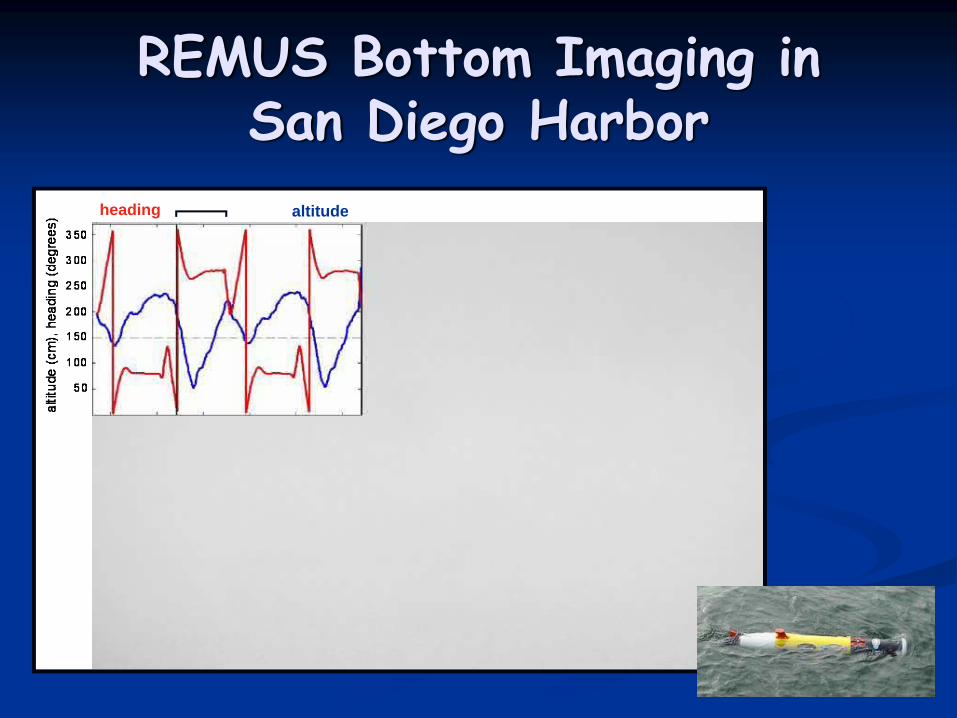
SAM profilealtitudeheading
REMUS Bottom Imaging in San Diego Harbor

MCM EOID performance predictionEODES-3 Tactical Decision Aid
Model optimized for AN/AQS-24 laser line scan systemsModel input is SAM attenuation data
METRON, Inc.www.metsci.com

Particle Composition with Gliders
http://marine.rutgers.edu/cool/
A) Salinity B) bb(650) (m-1)
C) c(650) (m-1) D) bb(650) / c(650)
Hudson River plume
%Mineral (in situ)
Algorithm based on Twardowski et al. (2001)
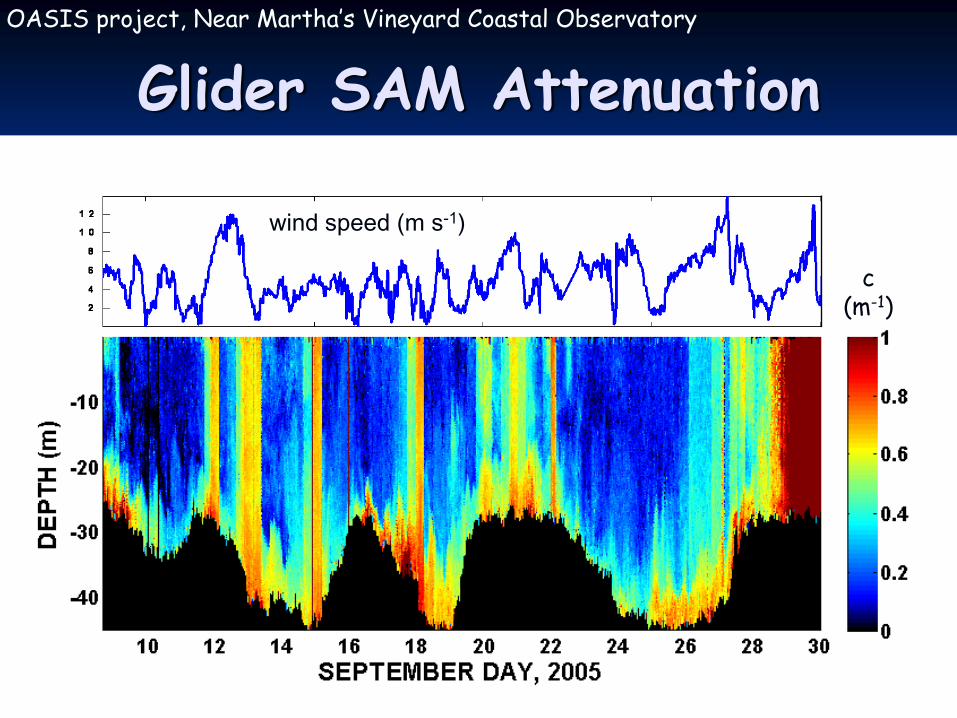
Glider SAM Attenuation
wind speed (m s-1)
c(m-1)
OASIS project, Near Martha’s Vineyard Coastal Observatory
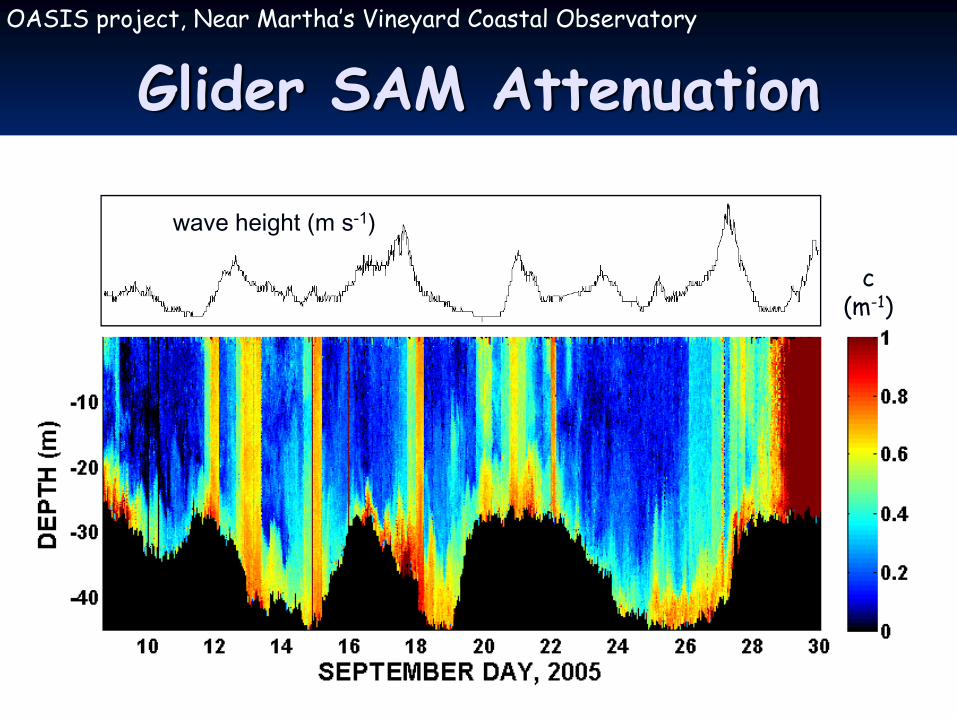
Glider SAM Attenuation
c(m-1)
wave height (m s-1)
OASIS project, Near Martha’s Vineyard Coastal Observatory

Glider SAM Attenuation
c(m-1)
latitude
longitude
OASIS project, Near Martha’s Vineyard Coastal Observatory

Glider SAM Attenuationc
(m-1)water column turbidity events occurring at night…!
OASIS project, Near Martha’s Vineyard Coastal Observatory
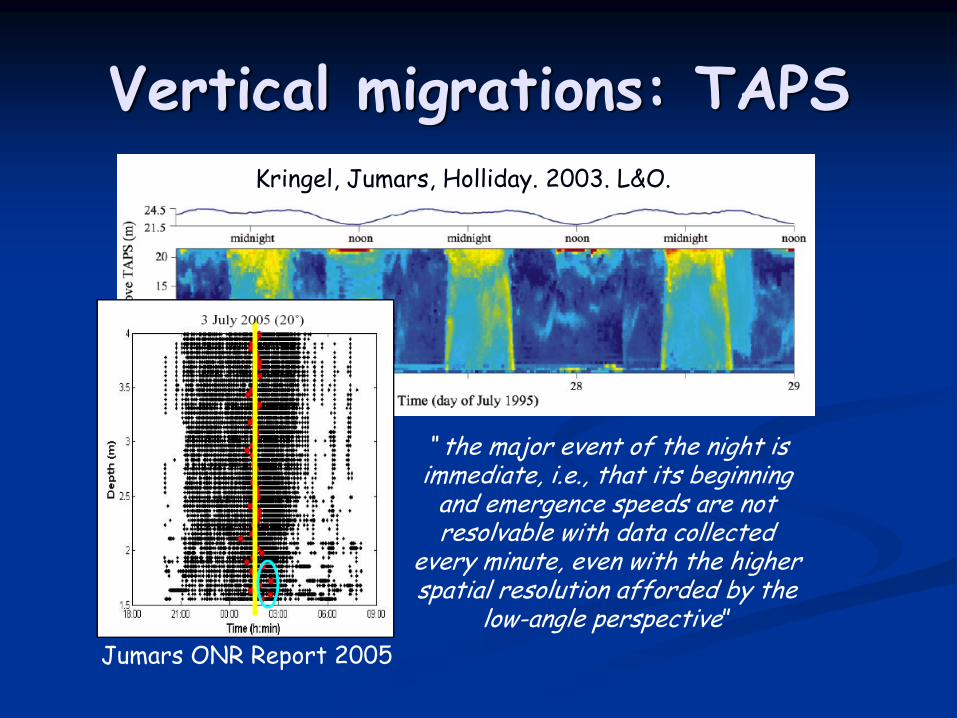
Vertical migrations: TAPSKringel, Jumars, Holliday. 2003. L&O.
“ the major event of the night is immediate, i.e., that its beginning
and emergence speeds are not resolvable with data collected
every minute, even with the higher spatial resolution afforded by the
low-angle perspective”Jumars ONR Report 2005

waveht
windspeed
OASIS 2005: glider SAM attenuation

Questionsnocturnal turbidity events: what are we really looking at? Are the optics really resolving mysid shrimp ~1 cm long?
no way…
Are we seeing an influx of smaller (optically significant) particles as a “migration residual”?But how does the entire water column clear so fast?Aren’t mysids attracted to light?
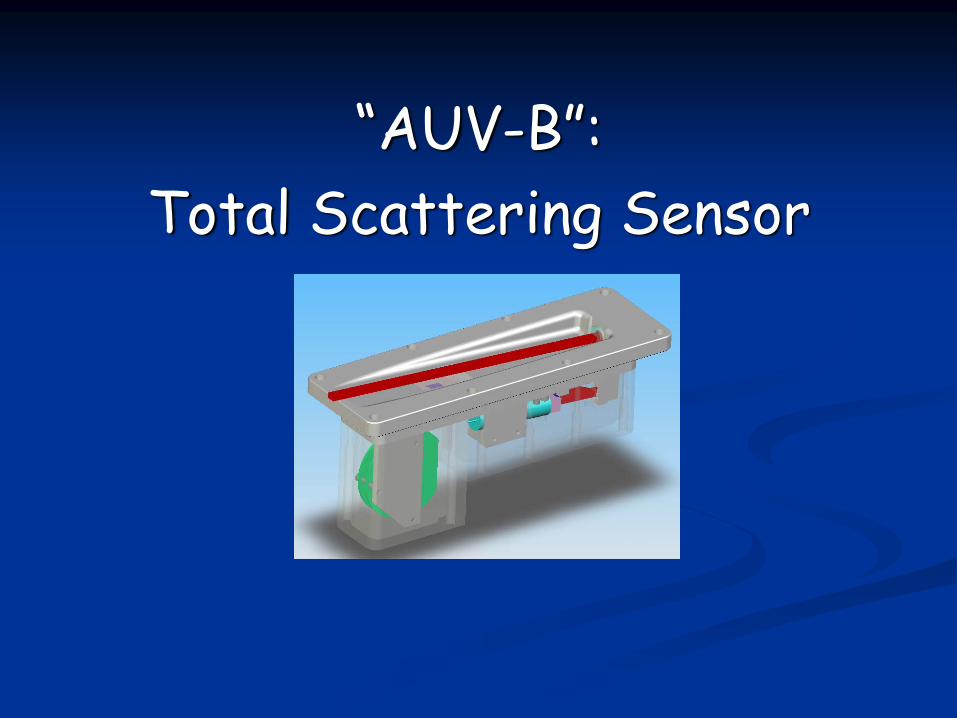
“AUV-B”: Total Scattering Sensor

AUV-B: Theory and Modeling
Teflon diffuserAcceptance angle (γa) critical
When bd = 1 mm and sd = 10 cm, then γa is ~0.7°, comparable to that of the WET Labs ac9 meter
γa

AUV-B Prototype: Design

AUV-B Prototype Testing
AUV-B SAM

AUV-B
n = 107,338
Long Island Sound: May, 2005

Comparison with b from ac9

OASIS 2007: autonomous profiler
AUV-B SENSORS• WL AUV-B• WL ACS• WL ECO-FLNTU• SBE49 CTD• NORTEK ADV

• Deployed Sept 9-21, 2007
profilerlocation
+
profilerlocation
+
profilerlocation
+
profilerlocation
+

windspeed(m/s)
waveheight(m)
b650(m-1)
Profiler AUV-B scatteringb650 at 5m
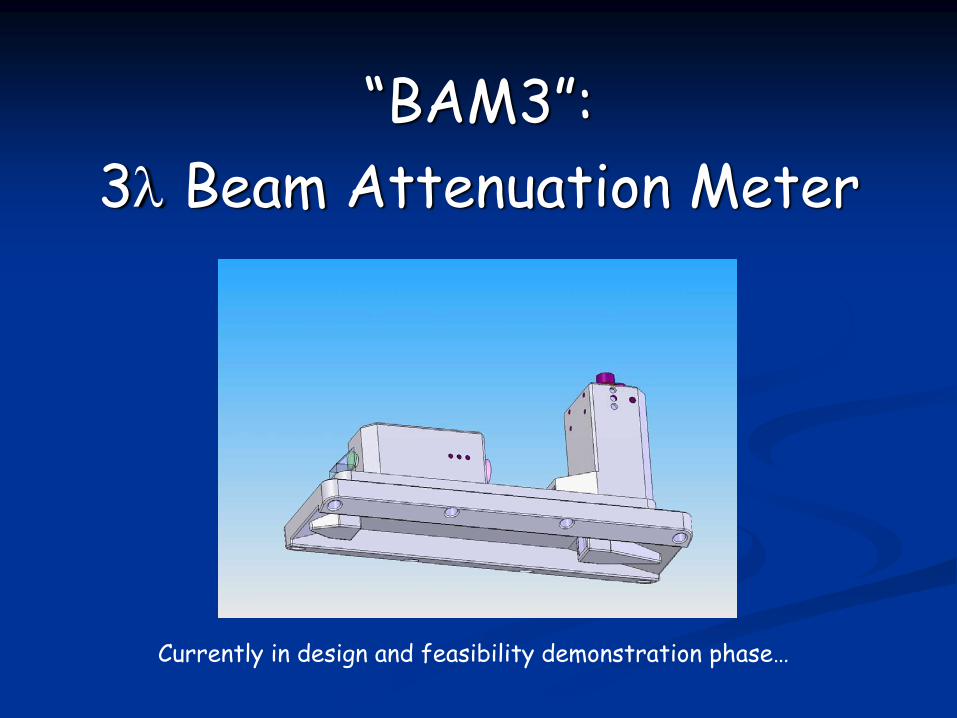
“BAM3”: 3λ Beam Attenuation Meter
Currently in design and feasibility demonstration phase…
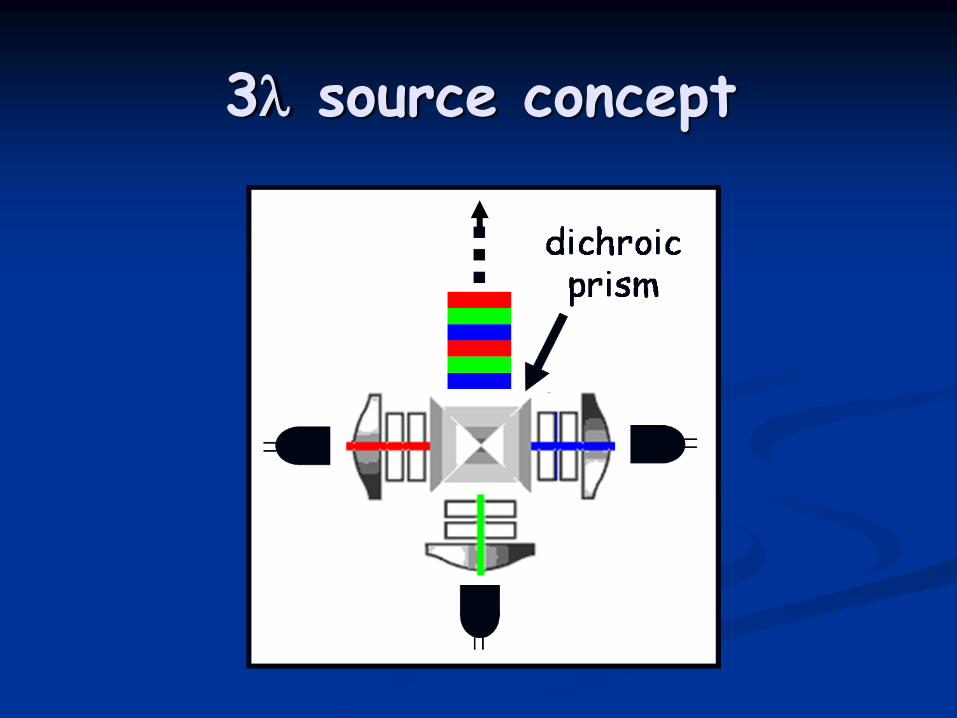
3λ source concept
LED660nm
LED532nm
LED470nm

What have we been doing the last 2 weeks off the pier?
RaDyO: Radiance in a Dynamic Ocean

Primary instrument package
Designed to investigate aspects of the particle population (size distribution, composition, etc.) and bubbles with optical scattering

Bubble VSFs (monodisperse)

Preliminary data…
Thank You
Time (relative)
beta
(60
deg)
/ b
eta
(120
deg
)
bubbles
Sediment plumes
Ebbing tide with surfzone gradually approaching sampling site…