environmental optimisation of gas fired engines in denmark
TRANSCRIPT

S U S T A I N A B L E G A S T E C H N O L O G Y
Danish Gas Technology Centre
Environmental optimisation of gas fired engines in Denmark
International Gas Research Conference 2014
Torben Kvist ([email protected])
S U S T A I N A B L E G A S T E C H N O L O G Y
Danish Gas Technology Centre
Participants The participants in this work are • Rolls-Royce • Wärtsilä • GE Jenbacher • PonPower (Caterpillar engines) • National Environmental Research Institute, NERI • Danish Gas Technology Centre, DGC.
Acknowledgement The work was financially supported by the ForskEL programme and Danish gas distribution companies.

S U S T A I N A B L E G A S T E C H N O L O G Y
Danish Gas Technology Centre
Background • ≈ 1.000 MW of electric power capacity is installed at natural gas
fired engine based CHP plants
• Main purpose is to deliver heat
• The heat is produced by an engine or a boiler depending on electricity price.
Source: Danish Energy Agency

S U S T A I N A B L E G A S T E C H N O L O G Y
Danish Gas Technology Centre
NOx emissions in Denmark
Source: Based on DCE data

S U S T A I N A B L E G A S T E C H N O L O G Y
Danish Gas Technology Centre
Background • A projection says that Denmark will not be able to meet the
2020 target for NOx
• One NOx source is gas fired CHP engines
• Often engines are adjusted to meet emission regulation as well as to have high efficiency
• It is possible to reduce the NOx by adjustment – however, it affects other emissions negatively

S U S T A I N A B L E G A S T E C H N O L O G Y
Danish Gas Technology Centre
Purpose The work will answer the questions • What is the NOx reduction potential by engine adjustment? • What are the consequences on other emissions in terms of
– Emitted amounts? – Related external costs?
• What are the socio-economic consequences?

S U S T A I N A B L E G A S T E C H N O L O G Y
Danish Gas Technology Centre
Approach How have we answered the questions? • Measurement of efficiency and emissions at different settings • Determination of external cost for different species • Analysis of conducted measurements • Economic analysis
S U S T A I N A B L E G A S T E C H N O L O G Y
Danish Gas Technology Centre
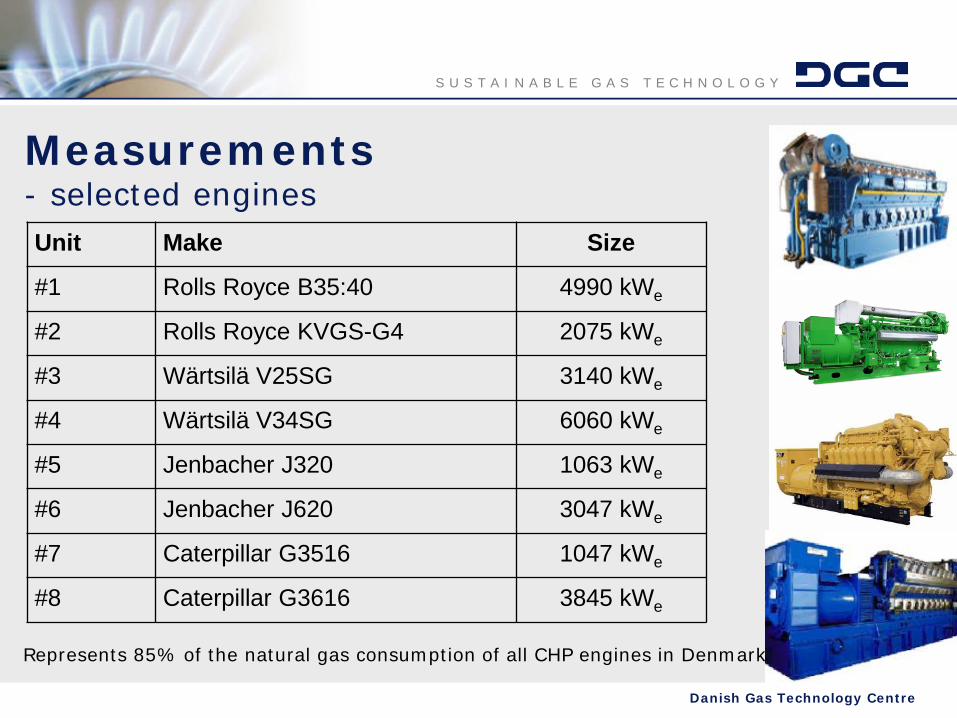
Measurements - selected engines Unit Make Size
#1 Rolls Royce B35:40 4990 kWe
#2 Rolls Royce KVGS-G4 2075 kWe
#3 Wärtsilä V25SG 3140 kWe
#4 Wärtsilä V34SG 6060 kWe
#5 Jenbacher J320 1063 kWe
#6 Jenbacher J620 3047 kWe
#7 Caterpillar G3516 1047 kWe
#8 Caterpillar G3616 3845 kWe
Represents 85% of the natural gas consumption of all CHP engines in Denmark

S U S T A I N A B L E G A S T E C H N O L O G Y
Danish Gas Technology Centre
Measurements - selected engine settings
Unit mg/m3(n) @ 5% O2
TI1 TI2 TI3 TI4
λ 1 M5 NOx = 200
λ 2 M6 NOx = 300
λ 3 M1 NOx = 200
M2 NOx = 300
M3/7 NOx = 400
M4 NOx = 500
λ 4 M8 NOx = 500

S U S T A I N A B L E G A S T E C H N O L O G Y
Danish Gas Technology Centre
Measurements - conducted measurements • O2, CO, CO2, NOx, NO2, UHC • Hydrocarbon composition – including formaldehyde • Fuel consumption, heat and electricity production

S U S T A I N A B L E G A S T E C H N O L O G Y
Danish Gas Technology Centre
Measurements - results

S U S T A I N A B L E G A S T E C H N O L O G Y
Danish Gas Technology Centre
Health related external costs
CPR data (who lives where)
Specific source (Measured emissions)
Concentration distribution (Atmospheric dispersion and chemistry)
Human exposure (Population data)
Human impact (Exposure response functions)
Resulting cost (Economic valuation)

S U S T A I N A B L E G A S T E C H N O L O G Y
Danish Gas Technology Centre
Health related external costs - Results
NOx CO HCHO C2H4 €/kg (NO2,eq) €/kg €/kg €/kg
7.6 9.3 10-4 1.3 10-3 0.29
CH4, C2H6, C3H8: No health effects at relevant concentrations

S U S T A I N A B L E G A S T E C H N O L O G Y
Danish Gas Technology Centre
Health related external costs - Relative importance, natural gas fired engines
S U S T A I N A B L E G A S T E C H N O L O G Y
Danish Gas Technology Centre
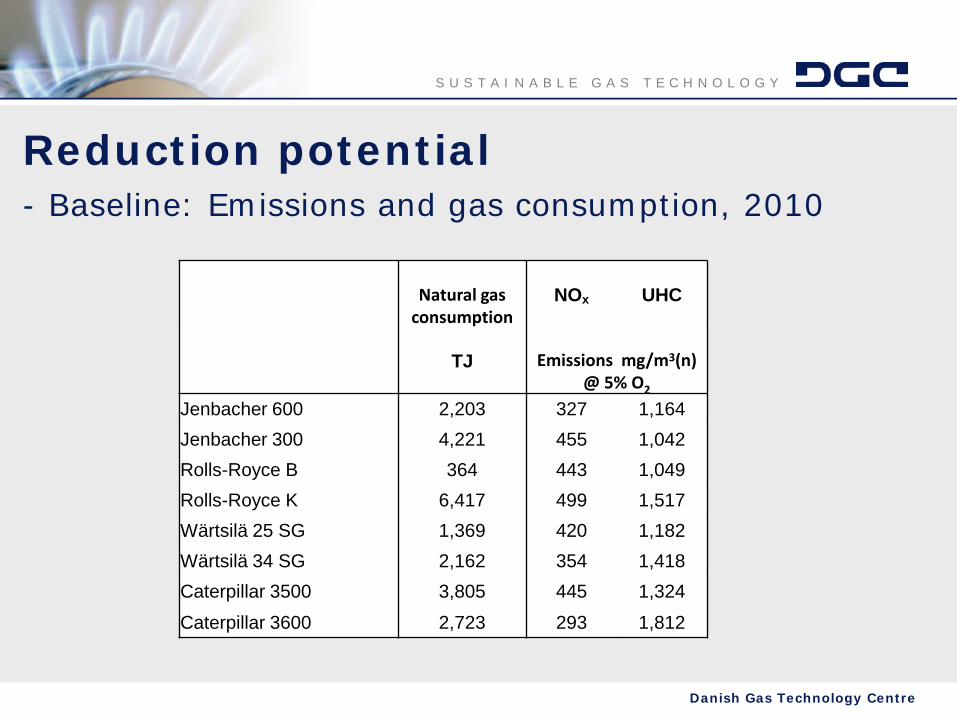
Reduction potential - Baseline: Emissions and gas consumption, 2010
Natural gas
consumption NOx UHC
TJ Emissions mg/m3(n) @ 5% O2
Jenbacher 600 2,203 327 1,164 Jenbacher 300 4,221 455 1,042 Rolls-Royce B 364 443 1,049 Rolls-Royce K 6,417 499 1,517 Wärtsilä 25 SG 1,369 420 1,182 Wärtsilä 34 SG 2,162 354 1,418 Caterpillar 3500 3,805 445 1,324
Caterpillar 3600 2,723 293 1,812

S U S T A I N A B L E G A S T E C H N O L O G Y
Danish Gas Technology Centre
Reduction potential - Results - gas engines NOx CH4 CO CO2
Before After Before After Before After Before After
ton/year ton/year ton/year million ton/year Jenbacher 600 227 175 834 993 144 197 122 123 Jenbacher 300 604 340 1,161 1,279 360 381 235 240 Rolls-Royce B 51 29 121 143 14 19 20 20 Rolls-Royce K 1,008 513 3,411 3,852 484 633 345 350 Wärtsilä 25 SG 181 109 608 719 126 164 74 75 Wärtsilä 34 SG 241 172 669 842 78 100 118 118 Caterpillar 3500 533 307 2,134 2,253 224 233 208 213 Caterpillar 3600 251 215 1,809 1,921 168 175 147 147 Sum 3,095 1,858 10,748 12,002 1,598 1,901 1,269 1,285 Increase -40% 12% 19% 2%

S U S T A I N A B L E G A S T E C H N O L O G Y
Danish Gas Technology Centre
Cost evaluation - Examples Engine • Price of natural gas (taxes are fixed) • Service and maintenance costs • Electricity and heat efficiency of the engine Boiler • Price of fuel • Energy and CO2 tax of fuel for the boiler if different from natural gas • Boiler efficiency

S U S T A I N A B L E G A S T E C H N O L O G Y
Danish Gas Technology Centre
Cost evaluation - production assumptions
• Power production is constant Higher gas consumption for the engines Higher heat production from the engines
• Total heat production is constant
Reduced heat production using boilers
∑∑ ∑ ++= productsproductionExternal CostCostCostcosts Total
0
300
600
900
1200
1500
0 100 200 300 400 500
District heating unit
Hea
t pric
e / D
KK
/MW
h
Power
Heat

S U S T A I N A B L E G A S T E C H N O L O G Y
Danish Gas Technology Centre
Cost evaluation Influence on energy production and consumption Electricity TJ/year 0
Heat – engines TJ/year 299
Natural gas - engines TJ/year 359
Heat - boilers TJ/year -299
Natural gas - boilers TJ/year -285

S U S T A I N A B L E G A S T E C H N O L O G Y
Danish Gas Technology Centre
Cost evaluation Importance of externalities Unit Before After Reduction
Natural gas TJ/year 23,264 23,338 -74.5 NOx ton/year 3,095 1,846 1,248 CH4 ton/year 10,748 12,002 -1,254 CO ton/year 1,598 1,893 -295 CO2 mill. ton/year 1,269 1,269 -0,4
S U S T A I N A B L E G A S T E C H N O L O G Y
Danish Gas Technology Centre
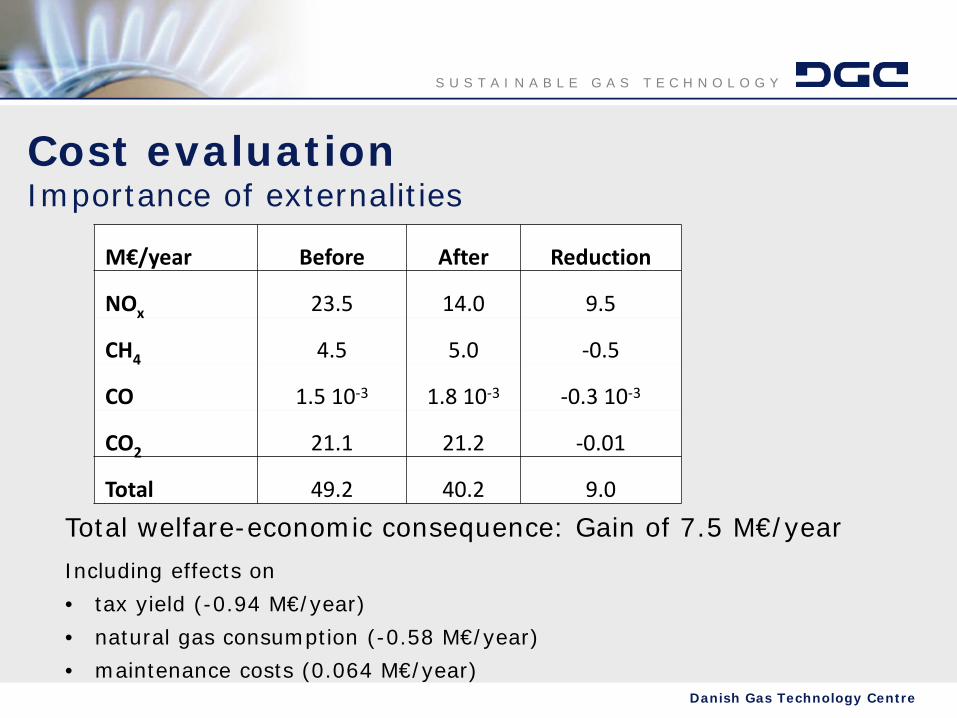
Cost evaluation Importance of externalities
M€/year Before After Reduction
NOx 23.5 14.0 9.5
CH4 4.5 5.0 -0.5
CO 1.5 10-3 1.8 10-3 -0.3 10-3
CO2 21.1 21.2 -0.01
Total 49.2 40.2 9.0
Total welfare-economic consequence: Gain of 7.5 M€/year
Including effects on • tax yield (-0.94 M€/year) • natural gas consumption (-0.58 M€/year) • maintenance costs (0.064 M€/year)

S U S T A I N A B L E G A S T E C H N O L O G Y
Danish Gas Technology Centre
Conclusions • For eight gas engine models it was possible to obtain NOx emissions as
low as 250 mg/m3 @ 5% O2 without after-treatment
• On average, the NOx reduction potential for Danish natural gas fired CHP engines corresponds to a reduction of 40% relative to the present level. Consequences: hydrocarbon emissions will increase by 12% and the CO emission will increase by 19%.
• Harmfulness in terms of negative health effect as well as climate effect was assessed. Change in related costs due to adjustment:
– NOx: 9.5 M€/year (saved) – Sum of other emitted components: 0.5 M€/year (extra costs) – Other welfare-economic consequences: 1.5 M€/year (extra costs)

S U S T A I N A B L E G A S T E C H N O L O G Y
Danish Gas Technology Centre
Thank you for your attention