environmental radiation andhuman...
TRANSCRIPT

ENVIRONMENTAL RADIATIONAND HUMAN HEALTH
ERNEST J. STERNGLASSUNIVERSITY OF PITTSBURGH
1. Introduction
The present paper will address itself to the evidence that low level radiationfrom nuclear fission products in the environment such as are released by nuclearexplosions and power reactors may already have produced serious effects onthe health of the world's population far beyond those ever believed possiblewhen our present radiation standards were originally formulated and adopted,especially for the case of the young infant.
Before discussing the latest evidence in some detail, I should like to reviewvery briefly the nature of the early discovery that low level radiation can pro-duce not only genetic but also serious somatic effects in man both at high andlow dose rates.
2. Historical background
The earliest indication that low level radiation could produce serious effectsin man came from the studies of Alice Stewart at Oxford University in 1958showing that mothers who had received a series of three to five pelvic X-raysduring pregnancy had children who were almost twice as likely to developleukemia and other cancers before age ten than mothers who had had no pelvicX-ray examinations [1].
This work was independently confirmed in 1962 in a major epidemiologicalstudy involving close to 800,000 children born in New York and New EnglandHospitals by Brian MacMahon of the Harvard School of Public Health [2].Using these two sets of data, it was possible to show that there appears to exista direct, straight line relationship between the number of X-ray films given toa pregnant woman and the probability that the child will subsequently developleukemia, and that there is therefore no evidence for the existence of a safe"threshold level" below which no additional cancers are produced, down to therelatively small dose from a single X-ray. Furthermore, the magnitude of theX-ray dose to the developing fetus in utero from one such X-ray was comparablewith the dose normally received in the course of two to three years of naturalbackground radiation, or from the fallout produced in the course of the 1961-1963 test series, namely 0.2-0.3 rad [3].These early findings have since been confirmed by the most recent results of
145

146 SIXTH BERKELEY SYMPOSIUM: STERNGLASS
A. Stewart, June, 1970 [4]. This extensive study, based on over 7,000 childrenborn in England and Wales between 1943 and 1965 who developed leukemiaor other cancers gave the result that for one rad to a population of one millionchildren exposed shortly before birth, there were an extra 300 to 800 cancerdeaths before age ten with a mean number of 572 i: 133 per rad. For a normalrate of incidence of about 700 cases per million children born, this means thatonly 1.2 rads (1200 mr) are required to double the spontaneous incidence. (SeeFigure 1.) Furthermore, Dr. Stewart's study showed that when the radiation
x 00O2.04
0
I.-z0
0u
1.0 -- - -
(0F ~~~~~~corr.coeff. -0.979w0 _
0. , , I
0 1 2 3 4
NUMBER OF X-RAY FILMFIGURE 1
Ratio of cancer cases to controls as a function of the number of abdominalX-ray films as reported by Stewart and Kneale (Lancet, June 6, 1970).

ENVIRONMENTAL RADIATION 147
exposure took place in the first trimester, the excess risk of cancer increased15 times [4]. This means that a dose of only some 80 mr was found to doublethe normal cancer risk for the early embryo, much less than the presently per-mitted 500 mr annual dose to any member of the general population.
3. Fallout and childhood leukemia
It was therefore possible that studies of large populations of children exposedto known incidents where localized fallout occurred in a given area might showdetectable increases in leukemia some years later. Such a localized "rain-out"was pointed out by Ralph Lapp [5] as having taken place in Albany-Troy,New York in April of 1953 following the detonation of a 40 kiloton bomb inNevada. An examination of the data on leukemia incidence published by theNew York State Department of Health showed that when plotted by year ofdeath there was a clear increase in the number of cases per year among childrenunder ten years of age at death from about two to three to as many as eight tonine per year some six to eight years after the arrival of the fallout, exactly thesame delay in peak incidence as observed in Hiroshima and Nagasaki. Further-more, the peak contained many children who were not even conceived until ayear or more after the arrival of the fallout, suggesting for the first time theexistence of an effect prior to conception, see Figure 2 [6].Due to the relatively small number of cases in Albany-Troy, it was difficult
to draw absolutely firm conclusions, and so the situation for New York State asa whole was examined. Again, peaks of leukemia incidence were clearly presentsome four to six years after known atmospheric tests in Nevada, greatly strength-ening the initial observations for Albany-Troy alone [6].
4. Early indications relating fallout and infant mortality
Following the arrival of the fallout in Albany-Troy in 1953, there was also adrastic slowdown in the steady decline of fetal mortality or still births in thatarea see Figure 3 [6]. Following up this unexpected finding, the fetal and infantmortality statistics for New York State as a whole were examined, followed bythose for California and other states. The same slowdown in the decline or evenrenewed rises in the mortality rates existed to varying degrees depending onthe amount of fallout in the milk, beginning in the early 1950's, the declinesresuming only two to four years after the end of atmospheric testing [7]. Forthe U.S. as a whole, the data is shown in Figure 4, where both the infant mor-tality rates for the total population and the nonwhite population has beenplotted together with the data for Sweden. It was then drawn to our attentionthat I. M. Moriyama of the U.S. National Center for Health Statistics hadpreviously pointed out the levelling trend in the U.S. (beginning in about 1951)as early as 1960 [8], and that he had in fact suggested the possibility that similarupward changes of mortality for all age groups might be connected with thesharp rises in environmental radioactivity from nuclear testing [9].

148 SIXTH BERKELEY SYMPOSIUM: STERNGLASS
'2PRECONCEPTION IRRADIATION
w 10 INTRAUTERINE IRRADIATION
ce. 8 POSTNATAL IRRADIATIONW~~~
w6 FALLOUT t
(0 jw
1952 1954 1956 1958 1960 1962CALENDAR YEAR OF DEATH
0 1 2 3 4 5 *6 7 8 9YEARS ELAPSED FROM ARRIVAL
*AVERAGE RATE FOR '52-5'5, BEFORE EFFECT OFFALLOUT COULD APPEAR (2.2 *O.8/YR)
FIGURE 2Number of leukemia cases per year of report for children under ten years of agein the Albany-Troy, N.Y. area, for which the data is complete, as reported byLade (Science, Vol. 143 (1964), p. 994). Period from 1952 to 1955 before effectof fallout could appear (*) gives an average annual number of 2.2 i 0.8 cases
per year.
Since then, we have extended our studies to other countries in the world, andespecially in northern Europe, which received the fallout from the Nevada testsin its northeasterly drift across the Atlantic, and the same patterns of slowdownfollowed by a renewed decline of infant mortality were found, as shown inFigure 5. At the same time the levelling trends were much less pronounced incountries like Canada and France, that were to the north or south of thepath of the Nevada fallout on its northeasterly course, so that they did notreceive as much short lived activity per unit strontium 90 in the milk (seeFigure 6).We have since established high degrees of correlation between the increases
in infant mortality above the declining base lines, and the measured strontium90 levels in the milk and therefore in the bone of fetuses, children and young

ENVIRONMENTAL RADIATION 149
40
ARRIVAL OFm0 HEAVY FALLOUTw (APRIL 25, 1953)
0 200
w
cc .ALBANY-TROY, -N.Y. \ \4 FETAL DEATH RATE1I0
a09 tAtHtt-g 8 NEVADA TESTS
w 7Ua.
6 l l I I1935 '40 '45 '50 '55 '60 '65 '70
YEARFIGURE 3
Fetal death rate reported per 1000 live births versus time before and after thearrival of fallout in the Albany-Troy area.
adults for all the nine regions of the Public Health Service's Raw Milk Network,for which data are available back to 1957-58. (Table I and Figure 7) [10].These correlations suggest that as many as 400,000 infants up to one year oldin the U.S. alone may have died as the result of nuclear testing by 1965.These results are so startling and so unexpected, that they have naturally
encountered considerable skepticism primarily because the technique of trend

150 SIXTH BERKELEY SYMPOSIUM: STERNGLASS
100 I . I I-
90 U.S.S.R. A-TESTS
vN0r[<Fww= [MORATORIUM(0 70
HNEVADA TESTS ES60
o 500,0;
tion, U.S. nonwhite population.and Sweden.40
0
t-30
20z
H-TESTS H-TESTS
lo ' * I .p I,\ I . I
I
1935 '40 '45 '50 '55 '60 '65 '170YEARS
FIGURE, 4
Infant mortality rate (0-1 year) per. 1000 live births for the U.S. total popula-tion, U.S. nonwhite population and Sweden.

ENVIRONMENTAL RADIATION 151
INFANT MORTALITY RATE o0-I YR.)40 NOLAND 40
ANDWALES U.S.-UK.-U.S.S.R.
TEST BAN30 TEST 30
IMORATORIUM
EL4M40 DEMAK20
30
20 1002w
NORWAY
30 -
000
w ~~~~~~~~~~10IL 20
430
02SWEDEN
20-10
f H-ESTSI
and SERIESH-TESTS '
...1... .1....'1....1I....1945 '50 '55 '60 '65 '70
YEAR
FIGURE 5
Infant mortality trends for northern European countries after World War II.Note onset of upward deviations peaking some three to five years after major
test series. Least square fits to 1946-1955 trend.

152 SIXTH BERKELEY SYMPOSIUM: STERNGLASS
100 I I I I I
INFANT MORTALITY RATE(O-I YR.)
so - (1946-1950 FIT)FRANCE
U)60 U.S. -U.S.S.R.
U.K.TEST BAN
w 40pA NiCANADA
0 40 -
0
Z H-BOMiOMB
NEVADA ~ ~ HIESTESTS ~ ~ TST
0 2
LL~ ~~~~~~~~~~~~~OL
10I-. ..
YEAR~ ~ ~~N
FIGUREC6I-fantmortaity tend fr Frace an Canaa aftr Word WarII.NtesTS
IL~ ~~~~~~~~~~~~~OL
YEAR~ ~~~AN
upward deviation than for the northern European countries, associated withthe fact that the path of the intense, short lived Nevada fallout largely nmissedCanada to the north and France to the south of the prevailing fallout movement.

ENVIRONMENTAL RADIATION 153
TABLE I
CORRELATION BETWEEN STRONTIUM 90 LEVELS AND EXCEsSS INFANT MORTALITY, SHOWINGEFFECT OF DIFFERENT LEVELS OF SHORT LIVED ISOTOPES ON THE; SLOPES OF THE REGRESSIONLINES, AS WELL AS THE EFFECT OF UNREPRESENTATIVE MILK SAMPLING AREAS IN THE CASE
OF CALIFORNIA, WASHINGTON STATE AND Omo
Correl. DegreesState or country Coeff. of freedom t Value Slope
California 0.964 11 12.00 8.0 4 0.63Georgia 0.954 12 10.97 3.08 d0.27Illinois 0.954 12 10.99 3.11 0.32Ohio 0.976 10 14.13 1.91 0.13Missouri 0.968 12 13.38 4.00 i 0.29New York 0.966 12 12.98 3.51 0.26Texas 0.967 12 13.19 4.64 0.34Utah 0.841 12 5.93 3.16 4: 0.56Washington 0.911 11 7.30 1.09 A 0.14
U.S. (HASI214) 0.980 14 18.26 3.15 :1 0.17
England & Wales 0.922 10 7.51 3.74 0.48New Zealand 0.950 9 9.17 3.83 0.40
analysis as used first by Moriyama to calculate "excess deaths" above normalexpectations for all age groups in the U.S. was based on the expectation of asteadily declining infant mortality at least until levels are reached equal tothose that had already been attained in other medically advanced nations ofthe world such as Sweden (see Figure 4). Such an assumption is however justifiedby the fact that in New Mexico, after the initial test in 1945, there was indeeda return to the same line of steady decline determined by the computer fit tothe 1935-50 period, due to the -low rainfall and therefore low levels of falloutin the milk after 1950, when nuclear testing was moved north to Nevada (Fig-ure 8). Furthermore, the most recent data on infant mortality show that in anumber of rural states such as Maine far from any nuclear facility, infant mor-tality rates have declined very sharply, reaching the levels predicted on thebasis of the 1935 to 1950 rate of decline, as illustrated in Figure 9 for the caseof Maine. Nevertheless, such large effects of relatively small amounts of radia-tion on infant mortality,, which is also. affected by many other factors, is diffi-cult to accept, and it is therefore important to find other data that is not subjectto the same criticism.
5. Fallout and congenital malformations
Such data exist in the case of childhood deaths associated with congenitalmalformations such as Down's Syndrome, microcephaly and congenital heartdefects. For this particular category of infant and childhood deaths, there has

90X-NEW YORK /*-NEW ZEALANDA- ENGLAND
s70 +-CANADA I
7E0 -/ EL"4 ~~~~~~~NEWYORK
60 a0
2
O- NEW50 90 ZEALAND
La
zI
La~ ~ ~ ~~FGR 7
0 30 I NOLANDcc
0 5 0 520
St 90 IN MILK (PCI/ I)
Correlation plots for excess infant mortality and strontium 90 in the milk (fouryear moving average). Note similarity in slope for geographical areas of highrainfall in the path of low altitude tropospheric fallout from tests in Nevada(New York and England) and tests in Australia (New Zealand). In contrast,note the small increase in mortality per unit strontium 90 for Canada, largelymissed by the initial pass of the low altitude Nevada and Pacific fallout clouds
with their high proportion of short lived isotopes.154

ENVIRONMENTAL RADIATION 155
1000_
(n
I-w
000oo
0.z4
Z~~~~~~~~ I
10 1,,1
1935 '40 '45 '50 '55 60 '65 870YEAR
FIGURE 8
Infant mortality trend for New Mexico, 1935-1970. Note the degree to whichrates continued to decline parallel to the 1935-50 projection, associated withthe very low annual rainfall and geographical location south of the Nevada
test site.

156 SIXTH BERKELEY SYMPOSIUM: STERNGLASS
100 _
I 50-
00O END OF
NEVADA TESTSw
*. WTh.. . ..
; -
-- '~~~~~~~~Stz-~ ~ ~ ~ ~ INEVADA TESTS
LAST H-TESTSto1 I I
- 1935 '40 '45 '5 55 '60 '6 '0YEAR
FIGURE 9
Infant mortality for Maine, 1935-1970. Note strong upward deviation beginningat the time of the Nevada tests (1951), followed by a return to the
projected 1935-50 trend line a few years after the end ofU.S. and U.S.S.R. atmospheric tests.

ENVIRONMENTAL RADIATION 157
been only a slight downward trend over the last 20 years, and neither theintroduction of new antibiotics, medical care methods nor the gradual improve-ment in diet and medical care has had significant effects on these mortalityrates. As a result, there is here no need to extrapolate a rapid downward trend,and one has for every state and many foreign countries, a well establishednearly horizontal base line to the onset of nuclear testing in 1945. Furthermore,it is well known that congenital malformations can be induced by relativelylow levels of radiation in animals, and recent studies of such conditions asmental retardation published by the United Nations Scientific Commissionon Radiation [11] have established that small amounts of radiation duringcertain critical periods of embryonic development and organ formation canproduce detectable effects in children.We therefore examined the incidence of deaths among congenitally defective
children in relation to children who died of accidents as a control group at variousdistances from the Nevada test site, where relatively high local fallout wasknown to have occurred in a number of instances, documented both by theAEC [12] and independent studies by scientists at the University of Utah [13]and the St. Louis Center for Nuclear Information [14].As an example, Figure 10 shows the annual number of deaths of congenitally
defective children up to four years old in Utah directly east of Nevada andtherefore generally downwind from the test site as taken from the publishedfigures in the U.S. Vital Statistics, together with the deaths in this age groupdue to accidents other than those involving automobiles. It is seen that theaverage number of deaths of congenitally defective children per year in thepretesting period 1937-45 stayed relatively constant at about 75 cases per year.But it rose to a peak of 123 cases per year in 1958, some five years after a par-ticularly large fallout incident in 1953, returning close to the pretesting rateof 80 per year five years after the end of atmospheric tests in Nevada. Such arise and decline while accidental deaths remained constant is clearly not ex-plainable in terms of a gradual rise in the number of births per year. Altogether,there seem to be some 480 children that are likely to have died of congenitalmalformations in Utah above expectations, based on a comparison with thenumber of accidental deaths since the onset of nuclear testing in 1945.An even more striking peak in deaths of congenitally defective children
relative to the number of accidental deaths took place in the five to fourteenyear age group shown in Figure 11 for the case of Utah, which includes childrenwho received radiation from the milk and food some time after birth. Again,a four to six year delay is seen to occur between exposure and death, quitesimilar to the case of Hiroshima and Albany-Troy, New York, correspondingto the fact that children born congenitally defective are much more prone todevelop leukemia with its four to six year delay of peak incidence.The rate of leukemia deaths for all children in the age group five to fourteen,
which was shown by Stewart [1] and MacMahon [2] to reflect the effects ofperinatal irradiation most strongly is plotted in Figure 12 for the same state.

158 SIXTH BERKELEY SYMPOSIUM: STERNGLASS
120
V10 Vi.S.R. CONGENITAL100 l;; 1 / I V/ *MALFORMATIONS
90 I /
480w
0w 70 A
U) NEVADA TESTS gm360 _j r ri _4I-. gi 13 I ~I I ACCIDENTS
2 r/
O0 1, I3U.g I r I LFj,r50I I I I I I jL gLI I1g I.3 rri
J40 j Li L.1 5 33 'z I~~~~~~Ui
30 Li
20-
I0
'35 '40 '45 '50 '55 '60 '65 '70YEAR
FIGURE 10
Changes in the annual number of deaths of congenitally defective children 0-4years old in Utah, compared with the number of
non-automobile related accidents.

ENVIRONMENTAL RADIATION 159
20
303w kT
IC~ ~ ~ ~ I
1W0 n CIE;T
10 I
°I.< lO _I
ILi
Z SzO
ri rI
5 '4 '45 'SU5 6 6 7
rF E1937-50 AVG. 2.9
a ~ t MRATRIUM
35 '40 '45 50 '55 '60 '65 '70
40 ACCIDENTSwI 30 .. j
Anulnubro ILth amon chlrenfv to fortee yersol
P.ro congenitl-yr 'choodtdw
35 '40 '45 '150 '55 660 '65 '70YEAR
FIGURE 11
Annual number of deaths among children five to fourteen years oldborn congenitally defective, compared with the number
of accidental deaths (non-automobile) [39].

160 SIXTH BERKELEY SYMPOSIUM: STERNGLASS
10TEST-MORATORIUM
8~~~~~~9_
Z2 U.S.S.R. -sT
MINNES TA NE NEAD
o H-TESTS6 ~~~~~~~~~~~~U.S.-U.S.S.R.
PACFIC
oL 5
0 ~~~N-M
C; UTAH0
ix3 1949- 5 AV.w
'IL
05.MINNESOTA(CONTROL)
4
MINN. 49-50 AV.
3UTAH 49-50OAV,-
1945 '50 '55 '60 '65 '70YEAR
FIGURE 12
Annual rate of leukemia deaths per 100,000 population aged five to fourteenyears for Utah near the Nevada test site compared with Minnesota as control.Major test series are indicated, together with the four to six year delay expected
for leukemia [39].
ENVIRONMENTAL RADIATION 161
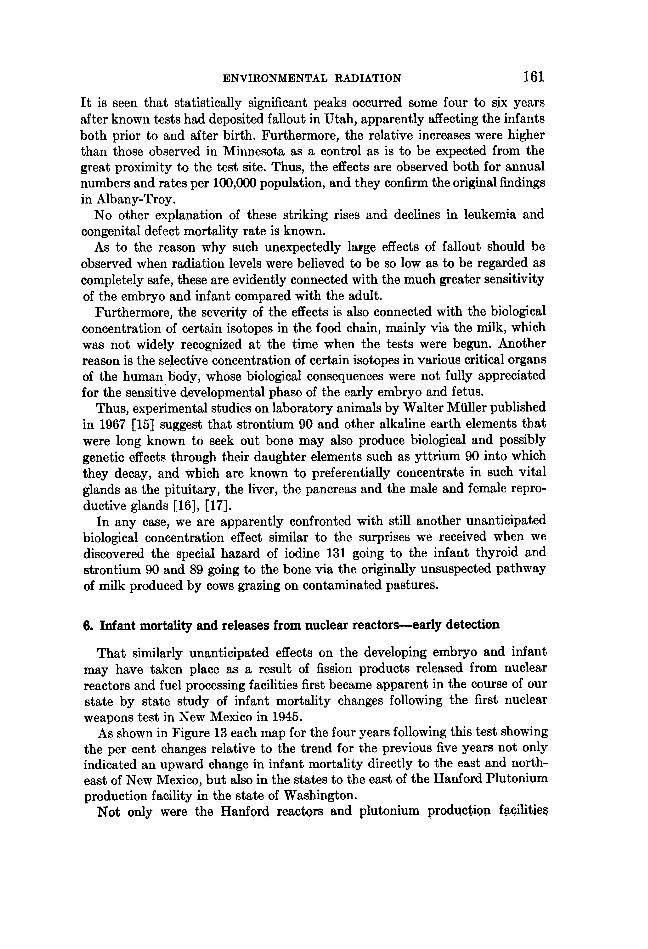
It is seen that statistically significant peaks occurred some four to six yearsafter known tests had deposited fallout in Utah, apparently affecting the infantsboth prior to and after birth. Furthermore, the relative increases were higherthan those observed in Minnesota as a control as is to be expected from thegreat proximity to the test site. Thus, the effects are observed both for annualnumbers and rates per 100,000 population, and they confirm the original findingsin Albany-Troy.No other explanation of these striking rises and declines in leukemia and
congenital defect mortality rate is known.As to the reason why such unexpectedly large effects of fallout should be
observed when radiation levels were believed to be so low as to be regarded ascompletely safe, these are evidently connected with the much greater sensitivityof the embryo and infant compared with the adult.Furthermore, the severity of the effects is also connected with the biological
concentration of certain isotopes in the food chain, mainly via the milk, whichwas not widely recognized at the time when the tests were begun. Anotherreason is the selective concentration of certain isotopes in various critical organsof the human body, whose biological consequences were not fully appreciatedfor the sensitive developmental phase of the early embryo and fetus.
Thus, experimental studies on laboratory animals by Walter Mtiller publishedin 1967 [15] suggest that strontium 90 and other alkaline earth elements thatwere long known to seek out bone may also produce biological and possiblygenetic effects through their daughter elements such as yttrium 90 into whichthey decay, and which are known to preferentially concentrate in such vitalglands as the pituitary, the liver, the pancreas and the male and female repro-ductive glands [16], [17].
In any case, we are apparently confronted with still another unanticipatedbiological concentration effect similar to the surprises we received when wediscovered the special hazard of iodine 131 going to the infant thyroid andstrontium 90 and 89 going to the bone via the originally unsuspected pathwayof milk produced by cows grazing on contaminated pastures.
6. Infant mortality and releases from nuclear reactors-early detection
That similarly unanticipated effects on the developing embryo and infantmay have taken place as a result of fission products released from nuclearreactors and fuel processing facilities first became apparent in the course of ourstate by state study of infant mortality changes following the first nuclearweapons test in New Mexico in 1945.As shown in Figure 13 each map for the four years following this test showing
the per cent changes relative to the trend for the previous five years not onlyindicated an upward change in infant mortality directly to the east and north-east of New Mexico, but also in the states to the east of the Hanford Plutoniumproduction facility in the state of Washington.Not only were the Hanford reactors and plutonium production facilitie*

162 SIXTH BERKELEY SYMPOSIUM: STERNGLASS
CO
")0
C)
c3
toCs 0c3 At ooC3
rn
oCa
cco$
ri Obo
c3 t
Oo
4. C
61 B
-c,.CCo._
5-oC> *f

ENVIRONMENTAL RADIATION 163
operating at very high levels since 1944, releasing into the environment the raregases that could not be trapped readily, but on a number of occasions, therewere serious accidents in the course of extracting the plutonium from theirradiated uranium fuel elements by chemical techniques, when fuel elementsburst into flames and discharged large quantities of fission products into theenvironment [18].The infant mortality changes were greater in North Dakota than in dry Idaho
and Montana, just as they were greater in Arkansas and Louisiana comparedwith dry Texas closer to the test site in New Mexico. This fits the well knownfact that 90 per cent of the fine tropospheric fallout comes down with the rain,since the line of heavy rainfalls passes down through the center of the UnitedStates just to the west of the Mississippi from North Dakota in the north toeastern Texas in the south.
This interpretation is further confirmed by a more detailed analysis of infantmortality changes in the counties near the Hanford plant before and after itwent into operation between 1943 and 1945. As can be seen from the bar graphin Figure 14, the counties containing the plant as well as those immediatelyadjacent to the east and south showed sharp rises in infant mortality up to150 per cent, while the more distant control counties, namely those in whichwater sampling stations were subsequently established, either rose less thanten per cent or actually declined between 1943 and 1945.
7. Infant mortality near boiling water reactors
A similar pattern of increased infant mortality has now been observed aroundthree commercial nuclear power reactors of the Boiling Water type (BWR),in which the single coolant loop design does not permit as tight a containmentof fission products leaking out of corroded fuel elements as in the naval sub-marine type Pressurized Water Reactor (PWR).As described in recent publications of the Bureau of Radiological Health [19],
these reactors have emitted as much as 800,000 curies of fission and neutronactivation products in the form of gases per year [20], compared with as littleas 0.001 curie per year for the prototype Pressurized Water Reactor at Ship-pingport, Pennsylvania.The first of the BWR's studied is the Dresden Reactor located near Morris,
Illinois in Grundy County, some 50 miles southwest of Chicago. Since close totwo-thirds of the population of Illinois lives within a radius of some 60 milesfrom this reactor, one might expect to find detectable changes in infant mor-tality for Illinois as a whole relative to other nearby states that correlate withthe rises and declines of emission when fuel elements'are changed.That this appears in fact to have taken place is illustrated by the plot of
infant mortality for Illinois compared with Ohio some 200 miles to the east forthe period 1959 to 1968 in Figure 15. It is seen that while during the time ofNevada testing, Ohio and Illinois showed the same infant mortality, within
164 SIXTH BERKELEY SYMPOSIUM: STERNGLASS
250 -
o~~~~
00,
200 0~~~
_ i5I 00~~~
S o o ~~o O o
FIGURE 15K) 0
~~I00~ - - _ _
w 0 4~w
50 z4~~so -~~J4: 4
K)
'3 z -J2
U- 0 0 0
ix 0 0 o 0 0IL 0 0
100w
wU) 2 zZ
_ _ 0
50 wOX CDOx o m 4c
14 z44 Z- c0 4
Percentchangeininfantmortality between 1943 and 1945 near the Hanford Reac-tor in the state of Washington before and after onset of operations in 1944. Con-trol counties are those where water sampling stations were placed. (Based on data
from [39].)

ENVIRONMENTAL RADIATION 165
~26.0NVADA TESTS F
a /9s LAST H-TESTSW A z
0
0t 24.0-
a2. ILLINOISw
I.-
YAR
22.0
0
z'a. ~~~~~~~~~OHIO
20.0
DRESDENK ~GASEOUSEMI SSION
zw
0~~0
1955 "60 "65 #70YEAR
FIGURE 15
Infant mortality in Illinois compared with Ohio for the period 1955 to 1968.Also shown are the annual releases of gaseous activity from the Dresden Reactor
[39].

166 SIXTH BERKELEY SYMPOSIUM: STERNGLASS
a few years after the end of testing, Ohio began a steady decline, whereasIllinois showed a peak highly correlated with the peak of gaseous emissionsbetween 1964 and 1967 (see Table II).
TABLE II
INFANT MORTALITY IN OMO AND ILLINOIS FOR THE PERIOD 1955-1968 BEFORE AND AFTERONSET OF GAs EMISSIONS FROM THE DRESDEN REACTOR IN 1961
Ohio Illinois
Inf. mort. Inf. mort.Live Infant rate/1000 Live Infant rate/1000 Curies of
Year births deaths live births births deaths live births gas emissions
1955 222,689 5530 24.8 217,041 5466 24.8 -1956 234,517 5785 24.7 229,760 5639 24.5 -1957 243,470 6008 24.7 238,734 6080 25.5 -1958 234,040 5940 25.4 234,980 5859 24.9 -1959 232,578 5799 24.9 240,208 6008 25.0 -1960 230,219 5524 24.0 238,928 5928 25.0 -1961 229,708 5298 23.1 237,382 5771 24.3 34,8001962 217,465 4954 22.8 230,878 5538 24.0 284,0001963 212,583 4938 23.2 225,062 5383 23.9 71,6001964 209,480 4614 22.0 222,248 5585 25.2 521,0001965 194,927 4346 22.3 208,188 5340 25.7 610,0001966 190,444 4066 21.4 201,442 5066 25.4 736,0001967 185,204 3824 20.6 193,745 4622 23.6 260,0001968 185,580 3769 20.3 193,520 4536 23.5 240,000
The degree of correlation may be judged from Figure 16 where the differencein infant mortality rates between Illinois and Ohio has been plotted againstthe annual gaseous discharges. The correlation coefficient is 0.865, and thet test of significance gives t = 4.565, which for the seven degrees of freedomgives P << 0.01.As in the case of Hanford it is of interest to see whether the effect can also be
detected in the nearby states to the east, the direction in which the prevailingwinds and weather patterns move. As seen in Figure 17, the infant mortalityrate for nearby Indiana does indeed fall exactly between that for Illinois andOhio on the other side of Indiana after the testing in Nevada ended and thedischarges from the Dresden reactor produced significant external doses,comparable with those from distant tests (see Table III).
Likewise in Michigan, just to the north of Indiana, infant mortality beganto fall consistently between Illinois and more distant Ohio when the generaldecline began after the end of nuclear testing in 1963 (see Figure 18 and TableIII).One would also expect on the basis of this hypothesis that a state far to the
northwest of Illinois and therefore upwind would show an even more rapiddecline after fallout from weapons testing decreased. That this is in fact the

ENVIRONMENTAL RADIATION 167
20
'66
15 I'68 6
F-/cc '64
4
Li.Z 10 /
U) Iw
/ 67
I-6 +'62
'a~ ~~6
O 4,'9 I I I I I I0 200 400 600
C- KILOCURIES OF GASEOUS ACTIVITYFIGURE 16
Correlation plot for the excess infant mortality in Illinois relative to Ohio vs.the annual average quantities of gaseous activity released from the Dresden
Reactor. (1959-1968; no data for 1960.) Least square fitted line shown.
case is seen for the case of North Dakota compared with Illinois in Figure 19(see Table III).The rates for Illinois and North Dakota seem to have been identical during
the period of heavy Nevada testing and plutonium production at Hanford priorto 1964, despite the great difference in ordinary air pollution and socioeconomiccharacter of the two states. But after the end of nuclear testing by the U.S.

168 SIXTH BERKELEY SYMPOSIUM: STERNGLASS
X 26.0 NEVADA TESTSx
LAST H-TESTS v X
8 .p LNILLNIw
a-w
22.0
:i 20.0t INDIANA
0
z OHI
E 20.0
K1 6 D DRESDENGASEOUS
0.5 EMISSION
ow 4
1955 '160 "65 870YEAR
FIGURE 17
Infant mortality for Indiana compared with Illinois and Ohio [39].

ENVIRONMENTAL RADIATION 169
TABLE III
INFANT MORTALITY RATES/1000 LivE BIRTHS
Infant mortality rates for five states in the northern U.S. upwind and downwind from Illinoisbefore and after onset of Dresden emissions in 1961.Source: [39].
Year Illinois Indiana Michigan Ohio North Dakota
1955 24.8 25.0 24.9 24.8 25.11956 24.5 24.3 24.5 24.7 24.81957 25.5 23.8 24.4 24.7 25.71958 24.9 24.6 24.6 25.3 24.91959 25.0 23.4 24.4 25.0 23.71960 25.0 23.9 24.1 24.0 24.81961 24.3 24.0 23.9 23.1 23.21962 24.0 23.2 24.0 22.8 22.61963 23.9 23.4 23.2 23.2 24.61964 25.1 23.8 23.0 22.0 23.11965 25.6 23.5 23.6 22.3 21.21966 25.1 22.8 22.5 21.3 20.81967 23.6 22.3 22.0 20.7 21.01968 23.1 22.2 21.8 20.0 17.7
Population 1960Illinois Indiana Michigan Ohio North Dakota
10,081,000 4,662,000 7,823,000 9,706,000 632,000
and U.S.S.R., North Dakota declined rapidly from nearly 25 per 1000 birthsto under 18 per 1000 by 1968, despite the well known lack of sufficient medicalcare in rural areas such as North Dakota.This suggests that although ordinary air pollution is undoubtedly detrimental
to health, the radioactivity released by nuclear testing and nuclear plants appearsto be significantly more serious in its effects on the early development of theembryo and infant.
In order to further test this hypothesis, the changes in infant mortality inthe six counties immediately adjacent to the Dresden plant for the years fol-lowing the sharpest rise in emission were compared with the changes in sixcontrol counties more than 40 miles to the west, Figure 20. They were chosento be as far away as possible in northern Illinois, not bordering either on theIllinois or Mississippi Rivers that are known to be polluted by radioactivewastes (see Table IV).The result of this test for 1966 relative to 1964 is shown in Figure 21. Again,
the same general pattern is observed as for the Hanford Reactors, the nearbycounties showing much greater rises than the more distant control counties ofsimilar rural character and comparable medical care.In the case of the Dresden reactor, it is possible to carry out a still more
crucial test of the biological mechanism that may be involved in bringing

170 SIXTH BERKELEY SYMPOSIUM: STERNGLASS
,_26.0OHIO LAST N-TE TS
p24.0
> ILL. X-;WN. ILINOI0.
w
WI. AA S
YAA
7i22.0/AMICHIGAN
z
z~~~~~~~~~AOHIO20.01
~0.5 BIG ROCK POINTGDRESDEN (MICH.Infant motliyfoicirzw0.
ow I(A .J 5-
4 4~~~~~2ow U
0 1960 '65 070YEAR
FIGURE 18
Infant mortality for Michigan compared with Illinois and Ohio [39].

ENVIRONMENTAL RADIATION 171
26.0 rVATASTS FtSLAST H-TESTS/
xILLINOIS
w X
002 22.0 -
w0l.
w
i.20.04
0
z4ZL 18.0z
N.-D.
16.0 I I
1955 60 Y65E70
FIGURE 19Infant mortality in North Dakota compared with Illinois [39].

WISCONSIN
\w ..I XLAKEJODAVIES$ STEPHENSOKWNNEAS, MCHENNY LAKE NiOHIBAN
C
FIGU E20 L m
DRES "P^" [ CDENR EACTOR(ILLINOS) J),Xz "^
FIGEURE2
Changes in infant mortality in six counties surrounding the Dresden Reactor compared withsix control counties to the west following by one year the period of maximum rise in gaseous
emissions (1963-1965).
Per cent Pop.change est.
1964 Rate 1966 Rate in rates JulyDeaths births 1000 Deaths births 1000 1964-66 1964
-9
Grundy (Reactor) 7 442 15.8 18 474 38.0 +141 23,500;: Livingston (S) 6 728 8.2 12 608 19.7 +140 41,2008 Kankakee (SE) 41 1976 20.7 54 1830 29.5 + 43 98,500,-Will (NE) 109 4920 22.2 100 4294 23.3 + 5 214,000
¢. LaSalle (W) 49 2176 22.5 39 1858 21.0 - 7 112,600Kendall (N) 11 460 23.9 7 422 16.6 - 31 20,000
Avg. + 48
Ogle (NW) 16 854 18.7 20 808 24.8 + 33 39,700- Winnebago (NW) 122 5002 24.4 122 4788 25.5 + 5 234,000o Henry (W) 17 930 18.3 16 862 18.6 + 2 50,000= Stephenson (NW) 25 978 25.6 20 808 24.8 - 3 47,000Q Knox (SW) 22 1130 19.5 17 946 18.0 - 8 63,700
Lee (W) 17 658 25.8 9 594 15.2 - 41 39,500Avg.- 2
172

ENVIRONMENTAL RADIATION 173
ADJACENT COUNTIES250
200
150
100-
hI0 w b.~- U) _
tq 50 0 _ -jw I- w z w .
zI-gCOTCO COUNTIES V
4~~~~~~
w x~~~~~z~~~~~
FIGURE 21
Per cent change in infant mortality in the six counties surrounding the DresdenReactor (<30 miles distant) between 1964 and 1966 compared with the changesin six control counties to the west, following the rise in activity released from
71,600 curies in 1963 to 610,000 curies in 1965 [39].
174 SIXTH BERKELEY SYMPOSIUM: STERNGLASS
about such a large effect for relatively small measured external doses, whicheven in the year of peak release (1966) did not exceed 70-80 mr at the plantboundary when the available measurements of 15-25 mr per year for 1967-68are used to calculate the dose.As discussed briefly above and elsewhere [21], the most serious effect is likely
to be an indirect one, whereby the radiation acts on the key biochemical proc-esses in such crucial glands controlling metabolism and growth as the pituitaryand thyroid glands. Such action could lead to a small decrease in weight at birth,or to a greater frequency of prematurity, such as has in fact been observed inanimal experiments and since the early 1950's, among infants born in theUnited States [22].Such immaturity at birth results in a reduced ability to fight off infections
and to a greater likelihood that a critical chemical or surfactant needed forproper functioning of the lung is missing, leading to respiratory distress andatelectasis [23] so that one would expect a higher mortality in early postnatallife.To test this hypothesis, one can compare the changes in the fraction of all
births that are classified as "premature" or under 2,500 grams for GrundyCounty as compared with the changes in the control counties to the west. Ifimmature birth is indeed the principal mechanism leading to excessive infantdeaths, one would then expect to find a greater rise in the fraction of such birthsduring the period of peak emission in Grundy than in the distant controlcounties.That this is indeed the case may be seen in the plot of Figure 22. A peak in
the incidence of premature births of close to 140 per cent is seen to have occurredin coincidence with the peak of gaseous emission, declining again as the emis-sions declined, while the control counties showed no such rise. For Grundy,the increase was from 3.60 to 8.70 per cent of all births (Table V).
Thus, both radioactive releases from nuclear facilities and nuclear detona-tions seem to produce similar changes in the infant mortality through theindirect biochemical action of fallout on the crucial hormone producing organsof the mother and the fetus, leading to a lowered resistance to the environmentalstress most critical shortly after birth.
Identical patterns of rises in infant mortality have now been found for twoother Boiling Water Reactors, as shown in Figure 23 for the group of ten smallcounties 0-40 miles around the Big Rock Point Plant in Michigan and in Figure24 for the Humboldt Reactor near Eureka in Humboldt County, NorthernCalifornia [19]. Again there is a sharp halt in the normal decline of infant mor-tality from its peak during the 1961-62 test series following release of largequantities of gaseous activity comparable to those released at the DresdenReactor, while more distant areas continue their decline, as shown for the Stateof Michigan as a whole between 1965 and 67 (see Figure 18 and Table III).

ENVIRONMENTAL RADIATION 175
160
140 - X
GRUNDYcn 120 ( DRESDEN)j
REACTOR )
I-I,,100 _ /Xw
I-I(, 80 _
x
z
LU 600 z~~~~~Z 0
x~~~~~~FE
gr 40 - t sxuO
w hiC-~~~~LUI
-20 l l l
1964 '65 '66 167 '68YEAR
FIGURE 22Per cent change in the fraction of births under 2500 grams for Grundy County
and the six control counties to the west [40].

176 SIXTH BERKELEY SYMPOSIUM: STERNGLASS
TABLE V
DRESDEN REACTOR AREA
Changes in the fraction of "premature" or underweight births in the county containing theDresden Reactor (Grundy) compared with the control counties more than 40 miles to the west.
Source: [40].
Counties Live Births by Years1964 1965 1966 1967 1968
Henry 947 915 862 892 798Knox 1114 1002 946 895 901Lee 665 606 594 612 610Ogle 861 798 808 745 764Stephenson 974 889 808 793 841Winnebago 5004 4780 4788 4794 4324
Grundy 445 426 474 457 460
Counties Premature Births less than 2500 Grams by Years.1964 1965 1966 1967 1968
Henry 52 57 49 65 53Knox 84 68 78 56 66Lee 46 28 30 41 37Ogle 51 40 53 46 54Stephenson 55 70 59 41 59Winnebago 355 342 353 324 336
Grundy 16 27 42 33 23
Counties Premature Birth Rate/100 Live Births (under 2500 grams)1964 1965 1966 1967 1968
Henry 5.5 6.2 5.7 7.3 6.6Knox 7.5 6.8 8.2 6.3 7.3Lee 6.9 4.6 5.1 6.7 6.1Ogle 5.9 5.0 6.6 6.2 7.1Stephenson 5.7 7.9 7.3 5.2 7.0Winnebago 7.1 7.2 7.4 6.8 7.7
Grundy 3.6 6.3 8.7 7.2 5.0
8. Infant mortality and nuclear fuel processing facilities
As described elsewhere in greater detail [24], the same pattern occurred alsofor the commercial fuel reprocessing plant operated by the Nuclear Fuel ServicesCompany in West-Valley, N.Y. after it went into operation in April of 1966[25]. Figure 27 shows that the counties of western New York within a 30-50mile radius rose sharply in infant mortality the following year, while the moredistant counties declined as did New York State as a whole. Like HumboldtCounty, the nearby areas had shown a peak near the height of weapons testing,then began to decline only to reverse this trend sharply after the onset of largeradioactive waste releases.

30
- 28 \
000
260X v\TEN
w\ ADJACENTgF 24 COUNTIESCt x (O-40 MILES)
- 22
4
o 20
zLL. 1z
16
ct 1000 o011O0 RADIOACTIVE
W. ~~~~~~~~~~GASRELEASE
= 500 (BIG ROCK POINT)
sc O 1962 '63 '64 '65 '66 '87 '68YEAR
FIGURE 23Infant mortality rate per 1000 live births for a group of ten counties within aradius of about 40 miles of the Big Rock Point Nuclear Plant in Charlevoix,Michigan, together with the yearly gaseous activity released. The total number
of deaths in these counties was 45 in 1966.177

30
L HUMBO LDTTCOUNTY
cn
F 225
0~~~~~~~x
w 20X-
oL x
0.816 [3] eessfo heHmod eco nresdfo 95cre
x~~~
1- 41I-z
NH -TESTS LAST U.S.-USSR HUMBOLDT REACTOR RELEASES, H -TESTS , , , I
1960 1965 1970YEAR
FiGURE 24
Infant mortality rate per 1000 live births in Humboldt County, Califomnia,1958-1969 L39]. Releases from the Humboldt Reactor increased from 5975 curiesgaseous waste in 1964 to 197,000 curies in 1965. Further rises took place in1967-1968. Liquid waste discharges rose steadily to a peak of 3.2 curies in 1968,corresponding to 19.7 per cent of the permissible limit. Note the peaks corre-
sponding to the 1961-62 nuclear tests, and the steadydecline of California as a whole after 1961.
178

ENVIRONMENTAL RADIATION 179
DEL L OREGON BORDER _
NORTE
SISKIYOU
CALIFORNRNITIAHST
EACTOR~ ~ ~ ~ ~ SARMET
/ HUMBOLDT
TEHAMAf
2F 2
MILES \A
\ > $~~~~~ACRAMENTOk ONOMA
FIGURE 25Map of northern California showing location of Humboldt Reactor and thecounties along the Pacific Coast as well as in the dry area to the east of the
coastal mountains.

180 SIXTH BERKELEY SYMPOSIUM: STERNGLASS
0I-wo
_J I 0 * U0020. U)E .i
(fl c 0I 2 '
z~~~40~
LI +50 -
U)2
_ 0
FROM S,9 I URIE I 1964+40 -- Sa: 00 0 0 00 a) 0 - - - - -
~~~ +30 ~ ~ -. 00 0 o 0+230 -- - t Ci tw 00~~~~~~z~~~~~~
595t 9,00cre.Ol Humold an De ot ontmeitl
z C
z-0
o -20 -
z
Z-30
~-40u -5LI NOTE:0. ~~GASEOUS EMISSIONS ROSE
FROM 5,975 CURIES IN 1964TC 197,000 CURIES IN 1965
FiGuREF 26
Per cent changes in infant mxortality rates for the counties surrounding theHumboldt Reactor between, 1964 and 1965, when gaseous releases rose from5975 to 197,000 curies. Only Humboldt and Del Norte County immediatelyadjacent along the Pacific Coast showed significant rises greater than ten percent. All other counties either remained constant or declined, especially thoseseparated from Humboldt by the coastal mountain ranges such as Trinity,Shasta, Tehama and Glenn to the east and southeast. (Based on data from [39].)

ENVIRONMENTAL RADIATION 181
t14On
03 0~~~~~~~~~~~~.- *1
0~~~~
0 0~~~~~~~~~~~~~~o 0 4~~~~~~~~~w'a 0 C
V 0 US~~~~~~~~~~~~0Urn
eI'-~~~~~~~~~~~, 6
I~~~~~~~~~ m:
0 w~~~~~~~~~~0
to1 o zco+ C
0,4%toU)0 a ~ ~ ~ ~ IaIne>- <q~QQ~

30
GENESSEECOUNTY
0O N.Y. STAT E2 25a:C-
20 '
20
z I
'5 U
LAST H-TEST N.F.S. PLANTSERIES GAS DISCHARGE
1
~~1960 '65 '70YEAR
FIGURE 28
Infant mortality rates between 1960 and 1967 for a typical county in westernNew York State within 40 miles of the Nuclear Fuels Services Plant in Catta-raugus County. Note sharp rise above the rate for New York State as a whole
when plant releases started in early 1966.182

ENVIRONMENTAL RADIATION 183
A typical case is Genessee County, N.Y., shown in Figure 28, where infantmortality rates began to exceed those of the rest of the state only after onsetof plant operation. A similar time history was observed for Warren and VenangoCounties downstream along the Allegheny River some of whose tributariescome within a few miles of the plant in Cattaraugus County.
9. Infant mortality near Gas Cooled Reactor
That even the relatively smaller radioactive gas releases from a Gas CooledNuclear Reactor appear to be capable of producing detectable rises in infantmortality is shown for the case of the Peach Bottom Reactor located on theSusquehanna River in York County, Pennsylvania. Figure 29 again shows thetypical drop in infant mortality after cessation of atmospheric tests for the twocounties on either side of the plant, namely York and Lancaster and the agricul-turally similar control county, Lebanon, 30 to 50 miles to the north. The declinecontinued until the onset of a large increase in emissions resulting from fuelfailure that started in 1968 and reached 109 curies in 1968 [19]. After 1967 Yorkand Lancaster reversed their trend, while the more distant control countymerely slowed its rate of decline.Part of the reason why even the small releases from the Peach Bottom Re-
actor could have had such a strong effect seems to lie in the fact that the sur-rounding area is a major dairy farming region, where such biologically importantbut relatively short lived rare gas daughter products as cesium 138 and strontium89 known to be produced in large amounts from the escaping xenon 138 andkrypton 89 [19] can rapidly enter the body through the locally produced milkand other dairy products. Thus, the number of curies released able to produceserious biological effects can be much smaller than from a fuel processing plantdischarging mainly Kr 85 that has no radioactive daughter product.
10. Nuclear air pollution and respiratory disease mortality
But the potential damage is not merely confined to the newborn and youngchild. There is evidence that suggests that the many radioactive gases presentlyreleased from nuclear reactors and nuclear tests may have a serious effect onthe incidence of chronic diseases of the respiratory system such as bronchitisand emphysema that equal or even exceed the effects of conventional chemicalair pollutants.
This is more strikingly shown in Figure 30, which shows the number of deathsdue to respiratory diseases other than influenza and pneumonia per 100,000population in New Mexico and New York State between 1942 and 1966.
It is clear that between 1945 and 1950, there was a sharp rise of deaths dueto noninfectious respiratory diseases such that the incidence of these diseasespreviously very low in the pollution free air of New Mexico, exceeded the death

184 SIXTH BERKELEY SYMPOSIUM: STERNGLASS
26 -
co 24 -
00
~20w
4 /
LV i ~~~~~~XV X LANCASTER
0 14
z , LEBANON
4l2 Il >30 mi. NORTH
to _RIRELEASES -PEACH BOTTOM
1962 '64 '66 '68 '70YEAR
FIGURE 29Infant mortality rates for the area near the Peach Bottom Reactor, York County,Pennsylvania, before and after onset of significant releases of gaseous activityin 1967-1968, compared with rates in nearby Lancaster, directly adjacent tothe east of the reactor, and Lebanon, more than 30 miles to the north of Lan-caster. Releases were 0.00126 curies in 1966, 7.76 curies in 1967, 109 curies in
1968 and 100 curies in 1969.

100-"§-|
80
60
w 40
w
O ,NEW MEXICO
I20 -
W 6k }DINtvXxx 'x 1xNEW OIR~2
0. .
0 '5'0(0.100
-8~~~~~~~~~8
0. 6w
4 ~~~~X.X4
4
0
2
1940 '45 '50 855 860 G65 '70YEAR
FIGURE 30
Mortality rate due to respiratory diseases other than pneumonia and influenzaper 100,000 population for New York and New Mexico between 1941 and 1965.
These diseases are principally emphysema, bronchitis and asthma.185

186 SIXTH BERKELEY SYMPOSIUM: STERNGLASS
rate for the same diseases in heavily polluted New York by as much as a factorof two.That this is not an isolated case perhaps associated with a sudden influx of
older people into New Mexico after 1950 follows from Figure 31 where similardata on deaths due to respiratory diseases have been plotted for Wyoming andIllinois. Again, there is the dramatic rise of chronic obstructive lung diseasedeaths in a state of almost no ordinary air pollution such as Wyoming to levelswell above the death rates in heavily industrialized and polluted Illinois. Anda similar situation exists for Wyoming relative to heavily polluted Pennsyl-vania, where respiratory death rates in 1944 were five times higher than inWyoming before nuclear testing began, while in recent years the rate in Wyomingbegan to exceed that in Pennsylvania, despite the fact that the chemical pollu-tion is much lower in Wyoming.Such an apparently strong effect of radioactivity in the dry air of the west
central part of the U.S., fits the observed high beta-radiation activity in thedusty areas of the western states relative to that in the high rainfall areas eastof the Mississippi, where the activity sinks into the soil to give lower air con-centrations but higher strontium 90 levels in the milk [26].That the operation of Boiling Water Nuclear reactors with their discharge
of large quantities of radioactive gases appears to have had a more serious effecton the rate of noninfectious respiratory disease than the operation of fossil fuelplants may also be inferred from Figure 31.
In the decade 1949 to 1959, prior to the start of Dresden releases, the mor-tality rate for these diseases rose only some 10 per cent despite a 100 per centincrease in power generated. But in the years following onset of Dresden opera-tions, the rate of rise increased almost ten-fold, exceeding that of either NewYork or Pennsylvania. And since the onset of Dresden emissions, respiratorydiseases and bronchitis as a cause of death in infants over 28 days in Illinoisshowed the sharpest rise among all causes of death [27].
Laboratory evidence that inhaled fission products such as the rare-earthisotopes can in fact produce chronic obstructive lung disease in animals suchas fibroadenomas, severe chronic inflammatory changes and added susceptibilityto infectious lung diseases, has recently been reported by H. L. Berke andD. Deitch [28].That especially the newborn infant between 0 and 28 days old seems to be
affected by fission products acting on the lung may be seen from a plot of therate of respiratory disease deaths among infants in the U.S. other than pneu-monia and influenza shown in [8].This rate rose suddenly by a factor of ten between 1949 and 1957, the
time of onset of heavy atmospheric testing, declining again after the end ofatmospheric testing in Nevada in 1958.That the rate of increase of respiratory cancer was also affected by the sharp
rise in atmospheric radioactivity from nuclear testing is indicated in Figure 32,where the relative changes in lung cancer rates per 100,000 population have

ENVIRONMENTAL RADIATION 187
100
80
60'-
4 4 TDAfETSF30I
x x} X*XoWYOMINGENIWETOK xIX
IL 20 | X |0
X ~ ~ ~ ~ ~
0 4 %'0
%I0 K
I-B4 - t
0
x
1940 '45 '50 855 "60 '65 '70YEAR
FIGURE 31
Mortality rate per 100,000 population for respiratory diseases other than pneu-monia and influenza for Wyoming and Illinois. Note also sharp rise in Illinois
after onset of Dresden operation in 1959.

188 SIXTH BERKELEY SYMPOSIUM: STERNGLASS
400 -
A NEW MEXICOw-j
> I X WYOMING300_i
o3OO I' I
200 - \A ILIN1
z 100It, | 4 - 1 3'-4AV
w~~~~~~~
N. Al/ (7
0.
(z 100 #..D* 1946-49 AVG.
'I r-~~::----:~A REL. RATEX H-TESTS
z
I.M (PERIOD )PACIFIC d t t t
NEVADTEST r4 7I NIEVADA TESTS, ,,, ,
1946 '50 '60 '70YEARFIGURE 32
Relative changes in the rates of respiratory cancers per 100,000 population inUtah, Illinois, Wyoming and New Mexico, 1946-1966. Also shown are the
principal atmospheric weapons test [39]. (1946-49 average rate = 100).

ENVIRONMENTAL RADIATION 189
been plotted for Illinois and three dry western mountain states between 1946and 1966. Using the average rate for 1946 to 1949 as reference rate equal to 100,rises in cancer rates for the lung, trachia and bronchus started to rise sharplysome five to nine years after the first nuclear detonation in New Mexico. Thegreatest relative rise took place in New Mexico, followed by Wyoming, whichshowed its greatest rise some seven years after onset of Nevada testing.
Illinois, despite its heavy air pollution presumably acting synergistically withthe radioactivity in the air rose about half as much as Wyoming and New Mexicoby 1966 relative to 1946-49, while Utah, with its lower air pollution, neverthelessapproached Illinois in its relative rise some seven to eight years after the peakof atmospheric testing in nearby Nevada. The observed lag of about seven yearsis consistent with the observed latency period of five to ten years for the uraniumminers who developed lung cancer.
11. Infant mortality changes near a Pressurized Water Reactor (PWR)
In view of the proposed large increase in the amount of nuclear generatingfacilities to be installed near large metropolitan areas such as New York City,it seemed desirable to carry out a study of possible health effects on childrenin the greater New York Metropolitan Area from tbe releases of nuclear facilitiesthat have been operating in this region for the past ten to fifteen years.The most important sources of radioactive effluent close to the New York
Metropolitan Area have been the Indian Point Pressurized Water Reactorlocated in Westchester County along the Hudson River some 20 miles north ofNew York City, and the Gas Cooled Nuclear Reactor at the Brookhaven Na-tional Laboratory near Upton, Suffolk County, Long Island 50 miles east ofManhattan.The study was based on the available data for infant mortality rates for all
the counties of New York State within a radius of 100 miles of New York Cityas published in the Annual Vital Statistics Reports of the New York StateDepartment of Health [32]. Information on the releases from the Indian PointUnit number 1 were obtained from a report of the U.S. Department of Health,Education and Welfare [19], as well as official AEC summaries of reactor re-leases [33]. It is important to note that the releases of radioactive gases andliquids, with the exception of tritium, were much higher from the Indian PointReactor than from Naval-type Pressurized Water Reactors such as Shipping-port [19]. Figures on releases of wastes from the Brookhaven National Labora-tory as well as on external radiation doses produced by gaseous releases andfallout were obtained from a report by A. P. Hull [34], using the average weeklydose rates at monitoring stations at the northeastern edge of the laboratorygrounds and 4.8 miles away to the north.The basic data on releases taken from these sources is reproduced in Tables
VI and VII.

190 SIXTH BERKELEY SYMPOSIUM: STERNGLASS
TABLE VI
RADIOACTIVE WAsTE DISCHARGES FROM INDIAN POINT UNIT No. 1
Radioactive waste discharges from the Indian Point Pressurized Water Reactor, Unit No. 1.Note the large drop in liquid waste discharges expressed in per cent of permissible levels sub-
sequent to the replacement of the original core in 1966.
Taken from U.S. Public Health Service Report BRH/DER 70-2 (March 1970).The 1969 data are taken from A.E.C. Report,
testimony of Commissioner J. T. Ramey, Pa. Senate, Oct., 1970.The last three entries for 1 year average are
based on radionuclide analysis.N.R. means not reported. Note that
new fuel core installed in 1966.
Liquid waste-grossGaseous waste Tritium in Liquid waste , and -y as % of
noble and act. gases liquid waste gross , and -y permissible limit
Year Curies Curies Curies 1 yr. av. 2 yr. av.1963 0.0072 N.R. 0.164 0.26 0.241964 13.2 N.R. 13.0 22.0 11.131965 33.1 N.R. 26.3 43.0 32.501966 36.4 125 43.7 70.1 56.501967 23.4 297 28.0 1.55 35.801968 59.7 787 34.6 1.65 1.601969 600 1100 28.0 1.50 1.58
In order to account for other factors known to affect infant mortality suchas socioeconomic, medical care, diet, drugs, pesticides, climate, air pollu-tion, infectious diseases, fallout and various unknown factors that might influ-ence the changes in infant mortality besides low level radiation from plantreleases, all mortality changes in the counties near the plant were comparedwith neighboring counties of similar socioeconomic character having no largesources of radioactive effluent.Thus, Westchester and Rockland may be compared most closely with Nassau
County, Long Island, since it has a similar total population of close to onemillion, similar suburban character, and closely similar fallout levels as wellas similar socioeconomic characteristics.
Furthermore, as shown in the map of lower New York State (Figure 33),it is possible to use progressively more distant counties of New York Statestretching in the form of a sector towards the northwest and north as controlcounties.
In order to correct for the fact that these counties further to the north havea more rural character than Westchester and therefore different socioeconomicsituations, medical care and air pollution, one can normalize the infant mor-tality rates in a suitable fashion and then examine the per cent changes follow-ing the onset of emissions. Since a given small dose of radiation is expected tohave closely the same relative effect on mortality changes regardless of the

ENVIRONMENTAL RADIATION 191
TABLE VII
EXTERNAL BACKGROUND RADIATION DOSE RATES AND WASTE DISCHARGESAT BROOKHAVEN NATIONAL LABORATORIES (BNL)
Based on data by A. P. Hull [34].The dose/year of BNL release is the difference between dose
measured at Northeast Perimeter Station and station 4.8 miles north.The total dose and the fallout dose are measured at 4.8 milesnorth of BNL perimeter; the dose measures in 1952 are from
station 3.5 miles south of BNL perimeter.The year 1951 has lowest background rate at station 4.8 milesnorth of BNL perimeter, taken as normal background rateprior to major weapons testing and releases from BNL.
Liquid waste Liquid wasteDose/yr. input to BNL released from
Total Fallout dose BNL release filter bed BNL filter bedYear mr/wk mr/wk. mr/yr. mr/yr mCi/yr mCi/yr.
1949 1.80 0.21 10.9 - - -1950 1.74 0.15 7.8 - - -1951 1.59 0.00 0.0 5.2 160.5 21.51952 - 0.03 1.5 3.6 116.6 27.91953 1.73 0.14 7.3 3.1 132.9 35.81954 1.66 0.07 3.7 5.2 182.1 48.51955 1.70 0.11 5.7 13.5 223.8 75.01956 1.79 0.20 10.4 7.8 170.0 55.01957 1.89 0.30 15.6 10.4 300.8 105.11958 2.23 0.64 33.2 20.8 325.1 106.01959 2.58 0.99 51.5 6.8 586.6 169.51960 1.88 0.29 15.1 3.6 542.9 177.81961 1.73 0.14 7.3 7.3 384.4 219.11962 2.41 0.82 42.8 5.2 128.9 135.91963 3.05 1.46 76.0 29.6 127.5 99.41964 2.65 1.06 55.2 28.6 89.0 76.41965 2.07 0.48 25.0 15.6 66.8 41.81966 1.77 0.18 9.4 12.0 85.1 37.21967 1.73 0.14 7.3 4.7 81.2 47.91968 1.70 0.11 5.7 2.6 21.5 16.21969 1.65 0.06 3.1 0
absolute rate, this technique allows one to detect changes in time as well aschanges with distance from the source despite such differences as medical careand economic level.The counties with smaller population can then be conveniently grouped into
larger units with approximately the same distance from the point of release ofthe effluent.The simplest and most direct test is to plot the pattern of mortality among
infants born live and 0-1 year at death per 1000 live births for the two countiesimmediately surrounding the Indian Point Reactor and compare it with thetime history in Nassau County 30 to 50 miles away (see Figure 34).As can be seen from an inspection of Figure [34], for a period of six years

192 SIXTH BERKELEY SYMPOSIUM: STERNGLASS
1960 POPULAT ION
tRE~ENE /
514S2-72 0 USER OlUTCHESS t \
l t > S~ ~~~~~ESTCHE-T
V \ 6 6 6,7 8~~~~66,74 /
\ \0 t~~~~~130,17t S.N,L.O0 a , YC SUffOLK.'MILES'
FIGURE 33
Map of lower New York State showing the location of the Indian Point Plantin Westchester and the Brookhaven National Laboratory in Suffolk.
Population figures are those for 1960.

ENVIRONMENTAL RADIATION 193
p22 -
a:
Z 17 1 t l * t , Sz~~WSOTCHESTE
o 1 ROCKLAND0~40 020 miles
la-
30 NASS AUT
IA.I
° 195 '60 '6 '64 mi.'87
SOUTH- EAST195 TESTS U.L-U.S.S.R- FRANCE CHINESE
TESTS40
30 ~~~~~~~~~~~LIQUIDWASTE30 ~~~~~~~~~~DISCHARGESw
~20
I0
1958 "60 %62 '64 '66 '68 '0
YEARFIGURE, 34
Infant mortality rates for Westchester and Rockland Counties compared withthe rates for Nassau 1958-1969. Also shown is the liquid radioactive waste
other than tritium released from the Indian Point Plant.

194 SIXTH BERKELEY SYMPOSIUM: STERNGLASS
prior to the onset of large releases from the Indian Point Plant in 1964, theinfant mortality rates for Nassau and Westchester-Rockland were essentiallythe same within the statistical fluctuation of about five per cent or A 1.0 per1000 births that exists for the observed 300 to 500 deaths per year. There wererises apparently associated with the fallout from the large test series in 1958and 1961-62 prior to the onset of large releases of the Indian Point Plant in1964 but the two counties showed exactly the same infant mortality rates of19.1 in 1961, the year of lowest fallout in the air and diet just prior to the re-sumption of atmospheric testing by the U.S.S.R. in the fall of 1961.However, after the releases began from the Indian Point Reactor, while
Nassau infant mortality moved downward as did most areas of the U.S. fol-lowing the end of nuclear testing [6] [7], Westchester and Rockland movedupward and remained high for a period of four successive years. Not until afterthe emissions began to show a tendency to decline following the replacementof the original fuel core in 1966 that had developed serious leaks [19] did West-chester and Rockland infant mortality decline close to where Nassau had moved.
If one now plots the difference in infant mortality between the two countiesnearest the reactor and compares it with the annual releases of liquid radio-active waste in the form of mixed fission products (beta and gamma emittersother than tritium) (Figure 35) expressed as per cent excess over the Nassaurate, one finds a direct linear relationship between excess mortality and theamount of activity as per cent of permissible limit of liquid releases.Applying a least square fitting procedure to the data for the period 1963 to
1969 one obtains a correlation coefficient C = 0.835. A still better fit is obtainedfor the two year average, or C = 0.974. The t test of statistical significancegives t = 9.96 which for the present case of five degrees of freedom givesP < 0.01. Since, as Figure 36 shows, gaseous releases closely followed liquidreleases in magnitude, not only areas bordering the Hudson River but alsoareas exposed to the gaseous releases would be expected to be affected.As an independent check of this result, it is of interest to compare the changes
of infant mortality for the two counties near the reactor with those countiesmore than 40 miles to the north and northwest, namely Columbia, Greene,Sullivan and Ulster, grouped together so as to provide a total population closerto that of Westchester and Rockland.
In order to allow such a comparison despite the more rural character of thesecontrol counties, their infant mortality rate was normalized to equal that forWestchester-Rockland in 1961, the year when Nassau showed the same infantmortality rate as the two counties next to Indian Point. Figure 37 thus showsthe per cent changes relative to the year 1961, again both before and after theemissions began.
It is seen that as in the case of the comparison with Nassau County in Figure34, the control group shows a very similar pattern prior to 1964, but as soon asthe releases occurred, a gap between the nearby and the distant counties beginsto appear amounting to about four standard deviations by 1966. The control

ENVIRONMENTAL RADIATION 195
35 -
30 _
30
~25o 0 1z
U-z
w 10
LIOUID WASTE- % Of PERMISSIBLE LIMIT(2 YR. AVERAGE0)FIGURE 35
Per cent excess infant mortality for Westchester and Rockland Counties relativeto Nassau versus the annual amounts of liquid waste discharged from Indian
Point, expressed in per cent of permissible limit.
counties show a rapid decline in infant mortality while the nearby countiesshow a rise followed by years of failure to decline.Once again, one can examine the correlation between the excess in the infant
mortality of the exposed counties as compared to the more distant controlcounties, as shown in Figure 38. As in the case of the use of Nassau as a control,

196 SIXTH BERKELEY SYMPOSIUM: STERNGLASS
60
U) 502U
, 40z
i 30 _UL.
M) 20-/0a </ COR. COEF. *0.891
10- /
~,0O'w I I , , ,I I0 10 20 30 40 50 60
LIQUID EFFLUENT - CURIESFIGURE 36
Correlation between liquid and gaseous effluent in the form of noble and activa-tion gases from the Indian Point Plant 1963-1968
as reported in the P.H.S. Publication BRH-DER-70-2.
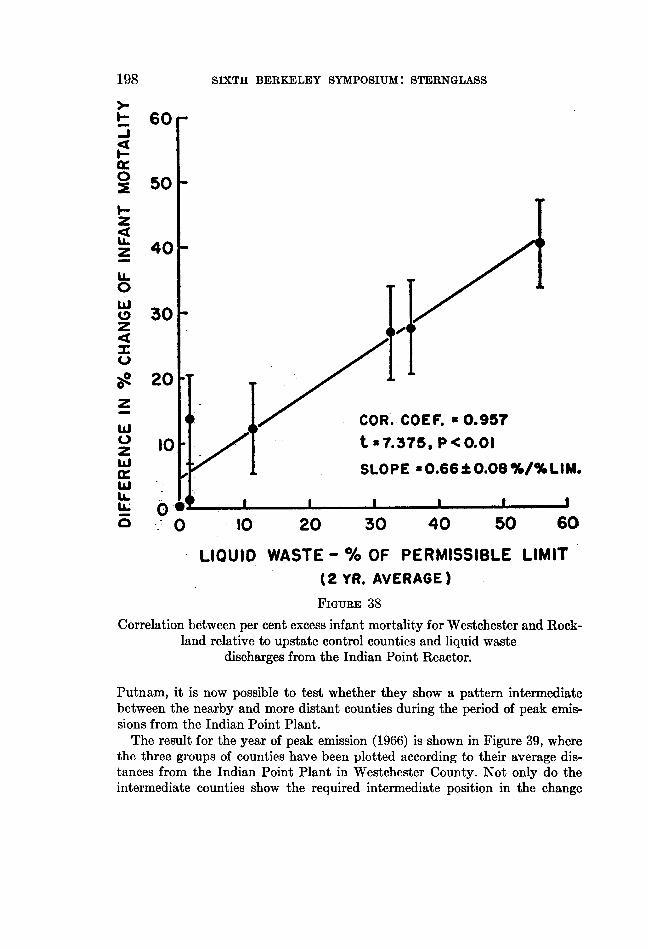
there is a strong, positive correlation between excess mortality and the quantityof radioactive wastes discharged in per cent of permissible limit. The correlationcoefficient is found to be 0.957 and t = 7.37, which for the five degrees of freedomleads again to a small probability P < 0.01 that this association is a pure chanceoccurrence. Furthermore, the amount of change per unit radioactive dischargeis found to be closely the same using this group of controls as when NassauCounty was used, within the accuracy of the data.Using the same normalization procedure for the group of intermediate counties
to the north of Westchester and Rockland, namely Dutchess, Orange and

ENVIRONMENTAL RADIATION 197
w 20 TEST AN
* ~~~~~~~~~~~WESTCHESTER
>- 10 _ ROCKLANDz- 0to20 miles3
z
z
Z UPSTATE N.Y._ Z/C W~~~~~~~~~~COUNTIES
||l -20- ./1 40-80 miles-30 1. 1 1 t WV t Y JNORTH- WEST
FRENCH U.S.S.R1 CHINESE TESTSINDIAN POINT 40DISCHARGES
30
900 1-131 20PiN MILK
-j
350 90a.
* ~~1958 '60 '62 '6 '66 '68 .0
Changes in infant mortality relative to 1961 for Westchester and Rocklandcompared with four upstate control counties 40 to 80 miles north. Also shownare Indian Point liquid releases and iodine 131 in New York City milk in average
monthly concentrations (pCi/liter).
198 SIXTH BERKELEY SYMPOSIUM: STERNGLASS
5-60
2 50
z
z 40U.
0 0 304
O' 20z~~~~FUCOR.ECOE3F. 0.957
ds th0 i 7.375, P <t.0beween L SLOPEunO.66 o.o8%/%LIM.
.0 10 20 30 40 50 60
LIQUID WASTE % OF PERMISSIBLE LIMIT(2 YR. AVERAGE)FIGUREF 38
Correlation between per cent excess infant mortality for Westchester and Rock-land relative to upstate control counties and liquid waste
discharges from the Indian Point Reactor.
Putnam, it is now possible to test whether they show a pattern intermediatebetween the nearby and more distant counties during the period of peak emis-sions from the Indian Point Plant.The result for the year of peak emission (1966) is shown in Figure 39, where
the three groups of counties have been plotted according to their average dis-tances from the Indian Point Plant in Westchester County. Not only do theintermediate counties show the required intermediate position in the change

ENVIRONMENTAL RADIATIONXc9
20 - WESTCHESTERS ROCKLAND
a-. 10 -
0
z4U.zZ -10 - OUTCHESS,ORANGE
42C -20 COLUMBIA ot c1.
30 l W _
0 20 40 60 j80 100 120 140
D- DISTANCE IN MILES.FIGURE 39
Per cent changes in infant mortality by 1966 relative to 1961 for counties atincreasing distances from the Indian Point Plant moving north.
of infant mortality, but the three groups show a dependence on distance con-sistent with an inverse first power law expected for long lived gases diffusingfrom a stack [35].As a further test of the hypothesis that the infant mortality changes are
associated with releases from the Indian Point Plant, one can make the sameplot for Nassau and Suffolk counties to the southeast as shown in Figure 40,and again the pattern of declining mortality fits the hypothesis.
It is of interest to see whether despite its much poorer socioeconomic pattern,air pollution problems and medical care, New York City shows a decline ininfant mortality during the time that Westchester and Rockland showed a riseabove the 1961 level. Using the same normalization procedure, the infant mor-tality for New York City shown in Figure 41 is in fact found to decline after1964, though not as rapidly as the more remote counties to the north and east.Thus, the pattern of infant mortality changes following the onset of radio-activity releases from the Indian Point Plant as shown in the bar-graph ofFigure 42 is consistent with a causal effect of the releases on infant mortality,similar to the effects already noted for seven other nuclear reactors and fuelprocessing facilities.

200 SIXTH BERKELEY SYMPOSIUM: STERNGLASS
20 WEStCHESTER>_ O ROCKLAND
4g- 10 _0 '
I- 0z4%
z -0NASSAUz O1 - r
4 -20 -
:C -_tSUFFOLK
-30 .I
.0 20 40 60 80 100 120 140
D - DISTANCE IN MILESFIGURE 40
Per cent changes in infant mortality by 1966 relative to 1961 for counties atincreasing distances from the Indian Point Plant moving southeast.
Taking either the control counties to the north or to the east as a reference,the excess infant mortality associated with a release of 43.7 curies per year ofmixed fission products in liquid waste and 36.4 curies of noble and activationgases is 41 per cent. For the year 1966, this represents an excess mortality ofapproximately 100 infants 0-1 year old in Westchester and Rockland Countiescombined out of a total of 367 infants that died in their first year of life during1966.For New York City, assuming that the relative changes shown for 1966 in
Figure 42 can be attributed to the plant releases, the excess mortality would beapproximately 26 per cent. This would mean that out of the total of 3,686 infantdeaths in 1966 some 750 probably died as a result of the operation of the IndianPoint Plant. Thus, although New York City is more distant than Westchesterand Rockland, due to its large population, the total number of additional deathsis some seven times larger than for the nearby counties.
12. Effects of low level fallout from nuclear testing in Long Island, N.Y.
These results are so serious that it is essential to apply still further tests in aneffort to see whether the observed association is likely to be of a causal nature.

ENVIRONMENTAL RADIATION 201
>. 20 W STCHESTER-j 6ts < <ROCKLAND
0-20 miles0 10
z
4 I 60_62 '6_'6_68'7
ta. 0zz
"Jm'
zz ~~~~~~~~~~~~20-50 mi.u ~~~~~~~~~SOUTH
9A-20LU.S.-U.S.S.R. CHINESE TESTSTESTS
40 INDIAN POINT
LIQUID WASTEDISCHARGES
30
20
10.
01960 '62 '64 '66 '68 '70oYEARFIGURE 41
Changes in infant mortality for Westchester and Rockland comparedwith New York City relative to the 1961 rates.

.4
20
wZ X
+13% z.
10 _ (A U U Z wZ
FIGUR 42
ZS~~~~~~4 1~w
iin aradius o-- uG 050 We~0 ~ W0 40
0Z ZZ #A.
z ~~Zz ~49
4 -3AU.. -2.7%z 0
z
-I00z W ~~~~~-10.5%0.0-~~~~I
-18%-20-
-26% -28.6%-30LFIGURE 42
Per cent changes of infant mortality for the year of peak releases from theIndian Point Plant by 1966 relative to 1961 for all Now York
qotlntiep within a radius of 100 miles,

ENVIRONMENTAL RADIATION 203
Thus, if low levels of radiation near a nuclear plant, typically well below the500 mr per year allowable to any individual or of the order of a few milliradsper year, can indeed produce such serious effects on the early embryo, theneffects should be seen for the low level fallout radiation measured at Brookhavenover a period of many years [32].
Assuming that Nassau County on Long Island just west of Suffolk Countyreceived essentially the same fallout levels as Brookhaven, it is possible to seewhether the changing levels of annual fallout dose were in fact accompanied bycorresponding changes in infant mortality in Nassau.The data on infant mortality rates for Nassau are shown in Figures 43 and 44
for the period following the first large H-bomb tests in the Pacific in 1954,together with the annual external gamma radiation dose as measured at Brook-haven [34] (see Table VII).
It is seen that as the radiation dose rose from about 6 mr/year in 1955 to51.5 mr/year in 1959, infant mortality rose 17 per cent from 18.1 to 21.2 perthousand live births. This first rise was followed by a second peak associatedwith the 1961-62 test series, again followed within a year by a renewed peakin infant mortality.Using the line connecting the points for 1955 before the rise and 1966 after
the end of large-scale testing as a reference, it is possible to arrive at estimatesfor the yearly excess infant mortality and compare them with the measuredexternal gamma dose.The result of this comparison is shown in Figure 44. It is seen that the excess
infant mortality in Nassau is indeed highly correlated with the changing levelsof fallout radiation varying up and down as fallout levels rose and declinedrepeatedly. The correlation coefficient is found to be 0.797, with a t value of4.172, corresponding to P < 0.01, making it a highly significant association.The slope of the line is found to be 0.22 4 0.05 per cent per mr/year. Thus,
this data suggests that a dose of as little as 1 millirad of fallout per year radia-tion from the ground, or only about one per cent of natural background radia-tion, leads to almost a Y4 per cent increase in infant mortality.
13. Leukemia in Nassau County, Long Island, associated with fallout
As still another test of the hypothesis that such small levels of radiation canin fact lead to detectable rises in leukemia even when given over a period ofmonths instead of in a few seconds as occurs for diagnostic X-rays, one canexamine the changes in leukemia in Nassau County and compare them withthe changes in external gamma radiation from fallout.Since the typical latency period for leukemia is some four to six years for the
infant irradiated in utero or early postnatal life [1], [2], [3], [4], the comparisonmust be carried out with the radiation level existing five years earlier.The leukemia data for Nassau County are shown in Figure 46, together with
the measured external radiation dose five years prior to the reported leukemiamortality.

204 SIXTH BERKELEY SYMPOSIUM: STERNGLASS
cc21NASSAU
%20 - INFANTma p /NMORTALITY
g:1902z IA
z
17
80 mr/yr9 ^ YEARLY19 60 / FALLOUTU. o A / t fRDOSE
2 40 -DOSE FROM4 / \ / n B.N.L. GAS
I-/\ / X RELEASES AT
420 I PERIMETER20 - T
I- \-.0#*I.X o I-s 01953 e55 '57 '59 '61 '63 '65 '67
YEARFIGURE 43
Infant mortality in Nassau County during period of peak nuclear testing in theatmosphere compared with external radiation levels measured at Brookhaven.Also shown are annual doses from gaseous releases measured at the northeast
perimeter of the Brookhaven Laboratory.
Inspection of Figure 45 shows a striking parallel behavior for the two quan-tities. This is confirmed by the calculated correlation, which is strong and posi-tive with a correlation coefficient of 0.819, t = 3.503 corresponding to P < 0.02.(Figure 46).The slope obtained by the least square fit is 0.49 i 0.13 per cent/mr/year,

ENVIRONMENTAL RADIATION 205
20 _ *
0 /Up.
2/1*/z
(n -
x/' COR. COEF. *0.797t tt 4.172, P<0.OI1*OR SLOPE a 0.22 *:0.05%/mr/yr
0 ** JI I0 20 40 60 80 100
EXTERNAL GAMMA DOSE mr/yrFIGURE 44
Excess infant mortality in Nassau County relative to the 1955-66 baselineversus the external gamma radiation dose measured at Brookhaven NationalLaboratory. The slope of the least square fitted line corresponds to a 22 per cent
increase for a dose of only 100 mr per year.
comparable with the slope relating the per cent increase of infant mortality andfallout radiation.From this result, one can calculate the doubling dose, or the dose for a 100
per cent increase, of 204 i 54 mr per year, equal to 51 E 13 mr in any threemonth period. Considering that this represents only external dose, a total

206 SIXTH BERKELEY SYMPOSIUM: STERNGLASS
80s NASSAUW LEUKEMIA RATE
4a PER MILLION POPULATION
,770 -
0
60'~~~~~~~~~~~
1960 `61 '62 '63 '64 '65 '66 '67
mr/yrw60- FALLOUT GAMMA DOSE RATE (B.N.L.)
Id (5 YEARS EARLIER)
w 40-0
J20 -
w 0 1 I I I I I1955 '56 '57 '58 '59 '60 '61 '62
YEARFIGURE 45
Leukemia rate per million population for Nassau County compared with themeasured external gamma radiation rate from fallout five years earlier.

ENVIRONMENTAL RADIATION 207
30 _ /
w
w_j 20- /S /~~~z
z / COR. COEF. n0.819- 10 t 3.503, P<0.02
/ SLOPE *O.4910.13%/mr/yr
/l.1 l l I lI
0 10 20 30 40 50 60
EXTERNAL GAMMA DOSE mr/yrFIGURE 46
Correlation between the per cent increase in leukemia rates in Nassau Countyand the annual dose from external fallout radiation. The least square fitted line
corresponds to an increase of 49 per cent for a dose of 100 mr per year.
doubling dose of 80 mr to the early embryo in the first trimester as obtainedfrom the study of diagnostic X-ray effects is therefore not unreasonable forfallout radiation as well. Thus there is no evidence for any decreased effective-ness of protracted as compared with high dose rate radiation from diagnosticX-rays in the early embryo and fetus.One should therefore not be surprised to find similar changes in infant mor-
tality that involve subtle genetic defects leading to slight immaturity at birth,

208 SIXTH BERKELEY SYMPOSIUM: STERNGLASS
which by itself tends to increase greatly the chance of death from respiratoryor infectious diseases [22]. Such changes in immaturity or lowered weight atbirth have in fact been observed in the county in which the Dresden Reactoris located and among children born in the U.S. since the early 1950's [22], thetime when large scale nuclear testing began, a trend that has only recently begunto reverse itself.
In fact, mortality for all age groups showed sharp upward changes beginningin the early 1950's as first pointed out by I. M. Moriyama [9].
14. Infant mortality near Brookhaven National Laboratory, Long Island, N.Y.
These considerations therefore lead one to expect that the gaseous and liquideffluent from the Brookhaven Gas Cooled Reactor may also have led to de-tectable changes in infant mortality in Suffolk County.That this appears in fact to have been the case is shown in Figure 47, where
the infant mortality in Suffolk County is plotted together with the reportedradioactive effluent produced and discharged at Brookhaven. The anomalousrise of infant mortality in Suffolk between 1953 and 1960 relative to Nassau isstrongly associated with the reported activity produced at Brookhaven andthe fraction released into the streams [34] which in turn reaches the wells servingfor irrigation and drinking water supplies in Suffolk County. Both before andafter this period, Suffolk and Nassau showed the same infant mortality rates.And with the drastic reduction in releases that took place since the peak ofactivity in 1959, infant mortality in Suffolk County dropped from a high of 24.1in 1960 to 19.3 in 1963, an unprecedented drop of 25 per cent in only three years.
15. Infant mortality and underground tests
On a number of occasions, significant quantities of radioactivity have escapedinto the atmosphere from underground nuclear detonations. The most seriousof these occurred at the Nevada Test Site on December 18, 1970, in the courseof a test of a so-called "tactical" weapon announced to be in the 20 kilotonrange [36].A radioactive cloud was reported to have risen to an altitude of some 8,000
feet, which drifted off towards the north and northwest [36] or towards Idahoand Montana.As tabulated in Radiological Health Data and Reports [37], the levels of
gross beta activity in surface air, the total deposition of beta activity on theground and the levels of cesium 137 in the milk increased during the month ofDecember 1970 over large areas of the northwestern and central United Statesas well as southern Canada shown for the case of milk in Figure 48.Upward changes in the levels of cesium 137 in the milk were recorded for
many states relative to the previous 12 months average. The highest levels wererecorded in Montana, the rise being 13 pC/l, corresponding to an increase of

ENVIRONMENTAL RADIATION 209
NEVADA AND PACIFIC TESTS H-TESTS CHINESE TESTSx x ~~SUFFOLK
x~~~
0
0~~~~~~~~~~~~~~~~~2 205
NASSAU -*
OI LIQUID ACTIVITY0Z _ I t PRODUCED 500zI 14 400z
-300wLIQUID ACTIVITYDISCHARGED _ 0 U
z / \ /< 4~~~200,17~~~~~~~~ ~~-J!
1951 '55 '59 '63 '67YEAR
FIGURE 47Infant mortality rates for Suffolk and Nassau Counties, 1949-1969, compared
with the releases of liquid radioactive waste from theBrookhaven National Laboratory in Suffolk County.

210 SIXTH BERKELEY SYMPOSIUM: STERNGLASS
0 ~ ~ ~ ~ ~ 0
.0 (1
42
W6~~~~~~
(DZ~~~~~~~~~~~~~~~~~~~~~~~~~~~~~~~~~~~~~~~~~~~~1-4 ~~~ ~~~~~~~~-~ 1
am ~~~ ~ ~ ~ ~ ~ ~~(2
la~~~~~~~~~~~~~(21

ENVIRONMENTAL RADIATION 211
186 per cent. No rises or actual declines took place throughout the entire southernUnited States, with the exception of Texas, Tennessee and Florida. Rises in thecesium content of milk took place also across a number of states in the northernUnited States and southern Canada, together with rises in ground depositionfor areas more than 3,000 miles from the test site as shown in Figure 49 forCanada, although maximum air concentrations or ground deposition did notalways result in maximum milk concentrations due to differences in precipita-tion and cattle feeding practices.The Monthly Vital Statistics Reports published by the National Center for
Health Statistics of the U.S. Department of Health, Education and Welfarefor the first three months of 1971 were examined for changes in infant mortalityrates in each state. Figure 50 shows that for the months of January and February1971 relative to the average for January and February 1969 and 1970, infantmortality rose most sharply in the states immediately to the north and northeastof Nevada, while it declined for most of the more distant states of the Southand East, with the exception of Maine, Connecticut and Kentucky wherelocalized precipitation presumably led to higher contamination levels.A similar pattern was found to hold for the months of January, February and
March combined relative to the corresponding periods in 1969 and 1970, witha general decline in infant mortality excesses relative to the first two monthsfollowing the detonation.
Thus, the most recent accidental release of radioactivity into the environ-ment for which much more complete documentation of radiation levels existsstrongly supports the hypothesis of a direct causal connection with infantmortality originally observed for the states downwind from the very first atomictest in New Mexico in July of 1945.
16. Summary and conclusion
The evidence of rises in infant mortality, congenital defects and childhoodcancers associated with nuclear testing has recently been corroborated bysimilar rises in infant mortality in the vicinity of four different types of nuclearfacilities known to release quantities of radioactive gases into the environmentthat led to nearby environmental activity levels comparable to those measuredduring nuclear weapons tests.
In both types of low level exposure, infant mortality was associated withincreased frequency of underweight birth or immaturity. Thus it appears thatlow level radiation acting on the early embryo, fetus, and young infant can notonly lead to significant rises in diseases previously known to be produced byradiation such as congenital defects and cancer, but it also appears to act indi-rectly so as to produce small decreases in maturity at birth that in turn canincrease the chance of early death from various causes such as respiratory dis-tress and infectious diseases.

212 SIXTH BERKELEY SYMPOSIUM: STERNGLASS
-1g.~~~~~~~~~~~~~-AiA
00~~~~~~
0IL~~~~~0 0rn~00,4-
~~~~~~000 0~~~

ENVIRONMENTAL RADIATION 213
4+3 0
I-44
g d)
o P
o
P. =i

214 SIXTH BERKELEY SYMPOSIUM: STERNGLASS
Co
+3 0
''
4
Ca0cee._Coc3c P,
= d C.
t O-4
4.
P o0

ENVIRONMENTAL RADIATION 215
In view of the present findings, it appears likely that both infant mortalityand chronic diseases for all ages having genetic components and involvingsubtle disturbances of the cell chemistry may have been more seriously affectedby low level environmental radiation than had been expected on the basis ofhigh level radiation studies on laboratory animals carried out mainly withexternal X-rays and gamma rays.
REFERENCES
[1] A. STEWART, J. WEBB, and D. HEwITT, "A survey of childhood malignancies," Brit.Med. J., Vol. 1 (1958), pp. 1495-1508.
[2] B. MACMAHON, "Pre-natal X-ray exposure and childhood cancers," J. Nat. Cancer Inst.,Vol. 28 (1962), pp. 1173-1191.
[3] E. J. STERNGLASS, "Cancer: relation of prenatal radiation to development of the diseasein childhood," Science, Vol. 140 (1963), pp. 1102-1104.
[4] A. STEWART and G. W. KNEALE, "Radiation dose effects in relation to obstetric X-raysand childhood cancers," Lancet, Vol. 1, pp. 1185-1188.
[5] R. LAPP, "Nevada test fallout and radioiodine in milk," Science, Vol. 137 (1962), pp.756-758.
[6] E. J. STERNGLASS, "Evidence for low-level radiation effects on the human embryo andfetus," Radiation Biology of the Fetal and Juvenile Mammal, AEC Symposium Series,Vol. 17, 1969, pp. 693-717 (Proceedings of 9th Hanford Biology Symposium).
[7] , "Infant mortality and nuclear tests," Bull. Atomic Sdi., Vol. 25 (1969), pp. 18-20.[8] I. M. MORIYAMA, "Recent changes in infant mortality trend," Pub. Health Rep., Vol. 75
(1960), pp. 391-406.[9] , "The change in mortality trend in the United States," National Center for
Health Statistics, Ser. 3, No. 1 (1964), pp. 1-45.[10] E. J. STERNGLASS, "Infant mortality and nuclear testing; a reply," Quart. Bull., Amer.
Assoc. Phys. Med., Vol. 4 (1970), pp. 115-119.[11] United Nations Scientific Committee on the Effects of Radiation, 24th Session, Supple-
ment No. 13 (A/7613), 1969.[12] "Major Activities in the Atomic Energy Programs," Semi-Annual Reports, January
1952 and later years.[13] C. W. MAYS, "Iodine-131 in Utah during July and August 1962," Hearings on Fallout,
Radiation Standards and Counter-Measures, Joint Committee on Atomic Energy, Part 2(1963), pp. 536-563; also, R. C. PENDLETON, R. D. LLOYD, and C. W. MAYs, Science,Vol. 141 (1963), pp. 640-642.
[14] E. RzIsS, in Hearings on Fallout Radiation Standards and Counter-Measures, Joint Com-mittee on Atomic Energy, Part 2 (1963), pp. 601-672.
[15] W. A. MULLER, "Gonad dose in male mice after incorporation of strontium-90," Nature,Vol. 214 (1967), pp. 931-933.
[16] E. SPODE, "tYber die Verteilung von Radioyttrium und radioaktiven seltener Erden imSaugerorganismus," Z. Naturfor8chung, Vol. 13b (1958), pp. 286-291.
[17] E. H. GRAUL and H. HUNDESHAGEN, "Studies of the organ distribution of yttrium 90,"Strahlentherapie, Vol. 106 (1958), pp. 405-457.
[18] D. H. SLADE (editor), Meteorology and Atomic Energy, USAEC, Div. Tech. Inf.(TlD-24190), 1968. (See Chapter 1, Section 2.2, p. 5ff.)
[19] "Radioactive waste discharges to the environment from nuclear power facilities," U.S.Dept. of H. E. W., P. H. S., Bur. Rad. Health (BRH-DER 70-2), Rockviile, Md., March1970.

216 SIXTH BERKELEY SYMPOSIUM: STERNGLASS
[20] "Radiological surveillance studies at a boiling water nuclear power station," U.S. Dept.H. E. W., P. H. S., Bur. Rad. Health (BRH-DER 70-1), Rockville, Md., March 1970.
[21] E. J. STERNGLASS, "A reply," Bull. Atomic Sci., Vol. 26 (1970), pp. 41-42; 47.[22] H. C. CHASE and M. E. BYRNES, "Trends in prematurity in the United States," Amer. J.
Public Health, Vol. 60 (1970), pp. 1967-1983.[23] J. H. KNELSON, "Environmental influence on intrauterine lung development," Arch.
Internal Med., Vol. 127 (1971), pp. 421-425.[24] E. J. STERNGLASS, "Infant mortality changes near a nuclear fuel reprocessing facility,"
University of Pittsburgh, Nov. 1970, presented at the Liscensing Hearings, Davis-BesseNuclear Plant, January 7, 1971, AEC Docket No. 50-346.
[25] B. SHLEIEN, "An estimate of radiation doses received in vicinity of a nuclear fuel re-processing plant," U.S. Dept. H. E. W., Bur. Rad. Health (BRH-NERHL 70-1), Rock-ville, Md., May 1970; also, BRH-NERHL 70-3, July 1970.
[26] Radiological Health Data and Reports, published monthly by the Bureau of Rad. Health,Rockville, Md.
[27] "Ten leading causes of infant death," Illinois Vital Statistics, 1963-1968, Table D,Illinois Department of Health, Springfield, Ill.
[28] H. L. BERKE and D. DEITCH, "Pathological effects in the rat after repetitive exposure toeuropium 152-154," Inhalation Carcinogenesis, AEC Symposium Series, Vol. 18, 1970. pp.429-431.
[29] J. I. MOSKALEV, L. A. BULDAKOv, A. M. LYAGINSKAYA, E. P. OVCHARENKO, and T. M.EGOROVA, "Experimental study of radionuclide transfer through the placenta andtheir biological action on the fetus," Radiation Biology of the Fetal and Juvenile Mammal,AEC Symposium Series, Vol. 17, 1969, pp. 153-166.
[30] T. M. FLIEDNER, R. J. HAAS, F. BOHNE, and E. B. HARRISS, "Radiation effects producedin pregnant rats and their offspring by continuous infusion of tritiated thymidime,"Radiation Biology of the Fetal and Juvenile Mammal, AEC Symposium Series, Vol. 17,1969, pp. 263-282.
[31] D. F. CAHILL, and C. L. YUILE, "Some effects of tritiated water on mammalian fetaldevelopment," Radiation Biology of the Fetal and Juvenile Mammal, AEC SymposiumSeries, Vol. 17, 1969, pp. 283-287.
[32] Annual Statistical Reports, New York State Department of Health, H. S. Ingraham,Commissioner, Albany, N.Y., available through 1967.
[33] Testimony of Commissioner J. T. Ramey, Hearings before the Pennsylvania Senate SelectCommittee on Reactor Siting, October 1970.
[34] A. P. HULL, "Background radiation levels at Brookhaven National Laboratory," reportsubmitted May 15, 1970, at the Licensing Hearings, Shoreham Nuclear Plant (SECDocket No. 50-322).
[35] M. J. MAY and I. F. STIuART, "Comparison of calculated and measured long term gammadoses from a stack effluent of radioactive gases," Environmental Surveillance in the Vicinityof Nuclear Facilities (edited by W. C. Reinig), Springfield, Illinois, C. C. Thomas Co.,1970, p. 234.
[36] ASsoCIATED PRESS, Mercury, Nevada, December 18, 1970.[37] Radiation Health Data and Reports, Vol. 12, No. 4 (1971), pp. 171-234, published by the
Environmental Protection Agency, Rockville, Md.[38] N. C. DYER and A. B. BRILL, "Fetal radiation dose from maternally administered 59Fe
and 13"I," Radiation Biology of the Fetal and Juvenile Mammal, AEC Symposium Series,Vol. 17, 1969, pp. 73-88.
[39] DEPARTMENT OF HEALTH, EDUCATION, and WELFARE, BUREAU OF STANDARDS, U.S.Vital Statistics, Washington, D.C., Government Printing Office.
[40] ILLINoIS DEPARTMENT OF HEALTH, Illinois Vital Statistics, 1963-1968, Springfield,Illinois.

ENVIRONMENTAL RADIATION 217
DiscussionQuestion: Alexander Grendon, Donner Laboratory, University of California,
BerkeleyThe brevity of the discussion period did not allow me to make any comment.
Part of this comment was made after the close of the morning session; the restis what I would have said, given time.
(1) You chose as your base the period 1935-1950. Sulfa drugs were introducedabout 1935; penicillin about 1945. These treatments caused a sharp decline inthe death rate. Why would you expect that sharp decline to continue ratherthan expecting a return to the gradual decline seen pre- 1935 and again post-1950?
(2) In one of your curves, included in the paper you prepared for the HealthPhysics Society meeting (Figure 13), you show a high correlation between radio-active gas releases from Dresden and per cent excess infant mortality rates inthe same years. Since radiation does not kill promptly, except at rates > 101times those possible here, why relate mortality to emissions in the same yearrather than, say, to emissions in the preceding year or earlier? I displaced yourdata by one year and, by eye, observe approximately zero correlation.
(3) In citing infant mortality around the Humboldt Reactor and relating itto gaseous emissions, you chose the years 1964-1965 to prove your point. Thefollowing data were supplied by the California Department of Public Health(slide shown):
Humboldt infant Gaseous releases Del Norte HumboldtYear mortality per 1000 Ci(X100) infant mortality fetal mortality1963 24.5 7 10/398 29
1964 20.0 60 7/369 271965 27.0 1,970 8/347 26
1966 18.4 2,820 8/281 211967 17.2 8,960s 4/285 19
You chose the only pair of years in which the data seem to support your hy-pothesis. How do you justify that choice? And did you know that there was arubella epidemic in Humboldt County in 1965, cases having risen from 49 inall of 1964 to 626 in the first nine months of 1965?Reply: E. J. Sternglass
(1) Indeed, in those areas of the United States where, due to low rainfall,there was very little fallout, such as New Mexico after 1945, infant mortalitydid continue to decline without any levelling off whatsoever. After 1963 inmany states having no nuclear facilities (such as Maine), infant mortality re-sumed its decline, recovering or actually exceeding the rapid rate of declinecharacteristic of the period 1935-1950. Thus, it is clear that the halt in declinewas a temporary phenomenon highly associated with fallout.
(2) For the case of fetal and infant mortality, deaths occur primarily in the

218 SIXTH BERKELEY SYMPOSIUM: STERNGLASS
period up to a few days to a few weeks after birth. Therefore the delay periodbetween exposure to radiation and the observed deaths can be as short as a fewmonths. The deaths are of an indirect type such as hyaline membrane disease,not of the true radiation type observed at very high doses.
(3) With respect to rubella epidemics, such outbreaks of infectious diseasesare precisely what are found whenever radiation exposure is high. It is foundthat the periods of very high fallout are followed by a weakening of the newbornexpressed in a subsequent abrupt rise in all infectious diseases. Such a rise inrubella incidence and in the incidents of other diseases occurred around theDresden Reactor following the period of its emission peak. Therefore, findingthe same correlation in the case of the Humboldt Reactor actually confirms thehypothesis.
Furthermore, the evidence for increased premature births during the activeperiod of the Dresden Reactor, and its decline during the inactive period con-tributes additional support to the hypothesis of an indirect effect.The choice of the period 1964-1965 as the period of investigation of the
Humboldt Reactor area was not made by me. The mortality rose for the firsttime according to the Bureau of Radiation and Health's publication, "Radio-active waste discharges to the environment from nuclear power facilities" (Figure4-2, [19]) when the emission level rose from as low as a few hundred curies permonth in 1964 to as high as 100,000 curies per month in August 1965. This,in fact, is why a comparison was made between the years 1964 and 1965; therehad been a thousand-fold increase in the rate of emission. Cumulatively, thismeant 197,000 curies per year, resulting in the forced shutdown of the reactorfrom September 1965 to December 1965. Subsequently, the reactor was not per-mitted to be operated at such high emission levels again until the end of 1966.Therefore, 1966 showed a sharp drop in infant mortality, fully confirming thehypothesis.Toward the end of 1966, emission levels once more increased (see Figure 4-2
[19]), and so for 1966 as a whole, the total emission was approximately one thirdhigher than in 1965. But the children who were irradiated did not begin to showthe effects until 1967, when (instead of declining to 10-15 deaths/1000/year asexpected from the 1961 to 1964 rate of decline), infant mortality remained high in1967-1968, while emission levels were allowed to reach 100,000 curies/monthonce again. And so, by 1969 there was another sharp rise in infant mortality.The rate for Humboldt County was 22 infant deaths/1000, exceeding the ratefor the rest of California which was 18 infant deaths/1000. Thus, the data forHumboldt County fully confirm the hypothesis that the large releases fromboiling-water reactors result in anomalously high infant mortality in the ad-jacent areas.Question: J. Neyman, Statistical Laboratory, University of California, BerkeleyWhile the graphs exhibited by Dr. Stermglass are impressive, the question in
my mind is whether the indicated increases in infant mortality are really causedby radiation. It is well known that, as time goes on, the environment is increas-

ENVIRONMENTAL RADIATION 219
ingly affected by all kinds of pollution. Therefore, it is possible that the increasesin mortality indicated by Dr. Sternglass represent a sum total of all the pollut-ants and, possibly, are not due to radiation.
In particular, with reference to the first slide of Dr. Sternglass illustratingan increase of deaths in parallel with the increase of X-ray films taken duringpregnancy, the question arises whether the extra X-ray pictures were takenbecause of some difficulties in pregnancy which later manifested themselves indeaths of the newborn.In general, causal relations can be established only through controlled experi-
ments. With observational studies, a comprehensive statistical analysis con-cerned with many suspected pollutants and many localities may represent anapproximation to an experiment.Reply: E. J. SternglassWith regard to X-ray examinations possibly being performed on disease-
prone individuals, note that extensive examination of the question has beenaccomplished (see Brian MacMahon). In a study of 800,000 cases X-rayed inNew England hospitals, it was concluded that no such association existed.Furthermore, the fact that there exists a direct relationship between the numberof X-rays and the increase in risk could not be explained by a suggestion thatthe X-rayed individuals were cancer-prone. Since the number of X-rays takenwas the same for all types of patients, and related to how many views the physi-cian requested, and how many repeats were necessary due to improper expo-sures, there can be no association between the number of X-rays and anyinherent characteristics of the mother irradiated.With respect to causal association of low level radiation and -leukemia and
cancer incidence, there is no question that this has been established in labora-tory experiments on all types of animals, and for the case of man one has thebombing effects in Hiroshima and the fallout incidents in Utah and Albany, N.Y.where everyone was iiradiated regardless of prior medical history or tendencies.The direct dose response in Hiroshima makes it highly unlikely that the associa-tion of radiation and cancer, leukemia, and similarly genetically caused problemscould be other than causal. Furthermore, the relationship between low levelradiation and reduction in birth weight has been demonstrated in the laboratory.There is no question that low levels retard growth in animal litters, and, byinference from studies of children exposed in Hiroshima and accidentally totherapeutic radiation, in man. Furthermore, it has been observed in a series ofabout 1000 pregnant mothers irradiated in the course of regular pelvic X-rays(which had been prescribed for all pregnant women studied by Dr. M. L. Griemat the University of Chicago in the mid 1940's), that their offspring showed asignificant increase in all types of illnesses and defects. Note that no selection ofpatients had been made in this study; every pregnant woman who requestednormal prenatal care was irradiated. Similarly, no selection based on difficultiesbefore or during pregnancy was involved in the case of some 800 pregnantwomen given tracer-doses of iron-59 in a study of nutritional requirements by

220 SIXTH BERKELEY SYMPOSIUM: STERNGLASS
P. F. Hahn and co-workers at Vanderbilt University in the late 1940's. Hereagain a significant excess of leukemia and other cancer cases were observedamong the 679 offspring (P = 0.03), despite the extremely small fetal doses thatranged from as little as 35.9 millirads to 1,780 millirads, comparable to dosesreceived in many fallout situations and diagnostic X-rays [38]. Thus, it seemsextremely unlikely that any other conclusion can be drawn than that low levelradiation produces cancer, leukemia, and retarded growth leading to increasedsensitivity to respiratory and other infectious diseases.Question: T. Sterling, Department of Applied Mathematics and Computer Sci-
ences, Washington UniversityIt is true that Dr. Sternglass has used some poor data and some good data.
It is also true that he has deferred to the judgment of recognized experts. Forexample, Dr. Stewart's data is based on a self selected sample and possiblybiased. The thymus data (that is, children radiated for "thymus" disease wheninfants, and followed in a prospective study) has many of the same flaws pointedout ad nauseum by Saenger, Silverman and myself (E. L. Saenger, F. N. Silver-man, T. D. Sterling, and M. E. Turner, "Neoplasia following therapeutic irra-diation for benign conditions in childhood," Radiology, Vol. 74 (1960), pp.889-904). But, the confrontations of Doctors Sternglass and Totter are part ofa pattern. In the last 15 years we have been in controversy-to mention justa few: the birth control pill, low dose radiation, smoking, and now, pesticidesand others. These controversies are based on a solid base of opinions and verylittle "hard" data. Constantly we review reviews. What are needed are (1)mechanisms to review data, and (2) authoritative statements of the kinds ofdata needed for inferences in the areas of controversy in question.The American Statistical Association has had a splendid record for performing
such public services through special commissions. Another source for authori-itative criteria would be the newly formed section on Biostatistics of the Na-tional Academy of Science-National Research Council. They ought to beasked to consider such questions and act on them.Reply: E. J. Sternglass
I am in full agreement that this information should be examined by the NAS,and it is my understanding that they are in the process of doing so. As to the databy Stewart and MacMahon, it is unlikely that some unrecognized factor creptinto their selection of patients. That the very factors which epidemiologists aretrained to recognize should have escaped the scrutiny of such noted epidemi-ologists is a remote possibility, which in the case of as serious a question as thisseems out of place.Question: J. R. Totter, Division of Biology and Medicine, Atomic Energy Com-
missionI have never before commented on Dr. Sternglass' presentation because I felt
that he had so obviously and flagrantly misused data that his work should notbe dignified by serious scientific comment. As statisticians or experimentalbiologists, you know that even in very well controlled experiments the data

ENVIRONMENTAL RADIATION 221
never fit the hypothesis being tested so beautifully as the data Dr. Sternglasshas presented. I believe, therefore, that he has convicted himself of selectionof data to fit his hypothesis. I shall mention only three examples.He presented Stewart and Kneale's dose response curve for childhood cancers
but did not mention the data from ABCC which appears to be totally at vari-ance with it. Dr. Stewart's data was based on about 1800 person rads while theABCC data was from about 35,000 person rads and, furthermore, was a rela-tively random sample.
Secondly, he used as a base for infant mortality the years 1935-1950. Theslope of the-line before 1935 was approximately the same as during the "fallout"years.
Thirdly, he did not mention the rubella epidemic during 1964-1965 in con-nection with the Dresden data.Reply: E. J. SternglassWith regard to the data of Stewart and Kneale, it should be pointed out that
rad doses under conditions of medical examinations with well defined X-rayfactors are far more precisely determined than could be done retrospectivelyfor the cases from Hiroshima and Nagasaki. Furthermore, Stewart and Kneale'sdata was based on 15 X 106 children born in England and Wales of whichten per cent were irradiated, yielding a study population of 1.9 X 10⁶ ir-radiated infants, of which 13,000 developed cancer. Some 7000 of the latterwere followed up. By way of contrast, in the case of the Hiroshima-Nagasakisurvivors, a mere handful of leukemia cases were born to known survivors ofradiation exposure the dose of which could be accurately estimated. Thus, theABCC study is vastly less reliable than fetal X-ray studies. Finally, the ABCCstudies suffer from the fact that fallout doses which descended on suburbs andthe surrounding area were considered to be zero, while E. T. Arakawa (see Neu,England Journal of Medicine, Vol. 263 (1960), pp. 488-493) estimated thatdoses of 100 rads were experienced in the suburbs of Nagasaki from fallout alone.Thus, there exists a great uncertainty in both the exposure of the proximateJapanese population, and even of the so-called control population which sup-posedly (according to the ABCC) was not irradiated. From all these considera-tions, we must conclude that the ABCC data are far inferior to that obtainedin fetal X-ray studies.As to the choice of the baseline, 1935-1950, the choice was not mine. It was
selected by Moriyama of the USPH Service, the National Center for HealthStatistics, in his analysis of changes in trends in infant mortality which he firstidentified in the 1960's. Furthermore, this slope has now resumed its early valuesince the end of testing, and the totally unexpected renewed decline of infantmortality has followed the gradual decrease in radioactivity in the environment.With regard to the question of the occurrence of rubella epidemics as an
alternative explanation of the rises in infant mortality, note that such epidemicsof childhood infectious diseases are in fact expected on the basis that the fetusand embryo are weakened by exposure to radiation so that the newborn hasreduced ability to fight off infections of all types.