environmental satisfaction in open-plan environments: 1
TRANSCRIPT

Environmental Satisfaction in Open-PlanEnvironments: 1. Scale Validation and Methods
Veitch, J.A.; Farley, K.M.J.; Newsham, G.R.
www.nrc.ca/irc/ircpubs
IRC-IR-844

Environmental Satisfaction in Open-Plan Environments: 1. ScaleValidation and Methods
by Jennifer A. Veitch, PhD., Kelly M. J. Farley, and Guy R. Newsham, PhD.
Internal Report No. IRC-IR-844
Date of issue: April 2002
This internal report, while not intended for general distribution, may be cited or referenced in otherpublications.

ES 1. Scale Validation & Methods Veitch, Farley & Newsham
IRC-IR-844 - 1 -
Environmental Satisfaction in Open-Plan Environments: 1. ScaleValidation and Methods
Jennifer A. Veitch, PhDKelly M. J. Farley
Guy R. Newsham, PhD.
Institute for Research in ConstructionNational Research Council CanadaMontreal Road, Ottawa, Ontario
CANADA, K1A 0R6
Internal Report No. IRC-IR-844
April 2002

ES 1. Scale Validation & Methods Veitch, Farley & Newsham
IRC-IR-844 - 2 -
Acknowledgements
This investigation forms part of the Field Study sub-task for the NRC/IRC project Cost-effective Open-Plan Environments (COPE) (NRCC Project # B3205), supported by Public Worksand Government Services Canada, Natural Resources Canada, the Building Technology TransferForum, Ontario Realty Corp, British Columbia Buildings Corp, USG Corp, and Steelcase, Inc. COPEis a multi-disciplinary project directed towards the development of a decision tool for the design,furnishing, and operation of open-plan offices that are satisfactory to occupants, energy-efficient, andcost-effective. Information about the project is available at http://www.nrc.ca/irc/ie/cope.
The authors are grateful to the following individuals: Chantal Arsenault, Emily Nichols, MarcelBrouzes, Roger Marchand, John Bradley and Scott Norcross (data collection); Louise Legault(research design advice); Kate Charles (data analysis advice); Gordon Bazana (data management).
c. 2002 Her Majesty in Right of Canada. National Research Council Canada, Ottawa, Ontario

ES 1. Scale Validation & Methods Veitch, Farley & Newsham
IRC-IR-844 - 3 -
Environmental Satisfaction in Open-Plan Environments:1. Scale Validation and Methods
Executive Summary
Organisations and their facilities managers are under pressure to reduce the space allocation toindividuals in open-plan offices, as a means to reduce costs. The reduced space allocation, however, riskscreating an unpleasant working environment, either directly through the creation of adverse physicalconditions (e.g., more noise, added obstructions to air circulation), or indirectly through psychologicalprocesses such as privacy or stress. As part of a larger project concerning the design and operation ofopen plan offices, a field study was conducted to determine the effects of open-plan office design(particularly workstation size and partition height) on the indoor environment and on occupant satisfactionwith that environment. The study is a pre-post renovation study of government office buildings that willundergo space-saving renovations to smaller cubicle sizes. This paper reports on time 1 data only (time 2data will not be available until 2003).
Three government office buildings in two cities were surveyed, with a total of 419 employees andtheir workstations participating. While research staff conducted extensive measurements of ventilation,temperature, noise, lighting, and descriptive characteristics of the workstation, the workstation occupantcompleted a 27-item questionnaire on a handheld computer. The questionnaire included 18 individualratings of satisfaction with environmental features, a 2-item index of overall environmental satisfaction,and a 2-item index of job satisfaction.
This paper reports on the methodology and on analyses of the underlying factor structure of the 18individual environmental features ratings, and of a model incorporating environmental and job satisfactionin relation to these ratings. Relationships between environmental features ratings and characteristics ofthe workstations, and specific relationships to other physical conditions in the workstation, will follow insubsequent papers.
The sample was divided into two random groups for exploratory and confirmatory factor analysis.Exploratory factor analysis using oblimin rotation revealed three factors, interpreted as Satisfaction withPrivacy, Satisfaction with Lighting and Satisfaction with Ventilation. Confirmatory factor analysis usingstructural equation modelling (on EQS) supported the three-factor model. The variables loading on eachlatent variable are as follows:
Satisfaction with Privacy: [satisfaction with...] visual privacy, conversational privacy, amount ofnoise from others' conversations, amount of background noise; amount of distraction, workstation size,degree of enclosure, ability to alter conditions; distance between coworkers; and aesthetic appearance.
Satisfaction with Lighting: [satisfaction with...] lighting quality, quantity of light on the desk,quantity of light for computer work, computer glare, and access to a view.
Satisfaction with Ventilation: [satisfaction with...] air quality, temperature, and air movement.The entire sample was recombined for analyses of the relationships between satisfaction with
aspects of environmental satisfaction, and overall environmental satisfaction and job satisfaction. Themodel with the best fit showed intercorrelations between the three aspects of environmental satisfaction,direct relationships between them and overall environmental satisfaction, and a direct relationship betweenoverall environmental satisfaction and job satisfaction. Although model fit was modest (e.g., standardisedRMR = .06), all paths are statistically significant and the model is consistent with other models in theenvironmental psychology literature. Future research should seek relationships between these variablesand other important job-related outcomes, such as organisational commitment, intent to turnover,absenteeism, and job performance.
ES 1. Scale Validation & Methods Veitch, Farley & Newsham
IRC-IR-844 - 4 -
Table of Contents1.0 Introduction ..................................................................................................................................52.0 Method........................................................................................................................................7
2.1 Sites.........................................................................................................................................72.1.1 Building 1 details.................................................................................................................72.1.2 Building 2 details.................................................................................................................82.1.3 Building 3 details.................................................................................................................8
2.2 Participants ..............................................................................................................................82.3 Dependent Measures ................................................................................................................9
2.3.1 Satisfaction questionnaire. ...................................................................................................92.3.2 Physical conditions............................................................................................................. 11
2.4 Procedure .............................................................................................................................. 142.4.1 Advance communications.................................................................................................. 142.4.2 Daytime measurements..................................................................................................... 142.4.3 Night-time measurements.................................................................................................. 162.4.4 Night-time acoustics measurements ................................................................................... 17
3.0 Results ....................................................................................................................................... 173.1 Descriptive Statistics and Data Screening................................................................................. 173.2 Independent Subsamples ......................................................................................................... 18
3.2.1 EFA group. ...................................................................................................................... 183.2.2 CFA group. ...................................................................................................................... 22
3.3 Exploratory Factor Analysis..................................................................................................... 243.4 Confirmatory Factor Analysis .................................................................................................. 253.5 Relations to Overall Environmental Satisfaction and Job Satisfaction .......................................... 28
4.0 Discussion ................................................................................................................................. 295.0 References................................................................................................................................ 30Appendix A...................................................................................................................................... 32Appendix B...................................................................................................................................... 45Appendix C...................................................................................................................................... 48Appendix D...................................................................................................................................... 50Appendix E...................................................................................................................................... 52

ES 1. Scale Validation & Methods Veitch, Farley & Newsham
IRC-IR-844 - 5 -
1.0 Introduction
Organisations and their facilities managers are under pressure to reduce the space allocation toindividuals in open-plan offices, as a means to reduce costs. The reduced space allocation, however, riskscreating an unpleasant working environment, either directly through the creation of adverse physicalconditions (e.g., more noise, added obstructions to air circulation), or indirectly through psychologicalprocesses such as privacy or stress. Predicting changes to the physical environment associated withworkstation design and partition height, and the effects of those physical conditions on environmentalsatisfaction, is the aim of the Cost-Effective Open-Plan Environments project.
The project design follows two decades of research into relations between the physical workenvironment and the individual worker, interpersonal relations, and the organisation (e.g., Carlopio, 1996;Oldham & Brass, 1979; Sundstrom, 1987; Sundstrom, Bell, Busby, & Asmus, 1996; Sutton & Rafaeli,1987). Despite considerable effort, the literature remains scattered and poorly linked to the engineeringand design disciplines that might make use of it. Designers and facilities managers have asked fordemonstrable proof that the physical environment influences organisational outcomes such as work output,absenteeism, turnover, and, ultimately, productivity. Psychologists, often lacking the expertise to measureor quantify the physical environment, have been unable to provide such direct evidence with scientificrigour (Rubin, 1987; Wyon, 1996).
One reason for the slow progress in this area has been the absence of multidisciplinary studiesincorporating strong measurement of both the physical environment and the individual or organisationalbehavioural outcomes. For instance, Sutton and Rafaeli (1987) defined hotness as "the product of anemployees judgement as to how often it got too hot at a work station and the [estimated] temperaturewhen it is at it hottest" (p. 264). Conversely, many other investigators have not used standardised tools tomeasure perceptions of the workplace or behaviours in it (Stokols & Scharf, 1990).
Standardised research instruments addressing the physical work environment should meet certainkey requirements (Stokols & Scharf, 1990). First, the questionnaire should be streamlined in length andwording so respondents can complete the protocols in a straightforward manner. Second, the scope of thecontent should be sufficiently broad to so that important aspects of facility design are not neglected. Inaddition to characteristics of the physical work environment, other variables that should be included arerespondent biographic characteristics, job status or category, and ratings of job or work satisfaction.Finally, survey items should be directly relevant to organisational problem-solving strategies. That is, thefindings from research using these instruments should suggest specific organisational and environmentaldesign strategies that can be implemented to resolve problems identified in the research.
With these issues in mind, Stokols and Scharf (1990) developed the Ratings of EnvironmentalFeatures (REF) questionnaire for use in a variety of office settings. Privacy, air quality and lighting werethe major, physical work environment variables included in the REF. The REF contains 27 items forwhich respondents rate the quality of several physical features (e.g., ‘conversational privacy within youroffice’ and ‘quality of lighting for the work you do’). Stokols and Scharf reported acceptable internalconsistency values (.87 to .94) over five pilot administrations of the REF. Although physical environmentaldata were also collected, analyses of these data have never been published.
Another example of the development of a standardised tool is Carlopio's (1996) Physical WorkEnvironment Satisfaction Questionnaire (PWESQ) which included the assessment of five general areas(environmental design, facilities, work organisation, equipment and tools, and health and safety). Hevalidated the tool in a field survey involving employees in eight companies ranging from a computerassembly site to durable goods manufacturing warehouses. The PWESQ met criteria for internalconsistency and discriminant validity; moreover, across settings, satisfaction with the physical environmentand job satisfaction both related to organisational commitment and intent to turnover. This is consistent

ES 1. Scale Validation & Methods Veitch, Farley & Newsham
IRC-IR-844 - 6 -
with existing organisational psychology theory. However, we could find no publications that used thePWESQ for further research into how measured physical conditions relate to satisfaction.
The Cost-Effective Open-Plan Environments (COPE) field study was designed to address thislimitation in knowledge, while providing an opportunity to test models based on laboratory, computersimulation, and literature review studies also conducted as part of the overall COPE project. The fieldstudy was designed to determine the effects of open-plan office design on the indoor environment and onoccupant satisfaction with that environment. It is a pre-post renovation study of office buildings that willundergo space-saving renovations to smaller cubicle sizes.
The COPE study is unique in that it combines extensive local physical measurements paired withsimultaneous questionnaire data collection. This report describes the methodology used in the field studyand addresses the validation of the satisfaction questionnaire, using time 1 data only (time 2 data will notbe available until 2003). Figure 1 shows a conceptual model of the field study. The model posits thatworkstation characteristics (particularly workstation size and partition height, but not limited to those),determine the physical conditions in the workstation. The physical conditions and the workstationcharacteristics jointly determine satisfaction with elements of the physical environment, measured usingthe 18-item Environmental Features Ratings (EFR) [based on Stokols and Scharf's (1990) Ratings ofEnvironmental Features]. The reduction of the 18 EFR items to a smaller number of components, andtheir relations to overall environmental satisfaction and to job satisfaction, is the topic of this report.
Based on the literature, we hypothesized that the 18-item Environmental Features Ratings wouldreflect a limited number of underlying latent variables. Based on the literature, we expected that factorsfor privacy, ventilation and lighting would emerge (Dillon & Vischer, 1987; González, Fernández, &Cameselle, 1997; Stokols & Scharf, 1990). Specifically, we expected that privacy would account for thegreatest proportion of the variance observed followed in order by ventilation and lighting. Moreover, wepredicted that these latent variables would be directly related to job satisfaction and overall satisfactionwith the environment (Dillon & Vischer, 1987; Wells, 2000).
To test these hypotheses, exploratory (EFA) and confirmatory factor analyses (CFA) wereconducted. This pair of techniques allows investigators to establish a preliminary model using half of thedata set, and then to test whether that model fits the remaining data using the other half. The latent,underlying variables thus established will provide a smaller, manageable, interpretable set of subscales –components of environmental satisfaction – for use in further analyses.
Overall EnvironmentalSatisfaction
Job SatisfactionFeature Importance Rankings
Controls: Building,Job Category, Sex, Age
Workstation Characteristics Physical IE Conditions
Environmental Features Ratings
Components of ES
Figure 1. Conceptual model of the COPE field study.

ES 1. Scale Validation & Methods Veitch, Farley & Newsham
IRC-IR-844 - 7 -
Structural equation modelling was used to test the hypothesized relationships between all variablesusing the entire data set. We predicted that the of latent variables would relate directly to overallenvironmental satisfaction, and that overall environmental satisfaction would predict job satisfaction.These procedures have been used to verify the validity of job satisfaction inventories, and suchrelationships have been observed (Carlopio, 1996; González et al., 1997; Wells, 2000).
2.0 Method
2.1 SitesData were collected in three federal government office buildings in large Canadian cities, occupied
by various departments. The buildings, and the specific locations within them, were selected because theycontained open-plan offices occupied by white-collar workers, were of a suitable size, were slated toundergo renovation in the 12-18 month period following the visit, and because their management waswilling to host the visit. The team intends to revisit the sites 6 months post-occupancy, within the sameseason as the original visit.
Table 1. Summary of site characteristics.Building Year
BuiltVisited # Floors Floor plate
(sf)Lighting HVAC Windows Sound
1 1977 Spring2000
11
(4 visited)
39000 (x 2towers)
4' cofferedprismaticfluorescent
ducted airVAV cooling/ perimeterhot-waterheating
non-openable
No soundmasking
2 1975 Summer2000
12
(3 visited)
40000 4' recessedparaboliccube
ducted airVAV cooling/ perimeterconventionheating
non-openable
No soundmasking
3 1975 Spring2000 andWinter2000
22
(4 visited)
18000 4' recessedprismatic(someparabolic)
ducted airVAV cooling/ perimeterhot andchilled waterheating &cooling
non-openable
Soundmasking inuse
Parts of four floors in the eastern half of this building were visited.Office accommodation at this location was primarily open-plan, with
some enclosed offices on the perimeter and at the centre of the floor plan. In the majority of cases, open-plan workstations were formed using free-standing fabric partitions, and free-standing furniture elements.Lighting was provided, almost universally, by surface mounted prismatic fixtures housing a single 4’fluorescent lamp. These fixtures were located at the centre of 5’x5’ ceiling coffer elements. Soundmasking was not in use at this location. The HVAC system comprised a ducted-air variable air volume(VAV) cooling system, and a perimeter hot-water heating system, both controlled by zone thermostats.Perimeter zones stretched between structural columns along the perimeter (33’) to a depth of about 10’;interior zones were up to 30’ x 30’ in size. The building operators controlled zone thermostats.Thermostats were generally fixed at 22oC, though certain thermostats had been adjusted to accommodatelocal preferences. The VAV system utilised two compartment fans in each tower of each floor. Each
2.1.1 Building 1 details.

ES 1. Scale Validation & Methods Veitch, Farley & Newsham
IRC-IR-844 - 8 -
fan served approximately half the floor plate, and was capable of supplying up to 25,500 cfm, with theoutside air fraction fixed at 10%. Manual controls ensured that the flow rate to the interior zones neverfell below 50% of maximum, and that the flow rate to the perimeter zones never fell below 20% ofmaximum. These fans were switched off between 6pm – 6am each night; only the fans serving thebuilding lobby and retail floors operated for 24 hours/day.
Areas of three floors were visited. Office accommodation at thislocation was primarily open-plan, with some enclosed offices on the
perimeter and at the centre of the floor plan. In the majority of cases, open-plan workstations wereformed using systems furniture elements. Lighting was provided, almost universally, by recessed paracubeparabolic fixtures housing a single 4’ fluorescent lamp. Orange-painted hollow ceiling beam-like elementsformed a 5’x5’ ceiling grid, and each of these 5’x5’ areas contained one (usually) fixture at the centre(usually). Sound masking was not in use at this location. The ceiling beams also contained slot airdiffusers. The HVAC system comprised a ducted-air VAV cooling system, and a perimeter convectionheating system. Zones served by individual VAV boxes were approximately 1500 ft2, though somesmaller perimeter zones had been created where solar gain was problematic. The building operatorscontrolled zone thermostats. The target thermostat setting was 22oC, though many thermostats had beenadjusted to accommodate local preferences. The building had two main fresh air fans with in-line heatingand cooling coils; there was also a cooling coil in the main return air duct. The VAV system utilised twocompartment fans on each floor. Each fan served approximately half the floor plate, with the outside airfraction fixed at 15%. Controls ensured that the flow rate to the interior zones never fell below 10% ofmaximum. These fans were switched off between 6pm – 2am each night.
Sections of four floors were visited, two in spring and two in winter.Office accommodation at this location was primarily open-plan, with
some enclosed offices at the centre of the floor plan. In the majority of cases, open-plan workstationswere formed using systems furniture elements. Lighting was provided, almost universally, by ceiling-recessed prismatic fixtures housing a single 4’ fluorescent lamp, though there were “paracube” prismaticfixtures in a few locations. These fixtures were located in a regular grid on 5’x5’ centres. Sound maskingwas used on all floors at this location. The HVAC system comprised a ducted-air VAV cooling system,and a perimeter hot- and chilled-water system. The perimeter system was locally controlled by occupants.The VAV system was controlled by zone thermostats in the interior; interior zones were up to 15’ x 20’ insize. Zones were originally aligned with office locations, but rearrangement of office furniture over theyears means that this is no longer the case. The building operators controlled interior zone thermostats.Thermostats were initially set at 20-22 oC, though certain thermostats had been adjusted to accommodatelocal preferences. The VAV system utilised a total of seven fans, four dedicated to the interior and threeto the perimeter. Perimeter fans served South, North-east and North-west zones. The outside air fractionvaried with external climate, but never fell below 15 %. These fans were switched off between 6pm –6am each night.
2.2 ParticipantsParticipants were the occupants of floors scheduled to undergo renovation in the selected building
within the project's time frame. All occupants present on the visit day were eligible to participate.Approximately 90% of those invited agreed to participate. Table 2 shows the descriptive statistics for thefull sample and broken down by building.
Table 2. Demographic characteristics of participants.Site N % English % female /% male Mean age (SD)Full sample 419 87.3 48.7 / 50.3 38.6 (10.8)Building 1 132 86.3 47.8 / 51.5 38.2 (12.7)
2.1.2 Building 2 details.
2.1.3 Building 3 details.

ES 1. Scale Validation & Methods Veitch, Farley & Newsham
IRC-IR-844 - 9 -
Site N % English % female /% male Mean age (SD)Building 2 160 98.8 48.8 / 50.6 39.5 (10.2)Building 3 127 75.6 49.6 / 48.8 37.8 (9.4)
Job CategoryAdministration Technical Professional Management
Full sample 36.0 14.8 41.3 6.7Building 1 18.9 11.4 68.2 0Building 2 47.5 11.3 32.5 8.1Building 3 39.4 22.8 24.4 11.8
EducationHigh School Community
CollegeUniversitycourses
UndergraduateDegree
GraduateDegree
Full sample 16.0 % 17.7 14.6 26.0 23.2Building 1 9.1 8.3 13.6 30.3 37.1Building 2 13.1 21.3 16.9 26.3 20.0Building 3 26.8 22.8 12.6 21.3 12.6Note. Percentages that do not sum to 100 are the result of rounding error and missing data.
2.3 Dependent MeasuresWorkstation occupants were asked to indicate theirworkplace satisfaction and demographic and other
information by answering a questionnaire presented on a palmtop computer. The computer used was anNEC Mobile Pro™ 770 running Microsoft® Windows® CE. The questionnaire was developed usingMicrosoft® Visual Basic 6 for Windows® CE. Participants responded to information screens andquestions by clicking buttons on the touch-sensitive screen using a stylus (Figure 2).
Following a series of information screens (the first of which gave the choice of continuing inEnglish or French), participants were presented with 27 questions. The information advised the participantto register their opinions of their workplace with reference to the conditions as they existed at the time theNRC staff arrived at their workstation seeking participation. A response with this frame of reference ismore relevant with respect to the physical conditions that were measured. Each question appeared on aseparate screen, and participants could proceed to the next screen (question) by completing the current
2.3.1 Satisfaction questionnaire.
Figure 2. The palmtop computerfeaturing one question from thefield study questionnaire. Theparticipant answered using astylus on a touch-sensitive screen.

ES 1. Scale Validation & Methods Veitch, Farley & Newsham
IRC-IR-844 - 10 -
question or skipping it, participants were not able to return to a screen once they had completed it. Datafrom each participant was stored in the palmtop’s memory, one file per participant.
The questions and their response categories are shown in Table 2. Questions 1 – 18 and 27 usedthe same seven-point satisfaction scale. These questions were based primarily on Stokols and Scharf(1990). Question 19 asked the participant to rank order seven elements of the work environment in termsof their importance; the software prevented the participant from assigning the same importance to two ormore elements. Questions 24 and 25 both used the same seven-point agree/disagree scale, and weredrawn with minor modification from a recent survey of job satisfaction for the Canadian federal publicservice (Ross, 1999). Question 26 asked the participant to rate how the environment influenced theirproductivity at the time of the survey relative to general prevailing conditions (Wilson & Hedge, 1987).The French translation was produced by a professional translator from the final English version, and theadequacy of the translation was confirmed by back-translation by a second translator.
Table 3. Satisfaction Questionnaire (English).Question Response Category1. Amount of lighting on thedesktop
VeryUnsatisfacto
ry
Unsatisfactory
SomewhatUnsatisfacto
ry
Neutral SomewhatSatisfactory
Satisfactory VerySatisfactory
2. Overall air quality in your work area3. Temperature in your work area4. Aesthetic appearance of your office5. Level of privacy for conversations in your office6. Level of visual privacy within your office7. Amount of noise from other people’s conversations while you are at your workstation8. Size of your personal workspace to accommodate your work, materials, and visitors9. Amount of background noise (i.e. not speech) you hear at your workstation10. Amount of light for computer work11. Amount of reflected light or glare in the computer screen12. Air movement in your work area13. Your ability to alter physical conditions in your work area14. Your access to a view of outside from where you sit15. Distance between you and other people you work with16. Quality of lighting in your work area17. Frequency of distractions from other people18. Degree of enclosure of your work area by walls, screens or furniture19. Rank order importance of:noise levels, temperature, privacy,air quality/ventilation,size of work space,window access, lighting
1st 2nd 3rd 4th 5th 6th 7th
20. How old are you? 18-29 30-39 40-49 50-59 60-69 70+
21. What is your sex? Female Male
22. Job category? Administrative Technical Professional Managerial
23. Highest education level? High school Communitycollege
Some university Bachelor degree Graduate degree
24. My department/agency is agood place to work
Verystronglydisagree
Stronglydisagree
Disagree Neitheragree nordisagree
Agree Stronglyagree
Verystrongly
agree25. I am satisfied with my job

ES 1. Scale Validation & Methods Veitch, Farley & Newsham
IRC-IR-844 - 11 -
Table 3. Satisfaction Questionnaire (English).Question Response Category26. Effect of environmentalconditions on personalproductivity
- 30 % - 20 % - 10 % 0 % + 10 % + 20 % + 30 %
27. Indoor environment in yourworkstation, as a whole
VeryUnsatisfacto
ry
Unsatisfactory
SomewhatUnsatisfacto
ry
Neutral SomewhatSatisfactory
Satisfactory VerySatisfactory
Note. French translation, showing the screen appearance, appears in Appendix A.
The employee was then thanked for his/her participation, and given a short paper questionnaireand a pre-paid envelope for return to NRC. This paper questionnaire provided a medium for anyadditional, open-ended comments the employee might have that they could not express in response to theelectronic questionnaire. This paper questionnaire is shown in Appendix B.
Physical measurements were made using two systems. Acart+chair system was used to make measurements of a
representative set of variables at each workstation during daytime and at night. Additional equipment wasused to make more detailed acoustics measurements at night. These systems are described below.
We developed a custom, mobile system to measure the microclimate at the position occupied byan employee in an open-plan office workstation. This system consists of two main components, the cartand the chair, both wheeled for mobility. The chair served as a platform for the indoor environmentsensors. In taking measurements, we temporarily replaced the occupant’s own chair with ours;fabricating our sensor platform in the shape of a chair meant that it had a similar effect on the
2.3.2 Physical conditions.
Illuminancecube
Airsample
Radianttemperature
Temperatureprobes
Sound Level
Relative humidity
Air velocity
IlluminanceSensors(movable)
Figure 3. The cart and chair used for physical measurements.

ES 1. Scale Validation & Methods Veitch, Farley & Newsham
IRC-IR-844 - 12 -
microclimate as the occupant’s own chair, adding to the validity of the measurements.The various sensors mounted on the chair are described in Table 1, and the appearance of the
chair is shown in Figure 3. The sensors were chosen to give as broad a characterisation of the indoorenvironment as possible within a reasonable time (< 15 mins.) and with reasonable mobility (cart+chairsystem to be moved by two staff through narrow openings typical of open-plan layouts). The selectionand location of sensors related to thermal comfort (air temperature, radiant temperature, humidity, and airvelocity) were designed to be as similar as possible to those followed in ASHRAE studies (Benton et al.,1990). Illuminance measurements were taken in defined locations in the workstation (Figure 4),corresponding to locations defined in lighting recommended practice documents (Human ResourcesDevelopment Canada (HRDC), 1989; Illuminating Engineering Society of North America (IESNA), 1993).
The chair was connected to the cart by an “umbilical cord” of sensor lines, power cords, andcommunications cables. The cart (Figure 3) held a laptop computer, battery and power supply, dataacquisitions equipment, and instrumentation for the air quality analysis. A custom data acquisition programon the laptop communicated with all instrumentation on the chair and cart, co-ordinated measurementcycles, and stored the resulting data. The cart also housed a camera, tape measures, open-endedquestionnaire envelopes, and other miscellaneous equipment. The cart was plugged in a wall socket(building’s regular 120V-AC power) overnight to charge the batteries. On a full charge it could operateindependently for a full day of measurements.
Table 4. Description of the various sensors used on the chair.Measures Sensor Manufacturer Location Range AccuracyIlluminance(light falling on asurface)
Siliconephotocell
Minolta T1 Desktop (various) 0.01 to 99,900 lx ± 5%
Illuminance Siliconephotocell
Minolta T1 6 faces of cube atseated head height
0.01 to 99,900 lx ± 5%
Air velocity Hot wire TSI- 8475 0.1m, 0.7m, 1.1m 0 to 1m/s ± 3%Octave bandanalyzer
Microphone Rion NA-29 Seated head height 27 to 130 dB(a)31.5Hz to 8kHz
± 0.1 dB
CO, CO2, THC,CH4
Photo-acousticIR
B&K 1302 Seated head height ± 0.3 ppm(TVOC)
Temperature RTD Omega 0.1m, 0.7m, 1.1m Room temp < 0.1 deg C.Relative Humidity Resistance
change of bulkpolymer
General EasternRH2
Seated torso height 20 to 95%0 to 20%
± 2%± 7%

ES 1. Scale Validation & Methods Veitch, Farley & Newsham
IRC-IR-844 - 13 -
Chair-based octave band noise level measurements were supplemented by 1/3 octave bandmeasurements at a sample of locations.
Measurements of sound propagation between adjacent workstations were performed at night.The source was a small Alpha Mite PSB loudspeaker with directionality similar to that of a human. Thereceivers consisted of an array of four microphones located at the corners of a square, 46cm on each side.
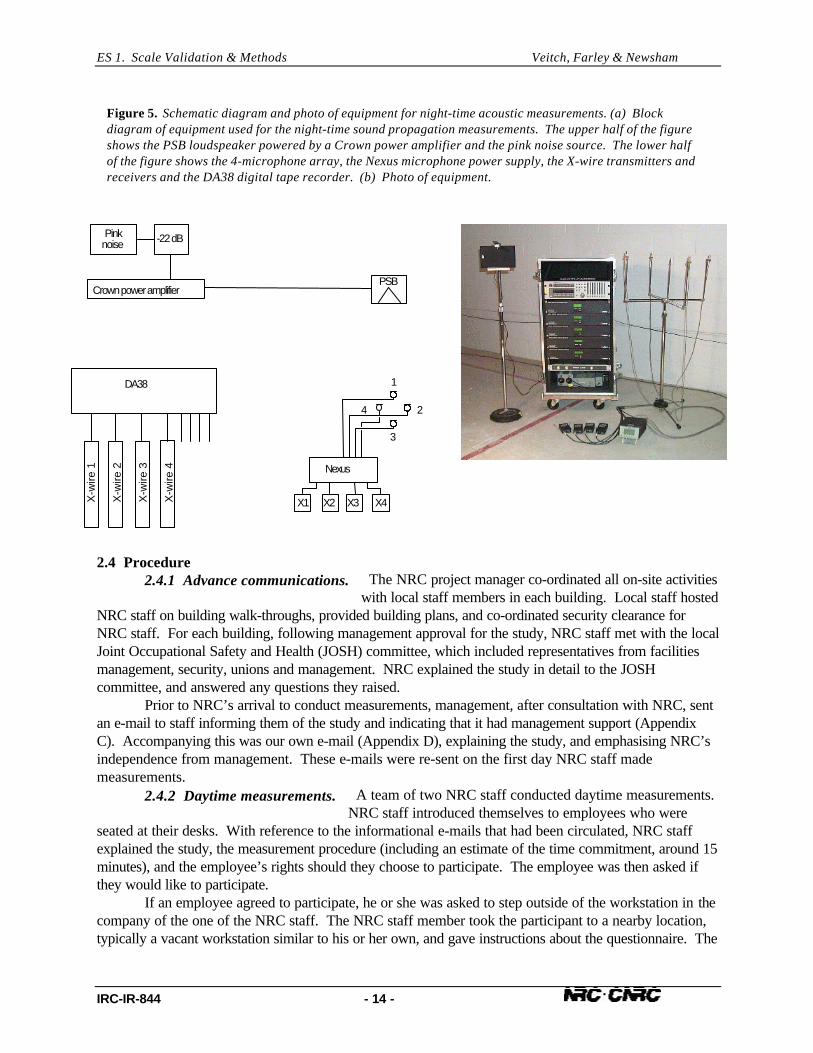
Measurements were made by radiating a known level of pink noise (equal sound energy in eachoctave) from the source and measuring the levels at the four microphones in the adjacent workstation. Thesound power output of the source was separately measured in a laboratory sound power measurement.This measured sound power output was then used to calculate a reference output level of the source for adistance of 0.9m in a free field (a location with no reflected sound). The microphone signals weretransmitted to receivers connected to 4 channels of an 8-channel digital tape recorder, as illustrated in theblock diagram of Figure 5(a), and the photo in Figure 5(b). Calibration signals were also recorded on eachchannel at the beginning and end of each measurement session. The tape recordings were played backunder computer control into a B&K 2144 real-time analyzer. The reduction of intruding speech soundswas estimated by subtracting these recorded levels from the known level of the source.
Figure 4. Placement of sensor chair and desktop illuminance sensors for daytime measurements.
ES 1. Scale Validation & Methods Veitch, Farley & Newsham
IRC-IR-844 - 14 -
2.4 Procedure The NRC project manager co-ordinated all on-site activitieswith local staff members in each building. Local staff hosted
NRC staff on building walk-throughs, provided building plans, and co-ordinated security clearance forNRC staff. For each building, following management approval for the study, NRC staff met with the localJoint Occupational Safety and Health (JOSH) committee, which included representatives from facilitiesmanagement, security, unions and management. NRC explained the study in detail to the JOSHcommittee, and answered any questions they raised.
Prior to NRC’s arrival to conduct measurements, management, after consultation with NRC, sentan e-mail to staff informing them of the study and indicating that it had management support (AppendixC). Accompanying this was our own e-mail (Appendix D), explaining the study, and emphasising NRC’sindependence from management. These e-mails were re-sent on the first day NRC staff mademeasurements.
A team of two NRC staff conducted daytime measurements.NRC staff introduced themselves to employees who were
seated at their desks. With reference to the informational e-mails that had been circulated, NRC staffexplained the study, the measurement procedure (including an estimate of the time commitment, around 15minutes), and the employee’s rights should they choose to participate. The employee was then asked ifthey would like to participate.
If an employee agreed to participate, he or she was asked to step outside of the workstation in thecompany of the one of the NRC staff. The NRC staff member took the participant to a nearby location,typically a vacant workstation similar to his or her own, and gave instructions about the questionnaire. The
2.4.1 Advance communications.
2.4.2 Daytime measurements.
Figure 5. Schematic diagram and photo of equipment for night-time acoustic measurements. (a) Blockdiagram of equipment used for the night-time sound propagation measurements. The upper half of the figureshows the PSB loudspeaker powered by a Crown power amplifier and the pink noise source. The lower halfof the figure shows the 4-microphone array, the Nexus microphone power supply, the X-wire transmitters andreceivers and the DA38 digital tape recorder. (b) Photo of equipment.
Pinknoise -22 dB
Crown power amplifierPSB
DA38
Nexus
X1 X2 X3 X4X-w
ire 1
X-w
ire 2
X-w
ire 3
2
3
4
X-w
ire 4
1

ES 1. Scale Validation & Methods Veitch, Farley & Newsham
IRC-IR-844 - 15 -
NRC staff member then left the participant to answer the questionnaire in private, and returned to help theother member of the NRC team with the physical measurements in the workstation. The participant wasinstructed to return to his or her workstation for assistance from the NRC staff if it were needed.
The measurements in the workstation began with two photographs. The first was a close-up ofthe computer screen with the screen turned off, principally to identify potential sources of reflected glare.The second photograph was an overall workstation picture, taken from the entrance to the workstation.Both photographs were taken with a Kodak™ DC 260 digital camera with a wide-angle lens. A smallblackboard featuring an ID code for the workstation was included in the photographs, and the same codewas recorded on the building plans. In addition, the photographs were automatically time-stamped, and thetime of the visit was recorded on the building plans. These measures helped ensure that all dataassociated with a particular workstation could be collated later.
Once the instruments were in place, software on the laptop on the cart automatically co-ordinatedmeasurements from the various sensors. Initially, the operator entered the workstation ID code, andinitials identifying him- or herself. The process began with the B&K 1302 taking an air sample foranalysis; this process took about 2.5 minutes. While this was happening, NRC staff took measurements ofworkstation size, partition height and ceiling height, and noted them down for later data entry.
Next the noise level measurements were made; this process took about 1.5 minutes, during thistime the NRC team took no actions that might disturb the measurement. The goal was to get a 20-secondmeasurement without intelligible speech sounds (a person talking on the telephone in the next cubicle, forexample). Measurements were repeated 3 times, or until a measurement without speech was captured,whichever occurred sooner. Other noises occurring during the measurement, such as ventilation noise ornoise from outside the building, were noted.
Next, temperature, air speed, humidity and illuminance measurements were taken. Measurementsof all these parameters were taken every 10 seconds, and six measurement cycles were completed in aone-minute period. The last of the six measurements for each variable is shown on the screen, whereasall six measurements, and the mean of all six for each variable, were written to file. On completion, thedesktop illuminance sensors were moved to a second location, and the measurements for those sensorswere repeated.
Finally, NRC staff entered additional information describing the workstation. These data includedrelative location of entrance and computer screen, workstation size, partition height and finish, ceilingheight, floor finish, lighting type and location, diffuser type and location, whether the VDT had an anti-glarescreen, and whether the occupant was wearing headphones when first approached. After completing thisscreen the operator was prompted to enter any additional comments.
At each stage in this process the operator could visually check the data and redo measurements ifnecessary. All data were recorded to a time-stamped text file on the laptop computer. Typically thephysical measurements were completed before the questionnaire, in which case NRC staff simply waitedfor the participant to return to the workstation with the palmtop computer.

ES 1. Scale Validation & Methods Veitch, Farley & Newsham
IRC-IR-844 - 16 -
The NRC team then moved on to invite the next available person to participate. There was no setplan as to which employees were approached when, and some work areas were revisited several times torecruit employees who had been unavailable on previous visits to the work area.
NRC staff returned after normal working hours (typically 7– 10 pm) to perform additional measurements with the
cart+chair system. These measurements provided baseline data without occupants, and data on the lightlevel provided by the electric lighting system independent of any daylight contribution. Measurementswere made in a subset (around 1/3) of the workstations that were visited during the day.
Measurements at night with the cart+chair system followed essentially the same protocol as thedaytime measurements, with the following exceptions:
2.4.3 Night-time measurements.
Figure 6. Illuminance sensor locations for additional night-time measurements (electriclighting only).

ES 1. Scale Validation & Methods Veitch, Farley & Newsham
IRC-IR-844 - 17 -
• Photographs were not taken, as they would have added little more information to the daytimephotographs.
• Additional desktop lighting measurements were made (Figure 6).• Workstation information on was not entered as it would have only duplicated the daytime data.
At night we also took the opportunity to take additional photographs not related to a particularworkstation (e.g., overall views, light fixtures, diffuser types).
At the end of every evening of measurements all data collected with the cart+chair system thatday, including questionnaire responses and photographs, were backed up to disk and CD-ROM.
Two additional NRC staff conducted the night-time sound propagation measurements. Night-time
sound propagation measurements were made in every workstation where daytime measurements hadbeen made (although not necessarily on the same day). The participant’s workstation acted as thereceiver workstation, and the source workstation was selected as the adjacent workstation from whichspeech sounds could most readily propagate. The sound source was located at the centre of the source workstation and was pointed towardsthe receiver workstation. The centre of the square receiver array was located at the centre of thereceiver workstation. Locating the source and receivers at the centres of each workstation approximatedthe average of the many possible occupant positions.
These sound propagation measurements were combined with the daytime ambient noise levelsmeasured using the cart+chair system to assess the expected speech privacy between adjacentworkstations. A number of other acoustical measures were also derived from these two sets ofmeasurements.
3.0 Results
This report concerns only the questionnaire data from time 1. Data concerning the physicalconditions data, and analyses of other relationships between physical variables and questionnaire data, willbe reported elsewhere.
3.1 Descriptive Statistics and Data ScreeningThe questionnaire data were transformed from their original format (Microsoft Excel) into a data
file that could be read by EQS for Windows 5.7b (Bentler & Wu, 1995). A careful review of thetransformed data confirmed the accuracy of data input. Data preparation and screening was conductedusing the procedures recommended by Kline (1997). Univariate normality was assessed by examining thekurtosis and skewness values of the individual items. According to Kline, skewness values greater than anabsolute value of 3 and kurtosis values greater than an absolute value of 8 indicate univariate normalityproblems. Univariate outliers were identified by examining frequency distributions of standardised scoresand multivariate outliers were detected by examining the values of the Mahalanobis distance statistic.Spot checks of several scatterplots indicated the presence of bivariate normality and linearity. Multivariatenormality was assessed by examining the probability plot for each variable. Correlation matrices wereexamined to check for multicollinearity and singularity (these terms refer to circumstances in whichvariables are very highly correlated, so that understanding their separate relations to other variables isimpossible).
The full sample data set (N=419) was screened for analyses that required the entire sample.Variable mean imputation was used for each observation of 19 cases that had missing data because thenumber of cases was small and the missing data were distributed across participants. A total of 12
2.4.4 Night-time acoustics measurements

ES 1. Scale Validation & Methods Veitch, Farley & Newsham
IRC-IR-844 - 18 -
univariate (4) and multivariate (8) outliers were identified and dropped leaving a total of 407 cases foranalysis. Table 5 shows the descriptive statistics for the entire sample of 419, the basis for thesedecisions.
Table 5. Descriptive Statistics: Entire SampleQuestion Mean Standard
DeviationKurtosis Skewness
EFR-1 Amount of lighting on the desktop 5.20 1.52 0.01 -0.93EFR-2. Overall air quality in your work area 4.22 1.64 -1.19 -0.21EFR-3. Temperature in your work area 4.22 1.64 -1.16 -0.27EFR-4. Aesthetic appearance of your office 4.22 1.66 -0.93 -0.29EFR-5. Level of privacy for conversations in your office 2.83 1.67 -0.68 0.68EFR-6. Level of visual privacy within your office 4.08 1.83 -1.22 -0.21EFR-7. Amount of noise from other people’s conversationswhile you are at your workstation
3.02 1.60 -0.83 0.45
EFR-8. Size of your personal workspace to accommodateyour work, materials, and visitors
4.60 1.78 -0.86 -0.57
EFR-9. Amount of background noise (i.e. not speech) youhear at your workstation
4.22 1.56 -0.31 -0.96
EFR-10. Amount of light for computer work 4.95 1.44 -0.81 -0.21EFR-11. Amount of reflected light or glare in the computerscreen
4.38 1.64 -0.36 -1.01
EFR-12. Air movement in your work area 3.82 1.64 -0.08 -0.16EFR-13. Your ability to alter physical conditions in yourwork area
3.51 1.62 0.18 -0.93
EFR-14. Your access to a view of outside from where you sit 4.47 2.26 -0.37 -1.41EFR-15. Distance between you and other people you workwith
4.84 1.51 -0.28 -0.75
EFR-16. Quality of lighting in your work area 4.79 1.52 -0.68 -0.64EFR-17. Frequency of distractions from other people 3.76 1.53 -0.96 0.05EFR-18. Degree of enclosure of your work area by walls,screens or furniture
5.01 1.10 1.56 -0.90
OES-1. Effect of environmental conditions on personalproductivity.
3.82 1.47 -0.62 0.22
OES-2. Indoor environment in your workstation, as a whole 4.20 1.53 -1.06 -0.10JS-1. My department/agency is a good place to work 5.01 1.10 -0.90 1.56JS-2. I am satisfied with my job 4.99 1.23 -0.72 0.76Note. EFR: Environmental Features Rating. OES: Overall Environmental Satisfaction. JS: Job Satisfaction.
3.2 Independent SubsamplesTo establish the latent variable structure of the 18-item Environmental Features Ratings, two
independent groups were required. Using the case selection specification procedure in EQS, the data wasthen randomly split into two groups, one for the exploratory factor analysis (EFA, N=210) and one for theconfirmatory factor analysis (CFA, N=209).
The EFA group consisted of 210 subjects and represented all three sites insimilar proportions to the overall group (Site 1, 32.9%; Site 2, 30.5%; and,
Site 3, 39.7%), and was similar to the overall sample in terms of language of response (English, 88.10%;French, 11.90%), sex (males 51 %; females, 47.6 %), age (39.0 years), job category (professional, 41 %;administration, 36.3%; technical, 15.7%; and, managerial, 7.1%) and education level (undergraduatedegree, 25.2%; graduate degree, 23.8%).
3.2.1 EFA group.

ES 1. Scale Validation & Methods Veitch, Farley & Newsham
IRC-IR-844 - 19 -
The data for the exploratory factor analysis (EFA) group was screened in accordance with theprocedures outlined above. The mean, standard deviation, kurtosis and skewness for first 18 satisfactionitems are presented in Table 6 (other variables are not included because they were not used in the EFA).Because the proportion of missing data was very low (5.2%) and scattered across several variables, itwas decided to impute the variable mean for each missing observation (Kline, 1997). For this data, themaximum skewness value was -.895 and the maximum kurtosis value was -1.383. Therefore, thesevalues were not considered problematic. There were three cases of univariate outliers with standardisedscores greater than + or –3. Using Mahalanobis distance with p <.001, five cases were identified asmultivariate outliers. Given that the remaining number of cases would be sufficient for the analysis(N=202) it was decided to delete the eight univariate and multivariate outliers (Kline, 1997).
Table 6. Descriptive Statistics: EFA GroupQuestion Mean Standard
DeviationKurtosis Skewness
EFR-1 Amount of lighting on the desktop 5.34 1.36 0.05 0.90EFR-2. Overall air quality in your work area 4.23 1.68 -1.06 -0.37EFR-3. Temperature in your work area 4.23 1.73 -1.16 -0.35EFR-4. Aesthetic appearance of your office 4.37 1.58 -0.92 -0.31EFR-5. Level of privacy for conversations in your office 2.86 1.74 -0.73 0.69EFR-6. Level of visual privacy within your office 4.18 1.89 -1.25 -0.27EFR-7. Amount of noise from other people’s conversationswhile you are at your workstation
3.07 1.58 -0.90 0.42
EFR-8. Size of your personal workspace to accommodateyour work, materials, and visitors
4.61 1.74 -0.85 -0.57
EFR-9. Amount of background noise (i.e. not speech) youhear at your workstation
4.22 1.55 -0.95 -0.25
EFR-10. Amount of light for computer work 5.02 1.39 0.04 -0.84EFR-11. Amount of reflected light or glare in the computerscreen
4.39 1.56 -0.93 -0.38
EFR-12. Air movement in your work area 3.94 1.66 -1.14 -0.17EFR-13. Your ability to alter physical conditions in yourwork area
3.53 1.67 -0.95 0.20
EFR-14. Your access to a view of outside from where you sit 4.49 2.24 -1.38 -0.37EFR-15. Distance between you and other people you workwith
4.80 1.57 -0.44 -0.72
EFR-16. Quality of lighting in your work area 4.87 1.45 -0.64 -0.59EFR-17. Frequency of distractions from other people 3.79 1.52 -1.04 0.02EFR-18. Degree of enclosure of your work area by walls,screens or furniture
4.61 1.62 -0.76 -0.48
To test for multicollinearity and singularity, a correlation matrix for the 18 satisfaction items wasconstructed (Table 7). Examination of the matrix did not identify any correlations above .80 (themaximum correlation value was .76 between the items ‘overall air quality in your work space’ and ‘airmovement in your workspace’). This indicated the absence of multicollinearity. The matrix was alsoexamined to determine the factorability of the scale. The majority of correlations were above .30 for allvariables except one. The item ‘your access to a view from where you sit’ had only one correlation above.3 (.30; ‘the aesthetic appearance of your office’) indicating potential factorability problems. A review ofthe communality values indicated the same variable had a value of 1.0. A variable with a communalityscore exceeding a value of 1 may cause the covariance matrix to be singular (Kline, 1997). Given that the

ES 1. Scale Validation & Methods Veitch, Farley & Newsham
IRC-IR-844 - 20 -
variable has a strong theoretical reason for being included in the questionnaire, it was decided to keep thevariable in the data for the purposes of the EFA.

Table 7. Intercorrelations between EFR questions for EFA group.EFR-1 EFR-2 EFR-3 EFR-4 EFR-5 EFR-6 EFR-7 EFR-8 EFR-9 EFR-10 EFR-11 EFR-12 EFR-13 EFR-14 EFR-15 EFR-16 EFR-17 EFR-18
EFR-1 1.00EFR-2 0.37 1.00EFR-3 0.19 0.57 1.00EFR-4 0.30 0.31 0.20 1.00EFR-5 0.25 0.39 0.25 0.45 1.00EFR-6 0.23 0.36 0.30 0.38 0.63 1.00EFR-7 0.19 0.35 0.22 0.36 0.71 0.51 1.00EFR-8 0.24 0.25 0.27 0.42 0.41 0.47 0.31 1.00EFR-9 0.25 0.31 0.30 0.32 0.37 0.48 0.49 0.24 1.00EFR-10 0.60 0.39 0.26 0.38 0.32 0.35 0.24 0.33 0.33 1.00EFR-11 0.30 0.34 0.41 0.30 0.37 0.37 0.34 0.33 0.34 0.60 1.00EFR-12 0.25 0.76 0.57 0.31 0.44 0.39 0.37 0.26 0.32 0.38 0.37 1.00EFR-13 0.26 0.38 0.38 0.48 0.51 0.40 0.44 0.42 0.30 0.33 0.37 0.42 1.00EFR-14 0.23 0.10 -0.14 0.30 0.06 -0.01 0.03 0.19 -0.05 0.17 -0.07 0.16 0.06 1.00EFR-15 0.23 0.30 0.20 0.36 0.44 0.48 0.40 0.30 0.40 0.36 0.32 0.30 0.31 0.10 1.00EFR-16 0.71 0.40 0.25 0.32 0.31 0.30 0.28 0.24 0.27 0.73 0.44 0.41 0.31 0.25 0.32 1.00EFR-17 0.23 0.36 0.28 0.25 0.55 0.43 0.71 0.24 0.50 0.32 0.33 0.39 0.36 -0.03 0.37 0.36 1.00EFR-18 0.23 0.28 0.22 0.42 0.44 0.57 0.42 0.49 0.33 0.35 0.24 0.32 0.36 0.11 0.42 0.26 0.43 1.00

ES 1. Scale Validation & Methods Veitch, Farley & Newsham
IRC-IR-844 - 22 -
The CFA group consisted of 209 subjects and was equivalent to the overallsample and to the EFA group in terms of site, (Site 1, 30.1%; Site 2, 30.1%;
and, Site 3, 39.7%) language of responding, (English, 87.6%; French, 12.4%), sex (males 49.8%; females,50.2%), age (38.2 years), job category (professional, 41.6%; administration, 34.8%; technical, 15.7%; and,managerial, 6.2%) and education level (undergraduate degree, 26.0%; graduate degree, 23%).
The data from the CFA group was screened using the same procedures as were used for theEFA group. There were 9 cases of missing data (4.39%) scattered across several variables so variablemean imputation was used for each observation. The mean, standard deviation, kurtosis and skewness forall items in the CFA group are presented in Table 8. Similar to the EFA group, checks of univariatenormality, linearity and multivariate normality revealed no problems for these data. One univariate and 3multivariate outliers were identified in the CFA group. These cases were deleted leaving 205 cases forthe analysis.
Table 8. Descriptive Statistics: CFA GroupQuestion Mean Standard
DeviationKurtosis Skewness
EFR-1 Amount of lighting on the desktop 5.11 1.60 -0.22 -0.87EFR-2. Overall air quality in your work area 4.06 1.62 -1.29 -0.03EFR-3. Temperature in your work area 4.22 1.55 -1.23 -0.16EFR-4. Aesthetic appearance of your office 4.16 1.71 -0.96 -0.25EFR-5. Level of privacy for conversations in your office 2.82 1.60 -0.62 0.65EFR-6. Level of visual privacy within your office 4.00 1.75 -1.20 -0.14EFR-7. Amount of noise from other people’s conversationswhile you are at your workstation
3.04 1.63 -0.81 0.42
EFR-8. Size of your personal workspace to accommodateyour work, materials, and visitors
4.58 1.82 -0.89 -0.57
EFR-9. Amount of background noise (i.e. not speech) youhear at your workstation
4.28 1.54 -0.97 -0.36
EFR-10. Amount of light for computer work 4.86 1.48 -0.40 -0.76EFR-11. Amount of reflected light or glare in the computerscreen
4.39 1.68 -1.09 -0.33
EFR-12. Air movement in your work area 3.76 1.59 -1.14 0.01EFR-13. Your ability to alter physical conditions in yourwork area
3.57 1.56 -0.86 0.14
EFR-14. Your access to a view of outside from where you sit 4.43 2.25 -1.43 -0.34EFR-15. Distance between you and other people you workwith
4.90 1.40 -0.22 -0.74
EFR-16. Quality of lighting in your work area 4.77 1.54 -0.76 -0.67EFR-17. Frequency of distractions from other people 3.79 1.54 -0.88 0.05EFR-18. Degree of enclosure of your work area by walls,screens or furniture
4.45 1.58 -0.83 -0.43
A review of the correlation matrix (Table 9) and communality values revealed no evidence ofmulticollinearity (all correlations <.80) or singularity (all communality values <1.0). Similar to the EFAgroup, the majority of correlations were above .30 for all variables except "your access to a view fromwhere you sit" which had only 1 correlation above .3 (.42; "the amount of lighting on the desktop"). Giventhese findings it was decided to proceed with the CFA.
3.2.2 CFA group.

Table 9. Intercorrelations between EFR questions for CFA groupEFR-1 EFR-2 EFR-3 EFR-4 EFR-5 EFR-6 EFR-7 EFR-8 EFR-9 EFR-10 EFR-11 EFR-12 EFR-13 EFR-14 EFR-15 EFR-16 EFR-17 EFR-18
EFR-1 1.00EFR-2 0.37 1.00EFR-3 0.22 0.50 1.00EFR-4 0.39 0.20 0.27 1.00EFR-5 0.29 0.18 0.22 0.44 1.00EFR-6 0.22 0.23 0.10 0.43 0.58 1.00EFR-7 0.28 0.18 0.11 0.41 0.61 0.53 1.00EFR-8 0.19 0.15 0.15 0.50 0.34 0.40 0.35 1.00EFR-9 0.28 0.23 0.12 0.36 0.38 0.52 0.53 0.37 1.00EFR-10 0.58 0.39 0.32 0.48 0.28 0.28 0.27 0.34 0.37 1.00EFR-11 0.26 0.26 0.31 0.23 0.16 0.20 0.21 0.20 0.28 0.46 1.00EFR-12 0.35 0.72 0.53 0.27 0.24 0.24 0.15 0.15 0.22 0.39 0.30 1.00EFR-13 0.28 0.29 0.21 0.54 0.35 0.31 0.44 0.46 0.36 0.43 0.22 0.26 1.00EFR-14 0.42 0.13 0.05 0.20 0.18 0.12 0.07 0.09 0.14 0.32 -0.11 0.25 0.14 1.00EFR-15 0.28 0.19 0.13 0.37 0.42 0.49 0.40 0.44 0.38 0.44 0.27 0.12 0.37 0.27 1.00EFR-16 0.71 0.35 0.25 0.49 0.32 0.26 0.25 0.32 0.33 0.70 0.39 0.44 0.38 0.40 0.39 1.00EFR-17 0.17 0.26 0.04 0.27 0.40 0.42 0.60 0.32 0.50 0.24 0.29 0.20 0.36 0.09 0.44 0.24 1.00EFR-18 0.24 0.20 0.12 0.50 0.40 0.53 0.47 0.58 0.47 0.38 0.33 0.20 0.52 0.09 0.47 0.29 0.45 1.00

ES 1. Scale Validation & Methods Veitch, Farley & Newsham
IRC-IR-844 - 24 -
3.3 Exploratory Factor AnalysisWe used exploratory factor analysis to identify the existence of theoretical latent or underlying
variables. This is a statistical technique that examines the intercorrelations between scores that individualsprovide on individual questions, seeking a simple structure of interpretable underlying variables that mightexplain the intercorrelations.
Using the factor analysis procedure in EQS (maximum likelihood extraction and direct obliminrotation) a free EFA was conducted to determine the number of factors. The cutoff for factor loadings tobe included in a factor was .4. This resulted in a solution with four factors having eigenvalues greater than1 (range = 1.038 to 7.213). Examination of the scree plot supported the four-factor solution. The four-factor solution was composed of three clear factors (labelled Satisfaction with Privacy, Satisfaction withLighting, and Satisfaction with Ventilation) with several high value loading items on each (Table 10). Afourth factor was a stand-alone factor (View) consisting of only one variable. Although these resultssupport a four-factor solution, the correlational problem with the "view" item identified during datascreening appeared to be negatively influencing this solution. According to Tabachnick and Fidell (2001)“if only one variable loads highly on a factor, the factor is poorly defined” (p. 622). Therefore, a three-factor EFA solution was forced.
Table 10. Factor loadings for rotated four-factor EFA solutionQuestion Sat. with
PrivacySat. withLighting
Sat. withVentilation
Sat. withView
EFR-7. Amount of noise from other people’s conversationswhile you are at your workstation
.79
EFR-17. Frequency of distractions from other people .72EFR-18. Degree of enclosure of your work area by walls,screens or furniture
.70
EFR-6. Level of visual privacy within your office .69EFR-15. Distance between you and other people you workwith
.69
EFR-5. Level of privacy for conversations in your office .66EFR-9. Amount of background noise (i.e. not speech) youhear at your workstation
.65
EFR-8. Size of your personal workspace to accommodateyour work, materials, and visitors
.56
EFR-13. Your ability to alter physical conditions in yourwork area
.52
EFR-4. Aesthetic appearance of your office .49EFR-16. Quality of lighting in your work area .78EFR-1 Amount of lighting on the desktop .77EFR-10. Amount of light for computer work .69EFR-11. Amount of reflected light or glare in the computerscreen
.56
EFR-12. Air movement in your work area .78EFR-2. Overall air quality in your work area .73EFR-3. Temperature in your work area .71EFR-14. Your access to a view of outside from where you sit .69Eigenvalues 7.21 1.99 1.47 1.04Note. Factor loading cut-off = .400
The three-factor solution (labelled Satisfaction with Privacy, Satisfaction with Lighting, andSatisfaction with Ventilation) was made up of the same items in the three-factor solution (Table 11). In

ES 1. Scale Validation & Methods Veitch, Farley & Newsham
IRC-IR-844 - 25 -
this case, all items appeared in the same factor as previously with the exception of EFR-14 (access to aview of outside), which loaded moderately (.54) on the Satisfaction with Lighting factor. The three factorsaccounted for 57.05% of the total variance observed. There were no cross loadings and all items loadedsignificantly on a factor, therefore all were retained. Internal consistency values (Cronbach’s alpha) weresatisfactory for each factor. Correlations among factors met the criteria for oblique (direct oblimin)rotation (Table 12). According to Tabachnick and Fidell (2001), if correlations exceed .32 on average,there is enough variance overlap among factors to warrant oblique rotation.
Table 11. Rotated three-factor EFA solutionQuestion Sat. with
PrivacySat. withVentilation
Sat. withLighting
EFR-7. Amount of noise from other people’s conversationswhile you are at your workstation
.79
EFR-17. Frequency of distractions from other people .71EFR-18. Degree of enclosure of your work area by walls,screens or furniture
.72
EFR-6. Level of visual privacy within your office .71EFR-15. Distance between you and other people you workwith
.68
EFR-5. Level of privacy for conversations in your office .79EFR-9. Amount of background noise (i.e. not speech) youhear at your workstation
.64
EFR-8. Size of your personal workspace to accommodateyour work, materials, and visitors
.57
EFR-13. Your ability to alter physical conditions in yourwork area
.56
EFR-4. Aesthetic appearance of your office .51EFR-12. Air movement in your work area .71EFR-2. Overall air quality in your work area .71EFR-3. Temperature in your work area .70EFR-16. Quality of lighting in your work area .65EFR-1 Amount of lighting on the desktop .65EFR-10. Amount of light for computer work .56EFR-11. Amount of reflected light or glare in the computerscreen
.44
EFR-14. Your access to a view of outside from where you sit .54% of variance explained 26.1 16.6 14.4Cronbach’s alpha .88 .82 .76Note. Factor loading cut-off = .400
Table 12. Factor correlations for three-factor solutionFactor Sat. with
PrivacySat. with
VentilationSat. withLighting
Satisfaction with Privacy 1.00Satisfaction with Ventilation .44 1.00Satisfaction with Lighting .39 .25 1.00
3.4 Confirmatory Factor AnalysisConfirmatory factor analysis is a form of structural equation modelling, in which the investigator
specifies a model that is expected to describe the observed data. The fit of the model to the data isevaluated against several criteria, the pattern of which leads to a judgement as to whether the fit is
ES 1. Scale Validation & Methods Veitch, Farley & Newsham
IRC-IR-844 - 26 -
acceptably good or not (Kline, 1997). In this study, the initial model was the three-factor solutiondeveloped in the EFA step. It was tested against the interrelations between responses for the CFA group(recall that this group was independent of the EFA group).
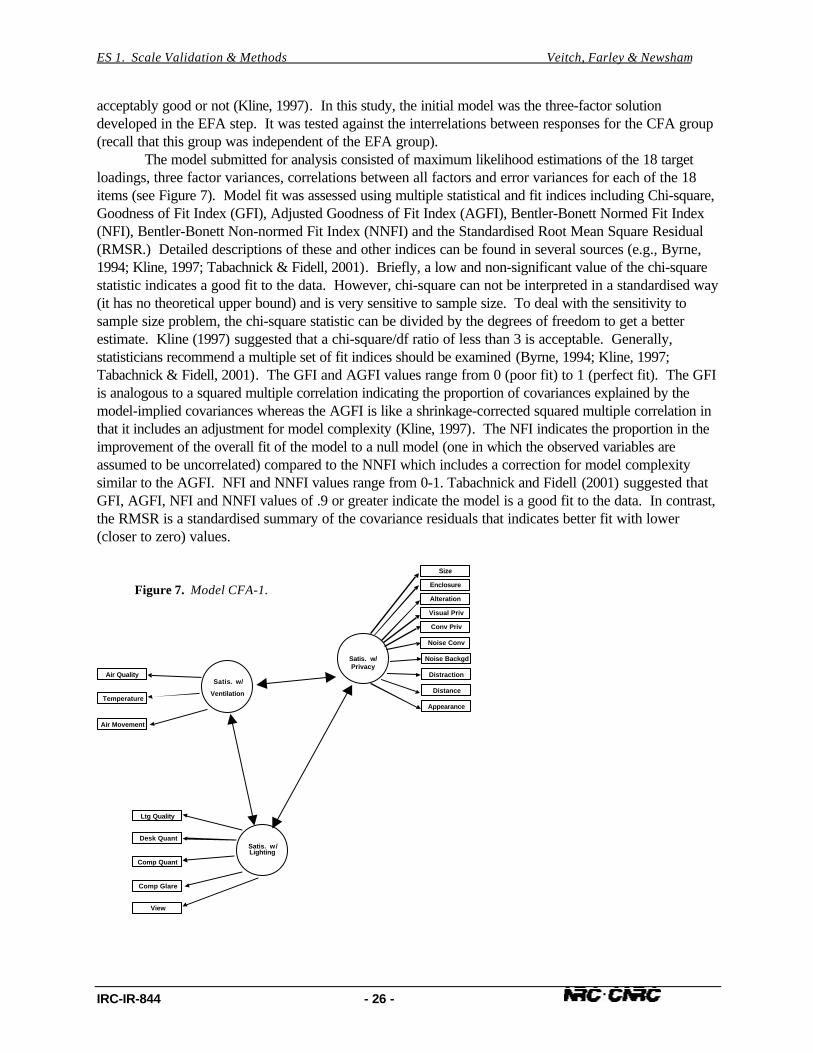
The model submitted for analysis consisted of maximum likelihood estimations of the 18 targetloadings, three factor variances, correlations between all factors and error variances for each of the 18items (see Figure 7). Model fit was assessed using multiple statistical and fit indices including Chi-square,Goodness of Fit Index (GFI), Adjusted Goodness of Fit Index (AGFI), Bentler-Bonett Normed Fit Index(NFI), Bentler-Bonett Non-normed Fit Index (NNFI) and the Standardised Root Mean Square Residual(RMSR.) Detailed descriptions of these and other indices can be found in several sources (e.g., Byrne,1994; Kline, 1997; Tabachnick & Fidell, 2001). Briefly, a low and non-significant value of the chi-squarestatistic indicates a good fit to the data. However, chi-square can not be interpreted in a standardised way(it has no theoretical upper bound) and is very sensitive to sample size. To deal with the sensitivity tosample size problem, the chi-square statistic can be divided by the degrees of freedom to get a betterestimate. Kline (1997) suggested that a chi-square/df ratio of less than 3 is acceptable. Generally,statisticians recommend a multiple set of fit indices should be examined (Byrne, 1994; Kline, 1997;Tabachnick & Fidell, 2001). The GFI and AGFI values range from 0 (poor fit) to 1 (perfect fit). The GFIis analogous to a squared multiple correlation indicating the proportion of covariances explained by themodel-implied covariances whereas the AGFI is like a shrinkage-corrected squared multiple correlation inthat it includes an adjustment for model complexity (Kline, 1997). The NFI indicates the proportion in theimprovement of the overall fit of the model to a null model (one in which the observed variables areassumed to be uncorrelated) compared to the NNFI which includes a correction for model complexitysimilar to the AGFI. NFI and NNFI values range from 0-1. Tabachnick and Fidell (2001) suggested thatGFI, AGFI, NFI and NNFI values of .9 or greater indicate the model is a good fit to the data. In contrast,the RMSR is a standardised summary of the covariance residuals that indicates better fit with lower(closer to zero) values.
Figure 7. Model CFA-1.
Satis. w/
Ventilation
Air Quality
Temperature
Air Movement
Satis. w/Lighting
Desk Quant
Comp Quant
Comp Glare
View
Ltg Quality
Satis. w/Privacy
Alteration
Enclosure
Distance
Appearance
Size
Conv Priv
Noise Backgd
Distraction
Visual Priv
Noise Conv

ES 1. Scale Validation & Methods Veitch, Farley & Newsham
IRC-IR-844 - 27 -
Table 13. CFA results: Goodness of fit indices? 2 ? 2/df GFI AGFI NFI NNFI RMSR
Optimal fit < 3 > .90 >.90 >.90 >.90 <.10CFA-1 363.4 2.75 .83 .77 .78 .82 .07CFA-2 353.2 2.69 .83 .78 .79 .83 .07Note. CFA-1, figure 7. CFA-2, figure 8. Full results with parameter estimates in Appendix E. N=205. Optimal valuesand their sources are described in the text.
Table 13 shows a summary of the results of the CFA, including optimal values for the various fitindices. The results for CFA-1 indicated a marginal fit between the model and the data. The LegrangeMultiplier (LM) test and the Wald W statistic were examined to determine possible misfits. The LM testprovides an estimate of how much the overall chi-square statistic would decrease if a particular parameterwere added. Conversely, the Wald W test estimates the amount the overall chi-square would increase if aparticular free parameter were fixed, that is, dropped from the model. In this case, the Wald W testindicated the model would not be improved by dropping any parameters. The LM test indicated the modelcould be improved by adding a parameter from the variable "the aesthetic appearance of your office" toFactor 3 Lighting. Satisfaction with the appearance of one’s office or workspace might reasonably berelated to the quality of lighting available. Therefore, it was decided to add the parameter and run a posthoc model.
This model, labelled CFA-2, is summarised in Table 13 and Figure 8. Additional parameters werefurther examined: the frequency distribution of the standardised residuals revealed that most residuals(91.81%) fell between -.10 and .10, which is desirable. All estimated factor loadings were significant andinternal consistency values for each subscale were satisfactory (Privacy, alpha = .89; Lighting, alpha =.82; and, Ventilation, alpha = .82). However, this result was not judged to be enough of an improvementover CFA Model 1 to warrant the additional complexity of a cross-loading item (a variable contributing to
Figure 8. Model CFA-2.
Satis. w/
Ventilation
Air Quality
Temperature
Air Movement
Satis. w/Lighting
Desk Quant
Comp Quant
Comp Glare
View
Ltg Quality
Satis. w/Privacy
Alteration
Enclosure
Distance
Appearance
Size
Conv Priv
Noise Backgd
Distraction
Visual Priv
Noise Conv

ES 1. Scale Validation & Methods Veitch, Farley & Newsham
IRC-IR-844 - 28 -
more than one latent variable). The cross-loading item would have complicated interpretation of furtheranalyses.
3.5 Relations to Overall Environmental Satisfaction and Job SatisfactionStructural equation modelling (SEM) was used to examine relationships between the EFR latent
variables model and the variables Overall Environmental Satisfaction and Job Satisfaction. The initialmodel to be tested hypothesized that all the latent variables were correlated. That is, it consisted of threefactors identical to the final CFA solution and included bidirectional paths from each factor to a compositeJob Satisfaction factor consisting of two items ("I am satisfied with my job" and "my department/agency isa good place to work") and another composite Environmental Satisfaction factor consisting of two items("indoor environment in your workstation as a whole", "effect of environmental conditions on personalproductivity" (Figure 9). Table 14 summarises this model.
Table 14. SEM results: Goodness of fit indices? 2 ? 2/df GFI AGFI NFI NNFI RMSR
Optimal fit < 3 > .90 >.90 >.90 >.90 <.10SEM-1 629.3 3.16 .86 .82 .84 .87 .06SEM-2 644.0 3.19 .86 .82 .84 .87 .06Note. SEM-1, Figure 9. SEM-2, figure 10. Full results with parameter estimates in Appendix E. N=407. Optimalvalues and their sources are described in the text.
The results for SEM-1 indicated a moderately good fit between the model and the data. (SeeAppendix E for the full model with parameters.) However, the choice of bidirectional relations betweenthe latent variables was somewhat arbitrary. We reconsidered the model, considering results such asWells (2000), who found a direct unidirectional relationship between environmental satisfaction and job
Figure 9. Model SEM-1.
Satis. w/
Ventilation
Air Quality
Temperature
Air Movement
Satis. w/Lighting
Desk Quant
Comp Quant
Comp Glare
View
Ltg Quality
Satis. w/Privacy
Alteration
Enclosure
Distance
Appearance
Size
Conv Priv
Noise Backgd
Distraction
Visual Priv
Noise Conv
Overall ES
Env Sat
Self-Prod
Job Satis
Good place
Sat w/ job

ES 1. Scale Validation & Methods Veitch, Farley & Newsham
IRC-IR-844 - 29 -
satisfaction. We tested this model, labelled SEM-2 in table 14 and shown in Figure 10. The model fit wasalmost identical to the first model. Model SEM-2 is more parsimonious, having fewer paths and aninterpretable relationship similar to other investigations.
4.0 Discussion
This is the first of a series of reports about the COPE project field study. The field study is a pre-post renovation study of employees in open-plan workstations, in which detailed physical measurementsare taken in conjunction with a satisfaction questionnaire. The investigation will result in informationconcerning the relationships between these physical parameters and environmental satisfaction, bothoverall and specific to subscales or components of environmental satisfaction. This report describes thedetailed methodology and establishes subscales of environmental satisfaction for use in future analyses ofthese data.
Several underlying latent variables were expected to emerge in the exploratory and confirmatoryfactor analyses of these time 1 data. The results were consistent with the prediction, but were mostinterpretable when a three-factor solution was forced in EFA The resulting components of environmentalsatisfaction were labelled Satisfaction with Privacy, Satisfaction with Ventilation, and Satisfaction withLighting. Over 50% of the variance in responses to the 18 items was explained, a good result, and theinternal consistency reliabilities were high. The CFA-1 model derived from the EFA result showedacceptable fit to the data. Future analyses with these components will use subscale scores that arearithmetic means of responses to the questions loading heavily on these three components (see Figure 7).
The result is broadly similar to other analyses of similar scales, although comparisons are trickybecause of differing sets of items included and different analytic choices and because some investigatorshave used multivariate techniques despite small sample sizes. For instance, González, Fernández, &Cameselle (1997) found five latent variables underlying environmental evaluations, which they named
Satis. w/
Ventilation
Air Quality
Temperature
Air Movement
Satis. w/Lighting
Desk Quant
Comp Quant
Comp Glare
View
Ltg Quality
Satis. w/Privacy
Alteration
Enclosure
Distance
Appearance
Size
Conv Priv
Noise Backgd
Distraction
Visual Priv
Noise Conv
Overall ES
Env Sat
Self-Prod
Job Satis
Good place
Sat w/ job
Figure 10. Model SEM-2.

ES 1. Scale Validation & Methods Veitch, Farley & Newsham
IRC-IR-844 - 30 -
Evaluation (aesthetics), Temperature, Noise, Air, and Space; their analysis of a 13-item scale had only 83participants (subjects:items = 6.4). Veitch and Newsham (1998) used a variation of the Stokols andScharf (1990) Ratings of Environmental Features and reported a five-factor solution (Noise, Ventilation,Furniture, Washrooms, and Lighting), based on 294 participants and 23 items, a more acceptablesubjects:items ratio (12.8). However, they used principal components analysis with Varimax rotation, atechnique that does not permit correlations between components, as was the case here. Some authorswould argue that intercorrelated components are logically expected with ratings of environments, whichare experienced as an integrated whole.
The initial result for the free EFA revealed a four-factor solution (Satisfaction with Privacy,Satisfaction with Ventilation, and Satisfaction with Lighting and Satisfaction with View), in whichSatisfaction with View had only one item loading on it. This indicated that the factor was poorly defined,resulting in the forced three-factor solution. The item loading on the View factor ("your access to a viewfrom where you sit") presented some problems in data screening but was retained for theoretical reasons(e.g., Sundstrom, 1987). When a three-factor solution was forced, the item loaded on the Lighting factor.The problem with the item appears to be correlational. That is, it correlated moderately with only one otheritem ("the aesthetic appearance of your office"). This item proved to be somewhat problematic in theCFA analyses. Although this relation is logical (access to a view may be related to the general aestheticappearance of one’s office), the question might have been difficult to answer for those people without awindow. Including these items in both the EFA and CFA might contributed to the marginal to moderate fitof the model to the data in the CFA and subsequent analyses. Future analyses will closely examine therole of having a window as a determinant of environmental satisfaction.
We tested two overall models of relations between the three components of environmentalsatisfaction, overall environmental satisfaction, and job satisfaction. The second (SEM-2, Figure 10)revealed good consistency with the conceptual model for the field study (Figure 1), moderately good fit,parsimony, and consistency with the literature. Wells (2000) also found that environmental satisfactionpredicted job satisfaction, as did Dillon and Vischer (1987). Although the fit was not perfect, we takeSEM-2 as a good representation of the data, and a guide for future research. People who are moresatisfied with the work environment report higher job satisfaction.
This finding is important both as a validation of the Environmental Features Ratings, the 18-itemscale developed for this field study, and because of the link it establishes between the physical workenvironment and the organisational psychology literature. Carlopio (1996) found that satisfaction with thephysical work environment including environmental design (e.g., light quality, light direction, air quality,cleanliness) and job satisfaction together predicted organisation commitment and intent to turnover.Hellman (1997) conducted a meta-analysis of over 50 studies, confirming that the relationship between jobsatisfaction and intent to leave was significantly different from zero and consistently negative. Thepresent findings suggest satisfaction with the indoor environment may play an indirect role in intent toturnover. This suggests a direction for future work, in which additional measurements of organisationaloutcomes such as organisational commitment, intent to turnover, or absenteeism might be added. Theaddition of such variables might permit tests of the hypothesis that better environmental conditionscontribute to organisational productivity.
5.0 References
Byrne, B. M. (1994). Structural equation modeling with EQS and EQS/Windows: Basic concepts,applications, and programming. Thousand Oaks, CA: Sage Publications.
Carlopio, J. R. (1996). Construct validity of a physical work environment satisfaction questionnaire.Journal of Occupational Health Psychology, 1, 330-344.

ES 1. Scale Validation & Methods Veitch, Farley & Newsham
IRC-IR-844 - 31 -
Dillon, R., & Vischer, J. C. (1987). Derivation of the Tenant Questionnaire Survey assessmentmethod: Office building occupant survey data analysis. Ottawa, ON: Architectural andEngineering Services. Public Works Canada.
González, M. S. R., Fernández, C. A., & Cameselle, J. M. S. (1997). Empirical validation of a model ofuser satisfaction with buildings and their environments as workplaces. Journal of EnvironmentalPsychology, 17, 69-74.
Hellman, C. M. (1997). Job satisfaction and intent to leave. Journal of Social Psychology, 137, 677-689.
Human Resources Development Canada (HRDC). (1989). Regulations respecting occupationalsafety and health made under Part II of the Canada Labour Code [SOR 89-525 (Part VI,Lighting)]. Ottawa, ON: HRDC.
Illuminating Engineering Society of North America (IESNA). (1993). American national standardpractice for office lighting (ANSI/IESNA-RP-1-1993). New York, NY: IESNA.
Kline, R. B. (1997). Principles and practice of structural equation modeling. New York: GuilfordPress.
Oldham, G. R., & Brass, D. J. (1979). Employee reactions to an open-plan office: A naturally-occurringquasi-experiment. Administrative Science Quarterly, 24, 267-284.
Ross, E. (1999). Public service employee opinion survey. Ottawa, ON: Special Survey Division.Statistics Canada.
Rubin, A. (1987). Office design measurements for productivity - a research overview (Report No.NBSIR 87-3688). Washington, D.C.: U.S. Dept of Commerce.
Stokols, D., & Scharf, F. (1990). Developing standardised tools for assessing employees' ratings offacility performance. In G. Davis, & F. T. Ventre (Eds.), Performance of Buildings andServiceability of Facilities (pp. 55-68). Philadelphia, PA: American Society for Testing andMaterials.
Sundstrom, E. (1987). Work environments: Offices and factories. D. Stokols, & I. Altman (Eds.),Handbook of Environmental Psychology (Vol. 1pp. 733-782). New York: Wiley.
Sundstrom, E., Bell, P. A., Busby, P. L., & Asmus, C. (1996). Environmental Psychology 1989-1994.Annual Review of Psychology, 47, 485-512.
Sutton, R. I., & Rafaeli, A. (1987). Characteristics of work stations as potential occupational stressors.Academy of Management Journal, 30(2), 260-276.
Tabachnick, B., & Fidell, L. (2001). Using multivariate statistics (5th ed.). Boston: Allyn and Bacon.Veitch, J. A., & Newsham, G. R. (1998). Lighting quality and energy-efficiency effects on task
performance, mood, health, satisfaction and comfort. Journal of the Illuminating EngineeringSociety, 27(1), 107-129.
Wells, M. M. (2000). Office clutter or meaningful personal displays: The role of office personalization inemployee and organizational well-being. Journal of Environmental Psychology, 20, 239-255.
Wilson, S., & Hedge, A. (1987). The office environment survey. London, UK: Building Use StudiesLtd.
Wyon, D. P. (1996). Indoor environmental effects on productivity. Proceedings of IAQ '96: Paths toBetter Building Environments (pp. 5-15). Atlanta, GA: American Society of Heating,Refrigerating, and Air Conditioning Engineers.

ES 1. Scale Validation & Methods Veitch, Farley & Newsham
IRC-IR-844 - 32 -
Appendix A

ES 1. Scale Validation & Methods Veitch, Farley & Newsham
IRC-IR-844 - 33 -

ES 1. Scale Validation & Methods Veitch, Farley & Newsham
IRC-IR-844 - 34 -

ES 1. Scale Validation & Methods Veitch, Farley & Newsham
IRC-IR-844 - 35 -

ES 1. Scale Validation & Methods Veitch, Farley & Newsham
IRC-IR-844 - 36 -

ES 1. Scale Validation & Methods Veitch, Farley & Newsham
IRC-IR-844 - 37 -

ES 1. Scale Validation & Methods Veitch, Farley & Newsham
IRC-IR-844 - 38 -
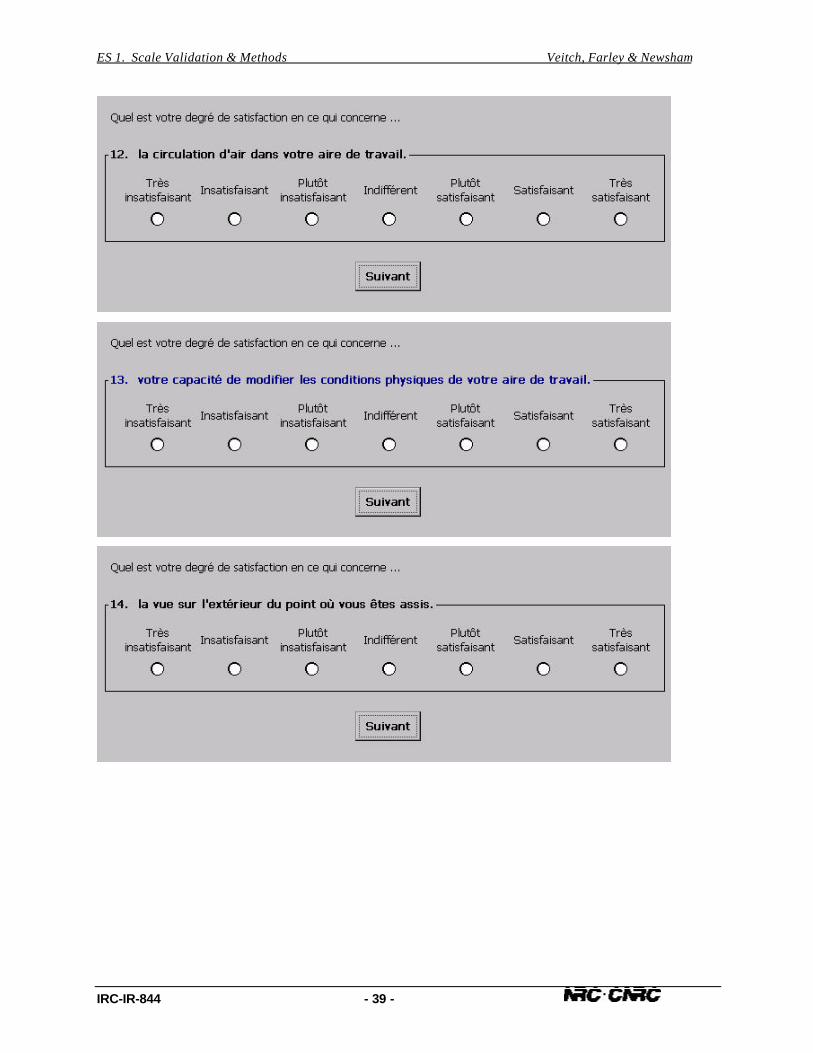
ES 1. Scale Validation & Methods Veitch, Farley & Newsham
IRC-IR-844 - 39 -

ES 1. Scale Validation & Methods Veitch, Farley & Newsham
IRC-IR-844 - 40 -

ES 1. Scale Validation & Methods Veitch, Farley & Newsham
IRC-IR-844 - 41 -

ES 1. Scale Validation & Methods Veitch, Farley & Newsham
IRC-IR-844 - 42 -
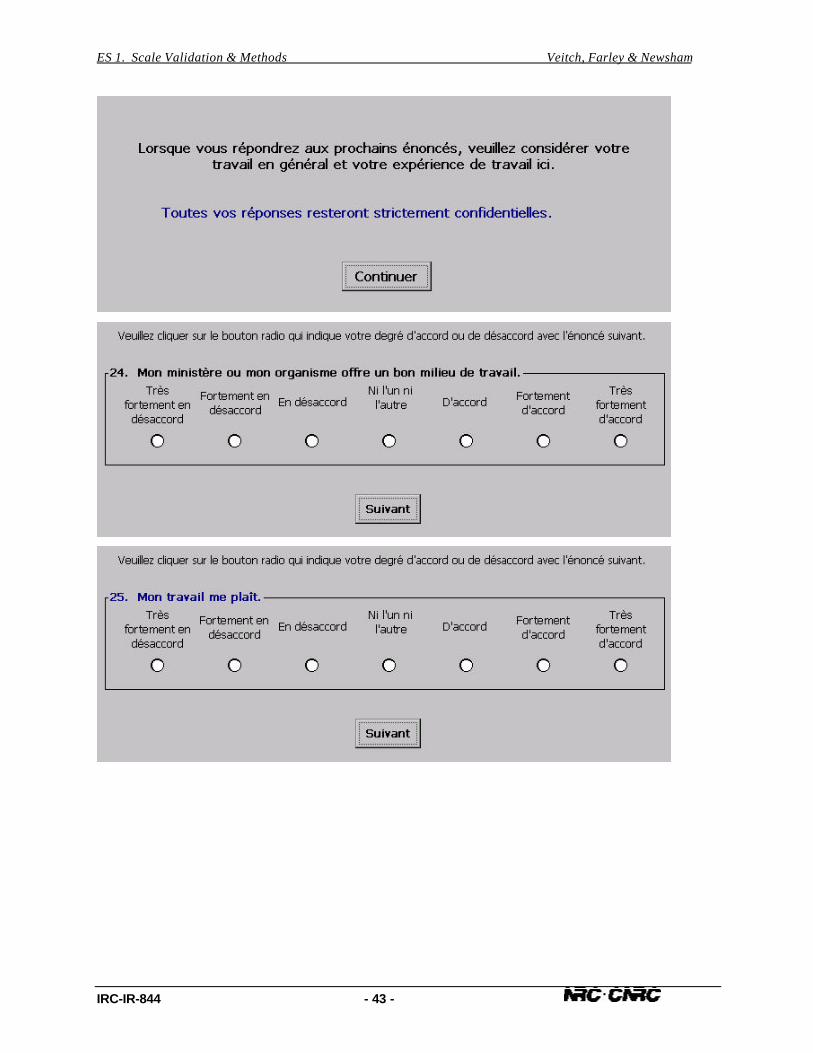
ES 1. Scale Validation & Methods Veitch, Farley & Newsham
IRC-IR-844 - 43 -

ES 1. Scale Validation & Methods Veitch, Farley & Newsham
IRC-IR-844 - 44 -

ES 1. Scale Validation & Methods Veitch, Farley & Newsham
IRC-IR-844 - 45 -
Appendix BOpen-ended Questionnaire for Additional Comments
National Research Council Conseil national de recherchesCanada Canada
Institute for Research in Institut de recherche enConstruction constructionOttawa, ON, CanadaK1A 0R6
B3205
NRC/IRC Open-Plan Office Survey Reply Form
Thank you for participating in our survey! We hope that you will help to round out our understanding ofhow the physical environment at work affects people by taking a few minutes to answer the followingquestions.
We designed the questionnaire to be easy to complete while the NRC research team completed itsmeasurements in your workstation. You might have found that the multiple-choice format restricted youfrom expressing more detailed or complex opinions. If you wish to provide us with more specificcomments about your workstation and its physical conditions, please use this form. We have attached astamped, addressed envelope that you can use to mail it directly back to the research team at NRC.
It is entirely up to you whether or not to complete this form. If you do, your responses will remain entirelyconfidential and anonymous. We ask that you provide us with the same identifying code on this form asyou used on the computer questionnaire, so that we can match responses and the physical data about yourworkstation. Although we might quote from your remarks here, we will not do so in any way that wouldallow individuals to be identified. Management, union, and other employees will not have access to yourresponses here. When you mail the form back, it will be stored at NRC in a locked file cabinet accessibleonly to project staff.
What do like most about your office?
What do you like least about your office?
If you could change one thing about your office, what would it be and how would you do it?

ES 1. Scale Validation & Methods Veitch, Farley & Newsham
IRC-IR-844 - 46 -
National Research Council Conseil national de recherchesCanada Canada
Institute for Research in Institut de recherche enConstruction constructionOttawa, ON, CanadaK1A 0R6
B3205Formulaire de réponse dans le cadre de
l’Étude du CNRC/IRC sur les bureaux en espace fonctionnel
Merci d’avoir participé à notre étude! Nous espérons que vous aiderez, en prenant quelques minutes pourrépondre aux questions qui se trouvent plus bas, à affiner notre compréhension de la manière dont le milieude travail matériel influe sur les gens.
Nous avons conçu le questionnaire de façon à ce qu’il soit facile à remplir pendant que l’équipe derecherche du CNRC effectuait ses mesures à votre poste de travail. Vous avez peut-être trouvé que laformule du choix multiple vous empêchait d’exprimer des opinions plus détaillées ou complexes. Si vousdésirez nous fournir d’autres précisions concernant votre poste de travail et ses conditions matérielles,veuillez utiliser ce formulaire. Vous trouverez ci-joint une enveloppe préadressée et affranchie que vouspouvez utiliser pour l’expédier directement à l’équipe de recherche du CNRC.
Vous êtes absolument libre de remplir ou non ce formulaire. Si vous décidez de le remplir, vos réponsesresteront entièrement confidentielles et anonymes. Nous vous demandons d’indiquer sur ce formulaire lemême code d’identification que vous avez utilisé pour le questionnaire sur ordinateur, ce qui nouspermettra d’associer les réponses et les données matérielles concernant votre poste de travail. Si nousfaisons état des observations que vous ferez ci-dessous, nous le ferons de manière à ce qu’elle nepermette pas de vous identifier. La direction, le syndicat et les autres employés n’auront pas accès auxréponses que vous fournirez ici. Votre formulaire sera conservé dans un classeur fermé à clef, au CNRC,et seuls les responsables du projet y auront accès.
Qu’aimez-vous le plus, dans votre bureau?
Qu’aimez-vous le moins, dans votre bureau?
Si vous pouviez changer une chose, dans votre bureau, que serait-ce et comment le feriez-vous?

ES 1. Scale Validation & Methods Veitch, Farley & Newsham
IRC-IR-844 - 47 -

ES 1. Scale Validation & Methods Veitch, Farley & Newsham
IRC-IR-844 - 48 -
Appendix CSample Memorandum to Employees from Management
From: Sent: Wednesday, MMM, DD, 2000To:
Subject: Indoor Environments: How's Ours? / Environnements intérieurs : Comment est le nôtre?
This memo is sent on behalf of XXX, Manager of XXXX
Cette note de service est envoyée au nom de XXX, Directrice de XXXX
We are pleased to welcome researchers from the National Research Council (NRC) to conductresearch into indoor work environments on our premises. This will be taking place on the X floor andselected areas on the XX floor at our headquarters during the week of XXXX. Some time may also berequired the following week. The work will examine the relationships between an open-plan office designsuch as ours, the indoor environment (sound, air quality, temperature, and lighting), and occupantsatisfaction with the indoor environment. This is a long-term study that will work toward future ability todevelop cost-effective office designs that are also pleasant for occupants, and new office products thatenhance workplace quality.
Our offices offer an ideal setting for this research for two reasons. The NRC requires large officespaces that are primarily open-plan, which our workplace provides. And second, our planned renovationson the X floor will allow the NRC to conduct research before and after renovations, identifying anychanges that occur.
Immediately prior to the research, you will find a memo on your desk from the NRC researchers,telling you about their work and what you can expect. Memos will be distributed to all workstations on theX floor, and to those affected by the research on the XX floor. Your participation will be invited, butcontribution to the research is strictly voluntary. Please rest assured that all information that you providewill be held in strict confidentiality by the NRC research team. If you choose to participate, it will requireno more than 15 minutes of your time.
Our department is among the sponsors of this study, so we are very supportive of the initiative andwe expect that we will all benefit from it over the long term. We hope that you will be accommodating ifasked to spare a few moments of your time. However we remind you that participation is on a completelyvoluntary basis, and if you cannot or do not wish to be involved in the research, simply respond with apolite "no thank you", and the researchers will move on.
Thank you!
---------Nous sommes heureux d'accueillir des chercheurs du Conseil national des recherches du Canada
(CNRC) qui effectueront des travaux de recherche sur les environnements de travail intérieurs dans noslocaux. Ces travaux auront lieu au X étage et certaines sections du XX étage de l'edifice pendant lasemaine du XXX et ils pourraient également se prolonger pendant la semaine suivante. Les travauxporteront sur les liens entre un bureau à aire ouverte comme le nôtre, l'environnement intérieur (son,qualité de l'air, température et éclairage) et la satisfaction que les occupants éprouvent envers cetenvironnement. Il s'agit d'une étude à long terme qui visera à mettre en place des capacités futures

ES 1. Scale Validation & Methods Veitch, Farley & Newsham
IRC-IR-844 - 49 -
d'élaborer des plans d'aménagement rentables qui sont agréables pour les occupants, et de nouveauxproduits de bureau qui rehaussent la qualité du milieu de travail.
Nos bureaux constituent un endroit idéal pour ces recherches pour deux raisons. Premièrement, leCRNC a besoin de vastes locaux à bureaux qui sont surtout à aire ouverte, et notre milieu de travailrépond à ce besoin. Deuxièmement, les rénovations que nous planifions au X étage permettront au CNRCd'effectuer des recherches avant et après les rénovations, et de déterminer les changements qui seproduisent.
Avant de débuter leurs travaux, les chercheurs du CNRC déposeront sur votre bureau une notede service décrivant comment ils procéderont et ce à quoi vous pouvez vous attendre. Ces notes deservice seront distribuées à tous les postes de travail du X étage, et aux postes du XX étage qui ferontpartie de l'étude. Votre participation sera sollicitée, mais votre contribution à ces travaux est strictementvolontaire. Soyez assurés que les renseignements obtenus par l'équipe de chercheurs du CNRCdemeureront strictement confidentiels. Si vous décidez de participer, cela exigera au plus 15 minutes devotre temps.
Étant un des parrains de cette étude, le département appuie fortement cette initiative et s'attendentà ce qu'elle soit avantageuse pour tous à long terme. Nous espérons que vous accommoderez leschercheurs s'ils vous demandent de leur consacrer quelques minutes de votre temps. Toutefois, nous vousrappelons que votre participation est complètement volontaire. Si vous ne pouvez pas ou ne voulez pasparticiper aux travaux de recherche, vous n'avez qu'à répondre poliment « non merci » et les chercheurspasseront à une autre personne.
Merci!

ES 1. Scale Validation & Methods Veitch, Farley & Newsham
IRC-IR-844 - 50 -
Appendix DSample NRC Announcement of Field Investigation
NRC/IRC Open-Plan Office Survey
The National Research Council's Institute for Research in Construction (NRC) is working on design andoperation guidelines for open-plan offices. Our goal is to develop a decision tool for interior designers andfacilities managers to use when planning office renovations or new construction, and to enable predictionsabout the likely consequences of certain changes in terms of the physical conditions and the satisfactionthose conditions will afford to occupants. This is a long-term project involving both laboratory and fieldinvestigations.
Your building has been selected as one site for our field investigations of buildings undergoing changes.We hope that you will agree to participate when the NRC team visits your area in the week of XXX, andagain in the future after the changes have been completed. Participation will take only about 10-15minutes each time. On each occasion, while you answer a short questionnaire about your opinions of thework environment, a member of the NRC research team will take measurements of the temperature, airquality, lighting, and noise where you usually sit in your workstation. In the same week as these visits takeplace, we will be making more detailed environmental measurements in the evenings, so as not to disturbyour work.
Whether you choose to participate or not is entirely your decision. If you do decide to participate, weassure you that all questionnaire responses will be completely confidential and private. Only the NRCresearch team will have access to the individual data. Your name will not appear in any data file ordocument connected to this project. Management, unions, and individual employees will not have accessto any information that you as an individual provide as part of this project. We will issue a report after theend of the data collection, based on the responses for your area [or building, as appropriate] as a whole.Everyone will receive copies of this report, and we will present it to the safety and health committee also.If you wish, we also will ensure that you receive summary information about the progress of the entireproject.
All data collection, storage and reporting will be conducted in accordance with the law, including thePrivacy Act.
If you have any questions about this research project, please contact Dr. Jennifer Veitch at 993-9671.She will be happy to discuss it with you.

ES 1. Scale Validation & Methods Veitch, Farley & Newsham
IRC-IR-844 - 51 -
Étude du CNRC/IRC sur les bureaux en espace fonctionnel
L’Institut de recherche en construction (IRC) du Conseil national de recherches (CNRC) a missur pied un projet d’élaboration de lignes directrices concernant la création et l’exploitation d’architecturesintérieures pour les bureaux en espace fonctionnel. Le but visé est de mettre au point un outil de décisiondont pourront se servir les architectes d’intérieur et les responsables de locaux lors de l’établissement desplans de rénovation ou de construction de bureaux, ainsi que de permettre de prévoir les conséquencesprobables de certains changements au niveau des conditions matérielles et de la satisfaction qu’en tirerontles occupants. Il s’agit d’un projet à long terme qui nécessite des études en laboratoire et sur le terrain.
Votre immeuble a été choisi, entre autres, pour faire l’objet de notre étude sur les bâtiments faisant l’objetde changements. Nous espérons que vous accepterez d’y participer lorsque l’équipe du CNRC se rendradans votre secteur la semaine du XXX et dans plusieurs mois une fois les changements effectués. Nousvous demanderons de nous consacrer chaque fois de 10 à 15 minutes. À chaque occasion, pendant quevous remplirez un bref questionnaire dans lequel vous direz ce que vous pensez de votre milieu de travail,un membre de l’équipe de recherche du CNRC effectuera des mesures touchant la température, la qualitéde l’air, l’éclairage et le bruit à l’endroit où vous vous tenez habituellement. Au cours de ces deuxsemaines, nous réaliserons des mesures plus poussées concernant les conditions matérielles, le soir, defaçon à ne pas perturber votre travail.
Vous êtes entièrement libre de participer à cette étude. Si vous acceptez de le faire, nous vous assuronsque toutes les réponses du questionnaire resteront strictement confidentielles. Seule l’équipe de recherchedu CNRC aura accès à cette information. Votre nom ne figurera dans aucun fichier de données ou autredocument lié à ce projet. La direction, les syndicats et les autres employés n’auront pas accès auxinformations que vous nous fournirez dans le cadre de ce projet. Une fois terminée la collecte desdonnées, nous rédigerons un rapport basé sur l’ensemble des réponses obtenues dans votre secteur [ouimmeuble, selon le cas]. Tous recevront un exemplaire de ce rapport, qui sera aussi remis au comité desanté et sécurité. Si vous le désirez, nous vous ferons aussi parvenir de l’information sommaire surl’évolution du projet lui-même.
La collecte des données, l’entreposage et la présentation des rapports seront effectués en toute légalité,notamment selon la Loi sur la protection des renseignements personnels.
Si vous avez des questions à poser au sujet de ce projet de recherche, veuillez communiquer avec JenniferVeitch, Ph.D., au 993-9671. Elle sera heureuse d’y répondre.

ES 1. Scale Validation & Methods Veitch, Farley & Newsham
IRC-IR-844 - 52 -
Appendix EComplete CFA and SEM Models

ES 1. Scale Validation & Methods Veitch, Farley & Newsham
IRC-IR-844 - 53 -
CFA-1
Ventilation

ES 1. Scale Validation & Methods Veitch, Farley & Newsham
IRC-IR-844 - 54 -
CFA-2
Ventilation

ES 1. Scale Validation & Methods Veitch, Farley & Newsham
IRC-IR-844 - 55 -
SEM-1
Ventilation

ES 1. Scale Validation & Methods Veitch, Farley & Newsham
IRC-IR-844 - 56 -
SEM-2
Ventilation