environmental science from space note: all images from nasa unless otherwise noted remote sensing...
TRANSCRIPT

Environmental Science From Space
Note: All images from NASA unless otherwise noted
Remote Sensing and the Electromagnetic Spectrum

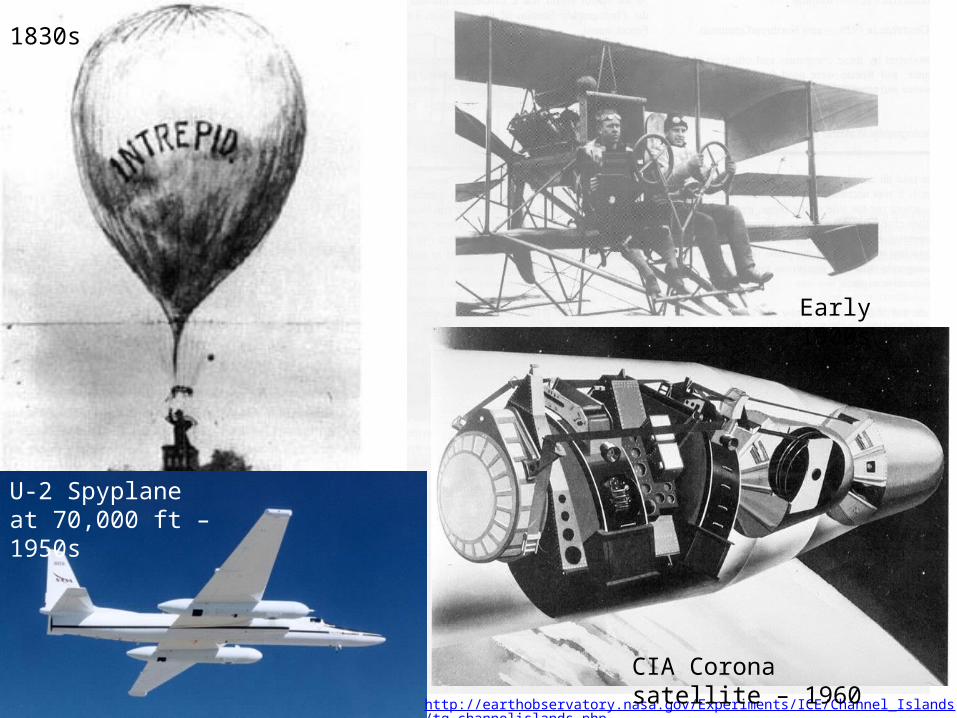
Remote Sensing= learning about an object or phenomenon
without touching, usually using satellites or airplanes
http://www.nasa.gov/centers/langley/news/factsheets/RemoteSensing.html
http://earthobservatory.nasa.gov/Experiments/ICE/Channel_Islands/tg_channelislands.php
1830s
Early 1900s
U-2 Spyplane at 70,000 ft – 1950s
CIA Corona satellite – 1960
http://www.nasa.gov/vision/earth/lookingatearth/earthweek.html

Videos
LandSat video: http://landsat.gsfc.nasa.gov/about/Terra orbit animation: http://earthobservatory.nasa.gov/Experiments/ICE/panama/panama_mov2.phpWatch live broadcast of LandSat: http://earthnow.usgs.gov/

Landsat 7
http://landsat.gsfc.nasa.gov/
http://science.hq.nasa.gov/kids/imagers/ems/infrared.html
Band Bandwidth (nm) Radiation1 450-515 Blue2 525-605 Green3 630-690 Red4 750-900 Near Infrared5 1,550-1,750 Shortwave Infrared6 10,400-12,500 Thermal Infrared7 2,090-2,350 Shortwave Infrared

1
2
Landsat 7: 7 bands
3
4
56
7
Watsonville3/4/2012

234
234
4-3-2
http://landsat.gsfc.nasa.gov/

3-2-1
4-3-2
7-4-2

http://missionscience.nasa.gov/ems/09_visiblelight.html
INFRARED
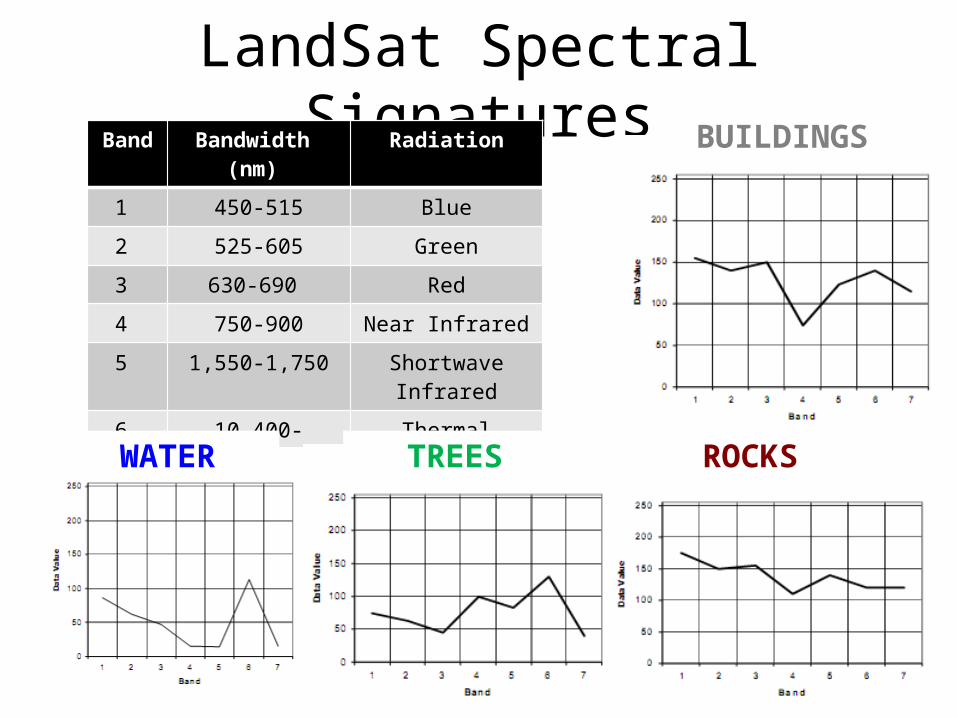
LandSat Spectral SignaturesBand Bandwidth (nm) Radiation
1 450-515 Blue
2 525-605 Green
3 630-690 Red
4 750-900 Near Infrared
5 1,550-1,750 Shortwave Infrared
6 10,400-12,500 Thermal Infrared
7 2,090-2,350 Shortwave Infrared
WATER TREES ROCKS
BUILDINGS

Pixels & RGB Codes= 255,0,0
= 0,255,0
= 0,0,255
=255,255,255
= 0,0,0
= ?,?,?
= 0,255,255
255,0,255
?
ACTIVITY:
Creating & Interpreting Remote Sensing Images
(Derived from NASA’s Remote Sensing Math)
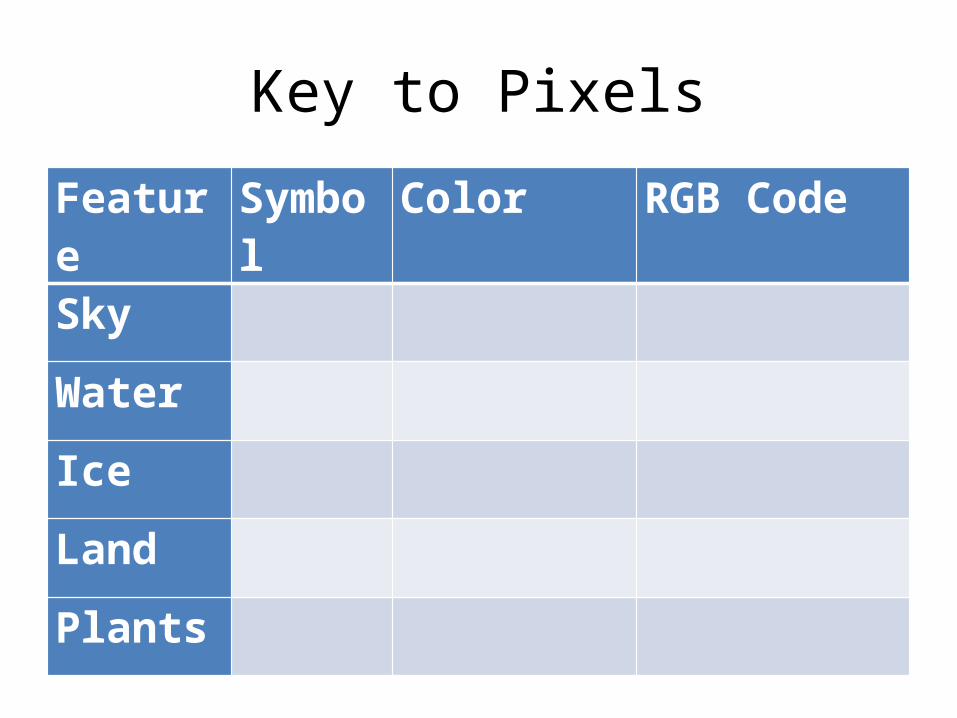
Key to PixelsFeature Symbol Color RGB Code
Sky
Water
Ice
Land
Plants

Key to PixelsFeature Symbol Color RGB Code
Sky S Black 0,0,0
Water W Blue 0,0,1
Ice I White 1,1,1
Land L Brown 1,1,0
Plants P Green 0,1,0

1 2 3 4 5 6 7 8 9
1
2
3
4
5
6
7
8
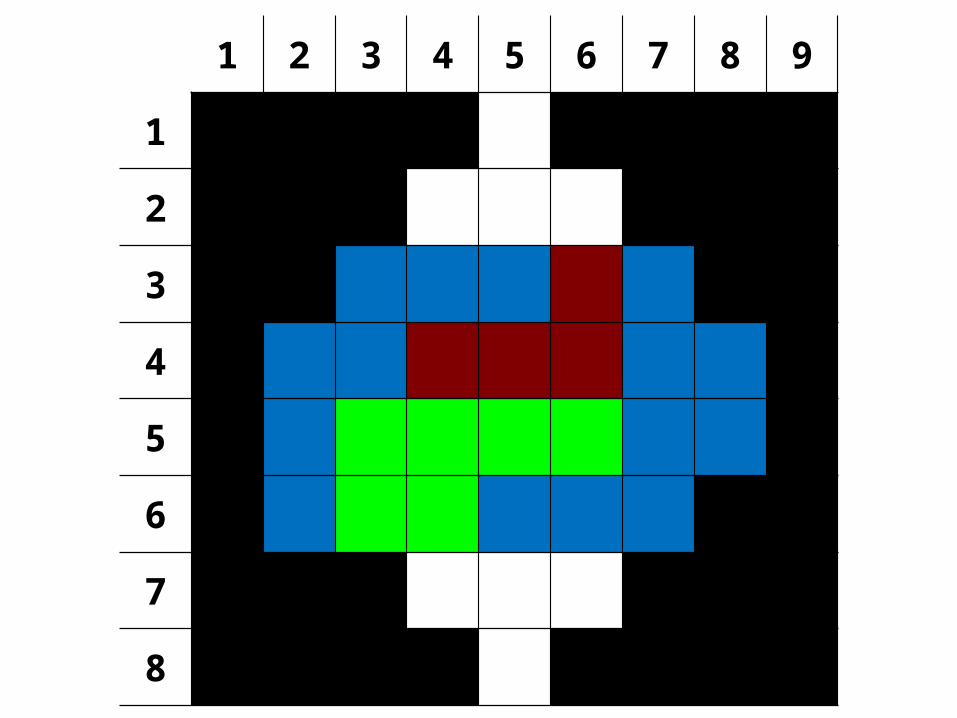
1 2 3 4 5 6 7 8 9
1
2
3
4
5
6
7
8

http://science.hq.nasa.gov/kids/imagers/ems/index.html

Reviewing Waves• _________________ (λ) = distance from any point on a
wave to an identical point on the next wave
• _________________ (f) = number of cycles or vibrations per unit of time (1 Hz = 1/s)
• _________________ (v) = distance/time
• __________ = _____________ * _____________
• Speed of light (c) in vacuum = 3.8 x 10⁸ m/s (186,000 miles/second)

Problem #1: Visible Light
• Which color has the longest wavelength?
• Which color has the highest frequency?
• Which color has the highest speed?
http://science.hq.nasa.gov/kids/imagers/ems/index.html
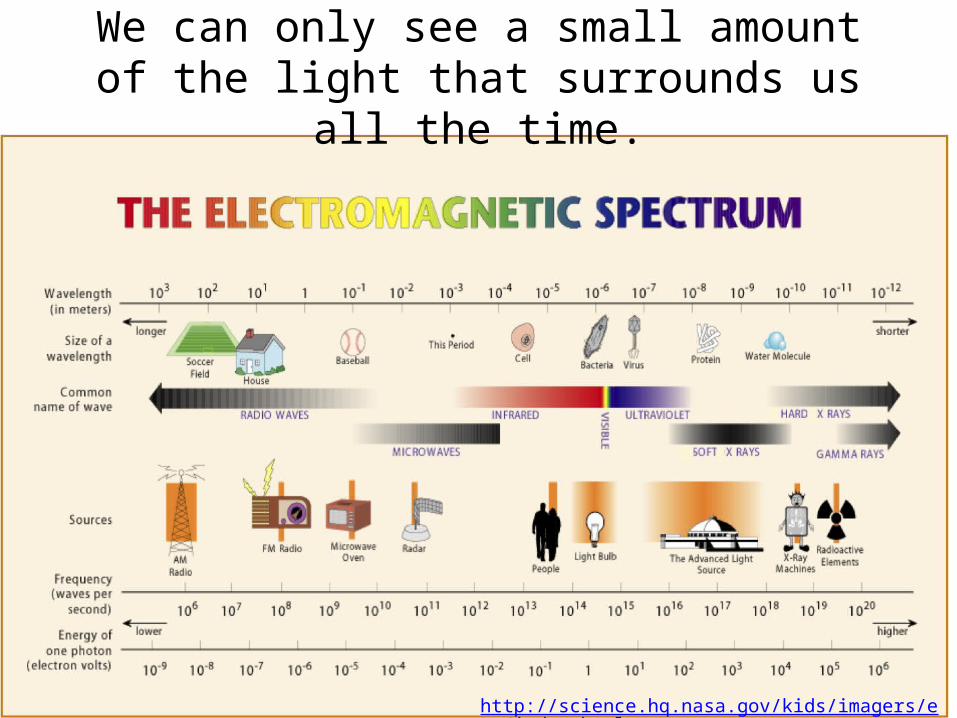
We can only see a small amount of the light that surrounds us all the time.
http://science.hq.nasa.gov/kids/imagers/ems/index.html

Radio Waves
• Carry TV, AM & FM radio, cell phone, & other communication signals
• Used by radio telescopes to study radiation emitted by objects in space
Carbon Monoxide (CO) gases in our Milky Way
galaxy

Problem #2: Radio• What’s the frequency of
your favorite radio station?
• Calculate its wavelength.

Microwaves
• Heat food by making molecules rotate fast
• Used to detect & measure distance to objects, such as airplanes & weather, with radar
sarakwatch.comhttp://science.hq.nasa.gov/kids/imagers/ems/micro.html

Microwaves
Credit: NASA image courtesy the QuikSCAT Science Team at the Jet Propulsion Laboratory
Credit: NASA/WMAP Science Team
Background radiation in the universe gives clues to the Big Bang
http://missionscience.nasa.gov/ems/06_microwaves.html

Infrared Waves
• Heat – used to determine temperature of objects
• Uses– Keeping food, spaces, animals
warm (heat lamps)– TV remote signal– Firefighting– Rattlesnakes use to detect
warm-blooded animals– Remote sensing
• Determine temperature of land, water
• Map clouds, vegetation
Image of Phoenix (AZ) with near infrared as red
Wikipedia

http://missionscience.nasa.gov/ems/07_infraredwaves.html
http://www.osdpd.noaa.gov/ml/ocean/sst/sst_50km.html

Infrared Imaging
• What object is in the image below?
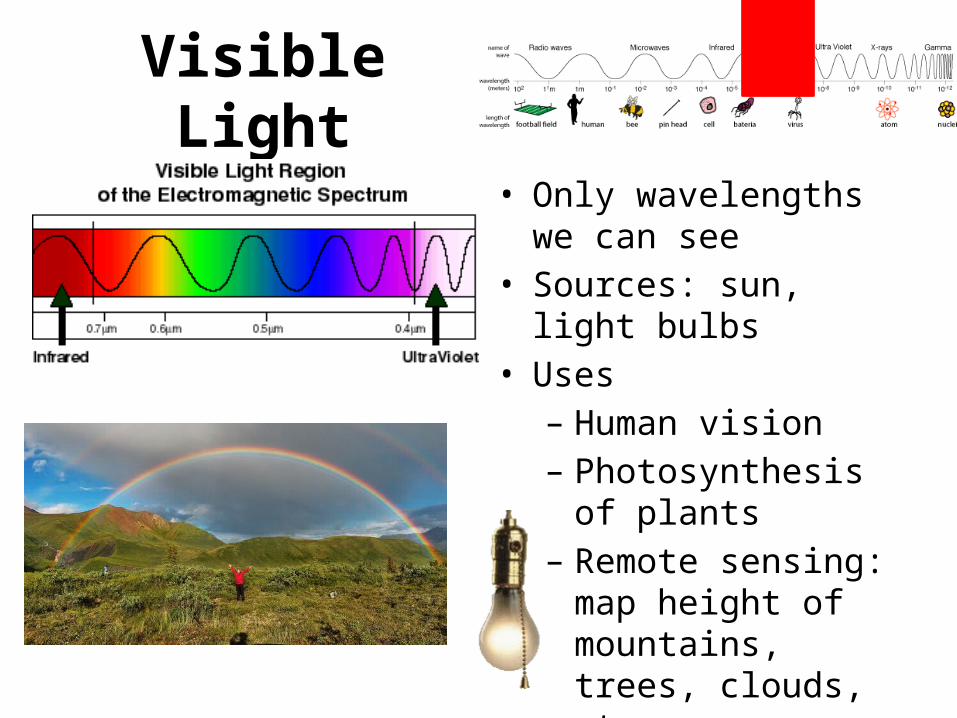
Visible Light
• Only wavelengths we can see
• Sources: sun, light bulbs• Uses
– Human vision– Photosynthesis of
plants– Remote sensing: map
height of mountains, trees, clouds, etc.

Laser Altimetry (LiDAR)
Outside Davenport, north of Santa Cruzwww.nps.edu/Faculty/Olsen/Student_theses/11Sep_Harmon.pdf
Where are the tallest trees?Credit: NASA Earth Observatory/Image by Jesse Allen and Robert Simmon/Based on data from Michael Lefsky.http://www.nasa.gov/topics/earth/features/forest-height-map.html

• Choose one of the following devices– Bluetooth (2400 MHz)– GPS (1575.42 MHz)– Wi-Fi (5 GHz)
• What wavelength is this?
• What type of radiation is this?
Garmin.com
Wikipedia
Problem #3: Technology

Ultraviolet Light
• Causes sunburn• Partially blocked by
ozone in atmosphere• Astronomers use to
study stars
UV image of Earth taken from Moon
Bees can see UV!

Hubble Space Telescope
stars forming in the Eagle Nebula
spiral galaxy Messier_100
Wikipedia

X-Rays
• Image bones & teeth for medicine
• Astronomers use to study very hot objects such as stars, supernova & black holes mosaic of several Chandra X-ray Observatory
images of the central region of our Milky Way galaxy reveals hundreds of white dwarf stars, neutron stars, and black holes. Separately, the Solar and Heliophysics Observatory (SOHO) captured these images of the Sun representing an entire solar cycle from 1996 through 2006. Credit: NASA/UMass/D.Wang et al. Sun images from SOHO – EIT Consortium: NASA/ESA

Gamma Rays
• Sources: – Radioactive atoms– Nuclear explosions– Lightning strikes– Supernova explosions (death of
star)
– Black holes
• Uses:– Detect spread of cancer– Kill cancer cells– Scan shipping containers for
security– Detect elements on other
planets

Mapping Vegetation
3-2-1
4-3-2
Normalized Difference Vegetation Index NDVI = (NIR – Red) / (NIR + Red)
North America seasonal NDVI animation: http://www.nasa.gov/topics/earth/features/obscure_data.html

Problem #4: Mapping Vegetation
• Calculate NDVI for the healthy tree.
• Calculate NDVI for the stressed tree.
Normalized Difference Vegetation Index NDVI = (NIR – Red) / (NIR + Red)
http://earthobservatory.nasa.gov/Experiments/ICE/panama/panama_ex2.php
red red

Vegetation Index Products
NASA Earth Observatory

234
234
4-3-2
http://landsat.gsfc.nasa.gov/

Activity: Remote Sensing of Barro Colorado Island
NASA’s Rainforest at the Crossroadshttp://earthobservatory.nasa.gov/Experiments/ICE/panama/
