environmental synopsis - homepage - joint legislative
TRANSCRIPT
A Legislative Service Agency of the Pennsylvania General Assembly
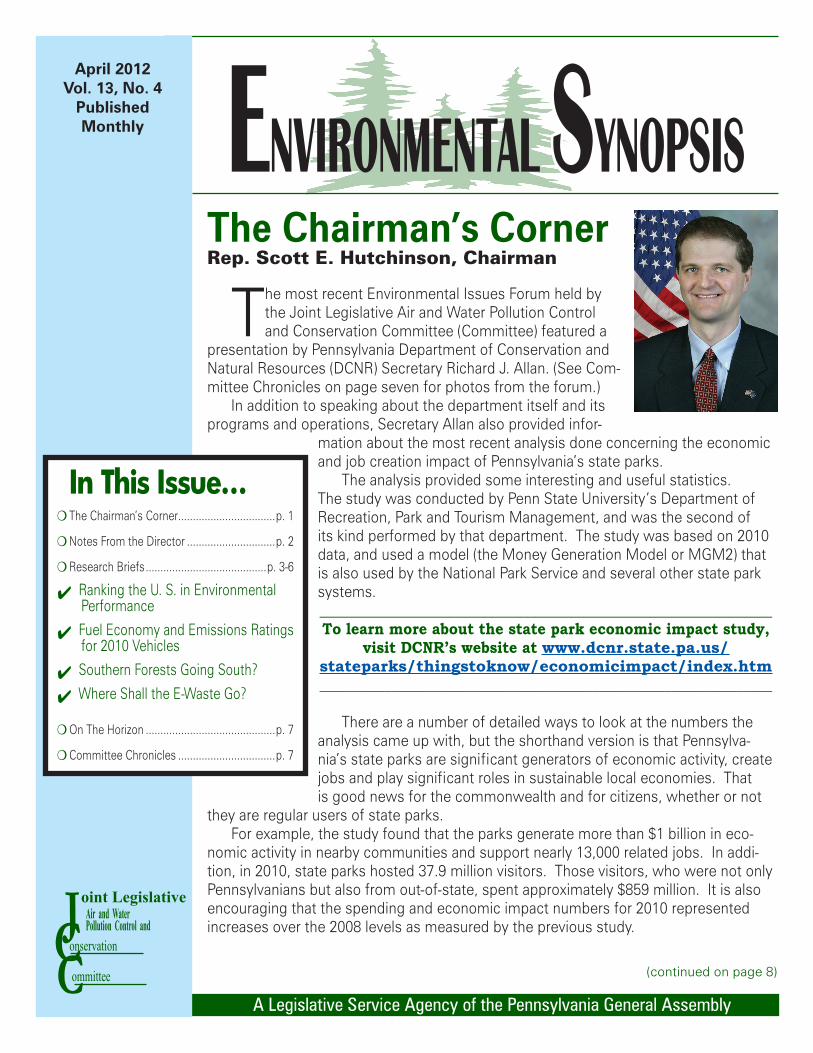
The Chairman’s CornerRep. Scott E. Hutchinson, Chairman
(continued on page 8)
April 2012Vol. 13, No. 4
Published Monthly ENVIRONMENTAL SYNOPSIS
In This Issue…The Chairman’s Corner .................................p. 1
Notes From the Director ..............................p. 2
Research Briefs .........................................p. 3-6
Ranking the U. S. in Environmental Performance
Fuel Economy and Emissions Ratings for 2010 Vehicles
Southern Forests Going South?
Where Shall the E-Waste Go?
On The Horizon ............................................p. 7
Committee Chronicles .................................p. 7
CJC
oint LegislativeAir and WaterPollution Control and
onservation
ommittee
The most recent Environmental Issues Forum held by the Joint Legislative Air and Water Pollution Control and Conservation Committee (Committee) featured a
presentation by Pennsylvania Department of Conservation and Natural Resources (DCNR) Secretary Richard J. Allan. (See Com-mittee Chronicles on page seven for photos from the forum.)
In addition to speaking about the department itself and its programs and operations, Secretary Allan also provided infor-
mation about the most recent analysis done concerning the economic and job creation impact of Pennsylvania’s state parks.
The analysis provided some interesting and useful statistics. The study was conducted by Penn State University’s Department of Recreation, Park and Tourism Management, and was the second of its kind performed by that department. The study was based on 2010 data, and used a model (the Money Generation Model or MGM2) that is also used by the National Park Service and several other state park systems._______________________________________________________________To learn more about the state park economic impact study,
visit DCNR’s website at www.dcnr.state.pa.us/stateparks/thingstoknow/economicimpact/index.htm_______________________________________________________________
There are a number of detailed ways to look at the numbers the analysis came up with, but the shorthand version is that Pennsylva-nia’s state parks are significant generators of economic activity, create jobs and play significant roles in sustainable local economies. That is good news for the commonwealth and for citizens, whether or not
they are regular users of state parks.For example, the study found that the parks generate more than $1 billion in eco-
nomic activity in nearby communities and support nearly 13,000 related jobs. In addi-tion, in 2010, state parks hosted 37.9 million visitors. Those visitors, who were not only Pennsylvanians but also from out-of-state, spent approximately $859 million. It is also encouraging that the spending and economic impact numbers for 2010 represented increases over the 2008 levels as measured by the previous study.
ENVIRONMENTAL SYNOPSIS / APRIL 2012 / P. 2
CRAIG D. BROOKS, EXECUTIVE DIRECTOR
NOTES FROM THE DIRECTOR
______________________________________________The AWWA study looks at the replacement
and expansion costs of drinking water networks in the United States
______________________________________________
Local water utilities make significant invest-ments to install, upgrade or replace equip-ment in order to deliver safe drinking water to
consumers.Every four years, the Environmental Protection
Agency conducts a survey of the anticipated costs of these investments and reports the results to Con-gress. The last survey was completed in 2009. That report found that the nation’s 53,000 community water systems and 21,400 not-for-profit, non-community wa-ter systems will need to invest billions of dollars over the next several decades for needed upgrades.
However, a more recent report by the American Water Works Association (AWWA) suggests that replacement and expansion costs for drinking water net-works in the United States will total more than $1 trillion be-tween 2011 and 2035 and will exceed $1.7 trillion by 2050. According to the report, the infrastructure costs will primarily be met through higher water bills and local fees. AWWA released the report as a call to action for utilities, consumers and policymakers to encourage them to prepare for the growing financial obligations.
The report added up only the costs of buried infrastructure for drinking water, leaving aside such expenses as treatment plants, storage tanks and wastewater infrastructure. It suggests that those buried costs alone could potentially triple the size of a typical family’s water bill in some communities and regions. Postponing infrastructure investment in the near-term, however, would raise the overall costs and increase the likelihood of water main breaks and other infrastructure failures, the report said. For its cost estimates, the report assumed that utilities will try to maintain current levels of service rather than allow breaks in water service to increase.
According to the report, over the 40 years through 2050, replacement costs will account for about 54 per-cent of the estimated total national costs, while popu-lation growth and migration will account for about 46 percent of the costs.
The cost burden per customer will also tend to be higher in smaller communities. According to the re-port, in the most affected small communities, a typical
three-person household could see its drinking water bill increase by as much as $550 per year from cur-rent levels. In the largest water systems, where costs can be spread over a large population base, needed investments would be consistent with annual cost increases per household ranging roughly from $75 to more than $100 per year by the mid 2030’s.
Currently the federal government helps water systems meet only a small portion of their costs, with most of that assistance going to smaller com-munities. However, a recent hearing by the House Transportation and Infrastructure Subcommittee on Water Resources and the Environment suggested developing innovative approaches to financing wa-
ter infrastructure that could supplement the state revolv-ing loan program. A draft legislative proposal is being considered to allow commu-nities to borrow money for water infrastructure projects
at a lower cost while having little or no effect on the federal budget.
Under the draft bill, to be called the Water Infra-structure Finance and Innovation Act, funds would be accessed from the U.S. Treasury at long-term rates and used to provide loans, loan guarantees, and other credit for water infrastructure projects. The draft bill would create the Water Infrastructure Finance and Innovation Authority to handle the loans, and contains provisions to make financing water infrastructure more affordable. This includes reducing the costs of state revolving loan fund programs by lending directly to communities and providing states with flexibility in using the funds. Eligible water infrastructure projects would include water, wastewater and wet weather related projects.
The AWWA report is available at: www.awwa.org/files/GovtPublicAffairs/GADocuments/Buried-NoLongerCompleteFinal.pdf.
The draft legislation on water infrastructure fi-nancing is available at: http://op.bna.com/env.nsf/r?Open=jsun-8rws9t.
Hearing testimony is available at: http://trans-portation.house.gov/hearings/hearingdetail.aspx?NewsID=1531.

ENVIRONMENTAL SYNOPSIS / APRIL 2012 / P. 3
RESEARCH BRIEFSEach month, the committee’s staff
researches and prepares a number of “briefs” on several topics relevant to the Joint Conservation
Committee’s mission. Very often, these briefs include references to reports
and further research on the topics so that readers may pursue issues on their own.
Please Note: The information and opinions expressed in the Research Brief articles do not necessarily represent the opinions or positions of the Joint Legislative Air and Water Pollution Control and Conservation Committee, nor those of the
Pennsylvania General Assembly.
United States Ranked 49th in Environmental Performance Index-- Tony M. Guerrieri, Research Analyst
The quality of the environment depends a lot on what policies a nation adopts. How well does the United States measure up, environ-
mentally? A joint study conducted by the Yale Center for En-
vironmental Law and Policy and Columbia University’s Center for International Earth Science Information Net-work has ranked the United States 49th in addressing pollution control and natural resource management challenges.
The study, “2012 Environmental Performance Index” (EPI), ranks 132 nations based on 22 indicators across 10 major policy categories. They are:
environmental health; water (effects on human health) and water resources (ecosystem effects); air pollution (for both effects on human health and the ecosystem); biodiversity and habitat; forests; fisheries; agriculture; and climate change.
Each of the 22 indicators receives a weighting that represents its overall importance. Between 2006 and 2008, for example, the contribution of climate change increased from 10 percent to 25 percent of a coun-try’s overall score, reflecting growing international attention to climate change.
The EPI distills a country’s capacity for sustained environmental health into a single number ranging from 0 to 100. The higher a country’s EPI score, the better positioned it is to achieve environmental sus-tainability. For example, the global leader in environ-
mental performance, Switzerland, registered 76.69 and the lowest ranked country, Iraq, is at 25.32 overall. The United States is at 56.60.
Rounding out the top five positions in the EPI rank-ing are:
Latvia (70.37); Norway (69.92); Luxembourg (69.2); and Costa Rica (69.03). All the top ranked nations have made substantial
investments in environmental infrastructure, pollu-tion control, and policies designed to move toward long-term sustainability. The report noted that Swit-zerland’s top-notch performance on the overall EPI derives from its high scores on metrics related to both ecosystem vitality and environmental health, particu-larly its very strong performance in biodiversity, habitat protection and air pollution control.
_________________________________________________The United States’ 49th place ranking is
significantly below other highly developed nations, and is neither its best nor worst
ranking _________________________________________________
The United States’ 49th place ranking is signifi-cantly below other highly developed nations including France (6th), the United Kingdom (9th), Germany (11th), Japan (23rd), and Canada (37th). Over the years, the United States has ranked as high as 28th among the 133 nations in the 2006 EPI, was 39th out of 149 na-tions in the 2008 EPI, and 61st out of 163 nations in the 2010 EPI.
In individual issues, the United States ranked high on water and air pollution management, but weak in greenhouse gas emissions. On that measure, it is in 121st place.
The two fastest-developing economies in the world ranked poorly, with India 125th and China 116th,
ENVIRONMENTAL SYNOPSIS / APRIL 2012 / P. 4
reflecting the strain rapid economic growth imposes on the environment, the report said.
According to the study, the five lowest ranked nations in eco-performance – South Africa (34.55), Kazakhstan (32.94), Uzbekistan (32.24), Turkmenistan (31.75), and the afore-mentioned Iraq (25.32) – are all countries grappling with deteriorating environmental circumstances in the context of significant economic development pressure and other challenges.
As a complement to the performance “snapshot” which the EPI offers, the report also contains a Pilot Trend Environmental Performance Index (Trend EPI) that shows which countries are improving and by how much on an issue-by-issue basis over the period of 2000 – 2010. Latvia stands at the top of the new Trend EPI followed by Azerbaijan, Romania, Albania and Egypt.
The U.S. places 77th in the Trend EPI rankings. For many countries near the top of the EPI rankings, the Trend EPI results will not be particularly meaningful as the longtime leaders have limited room for improve-ment. Iceland, for example, ranks 13th in the EPI but 64th in the Trend EPI – reflecting its high ranking in the EPI over the past decade, which makes further gains hard to achieve.
But some top-tier performers on this year’s EPI have strong Trend EPI ranks as well, indicating im-proved performance over the past ten years. The United Kingdom, for example, ranks 9th on the 2012 EPI list and 20th on the Trend EPI, which demonstrates that significant progress has been made over the last decade on a number of environmental issues.
The EPI results are published once every two years. The 99-page report is available at: http://epi.yale.edu/sites/default/files/downloads/2012%20EPI%20Full%20Report.pdf.
Auto Manufacturers Improved Fuel Economy, Carbon Emissions in 2010 Models-- Craig D. Brooks, Executive Director
Model year 2010 vehicles achieved an average fuel economy of 22.6 miles per gallon (mpg) and emitted an average of
394 grams of carbon dioxide per mile, according to an annual Environmental Protection Agency (EPA) report released in March 2012. According to the report, “Light-duty Automotive Technology, Carbon Dioxide Emissions, and Fuel Economy Trends:1975 Through 2011”, greenhouse gas emissions were the lowest on record, decreasing by three grams per mile compared
with 2009 model year vehicles. Additionally, corporate average fuel economy
(CAFE) for model year 2010 vehicles improved by 0.2 mpg over the previous year. This is also the best performance ever reported by EPA. According to the agency, this shows that auto manufacturers are mak-ing significant strides toward saving families money at the gas pump while also reducing greenhouse gas emissions.
Light-duty trucks, which include sport utility vehicles, vans, and pick-up trucks, accounted for 36 percent of all light-duty vehicle sales in 2010, a five percent increase from 2009. Truck market share is still nine percent less than its peak in 2004. EPA has said that direct comparisons to prior years can be difficult given the considerable turmoil in the automotive mar-ket in the past few years, but performance continues to improve.
_________________________________________________According to the EPA report released in March
2012, greenhouse gas emissions were the lowest on record
_________________________________________________
Despite the increase in fuel efficiency, model year 2010 vehicles weighed an average of 4,002 pounds, 85 more pounds than in 2009. EPA calculated the performance based on formal end-of-the-year reports submitted to the agency by automakers. EPA antici-pated model year 2011 vehicles will achieve 22.8 mpg while emitting 391.1 grams per mile of carbon dioxide.
Model year 2011 cars must achieve an industry-wide fuel economy average of 30.4 mpg, while light-duty trucks must achieve 24.4 mpg under a May 2010 rule that increases CAFE standards to 35.5 mpg by 2016. EPA and the National Highway Traffic Safety Administration (NHTSA) jointly proposed regulations in December 2011 that would set an average, fleet-wide fuel economy standard for vehicles of 54.5 mpg, as well as a carbon emissions limit of 163 grams per mile by 2025, which would equate to a fuel economy standard of 35.5 mpg.
EPA and NHTSA have also issued a rule setting the first greenhouse gas emissions and fuel economy stan-dards for model years 2014 to 2018 medium and heavy-duty pickup trucks, delivery vehicles and tractor trailers.
Although fuel economy standards are on the increase and greenhouse gas emissions are on the de-crease, they don’t come without a price, and automak-ers and truck dealers are pushing back against EPA’s latest proposed standards. A report, “A Look Back at EPA’s Costs and Other Impact Projections for MY 2004-2010 Heavy-Duty Truck Emissions Standards”, says that

ENVIRONMENTAL SYNOPSIS / APRIL 2012 / P. 5
agency rules issued in 1997, 2000 and 2001 to reduce pollution from heavy-duty trucks cost two to five times more than EPA estimated. That finding, according to automakers, should caution EPA as it pursues more stringent greenhouse gas emissions limits for heavy-duty and passenger vehicles in future years.
The adoption of these new control strategies and technologies directly resulted in higher prices for new heavy-duty trucks, the report said. According to the report, these mandates also resulted in significantly higher operating costs attributable largely to increased maintenance requirements, reduced reliability and lower fuel economy.
EPA’s report is available at: http://epa.gov/otaq/cert/mpg/fetrends/2012/420r12001.pdf. The au-tomakers’ report is available at: http://op.bna.com/env.nsf/r?Open=smiy-8s7q45.
Southern Forests at Risk-- Tony M. Guerrieri, Research Analyst
The forests of the southern United States cov-er about 200 million acres and provide impor-tant ecosystem services such as fresh water,
timber and recreation. Forests account for a large por-tion of land in the Southern region, with some states having two-thirds or more of their land area in forest. And, in addition, wood-related sectors of the South’s economy contributed more than one million jobs and more than $51 billion in payroll in 2009.
However, these forests are under intense pres-sure, according to a report by the United States Department of Agriculture (U.S.D.A.) Forest Service and the Southern Group of State Foresters. The report looks at the impact a variety of factors will have on the future of forests in 13 states stretching from Texas to Virginia.
Southern forests are being shaped by several trends, including urbanization, bio-energy use, weath-er patterns, land ownership changes and invasive species. The report concludes that these factors will significantly alter the South’s forests between the years 2010 and 2060.
In recent decades, many Southern communities have been experiencing rapid population growth. Between 1990 and 2008, the population of the region increased by 33 percent compared with the national average of 22 percent.
According to the report, population growth and the development that accompanies it could reduce forest-land in the South by about 10 percent over the next 50 years. The ensuing urbanization is expected to reduce the amount of forestland in the South by as much as 23 million acres – about the size of the state of South
Carolina – between now and 2060.The growing population reduces the capability of
forestry agencies to manage forests, the report sug-gests. About 86 percent of forestland in the South is under private ownership, nearly two-thirds of which is held by individuals or families, with the rest owned by United States or local government agencies.
One example of how encroachment of develop-ment can damage forests is the use of controlled burns to rejuvenate forests. Alteration of natural fire regimes and associated ecosystems, exacerbated by the increasing wildland-urban interface, has contrib-uted to increased loss from wildfire in recent years. Many Southern ecosystems are considered to be fire dependent, and certain species of plants require fire in order to regenerate.
However, fire suppression has changed the land-scape, allowing highly flammable material to build up within forests. This increases the risk of large wild-fires that are difficult to control. The combination of this heightened risk, urban sprawl, and other factors have increased the complexity of managing fire.
Shrinking forests also could affect other resources people depend on, like clean water. The report says an increase in demand brought on by population growth and stress on water supplies caused by climate change and land-use changes could result in more frequent water shortages and lower water quality._________________________________________________
Forests in 13 states stretching from Texas to Virginia are under intense pressure from a
variety of sources_________________________________________________
Non-native invasive species can also alter the com-position, structure and function of Southern forests. Non-native plants have infested almost 10 percent (or 19 million acres) of the region’s forests and can spread rapidly, replacing native plants needed by local wildlife. Some of the most significant invasions are from species introduced in just the last 10 years, the report says. Some species such as the emerald ash borer and laurel wilt are expanding rapidly throughout large areas of the South.
The report was developed using computer models and expert analysis and will serve as a guide as Forest Service personnel look to maintain the vitality and ef-ficiency of forests in the South. More than 30 scien-tists, researchers, foresters and other experts with the Forest Service, state forestry agencies and universities contributed to the report.
The U.S.D.A. Forest Service and Southern Group of State Foresters report is available at: http://www.srs.fs.usda.gov/futures/reports/draft/summary_report.pdf.

ENVIRONMENTAL SYNOPSIS / APRIL 2012 / P. 6
GSA Guidelines Bar Federal Agencies from Sending E-Waste to Landfills-- Craig D. Brooks, Executive Director
Federal agencies will no longer be permitted to dispose of electronic waste (e-waste) in land-fills and must send such waste to certified
third-party recyclers for end-of-life disposal, according to guidelines announced in March 2012 by the General Services Administration (GSA).
Under the National Strategy for Electronics Stew-ardship guidelines, the federal government will be en-couraged to maximize the use of technology by shar-ing equipment among agencies, and will be required to recycle e-waste that can no longer be reused. The government will also establish a tracking system for all e-waste, requiring federal agencies to submit an-nual reports on how they are managing it.
According to GSA, the policy will ensure the fed-eral government is leading by example and that every product they buy will be disposed of in a responsible manner. It stems from a government-wide policy re-leased in July 2011 that seeks to properly manage and dispose of electronic resources.
The guidelines were issued as a bulletin, but a proposed policy will be published and the rulemaking process will begin shortly. GSA could also publish an interim policy while it gathers public comment during the rulemaking process.
An informal survey of federal agencies conducted by GSA found that 62 percent of the agencies already recycled and just four percent sent waste materials to landfills.
Under the national strategy, the federal govern-ment will look to further electronics reuse by distribut-ing used equipment to eligible non-federal organiza-tions such as schools and non-profits. The guidelines will encourage reuse opportunities at the federal level first and encourage recipients of the used electronics to follow the same standards as the federal govern-ment.
On the international level, federal legislation to restrict the export of e-waste could be susceptible to challenge before the World Trade Organization (WTO), according to a report from the Congressional Re-search Service (CRS).
According to the report, entitled “Issues in Inter-national Trade Law: Restricting Exports of Electronic Waste”, one of WTO’s agreements - the General Agreement on Tariffs and Trade (GATT) - forbids restrictions on exports to and imports from any WTO member’s territory.
The report does state, however, that international trade law could justify e-waste export bans if war-ranted. According to the report, exemptions to GATT can be justified if found necessary to protect human, animal or plant life health of those under the WTO agreements. If WTO determined e-waste export restrictions violate GATT, the member country – in this case the United States – would have to modify or lift those restrictions or face WTO-authorized sanctions.
Currently, there are two bills in Congress that would restrict e-waste exports to developing countries – H.R. 2284 and S. 1270 although action on either bill is unlikely this year.
The CRS report comes after the U.S. International Trade Commission initiated a broad investigation into the characteristics and practices of e-waste export markets in January of this year.
______________________________________________Guidelines announced in March 2012 by the GSA prohibit federal agencies from
disposing of electronic waste in landfills andrequire such waste to be sent to certified
third-party recyclers for end-of-life disposal ______________________________________________
The United States has several agreements requir-ing the notification and consent of countries prior to transporting any hazardous wastes, including agree-ments with Mexico, Canada, and Organization for Economic Cooperation and Development countries. However, the United States is not a member of the Basel Convention, an international accord that forbids the export of hazardous materials unless the recipi-ent has been notified and consented to the shipment. There are 170 parties to the Basel Convention, which seeks to limit waste shipments from developed coun-tries to less-developed countries.
The Institute of Scrap Recycling Industries (ISRI)opposes the legislation currently introduced in Con-gress, has suggested that such laws would violate in-ternational law, and has warned of international trade repercussions.
According to ISRI President Robin Weiner in a recent press release, “An export ban bill will fail to put an end to irresponsible recycling around the world and will in fact take us backward by violating our trade obligations.”
The GSA guidelines are available at http://1.usa.gov/xd52M8 and the international report is available at http://op.bna.com/env.nsf?r?Open=aada-8s6rsx.

ENVIRONMENTAL SYNOPSIS / APRIL 2012 / P. 7
ON THE HORIZON . . . A LOOK AT UPCOMING EVENTS
Monday, June 18, 2012, 12 noon, (location to be determined) – Environmental Issues Forum.The June 2012 forum will feature a presentation by the Pennsylvania Biomass Energy Association.
Please e-mail Geoff MacLaughlin in the committee office at [email protected] or call Geoff at 717-787-7570 if you plan to attend the Environmental Issues Forum.
And, check the committee website at http://jcc.legis.state.pa.us for events that may be added to the schedule.
COMMITTEE CHRONICLES . . .A REVIEW OF SOME
MEMORABLE COMMITTEE EVENTS
The Joint Legislative Air and Water Pollution, Control and Conservation Committee’s (Committee) March 2012 Environmental Issues Forum featured a presentation by PA Department of Conservation and Natural Resources (DCNR) Secretary Richard J. Allan (photo at right). As described in some detail in the Chairman’s Corner article on page one, Secretary Allan spoke to a large crowd (photo below) about a recent study concerning the economic impact of Pennsylvania’s state parks, as well as the operations and programs of DCNR.
Following the presentation, Committee Chairman Rep. Scott Hutchinson (pictured at left with Secretary Allan) led a question and answer session from members of the audience.

ENVIRONMENTAL SYNOPSIS / APRIL 2012 / P. 8
How toContact
The JointConservation Committee
Phone: 717-787-7570 Fax: 717-772-3836
Location: Rm. 408, Finance Bldg.
Internet Website: http://jcc.legis.state.pa.us
Mail: Joint Conservation CommitteePA House of RepresentativesP.O. Box 202254Harrisburg, PA 17120-2254
CJC
oint LegislativeAir and WaterPollution Control and
onservation
ommittee
Perhaps an even more important number is that according to the analysis, for every dollar invested in the state parks, more than $12 ($12.41 as calculated by the study) is returned to Pennsylvania’s economy. That’s a good return, and is a better economic return than the estimated figures for 2008 ($7.62 for every dollar) and 2009 ($9.63).
Secretary Allan was quoted as stating, “Especially in challenging economic times, Pennsylvanians turn to their parks for affordable, healthful recreation and relaxation. Just as importantly, this analysis shows state parks also serve as economic genera-tors in the communities that surround them, many of which are rural.”
The study computed both the direct contribution of state park visitor spending to the Pennsylvania economy, and a total contribution figure (which combines direct contributions with secondary/indirect effects. The direct contribution figures were:
$628.7 million in sales (sales of businesses); 9,435 jobs (full and part-time); $227.2 million in labor income (wages, salaries, payroll benefits); and $360.6 million in value added effects.
The total contributions figures were as follows: $1.145 billion in sales; 12,630 jobs; $397.8 million in labor income; and $649.0 million in value added effects.
The study also showed that it is not only Pennsylvanians that generate economic impact. According to the analysis, the statewide sales impact of out-of-state visitors in 2010 was $274.2 million. Out-of-state visitor spending contributed to 2,976 jobs, $94.6 million in labor income and $154.5 million in value added effects.
In terms of what visitors, both in-state and out-of-state, spent their money on, the study showed that restaurants/bars and gas/oil constituted the largest percentage of visitor spending. That was followed by groceries and take-out food/drinks. The smallest percentage of visitor spending was on marinas and camping fees.
Visitors also purchase firewood, food, boat rentals, bait and many other items in nearby communities. The Bureau of State Parks has 145 private concessions to provide goods and services to visitors.
In his remarks at the Committee’s forum, Secretary Allan noted that in 2011 DCNR rolled out a state parks and forests mobile application for smart phones. The new “app” allows visitors, while on-the-go, to search for park and forest locations, activities and events, make reservations, get directions, and share photos.
In completing his presentation, the Secretary emphasized the following perspec-tive: “My vision for this department is to hold it up as the best conservation agency in the country, because how we manage our lands; protect our open spaces; grow our communities, inspire our citizens; and preserve precious habitat will shape our future as Pennsylvanians.”