environmental technology verification report · 2015-08-02 · environmental technology...
TRANSCRIPT

Environmental Technology Verification Report PRIVATE PALLET SECURITY SYSTEM, LLC. MULTITRACKTM LAYERED TRACKING SYSTEMS
Prepared by Battelle
Under a cooperative agreement with
U.S. Environmental Protection Agency

September 2009
Environmental Technology Verification Report
ETV Advanced Monitoring Systems Center
PRIVATE PALLET SECURITY SYSTEMS, LLC.
MULTITRACKTM LAYERED TRACKING SYSTEM
by
Ryan James, Brian Boczek, Zachary Willenberg, Amy Dindal, Battelle Deborah Kopsick, Carlos Rincon, Michelle Henderson, and John McKernan, U.S. EPA

ii
Notice The U.S. Environmental Protection Agency, through its Office of Research and Development, funded and managed, or partially funded and collaborated in, the research described herein. It has been subjected to the Agency’s peer and administrative review and has been approved for publication. Any opinions expressed in this report are those of the author (s) and do not necessarily reflect the views of the Agency, therefore, no official endorsement should be inferred. Any mention of trade names or commercial products does not constitute endorsement or recommendation for use.
iii
Foreword
The U.S. Environmental Protection Agency (EPA) is charged by Congress with protecting the Nation’s land, air, and water resources. Under a mandate of national environmental laws, the Agency strives to formulate and implement actions leading to a compatible balance between human activities and the ability of natural systems to support and nurture life. To meet this mandate, EPA’s research program is providing data and technical support for solving environmental problems today and building a science knowledge base necessary to manage our ecological resources wisely, understand how pollutants affect our health, and prevent or reduce environmental risks in the future. The National Risk Management Research Laboratory (NRMRL) is the Agency’s center for investigation of technological and management approaches for preventing and reducing risks from pollution that threaten human health and the environment. The focus of the Laboratory’s research program is on methods and their cost-effectiveness for prevention and control of pollution to air, land, water, and subsurface resources; protection of water quality in public water systems; remediation of contaminated sites, sediments and groundwater; prevention and control of indoor air pollution; and restoration of ecosystems. NRMRL collaborates with both public and private sector partners to foster technologies that reduce the cost of compliance and to anticipate emerging problems. NRMRL’s research provides solutions to environmental problems by: developing and promoting technologies that protect and improve the environment; advancing scientific and engineering information to support regulatory and policy decisions; and providing the technical support and information transfer to ensure implementation of environmental regulations and strategies at the national, state, and community levels. This publication has been produced as part of the Laboratory’s strategic long-term research plan. It is published and made available by EPA’s Office of Research and Development to assist the user community and to link researchers with their clients.
Sally Gutierrez, Director National Risk Management Research Laboratory

iv
Acknowledgments
The authors wish to acknowledge the contribution of the New Mexico Border Authority for hosting this verification at the Santa Teresa Port of Entry (POE) and, in particular, the efforts of Mr. Marco Herrara in providing his export expertise in support of this verification test. We thank Dr. Barry Thatcher of BorderWriting, for supporting this verification test, but specifically for his coordination with the Mexican Customs officials along with all other local participants. Also, we acknowledge the cooperation of the New Mexico Department of Public Safety in providing read locations and Servicio de Transporte Internacional y Local in providing a truck and driver and Ivan Calzada of the Texas Transportation Institute. Finally, we thank Ms. Debra Tellez, Ms. Katrina Varner, and Mr. Israel Anderson of the U.S. EPA, Mr. Stephen Niemeyer of the Texas Commission on Environmental Quality, and Mr. José Mario Sánchez Soledad, Comisión de Ecología y Protección Civil, Gobierno Municipal De Juárez for their review of the test/QA plan and/or this verification report.

v
Contents
Foreword ........................................................................................................................................ iii
Page
Acknowledgments.......................................................................................................................... iv
List of Abbreviations .................................................................................................................... vii
Chapter 1 Background ................................................................................................................... 1
Chapter 2 Technology Description ................................................................................................ 2
Chapter 3 Test Design and Procedures .......................................................................................... 3 3.1 Test Overview .......................................................................................................................3 3.2 Experimental Design .............................................................................................................4
3.2.1 RFID Tags and HAZMAT Waste Containers .......................................................... 4 3.2.2 Waste Container Configuration in the Semi-Trailer ................................................. 4 3.2.3 Meteorological and Shock Data ................................................................................ 5 3.2.4 Collision Test ............................................................................................................ 6 3.2.5 Truck Routes and Descriptions of Round Trips ...................................................... 6 3.2.6 Route Deviation ...................................................................................................... 10
3.3 Qualitative Evaluation Parameters ......................................................................................10
Chapter 4 Quality Assurance/Quality Control ............................................................................. 11 4.1 Audits ..................................................................................................................................11
4.1.1 Technical Systems Audit ....................................................................................... 11 4.1.2 Data Quality Audit .................................................................................................. 11
4.2 QA/QC Reporting ...............................................................................................................11 4.3 Data Review ........................................................................................................................12
Chapter 5 Statistical Methods ...................................................................................................... 13 5.1 Accuracy ............................................................................................................................13 5.2 Precision .............................................................................................................................13 5.3 Influence of Confounding Factors .....................................................................................14
Chapter 6 Test Results ................................................................................................................. 15 6.1 Accuracy .............................................................................................................................15 6.2 Precision ..............................................................................................................................17 6.3 Interference of Other RFID Signals ....................................................................................17 6.4 Influence of Confounding Factors ......................................................................................17 6.5 Operational Factors .............................................................................................................18
Chapter 7 Performance Summary ................................................................................................ 20
Chapter 8 References ................................................................................................................... 22
vi
Figures
Figure 2-1. P2S2 RFID tag in tag housing ......................................................................................2 Figure 2-2. P2S2 communication module (Sentry) ........................................................................2 Figure 3-1. RFID tag affixed to poly drum. ....................................................................................4 Figure 3-2. Tightly-packed configuration .......................................................................................5 Figure 3-3. Loosely-packed configuration ......................................................................................5 Figure 3-4. Collision Tags ..............................................................................................................6 Figure 3-5. U.S. route used during testing (border area enlargement). ..........................................7 Figure 3-6. U.S. route used during testing. .....................................................................................8 Figure 3-7. Mexico route used during testing (border area enlargement) ......................................9 Figure 3-8. Mexico route used during testing .................................................................................9 Figure 6-1. Screenshot from P2S2’s mapping software ...............................................................18
Tables
Table 3-1. Summary of Round Trips ........................................................................................... 10 Table 6-1. Accuracy ......................................................................................................................16 Table 6-2. Container Identification Data Completeness ...............................................................16 Table 6-3. Overall Accuracy ± Standard Deviation of Each RT ..................................................17 Table 6-4. Collision Test Results ..................................................................................................17 Table 6-5. Accuracy Results by Container Type ..........................................................................18 Table 7-1. Accuracy, Precision, and Data Completeness .............................................................20

vii
List of Abbreviations
AMS Advanced Monitoring Systems P2S2 Private Pallet Security System, LLC EPA Environmental Protection Agency ETV Environmental Technology Verification GPS Global positioning system GHz Gigahertz HAZMAT Hazardous materials LRB Laboratory record book MHz Megahertz Mph Mile per hour MX Mexico NMBA New Mexico Border Authority NMDPS New Mexico Department of Public Safety NRMRL National Risk Management Research Laboratory Poly Polyethylene POE Port of Entry QA Quality assurance QMP Quality Management Plan RFID Radio-frequency identification RT Round Trip SD Standard deviation STIL Servico de Transporte Internacional y Local TQAP Test Quality Assurance Plan U.S. United States
1
Chapter 1 Background
The U.S. Environmental Protection Agency (EPA) supports the Environmental Technology Verification (ETV) Program to facilitate the deployment of innovative environmental technologies through performance verification and dissemination of information. The goal of the ETV Program is to further environmental protection by accelerating the acceptance and use of improved and cost-effective technologies. ETV seeks to achieve this goal by providing high-quality, peer-reviewed data on technology performance to those involved in the design, distribution, financing, permitting, purchase, and use of environmental technologies. ETV works in partnership with recognized testing organizations; with stakeholder groups consisting of buyers, vendor organizations, and permitters; and with the full participation of individual technology developers. The program evaluates the performance of innovative technologies by developing test plans that are responsive to the needs of stakeholders, conducting field or laboratory tests (as appropriate), collecting and analyzing data, and preparing peer-reviewed reports. All evaluations are conducted in accordance with rigorous quality assurance (QA) protocols to ensure that data of known and adequate quality are generated and that the results are defensible. The EPA’s National Risk Management Research Laboratory (NRMRL) and its verification organization partner, Battelle, operate the Advanced Monitoring Systems (AMS) Center under ETV. The AMS Center evaluated the performance of the MultiTrackTM Layered Technology System by Private Pallet Security Systems, LLC. (P2S2), a web-based real-time locating and reporting system, in tracking hazardous materials (HAZMAT) being returned to the U.S. from Mexico under terms of the La Paz Agreement. Under this agreement, all HAZMAT waste generated by raw materials shipped into Mexico for use in foreign-owned factories (called maquilas) must be shipped back to their country of origin. Mexico does not classify the returned material as hazardous, but as a returned product, and therefore does not submit a Notice of Intent to the United States for the export of such HAZMAT waste. The current process makes it difficult to develop an accurate accounting of HAZMAT waste entering the United States from the maquilas and does not provide for timely identification of shipments that do not reach their designated receiving facilities. The lack of tracking of these wastes creates the possibility for waste to be illegally abandoned. An enhanced tracking system that provides accurate, timely data to regulatory officials would be beneficial in preventing this from occurring. This verification test evaluated the performance of such tracking technologies.

2
Chapter 2 Technology Description
This verification report provides results for the verification testing of P2S2’s MultiTrackTM Layered Tracking System (hereafter referred to as MultiTrack). Following is a description of the MultiTrack technology, based on information provided by the vendor. P2S2’s MultiTrack is a hybrid, multi-functional network topology that enables fully automated wireless identification, location, environment monitoring and real time tracking of HAZMAT shipped throughout the world, providing information down to the item level. During this verification testing, MultiTrack utilized active radio-frequency identification (RFID) tag tracking coupled with P2S2’s communication module (referred to as the Sentry). The system components included active RFID tags shown in Figure 2-1, an antenna that was attached to the inside of the trailer door, and the Sentry which was connected to the antenna and located in a box mounted to the external of the trailer door, as shown in Figure 2-2. The RFID tags emit a radio frequency that is read continuously by the antenna and stored by the Sentry. This eliminated the need to install or pass any fixed readers along the travel route. Then, approximately every five minutes, and any time an alarm event occurs, the Sentry transmitted the identified RFID tags and the type of the alert or alarm, as well as the global positioning (GPS) coordinates of the Sentry, to a central P2S2 database via cellular phone connection. Web-based P2S2 software allows real-time mapping of the movement of whatever is being tracked. The P2S2 communication module is customizable with a variety of communication, sensor and power options. Prior to the start of the verification test, P2S2 setup the MultiTrack according to their recommended configuration for optimal performance.
Figure 2-1. P2S2 RFID tag in tag housing
Figure 2-2. P2S2 communication module (Sentry)

3
Chapter 3 Test Design and Procedures
3.1 Test Overview
This verification test was conducted according to procedures specified in the Test/QA Plan for Verification of Radio Frequency Identification (RFID) for Tracking Hazardous Waste Shipments across International Borders(1)(TQAP) and adhered to the quality system defined in the ETV AMS Center Quality Management Plan (QMP) (2). Battelle conducted this verification test with support from the New Mexico Border Authority (NMBA), New Mexico Department of Public Safety (NMDPS), Texas Transportation Institute, U.S. EPA Region 6 El Paso Border Office, U.S. EPA Office of Enforcement and Compliance Assurance, BorderWriting, and Servicio de Transporte Internacional y Local (STIL). This verification test simulated shipments of HAZMAT waste contained in polyethylene (poly) drums, metal drums, and corrugated boxes through routine land transportation routes and across international ports of entry in the El Paso/Ciudad Juárez trade area. Originally, this ETV test was planned with the expectation that all of the trucking routes would include border crossings. However, due to concern of local authorities related to the violence in Ciudad Juarez during the test, there were some difficulties in obtaining permission to cross the border into Mexico (MX), so two of the trucking routes did not cross into MX and two routes included crossing the border into MX. RFID tags were attached to various containers and loaded onto a truck at the U.S. loading dock at the NMBA facility using a standard 53-foot semi-truck and trailer provided by STIL, a local trucking company. Throughout the testing, the containers were arranged in the trailer in either a tightly-packed or loosely-packed orientation. The MultiTrack system included the RFID tags (attached to HAZMAT waste containers) and in-trailer antenna along with the Sentry communication module attached to the exterior of the trailer door. The truck then left the NMBA loading dock, drove a prescribed route either solely in the U.S. or across the U.S. – MX Border. RFID tag reads were recorded electronically throughout each truck route. This verification test of the MultiTrack was conducted on March 24 and 26, 2009 at the NMBA Santa Teresa facility and other field locations throughout the El Paso/Ciudad Juárez trade area. The MultiTrack was verified by evaluating the following parameters:
• Accuracy – proper identification of the tagged containers at various locations, at various truck speeds, on corrugated boxes or steel and poly 55-gallon drums, and in tightly-packed and loosely-packed loading configurations. Specifically, proper identification is defined as the retrieval of all information available about the tagged item according to the vendor’s standard procedures.
• Precision – standard deviation (SD) of percent accuracy RFID tag read results.

4
• Interference of other RFID signals (collision test) – ability to discriminate the tags on the HAZMAT waste containers from other commercially-available RFID tags.
• Influence of confounding factors – container type, packing configuration and placement of tags/containers, environmental conditions, and internal trailer conditions.
• Operational factors – ease of use, technology cost, user-friendliness of vendor software, troubleshooting/downtime, etc.
3.2 Experimental Design
3.2.1 RFID Tags and HAZMAT Waste Containers
At the beginning of each day of testing, verification test staff verified the function of 12 P2S2 RFID tags to be used as part of this verfication testing by measuring the frequency and the effective radiated power of the tag using a Rhode and Schwartz FSH6 spectrum analyzer with a 435 Megahertz (MHz) antenna. This was done by placing all RFID tags into the trunk of an automobile thereby isolating the signal emitted by each RFID tag from the spectrum analyzer. Next, a single RFID tag was removed from the automobile trunk, the trunk was again closed, and the single RFID tag was taken into the NMBA office building. The single RFID tag emitted frequencies and the effective radiated power of each frequency was measured and recorded. This process was repeated for all 12 P2S2 RFID tags and the four RFID tags used for the collision test. According to current shipping practices, most of the HAZMAT entering MX from the U.S. are contained in either poly or steel 55-gallon drums, and much of the HAZMAT waste returning from the maquila and entering the U.S. is solid and packaged in one-cubic yard corrugated boxes or as drummed liquids. Accordingly, once the functioning of the RFID tags had been confirmed, four RFID tags were secured to poly 55-gallon drums, four were secured to the steel 55-gallon drums, and four were affixed to corrugated cardboard boxes for a total of twelve individual containers. One tag was affixed to each individual container. Figure 3-1 presents a photo of an RFID tag affixed to a poly drum. In the interest of safety, no actual hazardous waste was transported during the verification test. Each poly and metal 55-gallon drum used in the verification testing was filled with tap water and each corrugated box was filled with loosely folded cardboard. RFID tags were secured to the top of each poly and metal drum and to the side of each corrugated box using Velcro tape.
3.2.2 Waste Container Configuration in the Semi-Trailer
Each round trip (RT) conducted in the U.S. was performed using a tightly-packed configuration of the HAZMAT waste containers. Each RT into MX was performed using a loosely-packed configuration.
Figure 3-1. RFID tag affixed to poly drum

5
Each packaging configuration consisted of 12 individual containers. Two metal drums were placed on a pallet and the drums were shrink-wrapped to secure the drums during transport. The process was repeated for the poly drums as well. Therefore, four pallets of drums were created; two pallets of two metal drums each and two pallets of two poly drums each. The corrugated boxes were not affixed to a pallet but placed directly on the floor of the trailer. The corrugated boxes and the pallets of drums were then positioned inside the truck trailer in a tightly-packed configuration. For the loosely-packed configuration, each pallet contained one of each kind of drum. Figures 3-2 and 3-3 show diagrams of tightly packed and loosely packed container configurations.
Regardless of packing configuration, each corrugated box was positioned such that one RFID tag faced each side of the trailer (i.e., one RFID tag faced the driver’s side, the passenger’s side, the front, and the rear of the trailer).
3.2.3 Meteorological and Shock Data
After the palletized poly and metal 55-gallon drums and the corrugated boxes were loaded into the trailer and positioned in the correct packaging configuration, a ShocklogTM RD 298 system (Shocklog) was installed directly onto the floor of the trailer and a calibrated hot wire anemometer (TSI Incorporated, VelociCalc 9555-P Multi-function Ventilation Meter), capable of measuring temperature, barometric pressure, and relative humidity, was affixed to the passenger’s side of the trailer approximately two feet above the floor. At the end of each day of verification testing, the electronic data generated and captured by the Shocklog and the anemometer were transferred from the instrument to a computer by means of a portable drive.
Figure 3-2. Tightly-packed configuration
Figure 3-3. Loosely-packed configuration

6
3.2.4 Collision Test
A collision test was performed during each RT run to evaluate the ability for the MultiTrack system to discriminate the P2S2 RFID tags from other commercially available active RFID tags. Battelle supplied four commercially available tags for collision testing; the collision tags were active RFID tags (Wavetrend® TG801) at a frequency of 433 MHz, the same frequency at which the MultiTrack system operated. The collision tags were affixed to a wooden block as shown in Figure 3-4. At the beginning of the day of testing, the function of each collision tag was verified separately by measuring the frequency and the effective radiated power of the tags using the spectrum analyzer. A collision test was performed during each verification test run at the NMDPS truck inspection facility. The truck would conduct its first pass of the 25 and 15 miles per hour (mph) read locations. The truck would then begin its second pass and pass the 25 mph read location. After passing the 25 mph read location the second time, the truck stopped, the trailer was opened, and the collision tags added to one of the one-cubic yard corrugated boxes. The trailer doors were then closed and the truck proceeded past the 15 mph read location and on to the NMBA after which the collision tags were removed.
3.2.5 Truck Routes and Descriptions of Round Trips
The TQAP1 was written with the expectation that the same trucking route would be used throughout the verification test and that the route would include crossing over in MX. However, there was some difficulty in obtaining permission to cross the border into MX, so two of the RTs were performed within the U.S. and when the proper permission was obtained, the other two RTs were performed crossing the border into MX. Also, the TQAP was written with the assumption that the technologies to be evaluated would have external readers that would be set up at various read points throughout the trucking route. This was not the case for the MultiTrack. The MultiTrack uses an antenna inside the trailer door to receive the tag information. The antenna was mounted on the inside door of the trailer and the Sentry communication module on the outside of the door. These features eliminated the need to install or pass any fixed readers along the travel route. MultiTrack reported the presence and location (through the use of global positioning tracking) of the identified tags at five minute intervals. However, because the TQAP was originally written with the focus of external readers, specific read locations were still used to guide the truck routes and the speed that the truck was traveling. Because the data were reported approximately every five minutes, there was no guarantee that the RFID data would be collected
Figure 3-4. Collision Tags

7
exactly at the fixed read locations as defined in the TQAP. However, the routes the truck followed encompassed “stop and go” driving as well as highway driving. Therefore, the fixed read locations defined a route for the truck and the data were reported approximately every five minutes, providing additional tag identification and location data throughout the RTs than specified in the TQAP. The two RTs performed in the U.S. and the two RTs including the border crossing into MX are described below. U.S. Trucking Route. The U.S. Trucking Route was selected to mimic, as much as possible, the tag read locations presented in the TQAP and to challenge the MultiTrack system under the same critical variables and similar test conditions specified in the TQAP. The HAZMAT waste containers were loaded into the trailer and placed in the tightly-packed configuration for both of the U.S. RTs. The truck began all of the RTs (U.S. and MX) at the NMBA facility. One of the read locations (as planned for external readers) was located at the exit to the NMBA facility. Upon exit from the NMBA, the truck travelled to the NMDPS facility. Figure 3-5 shows the path of the truck between the NMBA and the NMDPS facility. The total distance between the two locations was approximately 0.75 miles. There were two read locations on the driveway to the NMDPS facility. The first location was designated as a 25 mile per hour (mph) read point and the second location was designated a 15 mph read point. As the truck approached both the 25 mph and 15 mph read points, the speed at which the truck was travelling was measured using a Stalker SportTM 24.15 Gigahertz (GHz) Doppler radar gun. The truck then exited the NMDPS facility and doubled back to make a second pass. After passing the 25 mph read point, the truck was stopped, the trailer doors opened, the contents of the trailer inspected for any shifting of the load, and collision tags were added. The truck then passed the 15 mph read point. After passing the 15 mph read location truck the collision tags were removed. As was the case with the first pass of the truck through the NMDPS facility, the speed at which the truck was travelling past the 25 mph and 15 mph read points was measured using the radar gun.
Figure 3-5. U.S. route used during testing (border area enlargement)

8
The truck then proceeded to the Sunland Park Racetrack and Casino parking lot (referred to as the casino read location) as is shown in Figure 3-6. This location was selected because the route to the casino (approximately 13 miles) provided highway and city driving and the parking lot at the casino provided adequate space for the truck to turnaround. From the NMDPS, the truck travelled northbound on Peter V. Domenici Boulevard, east on Airport Road, southeast on McNutt Road (NM-273) and finally north on Sunland Park Drive to the Sunland Park Racetrack and Casino parking lot. Upon arrival at the casino, the truck entered the parking lot and waited for five minutes to allow adequate time for an uplinked data report to P2S2’s central server from the casino location. The truck left the casino parking lot and proceeded northbound on Sunland Park Drive. The truck next travelled northwest on Doniphan Road, west on Aircraft Road and south on Peter V. Domenici Boulevard and then the truck returned to the NMBA facility. While the read locations provided a framework for the route the truck traversed and the speed at which it travelled, because the P2S2 system communicated the container identification and location approximately every 5 minutes, regardless of location, the container identification took place continuously throughout each RT. Mexico Trucking Route. The MX Route was selected to mimic, as closely as possible, the tag reader locations presented in the TQAP and to challenge the MultiTrack system under the same critical variables and similar test conditions specified in the TQAP, which included crossing the border to evaluate an considerations regarding the technology in an actual border crossing. The HAZMAT waste containers were loaded into the trailer and placed in the loosely-packed configuration for both of the MX RTs. The read locations defining the MX route are shown in Figure 3-7 and Figure 3-8. As for each U.S. and MX RT, the truck began its route at the NMBA facility. Upon exiting the NMBA, the truck travelled to the MX Jerónimo Port of Entry (POE) and into MX. The truck made its way through the POE with slow “stop and go” driving as it waited in a line of trucks and had to stop for various inspections. After passing through the POE, the truck proceeded for approximately 12 miles southbound on the Samalayuca-El Oasis Highway (Carratera Samalayuca-El Oasis).
Fi 38 55
mph
Figure 3-6. U.S. route used during testing
3 miles

9
The third read location (referred to as MX Turnaround) on the MX Route was located 0.6 miles north of the intersection of the Samalayuca-El Oasis Highway and MX Highway 2 After passing this read location, the truck performed a U-turn and proceeded northbound on the Samalayuca-El Oasis Highway, passing back into the U.S. through the Santa Teresa POE and U.S. Customs.
After passing through U.S. Customs, the truck then proceeded to the NMDPS facility, following the same route as had been included for the U.S RTs. The truck passed a 25 mph read point and a 15 mph read point and then doubled back to pass them again, with the collision tags added before the second pass by the 15 mph read point. As was the case during the U.S. RTs, the speed at which the truck was travelling past the 25 mph and 15 mph read location was measured using a radar gun. The truck then proceeded back to the NMBA read location. Each of the four RTs are summarized in Table 3-1.
Figure 3-8. Mexico route used during testing
5 miles
Figure 3-7. Mexico route used during testing (border area enlargement)
0.5 miles

10
Table 3-1. Summary of Round Trips
Truck Route Read Locations of Round Trips Information about RT
RT 1 U.S. Began at NMBA, NMDPS Facility (25 and 15 mph, collision test), casino, completed at NMBA
Tightly packed configuration
RT 2 U.S. Began at NMBA, NMDPS Facility (25 and 15 mph, collision test), casino, completed at NMBA
Tightly packed configuration
RT 3 MX Began at NMBA, Mexico Port of Entry, MX Turnaround, NMDPS Facility (25 and 15 mph, collision test), completed at NMBA
Loosely packed configuration, uplinked data missing for approximately half of the RT
RT 4 MX Began at NMBA, MX Port of Entry, MX Turnaround, NMDPS Facility (25 and 15 mph, collision test), completed at NMBA
Loosely packed configuration
3.2.6 Route Deviation
The MultiTrack had an optional feature to provide indication when the RFID tags had traveled outside a pre-programmed route. To test this feature, during each RT, the P2S2 staff constructed an “electronic fence” that simulated the truck leaving the pre-programmed route. When the truck crossed the location of the electronic fence, an alert was sent to the central database and documented with the rest of the RFID and location data. Alerts were also sent to email and cell phones via text messaging. The test evaluated whether or not the proper alert for such a route deviation would be made.
3.3 Qualitative Evaluation Parameters
Operational factors such as ease of use, technology cost, user-friendliness of vendor software, and troubleshooting/downtime, etc. documented based on observations by Battelle, Border Writing, and U.S. EPA staff.

11
Chapter 4 Quality Assurance/Quality Control
QA/QC procedures were performed in accordance with the TQAP for this verification test(1) and the QMP for the AMS Center(2). As noted throughout Chapter 3, there were some deviations from the TQAP, but the work was performed as described in the previous sections. None of the deviations from the test/QA plan resulted in any adverse impacts on the quality of the data produced by this verification test. All deviations were reviewed with the EPA ETV AMS Center Project Officer and EPA ETV AMS Center Quality Manager. QA/QC procedures and results are described in the following subchapters.
4.1 Audits
Two types of audits were performed during the verification test; a technical systems audit (TSA) of the verification test procedures, and a data quality audit. Because of the nature of RFID measurements, a performance evaluation audit, as is usually performed to confirm the accuracy of the reference method, was not applicable for this verification test. Audit procedures for the TSA and the data quality audit are described further below.
4.1.1 Technical Systems Audit
The Battelle AMS Center Quality Manager performed a TSA during the test to ensure that the verification test was performed in accordance with the TQAP for this verification test(1) and the QMP for the AMS Center(2). The TSA noted no adverse findings. A TSA report was prepared, and a copy was distributed to the EPA AMS Center Quality Manager. In addition, the EPA AMS Center Quality Manager was also present during a portion of the verification test and also performed a separate TSA.
4.1.2 Data Quality Audit
At least 10% of the data acquired during the verification test were audited. The data were traced from the initial acquisition, through reduction and statistical analysis, to final reporting to ensure the integrity of the reported results. All calculations performed on the data undergoing the audit were checked.
4.2 QA/QC Reporting
Each audit was documented in accordance with Sections 3.3.4 and 3.3.5 of the QMP for the AMS Center.(2) Once the audit reports were prepared, the Battelle Verification Test Coordinator ensured that a response was provided for each adverse finding or potential problem and

12
implemented any necessary follow-up corrective action. The Battelle Quality Manager ensured that follow-up corrective action was taken. The results of the TSA were submitted to the EPA.
4.3 Data Review
Records generated in the verification test received a one-over-one review before these records were used to calculate, evaluate, or report verification results. Data were reviewed by a Battelle technical staff member involved in the verification test. The person performing the review added his/her initials and the date to a hard copy of the record being reviewed.

13
Chapter 5 Statistical Methods
The statistical methods used to evaluate the quantitative performance factors listed in Section 3.2 are presented in this chapter. Qualitative observations were also used to evaluate verification test data.
5.1 Accuracy
A primary objective for this verification test was to determine the accuracy of P2S2’s MultiTrackTM Layered Tracking System performance with reading tags under critical variables and test conditions. Accuracy is a measure of the agreement between a measured value and the “true” value. For this verification, accuracy was determined as a percentage according to the following formula: A = (1 - E/N) × 100 (1) where A is the percent accuracy of the RFID system, E is the total number of tags that were not properly recognized, and N is the total number of tagged HAZMAT containers. The accuracy of the system was determined for each read point and packaging type and throughout the entire trip. The highest percent accuracy possible is 100%.
5.2 Precision
Precision is a measure of agreement among repeated measurement. The precision of tag reads completed by the MultiTrack was determined by calculating the SD of the accuracy at all possible read locations. The SD of the accuracy measurements was calculated using the following formula:
( )2n
1kii,kn
1i,N AA∑
=
−=S
where, SN,i is the SD of all accuracy measurements in verification test run i, n is the total number of possible read events in verification test run i, Ak,i is the percent accuracy of the RFID system reader for read event k during verification test run i, and Ai is the overall arithmetic average percent accuracy of the RFID system during verification test run i.

14
5.3 Influence of Confounding Factors
The influence of the different container types on the accuracy of container identification was evaluated by calculating the accuracy in each container during each RT. Then a paired t-test was performed to determine if significant differences existed between the accuracy of the identification of steel drums, poly drums, and cardboard boxes. Other possible confounding factors included meteorological and environmental conditions. These data were reviewed qualitatively in attempt to identify possible correlations where statistical approaches should be considered.
15
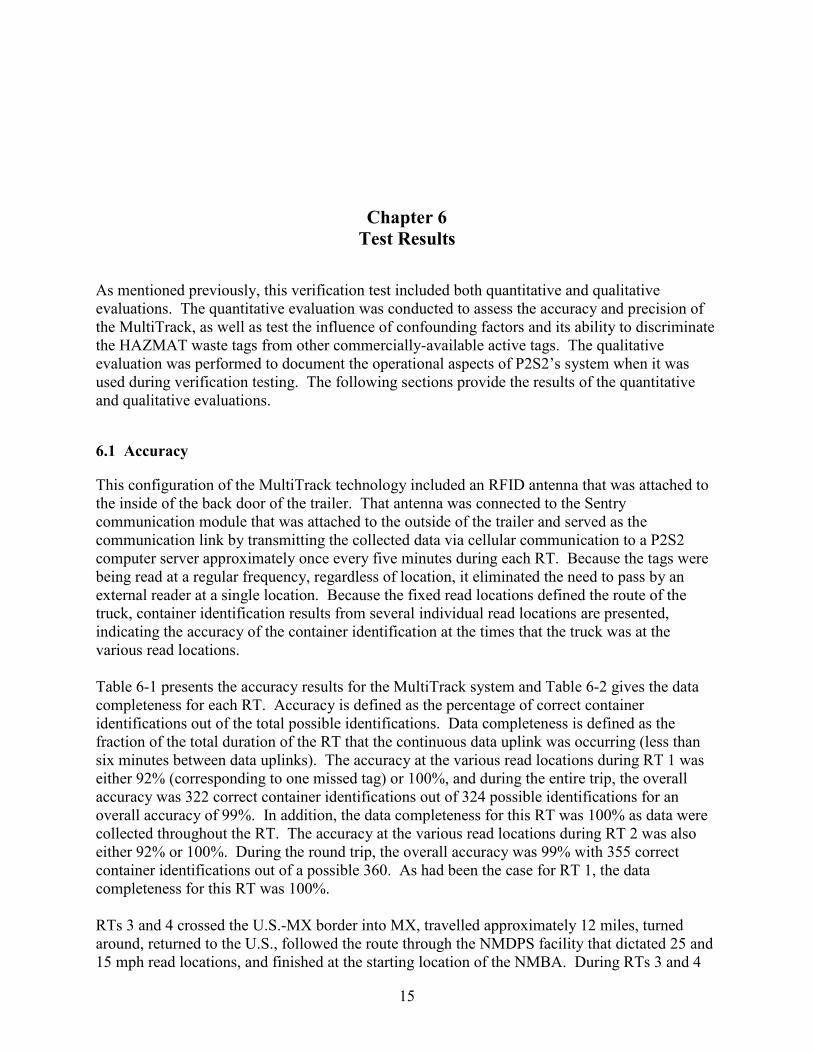
Chapter 6 Test Results
As mentioned previously, this verification test included both quantitative and qualitative evaluations. The quantitative evaluation was conducted to assess the accuracy and precision of the MultiTrack, as well as test the influence of confounding factors and its ability to discriminate the HAZMAT waste tags from other commercially-available active tags. The qualitative evaluation was performed to document the operational aspects of P2S2’s system when it was used during verification testing. The following sections provide the results of the quantitative and qualitative evaluations.
6.1 Accuracy
This configuration of the MultiTrack technology included an RFID antenna that was attached to the inside of the back door of the trailer. That antenna was connected to the Sentry communication module that was attached to the outside of the trailer and served as the communication link by transmitting the collected data via cellular communication to a P2S2 computer server approximately once every five minutes during each RT. Because the tags were being read at a regular frequency, regardless of location, it eliminated the need to pass by an external reader at a single location. Because the fixed read locations defined the route of the truck, container identification results from several individual read locations are presented, indicating the accuracy of the container identification at the times that the truck was at the various read locations. Table 6-1 presents the accuracy results for the MultiTrack system and Table 6-2 gives the data completeness for each RT. Accuracy is defined as the percentage of correct container identifications out of the total possible identifications. Data completeness is defined as the fraction of the total duration of the RT that the continuous data uplink was occurring (less than six minutes between data uplinks). The accuracy at the various read locations during RT 1 was either 92% (corresponding to one missed tag) or 100%, and during the entire trip, the overall accuracy was 322 correct container identifications out of 324 possible identifications for an overall accuracy of 99%. In addition, the data completeness for this RT was 100% as data were collected throughout the RT. The accuracy at the various read locations during RT 2 was also either 92% or 100%. During the round trip, the overall accuracy was 99% with 355 correct container identifications out of a possible 360. As had been the case for RT 1, the data completeness for this RT was 100%. RTs 3 and 4 crossed the U.S.-MX border into MX, travelled approximately 12 miles, turned around, returned to the U.S., followed the route through the NMDPS facility that dictated 25 and 15 mph read locations, and finished at the starting location of the NMBA. During RTs 3 and 4

16
Table 6-1. Accuracy Round Trip Number RT1 RT 2 RT 3 RT 4 Truck Route US US MX MX Packaging Config. Tight Tight Loose Loose Read Locations
NMBA exit 100% (12/12) 92% (11/12) 100% (12/12) 100% (12/12) MX POE (1) (1) 100% (12/12) 100% (12/12) NM Casino 92% (11/12) 100% (12/12) (1) (1) MX Turnaround (1) (1) 100% (12/12) 100% (12/12) NMDPS
25 mph pass 100% (12/12) 100% (12/12) 100% (12/12) 100% (12/12) 15 mph pass 100% (12/12) 100% (12/12) 100% (12/12) 100% (12/12) 25 mph pass 100% (12/12) 100% (12/12) 100% (12/12) 100% (12/12) 15 mph pass (collision test) 92% (11/12) 100% (12/12) 100% (12/12) 100% (12/12)
NMBA entrance 100% (12/12) 100% (12/12) 100% (12/12) 100% (12/12) Overall 99% (322/324) 99% (355/360) 100% (480/480) 100% (324/324) (1) Read location not applicable for this RT
Table 6-2. Container Identification Data Completeness Round Trip Number RT 1 RT 2 RT 3 RT 4 Truck Route US US MX MX Elapsed Time (min) of route 107 120 193 133
Duration of continuous data uplinks (min)
107 120 159 99
Data completeness 100% 100% 82% 74% there was one 34 minute time period during which container identification data were not collected. These gaps in data both occurred in MX as the truck returned from the MX turnaround point. According to P2S2, both of these gaps in data were caused by the lack of cellular phone coverage during those time periods. In both cases, the GPS tracking data were recorded (stored, but not transmitted) approximately every five minutes during the time period with missing data and then transmitted when the cellular connection was regained. Over each 34 minute period, six data transmissions had been stored and then were transmitted upon regaining connection. No container identification data were collected during these time periods. P2S2 explained that the MultiTrack system is also capable of storing the container identification data and then transmitting it along with the GPS information when the cellular coverage was regained. However, this feature had not been enabled during the verification test. Overall, the data completeness for the container identification during RTs 3 and 4 was 82% and 74%, respectively. Since the GPS data was stored when cellular phone service was unavailable, GPS data completeness was 100%. The accuracy at the various read locations during RTs 3 and 4 was consistently 100% throughout the RTs. In addition, throughout the times during each of these RTs that container identification data was collected, there were no misidentified containers for 100% accuracy. For RT 3 there were 480 correct container identifications and for RT 4, 324 correct container identifications.

17
6.2 Precision
The precision, or repeatability, of the RFID accuracy data were determined as described in Section 5.2 and is given in Table 6-3 along with the overall accuracy for each RT. Table 6-3. Overall Accuracy ± Standard Deviation of Each RT Truck Route Accuracy ± SD RT1-US 99% ± 2% RT2-US 99% ± 3% RT3-MX 100% ± 0% RT4-MX 100% ± 0%
The SDs were 2% and 3% for RTs 1 and 2 and 0% (meaning all individual data reports generated consistent results) for RTs 3 and 4.
6.3 Interference of Other RFID Signals
The collision test was performed as described in Section 3.2.4 by placing four active RFID tags into the trailer along with the containers that were tagged with the P2S2 RFID tags. Thereafter, the truck passed the second 15 mph read location at the NMDPS facility and continued onto the NMBA with the collision tags. The data corresponding to that time period are shown in Table 6-4. Overall, three out of the four available data sets resulted in 100% accuracy and one had 92% accuracy. Prevention of all or most reads from taking place would have indicated a significant interference. While difficult to determine conclusively with this small data set, these results were similar to those presented in Table 6-1, suggesting that there was little or no negative impact from the presence of four additional RFID tags. Table 6-4. Collision Test Results
Truck Route Accuracy (Identified Tags/Total Tags)
RT1-US 92% (11/12) RT2-US 100% (12/12) RT3-MX 100% (12/12) RT4-MX 100% (12/12)
6.4 Influence of Confounding Factors
Container type and packaging configuration. The RFID tags were placed on three different types of containers during the round trips. The accuracy results are presented in Table 6-5 by container type. The only container type that had data misidentified by the system was the poly drums. Accuracies near 100% (seven of out a total possible 684 during the RT1 and RT2 tests), suggest that confounding factors were not an issue during this evaluation. Meteorological and other environmental conditions. Throughout the two days of testing, the temperature inside the truck ranged from 13.3 to 28.5 degrees Celsius (°C). The relative humidity ranged from 14% to 20% and the barometric pressure ranged from 25.4 to 26.1 inches of mercury (in Hg). Upon a qualitative review of the accuracy data, meteorological conditions did not appear to impact the results, so no statistical analyses were performed. Similarly, there

18
Table 6-5. Accuracy Results by Container Type (in percent) Truck Route Steel Drum Poly Drum Cardboard Box
RT 1 100 98 100 RT 2 100 96 100 RT 3 100 100 100 RT 4 100 100 100
was no observable correlation between the Shocklog data collected during each RT and the accuracy results, so no statistical analyses were performed.
6.5 Operational Factors
The verification staff found that the MultiTrack system was easy to use. P2S2 staff set up the in-trailer antenna and the external Sentry communication module and assisted the verification staff in the application of the RFID tags. Once technology setup was complete, there was nothing more that had to be done to operate the MultiTrack system. As implemented during this test, the MultiTrack system required the communication module to be mounted on the outside of the trailer. If implemented this way, it could call attention to the trailer as one that carried valuable goods.
The software that P2S2 uses to handle the data collected by the uplinked data connection is web-based and offers a number of utilities that were used during the verification test. One optional feature that was tested was the ability for the software to provide an alert when the truck crossed an “electronic fence” placed along the planned truck route. This was evaluated by designating
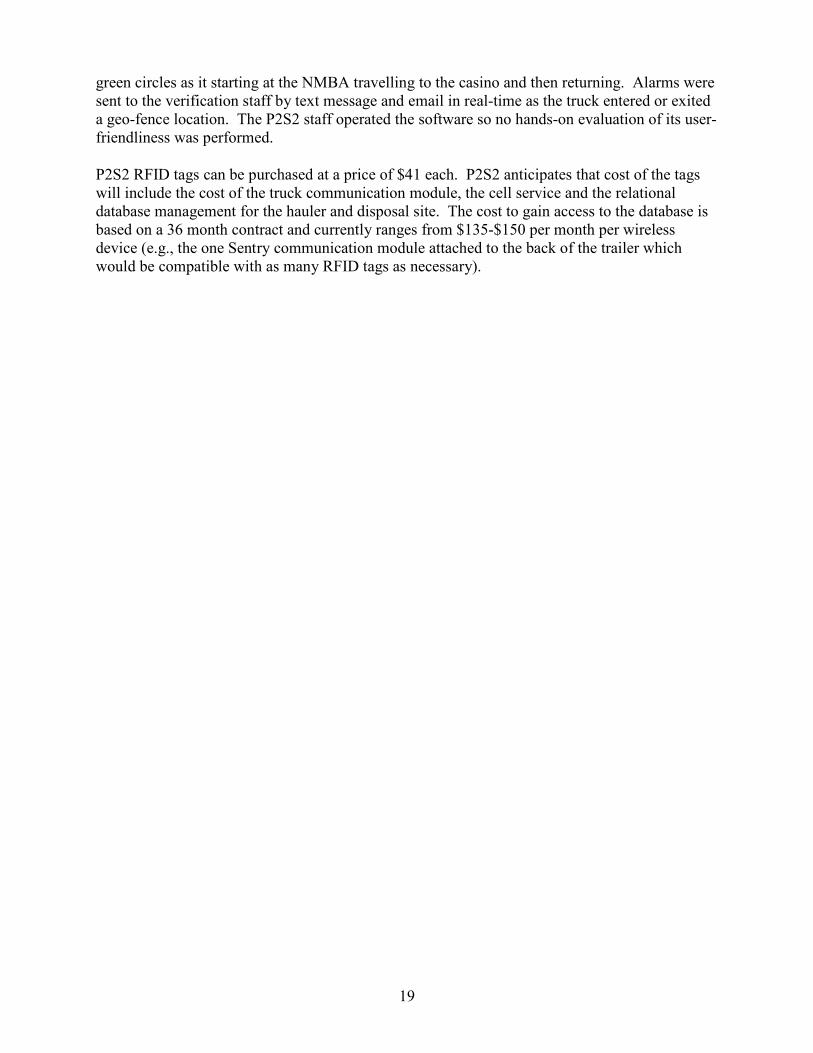
the U.S. and MX planned truck route (with destinations) in the system, and setting the alarm to indicate if the truck deviated from the planned route, and when the truck arrived at the destination. The electronic fence was identified as a “geo-fence or route builder” which provided a detailed visual track on the mapping web page. An example of a geo-fence location is shown in Figure 6-1 by a large green ring. The path of the truck is shown by solid
Figure 6-1. Screenshot from P2S2’s mapping software
19
green circles as it starting at the NMBA travelling to the casino and then returning. Alarms were sent to the verification staff by text message and email in real-time as the truck entered or exited a geo-fence location. The P2S2 staff operated the software so no hands-on evaluation of its user-friendliness was performed.
P2S2 RFID tags can be purchased at a price of $41 each. P2S2 anticipates that cost of the tags will include the cost of the truck communication module, the cell service and the relational database management for the hauler and disposal site. The cost to gain access to the database is based on a 36 month contract and currently ranges from $135-$150 per month per wireless device (e.g., the one Sentry communication module attached to the back of the trailer which would be compatible with as many RFID tags as necessary).

20
Chapter 7 Performance Summary
Accuracy and precision. Four RTs were performed using the MultiTrack system. Table 7-1 summarizes the accuracy, precision, and data completeness of the MultiTrack system. Table 7-1. Accuracy, Precision, and Data Completeness
Round Trip Accuracy (Correct IDs/Total
Possible) ± SD Data Completeness
RT1-US 99% (322/324) ± 2% 100% RT2-US 99% (355/360) ± 3% 100% RT3-MX 100% (480/480) ± 0% 82% RT4-MX 100% (324/324) ± 0% 74%
Across the four round trips, there was a possibility of 1,488 container identifications and the MultiTrack system made 1,481 of those identifications correctly for an overall accuracy of 99.5%. As discussed in Section 6.1, the two MX round trips included 34 minute periods that the truck was apparently out of the required cellular phone coverage area. During this time, the GPS tracking data were stored and transmitted upon regaining adequate cellular coverage; however, the feature that would have allowed for the MultiTrack system to store and report the container identification information along with the GPS data were not enabled during the verification test. Therefore, the container identification information was not documented during this timeframe which is indicated by the data completeness percentages of less than 100% for RTs 3 and 4. Interference with other RFID signals. The collision test was performed as described in Section 3.2.4 by placing four RFID tags into the trailer along with the containers that were tagged with the P2S2 RFID tags. Three out of the four collision test data sets resulted in 100% accuracy and one had 92% accuracy. Influence of confounding factors. The influence of container type and environmental conditions such as meteorological and shock conditions was considered as a possible factor in MultiTrack performance. However, accuracies near 100% for container identifications suggest that confounding factors were not an issue during this evaluation. Operational factors. The verification staff found that the MultiTrack system was easy to use. P2S2 staff set up the in-trailer antenna and the external Sentry communication module and assisted the verification staff in the application of the RFID tags. Once technology setup was complete, there was nothing more that had to be done to operate the MultiTrack system. As

21
implemented during this test, the MultiTrack system required the communication module to be mounted on the outside of the trailer. If implemented this way, it could call attention to the trailer as one that carried valuable goods. The software that P2S2 uses to handle the data collected by the uplinked data connection is web-based and offers a number of utilities that were used during the verification test. One optional feature that was tested was the ability for the software to provide an alert when the truck crossed an “electronic fence” placed along the planned truck route. This was evaluated by designating the U.S. and MX planned truck route (with destinations) in the system, and setting the alarm to indicate if the truck deviated from the planned route, and when the truck arrived at the destination. The P2S2 staff operated the software so no hands-on evaluation of its user-friendliness was performed. P2S2 RFID tags can be purchased at a price of $41 each. P2S2 anticipates that cost of the tags will include the cost of the truck communication unit, the cell service and the relational database management for the hauler and disposal site. The cost to gain access to the database is based on a 36 month contract and currently ranges from $135-$150 per month per wireless device (e.g., the one Sentry communication module attached to the back of the trailer which would be compatible with as many RFID tags as necessary).

22
Chapter 8 References
1. Test/QA Plan for Test/QA Plan for Verification of Radio Frequency Identification (RFID) for Tracking Hazardous Waste Shipments across International Borders, Battelle, Columbus, Ohio, March 23, 2009.
2. Quality Management Plan for the ETV Advanced Monitoring Systems Center, Version 7.0,
U.S. EPA Environmental Technology Verification Program, Battelle, Columbus, Ohio, November 2008.