environmental working group...- 2 - opinion in our opinion, the 2018 financial statements referred...
TRANSCRIPT

Environmental Working Group Financial Statements For the Years Ended December 31, 2018 and 2017
and Report Thereon

ENVIRONMENTAL WORKING GROUP
TABLE OF CONTENTS For the Years Ended December 31, 2018 and 2017
_______________
Page Independent Auditors’ Report ............................................................................................................. 1-2
Financial Statements
Statements of Financial Position ........................................................................................................ 3 Statements of Activities ...................................................................................................................... 4 Statement of Functional Expenses ..................................................................................................... 5 Statements of Cash Flows .................................................................................................................. 6 Notes to Financial Statements ....................................................................................................... 7-19

Marcum LLP n 1899 L Street, NW n Suite 850 n Washington, DC 20036 n Phone 202.227.4000 n Fax 202.227.4001 n www.marcumllp.com
Continued - 1 -
INDEPENDENT AUDITORS’ REPORT
To the Board of Directors of the Environmental Working Group
Report on the Financial Statements We have audited the accompanying financial statements of the Environmental Working Group, which comprise the statement of financial position as of December 31, 2018, and the related statements of activities, functional expenses and cash flows for the year then ended, and the related notes to the financial statements.
Management’s Responsibility for the Financial Statements Management is responsible for the preparation and fair presentation of these financial statements in accordance with accounting principles generally accepted in the United States of America; this includes the design, implementation, and maintenance of internal control relevant to the preparation and fair presentation of financial statements that are free from material misstatement, whether due to fraud or error.
Auditors’ Responsibility Our responsibility is to express an opinion on these financial statements based on our audit. We conducted our audit in accordance with auditing standards generally accepted in the United States of America. Those standards require that we plan and perform the audit to obtain reasonable assurance about whether the financial statements are free from material misstatement.
An audit involves performing procedures to obtain audit evidence about the amounts and disclosures in the financial statements. The procedures selected depend on the auditors’ judgment, including the assessment of the risks of material misstatement of the financial statements, whether due to fraud or error. In making those risk assessments, the auditor considers internal control relevant to the entity’s preparation and fair presentation of the financial statements in order to design audit procedures that are appropriate in the circumstances, but not for the purpose of expressing an opinion on the effectiveness of the entity’s internal control. Accordingly, we express no such opinion. An audit also includes evaluating the appropriateness of accounting policies used and the reasonableness of significant accounting estimates made by management, as well as evaluating the overall presentation of the financial statements.
We believe that the audit evidence we have obtained is sufficient and appropriate to provide a basis for our audit opinion.

- 2 -
Opinion In our opinion, the 2018 financial statements referred to above present fairly, in all material respects, the financial position of the Environmental Working Group as of December 31, 2018, and the changes in its net assets and its cash flows for the year then ended in accordance with accounting principles generally accepted in the United States of America.
Other Matters Prior Period Financial Statements EWG’s 2017 financial statements were audited by Raffa, P.C., whose practice was combined with Marcum LLP as of October 1, 2018, and whose report dated June 21, 2018, expressed an unmodified opinion on those statements.
Washington, DC August 14, 2019

ENVIRONMENTAL WORKING GROUP
The accompanying notes are an integral part of these financial statements.
- 3 -
2018 2017ASSETS
Cash and cash equivalents 4,132,014$ 3,199,253$ Due from related entities 24,782 52,063 Prepaid expenses and deposits 233,357 283,048 Grants and contributions receivable 3,971,807 1,250,228 Investments 3,166,740 2,643,745 Property and equipment, net 171,365 203,369
TOTAL ASSETS 11,700,065$ 7,631,706$
LIABILITIES AND NET ASSETS Liabilities
Accounts payable and accrued expenses 512,779$ 632,046$ Deferred rent and leasehold allowances 148,417 140,290
TOTAL LIABILITIES 661,196 772,336
Net Assets Without donor restrictions 6,652,890 5,319,123
With donor restrictions 4,385,979 1,540,247
TOTAL NET ASSETS 11,038,869 6,859,370
TOTAL LIABILITIES AND NET ASSETS 11,700,065$ 7,631,706$
STATEMENTS OF FINANCIAL POSITIONDecember 31, 2018 and 2017
_______________

ENVIRONMENTAL WORKING GROUP
The accompanying notes are an integral part of these financial statements.
- 4 -
Without With Without WithDonor Donor Donor Donor
Restrictions Restrictions Total Restrictions Restrictions TotalREVENUE AND SUPPORT
Grants and contributions 8,637,369$ 4,840,225$ 13,477,594$ 8,128,991$ 1,506,931$ 9,635,922$ In-kind contributions 321,994 - 321,994 802,273 - 802,273 Administrative and consulting fees 1,073,925 - 1,073,925 653,760 - 653,760 Special events 401,272 - 401,272 285,326 - 285,326 Rental income 75,248 - 75,248 66,864 - 66,864 Other income 11,786 - 11,786 53,384 - 53,384 Investment income, net 51,574 - 51,574 9,487 - 9,487 Net assets released from restrictions:
Satisfaction of program restrictions 1,994,493 (1,994,493) - 2,452,071 (2,452,071) -
TOTAL REVENUE AND SUPPORT 12,567,661 2,845,732 15,413,393 12,452,156 (945,140) 11,507,016
EXPENSES Program Services:
Toxics and human health 5,008,562 - 5,008,562 4,727,426 - 4,727,426 Food and agriculture 2,782,555 - 2,782,555 2,625,943 - 2,625,943 Licensing 1,182,371 - 1,182,371 810,849 - 810,849 Energy and natural resources 352,710 - 352,710 242,854 - 242,854
Total Program Services 9,326,198 - 9,326,198 8,407,072 - 8,407,072
Supporting Services:Management and general 790,745 - 790,745 839,378 - 839,378 Fundraising:
Fundraising – other 759,178 - 759,178 861,364 - 861,364 Fundraising – cost of direct benefit to donor 357,773 - 357,773 321,347 - 321,347
Total Fundraising 1,116,951 - 1,116,951 1,182,711 - 1,182,711
Total Supporting Services 1,907,696 - 1,907,696 2,022,089 - 2,022,089
TOTAL EXPENSES 11,233,894 - 11,233,894 10,429,161 - 10,429,161
CHANGE IN NET ASSETS 1,333,767 2,845,732 4,179,499 2,022,995 (945,140) 1,077,855
NET ASSETS, BEGINNING OF YEAR 5,319,123 1,540,247 6,859,370 3,296,128 2,485,387 5,781,515
NET ASSETS, END OF YEAR 6,652,890$ 4,385,979$ 11,038,869$ 5,319,123$ 1,540,247$ 6,859,370$
_______________
STATEMENTS OF ACTIVITIESFor the Years Ended December 31, 2018 and 2017
20172018

ENVIRONMENTAL WORKING GROUP
Energy and Total Management TotalToxics and Food and Natural Program and Supporting 2018 2017
Human Health Agriculture Licensing Resources Services General Fundraising Services Total Total
Salaries, taxes, and benefits 3,356,192$ 1,817,658$ 454,587$ 264,671$ 5,893,108$ 525,438$ 346,639$ 872,077$ 6,765,185$ 5,897,757$ Occupancy 489,031 256,615 62,813 38,728 847,187 80,418 44,149 124,567 971,754 1,087,898 Professional fees 217,902 164,176 420,782 1,579 804,439 19,317 18,341 37,658 842,097 522,310 Events and travel 119,417 92,192 120,915 10,101 342,625 42,675 374,566 417,241 759,866 713,417 Marketing and advertising 433,387 60,349 33,130 9,906 536,772 18,975 193,529 212,504 749,276 705,772 Research and data 81,454 165,488 38,438 3,241 288,621 9,425 9,785 19,210 307,831 231,513 Donated advertising 135,065 73,291 16,833 10,684 235,873 19,884 15,544 35,428 271,301 801,359 Information technology 105,162 105,944 14,640 8,655 234,401 17,756 10,805 28,561 262,962 205,860 Bank and credit card fees 48 34 9,417 4 9,503 26,382 93,894 120,276 129,779 92,987 Other 38,614 19,681 5,223 3,240 66,758 18,359 6,197 24,556 91,314 104,829 Supplies 32,290 27,127 5,593 1,901 66,911 12,116 3,502 15,618 82,529 65,459
TOTAL EXPENSES 5,008,562$ 2,782,555$ 1,182,371$ 352,710$ 9,326,198$ 790,745$ 1,116,951$ 1,907,696$ 11,233,894$ 10,429,161$
STATEMENT OF FUNCTIONAL EXPENSESFor the Year Ended December 31, 2018
_______________
Program Services Supporting Services
(With Summarized Financial Information For the Year Ended December 31, 2017)
The accompanying notes are an integral part of these financial statements.
- 5 -

ENVIRONMENTAL WORKING GROUP
The accompanying notes are an integral part of these financial statements.
- 6 -
2018 2017CASH FLOWS FROM OPERATING ACTIVITIES
Change in net assets 4,179,499$ 1,077,855$ Adjustments to reconcile change in net assets to net cash provided by operating activities:
Depreciation and amortization 111,888 172,697 Net realized and unrealized (gains) losses (5,499) 12,422 Changes in assets and liabilities:
Due from related entities 27,281 (19,056) Prepaid expenses and deposits 49,691 (38,892) Grants and contributions receivable (2,721,579) 600,088 Accounts payable and accrued expenses (119,267) 147,251 Deferred rent and leasehold allowances 8,127 79,019
NET CASH PROVIDED BY OPERATING ACTIVITIES 1,530,141 2,031,384
CASH FLOWS FROM INVESTING ACTIVITIES Acquisition of property and equipment (79,884) (22,783) Proceeds from sales of investments 2,500,281 2,109,492 Purchases of investments (3,017,777) (3,635,219)
NET CASH USED IN INVESTING ACTIVITIES (597,380) (1,548,510)
NET INCREASE IN CASH AND CASH EQUIVALENTS 932,761 482,874
CASH AND CASH EQUIVALENTS, BEGINNING OF YEAR 3,199,253 2,716,379
CASH AND CASH EQUIVALENTS, END OF YEAR 4,132,014$ 3,199,253$
_______________
STATEMENTS OF CASH FLOWSFor the Years Ended December 31, 2018 and 2017

ENVIRONMENTAL WORKING GROUP
NOTES TO FINANCIAL STATEMENTS For the Years Ended December 31, 2018 and 2017
_______________
Continued - 7 -
1. Organization and Summary of Significant Accounting Policies Organization The Environmental Working Group (EWG) is the nation’s most effective environmental health research and advocacy organization, whose mission is to conduct original, game-changing research that inspires people, businesses and governments to take action to protect human health and the environment. EWG’s areas of emphasis include agriculture, air and water pollution, children’s health, the public’s right to know, and environmental issues. These activities are funded primarily through grants and contributions. Basis of Accounting EWG’s financial statements have been prepared on the accrual basis of accounting. Accordingly, revenue is recognized when earned and expenses are recognized when the obligation is incurred. Cash and Cash Equivalents EWG considers all highly liquid investments with maturities of three months or less to be cash equivalents, except for certificates of deposit that have maturities of three months or less, which are held for investment purposes. Investments Investments are composed of mutual funds; equities; bank deposit sweep funds; municipal, government and corporate bonds; and certificates of deposit held for investment purposes as intended by EWG’s management. These investments are reported at fair value, which is the price that would be received to sell an asset or paid to transfer a liability in an orderly transaction between market participants at the measurement date. Fair Value of Financial Instruments Financial Accounting Standards Board (FASB) Accounting Standards Codification (ASC) Topic 820, Fair Value Measurement, defines fair value, establishes a framework for measuring fair value in accordance with accounting principles generally accepted in the United States of America (GAAP) and requires disclosures about fair value measurements for assets and liabilities that are measured at fair value on a recurring basis. The ASC emphasizes that fair value is a market-based measurement, not an entity-specific measurement, and therefore a fair value measurement should be determined based on the assumptions that market participants would use in pricing the asset or liability. As a basis for considering market participant assumptions in fair value measurements, the ASC established a fair value hierarchy based upon the transparency of the inputs to the valuation of an asset or liability. These inputs may be observable, whereby market participant assumptions are developed based on market data obtained from independent sources, and unobservable, whereby assumptions about market participant assumptions are developed by the reporting entity based on the best information available in the circumstances. The three levels of the fair value hierarchy are described as follows:

ENVIRONMENTAL WORKING GROUP
NOTES TO FINANCIAL STATEMENTS For the Years Ended December 31, 2018 and 2017
_______________
Continued - 8 -
1. Organization and Summary of Significant Accounting Policies (continued) Fair Value of Financial Instruments (continued)
Level 1 – Inputs based on quoted prices (unadjusted) in active markets for identical assets or liabilities accessible at the measurement date. Level 2 – Inputs other than quoted prices included in Level 1 that are observable for the asset or liability, either directly or indirectly, such as quoted prices for similar assets or liabilities in active markets. Level 3 – Unobservable inputs for the asset or liability, including the reporting entity’s own assumptions in determining the fair value measurement.
As of December 31, 2018 and 2017, only EWG’s investments, as described in Note 3 of these financial statements, were measured at fair value on a recurring basis. Property and Equipment and Related Depreciation and Amortization Property and equipment are stated at cost and are depreciated using the straight-line method over their estimated useful lives of two to eight years, with no salvage value. Software and website development costs incurred for planning and operating the websites and applications are expensed, whereas costs incurred in developing the applications and infrastructure are capitalized and amortized on a straight-line basis over an estimated useful life of three years. Leasehold improvements are stated at cost and are amortized over the lesser of the life of the asset or the life of the lease. EWG capitalizes all expenditures for property and equipment that are more than $1,000 and have an economic life in excess of one year. Expenditures for major repairs and improvements are capitalized. Expenditures for minor repairs and maintenance costs are expensed when incurred. Upon the retirement or disposal of the assets, the cost and the accumulated depreciation or amortization are eliminated from the accounts, and the resulting gain or loss is included in the accompanying statements of activities. Classification of Net Assets EWG’s net assets are reported as follows:
• Net assets without donor restrictions represent the portion of expendable funds that are available for support of EWG’s operations and amounts designated by the Board of Directors for special purposes.
• Net assets with donor restrictions represent funds that are specifically restricted by donors for use in various programs and/or for a specific period of time.
Revenue Recognition EWG recognizes all unconditional contributed support in the accounting period in which the commitment to give is made. Grants and contributions are considered without donor restrictions and available for general operations, unless specifically restricted by the donor. EWG reports grants and contributions of cash and other assets as net assets with donor

ENVIRONMENTAL WORKING GROUP
NOTES TO FINANCIAL STATEMENTS For the Years Ended December 31, 2018 and 2017
_______________
Continued - 9 -
1. Organization and Summary of Significant Accounting Policies (continued) Revenue Recognition (continued) restrictions if they are received with donor stipulations that limit the use of the donated assets to a particular purpose or to a specific period of time. When the stipulated time restriction ends or the purpose of the restriction is met, net assets with donor restrictions are reclassified to net assets without donor restrictions and reported in the accompanying statements of activities as net assets released from restrictions. In-Kind Contributions In-kind contributions are recognized as revenue and expense in the accompanying statements of activities at their estimated fair value at the date of donation. Functional Allocation of Expenses The costs of providing the various programs and other activities have been summarized on a functional basis in the accompanying statement of functional expenses. Expenses directly attributed to a specific program or supporting service are reported as expenses of that category, while shared costs that benefit multiple functional areas have been allocated among the various programs and supporting services based on estimates determined by management to be equitable. Salaries and benefits are allocated based on time and effort reports while overhead costs included in occupancy, online engagement fees, in-kind expense, information technology and other expenses are allocated based on the direct labor allocated to the program or supporting services. Estimates The preparation of financial statements in conformity with GAAP requires management to make estimates and assumptions that affect the reported amounts and disclosures. Accordingly, actual results could differ from those estimates. New Accounting Pronouncement On August 18, 2016, FASB issued Accounting Standards Update (ASU) 2016-14, Not-for-Profit Entities (Topic 958): Presentation of Financial Statements of Not-for-Profit Entities. The update addresses the complexity and understandability of net asset classification, deficiencies in information about liquidity and availability of resources, and the lack of consistency in the type of information provided about expenses and investment return. The ASU has been applied retrospectively to all periods presented. The major changes of the ASU affecting EWG include (a) requiring the presentation of only two classes of net assets now entitled “net assets without donor restrictions” and “net assets with donor restrictions”; (b) requiring that all nonprofits present an analysis of expenses by function and nature in either the statements of activities, a separate statement, or the notes to the statements and disclose a summary of the allocation methods used to allocate costs; (c) requiring the disclosure of quantitative and qualitative information regarding liquidity and availability of resources; and (d) presenting investment return net of external and direct internal investment expenses.
ENVIRONMENTAL WORKING GROUP
NOTES TO FINANCIAL STATEMENTS For the Years Ended December 31, 2018 and 2017
_______________
Continued - 10 -
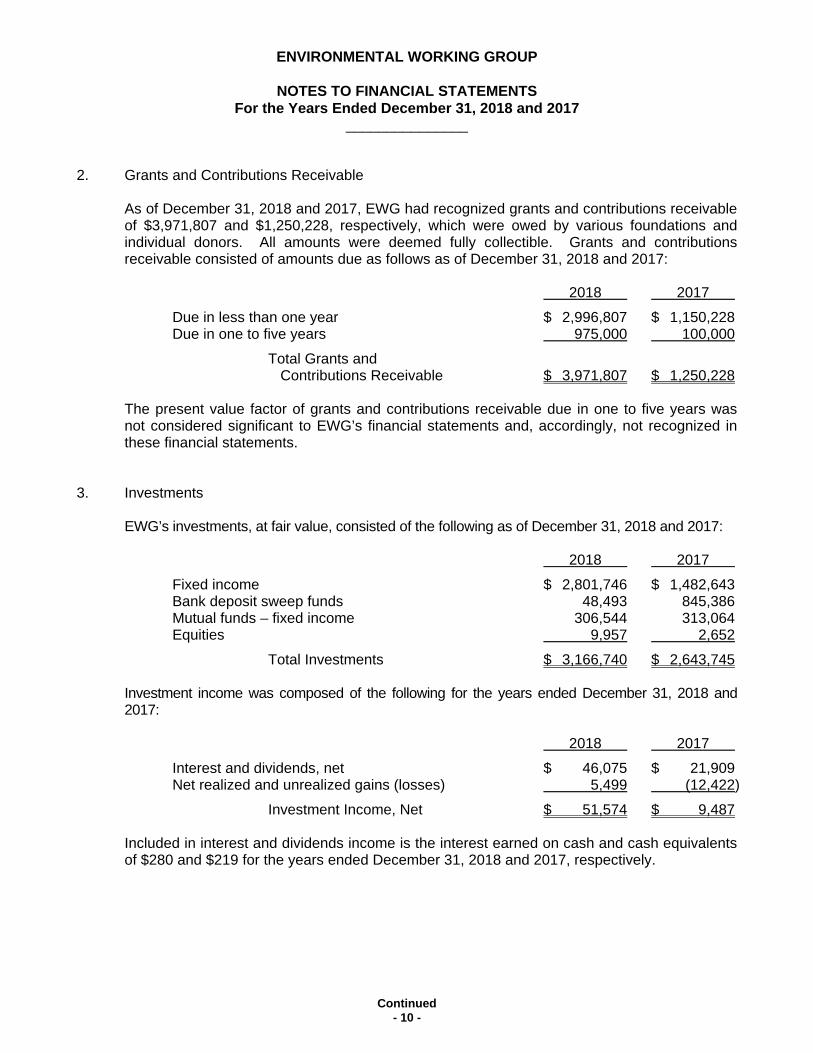
2. Grants and Contributions Receivable As of December 31, 2018 and 2017, EWG had recognized grants and contributions receivable of $3,971,807 and $1,250,228, respectively, which were owed by various foundations and individual donors. All amounts were deemed fully collectible. Grants and contributions receivable consisted of amounts due as follows as of December 31, 2018 and 2017:
2018 2017 Due in less than one year $ 2,996,807 $ 1,150,228 Due in one to five years 975,000 100,000
Total Grants and Contributions Receivable $ 3,971,807 $ 1,250,228
The present value factor of grants and contributions receivable due in one to five years was not considered significant to EWG’s financial statements and, accordingly, not recognized in these financial statements.
3. Investments EWG’s investments, at fair value, consisted of the following as of December 31, 2018 and 2017:
2018 2017 Fixed income $ 2,801,746 $ 1,482,643 Bank deposit sweep funds 48,493 845,386 Mutual funds – fixed income 306,544 313,064 Equities 9,957 2,652
Total Investments $ 3,166,740 $ 2,643,745 Investment income was composed of the following for the years ended December 31, 2018 and 2017:
2018 2017 Interest and dividends, net $ 46,075 $ 21,909 Net realized and unrealized gains (losses) 5,499 (12,422)
Investment Income, Net $ 51,574 $ 9,487 Included in interest and dividends income is the interest earned on cash and cash equivalents of $280 and $219 for the years ended December 31, 2018 and 2017, respectively.

ENVIRONMENTAL WORKING GROUP
NOTES TO FINANCIAL STATEMENTS For the Years Ended December 31, 2018 and 2017
_______________
Continued - 11 -
3. Investments (continued) The following table summarizes EWG’s investments measured at fair value on a recurring basis as of December 31, 2018:
Quoted Prices in Active Markets for Significant Identical Other Significant Assets/ Observable Unobservable Liabilities Inputs Inputs Fair Value (Level 1) (Level 2) (Level 3)
Investments measured at fair value: Fixed income: Certificates of deposit $ 1,411,778 $ - $ 1,411,778 $ - Government bonds 892,508 - 892,508 - Corporate bonds 497,460 - 497,460 - Mutual funds – fixed income: Ultrashort bonds 306,544 306,544 - - Equities: Large value 9,957 9,957 - -
Total Investments Measured at Fair Value 3,118,247 $ 316,501 $ 2,801,746 $ -
Bank deposit sweep funds(a) 48,493 Total Investments $ 3,166,740
(a) Not valued using the fair value measurement hierarchy.

ENVIRONMENTAL WORKING GROUP
NOTES TO FINANCIAL STATEMENTS For the Years Ended December 31, 2018 and 2017
_______________
Continued - 12 -
3. Investments (continued) The following table summarizes EWG’s investments measured at fair value on a recurring basis as of December 31, 2017:
Quoted Prices in Active Markets for Significant Identical Other Significant Assets/ Observable Unobservable Liabilities Inputs Inputs Fair Value (Level 1) (Level 2) (Level 3)
Investments measured at fair value: Fixed income: Certificates of deposit $ 532,800 $ - $ 532,800 $ - Government bonds 498,107 - 498,107 - Corporate bonds 326,445 - 326,445 - Municipal bonds 125,291 - 125,291 - Mutual funds – fixed income: Ultrashort bonds 313,064 313,064 - - Equities: Large value 2,652 2,652 - -
Total Investments Measured at Fair Value 1,798,359 $ 315,716 $ 1,482,643 $ -
Bank deposit sweep funds(a) 845,386 Total Investments $ 2,643,745
(a) Not valued using the fair value measurement hierarchy. EWG used the following methods and significant assumptions to estimate fair value for assets recorded at fair value as of December 31, 2018 and 2017:
Fixed income (certificates of deposit and municipal, government and corporate bonds) – Valued by discounting the related cash flows based on current yields of similar instruments with comparable durations, considering the creditworthiness of the issuer. Mutual funds – fixed income – Value derived from the net asset value of shares held at year-end and based on quoted market prices in active markets. Equities – Valued at the closing price reported in the active market in which the individual stocks are traded.

ENVIRONMENTAL WORKING GROUP
NOTES TO FINANCIAL STATEMENTS For the Years Ended December 31, 2018 and 2017
_______________
Continued - 13 -
4. Property and Equipment EWG held the following fixed assets as of December 31, 2018 and 2017:
2018 2017 Computer equipment $ 523,205 $ 484,914 Computer software 333,046 333,046 Leasehold improvements 272,529 268,904 Website development costs 199,134 199,134 Furniture and equipment 219,984 185,231
Total Property and Equipment 1,547,898 1,471,229 Less: Accumulated Depreciation and Amortization (1,376,533) (1,267,860) Property and Equipment, Net $ 171,365 $ 203,369
For the years ended December 31, 2018 and 2017, depreciation and amortization expense was $111,888 and $172,697, and it is included in occupancy in the accompanying statement of functional expenses.
5. Commitments and Risks Office Space On January 30, 2009, EWG entered into a noncancelable operating lease for office space, in Washington, D.C., which commenced on August 1, 2009, and was scheduled to end on July 31, 2016. Under the terms of the office space lease, the base rent was $21,842 per month and provided for 3% annual increases. On July 7, 2011, EWG entered into another office space lease agreement with the same landlord to lease additional office space. The additional office space lease commenced on September 1, 2011, and expired simultaneously with the original lease on July 31, 2016. The base rent under this new office space lease was $5,072 per month and provided for 3% annual increases. On March 12, 2015, the lease term of the existing lease agreement was amended to exercise EWG’s option to extend the leases for an additional five years year beginning on August 1, 2016, and expiring on July 31, 2021. The base rent under the amended lease is $39,753. The old office space lease also provided EWG with improvement allowances totaling $85,000 for construction, alteration and improvements, which have all been used. EWG also leases office space in California, Iowa and Minnesota. In July 2016, EWG entered into a new noncancelable six-year operating lease with an expiration date of September 30, 2022, for office space located in California. The lease commenced on October 6, 2016, requiring a base rent of $16,085 per month and a security deposit of $32,178. The lease provisions also provide for 3% annual increases, as well as a three-month rent abatement upon commencement of the lease term and allows for a reduction of the required deposit amount by approximately one-half after the third lease year, which would be $16,085.

ENVIRONMENTAL WORKING GROUP
NOTES TO FINANCIAL STATEMENTS For the Years Ended December 31, 2018 and 2017
_______________
Continued - 14 -
5. Commitments and Risks (continued) Office Space (continued) Additionally, EWG renewed its lease for the office space in Iowa, extending the lease through August 2017. The new base rent is $2,050 per month. Starting September 1, 2017, EWG continued the Iowa lease on a month-to-month basis at $2,150 per month. In May 2018, EWG entered into a noncancelable lease for office space in the Minneapolis, Minnesota, which commenced July 16, 2018, and is scheduled to expire on October 31, 2023. Under the terms of the agreement, EWG was required to provide a security deposit of $4,564, which is equivalent to the sum of the monthly base rent and EWG’s share of monthly operating costs and provides for 3% annual increases in rent. The lease also provided a three month abatement of rent and an improvement allowance up to $64,890. As of December 31, 2018, all of the improvement allowance had been used. In February 2017, EWG entered into a three-year noncancelable operating sublease with an organization for one suite in the office space located in Washington, D.C. The sublease is set to expire in January 2020 and includes a parking space as well as yearly rental increases. Under GAAP, lease incentives and scheduled rent increases over a lease term are recognized on a straight-line basis over the term of the lease. The difference between the GAAP rent expense and the required lease payments is reflected as deferred rent in the accompanying statements of financial position. The total rent expense for all of the leases discussed above was $804,810 and $820,340 for the years ended December 31, 2018 and 2017, respectively, and is included in occupancy in the accompanying statement of functional expenses. Total rental income from sublease income was $75,248 and 66,864 for years ended December 31, 2018 and 2017, respectively, and is included in the rental income in the accompanying statements of activities. As of December 31, 2018, the future minimum lease payments required under the noncancelable operating leases were as follows:
For the Year Ending Lease Sublease December 31, Payments Income Net
2019 $ 774,859 $ (77,889) $ 696,970 2020 797,511 (6,660) 790,851 2021 590,379 - 590,379 2022 227,216 - 227,216 2023 50,254 - 50,254
Total $ 2,440,219 $ (84,549) $ 2,355,670 Concentration of Credit Risk EWG maintains its cash and cash equivalents with certain commercial financial institutions, which aggregate balance, at times, may exceed the Federal Deposit Insurance Corporation (FDIC) insured limit of $250,000 per depositor per institution. As of December 31, 2018 and

ENVIRONMENTAL WORKING GROUP
NOTES TO FINANCIAL STATEMENTS For the Years Ended December 31, 2018 and 2017
_______________
Continued - 15 -
5. Commitments and Risks (continued) Concentration of Credit Risk (continued) 2017, EWG had demand deposits and certificates of deposit which exceeded the maximum limit insured by the FDIC by approximately $1,129,000 and $3,156,000, respectively. EWG monitors the creditworthiness of these institutions and has not experienced any credit losses on its cash and cash equivalents. EWG also invests in various investment securities that are exposed to various risks, including market, interest rate and credit risks. Due to the level of risk associated with certain investment securities, it is at least reasonably possible that changes in the values of the investment securities will occur in the near term and that such changes could materially affect the amounts reported in the financial statements. License Agreement On October 29, 2014, EWG and Health Child Health World (HCHW) entered into an asset transfer and licensing agreement, whereby the respective Boards of Directors of EWG and HCHW considered it advantageous and in the best interest of the individual organizations to improve efficiency and effectiveness of their programs by combining their respective assets and operations. Under the agreement, HCHW may request that all rights revert back to HCHW. On October 20, 2017, EWG agreed to terminate its license to use HCHW’s intellectual property granted to EWG pursuant to this agreement. There were no assets and liabilities related to HCHW as of October 20, 2017, that were required to be returned to HCHW. EWG also removed the HCHW fully depreciated property and equipment from the statement of financial position as of October 20, 2017.
6. Net Assets Net Assets Without Donor Restrictions As of December 31, 2018 and 2017, EWG’s net assets without donor restrictions were as follows: 2018 2017
Undesignated – operating $ 3,992,036 $ 3,176,378 Board-designated – reserve fund 2,660,854 2,142,745
Total Net Assets Without Donor Restrictions $ 6,652,890 $ 5,319,123
EWG has set a target of the Board-designated reserve fund to be equivalent to three months of operating expenses. Approval of the Board of Directors is required before EWG can access the reserve.

ENVIRONMENTAL WORKING GROUP
NOTES TO FINANCIAL STATEMENTS For the Years Ended December 31, 2018 and 2017
_______________
Continued - 16 -
6. Net Assets (continued) Net Assets With Donor Restrictions As of December 31, 2018 and 2017, net assets with donor restrictions were restricted follows: Subject to expenditure for specified purpose: 2018 2017
Water and agriculture $ 528,481 $ 857,946 Toxics and human health 2,261,804 599,328 Conservation database - 82,973 Licensing 595,694 -
Total Subject to Expenditure of Specified Purpose 3,385,979 1,540,247
Subject to the passage of time: General operations for 2019 1,000,000 -
Total Subject to Expenditure for Passage of Time 1,000,000 -
Total Net Assets With Donor Restrictions $ 4,385,979 $ 1,540,247
7. Line of Credit EWG has a $100,000 unsecured revolving line of credit that automatically renews each year. Amounts drawn on the line of credit accrue interest at the prime rate published in The Wall Street Journal plus 3.5%, and are payable on demand over a period of 48 months. The prime rate was 5.5% and 4.5% as of December 31, 2018 and 2017, respectively. During the years ended December 31, 2018 and 2017, no money was borrowed or repaid, and, as a result, there was no interest paid during the years ended December 31, 2018 and 2017. As of December 31, 2018 and 2017, EWG had no outstanding balance under this line of credit.
8. Availability and Liquidity As part of liquidity management, EWG has a policy to structure its financial assets to be available as its general expenses, liabilities and other obligations come due. In addition, EWG invests cash in excess of monthly requirements in a combination of sweep and short-term investments. Additionally, EWG maintains a board-designated reserve fund to allow for any variations in the timing of grant payments and EWG’s required obligations. To manage liquidity, EWG also maintains a line of credit of $100,000 with a bank that is drawn upon as needed during the year to manage cash flow. See Note 7 for further description of this line.

ENVIRONMENTAL WORKING GROUP
NOTES TO FINANCIAL STATEMENTS For the Years Ended December 31, 2018 and 2017
_______________
Continued - 17 -
8. Availability and Liquidity (continued) The following table reflects EWG’s financial assets as of December 31, 2018, reduced by amounts not available for general expenditures within one year.
Financial assets: Cash and cash equivalents $ 4,132,014 Grants and contribution receivable 3,971,807 Investments 3,166,740 Due from related entities 24,782
Financial Assets at Year-End 11,295,343 Less those unavailable for general expenditure within one year due to:
Donor-imposed restrictions: Grants and contribution receivable collectible beyond one year (975,000)
Internal designations: Board-designated reserve fund (2,660,854)
Financial Assets Available to Meet Cash Needs for General Expenditures within One Year $ 7,659,489
For purposes of analyzing resources available to meet general expenditures over a 12-month period, EWG considers contributions restricted for programs which are ongoing, major, and central to its annual operations to be available to meet cash needs for general expenditures. For the year ended December 31, 2018, restricted contributions of $3,410,979 were included in financial assets available to meet cash needs for general expenditures within one year.
9. Retirement Plan EWG maintains a defined-contribution retirement plan under Section 403(b) of the Internal Revenue Code (the IRC). Employees are eligible to participate in the plan and may elect to make contributions pursuant to a salary reduction beginning the month following employment. Under the terms of the plan, EWG may make a discretionary matching contribution to the plan, and employees are immediately vested in employer contributions. For the years ended December 31, 2018 and 2017, EWG made $255,194 and $217,409, respectively, in employer contributions.
10. Related-Party Transactions EWG is affiliated through common management with the EWG Action Fund (EWGAF). EWG is affiliated with Food Policy Action (FPA) and Organic Voices (OV) through board of directors membership of the President of EWG. EWGAF, FPA and OV are nonprofit, tax-exempt organizations under IRC Section 501(c)(4). EWGAF was established to promote civic responsibility and effective advocacy for the protection of the environment, FPA was established to advocate for policies on food and farming, and OV was formed to educate and empower consumers regarding the benefits of organic food.

ENVIRONMENTAL WORKING GROUP
NOTES TO FINANCIAL STATEMENTS For the Years Ended December 31, 2018 and 2017
_______________
Continued - 18 -
10. Related-Party Transactions (continued) In order for the organizations to minimize duplicative expenses and carry out their purposes in the most economical fashion, EWG provides certain management, accounting and administrative services to EWGAF, FPA and OV for a monthly fee based upon direct costs incurred and allocable staff and related costs. The table below summarizes by entity the amounts billed by, paid to and owed to EWG as of December 31, 2018 and 2017:
Amount Billed Amount Paid Balance Owed 2018 2017 2018 2017 2018 2017
EWGAF $ 171,882 $ 135,690 $ 215,500 $ 117,894 $ 4,824 $ 48,442 FPA 105,550 10,022 88,807 8,562 19,247 2,504 OV 711 5,121 1,117 5,321 711 1,117* $ 278,143 $ 150,833 $ 305,424 $ 131,777 $ 24,782 $ 52,063 * During the years ended December 31, 2018 and 2017, OV provided grants of $42,500
and $240,000, respectively, to EWG to fund its food policy work, which is reported in grants and contributions revenue in the accompanying statements of activities, of which $42,500 and $240,000, respectively, was paid during the year, including payments on awards from the prior year. As of December 31, 2018, there was no outstanding grant balance included in due from related entities in the accompanying statements of financial position.
11. Income Taxes EWG is exempt from federal and state income taxes on income other than net unrelated business income under Section 501(c)(3) of the IRC. As of December 31, 2018 and 2017, no tax provision was made, as EWG had no significant net unrelated business income. EWG follows the authoritative guidance relating to accounting for uncertainty in income taxes included in FASB ASC Topic 740, Income Taxes. These provisions provide consistent guidance for the accounting for uncertainty in income taxes recognized in an entity’s financial statements and prescribe a threshold of “more likely than not” for recognition and derecognition of tax positions taken or expected to be taken in a tax return. EWG performed an evaluation of uncertainty in income taxes for the years ended December 31, 2018 and 2017, and determined that there were no matters that would require recognition in the financial statements or that may have any effect on its tax-exempt status. As of December 31, 2018, the statute of limitations for tax years ended December 31, 2015, through December 31, 2017, remained open with the U.S. federal jurisdiction or the various states and local jurisdictions in which EWG files tax returns; however, there are no examinations in progress. It is EWG’s policy to recognize interest and/or penalties related to uncertainty in income taxes, if any, in income tax or interest expense. As of December 31, 2018 and 2017, EWG had no accrual for interest and/or penalties.

ENVIRONMENTAL WORKING GROUP
NOTES TO FINANCIAL STATEMENTS For the Years Ended December 31, 2018 and 2017
_______________
- 19 -
12. Reclassification Certain 2017 amounts have been reclassified to conform to the 2018 financial statement presentation.
13. Subsequent Events In preparing these financial statements, EWG has evaluated events and transactions for potential recognition or disclosure through August 14, 2019, the date the financial statements were available to be issued. There were no subsequent events identified that require recognition or disclosure in the financial statements.