environmentally responsible energy pricing
TRANSCRIPT

7/28/2019 ENVIRONMENTALLY RESPONSIBLE ENERGY PRICING
http://slidepdf.com/reader/full/environmentally-responsible-energy-pricing 1/138
ENVIRONMENTALLY RESPONSIBLE ENERGY PRICING
Professor W. Kip ViscusiPrincipal Investigator and Project Manager
Professor Wesley A. MagatCo-Principal Investigator, 1990-1991
Mark Dreyfus and Professor William GentrySenior Research Economists
Dr. Alan CarlinContract Officer
Fourth Draft: November 16, 1992
Interim Draft Report on Efficient Energy Pricing, Project onEconomics Research for Long-Term Environmental Risks and PollutionPrevention, Cooperative Agreement with Duke University CA-814388-
02. This is a preliminary draft analysis that is being circulated forcomments from EPA and is intended primarily to elicit substantiveinput regarding the study. It is not to be reproduced or distributedoutside of the agency without the written permission of the authors.
Please direct all correspondence to: Professor W. Kip Viscusi,
Department of Economics, Duke University, Durham, NC 27706,phone 919-660-1833, fax 919-684-8974.
7/28/2019 ENVIRONMENTALLY RESPONSIBLE ENERGY PRICING
http://slidepdf.com/reader/full/environmentally-responsible-energy-pricing 2/138
TABLE OF CONTENTS
EXECUTIVE SUMMARY . . . . . . . . . . . . . . . . . . . . . . . . . . . . . . . . . . i
A READER’S GUIDE . . . . . . . . . . . . . . . . . . . . . . . . . . . . . . . . . . . . . iv
PART I:
1.1
1.2
OVERVIEW: THE FULL SOCIAL COST ENERGY PRICINGAPPROACH . . . . . . . . . . . . . . . . . . . . . . . . . . . . . . . . . . . . . . . . . vi
BASELINE ESTIMATES . . . . . . . . . . . . . . . . . . . . . . . . . . . . . . . . 3
ENVIRONMENTAL EXTERNALITY BENEFITS . . . . . . . . . . . . . 5
PART II:THE FULL SOCIAL COST ENERGY PRICING APPROACH TOGREENHOUSE WARMING POLICY. . . . . . . . . . . . . . . . . . . . . 7
2.1. INTRODUCTION . . . . . . . . . . . . . . . . . . . . . . . . . . . . . 82.2. ECONOMIC FOUNDATIONS . . . . . . . . . . . . . . . . . . . . 92.3. ENERGY SOURCES AND POLLUTANTS . . . . . . . . . 112.4. EXTERNALITIES AND NET TAXES . . . . . . . . . . . . . 13
2.5. THE RANGE OF UNCERTAINTY . . . . . . . . . . . . . . . 152.6. CONCLUSION . . . . . . . . . . . . . . . . . . . . . . . . . . . . . . . 16
PREFACE TO THE APPENDICES TO PART II . . . . . . . . . . . . . . . . 21
APPENDIX 2.1SUMMARY OF BENEFITS DATA.... . . . . . . . . . . . . . . . . . . 22
1. INTRODUCTION AND SOURCE MATERIAL . . . . . . . 232. SOURCES OF UNCERTAINTY . . . . . . . . . . . . . . . . . . 25
3. UNIT BENEFIT CALCULATIONS . . . . . . . . . . . . . . . . 27Lead in Gasoline 28Particulate 29Sulfur Oxides (excluding SO4 mortality] 32SO4 Mortality 33Ozone 33
4. UNIT BENEFITS OF EMISSIONS REDUCTIONS TO

7/28/2019 ENVIRONMENTALLY RESPONSIBLE ENERGY PRICING
http://slidepdf.com/reader/full/environmentally-responsible-energy-pricing 3/138
ZERO . . . . . . . . . . . . . . . . . . . . . . . . . . . . . . . . . . . . . 35Visibility (related to acid deposition) 35Air Toxics from Motor Vehicles 36Lead in Gasoline 36
Particulate, Sulfur Oxides, and Ozone 375. PROJECTRED BENEFITS OF SELECTED CLEAN AIR
ACT AMENDMENTS EMISSIONS REDUCTIONSTARGETS . . . . . . . . . . . . . . . . . . . . . . . . . . . . . . . . . 38
6. SUMMARY OF ENERGY-RELATED TAX DATAAND TAX ALLOCATIONS . . . . . . . . . . . . . . . . . . . . 39Federal Excises 39Other Federal Taxes 39State Excises 40
Local Excises 40Severance Taxes 40Utility Taxes 41
7. CALCULATION OF RELATIVE CARBON TAXES . . . 418. SUMMARY OF COLLECTED INFORMATION . . . . . . 42
APPENDIX 2.2 . . . . . . . . . . . . . . . . . . . . . . . . . . . . . . . . . . . . . . . . . . 43SUMMARY OF DRAFT NEW YORK STATE ENERGY
PLAN: 1991 . . . . . . . . . . . . . . . . . . . . . . . . . . . . . . . . 44
Contrast with Estimates from Viscusi-Magat 45
PART III:OPTIONS FOR AND DISCUSSION OF IMPLEMENTING FULLSOCIAL COST ENERGY PRICING . . . . . . . . . . . . . . . . . . . . . 47
3.1 TAXATION OPTIONS . . . . . . . . . . . . . . . . . . . . . . . . . 483.2 CRITERIA FOR EVALUATING TAX
APPROACHES . . . . . . . . . . . . . . . . . . . . . . . . . . . . . . 493.3 OBJECTIVE OF FULL SOCIAL COST PRICING . 50
3.4 LIMITATIONS ON THE OBJECTIVE OF OPTIMALTAXES . . . . . . . . . . . . . . . . . . . . . . . . . . . . . . . . . . . . 503.5 BROAD-BASED IMPLEMENTATION OPTIONS . . . . 52
Consumption Tax 52
Production/Import Tax 52
Carbon Tax 53
Emissions Fees 53

7/28/2019 ENVIRONMENTALLY RESPONSIBLE ENERGY PRICING
http://slidepdf.com/reader/full/environmentally-responsible-energy-pricing 4/138
Targeted Taxes 54Gasoline and Diesel Fuel Tax 54Coal Output Tax 55Electricity Tax 55
Combinations of Targeted Taxes 56
APPENDIX 3.1 . . . . . . . . . . . . . . . . . . . . . . . . . . . . . . . . . . . . . . . . . . 57
PART IV:RESIDENTIAL ENERGY DEMAND AND THE TAXATION OFHOUSING . . . . . . . . . . . . . . . . . . . . . . . . . . . . . . . . . . . . . . . . . 58
4.1 THE TAX SYSTEM AS A SUBSIDY TO HOUSING . . 60Tax Incentives for Owner-Occupied Housing 60
Tax Incentives for Rental Property 64General Equilibrium Effects 67Total Tax Subsidy on Housing 68
4.2 THE COMPOSITION OF RESIDENTIAL ENERGYUSE . . . . . . . . . . . . . . . . . . . . . . . . . . . . . . . . . . . . . . 69
4.3 JOINT DEMAND FOR HOUSING ANDRESIDENTIAL ENERGY . . . . . . . . . . . . . . . . . . . . . 71
4.5 CONCLUSION . . . . . . . . . . . . . . . . . . . . . . . . . . . . . . . 75
REFERENCES . . . . . . . . . . . . . . . . . . . . . . . . . . . . . . . . . . . . . . . . . . 85

7/28/2019 ENVIRONMENTALLY RESPONSIBLE ENERGY PRICING
http://slidepdf.com/reader/full/environmentally-responsible-energy-pricing 5/138
LIST OF TABLES and FIGURES
Table 1.1
Table 2.1
Table 2.2
Table 2.3
Figure 2.1
Table A2.1.1
Table A2.1.2
Table A2.1.3
Table A2.1.4
Table A2.1.5
Table A2.1.6
Table A2.1.7
Table A2.1.8
Table A2.1.9
Table A2.1.10
Damage Computation in Hall Study
Unit Value of Benefits of Emission Reduction to Zero FollowingCompliance with Current Standards
Summary of Energy Externalities and Taxes Assuming Compliancewith Existing Environmental Regulations
Total Tax Revenue for Each Fuel Type
Taxes and Air Pollution Externalities as a Percent of Fuel Price
Total Benefits Drawn From Source Documents and Net BenefitsUsed in Unit Benefit Calculations
Annual Benefit of Compliance with Existing Regulations
Benefits of Compliance with Current Regulations Summarized inBTU-Equivalents
Unit Value of Benefits of Compliance with Existing Standards
Fuel Consumption and Price Data Used in Unit BenefitCalculations
Unit Value of Benefits of Compliance with Existing Standards-Modified Upper Bound
Unit Value of Benefits of Emission Reduction to Zero FollowingCompliance with Current Standards Base Case, Assuming 25%Emission Reduction
Unit Value of Benefits of Emission Recution to Zero FollowingCompliance with Current Standards Base Case, Assuming 10%Emission Reduction
Unit Value of Benefits of Emission Reduction to Zero FollowingCompliance with Current Standards Modified Upper Bound,Assuming 25% Emission Reduction
Unit Value of Benefits of Emission Reduction to Zero FollowingCompliance with Current Standards Modified Upper Bound,Assuming 10% Emission Reduction

7/28/2019 ENVIRONMENTALLY RESPONSIBLE ENERGY PRICING
http://slidepdf.com/reader/full/environmentally-responsible-energy-pricing 6/138
Table A2.1.11
Table A2.1.12
Table A2.1.13
Table A2.1.14
Table A2.1.15
Table A2.1.16
Table A2.1.17
Table A2.1.18
Table A3.1.1
Table A3.1.2
Table 4.1
Table 4.2
Table 4.3
Table 4.4
Table 4.5
Table 4.6
Table 4.7
Unit Benefit Value of Selected Clean Air Act AmendmentsEmissions Targets
Taxes Per Unit of Fuel Consumption
Taxes Per Unit of Fuel Consumption Net of Taxes Earmarked forSpecific Programs
Relative Carbon Taxes, Assuming 25% Emission Reduction
Gross Value of Benefits by Fuel-Assuming 25% Emission Reduction
Gross Value of Benefits by Fuel-Assuming 10% Emission Reduction
Summary of Energy Externalities and Taxes-Assuming 25%Emission Reduction
Summary of Energy Externalities and Taxes-Assuming 10%Emission Reduction
Alternative Tax Structures
Emissions Fee
User Cost of Homeownership Under Various Tax Policies
Weighted Tax Subsidy for Owner-occupied Housing
Total Tax Subsidy to Housing Relative to Corporate Assets
Composition of Residential Energy Use, By Region and Size of Unit,1987
Miscellaneous Electricity Use, By Appliance, 1987
The Effects of Increasing the Price of Housing Capital
The Effects of Alternative Policies on Residential Energy Demand
7/28/2019 ENVIRONMENTALLY RESPONSIBLE ENERGY PRICING
http://slidepdf.com/reader/full/environmentally-responsible-energy-pricing 7/138
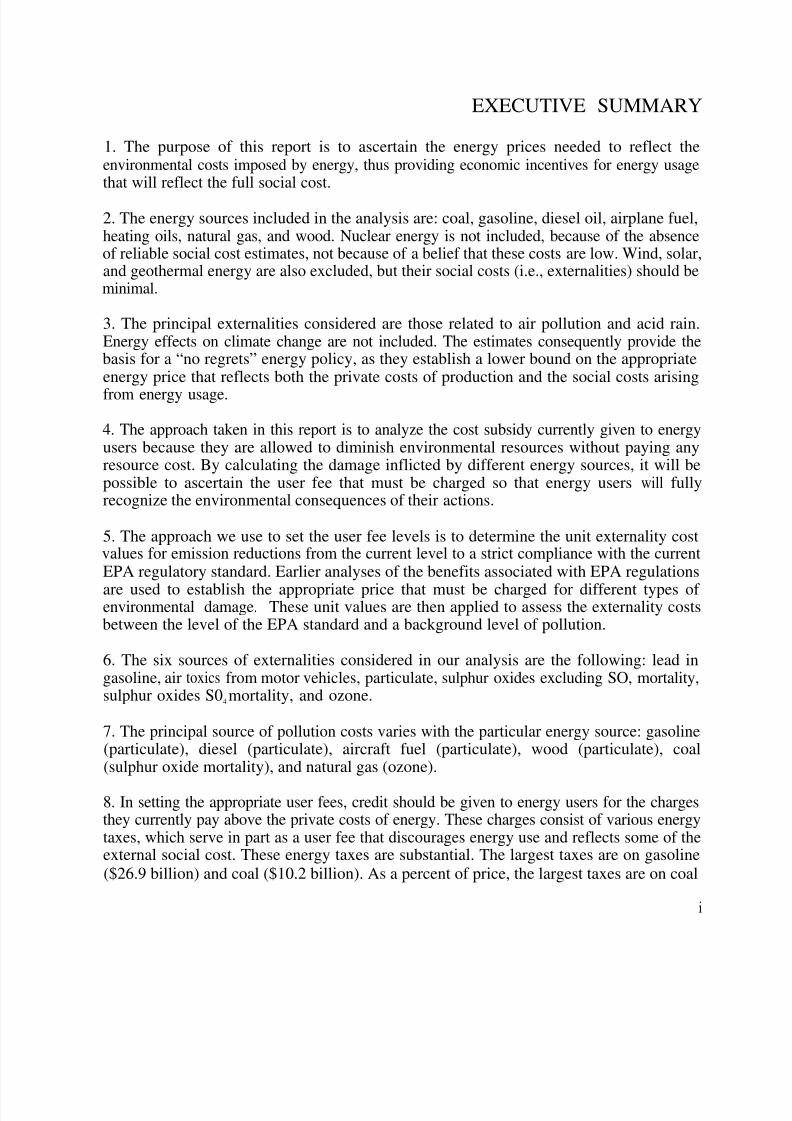
EXECUTIVE SUMMARY
1. The purpose of this report is to ascertain the energy prices needed to reflect theenvironmental costs imposed by energy, thus providing economic incentives for energy usagethat will reflect the full social cost.
2. The energy sources included in the analysis are: coal, gasoline, diesel oil, airplane fuel,heating oils, natural gas, and wood. Nuclear energy is not included, because of the absenceof reliable social cost estimates, not because of a belief that these costs are low. Wind, solar,and geothermal energy are also excluded, but their social costs (i.e., externalities) should beminimal.
3. The principal externalities considered are those related to air pollution and acid rain.Energy effects on climate change are not included. The estimates consequently provide thebasis for a “no regrets” energy policy, as they establish a lower bound on the appropriateenergy price that reflects both the private costs of production and the social costs arising
from energy usage.
4. The approach taken in this report is to analyze the cost subsidy currently given to energyusers because they are allowed to diminish environmental resources without paying anyresource cost. By calculating the damage inflicted by different energy sources, it will bepossible to ascertain the user fee that must be charged so that energy users will fullyrecognize the environmental consequences of their actions.
5. The approach we use to set the user fee levels is to determine the unit externality costvalues for emission reductions from the current level to a strict compliance with the currentEPA regulatory standard. Earlier analyses of the benefits associated with EPA regulations
are used to establish the appropriate price that must be charged for different types of environmental damage. These unit values are then applied to assess the externality costsbetween the level of the EPA standard and a background level of pollution.
6. The six sources of externalities considered in our analysis are the following: lead ingasoline, air toxics from motor vehicles, particulate, sulphur oxides excluding SO, mortality,sulphur oxides S04 mortality, and ozone.
7. The principal source of pollution costs varies with the particular energy source: gasoline(particulate), diesel (particulate), aircraft fuel (particulate), wood (particulate), coal(sulphur oxide mortality), and natural gas (ozone).
8. In setting the appropriate user fees, credit should be given to energy users for the chargesthey currently pay above the private costs of energy. These charges consist of various energytaxes, which serve in part as a user fee that discourages energy use and reflects some of theexternal social cost. These energy taxes are substantial. The largest taxes are on gasoline($26.9 billion) and coal ($10.2 billion). As a percent of price, the largest taxes are on coal
i

7/28/2019 ENVIRONMENTALLY RESPONSIBLE ENERGY PRICING
http://slidepdf.com/reader/full/environmentally-responsible-energy-pricing 8/138
Environmentally Responsible Ene rgy Pricing
(38 percent), diesel fuel (27 percent), and gasoline (25 percent). Many of these taxes arereturned as subsidies (e.g., the highway trust fund). After netting out these subsidiesreturned to users of the energy source, the highest net taxes are on gasoline ($18 billion) and
coal ($10 billion). As a percent of price, the largest net taxes are on coal (36 percent) andgasoline/diesel fuel/aircraft fuel/fuel oil (13-17 percent).
9. The report develops energy user fees under a variety of assumptions. The estimatespresented below are the midpoint assessments for two variants --25 percent reduction inemissions due to current regulations and 10 percent reduction in emissions. These twoscenarios reflect the influence of the extent of the emissions reduction that will be achievedby existing regulations. The greater the gains that will result from regulation, the smallerare the environmental costs that will be generated by the remaining pollution levels. Asummary of the results appears below:
Fuel Type
Gasoline
Diesel fuel
Aircraft fuel
Heating Oil
Natural GasWood
Coal
Units Current Net Externality$Taxes as a Cost as aPercent of Percent of Price Price
gallon 16.6% 16.7%
1000 cubic feet 6.4 1.1
short tons 0.0 152.4
short tons 35.9 528.0
Coal and wood are the greatest outliers in terms of the disparity between the current taxlevel and the user fee that should be imposed to capture the full social costs.
10. Figure 2.1 summarizes many of the key findings of the report with respect to currenttax levels and the range of estimates of the externality damages.
11. A carbon tax is not ideally suited to addressing these externalities since the pollutiondamages are correlated in different ways with carbon content. The full social cost pricescould, however, augment a carbon tax but the levels of these charges should vary by fueltype. Specific estimates of these amounts are provided.
ii

7/28/2019 ENVIRONMENTALLY RESPONSIBLE ENERGY PRICING
http://slidepdf.com/reader/full/environmentally-responsible-energy-pricing 9/138
Executive Summary
12. The demand for residential energy and its associated pollution also maybe inefficientbecause of housing tax subsidies.
13. The tax subsidy for housing capital has two effects on residential energy demand. First,by lowering the price of housing services, the tax subsidy increases the demand for housingservices and the associated energy. House size is strongly related to energy demanded forspace heating and cooling. Second, the subsidy for housing capital creates an incentive tosubstitute capital for energy in the production of housing services. This substitution effectencourages the purchase of energy-efficient capital (e.g., insulation).
13. Eliminating the tax subsidy for housing would increase the cost of housing capital by 23percent, lower the demand for housing services by 11.8 percent, and residential energydemand by 6.8 percent. Alternatively, a 20 percent tax on residential energy would resultin the same reduction in residential energy demand. Only eliminating the personal tax
advantages of owner-occupied and rental housing would reduce residential energy demandby 3.2 percent. Only eliminating the deductibility of mortgage interest and property taxesfor owner-occupiers would decrease residential energy demand by 2.1 percent.
14. These possible reductions in residential energy demand should be weighed against theincreases in energy demand associated with the increased consumption of and productionof other goods which would occur because of the switch from housing to other goods. Sincehousing is not a particularly energy-intensive good, these increases in energy associated withother goods might result in total energy demand not changing.
iii

7/28/2019 ENVIRONMENTALLY RESPONSIBLE ENERGY PRICING
http://slidepdf.com/reader/full/environmentally-responsible-energy-pricing 10/138
Environmentally Responsible Energy Pricing
A READER’S GUIDE
The purpose of this report is to assess various aspects of the pricing of energy, with
the ultimate objective being to determine how energy can be priced to promote its efficientutilization in the presence of the environmental externalities generated by energy. Theenvironmental damages considered will be limited in scope. In particular, we will focus onconventional externalities associated with traditional forms of pollution regulated by EPAas opposed to the more controversial externalities linked to global warming.
Part I of the report provides an introduction to the full social cost energy pricingissue. Why is it that energy prices may not correspond to their efficient level, and what arethe broad classes of external damages that must be taken into account?
Part II of the report represents the key component of the analysis. In it we outline
the taxes paid by different sources of energy and compare these taxes to the appropriate taxamount that should be levied to take into account the external damages associated with eachparticular form of energy use. Concerns such as this are not entirely new. They have beenraised by academics, by government organizations such as the National Academy of Sciences,and even by presidential candidates. What is new is that this report documents theappropriate level of taxes to bring the prices for these energy sources in line with their truecost to society. Perhaps the most surprising aspect of these calculations is that it is necessaryto move beyond the myopic focus on a gasoline tax and consider more broadly-based chargesthat can be imposed on energy to reflect the associated environmental damages.
Appendix 2.1 provides a more detailed discussion of how the full social cost energy
prices were calculated. This more technical assumption is intended to delineate theassumptions involved in the analysis as well as the specific EPA documents on which theseestimates were based.
Appendix 2.2 considers related issues of less prominence, such as the relationship of our results to the Draft New York State Energy Plan.
Part III of the report addresses implementation issues. In particular, what differenttax mechanisms are available to impose full social cost energy prices, and what are thecomparative advantages of using these different tax schemes? Appendix 3.1 provides relatedtax tables.
Part IV of the report represents a departure in terms of the focus in that the marketfailure being addressed is not the external damages caused by energy but rather theimplications of the variety of tax policies for housing that may distort energy usage. Inparticular, if these tax policies lead consumers to use an amount of energy that is more thanefficient, then it may be the case that the government has in place policies that actually
iv

7/28/2019 ENVIRONMENTALLY RESPONSIBLE ENERGY PRICING
http://slidepdf.com/reader/full/environmentally-responsible-energy-pricing 11/138
Executive Summary
encourage energy use beyond its efficient level rather than discourage it. Thus, the task of an appropriate energy pricing scheme is not simply to correct for the damages inflicted byenergy usage, but also to rectify the impact on the environment caused by government
policies that foster energy usage. The housing analysis in Part IV indicates that theseinfluences on energy usage are indeed quite substantial.
v

7/28/2019 ENVIRONMENTALLY RESPONSIBLE ENERGY PRICING
http://slidepdf.com/reader/full/environmentally-responsible-energy-pricing 12/138
PART I:
OVERVIEW THE FULL SOCIAL COST’ ENERGY PRICING APPROACH

7/28/2019 ENVIRONMENTALLY RESPONSIBLE ENERGY PRICING
http://slidepdf.com/reader/full/environmentally-responsible-energy-pricing 13/138
The Ene rgy Usage Objective
Ideally society wants to promote efficient utilization of all resources. The nation’senergy resources are among those for which we would like to establish efficient utilization.This concern is particularly great since energy consumption has been linked to a number of
important environmental costs principally relating to air pollution. Because energy users donot pay for these costs, they are labelled as “externalities” by economists.
In any market context, it is desirable for economic actors to bear the fullconsequences of their actions so that their behavior will incorporate the social effects as wellas the private benefits. In the case of energy usage, the consumers are not paying thesecosts since they are permitted to use an environmental ‘resource without paying any explicitfee.
The economic objective is twofold. First, we want all energy producers to besupplying the appropriate amount of each form of energy given these social costs, and we
want consumers to be consuming the amount of each energy source that reflects a balancingof the benefits to them of the energy and the social costs of their actions. To achieve thisobjective, which economists term an efficient energy usage objective, the incentives forenergy production and utilization must be correct.
Consider, for example, the situation of a representative firm that produces energy.There is some level of energy production that represents the amount of energy that shouldbe produced after recognizing the market value of the energy and all of the costs associatedwith energy production. This energy output level can be achieved in two ways. First, onecould establish an environmental quality standard that ensures that the production or usageof energy resulted in the level of pollution that balances the benefits and costs of pollution
reduction appropriately. Alternatively, one could charge a user fee for energy usage topromote the efficient outcome.’ One can achieve the objective of having the firm generatethe efficient amount of pollution using either a user fee or a standards approach. Theemphasis of the U.S. Environmental Protection Agency and other regulatory agencies hasbeen on the promulgation of regulatory standards.
Standards are also attractive to firms in that they involve lower compliance costs thando pollution fees, if these fees are imposed on all pollution, not just pollution above someregulatory standard. Under a standards regime, a firm must pay for the cost of meeting thestandard, but once the standard has been met the firm does not pay for any of the pollutionthat it generates. Thus, in effect, the firm receives a free right to pollute up to the efficient
level of pollution, and it is not charged for this pollution. In contrast, pollution fees that donot give firms some free pollution rights but will impose costs associated with control devicesas well as additional fees imposed for whatever pollution remains after the control deviceshave been installed.
Although environmental standards promote short-run efficiency in terms of
1

7/28/2019 ENVIRONMENTALLY RESPONSIBLE ENERGY PRICING
http://slidepdf.com/reader/full/environmentally-responsible-energy-pricing 14/138
Environmentally Responsible Energy Pricing
establishing the correct amount of pollution for any given firm in the industry, they do notestablish incentives for long-run efficiency. In particular, the incentives to enter pollutingindustries are too great because firms do not have to pay for the implicit subsidy they receive
by not internalizing the costs of the pollution that they generate. Pollution levels up to thestandard are free to the firm, but impose real societal costs.
The focus of this report will be on establishing user fees that will lead energy usersto incorporate the environmental costs of energy in their energy choices. The approach willbe to determine what the price of energy should be to internalize all the costs and subsidiesinvolved in the energy resource area. This calculation will indicate the appropriate user feelevel that will give both consumers and producers the correct price incentives. However,because of the character of this form of policy the energy user fee will also provide correcteconomic incentives for long-run entry into the industry.
2Thus, the overall purpose of this
study is to establish a policy that economists would term an efficient energy policy.
This objective is obviously quite ambitious and obtaining a definite assessment couldultimately require a major resource commitment by EPA -- far greater than the cost of thecurrent study. Because of resource constraints, the scope of this study will necessarily bemore limited than this and, as a result, the analysis will adopt several simplifications. Wewill highlight the major features of our approach in the first section of the report. Adetailed Appendix describes the methodology in greater detail. It should be emphasized thatthis research remains a work in progress. Additional research is underway to determine howuse of an externality tax approach can be incorporated in a policy context in which commandand control regulations are in place. Moreover, other second-best factors also enter.Housing tax subsidies distort energy usage, as
eventually we hope to address the net effectutilization of energy, recognizing that society’spullution control.
the final part of this report indicates. Thus,
of all market imperfections on the efficientobjective is to achieve the proper amount of
The emphasis will consequently be on only a subset of the adverse externalitiescreated by energy. The most notable exception is the omission of the global warmingexternalities from the analysis. The reason for this omission is not that we believe theseexternalities to be unimportant. Rather, the magnitude and direction of the greenhouseeffect impacts are now being debated in a number of arenas. One of the dividends of ouranalysis is to begin the process of ascertaining how much we can achieve the objectives of those who advocate policies to address the risks of climate change by adopting a user fee
approach that recognizes externalities other than those associated with climate change.
This policy approach has already been widely discussed in the global warmingliterature. Some observers have designated the policy approach we are adopting as the“bootstrap” approach or the “no regrets” approach. As a society, we know we should go atleast this far unless global warming will, on balance, be beneficial. Thus, our analysis is
2
7/28/2019 ENVIRONMENTALLY RESPONSIBLE ENERGY PRICING
http://slidepdf.com/reader/full/environmentally-responsible-energy-pricing 15/138
Environmental Externality Benefits
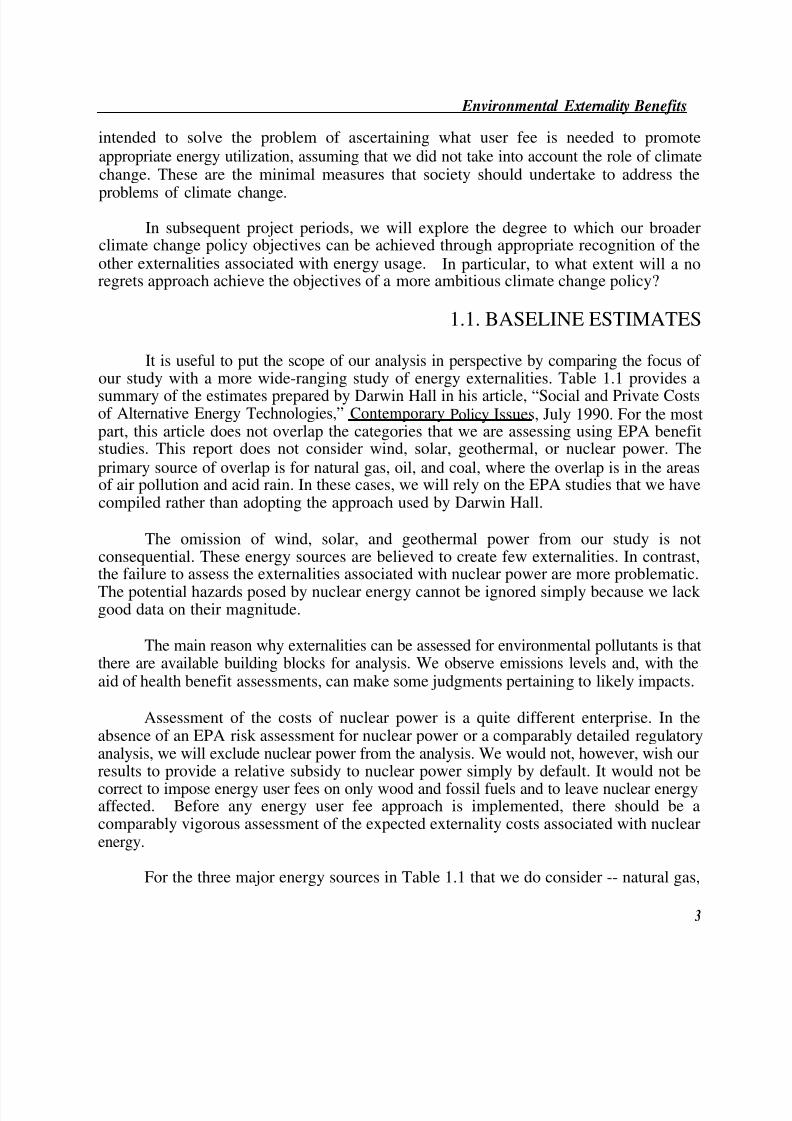
intended to solve the problem of ascertaining what user fee is needed to promoteappropriate energy utilization, assuming that we did not take into account the role of climatechange. These are the minimal measures that society should undertake to address the
problems of climate change.
In subsequent project periods, we will explore the degree to which our broaderclimate change policy objectives can be achieved through appropriate recognition of theother externalities associated with energy usage. In particular, to what extent will a noregrets approach achieve the objectives of a more ambitious climate change policy?
1.1. BASELINE ESTIMATES
It is useful to put the scope of our analysis in perspective by comparing the focus of our study with a more wide-ranging study of energy externalities. Table 1.1 provides a
summary of the estimates prepared by Darwin Hall in his article, “Social and Private Costsof Alternative Energy Technologies,” Contemporary Policy Issues, July 1990. For the mostpart, this article does not overlap the categories that we are assessing using EPA benefitstudies. This report does not consider wind, solar, geothermal, or nuclear power. Theprimary source of overlap is for natural gas, oil, and coal, where the overlap is in the areasof air pollution and acid rain. In these cases, we will rely on the EPA studies that we havecompiled rather than adopting the approach used by Darwin Hall.
The omission of wind, solar, and geothermal power from our study is notconsequential. These energy sources are believed to create few externalities. In contrast,the failure to assess the externalities associated with nuclear power are more problematic.
The potential hazards posed by nuclear energy cannot be ignored simply because we lack good data on their magnitude.
The main reason why externalities can be assessed for environmental pollutants is thatthere are available building blocks for analysis. We observe emissions levels and, with theaid of health benefit assessments, can make some judgments pertaining to likely impacts.
Assessment of the costs of nuclear power is a quite different enterprise. In theabsence of an EPA risk assessment for nuclear power or a comparably detailed regulatoryanalysis, we will exclude nuclear power from the analysis. We would not, however, wish ourresults to provide a relative subsidy to nuclear power simply by default. It would not be
correct to impose energy user fees on only wood and fossil fuels and to leave nuclear energyaffected. Before any energy user fee approach is implemented, there should be acomparably vigorous assessment of the expected externality costs associated with nuclearenergy.
For the three major energy sources in Table 1.1 that we do consider -- natural gas,
3

7/28/2019 ENVIRONMENTALLY RESPONSIBLE ENERGY PRICING
http://slidepdf.com/reader/full/environmentally-responsible-energy-pricing 16/138
Table 1.1
Damage Computation in Hall Study
Cumulative Estimates of External and Total Social Costs or Energy (dollars/unit of energy)
Source ofEnergyService
WaterP o l l u t i on
Solid Waste
A i rPol lut ionand AcidRain
Green House
NationalSecur i ty
NuclearInsuranceSubsidy
ReactorLoss
AdditionalSafety
CumulativeExternalcost(1989 $)
Private Cost(1989 $)
Tota l Soc ia lcost
ConaervationE f f i c i e n c y
0
0
0
0
0
0
0
0.5c-2c/kWh
0.5c-2c/kWh
36c/Gal lon
Wind
0
0
0
Solar Geothermall
0 Minor
0 0
0 Minor
0 0
0 0
0
0
0
0
8c-10c/
kWh
8c-10c/
kWh
0
0
0 0
0 0
0 0
0 Minor
9c-12c/ 5c-11c/
kWh kWh
9c-12c/ 5c-11c/
kWh kWh
Natural Gas
0
0
1988$ IB:$0.286/
MMBTU
1988$ MC:
$0-$2.56/ MMBTU
SubstantialReserves:
Soviet Unionand 1 ran
0
0
0
$0.30-$2.85/ MMBTU
$2.50-$3.00/ MMBTU
$2.80-$5.85/ MMBTU
Oi l
Omitted Omitted
Omitted
1985$ IB:$11.59/
BBL
1988$ MC:
$0-$3.48/ BBL
1985S AC:$5.79/BBL
AB: $4.20-$7.07/BBL
0
0
0
$16.85-$22.14 /
BBL
$15-$18/ BBL
$32 -$40/ BBL
Coal
Comitted
Omitted
1985$ IB:$16.80-
$18.77/TonMC: $7.23-$7.67/Ton
1988$ MC:
$0-$4.50/ MMBTU
0
0
0
0
$13.68-$124.75/
Ton
$35-$45/ Ton
$49-$170/ Ton
Nuclear
Omitted
1988$ AC:0. 07c/kWh
1986$ AC:0.85c/kWh
1985$ AC:0. 49c/kWh
1987$ AB:0. 14c/kWh
1988$ AB:0.16c-
0. 94c/kWh
1 . 9 c - 2 . 7 c /
kWh
14c-16c/
kWh
16c-19c/
kWh
(1989 $) Gasoline
Notes: IB= Incramenta l Benef i t ; AB=Average Benef i t ; AC=Average Coat ; MC=Marg ina l Cost ; BBL=Bar re ls o f Oi l , 42 ga l lons or 6MMBTU; Tons of Coal=2,000 pounds or 24.7 MMMBTU; MMBTU=Mil l ionBr i t ish Thermal Units; tc/kWh=cents per ki l lowatt hour level izedo v e r t h e l i f e o f a t y p i c a l u n i t ; M - T o n = M e t r i c T o n = 2 , 2 0 0 p o u n d s .
Source: See Hall (1990) for further explanation of the calculations.

7/28/2019 ENVIRONMENTALLY RESPONSIBLE ENERGY PRICING
http://slidepdf.com/reader/full/environmentally-responsible-energy-pricing 17/138
Environmentally Responsible Energy Pricing
coal, and oil -- we will focus on the air pollution and acid rain costs. We will abstract fromgreenhouse effect costs and national security costs. Each of these costs is very uncertain.The precise allocation of defense costs is particularly difficult to assess because of the
multiplicity of our defense policy objectives.
It is instructive to consider each row of Table 1.1 in turn. The first effect that DarwinHall considers is that of water pollution. He indicates negligible externalities associated withthe various energy sources so that omission of this component from our analysis will nothave a major effect on the results. The second row of the table pertains to solid wastepollution. With the exception of nuclear energy, this is also not a significant component.
The third row of Table 1.1 deals with air pollution and acid rain. This is theemphasis of our study and also the largest cost component in Hall’s study. The estimatesthat Hall developed will not be as reliable as those that can be obtained from the standpoint
of national EPA policy. In particular, his report uses the unit benefit values derived frompollution in California, principally in Los Angeles. In contrast, our estimates will rely onnational estimates of the air pollution costs of energy usage. Moreover, our assessment willbe much more comprehensive in terms of the particular types of pollutants that we consider.This difference with the analysis by Hall is not a minor variant. In particular, the largestexternalities associated with energy usage are those linked to air pollution and acid rain,The main adverse effects of acid rain are in the Eastern states so that a study based onCalifornia benefits will not capture this influence. To provide an entirely different analysisof these important benefit components as we do in this report is, in effect, to prepare analmost completely separate assessment of the energy externalities.
The fourth row of Table 1.1 pertains to the costs associated with climate change, Asis indicated above, there remains substantial debate over the magnitude and even thedirection of these effects. Our analysis will exclude these from consideration, not becausethey are unimportant, but because the focus of our analysis is to determine the pricing of energy that is required to achieve efficiency if we take into account factors other than globalwarming. In subsequent project periods we hope to address the global warming issue morefully.
The next row of the table pertains to national security. There remains substantialuncertainty over the appropriate allocation of defense costs to energy. To what extent wasthe war in the Persian Gulf intended primarily to influence the energy price as opposed to
promote other policy objectives? In the absence of making such an allocation, the costs of operations Desert Shield and Desert Storm cannot be allocated to gasoline and relatedpetroleum energy sources. There is no doubt an important linkage of such defense costs toenergy, but the extent of this linkage is unclear. Moreover, the overall magnitude of theultimate expenditure that the United States will incur is not yet determined. Even moreuncertain is the extent of our future obligation. As a result, this analysis will focus on the
4

7/28/2019 ENVIRONMENTALLY RESPONSIBLE ENERGY PRICING
http://slidepdf.com/reader/full/environmentally-responsible-energy-pricing 18/138
Environmental Externality Benefits
air pollution effects of energy rather than on the national security effects.
The final externality component of the analysis by Hall consists of the assessments
of the various aspects of nuclear energy, which lie outside the scope of our report.
1.2. ENVIRONMENTAL EXTERNALITY BENEFITS
The main focus of this report is to establish the environmental costs associated withvarious types of energy usage. All the estimates that will be discussed below are derivedfrom benefit studies done for the U.S. Environmental Protection Agency. It is helpful toreview the methodology that we are using since we hope that EPA officials will continue tocomment on the appropriateness of our selection of various empirical estimates from theavailable range of possible EPA estimates. The Appendix to this report summarizes themethodology in greater detail.
The information currently available as calculated by EPA pertains to the benefits thatwill be achieved by reducing current emissions to a pollution standard. The first step of theanalysis is to define what this standard is and how fast it will be met. The assumption thatwe have adopted in consultation with the OAQPS, is the following. We have assumed thatthe benefits associated with attaining compliance will be achieved in one year and that theywill not be phased in over a long period of time. In addition, in situations where thepollution standard is not specified in units that are comparable to those needed for assessingbenefits, we perform a sensitivity analysis assuming 10 percent and 25 percent reductions inpollution will ensure compliance with the current standards. In some cases, notably lead,we do have precise information regarding the standard level so that such an assumption is
not needed. However, for pollutants such as particulate, sulphur oxides, and ozone, wemust make this assumption in order to establish the compliance reference point.
After having determined the unit benefit value for reducing pollution from the currentlevel of emissions to a pollution standard, we then apply these benefit values to assess thetotal benefit that will be achieved by going from the current emissions level to a backgroundlevel of pollutants. We then use these benefit assessments in conjunction with the totalenergy amount to calculate the externality per unit of energy. In some cases the units aregallons, where in others they may be tons or cubic feet. The estimates that we haveprepared thus far appear reasonable given the information we have been able to obtainfrom the OAQPS staff in Durham, NC.3

7/28/2019 ENVIRONMENTALLY RESPONSIBLE ENERGY PRICING
http://slidepdf.com/reader/full/environmentally-responsible-energy-pricing 19/138
Environmentally Responsible Energy Pricing
NOTES
1. In theory, the extensive literature in economics on the optimal Pigouvian tax isintended to provide guidance on the setting of optimal externality taxes.
2. It should be noted that the user fees should be regarded as only an initialapproximation to such optimal fee levels. The theoretically correct user fee amount isbased on a complex set of economic influences beyond the degree of refinement possiblewith available data.
3. Before considering the particular estimates, let us briefly review some of the sourcesthat we used for our estimates. The benefit numbers for particulate, sulphur oxides, andNO
xare based on National Ambient Air Quality Standards (NAAQS) economic analyses.
The ozone numbers are from an Office of Technology Assessment (OTA) study and a
new study by Resources for the Future under contract to the OTA. The air toxicsestimates are based on estimates derived by the Office of Mobile Sources. The leadestimates are derived from an economic analysis of restricting lead and gasoline preparedby the EPA’s Office of Policy Analysis. The acid rain estimates are based on a study bythe National Acid Precipitation Assessment Program (NAPAP). The air toxics numbersand the lead numbers are perhaps most reliable in that we have a well-defined referencepoint in computing the benefit values. Carbon monoxide and NO
xare omitted from the
externality costs because of the absence of a definitive regulatory analysis of thesepollutants. Because of the timing of these various studies, our estimates will pertain to1986, the most recent year for which comprehensive estimates of externality costs couldbe generated.
6

7/28/2019 ENVIRONMENTALLY RESPONSIBLE ENERGY PRICING
http://slidepdf.com/reader/full/environmentally-responsible-energy-pricing 20/138
PART II:THE FULL SOCIAL COST ENERGY PRICING APPROACH TO
GREENHOUSE WARMING POLICY

7/28/2019 ENVIRONMENTALLY RESPONSIBLE ENERGY PRICING
http://slidepdf.com/reader/full/environmentally-responsible-energy-pricing 21/138
Environmentally Responsible Energy Pricing
2.1. INTRODUCTION
Policies to prevent substantial climate change will impose potentially enormous socialcosts to address a problem for which the character and associated consequences are highlyuncertain.’ At the most extreme, some scientists suggest that prospective climate changesmay, on balance, be beneficial. Many observers have consequently recommended a morecautious policy approach, at least as an initial step. Until the pertinent uncertainties areresolved, they suggest that we should follow the minimal course of action dictated by ourcurrent knowledge. The stringency of policies consequently should reflect the non-globalwarming damages and costs associated with emissions of greenhouse gases. This policyprescription has come to be known as the “no regrets” approach since even the mostfavorable informational developments regarding the risks of global warming will notundermine the desirability of taking these minimal actions.2
In other words, a “no regrets” approach is to adjust current prices to reflect all non-global warming damages associated with the emission of greenhouse gases? To ensure thatsociety adopts the most efficient mode of energy use, which is the most important source of greenhouse gases, and that the economically efficient amount of energy will be used, theprices of these energy sources should reflect their total social costs. On the basis of thisprinciple, the 1991 National Academy of Sciences greenhouse warming panel recommended:
Study in detail the “full social cost pricing” of energy, with a goal of graduallyintroducing such a system...On the basis of the principle that the pollutershould pay, pricing of energy production and use should reflect the full costsof the associated environmental problems. The concept of full social costpricing is a goal toward which to strive. Including all social, environmental,and other costs in energy prices would provide consumers and producers withthe appropriate information to decide about fuel mix, new investments, andresearch and development.’
The results reported in this section establish a major component of the value of thefull social cost prices. The environmental damages from fossil fuel use represent only amajor component of the full social costs because they exclude the non-environmental socialcosts of fossil fuel use. Other possible cost components include: national security costsassociated with ensuring uninterrupted oil imports and inefficiencies resulting from failure
of electric utilities to use marginal cost pricing? Although we know of no systematic studyof these non-environmental social costs, the magnitude of these costs may also be very large.The results reported here, however, pertain only to the environmental damages of fossil fueluse.8
Our assessment of the full social cost prices of regrets” policy involves enormous dollar stakes. Shifting
8
energy suggests that even a “noour focus from climate change to

7/28/2019 ENVIRONMENTALLY RESPONSIBLE ENERGY PRICING
http://slidepdf.com/reader/full/environmentally-responsible-energy-pricing 22/138
Full Social Cost Energy Pricing
more conventional environmental effects does not eliminate the prospect of considerableeconomic costs. Policies based on the estimated environmental impacts would necessitatesubstantial expenditures, possibly hundreds of billions of dollars annually. Moreover, there
is also considerable uncertainty with respect to environmental damages from energy usesother than greenhouse warming, although less so than with the valuation of global warmingdamages.
Even if full social cost energy pricing is never implemented, examination of theseprices is a useful mechanism for identifying the divergence between private and social costs.Should our policy emphasis, for example, be on improving fuel efficiency of automobiles, orshould we direct greater attention to decreasing pollution from coal? In terms of eliminatingthe underlying uncertainties, should analysts focus their attention on resolving thecomplexities of acid rain, or do the mortality risks associated with sulfur oxides represent anarea in which there is much more to be learned? Examining full social cost energy prices
highlights the salient open research questions as well as the broad outlines of what iscurrently known about appropriate pricing of energy. These issues are pertinent not onlyto climate change policy, but also to the debate over our national energy strategy.
2.2. ECONOMIC FOUNDATIONS
Ideally a society interested in the welfare of its citizens wants to promote efficientutilization of all resources, including energy resources. This concern is particularly greatsince energy consumption has been linked to a number of environmental costs, principallyrelating to air pollution. Because energy users do not compensate those who bear these
costs as part of a market transaction, they represent a classic case of environmentalexternalities.
In any market context, it is economically efficient for participants to bear the fullconsequences of their actions so that their behavior will incorporate the social effects as wellas the private benefits. Consumers of energy are not paying these costs since they arepermitted to use an environmental resource (i.e., atmospheric waste disposal) without payingany explicit fee.
The economic objective is twofold. First, energy producers should supply theappropriate amount of each form of energy given these social costs. Second, consumers
should consume the amount of each energy source that reflects a balancing of the benefitsto them of the energy and the social costs of their actions. To achieve this efficient energyusage objective, the incentives for energy production and utilization must be correct.
This report estimates user fees that lead energy users to incorporate theenvironmental costs of energy in their energy choices.’ This objective is obviously quiteambitious. Obtaining a definitive assessment could ultimately require a much more extensive
9

7/28/2019 ENVIRONMENTALLY RESPONSIBLE ENERGY PRICING
http://slidepdf.com/reader/full/environmentally-responsible-energy-pricing 23/138
Environmentally Responsible Energy Pricing
research effort. Because of resource constraints, the scope of this study will necessarily bemore limited, and substantial reliance will be placed on previous government analyses of energy-related pollution.8
The incorporation of the environmental externality costs of energy will be undertakenby relying largely upon benefit assessments that have served as the basis for EPA standards.Perhaps more than any other available documents, these assessments represent an officialgovernmental view of the environmental damages from energy use. This is not to say thatthese assessments should be accepted uncritically, as they have frequently been challengedby other government agencies, academics, and industry.’ Our approach provides anapproximation of these environmental costs.
The estimates reflect only a subset of the adverse environmental externalities createdby energy use. The most notable exception is the omission of the global warming
externalities from the analysis. The reason for this omission is not that these externalitiesare unimportant. Rather, the magnitude and even the direction of the greenhouse effectimpacts remain under strenuous debate. The intent of the “no regrets” policy assessmentis to determine whether many of the objectives of those advocating policies to address therisks of climate change can be achieved through a more limited approach that recognizesonly those externalities other than climate change.
This assessment of the social costs of energy embodies several simplifyingassumptions. Most fundamental is that the focus of the study is on the total social costs of pollution, which will generally be lower than the social cost that firms must pay for the rightto pollute. These environmental costs do take into account the role of compliance with
existing regulations, but do not incorporate charges that firms now pay or will pay underEPA policies being implemented. Under the acid rain trading system, new firms in areasthat have not attained their air quality standards are required to purchase permits for theirpollution from firms that have reduced pollution by a comparable amount. These permitcosts in effect will serve as a price that should be counted toward the firm’s payment of itsfull social costs.
Even when there are no permit changes, there generally are EPA regulations thatfrequently impose requirements that are more stringent than would be dictated on economicefficiency grounds. The difficulty is that even stringent standards do not solve all of theeconomic problems. Firms will still be given pollution levels up to the standard for free.
Indeed, all of the estimates in this study are based on an assumption of compliance withregulations. The focus is, however, on existing regulations, not on all regulations that willemerge as a consequence of the new Clean Air Act. As a result, the incentive of firms toenter the industry will be too great.10” The appropriate economic solution to achieve anefficient outcome requires the use of some kind of system to augment regulations. The levelof these fees will, however, be influenced by the stringency of current regulations -- a
10

7/28/2019 ENVIRONMENTALLY RESPONSIBLE ENERGY PRICING
http://slidepdf.com/reader/full/environmentally-responsible-energy-pricing 24/138
Full Social Cost Energy Pricing
complication not incorporated in the analysis. Continuing research under this project isexploring how the role of existing EPA standards can best be reconciled with the utilizationof a full social cost energy pricing approach. It should, however, be emphasized that the
results in this report do recognize that EPA regulations exist. In particular, compliance withexisting regulatory standards serves as the principal reference point for analysis.
The nature of the full social cost pricing approach also must be refined before itsultimate implementation. Ideally, the tax should be on pollution, not on energy. The mostobvious distinction that must be made is between anthracite and bituminous coal. However,generally there will be a need to reorganize differences in pollution associated with aparticular energy source. One of the main purposes of an energy pollution-free system isto encourage innovation to reduce pollution, such as by introducing control equipment thatwill decrease pollution from a particular form of energy. Firms will have no such incentiveif they are penalized based on the type of energy they use rather than on the damage that
it generates. The ultimate objective is to establish fees for pollution not for energy use. Thecalculations in this paper present what such a fee structure would look like overall, butshould not be regarded as providing a rationale for ignoring the level of damage associatedwith each energy source.
2.3. ENERGY SOURCES AND POLLUTANTS
Existing evidence on the costs associated with energy are most developed for variousforms of petroleum (gasoline, diesel, aircraft fuel, heating oil, and natural gas), wood, andcoal.” Excluded from this listing are three energy sources for which the environmental
damages may be negligible. Wind and solar power generate virtually no adverseenvironmental effects, and the water pollution and air pollution damages associated withgeothermal power are believed to be minimal.
Another energy source that we will not examine is nuclear power. Unfortunately,there is no comparable governmental study of nuclear hazards that enables us to include theassociated nuclear risks in our analysis. In contrast, pollution emissions levels areobservable, and with the aid of health benefit assessments, it is possible to make judgmentspertaining to the likely impacts of pollution from coal, wood, and petroleum-based fuels.
Assessment of the costs of nuclear power is a quite different enterprise.” Major
reactor failures are a rare event. How, for example, should we incorporate the Chernobylexperience in risk assessments for the U.S. nuclear industry? We observe signals of likelyhazards -- faulty safety practices, minor mishaps, and near disasters -- but ultimately the risk assessment for nuclear power hinges on subjective assessments of human and engineeringfailures. Some observers claim that the risks have been overblown, whereas others viewnuclear power as a serious threat. We do not view these uncertainties as insurmountable,but to date there have been no definitive assessments of the risks of nuclear power. In the
11

7/28/2019 ENVIRONMENTALLY RESPONSIBLE ENERGY PRICING
http://slidepdf.com/reader/full/environmentally-responsible-energy-pricing 25/138
Environmentally Responsible Energy Pricing
absence of governmental risk assessment for nuclear power or a comparable definitiveanalysis, nuclear power will be excluded from consideration.
The social cost results below should not provide a relative subsidy to nuclear powersimply by default. Before any environmental cost fee system is implemented, there shouldbe a comparably vigorous assessment of the expected externality costs associated withnuclear energy.
Each of the columns in Table 2.1 list the different energy sources that will be thesubject of the assessment. For each energy source, seven different components of externalcosts were considered. The importance of these categories differs by energy source. Forgasoline, the most detrimental externalities are for particulate, in large part because EPAregulations have already greatly reduced the role of lead pollution from motor vehicles.Particulate are also an important category of pollution for diesel, aircraft fuel, and wood.
For coal and heating oil, sulfur oxide mortality is of greatest import. Ozone is the mostdamaging pollutant linked to natural gas.
The externality costs associated with each pollutant are given both in terms of acontribution per unit of the fuel as well as a percentage of the 1986 retail price.13 The year1986 was selected to ensure the availability of the key data components. The estimates inTable 2.1 are based on the midpoints of the estimated EPA pollution benefit ranges. Thedegree of uncertainty in these estimates is explored below. These estimates also pertain toaverage benefit values over the entire range of remaining benefits. For the purpose of theanalysis it was necessary to assume that marginal and average damage levels from pollutionare equal since data are not available to permit estimation of the curvatrue of the
relationships. As a consequence, these estimates may understate the marginal unit benefitsof pollution reduction.
The role of the different pollutants varies by energy source. The remaining lead ingasoline imposes external costs on society that constitute roughly 1 percent of the retailprice.” Particulate emissions are pertinent to all the energy sources listed in Table 2.1.With the exception of natural gas, every energy source generates substantial particulateemissions. Both motor fuels as well as stationary source fuel combustion are involved.15
Particulate emissions impose costs on society equal to 9 percent of the price of gasoline, 23percent of the price of diesel, 11 percent of the price of aircraft fuel, 6 percent of the priceof heating oils, under 1 percent of the price of natural gas, 147 percent of the price of wood,
and 25 of the price of coal.
The next two categories of externalities in Table 2.1 pertain to sulfur oxides.Emissions of sulfur dioxide and resulting sulfate particles from motor fuels and stationarysource fuel combustion impose losses that can be best distinguished in terms of those thataffect mortality and those that do not.16 Although significant sulfur oxide costs are
12

7/28/2019 ENVIRONMENTALLY RESPONSIBLE ENERGY PRICING
http://slidepdf.com/reader/full/environmentally-responsible-energy-pricing 26/138
Table 2.1
Unit Value of Benefits of Emission Reduction to Zero Following Compliance with Current Standards”
3
*Pollution Gasoline Diesel Aircraft Fuel Heating Oils Natural Gas Wood
“ECoal
Category $ per gal $ per gal $ per gal $ per gal $ per 1,000 ft3
$ per short(% of price) (% of price)
$ per short(% of price) (% of price) (% of price) ton ton
(% of price)
3(% of price)
Lead in 0.0108Gasoline (1.16) n~nn~%1 f: &m~~Eal
Sulfur Oxides 0.0169 0.1044SOq Mortality (1.82) (11.10) 0“m91 mm :~~ E(1.42)
Ozone 0.0214 0.0176
(2.30) (1.87) H“w55 ~mm ~~? E(0.86)
Visibility
Air Toxicsfrom MotorVehicles bF~RREese estimates are based on midpoints of the estimated range of values.

7/28/2019 ENVIRONMENTALLY RESPONSIBLE ENERGY PRICING
http://slidepdf.com/reader/full/environmentally-responsible-energy-pricing 27/138
Full Social Cost Energy Pricing
associated with both diesel and heating oils, by far the greatest relative cost of sulfur oxideexternalities are those associated with coal. Sulfide damages excluding mortality constitute13 percent of the price of coal, and the mortality effects constitute 464 percent of the price
of coal. Put somewhat differently, the midpoint estimates of the sulfur oxide mortalityeffects of coal are almost 5 times larger than the market price of coal. As will be indicatedbelow, the level of these costs is also very uncertain.
The next category of externalities are those associated with reducing ambient ozoneconcentrations resulting from motor fuels and stationary source fuel combustion.” Thecosts of ozone pollution constitute 2 percent of the price for gasoline and diesel, under 1percent of the price for aircraft fuel, heating oils, and natural gas, and 3 percent of the pricefor wood and coal. The visibility externalities are largely associated with reducing sulfuroxide emissions from coal-fired power plants.18e These visibility costs constitute 23 percentof the price of coal.
The final environmental cost component in Table 2.1 consists of the quantities of potential cancer cases related to non-lead emissions from motor vehicles.19 These air toxiceffects constitute 2 percent of the price of gasoline and 14 percent of the price of diesel.
2.4. EXTERNALITIES AND NET TAXES
Ideally, the prices of these various energy sources should reflect the social costs theyimpose. To adjust for these costs one can impose an additional charge on the use of theseenergy sources. In effect, all usage of each energy type is treated as causing the sameaverage amount of pollution. If this policy is implemental, some mechanism should beadopted to link the charge to pollution. It is emissions of polutants, not energy usage, thatshould be discouraged, such an approach will also provide incentives for pollution-reducinginnovations.
One might view these charges as being a user fee for the environmental resource thatis not properly recognized in market transactions. To the extent that there are existing taxesimposed on energy sources, these would correct at least in part for the disparity between theprivate price and the social price of the energy source.
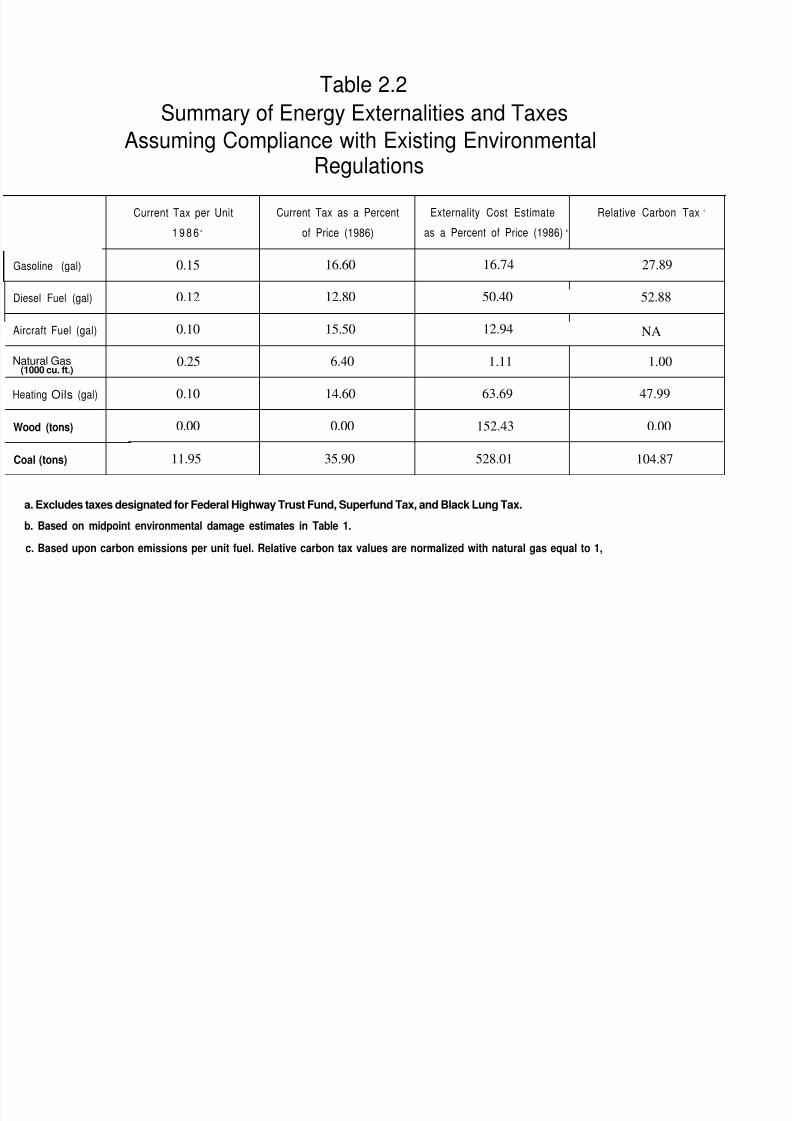
Table 2.2 summarizes the current net taxes paid by various energy sources as well asthe external costs that are generated. In situations in which the taxes equal the externalcosts, no additional charges on the energy source are appropriate.
Current taxes on gasoline are 17 percent of the price, roughly the same as theexternality cost. In the case of diesel fuel, the current net tax per gallon is 13 percent,whereas the externality cost per gallon is 50 percent. In the case of aircraft fuel, the currentnet tax per gallon is 16 percent of the price, and the externality cost is 13 percent. Existing
13
7/28/2019 ENVIRONMENTALLY RESPONSIBLE ENERGY PRICING
http://slidepdf.com/reader/full/environmentally-responsible-energy-pricing 28/138
Table 2.2
Summary of Energy Externalities and Taxes
Assuming Compliance with Existing EnvironmentalRegulations
oline (gal)
el Fuel (gal)
raft Fuel (gal)
000 cu. ft.)
ing Oils (gal)
od (tons)
l (tons)
Current Tax per Unit
1 9 8 6 a
0.15
0.12
0.10
ural Gas 0.25
0.10
0.00
11.95
Current Tax as a Percent
of Price (1986)
16.60
12.80
15.50
6.40
14.60
0.00
35.90
Externality Cost Estimate Relative Carbon Tax c
as a Percent of Price (1986) b
16.74 27.89
50.40 52.88
12.94 NA
1.11 1.00
63.69 47.99
152.43 0.00
528.01 104.87
Excludes taxes designated for Federal Highway Trust Fund, Superfund Tax, and Black Lung Tax.
Based on midpoint environmental damage estimates in Table 1.
Based upon carbon emissions per unit fuel. Relative carbon tax values are normalized with natural gas equal to 1,

7/28/2019 ENVIRONMENTALLY RESPONSIBLE ENERGY PRICING
http://slidepdf.com/reader/full/environmentally-responsible-energy-pricing 29/138
Environmentally Responsible Energy Pricing
tax levels are below the amount of the appropriate user fee in the case of diesel fuel, butthere is no such discrepant for gasoline and aircraft fuel.20
Heating oils represent a case similar to that of diesel fuel. The current tax level is15 percent, whereas the environmental cost is 64 percent. Natural gas currently has taxesof 6 percent, whereas the environmental cost is 1 percent. Somewhat strikingly, the currenttax levels for natural gas are in fact above the user fee level based on this analysis.Moreover, the environmental costs are very low in percentage terms.
Wood currently is not taxed, whereas the appropriate user fee for each short ton of wood is 152 percent of the price. Heat provided by wood stoves clearly is not a totallyenvironmentally responsible solution to the energy crisis.
The case of coal is most dramatic. The current tax per ton of coal is 36 percent of
the price, whereas the environmental costs are 529 percent of the price.
These taxes can be also put in different terms more closely linked to the currentgreenhouse debate. Advocates of policies to address greenhouse warming frequentlypropose that a carbon tax be implemented?’ The externalities considered here can alsobe incorporated within the context of a carbon tax, but the level of the base carbon tax toaccount for the externalities other than greenhouse warming will not be uniform. The finalcolumn in Table 2.2 indicates how high the relative carbon tax on each fuel should be, wherethe level of the carbon tax has been normalized by setting the tax on natural gas equal to1. The relative carbon tax for those gasoline sources for which estimates are available ismuch greater than it would be on natural gas, which is a comparatively clean energy source.
The relative carbon tax levels range from 1 for natural gas to 28 for gasoline to 105 for coal,A uniform carbon taxis not an appropriate vehicle for addressing environmental damagesother than global warming. One of the major advantages of our approach is that it adjustsfor the substantial heterogeneity in environmental costs rather than relying on a simplecarbon tax.
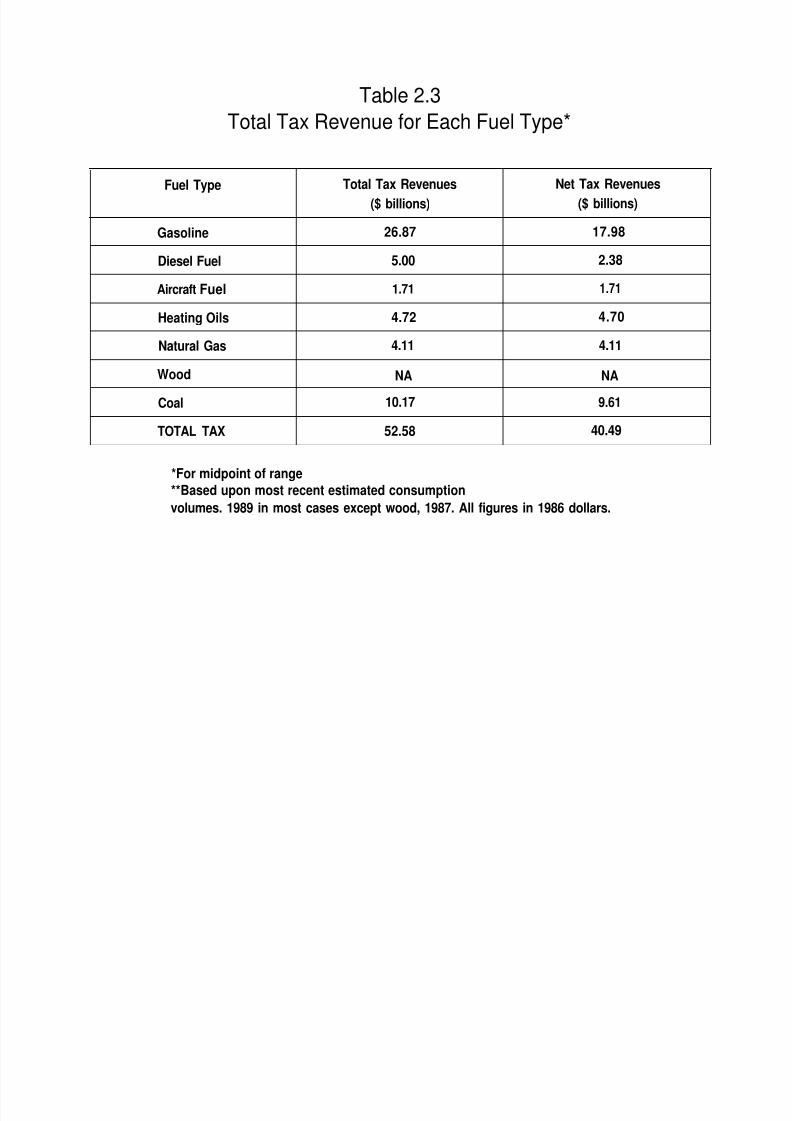
Irrespective of whether the tax is levied through a carbon tax or some othermechanism, the total price tag for the externalities will be quite high. Table 2.3 summarizesthe total environmental costs associated with each energy source, assuming that there is nochange in the quantity of energy used. There would, of course, be a substantial shifting awayfrom energy sources whose relative price increased. The total tax amount is $208 billion,
which is about two-thirds of the $281 billion projected budget deficit for fiscal year 1992.22
Over two-thirds of the estimated energy tax amount is attributable to coal. Gasoline, heatingoils, and wood would be taxed in the $10-$20 billion range, and coal would be $149 billion.
Imposing externality charges of this magnitude is certainly a daunting prospect. Amajor source of the relative popularity of regulatory standards as compared with taxes is that
14
7/28/2019 ENVIRONMENTALLY RESPONSIBLE ENERGY PRICING
http://slidepdf.com/reader/full/environmentally-responsible-energy-pricing 30/138
Table 2.3
Total Tax Revenue for Each Fuel Type*
Fuel Type Total Tax Revenues Net Tax Revenues
($ billions) ($ billions)
Gasoline 26.87 17.98
Diesel Fuel 5.00 2.38
Aircraft Fuel 1.71 1.71
Heating Oils 4.72 4.70
Natural Gas 4.11 4.11
Wood NA NA
Coal 10.17 9.61
TOTAL TAX 52.58 40.49
*For midpoint of range**Based upon most recent estimated consumption
volumes. 1989 in most cases except wood, 1987. All figures in 1986 dollars.

7/28/2019 ENVIRONMENTALLY RESPONSIBLE ENERGY PRICING
http://slidepdf.com/reader/full/environmentally-responsible-energy-pricing 31/138
Full Social Cost Energy Pricing
firms do not currently have to pay for these costs. In effect, the imposition of regulatorystandards allows firms to have a level of pollution up to the standard for free.23 Standardscan be effective in promoting the efficient degree of pollution control for any particular
energy source, but they will not provide the correct incentives for the modal choice amongalternative sources of energy.
Suppose, for example, that there are two possible sources of energy. Source A is ahighly polluting energy source for which it is very difficult to reduce pollution levels. SourceB is a very clean energy source for which it is possible to virtually eliminate the pollutionlevel at little cost. Setting efficient regulatory standards, which is to say those that equatethe marginal benefits to society of additional pollution reduction with the marginal costs of controls, will lead to very minimal pollution reduction for energy Source A, but may lead tothe elimination of pollution for Source B. In each case efficient controls would have beenimposed for the energy source, but what remains is an immense uncompensated
environmental cost imposed on society for energy Source A. Notwithstanding theseexternalities, society perhaps should continue to use Source A. However, unless the pricethat consumers pay for this energy source reflects the remaining environmental costs thatare generated, the price mechanism will not provide consumers with the appropriateincentive for making the appropriate energy choice.
2.5. THE RANGE OF UNCERTAINTY24
One reason for caution with respect to implementing such externality charges is thatthere remains considerable uncertainty in the ranges of the cost estimates. The pollutioneffect estimates are disputed by private industry officials as well as by many independentanalysts. Moreover, there remains a substantial range of uncertainty implied by thegovernmental studies on which this analysis has been based. Most of those analyses servedas the economic framework underlying the justification of government regulations and, asa consequence, were the result of substantial research effort. The range of uncertainty thatremains reflects, at least in part, the current imprecision of our scientific knowledge that maybe costly to reduce.
Instead of focusing on environmental costs based on the midpoints of governmentanalyses, Figure 2.1 indicates the current tax amounts, and the lower and upper bounds onthe appropriate environmental cost surcharge. Gasoline has a modest range of uncertainty-- from 2.5 percent to 31.0 percent of its price. In contrast, the lower bound estimate forcoal externalities is 21.0 percent, and the upper bound is 1,035.0 percent.
It is instructive to consider some of the sources of these uncertainties. In the caseof gasoline, the principal uncertainty is the societal cost of particulate emissions, for whichthe estimates range from 0.5-17.4 percent of the price. Particulate costs are also the majoruncertainty for diesel (1.2-44.7 percent of the price), aircraft fuel (0.5 -20.6 percent of the
15

7/28/2019 ENVIRONMENTALLY RESPONSIBLE ENERGY PRICING
http://slidepdf.com/reader/full/environmentally-responsible-energy-pricing 32/138
cd
(/ )
C6
I
r
Esl
a:-
W

7/28/2019 ENVIRONMENTALLY RESPONSIBLE ENERGY PRICING
http://slidepdf.com/reader/full/environmentally-responsible-energy-pricing 33/138
Environmentally Responsible Energy Pricing
price), and wood (7.5 -287.4 percent of the price). The sulfur oxide mortality effect rangeis the greatest for two energy sources -- heating oils (0.0-106.2 percent of the price) and coal(0.0-928.0 percent of the price). Although one can make judgments regarding the
appropriate estimate within these ranges, such as our reliance on the midpoints, the rangeof uncertainty signals the potential benefits of improving the informational base underlyingfull social cost energy pricing. The extent of uncertainty, our ability to resolve theuncertainty, the cost of resolving the uncertainty, and the benefits to the design of the energypricing system all affect the desirability of acquiring this information.
Unless there is no potential for information acquisition, these results imply thatadopting the “no regrets” social cost pricing approach may also involve substantial regret aswell. The presence of uncertainty need not paralyze policy development since taking noaction may be costly as well. It does suggest, however, that policies of informationacquisition and refinement of these environmental damage estimates should be a high
priority for additional research.
2.6. CONCLUSION
Reverting to an environmental strategy of “no regrets” that abstracts from the risksof global warming does not completely simplify the policy task. The remaining uncertaintiesinvolved are currently substantial, though they can potentially be reduced through additionalscientific and economic research. There is a particular need for further knowledge of thenature of the relationship between the external costs on society and additional reductionsin pollution. In addition, some of the most uncertain high stakes externality components,such as sulfur oxide mortality, merit detailed scrutiny so as to narrow the range of
uncertainty.
Shifting the focus from greenhouse warming to more short-term air pollutionproblems also does not eliminate the need for bearing enormous economic costs. The levelsof the environmental damages involved are substantial -- possibly on the order of hundredsof billions of dollars annually. Non-environmental costs may be significant as well. A societythat is reluctant to incur an extra nickel/gallon tax on gasoline is unlikely to accept asubstantial increase in its energy bill, particularly in the short run.
The difficulty is that there is no explicit market transaction that makes clear theimmense implicit price for energy pollution that society is now paying. Adverse healtheffects, such as mortality, are diffuse. Many of these impacts occur with a long time lag, andtheir incidence cannot easily be linked to particular energy sources. As a result, theirmagnitude is widely debated. The certainty of an immediate expenditure for energy taxesconsequently will tend to loom larger than the dimly understood prospects associated withenvironmental damages. These would be viewed more favorably if the government were tosubstitute energy taxes for other taxes that produce economic distortions, such as income
16
7/28/2019 ENVIRONMENTALLY RESPONSIBLE ENERGY PRICING
http://slidepdf.com/reader/full/environmentally-responsible-energy-pricing 34/138
Full Social Cost Energy Pricing
taxes.
Even if society does not adopt a full social cost pricing system for energy, analyzing
what the prices should be from an efficiency standpoint provides an illuminating framework for an analysis. Chief among the conclusions of this study is that the prices of the energysources that seem most out of line with their environmental damage are coal and wood.Natural gas is a comparatively clean energy source that is currently taxed more than iswarranted given the costs that its use imposes on society. Moreover, the almost exclusiveobsession of the popular press and much government regulation with private motor vehiclesappears to be misplaced. Gasoline pays its own way in the sense that the current gasolinetax equals the environmental damage imposed. Perhaps because of these efforts, the gapbetween the environmental costs resulting from gasoline and the taxes already imposed ismuch less than for energy sources such as diesel fuel and heating oils. Moreover, all of those adverse effects are dwarfed by the enormous, but highly uncertain environmental costs
associated with coal.
Pursuit of a “no regrets” policy of full social cost energy pricing raises the same classof concerns as do proposals to address climate change, but to a lesser degree. The stakesare immense, the uncertainties are considerable, and the possibility of regret over controllingpollution by more than will prove to have been warranted is quite real. These parallelssuggest that this entire policy area involves intrinsic uncertainties. Ultimately, decisions willhave to be made without clear-cut guarantees regarding their effects. At the same time,these uncertainties suggest that the value to society of scientific and economic research thatimproves the environmental information base may be considerable.
17

7/28/2019 ENVIRONMENTALLY RESPONSIBLE ENERGY PRICING
http://slidepdf.com/reader/full/environmentally-responsible-energy-pricing 35/138
Environmentally Responsible Energy Pricing
NOTES1. There remains a debate regarding the implications of climate change for greenhousewarming. Some areas may be affected differently by climate change. In addition, some
researchers hypothesize that there may be global cooling. The emphasis of this paperwill be on greenhouse warming, recognizing that there are diverse scientific views. Seethe National Academy of Sciences, Policy Implications of Greenhouse Warming(Washington: National Academy of Sciences, 1991). Some states share these concerns.See the New York State Energy Office, Draft New York State Enemy Plan, ExecutiveSummary, July 1991.
2. Others have labeled this the “bootstrap” approach. See Stephen H. Schneider, GlobalWarming: Are We Entering the Greenhouse Century? (San Francisco: Sierra ClubBooks, 1989).
3. Our analysis of this “no regrets” approach does not imply an endorsement of it. If theeffects of current actions are irreversible, waiting for uncertainties to be resolved mayimpose considerable costs.
4. National Academy of Sciences (1991), p. 73.
5. Some other omitted cost categories are those related to the following: urban vehiclecongestion due to non-pricing of road use during peak hours; overbuilding (from aneconomic perspective) of housing (and hence overuse of heating and cooling) due to thehome mortgage deduction; possible overuse of energy due to the inclusion of costs forenergy-using utilities in the rents charged for many apartments; possible overuse of
highways to haul freight in heavy trucks that may not pay the full cost of the damagesthey cause to the highways; and possible adverse effects of dependency on foreign oil onU.S. trade policy. An issue arises as to what extent some of these externalities should beattributed to the general activity or the energy source. The analysis also excludes totallife cycle environmental costs and only examines costs associated with energy use. Totalcosts for the fuel cycle also are likely to be greatest for coal.
6. The main building blocks for our assessment are past U.S. Environmental ProtectionAgency (EPA) studies of the economic damages from environmental pollutants resultingfrom fossil fuel use that the agency prepares as part of its major regulatory initiatives.Although these estimates can clearly be debated and possibly refined, they have received
substantial internal and public review since they provide the analytical foundation forU.S. regulatory policies.
7. It should be noted that the user fees should be regarded as only an initialapproximation to such optimal fee levels. The theoretically correct user fee amount isbased on a complex set of economic influences beyond the degree of refinement possiblewith available data. See Carlton and Loury (1980).
18
7/28/2019 ENVIRONMENTALLY RESPONSIBLE ENERGY PRICING
http://slidepdf.com/reader/full/environmentally-responsible-energy-pricing 36/138
Full Social Cost Energy Pricing
8. These studies in turn have sometimes relied on the academic literature. The upperbound of the damage estimates is based on Lave and Seskin (1978). The energy costestimates are based on Evans (1984).
9. See Nichols and Zeckhauser (1986), Lave (1982), and Zeckhauser and Viscusi (1990).
10. Thus, we will have achieved short-run efficiency, not long-run efficiency.
11. See Hall (1990), Schelling (1983), and Schelling (1991).
12. See Hall (1990) for a review of the literature on these effects.
13. These calculations also assume that compliance with existing EPA standards willachieve a 25 percent reduction in current pollution levels. To ensure comparability, theanalysis uses 1986 as the reference year.
14. These estimates were based on information from the U.S. EPA, Office of PolicyAnalysis, Costs and Benefits of Reducing Lead in Gasoline, Final RIA, February 1985,chapter VIII.
15. The underlying externality estimates are based on information from the U.S. EPA,Strategies and Air Standards Division, Regulatory Impact Analysis of the NAAQS forPM, Second Addendum, December 1986.
16. The basis for these estimates is the U.S. EPA, Office of Air and Radiation,Regulatory Impact Analysis of the NAAQS for Sulphur Oxides (Sulphur Dioxide), Draft
Report, March 1988, Executive Summary, Appendix B.
17. Resources for the Future, “The Health and Agricultural Benefits of Reduction inAmbient Ozone in the United States," December 1988, chapters 3 and 5.
18. National Acid Precipitation Program, Integrated Assessment Question OneEconomics, June 11, 1990.
19. U.S. EPA, Office of Mobile Sources, Air Toxics Emissions From Motor Vehicles,September 1987, Executive Summary.
20. This tax would be even larger if we knew the externalities for NO,.
21. See Nordhaus and Yohe (1983), Poterba (1991), and Nordhaus (1991).
22. See Council of Economic Advisors (1991), p. 375.
23. See Crandall (1983).
19

7/28/2019 ENVIRONMENTALLY RESPONSIBLE ENERGY PRICING
http://slidepdf.com/reader/full/environmentally-responsible-energy-pricing 37/138
Environmentally Responsible Energy Pricing
24. Uncertainty is an inherent component in other risk regulation contexts as well. SeeWilson and Crouch (1991).
20

7/28/2019 ENVIRONMENTALLY RESPONSIBLE ENERGY PRICING
http://slidepdf.com/reader/full/environmentally-responsible-energy-pricing 38/138
PREFACE TO THE APPENDICES TO PART II
At this time, the full social cost pricing study considers only air pollutants resultingfrom combustion of fuels. The scope of the study could be expanded in two ways, one, byadding other pollutants and pollution endpoints of concern, and two, by including otherrelevant points in the fuel cycle (e.g. wastes created from the exploration, development andproduction of fuels). We have considered several such extensions of the study’s scope, butin most cases we were unable to identify quantitative assessments of benefits sufficient indetail to derive unit benefits estimates.
Many different approaches have been used to investigate optimal energy taxes. Thisstudy follows a direct method of estimating the potential benefits from fuel consumption atcurrent emissions levels and fuel use rates. Benefits of other levels of emissions are thencalculated assuming a linear no threshold model. One study incorporating a similarapproach was recently reported by the New York State Energy Office. The methodologyincorporated in that study is briefly described in appendix 2.
Appendix 2.1 is a detailed discussion of the sources of information used in this reportand the assumptions and calculations used to derive the benefits estimates. It is the intentof this discussion that a researcher could duplicate the estimates in this report by followingthe same steps as described in the appendix. Appendix 2.2 is a brief review of the methodfollowed in the recent New York State study. Appendix 3.1 draws upon the unit benefitestimates generated here to compare a number of different approaches for implementingsocial cost energy pricing. These results are presented in tabular form for the followingimplementation approaches, a consumption tax, a production/import tax, a carbon tax torecover air pollution externalities, a coal output tax, an electricity tax, a gasoline and dieselfuel tax, and a comprehensive emissions fee system. A number of different implementationand institutional issues are raised for each approach.

7/28/2019 ENVIRONMENTALLY RESPONSIBLE ENERGY PRICING
http://slidepdf.com/reader/full/environmentally-responsible-energy-pricing 39/138
APPENDIX 2.1SUMMARY OF BENEFITS DATA

7/28/2019 ENVIRONMENTALLY RESPONSIBLE ENERGY PRICING
http://slidepdf.com/reader/full/environmentally-responsible-energy-pricing 40/138
1. INTRODUCTION AND SOURCE MATERIAL
The focus of this report is to catalogue the benefits available from elimination of airpollutants resulting from the combustion of fuels and to calculate the optimal taxes toaccount for energy-related pollution. Throughout this research effort, the benefits associatedwith fuel sources were drawn from existing government (or government sponsored) benefitassessments typically written for a specific pollutant, for example, sulfur dioxide or lead ingasoline. Several of these studies were conducted by the U.S. EPA’s Office of Air andRadiation in the review of National Ambient Air Quality Standards (NAAQS). The benefitsstudy cited for lead in gasoline was performed by the EPA’s Office of Policy Analysis. Otherstudies were performed by the Office of Mobile Sources, also of the EPA, and by theNational Acid Precipitation Assessment Program (NAPAP). One cited study was performedby a nonprofit research and consulting firm, Resources for the Future, under contract to theOffice of Technology Assessment (OTA).
Because of the diverse set of benefits studies that we have drawn from, benefitsvalues were often reported for different time frames using different accounting conventions.The numbers drawn from each study have been normalized to the annual dollar value of benefits in 1986 constant dollars for calendar year 1986. The year 1986 was chosen strictlyfor computational convenience. The specific steps taken to normalize the benefits from eachstudy are reported in detail below.
Table A2.1.1 lists the normalized benefits drawn from each government assessment.Source documents typically reported total benefits for all sources of a particular pollutant.This research report, however, focusses only on pollutants resulting from fuel-relatedsources. Many pollutant sources in the source documents are nonfuel-related. For example,particulate pollution may be the result of dust from dirt roads, forest fries and volcanos.Ozone pollution may result from evaporation of solvents in paints. Therefore, benefits datawere adjusted to account for fuel-related sources of pollution, only.
The most desirable method of adjusting the benefits data for pollution sources wouldbe to first determine the background concentration of each pollutant and then to determinethe marginal contribution to ambient concentration resulting from fuel sources.Unfortunately, this approach is precluded by the lack of detailed air quality data. As asecond best measure, emissions to the environment will be used as a proxy for environmentalquality data.
The EPA annually publishes air pollutant emissions estimates in the National AirPollutant Emission Estimates series. Emissions estimates from this source were used torelate the 1986 normalized health and environmental benefits to fuel-related pollutionsources. The EPA reports emissions for each of the following pollutants, lead, particulate,sulfur oxides (SO
x), nitrogen oxides (NO
x), volatile organic compounds (VOC’s), and carbon
monoxide (CO) for each of the following source categories, transportation, stationary sourcefuel combustion, industrial processes, solid waste disposal, and miscellaneous.

7/28/2019 ENVIRONMENTALLY RESPONSIBLE ENERGY PRICING
http://slidepdf.com/reader/full/environmentally-responsible-energy-pricing 41/138
Environmentally Responsible Energy Pricingg
No comprehensive benefits data were identified for the pollutants NOx
and carbonmonoxide; therefore, any health and environmental benefits resulting from reduction of these two pollutants are not captured in this study. To the extent that such benefits exist,
the documented externalities may be underestimated because NOx and CO effects are notincorporated.
Another source of potential underestimation may occur because benefits estimatesdrawn from the source documents were scaled downward to account for benefits which couldnot be linked with a specific fuel-related emissions source. The EPA emissions datadelineate emissions into two fuel-related categories, namely, transportation and stationarysource fuel combustion. For the transportation category, the EPA emissions estimates arefurther detailed into the following subcategories, highway, diesel, aircraft, railroads, vessels,farm machinery, construction machinery, industrial machinery, and other. As will beexplained in more detail below, only the first three categories relate to a specific fuel source
(e.g. gasoline, diesel fuel, or aircraft fuel). Because of the difficulty of assigning the otheremission categories to specific fuel sources, benefits estimates were scaled downward toexclude these source subcategories. Table A2.1.1 lists the proportion of benefits identifiedin the government assessments which have been allocated to transportation and fuelcombustion based upon this EPA data. The net benefits used in the remainder of thisresearch report are found in the final two columns of Table A2.1.1.
Throughout this report, ambient air quality is proxied by emissions of each pollutantof concern. Table A2. 1.2 lists the emissions of each pollutant in 1986, and calculates the netbenefits (from Table A2.1.1) of existing regulations measured per unit of emissions. Clearly,the lead in gasoline regulation yields several orders of magnitude higher benefits per gram
emissions than other regulations. Relative comparisons among the other pollutants shouldbe made with caution, however. These specific figures are subject to theinadequacies/assumptions of the source materials such as choices of categories of benefitsto include in each benefits assessment.
Another way to evaluate the data is by comparing benefits across fuel sources. Muchof the remainder of this discussion focusses on fuel source comparisons. Table A2.1.3 liststhe net benefits from Table A2.1.1, but the benefits are allocated over fuel sources. Clearly,the lead in gasoline regulations have generated significant benefits from gasoline. Butlooking at the upper bound estimates, it appears that the greatest source of potentialbenefits if from coal consumption. When looking at the benefits measured in BTU-
equivalents across fuel sources, the greatest benefits are again from coal consumption, whilemost petroleum-derived products have similar benefits when measured in BTUS [BTUconversion factors drawn from the “Monthly Energy Review,” January, 1987]. Throughoutthe projections made later in this report, this pattern will remain. The greatest potential tocapture future benefits appears to be from the consumption of coal.
24

7/28/2019 ENVIRONMENTALLY RESPONSIBLE ENERGY PRICING
http://slidepdf.com/reader/full/environmentally-responsible-energy-pricing 42/138
Appendix 1
In the remainder of this research report, the net benefits identified in Table A2.1.1are used to calculate benefits per unit of each fuel used in 1986 (i.e. dollar value of benefitsper gallon of gasoline consumed in 1986). For example, the total benefits allocated to
gasoline (based upon the proportion of emissions in 1986 from gasoline sources) are dividedby the consumption of gasoline in 1986 to yield benefits per gallon. These unit benefits canbe thought of as the unit benefits of strict compliance with current standards/regulations.
For computational convenience, unit benefits are assumed to be constant over timeand constant for the level of emissions. This second assumption is equivalent to assumingthat the health and environmental effects of each pollutant are linear with respect to airquality (proxied by emissions).
Assuming that unit benefits are constant, the unit benefits are used to extrapolate tothe potential benefits from reducing emissions from identifiable fuel-related sources to zero.
The unit benefit estimates and the projections to zero are found in Table A2.1.4 and TablesA2.1.6 through Table A2.1.10. The calculation of unit benefits and the method forprojecting to zero are discussed in more detail
2.
Two types of uncertainty enter into theA2.1.1 by ranges over which benefits are stated.
below.
SOURCES OF UNCERTAINTY
analysis. The first type is evident in TableThe ranges reflect uncertainty in the source
documents’ calculation of benefits, and in some cases, ‘the uncertainty may be extremelylarge--as in the range of benefits for S04 mortality. The second type of uncertainty arisesfrom the assumptions and limitations of this analysis and the data upon which the analysisis based.
For each pollutant listed in Table A2.1.1, benefits are displayed in ranges resultingfrom uncertainties in the benefits assessments. For lead in gasoline, the actual benefits of the regulation depend upon automobile owners’ compliance with regulations requiring useof unleaded fuel. If cars are misfueled, by adding leaded fuel, the emissions systems maybe impaired. The benefits range, therefore, reflects two different assumptions, no misfueling(upper bound) and partial misfueling (lower bound).
EPA’s estimate of the benefits of controlling particulate incorporates uncertainty asto the extent of the health and environmental effects of particulate pollution and
uncertainty regarding the economic valuations of health and environmental effects. Thebenefits analysis calculated benefits for a number of different scenarios reflecting underlyinguncertainty in the health and environmental effects of particulate exposure. For thisanalysis, two scenarios were chosen as upper bound and lower bound benefits estimatesbased upon EPA’s assertion that the two scenarios were most inclusive of the range of health and environmental effects without double-counting. In addition to the uncertaintyover the precise health and environmental effects of particulate exposure, EPA’s benefit
25

7/28/2019 ENVIRONMENTALLY RESPONSIBLE ENERGY PRICING
http://slidepdf.com/reader/full/environmentally-responsible-energy-pricing 43/138
Environmentally Responsible Energy Pricing
range is due in part to the valuation assigned to mortality risk. Each case was assigned avalue from $430,000 to $7,460,000.
In EPA’s benefits analysis for sulfur dioxide, uncertainty isquality modelling procedures and by the economic valuationsenvironmental effects.
introduced by the airassigned health and
For mortality related to S04, the benefits range in Table A2.1.1 is significantly widerthan the ranges for other pollutants. This range reflects the divergence of opinion in thescientific community regarding the mortality risk from exposure to S04 as well as a broadvaluation for reduction in incremental mortality risks. EPA’s benefits estimates included allavailable risk estimates with no attempt made to select the most appropriate values. Thebroad range adopted by EPA was incorporated in this study; however, in addition to EPAsrange, this study identifies an alternate upper bound estimate (referred to as the “modified
upper bound”) which may more accurately reflect the risks associated with S04 exposure.The question of the risks associated with S04 exposure is discussed in more detail below(section III.D).
The analysis of the benefits related to ozone includes uncertainty regarding both rateof incidence and valuation of symptoms.
The range of benefits related to visibility is the result of uncertainty in the economicvaluation of visibility improvements.
The range of benefits associated with air toxics in motor vehicles results from
uncertainty in the rate of incidence of several different air toxic pollutants.
The second type of uncertainty in this report results from limitations in source dataand analysis method. While the intent of this exercise is to identify the optimal level of taxeson fuel sources to account for associated externalities, the optimal taxes can only be ascomprehensive as the accounting of externalities. For example, no direct benefits fromcontrol of carbon monoxide or NO
xare included in this report. In the ozone analysis,
impaired lung function is not valued. If these pollutants/effects are significant risks/endpointsin the population, they are not accounted for in the calculation of optimal energy taxes.
A second source of uncertainty is regional variation reflected--or not reflected--in the
results. Some adverse health or environmental endpoints may be of concern only in someregions of the country. However, due to data and methodological limitations, such variationsare not captured in this analysis. The EPA regulatory analyses that provided the foundationof our study are national in scope. Emissions data are a critical element in the unit benefitcalculations described in detail below, but fuel consumption and pollutant emissions data arenot available on a regional basis. Therefore, this analysis assumes that emissions are
26

7/28/2019 ENVIRONMENTALLY RESPONSIBLE ENERGY PRICING
http://slidepdf.com/reader/full/environmentally-responsible-energy-pricing 44/138
distributed evenly throughout the country. This assumption may lead to some oversimplifiedresults.
Another source of uncertainty is the true risk of exposure to different pollutants asambient loadings of those pollutants change. Is the risk of an incremental exposure at highlevels of ambient concentration equal to the risk of an incremental exposure at low levelsof ambient concentration? In this analysis, unit benefits of emission reductions calculatedat a given ambient concentration are used to estimate the benefits of further emissionsreductions beyond the initial ambient concentrations. If the adverse health andenvironmental effects of pollutant exposures are actually nonlinear or exhibit a thresholdeffect, then using unit benefit estimates may introduce inaccuracies.
In some sense, despite its wide application in the literature, the linear, no thresholdmodel incorporated in this report is an arbitrary approach. Adopting some other model is
precluded by the lack of scientfic consensus of the underlying relationships between airquality and health/environmental effects, and between emissions and air quality. In a recentreport [New York 1991], the New York State Energy Office proposes an alternative linearthreshold model; however, this approach is similarly arbitrary without a scientific basis forthe threshold chosen and the resulting relationship between emissions and health effects.The New York State study is briefly reviewed elsewhere in this appendix.
An additional uncertainty relates to the base year and the fuel mix observed in thatyear. The volume of coal consumed in 1986, 768 million short tons, is composed of somemix of different types of coal, for example “high sulfur” and “low sulfur.” If the mix of coaltypes changes over time, perhaps as a result of compliance with Clean Air Act requirements,
then the unit benefits calculated for the base year would not necessarily be representativeof the true unit benefits in future years. This caveat could apply to any nonhomogeneousfuel source, especially coal and heating oils.
Many of these underlying uncertainties are discussed in more detail in other sectionsof this report, and other uncertainties are addressed where appropriate.
3. UNIT BENEFIT CALCULATIONS
This section presents a more detailed description of the benefit data for each
pollutant and of the unit benefit estimation method. As mentioned above, unit benefitsincorporate government estimates of benefits, and can be interpreted as the unit benefits of strict compliance with existing regulations/standards. TableA2.1.4 which details unit benefitsby pollutant and fuel source can be considered the benefits of compliance with existingregulations.
27

7/28/2019 ENVIRONMENTALLY RESPONSIBLE ENERGY PRICING
http://slidepdf.com/reader/full/environmentally-responsible-energy-pricing 45/138
Environmentally Responsible Energy Pricing
In Table A2.1.4, unit benefits are presented for the following pollutants, lead ingasoline, particulate (more specifically, PM10), sulfur oxides (excluding S04 mortality), S04
mortality, and ozone. The benefits are allocated over the following fuel sources, gasoline,
diesel fuel, aircraft fuel, coal, heating fuel oil, natural gas, and wood. The allocation of benefits occurs as follows. Recall that emission data are available for several transportationfuel categories and several stationary fuel source categories. For each pollutant, theproportion of total emissions resulting from each fuel category was calculated. This figureis multiplied by the total benefits for that pollutant to yield the benefits allocated to eachfuel. For example, from the EPA emissions data in the report, National Air PollutantEmission Estimates 1940-1988, gasoline accounts for 11.22% of the emission of particulatein 1986. The net benefits due to particulate are $31,193 million (upper bound estimate asadjusted in Table A2.1.1). The benefits allocated to gasoline are $31,193 million multipliedby 0.1122. Unit benefits are then estimated by dividing this result by the volume of gasolineconsumed in 1986. Table A2.1.4 contains estimated unit benefits for each fuel-pollutant
combination as well as a comparison of the magnitude of unit benefits and the price of eachfuel type.
The benefits data for each pollutant are outlined in more detail below. Seeparticularly the section on particulate to find the specific citations for fuel consumption andprice data.
Lead in Gasoline
Benefits data were drawn from EPA’s Costs and Benefits of Reducing Lead inGasoline, final Regulatory Impact Analysis which was produced in 1985 to accompany
regulations reducing lead in gasoline. The specific benefits estimates used in this reportwere drawn from Table VIII-7c (low bound with partial misfueling) and from Table VIII-7a(high bound with no misfueling).Categories of Benefits Incorporated:
Children: Benefits to children from reduced lead exposure included savings inexpenditures for medical treatment (for lead testing and blood chelation therapy) andsavings in compensatory education for IQ loss. Other adverse effects of leadexposure, including, chronic health effects, prematurity, birth malformation, andneurological disorders were not quantified.
Adults: Benefits to adults included morbidity and mortality effects of lead exposure.Morbidity benefits were restricted to avoided medical costs and foregone earnings forhypertension, stroke, and myocardial infarction. Mortality benefits valued at onemillion per individual based on occupational risk premium studies. Note: benefitswere estimated for white males ages 40-59, only, with the exception of hypertensionwith also included nonwhite males in this age group.
28

7/28/2019 ENVIRONMENTALLY RESPONSIBLE ENERGY PRICING
http://slidepdf.com/reader/full/environmentally-responsible-energy-pricing 46/138
Appendix 1
Fuel economy benefits: The change in gas formulation was estimated to reduce fuelconsumption. The dollar value of fuel savings were included.
Auto maintenance benefits: The changes would also lead to savings in vehiclemaintenance. Dollar value of savings for spark plugs, exhaust systems, and oilchanges included.
Conventional Pollutants: The fuel economy benefits will also reduce the release of other pollutants (primarily ozone) associated with gasoline combustion. Relatedbenefits to health, agricultural crops, ornamental plants, materials, and visibility areincluded.
Benefit Scenarios Used:
Three scenarios are incorporated in the RIA, assuming no misfueling, partialmisfueling, and full misfueling (misfueling occurs when conventional lead gasoline isused instead of unleaded gasoline). The benefit range used in the draft reportreflects the latter two scenarios.
Unit Benefit Calculations:
Benefits estimated for 1986 were used in all calculations. These numbers wereinflated from 1983 (as reported in the RIA) to 1986 using the implicit price deflator.All benefits are assumed to result from consumption of gasoline. The upper andlower bounds on the benefits range were each divided by the number of gallons of
gasoline consumed domestically in 1986 (source: Basic Petroleum Data Book, sectionVII Table 21, 9/89) to yield a unit benefit value in terms of dollars per gallonconsumed. The percent of 1986 price calculation incorporated the weighted [for leadand unleaded and for gasoline grades] average retail price per gallon based upondata from “Monthly Energy Review,” 7/90, Table 9.4, from the Energy InformationAdministration.
Particulates
Benefits data were drawn from EPA’s Regulatory Impact Analysis of the NationalAmbient Air Quality Standards for Particulate Matter 2nd addendum, December j 1986,
Table III.C.1. [low bound] and Table III.C.2 [upper bound]. This analysis was completedto accompany the most recent revision the National Ambient Air Quality Standard(NAAQS) for particulate.
Categories of Benefits Incorporated:
29

7/28/2019 ENVIRONMENTALLY RESPONSIBLE ENERGY PRICING
http://slidepdf.com/reader/full/environmentally-responsible-energy-pricing 47/138
Environmentally Responsible Energy Pricing
Mortality Incorporated a range of benefit from $0.43 to $7.46 per reduction of 1 X10+ in mortality risk.
Morbidity: Valued lost workdays, reduced activity days, and direct medicalexpenditures from chronic respiratory disease. Lost work days were valued at theaverage daily wage, and reduced activity days were valued at one-half the daily wage.
Soiling: Estimated benefits from cleaning and well-being of reduced householdsoiling. Excluded soiling and materials damage in commercial, institutional, andgovernment sectors.
Benefit Scenarios Used:
EPA’s estimates are based upon an extensive literature review of the adverse effects
of particulate. The many studies reviewed each utilized different assumptions aboutthe types of particles of concern, the exposed population, etc. EPA organized theseresults into six alternative standards (some more and some less strict than the currentstandard) and six aggregation methods. This report incorporates the estimates forstrict adherence to the current standard (PM
10at 50, annual and 150 24-hour) and
for aggregation scenarios C and D which where judged by the EPA as most inclusivewithout double-counting.
Unit Benefit Calculations:
EPA reported benefits as 1983 discounted present value in 1984 dollars at a 10
percent discount rate. The benefit flow was for the seven years from 1989 through1995. For the draft report, total benefits were converted to typical year values for1989 through 1995 in 1986 dollars.
Typical year benefits were allocated over fuel sources (including gasoline, diesel,aircraft fuel, heating fuel oil, natural gas, coal, and wood) based upon the proportionof emissions from each source. EPA has published emissions data for the NAAQSpollutants for 1940 through 1988 in the publication National Air Pollutant EmissionEstimates 1940-1988. Emissions are reported for the following categories,transportation, stationary source fuel combustion, industrial processes, solid wastedisposal and miscellaneous. Emissions from transportation are further detailed for
gasoline powered highway vehicles, diesel powered highway vehicles, aircraft railroadsvessels, farm, industrial, and commercial machinery, and other. Emissions fromstationary fuel combustion are broken down into coal, fuel oil, natural gas, wood, andother. Total emissions combining the transportation and fuel combustion categorieswere allocated to fuel-related categories based upon the reported emissions for 1988.Note that in some cases, for example VOCS, a large portion of the emissions result
30

7/28/2019 ENVIRONMENTALLY RESPONSIBLE ENERGY PRICING
http://slidepdf.com/reader/full/environmentally-responsible-energy-pricing 48/138
from activities other than fuel combustion. The benefits values drawn from existingreports were adjusted to reflect nonfuel emission sources. In addition, some benefitsrelated to fuel combustion were excluded due to the difficulty in identifying the
appropriate fuel source. The transportation categories: vessels, farm machinery,industrial machinery, commercial machinery, and other were excluded from ouranalysis because the actual fuel source for the emissions is not identified. Theproportion of benefits uncounted due to these omissions is listed in Table A2.1.1.
After allocating the benefits over each fuel source based upon the emissions fromthat source, unit values (e.g. benefits per gallon) were calculated using consumptiondata from 1986. Consumption values for gasoline, diesel, aircraft fuel, and naturalgas were drawn from the Basic Petroleum Data Book (BPDB) [gasoline, Table 21section VII; diesel, Table lOa, section VII; aircraft fuel, Table 21 section VII; naturalgas, Table 5a section XIII]. Consumption of heating fuel oils was estimated by
summing residual and distillate fuels designated for the following uses, heating oils,industrial use, oil company fuel, and electric utilities [Basic Petroleum Data Book,Tables 10a and 12a, section VII]. Coal (net of coal used for coke plants) and woodconsumption figures were drawn from the Annual Energy Review, 1987, from theEnergy Information Administration, Tables 76 and 95, respectively. Woodconsumption is for 1984.
The sources of price data are as follows: gasoline from the Energy InformationAdministration’s (EIA) “Monthly Energy Review,” Table 9.4, 7/90. Diesel fuel wasdrawn from the International Energy Annual, 1986, from the EIA, Table 17. Theprice of aircraft fuel is a weighted average based upon prices (excluding taxes)
reported in the “Monthly Energy Review,” Table 9.7 for aviation gas and kerosene-based jet fuel. The prices were weighted by the consumption volume for each foundin the EIA’s State Energy Data Report: Consumption estimates 1960-1986, Table 12.As this yielded a tax-free price, the unit tax on aircraft fuel identified in this reportwas added to the weighted price. The price of heating fuel oil is an average--weighted by the volumes of residual fuel oil (assumed to be equivalent to heavy oil)and distillate fuel oil (assumed equivalent to light oil)--of the reported price of No.2 home heating oil from the Annual Energy Review, 1987, Table 65, and the pricediscount between residual fuel oil and No. 2 fuel oil found in the Monthly EnergyReview, Tables 9.7 and 9.5. The BPDB provided the price of natural gas in Table13, section VI. The price of coal, delivered at electric utility power plants, CIF (i.e.
cost, insurance and freight) was drawn from the Annual Energv Review, 1987, Table81. The price per ton of wood was estimated from information in the RegularotyImpact Analysis: Residential Wood Heater New Source Performance Standardconducted by the EPA in 1986. The report lists regional prices of wood sold by thecord at the retail level. These regional prices were weighted by 1986 regionalpopulation to yield a national average. This national average was discounted by 25
31

7/28/2019 ENVIRONMENTALLY RESPONSIBLE ENERGY PRICING
http://slidepdf.com/reader/full/environmentally-responsible-energy-pricing 49/138
Environmentally Responsible Energy Pricing
percent, as suggested by the EPA analysis, to account for consumers who pay lessthan retail prices. Finally, the adjusted price per cord wasconverted to price pershort ton based on the conversion factor found in “Monthly Energy Review,” Table
A1, January 1990. The values used for consumption and price are listed in TableA2.1.5.
Sulfur Oxides (excluding SO 4
mortality)
Benefits data were drawn from EPA’s 1988 Regulatory Impact Analysis on theNational Ambient Air Quality Standards for Sulfur Oxides, Table 7 [for strict interpretationof current standards]. Benefits are estimated for 31 Eastern states, only. S04 mortalitybenefits were drawn from Tables B.2 and B.3. Agricultural benefits are calculated for onlythree crops, soybeans, wheat, and oats. Some ancillary benefits reported under sulfur oxidesare the result of reduced particulate emissions from compliance with the sulfur oxides
standards.
Categories of Benefits Included:
Mortality: Benefits are attributed to the reduced short-term non-episodic exposureto sulfur dioxide. Each statistical case is valued at from $420,000 to $7.3 million.
Morbidity: Sulfur dioxide morbidity is estimated only for short-term exposure. Long-term exposure is not included due to uncertainties. The symptoms valued includewheezing, shortness of breath, nose and throat irritation, and coughing. Symptomsare valued at from zero to $50 per hour reduced. Particulate benefits are valued as
in the particulate section.
Agricultural: Benefits calculated for increased crop yield for soybeans, wheat, andoats resulting from lower sulfur dioxide exposure.
Visibility: Benefits from improved visibility from reduced S04 emissions are includedbased on contingent valuation studies in nine cities. Materials Damage/Soiling:Soiling benefits from particulate are included similarly to those discussed in theparticulate section. Materials damage from sulfur dioxide is valued at from $0.77to $6.89 per year per household within the applicable distance from power plants.
Unit Benefit Calculations:
As in the particulate section discussed above, EPA reported in 1983 the presentvalue of benefits in 1984 dollars for reductions from 1990 through 2000 discountedat 10 percent. These benefits were converted to typical year values in 1986 dollarsand allocated as detailed in the particulate section.
32

7/28/2019 ENVIRONMENTALLY RESPONSIBLE ENERGY PRICING
http://slidepdf.com/reader/full/environmentally-responsible-energy-pricing 50/138
Appendix 1
SO 4
Mortality
As in the case of sulfur oxides, benefits data were drawn from EPA’s 1988 Regulatory
Impact Analysis on the National Ambient Air Quality Standards for Sulfur Oxides, fromTables B.2 and B.3. Mortality associated with exposure to SO
4is quite controversial. EPA
did not explicitly include these benefits in the RIA; however, in an appendix, estimates of SO
4mortalities are presented. Due to the controversial nature of the benefits, EPA
estimated the lower bound of the benefits range at zero cases. Reflecting this uncertainty,the tables include S04 mortality as a separate category from sulfur oxides.
In estimating the range of benefits associated with S04 mortality, EPA cited all theavailable studies as well as the opinion of two unnamed experts. The study upon which theupper bound is based, Chappie and Lave, ‘The Health Effects of Air Pollution: aReanalysis/’ has been criticized on many fronts. In Evans et al., “Cross-Sectional Mortality
Studies and Air Pollution Risk Assessment,” the authors perform a comprehensive reviewof the literature on S04 risk including reexamining the data analyzed by Chappie and Lave.In particular they correct for the seemingly arbitrary inclusion of three measures of SO
4by
Chappie and Lave, and they run regressions with separate measures of particulate and SO4
By using measures of these two pollutants as regressors, Evans estimates should decouplethe effects of particulate from the S04 risk estimates. The paper by Evans admits topotential multicollinearity and lack of significance of some important variables; nevertheless,this risk estimate may be more appropriate than that of Chappie and Lave.
Taking the above discussion into account, Table A2.1.6, presents the unit benefitsestimates as in the previous Table A2.1.4, except that the upper bound reflects the Evans
estimate rather than Chappie and Lave. The total benefits for this assumption werecalculated by the EPA in the analysis referenced above. Throughout the rest of thisresearch summary, this scenario will be referred to as the “modified upper bound.”
One other aspect of the SO4
mortality estimates is of note. EPA’s emission estimatesare listed as for all sulfur oxides. In the most part, the emissions are sulfur dioxide. Oncein the atmosphere, sulfur dioxide maybe transformed to S04. It is assumed throughout thisresearch report that there is a one-to-one relationship between the EPA’s reported level of sulfur oxides and S04. Therefore, unit benefit calculations for the pollution categories sulfuroxides and S04 mortality utilize the same emissions figures.
Ozone
Benefits data were drawn from The Health and Agricultural Benefits of Reductionsin Ambient Ozone in the United States by Alan Krupnick and Raymond Kopp in 1988 [page3-21 for health benefits and Tables 5-3, 5-5, 5-9, 5-11 for agricultural benefits] preparedunder contract to the Office of Technology Assessment. The Office of Technology
33

7/28/2019 ENVIRONMENTALLY RESPONSIBLE ENERGY PRICING
http://slidepdf.com/reader/full/environmentally-responsible-energy-pricing 51/138

7/28/2019 ENVIRONMENTALLY RESPONSIBLE ENERGY PRICING
http://slidepdf.com/reader/full/environmentally-responsible-energy-pricing 52/138
section) for the emissions of both VOCS and NOx
and then weighted by 75% to 25%respectively.
4. UNIT BENEFITS OF EMISSIONS REDUCTIONS TO ZERO
Using the unit benefit ratios discussed in Section III, projections of potential benefitsfor reducing emissions to zero from identifiable fuel-related sources are detailed in TablesA2.1.7 through A2.1.10.
Two new categories of benefits are introduced in these tables, benefits FROMvisibilityrelated to acid deposition and benefits from air toxics associated with motor vehicles. Inboth cases, the source documents estimate the total adverse health/environmental result of existing air quality/emissions. In effect, these estimates calculate the potential benefits of eliminating emissions altogether. Therefore, the benefits are classified in this report as
potential benefits from reducing emissions to zero, and are included only in the tablessummarizing projected benefits (as opposed to the tables summarizing the benefits of compliance with existing regulations). This section first discusses the benefits from these twosources, and then presents the method for projecting future benefits for the categoriespresented in section II.
Visibility (related to acid deposition)
Benefits data on visibility were drawn from the National Acid Precipitation Program(NAPAP) study. The Integrated Assessment of the NAPAP study, (Question 1: Economics,p.26) cites work by Chestnut and Rowe who developed a “consensus function” to examinevisibility values across a number of studies. Using their approach, Chestnut and Roweestimated that the benefits of visibility improvement from an average visual range of 30kilometers (km) to 150 km fall in the range from $3.2 to 12.8 billion annually. Thirty kmis the approximate average visual range in the eastern United States, and 150 km is theapproximate average visual range in the absence of air pollution. Therefore, the estimateby Chestnut and Rowe can serve as a proxy for the benefits associated with reduction of emissions of sulfur oxides (and associated visibility inhibiting pollutants like NO
x).
Unit Benefit Calculations:
Visibility benefits were allocated to fuel sources based on sulfur oxides emissions.Although other pollutants such as NOx and PM contribute to visibility reduction,sulfur oxides are the primary pollutant of concern. Benefits have been allocatedacross emissions categories based on 1986 output levels. Allocating benefits acrossemission sources may understate the benefits associatedutilities, the largest single source of visibility degradation.
with coal fired electric
35

7/28/2019 ENVIRONMENTALLY RESPONSIBLE ENERGY PRICING
http://slidepdf.com/reader/full/environmentally-responsible-energy-pricing 53/138
Environmentally Responsible Energy Pricing
Air Toxics f rom Motor Vehicles
Benefits for this section were drawn from a report from the EPA’s Office of MobileSources, Air Toxics Emissions From Motor Vehicles, September, 1987, Table S-1.
Categories of benefits included:
The report identifies carcinogens associated with motor vehicles. As several of thesource categories are not products of fuel consumption, such categories wereexcluded from our analysis. The remaining categories include diesel particulate,formaldehyde, benzene gasoline vapors, butadiene, ethylene, gasoline PIC/POM andVOCS from motor vehicles. Benefits are reported as a range of cancer deaths fromeach source. For two sources, butadiene and ethylene, uncertainties in the actual
health effects resulted in a lower bound of zero deaths. No morbidity benefits areincluded.
Allocation over sources:
The pollutants cited result from combustion of gasoline and/or diesel fuel. Benzene,gasoline vapors, and PIC/POM were allocated entirely to gasoline. Diesel particulateare allocated entirely to diesel fuel. The remaining categories were allocated overgasoline and diesel based upon the volume of each consumed in 1986, gasoline 85.57percent and diesel 14.43 percent. Source: Basic Petroleum Data Book, Table 21section VII and Table 10a section VII, respectively.
Mortality Valuation:
No dollar valuations were included in the EPA study. For this report, each case wasvalued at four million dollars.
Lead in Gasoline
Two data elements are necessary to extrapolate to the benefits of reducing emissionsto zero. The first element was estimated in Section III (above), namely, the availablebenefits, in this case, denominated in dollars per unit of fuel consumed. The second elementis the level of ambient concentration of the pollutant from which the reduction to zero willbe estimated. As in Section III, emissions will be used as a proxy for ambient pollutantconcentration.
In the ease of lead in gasoline, EPA issued regulations in 1985. Roughly two yearswere required for complete implementation of the lead phasedown. Over those two years,
36

7/28/2019 ENVIRONMENTALLY RESPONSIBLE ENERGY PRICING
http://slidepdf.com/reader/full/environmentally-responsible-energy-pricing 54/138

7/28/2019 ENVIRONMENTALLY RESPONSIBLE ENERGY PRICING
http://slidepdf.com/reader/full/environmentally-responsible-energy-pricing 55/138
Environmentally Responsible Energy Pricing
For particulates--and for sulfur oxides and ozone as well--retrospective emissions dataare not available. In the case of particulate and sulfur oxides, the EPA source documentsestimate benefits of future emissions reductions. In the case of ozone, the source document
predicts benefits if compliance with existing standards could be achieved. Because of thelimitations of these analyses, we cannot peer into the records of pollutant emissions, rathersome estimate of the emissions reductions which will/would result from compliance with theregulations must be made. A review of the background documents used by the EPA for theregulatory impact analyses yields little guidance on the air quality improvements or emissionsreductions which would be associated with the regulations. Based primarily on an a priori
judgement of what maybe reasonable, two initial cases have been used in these calculations.First, it is assumed that the existing regulations for particulate, sulfur oxides, and ozone willresult in a 25% reduction in emissions in the year that the regulations are implemented (orin the case of ozone, in the year that compliance is achieved). It is secondly assumed, thatthere will be a 10% reduction in emissions.
Unlike the case for lead in gasoline where gasoline was the only fuel of concern, thecalculation of projected benefits for these pollutants must occur on a fuel-by-fuel basis.Incorporating the unit benefit estimate for a particular pollutant and fuel combination, thecalculation may be as follows [($ benefits / fuel consumption) * (75% emission remaining
/ 25% emission reduction)]. This calculation is repeated for each pollutant and each fuelcombination using baseline emissions estimates from the most recent year available, 1988.The results are summarized in Table A2.1.7 for the case assuming a 25% emissionsreduction in the first year following implementation of the regulation. Table A2. 1.8summarizes the results assuming a 10?4 emissions reduction. Tables A2.1.9 and A2.1.10repeat the same estimates incorporating the modified upper bound estimate for SO
4
mortality.
As discussed in section 11 (above), projections of benefits beyond the base yearintroduces uncertainty due to the possibility of changing fuel qualities. If the mix of differenttypes of coal or heating oils change over time, then the unit benefit values based on the fuelmix in 1986 may not represent the true benefits of the fuel source in some other year.
5. PROJECTED BENEFITS OF SELECTED CLEAN AIR ACT’AMENDMENTS EMISSIONS REDUCTIONS TARGETS
We have not attempted to conduct a comprehensive assessment of the benefitsassociated with the recent Clean Air Act Amendments. However, as a number of emissionsreductions targets have been discussed widely, the unit benefits estimates from Section 11have been applied to these targets. The resulting rough estimates of the benefits of theemissions targets are summarized in Table A2.1.11.
38

7/28/2019 ENVIRONMENTALLY RESPONSIBLE ENERGY PRICING
http://slidepdf.com/reader/full/environmentally-responsible-energy-pricing 56/138
Appendix 1
The estimates in Table A2.1.11 assume that sulfur dioxide emissions will be reducedby 10 million tons annually. Projected benefits of the 10 million ton target were calculatedby applying unit benefit values--discussed in Section III. For sulfur dioxide, benefits were
calculated for the following categories, SOx morbidity, S0 4 mortality, and visibility. Theemissions reductions are anticipated at electric utilities, only; therefore, benefits werecalculated for coal and heating fuel oil in proportion to their consumption by electricityutilities.
Anticipated reductions in VOCS were used to estimate the potential benefitsassociated with ozone reduction. An annual target of 10 million tons of VOC emissionreduction was assumed. It was further assumed for this estimate that VOCS account for 100percent of ozone formation. Benefits were allocated over all fuel sources.
6. SUMMARY OF ENERGY-RELATED TAX DATA AND TAXALLOCATIONS
This section summarizes information collected to determine the average unit tax oneach fuel source. Taxes include federal and state excises, state severance taxes, and city andcounty excises and utility taxes. Table A2.1.12 summarizes the average per unit tax in 1986for each fuel type. Similarly, Table A2.1.13 summarizes average taxes, but taxes designatedfor a specific use, e.g. gasoline taxes dedicated to the federal highway trust fund, have beenexcluded. For some taxes, revenues were allocated over fuel sources because the fuel sourcecould not be readily identified. For example, severance taxes on petroleum were allocatedover gasoline, diesel, aircraft fuel, and heating oils. Allocation methods are discussed in
detail below. Tables A2.1.12 and A2.1.13 also present taxes for each fuel relative to thetotal BTU content of each fuel consumed in 1986.
Federal Excises
Taxes on gasoline and diesel fuel were drawn from “Statistics of Income Bulletin”from the IRS, Spring 1987, Table A2.1.12. Excises for gasoline and lubricating oils were$8,857,380,000 and for diesel and special motor fuels, $2,613,980,000. The full value of eachexcise was allocated to gasoline and diesel fuel, respectively. These funds are earmarked forthe Federal Highways Trust Fund. These figures differ slightly from Department of Transportation figures for the trust fund in 1986, but the difference is small.
The black lung tax levied on coal was $561,158,000 in 1986 according to the samesource. m e entire tax was allocated to coal.
Other Federal Trees
39

7/28/2019 ENVIRONMENTALLY RESPONSIBLE ENERGY PRICING
http://slidepdf.com/reader/full/environmentally-responsible-energy-pricing 57/138
Environmentally Responsible Energy Pricing
The windfall profits tax totalled $8,866,967,000 in 1986, while the superfund tax was$68,538,000 [IRS, "Statistics of Income Bulletin,” Spring 1987, Table 12]. At that time, thewindfall profits tax was falling rapidly. The superfund tax has grown significantly since this
time. These taxes were allocated over all refined oil products based on the proportion of each product to the total volume of refined products in 1986. Approximately 20 percent of these taxes is not included in the tables because only gasoline, aviation fuel, diesel fuel, andfuel oil are included.
State Excises
State excises for motor fuel were $14,836,960,000 according to the U.S. Dept. of Commerce “Quarterly Summary of Federal, State, and Local Tax Revenue,” Ott/Dec 1986,Tables 3,5. This figure differs slightly from the Department’s “Government Finances: StateGovernment Tax Collections in 1987,” Table 9. The difference is probably due to revisions
in the data. For some states, the latter source specified the amount collected from gasoline,diesel, and aircraft fuel, and other fuels not included in this study. Accordingly, taxescollected on other fuels were deleted from total state excises. The remaining taxes(approximately $14 billion) were allocated over gasoline, diesel, and aircraft fuel accordingto 1986 consumption levels. Reviewing the tax policies of individual states indicates thatmany different policies exist for inclusion/exclusion of aircraft fuel, special fuels, etc. Thesedifferences could not be captured in the tax allocations.
State excises for timber were $83 million; however, the proportion relevant for woodfuel could not be determined. Timber taxes were accordingly excluded from the report.
Local Excises
Local taxes for gasoline and other fuels were $260,040,000 according to the “QuarterlySummary of Federal, State, and Local Tax Revenue," Ott/Dee, 1986, Tables 3, 5. Thesetaxes were allocated to gasoline, diesel fuel, and aviation fuel according to 1986 consumptionlevels.
Severance Taxes
State severance taxes on coal were $463 million, and on oil and gas, $5,325 million
according to the Energy Information Agency’s “Monthly Energy Review” of July 1988, TablesFE2, FE4. The coal taxes were allocated to coal. The petroleum and gas taxes wereallocated between petroleum and natural gas based on the total BTUS of each consumedin 1986, according to consumption figures published in the U.S. Statistical Abstracts, 1989,Table 929. The petroleum taxes were further allocated to gasoline, diesel fuel, aircraft fuel,and heating oil in the same manner as the windfall profits tax.
40

7/28/2019 ENVIRONMENTALLY RESPONSIBLE ENERGY PRICING
http://slidepdf.com/reader/full/environmentally-responsible-energy-pricing 58/138
Utility Taxes
State utility tax collections were $6,022,529,000 according to the Department of
Commerce’s “Government Finances: State Government Tax Collections in 1987,” Table LNo information was available to help allocate these tax collections between fuel-related andnonfuel-related (e.g. telephone) utilities. State utility taxes were therefore not included inthe draft report.
City and county taxes for natural gas were $2,294 million, and city and county taxesfor electric utilities were $15,028 million. These figures were drawn from “GovernmentFinances: City Government Finances in 1986-87,” Table 1, and “Government Finances:County Government Finances in 1986-87,” Table 1, both published by the Bureau of theCensus. According to the Statistical Abstracts of the United States, Table 952, in 1986, 46percent of electric utility generation was due to coal and 12 percent from fuel oil. The
remaining amount was for nuclear, hydro, and natural gas. These percentages were adjustedupward to eliminate natural gas from the total leaving coal with 60.85 percent and fuel oil,15.87 percent of the nongas electricity generation.to coal and $2,385 to fuel oil.
7. CALCULATION OF
Accordingly, $9,145 million was allocated
RELATIVE CARBON TAXES
The carbon taxes calculated below apportion externality costs to different fuel sourcesbased on the carbon content of each fuel type. The results of this approach may differ fromother estimates found in the literature. Tax values in dollars are not calculated; rather, theestimates address the appropriate tax magnitude for each fuel source by comparing the tax
for each fuel to a common reference, the tax for natural gas.
Estimated carbon taxes for each fuel type are based upon the carbon dioxide contentof each fuel. Fuel carbon contents were drawn from Marland (1983). In Table A2.1.14, arelative carbon tax is estimated for each fuel, based upon these carbon loadings. First, thecarbon content is converted from emissions of carbon per 109 joules to emissions per unitfuel (e.g. emissions per gallon of gasoline). Joules were converted to BTUS [lO
1s joules =
0.948 quadrillion BTUs], and BTUS converted to fuel equivalents using the BTU conversionfactors found in the “Monthly Energy Review,” January, 1987. This carbon dioxide emissionsestimate is divided by the estimated externality cost (in this case for the midpoint of thebenefits range assuming 25% emission reduction due to current regulations) to yield a
measure of carbon dioxide emissions relative to externality costs per unit fuel--labelled thecarbon tax. The relative taxes in the last column of the table are scaled with natural gasequal to one by dividing the carbon tax for each fuel by the value for natural gas.
41

7/28/2019 ENVIRONMENTALLY RESPONSIBLE ENERGY PRICING
http://slidepdf.com/reader/full/environmentally-responsible-energy-pricing 59/138
Environmentally Responsible Energu Pricing
8. SUMMARY OF COLLECTED INFORMATION
Much of the information discussed throughout this research summary is collected ina few simple tables. Tables A2.1.15 and A2.1.16 report the total benefits for each fuel.These tables aggregate over all pollutants the total benefit--by fuel type--of compliance withexisting regulations and the total benefit--by fuel type--of reducing emissions to zero. TableA2.1.15 reports these figures assuming a 25% emissions reduction for compliance withexisting regulations, while Table A2.1.16 incorporates a 10’% emission reduction.
Tables A2.1.17 and A2.1.18 present an overall summary of the unit benefit and unittax information compiled to date. For each fuel type, the tables present the lower andupper bound of the unit benefits aggregated over all pollutants, summing the benefits of compliance with existing regulations and the benefits of reducing emissions to zero. The
midpoint of the unit benefits range is presented as is the modified upper bound based onthe S04 mortality estimate from Evans. Net unit taxes from Table A2.1.13 are presented,and both the modified upper bound and the net unit tax are presented as a percent of the1986 price of each fuel. Table A2.1.17 reports these figures assuming a 25% emissionsreduction for compliance with existing regulations, while Table A2.1.18 incorporates a 10%emission reduction.
42

7/28/2019 ENVIRONMENTALLY RESPONSIBLE ENERGY PRICING
http://slidepdf.com/reader/full/environmentally-responsible-energy-pricing 60/138
TABLE A2.1.1: TOTAL BENEFITS DRAWN FROM SOURCE DOCUMENTS AND NET BENEFITS USED IN UNIT BENEFIT CALCULATIONS
POLLUTANT
TOTAL BENEFITS * % OF TOTAL % OF TOTAL NET BENEFIT AS
FOR 1986 AS RESULTING FROM ALLOCATED TO AN USED IN STUDY
DRAWN FROM TRANSPORTATION & IDENTIFIED ($ MILLIONS)
SOURCE DOCUMENT FUEL COMBUSTION - FUEL SOURCE~~
($ MILLIONS)
LOW
LEAD IN GASOLINE 8,566
PARTICULATE 1,461
SULFUR OXIDES 1,220
(EXCLUDING S04MORTALITY)
S04
MORTALITY 0
OZONE + 279
HIGH
8,686
72,206
1,820
1.00
0.46
0.85
1.00
0.43
0.83
LOW HIGH
8,566 8,686
631 31,193
1,011 1,509
109,230 0.85 0.83 0 90,552
6,007 0.55 0.48 133 2,865
* SOURCE: EPA 1985, EPA 1986a, EPA 1988, RFF 1 ALL BENEFITS NORMALIZED TO 1986.
- PERCENT OF TOTAL EMISSIONS ATTRIBUTABLE TO TRANSPORTATION AND STATIONARY SOURCE FUEL COMBUSTION IN EPA 1990.
--SAME AS PRIOR COLUMN ELIMINATING THE FOLLOWING CATEGORIES: RAILROADS, VESSELS, FARM MACHINERY, INDUSTRIAL MAC]
OTHER OFF-HIGHWAY VEHICLES, AND OTHER STATIONARY SOURCES.+ ASSUMES VOC's ACCOUNT FOR 75% OF OZONE FORMATION AND NOX ACCOUNTS FOR 25%.

7/28/2019 ENVIRONMENTALLY RESPONSIBLE ENERGY PRICING
http://slidepdf.com/reader/full/environmentally-responsible-energy-pricing 61/138
TABLE A2.1.2: ANNUAL BENEFIT OF COMPLIANCE WITH EXISTING REGULATIONS
NET BENEFIT($ MILLIONS)+
POLLUTANT LOW HIGH
LEAD 8,566 8,686
PARTICULATE 631 31,193
SULFUR OXIDES 1,011 1,509
S04 MORTALITY 0 90,552
OZONE** 133 2,865
+ FROM TABLE 1, FINAL TWO COLUMNS.
EMISSIONS INBASELINE YEAR*
(METRIC TONS)
32,600
9,100,000
23,400,000
23,400,000
20,175,000
qBASELINES DRAWN FROM BENEFITS SOURCE DOCUMENTS:LEAD, 1984; PARTICULATES, 1978; SULFUR OXIDES, 1980;OZONE, 1984.
q* SUM OF 75%OF VOC EMISSIONS AND 25% OF NOX EMISSIONS.
BENEFIT PERTON EMISSION
($ MILLION/TON)
LOW HIGH
262,775 266,429
69 3,428
43 64
0 3,870
7 142

7/28/2019 ENVIRONMENTALLY RESPONSIBLE ENERGY PRICING
http://slidepdf.com/reader/full/environmentally-responsible-energy-pricing 62/138

7/28/2019 ENVIRONMENTALLY RESPONSIBLE ENERGY PRICING
http://slidepdf.com/reader/full/environmentally-responsible-energy-pricing 63/138
TABLE A2.1.4: UNIT VALUE OF BENEFITS OF COMPLIANCE WITH EXISTING STANDARDS-BASE CASE “
BENEFITS SOURCE GASOLINE
LEAD IN GASOLINE 0.07362 - 0.07465
($ PER GAL)
PARTICULATE
7.91 - 8.02%
(% OF PRICE)
DIESEL AIRCR AFT FUEL COAL HEATING OILS NATURAL GAS WOOD TOTALS
0.07362
0.03141 - 0.06963 0.00366 - 0.18070 0.00115 - 0.05689 0.14264 - 7.04944 0.00073 - 0.03614 0.00031 - 0.01510
($ PER GAL)
1.54488 - 76.35152 1.69477
($ PER GAL) ($ PER GAL) ($ PER TON) ($ PER GAL) ($ PER 1000 CU FT) ($ PER TON)
0.15 - 7.48% 0.39 - 19.22% 0.18 - 8.85% 0.43 - 21.17% 0.11 - 5.25% 0.01 - 0.38% 2.50 - 123.59%
(% OF PRICE) (% OF PRICE) (% OF PRICE) (% OF PRICE) (% OF PRICE) (% OF PRICE) (% OF PRICE)
SULFUR OXIDES 0.(IY313 - 0.00019 0.00078 - 0.00116 0.00007 - 0.00010 1.15046 - 1.71626 0.00272 - 0.00406 0.00002 - 0.00003 0.00645 - 0.00962
EXCLUDING SO4 ($ PER GAL)1.16062
($ PER GAL) ($ PER GAL) ($ PER TON) ($ PER GAL) ($ PER 1000 CU FT) ($ PER TON)
MORTALITY
0.01 - 0.02% 0.08 - 0.1 2% 0.01 - 0.02’% 3.45 - 5.15% 0.40 - 0.59?? 0.00 - 0.00% 0.01 - 0.02%
(% OF PRICE) (% OF PRICE) (% OF PRICE) (% OF PRICE) (% OF PRICE) (% OF PRICE) (% OF PRICE)
SULFUR OXIDES 0.00000 - 0.01122 0.00000 - 0.06975 0.00000 - 0.00622 0.00000 - ####### 0.00000 - 0.24341 0.00000 - 0.00163 0.00000 - 0.57728 0.00000
SO4 MORTALITY ($ PER GAL) ($ PER GAL) ($ PER GAL) ($ PER TON) ($ PER GAL) ($ PER 1000 CU FT) ($ PER TON)
0.00 - 1.21% 0.00 - 7.42% 0.00 - 0.97% 0 .00 - 309.32% 0.00 - 35.38% 0.00 - 0.04% 0.00 - 0.93%
(% OF PRICE) (% OF PRICE) (% OF PRICE) (% OF PRICE) (% OF PRICE) (% OF PRICE) (% OF PRICE)
OZONE
VISIBILITY q **
0.00063 - 0.01362 0.00051 - 0.01121 0.00016 - 0.04)351 0.03128 - 0.67397 0.0000 . 0,03131 0.00067 - 0.01451 0.06229 - 1.34275
($ PER GAL)
0.09560
($ PER GAL) ($ PER GAL) ($ PER TON) ($ PER GAL) ($ PER 1000 CU FT) ($ PER TON)
0.07 - 1.46% 0.05 - 1.19% 0.02 - 0.55% 0.09 - 2.02?4 0.01 - 0.1 9% 0.02 - 0.37% 0.10 - 2.1 7%
(% OF PRICE) (% OF PRICE) (% OF PRICE) (% OF PRICE) (% OF PRICE) (% OF PRICE) (% OF PRICE)
AIR TOXICS FROM ““*
MOTOR VEHI CLES
q ALL VALUES NORMALIZED TO $ 1986.
0
q VISIBI LITY BENEFITS OF CUREENT REGULATIONS
INCLUDED IN SULFUR OXIDES CATEGORY.
q ** NO BENEFITS RESULTING FROM CURRENT REGULATIONS.

7/28/2019 ENVIRONMENTALLY RESPONSIBLE ENERGY PRICING
http://slidepdf.com/reader/full/environmentally-responsible-energy-pricing 64/138
Footnotes for Table A2.1.4.
* ALL VALUES NORMALIZED TO $1986.
** VISIBILITY BENEFITS OF CURRENT REGULATIONS INCLUDED IN SULFUR
OXIDES CATEGORY.
*** NO BENEFITS RESULTING FROM CURRENT REGULATIONS.
Sample Calculation for Particulates:
Total benefits from Table 1: $631 million (lower bound) to $31,193 million (upperbound). Percent of identifiable fuel related emissions from each fuel source: gasoline25.96%, diesel 11.36%, aircraft fuel 3.06% coal 17.35$%, heating oils 4.05%, natural gas0.78%, wood 37.43%. Source: EPA 1990.
Multiply total benefit by percent of emissions from each fuel source divided byvolume of each fuel consumed in 1986 (from Table 5) to find unit benefit (e.g. benefit pergallon).
For gasoline: $631 million X 0.2596 / 116,354,196,000 gallons equals $0.0014 pergallon.
To find unit benefit as a percent of price, divide unit benefit by unit price (fromTable 5) and multiply by 100.
For gasoline: $0.0014 / $0.931 X 100 equals 0.15 percent of the unit price of gasoline.

7/28/2019 ENVIRONMENTALLY RESPONSIBLE ENERGY PRICING
http://slidepdf.com/reader/full/environmentally-responsible-energy-pricing 65/138
TABLE A2.1.5: FUEL CONSUMPTION AND PRICE DATA USED IN UNIT BENEFIT CALCULATIONS
FUEL TYPE CONSUMPTION (1986) PRICE (1986)
GASOLINE 116,354,196,000 GALS $0.931 PER GAL
DIESEL 19,625,760,000 GALS $0.940 PER GAL
AIRCRAFT 16,805,124,000 GALS $0.643 PER GAL
COAL 768,300,000 SH T TONS $33.300 PER SHT TON
HEATING OILS 34,979,448,000 GALS $0.688 PER GAL
NATURAL GAS 16,221,296,000 1000 FT**3 $3.960 PER 1000 FT q *3
WOOD 153,000,000 SHT TONS $61.780 PER SHT TON
SOURCE: CONSUMPTION DATA FOR GASOLINE, DIESEL,AIRCRAFT FUEL, NATURAL
GAS, AND HEATING OIL FROM BASIC PETROLEUM DATA BOOK. HEATING OIL ADJUSTED
TO INCLUDE ONLY NONTRANSPORTATION FUEL USES. COAL AND WOOD FROM AER 1987.
PRICES FOR GAS FROM MONTHLY ENERGY REVIEW, AUGUST, 1990. DIESEL
FUEL FROM INTERNATIONAL ENERGY ANNUAL, 1986. COAL FROM AER 1987.AIRCRAFT
FUEL AND FUEL OILS PRICES ARE WEIGHTED AVERAGES CALCULATED AS DESCRIBED IN
SECTION III.B WOOD PRICE FROM EPA 1986b, WEIGHTED BY 1986 REGIONAL
POPULATION WEIGHTS.

7/28/2019 ENVIRONMENTALLY RESPONSIBLE ENERGY PRICING
http://slidepdf.com/reader/full/environmentally-responsible-energy-pricing 66/138
TABLE A2.1 .6 UNIT VALUE OF BENEFITS OF COMPLIANCE WITH EXISTING STANDARDS-MODIFIED UPPER BOUND “
BENEFITS SOURCE
LEAD I N GASOLINE
GASOLINE DIESEL AIRCRAFT FUEL COAL HEATING OIL NATURAL GAS WOOD
0.0736 - 0.0746
($ PER GAL)
7.91 - 8.02%(% OF PRICE)
0.0007 - 0.0361
($ PER GAL)
0.0003 - 0.0151
($ PER 1000 CU FT)
1.5449 - 76.3515
($ PER TON)PARTICULATE 0.0014 - 0.0696
($ PER GAL)
0.0037 - 0.1807
($ PER GAL)
0.0012 - 0.0569
($ PER GAL)
0.1426 - 7.0494
($ PER TON)
0.11 - 5.25%(% OF PRICE)
0.01 - 0.38%(% OF PRICE)
2.50 . 123.59?4(% OF PRICE)
0.15 - 7.48%(% OF PRICE)
0.39 - 19.22%(% OF PRICE)
0.18 - 8.85%(% OF PRICE)
0.43 - 21.17%(% OF PRICE)
SULFUR OXIDESEXCLUDING S04MORTALITY
0.0001 - 0.0002
($ PER GAL)
0.0008 - 0.0012
($ PER GAL)
0.0001 - 0.0001($ PER GAL)
1.1505 - 1.7163
($ PER TON)0.0027 - 0.0041
($ PER GAL)
0.0000 - 0.0000
($ PER 1000 CU Ft)
0.0064 - 0.0096
($ PER TON)
0.01 - 0.02%
(% OF PRICE)
0.08 - 0.1 2%
(% OF PRICE)0.01 - 0.02%
(% OF PRICE)
3.45 - 5.15%(% OF PRICE)
0.40 - 0.59%
(% OF PRICE)0.06 - 0.00%
(% OF PRICE)0.01 - 0.0%
(% OF PRICE)
0.0000 - 0.0030
($ PER GAL)
0.0000 - 0.0184($ PER GAL)
0.0000 - 0.0016
($ PER GAL)
0.0000 - 27.1772($ PER TON)
0.0000 - 0.0642
($ PER GAL)
0.0000 - 0.0004
($ PER 1000 CU FT)0.0000 - 0.1523
($ PER TON)
SULFUR OXIDES
S04 MORTALITY
0.00 - 0.32%(% OF PRICE)
0.00 - 1.96%
(% OF PRICE)0.00 - 0.26%
(% OF PRICE)0.00 - 81.61%(% OF PRICE)
0.00 - 9.33%
(% OF PRICE)
0.00 - 0.01%
(% OF PRICE)
0.00 - 0.25%(% OF PRICE)
OZONE 0.0306 - 0.0136($ PER GAL)
0.0005 - 0.0112
($ PER GAL)
0.0002 - 0.0035
($ PER GAL)
0.0313 - 0.6740
($ PER TON)0.0301 - 0.0013
($ PER GAL)
0.0007 - 0.0145
($ PER 1000 CU FT)
0.0623 - 1.3427
($ PER TON)
0.07 - 1.46%
(% OF PRICE)
0.05 - 1.19%
(% OF PRICE)
0.02 - 0.55%
(% OF PRICE)
0.09 - 2.0294
(% OF PRICE)
0.01 - 0.19%
(% OF PRICE)
0.02 - 0.37%
(% OF PRICE)
0.10 - 2.17%
(% OF PRICE)
VISIBILITY ““”
AIR TOXICS FROM ““”MOTOR VEHICLES
q ALL VALUES NORMALIZED TO $1986.
q C VISIBILITY BENEFITS OF CURRENT REGULATIONS
lNCLUDED IN SULFUR OXIDES CATEGORY.
q *o NO BENEFITS RESULTING FROM CURRENT REGULATIONS.

7/28/2019 ENVIRONMENTALLY RESPONSIBLE ENERGY PRICING
http://slidepdf.com/reader/full/environmentally-responsible-energy-pricing 67/138
Footnotes for Table A2.1.6.
* MODIFIED UPPER BOUND INCORPORATES SO4 MORTALITY RISKESTIMATE
FROM EVANS, ET AL. 1984 AS UPPER BOUND RISK LEVEL FOR
MORTALITY FROM EXPOSURE TO SO4.
ALL VALUES NORMALIZED TO 1986.
** VISIBILITY BENEFITS OF CURRENT REGULATIONS INCLUDED IN SULFUROXIDES CATEGORY.
*** NO BENEFITS RESULTING FROM CURRENT REGULATIONS.
For Sample Calculations, see Table 4.

7/28/2019 ENVIRONMENTALLY RESPONSIBLE ENERGY PRICING
http://slidepdf.com/reader/full/environmentally-responsible-energy-pricing 68/138
TABLE A2.1.7: UNIT VALUE OF BENEFITS OF EMISSION REDUCTION TO ZERO FOLLOWING COMPLIANCE WITH CURRENT STANDARDS
TS SOURCE
N GASOLINE
ULATE
OXIDES
UDING SO4ALITY
OXIDES
MORTALITY
ITY
ICS FROM
R VEHICLES
GASOLINE
0.0104 - 0.0112
($ PER GAL)
1.12 - 1.20%
(% OF PRICE)
0.0042 - 0.1619($ PER GAL)
0.45 - 17.39%
( % OF PRICE)
0.0004 - 0.0006
($ PER GAL)
0.04 - 0.06%
(% OF PRICE)
0.0000 - 0.0338
($ PER GAL)
0.00 - 3.63%
(% OF PRICE)
0.0019 - 0.0409
($ PER GAL)
0.20 - 4.39%
(% OF PRICE)
0.0003 - 0.0013
($ PER GAL)
0.04 - 0.14%
(% OF PRICE)
0.0060 - 0.0386
($ PER GAL)
0.65 - 4. 14%
(% OF PRICE)
ALUES NORMALIZED TO $1986.
0.0110 - 0.4202($ PER GAL)
1.17 - 44.70%
(% OF PRICE)
0.0023 - 0.0035
($ PER GAL)
0.25 - 0.37%
(% OF PRICE)
0.0000 - 0.2087
($ PER GAL)
0.00 - 22.20%
(% OF PRICE)
0.0015 - 0.0336
($ PER GAL)
0.16 - 3.58%
(% OF PRICE)
0.0020 - 0.0082
($ PER GAL)
0.22 - 0.87%
(% OF PRICE)
BASE CASE, ASSUMING 25?4 EMISSION REDUCTION q
0.0423 - 0.2138
($ PER GAL)
4.50 - 22.75%
(% OF PRICE)
AIRCRAFT FUEL
0.0035 - 0.1322($ PER GAL)
0.54 - 20.56%(% OF PRICE)
0.0002 - 0.0003
($ PER GAL)
0.03 - 0.05%
(% OF PRICE)
0.0000 - 0.0182
($ PER GAL)
0.00 - 2.84%
(% OF PRICE)
0.0005 - 0.0105
($ PER GAL)
0.07 - I .64%
(% OF PRICE)
0.0002 - 0.0007
($ PER GAL)
0.03 - 0.11%
(% OF PRICE)
COAL
0.4278 - 16.3860($ PER SHT TON)
1.28 - 49.21%(% OF PRICE)
3.4518 - 5.1493
($ PER SHT TON)
10.37 - 15.46%(% OF PRICE)
0.0000 - 309.0251($ PER SHT TON)
0.00 - 928.00%(% OF PRICE)
0.0938 - 2.0219
($ PER SHT TON)
0.28 - 6.07%
(% OF PRICE)
3.0176 - 12.0704
($ PER SHT TON)
9.06 - 36.25%
(% OF PRICE)
HEATDIG OILS NATURAL GAS
0.0022 - 0.0841($ PER GAL)
0.32 - 12.23%
(% OF PRICE)
0.0082 - 0.0122
($ PER GAL)
1.19 - 1 .77%
(% OF PRICE)
0.0000 - 0.7305
($ PER GAL)
0.00 - 106.18%(% OF PRICE)
0.0002 - 0.0039
($ PER GAL)
0.03 - 0.57%
(% OF PRICE)
0.0071 - 0.0285
($ PER GAL)
1.04 - 4.15%
(% OF PRICE)
0.0009 - 0.0353($ PER 1000 CU FT)
0.02 - 0.s9%(% OF PRICE)
0.0001 - 0.0001
($ PER 1000 CU FT)
0.00 - 0.00%(% OF PRICE)
0.0000 - 0.0052
($ PER 1000 CU FT)
0.00 - 0.13%(% OF PRICE)
0.0020 - 0.0435
($ PER 1000 CU FT)
0.05 - 1.10%
(% OF PRICE)
0.000o - 0.0002
($ PER 1000 CU FT)
0.00 - 0.00%
(’% OF PRICE)
WOOD
4.6346 - 177.5229($ PER SHT TON)
7.50 - 287.35%
(% OF PRICE)
0.0203 - 0.0301
($ PER SH T TON)
0.03 - 0.05%
(% OF PRICE)
0.0000 - 1.8216
($ PER SHT TON)
0.00 - 2.95%(% OF PRICE)
0.1869 - 4.0282
($ PER SHT TON)
0.30 - 6.52%
(% OF PRICE)
0.0170 - 0.0680
($ PER SHT TON)
0.03 - 0.11%
(% OF PRICE)

7/28/2019 ENVIRONMENTALLY RESPONSIBLE ENERGY PRICING
http://slidepdf.com/reader/full/environmentally-responsible-energy-pricing 69/138
Footnotes for Table A2.1.7.
* ASSUMES STRICT COMPLIANCE WITH EXISTING STANDARDS FORPARTICULATE, SULFUR OXIDES, AND OZONE ACHIEVE A 25%REDUCTION IN TOTAL EMISSIONS OF EACH POLLUTANT.
ALL VALUES NORMALIZED TO $1986.
Sample Calculation for Particulate from Gasoline:
Using unit benefits from Table 4, multiply unit benefit times ratio of emissionsremaining to emissions reduced due to strict compliance with existing regulations.
For particulate from gasoline: $0.0014 (lower bound of unit benefit from Table 4)X (0.75 of emissions remaining /0.25 of emissions reductions achieved) equals $0.0042 pergallon of gasoline.
To find unit benefits as a percent of unit price, divide unit benefit by unit price (fromTable 5) and multiply by 100.
For gasoline: $0.0042 /$0.931 X 100 equals 0.45% of the unit price of gasoline.

7/28/2019 ENVIRONMENTALLY RESPONSIBLE ENERGY PRICING
http://slidepdf.com/reader/full/environmentally-responsible-energy-pricing 70/138
TABLE A2.1.8: UNIT VALUE OF BENEFITS OF EMISSION REDUCTION TO ZERO FOLLOWING COMPLIANCE WITH CURRENT STANDARDSBASE CASE, ASSUMING 10% EMISSION REDUCTION q
DIESEL AIRCRAFT FUEL COAL HEATING OILS NATURAL GAS WOODTS SOURCE
GASOLINE
GASOLINE
0.0104 - 0.0112
($ PER GAL)
1.12 - 1.20%
(% OF PRICE)
ULATES 0.0127 - 0.6267
($ PER GAL)
0.0329 - 1.6263
($ PER GAL)
0.0104 - 0.5120
($ PER GAL)
1.2837 - 63.4449
($ PER SHT TON)
0.0066 - 0.3252
($ PER GAL)
0.0027 - 0.1359
($ PER 1000 CU FT)
13.9039 - 687.1636
($ PER SHT TON)
1.36 - 67.31%
(% OF PRICE)
3.50 - 173.01%(% OF PRICE)
1.61 - 79.62%
(% OF PRICE)3.86 - 190.53%
(% OF PRICE)0.% - 47.27%
(% OF PRICE)0.07 - 3.43%
(% OF PRICE)22.51 - 1112.28%
(% OF PRICE)
OXIDESDING S04
ALITY
0.0011 - 0.0017
($ PER GAL)
0.0070 - 0.0105
($ PER GAL)
0.0006 - 0.0009
($ PER GAL)10.3541 - 15.4463
($ PER SHT TON)
0.0245 - 0.0365
($ PER GAL)
0.0002 - 0.0002
($ PER 1000 CU FT)
0.0580 - 0.0865
($ PER SHT TON)
0.12 - 0. 18%
(% OF PRICE)
0.75 - 1.11%
(% OF PRICE)0.10 - 0.1 5%
(% OF PRICE)31.09 - 46.3%
(% OF PRICE)3.56 - 5.31%
(% OF PRICE)
0.00 - 0.01%
(% OF PRICE)0.09 - 0.14%
(% OF PRICE)
R OXIDES
ORTALITY 0.0000 - 0.1010
($ PER GAL)
0.0000 - 0.6277
($ PER GAL)
0.0000 - 0.0560
($ PER GAL)
0.0000 - 927.0333
($ PER SHT TON)
0.0000 - 2.1907
($ PER GAL)
0.0000 - 0.0147
($ PER 1000 CU FT)
0.000 - 5.1955
($ PER SHT TON)
0.00 - 0.37%
(% OF PRICE)
0.00 - 10.85%
(% OF PRICE)0.00 - 66.78%
(% OF PRICE)0.00 - 8.71%
(% OF PRICE)
0.00 - 2783.88%
(% OF PRICE)
0.00 - 318.42%
(% OF PRICE)0.00 - 8.41%
(% OF PRICE)
0.0061 - 0.1306($ PER 1000 CU FT)
0.5606 - 12.0847($ PER SHT TON)
0.0057 - 0.1226($ PER GAL)
0.0046 - 0.1009($ PER GAL)
0.0014 - 0.0316($ PER GAL)
0.2815 - 6.0657($ PER SHT TON)
0.0005 - 0.0117($ PER GAL)
0.15 - 3.30%
(% OF PRICE)
0.91 - 19.56%
(% OF PRICE)0.61 - 13.16%
(% OF PRICE)
0.45 - 10.73%
(% OF PRICE)0.22 - 4.91%
(% OF PRICE)0.85 - 18.22%
(% OF PRICE)0.08 - 1.71%
(% OF PRICE)
TY 0.0003 - 0.0013
($ PER GAL)
0.0020 - 0.0082
($ PER GAL)
0.0002 - 0.0007
($ PER GAL)
3.0176 - 12.0704
($ PER SHT TON)
0.0071 - 0.0285
($ PER GAL)0.0000 - 0.0002
($ PER 1000 CU FT)
0,0170 - 0.0680
($ PER SHT TON)
0.04 - 0.14%
(% OF PRICE)0.22 - 0.87%
(% OF PRICE)0.03 - 0.11%
(% OF PRICE)9.06 - 36.25%
(% OF PRICE)
1.04 - 4.15%
(% OF PRICE)0.00 - 0.00%
(% OF PRICE)0.03 - 0.11%(% OF PRICE)
XICS FROM
R VEHICLES0.0060 - 0.0386
($ PER GAL)
0.0423 - 0.2138
($ PER GAL)
0.65 - 4 .14%
(% OF PRICE)
4.50 - 22.75%
(% OF PRICE)
ALUES NORMALIZED TO $ 1986.

7/28/2019 ENVIRONMENTALLY RESPONSIBLE ENERGY PRICING
http://slidepdf.com/reader/full/environmentally-responsible-energy-pricing 71/138
TABLE A2. 1. 9 UNIT VALUE OF BENEFITS OF EMISSION REDUCTION TO ZERO FOLLOWING COMPLIANCE WITH CURRENT STANDARDS
MODIFIED UPPER BOUND, ASSUMING 25% EMISSION REDUCTION q
DIESEL AIRCRAFT FUEL COAL HEATING OILS NATURAL GAS WOODBENEFITS SOURCE GASOLINE
LEAD IN GASOLINE 0.0104 - 0.0112
($ PER GAL)
1.12 - 1.20%(% OF PRICE)
PARTICULATE 0.0042 - 0.1619
($ PER GAL)
0.0110 - 0.4202 0.0035 - 0.1322 0.4278 - 16.3860 0.0022 - 0.0841 0.0009 - 0.0353
($ PER GAL) ($ PER GAL) ($ PER SHT TON) ($ PER GAL) ($ PER 1000 CU FT)
4.6346 - 177.5229
($ PER SHT TON)
0.45 - 17.39%
(% OF PRICE)1.17 - 44.70% 0.54 - 20.56% 1.28 - 49.21% 0.32 - 12.23% 0.02 - 0.89%
(% OF PRICE) (% OF PRICE) (% OF PRICE) (% OF PRICE) (% OF PRICE)7.50 - 287.35%
(% OF PRICE)
SULFUR OXIDES 0.0004 - 0.0006
EXCLUDING SO4 ($ PER GAL)MORTALITY
0.04 - 0.06%
(% OF PRICE)
0.0023 - 0.0035 0.0002 - 0.0003 3.4518 - 5.1493 0.0082 - 0.0122 0.0001 - 0.0001
($ PER GAL) ($ PER GAL) ($ PER SHT TON) ($ PER GAL) ($ PER 1000 CU FT)
0.0203 - 0.0301
($ PER SHT TON)
0.25 - 0.37% 0.03 - 0.05% 10.37 - 15.46% 1.19 - I .77% 0.00 - 0.00’%
(% OF PRICE) (% OF PRICE) (% OF PRICE) (% OF PRICE) (% OF PRICE)0.03 - 0.05’%
(% OF PRICE)
SULFUR OXIDES 0.0000 - 0.0089
S04 MORTALITY ($ PER GAL)0.0000 - 0. 05 52 0 .0 00 0 - 0.0049 0.0000 - 8 1. 53 17 0 .0 00 0 - 0. 19 27 0 .0 00 0 - 0.0013
($ PER GAL) ($ PER GAL) ($ PER SHT TON) ($ PER GAL) ($PER 1000 CU FT)
0.0000 - 0.4569
($ PER SHT TON)
0.00 - 0.95%
(% OF PRICE)
0.00 - 5.87% 0.00 - 0.77% 0.00 - 244.84% 0.00 - 28.00% 0.00 - 0.03%
(% OF PRICE) (% OF PRICE) (% OF PRICE) (% OF PRICE) (% OF PRICE)0.00 - 0.74%
(% OF PRICE)
0.0015 - 0.0336 0.0005 - 0.0105 0.0938 - 2.0219 0.0002 - 0.0039 0.0020 - 0.0435
($ PER GAL) ($ PER GAL) ($ PER SHT TON) ($ PER GAL) ($ PER 1000 CU FT)
0.1869 - 4.0282
($ PER SHT TON)OZONE 0.0019 - 0.0409
($ PER GAL)
0.20 - 4.39??
(% OF PRICE)
0.16 - 3.58% 0.07 - 1.64% 0.28 - 6.07% 0.03 - 0.57% 0.05 - I.1O%(% OF PRICE) (% OF PRICE) (% OF PRICE) (% OF PRICE) (% OF PRICE)
0.30 - 6.52%
(% OF PRICE)
VISIBILITY 0.0003 - 0.0013
($ PER GAL)
0.0020 - 0.0082 0.0002 - 0.0007 3.0176 - 12.0704 0.0071 - 0.0285 0.0000 -
($ PER GAL)
0.0002
($ PER GAL) ($ PER SHT TON) ($ PER GAL) ($ PER 1000 CU FT)
0.0170 - 0.0680
($ PER SHT TON )
0.04 - 0.14%
(% OF PRICE)
0.22 - 0.87% 0.03 - 0.11% 9.06 - 36.25% 1.04 - 4.15% 0.00 - 0.00%(% OF PRICE) (% OF PRICE) (% OF PRICE) (% OF PRICE) (% OF PRICE)
0.03 - 0.11%
(% OF PRICE)
AIR TOXICS FROM 0.0060 - 0.0386
MOTOR VEHICLES ($ PER GAL)0.0423 - 0.2138
($ PER GAL)
0.65 - 4.14%
(% OF PRICE)
q ALL VALUES NORMALIZED TO $ 1986.
4.50 - 22.75%
(% OF PRICE)

7/28/2019 ENVIRONMENTALLY RESPONSIBLE ENERGY PRICING
http://slidepdf.com/reader/full/environmentally-responsible-energy-pricing 72/138
TABLE A2.1 .10: UNIT VALUE OF BENEFITS OF EMISSION REDUCTION TO ZERO FOLLOWING COMPLIANCE WITH CURRENT STANDARDSMODIFIED UPPER BOUND, ASSUMING 10% EMLSS1ON REDUCTION q
BENEFITS SOURCE GASOLINE DIESEL AIRCRAFT FUEL COAL HEATING OILS NATURAL GAS
LEAD IN GASOLINE $0.0104 - $0.0112
($ PER GAL)
1.12 - 1.20%(% OF PRICE)
PARTICULATES $0.0127 - $0.6267 $0.0329 - $1.6263
$0.0104 - $0.5120$1.2837 - $63.4449 $0.0066 - $0.3252
($ PER GAL)
$0.0027 - S0.1359$13.9039 - S687.1636($ PER GAL) ($ PER GAL) ($ PER SHT TON) ($ PER GAL) ($ PER 1000 CU FT) ($ PER SHT TON)
1.36 - 67.31% 3.50 - 173.01% 1.61 - 79.62% 3.86 - 190.53% 0.96 - 47.27% 0.07 - 3.43% 22.51 - 1 I 12.28%
(% OF PRICE) (% OF PRICE) (% OF PRICE) (% OF PRICE) (% OF PRICE) (% OF PRICE) (% OF PRICE)
SULFUR OXIDES $0.001 1 - $0.0017 $0.0070 - $0.0105 $0.0006 - $0.0009 $10.3541 - $15.4463 $0.0245 - $0.0365 $0.0002 - $0.0002
EXCLUDING SO4 ($ PER GAL) ($ PER GAL)
$0.0580 -($ PER GAL)
$0.0865
($ PER SHT TON) ($ PER GAL) ($ PER 1000 CU FT) ($ PER SHT TON)
MORTALITY
0.12 - 0.18% 0.75 - 1.11% 0.10 - 0.15% 31.09 - 46.39% 3.56 - 5.31% 0.00 - 0.01% 0.09 - 0.14%
(% OF PRICE) (% OF PRICE) (% OF PRICE) (% OF PRICE) (% OF PRICE) (% OF PRICE) (% OF PRICE)
SULFUR OXIDES $0.0000 - S0.0266 $0.0000 - $0.1656 $0.0000 - $0.0148 $0.0000 - $244.5949 $0.0000 - $0.5780 $0.0000 - $0.0039
SO4 MORTALITY ($ PER GAL) ($ PER GAL) ($ PER GAL)$0.0000 - $1.3708
($ PER SHT TON) ($ PER GAL) ($ PER 1000 CU FT) ($ PER SHT TON)
0.00 - 2.86% 0.00 - 17.62% 0.00 - 2.30% 0.00 - 734.52% 0.00 - 84.01% 0.00 - 0.10% 0.00 - 2.22%
(% OF PRICE) (% OF PRICE) (% OF PRICE) ( % OF PRICE) (% OF PRICE) (% OF PRICE) (% OF PRICE)
OZONE
VISIBILITY
$0.0057 - $0.1226 $0.0046 - $0.1009 $0.0014 - $0.0316 $0.2815 - $6.0657 $0.0005 - $0.0117 $0.0061 - $0.1306 $0.5606 - $12.0847
($ PER GAL) ($ PER GAL) ($ PER GAL) ($ PER SHT TON) ($ PER GAL) ($ PER 1000 CU FT) ($ PER SHT TON)
0.61 - 13.16% 0.48 - 10.73% 0.22 - 4.91% 0.85 - 18.22% 0.08 - 1.71% 0.15 - 3.30% 0.91 - 19.56%
(% OF PRICE) (% OF PRICE) (% OF PRICE) (% OF PRICE) (% OF PRICE) ((% OF PRICE) (% OF PRICE)
$0.0003 - $0.0013 $0.0020 - S0.0082 $0.0002 - $0.0007 $3.0176 - $12.0704 $0.0071 - $0.0285 $0.0000 - $0.0002
($ PER GAL) ($ PER GAL)$0.0170 -
($ PER GAL) ($ PER SHT TON)$0.0680
($ PER GAL) ($ PER 1000 CU FT) ($ PER SHT TON)
0.04 - 0.14% 0.22 - 0.87% 0.03 - 0.11% 9.06 - 36.25% 1.04 - 4.1 5% 0.00 - 0.00% 0.03 - 0.11%(% OF PRICE) (% OF PRICE) (% OF PRICE) (% OF PRICE) (% OF PRICE) (% OF PRICE) (% OF PRICE)
AIR TOXICS FROM $0.0060 - $0.0386 $0.0423 - $0.2138
MOTOR VEHICLES ($ PER GAL) ($ PER GAL)
0.65 - 4.14% 4.50 - 22.75%(% OF PRICE) (% OF PRICE)
q ALL VALUES NORMALIZED TO $ 1986.

7/28/2019 ENVIRONMENTALLY RESPONSIBLE ENERGY PRICING
http://slidepdf.com/reader/full/environmentally-responsible-energy-pricing 73/138
TS SOURCE GASOLINE
N GASOLINE
ULATES
OXIDES
UDING S04ALITY
R OXIDESORTALITY
ITY
TABLE A2.1.11: UNIT BENEFIT VALUE OF SELECTED CLEAN AIR ACT AMENDMENTS EMISSIONS TARGETS
DIESEL AIR CRA FT FUEL COAL HEATING OILS NATURAL GAS
$2.1164 - $3.1576 $0.0019 - $0.0276($ PER SHT TON) ($ PER GAL)
6.36 - 9.48% 0.27 - 4.01%
(% OF PRICE) (% OF PRICE)
$0.0000 -$189.4833 $0.0000 - $0.1658($ PER SHT TON) ($ PER GAL)
0.00 - 569.02% 0.00 - 24.09%
(% OF PRICE) (% OF PRICE)
WOOD
$0.0012 -$0.0258 $0.0003 - $0.0058 $0.0003 - $0.0073
($ PER GAL)$0.0021 - $0.0451 $0.0001 - $0.0020 $0.0001 - $0.0027
($ PER GAL)$0.1484 - $3.1955
($ PER GAL) ($ PER SHT TON) ($ PER GAL) ($ PER 1000 CU FT) ($ PER SHT TON)
0.13 - 2.75% 0.03 - 0.62% 0.05 - 1.13% 0.01 - 0. 14% 0.01 - 0.29% 0.00 - 0.07%
(% OF PRICE)
0.24 - 5. 17%
(% OF PRICE) (% OF PRICE) (% OF PRICE) (% OF PRICE) (% OF PRICE) (% OF PRICE)
$1.3875 - $5.5512 $0.0012 - $0.0049($ PER SHT TON) ($ PER GAL)
4.17 - 16.67% 0.17 - 0 . 715
(% OF PRICE) (% OF PRICE)
XICS FROM
R VEHICLES
ALUESNORMALIZED TO $ 1986.

7/28/2019 ENVIRONMENTALLY RESPONSIBLE ENERGY PRICING
http://slidepdf.com/reader/full/environmentally-responsible-energy-pricing 74/138
Footnotes for Table A2.1.11.
* ALL VALUES NORMALIZED TO $1986.
+ ASSUMES SULFUR DIOXIDE EMISSIONS FROM ELECTRIC UTILITIES WILLBE REDUCED BY 10 MILLION TONS ANNUALLY. EMISSION REDUCTIONSALLOCATED BETWEEN COAL AND HEATING OILS BASED UPON
PROPORTIONOF ELECTRIC UTILITY OUTPUT FROM EACH SOURCE. UNIT BENEFITSCALCULATED AS IN TABLE 4 fn.
AASSUMES OZONE POLLUTION REDUCED BY 10 MILLION TONS ANNUALLY.ASSUMES THAT VOCS ACCOUNT FOR 100 PERCENT OF OZONE FORMATION.UNIT BENEFITS CALCULATED AS IN TABLE 4 fn.

7/28/2019 ENVIRONMENTALLY RESPONSIBLE ENERGY PRICING
http://slidepdf.com/reader/full/environmentally-responsible-energy-pricing 75/138
Footnotes for Table A2.1.11.
* ALL VALUES NORMALIZED TO $1986.
+ ASSUMES SULFUR DIOXIDE EMISSIONS FROM ELECTRIC UTILITIES WILLBE REDUCED BY 10 MILLION TONS ANNUALLY. EMISSION REDUCTIONSALLOCATED BETWEEN COAL AND HEATING OILS BASED UPON
PROPORTIONOF ELECTRIC UTILITY OUTPUT FROM EACH SOURCE. UNIT BENEFITSCALCULATED AS IN TABLE 4 fn.
“ ASSUMES OZONE POLLUTION REDUCED BY 10 MILLION TONS ANNUALLY.ASSUMES THAT VOCS ACCOUNT FOR 100 PERCENT OF OZONE FORMATION.UNIT BENEFITS CALCULATED AS IN TABLE 4 fn.

7/28/2019 ENVIRONMENTALLY RESPONSIBLE ENERGY PRICING
http://slidepdf.com/reader/full/environmentally-responsible-energy-pricing 76/138
Fuel Tvoe
Gasoline
Diesel fuel
Aircraft fuel
Natural gas
coal
Fuel oil
Table A2.1.12
Taxes Per Unit of Fuel Consumption
Total taxesper Fuel Type(in $ billions)
26.871
5.002
1.713
4.114
10.175
4.726
Note: All figures are in 1986 dollars.
Taxes perUnit of Fuel
.2309 /gallon
.2548/gallon
.1019 /gallon
.2536/1000 cu ft
12.6445/short ton
.1009/gallon
Taxes as aPercent of of Price
24.91
27.14
15.53
6.40
37.97
12.07
lIncludes Federal, state, and local excises, state severence taxes (allocated), windfall
profits tax (allocated), and Superfund tax (allocated).
2Includes Federal, state, and local excises, state severance taxes (allocated), windfall
profits tax (allocated), and Superfund tax (allocated).
3Includes state and local excises, state severance taxes (allocated), windfall profits tax
(allocated), and Superfund tax (allocated).
4
Includes state severance taxes, and city and county utility taxes. Excludes stateutility taxes. Total for all state utilities over $6 billion.
5Includes state severance taxes, black lung tax, and city and county utility taxes
(allocated). Excludes state utility taxes. Total for all utilities over $6 billion.
6Includes city and county utility taxes (allocated), state severance taxes (allocated),
windfall profits tax (allocated), and Superfund tax (allocated). Excludes state utilitytaxes. Total for all utilities over $6 billion.

7/28/2019 ENVIRONMENTALLY RESPONSIBLE ENERGY PRICING
http://slidepdf.com/reader/full/environmentally-responsible-energy-pricing 77/138
Table A2.1.13
Taxes Per Unit of Fuel Consumption Net of TaxesEarmarked for Specific Programs
+
Net Taxes* Net Taxesper Fuel Type per
Fuel Type (in $billions) Unit of Fuel
Gasoline 17.98 .1545/gal
Diesel Fuel 2.38 .1213/gal
Aircraft Fuel 1.71 .1016/gal
Heating Oil 4.70 .1005/gal
Natural gas 4.11 .2536/cu.ft.
Coal 9.61 11.9458/ton
Taxes asa Percentof Price
16.60
12.90
15.49
14.61
6.40
35.87
Net TaxPer
Million BTU
$1.24
0.87
0.76
0.93
0.58
0.25
q Excludes taxes designated for Federal Highways Trust Fund, Superfund Tax, and Black
Lung Tax. Some state and local tax revenues may be designated for specific uses but arenot excluded from this table.
+ All figures are for tax year 1986 in 1986 dollars.

7/28/2019 ENVIRONMENTALLY RESPONSIBLE ENERGY PRICING
http://slidepdf.com/reader/full/environmentally-responsible-energy-pricing 78/138
TABLE A2.1 .14: RELATIVE CARBON TAXES, ASSUMING 25% EMISSION REDUCTION
EXTERNALITY COST
POUNDS C02 PER UNIT ++
EMISSION PER
FUEL TYPE UNIT FUEL+ LOW MIDPOINT
GASOLINE (GALS) 5.48 $0.10 $0.28
DIESEL (GALS) 6.31 $0.06 $0.61
AIRCRAFT FUEL (GALS) NA $0.01 $0.12
COAL (SHT TONS) 1,219.02 $8.32 $232.71
HEATING OILS (GALS) 6.67 $0.02 $0.58
NATURAL GAS 32.85 $0.00 $0.06
(1000 FT**3)
WOOD (SHT TONS) NA $6.47 $134.11
+ SOURCE: C02 EMISSIONS FOR EACH FUEL FROM MARLAND 1983.
CONVERTED TO POUNDS C02 EMISSION PER UNIT FUEL BASED UPON
CONVERSION FACTORS IN “MONTHLY ENERGY REVIEW,” JANUARY 1987.
++ FROM SUMMING DOWN THE COLUMNS OF TABLES 4 AND 7.
** MODIFIED UPPER BOUND DIVIDED BY CARBON CONTENT, SCALED WITH
HIGH
$0.46
$1.15
$0.23
$457.10
$1.14
$0.12
$261.75
RELATIVE
CARBON TAX**
27.89
52.88
NA
104.87
47.99
1.00
NA
NATURAL GAS EQUAL TO ONE BY DIVIDING THE CARBON TAX FOR EACH FUEL
TYPE BY THE CARBON TAX FOR NATURAL GAS.

7/28/2019 ENVIRONMENTALLY RESPONSIBLE ENERGY PRICING
http://slidepdf.com/reader/full/environmentally-responsible-energy-pricing 79/138
TABLE A2.1.15: GROSS VALUE OF BENEFITS BY FUEL-ASSUMING 2 5 % EMISSION REDUCTION
GROSS BENEFIT OF COMPLIANCE GROSS BENEFIT OF REDUCTION
WITH CURRENT REGULATIONS q TO ZERO+
TOTAL BENEFIT ($ MILLIONS) TOTAL BENEFIT ($ MILLIONS)
FUEL SOURCE LOW HIGH LOW HIGH
GASOLINE 8,818.5 19,699.6 2,708.9 33,528.8
DIESEL 97.0 5,157.9 1,161.0 17,427.6
AIRCRAFT FUEL 23.2 1,121.3 72.6 2,722.9
COAL 1,017.5 86,390.2 5,371.2 264,796.7
HEATING OILS 122.8 9,966.0 618.0 30,056.5
NATURAL GAS 16.2 507.2 49.4 1,367.1
WOOD 246.9 11,977.0 743.4 28,071.0
* THE SUM FOR EACH FUEL TYPE OF THE UNIT BENEFIT VALUES FROM
TABLE 4 MULTIPLIED BY FUEL CONSUMPTION FROM TABLE 5.
+ THE SUM FOR EACH FUEL TYPE OF THE UNIT BENEFIT VALUES FROMTABLE 7 MULTIPLIED BY FUEL CONSUMPTION FROM TABLE 5.

7/28/2019 ENVIRONMENTALLY RESPONSIBLE ENERGY PRICING
http://slidepdf.com/reader/full/environmentally-responsible-energy-pricing 80/138
TABLE A2.1.16: GROSS VALUE OF BENEFITS BY FUEL-ASSUMING 10% EMISSION REDUCTION
GROSS BENEFIT OF COMPLIANCE GROSS BENEFIT OF REDUCTION
WITH CURRENT REGULATIONS *
TOTAL BENEFIT ($ MILLIONS)
FUEL SOURCE LOW HIGH
GASOLINE 8,818.5 19,699.6
DIESEL 97.0 5,157.9
AIRCRAFT FUEL 23.2 1,121.3
COAL 1,017.5 86,390.2
HEATING OILS 122.8 9,966.0
NATURAL GAS 16.2 507.2
WOOD 246.9 11,977.0
* THE SUM FOR EACH FUEL TYPE OF THE UNIT BENEFIT VALUES FROM
TABLE 4 MULTIPLIED BY FUEL CONSUMPTION FROM TABLE 5. (SAME
AS IN TABLE 15).
+ THE SUM FOR EACH FUEL TYPE OF THE UNIT BENEFIT VALUES FROMTABLE 8 MULTIPLIED BY FUEL CONSUMPTION FROM TABLE 8.
TO ZERO+
TOTAL BENEFIT ($ MILLIONS)
LOW HIGH
4,220.9 105,069.6
1,742.9 50,778.5
212.0 10,103.7
11,476.0 786,785,8
1,354.5 90,691.3
146.2 4,567.5
2,224.5 107,803.5

7/28/2019 ENVIRONMENTALLY RESPONSIBLE ENERGY PRICING
http://slidepdf.com/reader/full/environmentally-responsible-energy-pricing 81/138
TABLE A2.1.17: SUMMARY OF ENERGY EXTERNALITIES AND TAXES-ASSUMING 25% EMISSION REDUCTION
EXTERNALITY COSTS EXTERNALITY COSTS EXTERNALITY COSTS MODIFIED UPPER NET TAX PER
PER UNIT * PER UNIT PER UNIT + BOUND AS A ++ UNIT FUEL -
TYPE LOW HIGH
INE (GAL) $0.10 $0.46
L FUEL (GAL) $0.06 $1.15
AFT FUEL (GAL) $0.01 $0.23
(SHORT TONS) $8.32 $457.10
NG OILS (GAL) $0.02 $1.14
RAL GAS (1000 $0.00 $0.12
C FT)
(SHORT TONS) $6.47 $261.75
M SUMMING DOWN THE COLUMNS OF TABLES 4 AND 7.
DPOINT OF TWO PREVIOUS COLUMNS.
M SUMMING DOWN THE COLUMNS OF TABLES 6 AND 9.
MIDPOINT **
$0.28
$0.61
$0.12
$232.71
$0.58
$0.06
$134.11
MODIFIED
UPPER BOUND
$0.42
$0.95
$0.21
$153.78
$0.43
$0.11
$259.96
PERCENT OF
PRICE (1986)
45.58%
100.63%
32.79%
461.79%
62.08%
2.79%
420.79%
(1986)
$0.15
$0.12
$0.10
$11.95
$0.10
$0.25
NA
NET TAX AS
PERCENT OF
PRICE -
(1986)
16.60%
12.90%
15.80%
35.87%
14.61%
6.40%
NA
CE FROM TABLE 5 DIVIDED BY MODIFIED UPPER BOUND MULTIPLIED BY 100.
M TABLE 13.

7/28/2019 ENVIRONMENTALLY RESPONSIBLE ENERGY PRICING
http://slidepdf.com/reader/full/environmentally-responsible-energy-pricing 82/138
TABLE A2.1.18: SUMMARY OF ENERGY EXTERNALITIES AND TAXES-ASSUMING 10% EMISSION REDUCTION
EXTERNALITY COSTS EXTERNALITY COSTS EXTERNALITY COSTS MODIFIED UPPER NET TAX PER PER UNIT q PER UNIT PER UNIT + BOUND AS A ++ UNIT FUEL -
MODIFIED PERCENT OF
L TYPE
(1986)
LOW HIGH MIDPOINT ** UPPER BOUND PRICE (1986)
OLINE (GAL) $0.11 $1.07 $0. 59 $0.99 106.31% $0.15
EL FUEL (GAL) $0.09 $2.85 $1.47 $2.34 248.59% $0.12
RAFT FUEL (GAL) $0.01 $0.67 $0.34 $0.62 96.76% $0.10
L (SHORT TONS) $16.26 $1,136.50 $576.38 $378.24 1135.85% $11.95
TING OILS (GAL) $0.04 $2.88 $1.46 $1.09 157.81% $0.10
URAL GAS (1000 $0.01 $0.31 $0.16 $0.30 7.60’% $0.25
BIC FT)D (SHORT TONS) $16.15 $782.88 $399.52 $778.63 1260.3370 NA
OM SUMMING DOWN THE COLUMNS OF TABLES 4 AND 8.
OM SUMMING DOWN THE COLUMNS OF TABLES 6 AND 10.
NET TAX AS
PERCENT OF
PRICE -(1986)
16.60%
1 2.90%
15.80%
35.87%
14.61%
6.40%
NA
RICE FROM TABLE 5 DIVIDED BY MODIFIED UPPER BOUND MULTIPLIED BY 100.

7/28/2019 ENVIRONMENTALLY RESPONSIBLE ENERGY PRICING
http://slidepdf.com/reader/full/environmentally-responsible-energy-pricing 83/138
APPENDIX 2.2

7/28/2019 ENVIRONMENTALLY RESPONSIBLE ENERGY PRICING
http://slidepdf.com/reader/full/environmentally-responsible-energy-pricing 84/138
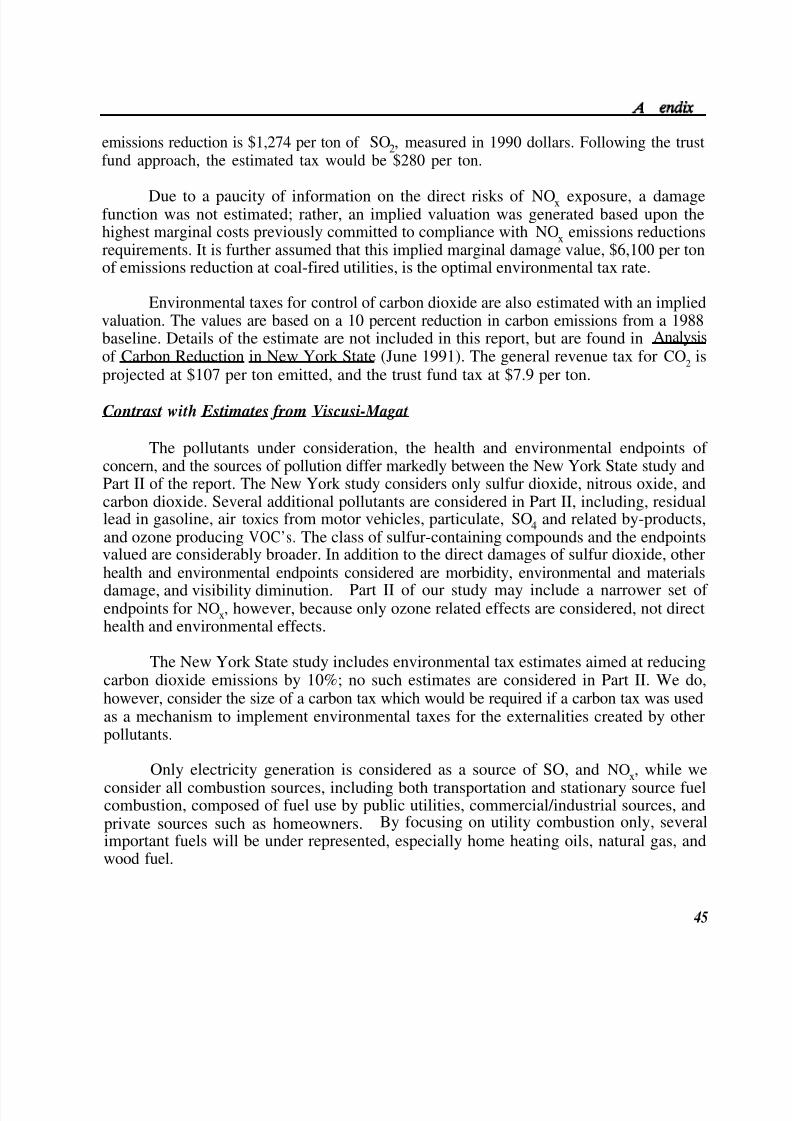
7/28/2019 ENVIRONMENTALLY RESPONSIBLE ENERGY PRICING
http://slidepdf.com/reader/full/environmentally-responsible-energy-pricing 85/138
emissions reduction is $1,274 per ton of SO2, measured in 1990 dollars. Following the trustfund approach, the estimated tax would be $280 per ton.
Due to a paucity of information on the direct risks of NOx exposure, a damagefunction was not estimated; rather, an implied valuation was generated based upon thehighest marginal costs previously committed to compliance with NOx emissions reductionsrequirements. It is further assumed that this implied marginal damage value, $6,100 per tonof emissions reduction at coal-fired utilities, is the optimal environmental tax rate.
Environmental taxes for control of carbon dioxide are also estimated with an impliedvaluation. The values are based on a 10 percent reduction in carbon emissions from a 1988baseline. Details of the estimate are not included in this report, but are found in Analysisof Carbon Reduction in New York State (June 1991). The general revenue tax for CO
2is
projected at $107 per ton emitted, and the trust fund tax at $7.9 per ton.
Contrast with Estimates from Viscusi-Magat
The pollutants under consideration, the health and environmental endpoints of concern, and the sources of pollution differ markedly between the New York State study andPart II of the report. The New York study considers only sulfur dioxide, nitrous oxide, andcarbon dioxide. Several additional pollutants are considered in Part II, including, residuallead in gasoline, air toxics from motor vehicles, particulate, SO4 and related by-products,and ozone producing VOC’s. The class of sulfur-containing compounds and the endpointsvalued are considerably broader. In addition to the direct damages of sulfur dioxide, otherhealth and environmental endpoints considered are morbidity, environmental and materials
damage, and visibility diminution. Part II of our study may include a narrower set of endpoints for NOx, however, because only ozone related effects are considered, not directhealth and environmental effects.
The New York State study includes environmental tax estimates aimed at reducingcarbon dioxide emissions by 10%; no such estimates are considered in Part II. We do,however, consider the size of a carbon tax which would be required if a carbon tax was usedas a mechanism to implement environmental taxes for the externalities created by otherpollutants.
Only electricity generation is considered as a source of SO, and NOx, while we
consider all combustion sources, including both transportation and stationary source fuelcombustion, composed of fuel use by public utilities, commercial/industrial sources, andprivate sources such as homeowners. By focusing on utility combustion only, severalimportant fuels will be under represented, especially home heating oils, natural gas, andwood fuel.
45
7/28/2019 ENVIRONMENTALLY RESPONSIBLE ENERGY PRICING
http://slidepdf.com/reader/full/environmentally-responsible-energy-pricing 86/138
Environmentally Responsible Energy Pricing
Estimated environmental taxes may differ between the two studies because of significantly different baselines used in the two studies. The New York State study assumescompliance with the Clean Air Act Amendments of 1990 in the baseline from which health
effects are measured. We incorporate a 1986 baseline which falls before the expectedimplementation of the most recent standards for ambient air concentrations of criteriapollutants.
The approaches used to determine the optimal tax rates are similar, but both studiesare subject to uncertainty about the methods used. Our study assumes that the adverseeffects of pollutants on health and environment are proportional to fuel consumption. TheNew York State study includes a linear relationship between emissions and adverse effectsbased upon an assumed no effects threshold for SO,. Because our study includes healtheffects as a constant proportion to fuel consumption, the optimal tax rate is constant overany level of emissions. The New York study, on the other hand, must also estimate a
marginal abatement cost function to help determine the optimal degree of pollutionreduction. Estimating this relationship introduces another level of uncertainty.
The environmental taxes for NOx and CO2 in the New York State study are based onthe assumption that maximum marginal abatement costs reflect the optimal marginal benefitof abatement. The existing environmental regulations which led to these observedexpenditures were not based on measures of optimal levels of abatement. Therefore, thereis no reason to believe that the observed abatement costs reflect social cost marginal prices.
There is an environmental externality costing research project under preparation bythe New York Dept of Public Service, the New York State Energy Research Development
Authority, the Empire State Electric Energy Research company, and the Electric PowerResearch Institute with the objective of developing a methodology for estimatingenvironmental externality costs for electricity generation. The project is expected to becompleted in 1994.
46

7/28/2019 ENVIRONMENTALLY RESPONSIBLE ENERGY PRICING
http://slidepdf.com/reader/full/environmentally-responsible-energy-pricing 87/138
PART III:OPTIONS FOR AND DISCUSSION OF IMPLEMENTING FULL
SOCIAL COST ENERGY PRICING

7/28/2019 ENVIRONMENTALLY RESPONSIBLE ENERGY PRICING
http://slidepdf.com/reader/full/environmentally-responsible-energy-pricing 88/138
Environmentally Responsible Energy Pricing
Prices of energy resources can be restored to their full social costs by adopting anoptimal taxation schedule. Part II of our report--The Full Social Cost Energy PricingApproach to Greenhouse Warming Policy--estimated optimal tax levels reflecting air
pollution-related costs incurred by society in the consumption of energy from fossil fuels.This part raises issues associated with tax implementation, and discusses some of theapproaches available for implementing energy taxes. Options discussed will include differenttax approaches which could be undertaken, and the various administrative levels at whichtaxes could be implemented. These administrative issues also raise related concerns, suchas the role of regional pollution variations. The extent to which each approach fulfills thegoal of full social cost pricing of energy sources is addressed at length.
3.1 TAXATION OPTIONS
A number of different taxes could be used to reflect social costs in energy prices.
Pertinent issues associated with each tax are addressed in the accompanying tables. In allcases, the objective of the tax is to link the tax as closely as possible to the damage beingcaused. Energy sources that are being used in a manner that is less polluting should betaxed less. Incorporating a tax mechanism that will provide incentives for pollution reductionwill remain a major challenge.
A consumption tax could be assessed at the retail sale of the appropriate fuels. Insome cases, primarily electric utilities, the tax would apply to the sale of the resulting energyrather than the retail sale of the fuel itself. A production/import tax would fall on theproducer or importer of the fuel at the point of production or at the time that the fuel wasimported into the United States. These two tax approaches, consumption taxes andproduction taxes are the broadest tax approaches which will be addressed.
A carbon tax assessed on different fuels based on the carbon content of each fueltype also entails broad coverage of all fuel types while playing a second role introducingincentives to reduce consumption of the highest carbon content fuels--those fuels thatcontribute most to potentially damaging climate change. This should not, however, beinterpreted as a tax designed to account for the environmental damages of global warming.As discussed in The Full Social Cost Energy Pricing Approach to Greenhouse WarmingPolicy (hereafter, Full Social Cost Energy Pricing), this analysis follows a “no regrets”approach to achieving efficient energy prices which is designed to reduce the burden of environmental damages of pollution. These taxes stop short of addressing global warmingdamages directly due to the current uncertainty in the magnitude--and even the direction--of the effects of climate change. The carbon tax examined in the study uses carbon content-based tax rates to incorporate social costs of conventional air pollutants into energy prices.
Several more narrow taxes could be imposed. A coal output tax would fall onproducers and importers of coal. Similarly, a gasoline and diesel fuel tax would be imposed
48

7/28/2019 ENVIRONMENTALLY RESPONSIBLE ENERGY PRICING
http://slidepdf.com/reader/full/environmentally-responsible-energy-pricing 89/138
Options for Discussion
on consumers at the retail pump. An electricity tax could be collected by electricitygenerating utilities, much as local and state taxes are collected today. These tax approachesare more narrowly targeted at specific segments of the energy market, but could be
implemented in combination to provide broader coverage.
An alternative approach to any of these tax schemes is imposing a fee on pollutionemissions. The revenues collected under an emissions fee approach would be equivalent tocollections using the traditional tax approach, but such fees introduce new administrativedemands on pollution emitters and regulators. Their advantage is that there will be a closelink between the tax and the environmental costs.
Each of these tax approaches could be administered at any level of government, fromlocal governments to the federal level. The greatest advantage of nationwideimplementation is ease of coordination and refinement of the appropriate tax levels. At
more localized administrative levels, taxes could be adjusted to account for the particularcharacteristics of that jurisdiction, enhancing fuel resource allocation, but coordination across
jurisdiction may become unmanageable.
Local taxes may also induce inefficiencies. A tax levied by the state of Virginia maylead Northern Virginia residents to buy their gasoline in Maryland or the District of Columbia.
3.2 CRITERIA FOR EVALUATING TAX APPROACHES
A number of questions should be asked of each social cost pricing implementation
strategy. Perhaps the most important issue is the extent to which the tax scheme fulfills thegoal of incorporating unpriced social costs specifically attributable to use of an energy sourceuse in the market price of each fuel.
The implementing jurisdiction and the effects of that level of control should beconsidered for each tax approach. If taxes implemented at the local level preclude updatingthe tax rates, then more broadly based implementation would be advantageous. On theother hand, local control would be more desirable if more sensitive, localized, informationwas incorporated in tax rates. As an example, pollution levels in Los Angeles may meritquite different taxes than pollution in Sacramento.
Ease of tax collections is also a pertinent factor. For some tax approaches, taxcollection mechanisms already exist. For example, gasoline and diesel taxes levied nationallyas well as by states and localities are collected at point of sale. State severance taxes arecollected at the wellhead for petroleum production, and utilities commonly collect taxesthrough their customers’ regular billing. No systems currently exist for collecting fees frompollution emitters at the emissions point.
49
7/28/2019 ENVIRONMENTALLY RESPONSIBLE ENERGY PRICING
http://slidepdf.com/reader/full/environmentally-responsible-energy-pricing 90/138
Environmentally Responsible Energy Pricing
The degree of difficulty associated with updating the tax rates may also varydepending on the tax approach.
One final issue which will be identified is the end use marketplace effects of each taxtype. While appropriately calibrated taxes would cause fuel consumption to adjust optimally,divergences from optimal taxes may have nonoptimal distortionary effects in end productmarkets.
3.3 OBJECTIVE OF FULL SOCIAL COST PRICING
Prices act as the marketplace signal to allocate goods and services amongproducers/sellers and consumers. To achieve the efficient allocation, market prices shouldreflect the full cost of supplying a good. The adverse marketplace implications of pollutionarise because pollution damages, and the true costs of the production of a commodity such
as energy, are often not reflected in market prices. In the case of energy consumption,market prices reflect the private costs of consumption, but not the environmentalconsequence.
Air pollution, the subject of this research effort, is shown in Full Social Cost Energy
Pricing to be a substantial cost of energy consumption. Excluding pollution costs fromenergy prices creates inadequate incentives for optimal resource allocation. It has beenshown by economists since the time of Pigou that incorporating an appropriate tax in theprice of a commodity priced below its full social cost can create a signal leading buyers andsellers to optimal resource allocation. One of the purposes of this research effort has beento calculate the appropriate tax rates on energy resources incorporating the full social costs
of energy production and consumption in the market price signal.
3.4 LIMITATIONS ON THE OBJECTIVE OF OPTIMAL TAXES
In practice, due to data limitations, technological and scientific uncertainty, andresource constraints, computing the precise tax rates to restore optimal resource allocationis an impossible task. A number of different sources of underlying uncertainty are discussedin the appendices to Full Social Cost Energy Pricing. The issue of regional variation is of particular concern with respect to the choice of the tax implementation approach. Trulyoptimal tax rates should vary on a regional or even localized level when environmental
and/or health damages vary.
Regional variation involves two classes of issues. First, different regions suffer varyingdegrees of environmental damage and health degradation from pollutants related to energyconsumption. Differences may occur in different regions of the country such as East andWest, urban versus rural environments, and even across local areas with differingmicroclimates. Some environmental pollutants may be of great concern in one area but not
50

7/28/2019 ENVIRONMENTALLY RESPONSIBLE ENERGY PRICING
http://slidepdf.com/reader/full/environmentally-responsible-energy-pricing 91/138
Options for Discussion
as significant in other areas. Ozone is of greatest concern in urban areas, most especiallythe Los Angeles Basin, while sulfur dioxide pollution--the main precursor to acidprecipitation--is of greater concern in the Midwest and Northeast, often in less populated
areas.
A second dimension of the regional nature of pollution is that the source of pollutionmay not be the area that incurs the adverse consequences. Ozone pollution from urbanareas may blow across rural areas reducing agricultural output. The sulfur dioxide emissionsof a few electricity generating power plants in the Midwest may be responsible for acidprecipitation over a much broader area.
Optimal taxes should take both of these considerations into account. Localized taxrates should account for the specific health and environmental damages of the emissions inthe local area and any downstream consequences of those emissions. Relative to the single
tax rates computed in Full Social Cost Energy Pricing taxes in Los Angeles, for example,are probably too low for ozone pollution and may be too high for sulfur oxides. Ozonepollution from Los Angeles blows across a wider region, threatening both agricultural outputand human health. But because the damages from sulfur oxides are greatest in the Midwestand Northeast, the single tax rate for sulfur oxides may be higher than is optimal for LosAngeles. In contrast, in large portions of the country, especially rural areas, energyconsumption may be responsible for de minimus health and environmental damages fromairborne pollutants, and the single tax rates imposed on energy in those areas maybe higherthan optimal resource allocations call for.
The above discussion of the direction of regional divergences from optimal tax rates
is necessarily inconclusive. Herein lies the difficulty in incorporating full social costs inmarket prices. Determining the desirable tax rate for a region or locality to reflect thehealth and environmental damages due to energy consumption in that area places anenormous information burden on policy makers. For the Los Angeles area, several studieshave examined the consequences of ozone pollution. Other studies have identified thedifferences in adverse consequences of ozone exposure in rural versus urban areas. Thesestudies are time consuming, data intensive, and subject to scientific uncertainty.
The tax rates computed in Full Social Cost Energy Pricing are subject to similarconstraints. Due to resources limitations and data availability, national emissions estimatesand nationwide damage estimates underlie the social cost calculations. Before implementing
such a tax approach, however, it would be necessary to conduct a more detailed analysis of the factors influencing variations to reflect more localized conditions.
The practical application of incorporating health and environmental social costs inenergy pricing necessitates the balancing of achieving optimality and effectively implementingthe tax policy. Some tax approaches may be easier to implement, but with the disadvantage
51

7/28/2019 ENVIRONMENTALLY RESPONSIBLE ENERGY PRICING
http://slidepdf.com/reader/full/environmentally-responsible-energy-pricing 92/138
Environmentally Responsible Energy Pricing
that regional variation may be more difficult to incorporate. Others may be appealingbecause of local flexibility, but tax refinement maybe more difficult to coordinate. Each of the tax approaches will be discussed below.
3.5 BROAD-BASED IMPLEMENTATION OPTIONS
The broad-based tax alternatives come closest to achieving social cost pricing becauseall fuel types fall under the tax. Some broad-based taxes inhibit flexibility becauseincorporating localized information may be impractical. Broad-based taxes are summarizedin the first three columns of Table A3.1.1 and for emissions fees, in Table A3.1.2.
Consumption Tax
A consumption tax would fall on fuel consumers at the point of purchase of the fuel
or in some cases for purchase of the energy produced from the fuel. The tax could beadministered centrally or on a state or local basis. Fuel taxes are already collected on mostconsumer purchases of gasoline, diesel fuel, aircraft fuel, and heating oils. While the finalbuyers of most supplies of coal and substantial quantities of natural gas and heating oils areelectric utilities, taxes on those fuels could be passed through to electricity customers. Newtax collections would have to be introduced on sales of wood fuel in most cases.
Because taxes would be collected at the point of sale/supply, incorporating differingtax rates for different regions would be possible, but coordinating differentiated tax ratesacross the different fuels and local jurisdictions may be unwieldy. Updating tax ratesbecause of new or improved scientific or emissions data may be difficult to coordinate as
well. Because the tax would fall on all fuels in relation to the emissions from that fuel,consumption levels of each fuel would adjust optimally.
Production/Import Tax
A tax on producers and importers could be levied at the point of production orimportation of each fuel and subsequently passed along to end users in price adjustments.Collection of such a tax would be relatively uncomplicated because of the smaller numberof producers/importers and because taxes are already collected from producers in the formof severance and importation taxes. More centralized administration of the tax would beappropriate due to the smaller number of producers/importers. New collections would have
to be introduced for wood fuel.
Because a production tax would be targeted toward petroleum rather than thederivative petroleum fuels, this tax is more indirectly linked to the externalities incorporatedin energy prices. The market mix of petroleum derived fuels could be distorted as well.
52

7/28/2019 ENVIRONMENTALLY RESPONSIBLE ENERGY PRICING
http://slidepdf.com/reader/full/environmentally-responsible-energy-pricing 93/138
Options for Discussion
This tax would be one of the easiest taxes to update based on new information, butat the same time is not readily adjustable for local and regional information. Because thetax is collected from only a small number of producers and importers (relative to the large
numbers of retailers) and because they are further distanced from actual consumption of thefuels, a more limited information set would be required to refine tax rates. But this samedistancing prevents adjusting tax rates at the local level.
Carbon Tax
The carbon tax as utilized in this approach would be used as a mechanism toincorporate the social costs of conventional pollutants in fuel prices based on the carbonloading of each fuel. As discussed in Full Social Cost Energv Pricing this is not a taxexplicitly designed to curb greenhouse gas emissions; that is, however, a secondary effect of this approach. This approach is one step removed from the socially optimal pricing schedule
because taxes on each fuel are not directly established based on the health andenvironmental damages of that fuel, but are tempered by the carbon content of the fuel.Some carbon content-based price incentives are thereby introduced but at the cost of asuboptimal allocation of fuel resources relative to conventional air pollutants.
The carbon-based tax could be introduced as either a consumption tax or aproduction/importation tax with the advantages and drawbacks of each discussed above.
This is a more difficult tax to update because of the need for additional informationon carbon loadings of each fuel type and the inherent variations in carbon content acrossdifferent sources of the same fuel. Introducing regional or local variation is also increasingly
complex because of the information requirement of the carbon content of fuels used in thatregion or locality.
In the marketplace for fuels, the carbon tax will introduce an incentive to reduceconsumption of high carbon content fuels, especially coal and natural gas. Thesemarketplace adjustments may not optimally account for air pollution externalities, forexample, natural gas has a high carbon loading but a relatively small adverse impact on theenvironment or health.
Emissions Fees
Fees assessed on the emissions of pollutants are an alternative broad-basedimplementation method. This approach yields the closest possible linkage between thesource of the externality and the assessment of the tax. Fees would be assessed on thepollutant of concern, rather than on the fuel source. Emissions fees would be passedthrough in the prices of fuels allowing for optimal allocation between fuels in themarketplace.
53

7/28/2019 ENVIRONMENTALLY RESPONSIBLE ENERGY PRICING
http://slidepdf.com/reader/full/environmentally-responsible-energy-pricing 94/138
Environmentally Responsible Energy Pricing
The disadvantages of emissions fees have been widely discussed in the environmentaleconomics literature. An emissions fee program may be perceived as transferring to thepolluter a pollution property right. This aspect of the fee approach has made fees politically
unattractive to groups concerned with whether pollution victims are compensated. Collectingthe taxes may be more difficult as well because of the need to collect specific data onemissions from each facility. Collecting emissions data from individuals--for example, fortheir home furnaces and woodstoves--could be unmanageable. Some estimated level of emissions charges would probably be required from homeowners.
To some extent, emissions fees already incorporate local and regional circumstancesbecause the fees adjust to the emissions in that locality if the fee levels properly incorporatethe resulting adverse health and environmental impacts. Some local adjustments could stillbe incorporated taking into account backgroung leers of each pollutant, dispersion patterns,etc.
Targeted Taxes
Targeted taxes are more narrowly focused than the consumption and production taxapproaches, but may be more easily implemented by local authorities. Some targeted taxesmay be more readily adjusted on a regional basis compared to a more general tax. Thesetaxes are however, further removed from the notion of optimal resource allocation becauseonly a limited number of pollution sources are targeted by the tax. Marketplace adjustmentsamong fuel types may be undesirable. Targeted taxes are summarized in the final threecolumns of Table A2.1.1.
Gasoline and Diesel Fuel Tax
A tax on purchases of motor fuels would address only a limited amount of totalpollutants from energy consumption. Taxes would be collected at the retail level much asfederal, state, and local excises are collected today. Current tax collection would allow forease of implementation at either a centralized or local level and ready adjustment on a localor regional level. Updating taxes would be relatively simple as the required information setis restricted to motor fuels, only.
A significant drawback to relying strictly on a motor fuels tax is that the greatestquantity of externalities resulting from fuel consumption is not covered. As discussed in theappendices to Full Social Cost Enengy Pricing, sulfur oxides pollutants from burning fossilfuels account for the greatest quantity of adverse health effects and for acid precipitation.Only a small amount of sulfur oxides emissions are addressed by a gasoline tax. The samedrawback holds for particulate pollution. Limited benefits will be achieved by focusing onlyon motor fuels. On the other hand, taxing motor fuels will address substantial amounts of
54
7/28/2019 ENVIRONMENTALLY RESPONSIBLE ENERGY PRICING
http://slidepdf.com/reader/full/environmentally-responsible-energy-pricing 95/138
Options for Discussion
air toxics resulting from motor fuels, residual lead remaining in gasoline, and the precursorsto ozone pollution, volatile organic compounds and nitrous oxides.
Coal Output Tax
Like the gasoline tax, a coal output tax addresses a restricted set of sources of conventional pollutants. In that sense, a coal output tax will result in a less than optimalresource allocation. This tax does, however, address the largest single polluting fuel source.Consumption of coal for fuel accounts for the greatest portion of acid precipitation andhealth effects of sulfur oxides. Substantial amounts of the precursors to ozone are alsoproducts of coal consumption.
As with the production tax discussed above, taxes could be collected from a limitednumber of suppliers providing for ease of implementation. These suppliers are somewhat
removed from local fuel consumption, making local administration of the tax and adjustmentof the tax rates unworkable.
Much like the case for the gasoline tax, updating the tax rates would be relativelysimple because of the more narrow focus of this approach. Also as is the case with themotor fuels tax, there will be marketplace incentives to reduce coal consumption which maynot yield an optimal resource allocation.
Electricity Tax
A tax on electricity would be one step removed from a more direct tax on fuel
consumption. In this case, electricity generators would tax consumers for their electricityuse, electricity which could be generated from a number of different combinations of coal,heating oils, and natural gas.
An electricity tax shares many of the same advantages and disadvantages of the motorfuels and coal output taxes discussed above. This tax focuses on a restricted set of the fuelsthat create conventional air pollutants, but significant environmental and health endpointsare addressed. Electric utilities are primarily responsible for the emissions of pollutantswhich lead to acid precipitation, and the large quantities of coal and heating oils consumedby electric utilities account for a substantial portion of the health and environmental effectsof sulfur oxides.
Administering an electricity tax at the local level provides a substantial opportunityto readily adjust tax rates for the health and environmental effects specific to that region’sfacilities. Supervisory and administrative boards overseeing public utilities already exist inmost areas. Some broader coordination would probability be required to insure that theadverse impacts occurring downstream from the facilities, as is the clearly the case with acid
55
7/28/2019 ENVIRONMENTALLY RESPONSIBLE ENERGY PRICING
http://slidepdf.com/reader/full/environmentally-responsible-energy-pricing 96/138
Environmentally Responsible Energy Pricing
precipitation which may occur far from the generating facilities, are properly incorporatedin local tax rates.
Taxing electricity would create incentives for utility customers to consume fuelsdirectly. Large customers like factories and businesses may wish to bum fuel on-site whilehomeowners may rely more heavily on furnaces for heat. These incentives may lead toundesirable emissions being shifted from electricity-generating facilities to homes andbusinesses.
Combinations of Targeted Trees
Implementing some combination of targeted taxes could be used as a means toachieve broad coverage, incorporate local control, and take advantage of administrativesimplicity. For instance, a coal output tax could be easily implemented and operated at the
federal level while a tax on electricity generation is used to adjust tax rates based on localcircumstances. Additional research would be required to address the different combinationsof taxes possible and the consequences for approaching an optimal resource allocation of each different approach.
56

7/28/2019 ENVIRONMENTALLY RESPONSIBLE ENERGY PRICING
http://slidepdf.com/reader/full/environmentally-responsible-energy-pricing 97/138
APPENDIX 3.1

7/28/2019 ENVIRONMENTALLY RESPONSIBLE ENERGY PRICING
http://slidepdf.com/reader/full/environmentally-responsible-energy-pricing 98/138
Tab le A3.1.1
A[ternet i ve Tax St ruc tu res
Consumption Tax Productiction/ Carbon Tax Coa l Output Tax E l e c t r i c i t y T a xImpo
Gasoline and Dieselr t T a x Fuel Ta x
ip t i on o f Tax Tax assessed at retail Tax assessed at producer/ Tax assessed at Tax assessed at Tax assessed at Tax assessed atlevel f o r a l l f u e l impor te r l eve l . Pr imar i l y r e t a i l level f o r a l l p r o d u c er / e l e c t r i c i t y retail gasolinest y p e s . assessed on coal, f u e l t y p e s . T a x importer level for generat i ng ut i l i ty . o u t l e t s .
petroleum and na tu ra l gas . amount determined by al l coal e x c e p tca rbon con ten t o f coa l used i n cok ingeach fue l . p rocess .
of Tax ’
o l i ne $ 0 . 2 8 / g a l $ 0.25/ga14 $ 0 . 2 8 / g a l
e l 0 . 6 1 / g a l 2 . 8 1 / g a l 0 . 6 1 / g a l
r a f t 0 . 1 2 / g a l NA
l 2 3 2 . 7 1 / t o n $232.71/ton 142.30/ton $ 2 3 2 . 7 1 / t o n
ing 0.58/gal 1.43/gal
ral 0.06/1000 cu. ft. 0 . 0 6 / 1 0 0 0 c u . f t . 0 . 0 6 / 1 0 0 0 c u . f t .
134 .11 / ton 134 .11 / ton NA
oleum 1 1 . 2 5 / b b l3
r i c i t y $ 0.0665/KWH5
Tax Revenue 284.99 288.34 259.38’ 197 .37 184.92 44.31989 est imatedmpt ion volumes
bil l ions $) 2
of Tax 21. 41 - 548. 36 22.4 5 - 554. 03 21.5 1 - 497. 53 7.06 - 387.68 6.67 - 363.45 12 .50 - 75 .91nue: lower and
bounds ( ins $)

7/28/2019 ENVIRONMENTALLY RESPONSIBLE ENERGY PRICING
http://slidepdf.com/reader/full/environmentally-responsible-energy-pricing 99/138
Table A3.1.1 (continued)
e of Coverage Broades t coverage. B roades t coverage. Broad coverage. Narrow c o ver ag e. Narrow co v er age. Narrowest coverage.Addresses especially Addresses on l y one Addresses only o n ef u e l s l i n k e d t o
M o t o r v e h i c l e s onlyfuel s o u r c e , t h o u g h s e t o f emissions
climate change, acid m o s t p o l l u t i n g sources .r a i n a n d s u l f u r source.o x i d e - r e l a t e de f f e c t s .
age t o Taxes assessed on each Taxes on petroleum based T a x e s linked to air Close l i n k a g e f o r a
r n a l i t y
Ups t ream l i nk t o Close linkage for a
fuel based on f u e l s l i n k e d t o p o l l u t i o n narrow s e t o f externality. narrow set of
c o n t r i b u t i o n t o t ot al externality indirectly. e x t e r n a l i t i e s o n l y e x t e r n a l i t i e s . P r i ma r i ly d r e s s e s e x t e r n a l i t i e s .
externality. Closest i n d i r e c t l y . E x t e n t o f A d d r e s s es t h e a c i d r a i n a n d o t h e rp o s s i b l e l i n k a g e . externality based on single most su l f u r ox i de- re l a ted
c o n t r ib u t i on o f e ac h p o l l u t i n g f u e l . e f f e c t s .f u e l t y p e , w h i l e t a xis based on carbonc o n t e n t .
o f Co l l ec t i on Tax c o l lected t h rough Ta x c o l lected t h rough a T a x c o l l e c t e d t h r o u g h Ta x c o l lected at Tax c o l lected at Tax COllected
e x i s t i n g c h a n n e l s ( i n l i m i t e d n u m b e r o f e x i s t i n g c h a n n e l s , producer/ e l e c t r i c u t i l i t i e s , t h r o u g h e x i s t i n gmost cases) . New p r o d u c e r s however, t ax will be importer l ev el . a r e a d i l y c h a r n e l s .
collections instituted importers. E a s i e s t b a s e d upon fuel E a s i e s t possiblef o r w e d .
i d e n t i f i a b l epossible collection. New composition rather collection. selection ofc o l l e c t i o n s i n s t i t u t e d f o r t han sa l es volume. f a c i l i t i e s withw oo d . e x i s t i n g t a x
c o l l e c t i o nmechanisms.
e o f Ref i nement7 Requi res updated R e q u i r es u p d a t e d M o r e diff icult tax to Requ i res updated Requ i res updated Requi res updated
i n f o r m a t i o n o n i n format i on on consumpt i on update. Requi res information on coal i n f o r m a t i o n o n i n f o r m a t i o n o nconsumption volumes. volumes. c o n t i n u a l u p d a t i n g o f consumpt i on volume. e l e c t r i c i t y gasol i ne /
c a r b o n c o n t e n t o f g e n e r a t i o n , f u e l d i e s e l c o n s u m p t i o neach fuel typa and consumpt i on values vo l ume.
i n f o r m a t i o n o n a n d f u e l m i x b yconsumpt i on volumes. electric u t i l i t i e s .
c t s i n Fuel Fuel consumpt ion will Could d i s t o r t m a r k et m i x I n l o n g - r u n s h o u l d Could d i s t o r t fuel In long-run c o u l d Hay l ead consumersets a d j u s t o p t i m a l l y t o of petroleum d e r i v e d dr i ve market toward input use away f rom (cad to lower demand
account f o r f u e l s . lower carbon-t o t r a v e l l e s s ,
c o a l . f o r e l e c t r i c i t y o r switch f u e l s , o rexternalities. c o n t a i n i n g f u e l s , b u t fuel w i t c h i n g b y switch t r ans i t mode
wi l l n o t optimally utilities towarda c c o u n t f o r a i r l e s s p o l l u t i n gpollution f u e l s .e x t e r n a l i t i e s .

7/28/2019 ENVIRONMENTALLY RESPONSIBLE ENERGY PRICING
http://slidepdf.com/reader/full/environmentally-responsible-energy-pricing 100/138
T a b l e A3.1.1 ( c o n t i n u e d )
t u t i o n a l F e d e r a l implementation Federal implementat ion Federal F e d e r a l , S t a t e Federal, state, ores
Federalallows e a s i e s t e a s i e s t . S t a t e p o s s i b l e . i m p l em e n ta t i o n p o s s i b l e . A t s t a t e local imp lemen ta t i onc o o r d i n a t i o n . S t a t e o r Because p roduc t i on tax
imp lementa t i oneas ies t . S ta te o r level, severance p o s s i b l e . U t i l i t y
l oca l more d i f f i c u l t toe a s i e s t . State/ l oca
could be collected from local poss ib le bu t t ax c o l lection taxes currentlyc o o r d i n a t e , but could m a n y fewer pert ies
possible. E x i s t i n gmo re d i f f i c u l t t o mechan i sms a l ready
take advent age ofc o l lected by s tates t ax c o l l e c t i o n
capered to a consumpt i o n coor d ina te . May be ex i s t . A t Federa l a n d l o c a l l y . N o mechanism at federaex i s t i ng p rog rams . tax , s ta te imp l emen ta t i o n t oo u nw ei l d y f or l ev el , b la c k l un g c u r r en t Fed er al t ax l evel fo r hi ghw ayCo l l ec t i on p rocesses more feas ib le . Severance state or local, tax is currently collection from t r u s t f u n d . S t a t e scurrently exist at t ax co l l ec t i on p rocesses espec ia l l y due to assessed o n c o a l . u t i l i t i e s .F e d e r a l level f o r mo to r ex i s t i n many s ta tes fo r
a n d t o t a l i t i e s h a v econ t i nua l upda t i ng o f
fue ls t axes and b lack these fue l s .
c o l l e c t i o n s y s t e m s
lung tex on coal , at op t ima l tax based on fo r mo to r fue l scarbon c o n t e n t . taxes .state and local levelfo r mo to r fue l s exc i sesa n d e l e c t r i c u t i l i t i e s .

7/28/2019 ENVIRONMENTALLY RESPONSIBLE ENERGY PRICING
http://slidepdf.com/reader/full/environmentally-responsible-energy-pricing 101/138
1.
2.
3.
4.
5.
6.
7.
Consumption tax estimates from appendix table 17, column 4. Represents midpointof estimated range assuming current regulations reduce emissions by 25% (for SOXand particulate). Estimates of other tax approaches use the consumption tax valuesas a baseline. Adjustments to the baseline are explained in the appropriatefootnotes.
Sum over all fuel types of optimal tax (midpoint estimate) for each fuel multipliedby most recent estimate of consumption of that fuel.
Per barrel tax on petroleum calculated as tax constraint divided by 1986 petroleumconsumption. Tax constraint calculated as sum of optimal tax on gasoline, dieselfuel, aircraft fuels, and heating oils multiplied by base year (1986) consumptionvolumes.
Tax constraint calculated as sum of optimal tax on gasoline, diesel fuel, coal, heatingoils, and natural gas multiplied by 1986 consumption volumes for each fuel. Aircraftfuel and wood fuel were deleted due to insufficient carbon content data. Taxconstraint was reallocated based upon relative carbon tax weights from appendixtable 14.
Tax constraint divided by total electric utility industry output for 1986 (source: U.S.Bureau of the Census, Statistical Abstract of the United States, Washington, D.C.(1989), Table 952), Tax constraint calculated as sum of optimal tax on coal, naturalgas, and heating oils times volume of each fuel consumed in electricity generationin 1986. Fuel consumption values drawn from (coal and natural gas) or calculatedfrom (heating oils) Annual Energy Review, 1987, Tables 70, 76, and 86.
Excludes carbon taxes on aircraft fuels and wood fuel.
Based on underlying linearity of benefits models, unit value of benefits (hence,optimal tax values) will be constant for any level of fuel consumption. If, however,linearity does not hold, optimal tax values must be reassessed as fuel consumptionvalues change.

7/28/2019 ENVIRONMENTALLY RESPONSIBLE ENERGY PRICING
http://slidepdf.com/reader/full/environmentally-responsible-energy-pricing 102/138
Table A3.1.2
Emissions Fee
Emissions Fee
ip t i on o f Fee Fee charged to em i t te rs fo r each uni t of po l lutant emitted.
of Tax ’
d i n Gaso l i ne $284.82/kilo
iculates 1 8 . 0 9 / k i l o
1 1 . 1 3 / k i l o
0 .09 / k i l o
C's 0 . 7 1 / k i l o
Tax Revenue for 1988 Emiss io ns Levels z $246.83 billion
e of Tax Revenue: lower and upper bounds (in billions $) 1 0 .2 5 - 48 3 .3 0
e of Coverage Broad coverage.
ge to Externality Closest Poss ib le l i nkage . Fees assessed on each pollutant.
o f Co l l ec t i on Ta x collected f rom each emi t te r based upon pollutant output. Will require plant-s p e c i f i c m o n i t o r i n g o r e s t i m a t i o n . N e w m e t h o d s will be required for fee collectionf rom auto use.
of Refinement Requ i res upda ted i n fo rmat i on on na t i ona l em iss ions o f each pollutant from each fuetype .
t s i n Fue l Marke ts Fuel consumption will adjust optimally to account for externalities.
t u t i o n a l I s s u e s F e d e r a l implementation. May be too unweildy for state or local g i v e n r e q u i r e m e n t sfor monitoring/estimation. Implies giving pollut ion property right to emitters;hence. may be politically unpopular.

7/28/2019 ENVIRONMENTALLY RESPONSIBLE ENERGY PRICING
http://slidepdf.com/reader/full/environmentally-responsible-energy-pricing 103/138
Footnotes for TableA3.12
1. Emissions fee calculated as midpoint of range of total benefits for each pollutanttype from appendix tables 4 and 7 divided by base year emissions. Base year 1986
except 1984 for lead in gasoline.
2. Total tax revenue calculated as sum over each pollutant type of optimal fee(midpoint) times emissions for most recent year, 1989.

7/28/2019 ENVIRONMENTALLY RESPONSIBLE ENERGY PRICING
http://slidepdf.com/reader/full/environmentally-responsible-energy-pricing 104/138
PART IVRESIDENTIAL ENERGY DEMAND AND THE TAXATION OF
HOUSING
The primary author of this section was William M. Gentry, Economics Professor, DukeUniversity.

7/28/2019 ENVIRONMENTALLY RESPONSIBLE ENERGY PRICING
http://slidepdf.com/reader/full/environmentally-responsible-energy-pricing 105/138
Residential Energy Demand
Increased concern about the environment has increased interest in policies aimed atreducing energy demand. To address environmental externalities associated with energyconsumption, economists often suggest targeting corrective energy taxes.’ While narrowly
focused energy taxes are powerful instruments for reducing energy demand, optimal taxtheory suggests that the taxation of substitutes and complements can play an important rolein commodity tax design: taxes on complements to energy and subsidies on substitutes forenergy reduce energy demand. This paper analyzes the effect of the tax treatment of housing on the demand for energy.
With almost 50 percent of the U.S. capital stock devoted to housing, even a smallinteraction between the tax treatment of housing and energy demand could induce a largechange in energy use. The link between the housing stock and energy demand is direct:housing services are produced by combining houses and residential energy. Estimates fromQuigley (1984a) suggest that utility expenditures are about 17 percent of the total annual
cost for housing services.2 In turn, residential energy demand is an important componentof total U.S. energy demand: in 1988, residential space heating and cooling, water heating,and other household appliances accounted for 16.4 quadrillion BTUS of energy --20 percentof the total energy consumed in the U.S.3
If consuming more housing increases residential energy demand, then reducing thedemand for housing reduces energy demand. Rather than discouraging housingconsumption, however, U.S. tax policy encourages consumption of and investment inhousing. The tax code favors housing in three ways: (1) for homeowners, imputed rents arenot taxed and mortgage interest and property taxes can be deducted from income; (2) forrental property, landlords benefit from provisions such as accelerated depreciation; and (3)
the corporate income tax induces investment in non-corporate assets, such as housing, ratherthan the corporate sector. Section 1 of the paper reviews the public finance literature onthe taxation of housing and estimates the size of the subsidy to housing from the tax system.
While the tax-treatment of housing may increase housing expenditures, it is less clearwhether this increase translates into an increase in residential energy demand. Housingexpenditures purchase a bundle of housing attributes: size, location, vintage, design, qualityof construction are but a few. Some of these attributes increase energy demand (e.g., size);others, such as energy-efficient design, decrease energy demand. However, both increasedsize and energy efficiency increase the value of a house. Moreover, residential energyconsumption encompasses a variety of end uses: the most important are space heating,
water heating, air conditioning and kitchen appliances. Some of these uses of energy aremore related to the amount of housing than others. For example, energy for space heatingdepends directly on the size of the house, but energy for water heating depends more on thenumber of residents than the size of the house. Section 2 explores the relation between thecomponents of energy demand and house characteristics.
59
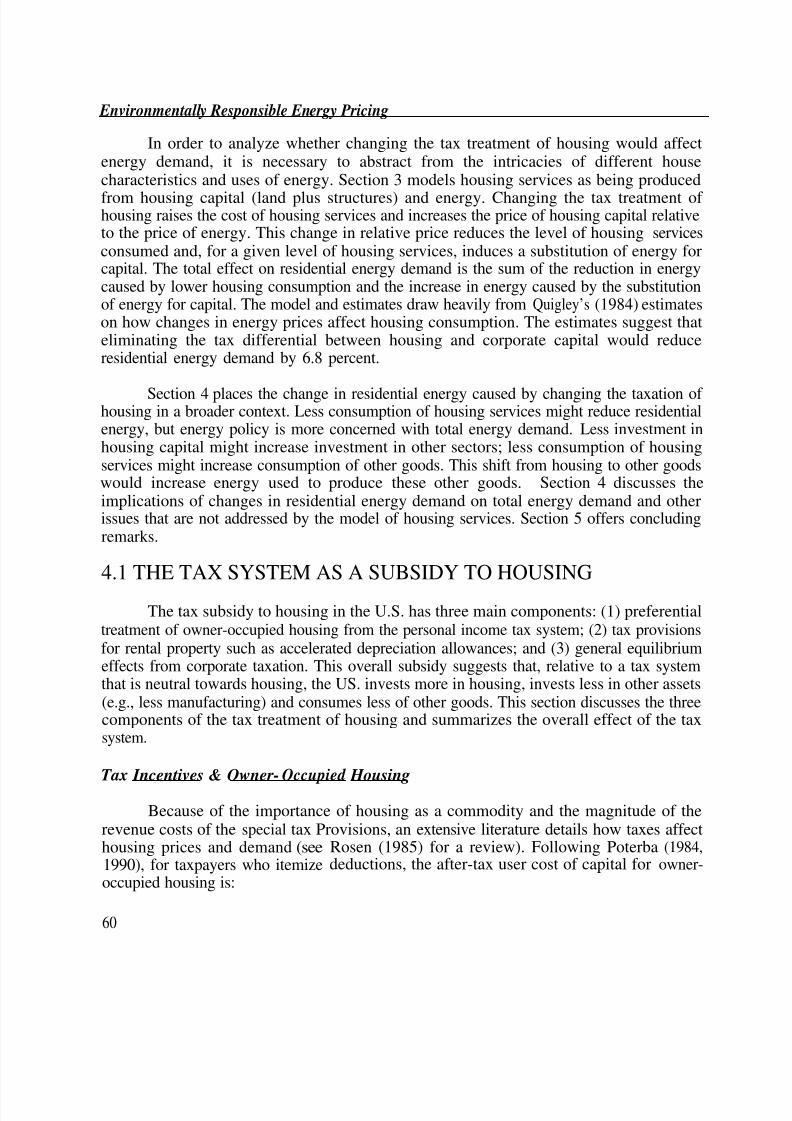
7/28/2019 ENVIRONMENTALLY RESPONSIBLE ENERGY PRICING
http://slidepdf.com/reader/full/environmentally-responsible-energy-pricing 106/138
Environmentally Responsible Energy Pricing
In order to analyze whether changing the tax treatment of housing would affectenergy demand, it is necessary to abstract from the intricacies of different housecharacteristics and uses of energy. Section 3 models housing services as being produced
from housing capital (land plus structures) and energy. Changing the tax treatment of housing raises the cost of housing services and increases the price of housing capital relativeto the price of energy. This change in relative price reduces the level of housing servicesconsumed and, for a given level of housing services, induces a substitution of energy forcapital. The total effect on residential energy demand is the sum of the reduction in energycaused by lower housing consumption and the increase in energy caused by the substitutionof energy for capital. The model and estimates draw heavily from Quigley’s (1984) estimateson how changes in energy prices affect housing consumption. The estimates suggest thateliminating the tax differential between housing and corporate capital would reduceresidential energy demand by 6.8 percent.
Section 4 places the change in residential energy caused by changing the taxation of housing in a broader context. Less consumption of housing services might reduce residentialenergy, but energy policy is more concerned with total energy demand. Less investment inhousing capital might increase investment in other sectors; less consumption of housingservices might increase consumption of other goods. This shift from housing to other goodswould increase energy used to produce these other goods. Section 4 discusses theimplications of changes in residential energy demand on total energy demand and otherissues that are not addressed by the model of housing services. Section 5 offers concludingremarks.
4.1 THE TAX SYSTEM AS A SUBSIDY TO HOUSING
The tax subsidy to housing in the U.S. has three main components: (1) preferentialtreatment of owner-occupied housing from the personal income tax system; (2) tax provisionsfor rental property such as accelerated depreciation allowances; and (3) general equilibriumeffects from corporate taxation. This overall subsidy suggests that, relative to a tax systemthat is neutral towards housing, the US. invests more in housing, invests less in other assets(e.g., less manufacturing) and consumes less of other goods. This section discusses the threecomponents of the tax treatment of housing and summarizes the overall effect of the taxsystem.
Tax Incentives & Owner- Occupied Housing
Because of the importance of housing as a commodity and the magnitude of therevenue costs of the special tax Provisions, an extensive literature details how taxes affecthousing prices and demand (see1990), for taxpayers who itemizeoccupied housing is:
60
Rosen (1985) for a review). Following Poterba (1984,deductions, the after-tax user cost of capital for owner-

7/28/2019 ENVIRONMENTALLY RESPONSIBLE ENERGY PRICING
http://slidepdf.com/reader/full/environmentally-responsible-energy-pricing 107/138
Residential Energy Demand
S=( l -@ )(i +r)+~+a+m-7rP. P #
(1)
where CO is the after-tax user cost of owner-occupied housing, @ is the individual’s marginaltax rate, i is the nominal interest rate, TP is the property tax rate as a fraction of the valueof the house,’ 8 is the physical depreciation rate for the house, a is the risk premium forhousing investments, m is the cost of home maintenance as a fraction of the house value,m. is the expected rate of house appreciation, PO is the price of owner-occupied housing.
At first glance, the tax system only appears to affect the user cost by reducing the costof homeownership through the deductibility of mortgage interest and property taxes. Whilethe deductibility of mortgage interest and property taxes are among the most visible parts
of the tax subsidy for housing, many other tax provisions affect housing. First, implicit inequation (1) are the assumptions that individuals can borrow or lend at the nominal interestrate, i, and that interest income is taxed at the rate, 0. Under these assumptions, the usercost does not depend on the percentage of the house that is financed by borrowing:housing is a tax- advantaged investment even if it is 100 percent equity financed. Thisinvariance between debt and equity finance highlights the source of the tax incentives forhomeownership: imputed rent (implicit income from consumption flows) is not taxed.Instead of creating a tax advantage for housing, mortgage interest deductibility merelyextends the tax advantage of equity-financed housing to homeowners who borrow (seeWoodward and Weicher (1989)).
Second, this user cost expression does not hold for households who do not itemize.Although the after-tax interest rate is still appropriate for the equity position of the non-itemizer, since the return on alternative investments is taxed, non-itemizers pay the before-tax interest rate and the full value of property taxes (e = 0).
5Third, the user cost depends
on the household’s marginal tax rate which varies across households. Therefore j the usercost depends on the other characteristics (mainly, income) of the household that affect taxrates. The dependence of the user cost on household tax rates makes it difficult to separateincome and tax effects in empirical work since the tax rate varies directly with income.Fourth, this user cost formula assumes that the price appreciation for houses is not taxed.Given the rollover provision (capital gains from house sales that are reinvested in housingare tax-deferred) and the one-time exclusion of $125,000 for people over age 55, this
assumption is realistic.6s These capital gains rules provide another tax incentive for housing.
Changing the taxation of housing would change the user cost of homeownership.Table 4.1 examines the user cost of homeownership under several potential policy reformsusing plausible parameters taken from Poterba (1990). The first line in the table is the usercost under the current policy with deductible mortgage interest and property taxes, untaxed
61
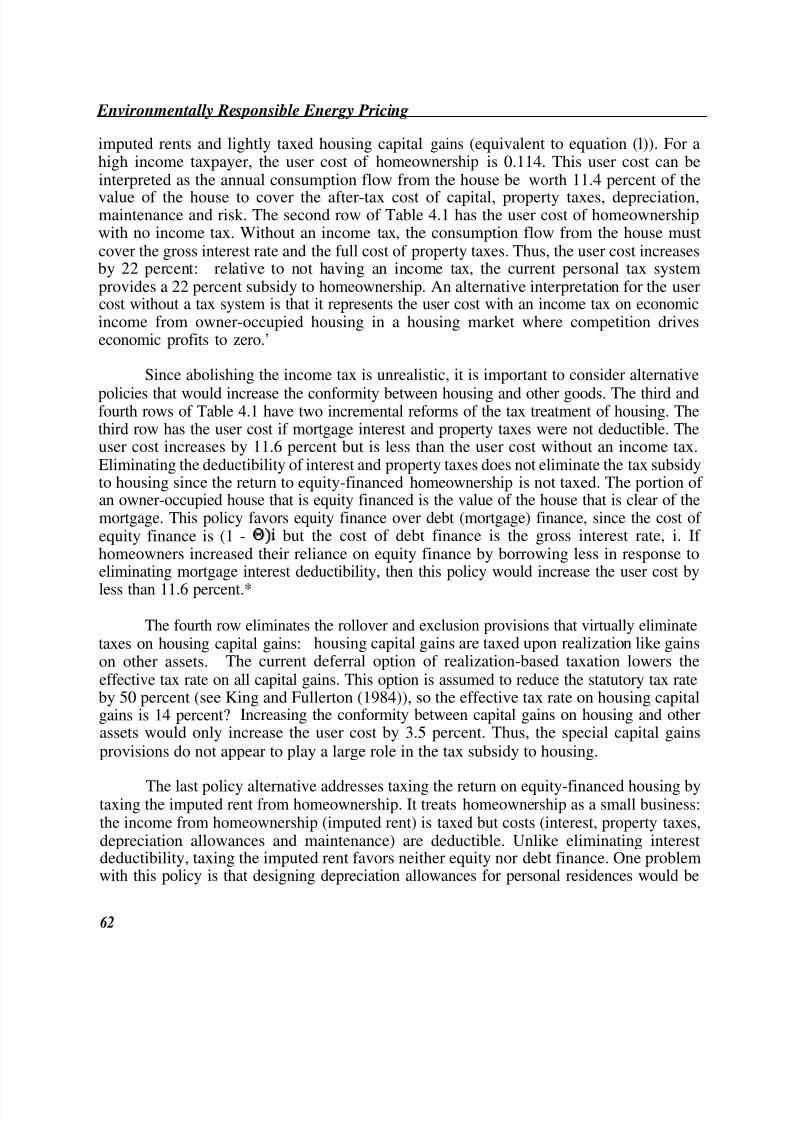
7/28/2019 ENVIRONMENTALLY RESPONSIBLE ENERGY PRICING
http://slidepdf.com/reader/full/environmentally-responsible-energy-pricing 108/138
Environmentally Responsible Energy Pricing
imputed rents and lightly taxed housing capital gains (equivalent to equation (l)). For ahigh income taxpayer, the user cost of homeownership is 0.114. This user cost can beinterpreted as the annual consumption flow from the house be worth 11.4 percent of the
value of the house to cover the after-tax cost of capital, property taxes, depreciation,maintenance and risk. The second row of Table 4.1 has the user cost of homeownershipwith no income tax. Without an income tax, the consumption flow from the house mustcover the gross interest rate and the full cost of property taxes. Thus, the user cost increasesby 22 percent: relative to not having an income tax, the current personal tax systemprovides a 22 percent subsidy to homeownership. An alternative interpretation for the usercost without a tax system is that it represents the user cost with an income tax on economicincome from owner-occupied housing in a housing market where competition driveseconomic profits to zero.’
Since abolishing the income tax is unrealistic, it is important to consider alternative
policies that would increase the conformity between housing and other goods. The third andfourth rows of Table 4.1 have two incremental reforms of the tax treatment of housing. Thethird row has the user cost if mortgage interest and property taxes were not deductible. Theuser cost increases by 11.6 percent but is less than the user cost without an income tax.Eliminating the deductibility of interest and property taxes does not eliminate the tax subsidyto housing since the return to equity-financed homeownership is not taxed. The portion of an owner-occupied house that is equity financed is the value of the house that is clear of themortgage. This policy favors equity finance over debt (mortgage) finance, since the cost of equity finance is (1 - El)i but the cost of debt finance is the gross interest rate, i. If homeowners increased their reliance on equity finance by borrowing less in response toeliminating mortgage interest deductibility, then this policy would increase the user cost by
less than 11.6 percent.*
The fourth row eliminates the rollover and exclusion provisions that virtually eliminatetaxes on housing capital gains: housing capital gains are taxed upon realization like gainson other assets. The current deferral option of realization-based taxation lowers theeffective tax rate on all capital gains. This option is assumed to reduce the statutory tax rateby 50 percent (see King and Fullerton (1984)), so the effective tax rate on housing capitalgains is 14 percent? Increasing the conformity between capital gains on housing and otherassets would only increase the user cost by 3.5 percent. Thus, the special capital gainsprovisions do not appear to play a large role in the tax subsidy to housing.
The last policy alternative addresses taxing the return on equity-financed housing bytaxing the imputed rent from homeownership. It treats homeownership as a small business:the income from homeownership (imputed rent) is taxed but costs (interest, property taxes,depreciation allowances and maintenance) are deductible. Unlike eliminating interestdeductibility, taxing the imputed rent favors neither equity nor debt finance. One problemwith this policy is that designing depreciation allowances for personal residences would be
62

7/28/2019 ENVIRONMENTALLY RESPONSIBLE ENERGY PRICING
http://slidepdf.com/reader/full/environmentally-responsible-energy-pricing 109/138
Residential Energy Demand
complicated. Furthermore, depreciation rules can often be exploited to reduce taxes.’”Under the assumption that the present value of depreciation allowances is fifty cents forevery dollar invested, treating homeownership as a small business increases the user cost by
19 percent.” With this set of parameters, this user cost approximately equals the user costwithout an income tax. More generous depreciation allowances would decrease the user costof homeownership.12
Since the user cost depends on the homeowner’s marginal tax rate, the subsidy fromthe tax system varies with a household’s income. For a household with a marginal tax rateof zero, the tax system does not affect the user cost. For a household with a 15 percentmarginal tax rate, the tax subsidy to housing relative to not having an income tax is 9.7percent rather than the 21.9 percent subsidy for households with a 28 percent tax rate. Theoverall subsidy to homeownership depends on the distribution of homeownership acrossincome groups. Table 4.2 presents the weighted average tax subsidy for owner-occupied
housing using data from the 1989 Consumer Expenditure Survey. Column (1) reports theincome distribution of homeowners. More than half of homeowners are in the middleincome group ($15,000 to $50,000 of income) that roughly corresponds to the 15 percentmarginal tax rate bracket. While only one-quarter of homeowners have incomes above$50,000, this high income group owns 41 percent of the value of owner-occupied housing.Weighting the tax subsidy for homeownership for each income class by the share of thehousing capital stock owned by the income class produces a weighted average tax subsidyfor the total stock of owner-occupied housing of 13.3 percent.
Along with the previously mentioned caveats on the user cost formula, these changesin the cost of homeownership are imprecise for a number of reasons. First, the calculation
of the change in the long-run after-tax cost of homeownership assumes that the supply of housing is perfectly elastic. This incidence assumption implies that a reduction in the subsidyis borne by future homeowners rather than the builders or current owners. While thisassumption follows previous analyses of the tax subsidy (e.g., Aaron (1972)), White andWhite (1977) show that both the distributional effects of the subsidy and the change in thequantity of housing depends critically on the supply elasticity of housing. In contrast to thecase of perfectly elastic supply, if the supply of housing was perfectly inelastic, then changesin the tax subsidy would be capitalized into current house prices and the incidence of thechanges would be entirely on current homeowners. Since the quantity of housing does notchange in this case, the tax subsidy would be expected to have little effect on energydemand. Intermediate values of the supply elasticity cause a mixture of these two cases.
However, since the perfectly elastic supply case has the largest changes in the cost of homeownership and the quantity of housing, it produces the largest possible interaction of the tax subsidy and residential energy demand.
Second, the changes in the user cost depend on the choice and stability of theparameters (e.g., the interest rate) in the user cost. For example, lower interest rates or
63

7/28/2019 ENVIRONMENTALLY RESPONSIBLE ENERGY PRICING
http://slidepdf.com/reader/full/environmentally-responsible-energy-pricing 110/138
Environmentally Responsible Energy Pricing
property tax rates would reduce the effect of eliminating deductibility of mortgage interestor property taxes. Moreover, changes in tax policy towards housing might affect the grossinterest rate or the reliance on property taxes by local governments. The implicit incidence
assumption is that tax policy towards housing does not affect the interest rate or othercomponents of the user cost.
Third, although analyzing these tax reforms is easy, implementing them is difficult.The most comprehensive reform of treating homeownership requires measuring imputedrents, calculating depreciation allowances, and recording maintenance expenses. In part, thispolicy would increase the cost of tax compliance for homeowners. However, valuing theimputed rents from owner-occupied housing creates bigger problems than justrecordkeeping: for many houses, a market rental value is hard to estimate. In addition tothe economic complications of these reforms, increasing the tax burden on homeownershipwould face political obstacles: since the mortgage interest deduction has long been a “sacred
cow” in tax policy, the political possibility of taxing imputed rent seems remote.
Overall, eliminating the tax subsidy to homeownership in the personal tax code bytaxing imputed rents would raise the user cost of homeownership by about 20 percent.These estimates of the size of the tax subsidy roughly conform to those in the previousliterature (e.g., Aaron (1972) and White and White (1977)). Incremental reforms, such aseliminating mortgage interest deductibility, would increase the user cost by less than 12percent. Given the assumptions underlying these estimates, they provide upper bounds onthe effect of tax policy on the cost of homeownership. These policies would directly effectthe two-thirds of Americans who own their homes; however, as discussed in the next section,these policies should be analyzed in conjunction with the tax treatment of rental property.
Tax Incentives & Rental Property
Since individuals choose whether to rent or own their homes, tax policies that affectthe user cost of homeownership cannot be completely separated from the tax treatment of rental property. For renters, rents depend on the user cost of rental property. Raising thecost of homeownership but not the user cost of rental property would induce individuals toswitch from owning to renting their homes.133 For individuals who switch from owning torenting, the cost of rental housing is greater than the user cost before the change in policybut less than the cost of homeownership after the policy change. Thus, the endogeneity of tenure status would dampen the reduction in housing investment induced by raising the user
cost of homeownership.
This endogeneity complicates analyzing the interaction between the tax treatment of housing and residential energy demand. Ignoring the shift from owning to renting that wouldoccur with the elimination of the tax subsidy for owner-occupied housing would overstate thepolicy’s effect on energy demand. Adjusting for the changes in tenure status would require
64

7/28/2019 ENVIRONMENTALLY RESPONSIBLE ENERGY PRICING
http://slidepdf.com/reader/full/environmentally-responsible-energy-pricing 111/138
Residential Energy Demand
simultaneously estimating changes in tenure status and amounts of residential energy.Another option for the analysis is to simultaneously change the tax treatment of rentalproperty such that rents would increase by the roughly the same proportion as the user cost
of homeownership. This option allows for the aggregation of rental and owner-occupiedhousing. The advantage of aggregating rental and owner-occupied housing is that thegeneral equilibrium tax effects discussed below do not distinguish between rental and owner-occupied housing. Section 3 analyzes energy demand by owner-occupiers ignoring the tenuredecision and energy demand by all households.
The user cost of rental property depends on the tax treatment of landlords.” Theuser cost for rental property depends on the landlord’s tax rate rather than the residents.The landlord’s tax rate could differ from the tenant’s either because tax rates are graduatedor because only the landlord itemizes deductions. With competition between landlords, rentsdepend on the tax code. Unlike owner-occupied housing, the rents from rental property are
taxed: the renter pays with income that is subject to the income tax and the landlord paystaxes on rents received. While this provision increases the tax burden on rental housing,rental property has a number of tax advantages relative to owner-occupied housing. As abusiness, the landlord can deduct maintenance expenses, property taxes, interest paymentsand depreciation allowances from income. The resulting user cost of rental property is:
(2)
where T is the landlord’s marginal tax rate, z is the present value of depreciation allowances
for $1 of investment, c, is the value of consumption from the rental property, P, is the priceof rental property, and other terms are defined as in equation (l).
The tax treatment of rental property as a business is similar to the policy proposedin the fifth row of Table 4.1: taxing rents but allowing deductions raises the user cost of homeownership by 19 percent. However, separating who owns the home from who livesthere creates a possible tax advantage for renting. An individual can choose between beingan owner-occupier without the taxation of imputed rents or renting from a landlord whovalues depreciation deductions highly because of a high marginal tax rate (see Gordon,Hines and Summers (1987)). This tax arbitrage opportunity between high tax bracketlandlords and low tax bracket renters could exist even if homeownership is taxed as a small
business. Depending on the parameters (e.g., generosity of depreciation allowances), theeffective tax rate on housing can either rise or fall with the marginal tax rate. The effectivetax rate is the percentage difference between the user cost with the tax system and the usercost without a tax system. For example, if investing one dollar generates depreciationallowances with a present value of one dollar, then increasing the tax rate decreases the user
65

7/28/2019 ENVIRONMENTALLY RESPONSIBLE ENERGY PRICING
http://slidepdf.com/reader/full/environmentally-responsible-energy-pricing 112/138
Environmentally Responsible Energy Pricing
cost (and the effective tax rate) because high tax rate investors have a higher value of theinterest deductions (i.e., a lower after-tax opportunity cost of capital).
As an example of why some people might prefer to rent for tax reasons, consider aperson with a tax rate of zero who can rent from a landlord with a tax rate of 45 percentand depreciation allowances with a present value of 70 cents for each dollar of investment.These parameters roughly correspond to U.S. tax policy before 1986 (see Gordon, Hines andSummers). The person with the zero tax rate has a user cost of homeownership of 0.139.In contrast, for the landlord, the user cost of rental property is 0.126. The low tax rateperson has an incentive to rent because the landlord has a lower after-tax opportunity costof capital. Relative to homeownership, renting lowers the individual’s cost of housing by 9.4percent ((0.139 - 0.126)/0.139).
In analyzing the effect of the tax treatment of housing on energy demand, one needs
to know whether to apply the tax subsidy to only owner-occupied housing or to a broadermeasure of the housing stock. As this example demonstrates, the tax treatment of landlordscan lower rents. In section 3, I use two measures of the size of the housing capital stock affected by the tax code: (1) assuming that the tax policy only addresses the personal taxcode subsidy to homeownership and that tenure choices do not change, I analyze the effectonly on the current stock of owner-occupied housing; and (2) assuming that the policychange simultaneously addresses the tax treatment of landlords, I analyze the effect of thesubsidy on the entire housing capital stock.
In terms of changing the user cost formula, policy reforms aimed at rental propertyare more subtle than those aimed at owner-occupied housing. Slower depreciation
allowances, stricter anti-tax shelter provisions, and a narrower spread between the tax ratesof landlords and tenants would all increase the user cost of rental property. The TaxReform Act of 1986 included all three of these changes to some degree (see Poterba(1990)). The user cost of rental property after 1986 is much closer to the user cost withouta tax system. Assuming that the present value of depreciation allowances fell to 50 centsper dollar invested and that the marginal landlord has a tax rate of 28 percent, the user costof rental property is 0.136 or a subsidy of 2.2 percent relative to not having an income tax.15
In considering changes in the tax treatment of owner-occupied housing, treatinghomeownership as a small business serves as a natural benchmark if imputed rents aretaxed, then housing faces the same level of taxation as nondurable consumption. For rentalproperty, however, there is not an obvious benchmark policy. The calculation of the 2.2
percent subsidy uses the user cost without a tax system as a benchmark. Anothercomparison is between the tax treatment of rental property and other investments: doesrental housing have a higher or lower effective tax rate than other uses of capital? However,comparisons with other investments introduce concerns regarding corporate level taxationof many alternative investments. The next section compares the level of taxation of housingand other capital.
66

7/28/2019 ENVIRONMENTALLY RESPONSIBLE ENERGY PRICING
http://slidepdf.com/reader/full/environmentally-responsible-energy-pricing 113/138

7/28/2019 ENVIRONMENTALLY RESPONSIBLE ENERGY PRICING
http://slidepdf.com/reader/full/environmentally-responsible-energy-pricing 114/138
Environmentally Responsible Energy Pricing
This difference is in addition to the tax advantages of housing that arise from the personaltax system.
Total Tax Subsidy on Housing
The tax treatment of homeownership, rental property and corporate capital combineto create a wedge between the pre-tax marginal product of corporate capital and the after-tax return to housing. This wedge is the total subsidy to housing from the tax system. Theprevious sections have given some of the details on each component of this wedge; however,these different tax provisions can be summarized as a subsidy at a rate s on the return tohousing relative to the pre-tax return to corporate capital:
rc = (l + s) rh(3)
where rc is the pre-tax return to corporate capital and rh is the rate of return to housingbefore taxes (price appreciation plus consumption value as a fraction of the total value of the house). This simple formula averages across rental and owner-occupied housing andacross individuals with different tax rates.
Table 4.3 aggregates the different elements of the favorable tax treatment of housinginto a single measure ofs. Column (1) of the table summarizes the personal tax advantagesto owner-occupied and rental housing. The personal tax advantage is the difference betweenthe tax treatment of housing and other non-durable consumption goods. To aggregate tothe tax subsidy on all residential capital, the tax advantages to owner-occupied and rental
housing are weighted by their shares in the housing stock. Column (2) is a rough estimateof the difference the taxation of noncorporate and corporate capital. This difference is therelative taxation of corporate capital and noncorporate capital that is subject to the personalincome tax. Column (3) is the total tax advantage of housing relative to corporate assets,the sum of columns (1) and (2).
Table 4.3 suggests that the tax system reduces the price of residential capital by 23percent relative to corporate capital. Much of this price reduction is concentrated on owner-occupied housing because of the favorable personal tax treatment of homeownership. Thesubsidy for owner-occupied housing is 26.3 percent relative to 15.2 percent for rentalhousing. About half of the subsidy for owner-occupied housing and the majority of the
subsidy for rental property come from the difference in taxation of corporate andnoncorporate assets.
While these parameters combine to yield a best guess of the magnitude of thefavorable tax treatment for housing, the exact size of the subsidy is uncertain. Both the usercost calculations and the effective tax rates between corporate and noncorporate capital are
68

7/28/2019 ENVIRONMENTALLY RESPONSIBLE ENERGY PRICING
http://slidepdf.com/reader/full/environmentally-responsible-energy-pricing 115/138
Residential Energy Demand
sensitive to assumptions about parameters. These parameters, such as interest rates and taxrates, change over time. Furthermore, some of the favorable tax treatment depends onspecific financing arrangements that may be endogenous to tax policy. For example, if
mortgage interest rates are higher than the return to savings for individuals, then the usercost of homeownership depends on the amount of borrowing which depends on tax rules fordeductibility. Despite these uncertainties, the estimates in Table 4.3 roughly approximatethe tax subsidy to housing.
4.2 THE COMPOSITION OF RESIDENTIAL ENERGY USE
The size of the subsidy to housing from the tax system is one of two main elementsin the interaction of the tax treatment of housing and energy demand. The other mainelement is the nature of residential energy demand. Residential energy consists of electricity(61%), natural gas (29%), oil (7%) and other sources (3%).” Residential energy
encompasses a variety of end uses: space heating, air conditioning, water heating, kitchenappliances, lighting, and other miscellaneous energy needs. Table 4.4 reports the breakdownof residential energy demand by end use, by region of the country, and house size for 1987.These data are from the Residential Energy Consumption Survey. The average U.S.household consumes 162 million BTUS of energy.20~ Space heating is the largest componentof residential energy demand covering 38 percent of the total. Air conditioning accounts foranother 9 percent of residential energy demand. Energy use for heating and cooling variesgreatly by region indicating the importance of climate for residential energy demand.
Miscellaneous energy demand, a broad category that includes such items as kitchenappliances and lighting, is the second largest category. Table 4.5 details the main categories
of miscellaneous demand for electricity. Electricity accounts for over 93 percent of the totalmiscellaneous energy demand.21’ Kitchen appliances are the most important group withinthe miscellaneous category using 48 percent of miscellaneous electricity. Other thanrefrigerators, which use almost one-third of all miscellaneous electricity, no single applianceaccounts for over 10 percent of the miscellaneous electricity demand.
While these statistics provide a useful summary of residential energy demand, thequestion remains whether they help in assessing the interaction between the tax subsidy andenergy demand. How do the changes in housing capital induced by the tax subsidy affectthese different categories of energy demand? One obstacle in answering this question is thatincreased expenditures on housing can purchase many different positive characteristics:
more rooms, a better location, a larger yard, more modem appliances are just a few of thedimensions of house quality.22a Some house characteristics, such as location and yard size,have little to do with energy demand. Other characteristics can either increase or decreaseenergy demand: for example, size is positively related withmore recently renovated) houses use less energy than older
energy demand but newer (orhouses.
69

7/28/2019 ENVIRONMENTALLY RESPONSIBLE ENERGY PRICING
http://slidepdf.com/reader/full/environmentally-responsible-energy-pricing 116/138
Environmentally Responsible Energy Pricing
Of the characteristics that increase energy demand, size is the easiest to compare withenergy use. Table 4.2 shows a strong positive relation between size and total energy use:increasing from the 1000- 1600 square foot range to the 2000-2400 square foot range
increases average energy demand by about 30 percent. However, the relation betweenenergy use and house size depends critically on the end use: energy for space heating andmiscellaneous uses increase considerably with house size, but water heating displays a muchweaker relation with house size. Also, this comparison does not control for otherdeterminants of energy demand that are correlated with house size, such as the number of people in the household. For example, even though larger houses are associated with usingmore energy to heat water, the relation between number of people in the household andenergy for hot water is much stronger than the relation with size: the typical 4 personhousehold uses 48 percent more energy for hot water than the typical 2 person household.23
Within the miscellaneous category energy for some appliances, such as televisions, mighthave little relation with house size but be strongly related to the characteristics of the
occupants.
Another house characteristic that might increase both house prices and energydemand is the number of miscellaneous appliances. Adding an appliance such as adishwasher increases the value of the house but also increases the demand for energy. Bysubsidizing consumer durables, the tax system encourages individuals to increase the numberof appliances in their homes. However, it is difficult to distinguish between the tax subsidyto homeownership and the tax subsidy to other durables. Consumer durables other thanhousing receive the same type of subsidy as owner-occupied homes: the implicit rentalincome from durables is not taxed. The distinction between the imputed rents from owner-occupied housing and durables within the house highlights a major problem in taxing
imputed rents from owner-occupied housing: does the imputed rent include the contentsof the house? If not, then a bias arises in favor of appliances rather than structures.24 If imputed rents from household durables are taxed, then logically the tax on imputed rentsshould extend to other durables, such as cars.
At least two positive housing characteristics reduce, rather than increase, energydemand: energy efficiency and vintage. Dinan and Miranowski (1989) find a positiverelation between house prices and energy efficiency. Their estimates imply that the housingmarket capitalizes improvements in energy efficiency at a 10 percent real discount rate.25
Since the tax subsidy reduces the cost of housing capital including any efficiencyimprovements, the tax treatment of owner-occupied housing encourages investments in
energy efficiency. Similarly, hedonic models of house prices reveal that, holding othercharacteristics fixed, newer houses are more valuable. Newer houses also use less energythan older houses: houses built after 1980 use one-third less energy for heating (controllingfor climate and house size) than houses built between 1950 and 1969.26 This statisticsuggests that the to the extent that tax subsidy encourages a newer housing stock, it reducesresidential energy demand.
70

7/28/2019 ENVIRONMENTALLY RESPONSIBLE ENERGY PRICING
http://slidepdf.com/reader/full/environmentally-responsible-energy-pricing 117/138
Residential Energy Demand
The net effect of the interaction between these different housing characteristics, thetax subsidy and energy demand is ambiguous. The model discussed in the next section treatshousing capital as a substitute for energy in producing housing services. As will be discussed
below, previous estimates of the substitutability between housing capital and residentialenergy suggest that there can only be limited substitution between capital and energy.
4.3 JOINT DEMAND FOR HOUSING AND RESIDENTIALENERGY
The amount of housing capital is directly tied to the amount of residential energyconsumed. In modeling the relation between housing and residential energy, Quigley(1984a) posits a production function for housing services with two inputs: housing capital(real estate) and energy. In turn, housing capital is a function of land and structures.
Quigley is mainly interested in how the increases in energy prices in the 1970s and 1980saffected the demand for residential energy, real estate and housing services. However, theestimated parameters can also be used to predict how tax policies that change the price of housing capital would affect residential energy.
Quigley models the supply of and demand for housing services in a competitivemarket. Housing services are produced from a nested constant elasticity of substitution(CES) production function combining land, structures and operating inputs?’ First, landand structures combine through a CES production function to produce housing capital.Second, housing capital and operating inputs (energy) combine through a CES productionfunction to produce housing services. The production function has constant returns to scale,
so competition implies a perfectly elastic supply of housing services. With competition, thesupply price of housing depends on input prices. Increasing the price on an input causes asubstitution away from that input (for a given level of housing services) and increases theprice of housing services.
Quigley estimates the quantity of housing services with a log-linear demand curve thatdepends on household income and the price of housing services implied by the productionfunction. The model is estimated using 7378 observations on new home sales from FederalHousing Administration insurance records for 5 metropolitan areas from 1974 through 1978.The advantage of using data from 1974 through 1978 is that relative input prices changeddramatically over the period: real energy prices rose by almost 40 percent. Only havingdata on new homes is a mixed blessing. The disadvantage is that the results might not revealchanges in the value of existing homes. The advantage is that new house designs are morelikely to be affected by changes in relative input prices. Since the estimates capture howhouse designs reflect relative prices, they are long-run estimates of changes in the housingstock. The estimated income elasticity for housing services is 0.34 and the estimated priceelasticity is -0.72.28
71

7/28/2019 ENVIRONMENTALLY RESPONSIBLE ENERGY PRICING
http://slidepdf.com/reader/full/environmentally-responsible-energy-pricing 118/138
Environmentally Responsible Energy Pricing
Unlike previous studies, Quigley also estimates an elasticity of substitution betweencapital and energy. This elasticity of substitution is estimated as 0.32 suggesting somelatitude for trading between capital and energy in producing housing services.29 Based on
the estimates of the substitutability of capital and energy and the demand parameters, a 10percent increase in energy prices is associated with a 0.9 percent decline in the demand forhousing services, 0.6 percent decline in the demand for real estate and a 2.8 percent declinein the demand for residential energy. This result suggests that policies targeted at changingthe price of energy (i.e., corrective energy taxes) would reduce energy demand withoutgreatly affecting the amount of housing capital.
The effect of eliminating the tax subsidy to housing on residential energy demandrequires asking the opposite question from Quigley: instead of estimating how increases inenergy prices affect the demand for housing services, removing the tax subsidy increases theprice of housing capital which lowers demand for housing services which includes residential
energy. For various changes in the price of housing capital (real estate), Table 4.6 reportsthe change in demand for housing services, real estate, and residential energy. For the 23percent increase in housing prices implied by eliminating the tax advantage to housing (seeTable 4.3), the demand for housing services would fall by 11.8 percent, the demand for realestate by 12.7 percent and the demand for residential energy by 6.8 percent. Thus, changingfrom the current tax system to one with neutral treatment between corporate and residentialcapital would reduce residential energy demand, though the effect might not be especiallylarge. In comparison, a tax on residential energy that increased the price by 20.0 percentwould induce the same reduction in residential energy demand. While a 20.0 percent taxon residential energy would induce the same reduction in energy demand, this tax is not aperfect substitute for eliminating the tax advantage of housing capital because the tax subsidy
to housing varies with income (since marginal tax rates depend on income) but the energytax would not vary by income.
The various entries in Table 4.6 correspond to alternative changes in the tax systemthat increase the relative price of housing capital and energy by more or less than 23percent. Table 4.7 summarizes the effects on residential energy demand of theaforementioned policies and several alternatives. Addressing the personal tax advantage tohousing without raising the tax on houses to the level of the tax on corporate capital wouldincrease the price of housing capital by 10 percent and reduce the demand for residentialenergy by 3.2 percent. Only raising the tax on owner-occupied housing to the level of taxation on corporate capital would increase the price of owner-occupied housing by 26
percent. Ignoring the endogeneity of tenure choice, this policy would reduce the demandfor residential energy by owner-occupiers by 7.5 percent.30 However, since owner-occupiersonly account for 74 percent of total residential energy demand, the total reduction inresidential energy demand would be only 5.6 percent.31
72

7/28/2019 ENVIRONMENTALLY RESPONSIBLE ENERGY PRICING
http://slidepdf.com/reader/full/environmentally-responsible-energy-pricing 119/138
Residential Energy Demand
Eliminating the deductibility of mortgage interest and property taxes -- a reform thatonly addresses part of the tax advantage of homeownership -- would have little effect onresidential energy demand. Assuming that 70 percent of middle income homeowners itemize
deductions and 100 percent of high income homeowners itemize deductions, eliminating thedeductibility of mortgage interest and property taxes would increase the weighted averageprice of housing by 6.7 percent. This increase in the price of housing capital would lowerthe demand for owner-occupied housing by about 4.3 percent (ignoring any effects on tenurechoice) and the demand for residential energy by homeowners by 2.9 percent or a 2.1percent reduction in total residential energy demand.
The change in residential energy demand induced by a change in the price of housingcapital can be decomposed into two parts. The first effect is the change in energy demandfor a change in the level of housing services with relative input prices constant. If thedemand for housing services fell by 11.8 percent without the change in relative prices, the
demand for residential energy would also fall by 11.8 percent.32 The second effect is asubstitution effect from the change in relative prices. Given a decrease of housing servicesby 11.8 percent, the substitution of energy for capital induced by the increase in the priceof housing capital increases the demand for residential energy by 5.0 percent (relative toenergy demand before the decrease in housing services). The net effect of eliminating thefavorable tax treatment of housing would be a 6.8 percent decrease in residential housing.However, this effect is much smaller than would be the case if one ignored thesubstitutability between housing capital and residential energy.
4.4 FURTHER ISSUES IN HOUSING AND ENERGY DEMAND
Increasing the level of taxation on housing to approximately the same as the taxationof other consumption goods and corporate investments lowers the demand for housingservices and, consequently, lowers the demand for residential energy. The 6.8 percentreduction in residential energy demand from eliminating the tax differential between housingand corporate capital is a 1.4 percent reduction in total U.S. energy consumption if energyused in other sectors of the economy does not change. However, this assumption -- thatenergy demand in other sectors is constant -- is suspect. A 11.8 percent reduction in housingservices would probably be accompanied by increased investment in other activities andincreased consumption of other goods. The net effect on total energy demand depends onthe increased energy demand associated with this increased investment and consumption.
The changes in investment and consumption induced by the increased taxation of housing create a labyrinth of general equilibrium effects. While a many-sector full generalequilibrium model of the economy might provide a rough estimate of these energy effects,tracing the exact change in total energy use from these effects is beyond the scope of thispaper.33w However, it is possible to put the potential reduction in residential energy in thecontext of the energy required for other consumption goods.
73

7/28/2019 ENVIRONMENTALLY RESPONSIBLE ENERGY PRICING
http://slidepdf.com/reader/full/environmentally-responsible-energy-pricing 120/138
Environmentally Responsible Energy Pricing
Energy required for final consumption of a good takes two forms: (1) energy usedby individuals in consuming the good (e.g., gasoline for a car) and (2) energy used toproduce goods and services. Input-output analysis measures the energy used introducing
goods and services. This analysis measures both the energy used directly introducing agood and the energy used in producing the inputs to the goods. Hannon, Blazeck, Kennedyand Illyes (1983) calculate energy intensities for 88 sectors in the economy. Compared toother goods, construction only uses a moderate amount of energy. The most energyintensive goods are chemicals, road construction, metal manufacturing,’ and transportationservices.34 Food, wood products (except paper), office machinery, and services (e.g.,communications) are among the least energy intensive commodities. In terms of energycontained in different goods, it is unlikely that consuming less housing and more of othergoods would greatly influence total energy demand. In general, changes in the product mixin the economy probably have only marginal effects on total energy used in production of goods.35
The analysis of the tax treatment of housing in sections 1 and 3 ignores tax incentivestargeted at improving energy efficiency. The user cost and general equilibrium models focuson the traditional public finance arguments of why housing is tax-favored. However, in thepast, the Federal tax code and many state tax codes have had specific incentives forinvestment in energy efficient housing. The Energy Tax Act of 1978 provided a tax creditof 15 percent of the investment (with a maximum credit of $300) for energy conservationmeasures such as adding insulation.36~ The credit was in effect from 1979 through 1985.Previous research on the effectiveness of energy tax credits has been inconclusive (for asummary, see Hassett and Metcalf (1992)). Hassett and Metcalf (1992) analyze the effectof energy conservation tax credits allowing for uncertainty in energy prices and irreversibilityof conservation investments. They find that while uncertainty in energy prices andirreversibility of investment lead to low level of conservation investment, the tax creditprograms have a statistically significant positive effect on the amount of investment. Theseprograms increase the tax subsidy to housing, but their targeted design results in increasedenergy conservation and possibly decreased energy use.
The model of the tax treatment of housing and residential energy demand increasingthe price of capital in a constant elasticity production function between housing capital andenergy abstracts from a wide variety of potential side-effects from changing the tax treatmentof housing. Building codes may prevent free substitution between energy and capital implied
by the unconstrained constant elasticity of substitution production function. If building codesprevent this substitution, then the model overstates the substitution effect of the increasedprice of capital and residential energy demand might decrease by more than 6.8 percent.Quigley (1984b) finds that the standards adopted by the California Energy Commission in1980 would result in a larger reduction in energy consumption in response to a 10 percentincrease in energy prices than would be implied by the substitution effect in the CESproduction function. The binding housing standards decrease individual welfare since the
74

7/28/2019 ENVIRONMENTALLY RESPONSIBLE ENERGY PRICING
http://slidepdf.com/reader/full/environmentally-responsible-energy-pricing 121/138
individuals are forced to alter their choice of housing capital and energy however, this policyis justifiable if the market price of energy does not fully reflect society’s value of energy.
Another side-effect that the model does not quantify is the possible effect on theorganization of the housing market. Increasing the price of housing capital might have twoeffects on the organization of housing markets that indirectly decrease total energy demand.First, decreasing housing consumption might result in more centralized cities which woulddecrease energy used in transportation, especially commuting. Second, the smaller housingstock might correspond to fewer single family detached houses and more multifamily housingunits that are more energy efficient. Assessing the importance of these indirect effectswould be mere speculation.
4.5 CONCLUSION
This paper analyzes the effect of eliminating the favorable tax treatment of housingon the demand for residential energy. Residential energy is used for heating, cooling,cooking and many other appliances. Despite the wide variety of end uses, energy is asubstitute for housing capital in producing housing services. Equalizing the taxation of noncorporate housing capital and corporate capital would increase the price of housingcapital by 23 percent which would reduce residential energy demand by 6.8 percent. Whileeliminating all of the tax advantages of housing would substantially decrease residentialenergy use, it would not substantially affect total energy demand: residential energy is only20 percent of total energy use and increased energy demand caused by the substitution togoods other than housing would offset, to some degree, the reduction in residential energy.
Analyzing the interaction between the tax treatment of housing and energy demandis important for tax policy for two reasons. First, although it is unlikely that the U.S. willrevoke the tax advantages of housing by reforming the income tax system in the near future,the tax differential between housing and other goods could be eliminated through a numberof other policy reforms. Examples include: (1) integrating the corporate and personal taxsystems which would eliminate the tax differential between corporate and noncorporatecapital; and (2) replacing the personal income tax with a a consumption tax that taxesimputed rents from owner-occupied housing.
37 Second, the interaction between housingand energy highlights the importance of the tax treatment of substitutes and complementsin designing tax policies aimed at reducing externalities. Eliminating the favorable tax
treatment of housing has roughly the same effect on residential energy demand as a 20percent tax on residential energy.
75

7/28/2019 ENVIRONMENTALLY RESPONSIBLE ENERGY PRICING
http://slidepdf.com/reader/full/environmentally-responsible-energy-pricing 122/138
Table 4.1: User Cost of HomeOwnership Under Various Tax Policies
Description of policy Implied user cost Percentage(User cost formula) for high income change from
taxpayer current policy
1.
Current policy (equation 1 in the text) 0.114 --
(l-@)(i +~P)+t3+m+ct-7r0
2.User cost without an income tax 0.139 +21.9%i+7P+t3+m+a-~e
3. Eliminate deductibility of mortgage interestand property taxes 0.127 +11.6%(l-@)Ei +(l-E)i +TP+t3+m+a-m0
4. Eliminate rollover and exclusion provisionsfor nominal capital gains on housing 0.118 +3.5%(l-@)(i +7p)+~+ m+cx-7rO+7W7r,
5. Tax imputed rents, allow deduction formortgage int., prop. tax, dep’n and 0.136 +19.3%maintenance[(1 - @)i + 8 + a - 7rC](l - 20)/(1 -@) + r, +m
The following parameters are taken from similar calculations in Poterba (1990): a nominalinterest rate, i, of 7 percent; a property tax rate, TP, of 2 percent of the property value; adepreciation rate, & of 2.5 percent; maintenance costs, m, of 1.4 percent; a risk premiumfor housing, a, of 4 percent; and an expected inflation, m., of 3 percent. The marginal taxrate on ordinary income, @, is assumed to be 28 percent. In the case that eliminates therollover and exclusion provisions, the accrual equivalent effective tax rate, rq, is assumed tobe one-half of the ordinary income tax rate (14 percent) to reflect the value of deferral.When the user cost depends upon the size of the mortgage, the equity-to-value ratio, E, istaken as 60 percent which roughly corresponds to the average value for the 1980s from theFederal Reserve Board’s Flow of Funds and Savings Section, 1988 (see Manchester andPoterba (1989)). The parameter z accounts for the present value of the depreciation
allowances for $1 of investment. Following Gordon, Hines and Summers (1987), z isapproximated as 0.5.
These calculations are made under two assumptions. First, the supply of housing is infinitelyelastic, so the tax (subsidy) falls on the consumer. Second, the changes in tax policy do notaffect the nominal interest rate, the risk premium, or the property tax rate.
76
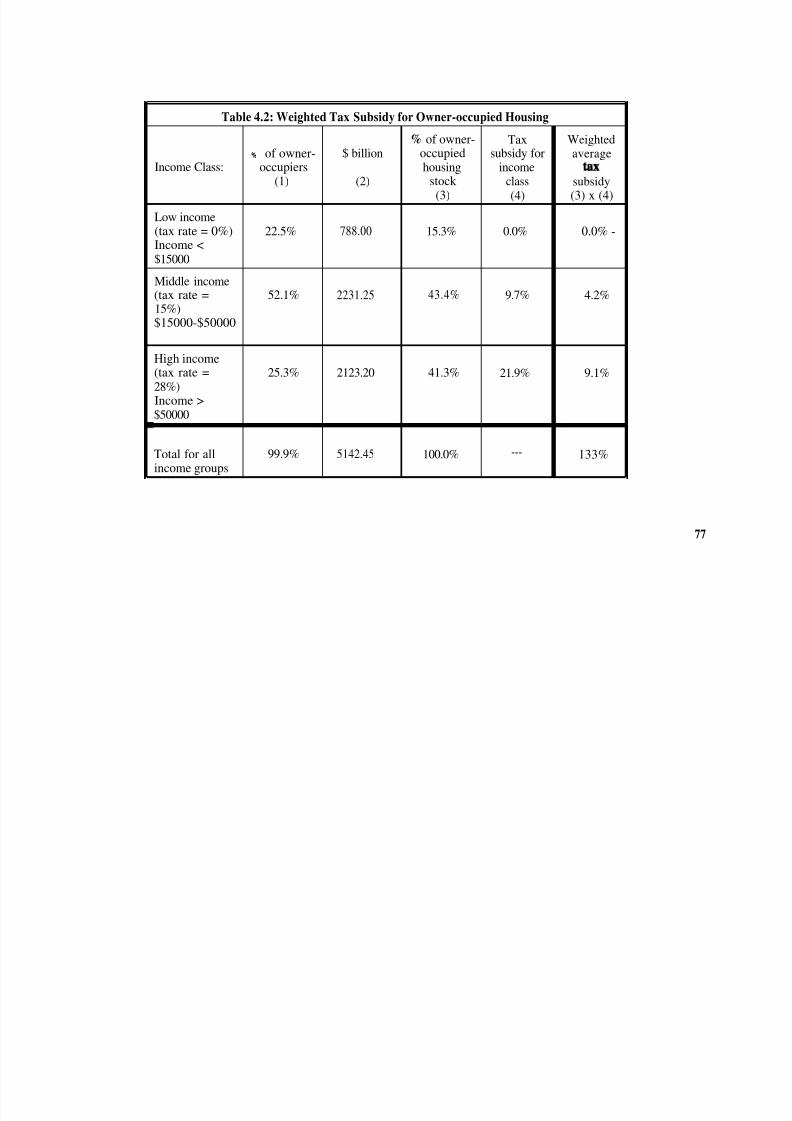
7/28/2019 ENVIRONMENTALLY RESPONSIBLE ENERGY PRICING
http://slidepdf.com/reader/full/environmentally-responsible-energy-pricing 123/138
Table 4.2: Weighted Tax Subsidy for Owner-occupied Housing
% of owner- Tax Weighted% of owner- $ billion occupied subsidy for average
Income Class: occupiers housing income(1) (2) stock class subsidy
(3) (4) (3) x (4)
Low income(tax rate = 0%) 22.5% 788.00 15.3% 0.0% 0.0% -Income <$15000
Middle income(tax rate = 52.1% 2231.25 43.4% 9.7% 4.2%15%)$15000-$50000
High income(tax rate = 25.3% 2123.20 41.3% 21.9% 9.1%
28%)Income >$50000
Total for all 99.9% 5142.45 100.0% --- 133%income groups
77

7/28/2019 ENVIRONMENTALLY RESPONSIBLE ENERGY PRICING
http://slidepdf.com/reader/full/environmentally-responsible-energy-pricing 124/138
Source: Consumer ExpenditureSurvey (CES) for 1989 for income distribution of tenure status and house values. Column(1)is the percentage of households in the income class that own their homes. Column (2) is the estimated value of homes ownedby households in the income class from the CES. Column (3) is the percentage of the total value of the owner-occupied housingstock owned by households in the income class (the entry in column (2) divided by $5142.45 billion). Column (4) are the taxsubsidies for homeownership for the income class. These subsidies are from author’s calculations using user cost formula similarto table 1. For owners, the percentage subsidy is the percentage increase in the user cost of moving from line 1 of table 1 toline 2 of table 1 for different marginal tax rates.
78

7/28/2019 ENVIRONMENTALLY RESPONSIBLE ENERGY PRICING
http://slidepdf.com/reader/full/environmentally-responsible-energy-pricing 125/138
Table 4.3: Total Tax Subsidy to Housing Relative to Corporate Assets
Personal Tax Corporate Tax Total TaxAdvantage Advantage Advantage
(1) (2) (1) + (2) = (3)
Owner-occupied 13.3% 13.0% 26.3%Housing
Rental Housing 2 . 2 % 13.0% 15.2%
WeightedAverage for all 10.0% 13.0% 23.0%ResidentialCapital
Weights for owner-occupied (70%) and rental housing (30%) are from the Survey of CurrentBusiness, August 1990, Table 9, page 101. The personal tax advantage for owner-occupiedhousing is from the calculations in Table 2 (and described in the text). The personal taxadvantage for rental housing is described in section I.B. The corporate tax advantage is thean average from the difference in the effective tax rates on corporate and noncorporatecapital taken from Fullerton, Gillette and Mackie (1987) and Fullerton and Karayannis(1992) (described in section I.C).
79

7/28/2019 ENVIRONMENTALLY RESPONSIBLE ENERGY PRICING
http://slidepdf.com/reader/full/environmentally-responsible-energy-pricing 126/138
Table 4.4 Composition of Residential Energy Use, By Region and Size of Unit, 1987
Housing BTUs per Space Heat Water Heat Air Cond. Misc.units housing
unit BTUs BTUs % BTUs % BTUs% %
National 90.5 161.9 60.7 38 233 15 14.4 9 61.1 38
By Region:
Northeast 19.0 162.7 83.9 52 18.2 11 6.0 4 54.7 33
Midwest 22.3 170.0 73.8 44 23.8 16 11.7 7 60.7 36
South 30.9 163.0 45.2 28 25.1 15 26.7 16 65.7 40
West 18.3 131.2 39.2 29 24.5 19 6.0 5 61.1 47
By sq. footage:
<999 32.3 114.3 42.9 38 20.1 18 9.2 8 42.1 371000-1600 25.6 155.8 54.1 35 24.4 16 15.1 10 62.1 40
1600-2000 11.2 183.9 70.6 38 24.2 13 18.4 10 70.6 38
2000-2400 8.4 201.7 79.5 40 25.9 13 17.7 9 78.6 39
>2400 13.0 233.8 98.9 42 26.1 11 23.8 10 85.1 36
80

7/28/2019 ENVIRONMENTALLY RESPONSIBLE ENERGY PRICING
http://slidepdf.com/reader/full/environmentally-responsible-energy-pricing 127/138
Housing units are in millions. BTUS are in millions. Housing units include houses, apartments, mobile homes for both owner-occupied and renters. For comparability between site electricity BTUS and fossil fuel BTUS, site electricity BTUS are multipliedby three.
Source: Household Energy Consumption and Ex p enditures 1987, Part 1: National Data, Energy Information Administration, U.S.Department of Energy (1989), pages 89, 93, 95, and 98.
81

7/28/2019 ENVIRONMENTALLY RESPONSIBLE ENERGY PRICING
http://slidepdf.com/reader/full/environmentally-responsible-energy-pricing 128/138
Table 4.5: Miscellaneous Electricity Use, By Appliance, 1987
Energy Use as a Energy Use as a
Percentage of Percentage of Appliance: Miscellaneous Total
Electricity Electricity
Kitchen: 48.4 30.2
Refrigerators 31.8 19.8
Freezers 8.1 5.1
Range/Oven 6.1 3.8
Microwave Ovens 1.1 0.7
Dishwashers 1.3 0.8
Clothes Dryers 9.0 5.6
Clothes Washers 1.4 0.8
Televisions 9.2 5.7
Furnace Fans 6.0 3.8
Water-Bed Heaters 4.0 2.5
Other 22.9 13.2
Miscellaneous electricity use accounts for 62,4 percent of total electricity use.
The other category includes lighting, small cooking appliances, computers, electric tools, ceilingfans, electric blankets and other electric appliances.
Source: Household Energy Consumption and Expenditures 1987, Part 1: National Data,Energy Information Administration, U.S. Department of Energy (1989), page 10.
82

7/28/2019 ENVIRONMENTALLY RESPONSIBLE ENERGY PRICING
http://slidepdf.com/reader/full/environmentally-responsible-energy-pricing 129/138

7/28/2019 ENVIRONMENTALLY RESPONSIBLE ENERGY PRICING
http://slidepdf.com/reader/full/environmentally-responsible-energy-pricing 130/138
Table 4.7: The Effects of Alternative Policies on Residential Energy Demand
Change inPolicy Alternative: Residential Energy
Demand
1. Raise the level of taxation on housing (owner-occupied andrental) to the level of taxation of corporate capital -6,8%(A 23.0% increase in the cost of housing capital)
2. A 20% increase in the price of residential energy -6.8%
3. Eliminate the personal tax advantage owner-occupied andrental housing with addressing the advantage created by the -3.2%
corporate tax (A 10% increase in the cost of housing capital)
4. Raise the level of taxation on owner-occupied housing to thelevel of taxation of corporate capital without addressing rental -5.6%property(A 26.0% increase in the cost of owner-occupied housing)
5. Eliminate the deductibility of mortgage interest and propertytaxes for owner-occupiers -2.1%(A 6.7% increase in the price of owner-occupied housing)
Source: Author’s calculations from tables 3 and 6, as described in the text.
84

7/28/2019 ENVIRONMENTALLY RESPONSIBLE ENERGY PRICING
http://slidepdf.com/reader/full/environmentally-responsible-energy-pricing 131/138
REFERENCES
Aaron, H. J., 1972, Shelter and Subsidies: Who Benefits from Federal Housing Policies,Washington, DC: Brookings Institution.
Bradford, D. F., 1986, Untangling the Income Tax, Cambridge: Harvard University Press.
Carlton, D. and G. Loury, 1980, “The Limitation of Pigouvian Taxes as a Long-Run Remedyfor Externalities,” Quarterly Journal of Economics, 94:559-566.
Cordes, J. J. and H. Galper, 1985, “Tax Shelter Activity Lessons from Twenty Years of Evidence,” National Tax Journal, 38:305-324.
Council of Economic Advisors, 1991, Economic Report of the President, Washington, DC: U.S.Government Printing Office.
Crandall, R., 1983, Controlling Industrial Pollution: The Economics and Politics of Clean Air,Washington, DC: Brookings Institution.
Dinan, T. M. and J. A. Miranowski, 1989, “Estimating the Implicit Price of Energy EfficiencyImprovements in the Residential Housing Market: A Hedonic Approach,” Journal of UrbanEconomics, 25:52-67.
Evans, J. S., 1984, “Cross-Sectional Mortality Studies and Air Pollution Risk Assessment,”Energy International, 10:55-83.
Fullerton, D., R. Gillette, and J. Mackie, 1987, “Investment Incentives Under the Tax Reform
Act of 1986,” in Compendium of Tax Research, 1987, Office of Tax Analysis, U.S. Departmentof the Treasury, 131-171.
Fullerton, D. and M. Karayannis, 1992, “Tax Evasion and the Allocation of Capital,” mimeo,Carnegie Mellon University.
Gordon, R. H., J. R. Hines, Jr., and L. H. Summers, 1987, “Notes on the Tax Treatment of Structures,” in The Effects of Taxation on Capital Accumulation, ed. by M. S. Feldstein, 223-254, University of Chicago Press.
Goulder, L. H., 1992, “Do the Costs of a Carbon Tax Vanish When Interactions with Other
Taxes are Accounted For?,” National Bureau of Economic Research Working Paper No. 4061.
Hall, D. H., 1990, “Preliminary Estimates of Cumulative Private and External Costs of Energy,”Contemporary Policy Issues, 8(3):283-307.
85

7/28/2019 ENVIRONMENTALLY RESPONSIBLE ENERGY PRICING
http://slidepdf.com/reader/full/environmentally-responsible-energy-pricing 132/138
Hannon, B., T. Blazeck, D. Kemedy, and R. Illyes, 1983, “A Comparison of Energy Intensities:1963, 1967 and 1972,” Resources and Energy, 5:83-102.
Hassett, K A. and G. E. Metcalf, 1992, “Energy Tax Credits and Residential ConservationInvestment,” National Bureau of Economic Research Working Paper No. 4020.
Hausman, J. A., 1979, “Individual Discount Rates and the Purchase and Utilization of Energy-using Durables,” Bell Journal of Economics, 10:33-54.
Hoyt, W. H. and S. S. Rosenthal, 1990, “Capital Gains Taxation and the Demand for Owner-occupied Housing,” Review of Economics and Statistics, 72:45-54.
Johnson, R. C. and D. L. Kasserman, 1983, “Housing Market Capitalization of Energy-savingDurable Good Investments,” Economic -21:374-386.
Khazzoom, J. D., 1987, "The Demand for Insulation --A Study in the Household Demand for
Conservation,” The Energy Journal, 8:73-92.
King, M. A. and D. Fullerton, 1984, The Taxation of Income from Capital, Chicago: Universityof Chicago Press.
Krenz, J. H., 1976, “Energy per Dollar Value of Consumer goods and Services," IEEETransactions on Systems. Man. @ Cybernetics, July, vol. SMC-4, 386-388.
Lave, L. B., cd., 1982, Quantitative Risk Assessment in Regulation, Washington, DC: BrookingsInstitution.
Lave, L. B. and E. P. Seskin, 1978, Air Pollution and Human Health, Baltimore: Johns HopkinsPress for Resources for the Future.
Longstreth, M., A. R. Coveney and J. S. Bowers, 1985, ‘The Effects of Changes in ImplicitEnergy Costs on Housing Prices,” Journal of Consumer Affairs, 19:57-73.
MacRae, C. D. and M. A. Turner, 1981, “Estimating Demand for Owner-occupied HousingSubject to the Income Tax," Journal of Urban Economics, 10:338-356.
Manchester, J. M. and J. M. Poterba, 1989, “Second Mortgages and Household Saving,”Regional Science and Urban Economics, 19:325-346.
National Academy of Sciences, 1991, Policy Implications of Greenhouse Warming, Washington,DC: National Academy of Sciences.
New York State Energy Office, 1991, Draft New York State Energy Plan, Executive Summary.
86

7/28/2019 ENVIRONMENTALLY RESPONSIBLE ENERGY PRICING
http://slidepdf.com/reader/full/environmentally-responsible-energy-pricing 133/138
Nichols, A. L. and R. J. Zeckhauser, 1986, ‘The Perils of Prudence,” Regulation, 10:13-24.
Nordhaus, W. D. and G. P. Yohe, 1983,
Palmquist, R. B., 1984, “Estimating the Demand for the Characteristics of Housing,” Review
of Economics and Statistics, 66:394-404.
Poterba, J. M., 1984, ‘Tax Subsidies to Owner-occupied Housing: An Asset-Market Approach,”Quarterly Journal of Economics, 99:729-752.
Poterba, J. M., 1990, ‘Taxation and Housing Markets: Preliminary Evidence on the Effects of Recent Tax Reforms,” in Do Taxes Matter? The Impact of the Tax Reform Act of 1986, ed.by J. Slemrod, 141-160, Cambridge: MIT Press.
Poterba, J. M., 1991, ‘Tax Policy to Combat Global Warming: On Designing a Carbon Tax,”in Global Warming: Economic Policy Responses, ed. by R. Dornbusch and J. M. Poterba, 71-
98, Cambridge: MIT Press.
Quigley, J. M., 1984a, ‘The Production of Housing Services and the Derived Demand forResidential Energy,” Rand Journal of Economics j 15:555-567.
Quigley, J. M., 1984b, “Residential Energy Standards and the Housing Market: A RegionalAnalysis,” International Regional Science Review, 9:201-216.
Quigley, J. M. and D. L. Rubinfeld, 1989, “Unobservable in Consumer Choice: ResidentialEnergy and the Demand for Comfort,” Review of Economics and Statistics, 71:416-425.
Rosen, H. S., 1979, “Housing Decisions and the U.S. Income Tax: An Econometric Analysis,”Journal of Public Economics, 11:1-23.
Rosen, H. S., 1985, “Housing Subsidies: Effects on Housing Decisions, Efficiency, and Equity,”in Handbook of Public Economics, volume 1, ed. by A. J. Auerbach and M. S. Feldstein, 375-420, North-Holland.
Ruderman, H., M. D. Levine and J. E. McMahon, 1987, ‘The Behavior of the Market forEnergy Efficiency in Residential Appliances Including Heating and Cooling Equipment, TheEnergy Journal, 8:101-124.
Schelling, T. C., 1983, “Climatic Change: Implications for Welfare and Policy,” ChantingClimate. Report of the Carbon Dioxide Assessment Committee, Washington, DC: NationalAcademy Press.
87
7/28/2019 ENVIRONMENTALLY RESPONSIBLE ENERGY PRICING
http://slidepdf.com/reader/full/environmentally-responsible-energy-pricing 134/138
__ _ _ _ _ _ _ _ _ 1991, “Economic Responses to Global Warming: Prospects for CooperativeApproaches,” in R. Dornbusch and J.M. Poterba, eds., 1991, Global Warming: Economic PolicyResponses Cambridge: MIT Press, pp. 197-221.
Schneider, S. H., 1989, Global Warming: Are We Entering the Greenhouse Century?, San
Francisco: Sierra Club Books.
U.S. Department of Energy, 1989, Household Energy Consumption and Expenditures 1987,Part 1: National Data, Washington, DC: U.S. Government Printing Office.
U.S. Department of Treasury, 1992, Integration of the Individual@ Corporate Tax Systems:Taxing Business Income Once, Washington, DC: U.S. Government Printing Office.
White, M. J. and L. J. White, 1977, “The Tax Subsidy to Owner-Occupied Housing: WhoBenefits?,” Journal of Public Economics, 3:111-126.
Wilson, R. and E. A. C. Crouch, 1991, “Risk Assessment and Comparisons: An Introduction,”Science, 252:522-528.
Woodward, S. E. and J. C. Weicher, 1989, “Goring the Wrong Ox: A Defense of the MortgageInterest Deduction,” National Tax Journal, 42:301-313.
Zeckhauser, R. J. and W. K. Viscusi, 1990, “Risk Within Reason,” Science, 248(4955):559-563.
88
7/28/2019 ENVIRONMENTALLY RESPONSIBLE ENERGY PRICING
http://slidepdf.com/reader/full/environmentally-responsible-energy-pricing 135/138

7/28/2019 ENVIRONMENTALLY RESPONSIBLE ENERGY PRICING
http://slidepdf.com/reader/full/environmentally-responsible-energy-pricing 136/138
allowing depreciation allowances is consistent with the policy of not taxing the imputedrents from homeownership.
10. Depreciation allowances create two tax-minimizing strategies: (1) borrowing toincrease the sum of interest and depreciation deductions, a tax sheltering strategy often
associated with partnerships (see Cordes and Galper (1985)); and (2) “churning” by whichassets are sold frequently to increase the total value of their depreciation allowanceswhen the tax system allows accelerated depreciation (see Gordon, Hines and Summers(1987)).
11. Depreciation allowances with a present value of fifty cents for every dollar investedroughly correspond to the present value of current depreciation allowances for businessstructures (using a discount rate of 6 percent). Currently, for tax purposes, businessstructures can be depreciated using straight-line depreciation over 27.5 years.
12. If the taxpayer received depreciation allowances with a present value of $1 for each
dollar invested (z = 1, in the formula in table 1), the user cost would only rise by 5%.The tax system would still provide a generous subsidy because the opportunity cost of capital is the after-tax return on bonds that are assumed to be taxed at the marginal taxrate for ordinary income. In contrast, if the taxpayer cannot deduct depreciation (z = O),the user cost would increase by 3 4 %
13. Rosen (1979) estimates that taxing imputed rents for homeowners would decreasesthe incidence of homeownership by over 4 percentage points.
14. I implicitly assume that rental property is owned by individuals or partnerships ratherthan corporations. See Poterba (1990) for a summary of the debate on the marginalsource of investment in rental housing.
15. As with homeownership, this subsidy is the same as the subsidy relative to an incometax on economic income with a perfectly competitive housing market and constantreturns to scale production.
16. As discussed below, similar to owner-occupied housing, the imputed rents fromconsumer durables are not taxed.
17. The comparisons for different types of capital are for 1989 from the Bureau of Economic Analysis, Survey of Current Business, August 1990, page 101, tables 5 and 9.
18. For a rich description of these interactions, see King and Fullerton (1984).
19. Source: Office of Technology Assessment, Building Energy Efficiency, 1992, p. 17.
These statistics mask the heterogeneity in sources for residential energy becauseelectricity is generated from a variety of fuels.
20. For comparability between electricity BTUS delivered to houses and fossil fuel BTUScontained in natural gas, electricity BTUS are multiplied by three throughout the paper.

7/28/2019 ENVIRONMENTALLY RESPONSIBLE ENERGY PRICING
http://slidepdf.com/reader/full/environmentally-responsible-energy-pricing 137/138

7/28/2019 ENVIRONMENTALLY RESPONSIBLE ENERGY PRICING
http://slidepdf.com/reader/full/environmentally-responsible-energy-pricing 138/138
32. If relative input prices are constant, the percentage decrease in residential energydemand equals the percentage decrease in housing services because the estimatedproduction (constant elasticity of substitution) has constant returns to scale.
33. Constructing a general equilibrium model that adequately captures the interaction
between housing capital, residential energy, the demand for other goods and investmentin alternative investments would be a difficult task. Among the more complex features of the model would be knowing the degree to which lower consumption of housing increasesconsumption of other goods as opposed to investment in alternative assets. Furthermore,individuals could switch to investing abroad which would complicate the effects on energydemand since the problem would expand to include foreign and domestic energy use.
34. The input-output analysis only includes commercially-produced transportationservices. Energy used by individuals to produce transportation is recorded as directhousehold consumption.
35. See Krenz (1976), page 387.
36. In addition, the Energy Act of 1978 provided larger credits for investment in solar,wind and geothermal energy equipment.
37. For a full explanation of the integration of personal and corporate taxation, see U.S.Department of Treasury (1992). For a discussion of the options of taxing consumptionrather than income and the tax treatment of housing under different consumption taxplans, see Bradford (1986).