enviz: a cytoscape app for integrated statistical analysis ... · page 1 of 40 tutorial: enviz...
TRANSCRIPT
Page 1 of 40 Tutorial: ENViz
ENViz: A Cytoscape App for Integrated
Statistical Analysis and Visualization of Sample-Matched Data with Multiple Data Types
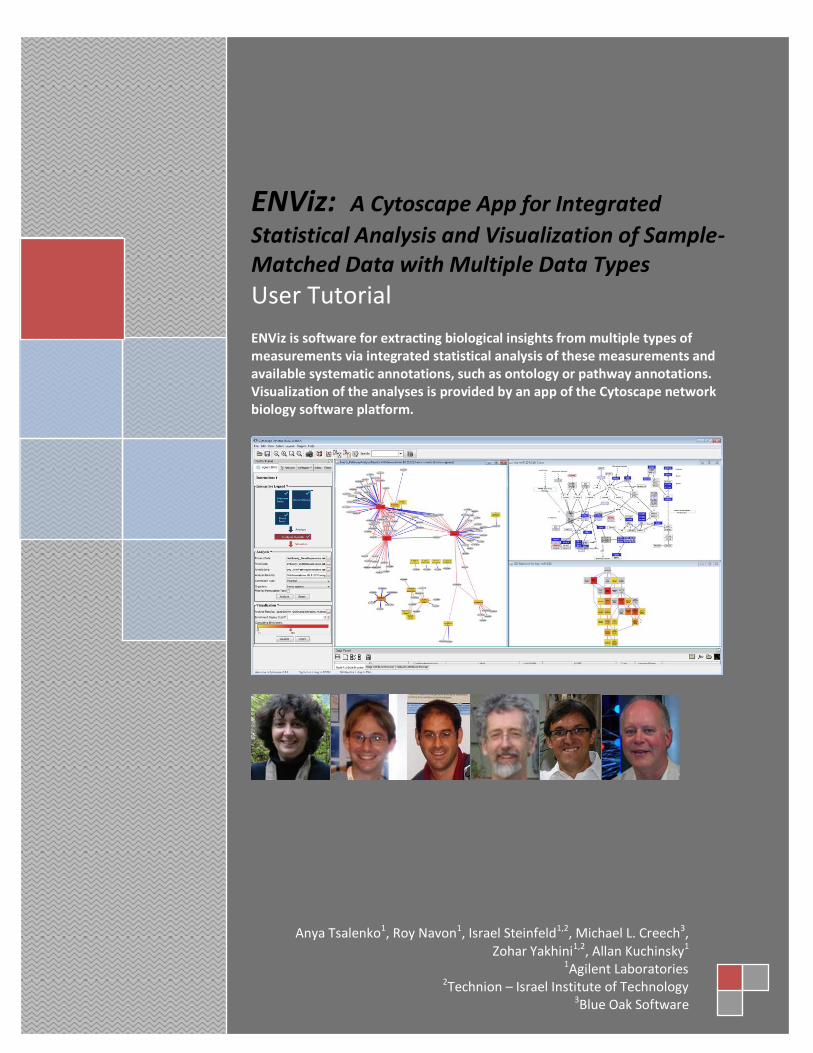
User Tutorial ENViz is software for extracting biological insights from multiple types of measurements via integrated statistical analysis of these measurements and available systematic annotations, such as ontology or pathway annotations. Visualization of the analyses is provided by an app of the Cytoscape network biology software platform.
Anya Tsalenko1, Roy Navon1, Israel Steinfeld1,2, Michael L. Creech3, Zohar Yakhini1,2, Allan Kuchinsky1
1Agilent Laboratories 2Technion – Israel Institute of Technology
3Blue Oak Software

Page 2 of 40 Tutorial: ENViz
In memory
Allan Kuchinsky, a colleague, a mentor, a fellow scientist, a dedicated friend. Allan was the living spirit behind ENViz. He passed away not long before we finished working on this project, leaving us all in shock and agony. Allan identified the potential for weaving a joint data analysis approach into Cytoscape and led us all through executing and completing this task. Even though Allan was constantly fighting cancer and its complications, he led our team with great enthusiasm to cross countless obstacles to make ENViz a reality. Allan also worked with great excitement with collaborators to apply ENViz to scientific studies and to learn how we could improve, provide more information, and add the correct touch of extra functionality. Allan’s work and enthusiasm brought the software to its current state, ready for release. We continue to learn from Allan--his work is still here for us to follow and trust. Above all, Allan was a dedicated friend. We will always remember Allan’s human warmth and his appreciation to the team’s work. We dedicate ENViz to Allan’s memory, as a scientist and as a human being. Always with a smile and always excited to discuss new science and how software can make it better.
Page 3 of 40 Tutorial: ENViz
ENViz User Tutorial
1. Welcome to ENViz
1.1 Introduction to ENViz
1.2 Installation
1.3 Input files
1.4 Example dataset
2. ENViz Analysis
2.1 Starting ENViz
2.2 Setting up input and results files
2.3 Running analysis 2.4 Filtering analysis results by permutation test
2.5 Generating annotation files
2.6 Good analysis practices
3. Visualizing Analysis Results
3.1 Enrichment networks
3.2 Pathway enrichment visualization
3.3 Gene Ontology enrichment visualization 3.4 Viewing and saving enrichment statistics
3.5 Color controls
3.6 Visualization of saved results
3.7 Visualization of generic enrichment data
4. ENViz Operational Notes
4.1 Destroying and recreating network views
4.2 Creating sub-networks from ENViz enrichment networks 4.3 Saving and Restoring Sessions
5. Software license
6. Acknowledgments
A. Appendix - Overview of ENViz Enrichment Analysis
Page 4 of 40 Tutorial: ENViz
1. Welcome to ENViz
ENViz (Enrichment Analysis and Visualization) performs joint enrichment analysis of two types of sample matched datasets and available systematic annotations. Examples of
such data sets may be gene expression, miRNA or other non-coding RNA expression, or
proteomics measurements collected in the same set of samples, together with pathway,
gene ontology (GO) or any custom annotation of the data. Enrichment analysis is based on minimum hypergeometric statistics [2, 3]. Results of enrichment analysis are
visualized as an interactive Cytoscape network, and could be visually overlaid on
biological pathways or GO hierarchy.
1.1. Introduction to ENViz
Over recent years, modern biology has undergone an information revolution, which is
evident in a shift of thinking and practice. While typical biological studies are
focused on specific pathways, like the p53 signaling pathway, the emergence of
novel high-throughput technologies now enables the quantification of biological features in a genome-wide scale. The rapid development of technology, in
particular, enabled measurements of mRNA expression levels, miRNA expression
levels, DNA methylation states, DNA copy number, etc. Various methodologies have
been developed, in recent years, to handle integrated analysis of functional genomics
data, mainly by studying the transcriptional programs and global organization of biological processes. Still, only a few tools support routine joint analysis of sample
cohort with multiple genomic measurement results. No such tools provide the
visualization strength of Cytoscape. In ENViz we aimed to provide a tool that enables
joint analysis and harnesses Cytoscape to support and provide a visualization interface.
ENViz approach to integrated data analysis uses the power of enrichment statistics
and knowledge of genomic annotation databases to assign relevant function annotations to profiled elements and to gain better understating of the relationship
between different molecular levels in the cells.
The basic idea is to first rank the informative elements according to a particular
aspect of the non-informative dataset and then search for enrichment of interesting annotations in the ranked list of elements. The enrichment results are therefore
directly assigned to the un-annotated profiled elements.
Even though development of ENViz was motivated by available modern biological measurements, joint analysis of two sample matched datasets and systematic
annotations may be applied to other measurement that fit in the setup described
below.
Page 5 of 40 Tutorial: ENViz
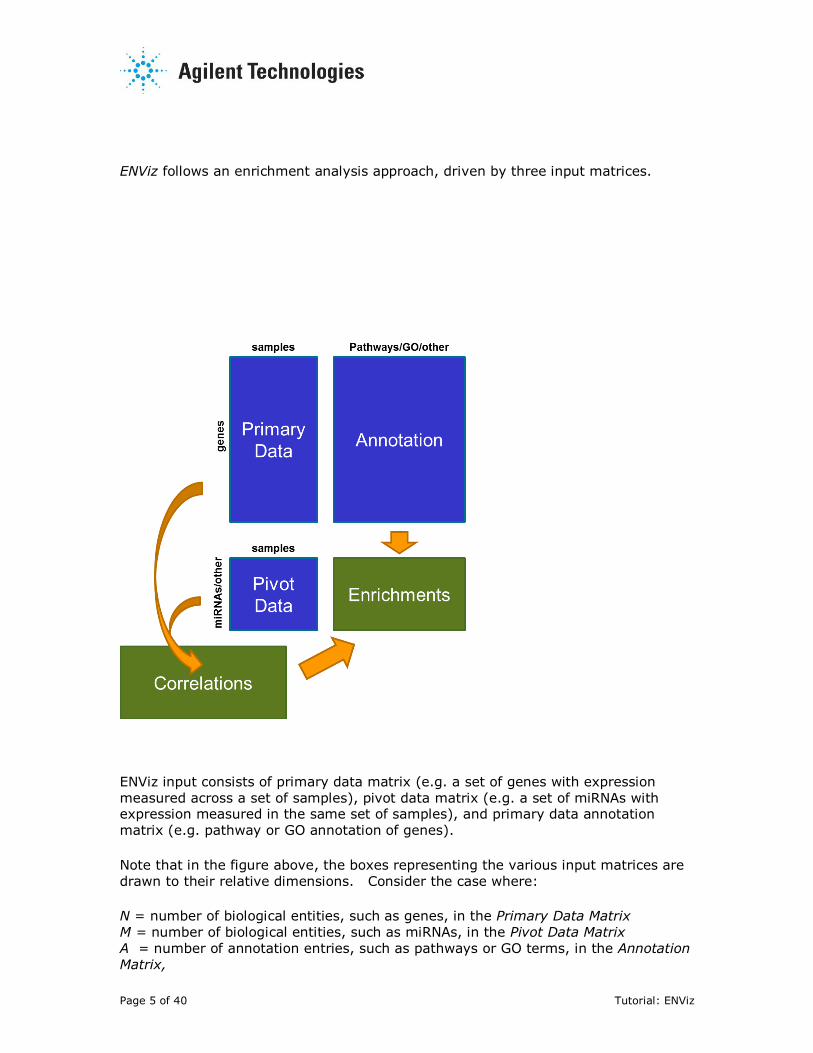
ENViz follows an enrichment analysis approach, driven by three input matrices.
ENViz input consists of primary data matrix (e.g. a set of genes with expression
measured across a set of samples), pivot data matrix (e.g. a set of miRNAs with expression measured in the same set of samples), and primary data annotation
matrix (e.g. pathway or GO annotation of genes).
Note that in the figure above, the boxes representing the various input matrices are
drawn to their relative dimensions. Consider the case where:
N = number of biological entities, such as genes, in the Primary Data Matrix
M = number of biological entities, such as miRNAs, in the Pivot Data Matrix
A = number of annotation entries, such as pathways or GO terms, in the Annotation
Matrix,
Page 6 of 40 Tutorial: ENViz
S = number of samples.
Then N * S = dimensions of Primary Data Matrix
M * S = dimensions of Pivot Data Matrix
N * A = dimensions of Annotation Matrix
M * A = dimensions of Enrichments Matrix N * M = dimensions of Correlations Matrix
ENViz analyses a primary data set with respect to a pivot data set and primary data
annotation in the following way. For each pivot entry,
we compute the correlation of pivot data to each element of primary data across all samples
we rank elements of the primary data based on this correlation (or anti-
correlation), and
compute the statistical enrichment of annotation elements (gene sets) in the top of this ranked list based on an mHG (minimum hypergeometric [2,3]) statistics.
Details of mHG statistics are explained in [2, 3, 5]. Briefly, for each annotation
element, we do the following. We consider top k ranking (by correlation) primary
data elements (genes), and compute enrichment of this annotation element in the
top k genes based on the hypergeometric statistics. We repeat this process for all threshold values, k, and choose k that optimizes the hypergeometric significance. A
bound on the corresponding p-value is calculated to correct for multiple testing [2, 3]
and an mHG score ≤-log10(mHG p-value) is reported (large values of the mHG score
represent significant enrichments). The correction is valid for every individual pivot element, but all enrichment results are not corrected for the number of pivot
elements and the number of annotation elements. For guidance on this next level of
correction please see Section 2.6 below.
Significant results are represented in Cytoscape as an enrichment network - a bipartite graph with nodes corresponding to pivot and annotation elements, and
edges corresponding to pivot-annotation entry pairs with enrichment scores better
than the user defined threshold. In addition,
for analysis of enrichment in biological pathways, correlations of primary data
and corresponding pivot data are visually overlaid on biological pathways for each significant pivot-annotation pair, using the WikiPathways [4] resource.
enrichments of GO categories are overlaid on top of the Gene Ontology DAG.
Edges of the enrichment network, representing significant associations, may
point to functionally relevant mechanisms.
Development
ENViz is a research prototype tool developed by the Computational Biology and
Informatics project at Agilent Laboratories, the central research organization of
Agilent Technologies.
License
ENViz is protected under the license agreement terms in Section 5.
Page 7 of 40 Tutorial: ENViz
ENViz also includes a number of other open source resources, which are detailed in
Section 6.
References [1] Cline, MS, et al., (2007) “Integration of biological networks and gene expression
data using Cytoscape”. Nat Protoc 2: 10. 2366-2382
[2] Eden, E, Lipson, D, Yogev, S, and Yakhini, Z. (2007), "Discovering Motifs in
Ranked Lists of DNA sequences", PLoS Computational Biology, 3(3):e39.
[3] Eden, E, Navon, R, et al. (2009) "GOrilla: A Tool For Discovery And Visualization of Enriched GO Terms in Ranked Gene Lists", BMC Bioinformatics, 10:48
[4] Kelder, T, et al (2011) “WikiPathways: building research communities on
biological pathways” NAR. doi: 10.1093/nar/gkr1074
[5] Enerly, E, et al (2011), “miRNA-mRNA Integrated Analysis Reveals Roles for miRNAs in Primary Breast Tumors”, PLoS One. Feb 22;6(2):e16915
Page 8 of 40 Tutorial: ENViz
1.2. Installation
For installation details, see the Cy2 User Readme or the Cy3 User Readme
documents.
1.3. Input files
ENViz requires two input files - the Primary data file and Pivot data file:
Primary data file: tab delimited text file with one row for each primary data
element (e.g. gene), and one column for each sample. First column should have
primary data element identifier. If primary data contains gene based measurements, first column should contain a gene identifier, which should be an EntrezID or a
GeneSymbol. The first row should have sample identifiers. Other entries in this file
have measurements for each primary data element in each sample. Missing values
should be denoted by ‘#’. In the sample dataset primary data file is Enerly_GeneExpression.tab.
Pivot data file: tab delimited file with one row for each pivot element, and one
column for each sample. The first column should have pivot identifiers. The first row
should have sample identifiers. Samples should be ordered in the same way in
primary and pivot data files and use the same identifiers, i.e. the first row in primary data file and the first row in the pivot data file should be the same. Other entries in
this file have measurements for each pivot element in each sample. Missing values
should be denoted by ‘#’. In the sample dataset pivot data file is
Enerly_miRNAExpression.tab.
Note that ENViz is not performing any pre-processing or filtering of the input data
files. You should apply the normalization/filtering processes best suited for your data.
Primary and pivot data should not have any duplicate entries.
Annotation file: optional tab delimited file containing systematic annotations of primary data elements that will be used for enrichment analysis. First column should
have primary data element identifiers. Primary data elements in the annotation file
and in the primary data file should be ordered in the same way and use the same
identifiers, i.e. the first columns in primary data file and in annotation file should be the same. First row should have annotation categories. Other entries of this file are
0s and 1s. 1 in row i column j indicates that primary element from row i belongs to
annotation category in column j. If an annotation file is not provided, ENViz can
generate one for GO (Gene Ontology) and for pathway annotations (using
WikiPathways). EntrezIDs or GeneSymbols are used to assign genes to pathway or GO categories.
In the sample dataset, the GO annotation file is Enerly_GO_Annotation.tab.gz, and
the pathway annotation file is Enerly_WikiPathway_Annotation.tab.gz (you may
notice the different .gz extension that specifies the files are compressed because the annotation files can be quite large).
1.4 Example dataset
Page 9 of 40 Tutorial: ENViz
For this tutorial, we use the dataset published in [5]. Data formatted for ENViz can
be downloaded from http://bioinfo.cs.technion.ac.il/people/zohar/ENViz/data.html
This dataset consists of 100 breast tumor samples with various characteristics. Primary data is gene expression profiles of 13,639 genes for 100 samples from
microarray experiments. Pivot data is microarray based miRNA profiles of 489
microRNAs measured for the same 100 samples. The sample dataset includes
pathway annotation files generated using WikiPathways and GO annotation file.
Primary data file: Enerly_GeneExpression.tab, a tab delimited file containing gene
expression data for 13,639 genes and 100 samples. Gene expression data is taken
from gProcessedSignal Agilent Feature Extraction files. The expression levels were
log2 transformed and quantile normalized [5].
Pivot data file: Enerly_miRNAExpression.tab, a tab delimited file containing data for
489 miRNAs and 100 samples. miRNA expression data is log2 transformed and
normalized to the 75th percentile [5].
Annotation files: GO annotation file Enerly_GO_Annotation.tab, and WikiPathway
annotation file Enerly_WikiPathway_Annotation.tab. The GO annotation file contains
gene annotations for 11,177 GO terms. GO annotation is based on GO database
release downloaded on 08/22/2013. The pathway annotation file contains gene annotations for 204 pathways.
In all examples and descriptions below, we will refer to primary data as gene
expression data from the sample dataset, pivot data as miRNA expression data from
pivot dataset, and annotation data as either GO annotation or pathway annotation from the sample dataset.
Page 10 of 40 Tutorial: ENViz
2.ENViz Analysis
2.1 Starting ENViz
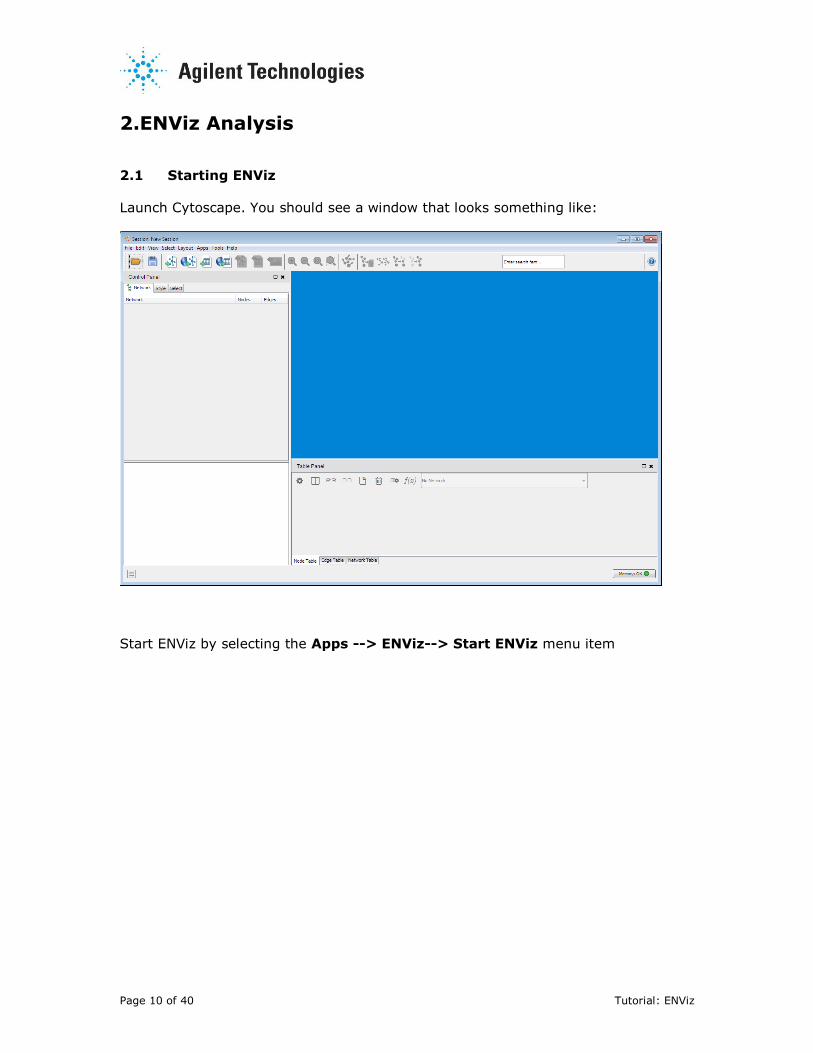
Launch Cytoscape. You should see a window that looks something like:
Start ENViz by selecting the Apps --> ENViz--> Start ENViz menu item
Page 11 of 40 Tutorial: ENViz
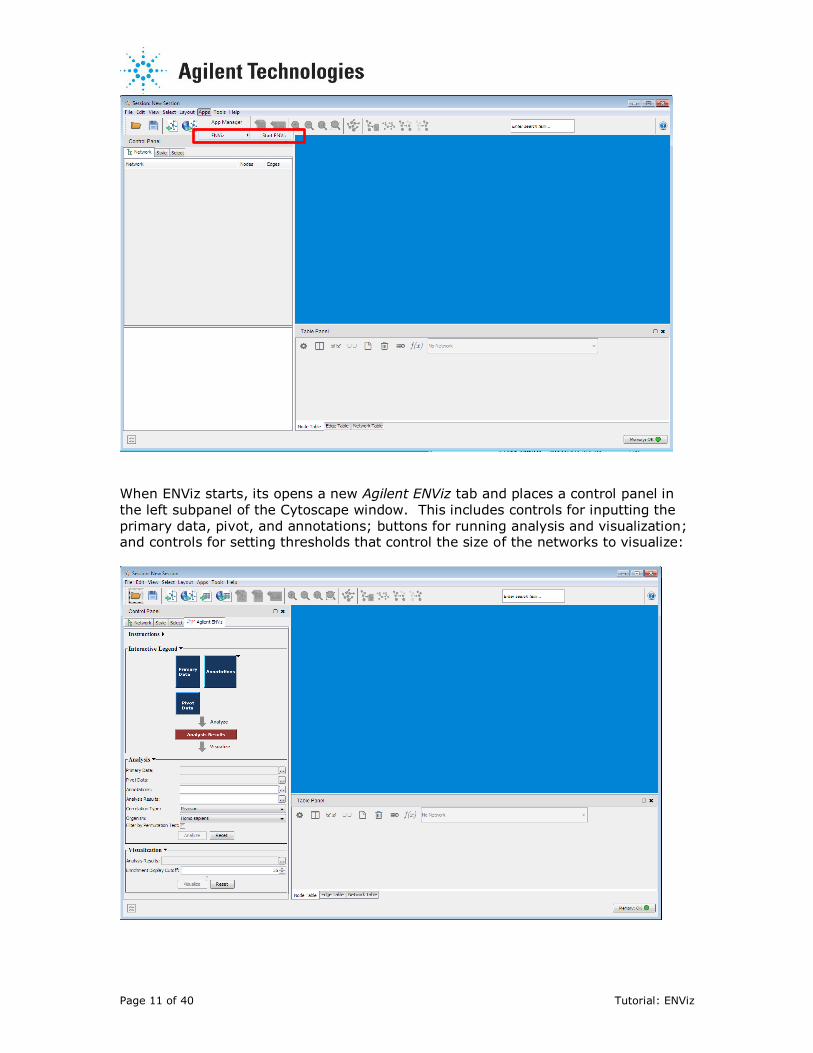
When ENViz starts, its opens a new Agilent ENViz tab and places a control panel in
the left subpanel of the Cytoscape window. This includes controls for inputting the
primary data, pivot, and annotations; buttons for running analysis and visualization; and controls for setting thresholds that control the size of the networks to visualize:
Page 12 of 40 Tutorial: ENViz
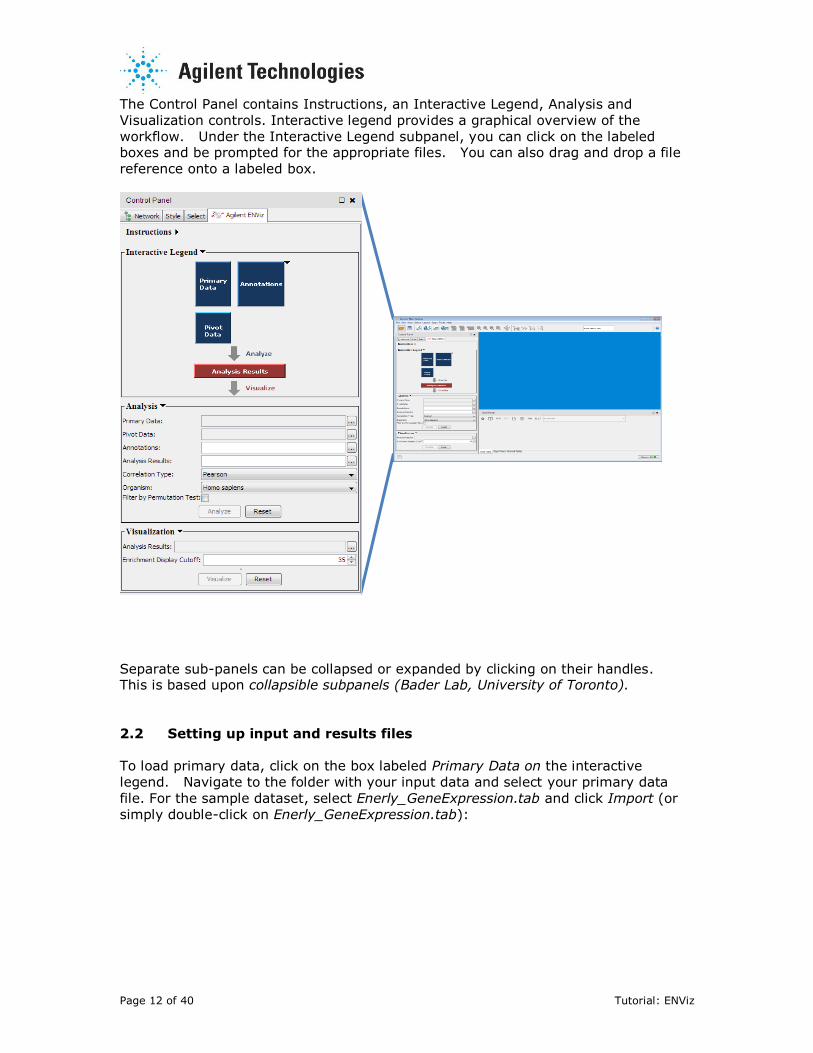
The Control Panel contains Instructions, an Interactive Legend, Analysis and
Visualization controls. Interactive legend provides a graphical overview of the
workflow. Under the Interactive Legend subpanel, you can click on the labeled boxes and be prompted for the appropriate files. You can also drag and drop a file
reference onto a labeled box.
Separate sub-panels can be collapsed or expanded by clicking on their handles. This is based upon collapsible subpanels (Bader Lab, University of Toronto).
2.2 Setting up input and results files
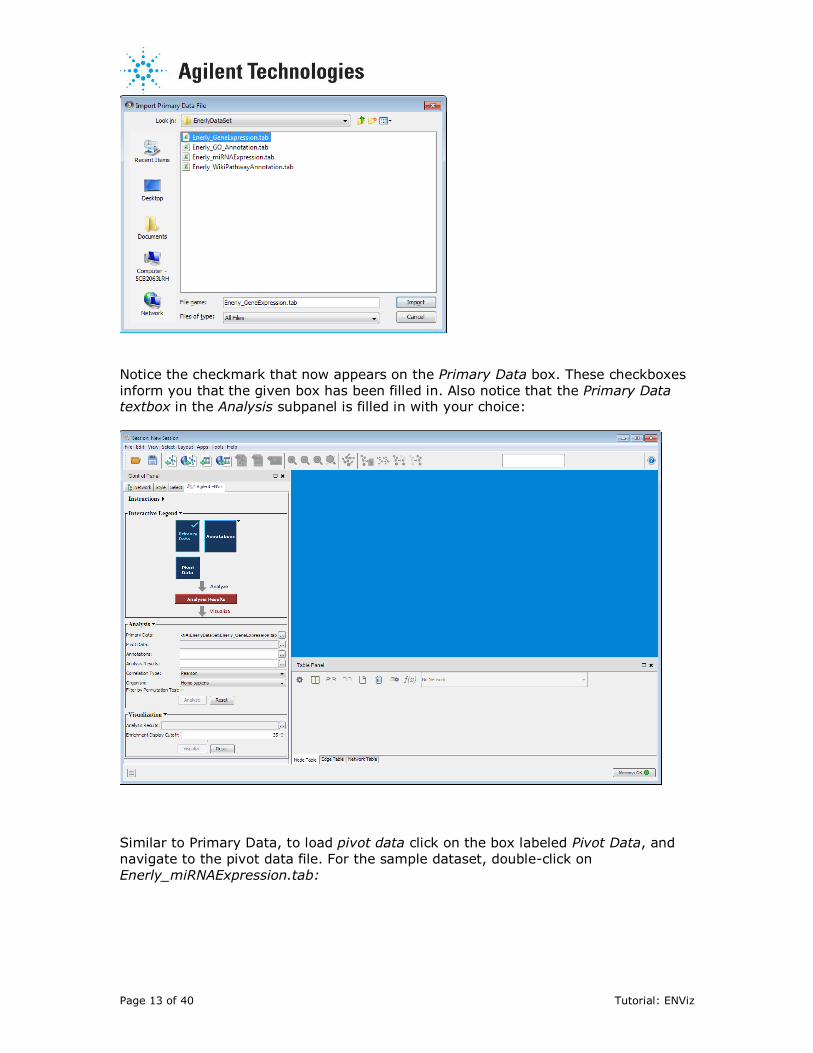
To load primary data, click on the box labeled Primary Data on the interactive
legend. Navigate to the folder with your input data and select your primary data
file. For the sample dataset, select Enerly_GeneExpression.tab and click Import (or
simply double-click on Enerly_GeneExpression.tab):
Page 13 of 40 Tutorial: ENViz
Notice the checkmark that now appears on the Primary Data box. These checkboxes
inform you that the given box has been filled in. Also notice that the Primary Data textbox in the Analysis subpanel is filled in with your choice:
Similar to Primary Data, to load pivot data click on the box labeled Pivot Data, and
navigate to the pivot data file. For the sample dataset, double-click on
Enerly_miRNAExpression.tab:
Page 14 of 40 Tutorial: ENViz
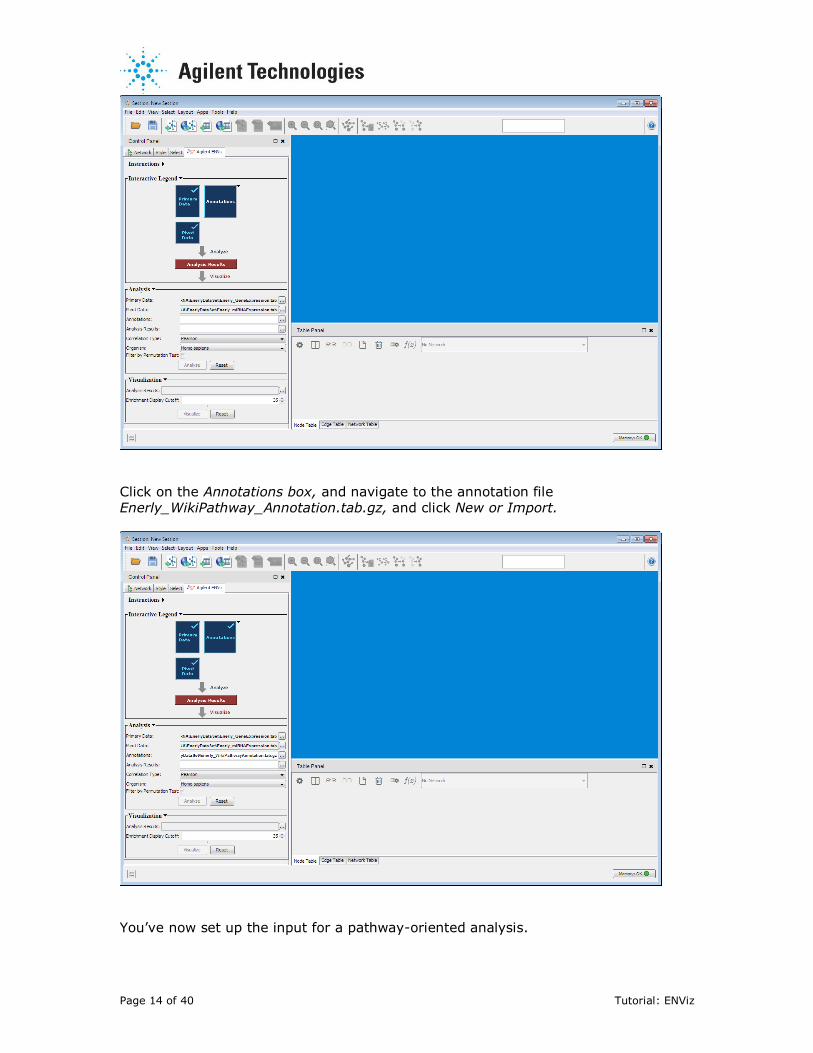
Click on the Annotations box, and navigate to the annotation file Enerly_WikiPathway_Annotation.tab.gz, and click New or Import.
You’ve now set up the input for a pathway-oriented analysis.
Page 15 of 40 Tutorial: ENViz
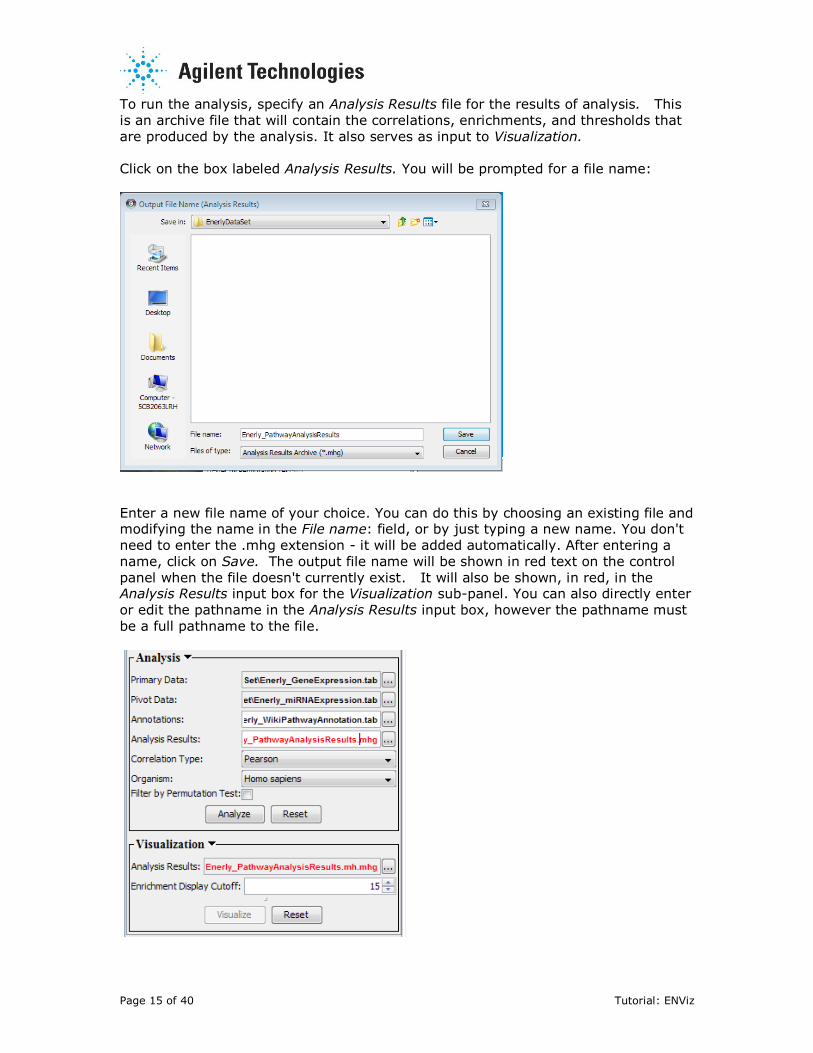
To run the analysis, specify an Analysis Results file for the results of analysis. This
is an archive file that will contain the correlations, enrichments, and thresholds that
are produced by the analysis. It also serves as input to Visualization.
Click on the box labeled Analysis Results. You will be prompted for a file name:
Enter a new file name of your choice. You can do this by choosing an existing file and modifying the name in the File name: field, or by just typing a new name. You don't
need to enter the .mhg extension - it will be added automatically. After entering a
name, click on Save. The output file name will be shown in red text on the control
panel when the file doesn't currently exist. It will also be shown, in red, in the Analysis Results input box for the Visualization sub-panel. You can also directly enter
or edit the pathname in the Analysis Results input box, however the pathname must
be a full pathname to the file.
Page 16 of 40 Tutorial: ENViz
The analysis results file is a zipped archive containing all the analysis data files
needed for visualizing your enrichment results as an enrichment network.
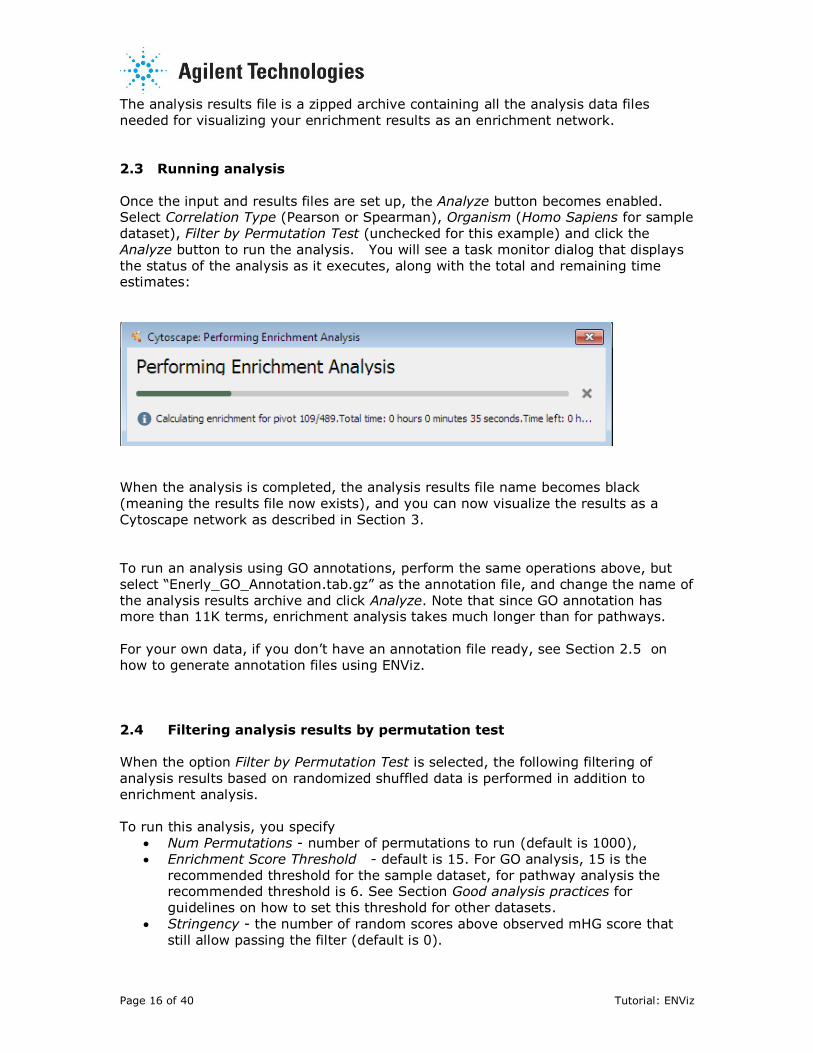
2.3 Running analysis
Once the input and results files are set up, the Analyze button becomes enabled. Select Correlation Type (Pearson or Spearman), Organism (Homo Sapiens for sample
dataset), Filter by Permutation Test (unchecked for this example) and click the
Analyze button to run the analysis. You will see a task monitor dialog that displays
the status of the analysis as it executes, along with the total and remaining time estimates:
When the analysis is completed, the analysis results file name becomes black
(meaning the results file now exists), and you can now visualize the results as a
Cytoscape network as described in Section 3.
To run an analysis using GO annotations, perform the same operations above, but
select “Enerly_GO_Annotation.tab.gz” as the annotation file, and change the name of
the analysis results archive and click Analyze. Note that since GO annotation has more than 11K terms, enrichment analysis takes much longer than for pathways.
For your own data, if you don’t have an annotation file ready, see Section 2.5 on
how to generate annotation files using ENViz.
2.4 Filtering analysis results by permutation test
When the option Filter by Permutation Test is selected, the following filtering of
analysis results based on randomized shuffled data is performed in addition to
enrichment analysis.
To run this analysis, you specify
Num Permutations - number of permutations to run (default is 1000),
Enrichment Score Threshold - default is 15. For GO analysis, 15 is the
recommended threshold for the sample dataset, for pathway analysis the recommended threshold is 6. See Section Good analysis practices for
guidelines on how to set this threshold for other datasets.
Stringency - the number of random scores above observed mHG score that
still allow passing the filter (default is 0).
Page 17 of 40 Tutorial: ENViz
For each permutation, samples in the pivot data are randomly shuffled. This means
that the columns of the matrix are permuted. For each pivot with at least one
enrichment score above Enrichment Score Threshold , the correlations between unchanged primary data and randomized pivot data, and the corresponding
enrichment scores Srand are calculated. If for a given pivot-annotation element pair
with enrichment score S, we observe Srand >= S more than Stringency times across
all permutations, this pivot-annotation element pair is considered not significant and its enrichment score is set to 0.
For pivot-annotation pairs that survive this permutation test filtering, the original
mHG score is reported as the enrichment score.
2.5 Generating annotation files
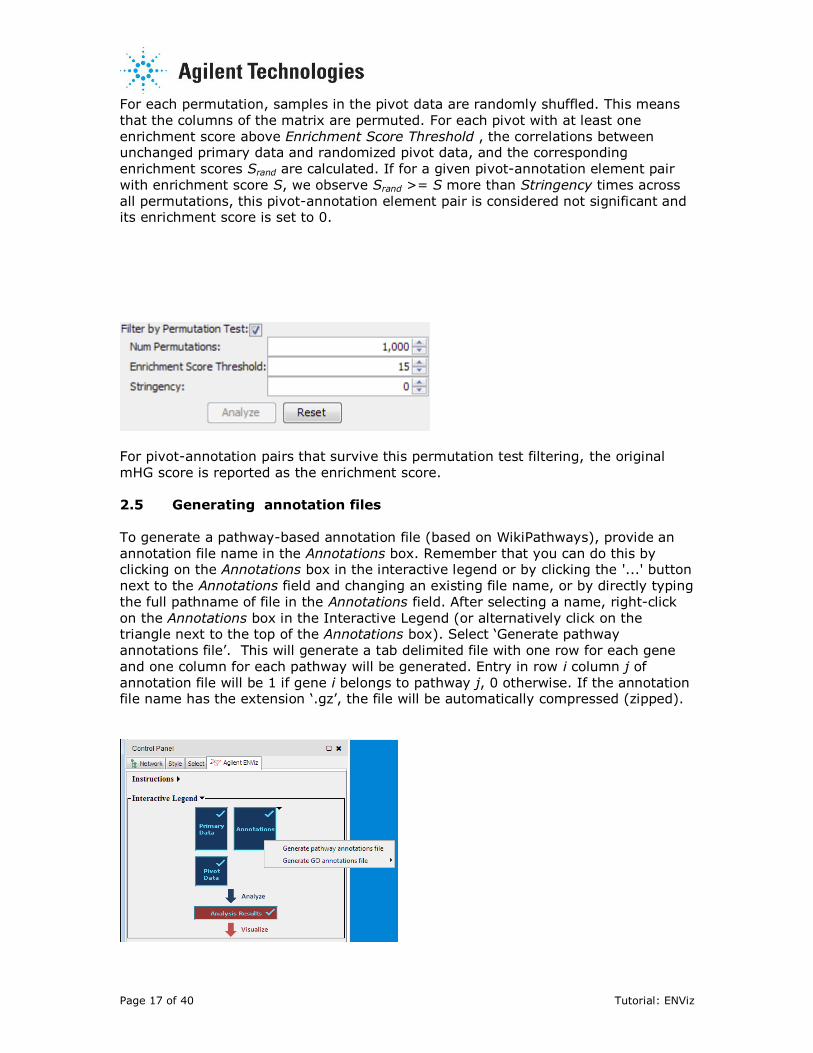
To generate a pathway-based annotation file (based on WikiPathways), provide an
annotation file name in the Annotations box. Remember that you can do this by clicking on the Annotations box in the interactive legend or by clicking the '...' button
next to the Annotations field and changing an existing file name, or by directly typing
the full pathname of file in the Annotations field. After selecting a name, right-click
on the Annotations box in the Interactive Legend (or alternatively click on the triangle next to the top of the Annotations box). Select ‘Generate pathway
annotations file’. This will generate a tab delimited file with one row for each gene
and one column for each pathway will be generated. Entry in row i column j of
annotation file will be 1 if gene i belongs to pathway j, 0 otherwise. If the annotation file name has the extension ‘.gz’, the file will be automatically compressed (zipped).
Page 18 of 40 Tutorial: ENViz
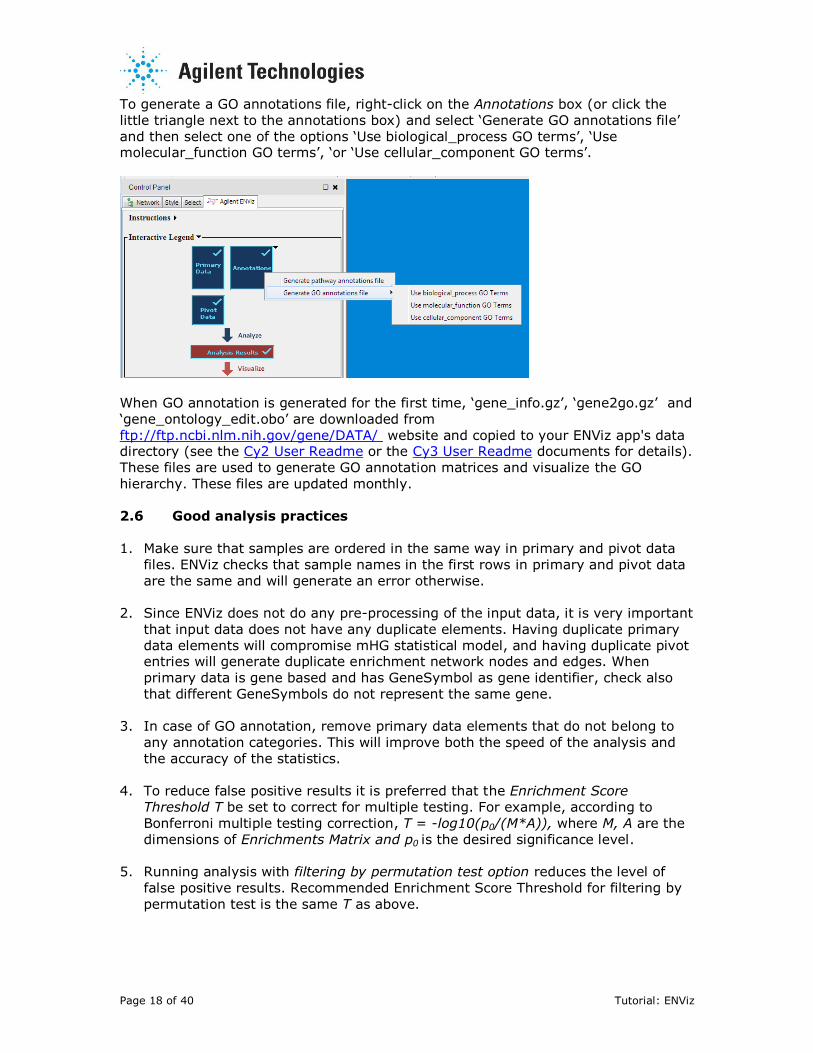
To generate a GO annotations file, right-click on the Annotations box (or click the
little triangle next to the annotations box) and select ‘Generate GO annotations file’
and then select one of the options ‘Use biological_process GO terms’, ‘Use molecular_function GO terms’, ‘or ‘Use cellular_component GO terms’.
When GO annotation is generated for the first time, ‘gene_info.gz’, ‘gene2go.gz’ and
‘gene_ontology_edit.obo’ are downloaded from
ftp://ftp.ncbi.nlm.nih.gov/gene/DATA/ website and copied to your ENViz app's data directory (see the Cy2 User Readme or the Cy3 User Readme documents for details).
These files are used to generate GO annotation matrices and visualize the GO
hierarchy. These files are updated monthly.
2.6 Good analysis practices
1. Make sure that samples are ordered in the same way in primary and pivot data
files. ENViz checks that sample names in the first rows in primary and pivot data
are the same and will generate an error otherwise.
2. Since ENViz does not do any pre-processing of the input data, it is very important
that input data does not have any duplicate elements. Having duplicate primary
data elements will compromise mHG statistical model, and having duplicate pivot entries will generate duplicate enrichment network nodes and edges. When
primary data is gene based and has GeneSymbol as gene identifier, check also
that different GeneSymbols do not represent the same gene.
3. In case of GO annotation, remove primary data elements that do not belong to
any annotation categories. This will improve both the speed of the analysis and
the accuracy of the statistics.
4. To reduce false positive results it is preferred that the Enrichment Score
Threshold T be set to correct for multiple testing. For example, according to
Bonferroni multiple testing correction, T = -log10(p0/(M*A)), where M, A are the
dimensions of Enrichments Matrix and p0 is the desired significance level.
5. Running analysis with filtering by permutation test option reduces the level of
false positive results. Recommended Enrichment Score Threshold for filtering by
permutation test is the same T as above.
Page 19 of 40 Tutorial: ENViz
3. Visualizing Analysis Results
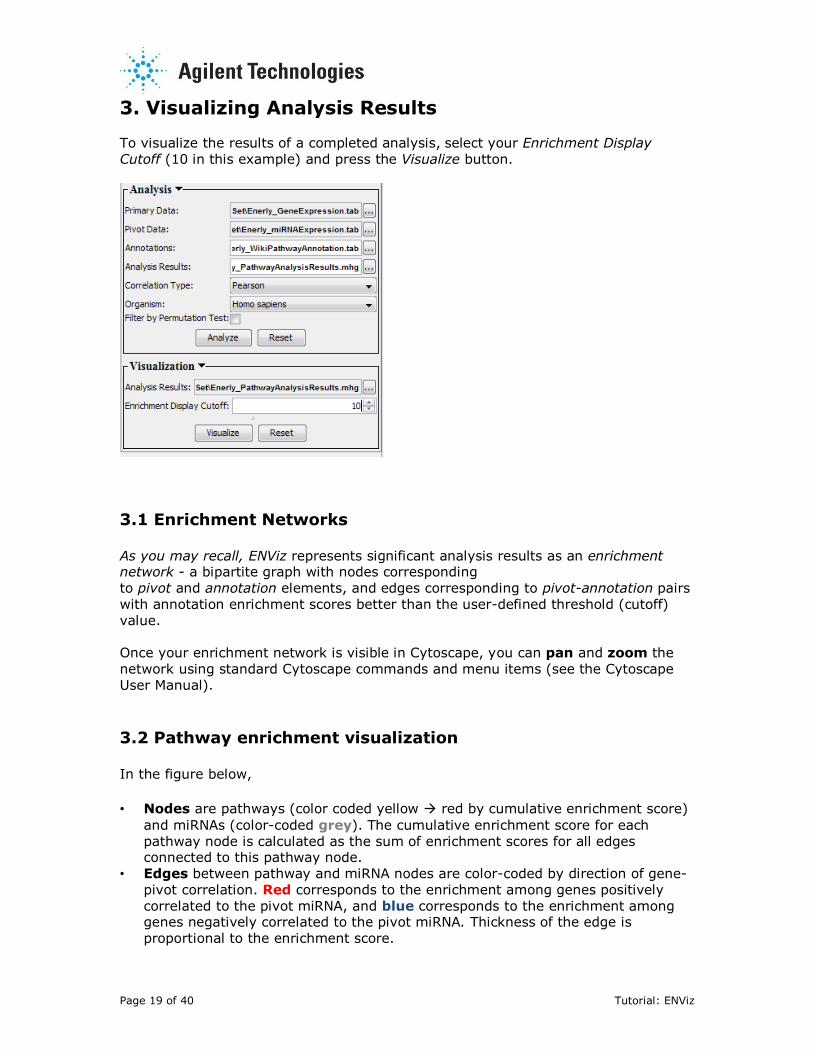
To visualize the results of a completed analysis, select your Enrichment Display
Cutoff (10 in this example) and press the Visualize button.
3.1 Enrichment Networks
As you may recall, ENViz represents significant analysis results as an enrichment network - a bipartite graph with nodes corresponding
to pivot and annotation elements, and edges corresponding to pivot-annotation pairs
with annotation enrichment scores better than the user-defined threshold (cutoff)
value.
Once your enrichment network is visible in Cytoscape, you can pan and zoom the
network using standard Cytoscape commands and menu items (see the Cytoscape
User Manual).
3.2 Pathway enrichment visualization
In the figure below,
• Nodes are pathways (color coded yellow red by cumulative enrichment score)
and miRNAs (color-coded grey). The cumulative enrichment score for each
pathway node is calculated as the sum of enrichment scores for all edges connected to this pathway node.
• Edges between pathway and miRNA nodes are color-coded by direction of gene-
pivot correlation. Red corresponds to the enrichment among genes positively
correlated to the pivot miRNA, and blue corresponds to the enrichment among genes negatively correlated to the pivot miRNA. Thickness of the edge is
proportional to the enrichment score.
Page 20 of 40 Tutorial: ENViz
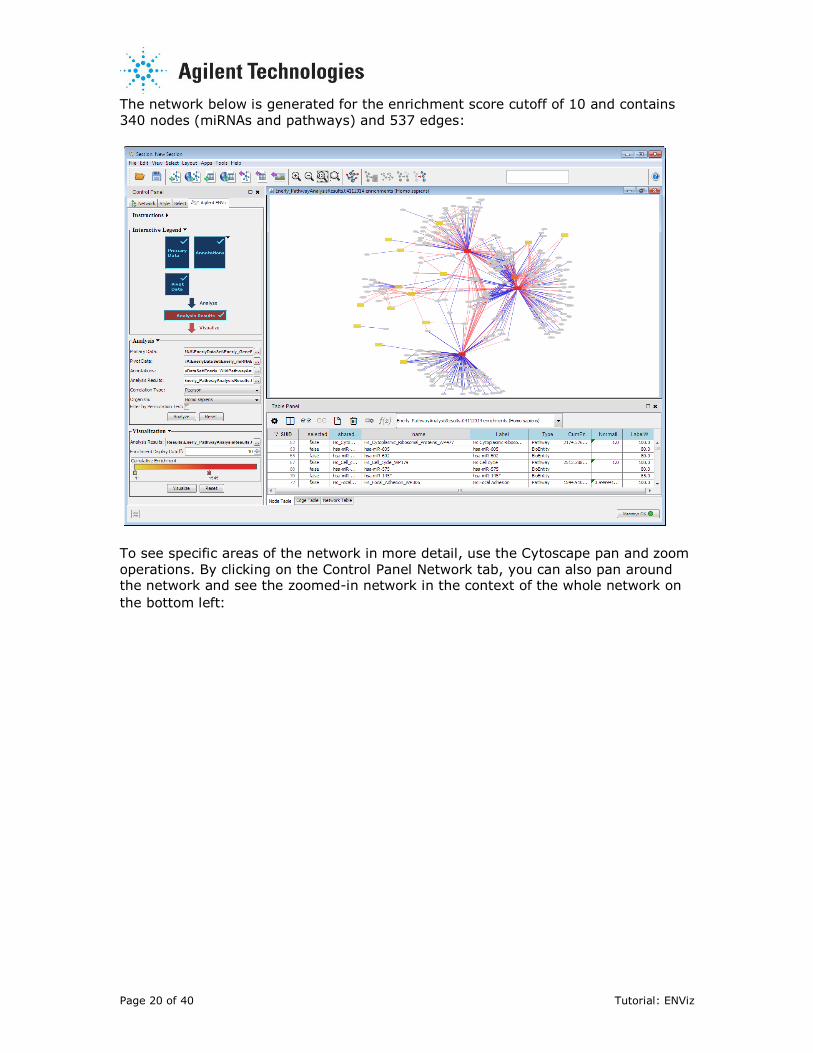
The network below is generated for the enrichment score cutoff of 10 and contains
340 nodes (miRNAs and pathways) and 537 edges:
To see specific areas of the network in more detail, use the Cytoscape pan and zoom
operations. By clicking on the Control Panel Network tab, you can also pan around the network and see the zoomed-in network in the context of the whole network on
the bottom left:
Page 21 of 40 Tutorial: ENViz
Visually overlaying enrichment information on pathways
For analysis of enrichment in biological pathways, correlations of primary data and
corresponding pivot data are visually overlaid on biological pathways for each significant pivot-annotation pair, using WikiPathways [4]. You can overlay
enrichment information on pathways by double-clicking on edges, pathways, and
pivot nodes in the enrichment network. Besides selecting the node or edge you
clicked on (and displaying it in green), one of the following pathway visual overlays takes place:
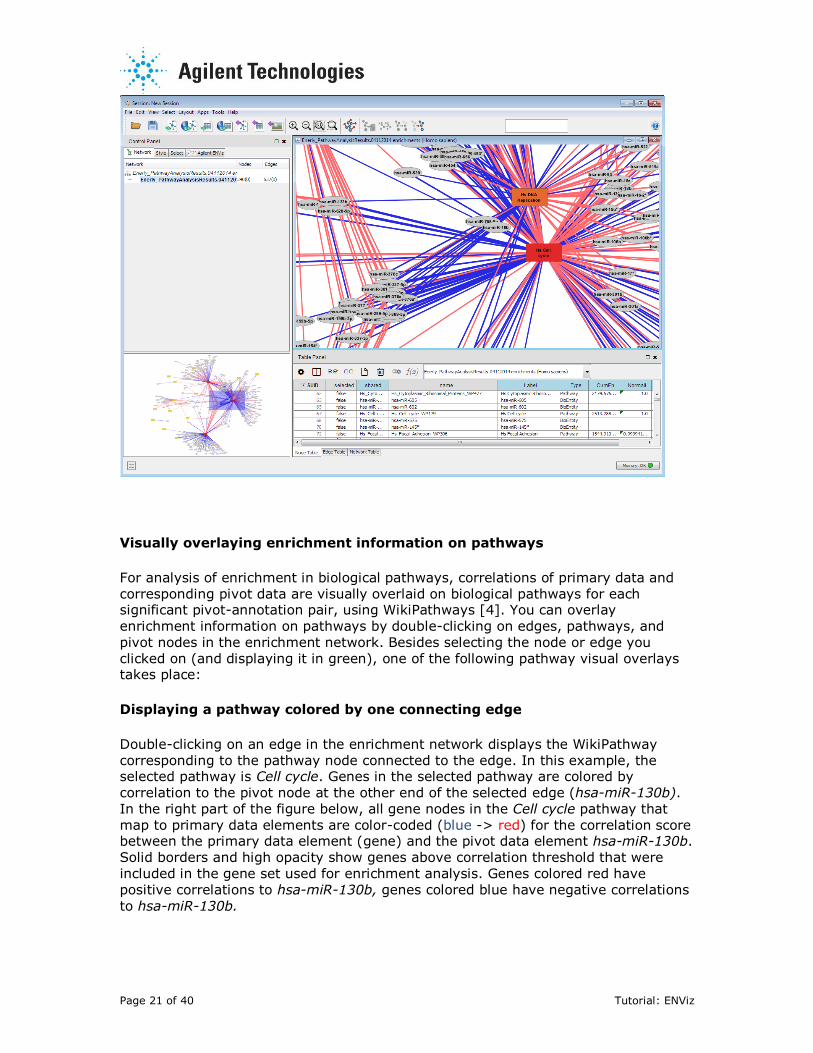
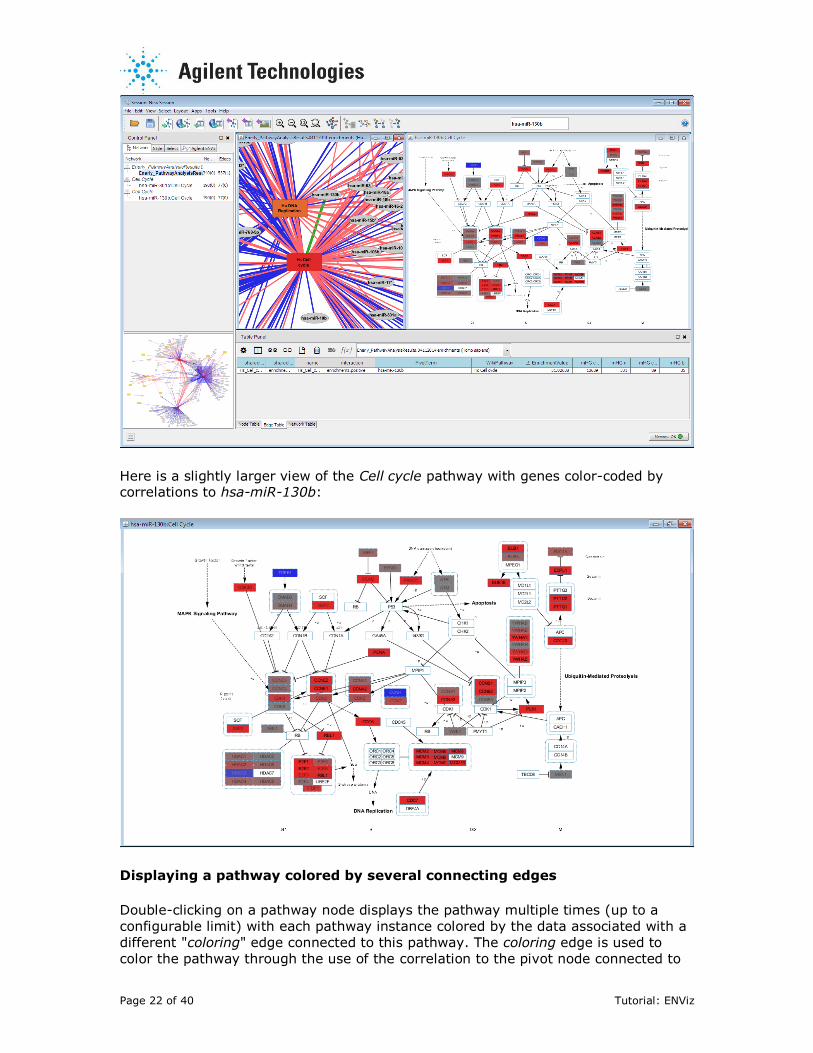
Displaying a pathway colored by one connecting edge
Double-clicking on an edge in the enrichment network displays the WikiPathway
corresponding to the pathway node connected to the edge. In this example, the selected pathway is Cell cycle. Genes in the selected pathway are colored by
correlation to the pivot node at the other end of the selected edge (hsa-miR-130b).
In the right part of the figure below, all gene nodes in the Cell cycle pathway that
map to primary data elements are color-coded (blue -> red) for the correlation score between the primary data element (gene) and the pivot data element hsa-miR-130b.
Solid borders and high opacity show genes above correlation threshold that were
included in the gene set used for enrichment analysis. Genes colored red have
positive correlations to hsa-miR-130b, genes colored blue have negative correlations
to hsa-miR-130b.
Page 22 of 40 Tutorial: ENViz
Here is a slightly larger view of the Cell cycle pathway with genes color-coded by correlations to hsa-miR-130b:
Displaying a pathway colored by several connecting edges
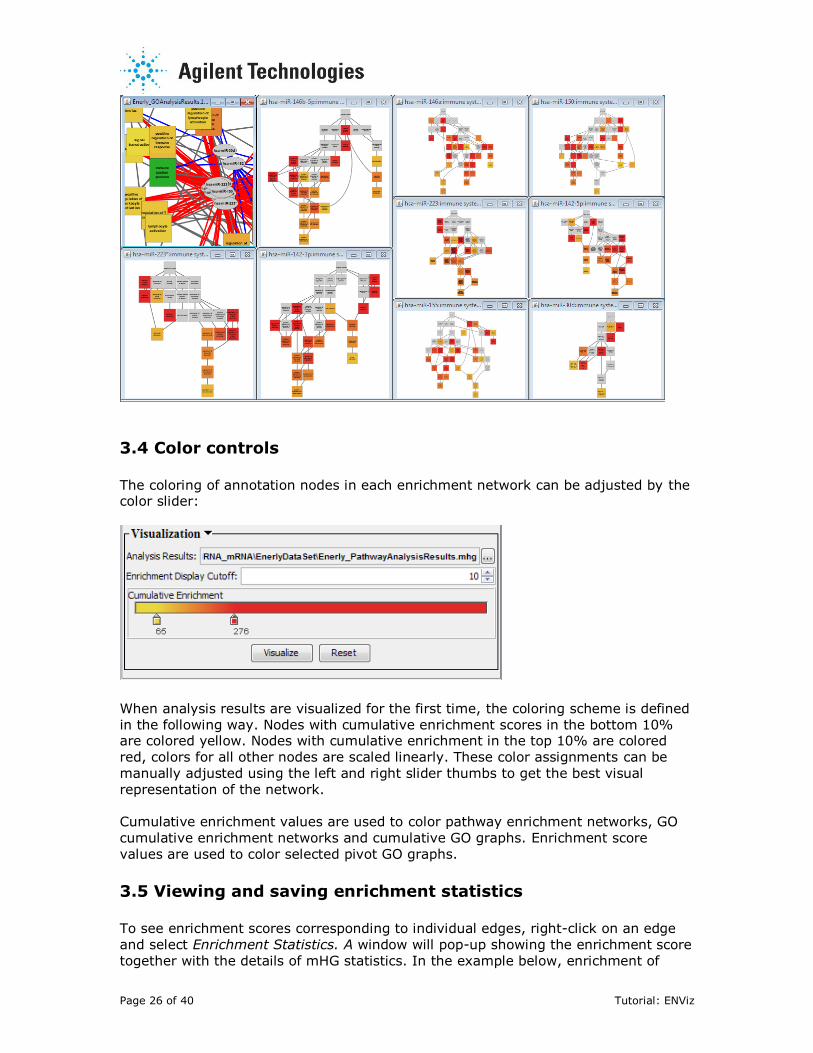
Double-clicking on a pathway node displays the pathway multiple times (up to a
configurable limit) with each pathway instance colored by the data associated with a
different "coloring" edge connected to this pathway. The coloring edge is used to
color the pathway through the use of the correlation to the pivot node connected to
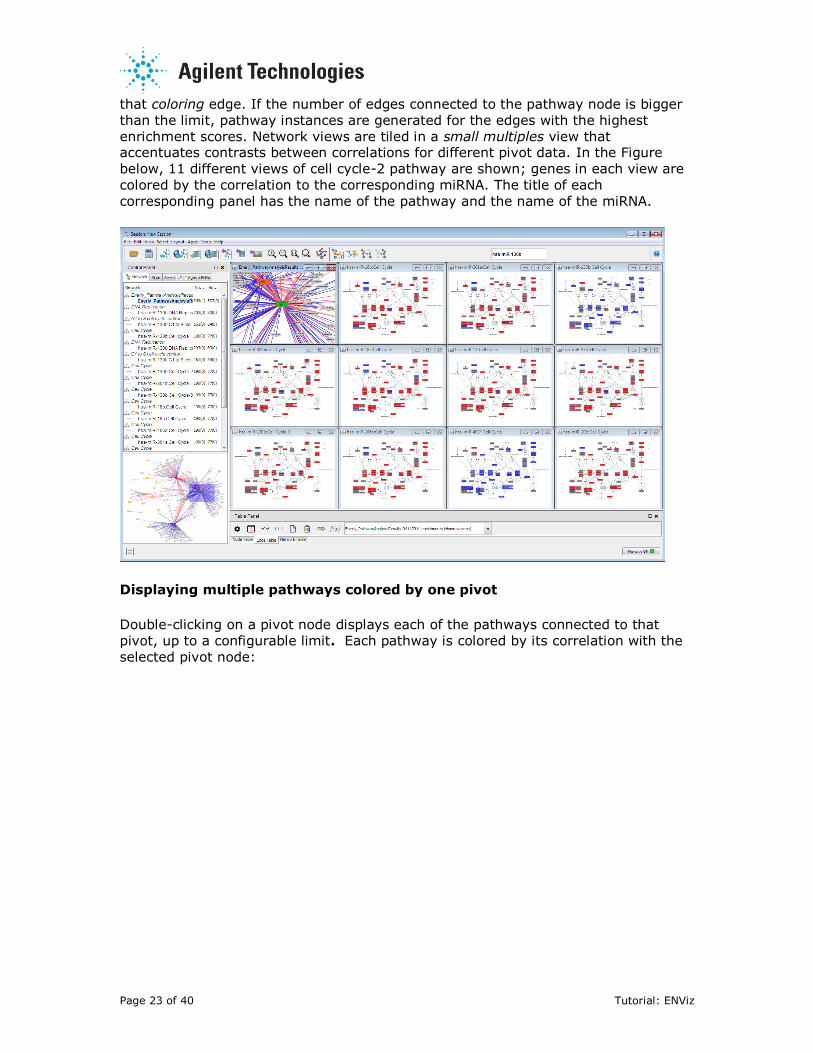
Page 23 of 40 Tutorial: ENViz
that coloring edge. If the number of edges connected to the pathway node is bigger
than the limit, pathway instances are generated for the edges with the highest
enrichment scores. Network views are tiled in a small multiples view that accentuates contrasts between correlations for different pivot data. In the Figure
below, 11 different views of cell cycle-2 pathway are shown; genes in each view are
colored by the correlation to the corresponding miRNA. The title of each
corresponding panel has the name of the pathway and the name of the miRNA.
Displaying multiple pathways colored by one pivot
Double-clicking on a pivot node displays each of the pathways connected to that
pivot, up to a configurable limit. Each pathway is colored by its correlation with the
selected pivot node:
Page 24 of 40 Tutorial: ENViz
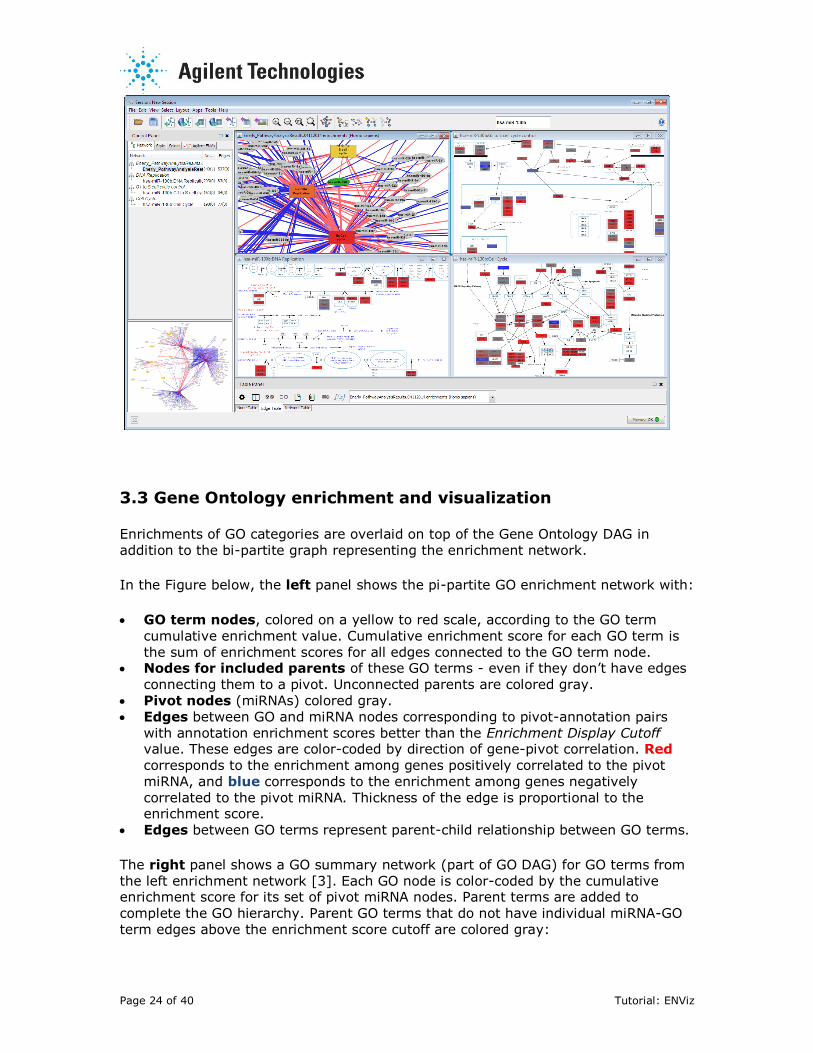
3.3 Gene Ontology enrichment and visualization
Enrichments of GO categories are overlaid on top of the Gene Ontology DAG in
addition to the bi-partite graph representing the enrichment network.
In the Figure below, the left panel shows the pi-partite GO enrichment network with:
GO term nodes, colored on a yellow to red scale, according to the GO term
cumulative enrichment value. Cumulative enrichment score for each GO term is
the sum of enrichment scores for all edges connected to the GO term node. Nodes for included parents of these GO terms - even if they don’t have edges
connecting them to a pivot. Unconnected parents are colored gray.
Pivot nodes (miRNAs) colored gray.
Edges between GO and miRNA nodes corresponding to pivot-annotation pairs
with annotation enrichment scores better than the Enrichment Display Cutoff value. These edges are color-coded by direction of gene-pivot correlation. Red
corresponds to the enrichment among genes positively correlated to the pivot
miRNA, and blue corresponds to the enrichment among genes negatively
correlated to the pivot miRNA. Thickness of the edge is proportional to the enrichment score.
Edges between GO terms represent parent-child relationship between GO terms.
The right panel shows a GO summary network (part of GO DAG) for GO terms from
the left enrichment network [3]. Each GO node is color-coded by the cumulative enrichment score for its set of pivot miRNA nodes. Parent terms are added to
complete the GO hierarchy. Parent GO terms that do not have individual miRNA-GO
term edges above the enrichment score cutoff are colored gray:
Page 25 of 40 Tutorial: ENViz
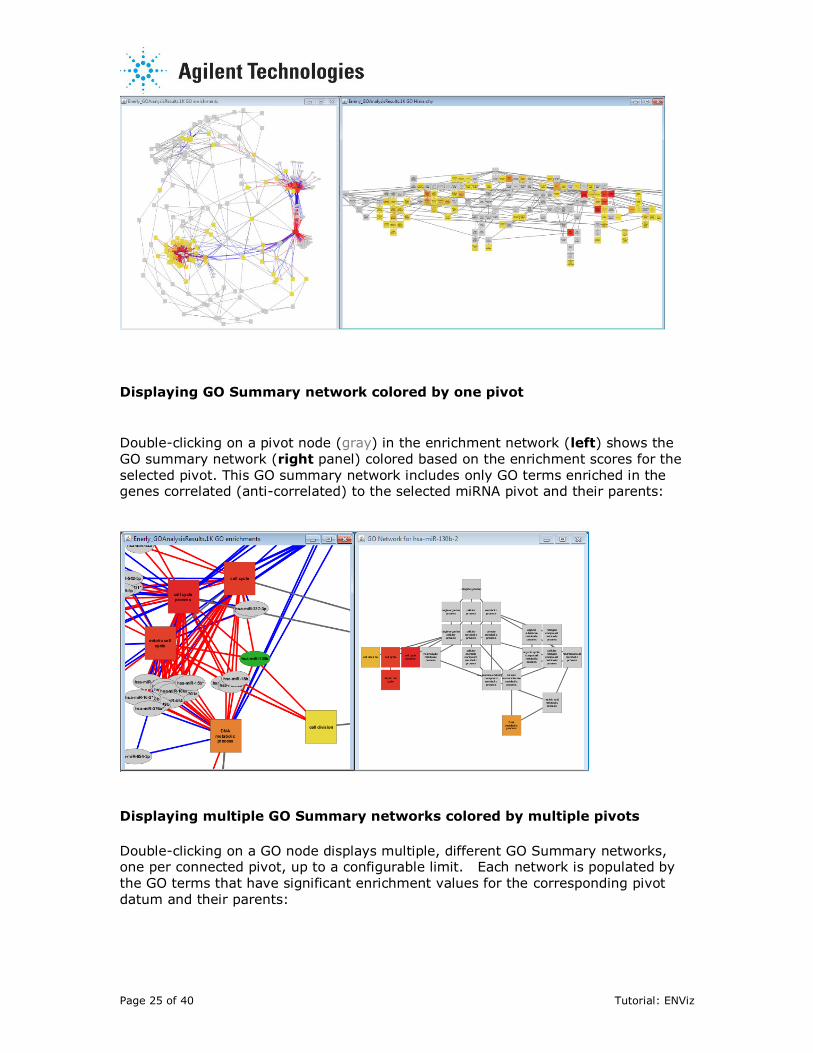
Displaying GO Summary network colored by one pivot
Double-clicking on a pivot node (gray) in the enrichment network (left) shows the
GO summary network (right panel) colored based on the enrichment scores for the
selected pivot. This GO summary network includes only GO terms enriched in the genes correlated (anti-correlated) to the selected miRNA pivot and their parents:
Displaying multiple GO Summary networks colored by multiple pivots
Double-clicking on a GO node displays multiple, different GO Summary networks, one per connected pivot, up to a configurable limit. Each network is populated by
the GO terms that have significant enrichment values for the corresponding pivot
datum and their parents:
Page 26 of 40 Tutorial: ENViz
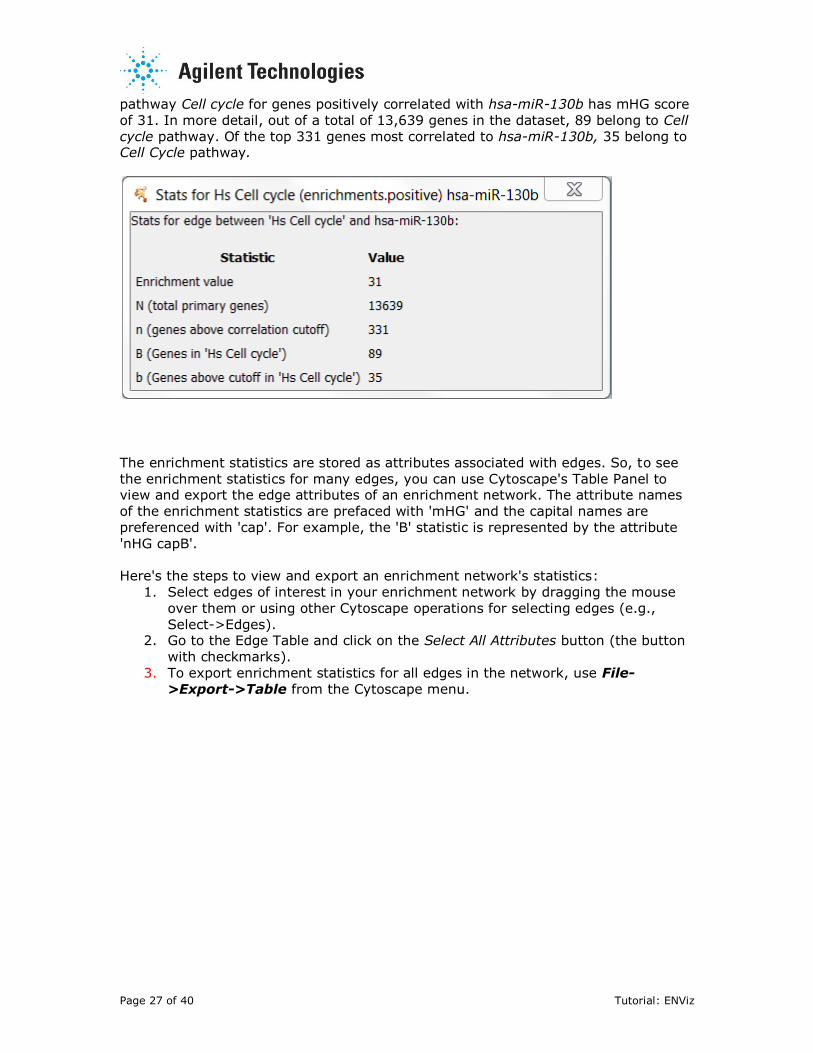
3.4 Color controls
The coloring of annotation nodes in each enrichment network can be adjusted by the color slider:
When analysis results are visualized for the first time, the coloring scheme is defined
in the following way. Nodes with cumulative enrichment scores in the bottom 10% are colored yellow. Nodes with cumulative enrichment in the top 10% are colored
red, colors for all other nodes are scaled linearly. These color assignments can be
manually adjusted using the left and right slider thumbs to get the best visual
representation of the network.
Cumulative enrichment values are used to color pathway enrichment networks, GO
cumulative enrichment networks and cumulative GO graphs. Enrichment score
values are used to color selected pivot GO graphs.
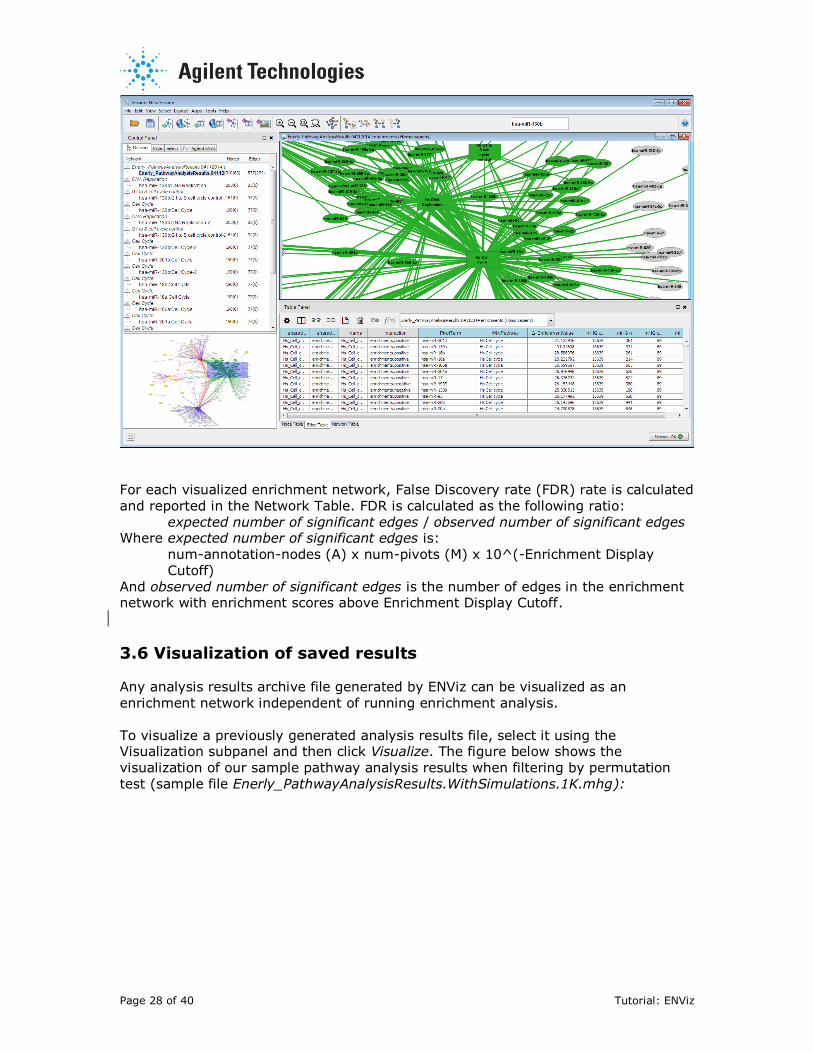
3.5 Viewing and saving enrichment statistics
To see enrichment scores corresponding to individual edges, right-click on an edge
and select Enrichment Statistics. A window will pop-up showing the enrichment score
together with the details of mHG statistics. In the example below, enrichment of
Page 27 of 40 Tutorial: ENViz
pathway Cell cycle for genes positively correlated with hsa-miR-130b has mHG score
of 31. In more detail, out of a total of 13,639 genes in the dataset, 89 belong to Cell
cycle pathway. Of the top 331 genes most correlated to hsa-miR-130b, 35 belong to Cell Cycle pathway.
The enrichment statistics are stored as attributes associated with edges. So, to see
the enrichment statistics for many edges, you can use Cytoscape's Table Panel to view and export the edge attributes of an enrichment network. The attribute names
of the enrichment statistics are prefaced with 'mHG' and the capital names are
preferenced with 'cap'. For example, the 'B' statistic is represented by the attribute
'nHG capB'.
Here's the steps to view and export an enrichment network's statistics:
1. Select edges of interest in your enrichment network by dragging the mouse
over them or using other Cytoscape operations for selecting edges (e.g.,
Select->Edges). 2. Go to the Edge Table and click on the Select All Attributes button (the button
with checkmarks).
3. To export enrichment statistics for all edges in the network, use File-
>Export->Table from the Cytoscape menu.
Page 28 of 40 Tutorial: ENViz
For each visualized enrichment network, False Discovery rate (FDR) rate is calculated
and reported in the Network Table. FDR is calculated as the following ratio:
expected number of significant edges / observed number of significant edges Where expected number of significant edges is:
num-annotation-nodes (A) x num-pivots (M) x 10^(-Enrichment Display
Cutoff)
And observed number of significant edges is the number of edges in the enrichment network with enrichment scores above Enrichment Display Cutoff.
3.6 Visualization of saved results Any analysis results archive file generated by ENViz can be visualized as an
enrichment network independent of running enrichment analysis.
To visualize a previously generated analysis results file, select it using the Visualization subpanel and then click Visualize. The figure below shows the
visualization of our sample pathway analysis results when filtering by permutation
test (sample file Enerly_PathwayAnalysisResults.WithSimulations.1K.mhg):
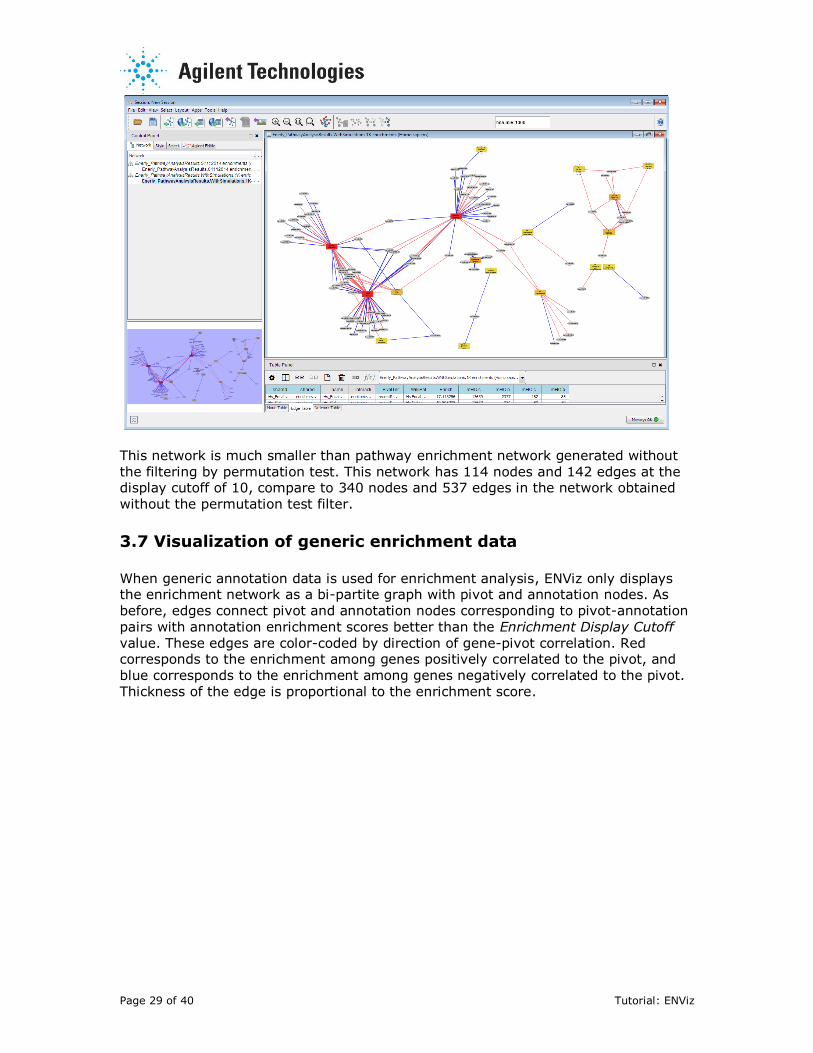
Page 29 of 40 Tutorial: ENViz
This network is much smaller than pathway enrichment network generated without
the filtering by permutation test. This network has 114 nodes and 142 edges at the display cutoff of 10, compare to 340 nodes and 537 edges in the network obtained
without the permutation test filter.
3.7 Visualization of generic enrichment data
When generic annotation data is used for enrichment analysis, ENViz only displays the enrichment network as a bi-partite graph with pivot and annotation nodes. As
before, edges connect pivot and annotation nodes corresponding to pivot-annotation
pairs with annotation enrichment scores better than the Enrichment Display Cutoff
value. These edges are color-coded by direction of gene-pivot correlation. Red corresponds to the enrichment among genes positively correlated to the pivot, and
blue corresponds to the enrichment among genes negatively correlated to the pivot.
Thickness of the edge is proportional to the enrichment score.
Page 30 of 40 Tutorial: ENViz
4. ENViz Operational Notes
For details on recommended computer configuration, ENViz configuration, and
migrating data to new versions of ENViz, see the Cy2 User Readme or the Cy3 User
Readme documents.
4.1 Destroying and recreating network views
ENViz fully supports destroying and creating Cytoscape views of ENViz-generated
CyNetworks. Because ENViz can quickly generate many Cytoscape views, you may wish to destroy some network views and then bring them back at a later time. To
remove views:
1. Click on Cytoscape's Control Panel Network tab
2. Select the network views to remove 3. Bring up the context menu on any of the selected networks (e.g., right-click
on Windows) and perform Destroy View.
To recreate views:
1. Select some or all of the networks for which you destroyed views. 2. Bring up the context menu on any of these selected networks and perform
Create View.
The networks for which you recreated views should behave normally and support all
ENViz operations.
4.2 Creating sub-networks from ENViz enrichment networks
For many cases, you can use Cytoscape to create sub-networks of ENViz networks
and have these sub-networks behave like the original enrichment network in that the
various ENViz operations will work on edges, pivots, and annotations in the sub-network.
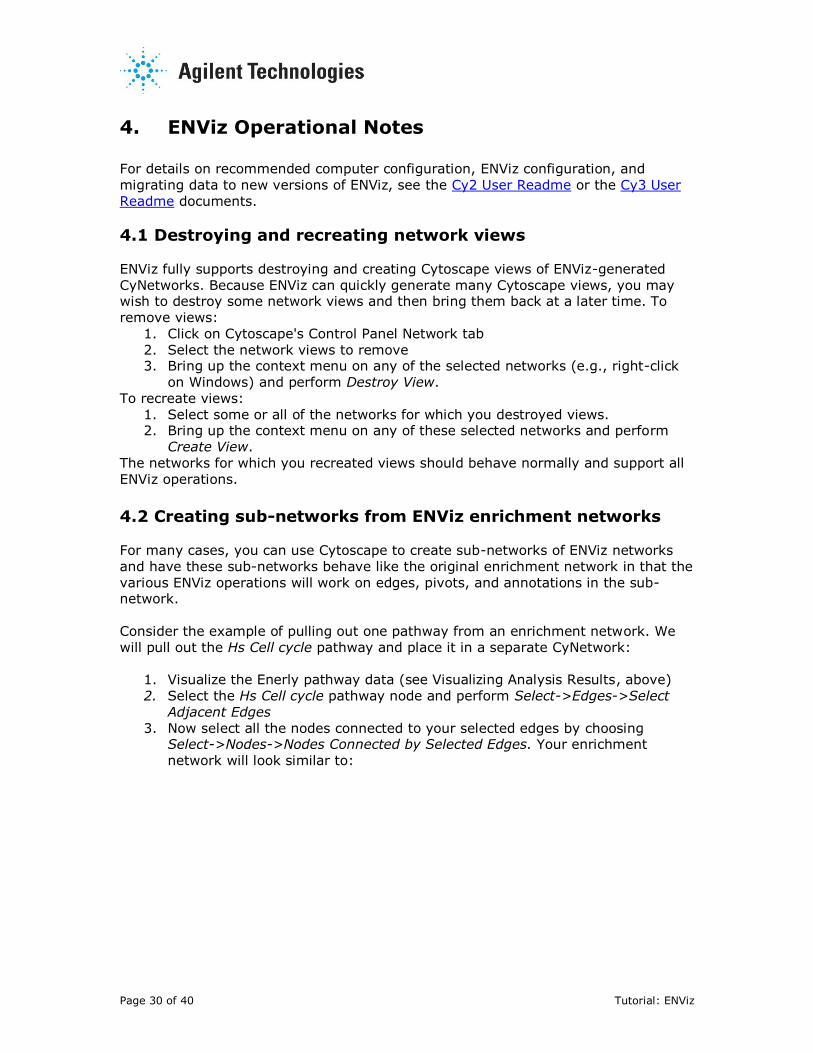
Consider the example of pulling out one pathway from an enrichment network. We
will pull out the Hs Cell cycle pathway and place it in a separate CyNetwork:
1. Visualize the Enerly pathway data (see Visualizing Analysis Results, above)
2. Select the Hs Cell cycle pathway node and perform Select->Edges->Select
Adjacent Edges
3. Now select all the nodes connected to your selected edges by choosing Select->Nodes->Nodes Connected by Selected Edges. Your enrichment
network will look similar to:
Page 31 of 40 Tutorial: ENViz
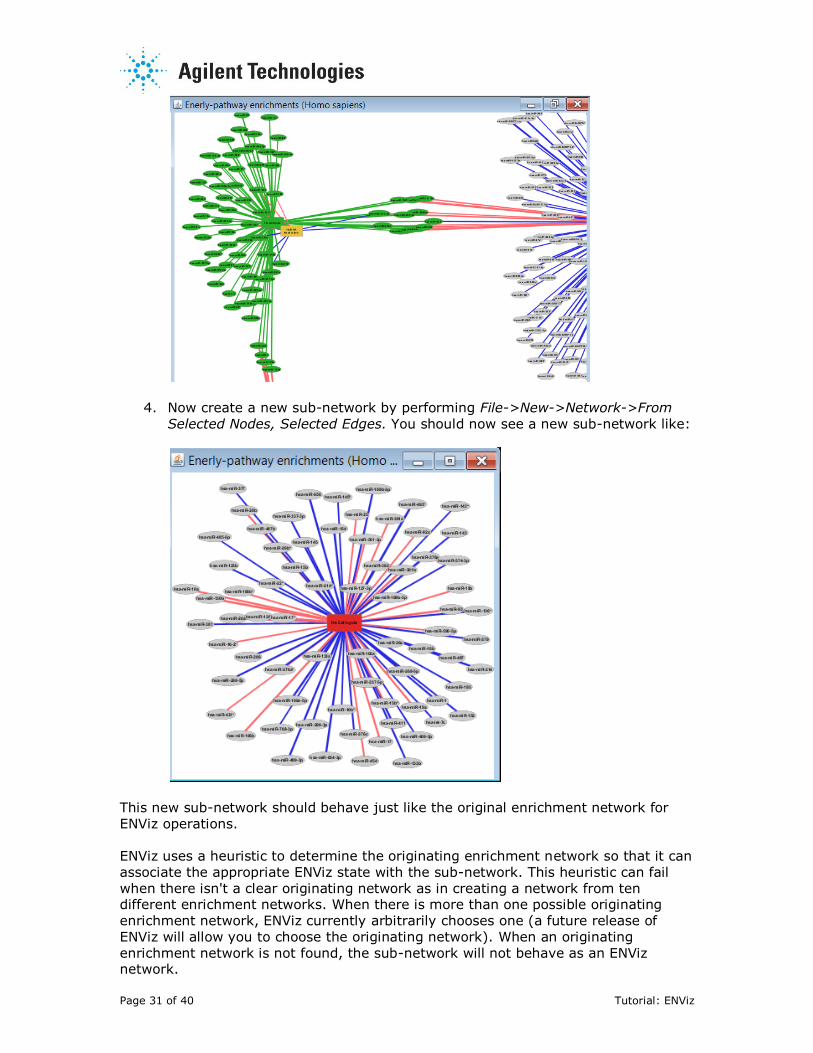
4. Now create a new sub-network by performing File->New->Network->From
Selected Nodes, Selected Edges. You should now see a new sub-network like:
This new sub-network should behave just like the original enrichment network for
ENViz operations.
ENViz uses a heuristic to determine the originating enrichment network so that it can
associate the appropriate ENViz state with the sub-network. This heuristic can fail
when there isn't a clear originating network as in creating a network from ten different enrichment networks. When there is more than one possible originating
enrichment network, ENViz currently arbitrarily chooses one (a future release of
ENViz will allow you to choose the originating network). When an originating
enrichment network is not found, the sub-network will not behave as an ENViz network.
Page 32 of 40 Tutorial: ENViz
4.3 Saving and restoring sessions
Cytoscape networks created by ENViz can be saved and restored1 in Cytoscape
sessions, however the functionality of these networks is limited to displaying the networks at they appeared when saved and to having the correct attributes
associated with the nodes and edges in each of these networks.
All ENViz-specific operations, like double-clicking on nodes and edges are not supported.
5. Software license
AGILENT TECHNOLOGIES, INC. SOFTWARE LICENSE AGREEMENT
ATTENTION: DOWNLOADING, COPYING, PUBLICLY DISTRIBUTING, OR USING THIS SOFTWARE IS SUBJECT TO THE AGREEMENT SET FORTH BELOW.
TO DOWNLOAD, STORE, INSTALL, OR RUN THE SOFTWARE, YOU MUST FIRST AGREE TO AGILENT'S SOFTWARE LICENSE AGREEMENT BELOW. IF YOU HAVE READ, UNDERSTAND AND AGREE TO BE BOUND BY THE SOFTWARE LICENSE AGREEMENT BELOW, YOU SHOULD CLICK ON THE "AGREE" BOX AT THE BOTTOM OF THIS PAGE. THE SOFTWARE WILL THEN BE DOWNLOADED TO OR INSTALLED ON YOUR COMPUTER.
IF YOU DO NOT AGREE TO BE BOUND BY THE SOFTWARE LICENSE AGREEMENT BELOW, YOU SHOULD CLICK ON THE "DO NOT AGREE" BOX AT THE BOTTOM OF THIS PAGE AND CANCEL THE DOWNLOAD OR INSTALLATION OF THE SOFTWARE.
Software. "Software" means one or more computer programs in object code format, whether stand-alone or bundled with other products, and related documentation. It does NOT include programs in source code format.
License Grant. Agilent grants you a non-exclusive license to download one copy of the Software, and to store or run that copy of the Software for internal use and purposes in accordance with this Agreement and the documentation provided with the Software. Such documentation may include license terms provided by Agilent's third party suppliers, which will apply to the use of the Software and take precedence over these license terms. In the absence of documentation specifying the applicable license, you may store or run one copy of the Software on one machine or instrument. If the Software is otherwise licensed for concurrent or network use, you may not allow more than the maximum number of authorized users to access and use the Software concurrently.
License Restrictions. You may make copies or adaptations of the Software for archival purposes or when copying or adaptation is an essential step in the authorized use of the Software, but for no other purpose. You must reproduce all copyright notices in the original Software on all permitted copies or adaptations. You may not copy the Software onto any public or distributed network.
Upgrades. This license does not entitle you to receive upgrades, updates or technical support.
Ownership. The Software is owned and copyrighted by Agilent or its third party suppliers. Agilent and its third party suppliers retain all right, title and interest in the Software. Agilent and its third party suppliers may protect their respective rights in the Software in the event of any violation of this Agreement.
No Disassembly. You may not disassemble or otherwise modify the Software without written authorization from Agilent, except as permitted by law. Upon request, you will provide Agilent with reasonably detailed information regarding any permitted disassembly or modification.
High Risk Activities. The Software is not specifically written, designed, manufactured or intended for use in the planning, construction, maintenance or direct operation of a nuclear facility, nor for use in on line control or fail safe operation of aircraft navigation, control or communication systems, weapon systems or direct life support systems.
Transfer. You may transfer the license granted to you here provided that you deliver all copies of the Software to the transferee along with this Agreement. The transferee must accept this Agreement as a condition to any transfer. Your license to use the Software will terminate upon transfer.
Termination. Agilent may terminate this license upon notice for breach of this Agreement. Upon termination, you must immediately destroy all copies of the Software.
1 Note that you may see some error messages when restoring your session about the
CytoscapeSessionReader not being able to read files (NullPointerException). You can ignore these
messages-the networks referenced seem to be restored correctly.
Page 33 of 40 Tutorial: ENViz
Export Requirements. If you export, re-export or import Software, technology or technical data licensed hereunder, you assume responsibility for complying with applicable laws and regulations and for obtaining required export and import authorizations. Agilent may terminate this license immediately if you are in violation of any applicable laws or regulations.
U.S. Government Restricted Rights. Software and technical data rights granted to the federal government include only those rights customarily provided to end user customers. Agilent provides this customary commercial license in Software and technical data pursuant to FAR 12.211 (Technical Data) and 12.212 (Computer Software) and, for the Department of Defense, DFARS 252.227-7015 (Technical Data - Commercial Items) and DFARS 227.7202-3 (Rights in Commercial Computer Software or Computer Software Documentation).
NO WARRANTY. TO THE EXTENT ALLOWED BY LOCAL LAW, AND EXCEPT TO THE EXTENT AGILENT HAS PROVIDED A SPECIFIC WRITTEN WARRANTY APPLICABLE TO THIS PRODUCT, THIS SOFTWARE IS PROVIDED TO YOU "AS IS" WITHOUT WARRANTIES OR CONDITIONS OF ANY KIND, WHETHER ORAL OR WRITTEN, EXPRESS OR IMPLIED. AGILENT SPECIFICALLY DISCLAIMS ANY IMPLIED WARRANTIES OR CONDITIONS OF MERCHANTABILITY, SATISFACTORY QUALITY, NON-INFRINGEMENT AND FITNESS FOR A PARTICULAR PURPOSE. SHOULD THE SOFTWARE PROVE DEFECTIVE, YOU ASSUME THE ENTIRE RISK AND COST RESULTING FROM OR RELATING TO THE DEFECT. SOME JURISDICTIONS DO NOT ALLOW EXCLUSIONS OF IMPLIED WARRANTIES OR CONDITIONS, SO THE ABOVE EXCLUSION MAY NOT APPLY TO YOU. YOU MAY HAVE OTHER RIGHTS THAT VARY ACCORDING TO LOCAL LAW.
LIMITATION OF LIABILITY. TO THE EXTENT ALLOWED BY LOCAL LAW, IN NO EVENT WILL AGILENT OR ITS SUBSIDIARIES, AFFILIATES OR SUPPLIERS BE LIABLE FOR DIRECT, SPECIAL, INCIDENTAL, CONSEQUENTIAL OR OTHER DAMAGES (INCLUDING LOST PROFIT, LOST DATA, OR DOWNTIME COSTS), ARISING OUT OF THE USE, INABILITY TO USE, OR THE RESULTS OF USE OF THE SOFTWARE, WHETHER BASED IN WARRANTY, CONTRACT, TORT OR OTHER LEGAL THEORY, AND WHETHER OR NOT ADVISED OF THE POSSIBILITY OF SUCH DAMAGES. YOUR USE OF THE SOFTWARE IS ENTIRELY AT YOUR OWN RISK. SOME JURISDICTIONS DO NOT ALLOW THE EXCLUSION OR LIMITATION OF LIABILITY FOR DAMAGES, SO THE ABOVE LIMITATION MAY NOT APPLY TO YOU.
Applicable Law. Disputes arising in connection with this Agreement will be governed by the laws of the United States and of the State of New York, without regard to choice of law provisions. The United Nations Convention for Contracts for the International Sale of Goods will not apply to this Agreement.
Unenforceability. To the extent that any provision of this Agreement is determined to be illegal or unenforceable, the remainder of this Agreement will remain in full force and effect.
Entire Agreement. This Agreement constitutes the entire agreement between you and Agilent, and supersedes any previous communications, representations or agreements between the parties, whether oral or written, regarding transactions hereunder except for a specific warranty issued by Agilent with regard to this product. Your additional or different terms and conditions will not apply. This Agreement may not be changed except by an amendment signed by an authorized representative of each party.
6. Acknowledgments
ENViz software uses the following resources:
WikiPathways:
http://wikipathways.org/index.php/WikiPathways, used according to the following terms of use and license
http://wikipathways.org/index.php/WikiPathways:License_Terms
Gene Ontology http://www.geneontology.org/
JSON (JavaScript Object Notation) - lightweight data-interchange format, used
according to the following license:
Copyright (c) 2002 JSON.org
Permission is hereby granted, free of charge, to any person obtaining a copy of this
software and associated documentation files (the "Software"), to deal in the Software
without restriction, including without limitation the rights to use, copy, modify,
merge, publish, distribute, sublicense, and/or sell copies of the Software, and to

Page 34 of 40 Tutorial: ENViz
permit persons to whom the Software is furnished to do so, subject to the following
conditions:
The above copyright notice and this permission notice shall be included in all copies or substantial portions of the Software.
The Software shall be used for Good, not Evil.
THE SOFTWARE IS PROVIDED "AS IS", WITHOUT WARRANTY OF ANY KIND,
EXPRESS OR IMPLIED, INCLUDING BUT NOT LIMITED TO THE WARRANTIES OF MERCHANTABILITY, FITNESS FOR A PARTICULAR PURPOSE AND
NONINFRINGEMENT. IN NO EVENT SHALL THE AUTHORS OR COPYRIGHT HOLDERS
BE LIABLE FOR ANY CLAIM, DAMAGES OR OTHER LIABILITY, WHETHER IN AN
ACTION OF CONTRACT, TORT OR OTHERWISE, ARISING FROM, OUT OF OR IN CONNECTION WITH THE SOFTWARE OR THE USE OR OTHER DEALINGS IN THE
SOFTWARE.
We are very grateful to Robert Kincaid and Melanie Tory for multiple suggestions on
the software and UI improvements. We thank Josh Spin and Sandra Nyberg for
valuable user feedback. Also, many thanks to Alexander Pico for help with Cytoscape
plugin and WikiPathways issues.
Page 35 of 40 Tutorial: ENViz
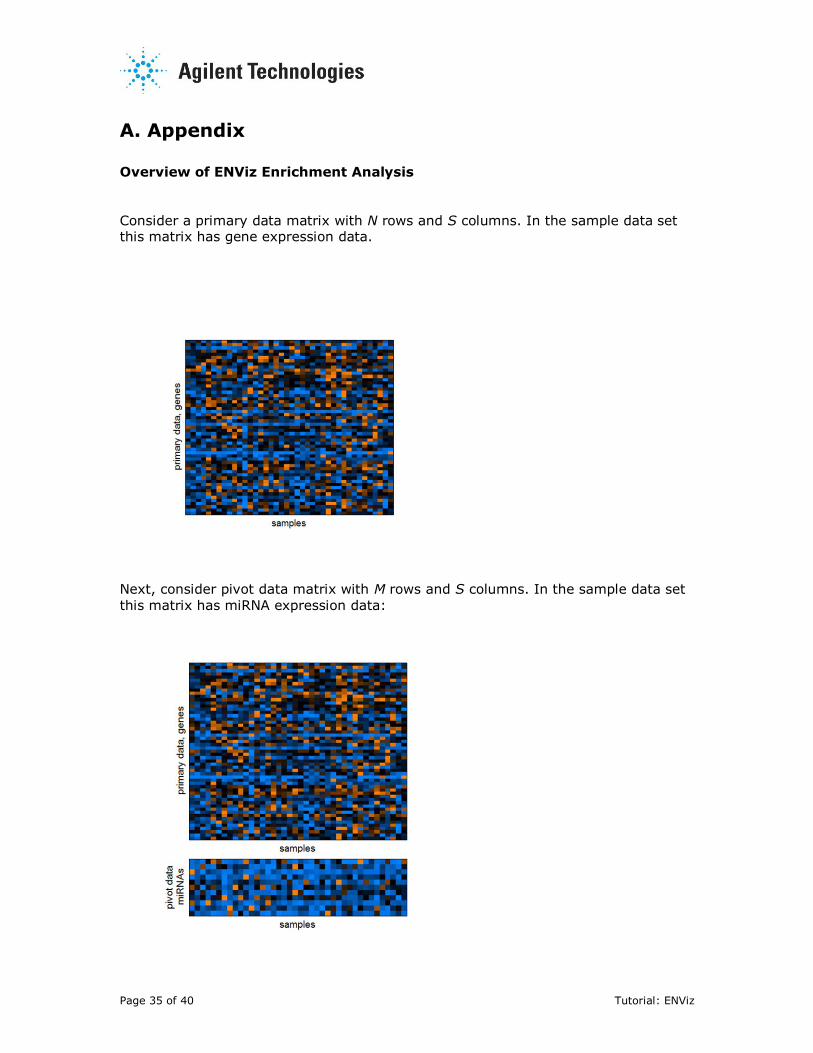
A. Appendix Overview of ENViz Enrichment Analysis
Consider a primary data matrix with N rows and S columns. In the sample data set this matrix has gene expression data.
Next, consider pivot data matrix with M rows and S columns. In the sample data set
this matrix has miRNA expression data:
Page 36 of 40 Tutorial: ENViz
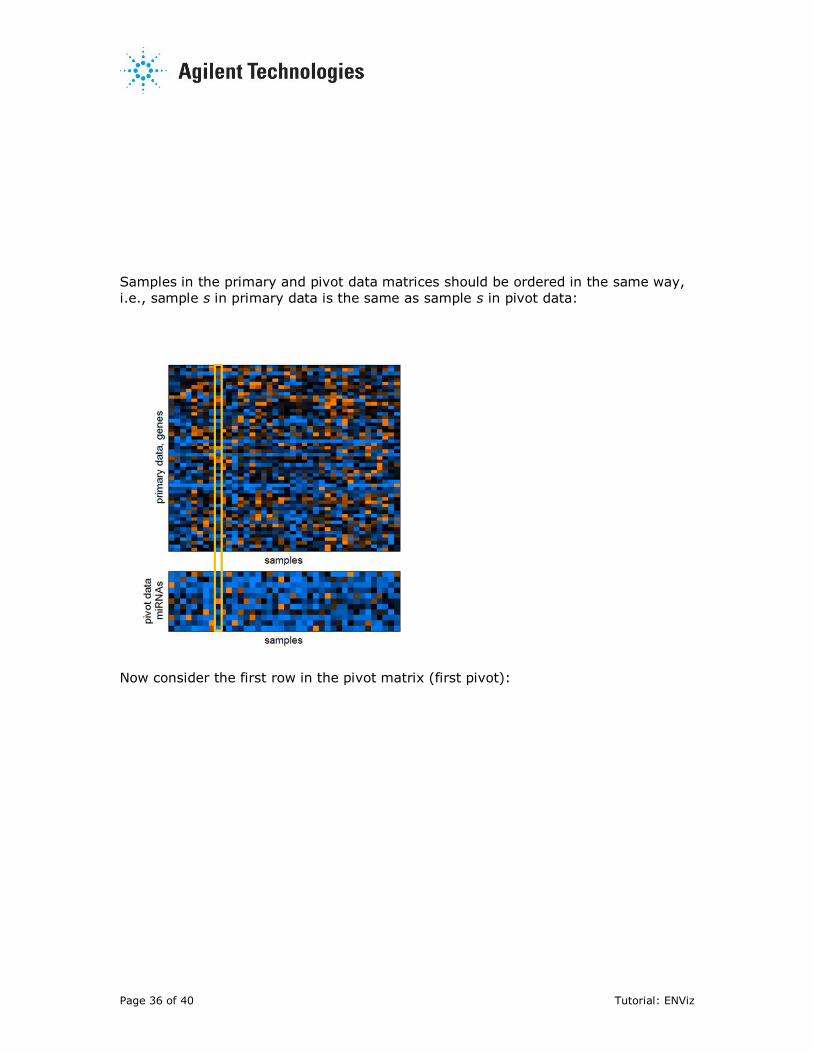
Samples in the primary and pivot data matrices should be ordered in the same way,
i.e., sample s in primary data is the same as sample s in pivot data:
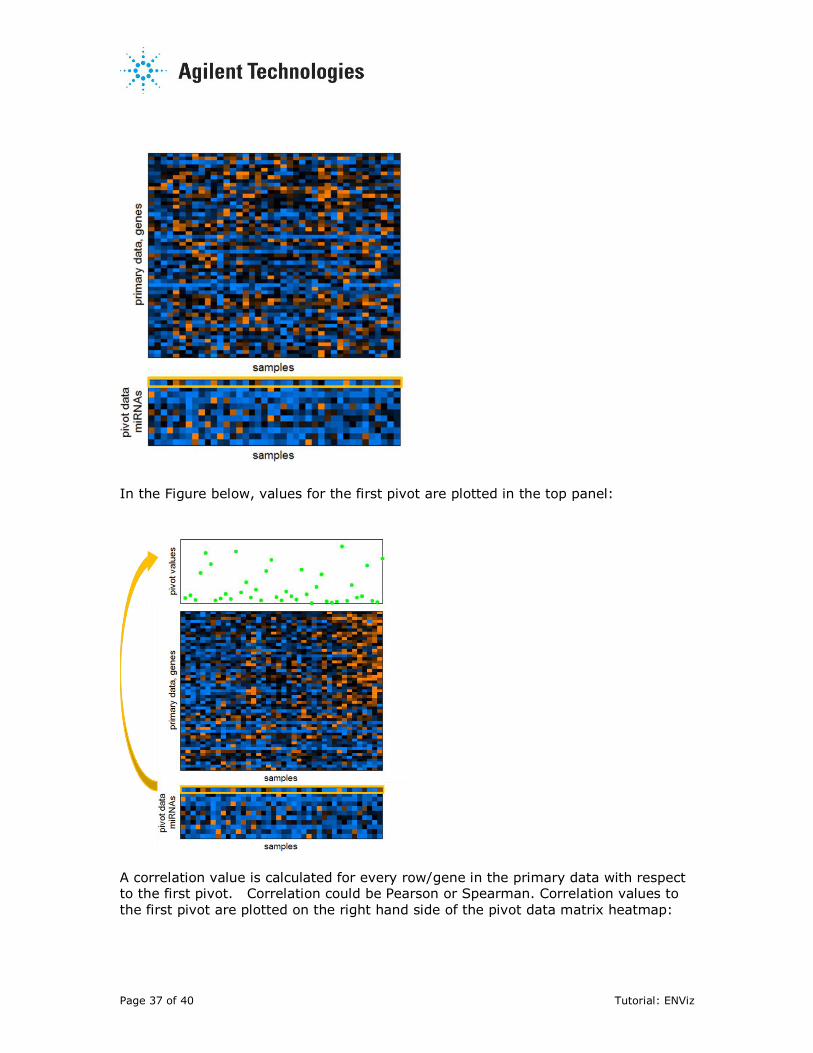
Now consider the first row in the pivot matrix (first pivot):
Page 37 of 40 Tutorial: ENViz
In the Figure below, values for the first pivot are plotted in the top panel:
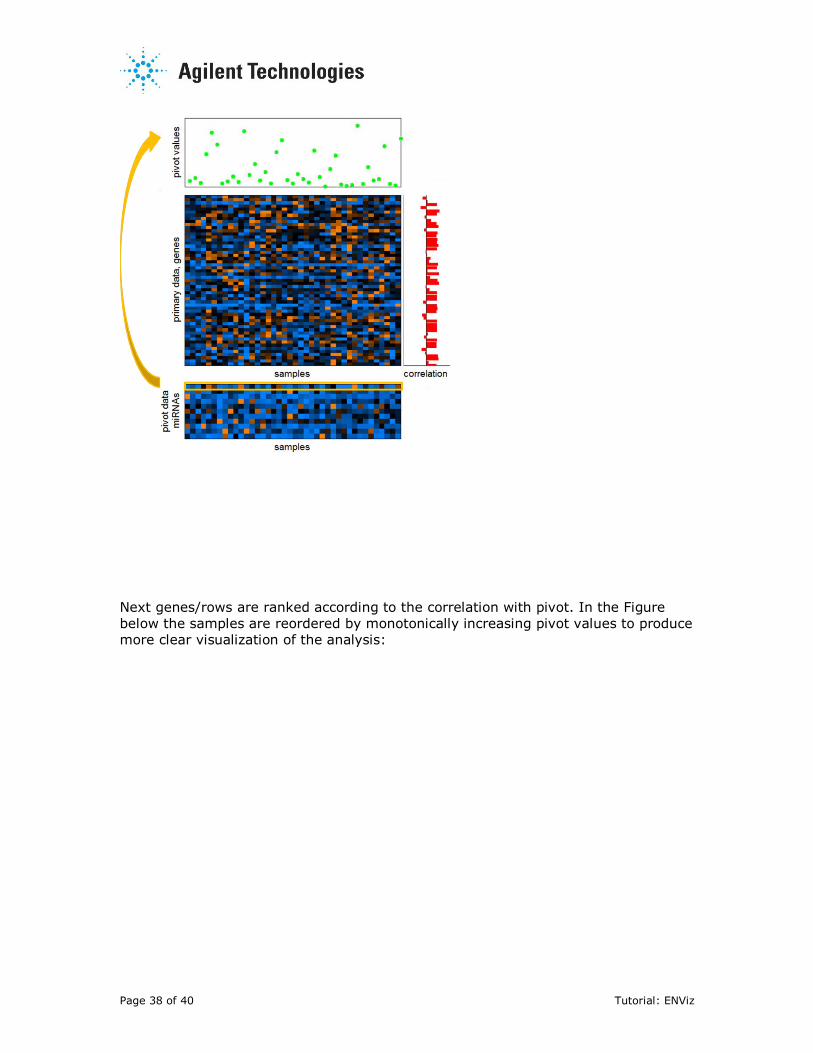
A correlation value is calculated for every row/gene in the primary data with respect to the first pivot. Correlation could be Pearson or Spearman. Correlation values to
the first pivot are plotted on the right hand side of the pivot data matrix heatmap:
Page 38 of 40 Tutorial: ENViz
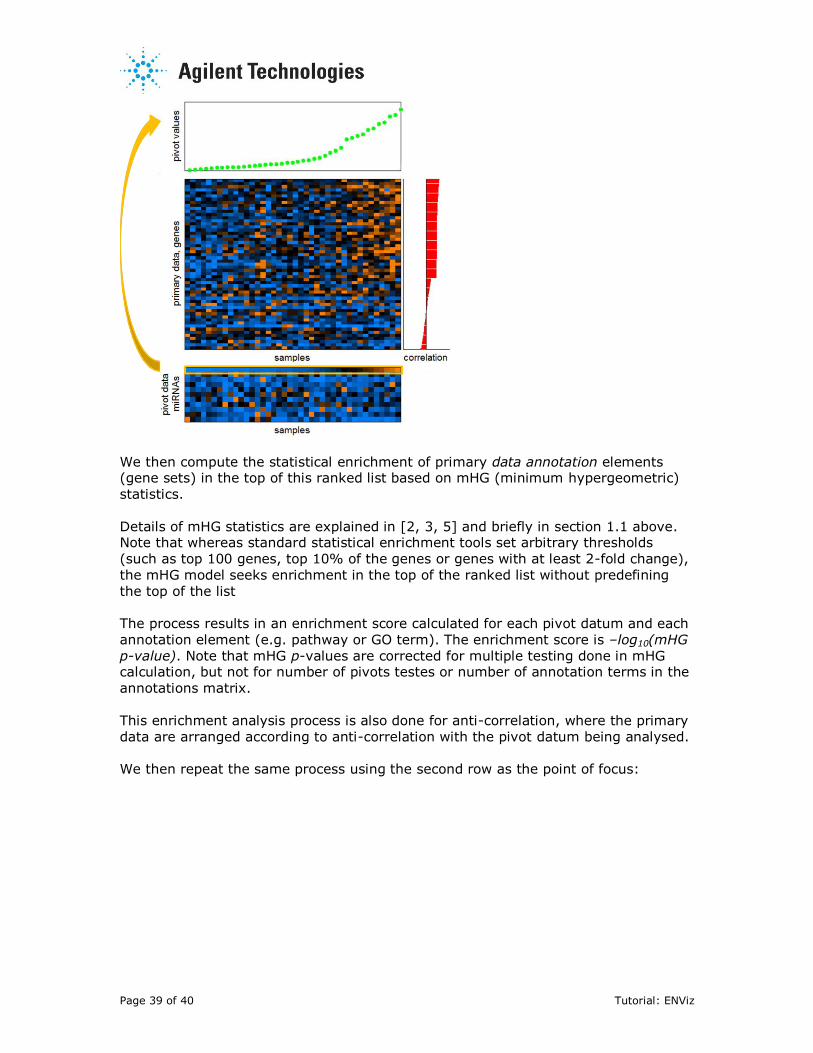
Next genes/rows are ranked according to the correlation with pivot. In the Figure
below the samples are reordered by monotonically increasing pivot values to produce
more clear visualization of the analysis:
Page 39 of 40 Tutorial: ENViz
We then compute the statistical enrichment of primary data annotation elements (gene sets) in the top of this ranked list based on mHG (minimum hypergeometric)
statistics.
Details of mHG statistics are explained in [2, 3, 5] and briefly in section 1.1 above. Note that whereas standard statistical enrichment tools set arbitrary thresholds
(such as top 100 genes, top 10% of the genes or genes with at least 2-fold change),
the mHG model seeks enrichment in the top of the ranked list without predefining
the top of the list
The process results in an enrichment score calculated for each pivot datum and each
annotation element (e.g. pathway or GO term). The enrichment score is –log10(mHG
p-value). Note that mHG p-values are corrected for multiple testing done in mHG calculation, but not for number of pivots testes or number of annotation terms in the
annotations matrix.
This enrichment analysis process is also done for anti-correlation, where the primary
data are arranged according to anti-correlation with the pivot datum being analysed.
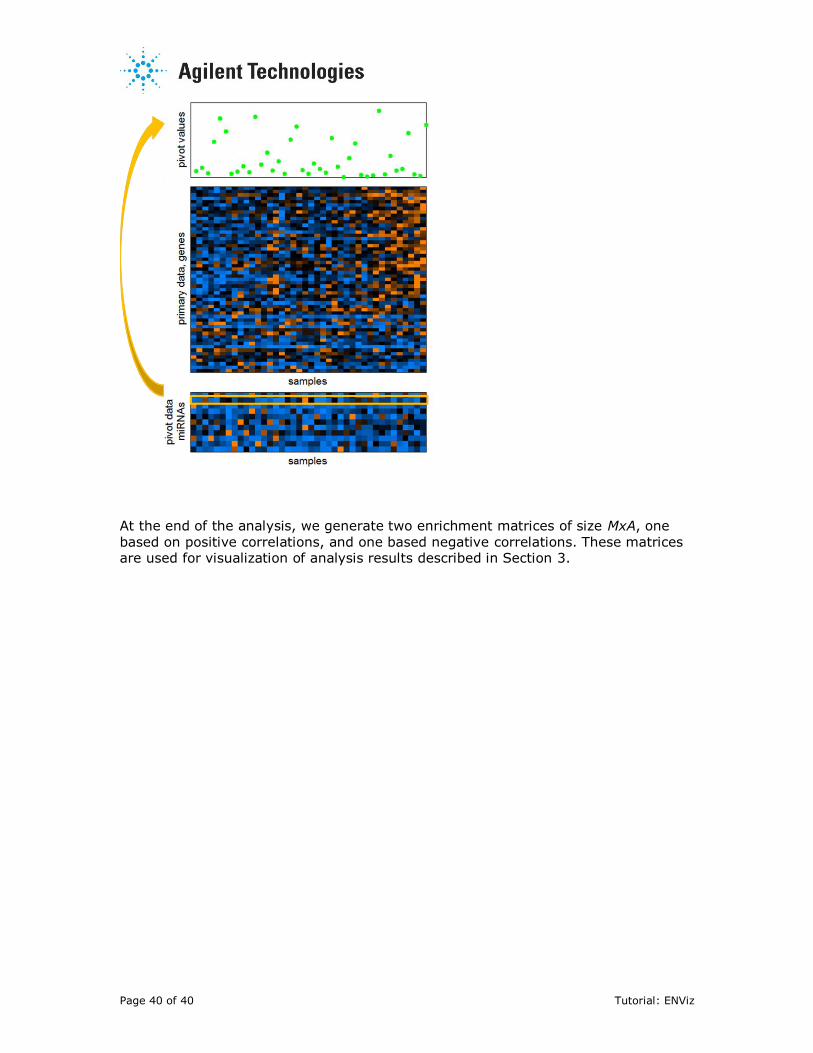
We then repeat the same process using the second row as the point of focus:
Page 40 of 40 Tutorial: ENViz
At the end of the analysis, we generate two enrichment matrices of size MxA, one
based on positive correlations, and one based negative correlations. These matrices are used for visualization of analysis results described in Section 3.