enzymatic synthesis and application of structured …
TRANSCRIPT

ENZYMATIC SYNTHESIS AND APPLICATION OF STRUCTURED LIPIDS FOR
INFANT FORMULA
by
LONG ZOU
(Under the Direction of Casimir C. Akoh)
ABSTRACT
A human milk fat (HMF) analogue synthesis from tripalmitin, stearidonic acid
(SDA) soybean oil, and docosahexaenoic acid (DHA) was scaled up by interesterification
catalyzed by Novozym 435 and acidolysis by Lipozyme TL IM, and then purified by
short-path distillation (SPD). This structured lipid (SL) contained 5.4 mol% DHA and 8.0
mol% SDA, with 57.0 mol% palmitic acid esterified at sn-2 position. Although
tocopheryl and tocotrienyl fatty acid esters were formed during interesterification and
acidolysis, >50% of vitamin E isomers were lost into distillates (wastes) during SPD,
which contributed mostly to the rapid oxidative deterioration of SLs in the recent and past
studies. Response surface methodology was applied to investigate the effects of lecithin,
monoacylglycerol, locust bean gum (LBG), and carrageenan on the physical and
oxidative properties of SL-based infant formula (IF) emulsion. Particle size, optical
stability, viscosity, relative content of DHA and SDA, and total oxidation value were
assessed during 28-day storage. In addition, the effect of permitted antioxidants (added at
0.005 and 0.02% of oil, respectively), including α-tocopherol, β-carotene, ascorbyl
palmitate, ascorbic acid, citric acid, and their combinations, on the lipid oxidation was

evaluated under an accelerated storage. The peroxide value, anisidine value, and hexanal
concentration of emulsion samples were measured. It was found that the optimal
conditions to achieve the highest physical and oxidative stability of SL-based IF emulsion
were 0.2 g/100 mL lecithin, 0.4 g/100 mL monoacylglycerol, 0.045 g/100 mL LBG,
0.015 g/100 mL carrageenan, and 0.005% ascorbyl palmitate. On the basis of
measurement of peroxide and anisidine values over a 28-day period, annatto TRF was
found to be a more effective antioxidant than palm TRF and α-tocopherol in inhibiting
lipid oxidation in menhaden fish oil and SL-based IF emulsion at 0.02% and 0.05%.
Addition of α-tocopherol (0-75%) did not interfere with the antioxidant activity of
tocopherol-free annatto TRF in the foods tested. Overall, this study has important
implications for the successful incorporation of SL into IF products for better infant
nutrition and health.
INDEX WORDS: Structured lipid, Lipase, Infant formula, Tocopherol, Tocotrienol,
Antioxidant, Lipid oxidation, Oil-in-water emulsion, Annatto,
Stearidonic acid soybean oil, Human milk fat

ENZYMATIC SYNTHESIS AND APPLICATION OF STRUCTURED LIPIDS FOR
INFANT FORMULA
by
LONG ZOU
B.S., Jimei University, China, 2005
M.S., Ocean University of China, China, 2008
A Dissertation Submitted to the Graduate Faculty of The University of Georgia in Partial
Fulfillment of the Requirements for the Degree
DOCTOR OF PHILOSOPHY
ATHENS, GEORGIA
2014

© 2014
Long Zou
All Rights Reserved

ENZYMATIC SYNTHESIS AND APPLICATION OF STRUCTURED LIPIDS FOR
INFANT FORMULA
by
LONG ZOU
Major Professor: Casimir C. Akoh Committee: Rakesh K. Singh William L. Kerr Ronald B. Pegg Electronic Version Approved: Julie Coffield Interim Dean of the Graduate School The University of Georgia August 2014

iv
DEDICATION
To my dear wife, my parents, and my sister

v
ACKNOWLEDGEMENTS
First of all I would like to especially thank my advisor, Dr. Casimir C. Akoh, for
his valuable advice and guidance on my academics, career, and personal matters
throughout the Ph.D. study. It has been my greatest pleasure to be his student under his
enthusiasm and expertise.
I also express my deep appreciation to Drs. Yao-Wen Huang, William L. Kerr,
Rakesh K. Singh, Alex Kojo Anderson, and Ronald B. Pegg for serving on my advisory
committee, and to Dr. Mark Harrison, Ms. Karen Simmons, and Ms. Lisa Cash for their
support and advice during my study. Also, I deeply appreciate my former M.S. advisor,
Dr. Hong Lin for his constant encouragement, support, and advice to lead my step
forward. I am grateful for the funding support from USDA National Institute of Food and
Agriculture for their grant to Dr. Akoh and also the two-year assistantship from the
Graduate School, The University of Georgia.
I would like to thank all my lab members for their kind support towards the
completion of my research. Special thanks to Ms. Victoria Wentzel, Garima Pande,
Supakana Nagachinta, Leslie Kleiner, and Ebenezer Ifeduba.
I owe my sincere thanks to all the faculty and staff of the Department of Food
Science & Technology for helping me out through the study.
Lastly, I would like to thank my parents and family for their endless love and
encouragement.

vi
TABLE OF CONTENTS
Page
ACKNOWLEDGEMENTS ............................................................................................. v
LIST OF TABLES ........................................................................................................vii
LIST OF FIGURES ........................................................................................................ ix
CHAPTER
1 INTRODUCTION.......................................................................................... 1
2 LITERATURE REVIEW ............................................................................... 7
3 IDENTIFICATION OF TOCOPHEROLS, TOCOTRIENOLS, AND THEIR
FATTY ACID ESTERS IN RESIDUES AND DISTILLATES OF
STRUCTURED LIPIDS PURIFIED BY SHORT-PATH DISTILLATION .. 67
4 CHARACTERIZATION AND OPTIMIZATION OF PHYSICAL AND
OXIDATIVE STABILITY OF STRUCTURED LIPID-BASED INFANT
FORMULA EMULSION: EFFECTS OF EMULSIFIERS AND
BIOPOLYMER THICKENERS ................................................................... 98
5 OXIDATIVE STABILITY OF STRUCTURED LIPID-BASED INFANT
FORMULA EMULSION: EFFECT OF ANTIOXIDANTS ....................... 129
6 ANTIOXIDANT ACTIVITIES OF ANNATTO AND PALM
TOCOTRIENOL-RICH FRACTIONS IN FISH OIL AND STRUCTURED
LIPID-BASED INFANT FORMULA EMULSION ................................... 161
7 CONCLUSIONS ........................................................................................ 185

vii
LIST OF TABLES
Page
Table 2.1: Dietary reference intakes: recommended dietary allowances and adequate
intakes for infants from birth to 1 year................................................................ 58
Table 2.2: Composition of mature human milk .............................................................. 59
Table 2.3: Major fatty acid composition of mature human milk ..................................... 60
Table 2.4: Representative studies on lipase-catalyzed synthesis of human milk fat
analogues ........................................................................................................... 61
Table 2.5: Compositional regulations of infant formula ................................................. 63
Table 2.6: Additives permitted in infant formula products ............................................. 65
Table 3.1: Total fatty acid profiles (mole percent) and molecular weight of substrates and
scaled-up SLs at optimal conditions ................................................................... 91
Table 3.2: Tocopherol and tocotrienol concentration and free fatty acid percentage of
substrates and scaled-up SLs .............................................................................. 92
Table 3.3: Tocopheryl and tocotrienyl esters identified by GC-MS in distillates after
short-path distillation ......................................................................................... 93
Table 4.1: Composition of the micronutrient premix fortified in ready-to-feed structured
lipid-based infant formula ................................................................................ 122
Table 4.2: Composition of structured lipid-based infant formula emulsion ................... 123
Table 4.3: D-optimal design: independent (Xi) and response variables (Yi). ................. 124

viii
Table 4.4: ANOVA for the effects of independent variables on the dependent variables,
and corresponding coefficients of the regression models .................................. 125
Table 4.5: Correlation coefficients (R) among methods for assessing the physical and
oxidative stability of infant formula emulsion .................................................. 126
Table 4.6: Expected and observed values for the model verification using a Chi-squared
test ............................................................................................................ 127
Table 5.1: Volatile oxidation compounds of structured-lipid based infant formula
identified by dynamic headspace GC-MS ......................................................... 154
Table 5.2: Fatty acid profiles (mole percent) of extracted fat from infant formulas ....... 155
Table 6.1: Summaries of research on the antioxidant activity of tocotrienols in model
systems, fats, and oils ....................................................................................... 179

ix
LIST OF FIGURES
Page
Figure 3.1: MALDI-TOF mass spectra of α-tocopherol, α-tocopheryl oleate and α-
tocopheryl linoleate from vitamin E linoleate mixture in positive ion mode. ....... 94
Figure 3.2: Total ion chromatograms of tocopheryl and tocotrienyl esters identified in the
(A) WNSL and (B) WLDHA in the SIM mode. ................................................. 95
Figure 3.3: Representative structures and EI full scan mass spectra of tocopheryl and
tocotrienyl esters: (A) α-tocopheryl oleate from vitamin E linoleate mixture, (B)
β(or γ)-tocopheryl palmitate from WNSL, and (C) α-tocotrienyl palmitate from
WLDHA. ........................................................................................................... 96
Figure 3.4: Mass spectrometric fragmentation mechanism of α-, β-, γ-, and δ- tocopheryl
linoleate in the EI mode. .................................................................................... 97
Figure 4.1: Contour plots showing (A) the effect of monoacylglycerols (MAG) and
lecithin on particle size, (B) the effect of carrageenan and locust bean gum (LBG)
on optical change, (C) the effect of MAG and LBG on apparent viscosity, (D) the
effect of lecithin and LBG on concentration ratio of palmitic acid to DHA and
SDA, and (E) the effect of lecithin and carrageenan (CG) on TOTOX value, while
keeping the left two independent variables constant, respectively ..................... 128
Figure 5.1: (A) Total ion chromatogram of the volatile compounds extracted from
structured-lipid based infant formula after 4-week storage at 37 °C by dynamic

x
headspace GC-MS; (B) Chromatogram of a matrix-matched standard solution
spiked with hexanal at 0.01 μg/mL analyzed by SPME-GC .............................. 156
Figure 5.2: Effect of antioxidants (0.005%) on the oxidative stability of structured lipid-
based infant formula emulsion over time at 37 °C: (A) peroxide value; (B) p-
anisidine value; and (C) hexanal content. ......................................................... 157
Figure 5.3: Effect of antioxidants (0.02%) on the oxidative stability of structured lipid-
based infant formula emulsion over time at 37 °C: (A) peroxide value; (B) p-
anisidine value; and (C) hexanal content. ......................................................... 158
Figure 5.4: Effect of α-tocopherol, ascorbic acid, and their mixture at a ratio of 1:1
(0.02%) on the oxidative stability of structured lipid-based infant formula
emulsion after 28 days of storage at 37 °C: (A) peroxide value; (B) p-anisidine
value; and (C) hexanal content. ........................................................................ 159
Figure 5.5: Oxidation induction time of structured lipid-based and commercial infant
formulas determined by DSC at 80 °C. ............................................................. 160
Figure 6.1: Chemical structures of tocotrienols and tocopherols ................................... 180
Figure 6.2: Effect of antioxidants (0.02% and 0.05%) on the oxidative stability of
menhaden fish oil at 37 °C: (A) and (B) peroxide value; (C) and (D) p-anisidine
value ............................................................................................................ 181
Figure 6.3: Effect of antioxidants (0.02% and 0.05%) on the oxidative stability of
structured lipid-based infant formula emulsion at 37 °C: (A) and (B) peroxide
value; (C) and (D) p-anisidine value. Data points represent the average of
duplicate samples ............................................................................................. 182

xi
Figure 6.4: Effect of α-tocopherol addition on the antioxidant ability of annatto
tocotrienol-rich fraction (TRF) in menhaden fish oil at 0.02% and 0.05% after 28
days of storage: (A) peroxide value; (B) p-anisidine value................................ 183
Figure 6.5: Effect of α-tocopherol addition on the antioxidant ability of annatto
tocotrienol-rich fraction (TRF) in structured lipid-based infant formula emulsion
at 0.02% and 0.05% after 28 days of storage: (A) peroxide value; (B) p-anisidine
value ............................................................................................................ 184

1
CHAPTER 1
INTRODUCTION
There is a growing interest among food chemists and nutritionists concerning
structured lipids (SLs) due to their desired physiochemical properties and/or health
benefits for food or nutritional applications, such as human milk fat (HMF) analogues.
Lipase-catalyzed synthesis of SLs, commonly interesterification and acidolysis, is
preferred over chemical synthesis because of its specificity and better control over the
final products (Xu, 2000). Human milk is the best source of nutrients for infants.
However, it is not always possible to feed infants with human milk due to physiological
and cultural reasons. The fatty acid composition and distribution of HMF are believed to
be a gold standard, and omega-3 long chain polyunsaturated fatty acids (n-3 LCPUFAs)
have been shown to play an essential role in the retinal and neurological development of
infants (Schuchardt, Huss, Stauss-Grabo, & Hahn, 2010). Therefore, SLs, which mimic
the unique structure of HMF as well as containing n-3 LCPUFAs in the triacylglycerol
backbone, are needed and may maximize health benefits for infants.
Moreover, it is important to consider whether such tailor-made lipids are
oxidatively stable to allow their use as ingredients. Many studies (Maduko, Park, &
Akoh, 2008; Martin, Reglero, & Senorans, 2010; Senanayake & Shahidi, 2002; Teichert
& Akoh, 2011) have reported that SLs produced by either lipase-catalyzed
interesterification or acidolysis are characterized by a lower oxidative stability compared
to the initial fat/oil substrates. The most serious concern is the loss of endogenous

2
antioxidants during production and purification of SLs, especially tocopherols and
tocotrienols, when vegetable oils are used as substrates. However, the reason or the basis
for the loss of these important antioxidants is poorly understood.
Furthermore, after synthesis and characterization of SLs as HMF analogues, little
work has been carried out to further apply these HMF analogues as an ingredient in
actual food system, such as ready-to-feed infant formula (IF). The formation and
stabilization of an oil-in-water (O/W) emulsion is an integral step in the manufacture of
infant nutritional products. Physical instability (e.g., creaming) and lipid oxidation are
among the most fundamental problems that can occur in IF emulsions, limiting the shelf-
life and acceptance of the final products. Therefore, it is necessary to understand the
interactions among different food ingredients and optimize the formulation (e.g.,
emulsifiers, thickeners, and/or antioxidants) to minimize the physical and oxidative
instability.
Additionally, there is a growing interest in food industry to apply natural
antioxidant to retard or inhibit lipid oxidation, due to their efficacy, safety, and additional
health-promoting benefits. Although the antioxidant and biological properties of
tocopherols, especially α-tocopherol, have been investigated extensively, little is known
about antioxidant activities of tocotrienols in food systems. An expanding body of
evidence has demonstrated that tocotrienols possesses powerful cholesterol-lowering,
anticancer, and neuroprotective properties that are often not exhibited by tocopherols
(Aggarwal, Sundaram, Prasad, & Kannappan, 2010; Watson & Preedy, 2009).
Nevertheless, unexpectedly, α-tocopherol has been shown to attenuate tocotrienol health
benefits in vivo (e.g., hypocholestrolemic and anticancer effects) (Qureshi et al., 1996;

3
Shibata et al., 2010). Little is known whether α-tocopherol can interfere with the
antioxidant ability of tocotrienols in foods. The major commercial sources of tocotrienols
are palm, rice bran and annatto. Palm or rice tocotrienol is a mixture of tocopherols and
tocotrienols, whereas annatto tocotrienol is virtually tocopherol-free and composed of
only γ- and δ-tocotrienols (Watson et al., 2009).
To fill these gaps, the research entitled “enzymatic synthesis and application of
structured lipids for infant formula” is carried out, and the whole dissertation is divided
into seven chapters. The first chapter gives introduction about the rationales, hypotheses,
and objectives of the research. The second chapter is a literature review of topics related
to infant nutrition, human milk composition, SLs as HMF analogues, infant formula, and
lipid oxidation in emulsions. The third chapter discusses the fate of endogenous
tocopherols and tocotrienols during production and purification of SLs. The fourth and
fifth chapters discuss the effect of emulsifiers, thickeners, and antioxidants on the
stability of SL-based IFs. The sixth chapter is on the antioxidant behaviors of tocotrienol-
rich fractions (TRFs) from different sources in bulk oils and O/W emulsions. The last
chapter covers the highlights of the whole study, along with some suggestions for future
work.
The goal of this dissertation research is to improve infant nutrition and health by
exploring and delivering functional and physiological SLs in their diets. To achieve this
goal, the specific objectives and hypotheses are set as follows.
Objective 1: Investigate the fate of endogenous vitamin E isomers during
production and purification (short-path distillation, SPD) of SLs. Specifically, (1)
identify tocopheryl and/or tocotrienyl fatty acid esters formed during lipase-catalyzed

4
interesterification and acidolysis; (2) quantitatively determine tocopherols and
tocotrienols present in all of the fractions after SPD. Hypothesis 1: The formation of
tocopheryl and/or tocotrienyl fatty acid esters, during either lipase-catalyzed
interesterification or acidolysis, is responsible for the compromised oxidative stability of
SLs (e.g., HMF analogues).
Objective 2: Develop a physically and oxidatively stable SL-based IF emulsion
to deliver HMF analogues enriched with beneficial LCPUFAs for infant nutrition and
health. Specifically, (1) investigate the effects of two important categories of ingredients,
emulsifiers (lecithin and monoacylglycerol) and thickeners (locust bean gum and
carrageenan), on the physical and oxidative stability of SL-based IF emulsion, and
optimize their levels to achieve the highest stability; (2) examine the effects of permitted
antioxidants on the oxidative stability of SL-based IF emulsion, and find the best
candidate to minimize lipid oxidation. Hypothesis 2: The physical and oxidative
stabilities of SL-based IF emulsion is highly influenced by the types and concentrations
of emulsifiers, thickeners, and antioxidants.
Objective 3: Determine and compare the antioxidant activities of commercial
annatto and palm TRFs in actual food systems, fish oil (bulk oil) and SL-based ready-to-
feed IF (O/W emulsion). Additionally, test whether α-tocopherol can interfere with the
antioxidant activity of tocopherol-free annatto TRF in the above foods. Hypothesis 3:
Annatto TRF is an effective natural antioxidant in foods.

5
References
Aggarwal, B. B., Sundaram, C., Prasad, S., & Kannappan, R. (2010). Tocotrienols, the
vitamin E of the 21st century: Its potential against cancer and other chronic
diseases. Biochemical Pharmacology, 80(11), 1613-1631.
Maduko, C. O., Park, Y. W., & Akoh, C. C. (2008). Characterization and oxidative
stability of structured lipids: Infant milk fat analog. Journal of the American Oil
Chemists’ Society, 85(3), 197-204.
Martin, D., Reglero, G., & Senorans, F. J. (2010). Oxidative stability of structured lipids.
European Food Research and Technology, 231(5), 635-653.
Qureshi, A. A., Pearce, B. C., Nor, R. M., Gapor, A., Peterson, D. M., & Elson, C. E.
(1996). Dietary α-tocopherol attenuates the impact of γ-tocotrienol on hepatic 3-
hydroxy-3-methylglutaryl coenzyme a reductase activity in chickens. The Journal
of Nutrition, 126(2), 389-394.
Schuchardt, J. P., Huss, M., Stauss-Grabo, M., & Hahn, A. (2010). Significance of long-
chain polyunsaturated fatty acids (PUFAs) for the development and behaviour of
children. European Journal of Pediatrics, 169(2), 149-164.
Senanayake, S., & Shahidi, F. (1999). Enzymatic incorporation of docosahexaenoic acid
into borage oil. Journal of the American Oil Chemists’ Society, 76(9), 1009-1015.
Shibata, A., Nakagawa, K., Sookwong, P., Tsuduki, T., Asai, A., & Miyazawa, T. (2010).
α-Tocopherol attenuates the cytotoxic effect of δ-tocotrienol in human colorectal
adenocarcinoma cells. Biochemical and Biophysical Research Communications,
397(2), 214-219.

6
Teichert, S. A., & Akoh, C. C. (2011). Characterization of stearidonic acid soybean oil
enriched with palmitic acid produced by solvent-free enzymatic
interesterification. Journal of Agricultural and Food Chemistry, 59(17), 9588-
9595.
Watson, R. R., & Preedy, V. R. (2009). Tocotrienols :Vitamin E beyond tocopherols.
Boca Raton, FL: CRC Press.
Xu, X. B. (2000). Production of specific-structured triacylglycerols by lipase-catalyzed
reactions: A review. European Journal of Lipid Science and Technology, 102(4),
287-303.

7
CHAPTER 2
LITERATURE REVIEW
Nutritional needs during infancy
Infancy is a period (0-12 months) marked by the most rapid physical growth and
development of a person’s life (NRC, 2006; Trahms & McKean, 2008). Infancy can be
divided into several stages, with physical growth, behavioral developments, nutrition
needs, and feeding patterns varying significantly (Isaacs, 2011). The most rapid changes
occur in early infancy (0-6 months). Typically, infants double their birth weight by 4 to 6
months (Pipes & Trahms, 1993). The digestive system of healthy full-term infants is
functional at birth, although the levels of digestive enzymes may be lower than older
infants (Isaacs, 2011; Pipes et al., 1993). It takes about 6 months for the gastrointestinal
tract to mature (Hagan, Shaw, & Duncan, 2008). In late infancy (7-12 months), infants’
physical maturation and mastery of purposeful activity allow them to eat a wide variety
of foods. World Health Organization (WHO) and American Academy of Pediatrics
(AAP) recommend starting feeding complementary foods after exclusive breastfeeding
for 6 months (Eidelman et al., 2012; WHO, 2009). Inadequate nutrition in infancy may
lead to lifelong consequences. Therefore, to meet the growth demands of infants,
adequate intakes of calories, protein, fat, carbohydrate, vitamins, and minerals are
required. The dietary reference intakes (DRIs) for infants (NRC, 2006) are extrapolated
from the intakes of full-term infants exclusively fed human milk (Table 2.1).

8
Energy
The caloric needs during infancy are higher than other life stages. The average
caloric need of infants in the first 6 months is 108 kcal/kg body weight, and the need is
reduced to 98 kcal/kg body weight from 7 to 12 months (Isaacs, 2011; NRC, 2006).
About half of infant calories should be obtained from fat to meet the demands of growth
and development (Trahms et al., 2008). Factors that account for the caloric needs of
infants include weight, growth rate (e.g., catch-up and lag-down periods), sleep/wake
cycle, temperature and climate, physical activity, metabolic response to food, and health
status (Isaacs, 2011).
Protein
Protein needs of infants vary with the same factors as calorie needs (Isaacs, 2011).
However, they are also influenced by body composition due to the requirements for tissue
replacement, deposition of lean body mass, and growth (Isaacs, 2011; Trahms et al.,
2008). Recommended protein intake from birth to 6 months is 9.1 g of protein per day,
and from 7 to 12 months the need is 11 g of protein per day (Table 2.1). Moreover, the
amino acids that are essential for adults are also required by infants, including
phenylalanine, valine, threonine, tryptophan, methionine, leucine, isoleucine, lysine, and
histidine. Additionally, Tyrosine, cystine, and taurine are essential for premature infants
(Fomon, 1993).
Fat
Infants need fat, a concentrated source of calories, to support their high demand
for calories. The current recommendation for infants younger than 1 year of age is to
consume a minimum of 30 g of fat per day (Table 2.1). Cholesterol intake should not be

9
restricted during infancy because of the needs for gonad and brain development (Isaacs,
2011). Besides total fat, infants also require essential fatty acids, linoleic acid (LA) and α-
linolenic acid (ALA), as substrates for the syntheses of hormones, eicosanoids, and long-
chain polyunsaturated fatty acids, especially arachidonic acid (ARA), eicosapentaenoic
acid (EPA), and docosahexaenoic acid (DHA). The current recommendation of linoleic
acid (a precursor of the n-6 fatty acids) is 4.4 g/day for infants younger than 6 months of
age and 4.6 g/day for infants from 7 months to 1 year of age. The need for α-linolenic
acid (a precursor of the n-3 fatty acids) is 0.5 g/day during the first year of life. Recently
the importance of ARA and DHA for the retinal and neurologic developments in infants
has been recognized (Kidd, 2007; Schuchardt, Huss, Stauss-Grabo, & Hahn, 2010).
However, their dietary intakes are uncertain.
Carbohydrate
Carbohydrates (e.g., lactose in breast milk) supply 30-60% of the energy intake
during infancy (Trahms et al., 2008). However, some infants cannot tolerate lactose and
an alternative formula may be required in their diet. Recommended intake from birth to 6
months is 60 g per day, and from 7 to 12 months the need is 95 g per day.
Water
The recommended total water intake for infants is 0.7 L/day for infants up to 6
months and 0.8 L/day for infants from 7 to 12 months of age. Concentrated and
excessively diluted milk or formula is inappropriate for infants. In very hot and humid
environments, infants may require additional water. In addition, juice is not needed
before the age of 6 months, and colas and tea should be avoided (Eidelman et al., 2012).

10
Micronutrients
For the micronutrients, specific supplements are recommended for breastfed
infants under circumstances.
Iron
Although iron in human milk is highly bioavailable, infants who are only fed
human milk are at risk at 4 to 6 months of age for developing a negative iron balance and
may deplete the iron reserves by 6 to 9 months (Kim, Cheong, Jun, Choi, & Son, 1996).
Therefore, the recommended adequate intake (AI) for infants from 0 to 6 months of age is
0.27 mg/day, and for infants from 7 to 12 months, the AI is 11 mg/day. Iron fortified
cereals and infant formula are good complementary sources (WHO, 2009).
Fluoride
Fluoride is necessary for the tooth development. Fluoride supplements are
recommended if the family lives in a place that does not provide fluoridated water
(Eidelman et al., 2012; Isaacs, 2011). The DRI for fluoride is 0.01 and 0.5 mg daily for
infants < 6 months and 7-12 months of age, respectively.
Vitamin D
Human milk supplies all the vitamins the infant needs except for vitamin D. It
only contains approximately 0.5 μg of vitamin D (Trahms et al., 2008). Thus, breastfed
infants are at risk for vitamin D deficiency due to low amounts in breast milk and limited
sun exposure. A vitamin D supplement of 5 μg per day for breastfed infants is
recommended to prevent vitamin D deficiency and rickets.

11
Vitamin B12
Vitamin B12 supplements may be needed if the mother has followed a vegan diet
for a long time before and during the pregnancy. The AI for infants is 0.4 μg/day during
the first 6 months and 0.5 μg/day during the second 6 months of life.
Vitamin K
Deficiency of Vitamin K may result in bleeding or hemorrhagic disease of the
new born (Trahms et al., 2008). The AI for infants is 2 μg/day during the first 6 months
and 2.5 μg/day during the second 6 months of life. To reduce the risk of hemorrhagic
disease, an injection of vitamin K is required for the newborns in many states of America
(Eidelman et al., 2012).
Human milk composition
Human milk provides a complex of nutrients that an infant needs in the first 12
months of life, including proteins, carbohydrates, fats, vitamins, minerals, water, and
other physiological components (e.g., white cells and enzymes) (Riordan, 2005; Table
2.2). Human milk is not a uniform body fluid. It varies not only from individual to
individual but also with stages of lactation, time of feeding, and maternal diet (Akers &
Groh-Wargo, 1999). On the basis of expression stage, human milk can be divided into
colostrum (0-7days), transitional milk (7-14 days), mature milk (14 days-7 months), and
extended lactation (7 months-2 years) (Akers et al., 1999). Each stage has its own
biochemical components and properties. For example, yellowish colostrum is lower in
carbohydrate, fat, and energy than mature milk but higher in protein, fat-soluble vitamins
(e.g., vitamin A), minerals, and antibodies (e.g., immunoglobulin A, IgA) (Riordan,

12
2005). Thus colostrum can provide important immune protections to an infant when he or
she is first exposed to the microorganisms in the environment (WHO, 2009).
Fat
Human milk contains 3-5 g/100 mL fat, which provides >50% of the dietary
energy and essential fatty acids (LA and ALA) required by the infants (Jenness, 1979).
Moreover, human milk fat (HMF) is a structural component of cell membranes, a carrier
of fat-soluble vitamins, and a precursor for the synthesis of hormones and eicosanoids
(e.g., prostaglandins, thromboxanes, and leukotrienes) (Jensen, 1999). HMF is composed
of triacylglycerols (TAGs, 98-99%), phospholipids (0.26-0.80%), sterols (mainly
cholesterols, 0.25-0.34%), and other minor components (Jensen, 1999).
The TAGs in HMF have specific compositions (Jensen, 1999; Lopez-Lopez,
Sabater, Folgoso, Urgell, & Bargallo, 2002; Straarup, Lauritzen, Faerk, Hoy, &
Michaelsen, 2006). The major fatty acids (FAs) are oleic acid (28-44%), palmitic acid
(15-25%), linoleic acid (11-25%), myristic acid (4-9%), and stearic acid (5-8%) (Table
2.3). It also contains minor medium-chain FAs (e.g., caprylic acid and capric acid), long-
chain polyunsaturated fatty acids (LCPUFAs; e.g., DHA, EPA, and ARA), and
conjugated linolenic acid (mainly cis-9, trans-11 C18:2). The FA composition of HMF is
highly influenced by maternal diet (Riordan, 2005). Medium-chain FAs provide rapid
source of energy for infants. DHA and ARA are critical components of cellular
membranes and essential for the retinal and brain development (Schuchardt, Huss,
Stauss-Grabo, & Hahn, 2010). DHA and EPA combinations have been shown to benefit
neurological disorders, such as attention deficit hyperactivity disorder (Kidd, 2007). LA

13
and ALA and their products DHA, EPA, and ARA in proper balance may be required for
optimal nutrition of infants (Jensen, 1999; Michalski, 2013).
The TAGs in HMF also have a unique stereospecific structure (“OPO”) with
palmitic acid primarily esterified at sn-2 position (about 60%) and unsaturated FAs
mainly at sn-1,3 positions (Lopez-Lopez et al., 2002; Straarup et al., 2006). This unique
FA distribution greatly affects their digestion, absorption, and metabolism. During fat
digestion, pancreatic lipase (sn-1,3 specific enzyme) hydrolyzes FAs at sn-1,3 positions
as free fatty acids, producing 2-monoacylglycerol which is efficiently absorbed.
However, the absorption efficiency of the FAs from sn-1,3 positions depends on the
length of carbon chain and degree of unsaturation. If palmitic acid is predominately
located at sn-1,3 positions, like physically blended vegetable oils used in traditional
infant formula, it is released as free palmitic acid. At the alkaline condition of small
intestine, these free palmitic acid interact readily with cations (e.g., calcium and
magnesium) to form insoluble soaps which are excreted as hard stools (Lien, 1994;
Carnielli et al., 1995; Lopez-Lopez et al., 2001). This results in the unavailability of
palmitic acid and minerals to infants. Therefore, the unique TAG structure of HMF
improves absorption of palmitic acid (energy) and calcium and has substantial benefits
for the growth of infants (Innis, 2011). That is why recent researches in the field of infant
formula tend to synthesize lipids to mimic TAG structure of HMF.
In human milk (oil-in-water), lipid molecules are organized in the form of a
unique emulsified structure, milk fat globules (MFGs). It contains a core composed of
TAGs, surrounded by a biological milk fat globule membrane (MFGM) (Lopez and
Menard, 2011; Michalski, Briard, Michel, Tasson, & Poulain, 2005). In mature milk,

14
MFGs have a mean diameter of 4-5 μm and a surface area of about 2 m2/g (Lopez et al.,
2011). The size of MFGs is larger in colostrum and transitional milk than in mature milk
(Michalski et al., 2005). Interestingly, MFG size has been found to be correlated with
lipid content, indicating that increasing milk fat content is associated with larger MFGs
rather than an increased number of MFGs of similar size (Michalski et al., 2005).
Compared to MFGs, homogenized lipid droplets in infant formula have a smaller particle
size (~1 μm) and larger surface area (~22 m2/g) (Michalski et al., 2005). The MFGM
with a trilayer structure contains phospholipids, glycolipids, proteins (e.g., membrane
transporters, receptors, and enzymes), and lipid rafts rich in cholesterol and sphigomyelin
(Lopez et al., 2011). All these together can protect infants against infections (Hamosh et
al., 1999) and enhance lipid digestion and absorption (Armand et al., 1996). In addition,
the protective structure of MFGM also contributes to the high oxidative stability of
expressed human milk despite its richness in LCPUFAs (Michalski, 2013).
Protein
Mature human milk contains 0.8-0.9 g/100 mL protein with balanced amino acids
to meet the nutritional needs of infants (Jenness, 1979). It mainly contains casein and
whey protein. Whey protein, which is acidified in the stomach, forms a soft and
flocculent curd that is easily digested, whereas casein (the primary protein in cow milk)
forms a tough and less digestible curd that requires a high expenditure of energy
(Riordan, 2005). The level of whey protein and casein changes as lactation proceeds,
resulting in a whey protein/casein ratio of about 90:10 in early lactation, 60:40 in mature
milk, and 50:50 in late lactation (Kunz and Lonnerdal, 1992). Whey protein in human
milk is also composed of five major components, α-lactalbumin, serum albumin,

15
lactoferrin, immunoglobulins, and lysozyme (Raiha, 1985). α-Lactalbumin is the
dominant whey protein in human milk. Compared to cow milk, human milk contains
higher content of α-lactalbumin but no β-lactoglobulin (Raiha, 1985). Lactoferrin,
immunoglobulins (especially IgA), and lysozyme play important roles in the
immunological defense of infants (Riordan, 2005). Lactoferrin also protects infants
against iron-deficiency (Raiha, 1985). About 25% of the total nitrogen of human milk
represents nonprotein compounds including urea, uric acid, creatine, creatinine, and a
large number of amino acids (e.g., glutamic acid and taurine) (Jenness, 1979; Raiha,
1985).
Carbohydrate
The main carbohydrate in human milk is lactose (about 7 g/100 mL), although a
small amount of galactose, fructose, and oligosaccharides is also present (Jenness, 1979).
Lactose enhances calcium absorption and metabolizes readily to supply energy for the
rapid growth of infants (Riordan, 2005). The enzyme lactase is present in the intestinal
mucosa after birth (Riordan, 2005). However, its activity gradually diminishes after
weaning, resulting in lactose intolerance. Oligosaccharides promote the growth of
Bifidobacteria and Lactobacilli, balancing intestinal microbes and protecting against
infection from pathogenic bacteria (Dai, Nanthkumar, Newburg, & Walker, 2000).
Vitamins and minerals
Breast milk normally contains sufficient vitamins for an infant, except vitamin D
and K (Jenness, 1979; WHO, 2009). Therefore, the infant needs exposure to sunlight to
generate endogenous vitamin D or a supplement of vitamin D. Only a small amount of
vitamin K, which is required for the synthesis of blood-clotting factors, is present in

16
human milk (Riordan, 2005). After birth, intakes of human milk can promote
gastrointestinal bacterial colonization, which increases the levels of vitamin K (Riordan,
2005). The principal mineral constituents of human milk are sodium, potassium, calcium,
magnesium, phosphorus, and chloride (Jenness, 1979; WHO, 2009). The minerals iron
and zinc are present at a relatively low concentration, but their bioavailability is high
(WHO, 2009).
Lipase-catalyzed synthesis of structured lipids (SLs) as HMF analogues (HMFAs)
The fatty acid composition and distribution of HMF are believed to be a gold
standard, and many approaches have been tried to produce SLs to mimic HMF (Table
2.4). SLs are generally defined as TAGs that have been chemically or enzymatically
modified from their natural biosynthetic state by changing the FA composition and/or the
positions of FAs in the glycerol backbone to yield novel lipids (Akoh & Kim, 2008). SLs
can be synthesized by direct esterification, acidolysis, alcoholysis, and interesterification
reactions.
Direct esterification: Glycerol + FA → TAG + Water
Acidolysis: TAG1 + FA1 → TAG2 + FA2
Alcoholysis: TAG1 + Alcohol1 → TAG2 + Alcohol2
Interesterification: TAG1 + TAG2 → TAG3 + TAG4
Lipase-catalyzed synthesis is preferred over chemical synthesis because of
specificity, mild reaction conditions, ease of product recovery, energy efficiency, and
minimal waste disposal (Xu, 2000). Factors, including lipase activity and load, substrates,
synthesis procedures, temperature, water activity, reaction time, and reactors, could affect
the composition, yield, and purity of the products. For example, diacylglycerols (DAGs)

17
are considered as the intermediates in the reaction, which are produced by hydrolysis
from original TAGs and reesterified with FAs to form new TAGs. However, DAGs are
also the precursor of side reactions (acyl migration) since they are not thermodynamically
stable, which lead to the formation of by-products. Therefore, all these factors should be
considered when selecting strategies for enzymatic production of HMFAs.
Lipases
Lipases (triacylglycerol hydrolase, EC 3.1.1.3) can catalyze hydrolytic and
synthetic reactions of fats and oils in the presence or absence of organic solvents. A
certain amount of water is also needed to maintain the lipase in an active three-
dimensional structure, making the active site accessible to the substrate via an interfacial
activation mechanism (Willis & Marangoni, 2008). Commercial lipases are available
from microbial, plant, and animal sources. Among them, microbial lipases are the most
attractive ones as they are thermostable, without co-lipase requirements, and of different
specifications that have been extensively described (Xu, 2000). Lipases from different
sources display distinct FA and positional specificity. Lipase from Candida rugosa
exhibits discrimination against DHA, γ-linolenic acid (GLA), and stearidonic acid (SDA)
(Weber & Mukherjee, 2008). Recently, pancreatic lipase has been shown to selectively
hydrolyze docosapentaenoic acid over EPA and DHA due to the FA specificity rather
than regiospecificity (Akanbi, Sinclair, & Barrow, 2014). Lipases can also exhibit
specificity to certain FA chain length (Weber et al., 2008; Xu, 2000). sn-1,3 Specific
lipases (e.g., lipase from Rhizomucor miehei) preferentially catalyze reactions on the
external (sn-1 or sn-3) positions of the glycerol backbone, without affecting the internal
position (sn-2) due to steric hindrance (Stadler, Kovac, Haalck, Spener, & Paltauf, 1995).
18
In contrast, nonspecific lipases do not possess positional or FA selectivity and produce
products that are similar to those obtained through chemical reactions (Macrae, 1983).
The stability of lipases is one of the major concerns for industrial applications due
to their high cost. Immobilization is often used to improve their stability and reusability,
thus lowering the cost of the reaction. Immobilization also affects the selectivity,
chemical, and physical properties of the lipases (Rodrigues, Ortiz, Berenguer-Murcia,
Torresd, & Fernandez-Lafuente, 2013). So far, Lipozyme TL IM (Thermomyces
lanuginosus immobilized on silica gel, sn-1,3 specific lipase) , Lipozyme RM IM
(Rhizomucor miehei immobilized on microporous ion exchange resin, sn-1,3 specific
lipase), and Novozym 435 (Candida antarctica immobilized on macroporous acrylic
resin beads, nonspecific lipase) have gained more attention for the production of HMFAs
(Table 2.4). Lipozyme TL IM was found to have much lower catalytic activity than
Lipozyme RM IM in the acidolysis, while they had similar catalytic activity in
interesterification (Yang, Fruekilde, & Xu, 2003).
Lipase content affects the reaction rate. A high enzyme load accelerates the
reaction and improves the incorporation of acyl donors. However, an increase in enzyme
load also increases acyl migration and production cost (Xu, 2000). Therefore, a suitable
enzyme load (usually 10-20% of total substrates) is important for shaping the fatty acid
profiles of the products.
Substrates
Substrates in the form of ethyl ester, TAG, or free fatty acid (FFA) are often used
as acyl donors to produce HMFAs. The reaction between two TAGs by sn-1,3 specific
lipases results in similar TAG species to those produced by randomization, even though

19
their contents may not be totally the same (Xu, 2000). The selection of ethyl esters as
acyl donors are mainly due to their easy separation by distillation but more DAG
formation may occur (Xu, 2000). FFAs are commonly used as acyl donors due to their
easy availability and high reactivity. Table 2.4 summarizes the substrates used in recent
studies to synthesize HMFAs. Due to a high proportion of palmitic acid at sn-2 position,
lard has been selected as a starting material for the production of HMFAs. However,
because of religious constraints and potential health concerns, lard is not widely used.
Palm stearin, a fraction of palm oil with a high content of tripalmitin, has been
successfully applied to produce HMFAs. Vegetable oils, such as olive and amaranth oils,
are rich sources of oleic and linoleic acids. Oils containing LCPUFAs (e.g., DHA, EPA,
and ARA) are used to benefit the retinal and brain development of infants. SDA soybean
oil (SDASO) is also used to increase the intake of n-3 FAs in infants. SDA converts to
EPA more efficiently than ALA by skipping Δ6-desaturase rate-limiting step (Lemke et
al., 2010), and is considered a “pro-EPA” fatty acid. Also, SDA is more stable than EPA
and DHA for commercial use due to less unsaturation. Medium-chain FAs (especially
caprylic and capric acids) from Neobee can provide a quick source of energy and a
protection to bacterial and viral infections. In addition, a proper balance of LA/ALA or n-
6/n-3 PUFAs of final products should also be considered for the selection of acyl donors
to meet the nutrition requirements of infants.
The TAG compositions of the products depend on the substrate ratios after
reaction equilibrium has been achieved. A high substrate ratio certainly moves the
reaction equilibrium to the product side and improves the acyl incorporation. The choice
of substrate mole ratio is also related to the cost of downstream processing and the

20
associated difficulties of separating FFAs and acyl donors by distillation to obtain
purified HMFAs. Therefore, a reasonable amount of substrates should be selected.
Synthesis procedure
There are two general reaction routes for HMFA production. The first route is
conducted in one step, i.e. acidolysis of TAG with FA, or interesterification between two
TAGs or between TAG and ethyl or methyl ester of FA. One-step process is normally
simple and easily performed without additional hydrolysis steps. Betapol (Loders
Croklaan, Glen Ellyn, IL, USA), an example of commercial HMFAs, is produced by
acidolysis of tripalmitin with unsaturated FAs catalyzed by sn-1,3 specific lipase (King &
Padley, 1989).
The second route is carried out in two steps, i.e., hydrolysis and reesterification
with the acyl groups to be incorporated, which can produce products of a high yield and
purity. A typical two-step approach involves alcoholysis of TAG by sn-1,3 specific lipase
to first obtain 2-monoacylglycerol (MAG), followed in the second step by direct
esterification of purified 2-MAG with unsaturated FAs (Schmid, Bornscheuer,
Soumanou, McNeill, & Schmid, 1999).
Recently, Pande, Sabir, Baeshen, and Akoh (2013) used multiple lipases for
HMFA synthesis. They reported that although enzymes had better reusability in two-
stage (sequential addition of lipase) synthesis, one-stage (dual lipase) synthesis was faster
and also resulted in higher incorporation of acyl groups (e.g., ARA and DHA) than two-
stage synthesis.

21
Temperature
Temperature has a dual effect on the rate of reaction. According to the Arrhenius
law, an increase in temperature usually results in an acceleration effect during reactions
catalyzed by enzymes. At elevated temperatures, operation is also easy, since a high
temperature increases solubility of substrates in organic solvents or decreases the
viscosity of substrates in a solvent-free system for food applications. However, higher
temperature leads to higher lipase deactivation rates and more acyl migration as well. A
compromise among incorporation, acyl migration, and lipase deactivation has to be made
to select the right reaction temperature (usually 50-70 °C) (Willis et al., 2008).
Water activity
A minimum amount of water is essential to activate the lipase. However, higher
quantities of water result in a higher hydrolysis of TAGs as well as a higher acyl
migration that may affect the yield and purity of products (Willis et al., 2008). The
optimum water activity for lipase-catalyzed reactions is generally between 0.25 and 0.45,
which usually corresponds to moisture contents between 0.5 and 1% (Soumanou,
Perignon, & Villeneuve, 2013).
Reactors
The commonly used reactors for the production of HMFAs are stirred batch
reactor and fixed bed reactor. Stirred batch reactor is often used in laboratory due to its
simplicity and low cost. The substrates and immobilized lipases are fed manually, and
the reaction takes place at a specific temperature and time with continuous stirring. The
product is collected after separation from lipases by filtration. The reaction rate in a
stirred batch reactor was found to be higher than that obtained in a fixed bed reactor

22
(Jimenez et al., 2010). However, a gradual decline in enzymatic activity with increasing
batch numbers was reported (Holm & Cowan, 2008). Therefore, addition of lipases or a
longer reaction time without addition is required.
Fixed bed reactors are generally used for a large-scale synthesis because of their
efficiency, low cost, and ease of operation. Fixed bed reactors consist of a column packed
with immobilized enzymes through which the substrates and products are pumped in and
out at the same rate. Increasing residence time in the reactor could increase the product
yield (Willis et al., 2008). However, substrate utilization is limited due to the equilibrium
nature of the reaction (Soumanou et al., 2013). Therefore, multi-stage processes have
been utilized to increase the incorporation rate of FAs into TAGs, such as the production
of Betapol in industry (Akoh & Xu, 2002; Soumanou et al., 2013). After acidolysis
reaction in the first fixed bed reactor, products were purified by distillation to remove
FFAs. The purified product was then reacted again with new acyl donors (e.g., oleic acid)
for the acidolysis reaction in the second fixed bed reactor. After a second purification
step to remove FFAs, the products were fractionated and refined for edible uses.
Evaluation of HMFAs
Different HMFAs have different FA compositions and positional distributions.
Therefore, some criteria are needed to evaluate their quality. Wang et al. (2010) reported
a model to evaluate the degree of similarity of HMFAs to HMF on the basis of total and
sn-2 FA composition. A “deducting score” principle was used in the model to evaluate
the degree of similarity. Zou et al. (2011) applied this model to evaluate HMFAs from
palm stearin, and a high score of 85.8 was obtained. Recently, Zou et al. (2013) extended
the previous evaluation model and used TAG composition as a comparison base.

23
Stability of HMFAs
HMFSs produced with fats and oils containing unsaturated fatty acids (e.g.,
LCPUFAs) can deteriorate during storage and produce off-flavors due to oxidation. In
addition, the reaction processes for HMFAs increase FFA concentration, which also
contributes to the development of unacceptable off-flavors. Therefore, oxidation stability
of HMFAs provides insights on the acceptability and nutritional quality of these tailor-
made lipids for formulation and consumption. In general, most studies have reported less
oxidative stability of HMFAs compared to original oils (Martin, Reglero, & Senorans,
2010). This decrease is mainly attributed to the loss of endogenous antioxidants (e.g.,
tocopherols) during purification steps (e.g., distillation) (Maduko, Park, & Akoh, 2008;
Sørensen, Xu, Zhang, Kristensen, Jacobsen, 2010). Hamam and Shahidi (2006) also
proposed that the formation of tocopheryl fatty acid esters in acidolysis may compromise
the oxidative stability of modified oils. Therefore, tocopherols, other natural antioxidants
(e.g., rosemary extract) or synthetic ones (e.g., ascorbyl palmitate) should be
supplemented to stabilize HMFAs.
Infant formula (IF)
Human milk is the best source of nutrients for infants. However, it is not always
possible to feed infants with human milk due to physiological and cultural reasons, thus
an alternative formula is needed. IF is defined as a food which purports to be or is
represented for special dietary use solely as a food for infants by reason of its simulation
of human milk or its suitability as a complete or partial substitute for human milk (FDA,
1938). Typically, infant nutritional products contain dairy proteins, vegetable oils,
lactose, vitamins, minerals, food additives (e.g., thickeners, emulsifiers, antioxidants, and

24
acidity regulators), and other nutrients. The AAP recommends that iron-fortified cow’s
milk-based IF is the most appropriate milk feeding from birth to 12 months for infants
who are not breastfed or who are partially breastfed (Baker et al., 1999).
Types
Infant nutritional products are commercially available in several forms, including
convenient ready-to-feed liquid, concentrated liquid, and powdered products. Ready-to-
feed liquid IF does not require addition of water and is convenient for feeding, whereas
both concentrated liquid and powdered formulas require dilution prior to use. Thus, the
safety of these formulas may be compromised if the water is contaminated. In addition,
powdered IFs are not subject to the same sterilization process as liquid formulas, thus
they are more susceptible to bacterial contaminations, such as Enterobacter sakazakii
(WHO, 2007). Therefore, infants who are not breastfed and of high-risk (e.g., preterm
babies) should be encouraged to use sterile liquid formula or formula which has
undergone an effective decontamination procedure (e.g. use of boiling water to
reconstitute or heat reconstituted formula (WHO, 2007).
Based on the ingredients, IFs can also be divided into milk protein-based (whey
protein dominant or casein dominant), lactose-free milk protein-based, soy protein-based,
hydrolyzed protein-based (extensively or partially), and amino acid-based products
(Martinez & Ballew, 2011; Smith, Clinard, & Barnes, 2011). The commonly used protein
includes skim milk powder, demineralized whey protein, whey protein concentrate, α-
lactalbumin whey protein concentrate, milk protein isolate, soy protein isolate,
hydrolyzed protein, sodium caseinate, and calcium caseinate (McSweeney, 2008). Casein
is the predominant protein in cow’s milk, whereas the primary protein in human milk is

25
whey protein. To mimic human milk, some cow milk-based infant formulas have been
adapted to contain more whey protein by changing the whey protein/casein ratio from
about 20:80 to 60:40. In addition, products fortified with α-lactalbumin, which is rich in
tryptophan and cysteine (Heine, Klein, & Reeds, 1991), have been a recent innovation to
mimic human milk. Lactose-free milk protein-based products are suitable for infants who
are lactose-intolerant but who can tolerate milk protein. Soy protein-based products are
available for infants who display milk protein or lactose intolerance. Infants with
allergies or intolerance to intact milk or soy proteins often consume hypoallergenic IFs,
including partially or extensively hydrolyzed protein-based and amino acid-based
products.
Based on the infant’s growth, they can also be categorized into preterm, term,
follow-up (6-12 months), and toddler (1-3 years) formulas. There are also other IFs for
special needs, including human milk fortifiers and metabolic formulas. For preterm
infants, particularly very low birth weight (VLBW) infants (< 1500 g), human milk alone
is inadequate to meet the nutritional needs. Therefore, fortification of human milk with
nutrients is recommended. Currently commercial human milk fortifiers contain protein,
carbohydrate, fat, and up to 23 vitamins and minerals (Martinez et al., 2011). Metabolic
formulas are designed for infants with rare metabolic disorders, including maple syrup
urine disease, phenylketonuria, and tyrosinemia (Smith et al., 2011).
Processing
The manufacturing processes of IFs depend on the type. For liquid products, the
formation and stabilization of an oil-in-water (O/W) emulsion is an integral step,
generally produced by mixing and homogenizing an oil phase in an aqueous phase,

26
mainly consisting of dairy proteins, carbohydrate, minerals, and vitamins. Specifically,
once oil and aqueous phases are blended, the mixture is temporarily stored or transported
via pipeline to pasteurization equipment. After pasteurization, the coarse emulsion is
further homogenized to form a uniform mixture with a small droplet size (typically ~1
μm). Before packaging, the compositions are standardized to ensure that key parameters
(e.g., pH and micronutrient concentrations) are at appropriate levels. Then the packaged
products are ready for sterilization, which is achieved by thermal treatments such as ultra
high temperature processing (e.g., 135-150 °C for 3-5 s) or in-container retort
sterilization (e.g. 120 °C for 5-10 min) or a combination of these processes (McSweeney,
2008).
Generally, powdered IF is manufactured using three types of processes: a dry
blending process, a wet mixing/spray drying process, and a combined process (FDA,
2003). In the dry blending process, the ingredients received from suppliers in a
dehydrated powdered form are mixed together to achieve a uniform blend. This process
does not involve the use of water. However, there is no heat treatment to destroy bacteria
in the final product. Thus, if one or more ingredients are contaminated by even low
numbers of harmful bacteria, these bacteria are likely to be present in the finished
product. In the wet mixing/spray drying process, ingredients are blended together,
homogenized, pasteurized, and spray dried to form a powdered product. Due to the use of
pasteurization to destroy harmful bacteria, this process is less dependent on the
microbiological quality of ingredients. However, this process requires frequent wet
cleaning of equipments (e.g., spray dryer), which may be a source of product
contamination. In the combined process, a base powder (consisting mainly of protein and

27
fat components) is produced using the wet mixing/spray drying process, and then the base
powder is dry blended with the carbohydrate, mineral, and vitamins.
Regulatory requirements
As a human milk substitute intended to meet the normal nutritional requirements
of infants, IF is highly regulated worldwide. Regulations for energy and nutrients are
summarized in Table 2.5, and permitted additives are listed in Table 2.6. Requirements
for special ingredients are discussed as follows.
All ingredients and food additives should be gluten-free (CAC, 1981).
The use of sesame and cotton seed oils should be prohibited (EC, 2006). Lauric
and myristic acids together should not exceed 20% of total FAs (CAC, 1981; EC, 2006;
Koletzko et al., 2005). Commercially hydrogenated fats and oils should not be used
(CAC, 1981). For endogenous trans-FAs, the content should not exceed 3% of total FAs
(CAC, 1981; EC, 2006; Koletzko et al., 2005). The erucic acid content should not exceed
1% of total FAs (CAC, 1981; EC, 2006; Koletzko et al., 2005). The total content of
phospholipids should not exceed 300 mg/100 kcal (about 2 g/L) (CAC, 1981; EC, 2006;
Koletzko et al., 2005). Prior to 2002, ARA and DHA were not ingredients for IFs in the
United States. Currently most manufacturers in the United States add ARA and DHA to
their IF products. However, Food and Drug Administration (FDA) treats the evaluation of
their safety as new ingredients, and AAP takes no official position on their addition
(USDA, 2009). Other regulatory authorities (e.g., Codex Alimentarius Commission,
CAC) permit the optional addition of n-3 and n-6 LCPUFAs. In general, the content of
ARA should be at least the same concentration as DHA, whereas the content of EPA
should not exceed the DHA concentration (CAC, 1981; EC, 2006; Koletzko et al., 2005).

28
In addition, European Commision (EC) recommends that the content of n-3 and n-6
LCPUFAs (C20 -C22) should not exceed 1 and 2% of the total fat content, respectively
(EC, 2006). For n-6 LCPUFAs, ARA content should also not exceed 1% of the total fat
content (EC, 2006). European Society for Paediatric Gastroenterology, Hepatology and
Nutrition (ESPGHAN) states that the optional addition of DHA should not exceed 0.5%
of total fat intake until its safety and benefits have been adequately demonstrated
(Koletzko et al., 2005).
Lactose and glucose polymers including maltose, maltodextrin, and glucose syrup
may be used as carbohydrates in IFs (CAC, 1981; EC, 2006; Koletzko et al., 2005). Only
precooked and gelatinized starches that are naturally gluten-free may be added to IFs up
to 30% of total carbohydrates and up to 2 g/100 mL (CAC, 1981; EC, 2006; Koletzko et
al., 2005). Sucrose and glucose may only be added to hydrolyzed protein-based IFs and
their content should not exceed 20% of the total carbohydrate content and 2 g/100 kcal,
respectively (EC, 2006). Fructose addition should be avoided in IFs due to hereditary
fructose intolerance which may cause death in young infants (CAC, 1981; EC, 2006;
Koletzko et al., 2005).
Prebiotics (commonly fructo- and galacto-oligosaccharides) are nutrients that
support the growth of nonpathogenic bacteria in the intestine, while probiotics, including
Bifidobacteria and Lactobacilli, are good for the gut health and decrease the risk of
infections during infancy. In addition, formulas supplemented with probiotics have been
reported to reduce the incidence of eczema, necrotizing enterocolitis, and mortality in
high-risk infants (e.g., VLBW infants) (Martinez et al., 2011). If prebiotics are added,
their content should not exceed 0.8 g/100 ml in a combination of 90% galacto-

29
oligosaccharide and 10% fructo-oligosaccharide (EC, 2006). The optional addition of
taurine and total nucleotides should not exceed 12 mg/100 kcal and 5 mg/100 kcal,
respectively (CAC, 1981; EC, 2006; Koletzko et al., 2005). Although manufacturers
have started adding nucleotides, prebiotics, and probiotics to IF products, more research
is needed to confirm their benefits.
Lipid oxidation in O/W emulsions
An emulsion consists of two immiscible liquids (usually oil and water), with one
being dispersed in the other in the form of small spherical droplets (McClements, 2008).
A system that consists of oil droplets dispersed in an aqueous phase is referred to as an
O/W emulsion, such as milk, soups, infant formula, and mayonnaise, whereas a system
that consists of water droplets dispersed in an oil phase is called a water-in-oil (W/O)
emulsion, such as margarine, butter, and spread. Emulsions are thermodynamically
unstable systems due to the free energy required to increase the surface area between the
oil and water phases and different density between two phases (McClements & Decker,
2000). Physical instability of emulsions can occur through a variety of mechanisms,
including creaming, flocculation, coalescence, sedimentation, Ostwald ripening, and
phase inversion (McClements, 2008). To form kinetically stable emulsions, emulsifiers
are needed before homogenization, forming a protective membrane that prevents the
droplets from aggregating. The most common emulsifiers used in food industry are
amphiphilic proteins (e.g., whey protein, casein, soy protein, and egg protein),
phospholipids (e.g., soy lecithin), and small-molecule surfactants (e.g., MAG and DAG).
Due to the large surface area that facilitates interactions between oil droplets and water-
soluble components, lipid oxidation in O/W emulsions are significantly different from in

30
W/O emulsions which occur at a rate similar to that in bulk oils (McClements et al.,
2000). This section will focus on O/W emulsions, which may be considered to be
consisted of three distinct regions: the interior of the droplet (oil and oil-soluble
components), the continuous phase (water and water-soluble ingredients), and the
interfacial region (surface-active molecules).
Mechanisms of lipid oxidation
Lipid oxidation is a complex process mainly initiated by light, heat, enzymes, and
metals, and can be categorized into photooxidation, enzymatic oxidation, and
autoxidation (Kiokias, Varzakas, Arvanitoyannis, & Labropoulos, 2010). Photooxidation
involves excitation of a photosensitizer (e.g., chlorophyll and riboflavin) and energy
transfer to triplet oxygen, producing singlet oxygen which reacts directly with the double
bonds of unsaturated lipids by addition rather than through free radical intermediates to
initiate lipid oxidation (Shahidi & Zhong, 2010). Certain enzymes (e.g., lipoxygenase in
cereals, fruits, and vegetables) can directly catalyze the formation of lipid hydroperoxides
from molecular oxygen and lipid substrates (Barham et al., 2010). Although
photooxidation and enzymatic oxidation may play a role, the most common and
important process is lipid autoxidation.
Lipid autoxidation is an autocatalytic process via a free radical chain mechanism
that proceeds through initiation, propagation, and termination stages (Kiokias et al.,
2010).
Initiation: RH→ R• + H•
or RH + X• (initiator radical) → R• + XH
Propagation: R• + O2 → ROO•

31
ROO• + RH → ROOH + R•
ROOH→ OH• + RO•
RO• → Secondary oxidation products (e.g., aldehydes)
Termination: R• + R• → R-R
R• + ROO• → ROOR
ROO• + ROO• → ROOR + O2
RO• + RO• → ROOR
RO• + R•→ ROR
In the presence of initiators (e.g., heat, light, irradiation, and metal ions), initiation
occurs as hydrogen is abstracted from an unsaturated lipid (RH), resulting in a lipid free
radical (R•). This lipid radical immediately reacts with molecular oxygen (O2) to form a
lipid peroxyl radical (ROO•) and starts to propagate. The propagation stage of oxidation
is fostered by lipid-lipid interactions, whereby the lipid peroxyl radical reacts with
another unsaturated lipid, generating a new lipid free radical and lipid hydroperoxide
(ROOH). The propagation can be continuously repeated until radicals (e.g., R• or ROO•)
react with each other to terminate the process by forming stable and nonreactive
molecules (e.g., ROOR). During propagation, lipid hydroperoxides, which is recognized
as the primary products of oxidation, are formed. They are unstable and can decompose
to a complex mixture of secondary oxidation products by homolytic cleavage followed by
β-scission of the lipid alkoxyl radical (RO•) produced. The formed secondary oxidation
products, including aldehydes, ketones, alcohols, acids, and hydrocarbons, are
responsible for the sensory properties of oxidized oils and fats. In addition, reactions
between radicals and antioxidants can also terminate the propagation step.

32
Among different initiator, transition metals (e.g., cobalt, iron, magnesium, and
copper) are the major prooxidants in O/W emulsions, and they can initiate lipid
autoxidation by hydrogen abstraction from an unsaturated lipid as mentioned previously
or reaction with oxygen. For the latter, the anion produced can either lose an electron to
produce single oxygen or react with a proton to form a hydroxyl radical, which may serve
as a chain initiator (Kiokias et al., 2010).
Initiation: RH + M(n+1)+ → R• + H+ + Mn+
or Mn+ + O2 → M(n+1)+ + O2•- ; O2
•- → 1 O2 or OH•
More importantly, transition metals can also promote oxidation by catalyzing the
decomposition of lipid hydroperoxides located at the droplet surface into free radicals
while the metals themselves undergo redox cycling (Kiokias et al., 2010).
Propagation: Mn+ + ROOH → RO• + OH- + M(n+1)+
M(n+1)+ + ROOH → ROO• + H+ + Mn+
For iron, ferrous (Fe2+) was reported to be a stronger prooxidant than ferric (Fe3+)
due to its higher solubility and reactivity (Mei, Decker, & McClements, 1998a; Mei,
McClements, Wu, & Decker, 1998b), which means that the presence of iron reducing
agents in emulsions can promote oxidation, such as ascorbic acid. On the other hand,
metal chelators (e.g., EDTA and citric acid) can increase the oxidative stability.
Factors that influence lipid oxidation in O/W emulsions
Ingredient quality
Ingredient quality has a significant influence on the oxidative stability of O/W
emulsions. For example, low-quality oils with a high concentration of lipid
hydroperoxides already present oxidize faster than oils of good quality (Let, Jacobsen, &

33
Meyer, 2005). FFAs can promote lipid oxidation in O/W emulsions due to their ability to
increase the negative charge of emulsion droplets and thus increase interactions between
transition metals and droplets (Waraho, Cardenia, Rodriguez-Estrada, McClements, &
Decker, 2009).
Chemical structure of lipids
The chemical structure of lipids, especially the composition (e.g., number and
location of double bonds) and positional distribution of FAs, determines their
susceptibility to oxidation.
Typically, the rate of lipid oxidation increases as the degree of FA unsaturation
increases. However, some researchers have found the opposite trend in O/W emulsion,
with oxidative stability increasing as the degree of FA unsaturation increases (Miyashita,
Nara, Ota, 1993). It is possible that compared to saturated FAs, unsaturated FAs are
buried more deeply within the hydrophobic interior of the droplets and therefore are less
susceptible to attack by prooxidants from aqueous phase.
In addition, it has been found that the closer the double bond is to the methyl end
of a FA molecule, the greater its stability to oxidation (Miyashita, Azuma, Ota, 1995).
This is probably because the hydrocarbon tail (methyl end) is located in the hydrophobic
interior while the carboxyl end orients toward the aqueous phase which is prone to attack.
The positional distribution of FAs in a TAG molecule also plays a role in its
oxidative stability. Shen and Wijesundera (2009) revealed that DHA was more stable to
oxidation when located at the sn-2 position of glycerol backbone.

34
Droplet characteristics
The effect of oil concentration and particle size on the lipid oxidation in O/W
emulsion has been investigated. Osborn-Barnes and Akoh (2004) reported that a decrease
in the oil concentration led to an increase in total oxidation in caprylic acid/canola oil SL-
based emulsions. One possible explanation for this increase is that the number of radicals
generated per oil droplet increases as the oil concentration decreases (McClements et al.,
2000).
For a fixed oil concentration, the rate of lipid oxidation increases as the droplet
size decreases due to the increased droplet surface, which increases the chance to interact
with diffused oxygen, water-soluble radicals and prooxidants. However, if there are only
a limited amount of reactants scattering at the droplet surface, changing the droplet size
may have no effect on the oxidation rate (McClements et al., 2000). This might explain
why some studies found no correlation between droplet size and lipid oxidation (Osborn-
Barnes & Akoh, 2004).
Interfacial characteristics
The properties of interface, such as droplet charge and thickness, strongly
influence the rate of lipid oxidation since it is the region where water-soluble and lipid-
soluble components interact and where surface-active materials (e.g., antioxidants and
emulsifiers) concentrate.
Emulsion droplet charge is influenced by the type of emulsifiers (e.g., cationic,
anionic or neutral) used to stabilize the emulsions and pH of the emulsions. The role of
droplet charge can be demonstrated by the measurement of ζ potential of the emulsion
droplets. Several studies have shown that emulsions stabilized with anionic surfactants

35
oxidize quickly due to the electrostatic attraction of cationic transition metals, whereas
cationic surfactants decrease oxidation rates by electrostatically repelling metals away
from the lipids (Mancuso, McClements, & Decker, 1999; Mei et al., 1998a; Mei, et al.,
1998b; Silvestre, Chaiyasit, Brannan, McClements, & Decker, 2000)
The role of droplet charge has also been demonstrated in protein-stabilized
emulsions. In menhaden O/W emulsions stabilized by whey protein isolate, the rate of
lipid oxidation was fastest when the pH was greater than the pI of the protein, since
emulsion droplet was negatively charged to attract transition metal ions (Donnelly,
Decker, & McClements, 1998; Mancuso et al., 1999; Mei et al., 1998a; Mei, et al.,
1998b). However, the density of the droplet charge does not always correlate with
oxidative stability in protein-stabilized emulsions, probably because proteins have
additional properties that may impact oxidation, such as scavenging free radicals and
creating thick interfaces (Waraho, McClements, & Decker, 2011).
Emulsion droplet interfacial thickness is dependent on the size of the emulsifier
head or tail group. It was observed that lipid oxidation was slower in the emulsion
stabilized by the emulsifier with a longer polar head group, which suggests that the
thicker interfacial layer is able to act as a physical barrier that separated the lipid
substrate from prooxidants in the aqueous phase (Silvestre et al., 2000). In addition, some
emulsifier molecules consisting of sugar or amino acid moieties (e.g., cysteine and
tyrosine) may also act as chemical barriers to retard lipid oxidation due to their radical
scavenging abilities (McClements et al., 2000).

36
Components in the aqueous phase
Components in the aqueous phase, such as proteins, surfactants, polysaccharides
transition metals, salts, sugars, acids, bases, and buffers, may impact lipid oxidation
either as prooxidants or antioxidants, depending on their chemical properties.
The nonadsorbed proteins in the continuous phase may increase or decrease the
oxidative stability of O/W emulsions through enzymatic or nonenzymatic mechanisms,
including catalysis of specific reactions, chelation of transition metals, and free radical
scavenging (McClements et al., 2000). For example, glucose oxidase has been shown to
retard lipid oxidation in mayonnaise containing fish oils, probably due to oxygen
consumption by glucose oxidation (Isaksen & Adler-Nissen, 1997). Casein, transferrin,
phosvitin, and lactoferrin have been shown to be effective antioxidants because of their
ability to chelate iron (McClements et al., 2000; Waraho et al., 2011).
In O/W emulsions, surfactants (e.g., lecithin) adsorb onto the emulsion droplet
surface until the interface is saturated, and the excess surfactants partition into the
continuous phase. If the surfactant concentration in the continuous phase exceeds its
critical micelle concentration, surfactant micelles form. These surfactant micelles can
solubilize lipid hydroperoxides, transition metals, and/or antioxidants out of emulsion
droplets into continuous phase to alter lipid oxidation (Waraho et al., 2011).
Polysaccharides are often added to O/W emulsions to enhance the viscosity of
aqueous phase, which enhances textural attributes and stabilizes the droplets against
physical instability (e.g., creaming). Polysaccarides may also inhibit lipid oxidation in
O/W emulsions through metal chelation and free radical scavenging (McClements et al.,
2000; Waraho et al., 2011).

37
Transition metals in the continuous phase, especially iron and copper, can
promote lipid oxidation by decomposing lipid hydroperoxides on the droplet surface into
free radicals and secondary oxidation products. The rate of copper-mediated oxidation
was reported to be over 50-fold faster than that with an equal concentration of iron
(Osborn-Barnes & Akoh, 2003)
Salts may act as prooxidants or antioxidants depending on the nature of the
system involved. Take sodium chloride as an example, the antioxidant effect is probably
because of its ability to reduce the tendency for transition metal ions to accumulate at the
droplet interface, whereas the prooxidant effect may be due to its ability to increase the
catalytic activity of iron (McClements et al., 2000).
Nonreducing sugars, such as sucrose, have been shown to retard lipid oxidation
(Ponginebbi, Nawar, & Chinachoti, 1999). The possible mechanisms include decreasing
the concentration of oxygen dissolved in the aqueous phase, increasing the viscosity of
the aqueous phase, and scavenging free radicals (McClements et al., 2000). Reducing
sugars have been shown to promote lipid oxidation in O/W emulsions due to their ability
to reduce transition metal ions to their most active state (e.g., Fe2+ and Cu+) (Yamauchi,
Goto, Kato, & Ueno, 1984)
Acids, bases, and buffers affect the oxidative stability of O/W emulsions by
controlling the pH, and thus different factors (e.g., type of emulsifiers and solubility) may
be involved, leading to the inconsistent results in the literature (McClements et al., 2000).
Oxygen concentration
Oxygen is involved in lipid autoxidation as mentioned above. At low oxygen
concentrations, the rate-limiting step of lipid oxidation is the diffusion of oxygen through

38
the aqueous phase. Thus, the rate of lipid oxidation increased with mechanical agitation
under oxygen-limiting conditions. However, the diffusion of oxygen is no more a rate-
limiting step when oxygen concentration is high, and the diffusion rate of oxygen is faster
than the oxidation rate (McClements et al., 2000). Therefore, the effective method to
retard oxidation is to reduce the concentration of oxygen, such as packing under vacuum
or inert gas such as nitrogen and argon.
Methods for measuring lipid oxidation in O/W emulsions
A wide variety of analytical techniques have been developed to study lipid
oxidation in bulk oils, and many of them can also be applied to monitor lipid oxidation in
O/W emulsions. The available methods to monitor lipid oxidation in emulsions can be
divided into five groups based on what they measure: the absorption of oxygen, the loss
of initial substrates, the formation of free radicals, and the formation of primary and
secondary oxidation products.
Oxygen absorption can be evaluated through measurements of headspace oxygen
concentration. Substrate losses can be evaluated by physical (e.g., weight-gain) or
chemical tests (e.g., FA composition). Free radicals can be measured by electron spin
resonance. The primary oxidative changes can be evaluated by measuring peroxide value
and conjugated dienes, while the common techniques used to monitor secondary
oxidation products include p-anisidine value, total oxidation value, 2-thiobarbituric acid
reactive substance value, carbonyls, and volatile compounds by spectroscopic and/or
chromatographic methods. Other techniques, such as differential scanning calorimetry
and nuclear magnetic resonance, can also be used for measuring lipid oxidation. In
addition, sensory tests are often conducted to provide subjective evaluation of oxidative

39
deterioration. The details for these techniques have been reviewed extensively in the
literature (Shahidi & Wanasundara, 2008) and thus will not be discussed here.
There is no uniform and standard method for detecting all oxidative changes in
different emulsion systems. Each method has its advantages and disadvantages.
Therefore, it is necessary to select a proper and adequate method for a particular
application. The use of two or more methods assessing both primary and secondary
oxidation products is highly recommended.
Strategies for controlling lipid oxidation in O/W emulsions
On the basis of factors that influence lipid oxidation in O/W emulsions, different
strategies for retarding lipid oxidation can be identified, including controlled preparation
and storage conditions, removal of oxygen, usage of fresh and high-quality ingredients to
prepare emulsions, interfacial engineering to control the thickness and charge of droplets,
and addition of antioxidants.
It is necessary to prepare and store O/W emulsions under carefully controlled
conditions to retard or minimize lipid oxidation, such as refrigerated temperatures, low
light, and preventing contamination from prooxidants.
Packing under vacuum or nitrogen to exclude oxygen from emulsion products has
been used commercially to minimize lipid oxidation in mayonnaise and salad dressings
during storage (McClements et al., 2000). However, once the product is opened, lipid
oxidation accelerates.
The susceptibility of food emulsions to lipid oxidation can also be improved by
ensuring that the ingredients used are low in hydroperoxides, transition metals, or other

40
prooxidants (e.g., FFAs). However, it may not be economically feasible to purchase high-
purity ingredients or to use extra processing steps to purify the ingredients before use.
Compared to single layer emulsions, multilayer emulsions, where the droplet
interface is coated by multiple layers of biopolymers, possess a thicker interfacial layer
that can provide more physical as well as electrical barriers to reduce the interactions
between prooxidants in the continuous phase and emulsion droplets. Some studies have
shown that multilayer emulsions can inhibit lipid oxidation when the exterior layer of the
emulsion droplet is cationic (Djordjevic, Cercaci, Alamed, McClements, & Decker, 2007;
Klinkesorn, Sophanodora, Chinachoti, Decker, & McClements, 2005). Katsuda,
McClements, Miglioranza, and Decker (2008) also found that anionic emulsions
stabilized with β-lactoblobulin-pectin multilayer had similar oxidative stability as the
cationic emulsions with β-lactoblobulin alone.
Addition of antioxidant is one of the most effective and convenient strategies to
retard or prevent lipid oxidation (Shahidi & Zhong, 2010). According to the mechanisms
of action, antioxidants can be broadly classified as primary antioxidants (e.g.,
tocopherols, butylated hydroxytoluene, and tertiary butylhydroquinone) which scavenge
free radicals to break chain-reactions of oxidation, or secondary antioxidants which
protect lipids against oxidation mainly by chelating transition metals, quenching singlet
oxygen, replenishing hydrogen to primary antioxidants, and/or scavenging oxygen, such
as EDTA, citric acid, and carotenoids (Reische, Lillard, & Eitenmiller, 2008). In some
cases, some antioxidants exhibit both primary and secondary inhibition mechanisms and
are referred as multiple-function antioxidants, such as ascorbic acid (Reische, Lillard, &
Eitenmiller, 2008). Moreover, combinations of antioxidants with different mechanisms

41
of action, such as α-tocopherol/ascorbic acid, have been reported to exhibit synergistic
antioxidant effects (Decker, 2008). Due to the safety concerns about potentially toxic
effects of synthetic additives, there is a worldwide trend toward the use of natural
antioxidants, Moreover, many natural antioxidants possess additional health-promoting
benefits in vivo. Some examples include tocopherols, carotenoids, ascorbic acid, and
phenolic compounds from tea (e.g., catechin and epigallocatechin gallate), olive oil (e.g.,
hydroxytyrosol), rosemary (e.g., carnosic acid), and fruits (e.g., caffeic acid and
anthocyanin) (Reische, et al., 2008; Brewer, 2011). Oxidative reactions are believed to be
mostly prevalent at the oil-water interface (McClements et al., 2000). Therefore, in
addition to its innate potency, the effectiveness of an antioxidant is influenced by its
polarity and solubility, which subsequently determine its actual location in O/W
emulsion. With respect to interfacial phenomenon, “polar paradox theory” was proposed,
which states that polar antioxidants are more effective in less polar media, such as bulk
oil, whereas nonpolar antioxidants are more effective in more polar media, such as O/W
emulsion (Porter, 1993). The high efficacy of nonpolar antioxidants in O/W emulsion is
primarily attributed to their high affinity to orient toward the oil-water interface.
However, new evidence suggests that this empirical observation seems to be a particular
case of a much wider picture, and more complex factors (e.g., critical concentration) in
addition to polarity should be considered to explain antioxidant efficacy (Shahidi, &
Zhong, 2011). Furthermore, compounds with antioxidant activity may also exhibit
prooxidant behavior under certain conditions. Huang, Frankel, and German (1994)
reported that whether α-tocopherol acted as an antioxidant or prooxidant depended on the
test system, concentration, oxidation time, and the method used to determine oxidation.

42
Therefore, all relevant factors must be taken into account when selecting antioxidants for
a particular food system, and experiments should be performed before adding them as
functional ingredients.

43
References
Akanbia, T. O., Sinclairb, A. J., & Barrowa, C. J. (2014). Pancreatic lipase selectively
hydrolyses DPA over EPA and DHA due to location of double bonds in the fatty
acid rather than regioselectivity. Food Chemistry, 160, 61-66.
Akers, S. M., & Groh-Wargo, S. L. (1999). Normal nutrition during infancy. In P. Q.
Samour, K. K. Helm, & C. E. Lang (Eds.), Handbook of pediatric nutrition, (2nd
ed.), (pp. 65-97). Gaithersburg, MD: Aspen Publishers, Inc.
Akoh, C. C., & Kim, B. H. (2008). Structured lipids. In C. C. Akoh & D. B. Min (Eds.),
Food lipids: Chemistry, nutrition, and biotechnology, (3rd ed.), (pp. 841-856).
Boca Raton, FL: CRC Press.
Akoh, C. C., & Xu, X. (2002). Enzymatic Production of Betapol and other specialty fats.
In T. M. Kuo & H. Gardner (Eds.), Lipid biotechnology, (pp. 461-478). New
York, NY: Marcel Dekker, Inc.
Armand, M., Hamosh, M., Mehta, N. R., Angelus, P. A., Philpott, J. R., Henderson, T.
R., et al. (1996). Effect of human milk or formula on gastric function and fat
digestion in the premature infant. Pediatric Research, 40(3), 429-437.
Baker, S. S., Cochran, W. J., Flores, C. A., Georgieff, M. K., Jacobson, M. S., Jaksic, T.,
et al. (1999). Iron fortification of infant formulas. Pediatrics, 104(1), 119-123.
Barham, P., Skibsted, L. H., Bredie, W. L. P., Frost, M. B., Moller, P., Risbo, J., et al.
(2010). Molecular gastronomy: A new emerging scientific discipline. Chemical
Reviews, 110(4), 2313-2365.

44
Brewer, M. S. (2011). Natural antioxidants: Sources, compounds, mechanisms of action,
and potential applications. Comprehensive Reviews in Food Science and Food
Safety, 10(4), 221-247.
CAC (Codex Alimentarius Commission). (1981). Standard for infant formula and
formulas for special medical purposes intended for infants. Retrieved from
http://www. codexalimentarius.org/download/standards/288/CXS_072e.pdf.
Accessed 06.12.14.
Carnielli, V. P., Luijendijk, I. H. T., Vangoudoever, J. B., Sulkers, E. J., Boerlage, A. A.,
Degenhart, H. J., et al. (1995). Feeding premature newborn infants palmitic acid
in amounts and stereoisomeric position similar to that of human milk: Effects on
fat and mineral balance. American Journal of Clinical Nutrition, 61(5), 1037-
1042.
Dai, D. W., Nanthkumar, N. N., Newburg, D. S., & Walker, W. A. (2000). Role of
oligosaccharides and glycoconjugates in intestinal host defense. Journal of
Pediatric Gastroenterology and Nutrition, 30, 23-33.
Decker, E. A. (2008). Antioxidant mechanisms. In C. C. Akoh & D. B. Min (Eds.), Food
lipids: Chemistry, nutrition, and biotechnology, (3rd ed.), (pp. 475-492). Boca
Raton, FL: CRC Press.
Djordjevic, D., Cercaci, L., Alamed, J., McClements, D. J., & Decker, E. A. (2007).
Chemical and physical stability of citral and limonene in sodium dodecyl sulfate-
chitosan and gum arabic-stabilized oil-in-water emulsions. Journal of
Agricultural and Food Chemistry, 55(9), 3585-3591.

45
Donnelly, J., Decker, E., & McClements, D. (1998). Ability of emulsifiers to influence
iron-catalyzed oxidation of emulsified menhaden oil. Journal of Food Science,
63(6), 997-1000.
EC (European Commision). (2006). Commission Directive 2006/141/EC of 22 December
2006 on infant formulae and follow-on formulae and amending Directive
1999/21/EC Text with EEA relevance. Retrieved from http://eur-
lex.europa.eu/legal-content/EN/TXT/PDF/?uri=CELEX:32006L0141&from=EN.
Accessed 06.12.14.
Eidelman, A. I., Schanler, R. J., Johnston, M., Landers, S., Noble, L., Szucs, K., et al.
(2012). Breastfeeding and the use of human milk. Pediatrics, 129(3), 827-841.
FDA (U.S. Food and Drug Administration). (1938). Federal Food, Drug, and Cosmetic
Act, Section 201. Retrieved from
http://www.fda.gov/regulatoryinformation/legislation/federalfooddrugandcosmeti
cactfdcact/fdcactchaptersiandiishorttitleanddefinitions/ucm086297.htm. Accessed
06.12.14.
FDA (U.S. Food and Drug Administration). (1985). Code of Federal Regulations Title
21. Retrieved from http://www.accessdata.fda.gov/scripts/cdrh/cfdocs/cfcfr/
CFRSearch.cfm?fr=107.100. Accessed 06.12.14.
FDA (U.S. Food and Drug Administration). (2003). Powdered infant formula: an
overview of manufacturing processes. Retrieved from
http://www.fda.gov/ohrms/dockets/ac/03/briefing/3939b1_tab4b.htm. Accessed
06.12.14.
Fomon, S. J. (1993). Nutrition of normal infants. St. Louis, MO: Mosby.

46
Hagan, J. F., Shaw, J. S., & Duncan, P. M. (2008). Bright futures: Guidelines for health
supervision of infants, children and adolescents. (3rd ed.) Elk Grove Village, IL:
American Academy of Pediatrics.
Hamam, F., & Shahidi, F. (2006). Acidolysis reactions lead to esterification of
endogenous tocopherols and compromised oxidative stability of modified oils.
Journal of Agricultural and Food Chemistry, 54(19), 7319-7323.
Hamosh, M., Peterson, J. A., Henderson, T. R., Scallan, C. D., Kiwan, R., Ceriani, R. L.,
et al. (1999). Protective function of human milk: The milk fat globule. Seminars
in Perinatology, 23(3), 242-249.
Heine, W. E., Klein, P. D., & Reeds, P. J. (1991). The importance of alpha-lactalbumin in
infant nutrition. Journal of Nutrition, 121(3), 277-283.
Holm, H. C., & Cowan, D. (2008). The evolution of enzymatic interesterification in the
oils and fats industry. European Journal of Lipid Science and Technology, 110(8),
679-691.
Huang, S. W., Frankel, E. N., & German, J. B. (1994). Antioxidant activity of alpha-
tocopherols and gamma-tocopherols in bulk oils and in oil-in-water emulsions.
Journal of Agricultural and Food Chemistry, 42(10), 2108-2114.
Ilyasoglu, H., Gultekin-Ozguven, M., & Ozcelik, B. (2011). Production of human milk
fat substitute with medium-chain fatty acids by lipase-catalyzed acidolysis:
Optimization by response surface methodology. LWT-Food Science and
Technology, 44(4), 999-1004.
Innis, S. M. (2011). Dietary triacylglycerol structure and its role in infant nutrition.
Advances in Nutrition, 2(3), 275-283.

47
Innis, S. M., Dyer, R., & Nelson, C. M. (1994). Evidence that palmitic acid is absorbed as
sn-2 monoacylglycerol from human-milk by breast-fed infants. Lipids, 29(8), 541-
545.
Isaacs, J. S. (2011). Infant nutrition. In J. E. Brown, J. S. Isaacs, U. B. Krinke, E.
Lechtenberg, M. A. Murtaugh, C. Sharbaugh, P. L. Splett, J. Stang, & N. H.
Wooldridge (Eds.), Nutrion through the life cycle, (4th ed.), (pp. 222-246).
Belmont, CA : Wadsworth, Cengage Learning.
Isaksen, A., & Adler-Nissen, J. (1997). Antioxidative effect of glucose oxidase and
catalase in mayonnaises of different oxidative susceptibility. I. Product trials.
Food Science and Technology-Lebensmittel-Wissenschaft & Technologie, 30(8),
841-846.
Jenness, R. (1979). The composition of human milk. Seminars in Perinatology, 3(3), 225-
239.
Jensen, R. G. (1999). Lipids in human milk. Lipids, 34(12), 1243-1271.
Jensen, R. G., Ferris, A. M., Lammi-keefe, C. J., & Henderson, R. A. (1990). Lipids of
bovine and human milks: A comparison. Journal of Dairy Science, 73(2), 223-
240.
Jimenez, M. J., Esteban, L., Robles, A., Hita, E., Gonzalez, P. A., Munio, M. M., et al.
(2010). Production of triacylglycerols rich in palmitic acid at position 2 as
intermediates for the synthesis of human milk fat substitutes by enzymatic
acidolysis. Process Biochemistry, 45(3), 407-414.
Katsuda, M. S., McClements, D. J., Miglioranza, L. H. S., & Decker, E. A. (2008).
Physical and oxidative stability of fish oil-in-water emulsions stabilized with beta-

48
lactoglobulin and pectin. Journal of Agricultural and Food Chemistry, 56(14),
5926-5931.
Kidd, P. M. (2007). Omega-3 DHA and EPA for cognition, behavior, and mood: Clinical
findings and structural-functional synergies with cell membrane phospholipids.
Alternative Medicine Review, 12(3), 207-227.
Kim, S. K., Cheong, W. S., Jun, Y. H., Choi, J. W., & Son, B. K. (1996). Red blood cell
indices and iron status according to feeding practices in infants and young
children. Acta Paediatrica, 85(2), 139-144.
King, D. M., & Padley, F. B. (1989). U.S. Patent No. 4876107. Washington, DC: U.S.
Patent and Trademark Office.
Kiokias, S., Varzakas, T. H., Arvanitoyannis, I. S., & Labropoulos A. E. (2010). Lipid
oxidation and control of oxidation. In F. Yildiz (Ed.), Advances in food
biochemistry, (pp. 383-408). Boca Raton, FL: CRC Press.
Klinkesorn, U., Sophanodora, P., Chinachoti, P., Decker, E. A., & McClements, D. J.
(2005). Encapsulation of emulsified tuna oil in two-layered interfacial membranes
prepared using electrostatic layer-by-layer deposition. Food Hydrocolloids, 19(6),
1044-1053.
Koletzko, B., Baker, S., Cleghorn, G., Neto, U. F., Gopalan, S., Hernell, O., et al. (2005).
Global standard for the composition of infant formula: Recommendations of an
espghan coordinated international expert group. Journal of Pediatric
Gastroenterology and Nutrition, 41(5), 584-599.
Kunz, C., & Lonnerdal, B. (1992). Re-evaluation of the whey protein/casein ratio of
human milk. Acta Paediatrica, 81(2), 107-112.

49
Lemke, S. L., Vicini, J. L., Su, H., Goldstein, D. A., Nemeth, M. A., Krul, E. S., et al.
(2010). Dietary intake of stearidonic acid-enriched soybean oil increases the
omega-3 index: Randomized, double-blind clinical study of efficacy and safety.
American Journal of Clinical Nutrition, 92(4), 766-775.
Let, M. B., Jacobsen, C., & Meyer, A. S. (2005). Sensory stability and oxidation of fish
oil enriched milk is affected by milk storage temperature and oil quality.
International Dairy Journal, 15(2), 173-182.
Lien, E. L. (1994). The role of fatty acid composition and positional distribution in fat
absorption in infants. Journal of Pediatrics, 125(5), S62-S68.
Lopez-Lopez, A., Castellote-Bargallo, A. I., Campoy-Folgoso, C., Rivero-Urgell, M.,
Tormo-Carnice, R., Infante-Pina, D., et al. (2001). The influence of dietary
palmitic acid triacylglyceride position on the fatty acid, calcium and magnesium
contents of at term newborn faeces. Early Human Development, 65, S83-S94.
Lopez-Lopez, A., Lopez-Sabater, M. C., Campoy-Folgoso, C., Rivero-Urgell, M., &
Castellote-Bargallo, A. L. (2002). Fatty acid and sn-2 fatty acid composition in
human milk from Granada (Spain) and in infant formulas. European Journal of
Clinical Nutrition, 56(12), 1242-1254.
Lopez, C., & Menard, O. (2011). Human milk fat globules: polar lipid composition and in
situ structural investigations revealing the heterogeneous distribution of proteins
and the lateral segregation of sphingomyelin in the biological membrane. Colloids
and Surfaces B-Biointerfaces, 83(1), 29-41.
Macrae, A. R. (1983). Lipase-catalyzed interesterification of oils and fats. Journal of the
American Oil Chemists’ Society, 60(2), 291-294.

50
Maduko, C. O., Park, Y. W., & Akoh, C. C. (2008). Characterization and oxidative
stability of structured lipids: Infant milk fat analog. Journal of the American Oil
Chemists’ Society, 85(3), 197-204.
Mancuso, J., McClements, D., & Decker, E. (1999). The effects of surfactant type, pH,
and chelators on the oxidant of salmon oil-in-water emulsions. Journal of
Agricultural and Food Chemistry, 47(10), 4112-4116.
Martin, D., Reglero, G., & Senorans, F. J. (2010). Oxidative stability of structured lipids.
European Food Research and Technology, 231(5), 635-653.
Martinez, J. A., & Ballew, M. P. (2011). Infant formulas. Pediatrics in Review, 32(5),
179-189.
McClements, D. J. (2008). Lipid-based emulsions and emulsifiers. In C. C. Akoh & D. B.
Min (Eds.), Food lipids: Chemistry, nutrition, and biotechnology, (3rd ed.), (pp.
64-96). Boca Raton, FL: CRC Press.
McClements, D. J., & Decker, E. A. (2000). Lipid oxidation in oil-in-water emulsions:
Impact of molecular environment on chemical reactions in heterogeneous food
systems. Journal of Food Science, 65(8), 1270-1282.
McSweeney, S. L. (2008). Emulsifiers in infant nutritional products. In G. L. Hasenhuettl
& R. W. Hartel (Eds.), Food emulsifiers and their applications, (2nd ed.), (pp.
233−261). New York: Springer Science+Business Media, LLC.
Mei, L. Y., Decker, E. A., & McClements, D. J. (1998). Evidence of iron association with
emulsion droplets and its impact on lipid oxidation. Journal of Agricultural and
Food Chemistry, 46(12), 5072-5077.

51
Mei, L. Y., McClements, D. J., Wu, J. N., & Decker, E. A. (1998). Iron-catalyzed lipid
oxidation in emulsion as affected by surfactant, ph and nacl. Food Chemistry,
61(3), 307-312.
Michalski, M. C. (2013). Lipids and milk fat globule properties in human milk. In S.
Zibadi, R. R. Watson, & V. R. Preedy (Eds.), Handbook of dietary and nutritional
aspects of human breast milk, (pp. 315-334). Wageningen, The Netherlands:
Wageningen Academic Publishers.
Michalski, M. C., Briard, V., Michel, F., Tasson, F., & Poulain, P. (2005). Size
distribution of fat globules in human colostrum, breast milk, and infant formula.
Journal of Dairy Science, 88(6), 1927-1940.
Miyashita, K., Azuma, G., & Ota, T. (1995). Oxidative stability of geometric and
positional isomers of unsaturated fatty acids an aqueous solution. Yukagaku,
44(6), 425-430.
Miyashita, K., Nara, E., & Ota, T. (1993). Oxidative stability of polyunsaturated fatty-
acids in an aqueous-solution. Bioscience Biotechnology and Biochemistry, 57(10),
1638-1640.
Nagachinta, S., & Akoh, C. C. (2012). Enrichment of palm olein with long chain
polyunsaturated fatty acids by enzymatic acidolysis. LWT-Food Science and
Technology, 46(1), 29-35.
NRC (National Research Council). (2006). Dietary reference intakes: The essential guide
to nutrient requirements. Washington, DC: The National Academies Press.

52
Osborn-Barnes, H. T., & Akoh, C. C. (2003). Copper-catalyzed oxidation of a structured
lipid-based emulsion containing α-tocopherol and citric acid: Influence of pH and
NaCl. Journal of Agricultural and Food Chemistry, 51(23), 6851-6855.
Osborn, H. T., & Akoh, C. C. (2004). Effect of emulsifier type, droplet size, and oil
concentration on lipid oxidation in structured lipid-based oil-in-water emulsions.
Food Chemistry, 84(3), 451-456.
Pande, G., Sabir, J. S. M., Baeshen, N. A., & Akoh, C. C. (2013). Enzymatic synthesis of
extra virgin olive oil based infant formula fat analogues containing ARA and
DHA: One-stage and two-stage syntheses. Journal of Agricultural and Food
Chemistry, 61(44), 10590-10598.
Pina-Rodriguez, A. M., & Akoh, C. C. (2009). Synthesis and characterization of a
structured lipid from amaranth oil as a partial fat substitute in milk-based infant
formula. Journal of Agricultural and Food Chemistry, 57(15), 6748-6756.
Pipes, P. L., & Trahms, C. M. (1993). Nutrition in infancy and childhood. (5th ed.). St.
Louis, MO: Mosby.
Ponginebbi, L., Nawar, W. W., & Chinachoti, P. (1999). Oxidation of linoleic acid in
emulsions: Effect of substrate, emulsifier, and sugar concentration. Journal of the
American Oil Chemists’ Society, 76(1), 131-138.
Porter, W. L. (1993). Paradoxical behavior of antioxidants in food and biological
systems. Toxicology and Industrial Health, 9(1-2), 93-122.
Raiha, N. C. R. (1985). Nutritional proteins in milk and the protein requirement of
normal infants. Pediatrics, 75(1), 136-141.

53
Reische, D. W., Lillard, D. A., & Eitenmiller, R. R. (2008). Antioxidants. In C. C. Akoh
& D. B. Min (Eds.), Food lipids: Chemistry, nutrition, and biotechnology, (3rd
ed.), (pp. 409-430). Boca Raton, FL: CRC Press.
Riordan, J. (2005). The biological specificity of breastmilk. In J. Riordan (Ed.),
Breastfeeding and human lactation, (3rd ed.), (pp. 97-136). Sudbury, MA: Jones
and Bartlett Publishers, Inc.
Rodrigues, R. C., Ortiz, C., Berenguer-Murcia, A., Torres, R., & Fernandez-Lafuente, R.
(2013). Modifying enzyme activity and selectivity by immobilization. Chemical
Society Reviews, 42(15), 6290-6307.
Sahin, N., Akoh, C. C., & Karaali, A. (2005). Enzymatic production of human milk fat
substitutes containing gamma-linolenic acid: Optimization of reactions by
response surface methodology. Journal of the American Oil Chemists’ Society,
82(8), 549-557.
Schmid, U., Bornscheuer, U. T., Soumanou, M. M., McNeill, G. P., & Schmid, R. D.
(1999). Highly selective synthesis of 1,3-oleoyl-2-palmitoylglycerol by lipase
catalysis. Biotechnology and Bioengineering, 64(6), 678-684.
Schuchardt, J. P., Huss, M., Stauss-Grabo, M., & Hahn, A. (2010). Significance of long-
chain polyunsaturated fatty acids (PUFAs) for the development and behaviour of
children. European Journal of Pediatrics, 169(2), 149-164.
Shahidi, F., & Wanasundara, U. N. (2008). Methods for measuring oxidative rancidity in
fats and oils. In C. C. Akoh & D. B. Min (Eds.), Food lipids: Chemistry, nutrition,
and biotechnology, (3rd ed.), (pp. 387-403). Boca Raton, FL: CRC Press.

54
Shahidi, F., & Zhong, Y. (2010). Lipid oxidation and improving the oxidative stability.
Chemical Society Reviews, 39(11), 4067-4079.
Shahidi, F., & Zhong, Y. (2011). Revisiting the polar paradox theory: A critical
overview. Journal of Agricultural and Food Chemistry, 59(8), 3499-3504.
Shen, Z., & Wijesundera, C. (2009). Effects of docosahexaenoic acid positional
distribution on the oxidative stability of model triacylglycerol in water emulsion.
Journal of Food Lipids, 16(1), 62-71.
Silvestre, M., Chaiyasit, W., Brannan, R., McClements, D., & Decker, E. (2000). Ability
of surfactant head group size to alter lipid and antioxidant oxidation in oil-in-
water emulsions. Journal of Agricultural and Food Chemistry, 48(6), 2057-2061.
Smith, J. D., Clinard, V., & Barnes, C. L. (2011). Pharmacists' guide to infant formulas
for term infants. Journal of the American Pharmacists Association, 51(3), 28-37.
Sørensen, A. D. M., Xu, X. B., Zhang, L., Kristensen, J. B., & Jacobsen, C. (2010).
Human milk fat substitute from butterfat: Production by enzymatic
interesterification and evaluation of oxidative stability. Journal of the American
Oil Chemists’ Society, 87(2), 185-194.
Soumanou, M. M., Perignon, M., & Villeneuve, P. (2013). Lipase-catalyzed
interesterification reactions for human milk fat substitutes production: A review.
European Journal of Lipid Science and Technology, 115(3), 270-285.
Stadler, P., Kovac, A., Haalck, L., Spener, F., & Paltauf, F. (1995). Stereoselectivity of
microbial lipases-the substitution at position sn-2 of triacylglycerol analogs
influences the stereoselectivity of different microbial lipases. European Journal of
Biochemistry, 227(1-2), 335-343.

55
Straarup, E. M., Lauritzen, L., Faerk, J., Hoy, C. E., & Michaelsen, K. F. (2006). The
stereospecific triacylglycerol structures and fatty acid profiles of human milk and
infant formulas. Journal of Pediatric Gastroenterology and Nutrition, 42(3), 293-
299.
Tecelao, C., Rivera, I., Sandoval, G., & Ferreira-Dias, S. (2012). Carica papaya latex: A
low-cost biocatalyst for human milk fat substitutes production. European Journal
of Lipid Science and Technology, 114(3), 266-276.
Teichert, S. A., & Akoh, C. C. (2011). Characterization of stearidonic acid soybean oil
enriched with palmitic acid produced by solvent-free enzymatic
interesterification. Journal of Agricultural and Food Chemistry, 59(17), 9588-
9595.
Trahms, C. M., & McKean, K. N. (2008). Nutrition during infancy. In L. K. Mahan & S.
Escott-Stump (Eds.), Krause's food & nutrition therapy, (12th ed.), (pp. 199-
221). St. Louis, MO: Elsevier Saunders.
USDA (U.S. Department of Agriculture). (2009). Infant formula feeding. Retrieved from
http://www.nal.usda.gov/wicworks/Topics/FG/Chapter4_InfantFormulaFeeding.p
df. Accessed 06.12.14.
Wang, Y. H., Mai, Q. Y., Qin, X. L., Yang, B., Wang, Z. L., & Chen, H. T. (2010).
Establishment of an evaluation model for human milk fat substitutes. Journal of
Agricultural and Food Chemistry, 58(1), 642-649.
Waraho, T., Cardenia, V., Rodriguez-Estrada, M. T., McClements, D. J., & Decker, E. A.
(2009). Prooxidant mechanisms of free fatty acids in stripped soybean oil-in-

56
water emulsions. Journal of Agricultural and Food Chemistry, 57(15), 7112-
7117.
Waraho, T., McClements, D. J., & Decker, E. A. (2011). Mechanisms of lipid oxidation
in food dispersions. Trends in Food Science & Technology, 22(1), 3-13.
Weber, N., & Mukherjee, K. D. (2008). Lipid biotechnology. In C. C. Akoh & D. B. Min
(Eds.), Food lipids: Chemistry, nutrition, and biotechnology, (3rd ed.), (pp. 707-
748). Boca Raton, FL: CRC Press.
WHO (World Health Organization). (2007). Enterobacter sakazakii and other
microorganisms in powdered infant formula. Retrieved from
http://www.who.int/foodsafety/publications/micro/es.pdf?ua=1. Accessed
06.12.14.
WHO (World Health Organization). (2009). Infant and young child feeding: Model
chapter. Geneva, Switzerland: WHO Press.
Wills, W. M., & Marangoni, A. G. (2008). Enzymatic interesterification. In C. C. Akoh
& D. B. Min (Eds.), Food lipids: Chemistry, nutrition, and biotechnology, (3rd
ed.), (pp. 807-834). Boca Raton, FL: CRC Press.
Xu, X. B. (2000). Production of specific-structured triacylglycerols by lipase-catalyzed
reactions: A review. European Journal of Lipid Science and Technology, 102(4),
287-303.
Yamauchi, R., Goto, Y., Kato, K., & Ueno, Y. (1984). Pro-oxidant effect of
dihyroxyacetone and reducing sugars on autoxidation of methyl linoleate in
emulsions. Agricultural and Biological Chemistry, 48(4), 843-848.

57
Yang, T. K., Fruekilde, M. B., & Xu, X. B. (2003). Applications of immobilized
thermomyces lanuginosa lipase in interesterification. Journal of the American Oil
Chemists’ Society, 80(9), 881-887.
Yang, T. K., Xu, X. B., He, C., & Li, L. T. (2003). Lipase-catalyzed modification of lard
to produce human milk fat substitutes. Food Chemistry, 80(4), 473-481.
Zou, X. Q., Huang, J. H., Jin, Q. Z., Guo, Z., Liu, Y. F., Cheong, L. Z., et al. (2013).
Model for human milk fat substitute evaluation based on triacylglycerol
composition profile. Journal of Agricultural and Food Chemistry, 61(1), 167-175.
Zou, X. Q., Huang, J. H., Jin, Q. Z., Liu, Y. F., Song, Z. H., & Wang, X. G. (2011).
Lipase-catalyzed preparation of human milk fat substitutes from palm stearin in a
solvent-free system. Journal of Agricultural and Food Chemistry, 59(11), 6055-
6063.

58
Table 2.1 Dietary reference intakes: recommended dietary allowances and adequate intakes for infants from birth to 1 yeara
Nutrient (amount/day)
Age Birth-6 months 7 months-1 year
Energy (kcal)b 570 (Male); 520 (Female) 743 (Male); 676 (Female) Protein (g) 9.1 11* Fat (g) 31 30 Linoleic acid (g) 4.4 4.6 α-Linolenic acid (g) 0.5 0.5 Carbohydrate (g) 60 95 Water (L) 0.7 0.8 Vitamin A (μg) 400 500 Vitamin D (μg) 5 5 Vitamin E (mg) 4 5 Vitamin K (μg) 2 2.5 Vitamin C (mg) 40 50 Thiamin (mg) 0.2 0.3 Riboflavin (mg) 0.3 0.4 Niacin (mg) 2 4 Vitamin B6 (mg) 0.1 0.3 Folate (μg) 65 80 Vitamin B12 (μg) 0.4 0.5 Pantothenic acid (mg) 1.7 1.8 Biotin (μg) 5 6 Choline (mg) 125 150 Calcium (mg) 210 270 Phosphorus (mg) 100 275 Magnesium (mg) 30 75 Iron (mg) 0.27 11* Zinc (mg) 2 3* Iodine (μg) 110 130 Selenium (μg) 15 20 Fluoride (mg) 0.01 0.5 Manganese (mg) 0.003 0.6 Molybdenum (μg) 2 3 Chromium (μg) 0.2 5.5 Copper (μg) 200 220 Potassium (g) 0.4 0.7 Sodium (g) 0.12 0.37 Chloride (g) 0.18 0.57 (NRC, 2006) a Recommended dietary allowances (RDAs; marked by an asterisk) and adequate intakes (AIs) may both be used as goals for individual intake. RDAs are set to meet the needs of 97-98% individuals in a group. An AI is set instead of an RDA if there is insufficient data to set an RDA. For healthy breastfed infants, the AI is the mean intake. b Estimated energy requirements

59
Table 2.2 Composition of mature human milk
Nutrient Human milk (per 100 mL) Energy (kcal) 60-75 Protein (g) 0.8-0.9 Fat (g) 3-5 Carbohydrate (g) 6.9-7.3 Vitamin A (IU) 133-177 β-Carotene (μg) 16-23 Vitamin D (IU) 2.5-5.0 Vitamin E (IU) 0.48 Vitamin K (μg) 0.1-0.23 Vitamin C (mg) 4-6 Thiamin (μg) 16-20 Riboflavin (μg) 31-50 Niacin (μg) 0.18 Vitamin B6 (μg) 10.7-28 Folate (μg) 4.2-5.2 Vitamin B12 (μg) 0.02-0.06 Pantothenic acid (μg) 261 Biotin (μg) 0.53 Calcium (mg) 25-35 Phosphorus (mg) 13-16 Magnesium (mg) 3.0 Iron (mg) 0.02-0.04 Zinc (mg) 0.15-0.25 Selenium (μg) 1.6 Fluoride (μg) 0.5-1.0 Manganese (μg) 0.41 Chromium (μg) 0.03 Copper (μg) 31 Potassium (mg) 44.3-58 Sodium (mg) 11.2-15 Chloride (mg) 37.3 (Akers & Groh-Wargo, 1999; Jenness, 1979; Riordan, 2005)

60
Table 2.3 Major fatty acid composition of mature human milk (%)a
Fatty acid Human milkb Human milkc Human milkd
Total sn-2 Total sn-2 Total sn-2 C8:0 ND ND ND ND 0.1-0.4 ND C10:0 ND ND 2.9 1.6 0.9-3.1 0.3-0.5 C12:0 4.1 2.5 7.3 6.9 4.1-9.4 4-5.6 C14:0 5.5 6.2 9.4 15.4 3.6-9.1 8.1-11.3 C16:0 21 54.2 27 57.1 15.4-24.5 47.9-56.7 C16:1n-7 3.1 3.5 3.6 1.6 1.1-2.8 1.4-2.4 C18:0 7.1 2.9 7.1 4.9 4.6-8.1 1.4-2 C18:1n-9 40.2 17.1 34.2 8.1 28.3-43.8 11.2-16.7 C18:2n-6 13.4 8.1 7.9 3.7 10.6-25.3 8.2-13.7 C18:3n-3 1.5 0.9 Trace ND 0.4-1.7 0.5-0.7 C20:4n-6 0.5 0.7 ND ND 0.2-0.8 0.5-0.8 C22:6n-3 0.2 0.4 ND ND 0.2-0.6 0.5-0.7 LA/ALA 8.9 NA ND ND 14.4-39.5 NA a Abbreviations: LA/ALA, linoleic acid/linolenic acid; ND, not detected; NA, not applicable. b Reference: Innis, Dyer, and Nelson (1994). c Reference: Jensen, Ferris, Lammi-Keefe, and Henderson (1990). d Reference: Lopez-Lopez, Sabater, Folgoso, Urgell, and Bargallo (2002).

61
Table 2.4 Representative studies on lipase-catalyzed synthesis of human milk fat analoguesa
Reaction type
Substrates (Mole ratio)
Reaction conditions Products Reference
Lipase and load (%)b T (°C)
Time (h)
PA at sn-2 (mol%)
Others
Interesterification/ Acidolysis
Tripalmitin/extra virgin olive oil/ARASCO and DHASCO FAs (1:1:0.5)
Novozym 435 (10) Lipozyme TL IM (10)
60 6 55.34 5.95% ARA 2.60% DHA
Pande, Sabir, Baeshen, and Akoh (2013)
Acidolysis Palm olein/ARASCO and DHASCO FAs (1:18)
Novozym 435 (10)
60 24 22.11 8.05% ARA 17.20% DHA
Nagachinta and Akoh (2012)
Acidolysis Tripalmitin/oleic acid (1:2)
Carica paraya lipase 60 24 73.9 28.4% O Tecelao, Rivera, Sandoval, and Ferreira-Dias (2012)
Interesterification SDASO/tripalmitin (1:2)
Novozym 435 (10)
65 18 60.84 8.15% SDA Teichert and Akoh (2011)
Lipozyme RM IM (10)
60.63 8.38% SDA
Acidolysis Tripalmitin/hazelnut oil FAs and Neobee FAsc (1:3.35)
Lipozyme RM IM (19.78)
57 NA NA 12.8 % C8:0 10.6% C10:0 30% PA
Ilyasoglu, Gultekin-Ozguven, and Ozcelik (2011)
Acidolysis Palm stearin/mixed FAsd
(1:14.6) Lipozyme RM IM (10.7)
57 3.4 62.8 29.7% PA Zou et al. (2011)
Acidolysis Butterfat/rapeseed and soybean oil FAs (1:2)
Lipozyme RM IM (NA)
65 NA 56.12 NA Sorensen, Xu, Zhang, Kristensen, and Jacobsen ( 2010)
Interesterification Amaranth oil/ethyl palmitate (1:4)
Novozym 435 (10)
60 3 20.8 NA Pina-Rodriguez and Akoh (2009)
Acidolysis CAO/DHASCO FAs (1:0.04)
Lipozyme RM IM (10)
60 1.6 20.2 1.9% DHA
Interesterification Tripalmitin/BFO (1:3)
Lipozyme RM IM (10)
55 14.4 46.9 1.2% EPA 0.2% DHA
Maduko, Park, and Akoh (2008)
Acidolysis Tripalmitin/hazelnut oil FAs and GLA (1:16)
Lipozyme RM IM (10)
55 21.6 74.9 10.1% GLA 43.6% O
Sahin, Akoh, and Karaali (2005)
Lipozyme TL IM (6)
73.9 10.0% GLA 44.3% O
Acidolysis Lard/soybean oil FAs Lipozyme RM IM 61 1 71.1 LA/ALA=10.5 Yang, Xu, He, and

62
(1:2.4) (13.7) Li (2003) Interesterification Tripalmitin/ethyl esters of
EPA and DHA (1:5) Lipozyme TL IM (20)
60 20 NA 42% EPA and DHA
Yang, Fruekilde, and Xu (2003)
Alcoholysis/ esterification
Tripalmitin/ethanol (1:10) Rhizopus delemar immobilized on EP 100 (10)
52 24 NA 80% 2-monopalmitin
Schmid, Bornscheuer, Soumanou, McNeill, and Schmid (1999)
2-monopalmitin/oleic acid (1:3)
Rhizopus delemar immobilized on EP 100 (10)
38 16 96 90% O at sn-1,3 position
a Abbreviations: T, temperature; PA, palmitic acid; SDASO, stearidonic acid soybean oil; ARA, arachidonic acid; SDA, stearidonic acid; EPA, eicosapentaenoic acid; DHA, docosahexaenoic acid; FA, fatty acid; LA/ALA, linoleic acid/α-linolenic acid; O, oleic acid; GLA, γ-linolenic acid; DHASCO, DHA single-cell oil; ARASCO, ARA single-cell oil; CAO, customized amaranth oil, product of amaranth oil and ethyl palmitate; BFO, oil blend containing 2.1:1.1:0.8:0.4 (v/v/v/v) coconut, safflower, soybean, and fish oils; NA, not available. b Weight percentage of total substrates. c Mixture of medium-chain fatty acids (caprylic and capric acids). d Mixed FAs are from rapeseed oil, sunflower oil, palm kernel oil, stearic acid, and myristic acid.

63
Table 2.5 Compositional regulations of infant formula Energy or nutrient (per 100 kcal)
FDAa CAC EC ESPGHAN Minimum Maximum Minimum Maximum Minimum Maximum Minimum Maximum
Energy (kcal per 100 mL) − − 60 70 60 70 60 70 Protein (g)b 1.8 4.5 1.8 3 1.8 3.5 1.8 3 Fat (g) 3.3 6 4.4 6 4 6 4.4 6 Linoleic acid (g) 0.3 − 0.3 − 0.3 1.2 0.3 1.2 α-Linolenic acid (g) − − 0.05 − 0.05 − 0.05 − Linoleic/α-linolenic acids − − 5:1 15:1 5:1 15:1 5:1 15:1 Carbohydrate (g) − − 9 14 9 14 9 14 Vitamin A (μg RE) c 250 IU 750 IU 60 180 60 180 60 180 Vitamin D (μg) d 40 IU 100 IU 1 2.5 1 3 1 2.5 Vitamin E (mg α-TE) e 0.7 IU − 0.5 − 0.5 5 0.5 5 Vitamin K (μg) 4 − 4 − 4 25 4 25 Vitamin C (mg) 8 − 10 − 10 30 8 30 Thiamin (μg) 40 − 60 − 60 300 60 300 Riboflavin (μg) 60 − 80 − 80 400 80 400 Niacin (μg) 250 − 300 − 300 1500 300 1500 Vitamin B6 (μg) 35 − 35 − 35 175 35 175 Folic acid (μg) 4 − 10 − 10 50 10 50 Vitamin B12 (μg) 0.15 − 0.1 − 0.1 0.5 0.1 0.5 Pantothenic acid (μg) 300 − 400 − 400 2000 400 2000 Biotin (μg) 1.5 − 1.5 − 1.5 7.5 1..5 7.5 Choline (mg) 7 − 7 − 7 50 7 50 Inositol (mg) 4 − 4 − 4 40 4 40 L-Carnitine (mg) − − 1.2 − 1.2 − 1.2 − Calcium (mg) 60 − 50 − 50 140 50 140 Phosphorus (mg)f 30 − 25 − 25 90 25 90 Calcium/ phosphorus 1.1:1 2:1 1:1 2:1 1:1 2:1 1:1 2:1 Magnesium (mg) 6 − 5 − 5 15 5 15 Iron (mg)g 0.15 3 0.45 − 0.6 2 0.3 1.3 Zinc (mg) 0.5 − 0.5 − 0.5 1.5 0.5 1.5

64
Iodine (μg) 5 75 10 − 10 50 10 50 Selenium (μg) − − 1 − 1 9 1 9 Fluoride (μg) − − − 100 − 100 − 60 Manganese (μg) 5 − 1 − 1 100 1 50 Copper (μg) 60 − 35 − 35 100 35 80 Potassium (mg) 80 200 60 180 60 160 60 160 Sodium (mg) 20 60 20 60 20 60 20 60 Chloride (mg) 55 150 50 160 50 160 50 160 (CAC, 1981; EC, 2006; FDA, 1985; Koletzko et al., 2005) a Abbreviations: FDA, U. S. Food and Drug Administration; CAC, Codex Alimentarius Commission; EC, European Commision; ESPGHAN, European Society for Paediatric Gastroenterology, Hepatology and Nutrition; −, not specified. b For soy protein isolates, requirements are 2.25-3 g/100 kcal (CAC, ESPGHAN, and EC). c 1 μg RE (retinol equivalent) = 3.33 IU Vitamin A = 1 μg all-trans retinol. Retinol contents shall be provided by preformed retinol, while any contents of carotenoids should not be included in the calculation and declaration of vitamin A activity. d 1 μg calciferol = 40 IU vitamin D. e 1 mg α-TE (alpha-tocopherol equivalent) = 1 mg d-α-tocopherol. Vitamin E content shall be at least 0.5 mg α-TE per g PUFA, using the following factors of equivalence to adapt the minimal vitamin E content to the number of fatty acid double bonds in the formula: 0.5 mg α-TE/g linoleic acid (18:2n-6); 0.75 α-TE/g α-linolenic acid (18:3n-3); 1.0 mg α-TE/g arachidonic acid (20:4n-6); 1.25 mg α-TE/g eicosapentaenoic acid (20:5n-3); 1.5 mg α-TE/g docosahexaenoic acid (22: n-3) (CAC, ESPGHAN, and EC); 0.7 IU/g linoleic acid (18:2n-6) (FDA). g For soy protein isolates, requirements are 0.45-2 mg/100 kcal (ESPGHAN and EC). h For soy protein isolates, requirements are 30-100 mg/100 kcal (ESPGHAN and EC).

65
Table 2.6 Additives permitted in infant formula productsa
Additive CAC EC Thickeners Guar gum 1 g/L in liquid formulas containing hydrolyzed
protein 1 g/L in liquid formulas containing hydrolyzed protein
Locust bean gum 1 g/L in all types of IF 1 g/L in follow-on formulas only Distarch phosphate 5 g/L singly or in combination in soy-based IF only − Acetylated distarch phosphate − Phosphated distarch phosphate 25 g/L singly or in combination in hydrolyzed
protein- and amino acid-based IF only −
Hydroxypropyl starch − Carrageenanb 0.3 g/L in regular milk-and soy-based liquid IF only;
1 g/L in hydrolyzed protein- and amino acid-based liquid IF only
0.3 g/L in follow-on formulas only
Pectin − 5 g/L in acidified follow-on formulas only Emulsifiers Lecithinsc 5 g/L in all types of IF 1 g/L Mono- and diacylglycerolsc 4 g/L in all types of IF 4 g/L Citric acid esters of mono- and diglycerides of fatty acidsc
9 g/L in products containing hydrolyzed proteins, peptides or amino acids
Sucrose esters of fatty acidsc 120 mg/L in products containing hydrolyzed proteins, peptides or amino acids
Starch sodium octenyl succinate 20 g/L in IF for special medical purposes Acidity Regulators Sodium hydroxide 2 g/L singly or in combination and within the limits
for sodium, potassium, and calcium in all types of IF −
Sodium hydrogen carbonate 2 g/L singly or in combination and within the limits for sodium, potassium and calcium in all types of IF
− Sodium carbonate Potassium hydroxide Potassium hydrogen carbonate Potassium carbonate Calcium hydroxide L(+) lactic acid Limited by GMP in all types of IF quantum satis Citric acid quantum satis Sodium dihydrogen citrate 2 g/L Trisodium citrate Potassium citrate − Antioxidants Mixed tocopherol concentrate 10 mg/L in all types of IF singly or in combination 10 mg/L individually or in combination

66
Ascorbyl palmitate 10 mg/L in all types of IF singly or in combination 10 mg/L Packaging gases Carbon dioxide GMP − Nitrogen GMP − (CAC, 1981; EC, 2006) a Abbreviations: CAC, Codex Alimentarius Commission; EC, European Commision; IF, infant formula; GMP, good manufacturing practice; −, not specified. b Its use is restricted until evaluation is completed. c If more than one of the substances is added, the maximum level for each of those substances is lowered with the relative part as present of the other substances.

67
CHAPTER 3
IDENTIFICATION OF TOCOPHEROLS, TOCOTRIENOLS, AND THEIR FATTY
ACID ESTERS IN RESIDUES AND DISTILLATES OF STRUCTURED LIPIDS
PURIFIED BY SHORT-PATH DISTILLATION1
1 Zou, L., and Akoh, C. C. 2013. Journal of Agricultural and Food Chemistry, 61, 238- 246. Reprinted here with permission of the publisher.

68
Abstract
The fate of endogenous vitamin E isomers during production and purification of
structured lipids (SLs) was investigated. Two SLs involving tripalmitin, stearidonic acid
soybean oil, and docosahexaenoic acid were synthesized by transesterification catalyzed
by Novozym 435 (NSL) and acidolysis by Lipozyme TL IM (LDHA) and purified by
short-path distillation (SPD). The electron impact and chemical ionization mass spectra
of tocopheryl and tocotrienyl fatty acid esters in the distillates measured by GC-MS in
synchronous scan/SIM mode demonstrated that these esters were formed during
acidolysis as well as transesterification. The predominant esters were tocopheryl
palmitate, tocopheryl oleate, and tocopheryl linoleate homologues, and no tocopheryl or
tocotrienyl linolenate, stearidonate, or docosahexaenoate was found. Meanwhile, none of
these esters were detected in the residues for either NSL or LDHA. Less than 50% of
vitamin E isomers were present in residues after SPD. This loss played a major role in the
rapid oxidative deterioration of SLs from previous studies with less contribution from the
formation of tocopheryl and tocotrienyl esters. The lost tocopherols and tocotrienols
present at high concentration in the distillates may be recovered and used to improve the
oxidative stability of SLs.
Keywords: tocopherol; tocotrienol; tocopheryl/tocotrienyl fatty acid ester; short-path
distillation; oxidative stability; structured lipid; stearidonic acid soybean oil

69
Introduction
Structured lipids (SLs) are generally defined as triacylglycerols (TAGs) that have
been chemically or enzymatically modified from their natural biosynthetic state by
changing the fatty acids (FA) composition and/or the positions of FAs in the glycerol
backbone to yield novel lipids. Lipase-catalyzed synthesis of SLs, commonly
transesterification and acidolysis, is preferred over chemical synthesis because of
specificity and better control over the final products (Xu, 2000). The current popularity of
SLs is well-known because of their desired physical characteristics, chemical properties,
and/or health benefits, for food or nutritional applications (Osborn & Akoh, 2002), such
as human milk fat analogues, reduced-calorie fats, enteral and parenteral nutrition, trans-
free margarines, and cocoa butter substitutes. Furthermore, it is important to consider
whether such tailor-made lipids are oxidatively stable to allow their use as ingredients.
The stability of fats and oils depends on a number of intrinsic and extrinsic factors,
mainly the unsaturation degree of FAs, minor components, environmental conditions
(e.g., oxygen, light, and temperature), and use of antioxidants (Shahidi & Zhong, 2010).
Tocopherols and tocotrienols, naturally occurring minor components present in
vegetable oil, are known as important endogenous antioxidants that protect oil against
oxidation. It is widely accepted that the antioxidant activities of the tocopherols and
tocotrienols are mainly due to their abilities to donate their phenolic hydrogens to lipid
free radicals and retard lipid peroxidation process. The relative antioxidant activities of
the tocopherols in vivo are α- > β- > γ- > δ-tocopherol (Eitenmiller & Lee, 2004).
However, relative antioxidant activities in model and food systems are variable. α-
Tocopherol generally was a more effective antioxidant at low concentration but a less

70
effective antioxidant at high levels than γ-tocopherol in fats and oils (Seppanen, Song, &
Csallany, 2010). γ-Tocotrienol was found to have higher antioxidant activity than α-
tocotrienol, and tocotrienols may be better antioxidants than their corresponding
tocopherols in certain fat and oil systems (Seppanen et al., 2010).
Modified TAGs, free fatty acids (FFAs) or fatty acid esters are the main
components of products after lipase-catalyzed reactions. FFAs and fatty acid esters
should be removed from the products before they are used for edible purposes. Modified
TAGs, especially those containing polyunsaturated fatty acids, are heat sensitive and
have high boiling points. Therefore, thermal decomposition and oxidation easily take
place during purification at high temperatures under atmospheric pressure. Furthermore,
severe acyl migration may occur under harsh purifying conditions due to the presence of
diacylglycerols in the reaction mixture, which act as intermediates for the lipase-
catalyzed reactions (Xu, Skands, & Adler-Nissen, 2001). These limitations can be
minimized by use of short-path distillation (SPD). SPD, also called molecular distillation,
is a thermal separation technique based on an apparatus with a gap between the
evaporator and condenser of equal or less dimension than the mean free path of the
molecules to be evaporated (Oterhals, Kvamme, & Berntssen, 2010). It is characterized
by the combination of very short residence time in the evaporator (1−10 s), high vacuum
level (0.1−100 Pa), short distance between the evaporator and condenser (10−50 mm),
and approximately collision-free mass transfer of molecules in the distillation space
(Lutisan, & Cvengros, 1995; Lutisan, Cvengros, & Micov, 2002). Samples are
fractionated into a heavy fraction (residue) and a light fraction (distillate or waste) on the
basis of volatility. SPD lowers the boiling temperature and is an excellent method for the

71
separation, purification, and concentration of thermolabile substances with low vapor
pressure. There are many applications of SPD in lipids, such as purification of SLs (Xu,
Jacobsen, Nielsen, Heinrich, & Zhou, 2002), fractionation of fatty acid ethyl esters
(Vazquez & Akoh, 2010), and concentration of squalene from shark liver oil (Pietsch &
Jaeger, 2007).
Several authors (Maduko, Park, & Akoh, 2008; Martin, Reglero, & Senorans,
2010; Senanayake & Shahidi, 2002; Teichert & Akoh, 2011a) have reported that SLs
produced by both lipase-catalyzed transesterification and acidolysis are characterized by
a lower oxidative stability compared to the initial fat/oil substrates. This decrease may be
due to exposure to light, oxygen, and high temperature during reaction and purification
steps (e.g., distillation, washing, or filtration). The most serious concern is the loss of
endogenous antioxidants during production and purification, especially tocopherols and
tocotrienols, when vegetable oils are used as substrates for the production of SLs.
Hamam and Shahidi (2006) reported that tocopherols in the oils were esterified with free
fatty acids present at high level in the reaction mixture during production of SLs by
enzymatic acidolysis, thus leading to the formation of tocopheryl esters that do not
provide any stability to the resultant modified oils as they lack any free hydroxyl groups
on the phenolic ring of the molecule. These tocopheryl esters may be removed from the
reaction product during SPD. However, the mechanism of tocopherol loss associated with
transesterification, another important reaction for the production of SLs with much lower
content of FFAs, is unknown. For the purification step, many studies (Maduko et al.,
2008; Martin et al., 2010; Teichert & Akoh, 2011b; Xu et al., 2002) reported that
substantial amounts of tocopherols and tocotrienols were lost during SPD of SLs while

72
decreasing the FFA content. However, few of them indicated where these tocopherols
and tocotrienols were after SPD. These vitamin E isomers may be recovered and added
back to SLs to compensate for their oxidative stability. Therefore, the first objective of
this study was to investigate the removal or loss of endogenous antioxidants during
lipase-catalyzed transesterification by identifying tocopheryl and/or tocotrienyl fatty acid
esters present in residues and distillates of SLs purified by SPD. Lipase-catalyzed
acidolysis was also examined to verify previous findings (Hamam et al., 2006). Our
second objective was to quantitatively determine tocopherols and tocotrienols present in
all of the fractions after SPD and to find a possible source of reusable tocopherols and
tocotrienols.
Materials and Methods
Materials
Stearidonic acid soybean oil (SDASO) was kindly donated by Monsanto Co. (St.
Louis, MO, USA). Docosahexaenoic acid single-cell oil (DHASCO) containing 40%
DHA was purchased from Martek Bioscience Corp., now DSM Nutritional Products Ltd.
(Columbia, MD, USA). sn-1,3 specific lipase Lipozyme TL IM and nonspecific lipase
Novozym 435 were obtained from Novozymes A/S (Bagsvaerd, Denmark). Supelco 37
component FAME mix, 2,5-dihydroxybenzoic acid, and α-, β-, γ-, and δ-tocopherols were
purchased from Sigma-Aldrich Chemical Co. (St. Louis, MO, USA). Methyl
nonadecanoate was obtained from Nu-Chek Prep, Inc. (Elysian, MN, USA), and
stearidonic acid methyl ester was purchased from Cayman Chemical (Ann Arbor, MI,
USA). Tripalmitin and nonadecanoic acid were purchased from TCI America (Portland,
OR, USA). Vitamin E linoleate mixture, consisting of 50−65% tocopheryl linoleate,

73
25−40% tocopheryl oleate, and no more than 1% α-tocopherol, was generously provided
by TRI-K Industries, Inc. (Denville, NJ, USA). All solvents were of analytical grade and
purchased from J. T. Baker Chemical Co. (Phillipsburg, NJ, USA) or Fisher Scientific
(Norcross, GA, USA).
Scaled-up Synthesis of SLs
Two SLs were respectively scaled up in a 1 L stir-batch reactor with constant
stirring at 200 rpm using optimal conditions previously reported (Teichert et al., 2011a;
Teichert et al., 2011b). Briefly, structured lipid of SDASO and tripalmitin catalyzed by
10% Novozym 435 (NSL) was produced through transesterification at 65 °C for 18 h
with a substrate mole ratio of 1:2. Structured lipid of NSL and DHASCO-FFAs catalyzed
by 10% Lipozyme TL IM (LDHA) was prepared through acidolysis at 65 °C for 24 h
with a substrate mole ratio of 1:1. DHASCO-FFAs were prepared from DHASCO by
saponification as described by Teichert and Akoh (2011b). The reactor was sealed and
wrapped with foil to reduce exposure to light and oxygen. After reaction, the resulting
products were vacuum filtered through a Whatman no. 1 paper filter containing
anhydrous sodium sulfate to dry and separate the SLs from the biocatalyst. If the products
needed to be stored before SPD, they were flushed with nitrogen and kept in an airtight
amber container at −80 °C.
Short-Path Distillation
SPD was used to remove FFAs from the reaction mixture. SPD was performed
using a KDL-4 (UIC Inc., Joliet, IL, USA) system under the following conditions: feed
holding temperature of 65 °C for NSL and LDHA, feeding rate of approximately 100
mL/h, evaporator heating temperature of 185 °C, condenser cooling temperature of

74
20−25 °C, roller speed of 200 rpm, and vacuum of <13.33 Pa. SLs were passed through
SPD once (NSL) or twice (LDHA) to obtain FFA concentrations of <1%. FFA content
expressed as oleic acid percentage was determined according to AOCS Official Method
Ca 5a-40 (AOCS, 2009). The average and standard deviation of triplicate analyses were
reported (Table 3.2).
Fatty Acid Composition
Lipid samples were converted to FAMEs following AOAC Official Method
996.01 (AOAC, 2005) with minor modifications. Briefly, 100 mg of sample was weighed
into a Teflon-lined test tube, and 100 μL of 20 mg/mL C19:0 in hexane was added as an
internal standard and dried with nitrogen to remove the solvent. Two milliliters of 0.5
mol/L NaOH in methanol was added, followed by vortex and incubation at 100 °C for 5
min to saponify the lipid. After cooling under the tap water, 2 mL of 14% boron
trifluoride in methanol was added. Then the sample was vortexed for 1 min, incubated at
100 °C for 5 min for methylation, and cooled under tap water. To stop the reaction and
extract the FAMEs, 2 mL of hexane and 2 mL of saturated NaCl solution were added.
The sample was vortexed for exactly 2 min and then centrifuged at 2000 rpm for 5 min to
separate the organic and aqueous layers. The upper organic layer was filtered through an
anhydrous sodium sulfate cartridge and recovered into a GC vial for analysis. FAME
external standard mixture containing Supelco 37 component FAME mix, methyl
nonadecanoate, and stearidonic acid methyl ester was run parallel with the sample.
FAME samples were analyzed with an Agilent 6890N GC (Agilent Technologies
Inc., Santa Clara, CA, USA) equipped with an autosampler and a flame ionization
detector. Separation was achieved on a 100 m × 0.25 mm i.d., 0.20 μm film thickness,

75
Supelco SP-2560 fused silica capillary column (Sigma-Aldrich Chemical Co.). The
temperature program was 140 °C initially for 5 min, ramped to 240 °C at 4 °C/min and
held for 20 min. Helium was the carrier gas at a constant flow rate of 1.1 mL/min. Split
injection at a ratio of 5:1 was employed, and the injection volume was 1 μL. The injector
and detector were maintained at 260 °C. Relative fatty acid content as mole percent was
calculated on the basis of response factors and conversion factors (AOAC, 2005; DeVries
et al., 1999), using C19:0 as internal standard. The average and standard deviation of
triplicate analyses were reported (Table 3.1).
Determination of Tocopherols and Tocotrienols by HPLC
Lipid samples (0.1±0.001 g) were weighed into a test tube, and 5 mL of HPLC-
grade hexane was added. The samples were then vortexed for 30 s and centrifuged at
1000 rpm for 10 min. A portion of the hexane layer was transferred into an HPLC vial for
analysis. Tocopherol standards were prepared according to the procedure of previous
studies (Lee, Landen, Phillips, & Eitenmiller, 1998; Shin, Huang, Pegg, Phillips, &
Eitenmiller, 2009; Teichert et al., 2011a). Twenty microliters of the sample extract or
tocopherol standard solution was injected into a HPLC system consisting of a Shimadzu
LC-6A pump equipped with an RF-10AXL fluorescence detector (Shimadzu Corp.,
Columbia, MD, USA), a SpectraSeries AS 3000 autosampler (Thermo Separation
Products Inc., San Jose, CA, USA), a 250 mm × 4 mm i.d., 5 μm particle size, normal
phase LiChrosorb Si 60 Hibar RT column (Merck KGaA, Darmstadt, Germany), and an
Agilent Chemstation software (Agilent Technologies Inc.). The isocratic mobile phase
contained 0.85% (v/v) isopropanol in hexane, and the flow rate was 1.0 mL/min. The
excitation and emission wavelengths of the detector were 290 and 330 nm, respectively.

76
Quantitation of tocopherols was performed using an external standard calibration curve
method. Palm olein was used to identify α-, γ-, and δ-tocotrienols (AOCS, 2009). The
fluorescence intensity of tocotrienols is the same as the corresponding tocopherols, so the
tocotrienol content may be calculated using the same calibration curve of the
corresponding tocopherols according to AOCS Official Method Ce 8-89 (AOCS, 2009).
All samples were analyzed in triplicate, and average values and standard deviation were
reported (Table 3.2).
Without considering the decomposition by light, oxygen, and heat, the loss
percentage of tocopherol or tocotrienol after reaction was calculated on the basis of the
law of conservation of mass, using the equation
loss (%) after reaction =
100molMWmolMW
)molMWmol(MWmolMWmolMWbbbaaa
SLbbaabbbaaa
CCCCC (1)
where aMW and bMW are the molecular weights of substrates a and b, respectively;
amol and bmol are the mole units of substrates a and b, respectively; aC , bC , and SLC
are the tocopherol or tocotrienol contents (μg/g) of substrates a, b, and structured lipid
after reaction, respectively.
Similarly, the loss percentage of tocopherol or tocotrienol after SPD was
calculated as
loss (%) after SPD = 100
SLRW
WRSL
)-()-(
CCCCCC (2)
where WC , RC , and SLC are the tocopherol or tocotrienol contents (μg/g) of distillate or
waste after SPD, residue after SPD, and structured lipid after reaction, respectively.

77
Tocopheryl and Tocotrienyl Esters Analysis by MALDI-TOF-MS
Lipid samples were dissolved in isopropanol at 1 mg/mL. A 20 mg/mL mixture of
2,5-dihydroxybenzoic acid in 50% methanol was used as matrix. For MALDI analysis,
0.8 μL of sample and matrix, respectively, was mixed together in a ratio of 1:1 (v/v) on a
stainless steel MALDI target and then air-dried at room temperature. Samples were
analyzed on a TOF/TOF 5800 system (AB Sciex, Framingham, MA, USA) equipped
with a nitrogen laser (λ = 337 nm) and a reflector detector. An acceleration voltage of 20
kV was used. Mass spectra within an m/ z range of 300−900 were acquired in positive ion
mode. A magnified image of the MALDI target was used to visually select regions of
sample. Spectra were acquired with adjustment of the sample position to produce intense
ions for tocopheryl and tocotrienyl esters.
Tocopheryl and Tocotrienyl Esters Analysis by GC-MS
Two ionization modes, EI and PCI, were employed to identify tocopheryl and
tocotrienyl esters. GC-MS measurements operated in the EI mode was performed on an
Agilent 7890 GC coupled to a 5975C MSD and an autoinjector (Agilent Technologies
Inc.). A 30 m × 0.25 mm i.d., 0.25 μm film thickness, Alltech Econo-Cap EC-1 fused
silica capillary column (Alltech Associates Inc., Deerfield, IL, USA) was used for
separation. The column temperature was maintained at 80 °C for 2 min, then increased at
30 °C/min to 140 °C, and held for 2 min, finally programmed to 325 °C at 20 °C/min,
and held isothermally at 325 °C for 70 min (total 85.25 min). Carrier gas was helium with
purity above 99.999%, and the flow rate was set at 1 mL/min. The injector temperature
was maintained at 290 °C. Splitless injection was employed, and the injection volume
was 2 μL. MS detection was performed on a single-quadrupole mass spectrometer under

78
synchronous scan/SIM mode, and conditions were as follows: ion source, 230 °C;
electron energy, 70 eV; transfer line, 300 °C; quadrupole,150 °C; m/ z range, 30−780.
Characteristic ions in the SIM mode were m/ z 430, 416, 416, and 402 for α-, β-, γ-, and
δ-tocopheryl esters, respectively, and m/ z 424, 410, 410, and 396 for α-, β-, γ-, and δ-
tocotrienyl esters, respectively. Dwell time was 100 ms each. The PCI mass spectra in
synchronous scan/SIM mode were acquired on a Shimadzu GCMS QP2010 Ultra system,
using ammonia as the reagent gas. Other chromatographic conditions were identical to
those described for the EI mode.
Statistical Analysis
One-way ANOVA was conducted using SAS software, version 9.2 (SAS Institute
Inc., Cary, NC, USA). Duncan’s multiple-range test was performed to determine
significant differences of variables (α = 0.05).
Results and Discussion
SLs were selected on the basis of enzymatic reaction types and lipase specificity.
NSL was synthesized through enzymatic transesterification by enriching SDA soybean
oil with about 60% palmitic acid esterified at the sn-2 position and about 8% of total
SDA. NSL was also a starting substrate for LDHA, which further incorporated DHA by
lipase-catalyzed acidolysis. These two SLs may be useful as human milk fat analogues
with health benefits of omega-3 fatty acids. The FA profiles of substrates and resulting
SLs after SPD are shown in Table 3.1. The results from the FA profile were used to
estimate the average molecular weight of the substrates and products. More importantly,
the fatty acid composition of the substrates determines the range of FA species that may
be available to form tocopheryl and tocotrienyl fatty acid esters. The major FAs of

79
SDASO were SDA (25.74 mol %), linoleic acid (24.22 mol %), palmitic acid (13.93 mol
%), oleic acid (13.21 mol %), α-linolenic acid (11.01 mol %), γ-linolenic acid (7.22 mol
%) and stearic acid (3.87 mol %). In the case of NSL, palmitic acid (67.49 mol %),
linoleic acid (8.51 mol %), SDA (8.39 mol %), oleic acid (5.04 mol %), and stearic acid
(2.54 mol %) were the dominant FAs, which were in agreement to our previous study.16
The major FAs saponified from DHASCO were DHA (45.51 mol %), followed by oleic
acid (23.07 mol %), myristic acid (10.94 mol %), and palmitic acid (7.45 mol %).
During lipase-catalyzed transesterification, FAs are cleaved off the glycerol
backbone and not all of these FAs reattach to the TAG, resulting in FFAs. FFA contents
of substrates and products are shown in Table 3.2. FFA percentage of NSL after reaction
was higher than that of the original SDASO with a significant difference at P < 0.05.
SPD removed most of the liberated FFAs and restored FFA content similar to fresh oil
status (below 0.1%). For LDHA produced by acidolysis, a much higher FFA content
(26.95%) was present in the product after reaction because DHASCO-FFAs were one of
the starting substrates. Repetitive SPD was required to remove most of the FFA, but FFA
percentage (0.35%) was not as low as substrate NSL (P < 0.05).
Tocopherol and tocotrienol concentrations of substrates, SLs before and after
SPD, and distillates after SPD were measured by normal phase HPLC and are shown in
Table 3.2. The elution order of tocopherols and tocotrienols was α-tocopherol, α-
tocotrienol, β-tocopherol, γ-tocopherol, γ-tocotrienol, δ-tocopherol, and δ-tocotrienol.
Due to the instability of these compounds, all of the test samples were protected from
light and oxygen, and analyzed on the day of preparation. According to the law of
conservation of mass, loss percentages for different reactions (transesterification and

80
acidolysis) as well as SPD were calculated, and average values were reported (Table 3.2).
For both NSL and LDHA, more vitamin E isomers were lost after SPD than during
enzymatic production. Specifically, there were 59 and 73% total losses of tocopherols
and tocotrienols during purification by SPD compared to 3 and 21% losses during
enzymatic production of NSL and LDHA, respectively. These lost tocopherols and
tocotrienols after SPD were found to be present in the distillate at high concentration,
which suggests that they should not be discarded as wastes. Instead, they should be
recovered and added back to SLs to maintain or protect the oxidative stability of final
products. As shown in Table 3.2, losses of α-, β-, γ-, and δ-tocopherols after SPD for
LDHA were 61, 100, 86, and 88%, respectively, with 52, 51, 57, and 68% losses for
NSL. A possible explanation for the higher loss after SPD in LDHA than NSL may be
due to repetitive passes to remove FFAs after acidolysis and therefore longer exposure to
heat and light. Another observation was a higher loss of vitamin E isomers during
acidolysis of LDHA (27, 20, 27, and 20% for α-, β-, γ-, and δ-tocopherols, respectively)
compared to transesterification of NSL (5, 8, 1, and 7%). There are two possible
explanations. First, longer reaction time under heat for LDHA (24 h) may contribute in
part to the difference. Second, higher amounts of tocopheryl and tocotrienyl esters were
estimated to have been formed by acidolysis than transesterification due to the
availability of carboxylic acids. As can be seen in Table 3.2, for NSL and LDHA, there
was a significant difference in loss percentage (P < 0.05) among tocopherol and
tocotrienol species during either enzymatic reaction or purification. This may be possibly
due to the preference of tocopherols or tocotrienols to form esters during
transesterification and acidolysis. As mentioned above, these esters were removed into

81
the distillate by SPD and contributed to the loss of tocopherols and tocotrienols. This may
be partly attributed to relative sensitivity of these isomers in response to environmental
stresses (e.g., oxygen, heat, light, and exposure time). For tocotrienols in LDHA, it was
expected that tocotrienols will degrade more than corresponding tocopherols during both
acidolysis and SPD because of the presence of three unsaturated double bonds in the
isoprenoid side chain, like γ-tocotrienol in this study. Surprisingly, α-tocotrienol had a
much lower loss than α-tocopherol and other vitamin E isomers. The reason is unclear,
and it is unlikely that the structural difference had any effect. Lee and Park (2008) studied
the stability of vitamin E isomers extracted from rice bran oil under various temperature
and oxygen conditions. They found that α-tocotrienol degraded more rapidly than other
isomers, whereas γ-tocopherol was the most stable isomer. Oxygen level also had
significant impact on the stability of each isomer in their studies, where severe reductions
in γ-tocopherol (by 20%) and γ-tocotrienol (29%) were observed under 2% oxygen
conditions, whereas under 0% no degradation was observed even after exposure to 95 °C
for 4 h.
Two mass spectrometric techniques, MALDI-TOF-MS and GC-MS, were
employed to confirm the hypothesis that tocopheryl and tocotrienyl fatty acid esters were
formed during both acidolysis and transesterification. A number of matrices were
investigated for the MALDI analysis including 2,5-dihydroxybenzoic acid, α-cyano-4-
hydroxycinnamic acid, and sinapinic acid. 2,5-Dihydroxybenzoic acid proved to work
best in producing a mass profile of vitamin E linoleate mixture standard in a very clear
and systematic manner (Figure 3.1). It can be seen that the spectra of α-tocopheryl oleate,
α-tocopheryl linoleate, and α-tocopherol were dominated by sodiated molecules ([M +

82
Na]+) and showed no protonated molecules ([M + H]+). α-Tocopheryl oleate and linoleate
also yielded potassium adduct ions ([M + K]+). After subtraction of the background and
correction for isotope contributions, the data produced from distillates and residues of
NSL and LDHA were identified on the basis of molecular masses, [M + Na]+ and [M +
K]+, which were calculated according to the fatty acid and vitamin E isomer profiles of
substrates. Unexpectedly, none of the ester ions were found in the spectra. This may be
due to a strong “matrix effect” from abundant endogenous compounds, such as TAGs,
diacylglycerols, monoacylglycerols, and FFAs, which interfere with tocopheryl and
tocotrienyl fatty acid esters present at much lower levels.
However, this challenge was overcome by selection of GC-MS in synchronous
scan/SIM mode to achieve column baseline separation and mass spectrometric separation
as well. Synchronous scan/SIM is an acquisition technique by rapid alternation between a
full scan and SIM modes, which enables simultaneous collection of common full scan
data (qualitative) and SIM data (quantitative) in a single run without sacrificing
performance (Meng, 2005). The SIM mode offers significant improvement in sensitivity
over full scan mode; thus, it can be utilized to track signals of trace level compounds by
eliminating the matrix noise. Because the data were acquired simultaneously, the
uncertainty in compound identification was minimized and sample analysis time was
reduced. Due to high molecular weight and boiling points of tocopheryl and tocotrienyl
esters, high column temperature was used to separate these compounds. Total ion
chromatograms of identified tocopheryl and tocotrienyl esters in the distillates of NSL
and LDHA in the SIM mode and some typical full scan mass spectra are presented in
Figures 3.2 and 3.3, respectively. The peak order of esters was δ-, β(or γ)-, and α-moiety,

83
separately. Tocopheryl/tocotrienyl fatty acid esters have their own unique EI
fragmentation patterns. Taking tocopheryl linoleate as an example (Figure 3.4), after
ionization, the molecular ion of tocopheryl linoleate undergoes a rearrangement involving
hydrogen transfer from α-carbon to ester oxygen to remove the linoleic acid moiety. The
resulting fragments include a neutral ketene molecule and a radical cation of the phenyl
alcohol at m/ z 430, 416, 416, and 402, respectively (α-, β-, γ-, and δ-tocopheryl linoleate,
respectively). The tocopherol ion (base peak) is further fragmented by retro-Diels−Alder
reaction with hydrogen transfer into an intense ion at m/ z 165, 151, 151, and 137,
respectively, and also by α-cleavage into a weaker ion at m/ z 205, 191, 191, and 177,
respectively. The β- and γ-isomers may not be discriminated because they have the same
number of methyl groups at different positions in the chroman ring (Figure 3.4). The
fragmentation mechanism was supported by direct analysis of vitamin E linoleate mixture
standard (Figure 3.3) and previous studies (Klink, Buchs, & Gulacar, 1994; Pereira et al.,
2002). Similarly, tocotrienyl esters undergo the same fragmentation routes as tocopheryl
esters, creating different tocotrienyl ions (base peak) but the same secondary fragmented
ions (Figure 3.3). As a result, these characteristic fragment ions were chosen in
synchronous scan/SIM mode to track and distinguish different types (α, β, γ, or δ) of
tocopheryl/tocotrienyl moieties. Finally, α-, β-, γ-, and δ-tocopheryl/tocotrienyl fatty acid
esters, although very low in the samples, could be identified on the basis of additional
information from observed molecular ions and theoretical molecular mass calculation.
Meanwhile, none of these esters were found in the residues of either NSL or LDHA,
which indicates that all of the tocopheryl and tocotrienyl esters formed during acidolysis
and transesterification were fractionated into distillates after SPD.

84
Furthermore, under the same analytical conditions, GC-MS/PCI was employed to
verify the identification of the tocopheryl and tocotrienyl esters in the distillates, the
molecular ions of which were produced at extremely weak abundance in EI mode (Figure
3.3). PCI is a soft ionization technique, and pseudomolecular ion, [M + NH4]+, is yielded
at relatively high intensity when using ammonia as the reagent gas. Tocopheryl and
tocotrienyl fatty acid esters identified by GC-MS in EI and PCI modes are summarized in
Table 3.3. For NSL by transesterification, δ- and β(or γ)-tocopheryl palmitate, β(or γ)-
tocopheryl oleate, and β(or γ)-tocopheryl linoleate were confirmed in both EI and PCI
modes, whereas δ- and β(or γ)-tocopheryl myristate, δ- and α-tocopheryl oleate, δ- and α-
tocopheryl linoleate, α-tocopheryl palmitate, and δ- and β(or γ)-tocopheryl stearate were
confirmed only in EI mode. In the case of LDHA by acidolysis, δ- and β(or γ)-tocopheryl
palmitate, α-tocopheryl palmitate, α-tocopheryl oleate, and α-tocopheryl linoleate were
verified in PCI and EI modes, whereas β(or γ)-tocopheryl oleate, β(or γ)- tocopheryl
linoleate and α-tocotrienyl palmitate were verified only in EI mode. The dominant esters
formed were tocopheryl palmitate, tocopheryl oleate, and tocopheryl linoleate
homologues, which were found in both NSL and LDHA. However, tocopheryl myristate
and stearate and δ-tocopheryl linoleate and oleate were identified only in NSL even
though a higher content of corresponding fatty acids was present in the reaction medium
of LDHA (Table 3.1), and α-tocotrienyl palmitate was solely formed in LDHA. It is
likely that vitamin E isomers in the reaction mixture, not FFA, primarily play a role in the
formation of tocopheryl and tocotrienyl fatty acid esters. It is also important to note that
none of the tocopheryl/tocotrienyl linolenate, stearidonate, and docosahexaenoate were
identified in either NSL catalyzed by nonspecific lipase or LDHA catalyzed by sn-1,3

85
specific lipase. This may be due to the preference of lipases, Lipozyme TL IM and
Novozym 435, for a specific fatty acid or fatty acids with a certain chain length range and
unsaturation (Weete, Lai, & Akoh, 2008). Peng, Xu, Mu, Hoy, and Adler-Nissen (2002)
reported similarly that Lipozyme TL IM showed a slight discrimination over very long
chain polyunsaturated fatty acids, eicosapentaenoic acid and DHA, compared to
conjugated linoleic acid and caprylic acid.
The assumption that tocopheryl and tocotrienyl fatty acid esters are formed
during transesterification in addition to acidolysis was successfully confirmed. All of the
esters were fractionated into distillates after SPD. This is the first report that determined
these trace-level esters in distillates by GC-MS in EI and PCI modes on the basis of
synchronous scan/SIM acquisition technique. Furthermore, >50% of vitamin E isomers
were lost into distillates during SPD, which contributed mostly to the rapid oxidative
deterioration of SLs in the past studies and to a lesser extent from the formation of
tocopheryl and tocotrienyl esters. This implies that these lost tocopherols and tocotrienols
in the distillates, previously discarded as wastes, may be recovered and even added back
to the final oil products (SLs) to improve their oxidative stability.
Acknowledgments
This project was supported by Agriculture and Food Research Initiative
Competitive Grant 2009-65503-05734 from the USDA National Institute of Food and
Agriculture and in part by the Department of Energy-funded (DE-FG02-93ER-20097)
Center for Plant and Microbial Complex Carbohydrates. We thank Monsanto Co. and
TRI-K Industries, Inc., for providing the SDA soybean oil and vitamin E linoleate

86
mixture, respectively. We also thank Dr. Zhirui Wang for her valuable technical
assistance with GC-MS and MALDI-TOF-MS analysis.

87
References
AOAC (2005). Official methods of analysis of AOAC International. Official method
996.01. Gaithersburg, MD: AOAC International.
AOCS (2009). Official methods and recommended practice of the American Oil
Chemists’ Society. Methods Ca 5a-40 and Ce 8-89. Champaign, IL: AOCS.
DeVries, J. W., Kjos, L., Groff, L., Martin, B., Cernohous, K., Patel, H., et al. (1999).
Studies in improvement of Official Method 996.06. Journal of AOAC
International, 82(5), 1146-1155.
Eitenmiller, R. R., & Lee, J. (2004). Oxidation and the role of vitamin E as an antioxidant
in foods. In R. R. Eitenmiller & J. Lee (Eds.), Vitamin E: Food chemistry,
composition, and analysis, (pp. 97-124). New York, NY: Marcel Dekker, Inc.
Hamam, F., & Shahidi, F. (2006). Acidolysis reactions lead to esterification of
endogenous tocopherols and compromised oxidative stability of modified oils.
Journal of Agricultural and Food Chemistry, 54(19), 7319-7323.
Klink, G., Buchs, A., & Gulacar, F. O. (1994). Tocopheryl esters from Nymphea alba and
Nuphar luteum. Phytochemistry, 36(3), 813-814.
Lee, J., Landen, W. O., Phillips, R. D., & Eitenmiller, R. R. (1998). Application of direct
solvent extraction to the LC quantification of vitamin E in peanuts, peanut butter,
and selected nuts. Peanut Science, 25(2), 123-128.
Lee, Y. S., & Park, S. R. (2008). Comparative stability of vit E isomers extracted from
unsaponifiable fractions of rice bran oil under various temperature and oxygen
conditions. Korean Journal of Plant Resources, 21(6), 435-439.

88
Lutisan, J., & Cvengros, J. (1995). Mean free-path of molecules on molecular distillation
Chemical Engineering Journal and the Biochemical Engineering Journal, 56(2),
39-50.
Lutisan, J., Cvengros, J., & Micov, M. (2002). Heat and mass transfer in the evaporating
film of a molecular evaporator. Chemical Engineering Journal, 85(2-3), 225-234.
Maduko, C. O., Park, Y. W., & Akoh, C. C. (2008). Characterization and oxidative
stability of structured lipids: Infant milk fat analog. Journal of the American Oil
Chemists’ Society, 85(3), 197-204.
Martin, D., Reglero, G., & Senorans, F. J. (2010). Oxidative stability of structured lipids.
European Food Research and Technology, 231(5), 635-653.
Meng, C. K. (2005). Improving productivity with synchronous SIM/scan. Retrieved from
http://www.chem.agilent.com/Library/technicaloverviews/Public/5989-
3108EN.pdf. Accessed 06.12.14.
Osborn, H. T., & Akoh, C. C. (2002). Structured lipids-novel fats with medical,
nutraceutical, and food applications. Comprehensive Reviews in Food Science and
Food Safety, 1(3), 110-120.
Oterhals, A., Kvamme, B., & Berntssen, M. H. G. (2010). Modeling of a short-path
distillation process to remove persistent organic pollutants in fish oil based on
process parameters and quantitative structure properties relationships.
Chemosphere, 80(2), 83-92.
Peng, L. F., Xu, X. B., Mu, H. L., Hoy, C. E., & Adler-Nissen, J. (2002). Production of
structured phospholipids by lipase-catalyzed acidolysis: Optimization using

89
response surface methodology. Enzyme and Microbial Technology, 31(4), 523-
532.
Pereira, A. S., Siqueira, D. S., Elias, V. O., Simoneit, B. R. T., Cabral, J. A., & Neto, F.
R. A. (2002). Three series of high molecular weight alkanoates found in
Amazonian plants. Phytochemistry, 61(6), 711-719.
Pietsch, A., & Jaeger, P. (2007). Concentration of squalene from shark liver oil by short-
path distillation. European Journal of Lipid Science and Technology, 109(11),
1077-1082.
Senanayake, S., & Shahidi, F. (2002). Chemical and stability characteristics of structured
lipids from borage (Borago officinalis L.) and evening primrose (Oenothera
biennis L.) oils. Journal of Food Science, 67(6), 2038-2045.
Seppanen, C. M., Song, Q. H., & Csallany, A. S. (2010). The antioxidant functions of
tocopherol and tocotrienol homologues in oils, fats, and food systems. Journal of
the American Oil Chemists’ Society, 87(5), 469-481.
Shahidi, F., & Zhong, Y. (2010). Lipid oxidation and improving the oxidative stability.
Chemical Society Reviews, 39(11), 4067-4079.
Shin, E. C., Huang, Y. Z., Pegg, R. B., Phillips, R. D., & Eitenmiller, R. R. (2009).
Commercial runner peanut cultivars in the United States: Tocopherol
composition. Journal of Agricultural and Food Chemistry, 57(21), 10289-10295.
Teichert, S. A., & Akoh, C. C. (2011a). Characterization of stearidonic acid soybean oil
enriched with palmitic acid produced by solvent-free enzymatic
interesterification. Journal of Agricultural and Food Chemistry, 59(17), 9588-
9595.

90
Teichert, S. A., & Akoh, C. C. (2011b). Modifications of stearidonic acid soybean oil by
enzymatic acidolysis for the production of human milk fat analogues. Journal of
Agricultural and Food Chemistry, 59(24), 13300-13310.
Vazquez, L., & Akoh, C. C. (2010). Fractionation of short and medium chain fatty acid
ethyl esters from a blend of oils via ethanolysis and short-path distillation.
Journal of the American Oil Chemists’ Society, 87(8), 917-928.
Weete, J. D., Lai, O. M., & Akoh, C. C. (2008). Microbial lipases. In C. C. Akoh & D. B.
Min (Eds.), Food lipids: Chemistry, nutrition, and biotechnology, (3rd ed.), (pp.
783-788). Boca Raton, FL: CRC Press.
Xu, X. B. (2000). Production of specific-structured triacylglycerols by lipase-catalyzed
reactions: A review. European Journal of Lipid Science and Technology, 102(4),
287-303.
Xu, X. B., Jacobsen, C., Nielsen, N. S., Heinrich, M. T., & Zhou, D. Q. (2002).
Purification and deodorization of structured lipids by short path distillation.
European Journal of Lipid Science and Technology, 104(11), 745-755.
Xu, X. B., Skands, A., & Adler-Nissen, J. (2001). Purification of specific structured
lipids by distillation: Effects on acyl migration. Journal of the American Oil
Chemists’ Society, 78(7), 715-718.

91
Table 3.1 Total Fatty Acid Profiles (Mole Percent) and Molecular Weight of Substrates and Scaled-up SLs at Optimal Conditionsa
fatty acid SDASO (866.74)b DHASCO-FFAs (287.46) NSL (827.76) LDHA (835.83) C8:0 ND 0.46±0.00 ND ND C10:0 ND 1.74±0.02a ND 0.38±0.01b C12:0 ND 5.48±0.05a ND 1.31±0.01b C14:0 0.10±0.00d 10.94±0.10a 1.42±0.00c 3.60±0.01b C14:1 ND 0.25±0.00a ND 0.06±0.00b C16:0 13.93±0.03c 7.45±0.08d 67.49±0.12a 55.94±0.45b C16:1n-7 0.11±0.00c 3.21±0.01a 0.05±0.01d 0.78±0.01b C17:0 0.08±0.07a ND 0.07±0.01b 0.07±0.00b C18:0 3.87±0.04a 0.72±0.02d 2.54±0.01b 2.14±0.00c C18:1n-9 13.21±0.15b 23.07±0.12a 5.04±0.01d 9.40±0.16c C18:2n-6 24.22±0.07a 1.17±0.00d 8.51±0.02b 7.26±0.09c C20:0 0.21±0.00a ND 0.08±0.00b 0.07±0.00c C18:3n-6 7.22±0.03a ND 2.44±0.01b 2.29±0.03c C20:1n-9 0.17±0.00a ND 0.07±0.00b 0.07±0.00b C18:3n-3 11.01±0.07a ND 3.71±0.02b 3.06±0.04c C18:4n-3 25.74±0.14a ND 8.39±0.03b 7.97±0.07c C22:0 0.11±0.00a ND 0.04±0.00b 0.05±0.01b C24:0 0.03±0.00a ND 0.01±0.00b 0.01±0.00b C22:6n-3 ND 45.51±0.38a ND 5.43±0.06b aMean ±SD, n = 3. Values with different letter in the same row are significantly different by Duncan’s multiple-range test (P < 0.05). Abbreviations: SDASO, stearidonic acid soybean oil; DHA, docosahexaenoic acid; DHASCO-FFAs, free fatty acids hydrolyzed from DHA single-cell oil; NSL, structured lipid of SDASO/tripalmitin (1:2, mol/mol) at 65 °C for 18 h catalyzed by 10% Novozym 435; LDHA, structured lipid of DHA/NSL (1:1, mol/mol) at 65 °C for 24 h catalyzed by 10% Lipozyme TL IM; ND, not detected. bAverage molecular weight (in parentheses), n = 3.

92
Table 3.2 Tocopherol and Tocotrienol Concentration and Free Fatty Acid Percentage of Substrates and Scaled-up SLsa
tocopherol and tocotrienol contents (μg/g) FFA (%) α-T α-T3 β-T γ-T γ-T3 δ-T total
NSL SDASO (Sr) 63.01±1.82b ND 10.82±0.93b 565.83±4.83b ND 192.20±5.52b 831.87±13.09b 0.02±0.00b NSL before SPD 20.88±1.35c
(5%C) ND 3.48±0.08c
(8%A) 195.11±8.28c
(1%D) ND 62.57±2.69c
(7%B) 282.04±12.41c
(3%) 2.17±0.03a
NSL after SPD 10.20±0.28d (52%C)
ND
1.73±0.18d (51%D)
87.14±0.20d (57%B)
ND 20.73±0.16d (68%A)
119.81±0.82d (59%)
0.03±0.01b
WNSL after SPD 694.03±26.35a ND 155.94±5.49a 4170.62±66.92a ND 1890.31±12.70a 6910.9±47.78a NA LDHA DHASCO-FFAs (Sr) 26.76±0.28b 174.60±2.22a 6.09±0.17a 72.64±1.73c 4.74±0.12a 38.04±3.89b 322.87±8.42b NA NSL after SPD (Sr) 10.20±0.28c ND 1.73±0.18d 87.14±0.20b ND 20.73±0.16c 119.81±0.82d 0.03±0.01c LDHA before SPD 10.57±0.22c
(27%B) 40.46±0.48c
(10%D) 2.28±0.01c
(20%C) 61.05±0.53d
(27%B) 0.63±0.05b
(48%A) 20.24±0.16c
(20%C) 135.23±1.44c
(21%) 26.95±0.02a
LDHA after SPD 5.23±0.09d (61%D)
28.93±0.53d (39%E)
ND (100%A)
13.92±0.20e (86%C)
ND (100%A)
3.75±0.02d (88%B)
51.82±0.84e (73%)
0.35±0.01b
WLDHA after SPD 29.30±0.30a 110.72±1.42b 5.08±0.16b 133.11±1.51a ND 52.80±2.36a 331.00±5.75a NA aMean ±SD, n = 3. Values with different lower case letters in the same column for each SL are significantly different by Duncan’s multiple-range test (P < 0.05). Average loss percentage of the tocopherol or tocotrienol is given in parentheses, n = 3. Values with different upper case letters in the same row are significantly different by Duncan’s multiple-range test (P < 0.05). Abbreviations: T, tocopherol; T3, tocotrienol; FFA, free fatty acid; SPD, short-path distillation; Sr, substrate; SDASO, NSL, LDHA, and DHASCO-FFAs: see Table 3.1 for explanation of abbreviations; WNSL and WLDHA, distillate by short-path distillation from NSL and LDHA, respectively; ND, not detected; NA, not applicable.

93
Table 3.3 Tocopheryl and Tocotrienyl Esters Identified by GC-MS in Distillates after Short-Path Distillationa
no.c tocopheryl/tocotrienyl ester Mr GC-MS/EIb GC-MS/PCI WNSL WLDHA
base peak M+ other ions [M+NH4]+ EI PCI EI PCI 1 δ-tocopheryl myristate 612 402 (100) 612 (2) 137 (18), 177 (9) 630 + − − − 2 β (or γ)-tocopheryl myristate 626 416 (100) 626 (2) 151(27), 191(5) 644 + − − − 3 δ-tocopheryl palmitate 640 402 (100) 640 (2) 137 (16), 177 (7) 658 + + + + 4 β (or γ)-tocopheryl palmitate 654 416 (100) 654 (1.5) 151(25), 191(4) 672 + + + + 5 δ-tocopheryl oleate 666 402 (100) 666 (1.5) 137 (17), 177 (8) 684 + − − − 6 δ-tocopheryl linoleate 664 402 (100) 664 (1.5) 137 (19), 177 (8) 682 + − − − 7 α-tocopheryl palmitate 668 430 (100) 668 (1.5) 165 (23), 205 (3) 686 + − + + 8 δ-tocopheryl stearate 668 402 (100) 668 (1.2) 137 (17), 177 (6) 686 + − − − 9 β (or γ)-tocopheryl oleate 680 416 (100) 680 (1.5) 151(27), 191(4) 698 + + + − 10 β (or γ)-tocopheryl linoleate 678 416 (100) 678 (1.8) 151(28), 191(4) 696 + + + − 11 β (or γ)-tocopheryl stearate 682 416 (100) 682 (1) 151(26), 191(3) 700 + − − − 12 α-tocotrienyl palmitate 662 424 (100) 662 (3) 165 (28), 205 (12) 680 − − + − 13 α-tocopheryl oleate 694 402 (100) 694 (1) 165 (27), 205 (4) 712 + − + + 14 α-tocopheryl linoleate 692 402 (100) 692 (1) 165 (28), 205 (4) 710 + − + +
a Abbreviations: Mr, molecular weight; WNSL and WLDHA: see Table 3.2 for explanation of abbreviations; M+ and [M+NH4]+, molecular ion formed by EI and PCI, respectively; +, detected; −, not detected. bCharacteristic ions formed by EI and their relative abundance (%) (in parentheses). cNumber corresponds to the numbers in Figure 3.2.

94
Figure 3.1 MALDI-TOF mass spectra of α-tocopherol, α-tocopheryl oleate and α-tocopheryl linoleate from vitamin E linoleate mixture in positive ion mode.
m/ z
Rel
ativ
e in
tens
ity (%
)
α-tocopherol [M + Na]+
α-tocopheryl linoleate [M + K]+
α-tocopheryl oleate [M + Na]+
α-tocopheryl linoleate [M + Na]+
α-tocopheryl oleate [M + K]+

95
Figure 3.2 Total ion chromatograms of tocopheryl and tocotrienyl esters identified in the (A) WNSL and (B) WLDHA in the SIM mode. Peak numbers correspond to the esters listed in Table 3.3; a, b, c and d are unknown compounds. (WNSL and WLDHA, distillate by short-path distillation from NSL and LDHA, respectively.)
Retention time (min)
1 2
3 4
5&6 7 8
9&10
11 13&14
4
3
7 9&10 12 13&14
A
B
a b
d c

96
Figure 3.3 Representative structures and EI full scan mass spectra of tocopheryl and tocotrienyl esters: (A) α-tocopheryl oleate from vitamin E linoleate mixture, (B) β(or γ)-tocopheryl palmitate from WNSL, and (C) α-tocotrienyl palmitate from WLDHA. (WNSL and WLDHA, distillate by short-path distillation from NSL and LDHA, respectively.)
O
O
O
A
O
O
O
O
O
O
B
Rel
ativ
e ab
unda
nce
(%)
C
O
O
O
m/ z

97
Figure 3.4 Mass spectrometric fragmentation mechanism of α-, β-, γ-, and δ- tocopheryl linoleate in the EI mode. (RDA, retro-Diels−Alder reaction.)
α-cleavage RDA
R1=R2=R3=CH3, C10H13O2, m/ z=165 R1= R3=CH3 R2=H, C9H11O2, m/ z=151 R2=R3=CH3, R1=H, C9H11O2, m/ z=151 R3=CH3 R1=R2=H, C8H9O2, m/ z=137
R1=R2=R3=CH3, C13H17O2, m/ z=205 R1= R3=CH3 R2=H, C12H15O2, m/ z=191 R2=R3=CH3, R1=H, C12H15O2, m/ z=191 R3=CH3 R1=R2=H, C11H13O2, m/ z=177
CO
O
R1
O
R2
R3
O
H+●
O
R1
HO
R2
R3
+●
OH
R1
HO
R2
R3 O
R1
HO
R2
R3
ketene
rearrangement R1=R2=R3=CH3, α-tocopheryl linoleate, C47H80O3, m/ z=692 R1= R3=CH3 R2=H, β-tocopheryl linoleate, C46H78O3, m/ z=678 R2=R3=CH3 R1=H, γ-tocopheryl linoleate, C46H78O3, m/ z=678 R3=CH3 R1=R2=H, δ-tocopheryl linoleate, C45H76O3, m/ z=664
R1=R2=R3=CH3, α-tocopheryl ion, C29H50O2, m/ z=430 R1= R3=CH3 R2=H, β-tocopheryl ion, C28H48O2, m/ z=416 R2=R3=CH3 R1=H, γ-tocopheryl ion, C28H48O2, m/ z=416 R3=CH3 R1=R2=H, δ-tocopheryl ion, C27H46O2, m/ z=402
98
CHAPTER 4
CHARACTERIZATION AND OPTIMIZATION OF PHYSICAL AND OXIDATIVE
STABILITY OF STRUCTURED LIPID-BASED INFANT FORMULA EMULSION:
EFFECTS OF EMULSIFIERS AND BIOPOLYMER THICKENERS1
1 Zou, L., and Akoh, C. C. 2013. Food Chemistry, 141, 2486-2494. Reprinted here with permission of the publisher.

99
Abstract
Response surface methodology (RSM) was applied to investigate the effects of
lecithin (0-0.4 g/100 mL), monoacylglycerol (0-0.4 g/100 mL), locust bean gum (LBG;
0-0.1 g/100 mL), and carrageenan (0-0.02 g/100 mL) on the physical and oxidative
properties of structured lipid-based infant formula emulsion containing dairy proteins,
lactose, vitamins, minerals, and other micronutrients. Particle size, optical stability,
viscosity, relative content of docosahexaenoic acid and stearidonic acid, and total
oxidation value were assessed during 28-day storage. ANOVA results showed that the
experimental data were satisfactorily fitted to second-order polynomial models by
multiple linear regression. The contour plots illustrated that lecithin and
monoacylglycerol played a dominant role in controlling the emulsion stability compared
to LBG and carrageenan. Lecithin content significantly affected all the responses
measured, particularly lipid oxidation. Increasing monoacylglycerol concentration led to
an increase in particle size and emulsion viscosity. The optimal condition to achieve the
highest stability was predicted to be 0.2, 0.4, 0.045, and 0.015 g/100 mL lecithin,
monoacylglycerol, LBG, and carrageenan, respectively. The verification data further
demonstrated the suitability of the models explored by RSM. Overall, the findings
obtained in this study have important implications for the successful incorporation of
structured lipid into infant formula emulsion for better infant nutrition and health.
Keywords: infant formula; structured lipid; emulsion stability; lipid oxidation; response
surface methodology; stearidonic acid soybean oil

100
Introduction
Human milk contains 3−5% fat with 98−99% in the form of triacylglycerols
(Jensen, 1996). Human milk fat (HMF) provides essential fatty acids (FAs) and >50% of
the dietary energy required by the infants (Wells, 1996). The structure of HMF with
60−70% palmitic acids esterified at sn-2 position and unsaturated FAs mainly at sn-1,3
positions (Jensen, 1996), is metabolically different from that of physically blended
vegetable oils used in infant formula (IF). It improves absorption of palmitic acid
(energy) and calcium, and has substantial benefits for the growth of infants (Lien, 1994;
Sheila, 2011). Numerous studies have shown that omega-3 long chain polyunsaturated
fatty acids (omega-3 LCPUFAs), mainly docosahexaenoic acid (DHA) and
eicosapentaenoic acid (EPA), provide extensive health benefits associated with
cardiovascular diseases, cognitive disorders, immune dysfunction, and inflammatory
diseases (Connor, 2000; Simopoulos, 1991). DHA is also essential for the normal
functional development of retina and brain in infants (Connor, 2000; Simopoulos, 1991).
Stearidonic acid (SDA), an omega-3 LCPUFA in stearidonic acid soybean oil (SDASO),
converts to EPA more efficiently than α-linolenic acid by skipping Δ6-desaturase rate-
limiting step (Lemke et al., 2010). Therefore, a structured lipid (SL), which mimics the
unique structure of HMF as well as containing DHA and SDA in the triacylglycerol
backbone, may maximize health benefits for infants.
Human milk is the best source of nutrients for infants. However, it is not always
possible to feed infants with human milk due to physiological and cultural reasons, thus
an alternative formula is needed. Ready-to-feed IF is an oil-in-water (O/W) emulsion
system, generally produced by homogenizing an oil phase in an aqueous phase mainly

101
consisting of dairy proteins, carbohydrate, minerals and vitamins. The major physical
instability of IF emulsion is creaming, in combination with droplet aggregation (Fligner,
Fligner, & Mangino, 1990; McSweeney, 2008), reducing the shelf life of the final
products. Lipid oxidation is another unfavorable process in most foods containing omega-
3 LCPUFAs. It produces toxic compounds, and alters flavor, texture, appearance, and
nutritional value of foods (McClements & Decker, 2000), which are unacceptable to
consumers. Therefore, stability of IF emulsion to creaming and oxidation is of practical
significance to food scientists and manufacturers.
Governed by Codex Alimentarius regulations (CAC, 1981), lecithin and
monoacylglycerol, and locust bean gum (LBG) and carrageenan, are the only non-protein
based emulsifiers and thickeners permitted in regular milk-based liquid IF, respectively.
Being low-molecular weight oil-soluble surfactants, lecithin (zwitterionic) and
monoacylglycerol (non-ionic), may influence the stability of dairy emulsion through
several mechanisms: 1) reduce surface tension more rapidly than milk proteins,
facilitating the formation of smaller droplets; 2) displace adsorbed milk proteins from
O/W interface; 3) interact with interfacial proteins, leading to a thicker and stronger
adsorbed layer; 4) increase the viscosity of aqueous phase through the formation of self-
bodying mesophase structures (Dickinson, Mauffret, Rolfe, & Woskett, 1989;
McSweeney, 2008). Lecithin was also found to be able to increase heat stability of model
IF emulsion through the formation of protein-phospholipid complexes, whereas
monoacylglycerol reduced heat stability due to interfacial protein displacement
(McSweeney, Healy, & Mulvihill, 2008). Moreover, the effects of these emulsifiers on
droplet characteristics, such as interfacial thickness and density, size, and charge,

102
subsequently impact lipid oxidation. Fomuso, Corredig and Akoh (2002) found that
emulsifier type and concentration influenced oxidation rate of fish oil-based SL
emulsions. In addition to emulsifiers, polysaccharides have been found to not only
increase emulsion viscosity to stabilize droplets against creaming, but also retard lipid
oxidation in O/W emulsions due to free radical scavenging and transition metal chelating
capabilities (McClements et al., 2000; Waraho, McClements, & Decker, 2011). Trommer
and Neubert (2005) reported that LBG can reduce the level of lipid peroxidation
products. Carrageenan was found to increase the oxidative stability of menhaden oil-in-
water emulsions since its anionic groups can bind to cationic metals (Chen, McClements,
& Decker, 2010).
Response surface methodology (RSM) is a collection of mathematical and
statistical methods used to model and optimize the processes in which response variables
are affected by multiple independent variables, alone or in combination (Myers,
Montgomery, & Anderson-Cook, 2011). This procedure not only determines the
interaction between independent variables, but also reduces the number of experimental
trails, leading to time and cost saving. To the best of our knowledge, there is no specific
research reported on application of SLs in an actual food system―an infant formula
emulsion containing dairy proteins, lactose, lipid, vitamins, minerals and other nutrients.
Therefore, the objective of this study was to develop a physically and oxidatively stable
SL-based IF emulsion to deliver HMF analogues enriched with DHA and SDA for infant
nutrition and health. RSM was used to optimize the levels of emulsifiers (lecithin and
monoacylglycerol) and thickeners (LBG and carrageenan) needed to achieve a target

103
value of particle size (~1 μm), the minimum optical change, a suitable viscosity, the
lowest loss of DHA and SDA, and the least lipid oxidation products.
Materials and methods
Materials
SDASO was kindly donated by Monsanto Co. (St. Louis, MO). Tripalmitin was
purchased from TCI America (Portland, OR), and docosahexaenoic acid single-cell oil
(DHASCO) containing 40% DHA was obtained from Martek Bioscience Corp., now
DSM Nutritional Products Ltd. (Columbia, MD). sn-1,3 specific lipase Lipozyme TL IM
and nonspecific lipase Novozym 435 were obtained from Novozymes A/S (Bagsvaerd,
Denmark). High heat nonfat dry milk, CM-993X κ/λ-carrageenan, and LBG were
generously provided by O-AT-KA Milk Products Cooperative, Inc. (Batavia, NY),
Ingredients Solutions, Inc. (Waldo, ME), and TIC Gums, Inc. (Waldo, ME), respectively.
Distilled monoacylglycerol, Dimodan HS K-A, was a product from Danisco USA Inc.
(New Century, KS). A de-oiled enzyme-modified soy lecithin powder, Alcolec EM, was
kindly donated by American Lecithin Co. (Oxford, CT). The main phospholipids present
in the lecithin were 24 wt% phosphatidylcholine and lysophosphatidylcholine in total as
indicated by the manufacturer. α-Lactalbumin enriched whey protein concentrate and
5120 IF lactose were kindly donated by Hilmar Ingredients (Hilmar, CA). A
micronutrient premix mainly consisting of vitamins, minerals and nucleotides (Table 4.1)
was custom-formulated by Fortitech, Inc. (Schenectady, NY).
Production and characterization of structured lipids
The DHA and SDA-containing HMF analogue was enzymatically synthesized by
a two-step procedure using optimal conditions previously reported (Teichert & Akoh,

104
2011; Zou & Akoh, 2013). First, structured lipid from SDASO and tripalmitin, called
NSL, was produced through interesterification catalyzed by Novozym 435. Second, NSL
was reacted with FAs saponified from DHASCO by acidolysis using Lipozyme TL IM as
a biocatalyst. SL products were next purified by short-path distillation using a KDL-4
(UIC Inc., Joliet, IL) system as described by (Zou et al., 2013). FA profile, free fatty acid
(FFA) percentage, and tocopherol content were determined according to the methods
previously reported (Teichert et al., 2011; Zou et al., 2013). All samples were analyzed in
triplicate.
Preparation of infant formula emulsion
According to the formulation described in Table 4.2, the SL-based O/W IF
emulsion was prepared as follows: high heat nonfat dry milk, α-lactalbumin enriched
whey protein concentrate, lactose, and thickeners (LBG and/or carrageenan) were
dissolved in deionized water at 60 °C with stirring and then hydrated overnight at 4 °C to
ensure complete dispersion and hydration. Lecithin and/or monoacylglycerol were
dispersed in SL at 65 °C. The oil phase was added to the aqueous phase while stirring,
and the blend was tempered at 60 °C. Then the micronutrient premix and sodium azide
(0.01%, w/v) were added. The coarse emulsion was prepared using a Polytron high-speed
batch disperser (Kinematica, Inc., Bohemia, NY) at setting 5 for 2 min. The coarse
emulsion was then passed 3 times through an EmulsiFlex-C5 high-pressure homogenizer
(Avestin, Inc., Ottawa, Canada) at 5000−7000 psi (34.47−48.26 MPa). After adjustment
of pH to 6.8 with 0.1 mol/L sodium hydroxide, the mixture was filled into a container and
sterilized in an autoclave at 121 °C for 6 min. After sterilization, the emulsion was cooled

105
down as quickly as possible and stored at room temperature for 28 days. All the emulsion
samples were prepared in duplicates.
Measurement of particle size distribution
The particle size distribution was determined using a LS 13 320 MW laser
diffraction particle size analyzer (Beckman Coulter, Inc., Miami, FL). To avoid multiple
scattering effects, samples were added dropwisely to deionized water in the dispersion
cell until obscuration value reached 8−10%. The real and imaginary refractive index (RI)
of particle was 1.471 and 0, respectively, and RI of dispersant was 1.332. Each emulsion
sample was analyzed in triplicate, and surface-area-average diameter (D3,2) was reported.
Optical analysis by Turbiscan
Turbiscan, based on multiple light scattering, is an optical analyzer, which can be
used to monitor reversible (creaming and sedimentation) and irreversible (coalescence
and flocculation) destabilization phenomena in a concentrated and opaque emulsion
without dilution (Mengual, Meunier, Cayre, Puech, & Snabre, 1999). It can detect phase
changes much earlier and easier than classic approaches (Mengual et al., 1999).
Seven milliliters of emulsion sample was placed in a flat-bottomed screw-cap
cylindrical glass tube, tightly sealed, and stored at room temperature without shaking.
The tube was then scanned by Turbiscan Classic MA 2000 (Formulaction Inc., Davie,
FL), equipped with a pulsed near infrared light source (λ = 880 nm). Light transmitted
through and backscattered by the sample was received by two synchronous detectors at
an angle of 0° and 135° with respect to the incident beam, respectively. A plot was
produced by the software with transmission (T) or backscattering (BS) signal on the y-
axis and the sample height (mm) on the x-axis. A height of 0 mm corresponded to the

106
bottom of tube. The same sample measured at different times (day 0 and 28) was
recorded in the same file to easily calculate the variations of T or BS signal. In the
reference mode of software, after subtracting values of first scan (day 0), mean value
kinetics of BS signal with 0% T at the height of 2-12 (creaming layer) and 20-30 mm
(aggregation layer) were obtained, respectively. The sum value (BS ) was reported to
evaluate optical change.
Rheological properties
Steady shear viscosity was measured using a SR-5000 stress-controlled rheometer
(Rheometric Scientific, Inc., Piscataway, NJ), equipped with a double-wall couette
geometry and a bath temperature controller. Fifteen milliliters of emulsion sample was
placed in the double-wall couette, and left for 2 min before starting measurements. A gap
of 0.5 mm was used. Steady stress sweep test was performed at 25 °C over a shear stress
range of 0.005 to 5 Pa. All the samples (day 0) were tested within 24 h after emulsion
preparation. Power law model was used to fit the starting portion ( ≤ 20 s-1) of flow
curve
1 nK (1)
where is apparent viscosity, K is consistency index, is shear rate, and n is flow
behavior index. At low shear rate of 1 s-1 (similar to standing at rest), is equal to K ,
which thus can be used to compare shear-thinning (0 < n < 1) or shear-thickening (n > 1)
behavior of non-Newtonian fluids.
Relative content of DHA and SDA
Two milliliters of hexane was added to 300 μL of emulsion sample, mixed thoroughly,
and centrifuged at 2000 rpm for 5 min. The upper phase was dried with nitrogen,

107
methylated, and then analyzed for its fatty acid composition as previously described (Zou
et al., 2013). Due to higher stability to oxidation than DHA and SDA, saturated palmitic
acid was selected as a reference fatty acid. The concentration ratio of palmitic acid to
DHA and SDA ( SDADHAacid palmitic CC ) was calculated as a direct indicator of lipid
oxidation.
Measurements of primary and secondary lipid oxidation products
Lipid hydroperoxide, measured as peroxide value (PV), was determined using a
modified method of Shanta and Decker (Shantha & Decker, 1994). Briefly, 0.3 mL of
emulsion sample was mixed with 1.5 mL of isooctane/2-propanol (3:2, v/v), and vortexed
three times for 10 s each. After centrifugation at 2000 rpm for 5 min, 0.20 mL of the clear
upper layer (isooctane as a blank) was mixed with 2.8 mL of methanol/1-butanol (2:1,
v/v), 15 μL of 3.94 mol/L ammonium thiocyanate solution and 15 μL of 0.072 mol/L
ferrous ion solution (freshly prepared from supernatant by mixing an equal amount of
0.132 mol/L BaCl2 and 0.144 mol/L FeSO4 in 0.4 mol/L HCl), and then vortexed. After
incubation at room temperature for 20 min, absorbance of the solution in blood-red color
was measured at 510 nm by a UV-1601 UV-visible spectrophotometer (Shimadzu Corp.,
Columbia, MD). PV (expressed as mmol/L emulsion) was quantified using a cumene
hydroperoxide standard curve (5, 10, 50, 100, 500, and 1000 μmol/L in methanol), and
calculated using the equation
100030
6051
.a..bAPV (2)
where A is absorbance of the sample against blank. a and b are slope and y-intercept
obtained from the standard curve, respectively.

108
Para-anisidine value (p-AnV) was determined according to the AOCS Official
Method Cd 18-90 (AOCS, 2009) with minor modifications. Briefly, 2 mL of emulsion
sample was added into a 25-mL volumetric flask and made up to the mark with isooctane.
After mixing thoroughly, the sample was transferred to a 50-mL centrifuge tube and
vortexed twice for 10 s each. After centrifugation at 5000 rpm for 10 min, absorbance (
1A ) of the upper layer was measured at 350 nm against isooctane as a blank. Five
milliliters of the upper layer or isooctane was then transferred to a 10-mL test tube. One
milliliter of p-anisidine solution (0.25% in glacial acetic acid, w/v) was added and
vortexed for 10 s. After incubation at room temperature for 10 min, absorbance ( 2A ) was
measured at 350 nm against isooctane containing p-anisidine as a blank. p-AnV was
determined using the equation
2
2125 12 AA.p-AnV (3)
The total oxidation (TOTOX) value was calculated as
p-AnVPVeTOTOX valu 2 (4)
Experimental design and statistical analysis
The effect of four independent variables namely, lecithin (0, 0.2, 0.4 g/100 mL,
1X ), monoacylglycerol (0, 0.2, 0.4 g/100 mL, 2X ), LBG (0, 0.02, 0.1 g/100 mL, 3X ),
and carrageenan (0, 0.004, 0.02 g/100 mL, 4X ), on the particle size ( 1Y ), optical change (
2Y ), apparent viscosity ( 3Y ), SDADHAacid palmitic CC ( 4Y ), and TOTOX value ( 5Y ), was
evaluated by RSM using Modde 5.0 software (Umetrics AB, Umeå, Sweden). A D-
optimal design (Table 4.3) generated twenty-seven experiments consisting of twenty-four
different combinations and three more replicates of the center point. Experiment at each

109
design point was randomly performed in duplicate, resulting in a total of fifty-four runs.
The relationship between the independent and response variables from the above design
was explored by multiple linear regression, and fitted into a second-order polynomial
equation
iji ij
jiiji
iiii
ii εXXβXβXββY
3
1
4
1
4
1
24
10 (5)
where Y is the response variable. iX and jX are the independent variables. 0β , iβ , iiβ ,
and ijβ are constant, linear, quadratic, and interaction regression coefficients,
respectively. ijε is the error term. Analysis of variance (ANOVA) was performed to
investigate the goodness of model fitting based on coefficient of determination ( 2R ),
adjusted 2R ( 2adjR ), and lack of fit test. It was also used to assess the significance of
regression as well as each coefficient in the model based on F-test at α = 0.05. The
predictive power of the model was evaluated by 2Q , which was associated with the
predicted residual sums of squares. The contour plot was employed to visualize the
interaction of independent variables on the responses, and to identify the optimum region
for desired responses. The independent variable with the greatest effect was kept on the
x-axis, the second was placed on the y-axis, and the other two with the least effect were
held constant. Optimal conditions were generated by optimizer function of the software.
Finally, additional confirmation experiments under optimal and another four random
conditions were carried out to verify the adequacy of the model. A Chi-squared test was
performed to determine significant difference between the predicted and observed values
(α = 0.05).

110
Results and discussion
Compositional analysis
As shown in Table 4.2, the total energy density of IF was 65.2 kcal/100 ml,
consisting of 5.3, 2.1, and 11.0 g/100 kcal lipid, protein and carbohydrate, respectively.
These values, including micronutrient specifications (Table 4.1), meet the nutrient
requirements by both FDA regulation 21CFR107.100 (FDA, 1985) and ESPGHAN
recommended standards (Koletzko, Baker, Cleghorn, Neto, Gopalan, Hernell, et al.,
2005). In addition, α-lactalbumin enriched whey protein concentrate was used to
compensate for the protein difference between bovine milk and human milk. The ratio of
casein:whey protein was kept at 40:60 to mimic mature human milk status (Wells, 1996).
The major FAs of purified SL were palmitic acid (55.9 mol %), oleic acid (9.4 mol %),
SDA (8.0 mol %), linoleic acid (7.3 mol %), and DHA (5.4 mol %), with 57.0 mol %
palmitic acid esterified at sn-2 position, which demonstrates that this HMF analogue with
health benefits of omega-3 FAs was successfully synthesized. After short-path
distillation, FFA percentage and total vitamin E content of SL were reduced to 0.35% and
51.82 μg/g, respectively. Lecithin mainly contained linoleic acid (62.9 mol %), palmitic
acid (19.7 mol %), oleic acid (8.3 mol %), stearic acid (4.1 mol %), and α-linolenic acid
(5.0 mol %), whereas the principal FAs present in monoacylglycerol were stearic acid
(85.7 mol %) and palmitic acid (14.3 mol %). The FA saturation status may contribute to
the differences between solubility and functionality of these two emulsifiers.
Model fitting
As can been seen in Table 4.3, the initial viscosity of IF emulsion ranged from
22.19 to 222.9 Pa·S. After storage for 28 days, the particle size, optical change,

111
SDADHAacid palmitic CC , and TOTOX value ranged from 0.58 to 3.57 μm, 4.18 to 20.93%,
5.51 to 13, and 1.96 to 11.01, respectively. Multiple linear regression was used to fit the
experimental data (Table 4.3) into separate second-order polynomial models. ANOVA
for the five response variables is shown in Table 4.4. All the regression models were
highly significant (p < 0.01). The 2R value, the fraction of variation of the response
explained by the model, was 0.860, 0.915, 0.815, 0.920, and 0.892 for particle size,
optical change, apparent viscosity, SDADHAacid palmitic CC , and TOTOX value,
respectively. In other words, more than 80% of the variation in the response variables
could be explained by the corresponding models, indicating the good explanatory power
of the models. The 2adjR values were calculated to check the adequacy of the models. The
closer value of 2adjR to 2R indicates that non-significant terms were not included in the
models. The lack of fit tests with insignificant results (P > 0.05) further demonstrates the
satisfactory fitness of the models. The 2Q values, the fraction of variation of the response
that can be predicted by the model, were higher than 0.70 (0.735−0.848), indicating that
the models had good predictive abilities. The observed versus predicted plots had linear
distributions for all the response variables (data not shown). Therefore, the models after
eliminating insignificant coefficients (P > 0.05) can be written as equations (6) − (10). As
shown in Table 4.4, the linear term of lecithin ( 1 ) affected all the response variables,
and the linear term of monoacylglycerol ( 2 ) was the most significant coefficient.
Particle size ( 1Y ) =
24141223421 162.0144.0277.0431.0243.0538.0327.0781.0 XXXXXXX (6)

112
Optical change ( 2Y ) =
3423141324
23
22
214321
611.0866.1656.1551.0200.2
661.1418.3256.3962.1948.0604.0496.0820.6
XXXXXXXXXXXX
(7)
Apparent viscosity ( 3Y ) =
231222321 741.8679.10385.22657.16884.26929.8184.94 XXXXXX (8)
SDADHAacid palmitic CC ( 4Y ) =
342423
24
23
22
21321
554.0378.0700.0764.1771.1533.1555.1406.0369.0380.1568.4
XXXXXXXXXX
(9)
TOTOX value ( 5Y ) =
14122141 519.0640.0636.1591.0872.1553.2 XXXXX (10)
Particle size
As shown in Table 4.4, the most significant factor determining the variation of
particle size was the linear effect of monoacylglycerol, followed by the linear effect of
lecithin and interactive effect of monoacylglycerol and lecithin. It was found that the
linear term of LBG had a non-significant (P >0.05) effect on the particle size but showed
a significant (P < 0.05) effect in the quadratic term. The linear term of carrageenan
exhibited a highly significant (P < 0.01) negative effect on the particle size; in contrast,
the response value was positively influenced by the linear terms of monoacylglycerol and
lecithin. Figure 4.1A illustrates that a higher level of monoacylglycerol and lecithin
present in the IF emulsion resulted in a larger particle size of the final product after 28-
day storage. The displacement of milk proteins by monoacylglycerol and/or lecithin at
the O/W interface may reduce the protein surface coverage of oil droplets and thus
contribute to the destabilization (e.g., droplet aggregation), regardless of the small

113
particle size initially induced by the presence of these non-protein emulsifiers (Euston,
Finnigan, & Hirst, 2001; Fligner et al., 1990; McSweeney, 2008).
Optical change
All the parameters were significant (P < 0.05) except the interaction term of
lecithin and monoacylglycerol, and interaction term of monoacylglycerol and
carrageenan (Table 4.4). The most significant factor was the linear term of carrageenan
with a negative effect on optical change, followed by a second-order term of
monoacylglycerol and LBG with a positive effect. In Figure 4.1B, it can be seen that the
optical change was decreased by addition of carrageenan up to about 0.01 g/100 mL
while a further addition had little effect. This behavior may be explained by the
interaction between carrageenan molecules and protein-coated droplets. After adjusting
the pH of emulsion to 6.8 (pH > pI), both of them became negatively charged. Therefore,
as the carrageenan concentration in the continuous phase increased, there was stronger
electrostatic repulsion between anionic polysaccharides and droplets to avoid bridging
flocculation (Cho, Decker, & McClements, 2009; McClements, 2005), hence minimizing
optical instability. However, too many polysaccharides present in the continuous phase,
either carrageenan or LBG, may cause depletion flocculation (McClements, 2005). As
shown in Figure 4.1B, the optimal level of LBG ranging from 0.01−0.06 g/100 mL may
give the minimum optical change when both lecithin and monoacylglycerol were kept
constant at 0.2 g/100 mL.
Apparent viscosity
All of the emulsions studied exhibited shear-thinning behavior (0 < n < 1) over
the shear rate range tested (data not shown). As can be seen in Table 4.4, the most

114
significant factor affecting the viscosity was the linear term of monoacylglycerol,
followed by the linear term of LBG. Both of them had positive effects. The linear,
quadratic, and interactive effects of carrageenan were shown to be non-significant (P
>0.05) on the viscosity, which suggested that there was no significant contribution from
either synergetic interaction between carrageenan and LBG, or gelling behavior of κ-
carrageenan. Figure 4.1C illustrates that the higher the content of monoacylglycerol and
LBG, the higher the viscosity of the emulsions. It also shows that the viscosity was
mainly influenced by monoacylglycerol and to a lesser extent by LBG. A possible
explanation for the significant positive effect of monoacylglycerol on the viscosity may
be due to the formation of self-bodying mesophase structure of non-adsorbing
monoacylglycerol in the continuous phase (Dickinson et al., 1989). As a result, the
emulsions were more structured, increasing the viscosity. Due to the major contribution
of monoacylglycerol (Figure 4.1A and C), viscosity analysis was found to be highly
correlated (R = 0.678) with the measurement of particle size distribution (Table 4.5).
However, both of them did not correlate well with optical analysis (R = 0.330 and 0.333,
respectively). In other words, taking optical analysis as a reference measurement, particle
size and initial viscosity may not be good indicators of long-term physical stability by
assessing early changes occurring in the IF emulsions.
Relative content of DHA and SDA
The relative content of DHA and SDA was calculated as the concentration ratio of
palmitic acid to DHA and SDA. This ratio was expected to decrease with a decrease in
oxidation of DHA and SDA. As seen in Table 4.4, the most significant factor was the
linear term of lecithin, followed by the interaction term of monoacylglycerol and LBG.

115
Both of them had negative effects on the oxidation of DHA and SDA. Figure 4.1D also
demonstrates that a lower oxidation occurred at a higher level of lecithin. There are two
possible explanations. First, this may be due to the formation of lecithin micelles in the
continuous phase. When the lecithin exceeds a critical concentration, lecithin micelles
may form (Waraho et al., 2011). Cho, McClements and Decker (2002) reported that
surfactant micelles could decrease lipid oxidation through their ability to solubilize the
irons and keep them in the continuous phase, thus the transition metals (e.g., iron and
copper) would be less likely to interact with oxidizable lipids. Nuchi, Hernandez,
McClements and Decker (2002) also found that surfactant micelles may solubilize lipid
hydroperoxides out of the emulsion droplets which could prevent free radicals formed by
hydroperoxide decomposition from attacking unsaturated lipids in the lipid droplet core,
thus increasing the oxidative stability of emulsion. Second, this may be attributed to the
formation of protein/lecithin complexes at the O/W interface (McSweeney et al., 2008),
leading to a thicker adsorbed layer which creates steric hindrance of interactions between
lipid droplets and pro-oxidants from the continuous phase as well as free radicals at the
interface to inhibit lipid oxidation.
TOTOX value
The TOTOX value is an evaluation of both primary and secondary oxidation
products used to estimate oxidative deterioration of food lipids. As shown in Table 4.4,
the most significant factor on TOTOX value was the linear term of lecithin having a
negative effect, followed by the quadratic term of lecithin having a positive effect. In
addition, none of LBG terms were significant (P >0.05), whereas the linear term of
carrageenan had a highly significant (P <0.01) negative effect on TOTOX value. Figure

116
4.1E confirms that TOTOX value decreased with increased carrageenan content. The
inhibitory effect of carrageenan on lipid oxidation in O/W emulsion may be probably
attributed to its capability to chelate transition metals in the continuous phase (Chen et
al., 2010). As shown in Table 4.5, TOTOX value was also found to correlate well (R =
0.674) with SDADHAacid palmitic CC , which demonstrates the adequacy of this method to
indicate lipid oxidation in IF emulsion. Besides, there was a negative correlation between
particle size and TOTOX value (R = -0.329) as well as SDADHAacid palmitic CC (R = -
0.409). The results indicate that the rate of lipid oxidation increased as the particle size
decreased, but the effect of particle size on lipid oxidation was not significant.
Optimization of variables and verification of models
The criteria of targeted particle size (~1 μm), the minimum optical change, the
lowest ratio of palmitic acid to DHA and SDA, and the minimum TOTOX value, were
applied in the optimization procedure. The optimal conditions were determined to be 0.2
g/100 mL lecithin, 0.4 g/100 mL monoacylglycerol, 0.045 g/100 mL LBG, and 0.015
g/100 mL carrageenan, resulting in predicted response values for particle size, optical
change, viscosity, SDADHAacid palmitic CC , and TOTOX value at 1.17 μm, 3.48%, 96.28
Pa·S, 3.33, and 2.17, respectively. Since the computed Chi-squared values (Table 4.6)
were smaller than the table value (9.488) at α = 0.05 and df = 4, there was no significant
difference between the expected and observed values, which indicates the high adequacy
of the corresponding models.
Conclusions
A HMF analogue enriched with DHA and SDA was successfully synthesized and
incorporated in a ready-to-feed IF to benefit the development and growth of infants. The

117
ANOVA and verification data demonstrates that RSM could be used to optimize the
levels of emulsifiers (lecithin and monoacylglycerol) and biopolymer thickeners (LBG
and carrageenan) for the highest physical and oxidative stability. The contour plots
showed that lecithin and monoacylglycerol played a more important role than LBG and
carrageenan in controlling the emulsion stability. Lecithin content affected all the
responses measured, particularly lipid oxidation. An increase in monoacylglycerol
concentration was associated with large particle size and high emulsion viscosity.
Overall, the results obtained in this study should aid in the formulation of SL-based IF
emulsion. Further research will be conducted on assessing oxidative stability of SL-based
IF emulsion in the presence of antioxidants.
Acknowledgments
This project was supported by Agriculture and Food Research Initiative
Competitive Grant 2009-65503-05734 from the USDA National Institute of Food and
Agriculture. We thank Monsanto Co. and Fortitech, Inc. for providing the SDA soybean
oil and micronutrient premix, respectively. We also thank Hilmar Ingredients and
American Lecithin Co. for supplying whey protein concentrate and soy lecithin,
respectively.

118
References
AOCS. (2009). Official methods and recommended practice of the American Oil
Chemists' Society. Method Cd 18-90. Champaign, IL: AOCS.
CAC (Codex Alimentarius Commission). (1981). Standard for infant formula and
formulas for special medical purposes intended for infants. Retrieved from
http://www. codexalimentarius.org/download/standards/288/CXS_072e.pdf.
Accessed 06.12.14.
Chen, B. C., McClements, D. J., & Decker, E. A. (2010). Role of continuous phase
anionic polysaccharides on the oxidative stability of menhaden oil-in-water
emulsions. Journal of Agricultural and Food Chemistry, 58(6), 3779−3784.
Cho, Y. H., Decker, E. A., & McClements, D. J. (2009). Competitive adsorption of mixed
anionic polysaccharides at the surfaces of protein-coated lipid droplets. Langmuir,
25(5), 2654−2660.
Cho, Y. J., McClements, D. J., & Decker, E. A. (2002). Ability of surfactant micelles to
alter the physical location and reactivity of iron in oil-in-water emulsion. Journal
of Agricultural and Food Chemistry, 50(20), 5704−5710.
Connor, W. E. (2000). Importance of n-3 fatty acids in health and disease. American
Journal of Clinical Nutrition, 71(1), 171−175.
Dickinson, E., Mauffret, A., Rolfe, S. E., & Woskett, C. M. (1989). Adsorption at
interfaces in dairy systems. Journal of the Society of Dairy Technology, 42(1),
18−22.

119
Euston, S. R., Finnigan, S. R., & Hirst, R. L. (2001). Aggregation kinetics of heated whey
protein-stabilised emulsions: Effect of low-molecular weight emulsifiers. Food
Hydrocolloids, 15(3), 253−262.
FDA (U.S. Food and Drug Administration). (1985). Code of Federal Regulations Title
21. Retrieved from http://www.accessdata.fda.gov/scripts/cdrh/cfdocs/cfcfr/
CFRSearch.cfm?fr=107.100. Accessed 06.12.14.
Fligner, K. L., Fligner, M. A., & Mangino, M. E. (1990). The effects of compositional
factors on the short-term physical stability of a concentrated infant formula. Food
Hydrocolloids, 4(2), 95−104.
Fomuso, L. B., Corredig, M., & Akoh, C. C. (2002). Effect of emulsifier on oxidation
properties of fish oil-based structured lipid emulsions. Journal of Agricultural and
Food Chemistry, 50(10), 2957−2961.
Jensen, R. G. (1996). The lipids in human milk. Progress in Lipid Research, 35(1),
53−92.
Koletzko, B., Baker, S., Cleghorn, G., Neto, U. F., Gopalan, S., Hernell, O., et al. (2005).
Global standard for the composition of infant formula: Recommendations of an
espghan coordinated international expert group. Journal of Pediatric
Gastroenterology and Nutrition, 41(5), 584−599.
Lemke, S. L., Vicini, J. L., Su, H., Goldstein, D. A., Nemeth, M. A., Krul, E. S., et al.
(2010). Dietary intake of stearidonic acid-enriched soybean oil increases the
omega-3 index: Randomized, double-blind clinical study of efficacy and safety.
American Journal of Clinical Nutrition, 92(4), 766−775.

120
Lien, E. L. (1994). The role of fatty-acid composition and positional distribution in fat-
absorption in infants. Journal of Pediatrics, 125(5), 62−68.
McClements, D. J. (2005). Food emulsions: Principles, practice, and techniques (2nd
ed.). Boca Raton, FL: CRC Press.
McClements, D. J., & Decker, E. A. (2000). Lipid oxidation in oil-in-water emulsions:
Impact of molecular environment on chemical reactions in heterogeneous food
systems. Journal of Food Science, 65(8), 1270−1282.
McSweeney, S. L. (2008). Emulsifiers in infant nutritional products. In G. L. Hasenhuettl
& R. W. Hartel (Eds.), Food emulsifiers and their applications, (2nd ed.), (pp.
233−261). New York: Springer Science+Business Media, LLC.
McSweeney, S. L., Healy, R., & Mulvihill, D. M. (2008). Effect of lecithin and
monoglycerides on the heat stability of a model infant formula emulsion. Food
Hydrocolloids, 22(5), 888−898.
Mengual, O., Meunier, G., Cayre, I., Puech, K., & Snabre, P. (1999). Turbiscan MA
2000: multiple light scattering measurement for concentrated emulsion and
suspension instability analysis. Talanta, 50(2), 445−456.
Myers, R. H., Montgomery, D. C., & Anderson-Cook, C. M. (2011). Response surface
methodology, process and product optimization using designed experiments (3rd
ed.). New York, NY: Wiley.
Nuchi, C. D., Hernandez, P., McClements, D. J., & Decker, E. A. (2002). Ability of lipid
hydroperoxides to partition into surfactant micelles and alter lipid oxidation rates
in emulsions. Journal of Agricultural and Food Chemistry, 50(19), 5445−5449.

121
Shantha, N. C., & Decker, E. A. (1994). Rapid, sensitive, iron-based spectrophotometric
methods for determination of peroxide values of food lipids. Journal of AOAC
International, 77(2), 421−424.
Sheila, M. I. (2011). Dietary triacylglycerol structure and its role in infant nutrition.
Advances in Nutrition, 2, 275−283.
Simopoulos, A. P. (1991). Omega-3 fatty acids in health and disease and in growth and
development. American Journal of Clinical Nutrition, 54(3), 438−463.
Teichert, S. A., & Akoh, C. C. (2011). Modifications of stearidonic acid soybean oil by
enzymatic acidolysis for the production of human milk fat analogues. Journal of
Agricultural and Food Chemistry, 59(24), 13300−13310.
Trommer, H., & Neubert, R. H. H. (2005). The examination of polysaccharides as
potential antioxidative compounds for topical administration using a lipid model
system. International Journal of Pharmaceutics, 298(1), 153−163.
Waraho, T., McClements, D. J., & Decker, E. A. (2011). Mechanisms of lipid oxidation
in food dispersions. Trends in Food Science & Technology, 22(1), 3−13.
Wells, J. C. K. (1996). Nutritional considerations in infant formula design. Seminars in
Neonatology, 1(1), 19−26.
Zou, L., & Akoh, C. C. (2013). Identification of tocopherols, tocotrienols, and their fatty
acid esters in residues and distillates of structured lipids purified by short-path
distillation. Journal of Agricultural and Food Chemistry, 61, 238−246.
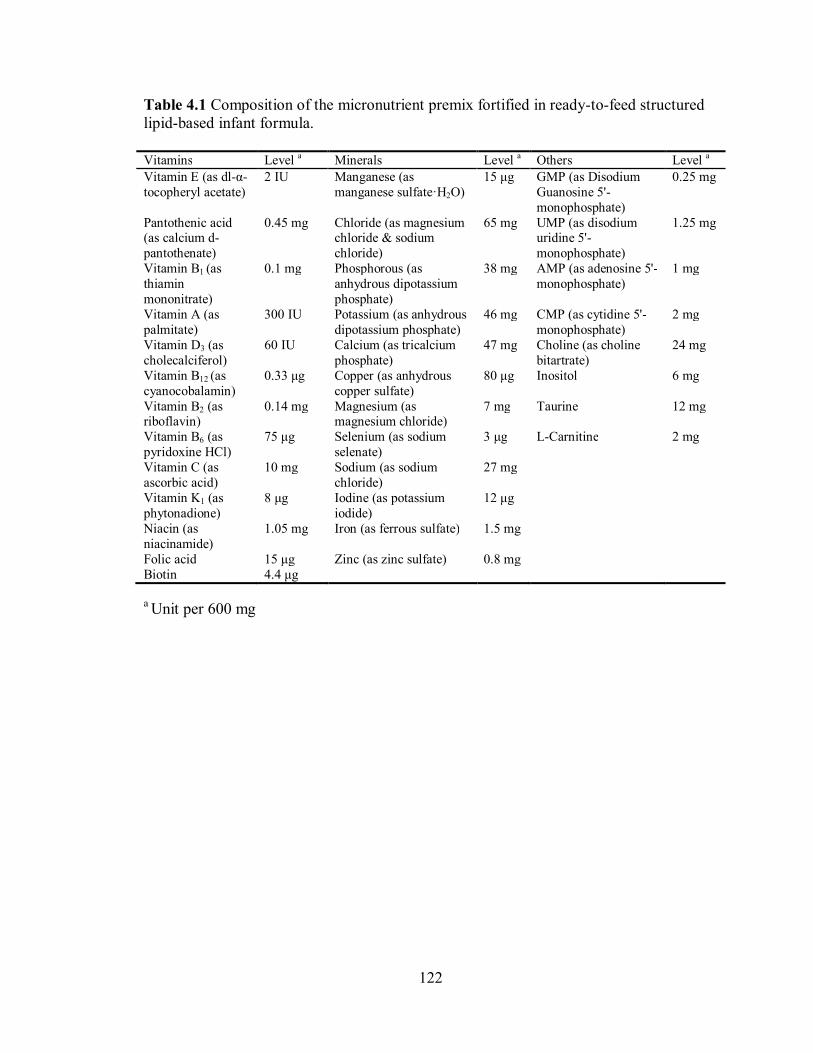
122
Table 4.1 Composition of the micronutrient premix fortified in ready-to-feed structured lipid-based infant formula. Vitamins Level a Minerals Level a Others Level a Vitamin E (as dl-α-tocopheryl acetate)
2 IU Manganese (as manganese sulfate·H2O)
15 μg GMP (as Disodium Guanosine 5'-monophosphate)
0.25 mg
Pantothenic acid (as calcium d-pantothenate)
0.45 mg Chloride (as magnesium chloride & sodium chloride)
65 mg UMP (as disodium uridine 5'- monophosphate)
1.25 mg
Vitamin B1 (as thiamin mononitrate)
0.1 mg Phosphorous (as anhydrous dipotassium phosphate)
38 mg AMP (as adenosine 5'-monophosphate)
1 mg
Vitamin A (as palmitate)
300 IU Potassium (as anhydrous dipotassium phosphate)
46 mg CMP (as cytidine 5'- monophosphate)
2 mg
Vitamin D3 (as cholecalciferol)
60 IU Calcium (as tricalcium phosphate)
47 mg Choline (as choline bitartrate)
24 mg
Vitamin B12 (as cyanocobalamin)
0.33 μg Copper (as anhydrous copper sulfate)
80 μg Inositol 6 mg
Vitamin B2 (as riboflavin)
0.14 mg Magnesium (as magnesium chloride)
7 mg Taurine
12 mg
Vitamin B6 (as pyridoxine HCl)
75 μg Selenium (as sodium selenate)
3 μg L-Carnitine 2 mg
Vitamin C (as ascorbic acid)
10 mg Sodium (as sodium chloride)
27 mg
Vitamin K1 (as phytonadione)
8 μg Iodine (as potassium iodide)
12 μg
Niacin (as niacinamide)
1.05 mg Iron (as ferrous sulfate) 1.5 mg
Folic acid 15 μg Zinc (as zinc sulfate) 0.8 mg Biotin 4.4 μg
a Unit per 600 mg

123
Table 4.2 Composition of structured lipid-based infant formula emulsion. Ingredient Content
(g) Macronutrient contribution (g) Energy a
(kcal) Lipid Protein Carbohydrate High heat nonfat dry milk b 20.0 0.2 6.8 10.6 71.4 α-Lactalbumin enriched whey protein concentrate c
8.8 1.1 6.9 0.1 37.9
Structured lipid 33.2 33.2 0 0 298.8 Lactose 61.0 0 0 61.0 244.0 Micronutrient premix d 3.9 0 0 0 0 Others e 873.1 0 0 0 0 Total 1000 34.5
(47.6%) f 13.7 (8.4%)
71.7 (44.0%)
652
a Energy density for lipid, protein and carbohydrate is 9, 4, and 4 kcal/g, respectively. b High heat nonfat dry milk contains 0.76% lipid, 34% protein, and 53% carbohydrate. c α-Lactalbumin enriched whey protein concentrate contains 12% lipid, 78% protein, and 1.5% carbohydrate. d The usage is 600 mg premix/100 kcal. e Others include lecithin, monoacylglycerol, locust bean gum, carrageenan and deionized water, and their contributions to macronutrient and energy are negligible. f Energy contribution (%) from each macronutrient is given in parentheses.

124
Table 4.3 D-optimal design: independent ( iX ) and response variables ( iY ). No. Independent variables (g/100 mL) Response variables (mean ± SD, n = 2)
Lecithin ( 1X )
MAG a ( 2X )
LBG ( 3X )
CG ( 4X )
D3,2 (μm) ( 1Y )
BS (%) ( 2Y )
(Pa·S) ( 3Y )
SDADHAacid palmitic CC ( 4Y )
TOTOX value ( 5Y )
1 0 0 0 0 0.74±0.09 15.78±0.19 44.47±0.00 8.09±0.02 7.19±0.23 2 0 0 0.1 0.004 0.60±0.00 9.27±0.49 37.45±21.57 11.01±1.81 5.53±0.58 3 0 0 0.02 0.02 0.60±0.00 6.30±0.99 35.10±0.00 8.02±0.42 4.98±0.29 4 0 0 0.1 0.02 0.68±0.04 4.54±0.51 70.01±0.00 10.59±1.40 6.50±0.16 5 0 0.2 0.1 0 1.31±0.18 18.70±3.16 84.12±5.61 11.78±0.31 9.22±2.53 6 0 0.2 0 0.02 0.94±0.02 11.00±0.38 70.03±4.26 11.70±1.84 6.47±1.18 7 0 0.4 0 0 1.29±0.15 10.83±0.78 69.18±6.81 8.67±0.39 9.89±0.08 8 0 0.4 0.1 0 1.29±0.11 18.83±0.10 87.79±0.52 9.07±0.28 9.56±0.45 9 0 0.4 0.02 0.004 1.42±0.22 9.99±0.52 75.34±0.00 6.26±0.01 7.87±0.62 10 0 0.4 0 0.02 1.02±0.28 6.67±0.45 62.01±2.09 10.25±0.04 6.93±2.03 11 0 0.4 0.1 0.02 1.25±0.01 10.80±1.51 85.78±5.41 7.84±0.00 6.18±0.04 12 0.2 0 0.1 0 1.21±0.30 8.91±0.39 69.80±0.00 8.67±0.04 4.50±0.54 13 0.2 0 0 0.02 0.62±0.01 6.71±0.45 33.14±0.00 6.18±0.25 3.68±0.66 14 0.2 0.2 0.02 0 1.26±0.10 11.30±0.71 89.24±1.03 6.00±0.09 3.76±0.59 15 0.2 0.4 0.1 0.02 1.54±0.27 6.69±0.41 147.48±0.73 6.27±0.08 2.99±0.89 16 0.4 0 0.02 0 0.70±0.11 8.02±0.65 29.62±0.00 6.00±0.14 3.87±0.66 17 0.4 0 0.1 0.004 0.83±0.11 9.24±0.54 34.77±12.95 7.08±0.18 3.81±0.27 18 0.4 0 0 0.02 0.97±0.13 9.24±0.98 44.42±0.00 6.00±0.66 3.19±0.27 19 0.4 0 0.1 0.02 0.67±0.12 7.90±0.01 62.15±0.00 7.00±0.14 3.73±0.27 20 0.4 0.2 0 0.004 1.44±0.40 10.09±0.82 84.72±2.11 6.41±0.04 3.71±0.71 21 0.4 0.4 0 0 2.88±0.00 7.37±0.35 80.24±2.02 5.55±0.06 2.53±0.21 22 0.4 0.4 0.1 0 3.49±0.12 13.74±0.40 148.05±2.24 6.21±0.13 3.15±0.20 23 0.4 0.4 0.02 0.02 1.24±0.22 8.01±1.18 76.03±0.66 6.22±0.12 2.80±0.22 24 0.4 0.4 0.1 0.02 1.82±0.37 12.15±0.43 215.44±10.56 6.46±0.01 3.15±0.21 25 0.4 0.4 0.1 0.02 2.66±0.42 13.23±0.76 118.31±7.68 6.19±0.18 2.77±1.15 26 0.4 0.4 0.1 0.02 2.17±0.23 15.94±0.44 117.20±2.40 5.98±0.10 3.73±0.74 27 0.4 0.4 0.1 0.02 2.51±0.95 12.86±0.47 201.20±0.37 6.16±0.16 2.62±0.03 a Abbreviations: MAG, monoacylglycerol; LBG, locust bean gum; CG, carrageenan; D3,2, particle size; BS , optical change; , apparent viscosity; SDADHAacid palmitic CC , concentration ratio of palmitic acid to DHA and SDA.

125
Table 4.4 ANOVA for the effects of independent variables on the dependent variables, and corresponding coefficients of the regression models. Parameters D3,2 (μm, 1Y ) a
BS (%, 2Y ) (Pa·S, 3Y ) SDADHAacid palmitic CC (
4Y )
TOTOX value ( 5Y )
Coefficient P-value Coefficient P-value Coefficient P-value Coefficient P-value Coefficient P-value 0β 0.781 0.020* b 6.820 1.4E-6** 94.184 1.6E-4** 4.568 5.7E-9** 2.553 0.004**
Linear 1β 0.327 3.1E-7** -0.496 0.017* 8.929 0.021* -1.380 2.4E-16** -1.872 2.8E-16**
2β 0.538 5.3E-12** 0.604 0.006** 26.884 2.5E-8** -0.369 0.001** 0.162 0.270
3β 0.099 0.096 0.948 8.9E-5** 16.657 2.1E-4** 0.406 0.001** 0.092 0.549
4β -0.243 6.6E-5** -1.962 6.8E-12** 2.285 0.553 0.094 0.373 -0.591 1.7E-4** Quadratic
11β 0.005 0.970 3.256 2.0E-7** -13.510 0.173 1.555 8.4E-7** 1.636 5.7E-5**
22β 0.025 0.862 -3.418 1.0E-7** -22.385 0.029* -1.533 1.4E-6** -0.478 0.201
33β 0.431 0.040* 1.661 0.034* 11.730 0.413 1.771 4.9E-5** 0.550 0.305
44β 0.134 0.576 2.200 0.017* 1.738 0.917 1.764 3.9E-4** 1.161 0.069 Interaction
12β 0.277 2.1E-5** -0.036 0.869 10.679 0.011* 0.143 0.199 -0.640 1.2E-4**
13β 0.099 0.088 0.551 0.013* 7.970 0.053 -0.043 0.695 0.100 0.504
14β -0.144 0.015* 1.656 1.4E-9** 1.825 0.647 0.003 0.976 0.519 0.001**
23β 0.097 0.119 1.866 5.1E-10** 8.741 0.048* -0.700 5.3E-7** -0.096 0.552
24β -0.162 0.008** 0.306 0.167 -2.286 0.579 0.378 0.002** -0.132 0.391
34β -0.028 0.625 -0.611 0.006** 6.324 0.117 -0.554 8.2E-6** -0.029 0.847 Regression 0.000** 0.000** 0.000** 0.000** 0.000** Lack of fit 0.064 0.055 0.588 0.061 0.094
2R 0.860 0.915 0.815 0.920 0.892 2adjR 0.810 0.884 0.749 0.892 0.853
2Q 0.764 0.848 0.735 0.838 0.788
a D3,2, BS , , and SDADHAacid palmitic CC : see Table 4.3 for explanation of abbreviations. b *, significant at α = 0.05; **, significant at α = 0.01.

126
Table 4.5 Correlation coefficients (R) among methods for assessing the physical and oxidative stability of infant formula emulsion. Methods D3,2
a BS SDADHAacid palmitic CC TOTOX value D3,2 1.000 0.330 0.678 -0.409 -0.329 BS 0.330 1.000 0.333 0.107 0.318 0.678 0.333 1.000 -0.290 -0.296
EPADHA
acid palmitic
CC
-0.409 0.107 -0.290 1.000 0.674
TOTOX value -0.329 0.318 -0.296 0.674 1.000 a D3,2, BS , , and SDADHAacid palmitic CC : see Table 4.3 for explanation of abbreviations.

127
Table 4.6 Expected and observed values for the model verification using a Chi-squared test. Lecithin (g/100 mL)
MAG a (g/100 mL)
LBG (g/100 mL)
CG (g/100 mL)
D3,2 (μm) BS (%) (Pa·S)
SDADHA
acid palmitic
CC
TOTOX
value
ef of ef of ef of ef of ef of 0.2 0.4 0.045 0.015 1.16 1.71 3.49 4.48 96.38 100.23 3.42 3.77 2.17 3.45 0.2 0.1 0 0.01 0.90 1.88 7.31 8.16 74.59 85.15 5.38 6.68 2.76 2.98 0.35 0.35 0.01 0.02 1.36 1.67 7.84 10.42 89.63 105.2 7.19 7.87 2.72 3.15 0.4 0.4 0 0 2.74 2.91 6.62 7.01 89.38 82.10 5.83 5.61 3.15 3.40 0.05 0.2 0.015 0.004 0.85 1.03 11.92 14.15 80.89 70.12 7.39 8.23 6.13 5.53
2 = eeo fff 2 1.46 1.66 6.38 0.52 0.92
a Abbreviations: MAG, LBG, CG, D3,2, BS , , and SDADHAacid palmitic CC : see Table 4.3 for explanation of abbreviations;
ef , expected response value; of , observed response value, n = 2.

128
Figure 4.1 Contour plots showing (A) the effect of monoacylglycerols (MAG) and lecithin on particle size, (B) the effect of carrageenan and locust bean gum (LBG) on optical change, (C) the effect of MAG and LBG on apparent viscosity, (D) the effect of lecithin and LBG on concentration ratio of palmitic acid to DHA and SDA, and (E) the effect of lecithin and carrageenan (CG) on TOTOX value, while keeping the left two independent variables constant, respectively.
Optical change (Lecithin: 0.2 g/100 mL; MAG: 0.2 g/100 mL)
B
LBG
(g/1
00 m
L)
CG (g/100 mL)
A
Leci
thin
(g/1
00 m
L)
MAG (g/100 mL)
Particle size (LBG: 0.02 g/100 mL; CG: 0.004g/100 mL)
Concentration ratio of palmitic acid to DHA and SDA
(MAG: 0.2 g/100 mL; CG: 0.004 g/100 mL)
D
LBG
(g/1
00 m
L)
Lecithin (g/100 mL)
Apparent viscosity (Lecithin: 0.2 g/100 mL; CG: 0.004g/100 mL)
C
LBG
(g/1
00 m
L)
MAG (g/100 mL)
TOTOX value (MAG: 0.2 g/100 mL; LBG: 0.02 g/100 mL)
E
CG
(g/1
00 m
L)
Lecithin (g/100 mL)

129
CHAPTER 5
OXIDATIVE STABILITY OF STRUCTURED LIPID-BASED INFANT FORMULA
EMULSION: EFFECT OF ANTIOXIDANTS1
1 Zou, L., and Akoh, C. C. Submitted to Journal of Agricultural and Food Chemistry, 05/20/14.

130
Abstract
The effect of permitted antioxidants, including α-tocopherol, β-carotene, ascorbyl
palmitate, ascorbic acid, citric acid, and their combinations, on the lipid oxidation of
structured lipid (SL)-based infant formula (IF) emulsion was evaluated. The oil-in-water
IF emulsion was formulated with a human milk fat analogue enriched with
docosahexaenoic acid and stearidonic acid, and the antioxidants were added at 0.005 and
0.02% of oil. The peroxide values, anisidine values, and hexanal concentrations of
emulsion samples stored in the dark at 37 °C were measured over a 28-day period. The
results showed that whether a compound exhibited antioxidant, neutral, or prooxidant
behavior depended on its mechanism of action, polarity, concentration, oxidation time,
method used to determine lipid oxidation, and environmental conditions (e.g., headspace
oxygen and pH). The most effective antioxidant was ascorbyl palmitate at 0.005%, and a
synergistic antioxidant effect was found between α-tocopherol and β-carotene. A high
correlation (r = 0.84) was observed between anisidine value and hexanal content. Our
findings have important implications for the successful incorporation of SL into IF
products for infant nutrition and health.
Keywords: lipid oxidation; antioxidant; structured lipid; infant formula; emulsion;
hexanal; stearidonic acid soybean oil

131
Introduction
With the increased use of polyunsaturated oils and fortification of mineral
nutrients (e.g., iron) for health benefits, lipid oxidation has become a major concern in
emulsion-based food products, such as milk, beverages, and ready-to-feed infant formula
(IF). It leads to the development of undesirable off-flavors, nutrient loss, and potentially
toxic compounds, thus making the foods unsuitable for consumption (McClements &
Decker, 2000). One of the most effective and convenient strategies to retard or prevent
lipid oxidation is to add antioxidants (Shahidi & Zhong, 2010).
According to the mechanisms of action, antioxidants can be broadly classified as
primary antioxidants which scavenge free radicals to break chain-reactions of oxidation,
or secondary antioxidants which protect lipids against oxidation mainly by chelating
transition metals, quenching singlet oxygen, replenishing hydrogen to primary
antioxidants, and/or scavenging oxygen (Reische, Lillard, & Eitenmiller, 2008).
Governed by Codex Alimentarius regulations (CAC, 1981), tocopherols, β-carotene,
ascorbic acid, ascorbyl palmitate, and citric acid are permitted compounds that may act as
antioxidants in regular milk-based IF. α-Tocopherol is an important lipophilic primary
antioxidant that protects by donating phenolic hydrogen to lipid free radicals (Eitenmiller
& Lee, 2004). Due to the presence of conjugated double bonds in the molecule, the lipid-
soluble β-carotene can act as primary antioxidant by scavenging free radicals under low
oxygen pressure or as secondary antioxidant by physically quenching singlet oxygen to
produce ground-state triplet oxygen and release the excess energy in the form of heat
(Reische et al., 2008). Water-soluble ascorbic acid represents a multifunctional
antioxidant that exerts its antioxidant effect via inactivation of free radicals, regeneration

132
of primary antioxidant by hydrogen donation, metal chelating, and scavenging oxygen by
reduction (Reische et al., 2008). Ascorbyl palmitate is the hydrophobic derivative of
ascorbic acid, but its antioxidant ability is still based on the ascorbic acid group. Citric
acid with multiple carboxyl groups is capable of inhibiting metal-catalyzed oxidation by
forming a thermodynamically stable complex with transition metal ions (Decker, 2008).
Moreover, combinations of antioxidants with different mechanisms of action, such as α-
tocopherol/ascorbic acid, α-tocopherol/citric acid, and α-tocopherol/β-carotene, have
been reported to exhibit synergistic antioxidant effects (Decker, 2008; Eitenmiller et al.,
2004).
Oil-in-water (O/W) emulsion is often more susceptible to oxidation than bulk oil
due to its larger surface area that promotes interactions between the lipids and water-
soluble prooxidants (Waraho, McClements, & Decker, 2011). Oxidative reactions are
believed to be mostly prevalent at the oil-water interface (McClements et al., 2000).
Therefore, in addition to its innate potency, the effectiveness of an antioxidant is
influenced by its polarity and solubility, which subsequently determine its actual location
in O/W emulsion. With respect to interfacial phenomenon, “polar paradox theory” was
proposed, which states that polar antioxidants are more effective in less polar media, such
as bulk oil, whereas nonpolar antioxidants are more effective in more polar media, such
as O/W emulsion (Porter, 1993). The high efficacy of nonpolar antioxidants in O/W
emulsion is primarily attributed to their high affinity to orient toward the oil-water
interface. However, new evidence suggests that this empirical observation seems to be a
particular case of a much wider picture, and more complex factors (e.g., critical
concentration) in addition to polarity should be considered to explain antioxidant efficacy

133
(Shahidi & Zhong, 2011). Furthermore, compounds with antioxidant activity may also
exhibit prooxidant behavior under certain conditions (Osborn-Barnes & Akoh, 2003b).
Huang, Frankel, and German (1994) reported that whether α-tocopherol acted as an
antioxidant or prooxidant depended on the test system, concentration, oxidation time, and
the method used to determine oxidation. Therefore, all relevant factors must be taken into
account when selecting antioxidants for a particular food system, and experiments should
be performed before adding them as functional ingredients.
In our previous study (Zou & Akoh, 2013b), a human milk fat analogue enriched
with docosahexaenoic acid (DHA) and stearidonic acid (SDA), which has potential to
benefit the development and growth of infants, was synthesized and incorporated into an
actual food system―ready-to-feed IF containing dairy proteins, lactose, lipid, vitamins,
minerals, and other nutrients. The emulsifiers and thickeners were optimized to achieve
the highest physical and oxidative stability. However, since lipid oxidation in O/W
emulsion cannot be controlled by just the emulsifiers and thickeners, antioxidants are
needed to further protect against rancidity, and their effectiveness in IF with complex
matrices (e.g., metals and emulsifiers), which may interact with antioxidants and affect
the rate of oxidation, is necessary to be assessed. Moreover, the oxidative stability of
structured lipids (SLs) in real foods has seldom been investigated in the literature
(Martin, Reglero, & Senorans, 2010). Therefore, as a continuation of our previous work,
the objective of this study was to evaluate the effect of permitted antioxidants, including
α-tocopherol, β-carotene, ascorbic acid, ascorbyl palmitate, and citric acid, on the lipid
oxidation of SL-based IF emulsion (O/W). Mixtures of α-tocopherol/ascorbic acid, α-

134
tocopherol/ascorbyl palmitate, α-tocopherol/citric acid, and α-tocopherol/β-carotene,
were also tested to clarify the mechanism of antioxidant synergism.
Materials and Methods
Materials
Tripalmitin was purchased from TCI America (Portland, OR, USA). SDA
soybean oil was kindly donated by Monsanto Co. (St. Louis, MO, USA). DHA single-cell
oil containing 40% DHA was purchased from DSM Nutritional Products Ltd. (Columbia,
MD, USA). sn-1,3 Specific lipase Lipozyme TL IM and nonspecific lipase Novozym 435
were obtained from Novozymes A/S (Bagsvaerd, Denmark). α-Tocopherol (≥ 96%
purity), β-carotene (95% purity), ascorbic acid, ascorbyl palmitate, citric acid (≥ 99.5%
purity), C7-C30 saturated alkanes, and Tenax porous polymer adsorbent (60-80 mesh)
were purchased from Sigma-Aldrich Chemical Co. (St. Louis, MO, USA). Hexanal (98%
purity) and n-butyl acetate (≥ 99.5% purity) were obtained from Alfa Aesar (Ward Hill,
MA, USA). Commercial milk-based Similac Advance ready-to-feed IF (Abbott Nutrition,
Lake Forest, IL, USA) was purchased from a local convenience store. The DHA and
SDA containing SL, which mimicked human milk fat, was enzymatically produced as
previously reported (Zou & Akoh, 2013a). All the solvents were of analytical grade, and
purchased from J.T. Baker Chemical Co. (Phillipsburg, NJ, USA) or Fisher Scientific
(Norcross, GA, USA).
Preparation of Emulsion Samples
The SL-based IF emulsion consisting of 3.5% lipid at pH 6.8 was prepared
according to the optimal formulation and procedures described by Zou et al. (2013b).
Antioxidants were added to the emulsion system at 0.02% or 0.005% of the oil. Mixed

135
antioxidant systems contained equal amounts (0.01 % of the oil) of the antioxidant. α-
Tocopherol in hexane was added directly to the oil phase before homogenization.
Ascorbyl palmitate was dissolved in ethanol and then added to the oil. β-Carotene was
dissolved in hexane before addition to the oil. Organic solvents were evaporated under
nitrogen. Ascorbic acid and citric acid were added to the aqueous phase before
homogenization. The sample without addition of antioxidants was used as a “control,”
whereas the sample without addition of antioxidants but flushed under nitrogen was used
as another control, named “control-N2.” The commercial ready-to-feed IF was regarded
as a “reference.”
Oxidation Experiments
The oxidative stability was studied by means of an accelerated storage, which is
commonly used to obtain reliable information on product stability. Emulsion samples (50
mL) were placed in capped glass bottles, covered with Parafilm, and allowed to oxidize
in a covered water bath at 37 °C for 4 weeks. The primary and secondary oxidation
products were measured after 0, 7, 14, 21, and 28 days of storage.
Spectroscopic Measurements of Lipid Oxidation Products
Lipid hydroperoxide, measured as peroxide value (PV), was determined using a
modified method of Shanta and Decker (1994). The analytical procedure was performed
as described previously (Zou et al., 2013b). p-Anisidine value (AV) determines the
amount of aldehydes (mainly 2-alkenals and 2,4-alkadienals), which are secondary
products from the decomposition of hydroperoxides. The AV of emulsion samples (2
mL) was determined according to the AOCS Official Method Cd 18-90 (AOCS, 2009)
with minor modifications as reported previously (Zou et al., 2013b).

136
Identification of Volatile Oxidation Products by Dynamic Headspace Gas
Chromatography-Mass Spectrometry (GC-MS)
Volatile compounds after oxidation were analyzed using a modified method
described previously (Yang, Lee, Jeong, Kim, & Kays, 2008). Briefly, emulsion samples
(100 mL) were stirred in a specially constructed 1 L glass beaker at 25 °C for 30 min.
The beaker was sealed with a ground glass lid containing entry and exit ports, which were
wrapped with aluminum foil to minimize losses during sampling. Immediately after
stirring, volatiles were then collected on a 10 cm × 4 mm i.d. stainless-steel Tenax trap
(Scientific Instrument Services, Inc., Ringoes, NJ, USA) filled with 250 mg Tenax
porous polymer adsorbent, using an air sampling pump. Air was purified using a charcoal
filter connected to the entry port and passed through the beaker at 150 mL/min for 60
min. A 50 mL Erlenmeyer flask was placed between the exit port and the trap to collect
any condensation.
After sampling, the Tenax trap was loaded on TD-5 automated short-path thermal
desorption system (Scientific Instrument Services, Inc.), which was connected to the
injection port of 6890N/5973 GC-MS (Agilent Technologies Inc., Santa Clara, CA,
USA). The volatiles were desorbed from the Tenax trap at 250 °C for 5 min with helium
at a flow rate of 10 mL/min and then collected on the first 4 cm of the GC column using a
SIS 2-inch cryo-trap (−40 °C) (Scientific Instrument Services, Inc.). After desorption, the
cryo-trap was rapidly heated to 200 °C, and the GC separation was achieved with a 30 m
× 0.25 mm i.d., 0.25 μm film thickness, J&W DB-5ms fused silica capillary column
(Agilent Technologies Inc.). The column temperature was initially maintained at 40 °C,
then increased at 1.5 °C/min to 65 °C and held for 1 min, next at 2 °C/min to 120 °C for 1

137
min, and finally programmed at 15 °C/min to 280 °C for 5 min (total 61.83 min). Carrier
gas was helium with purity above 99.999%, and the flow rate was set at 1 mL/min. The
injector temperature was maintained at 225 °C, and a split ratio of 0.5:1 was employed.
MS detection was performed on a single-quadrupole mass spectrometer in full scan
electron impact ionization mode, and conditions were as follows: ion source, 230 °C;
electron energy, 70 eV; transfer line, 280 °C; quadrupole, 150 °C; m/z range, 35-350;
solvent delay, 0 min.
The volatiles were tentatively identified by comparing their mass spectra and
relative abundances with NIST 02 and Wiley 7 spectral libraries. Identifications were
further confirmed by comparing Kovats retention indices with those reported previously
in the literature using similar GC column and temperature program
(http://webbook.nist.gov/). Retention indices were calculated by running a standard of
C7-C30 saturated alkanes under the same conditions as samples.
Hexanal Analysis by Solid Phase Microextraction (SPME)-GC
Four milliliters of emulsion samples were placed in 40 mL headspace vials, and
10 μL of 50 ug/mL butyl acetate in deionized water was added as an internal standard.
The vials were sealed with polytetrafluoroethylene/silicone septa and polypropylene open
top caps. The samples were equilibrated with magnetic stirring (500 rpm) at 25 °C for 30
min. Then a preconditioned (250 °C for 30 min) 65 μm thickness polydimethylsiloxane/
divinylbenzene (PDMS/DVB) SPME fiber (Sigma-Aldrich Chemical Co.) was manually
injected into the vial headspace at a fixed position and exposed for additional 10 min at
25 °C to adsorb volatiles. Immediately after sampling, the fiber was thermally desorbed
at 250 °C for 5 min in the GC injection port, which was initially kept at splitless mode for

138
3 min and then switched to split mode for another 2 min to prevent carry-over from run to
run. The purge flow to split vent was set at 40 mL/min.
Hexanal was measured using a 5890 Series II GC system (Agilent Technologies
Inc.), which was equipped with a 0.75 mm i.d. narrow bore inlet liner, a 30 m × 0.32 mm
i.d., 1 μm film thickness, J&W DB-5 capillary column, merlin microseal septum, and a
flame ionization detector. As the diameter of injection port liner used can affect peak
width, a narrow 0.75 i.d. inlet liner was used to make peaks sharper. The merlin
microseal septum was used to minimize injection failure. The carrier gas was helium at a
constant flow of 1.2 ml/min. The oven temperature was initially kept at 40 °C for 5 min,
followed by an increase of 10 °C/min to 150 °C, then an increase of 25 °C/min to 250 °C
and held for 5 min to clean the column. The FID temperature was 250 °C. Hexanal was
quantified using a matrix-matched internal standard calibration curve by plotting peak-
area ratio of hexanal to butyl acetate against hexanal concentration over the range of
0.001-10 μg/mL in a fresh IF matrix. The unspiked and spiked standard solutions were
subjected to the same analysis procedures as described for the emulsion samples. The
linearity of the calibration curve was determined by least-squares linear regression
analysis. The method accuracy was evaluated by analyzing five replicate samples spiked
with hexanal at 1 μg/mL, and the recovery rate was reported. The intra-day and inter-day
precisions, expressed as relative standard deviation, were determined by analyzing five
replicate samples on a single day and on different days, respectively. The limit of
detection (LOD) and quantification (LOQ) were determined by measuring a series of
matrix-matched standards until the signal-to-noise ratios were ≥ 3 and ≥ 10, respectively.

139
Fat Extraction and Fatty Acid Profile
The Bligh and Dyer protocol was used to extract the fat from liquid IF samples,
following the procedures previously reported (Teichert & Akoh, 2011). The extracted fat
was then analyzed for total fatty acid and positional profiles as described previously
(Teichert et al., 2011; Zou et al., 2013a).
Oxidative Stability Analysis by Differential Scanning Calorimetry (DSC)
The oxidative stabilities of SL-based IF with optimized formulation and
commercial IF were evaluated and compared on the basis of oxidation induction time
(OIT) using 204 F1 Phoenix DSC (Netzsch Group, Burlington, MA, USA). Oxygen was
used as the purge gas at a rate of 20 mL/min. Liquid samples (about 10 mg) were placed
in a crimped aluminum sample pan, and the lid was pierced with two pinholes to facilitate
contact with oxygen. The temperature was maintained isothermally at 80 °C for 60 min.
Statistical Analysis
All the experiments were conducted on duplicate samples. The effect of different
antioxidants on lipid oxidation over time was evaluated by two-way repeated measures
ANOVA of fixed-effects models, using SAS software, version 9.2 (SAS Institute Inc.,
Cary, NC, USA). Duncan’s multiple-range test was performed to determine significant
differences of the measurements on the same day (α = 0.05). The relationships of PV,
AV, and hexanal concentration were determined by Pearson correlation analysis, and
Pearson correlation coefficient (r) was reported.

140
Results and Discussion
Volatile Oxidation Products in IF
As can be seen from Figure 5.1A and Table 5.1, a complex mixture of secondary
lipid oxidation volatiles, including 12 aldehydes, 4 ketones, 3 furans, 2 alcohols, 2
aromatics, 2 sulfides, 2 alkenes and 1 terpene, was generated in SL-based IF after 4-week
storage. These flavor volatiles, which play important roles in the organoleptic perception
of IF products, probably derive from Maillard reactions and lipid autoxidation during
sterilization processing and/or storage. Most of the compounds have been previously
identified in the headspace of IF products (Fenaille, Visani, Fumeaux, Milo, & Guy,
2003; Hausner, Philipsen, Skov, Petersen, & Bredie, 2009; van Ruth, Floris, & Fayoux,
2006). Hausner et al. (2009) indicated that substantial differences were present among
different brands, formula types (e.g., powder and ready-to-feed), and/or different matrices
(e.g., milk-based and hydrolyzed milk protein-based) of IF products. Among the 28
volatiles identified (Figure 5.1A), hexanal (no. 5) was the most abundant chemical,
followed by 2-ethylfuran (no. 1), 2-pentylfuran (no. 19), and D-limonene (no. 23).
Hexanal with a green, grassy, fatty aroma (Table 5.1) arises from the oxidation of n-6
polyunsaturated fatty acids (PUFAs) (Romeu-Nadal, Castellote, & Lopez-Sabater, 2004),
especially linoleic acid which is abundant in IF. Consistent with the previous results
(Fenaille et al., 2003; Hausner et al., 2009; van Ruth et al., 2006), propanal which is
considered to be a major breakdown product of n-3 PUFAs (Romeu-Nadal et al., 2004),
was not found in our study, albeit a significant amount of DHA and SDA was
incorporated (Table 5.2). These observations demonstrated that oxidation of single
molecules does not correlate well with that of food systems with complex matrices.

141
Jimenez-Alvarez et al. (2008) also found that not all the volatile compounds detected
during the oxidation of tri-DHA standard were observed in milk containing cod oil during
storage. 2-Ethylfuran and 2-pentylfuran may derive from the degradation of 2,4-
heptadienal and 2,4-decadienal and/or Maillard reactions (e.g., Strecker degradation)
(Hausner et al., 2009). D-limonene, the only terpene identified in our study, probably
originates from the forage of the cows via the food chain (Hausner et al., 2009). Due to
the high level and a low odor threshold of 4.5 μg/kg in water (Table 5.1), hexanal was
chosen as a marker to evaluate lipid oxidation in SL-based IF during storage.
Hexanal Analysis by SPME-GC
A SPME-GC method was developed to quantify hexanal in IF samples.
According to the SPME manufacturer, PDMS/DVB fiber was selected on the basis of its
capacity and sensitivity to small polar and nonpolar molecules. The addition of salt (e.g.,
NaCl) to aqueous samples prior to SPME extraction is frequently used to decrease the
solubility of volatiles in the aqueous phase and drive them into the headspace. However,
this “salting out” step was not carried out due to its insignificant enhancement on the
relatively nonpolar hexanal extraction (data not shown). A low temperature of 25 °C was
used during equilibration and sampling to avoid heat-related alterations. It should be
noted that SPME quantification is feasible in non-equilibrium situations once the
agitation conditions and adsorption time are held constant (Ai, 1997). Therefore,
provided sensitivity is accepted, a short equilibration and sampling time, rather than
exhaustive extraction, can be used for quantitative analysis of hexanal. Butyl acetate was
used as an internal standard to compensate for the losses of hexanal during sample
preparation and injection and facilitate identification of the analyte. Figure 5.1B shows

142
that hexanal and butyl acetate were baseline separated. To correct for matrix effects, a set
of aliquots of fresh IF samples with increased amounts of hexanal was used as standards
for calibration. Good linearity (R2 = 0.9909) was observed over a concentration range of
0.001-10 μg/mL for the calibration curve. The LOD and LOQ were found to be 0.4 and 4
ng, respectively, which are comparable to the values reported by other authors (Garcia-
Llatas, Lagarda, Romero, Abellan, & Farre, 2007). An acceptable recovery percentage
ranging from 104.3-123.0% was obtained. The intra-day and inter-day precisions were
1.4 and 4.0%, respectively, which shows good repeatability of the method. All these
validated parameters demonstrated that the developed SPME-GC method is reliable,
sensitive, and convenient as a routine technique to determine hexanal in IF products.
Effect of Antioxidants
Comparison of Control Samples
As can be seen from Figures 5.2 and 5.3, primary and secondary oxidation
products in the control samples with nitrogen flushing was lower than the corresponding
control samples without nitrogen treatments after 7 days of storage, and the difference
increased with incubation time. This may be due to the displacement of headspace
oxygen by inert nitrogen to decrease the rate of lipid autoxidation. It indicates that
nitrogen flushing can be an effective technique to protect IF products against oxidation.
We observed a longer induction period of primary and secondary lipid oxidations in the
commercial IF references compared to SL-based samples. There are two possible
explanations. First, a significant amount of labile fatty acids, including C18:3n-6,
C18:3n-3, C18:4n-3, and C22:6n-3, were incorporated in the SL-based samples compared
to the commercial product (Table 5.2). Second, the variance in their compositions, such

143
as emulsifiers, minerals, and antioxidants, may also contribute to the difference in the
oxidative stability.
Antioxidant Effects at a Low Addition Level
At a level of 0.005%, no significant difference (p > 0.05) was found in lipid
hydroperoxide concentrations among α-tocopherol, β-carotene, and citric acid during the
entire incubation period (Figure 5.2A). Their antioxidant effects were observed between
7 to 21 days. Ascorbyl palmitate exhibited strong antioxidant effect after 14 days of
oxidation, whereas the hydrophilic counterpart, ascorbic acid, showed a small antioxidant
activity between 7 to 14 days and prooxidant activity after 21 days of incubation.
Sorensen et al. (2011) reported similarly that ascorbic acid in O/W emulsion (5% oil) at
pH 7 was efficient at the beginning of storage and acted as a prooxidant towards the end.
The prooxidative effect of ascorbic acid on the basis of hydroperoxide formation may be
ascribed to its ability to reduce transition metal ions (e.g., Cu2+ and Fe3+) that are
abundant in IF as mineral nutrients. The reduced metal ions have high abilities to initiate
metal-catalyzed lipid oxidation in the presence of oxygen and produce singlet oxygen and
hydroxyl radical (Kiokias, Varzakas, Arvanitoyannis, & Labropoulos, 2010) which
further promote the formation of hydroperoxides.
On the basis of AVs, no antioxidant effect was observed for α-tocopherol and
citric acid (Figure 5.2B). Ascorbic acid showed a little antioxidant activity between 14 to
28 days, whereas β-carotene and ascorbyl palmitate, exhibited antioxidant effect after 21
days of oxidation. It appears that lipophilic ascorbyl palmitate was more active than
hydrophilic ascorbic acid as an antioxidant in IF emulsion on the basis of PV and AV
measurements, which is in agreement with the “polar paradox theory” (Porter, 1993).

144
On the basis of hexanal formation, no significant difference (p > 0.05) was found
between ascorbic acid and ascorbyl palmitate during the entire incubation period (Figure
5.2C). Moreover, all the compounds except citric acid exhibited antioxidant activities
after 21-day storage. Osborn-Barnes and Akoh (2003a) also reported that citric acid did
not significantly affect the oxidation rate in O/W model emulsion formulated with 10%
canola oil/caprylic acid SLs at pH 7. The inefficacy of citric acid on the primary and
secondary oxidation (Figure 5.2) can be explained by its week interaction with transition
metal ions. As the pH of emulsion (6.8) approaches the pKa of citric acid (6.4), its
carboxylic groups are not fully ionized and thus the chelating activity decreases. Another
possible explanation may be the presence of other metal ions (e.g., calcium) in IF that can
compete with the prooxidative metal ions for the binding sites of citric acid.
Antioxidant Effects at a High Addition Level
In contrast to the addition level at 0.005%, no antioxidant effect was observed for
all evaluated compounds at 0.02% on the basis of PVs and AVs (Figure 5.3A and B). No
significant difference (p > 0.05) was found in the PVs and AVs among ascorbic acid,
ascorbyl palmitate, and citric acid. Both α-tocopherol and β-carotene showed prooxidant
effects on primary and secondary oxidations (AVs) after 28 days of storage. This finding
is consistent with that of Osborn-Barnes et al. (2003b), who reported that α-tocopherol
and β-carotene at 0.02% exhibited prooxidant activities in SL-based O/W model
emulsion stabilized with sucrose fatty acid ester. The prooxidative effect of α-tocopherol
at high concentrations may be mainly attributed to its synergism with prooxidants already
in the system, such as transition metal ions, high initial levels of hydroperoxides, and
reactive oxygen species (Kamal-Eldin & Appelqvist, 1996). The prooxidant chemistry of

145
β-carotene is highly related to its electron-rich structure with a conjugated polyene chain,
which is susceptible to attack from electrophilic reagents, such as lipid peroxyl radicals.
The antioxidant efficacy of β-carotene depends on the balance between its radical
trapping and autoxidation. At a high concentration, autoxidation reactions in the presence
of oxygen are favored to consume β-carotene without scavenging peroxyl radicals,
allowing its prooxidant activity to predominate (Decker, 2008; Osborn-Barnes et al.,
2003b). Therefore, it is likely that each antioxidant has a critical concentration in a
specific matrix for maximum efficacy. Below the critical concentration, the antioxidant
effect is below the optimum, and above which the prooxidant effect may dominate,
probably by synergizing with other prooxidants present in the substrate. However, more
research is required to confirm this hypothesis.
On the basis of hexanal formation, ascorbyl palmitate and α-tocopherol showed
antioxidant activities at 0.02% after 21-day incubation (Figure 5.3C), and ascorbyl
palmitate was more effective than α-tocopherol. Ascorbic acid, citric acid, and β-carotene
exhibited small antioxidant effects between 14 to 28 days.
Antioxidant Synergism
As shown in Figure 5.4, PV, AV, and hexanal concentration were significantly
lower (p < 0.05) in samples with α-tocopherol/β-carotene mixture than those with α-
tocopherol or β-carotene alone after 28-day storage. In other words, the mixture of α-
tocopherol and β-carotene showed a strong synergistic effect in inhibiting lipid oxidation.
Heinonen, Haila, Lampi, and Piironen (1997) also found a synergistic effect of α-
tocopherol and β-carotene on oxidation in 10% O/W emulsion of rapeseed oil. Two
mechanisms may be considered to explain the synergism of α-tocopherol and β-carotene.

146
First, a cycle is operated to regenerate tocopherols from tocopheroxyl radicals by
interaction with β-carotene (Eitenmiller et al., 2004). Second, α-tocopherol protects β-
carotene from being autoxidized (Kiokias et al., 2010). However, no antioxidant
synergism was observed among mixtures of α-tocopherol/ascorbic acid, α-
tocopherol/ascorbyl palmitate, and α-tocopherol/citric acid. It has been proposed that the
synergistic effect of tocopherols with other antioxidants is mainly due to regeneration of
tocopherols from tocopheroxyl radicals by hydrogen donation, thus preventing
tocopheroxyl radicals from propagating lipid autoxidation (Decker, 2008; Eitenmiller et
al., 2004). However, antioxidants like ascorbic acid and ascorbyl palmitate may have
other independent antioxidative potentials (e.g., inactivating free radicals and scavenging
oxygen), which are hypothesized to be predominant in IF products, rather than
replenishing hydrogen to tocopherols. Therefore, no significant synergism could be
observed between these antioxidants and α-tocopherol. The inefficiency of citric acid as a
chelator in our study could explain its week interaction with α-tocopherol for a
synergistic antioxidant effect.
Antioxidant Selection
The most effective antioxidant in inhibiting lipid oxidation of SL-based IF
emulsion was ascorbyl palmitate at 0.005%, as determined by PV, AV, and hexanal
content. Jacobsen, Let, Nielsen, and Meyer (2008) also reported that ascorbyl palmitate
seemed to work best at low concentrations in fish oil-enriched milk with 1.5% fat, rather
than in other tested food systems, including milk drink, salad dressing, and mayonnaise.

147
Correlations of Oxidation Measurements
Due to the measurements of different stages of oxidation, both AV and hexanal
content did not correlate well with PV (r = 0.50 and 0.35, respectively). However, a
highly significant positive correlation (r = 0.84, p < 0.0001) was found between AV and
hexanal concentration, which also demonstrated the adequacy of headspace hexanal
analysis to indicate secondary lipid oxidation in IF emulsion. The high correlation
between AV and hexanal analysis has also been reported in the shelf-life evaluation of
nuts and frying oils (Tompkins & Perkins, 1999; Zajdenwerg, Branco, Alamed, Decker,
& Castro, 2011).
Oxidative Stability of IF Products Measured by DSC
Oxidation reactions are exothermic and thus can be measured by DSC. OIT
measures oxidative stability of the materials in an isothermal mode (temperature) under
an accelerated oxidative environment. It can be determined by intersection of
extrapolated baseline and tangent line of the exothermic curve. The higher the OIT value,
the more stable the substrate. As shown in Figure 5.5, the exothermic peak of SL-based
and commercial IF appeared after oxidation for 32.9 and 34.0 min, respectively. The
shorter OIT of SL-based IF compared to the commercial product is possibly due to the
differences in the composition, such as lipid unsaturation (Table 5.2), type and level of
antioxidants, emulsifiers, and minerals. In addition, a good agreement of the results with
PV, AV, and hexanal content (Figures 5.2 and 5.3) suggests that DSC technique is
suitable for oxidation studies of liquid IF products.
In conclusion, the efficacy of permitted compounds as antioxidants in SL-based
IF emulsion depends not only on their mechanism of action, but also on polarity,

148
concentration, oxidation time, method used to determine lipid oxidation, and
environmental conditions (e.g., headspace oxygen and pH). A synergistic antioxidant
effect was found between α-tocopherol and β-carotene. A high correlation between
anisidine value and hexanal content indicates the goodness of hexanal analysis by SPME-
GC as an indicator of flavor deterioration in IF products. The most effective antioxidant
was ascorbyl palmitate at 0.005%. However, compared to the commercial ready-to-feed
IF, our SL-lipid product was slightly less stable on the basis of DSC measurement, but
that was due to the high incorporation of unsaturated fatty acids (e.g., DHA and SDA).
Nitrogen flushing may be used as a supplemental technique to further protect against
oxidation. Overall, this study has important implications for the successful development
of SL-based IF products for infant nutrition and health.
Acknowledgments
This project was supported by Agriculture and Food Research Initiative
Competitive Grant 2009-65503-05734 from the USDA National Institute of Food and
Agriculture. We thank Monsanto Co. for providing the SDA soybean oil. We also thank
Professor Stanley J. Kays from Department of Horticulture, the University of Georgia for
his valuable assistance with volatiles analysis by dynamic headspace GC-MS.

149
References
Ai, J. (1997). Solid phase microextraction for quantitative analysis in nonequilibrium
situations. Analytical Chemistry, 69(6), 1230-1236.
AOCS. (2009). Official methods and recommended practice of the American Oil
Chemists' Society. Method Cd 18-90. Champaign, IL: AOCS.
Buttery, R. G., Turnbaugh, J. G., & Ling, L. C. (1988). Contribution of volatiles to rice
aroma. Journal of Agricultural and Food Chemistry, 36(5), 1006-1009.
CAC (Codex Alimentarius Commission). (1981). Standard for infant formula and
formulas for special medical purposes intended for infants. Retrieved from
http://www. codexalimentarius.org/download/standards/288/CXS_072e.pdf.
Accessed 06.12.14.
Decker, E. A. (2008). Antioxidant mechanisms. In C. C. Akoh & D. B. Min (Eds.), Food
lipids: Chemistry, nutrition, and biotechnology, (3rd ed.), (pp. 475-492). Boca
Raton, FL: CRC Press.
Eitenmiller, R. R. & Lee, J. (2004). Oxidation and the role of vitamin E as an antioxidant
in foods. In R. R. Eitenmiller & J. Lee (Eds.), Vitamin E: Food chemistry,
composition, and analysis (pp. 89-135). New York, NY: Marcel Dekker, Inc.
Fenaille, F., Visani, P., Fumeaux, R., Milo, C., & Guy, P. A. (2003). Comparison of mass
spectrometry-based electronic nose and solid phase microextraction gas
chromatography-mass spectrometry technique to assess infant formula oxidation.
Journal of Agricultural and Food Chemistry, 51(9), 2790-2796.
Garcia-Llatas, G., Lagarda, M. J., Romero, F., Abellan, P., & Farre, R. (2007). A
headspace solid-phase microextraction method of use in monitoring hexanal and

150
pentane during storage: Application to liquid infant foods and powdered infant
formulas. Food Chemistry, 101(3), 1078-1086.
Huang, S. W., Frankel, E. N., & German, J. B. (1994). Antioxidant activity of α- and γ-
tocopherols in bulk oils and in oil-in-water emulsions. Journal of Agricultural and
Food Chemistry, 42(10), 2108-2114.
Hausner, H., Philipsen, M., Skov, T. H., Petersen, M. A., & Bredie, W. L. P. (2009).
Characterization of the volatile composition and variations between infant
formulas and mother's milk. Chemosensory Perception, 2(2), 79-93.
Heinonen, M., Haila, K., Lampi, A. M., & Piironen, V. (1997). Inhibition of oxidation in
10% oil-in-water emulsions by β-carotene with α- and γ-tocopherols. Journal of
the American Oil Chemists’ Society, 74(9), 1047-1052.
Jacobsen, C., Let, M. B., Nielsen, N. S., & Meyer, A. S. (2008). Antioxidant strategies
for preventing oxidative flavour deterioration of foods enriched with n-3
polyunsaturated lipids: A comparative evaluation. Trends in Food Science &
Technology, 19(2), 76-93.
Jimenez-Alvarez, D., Giuffrida, F., Golay, P. A., Cotting, C., Destaillats, F., Dionisi, F.,
et al. (2008). Profiles of volatile compounds in milk containing fish oil analyzed
by HS-SPME-GC/MS. European Journal of Lipid Science and Technology,
110(3), 277-283.
Kamal-Eldin, A., & Appelqvist, L. A. (1996). The chemistry and antioxidant properties
of tocopherols and tocotrienols. Lipids, 31(7), 671-701.

151
Kiokias, S., Varzakas, T. H., Arvanitoyannis, I. S., & Labropoulos A. E. (2010). Lipid
oxidation and control of oxidation. In F. Yildiz (Ed.), Advances in food
biochemistry, (pp. 383-408). Boca Raton, FL: CRC Press.
Martin, D., Reglero, G., & Senorans, F. J. (2010). Oxidative stability of structured lipids.
European Food Research and Technology, 231(5), 635-653.
McClements, D. J., & Decker, E. A. (2000). Lipid oxidation in oil-in-water emulsions:
Impact of molecular environment on chemical reactions in heterogeneous food
systems. Journal of Food Science, 65(8), 1270-1282.
Milo, C., & Grosch, W. (1993). Changes in the odorants of boiled trout (Salmo fario) as
affected by the storage of the raw material. Journal of Agricultural and Food
Chemistry, 41(11), 2076-2081.
Osborn-Barnes, H. T., & Akoh, C. C. (2003a). Copper-catalyzed oxidation of a structured
lipid-based emulsion containing α-tocopherol and citric acid: Influence of pH and
NaCl. Journal of Agricultural and Food Chemistry, 51(23), 6851-6855.
Osborn-Barnes, H. T., & Akoh, C. C. (2003b). Effects of α-tocopherol, β-carotene, and
soy isoflavones on lipid oxidation of structured lipid-based emulsions. Journal of
Agricultural and Food Chemistry, 51(23), 6856-6860.
Peres, C., Denoyer, C., Tournayre, P., & Berdague, J. L. (2002). Fast characterization of
cheeses by dynamic headspace-mass spectrometry. Analytical Chemistry, 74(6),
1386-1392.
Porter, W. L. (1993). Paradoxical behavior of antioxidants in food and biological
systems. Toxicology and Industrial Health, 9(1-2), 93-122.

152
Reische, D. W., Lillard, D. A., & Eitenmiller, R. R. (2008). Antioxidants. In C. C. Akoh
& D. B. Min (Eds.), Food lipids: Chemistry, nutrition, and biotechnology, (3rd
ed.), (pp. 409-430). Boca Raton, FL: CRC Press.
Romeu-Nadal, A., Castellote, A. I., & Lopez-Sabater, M. C. (2004). Headspace gas
chromatographic method for determining volatile compounds in infant formulas.
Journal of Chromatography A, 1046(1-2), 235-239.
Shahidi, F., & Zhong, Y. (2010). Lipid oxidation and improving the oxidative stability.
Chemical Society Reviews, 39(11), 4067-4079.
Shahidi, F., & Zhong, Y. (2011). Revisiting the polar paradox theory: A critical
overview. Journal of Agricultural and Food Chemistry, 59(8), 3499-3504.
Shantha, N. C., & Decker, E. A. (1994). Rapid, sensitive, iron-based spectrophotometric
methods for determination of peroxide values of food lipids. Journal of AOAC
International, 77(2), 421-424.
Sorensen, A. D. M., Nielsen, N. S., Decker, E. A., Let, M. B., Xu, X., & Jacobsen, C.
(2011). The efficacy of compounds with different polarities as antioxidants in
emulsions with omega-3 lipids. Journal of the American Oil Chemists’ Society,
88(4), 489-502.
Teichert, S. A., & Akoh, C. C. (2011). Modifications of stearidonic acid soybean oil by
enzymatic acidolysis for the production of human milk fat analogues. Journal of
Agricultural and Food Chemistry, 59(24), 13300-13310.
Tompkins, C., & Perkins, E. G. (1999). The evaluation of frying oils with the p-anisidine
value. Journal of the American Oil Chemists’ Society, 76(8), 945-947.

153
Triqui, R., & Bouchriti, N. (2003). Freshness assessments of Moroccan sardine (Sardina
pilchardus): Comparison of overall sensory changes to instrumentally determined
volatiles. Journal of Agricultural and Food Chemistry, 51(26), 7540-7546.
van Ruth, S. M., Floris, V., & Fayoux, S. (2006). Characterisation of the volatile profiles
of infant formulas by proton transfer reaction-mass spectrometry and gas
chromatography-mass spectrometry. Food Chemistry, 98(2), 343-350.
Waraho, T., McClements, D. J., & Decker, E. A. (2011). Mechanisms of lipid oxidation
in food dispersions. Trends in Food Science & Technology, 22(1), 3-13.
Yang, D. S., Lee, K. S., Jeong, O. Y., Kim, K. J., & Kays, S. J. (2008). Characterization
of volatile aroma compounds in cooked black rice. Journal of Agricultural and
Food Chemistry, 56(1), 235-240.
Zajdenwerg, C., Branco, G. F., Alamed, J., Decker, E. A., & Castro, I. A. (2011).
Correlation between sensory and chemical markers in the evaluation of Brazil nut
oxidative shelf-life. European Food Research and Technology, 233(1), 109-116.
Zou, L., & Akoh, C. C. (2013a). Identification of tocopherols, tocotrienols, and their fatty
acid esters in residues and distillates of structured lipids purified by short-path
distillation. Journal of Agricultural and Food Chemistry, 61(1), 238-246.
Zou, L., & Akoh, C. C. (2013b). Characterisation and optimisation of physical and
oxidative stability of structured lipid-based infant formula emulsion: Effects of
emulsifiers and biopolymer thickeners. Food Chemistry, 141(3), 2486-2494.

154
Table 5.1 Volatile Oxidation Compounds of Structured-Lipid Based Infant Formula Identified by Dynamic Headspace GC-MS No.a compound RIb identificationc odor descriptiond thresholde
(μg/kg) aldehydes
2 pentanal 714 MS,RI woody, pungent, fruity 12 5 hexanal 793 MS,RI green, grassy, fatty 4.5 7 trans-2-hexenal 836 MS,RI fatty, green 17
11 cis-4-heptenal 888 MS biscuit-like, fatty, fishy 0.06 12 heptanal 891 MS,RI fatty, woody 3 14 trans-2-heptenal 939 MS soapy, tallowy 13 15 benzaldehyde 943 MS,RI bitter almond, aromatic, sweet 350 22 trans, trans-2,4-
heptadienal 999 MS fatty, rancid −f
21 octanal 994 MS,RI fatty, sweet, green, orange 0.7 25 trans-2-octenal 1046 MS,RI fatty, green, raw nut 3 27 nonanal 1096 MS,RI waxy, painty 1 28 trans, trans-2,4-
decadienal 1306 MS,RI fried fat 0.07
alcohols 17 1-octen-3-ol 970 MS,RI mushroom, musty 1 8 1-hexanol 849 MS,RI green 2500
aromatics 4 toluene 752 MS paint 1000
13 2-ethylphenol 909 MS − − ketones 10 2-heptanone 878 MS,RI blue cheese, spicy, musty 140 18 6-methyl-5-hepten-2-one 978 MS − 50 24 3-octen-2-one 1029 MS,RI rose, fatty, spicy − 26 3,5-octadien-2-one 1059 MS fatty, fruity −
terpenes 23 D-limonene 1015 MS,RI orange-like 10
furans 1 2-ethylfuran 708 MS coffee-like −
19 2-pentylfuran 981 MS,RI floral, fruit 6 20 cis-2-(2-pentenyl)furan 992 MS − −
sulfides 3 dimethyl disulfide 735 MS cauliflower, garlic, cabbage-like 7.6
16 dimethyl trisulfide 950 MS alliaceous, meaty, cabbage-like 0.01 alkenes
6 3,5-octadiene 806 MS − − 9 1,3-trans-5-cis-octatriene 863 MS − −
aNumbers correspond to the labeled peaks in Figure 5.1. bRI, Kovats retention index. cMethod of identification: MS, by comparison of the mass spectrum and relative abundance with the NIST and Wiley mass spectral libraries; RI, by comparison of RI with those from the literature. dAdapted from literature (Fenaille, Visani, Fumeaux, Milo, & Guy, 2003; Milo & Grosch, 1993; Peres, Denoyer, Tournayre, & Berdague, 2002; Triqui & Bouchriti, 2003; Yang, Lee, Jeong, Kim, & Kays, 2008). e Odor threshold in water and adapted from literature (Buttery, Turnbaugh, & Ling, 1988; Fenaille et al., 2003; Milo et al., 1993; Yang et al., 2008). f −, unknown.

155
Table 5.2 Fatty Acid Profiles (Mole Percent) of Extracted Fat from Infant Formulasa
fatty acid commercial infant formula SL-based infant formula
total sn-2 total sn-2 C8:0 3.3±0.0a 0.5±0.1a 0.2±0.0b ND C10:0 2.4±0.0a 1.3±0.1a 0.4±0.0b ND C12:0 16.6±0.0a 33.9±1.3a 1.2±0.0b 1.0±0.0b C14:0 6.0±0.0a 4.2±0.1a 3.3±0.0b 3.2±0.0b C16:0 10.9±0.0b 2.0±0.0b 54.5±0.1a 62.3±0.3a C18:0 3.7±0.0b 1.5±0.1b 9.2±0.0a 11.9±0.6a C18:1n-9 33.5±0.1a 32.2±0.8a 8.5±0.2b 5.3±0.1b C18:2n-6 20.3±0.0a 22.7±0.8a 7.5±0.0b 4.9±0.2b C18:3n-6 0.1±0.0b ND 1.8±0.0a 1.5±0.0a C18:3n-3 1.9±0.0b 1.4±0.1b 2.5±0.0a 1.8±0.0a C18:4n-3 ND ND 6.2±0.0a 5.2±0.2a C20:4n-6 0.2±0.0a ND ND ND C22:6n-3 0.2±0.0b 0.1±0.1b 3.9±0.0a 2.3±0.1a aMean ±SD, n = 3. Values with different letter in the same row and category (i.e., total or sn-2) are significantly different by Duncan’s multiple-range test (p < 0.05). Trace amounts of C16:1n-7, C17:0, C20:0, C20:1, C22:0, C24:0, and C24:1 were detected. Abbreviations: SL, structured lipid; ND, not detected.

156
Figure 5.1 (A) Total ion chromatogram of the volatile compounds extracted from structured-lipid based infant formula after 4-week storage at 37 °C by dynamic headspace GC-MS. Peak numbers correspond to the compounds listed in Table 5.1; (B) Chromatogram of a matrix-matched standard solution spiked with hexanal at 0.01 μg/mL analyzed by SPME-GC.
0 5 10 15 20 25 30 35
0.0
6.0x10⁶
1.2x10⁷
1.8x10⁷
2827262524
23222120
19
181716
151413
1211
987
6
5
4
3
2
1
10
Abu
ndan
ce
Retention time (min)
12.0 12.5 13.0 13.5
0.0
5.0x10³
1.0x10⁴
1.5x10⁴
Butyl acetate(Internal standard)
Abu
ndan
ce
Retention time (min)
Hexanal
A)
B)

157
Figure 5.2 Effect of antioxidants (0.005%) on the oxidative stability of structured lipid-based infant formula emulsion over time at 37 °C: (A) peroxide value; (B) p-anisidine value; and (C) hexanal content. Data points represent the average of duplicate samples.
0 7 14 21 28
0.0
0.1
0.2
0.3
0.40.005%
α-Tocopherol Ascorbyl palmitate β-Carotene Citric acid Ascorbic acid Control Control-N2 Reference
A
Pero
xide
val
ue (m
mol
/L)
Time (day)
0 7 14 21 280.0
0.3
0.6
0.9
1.2B
p-A
nisi
dine
val
ue
(abs
orba
nce/
mL)
Time (day)
0 7 14 21 28
0
2
4
6C
Hex
anal
(μg/
mL)
Time (day)

158
Figure 5.3 Effect of antioxidants (0.02%) on the oxidative stability of structured lipid-based infant formula emulsion over time at 37 °C: (A) peroxide value; (B) p-anisidine value; and (C) hexanal content. Data points represent the average of duplicate samples.
0 7 14 21 28
0.0
0.4
0.8
1.2
1.6
2.0 0.02%
α-Tocopherol Ascorbyl palmitate β-Carotene Citric acid Ascorbic acid Control Control-N2 Reference
A
Pero
xide
val
ue (m
mol
/L)
Time (day)
0 7 14 21 280.0
0.5
1.0
1.5
2.0 B
p-A
nisi
dine
val
ue(a
bsor
banc
e/m
L)
Time (day)
0 7 14 21 280
2
4
6C
Hex
anal
(μg/
mL)
Time (day)

159
Figure 5.4 Effect of α-tocopherol, ascorbic acid, and their mixture at a ratio of 1:1 (0.02%) on the oxidative stability of structured lipid-based infant formula emulsion after 28 days of storage at 37 °C: (A) peroxide value; (B) p-anisidine value; and (C) hexanal content. Different lower-case letters within each category indicate a significant difference (α = 0.05).
0
1
2
3
b
a
a
α-Tocopherol β-Carotene α-Tocopherol + β-carotene
Pero
xide
val
ue (m
mol
/L)
0.02%0
1
2
3BA
Concentration
ConcentrationConcentration
b
a
a
p-A
nisi
dine
val
ue(a
bsor
banc
e/m
L)
0.02%
0
2
4
6 C
b
aa
Hex
anal
(μg/
mL)
0.02%

160
Figure 5.5 Oxidation induction time of structured lipid-based and commercial infant formulas determined by DSC at 80 °C.
10 20 30 40 50 600.00
0.25
0.50
0.75
1.00
1.25
OIT = 32.9 min
Hea
t flo
w (m
W/m
g)
Time (min)
Comercial infant formula Structured lipid-based infant formula
Exot
herm
alOIT = 34.0 min

161
CHAPTER 6
ANTIOXIDANT ACTIVITIES OF ANNATTO AND PALM TOCOTRIENOL-RICH
FRACTIONS IN FISH OIL AND STRUCTURED LIPID-BASED INFANT FORMULA
EMULSION1
1 Zou, L., and Akoh, C. C. Submitted to Food Chemistry, 04/13/14.

162
Abstract
The effectiveness of annatto and palm tocotrienol-rich fractions (TRFs) as natural
antioxidants to inhibit lipid oxidation in menhaden fish oil and structured lipid-based
infant formula emulsion was evaluated and compared. The peroxide and anisidine values
of the bulk oil and oil-in-water emulsion samples stored at 37 °C were measured over a
28-day period. The results showed that annatto TRF was a more effective antioxidant
than palm TRF and α-tocopherol in both food systems at 0.02% and 0.05%. Factors,
including structural differences in chromanol head and isoprenoid tail, polarity,
concentration, oxidation time, and the method used to monitor lipid oxidation, were
responsible for the different behaviors of tocopherols and tocotrienols. In contrast to the
reported findings in vivo, addition of α-tocopherol (0-75%) did not interfere with the
antioxidant activity of tocopherol-free annatto TRF in foods. Our findings may lead to the
development of new natural antioxidant products for food applications.
Keywords: tocotrienol; antioxidant; annatto; palm; structured lipid; fish oil; infant
formula; emulsion

163
Introduction
Lipid oxidation in foods has become a major concern with the increased use of
polyunsaturated vegetable, fish, or microbial oils for health benefits. It not only produces
undesirable off-flavors but also decreases the nutritional quality and safety of food
products (McClements & Decker, 2000), which are unacceptable to consumers. Among
the methods employed to retard or inhibit oxidation of lipids, addition of antioxidants can
be an effective solution (Shahidi & Zhong, 2010; Waraho, McClements, & Decker,
2011). Due to the safety concerns about potentially toxic effects of synthetic additives,
there is a worldwide trend toward the use of natural antioxidants (Waraho et al., 2011).
Moreover, many natural antioxidants possess additional health-promoting benefits in
vivo.
Vitamin E compounds (tocopherols and tocotrienols) are considered to be a major
group of natural fat-soluble chain-breaking antioxidants to prevent lipid oxidation in
foods and biological systems (Eitenmiller & Lee, 2004). Structurally, they are
characterized by a chromanol head with two rings (one phenolic and one heterocyclic)
and a lipophilic isoprenoid tail (Figure 6.1). The tocopherols have a saturated phytyl tail,
whereas their corresponding tocotrienols have a shorter unsaturated farnesyl tail with
three isolated double bonds. The position and number of methyl groups on the chromanol
head determine the specific type of tocopherol or tocotrienol homologues, named α, β, γ,
or δ. It is widely accepted that the antioxidant activity of tocopherols and tocotrienols is
mainly due to their ability to donate phenolic hydrogen to lipid free radicals, with less
contribution from singlet oxygen quenching (Eitenmiller et al., 2004). The more methyl
substitutes at the ortho- and/or para-position to the hydroxyl group, the more easily the

164
O-H bond can be cleaved (Kamal-Eldin & Appelqvist, 1996; Wright, Johnson, &
DiLabio, 2001). Thus, the relative antioxidant effectiveness of different isomers is
originally believed to be in the order of α > β > γ > δ on the basis of hydrogen-donating
power (Kamal-Eldin et al., 1996). The corresponding tocopherols and tocotrienols are
also expected to exert similar antioxidant potential due to the presence of the same
chromanol group. However, there is considerable conflicting evidence regarding their
antioxidant activities in vivo, in vitro, in model systems, and in specific food matrices
(Eitenmiller et al., 2004; Kamal-Eldin et al., 1996; Seppanen, Song, & Csallany, 2010).
The reasons behind this confusion have not yet been fully understood. It is recognized
that the effectiveness of an antioxidant in foods is not only determined by its structure
and chemical reactivity toward lipid radicals but also dependent on other factors
including its stability, polarity, molecular size, concentration, environmental conditions
(e.g., pH and temperature), physical distribution and mobility in the media (e.g., bulk oil
or oil-in-water emulsion), and presence of antagonists or synergists (Decker, Warner,
Richards, & Shahidi, 2005; Shahidi & Zhong, 2011; Waraho et al., 2011). Huang,
Frankel, and German (1994) also proposed that whether α-tocopherol acted as an
antioxidant or prooxidant depended on concentration, oxidation time, the method used to
determine oxidation, and physical state (bulk phase or emulsion). Although the
antioxidant and biological properties of tocopherols, especially α-tocopherol, have been
investigated extensively, little is known about antioxidant properties of tocotrienols in
foods (Table 6.1), probably because of the scarcity of these compounds and lower
biological vitamin E activity than tocopherols.

165
Up till now, the commercial sources of tocotrienols are palm, rice bran, and
annatto (Bixa orellana L.) (Watson & Preedy, 2009). Palm or rice tocotrienol-rich
fraction (TRF), is actually a mixture of tocopherols and tocotrienols, typically containing
25-50% tocopherols (mostly as α-tocopherol) (Watson et al., 2009). Annatto TRF, on the
other hand, is virtually tocopherol-free and composed of only γ- and δ-tocotrienols
(Watson et al., 2009). An expanding body of evidence has demonstrated that tocotrienols
possesses powerful cholesterol-lowering, anticancer, and neuroprotective properties that
are often not exhibited by tocopherols (Aggarwal, Sundaram, Prasad, & Kannappan,
2010; Watson et al., 2009). Nevertheless, unexpectedly, α-tocopherol has been shown to
attenuate tocotrienol health benefits in vivo (e.g., hypocholestrolemic and anticancer
effects) (Qureshi et al., 1996; Shibata et al., 2010). This finding immediately suggests a
question that needs to be addressed: will α-tocopherol interfere with the antioxidant
ability of tocotrienols in foods?
Therefore, the first objective of this study was to determine and compare the
antioxidant activities of commercial annatto and palm TRFs in bulk oil and in oil-in-
water emulsion, with α-tocopherol, δ-tocopherol, and δ-tocotrienol standards as
references. Two actual food systems, fish oil and structured lipid (SL)-based ready-to-
feed infant formula, were employed, respectively. Our second objective was to explore
whether α-tocopherol can interfere with the antioxidant activity of tocopherol-free
annatto TRF in the above foods. Different combinations of α-tocopherol and annatto TRF
at ratios of 100:0, 75:25, 50:50, 25:75, and 0:100 were used. A better understanding of
antioxidant behavior of tocotrienol products would be of great interest to food

166
manufacturers and consumers, and may lead to the development of new natural
antioxidants in food industry.
Materials and methods
Materials
Tripalmitin was purchased from TCI America (Portland, OR, USA). Stearidonic
acid (SDA) soybean oil was kindly donated by Monsanto Co. (St. Louis, MO, USA).
Docosahexaenoic acid (DHA) single-cell oil containing 40% DHA was purchased from
Martek Bioscience Corp., now DSM Nutritional Products Ltd. (Columbia, MD, USA).
sn-1,3 Specific lipase Lipozyme TL IM and nonspecific lipase Novozym 435 were
obtained from Novozymes A/S (Bagsvaerd, Denmark). α- and δ-Tocopherol standards (≥
96 and 90% purity, respectively) and menhaden fish oil were purchased from Sigma-
Aldrich Chemical Co. (St. Louis, MO, USA). The major fatty acids of fish oil were C16:0
(20.0 mol%), C20:5n-3 (15.2 mol%), C16:1n-7 (13.5 mol%), C22:6n-3 (13.0 mol%),
C14:0 (10.5 mol%), and C18:1n-9 (5.8 mol%), as determined by gas chromatography of
methyl esters (Zou & Akoh, 2013a). DeltaGold annatto TRF (11% γ-tocotrienol and 89%
δ-tocotrienol), palm TRF (23% α-tocopherol, 25% α-tocotrienol, 2% β-tocotrienol, 35%
γ-tocotrienol, and 15% δ-tocotrienol), and δ-tocotrienol standard (≥ 99% purity), were
generously provided by American River Nutrition, Inc. (Hadley, MA, USA). The DHA
and SDA containing SL, which mimicked human milk fat, was enzymatically produced
as previously reported (Zou et al., 2013a). All the solvents were of analytical grade, and
purchased from J.T. Baker Chemical Co. (Phillipsburg, NJ, USA) or Fisher Scientific
(Norcross, GA, USA).

167
Preparation of bulk oil and oil-in-water emulsion samples
Tocopherols and/or tocotrienols at 0.02% and 0.05% levels were dissolved in
hexane and then added to menhaden oil or SL before emulsification. Organic solvents
were evaporated under nitrogen. The SL-based infant formula emulsion consisting of
3.5% lipid was prepared according to the optimal formulation and procedures described
by Zou and Akoh (2013b). The bulk oil and emulsion samples without addition of
antioxidants were used as the controls.
Oxidation experiments
The oxidative stability was studied by means of an accelerated storage. Both bulk
oil (5 g) and emulsion (25 mL) samples were placed in capped glass bottles, covered with
Parafilm, and allowed to oxidize in a covered water bath at 37 °C for 4 weeks. The
primary and secondary oxidation products were measured after 0, 7, 14, 21, and 28 days
of storage. Lipid hydroperoxide, measured as peroxide value (PV), was determined using
a method described by Chaiyasit, McClements, and Decker (2005). For bulk menhaden
oil, the samples (0.01 g) were diluted with 4 mL of isooctane before measurements.
Emulsion samples were analyzed by the same procedure described previously (Zou et al.,
2013b). p-Anisidine value (AV) determines the amount of aldehydes (mainly 2-alkenals
and 2,4-alkadienals), which are secondary products from the decomposition of
hydroperoxides. The AV of menhaden oil (0.5 g) was determined according to the AOCS
Official Method Cd 18-90 (AOCS, 2009). Emulsion samples (2 mL) were analyzed using
the same method with minor modifications as previously reported (Zou et al., 2013b).

168
Statistical analysis
All the experiments were conducted on duplicate samples. The effect of different
antioxidants on lipid oxidation over time was evaluated by two-way repeated measures
ANOVA of fixed-effects models, using SAS software, version 9.2 (SAS Institute Inc.,
Cary, NC, USA). Duncan’s multiple-range test was performed to determine significant
differences of the measurements on the same day (α = 0.05).
Results
Antioxidant activity in bulk oil
As can been seen in Figure 6.2A and B, the rate of hydroperoxide formation in the
control oil increased steeply after 21 days of storage. No significant difference (p > 0.05)
was found in lipid hydroperoxide concentrations among the control, annatto TRF, and δ-
isomer standards at levels of 0.02% and 0.05% during the entire incubation period
(Figure 6.2A and B). In the presence of α-tocopherol, the rate of hydroperoxide formation
increased with concentration and incubation time, whereas the PVs were not significantly
different (p > 0.05) between 0.02% and 0.05% for other compounds. At both
concentrations, palm TRF showed prooxidant activity between 14 and 28 days. No
antioxidant effect was observed in bulk oil on the basis of hydroperoxide formation.
As shown in Figure 6.2C and D, secondary oxidation products were detected after
the appearance of lipid hydroperoxides. Their concentrations fluctuated in the control
menhaden oil during the incubation (Figure 6.2C and D). In contrast to hydroperoxide
formation, all the compounds exhibited antioxidant activities during initial 14 days of
incubation at 0.02% and 0.05% (Figure 6.2C and D). However, α-tocopherol and palm
TRF had significantly higher (p < 0.05) prooxidant activities than annatto TRF and δ-

169
isomer standards after 21 days of storage at the two concentrations tested. For all
evaluated compounds, increasing concentration from 0.02 to 0.05% did not lead to a
pronounced change in the AV curve during the incubation period (Figure 6.2C and D).
Antioxidant activity in oil-in-water emulsion
As shown in Figure 6.3, both primary and secondary oxidations were slower in
infant formula emulsion than in bulk oil, as indicated by a longer induction period in all
the samples. At 0.02% and 0.05%, δ-tocotrienol and annatto TRF were significantly
better (p < 0.05) than α-tocopherol, δ-tocopherol, and palm TRF in decreasing the
formation of lipid hydroperoxides (Figure 6.3A and B). δ-Tocotrienol showed antioxidant
effect on primary oxidation after 28 days of storage at both concentrations. However,
annatto TRF showed a small prooxidant activity at 0.02% (Figure 6.3A) and antioxidant
activity at 0.05% (Figure 6.3B) on the final day of storage. On the basis of hydroperoxide
formation, prooxidant effects were observed for tocopherol standards (α- and δ-) and
palm TRF after 28 days of oxidation at the two concentrations tested. An increase in the
concentration of the compounds except δ-tocotrienol from 0.02 to 0.05% led to a
decrease in the formation of lipid hydroperoxide after 28-day incubation.
No significant difference (p > 0.05) was found in the AVs among the control,
annatto TRF, palm TRF, and δ-isomer standards at levels of 0.02% and 0.05% during the
entire incubation period (Figure 6.3C and D). At both levels, α-tocopherol promoted the
formation of secondary oxidation products after 28 days of incubation. No antioxidant
effect was observed in oil-in-water emulsion on the basis of hydroperoxide
decomposition. However, different from the bulk oil, there was a decrease in the AV

170
when the concentration was increased from 0.02 to 0.05% for the compounds evaluated
after 28-day oxidation.
Effect of α-tocopherol addition on the antioxidant ability of annatto TRF in bulk oil
and oil-in-water emulsion
In bulk oil, no significant difference (p > 0.05) was found in the PVs among
different combinations (100:0, 75:25, 50:50, 25:75, and 0:100) of α-tocopherol and
annatto TRF at 0.02% after 28-day storage (Figure 6.4A). However, at 0.05%, annatto
TRF alone or combinations of annatto TRF and α-tocopherol were significantly better (p
< 0.05) than α-tocopherol alone in inhibiting primary oxidation (Figure 6.4A). The same
results at both concentrations were also obtained on the basis of hydroperoxide
decomposition (Figure 6.4B).
In infant formula emulsion, lipid hydroperoxides in the annatto TRF-containing
samples were significantly lower (p < 0.01) than samples with α-tocopherol alone at both
concentrations tested (Figure 6.5A). Similar to the PV results, AVs were significantly
lower (p < 0.05 at 0.02%; p < 0.01 at 0.05%) in the annatto TRF-containing samples than
α-tocopherol treatments (Figure 6.5B). Additionally, increasing the antioxidant
concentration from 0.02 to 0.05% led to a decrease in both primary and secondary
oxidations after 28-day storage (Figure 6.5A and B). No significant difference (p > 0.05)
was observed in antioxidant activities among annatto TRF-containing samples at all the
conditions tested (Figs. 6.4 and 6.5).
Discussion
In our study, the PV and AV were used to assess and distinguish the effectiveness
of commercial annatto and palm TRFs in inhibiting lipid hydroperoxide formation and

171
decomposition in different media. In bulk oil, δ-tocotrienol, δ-tocopherol, and annatto
TRF (about 90% δ-tocotrienol) were more active than α-tocopherol and palm TRF (about
25% α-tocopherol) as antioxidants on the basis of PV and AV measurements (Figure 6.2).
The difference in antioxidant effectiveness seems to be mainly attributed to the difference
in methyl groups. The finding is consistent with that of Dolde and Wang (2011), who
reported that δ type tocopherol or tocotrienol had a higher antioxidant activity in corn oil
at 60 °C than α type. Several mechanisms may be considered to explain the difference.
First, in contrast to α type containing three methyl groups in the chromanol ring, the
corresponding δ type only contains one methyl group, leading to a high polarity
(Chaiyasit et al., 2005). As a result, δ type has a high affinity oriented toward the
interface of the colloid (water in oil) in bulk oil, and is hence more effective in inhibiting
oxidation than the nonpolar α type that is dissolved in the oil phase. This is in agreement
with the “polar paradox theory” (Porter, 1993), which states that polar antioxidants are
more effective in less polar media, such as bulk oil, whereas nonpolar antioxidants are
more effective in relatively more polar media, such as oil-in-water emulsion. Second, as
the hydrogen-donating power of α type is high, its stability is low compared to δ type,
especially at elevated temperature and oxygen content (Huang et al., 1994; Kim, 2007).
Third, the ortho-position 5 with respect to the hydroxyl group (Figure 6.1) is the primary
site for radical-radical (termination) reactions (Kamal-Eldin et al., 1996). Therefore, the
sterically hindered radical of α type is converted to a non-radical species slower than
other isomers, with δ type being the fastest. In addition to that, the oxidation products of
δ type, typically diphenyl ether dimer and biphenyl dimer, can be effective as
antioxidants, whereas the oxidation products of α type, mainly α-tocopheryl and α-

172
tocotrienyl quinones, have no antioxidant activity (Huang et al., 1994). Fourth, in the
presence of high initial levels of hydroperoxides, α type is expected to decompose them
at a faster rate compared to δ type due to its greater potential to donate its phenolic
hydrogen (Kamal-Eldin et al., 1996). Fifth, α type tocopherol and tocotrienol are capable
of reducing transition metal ions (e.g., Cu2+) to act as prooxidants, but the other forms (β,
γ, or δ) are not (Kamal-Eldin et al., 1996; Watson et al., 2009). Compared to the bulk oil,
this mechanism is supposed to be more pronounced in infant formula emulsion, as it
contains a large amount of metal ions as mineral nutrients.
In oil-in-water emulsion system, the induction periods of primary and secondary
oxidations were longer than bulk oil (Figure 6.3). Moreover, compared to the bulk oil, the
concentration factor has a higher influence on the antioxidant activity. These observations
suggest that lipophilic antioxidants, like annatto and palm TRFs, are more effective in
hydrophilic environments (e.g., infant formula emulsion) to protect oil against oxidation,
which is consistent with the “polar paradox theory”. In oil-in-water emulsion, δ-
tocotrienol and annatto TRF (about 90% δ-tocotrienol) were found to be more effective
than α-tocopherol, δ-tocopherol, and palm TRF (about 25% α-tocopherol) in inhibiting
the hydroperoxide formation, suggesting that the lipophilic isoprenoid tail may be partly
responsible for the difference. There are two possible explanations for the higher
antioxidant potency of tocotrienols than tocopherols in oil-in-water emulsion. First, due
to the presence of three double bonds, tocotrienols form a short “arc” conformation over
the chromanol ring (Watson et al., 2009) that renders them more flexible and mobile to
cover a large surface area of oil droplets. In other words, tocotrienols are more uniformly
distributed in the oil-water interface than tocopherols to protect oil against oxidation.

173
Second, tocotrienols have a higher recycling efficiency from their chromanoxyl radicals
than tocopherols (Serbinova, Kagan, Han, & Packer, 1991), which makes the reaction
with lipid radicals more efficient.
Structurally, it appears that although the hydroxyl group confers the antioxidant
potency of tocopherols and tocotrienols, the double bonds in the isoprenoid tail and the
methyl group at position 5 of the chromanol head may contribute to the net antioxidant
effectiveness of tocopherols and tocotrienols in food systems.
Limited studies in vivo (Aggarwal et al., 2010) have shown that both the
molecular and therapeutic targets of tocotrienols are distinct from those of tocopherols.
For example, suppression of inflammatory transcription factor NF-κB that is closely
related to carcinogenesis, inhibition of HMG-CoA reductase that is essential for
cholesterol synthesis, and inhibition of mammalian DNA polymerases and certain protein
tyrosine kinases, are unique to tocotrienols (Aggarwal et al., 2010). Addition of
tocopherols not only compromises the unique functions of tocotrienols, but also inhibits
their cellular uptake (Shibata et al., 2010). Effective compositions for the cholesterol-
lowering benefit have been suggested to consist of 15-20% α-tocopherol and about 60%
γ- or δ-tocotrienols, whereas ineffective preparations consist of 30% or more α-
tocopherol and about 45% γ- or δ-tocotrienols (Qureshi et al., 1996). In contrast to the
findings in vivo, no inhibitory effect of α-tocopherol (0-75%) on the antioxidant ability of
annatto TRF (a mixture of γ- and δ-tocotrienols) was found in menhaden fish oil and
infant formula emulsion (Figs. 6.4 and 6.5), which have distinct chemical, physical, and
environmental properties. Moreover, similar to the previous results, α-tocopherol/annatto
TRF mixtures were again shown to be more effective as antioxidants in more polar

174
media. From food application’s point of view, since the antioxidant ability of annatto
TRF alone or α-tocopherol/annatto TRF mixture is better than α-tocopherol, one may use
annatto TRF to fully or partially replace α-tocopherol as an antioxidant in food
formulations, especially in oil-in-water emulsion systems. However, more research is
required to confirm this hypothesis.
Conclusions
It appears that factors like the structural characteristics (e.g., hydroxyl groups,
methyl groups, and double bonds) and their resulting polarity, concentration, oxidation
time, media, and the method used to monitor lipid oxidation, may determine the
antioxidant, neutral, or prooxidant behaviors of annatto and palm TRFs. In our study,
annatto TRF was found to be more effective than palm TRF and α-tocopherol in
inhibiting lipid oxidation in menhaden fish oil and structured-lipid based infant formula
emulsion at 0.02% and 0.05%. Addition of α-tocopherol did not attenuate antioxidant
activity of annatto TRF in the foods tested. More studies and applications are needed to
explore annatto TRF as a promising natural antioxidant as well as a functional ingredient
for the enhancement of food quality and human health.
Acknowledgments
This project was supported by Agriculture and Food Research Initiative
Competitive Grant 2009-65503-05734 from the USDA National Institute of Food and
Agriculture. We thank Monsanto Co. for providing the SDA soybean oil. We also thank
American River Nutrition, Inc. for supplying annatto TRF, palm TRF, and δ-tocotrienol
standard.

175
References
Aggarwal, B. B., Sundaram, C., Prasad, S., & Kannappan, R. (2010). Tocotrienols, the
vitamin E of the 21st century: Its potential against cancer and other chronic
diseases. Biochemical Pharmacology, 80(11), 1613-1631.
AOCS. (2009). Official methods and recommended practice of the American Oil
Chemists' Society. Method Cd 18-90. Champaign, IL: AOCS.
Chaiyasit, W., McClements, D. J., & Decker, E. A. (2005). The relationship between the
physicochemical properties of antioxidants and their ability to inhibit lipid
oxidation in bulk oil and oil-in-water emulsions. Journal of Agricultural and
Food Chemistry, 53 (12), 4982-4988.
Decker, E. A., Warner, K., Richards, M. P., & Shahidi, F. (2005). Measuring antioxidant
effectiveness in food. Journal of Agricultural and Food Chemistry, 53(10), 4303-
4310.
Dolde, D., & Wang, T. (2011). Oxidation of corn oils with spiked tocols. Journal of the
American Oil Chemists' Society, 88(11), 1759-1765.
Eitenmiller, R. R. & Lee, J. (2004). Oxidation and the role of vitamin E as an antioxidant
in foods. In R. R. Eitenmiller & J. Lee (Eds.), Vitamin E: Food chemistry,
composition, and analysis (pp. 89-135). New York, NY: Marcel Dekker, Inc.
Feng, H. P. (1995). Preparative techniques for isolation of vitamin E homologues and
evaluation of their antioxidant activities (Doctoral dissertation). The University of
Georgia, Athens, GA.

176
Huang, S. W., Frankel, E. N., & German, J. B. (1994). Antioxidant activity of α- and γ-
tocopherols in bulk oils and in oil-in-water emulsions. Journal of Agricultural and
Food Chemistry, 42(10), 2108-2114.
Kamal-Eldin, A., & Appelqvist, L. A. (1996). The chemistry and antioxidant properties
of tocopherols and tocotrienols. Lipids, 31(7), 671-701.
Kim, H. J. (2007). Oxidation mechanism of riboflavin destruction and antioxidant
mechanism of tocotrienols (Doctoral dissertation). The Ohio State University,
Columbus, OH.
McClements, D. J., & Decker, E. A. (2000). Lipid oxidation in oil-in-water emulsions:
Impact of molecular environment on chemical reactions in heterogeneous food
systems. Journal of Food Science, 65(8), 1270-1282.
Porter, W. L. (1993). Paradoxical behavior of antioxidants in food and biological
systems. Toxicology and Industrial Health, 9(1-2), 93-122.
Qureshi, A. A., Pearce, B. C., Nor, R. M., Gapor, A., Peterson, D. M., & Elson, C. E.
(1996). Dietary α-tocopherol attenuates the impact of γ-tocotrienol on hepatic 3-
hydroxy-3-methylglutaryl coenzyme a reductase activity in chickens. The Journal
of Nutrition, 126(2), 389-394.
Romero, N., Robert, P., Masson, L., Ortiz, J., Gonzalez, K., Tapia, K., et al. (2007).
Effect of α-tocopherol, α-tocotrienol and Rosa mosqueta shell extract on the
performance of antioxidant-stripped canola oil (Brassica sp.) at high temperature.
Food Chemistry, 104(1), 383-389.
Seher, A., & Ivanov, S. A. (1973). Natural antioxidants I: Antioxidative action of
tocotrienols. Fette, Seifen, Anstrichmittel, 75(10), 606-608.

177
Seppanen, C. M., Song, Q. H., & Csallany, A. S. (2010). The antioxidant functions of
tocopherol and tocotrienol homologues in oils, fats, and food systems. Journal of
the American Oil Chemists' Society, 87(5), 469-481.
Serbinova, E., Kagan, V., Han, D., & Packer, L. (1991). Free-radical recycling
intramembrane mobility in the antioxidant preperties of alpha-tocopherol and
alpha-tocotrienol. Free Radical Biology & Medicine, 10(5), 263-275.
Shahidi, F., & Zhong, Y. (2010). Lipid oxidation and improving the oxidative stability.
Chemical Society Reviews, 39(11), 4067-4079.
Shahidi, F., & Zhong, Y. (2011). Revisiting the polar paradox theory: A critical
overview. Journal of Agricultural and Food Chemistry, 59(8), 3499-3504.
Shibata, A., Nakagawa, K., Sookwong, P., Tsuduki, T., Asai, A., & Miyazawa, T. (2010).
α-Tocopherol attenuates the cytotoxic effect of δ-tocotrienol in human colorectal
adenocarcinoma cells. Biochemical and Biophysical Research Communications,
397(2), 214-219.
Top, A. G. M., Ong, A. S. H., Kato, A., Watanabe, H., & Kawada, T. (1989). Antioxidant
activities of palm vitamin E with special reference to tocotrienols. Elaeis, 1(1),
63-67.
Wagner, K. H., Wotruba, F., & Elmadfa, I. (2001). Antioxidative potential of tocotrienols
and tocopherols in coconut fat at different oxidation temperatures. European
Journal of Lipid Science and Technology, 103(11), 746-751.
Waraho, T., McClements, D. J., & Decker, E. A. (2011). Mechanisms of lipid oxidation
in food dispersions. Trends in Food Science & Technology, 22(1), 3-13.

178
Watson, R. R., & Preedy, V. R. (2009). Tocotrienols: Vitamin E beyond tocopherols.
Boca Raton, FL: CRC Press.
Wright, J. S., Johnson, E. R., & DiLabio, G. A. (2001). Predicting the activity of phenolic
antioxidants: Theoretical method, analysis of substituent effects, and application
to major families of antioxidants. Journal of the American Chemical Society,
123(6), 1173-1183.
Yamaoka, M., Tanaka, A., & Kato, A. (1985). Antioxidative activity of tocotrienols.
Yukagaku, 34(2), 120-122.
Zou, L., & Akoh, C. C. (2013a). Identification of tocopherols, tocotrienols, and their fatty
acid esters in residues and distillates of structured lipids purified by short-path
distillation. Journal of Agricultural and Food Chemistry, 61(1), 238-246.
Zou, L., & Akoh, C. C. (2013b). Characterisation and optimisation of physical and
oxidative stability of structured lipid-based infant formula emulsion: Effects of
emulsifiers and biopolymer thickeners. Food Chemistry, 141(3), 2486-249.

179
Table 6.1 Summaries of research on the antioxidant activity of tocotrienols in model systems, fats, and oils. Substrate Concentration Oxidation
temperature (°C) Measurement Result Reference
Model systems Methyl linoleate 0.02%, 0.05% 60 Weight gain α-T3
> α-T, γ-T3> γ-T a Yamaoka, Tanaka, and Kato (1985)
Fats and oils Lard 0.02%, 0.05% 110 Refractometric method Tocotrienols > Tocopherols,
δ-T3 > γ-T3 > β-T3 > α-T3 Seher and Ivanov (1973)
Palm olein 0.02-0.2% 100 Rancimet test γ-T3 ≥ δ-T3 > α-T3 Top, Ong, Kato, Watanabe, and Kawada (1989)
Palm olein Palm olein Corn oil Soybean oil
0.01-0.1% 0.04% 0.04% 0.04%
110 110 110 110
OSI TOTOX, CD TOTOX, CD TOTOX, CD
γ-T3 ≥ γ-T > α-T3 ≈ α-T γ-T3 > γ-T > α-T3 ≥ α-T γ-T3 > γ-T > α-T3 ≈ α-T γ-T3 > γ-T > α-T3 > α-T
Feng (1995)
Coconut fat 0.01-0.1% 0.01-0.1%
160
60
OSI PV, CD
δ-T3 > γ-T3 > β-T3 > α-T3, δ-T3 > δ-T, γ-T3> γ-T δ-T3 and γ-T3 as antioxidants, α-T3 and β-T3 as prooxidants
Wagner, Wotruba, and Elmadfa (2001)
Canola oil Unfixed 180 OSI α-T at 432 mg/kg > α-T3 at 138 mg/kg ≈ α-T at 155 mg/kg
Romero et al. (2007)
Lard 0.01-0.1% 55 Headspace oxygen, PV δ-T3 > γ-T3 > β-T3 > α-T3 Kim (2007) Corn oil 0.01-0.5% 60 PV, OSI γ-T3 > δ-T3 ≈ δ-T > α-T3 ≈ α-T Dolde and Wang (2011)
a Abbreviations: T3, tocotrienol; T, tocopherol; OSI, oil stability index; TOTOX, total oxidation value; CD, conjugated diene; PV, peroxide value.

180
Tocotrienols or tocopherols R1 R2
α (5,7,8-trimethyl) CH3 CH3
β (5,8-dimethyl) CH3 H
γ (7,8-dimethyl) H CH3
δ (8-monomethyl) H H
Figure 6.1 Chemical structures of tocotrienols and tocopherols.
O
R1
HO
R2
CH3
6
7 8
5
O1
2
34
R1
HO
R2
CH3
1'
2'
3'
4'
5'
6'
7'
8'
9'
10'
11'
12'
Tocotrienols
Tocopherols

181
Figure 6.2 Effect of antioxidants (0.02% and 0.05%) on the oxidative stability of menhaden fish oil at 37 °C: (A) and (B) peroxide value; (C) and (D) p-anisidine value. Data points represent the average of duplicate samples. (TRF, tocotrienol-rich fraction)
0 7 14 21 28
10
20
30
40
50
60
70
80
90
100
D C
B 0.02%
Control δ-Tocopherol δ-Tocotrienol Palm TRF α-Tocopherol Annatto TRF
Pero
xide
val
ue (m
mol
/kg)
Time (day)
A
0 7 14 21 28
10
20
30
40
50
60
70
80
90
1000.05%
Pero
xide
val
ue (m
mol
/kg)
Time (day)
0 7 14 21 28
28
30
32
34
36
38
40
42
44
p-A
nisid
ine
valu
e (a
bsor
banc
e/g)
Time (day)
0.02% 0.05%
0 7 14 21 28
28
30
32
34
36
38
40
42
44
p-A
nisid
ine
valu
e (a
bsor
banc
e/g)
Time (day)

182
Figure 6.3 Effect of antioxidants (0.02% and 0.05%) on the oxidative stability of structured lipid-based infant formula emulsion at 37 °C: (A) and (B) peroxide value; (C) and (D) p-anisidine value. Data points represent the average of duplicate samples. (TRF, tocotrienol-rich fraction)
0 7 14 21 280.0
0.1
0.2
0.3
0.4
0.5
0.6
0.7
0.8
0.9
DC
BA
Control δ-Tocopherol δ-Tocotrienol Palm TRF α-Tocopherol Annatto TRF
Pero
xide
val
ue (m
mol
/L)
Time (day)
0.02%
0 7 14 21 280.0
0.1
0.2
0.3
0.4
0.5
0.6
0.7
0.8
0.9 0.05%
Pero
xide
val
ue (m
mol
/L)
Time (day)
0 7 14 21 280.0
0.5
1.0
1.5
2.0
2.5
3.0
p-A
nisi
dine
val
ue (a
bsor
banc
e/m
L)
Time (day)
0.02% 0.05%
0 7 14 21 280.0
0.5
1.0
1.5
2.0
2.5
3.0p-
Ani
sidi
ne v
alue
(abs
orba
nce/
mL)
Time (day)

183
Figure 6.4 Effect of α-tocopherol addition on the antioxidant ability of annatto tocotrienol-rich fraction (TRF) in menhaden fish oil at 0.02% and 0.05% after 28 days of storage: (A) peroxide value; (B) p-anisidine value. Different lower-case letters within each concentration group indicate a significant difference (*, α = 0.05).
0.02% 0.05%0
24
48
72
96
Concentration
a
a
bbbb
a a b b
aa a aa
a bb
a
a
*
*
α-Tocopherol Annatto TRF 25% α-Tocopherol + 75% annatto TRF 50% α-Tocopherol + 50% annatto TRF 75% α-Tocopherol + 25% annatto TRF
Pero
xide
val
ue (m
mol
/kg)
Concentration
0.02% 0.05%0
12
24
36
48 B
A
p-A
nisi
dine
val
ue (a
bsor
banc
e/g)

184
Figure 6.5 Effect of α-tocopherol addition on the antioxidant ability of annatto tocotrienol-rich fraction (TRF) in structured lipid-based infant formula emulsion at 0.02% and 0.05% after 28 days of storage: (A) peroxide value; (B) p-anisidine value. Different lower-case letters within each concentration group indicate a significant difference (*, α = 0.05; **, α = 0.01).
0.02% 0.05%0.0
0.2
0.4
0.6
0.8
1.0
Concentration
bb
b
b
b
bb
b
b
b
bb
a a
a
a
B
A
*
**
**
α-Tocopherol Annatto TRF 25% α-Tocopherol + 75% annatto TRF 50% α-Tocopherol + 50% annatto TRF 75% α-Tocopherol + 25% annatto TRF
Pero
xide
Val
ue (m
mol
/L)
0.02% 0.05%0.0
0.5
1.0
1.5
2.0
2.5
3.0Concentration
bbb
b
**
p-A
nisi
dine
val
ue (a
bsor
banc
e/m
L)

185
CHAPTER 7
CONCLUSIONS
A structured lipid (SL), which mimics the unique structure of human milk fat
(HMF) as well as containing omega-3 long chain polyunsaturated fatty acids (n-3
LCPUFAs) in the triacylglycerol backbone, was successfully produced by a two-step
enzymatic interesterification and acidolysis using tripalmitin, stearidonic acid (SDA)
soybean oil, and docosahexaenoic acid (DHA) as substrates. The SL contained 5.4 mol%
DHA and 8.0 mol% SDA, with 57.0 mol% palmitic acid esterified at sn-2 position. It was
found that the endogenous antioxidants, tocopherols or tocotrienols, in the original oils
were mainly lost during enzymatic reactions as fatty acid esters and/or during purification
in a free form (>50%). These two types of losses together resulted in a compromised
oxidative stability of the SL produced.
After optimizing the type and level of emulsifiers, thickeners, and antioxidants, a
SL-based ready-to-feed infant formula (IF) with the highest physical and oxidative
stability was successfully developed. The optimal conditions were 0.2 g/100 mL lecithin,
0.4 g/100 mL monoacylglycerol, 0.045 g/100 mL locust bean gum, 0.015 g/100 mL
carrageenan, and 0.005% ascorbyl palmitate (of oil). Several important findings about
ingredient interactions were observed. First, emulsifiers (lecithin and monoacylglycerol)
played a more important role than thickeners (locust bean gum and carrageenan) in
controlling the emulsion stability. Lecithin content significantly affected lipid oxidation.
An increase in monoacylglycerol concentration was associated with large particle size

186
and high emulsion viscosity. Second, the efficacy of permitted compounds as
antioxidants in SL-based IF emulsion depended not only on their mechanism of action,
but also on polarity, concentration, oxidation time, method used to determine lipid
oxidation, and environmental conditions (e.g., headspace oxygen and pH). Nitrogen
flushing could be used as a supplemental technique to further protect against oxidation.
Compared to palm tocotrienol-rich fraction (TRF) and α-tocopherol, annatto TRF
was proved to be a more effective natural antioxidant to inhibit lipid oxidation in
menhaden fish oil and SL-based IF emulsion, particularly in the latter case. It appears that
the structural characteristics (e.g., hydroxyl groups, methyl groups, and double bonds) of
tocotrienols largely contribute to the difference. Addition of α-tocopherol did not
attenuate antioxidant activity of annatto TRF in the foods tested. From food application’s
point of view, one might use annatto TRF to fully or partially replace α-tocopherol as an
antioxidant in food formulations, especially in oil-in-water emulsion systems.
All the objectives of this study described in the introduction section (chapter 1)
were achieved. This research resulted in a ready-to-feed IF product containing HMF
analogues enriched with DHA and SDA to improve infant nutrition and health. The
substrate, SDA enriched soybean oil, is a sustainable and oxidatively stable plant-based
source of omega-3 fatty acids. The SDA-based SL can compete with flaxseed oil, fish
oil, Betapol, and Infat for the lipid source in IF market. Moreover, a better understanding
of how emulsifiers, biopolymer thickener, and/or antioxidants at the oil-in-water interface
affect the kinetics of lipid oxidation in SL-based emulsion is of great interest to food
manufacturers and consumers, and may lead to new strategies to extend shelf-life of
omega-3 enriched foods. The findings of annatto TRF as a powerful natural antioxidant

187
may lead to its application as a functional ingredient in food industry for the enhancement
of food quality and human health as well. Overall, this study has important implications
for the successful use of SLs for food formulations.
Suggestions for future work:
(1) Find efficient and cost-effective strategies to recover the lost tocopherols and
tocotrienols in the distillates and add back to the final oil products (SLs) to improve their
oxidative stability.
(2) Verify the health-promoting effects of the HMF enriched with DHA and SDA
in animal models by analyzing the absorption of palmitic acid and calcium and
bioavailability of omega-3 fatty acids in the tissues (e.g., eyeball and brain).
(3) Evaluate and compare the acceptace of SL-based ready-to-feed IFs with
corresponding commercial products through sensory analysis.