enzyme-assisted separation and hydrolysis of gluten
TRANSCRIPT

Enzyme-assistedseparation and hydrolysis
of gluten–
options for intensification
Nicolas A. Hardt
Thesis committee
PromotorProf. Dr R.M. BoomProfessor of Food Process EngineeringWageningen University
Co-promotorDr A.J. van der GootAssociate professor, Food Process EngineeringWageningen University
Other membersProf. Dr H. Gruppen, Wageningen UniversityProf. Dr H.P. Schuchmann, Karlsruhe Institute of Technology, GermanyDr H. Streekstra, DSM, DelftProf. Dr V. Fogliano, Wageningen University
This research was conducted under the auspices of the Graduate School VLAG(Advanced studies in Food Technology, Agrobiotechnology, Nutrition and HealthSciences)

Enzyme-assistedseparation and hydrolysis
of gluten–
options for intensification
Nicolas A. Hardt
Thesissubmitted in fulfilment of the requirements for the degree of doctor
at Wageningen Universityby the authority of the Rector Magnificus
Prof. Dr M.J. Kropff,in the presence of the
Thesis Committee appointed by the Academic Boardto be defended in public
on Monday 20 October 2014at 1.30 p.m. in the Aula.

Nicolas A. HardtEnzyme-assisted separation and hydrolysis of gluten: options for intensification,171 pages.
PhD thesis, Wageningen University, Wageningen, NL (2014)With references, with summaries in Dutch and English
ISBN 978-94-6257-122-8

Table of Contents
Chapter 1General introduction 1
Chapter 2Wheat dough rheology at low water content and theinfluence of xylanases
13
Chapter 3Shear-induced starch–gluten separation at very lowwater content aided by xylanases
31
Chapter 4Influence of high solid concentrations on enzymaticwheat gluten hydrolysis and resulting functionalproperties
49
Chapter 5Factors impeding enzymatic wheat gluten hydrolysisat high solid concentrations
65
Chapter 6Starch facilitates enzymatic wheat gluten hydrolysis 85
Chapter 7General discussion 103
References 123
Appendix 141
Summary 151

List of Figures
1.1 Development of world wheat gluten production . . . . . . . . . . . . . 21.2 Schematic overview of the thesis . . . . . . . . . . . . . . . . . . . . . . . 10
2.1 Farinograph dough consistency and peak time . . . . . . . . . . . . . . 192.2 Dynamic oscillation measurements . . . . . . . . . . . . . . . . . . . . . 212.3 Creep-recovery tests . . . . . . . . . . . . . . . . . . . . . . . . . . . . . . 222.4 G′ – comparison with literature . . . . . . . . . . . . . . . . . . . . . . . 252.5 Jc,max – comparison with literature . . . . . . . . . . . . . . . . . . . . . 272.6 Influence of total strain on elastic strain . . . . . . . . . . . . . . . . . . 28
3.1 Dough at 43.5% water content . . . . . . . . . . . . . . . . . . . . . . . . 373.2 Dough at <40% water content . . . . . . . . . . . . . . . . . . . . . . . . 383.3 Shear cell torque . . . . . . . . . . . . . . . . . . . . . . . . . . . . . . . . 393.4 Stained gluten clusters . . . . . . . . . . . . . . . . . . . . . . . . . . . . . 413.5 Shear cell torque and protein content . . . . . . . . . . . . . . . . . . . . 423.6 Shearing time and protein content . . . . . . . . . . . . . . . . . . . . . . 433.7 Microscopy of patches . . . . . . . . . . . . . . . . . . . . . . . . . . . . . 45
4.1 Visual appearance of hydrolysis . . . . . . . . . . . . . . . . . . . . . . . 574.2 Molecular mass distribution . . . . . . . . . . . . . . . . . . . . . . . . . . 594.3 Solubility – NSI . . . . . . . . . . . . . . . . . . . . . . . . . . . . . . . . . 604.4 Foam stability . . . . . . . . . . . . . . . . . . . . . . . . . . . . . . . . . . 61
5.1 Graphical table of contents . . . . . . . . . . . . . . . . . . . . . . . . . . 675.2 DH% over time and solid concentration . . . . . . . . . . . . . . . . . . 725.3 48 h hydrolysis . . . . . . . . . . . . . . . . . . . . . . . . . . . . . . . . . . 735.4 Molecular mass distribution . . . . . . . . . . . . . . . . . . . . . . . . . . 745.5 Water activity and sorption isotherms . . . . . . . . . . . . . . . . . . . . 755.6 Concentration effect – schematic illustration . . . . . . . . . . . . . . . 765.7 DH%×S0 as function of time . . . . . . . . . . . . . . . . . . . . . . . . . 775.8 DH% as function of E0 ×time . . . . . . . . . . . . . . . . . . . . . . . . . 795.9 DH%×S0/E0 as function of E0 . . . . . . . . . . . . . . . . . . . . . . . . 81
6.1 Hydrolysis of WFG and VWG . . . . . . . . . . . . . . . . . . . . . . . . . 926.2 Hydrolysis of VWG + starch and SWG . . . . . . . . . . . . . . . . . . . 936.3 Molecular mass distribution . . . . . . . . . . . . . . . . . . . . . . . . . . 946.4 Solubility – NSI . . . . . . . . . . . . . . . . . . . . . . . . . . . . . . . . . 95
vii

6.5 Influence of the protein content . . . . . . . . . . . . . . . . . . . . . . . 96
7.1 Hydrolysis rate limitation for several enzymes . . . . . . . . . . . . . . 1077.2 Initial rate as function of the solid concentration . . . . . . . . . . . . . 1097.3 Influence of enzyme concentration for several enzymes . . . . . . . . . 1107.4 Sankey diagram of water consumption . . . . . . . . . . . . . . . . . . . 1127.5 Plastein reaction . . . . . . . . . . . . . . . . . . . . . . . . . . . . . . . . . 120
A.1 Inital rate as function of the enzyme concentration . . . . . . . . . . . 143A.2 Inital rate as function of the enzyme concentration . . . . . . . . . . . 144A.3 Sankey diagram with masses . . . . . . . . . . . . . . . . . . . . . . . . . 150
viii

List of Tables
4.1 Sampling parameters . . . . . . . . . . . . . . . . . . . . . . . . . . . . . . 554.2 Water consumption and reactor productivity . . . . . . . . . . . . . . . 63
5.1 Sampling parameters . . . . . . . . . . . . . . . . . . . . . . . . . . . . . . 70
6.1 Sampling parameters . . . . . . . . . . . . . . . . . . . . . . . . . . . . . . 89
7.1 Centrifugal separation – protein content and yield . . . . . . . . . . . . 1137.2 Water, energy, and volume use – gluten separation & hydrolysis . . . 1147.3 Volume use for longer reaction times . . . . . . . . . . . . . . . . . . . . 1167.4 Water, energy, and volume use for xylanase addition . . . . . . . . . . 117
A.1 Two-factor ANOVA – influence of the enzyme . . . . . . . . . . . . . . . 142A.2 Two-factor ANOVA – influence of the water content . . . . . . . . . . . 142A.3 Water, energy, and volume use – separation wheat flour . . . . . . . . 145A.4 General assumptions separation and hydrolysis . . . . . . . . . . . . . . 146A.5 Assumptions standard separation and hydrolysis . . . . . . . . . . . . . 147A.6 Assumptions shear-induced separation and high-solid hydrolysis . . . 148A.7 Assumptions high-solid wheat flour hydrolysis . . . . . . . . . . . . . . 149
ix


List of Symbols
Abbreviations
AX arabinoxylanBU Brabender unitsDH% degree of hydrolysisSWG self-washed gluten from Ibis wheat flourVWG vital wheat glutenVWG + starch vital wheat gluten plus added starchWE-AX water-extractable arabinoxylanWFG gluten present in Ibis wheat flourWU-AX water-unextractable arabinoxylan
Symbols
aw water activity (–)E enzyme concentrationE0 initial enzyme concentrationG′ elastic modulus (Pa)G′′ viscous modulus (Pa)Jc,max maximum creep compliance (kPa−1)Jel relative elastic part (–)km substrate concentration at which V=Vmax
2S solid concentrationSm substrate concentration (Michaelis-Menten eq.)tan δ loss factor (–)V velocity of reactionVmax maximum velocity of reaction


Cha
pter
1
CH
AP
TE
R
1General introduction

Cha
pter
1
Chapter 1
1.1 Introduction
Food production is the largest consumer of water in the world. Approximately
70% of the world water is used for agricultural, 20% for industrial, and 10%
for domestic use [30]. In Europe, 48% of the water is used by industry and
8–15% of this water by the food industry [101]. This is of importance because
freshwater is a scarce good in many regions of the world. Predictions say that
less than 50% of the world’s population will have an adequate water supply in
2025 [27].
Among the crops produced, wheat is the third most important one in the
world [95] and a very important food source. Besides using wheat as a whole, for
instance in breadmaking, wheat is also separated into its individual constituents,
primarily gluten and starch. Fig. 1.1 illustrates that the world gluten production
is still a fraction of the world wheat production, but increases disproportionately.
1 9 7 5 1 9 8 0 1 9 8 5 1 9 9 0 1 9 9 5 2 0 0 0 2 0 0 5 2 0 1 0 2 0 1 50
1 0 0
2 0 0
3 0 0
4 0 0
5 0 0
6 0 0
7 0 0
world
whe
at pr
oduc
tion (
106 to
nnes
)
y e a r
0 . 0
0 . 2
0 . 4
0 . 6
0 . 8
1 . 0
1 . 2
1 . 4 w
orld g
luten
prod
uctio
n (10
6 tonn
es)
Fig. 1.1: Development of world wheat production (�, primary y-axis, [41]) and wheat glutenproduction (4, secondary y-axis, [31]) in million tonnes.
After separation, gluten and starch can be utilized in its native form or
further processed, for instance by means of hydrolysis. Both, the separation
and the hydrolysis of starch and gluten, currently consume copious amounts
of water, which is undesirable from an environmental and economic point of
view. Therefore, this thesis aims at investigating enzyme-assisted starch–gluten
2

Cha
pter
1
General introduction
separation and the subsequent hydrolysis of gluten at low water concentrations,
with an emphasis on the gluten hydrolysis.
The following introduction gives a summary of wheat and its constituents and
the state of the art in starch–gluten separation and gluten hydrolysis. Afterwards,
potentials and drawbacks of intensified wheat processing are shown, followed
by an outline of this thesis.
1.2 Wheat
Wheat benefits from its tolerance to diverse climates: it can be grown from
Scandinavia and Russia in the North, to Argentina in the South [121]. Wheat
is generally cultivated as common wheat (Triticum aestivum) for use in bread,
Asian noodles, cakes or pastries, and as durum wheat (Triticum durum) for use
in pasta or couscous [40].
Wheat is commonly distributed in its milled form as wheat flour, which
contains about 70% starch, 12% protein, 2% lipids, 2–3% non-starch
carbohydrates (arabinoxylan, etc.), and 14% water depending on the type of
flour and the season [129]. In the following, the properties of these fractions
will be summarized.
1.2.1 Wheat starch
Wheat starch consists of the two glucans amylose and amylopectin, with
20–30% amylose and 70–80% amylopectin in most wheat starches [121].
Amylose has a linear polymer structure with a polymerization degree of several
hundred up to 104 [141]. Amylopectin has a branched polymer structure with a
polymerization degree of 105–107. Starch is semi-crystalline with 30% of the
mass being crystalline and 70% amorphous [8]. Wheat starch is present in form
of granules that can be divided into a bigger A-type and a smaller B-type with
diameters of 15–35 µm and 2–10 µm [124]. When wheat is hydrated and
mixed at temperatures below 50 °C, starch maintains its granular form and is
physically entrapped in the gluten network [118].
3

Cha
pter
1
Chapter 1
1.2.2 Wheat gluten
Wheat Gluten, the major protein of wheat, has been defined as the cohesive,
viscoelastic, proteinaceous material prepared as a by-product of the isolation of
starch from wheat flour [32]. Gluten consists of gliadins and glutenins, which
both contribute to the unique viscoelastic properties of wheat dough. Gliadins
are sticky when hydrated and mainly contribute to the viscosity and extensibility
of dough [148]. They are present in gluten as α-, β-, γ-, and ω-gliadin with
molecular masses of 30–80 kDa [129]. Gliadins are mainly present as monomeric
proteins due to their low charge densities and low number of disulphide bridges
[11]. In contrast, hydrated glutenins are both cohesive and elastic and contribute
to the dough strength and elasticity [148]. When reduced with a reducing agent,
glutenins can be divided into two subunits: high molecular weight (HMW) and
low molecular weight (LMW) glutenins with molecular masses of 65–90 and
30–60 kDa [129]. In wheat gluten and flour, glutenins are present as polymeric
proteins linked via disulphide bridges; the resulting clusters reach molecular
masses larger than 10,000 kDa [148]. Wheat gluten is rich in the amino acids
glutamine and proline. Furthermore, except for lysine, it contains all essential
amino acids necessary for humans in the required amounts [31].
1.2.3 Wheat arabinoxylan
Arabinoxylan (AX) is a cell wall component of wheat. The structure of AX is a
linear backbone of β-1,4 linked xylan with arabinose side-chains [137], with
typical A/X-ratios of 0.5 to 0.83 [61]. AX can be divided into water-extractable
(WE-AX) and water-unextractable (WU-AX) arabinoxylan in a ratio of one WE-
AX to three WU-AX [129]. WE-AX and WU-AX have similar structures [10];
the possible reason for the water-extractable nature of WE-AX are incomplete
crosslinking with other cell wall components, and small structural differences
compared to WU-AX. Moreover, initial, incomplete enzymatic degradation in the
kernel may play a role for the water-extractable nature [28].
4
Cha
pter
1
General introduction
1.2.4 Other ingredients
Most of the non-starch polysaccharides in wheat flour are arabinoxylans. The
remaining 15% consist of β -glucan, cellulose and arabinogalactan-peptides [52].
Wheat lipids are present as 50% polar and 50% non-polar lipids. Furthermore,
they are divided into free, bound, and starch lipids. The free lipids show a strong
tendency to ’bind’ to gluten during mixing [129].
Wheat gluten represents 78% of the proteins present in wheat. Besides,
wheat also contains 15% water-soluble albumins and 7% globulins that are
soluble in dilute salt solutions [8].
1.3 From wheat flour to gluten hydrolysate
Refining of wheat into its constituents generates value since the separated
ingredients have many more applications than the wheat itself. If we consider a
typical wheat process starting with the wheat and having the hydrolysate as the
end product, then the process starts with the milling of the wheat kernel,
followed by the separation of the starch and the gluten. The separated starch
fraction is then either used in its native form, predominantly in bakery products
[85], or the starch is often hydrolyzed and used for syrups, an important
ingredient for beverages, or as washing detergent [58]. The separated gluten
fraction can also be either used in its native form or further be processed among
others by means of hydrolysis. We will now discuss starch–gluten separation
and gluten hydrolysis in more detail.
1.3.1 Starch–gluten separation
Wheat starch and gluten are separated industrially by processes such as the
Martin or the batter process [129]. The Martin process is the traditional process
to separate starch and gluten and still in use today. Here, wheat flour is wetted
until a dough forms. In a second step additional water is added to the dough,
washing away the starch and other components from the gluten. In a next step,
centrifugation separates the starch and the water-soluble components.
5

Cha
pter
1
Chapter 1
In the batter process, approximately equal amounts of water and flour are
mixed. A batter forms, which is mechanically broken up by adding more water.
The gluten aggregates formed coalesce to gluten clusters, which are low in
starch, and form a curd-like structure. The gluten curds are then removed using
gyrating sieves [54, 129].
Starch–gluten separation can be enhanced by using xylanases. Xylanases
(endo-1,4- β-xylanases, EC 3.2.1.8) are hydrolases preferably degrading the
xylan backbone of arabinoxylan (AX), causing a decrease in degree of
polymerization. Xylanases differ in their ability to hydrolyze WU-AX and WE-AX.
They are commonly used in the baking industry to improve the dough
manageability and the bread volume [36].
AX have a relatively high water holding capacity. In total, AX have been
reported to hold up to ten times their weight in water [28] and been suggested to
hold up to a quarter of the water present in dough [5, 15]. When xylanases are
added to hydrated wheat, they reduce the water-holding capacity of AX and thus
the dough or batter viscosity. The reduced viscosity then results in an improved
agglomeration of the gluten. This, however, has only been reported for WE-AX
hydrolysis [24, 45]. Mild hydrolysis of WU-AX, on the other hand, influences
the separation negatively because WU-AX solubilizes upon hydrolysis, which
increases the viscosity of the dough or batter. Only when WU-AX is severely
hydrolyzed to a low molecular mass, the viscosity decreases again and hydrolysis
of WU-AX also results in improved gluten agglomeration [47].
1.3.2 Wheat gluten hydrolysis
Wheat gluten is considered to be a byproduct of the production of wheat starch
and therefore available in large quantities at moderate prices, cheaper than
milk or soy proteins [31]. In industry, native wheat gluten is for instance used
as a bread improver, as a binder in meat products and pet food, and to fortify
flours e.g. in breakfast cereals [32]. However, its further application in the food
industry is limited because native wheat gluten is scarcely water-soluble close
to its isoelectric point at pH 6–7. In addition, it has low emulsifying activity
6

Cha
pter
1
General introduction
and does not produce steady foams [111]. One possibility to overcome these
limitations is to hydrolyze wheat gluten.
Enzymatic hydrolysis of wheat gluten improves the water solubility at neutral
pH [23, 69]. Mild enzymatic hydrolysis is mainly performed to alter functional
properties such as foaming and emulsifying properties [80, 92], and in bakery
to soften hard wheat gluten [37]. Extensive enzymatic hydrolysis is performed
to use gluten for instance as a savory flavoring agent [51], in sports nutrition
[13], and for the production of hypoallergenic foods [25].
Wheat gluten can be hydrolyzed using acids or enzymes (i.e. proteases). The
usage of acids is accompanied by several disadvantages, such as the formation
of undesirable tastes and toxic components [25]. Furthermore, the use of acids
leads to large amounts of salt after neutralization of the product. Enzymes,
on the other hand, possess several advantages over acids like milder process
conditions and no undesirable side reactions, while the functional properties
of the final product can be better controlled by choosing specific enzymes [68].
Furthermore, enzymes are biodegradable and can remain in the final product
when inactivated. On the downside, enzymatic hydrolysis usually results in
incomplete hydrolysis and may lead to products with a bitter (off-)taste [22].
In most cases, the bitterness problem can be resolved using specific proteases.
However, these proteases are costly and determine the overall costs of the final
product to a large extent [38].
Proteases (EC 3.4) are classified according to the nature of their catalytic
site (aspartic, glutamic, metallo, cysteine, serine, and threonine proteases) and
their origin (microbial, animal, plant) [81, 98]. Furthermore, it is divided
between proteases hydrolyzing internal peptide bonds (endopeptidase or
proteinase) and proteases cleaving terminal peptide bonds or di- or tripeptides
(exopeptidase or peptidase) [48]. Proteases are very diverse regarding their
specificity: Some proteases are exclusively specific towards a unique peptide
bond, such as the angiotensin-converting enzyme [81]. Other proteases are
unselective and randomly cleave many different peptide bonds, which allows
the hydrolysis to higher degrees of hydrolysis (DH%). Commercial enzyme
mixtures often contain proteases with different catalytic sites and exo and endo
7
Cha
pter
1
Chapter 1
activities [98]. In this thesis, only commercial enzyme mixtures are used with
the aim to hydrolyze to high DH%.
1.4 Intensification of the process
As mentioned, the separation and the hydrolysis of gluten currently consume
copious amounts of water: Conventional starch–gluten separation often requires
10 to 15 L of water per kg of dry matter [119]. Typical wheat gluten
concentrations for enzymatic hydrolysis at neutral pH are around 20%
[22, 84, 152] equivalent to 4 L of water per kg dry matter.
Alternatively, starch and gluten can be separated by applying a curvilinear
shear flow in an in-house building shearing device (Wageningen University, The
Netherlands) allowing more concentrated conditions. This has been extensively
studied at water contents down to 42% (i.e. 0.7 L water per kg dry matter)
[103, 104, 133, 134, 135]. However, little is known about combining the addition
of xylanases with shear-induced starch–gluten separation. Furthermore, little
is known about the rheological behavior of dough in general at water contents
below 40% and the addition of xylanases.
Likewise, wheat gluten hydrolysis may be performed at higher solid loadings.
To the best of our knowledge, this has never been studied. Also the hydrolysis
of other proteins at high solid contents has rarely been investigated [16, 71,
113]. A little more is known about high-solid hydrolysis of polysaccharides, for
instance for the hydrolysis of cellulose and lignocellulose for biofuel production
[43, 59, 72, 110] or wheat starch [6, 130, 131].
Generally, aiming at lower water concentrations provides several benefits:
(1) System capacity: A higher solid concentration results in a larger system
capacity either by a higher throughput in existing equipment or by smaller
reactors, which reduces the capital costs. (2) Energy usage: At higher solid
concentrations, less energy is required for heating and cooling during the process
and the consequent dehydration of the product, which reduces the operating costs.
Furthermore, wheat gluten is often dried employing ring driers at 20% moisture,
which involves mixing of wet gluten with dry gluten [31]. Hence, ring drying
requires less addition of dry gluten when the preceding process is performed
8

Cha
pter
1
General introduction
at higher solid concentrations. (3) Wastewater: Higher solid concentrations
produce less wastewater with inherently lower treatment and disposal costs
while more of the raw material will end up in the product, instead of in the
wastewater. (4) Downstream processing: Higher product concentrations can
facilitate the downstream processing and lower the downstream processing costs
[59, 94].
On the downside, aiming at lower water concentrations also creates new
challenges: (1) Mixing problems: A higher solid concentration results in an
increased viscosity. This increased viscosity may lead to insufficient mixing and
can be highly energy consuming in conventional stirring tanks [72]. Furthermore,
the control of reaction parameters, such as pH and temperature is hampered
at high solid concentrations. Besides, water acts as the solvent for the enzyme
and as the transport medium for the substrate and the product. Thus, higher
solid concentrations can lead to diffusional limitations. (2) Water availability:
The water activity decreases at low water contents, which influences the enzyme
activity and possibly the thermodynamic equilibrium of the hydrolysis reaction.
(3) Enzyme inhibition and inactivation: Higher amounts of substrate and product
can lead to enhanced substrate and product inhibition, influencing the enzyme
kinetics. Furthermore, proteases can be substrate to other proteases, which can
result in self-inactivation. At higher solid concentrations, often higher enzyme
contents are needed. Therefore, higher enzyme contents can also lead to higher
rates of self-inactivation.
1.5 Thesis Outline
The objective of this research is to investigate the effect of increased dry matter
concentrations and enzyme usage on a full wheat process chain from wheat flour
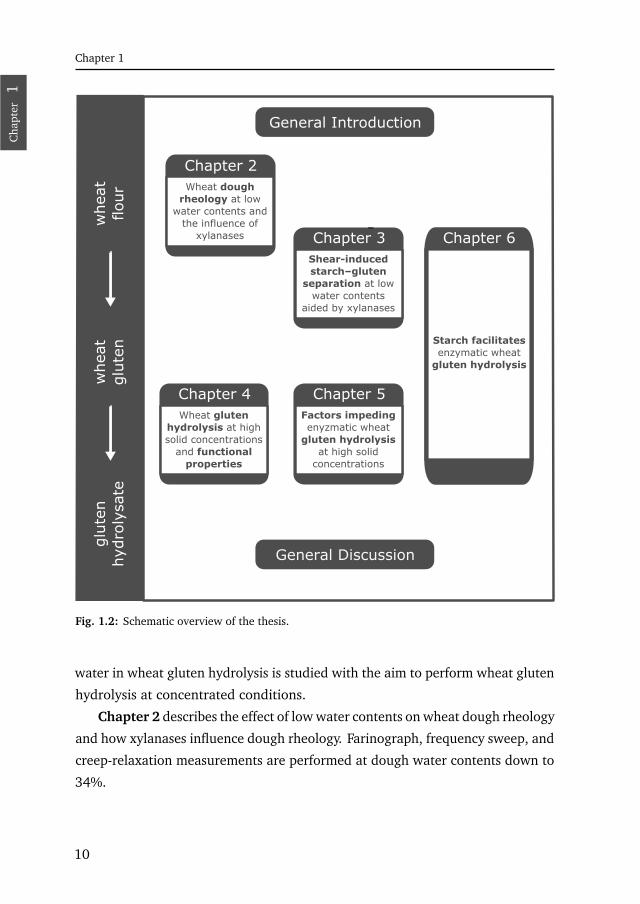
to a wheat gluten hydrolysate. A schematic overview of this thesis is given in
Fig. 1.2. This research study is divided into two parts: First, the role of xylanases
in high dry matter dough is studied with the aim to further reduce the water
content in the shear-induced starch–gluten separation. It is hypothesized that
the water held by AX is released during the enzymatic degradation of AX, giving
the opportunity to further increase the dry matter content. Second, the role of
9
Cha
pter
1
Chapter 1
GeneralmIntroduction
glu
ten
hyd
roly
sate
GeneralmDiscussion
whea
tmglu
ten
whea
tmflou
r
Chapterm2Wheat dough
rheologymatmlowmwatermcontentsmandm
theminfluencemofmxylanases Chapterm3
Shear-induced starch–gluten
separationmatmlowmwatermcontentsm
aidedmbymxylanases
Chapterm4Wheat gluten
hydrolysismatmhighmsolidmconcentrationsm
andmfunctional properties
Chapterm5Factors impeding enyzmaticmwheat
gluten hydrolysis atmhighmsolidm
concentrations
Chapterm6
Starch facilitatesmenzymaticmwheat
gluten hydrolysis
–
Fig. 1.2: Schematic overview of the thesis.
water in wheat gluten hydrolysis is studied with the aim to perform wheat gluten
hydrolysis at concentrated conditions.
Chapter 2 describes the effect of low water contents on wheat dough rheology
and how xylanases influence dough rheology. Farinograph, frequency sweep, and
creep-relaxation measurements are performed at dough water contents down to
34%.
10

Cha
pter
1
General introduction
Chapter 3 describes the influence of xylanases on the shear-induced starch–
gluten separation by releasing water associated with arabinoxylan. It is studied
how low water contents and xylanases influence the separation mechanism and
the protein content of the gluten-rich clusters.
Chapter 4 introduces enzymatic wheat gluten hydrolysis at high solid
concentrations and studies how the solid concentration during hydrolysis affects
the functional properties and the molecular mass distribution of the resulting
hydrolysates. Furthermore, the industrial potential of high-solid wheat gluten
hydrolysis is shown. Despite the advantages of high-solid gluten hydrolysis, a
lower degrees of hydrolysis at increased wheat gluten concentrations and
constant enzyme-to-substrate ratios is observed. In chapter 5 we study possible
causes of this concentration effect, namely mass transfer limitations, enzyme
inhibition, enzyme inactivation, water activity, and the plastein reaction.
Chapter 6 studies wheat gluten hydrolysis in wheat flour at high solid
contents before starch and gluten are separated. Wheat flour and vital wheat
gluten are hydrolyzed at different solid but the same protein contents.
Furthermore, the influence of starch on wheat gluten hydrolysis is evaluated by
hydrolyzing vital wheat gluten with starch addition and by investigating the
influence of the wheat flour concentration from 20% to 70% (w/w) on the
hydrolysis.
The general discussion in chapter 7 summarizes and generalizes the main
findings of this thesis and compares the current status in starch–gluten separation
and gluten hydrolysis with the concentrated separation and hydrolysis processes
developed in this study. In the end, future prospects in high-solid wheat gluten
hydrolysis are briefly discussed.
11

Cha
pter
1

Cha
pter
2C
hapt
er2
CH
AP
TE
R
2Wheat dough rheology at low water
content and the influence of xylanases

Cha
pter
2C
hapt
er2
Chapter 2
Abstract
We report the effect of low water content and xylanases on wheat dough
rheology. Farinograph, dynamic oscillation, and creep-recovery measurements
were performed using water concentrations from 34–44.8% (total basis). A
water reduction from 43.5–44.8% to 34% increased G′ and G′′-values, increased
resistance upon mixing as evidenced by higher Farinograph Brabender Unit
values, and decreased the maximum creep compliance by 1–2 orders of
magnitude. Furthermore, it was investigated whether the influence of the water
content on G′ and creep-relaxation tests was similar at higher water contents
previously reported with this study at low water content. The results obtained at
these low water conditions were in line with extrapolated data from literature.
Addition of an endoxylanase with a higher selectivity for water-unextractable
arabinoxylans and an endoxylanase with a higher selectivity for
water-extractable arabinoxylans both resulted in lower G′ and Farinograph
dough consistencies and an increase in maximum creep compliance. The major
influence of both xylanases was the release of water with possible water
reductions of 2–5% (on water basis). However, no distinct differences between
the two xylanases were observed.
This chapter has been submitted as:Hardt, N. A., R. M. Boom, and A. J. van der Goot. Wheat dough rheology at low watercontents and the influence of xylanases.
14

Cha
pter
2C
hapt
er2
Wheat dough rheology at low water content and the influence of xylanases
2.1 Introduction
Mixing water and wheat flour at the right proportion results in a heterogeneous
dough system mainly consisting of a hydrated gluten network with embedded
starch granules. It is the contribution of the gluten proteins that allows wheat
to form a viscoelastic and strain-hardening dough. However, a dough is only
obtained in a relatively small concentration range of about 30–55% (total basis)
water. Lower water contents result in a cohesive and wetted powder; higher
water contents result in a batter.
Since the biopolymers in wheat are immiscible, water is present in each
respective phase and at the interphases [44]. As a result, water influences the
rheological behavior of dough. It has been reported that increasing water
contents reduce Farinograph Brabender Units (BU) [79] and G′ and G′′ in
dynamic oscillation measurements [49, 63]. In creep-relaxation tests, the creep
compliance increases with increasing water contents at constant stress, whereas
the elastic contribution decreases [63, 88].
Wheat dough rheology is mainly studied in literature with the goal to relate
it to the breadmaking quality at water concentrations representing optimal water
absorption and higher. To the best of our knowledge, wheat dough rheology
has only been described to water concentrations as low as 41–42% [79, 83,
122]. Studying dough rheology at lower water concentrations would extend our
understanding of the role of water in dough. Moreover, aiming at lower water
concentrations in processes in general is advantageous from an environmental
and economic point of view. First, more concentrated conditions result in larger
system capacities and in less drying energy and time in case the final product
needs to be dried [57]. Second, more concentrated conditions require less water
and produce less wastewater with inherently lower treatment and disposal costs
while more of the raw material will end up in the product instead of in the
wastewater. In practice, wheat doughs with water contents below optimal water
absorption can for instance be used in pasta production using durum wheat and
extrusion processes [74], or in shear-induced starch–gluten separation [55].
The amount of water added to dough is determined by the water needed to
fully hydrate the gluten. However, wheat contains water absorbing components
15

Cha
pter
2C
hapt
er2
Chapter 2
such as arabinoxylan (AX) that compete with gluten for water [144, 145]. AX
is present in wheat flour as water-extractable arabinoxylan (WE-AX) at 0.5%
(w/w) and as water-unextractable arabinoxylan (WU-AX) at 1.5% (w/w) [129]
with water-holding capacities up to 9.9 g water/g WU-AX and 6.3 g water/g
WE-AX [28]. Hydrolyzing AX by means of xylanases could release water and
make it available for gluten hydration, which would reduce the overall water
addition to dough. The approach of using reduced water contents with the help
of xylanases has been used previously for pasta production [14]. However, to the
best of our knowledge, low water content in combination with xylanase addition
have never been studied regarding wheat dough rheology.
2.2 Materials & Methods
2.2.1 Materials
Soissons wheat flour from a single, common wheat cultivar was obtained from
Meneba (Rotterdam, The Netherlands). The water and protein content were
14.4±0.4% and 10.7±0.4% (N×5.7), respectively (all by weight). Farinograph
optimal water absorption was 55.8% on 14% moisture basis (AACC-method
54-21). Shearzyme 500L was kindly provided by Novozymes A/S (Bagsværd,
Denmark). Shearzyme is a monocomponent endoxylanase from Aspergillus
aculeatus with a greater selectivity for WE-AX [45]. Grindamyl POWERBake 950
was kindly supplied by Danisco A/S (Brabrand, Denmark). Grindamyl
POWERBake 950 is an endoxylanase from Bacillus subtilis with a greater
selectivity for WU-AX [109]. The xylanases will be referred to as Shearzyme and
Grindamyl in the following. Tap water was used in all experiments.
2.2.2 Water and enzyme contents
Water contents of 34%, 36%, 38%, 39.5%, 41.5%, 43.5%, and 44.8% (based on
total weight) were used in this study similar to Hardt et al. [55]. This corresponds
to Farinograph water absorptions of 29.7%, 33.8%, 38.1%, 41.5%, 46.3%, 51.5%,
and 55.1% (all on 14.4% flour moisture basis). It was assumed that the wheat
flour consisted of 0.5% WE-AX and 1.5% WU-AX [129]. Enzyme-to-substrate
16

Cha
pter
2C
hapt
er2
Wheat dough rheology at low water content and the influence of xylanases
ratios of 1:6 (0.17 g enzyme/g WE-AX) in case of Shearzyme and 1:9 (0.11 g
enzyme/g WU-AX) in case of Grindamyl were used to ensure a high enzyme
activity and to limit inhibition.
2.2.3 Farinograph
A 50-g mixer connected to a Do-corder E330 equipped with a PL2100 computer
interface and controller unit (Brabender, Duisburg, Germany) for torque
measurement was used to evaluate the Farinograph dough characteristics
according to AACC-method 54-21 at 30 °C. Farinograph dough consistencies are
typically expressed in Brabender Units (BU), with 1 BU = 0.00196 Nm in a 50-g
mixer.
2.2.4 Dynamic oscillation and creep-recovery measurements
Tap water at 35 °C was added to wheat flour in a 10-g Farinograph mixer and
mixed for 5 min at 40 °C. The temperature of 40 °C was chosen to have a balance
between a practical temperature for dough mixing and the optimum temperature
of Grindamyl and Shearzyme of 50 °C [109] and 70 °C [89], respectively. The
mixing time was kept constant to allow constant times of the xylanases to be
active. Nevertheless, all samples with water contents higher than 34% had peak
times of 6 min or below (Fig. 2.1). After mixing, the samples were sealed in a
plastic bag and rested at room temperature for 15 min before application in the
rheometer.
Dynamic oscillation and creep-recovery measurements were performed
employing a Physica MCR 301 rheometer (Anton Paar, Germany). A plate–plate
geometry was used with profiled plates and a plate diameter of 25 mm,
operated at 20 °C. A piece from the inside of the dough from the plastic bag was
placed on the rheometer. The sample was gently trimmed after compressing and
fixed at a 2 mm gap. At 34% water content, the compression to the 2 mm gap
could take up to 15 min. Drying was prevented by placing a wetted tissue next
to the plates combined with a solvent trap.
Dynamic oscillation measurements. G′, G′′, and consequently tan δ =
G′′/G′ were determined over a frequency of 0.1 Hz to 10 Hz. The strain was
17

Cha
pter
2C
hapt
er2
Chapter 2
0.01% and measured to be within the linear viscoelastic region. The samples were
allowed to rest an additional 5 min on the rheometer before the measurement,
i.e. the samples rested a total of 20 min, allowing a careful balance between
relaxation and a possible drying of the sample. Moreover, a resting time of
20 min is common in literature, e.g. [49, 63]. Resting times were kept constant
because of the xylanase addition. Experiments were performed in triplicate.
Creep-recovery measurements were performed by applying 1000 Pa for
1 min and recording the relaxation for 5 min at 0 Pa. The shear stress of 1000 Pa
was chosen to allow strains above 0.5% at 34% water content. Samples were
allowed to rest an additional 15 min on the rheometer before the measurement.
The maximum creep compliance Jc,max (kPa−1) after 1 min and the creep recovery
compliance Jr (kPa−1) after another 5 min were recorded. Subsequently, the
relative elastic part Jel = Jr/Jc,max was derived. Experiments were performed in
triplicate.
2.2.5 Statistical analysis
A two-factor analysis of variance was performed to test significant differences
(α= 0.05) in water content and enzyme addition using SPSS version 19.0. We
chose an ANOVA because it allowed the comparison of samples with and without
xylanase addition in the whole water content range used, using more data points
for comparison. The results of all two-factor ANOVAs can be found in appendix
A.1. Data were normally distributed based on the Shapiro–Wilk test. Logarithmic
values were used to test significant differences in dough consistency, G′ and Jc,max
for different water contents. Experiments at 34% water content were single
experiments, since the applied forces at 34% water were close to the rheometer’s
limit. Therefore, they were excluded in the ANOVA. Significance tests for Jc,max
were only performed up to water contents of 39.5%. In the following text, the
word significant will only be used to refer to statistically significant results of the
ANOVA.
A simple power law fit: a × xn was used to fit the dough consistency and
G′ as a function of the water content similar to Lefebvre and Mahmoudi [78].
We would like to stress that the primary goal was expressing the non-linear
18

Cha
pter
2C
hapt
er2
Wheat dough rheology at low water content and the influence of xylanases
relationship between the respective rheological parameter and the water content
and not to obtain the most suitable fit.
2.2.6 Digitizing data from literature
Data from literature was extracted using the software Engauge Digitizer 4.1. To
reduce the number of displayed publications for a better clarity of the graphs,
only studies with at least three different tested water contents were taken into
consideration. For frequency sweeps G′-values had to be measured at 1 Hz and
strains and temperature did not exceed 0.2% and 30 °C. In several studies, the
water content was given as water absorption instead of water content on total
basis; we corrected for this. A water content of 14% was assumed for those
wheat flours for which no water content was specified.
2.3 Results
2.3.1 Farinograph
Fig. 2.1 shows the influence of low water content and xylanase addition on
the Farinograph peak time and consistency after 30 min. Decreasing the water
1 0 2
1 0 3
1 0 4
cons
isten
cy af
ter 30
minu
tes (B
U)
3 3 3 6 3 9 4 2 4 50
5
1 0
1 5
2 0
2 5
3 0 n o x y l a n a s e G r i n d a m y l S h e a r z y m e
peak
time (
min)
w a t e r c o n t e n t ( % o n t o t a l b a s i s )
Fig. 2.1: Farinograph dough consistency after 30 min (closed symbols) and peak time (opensymbols). R2 > 0.99 for all power law fits. Please note the log–log plot. The entire mixing profilesare shown in appendix A.2.
19

Cha
pter
2C
hapt
er2
Chapter 2
content resulted in longer peak times for water contents below 40%. The addition
of both xylanases showed no statistically significant influence on the peak time. At
34% water content, the peak time increased noticeably and it might be doubtful
whether it was actually reached after 30 min, when the experiment was ended.
This was the only water concentration at which the gluten was not sufficiently
hydrated to form a coherent dough within 5 min.
The dough consistency in Farinograph experiments is generally expressed in
Brabender Units (BU). We plotted the averaged values recorded of the last 30 s
of every experiment (i.e. after 30 min of running) to allow enough time for AX
hydrolysis to occur. Without enzyme the dough consistency increased upon water
reduction. This water effect could be described by a power law (R2 > 0.99).
The addition of Shearzyme and Grindamyl significantly decreased the dough
consistency at every water content, with the decrease being more pronounced at
higher water contents. No significant differences were found between Shearzyme
and Grindamyl regarding dough consistency and peak time. The entire mixing
profiles of the different water contents can be found in appendix A.2.
2.3.2 Dynamic oscillation measurements
Fig. 2.2 displays the influence of low water content and xylanase addition on
G′, G′′, and tan δ. Decreasing the water content from 43.5% to 34% led to a
fortyfold non-linear increase in G′ and G′′ (Fig. 2.2a). Increasing the frequency
from 0.3 to 10 Hz showed the typical increase in G′ and G′′ following power law,
but this frequency-caused increase was rather independent of the water content;
the power law index n remained between 0.18 to 0.22 for G′ and 0.24 to 0.28
for G′′ in the frequency range of 1 to 10 Hz.
The addition of Shearzyme and Grindamyl significantly decreased G′ at
all water contents compared to dough without xylanase (Fig. 2.2b). However,
no significant difference in G′ was found between Shearzyme and Grindamyl.
Furthermore, the addition of both enzymes increased tan δ at water contents
below 43.5% (Fig. 2.2c). At 43.5% water content, tan δ also slightly increased
for no xylanase addition from 0.310 to 0.349. Nevertheless, overall, the increase
in tan δ was statistically significant for Grindamyl compared to no xylanase
20

Cha
pter
2C
hapt
er2
Wheat dough rheology at low water content and the influence of xylanases
0 . 1 1 1 0
1 0 4
1 0 5
1 0 6
3 3 3 6 3 9 4 2 4 5
1 0 4
1 0 5
1 0 6
3 3 3 6 3 9 4 2 4 50 . 0
0 . 2
0 . 4
0 . 6
a
3 4 % 3 6 % 3 8 % 3 9 . 5 % 4 3 . 5 %
G', G
'' (Pa
)
f r e q u e n c y ( H z )
b
n o x y l a n a s e G r i n d a m y l S h e a r z y m e
G' at
1 Hz
(Pa)
w a t e r c o n t e n t ( % o n t o t a l b a s i s )
c
n o x y l a n a s e G r i n d a m y l S h e a r z y m e
tan δ
w a t e r c o n t e n t ( % o n t o t a l b a s i s )
Fig. 2.2: (a) Influence of the water content on G′ and G′′ at different frequencies without enzymeaddition. The legend indicates the water content. Closed and open symbols represent G′ andG′′ respectively. Error bars represent the standard deviation and are only shown for G′′ but weresimilar for G′. (b) Influence of the water content on G′ at 1 Hz with and without xylanase addition.R2 > 0.98 for all power law fits. (c) tan δ at 1 Hz at different water contents. Standard deviationis only shown if > 0.03. Please note the log–log plot.
addition. The increase in tan δ for Shearzyme addition was not statistically
significant.
2.3.3 Creep-relaxation measurements
Fig. 2.3 depicts the influence of the water content and xylanase addition on the
maximum creep compliance Jc,max and the relative elastic part Jel. Increasing
the water content from 34% to 43.5% resulted in a non-linear increase in Jc,max
of more than two orders of magnitude with and without xylanase addition
(Fig. 2.3a). Furthermore, an increase in slope was observed above 39.5%.
Xylanase addition significantly increased Jc,max.
21

Cha
pter
2C
hapt
er2
Chapter 2
3 3 3 6 3 9 4 2 4 51 0 - 3
1 0 - 2
1 0 - 1
1 0 0
1 0 1
3 3 3 6 3 9 4 2 4 50 . 0
0 . 2
0 . 4
0 . 6
0 . 8
1 . 0a
n o x y l a n a s e G r i n d a m y l S h e a r z y m e
J c,max
(kPa
-1)
w a t e r c o n t e n t ( % o n t o t a l b a s i s )
n o x y l a n a s e G r i n d a m y l S h e a r z y m e
b
J el (-)
w a t e r c o n t e n t ( % o n t o t a l b a s i s )
Fig. 2.3: Creep-recovery tests. (a) Jc,max after 1 min at an applied shear stress of 1000 Pa. (b) Jel
after another 5 min at 0 Pa. Error bars represent the standard deviation. Please note the log–logplot.
At water contents below 40%, xylanase addition had no significant influence
on Jel (Fig. 2.3b). However, higher water contents overall resulted in significantly
lower Jel at all water contents, although at water contents below 40% the effect
was rather small. For instance, Jel remained between 0.71 and 0.77 between
36% and 39.5% water content. The scatter in Jel at 34% can be traced back to
the fact that experiments were only performed once. At 43.5% water content, Jel
decreased considerably with and without xylanase addition compared to water
contents < 40%. With xylanase addition this decrease was even more distinct
with Jel < 0.1. No statistically significant differences between Shearzyme and
Grindamyl were found in Jc,max and Jel at all water contents.
Jel and tan δ both characterize the elastic properties of the dough. The reason
why Jel (Fig. 2.3b) showed a greater dependency on the water content than
tan δ (Fig. 2.2c) can be related to the applied forces. While tan δ measurements
were performed in the linear viscoelastic region of the dough, Jel measurements
were performed outside the linear viscoelastic region. Consequently, the applied
torque values in the rheometer were 12 to 1100 times higher for Jel than for
tan δ at 1 Hz depending on the water content and xylanase used.
22

Cha
pter
2C
hapt
er2
Wheat dough rheology at low water content and the influence of xylanases
2.4 Discussion
Decreasing the water content from 43.5% to 34% resulted in an increase in
dough consistency (Fig. 2.1), G′ and G′′ (Fig. 2.2), and a decrease in Jc,max
(Fig. 2.3) of 1–2 orders of magnitude. The addition of both xylanases showed
the same effect as the addition of water. Below, we will evaluate the role of water
in wheat dough rheology at very low water content and compare our results to
wheat doughs at higher water contents. Furthermore, we will discuss the effect
of xylanase addition on wheat dough rheology.
2.4.1 Farinograph
The observed increase in dough consistency for decreasing water contents without
xylanase addition (Fig. 2.1) is in agreement with the trend obtained by Létang
et al. [79], obtaining similar BU-values in a water content range of 41.5% to
45%. However, opposed to our study, water content and dough consistency
were presented to be linearly correlated at water contents from 41.5% to 50.5%
[42, 79]. Daniels [29], though, also showed a non-linear relationship between
the water content and the torque down to 34% water content, albeit in a different
mixing device.
2.4.2 Dynamic oscillation measurements
Small deformation rheological tests, such as dynamic oscillation measurements,
indicate the linear viscoelastic behavior of wheat dough. While it is agreed that
the presence of starch narrows the linear viscoelastic range of wheat dough
[66, 126], the influence of starch–starch, starch–protein, and protein–protein
interactions on G′ (and G′′) has remained controversial. Different authors
suggested that starch–starch and starch–protein interactions determine G′ to a
large extent at small deformations, since weak wheat flours with consequent
higher starch contents and starch–gluten blends with higher starch contents
showed higher G′ than strong wheat flours and starch–gluten blends with lower
starch contents [66, 67, 107]. In contrast, Lefebvre [76] pointed out that starch
granules are unable to form networks. Instead, they act as large particles with
hydrodynamic forces dominating over particle-particle interactions. This supports
23

Cha
pter
2C
hapt
er2
Chapter 2
that the protein determines the linear viscoelastic behavior in small deformation
tests.
Investigating the influence of a distinct wheat component on G′ by changing
the component’s content inevitably changes the contents of all other
components and their ratios to one another. Therefore, also the role of water
must be considered to understand the influence of starch and gluten on G′. For
instance, Uthayakumaran et al. [126] showed that replacing wheat gluten by
starch decreased G′ at constant water contents, which seems contradictory to
the findings mentioned regarding flours high in starch. However, the authors
further showed that starch addition increased G′ when performing the
experiments at optimal water absorption instead of at constant water contents.
Fig. 2.2b illustrates that decreasing water contents increased G′ at 1 Hz in a
non-linear fashion. Obviously, the total water content, the amount of free water,
and the water distribution among the wheat components need to be considered
when understanding wheat dough rheology.
The wheat flour used in this study had a dry matter-to-water ratio of 1.23:1
at optimal water absorption. This ratio reached almost 2:1 at 34% water content.
Consequently, the competition for water among the wheat ingredients increased
at these low water content. The question is, whether water depletion below
40% water content favored one of the phases, e.g. the gluten phase, regarding
the water distribution. The results presented indicated that the slopes of the
graphs of the dough consistency (Fig. 2.1) and G′ (Fig. 2.2b) as function of
the moisture content remained constant, which suggests that decreasing water
contents down to 34% water content decreased the amount of free water rather
than water binding to starch, gluten, etc. As a result, the dough consistency and
G′ increased at lower water contents, since water acts as a plasticizer in dough
[35], but not because the mechanism of hydration changed. This argumentation
is supported by literature. As mentioned, water is present in dough in each
respective phase (i.e. gluten, starch, AX, etc.) and at the interphases [44]. Here,
dough is hydrated by the first and second monolayers, by capillary condensation,
and by free water [114]. Using NMR-T2 relaxation times, Ruan et al. [114]
observed the formation of a liquid “free” water phase sufficient to mobilize the
flour constituents at water contents above 35%, which relates to the lowest water
24

Cha
pter
2C
hapt
er2
Wheat dough rheology at low water content and the influence of xylanases
content used in this study. Furthermore, it was shown that at water contents
above 33% the amount of free water increases for increasing water contents
whereas the amount of tighter-bound water remains constant [35].
To obtain a better view on the impact of the water content on the slope of the
non-linear decrease in G′, Fig. 2.4 compares the influence of the water content
on G′ at 1 Hz at low water content (Fig. 2.2b) with higher water contents up to
51% reported in literature.
Our results from 34% to 43.5% water content fall in line with the values in
literature at higher water contents. G′ reduces in a steady, non-linear fashion over
the whole water content range in which a dough is formed. This is displayed by
the similar trends of the power law exponent n, with −10< n< −19 in literature
and n = −15.4 in this study and corresponding high R2. The differences in G′ at
constant water contents can be explained by differences in the wheat cultivar,
with consequent differences in protein content, protein composition, and water
absorption. Furthermore, the behavior of tan δ also supports that water acts as
3 0 3 5 4 0 4 5 5 0 5 51 0 2
1 0 3
1 0 4
1 0 5
1 0 6
�* !)�)*+�-��n �� �������������&(�&'&+#&)�e t a l . ��������n ���������������"#���%�����"�(������n ���������������.*�%��e t a l . ��������n ��������������%!�e t a l . �������n ����������� ���)*(&$�**�&�e t a l . �������n ���������������"�%�!�e t a l . �������n �����������
G' at
1 Hz
(Pa)
,�*�(��&%*�%*����&%�*&*�#���)!)�Fig. 2.4: Influence of the water content on G′ at 1 Hz. Comparison with literature at a watercontent range from 34% to 51%. Trend lines are power law fits. Power law exponent n and R2 aregiven in the legend derived from a simple power law fit: a × xn. Please note the log–log plot. 1
durum wheat. 2 wheat cultivar Yekora. Sources: Georgopoulos et al. [49], Jekle and Becker [63],Létang et al. [79], Mani et al. [83], Mastromatteo et al. [88], Skendi et al. [122].
25

Cha
pter
2C
hapt
er2
Chapter 2
a plasticizer in dough that changes the values of the rheological parameters, but
not the hydration of dough as such. Fig. 2.2c shows tan δ to be independent of
the water content at water contents below 40%. Even a further water content
increase to 43.5% affected tan δ only slightly, with at most a 13% increase. This
is in line with most studies found in literature, revealing either no influence of the
water content on tan δ [9, 79], or only a slight increase in tan δ for increasing
water contents [63].
2.4.3 Creep-relaxation
Since water acts as a plasticizer in dough, applying a constant stress will increase
Jc,max when adding water, as observed in Fig. 2.3a. However, a change in slope
for the non-linear increase was observed for water contents above 40% because
high strains generally lead to disorientation of the dough structure. Hence, Jc,max
was also a function of the elastic and viscous deformation. At higher water
contents the influence of the viscous part increased as seen in Fig. 2.3b, which
explains the change in slope observed in Fig. 2.3a. Fig. 2.5 compares our results
for Jc,max at low water content with higher water contents up to 51% reported in
literature.
Similar to our observations, the slope of the non-linear increase in Jc,max is
generally larger at higher than at lower water contents. Also, a change in slope
can be seen in some studies for increasing water contents [63]. The observed
differences in Jc,max in the different studies can be explained by differences in
the wheat cultivar and the applied stresses.
While in the linear viscoelastic region Jc,max is independent of the force
applied, Jc,max increases with increasing force in the non-linear viscoelastic
region. The transition from linear to non-linear viscoelastic region has been
shown to occur above 10 Pa for a common wheat cultivar at optimal water
absorption [128], which is considerably lower than the forces used and depicted
in Fig. 2.5. The question is whether the higher increase in Jc,max at higher water
contents was only caused by disorientation and damage of the dough structure
[127, 147], or whether the water content also explains the higher increase in
Jc,max and the consequent decline in Jel. To test this, Fig. 2.6 shows the effect of
the total strain on the recoverable, elastic strain. The approach to compare the
26

Cha
pter
2C
hapt
er2
Wheat dough rheology at low water content and the influence of xylanases
3 0 3 5 4 0 4 5 5 0 5 51 0 - 3
1 0 - 2
1 0 - 1
1 0 0
1 0 1
1 0 2
t h i s s t u d y , 1 0 0 0 P a E d w a r d s e t a l . ( 1 9 9 9 ) 1 , 4 , 1 0 0 P a J e k l e a n d B e c k e r ( 2 0 1 1 ) 3 , 2 5 0 P a M a s t r o m a t t e o e t a l . ( 2 0 1 3 ) 4 , 5 0 P a S k e n d i e t a l . ( 2 0 1 0 ) 2 , 2 5 0 P a S k e n d i e t a l . ( 2 0 1 0 ) 2 , 5 0 P a
J c,max
(kPa
-1)
w a t e r c o n t e n t ( % o n t o t a l b a s i s )Fig. 2.5: Jc,max recorded after 1 min. Comparison with literature at a water content range from34% to 51%. The legend indicates the literature source and the applied stress. Please note thelog–log plot. 1 wheat cultivar Durex. 2 wheat cultivar Yekora. 3 Jc,max recorded after 3 min. 4
durum wheat. Sources: Edwards et al. [39], Jekle and Becker [63], Mastromatteo et al. [88],Skendi et al. [122].
total strain with the elastic strain has been used previously by Lefebvre [77] for
creep times ≥3 h at constant water contents. Here, we compare the total strain
to the elastic strain of our study with other studies at short creep times. In all
studies, higher strains were achieved with higher water contents, except for van
Bockstaele et al. [128] who used higher stresses.
Remarkably, the data from almost all studies form a master curve. At low
strains most of the deformation can be recovered. When reaching strains above
10%, the dough deformation is too high and results in disorientation and damage
of the dough structure. As a result, the increase in elastic strain levels off and the
irreversible strain increases. The irreversible strain is the distance between the
line of identity and the data points. Lefebvre [77] showed very similar results
for longer creep times by using different wheat cultivars. He further showed that
gluten shows exactly the same behavior, meaning that the relaxation behavior of
27

Cha
pter
2C
hapt
er2
Chapter 2
1 0 - 3 1 0 - 2 1 0 - 1 1 0 0 1 0 11 0 - 3
1 0 - 2
1 0 - 1
1 0 0
1 0 1 t h i s s t u d y , n o x y l a n a s e t h i s s t u d y , G r i n d a m y l t h i s s t u d y , S h e a r z y m e E d w a r d s e t a l . ( 1 9 9 9 ) 1 , 5
J e k l e a n d B e c k e r ( 2 0 1 1 ) 3
M a s t r o m a t t e o e t a l . ( 2 0 1 3 ) 5
S k e n d i e t a l . ( 2 0 1 0 ) 2 , 2 5 0 P a S k e n d i e t a l . ( 2 0 1 0 ) 2 , 5 0 P a v a n B o c k s t a e l e e t a l . ( 2 0 1 1 ) 4
elasti
c stra
in (-)
t o t a l s t r a i n ( - )Fig. 2.6: Influence of the total strain on the elastic strain. The solid line shows the line of identity(x = y). By implication, the distance between the line of identity and the data points shows theirreversible strain. The legend indicates the literature source. 1 wheat cultivar Durex. 2 wheatcultivar Yekora. 3 total strain recorded after 3 min. 4 total strain recorded after 5 min. 5 durumwheat. Sources: Edwards et al. [39], Jekle and Becker [63], Mastromatteo et al. [88], Skendiet al. [122], van Bockstaele et al. [128].
wheat dough in the non-linear viscoelastic region is determined by the protein
phase.
Fig. 2.6 illustrates that the amount of elastic strain is independent of the
water content, the wheat cultivar, and the applied stress; the relaxation behavior
of wheat dough is only determined by the total strain. The total strain, of course,
can be influenced by the water content and the applied stress. Our results at low
water content without xylanase addition only resulted in strains up to 75%. To
also see the effect of higher strains, the influence of Shearzyme and Grindamyl
on the elastic strain is also depicted in Fig. 2.6. Again, the elastic strain was a
function of the total strain.
28

Cha
pter
2C
hapt
er2
Wheat dough rheology at low water content and the influence of xylanases
2.4.4 Xylanase and dough rheology
Hydrolysis of AX decreased Farinograph dough consistency (Fig. 2.1), G′
(Fig. 2.2b), and increased Jc,max (Fig. 2.3a). This is in agreement with other
studies at water contents above 40%, where xylanase addition reduces the
dough consistency [60, 64] and G′ [146]. The addition of WE-pentosans to
gluten, which has the opposite effect than adding xylanase, was shown to
decrease Jc,max [82].
The impact of Grindamyl and Shearzyme addition on the dough consistency,
G′, and Jc,max decreased at lower water contents. It is known that an increase
in substrate concentration results in a lower conversion at constant enzyme-to-
substrate ratios. Santala et al. [116] showed reducing hydrolysis rates at water
contents below 40% for wheat bran AX hydrolysis, which has also been observed
for wheat gluten and other biopolymeric systems [56]. Nevertheless, despite the
reduced AX conversion rate at low water content, both xylanases proved to be
active at all water contents for all rheological characteristics studied.
AX indirectly impedes gluten network formation by competing for water
[144, 145]. In this study, Shearzyme and Grindamyl mainly resulted in the
release of water as seen for the reduced BU-values (Fig. 2.1) and G′ (Fig. 2.2b).
The amount of released water ranged between 2–5% (on water basis, derived
from the power law fits) for the dough consistency and G′ and increased with
increasing water contents; i.e. a dough with xylanase behaved like a regular
dough with additional 2–5% water (on water basis). However, we also found
a small increase in tan δ at water contents below 40%, which proved to be
statistically significant at least for Grindamyl. This shows that Grindamyl addition
made the dough slightly more viscous.
Even though Shearzyme and Grindamyl behaved similarly in many aspects,
Shearzyme has a greater selectivity for WE-AX and Grindamyl has a greater
selectivity for WU-AX [45, 109]. Mild hydrolysis of WU-AX results in the
solubilization of WU-AX and increased viscosities [45]. Upon prolonged
hydrolysis the molecular weight of this solubilized WU-AX will reduce further,
which will reduce the viscosity again. Therefore, higher BU-values for
Grindamyl compared to Shearzyme would be theoretically expected during the
mixing, which did not occur (see appendix A.2). Also no significant differences
29

Cha
pter
2C
hapt
er2
Chapter 2
in G′, Jc,max and Jel were found. Only with respect to tan δ, a small difference
was found between Shearzyme and Grindamyl. One reason why hardly any
differences were observed between Grindamyl and Shearzyme could be that
hydrolysis was performed at very concentrated conditions. The effect of WU-AX
hydrolysis on the water-holding capacity, with a consequent release of water is
then much larger than the effect of solubilizing the hydrolyzed WU-AX.
2.5 Conclusions
We studied the influence of low water content on wheat dough rheology down
to 34% water content. Decreasing water contents increased Farinograph dough
consistency and G′, and decreased Jc,max in a non-linear fashion of 1–2 orders of
magnitude. This non-linear behavior occurred with a steady slope for the dough
consistency and G′, indicating that simply the amount of free water decreased at
low water content with a resulting decline of the plasticizing effect of water.
Furthermore, we studied the possibility of reducing the dough water content
while maintaining the rheological behavior of the dough, by addition of xylanase
and a consequent release of water. The addition of Shearzyme with a higher
selectivity of WE-AX and Grindamyl with a higher selectivity for WU-AX allowed
water savings of 2–5% (on water basis). In total, xylanase addition mainly
influenced the dough consistency, G′, and Jc,max similar to an increase in water
content.
Acknowledgements
The research leading to these results has received funding from the [European
Community’s] Seventh Framework Programme [FP7/2007-2013] under grant
agreement no. 238084.
30

Cha
pter
3C
hapt
er3
Cha
pter
3
CH
AP
TE
R
3Shear-induced starch–gluten separation
at very low water content aided by
xylanases

Cha
pter
3C
hapt
er3
Cha
pter
3
Chapter 3
Abstract
This study examines the influence of extremely low water content on
shear-induced starch–gluten separation and how endoxylanases influence the
separation by releasing water associated with arabinoxylan. Shearing was
performed at a water content ranging from 34% to 43.5% (w/w). It was
possible to concentrate gluten to 60% protein content in local gluten clusters
and most of the concentration occurred within 5 min. Contrary to higher water
concentrations, a water content <40% resulted in local separation of starch and
gluten but no inward migration of the gluten. The addition of an endoxylanase
with a higher selectivity for water-unextractable arabinoxylans and an
endoxylanase with a higher selectivity for water-extractable arabinoxylans both
resulted in a significant reduction in torque. The major influence of xylanase
was the release of 3–5% water (on a water basis), allowing separation at even
lower water content. Furthermore, no significant differences were found
between the enzymes.
This chapter has been published as:Hardt, N. A., H. Chauhan, R. M. Boom, and A. J. van der Goot (2014). Shear-inducedstarch–gluten separation at very low water content aided by xylanases. Journal of FoodEngineering 141(1), 51–57.
32
Cha
pter
3C
hapt
er3
Cha
pter
3
Shear-induced starch–gluten separation at very low water content aided by xylanases
3.1 Introduction
Wheat starch and gluten are separated industrially by processes such as the Martin
or the batter process [129]. These processes consume copious amounts of water
and often require 10–15 L of water per kg of dry matter [119]. Alternatively,
starch and gluten can be separated under more concentrated conditions by
exposing wheat dough to curvilinear shear flow. Peighambardoust et al. [103]
and van der Zalm et al. [134] showed that gluten can be concentrated using an
in-house cone-in-cone shearing device at a water content as low as 42% (on a
total basis). In this device, wheat dough is placed between an upper fixed cone
and a lower rotating cone. The gluten separates from the starch following a three-
step mechanism: (1) gluten aggregates form on shearing; (2) then form bigger
gluten clusters that deform due to the restriction of growth; (3) and migrate to
the apex of the cone [133]. The result is a gluten-enriched region at the center
of the cone with up to 60% protein content [134] and a gluten-depleted region
at the outside of the cone. Demixing and migration have also been reported for
other polymers [2, 34, 125]. Generally, demixing and migration of polymers
can occur in curvilinear shear flows when the components of the mixture differ
strongly in their viscoelastic properties [73], as is the case for gluten and starch.
Shear-induced starch–gluten separation under concentrated conditions has
several advantages. More concentrated conditions generally result in larger
system capacity and require less energy for dehydration if the final product
needs to be dried [57]. Furthermore, more concentrated conditions require less
water and produce less wastewater with inherently lower treatment and disposal
costs. Also, in contrast to current industrial starch–gluten separation processes,
water-soluble proteins are not lost during shear-induced separation.
Besides its main components, starch and gluten, wheat flour also contains
other minor components, such as the pentosan arabinoxylan (AX). AX can be
divided into water-extractable (WE-AX) and water-unextractable arabinoxylan
(WU-AX) with concentrations of about 0.5% and 1.5% in wheat flour, respectively
[129]. WE-AX and WU-AX have been reported to negatively influence gluten
network formation and agglomeration [47, 144, 145]. This can be explained by
the competition between AX and gluten for water; the water-holding capacities of
33

Cha
pter
3C
hapt
er3
Cha
pter
3
Chapter 3
AX are up to 9.9 g water/g WU-AX and 6.3 g water/g WE-AX [28]. Furthermore,
WE-AX and WU-AX may negatively influence gluten formation directly by cross-
linking of gluten and AX via ferulic acid [144, 145] and by steric hindrance
[47, 129].
AX can be hydrolyzed using endoxylanases. In conventional starch–gluten
separation, WE-AX hydrolysis has been reported to improve the agglomeration of
gluten, because the hydrolysis reduces the water-holding capacity of WE-AX and
thus the dough viscosity [24, 45]. However, hydrolysis of WU-AX only results in
improved agglomeration when WU-AX is severely hydrolyzed to a low molecular
mass [47]. Mild hydrolysis solubilizes WU-AX, which initially increases dough
viscosity.
AX hydrolysis is promising regarding shear-induced starch–gluten separation,
because it releases water, and possible removal of AX from the gluten might
improve gluten agglomeration. Theoretically, this allows a reduction in the
overall water content towards even more concentrated conditions. The approach
of using reduced water content with the help of xylanases has been used before in
pasta production [14]. In this study, we investigate the combination of addition
of endoxylanase and extremely low water content during shear-induced starch–
gluten separation using an endoxylanase with a higher selectivity for WU-AX
and an endoxylanase with a higher selectivity for WE-AX.
3.2 Materials & Methods
3.2.1 Materials
Soissons wheat flour from a single wheat cultivar was obtained from Meneba
(Rotterdam, The Netherlands). The water content was 14.4±0.4% and the
crude protein content was 10.7±0.4% (N×5.7) (both by weight). Vital wheat
gluten (Roquette) with 72.8±1.0% (N×5.7) crude protein content and 8.0±0.6%
water content was obtained from Barentz BV (Hoofddorp, The Netherlands).
Shearzyme 500L was kindly provided by Novozymes A/S (Bagsværd, Denmark).
Shearzyme is a monocomponent endoxylanase from Aspergillus aculeatus with
a greater selectivity for WE-AX [45]. Grindamyl POWERBake 950 was kindly
supplied by Danisco A/S (Brabrand, Denmark). Grindamyl POWERBake 950 is
34

Cha
pter
3C
hapt
er3
Cha
pter
3
Shear-induced starch–gluten separation at very low water content aided by xylanases
an endoxylanase from Bacillus subtilis with a greater selectivity for WU-AX [109].
The xylanases are referred to as Shearzyme and Grindamyl in the following. Tap
water was used in all experiments.
3.2.2 Water and enzyme contents
Water contents of 34%, 36%, 38%, 39.5%, and 43.5% (based on total weight)
were used in this study. This corresponds to Farinograph water absorptions
of 29.7%, 33.8%, 38.1%, 41.5%, and 51.5% (based on 14.4% flour moisture).
The upper value of 43.5% water was chosen because it represents the standard
water content for shear-induced starch–gluten separation [134]. The lower
value of 34% water was chosen because no full hydration of dough occurs during
shearing at lower water content; some material remains powdery. It was assumed
that wheat flour consists of 0.5% WE-AX and 1.5% WU-AX [129]. Enzyme-to-
substrate ratios of 1:6 (0.17 g enzyme/g WE-AX) for Shearzyme and 1:9 (0.11 g
enzyme/g WU-AX) for Grindamyl were used to ensure high xylanase activity
and limit inhibition. The xylanase was always added to the water before adding
to the wheat flour.
3.2.3 Shearing process
Shear experiments were conducted using a cone-in-cone shearing device
developed in house (Wageningen University, The Netherlands), as described in
detail previously [86, 103]. The shear cell was connected to a Do-corder E330
equipped with a PL2100 computer interface and controller unit (Brabender,
Duisburg, Germany) to measure torque and temperature. The shear cell was
heated to 40±1 °C using a circulating water flow. A sample of 100 g was
prepared for each experiment with varying water content. In addition, 2% salt
(on a flour basis) was added to enhance the separation [135]. The sample was
loaded onto the lower cone. The upper cone was closed and a pressure of
310±10 kPa was applied. The sample was then sheared at 5 rpm for 5 min,
which allowed better sample mixing. The sample was then sheared at 15 rpm
for 25 min, except for the experiments on the influence of time on the protein
content, when the rotational speed was 5 rpm. After the treatment, the samples
35

Cha
pter
3C
hapt
er3
Cha
pter
3
Chapter 3
were photographed using a Canon EOS 30D camera. Then, half of the sample
was frozen for microscopy analysis. From the other half of the sample, gluten
clusters were gently removed, frozen, freeze-dried, and used to determine the
protein content. Shear cell experiments were performed in triplicate unless
otherwise stated. The shearing experiment depicted in Fig. 3.1a was performed
using another shear cell cone, but with the same geometry as the shear cell cone
used for the other experiments. Nevertheless, the separation was independent
of the shear cell cone, as can be seen when comparing Fig. 3.1a and Fig. 3.4d.
3.2.4 Coloring of gluten clusters
To visualize the migration behavior of gluten, 12 g of vital wheat gluten, 8 g of
wheat flour and 10 g of water were mixed and gluten clusters with approximately
55% protein (dry basis) were formed. These clusters were stained with 0.3%
rhodamine B in 2-methoxyethanol for 1 h and subsequently rinsed with clean
2-methoxyethanol. The stained gluten clusters were placed in the middle of a
fresh sample, which had been sheared for 30 s (Fig. 3.4a). Then, shearing was
performed at 5 rpm.
3.2.5 Protein content
The protein content (N×5.7) of the gluten clusters was determined using the
Dumas method (N analyzer FlashEA 1112 series, Thermo Scientific, Interscience).
Methionine was used as a standard.
3.2.6 Microscopy
Samples were sectioned at 70 µm on a cryotome (Microm, Heidelberg, Germany)
and stained with 0.1% rhodamine B in 2-methoxyethanol for 1 h. The stained
sections were examined under light and polarized light using a Nikon Eclipse
80i microscope equipped with a 100-W mercury lamp and a 10× objective with
0.5 numerical aperture.
36

Cha
pter
3C
hapt
er3
Cha
pter
3
Shear-induced starch–gluten separation at very low water content aided by xylanases
3.2.7 Statistical analysis
A two-factor analysis of variance (ANOVA) was performed to test significant
differences (α = 0.05) in shear cell torque and protein content for different water
contents and xylanase addition using SPSS version 19.0. Data were normally
distributed based on the Shapiro–Wilk test. Logarithmic torque values were used
to test the significance. Torque trend lines as a function of the water content
were fitted using a simple power law fit: a× xn. However, the primary goal was
to examine the non-linear relationship between torque and water content and
not to obtain the most suitable fit.
3.3 Results & Discussion
3.3.1 Visual appearance of dough
Shear-induced starch–gluten separation has been introduced at water contents
from 42% to 46% [103, 106, 134]. At these water contents, shearing of wheat
dough results in local gluten aggregates, which subsequently grow and migrate
to the the appex of the cone. In Fig. 3.1a, the separation was reproduced at
43.5% water content. In industrial wheat separation, xylanases can be used to
Fig. 3.1: Visual appearance of the dough just after shearing at 43.5% water content. The legendsindicate the water content used. NO, no xylanase; G, Grindamyl added; S, Shearzyme added.
facilitate the separation by releasing water. Therefore, the influence of Grindamyl
and Shearzyme on shear-induced starch–gluten separation was investigated
(Fig. 3.1b, c). However, separation ceased to occur on addition of both xylanases.
Water was visibly released and a slack and sticky dough was obtained. The
37

Cha
pter
3C
hapt
er3
Cha
pter
3
Chapter 3
release of water had a similar effect as adding too much water to the shearing
process, which was reported to have a negative influence on separation [134].
As a result of Fig. 3.1, we investigated whether separation could be induced
at a lower water content after addition of enzyme. Fig. 3.2 shows the influence
of water content from 34% to 38% and addition of xylanase on the visual
appearance of dough after shearing. The separation process changed at lower
Fig. 3.2: Visual appearance of the dough just after shearing at 34–38% water content. The legendsindicate the water content used. NO, no xylanase; G, Grindamyl added; S, Shearzyme added.
water content. The formation of local gluten clusters was observed without
xylanases at water contents of 36% and 38% (Fig. 3.2b, c). However, these
clusters no longer migrated towards the apex of the cone. At 34% water content,
no gluten clusters were visible (Fig. 3.2a). The addition of xylanases also resulted
in the formation of local gluten clusters without migration towards the apex of
38

Cha
pter
3C
hapt
er3
Cha
pter
3
Shear-induced starch–gluten separation at very low water content aided by xylanases
the cone (Fig. 3.2d–i). Only small differences were observed between Grindamyl
and Shearzyme, which are presumably not of technological relevance.
3.3.2 Separation mechanism at low water content
The question arises why gluten cluster migration ceases at low water content,
independent of the addition of xylanase. At a water content above 40%, gluten
aggregation mainly depends on the shear rate, whereas the migration of the
clusters is mainly influenced by the shear stress [133, 134]. Too high shear
stresses have been shown to result in the breakup of gluten aggregates [106, 133,
134]. Thus, on the one hand, low shear stresses (achieved by low shear rates)
are necessary to allow the formation of gluten clusters that grow large enough
to be able to deform and migrate. On the other hand, high stresses are necessary
to deform these gluten aggregates, which is a prerequisite for migration.
Decreasing the water content results in larger shear stresses, which is
equivalent to an increase in torque in the shearing device (Fig. 3.3). Fig. 3.3
3 2 3 6 4 0 4 41 0 0
1 0 1
1 0 2
n o x y l a n a s e G r i n d a m y l S h e a r z y m eav
erage
d tor
que 1
0-30
min
(Nm)
w a t e r c o n t e n t ( % )Fig. 3.3: Shear cell torque. Shearing at 15 rpm and 40 °C. Average torque within a timeframe of10–30 min as a function of the water content. Trend lines were derived using a simple power lawfit: a× xn. R2 > 0.96 for all fits. Power law parameters a and n were 0.061, -5.6 for no xylanase,0.048, -5.6 for addition of Grindamyl, and 0.030, -6.1 for addition of Shearzyme.
shows the average torques over 10–30 min shearing time, which is enough time
to see the effect of arabinoxylan hydrolysis. Decreasing the water content from
39

Cha
pter
3C
hapt
er3
Cha
pter
3
Chapter 3
43.5% to 34% resulted in a fourfold, non-linear increase in torque. The addition
of Shearzyme and Grindamyl significantly reduced the torque, which is in line
with Fig. 3.1 and Fig. 3.2. No significant difference in torque was found
between Shearzyme and Grindamyl.
At first sight, it seems contradictory that higher shear stresses, indicated by
higher torques, facilitate the formation of relatively large gluten clusters without
breakage, but impede migration. Once local gluten aggregates form, they can
be considered as embedded in a matrix mainly consisting of gluten (although
consequently lower in content than in the initial dough) and starch. This matrix
exerts a stress on the gluten aggregates that is larger with decreasing water
content. However, the gluten aggregates formed also show greater resistance to
extension with decreasing water content. The increase in resistance to extension
with decreasing water content was demonstrated in creep tests, although at
higher water contents [63, 88]. Therefore, the formation of gluten clusters can
occur at water contents below 40%, remarkably, without breakage of the clusters.
But why does migration fail to appear? At higher water contents from
42% to 46%, the formation of gluten clusters is followed by deformation of
these clusters and subsequent migration towards the apex of the cone [133].
However, the clusters only start deforming once their growth is restricted; the
space between the upper and the lower shear cell cone determines the maximum
cluster size. Consequently, van der Zalm et al. [133] showed that local gluten
clusters without migration also emerged at water contents >40% when the angle
between the upper and the lower cone was changed to 7.5° compared with
2.5° in this study. The gap between the two shear cell cones is considerably
higher at larger cone angles, especially at the outside of the cone, and gluten
clusters need to grow considerably larger before their growth is restricted and
they start to extend. However, the formation of local gluten clusters at an
angle of 2.5° without migration was never reported at higher water contents.
Obviously, something is hindering the clusters from migrating at water contents
<40%. In this study, starch–gluten separation was conducted using extremely
water-depleted doughs, with the dough and especially the starch densely packed.
It seems that gluten clusters cannot migrate inwards through such a dense
phase. To test this assumption, we added rhodamine B-stained gluten clusters
40

Cha
pter
3C
hapt
er3
Cha
pter
3
Shear-induced starch–gluten separation at very low water content aided by xylanases
at 38% and 43.5% water content at the beginning of the shearing process and
photographed the distribution of these clusters after 5 and 15 min (Fig. 3.4). At
Fig. 3.4: Visual appearance of migration of gluten clusters stained with rhodamine B at 38% and43.5% water content without addition of xylanase. The legend indicates the water content andthe shearing time.
38% water content, the added gluten clusters broke within 5 min and a colored
ring in the middle of the sample could be seen. After 15 min, the sample was
further mixed. However, only the outer parts of the sample mixed. There was
no exchange between the inner 30% of the cone and the rest. For comparison,
the same experiment was performed at 43.5% water content (Fig. 3.4d). Here,
inward migration of gluten towards the apex of the cone could be clearly seen.
Also the protein content increased towards the apex of the cone, as shown by
the more intense color.
One explanation for the absence of any mixing on the inside of the cone at
low water content is the development of the shear rate along the cone. It has
41

Cha
pter
3C
hapt
er3
Cha
pter
3
Chapter 3
been reasoned that starch granules cause the cones to not completely touch at
the apex, which introduces an inhomogeneous shear field in the cone [133];
the radial shear rate is no longer constant, but gradually increases from zero
at the center of the cone towards higher shear rates at the outside of the cone.
Hence, presumably no mixing occurred on the inside of the cone because of the
low shear rates and the dense and water-depleted dough. This explains why the
gluten clusters cannot migrate through this part of the dough.
3.3.3 Protein content
Fig. 3.5 shows the influence of the water content and addition of xylanase on
the protein content of the gluten clusters. The protein content is plotted as a
function of the torque because the addition of xylanase reduced the viscosity
of the dough and thus the torque. The addition of Shearzyme and Grindamyl
0 5 1 0 1 5 2 0 2 50 %
1 0 %
2 0 %
3 0 %
4 0 %
5 0 %
6 0 %
3 6 %
3 8 %
3 9 . 5 %
3 4 %
3 6 %
3 8 %
3 9 . 5 %
3 4 %
3 6 %
3 8 %3 9 . 5 %
n o x y l a n a s e G r i n d a m y l S h e a r z y m e
S o i s s o n s w h e a t f l o u r
prote
in co
ntent
(dry
basis
)
t o r q u e ( N m )
Fig. 3.5: Influence of the shear cell torque on the protein content. The legend indicates thexylanase used. The standard deviation of triplicates is given for Shearzyme. The shear cellexperiments using Grindamyl and without addition of xylanase were performed in duplicate. Thewater content during shearing is displayed next to the symbols. The dashed line represents theprotein content of Soissons wheat flour.
resulted in significantly higher protein contents compared with the xylanase-free
sample at all water contents, due to the reduced viscosity; when testing the
influence of both xylanases on the protein content as a function of the torque
instead of the water content, no distinct differences were found compared with
42
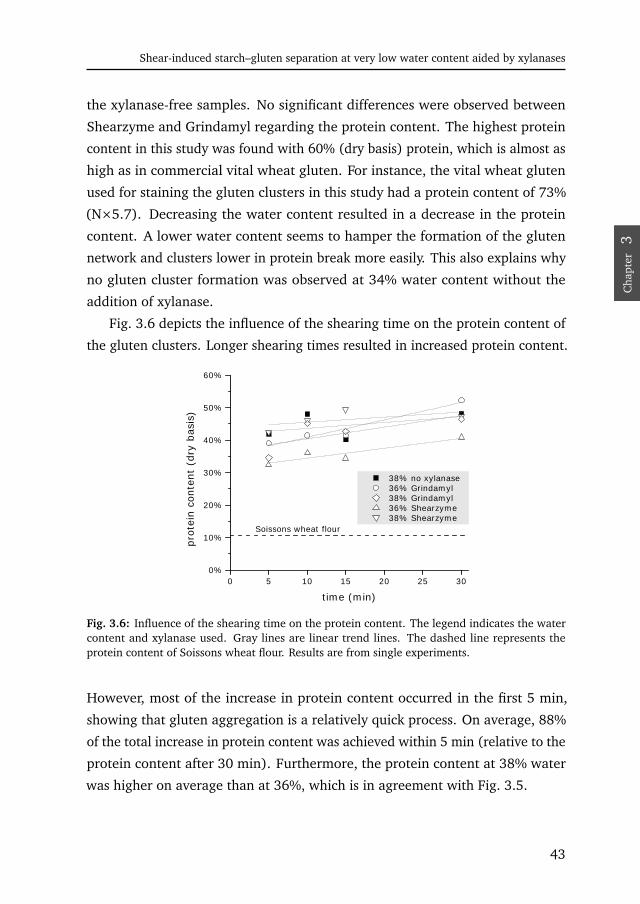
Cha
pter
3C
hapt
er3
Cha
pter
3
Shear-induced starch–gluten separation at very low water content aided by xylanases
the xylanase-free samples. No significant differences were observed between
Shearzyme and Grindamyl regarding the protein content. The highest protein
content in this study was found with 60% (dry basis) protein, which is almost as
high as in commercial vital wheat gluten. For instance, the vital wheat gluten
used for staining the gluten clusters in this study had a protein content of 73%
(N×5.7). Decreasing the water content resulted in a decrease in the protein
content. A lower water content seems to hamper the formation of the gluten
network and clusters lower in protein break more easily. This also explains why
no gluten cluster formation was observed at 34% water content without the
addition of xylanase.
Fig. 3.6 depicts the influence of the shearing time on the protein content of
the gluten clusters. Longer shearing times resulted in increased protein content.
0 5 1 0 1 5 2 0 2 5 3 00 %
1 0 %
2 0 %
3 0 %
4 0 %
5 0 %
6 0 %
3 8 % n o x y l a n a s e 3 6 % G r i n d a m y l 3 8 % G r i n d a m y l 3 6 % S h e a r z y m e 3 8 % S h e a r z y m e
S o i s s o n s w h e a t f l o u r
prote
in co
ntent
(dry
basis
)
t i m e ( m i n )
Fig. 3.6: Influence of the shearing time on the protein content. The legend indicates the watercontent and xylanase used. Gray lines are linear trend lines. The dashed line represents theprotein content of Soissons wheat flour. Results are from single experiments.
However, most of the increase in protein content occurred in the first 5 min,
showing that gluten aggregation is a relatively quick process. On average, 88%
of the total increase in protein content was achieved within 5 min (relative to the
protein content after 30 min). Furthermore, the protein content at 38% water
was higher on average than at 36%, which is in agreement with Fig. 3.5.
43

Cha
pter
3C
hapt
er3
Cha
pter
3
Chapter 3
The highest protein contents in this study ranged between 55% and 60%
(Fig. 3.5). This is in agreement with previous shear cell studies at higher water
contents [103, 134]. In these studies, several process parameters such as the
water content, the temperature, the rotation rate, and the processing time were
changed. These experiments suggest that there is a threshold above which
gluten cannot be concentrated further when inducing shear under concentrated
conditions.
The remaining 40% of the gluten clusters with the highest protein content
consists mainly of starch. To get more insight into the structure of the gluten
clusters, we stained the gluten phase using rhodamine B and made use of the
birefringence of starch granules under polarized light (Fig. 3.7). Fig. 3.7a–d
compares the structure of gluten clusters at 38% water content with Grindamyl,
Shearzyme and without addition of xylanase and at 36% water content with
addition of Shearzyme. The gluten clusters mainly consisted of a gluten network
with starch granules embedded in this network. Starch has been reported to
be physically entrapped in the gluten network [112, 118]. Nevertheless, we
always observed sections inside the clusters that were high in starch and sections
without starch. Therefore, starch and gluten also separated on a small scale.
Furthermore, we observed no major differences in the microscopic appearance
of the gluten clusters when xylanase was added.
The starch distribution in Fig. 3.7a–d provides some information on the
maximum attainable protein content of local gluten clusters. The starch
granules are embedded in the gluten network and can only be removed through
deformation of the gluten clusters by applying shear stress. However, the gluten
clusters themselves are embedded in the dough phase, which mainly consists of
starch. Therefore, it is likely that shearing of the gluten clusters results in
equilibrium, whereby starch granules are removed from the clusters but new
starch granules are also embedded again. This is supported by the fact that the
protein content was rather independent of the shearing time after 5 min.
Overall, this would explain why the highest protein content during
shear-induced starch–gluten separation has not yet exceeded 60%.
Fig. 3.7e gives an impression of the starch distribution in a whole gluten
cluster. Fig. 3.7f shows the effect of shearing on a dough at 34% water content
44

Cha
pter
3C
hapt
er3
Cha
pter
3
Shear-induced starch–gluten separation at very low water content aided by xylanases
Fig. 3.7: Gluten clusters under light and polarized light. Starch granules illuminate underpolarized light. Rhodamine B-stained gluten appears red. The legends indicate the water contentused. NO, no xylanase; G, Grindamyl added; S, Shearzyme added. Image (e) was taken using a2× objective. All other images were taken using a 10× objective.
without addition of xylanase. As mentioned earlier, no visible separation was
observed here. Nevertheless, some small gluten sections were found using the
microscope.
45

Cha
pter
3C
hapt
er3
Cha
pter
3
Chapter 3
3.3.4 Influence of xylanase
We studied the influence of Shearzyme and Grindamyl on shear-induced starch–
gluten separation to answer two questions: (1) Does AX hydrolysis release
water and does the consequent reduction in viscosity facilitate the separation
process? (2) Does a possible removal of any direct interaction between gluten
and AX improve gluten agglomeration and result in higher protein content in the
gluten clusters? The release of water was clearly visible (Fig. 3.1 and Fig. 3.2)
and confirmed by changes in torque (Fig. 3.3). This is in line with Wang et al.
[144, 145]. The consequent reduced viscosities allowed separation at even lower
water content (Fig. 3.2). However, no strong evidence was found that Shearzyme
and Grindamyl influenced the formation of gluten clusters other than the release
of water. Although small differences in the visual appearance of the gluten
clusters were observed (Fig. 3.2), we did not find any increase in protein content
with the addition of xylanase. The increase in protein content at a constant water
content (e.g. 38%) can be explained by the reduced torque (Fig. 3.5).
Even though Shearzyme and Grindamyl behaved similarly in many aspects,
Shearzyme has a greater selectivity for WE-AX and Grindamyl has a greater
selectivity for WU-AX [45, 109]. As mentioned earlier, mild hydrolysis of
WU-AX results in the solubilization of WU-AX and increased viscosity. On
prolonged hydrolysis, the molecular weight of this solubilized WU-AX reduces
further, which reduces the viscosity again. Therefore, higher torque values are
theoretically expected in the case of WU-AX hydrolysis using Grindamyl, at least
at the beginning of the shearing process. However, the averaged torque within
10–30 min was independent of the xylanase used (Fig. 3.3), just like the torque
at the beginning of the reaction (not shown). The overall visual appearance of
the dough samples was rather independent of the type of enzyme used
(Fig. 3.2), and no significant difference in the protein content of the clusters was
found (Fig. 3.5). This differs from conventional starch–gluten separation, where
the hydrolysis of WE-AX improves the separation to a much larger extent than
hydrolysis of WU-AX [24, 45], because of the opposite influence of WU-AX and
WE-AX hydrolysis on the viscosity. One reason for this difference could be that
starch–gluten separation in the shear cell was performed at very concentrated
conditions. Thus, the effect of WU-AX hydrolysis on the water-holding capacity,
46

Cha
pter
3C
hapt
er3
Cha
pter
3
Shear-induced starch–gluten separation at very low water content aided by xylanases
with consequent reductions in viscosity and torque (Fig. 3.3), was much larger
than the effect of solubilizing WU-AX, if solubilization even occurred at this low
water content.
3.3.5 Concluding remarks on practical implications of xylanases
We investigated the modification of shear-induced starch–gluten separation from
a wheat dough by enzymatically hydrolyzing arabinoxylans at very low water
content. For this, a xylanase with a higher specificity for water-unextractable
arabinoxylan (Grindamyl) and another xylanase with a higher specificity for
water-extractable arabinoxylan (Shearzyme) were evaluated. It was shown that
enzyme addition at increased water content negatively influenced the
separation. Therefore, we concluded that shear-induced separation only
benefits from addition of xylanase at a water content <40%.
The combined effects of the water content and hydrolysis of arabinoxylan on
the torque can be described using a power law equation (Fig. 3.3). This can be
used to estimate possible water reductions by using xylanase in starch–gluten
separation at very low water content. Shearzyme allowed water reductions of
3.2–4.8% (from 34% to 43% water) and Grindamyl a water reduction of 4.1%
(all reductions on a water basis).
The use of either xylanase led to a significant increase in the protein content
of the clusters of around 5.6% (on a dry basis) when using 36–38% water in
the dough. This could be attributed to the release of water by arabinoxylan
hydrolysis, and the consequent reduction in the viscosity of the dough.
Although gluten clusters can be formed at water contents <40%, it was not
possible for the gluten clusters to migrate towards the apex of the cone. However,
migration and large-scale separation of starch and gluten are not necessarily
required to separate starch and gluten. Local separation might be an interesting
first step in separation of starch and gluten. In a next process step, the gluten
and the starch could be further separated. We generally observed that the gluten
clusters showed higher resistance to disruption and breakage than the gluten-
depleted regions in the wet and the dry state. Hence, the gluten clusters could
be separated by mechanical force. Here, dehydration might ease the separation.
47
Cha
pter
3C
hapt
er3
Cha
pter
3
Chapter 3
Alternatively, dry fractionation might be a possibility to further separate the dried
shear cell samples [119].
Acknowledgements
The research leading to these results has received funding from the [European
Community’s] Seventh Framework Programme [FP7/2007-2013] under grant
agreement no. 238084. We would like to thank Norbert de Ruijter for his
assistance with the microscopy measurements. We thank Hans Frijters for
technical assistance.
48

Cha
pter
4C
hapt
er4
Cha
pter
4C
hapt
er4
CH
AP
TE
R
4Influence of high solid concentrations on
enzymatic wheat gluten hydrolysis and
resulting functional properties

Cha
pter
4C
hapt
er4
Cha
pter
4C
hapt
er4
Chapter 4
Abstract
Enzymatic hydrolysis at increased solid concentrations is beneficial with regard
to energy and water consumption. This study examines the influence of the solid
concentration on the enzymatic hydrolysis of wheat gluten and the resulting
functional properties of the hydrolysate. Wheat gluten was mildly hydrolyzed
at a solid concentration varying from 10% to 60% to degrees of hydrolysis
(DH%) ranging from 3.2% to 10.2%. The gluten was susceptible to hydrolysis
at all solid concentrations but the hydrolysis rate was influenced by increasing
solid concentrations. Size-exclusion high-performance liquid chromatography
revealed an increase in the ratio of peptides with a molecular mass >25 kDa
for solid concentrations of 40% and 60%. The water solubility increased on
hydrolysis and was independent of the solid concentration during proteolysis.
The foam stability was not influenced by the solid concentration at low DH%.
At DH% higher than 8%, high solid concentrations increased the foam stability,
which might be related to the presence of more peptides with a molecular mass
>25 kDa. In addition, we found increased reactor productivity. The results show
the potential of hydrolyzing wheat gluten at high solid concentrations, which
could lead to large savings for water and energy use when applied industrially.
This chapter has been published as:Hardt, N. A., A. J. van der Goot, and R. M. Boom (2013). Influence of high solidconcentrations on enzymatic wheat gluten hydrolysis and resulting functional properties.Journal of Cereal Science 57(3), 531–536.
50

Cha
pter
4C
hapt
er4
Cha
pter
4C
hapt
er4
Wheat gluten hydrolysis at high solid concentrations and functional properties
4.1 Introduction
Wheat gluten, the major protein of wheat, is a valuable ingredient in the
breadmaking industry. Moreover, it is a plant protein, renewable, and
abundantly available at moderate prices. Although native wheat gluten is an
excellent bread improver, its further application in the food industry is limited.
Native wheat gluten is scarcely water-soluble close to its isoelectric point at pH
6–7. In addition, it has low emulsifying activity and does not produce steady
foams [111]. One possibility to overcome these limitations is to hydrolyze wheat
gluten. Mild hydrolysis at low solid concentrations has been demonstrated to
enhance the water solubility at neutral pH [70, 143]. Furthermore, foam
capacity increases and foam stability decreases [80, 92, 142].
Wheat gluten can be hydrolyzed either chemically at high or low pH or
by means of enzymes. Acid hydrolysis can be applied easily and is the most
commonly used method to hydrolyze gluten in industry [22]. However, acid
hydrolysis can lead to undesired side reactions, may result in the degradation of
essential amino acids [33], and can lead to products with too much salt [22].
Enzymatic hydrolysis is a milder and more specific process with few undesirable
side reactions. Furthermore, enzymes are biodegradable and can remain in the
final product when inactivated.
Protein hydrolysis is usually performed at low solid concentrations. The
highest solid concentrations used for enzymatic wheat gluten hydrolysis at neutral
pH range from 13% to 22% [22, 84, 117]. At low solid concentrations, wheat
gluten forms a fluid-like dispersion with all the gluten dispersed in the liquid.
For higher solid concentrations, wheat gluten forms a dough with high viscosity
and elasticity. This increased viscosity may lead to insufficient mixing and can
be highly energy consuming in conventional stirring tanks [72]. Therefore, low
solid concentrations are preferred industrially because of the manageability of
the system. In addition, water plays an important role as the solvent for the
enzyme and as the transport medium for the substrate and the product; thus, a
reduced water concentration might lead to diffusional limitations. Water can
also act as a reactant and this role can be influenced by reduced water activity at
higher solid concentrations.
51

Cha
pter
4C
hapt
er4
Cha
pter
4C
hapt
er4
Chapter 4
The use of a higher concentration, however, has several advantages. First, it
results in larger system capacity either by a higher throughput in existing
equipment or by a reduced system volume [131]. Second, less energy is
required to heat and cool the slurry during the hydrolysis reaction and the
consequent drying of the product, thus reducing the energy usage and costs for
processing. Furthermore, downstream processing is facilitated by higher
product concentrations [94]. Third, a high solid concentration during hydrolysis
requires less water and produces less wastewater with inherently lower
treatment and disposal costs.
Few studies have investigated enzymatic protein hydrolysis at high solid
concentrations. Krause et al. [71] examined the chymosin-catalyzed hydrolysis of
β -casein at 1% and 50% (w/v) dry mass concentration. Hydrolysis was strongly
limited at 50% (w/v), which was explained by the competition between the
enzyme and the substrate for the reduced amount of water available. Enzymatic
hydrolysis of whey protein isolate and egg white protein has been investigated
for concentrations up to 30% (w/v) and 35% (w/v), respectively [16, 113]. In
both cases, hydrolysis occurred at higher substrate concentrations but a lower
hydrolysis rate was observed with increasing substrate concentration. Several
publications report the same effect for the hydrolysis of biomass in biofuel
production [72]. The decreased hydrolysis rate appears to be an intrinsic effect
of increasing solid concentrations and its cause is not yet fully understood. To
the best of our knowledge, wheat gluten hydrolysis at high solid concentration
has never been reported in the literature. Moreover, for proteins in general,
the influence of the solid concentration during proteolysis on the functional
properties of the resulting hydrolysates has not been described in the literature
so far.
In this study, enzymatic wheat gluten hydrolysis was examined using solid
concentrations ranging from 10% to 60%. The aim was to study whether the
solid concentration during proteolysis affects the functional properties of the
resulting wheat gluten hydrolysates. Solubility and foam stability tests were
carried out and the molecular mass distribution was evaluated. The potential
reductions in the use of water and energy are discussed.
52

Cha
pter
4C
hapt
er4
Cha
pter
4C
hapt
er4
Wheat gluten hydrolysis at high solid concentrations and functional properties
4.2 Materials & Methods
4.2.1 Materials
Vital wheat gluten (Roquette) with 72.8±1.0% crude protein content (N×5.7)
and 8.0% water content (all by weight) was obtained from Barentz BV, Hoofddorp,
The Netherlands. Protease from Aspergillus oryzae (Flavourzyme 500 LAPU/g)
from Novozymes was purchased from Sigma-Aldrich, Germany. Flavourzyme
contains a mixture of endo- and exoproteases [38]. Milli-Q water was used in
all experiments.
4.2.2 Hydrolysis reaction
The hydrolysis reactions were carried out using a 200-mL double-walled glass
vessel connected to a water bath. Each experiment was conducted using a total
mass of 100 g, varying the solid concentrations from 10% to 60% (w/w), and
an enzyme-to-substrate ratio of 1:100 (w/w). The hydrolysis temperature was
50 °C. Before hydrolysis, the vital wheat gluten powder was allowed to stand for
5 min at the reaction temperature. The enzyme was first mixed with the water
before adding it to the substrate. The double-walled glass vessel was closed
with a clasp to avoid evaporation of water and stirred using an overhead stirrer
at 40 rpm. The reaction was conducted under floating pH conditions. After
hydrolysis, all samples were inactivated for 10 min at 95 °C in a water bath.
The samples were then cooled down, frozen, and freeze dried. The freeze-dried
samples were ground and stored for further analysis.
4.2.3 Degree of hydrolysis (DH%)
The degree of hydrolysis (DH%) was measured by the o-phthaldialdehyde (OPA)
method according to Nielsen et al. [99], with minor modifications: 1.25 mg/mL
wheat gluten hydrolysate was suspended in 12.5 mM sodium tetraborate
decahydrate plus 2% (w/w) sodium dodecyl sulfate (SDS) according to Wang
et al. [142], mixed for 60 min and then centrifuged at 3900× g for 15 min. The
resulting supernatant was used for analysis. The DH% was calculated using the
53

Cha
pter
4C
hapt
er4
Cha
pter
4C
hapt
er4
Chapter 4
following formula:
DH%=(Serine-NH2 − β)/α
htot(4.1)
where
Serine-NH2 =Ahydr − AOPA
protein� g
l
� ·mM serine
Aserine − AOPA(4.2)
and Serine-NH2 is meqv serine-NH2 per gram of protein. Ahydr is the absorbance
of the wheat gluten hydrolysate sample, AOPA is the absorbance of the blank OPA
reagent, and Aserine is the absorbance of the serine standard. htot = 8.3 and α = 1
[1]. A value of 0.16 was measured for β . The calculated DH% was the mean of
four determinations.
4.2.4 Process conditions
Table 4.1 shows the process conditions used for the various wheat gluten
hydrolyses. Hydrolysates were obtained in a DH% range from 3.2% to 10.2%.
We only measured the DH% after completion of the hydrolysis reaction. Online
DH% measurement methods, such as the pH-stat method, were not suitable for
higher solid concentrations, because most native samples had the consistency of
a dough.
4.2.5 Size-exclusion high-performance liquid chromatography
Wheat gluten hydrolysate (2.5 mg/mL) was suspended in 12.5 mM sodium
tetraborate decahydrate plus 2% (w/w) SDS, stirred overnight, and then
centrifuged at 3900× g for 15 min. The resulting supernatant was injected onto
a TSKGel G2000 SWXL (300×7.8 mm) column and eluted with 70% / 30% /
0.1% water / acetonitrile / trifluoroacetic acid at a flow rate of 1.0 mL/min and
detected at a wavelength of 214 nm. All experiments were performed in
duplicate. The molecular mass distribution was calculated according to
molecular mass markers based on carbonic anhydrase (29,000 Da),
α-lactalbumin (14,100 Da), aprotinin (6510 Da), insulin (5700 Da), bacitracin
(1420 Da), and phenylalanine (165 Da). The standard calibration curve was:
log10MW = 7.1268 − 0.452tr where tr is the retention time. Based on the
54

Cha
pter
4C
hapt
er4
Cha
pter
4C
hapt
er4
Wheat gluten hydrolysis at high solid concentrations and functional properties
Table 4.1: Sampling parameters: solid concentration, hydrolysis time, and DH%; errors representstandard deviation of DH% measurements.
Solid Hydrolysis timeDH%
concentration (min)
10% 45 3.2±0.2%10% 55 4.4±0.2%10% 105 6.2±0.6%10% 130 8.4±0.3%10% 155 10.2±0.4%20% 60 3.0±0.1%20% 75 4.9±0.2%20% 165 9.1±0.3%40% 60 4.5±0.2%40% 150 6.7±0.4%40% 200 9.4±0.2%60% 110 3.8±0.2%60% 145 5.5±0.2%60% 360 8.8±0.3%60% 420 9.2±0.2%
molecular mass, the results were divided into the following classes: <2 kDa,
2–10 kDa, 10–25 kDa, and >25 kDa.
4.2.6 Solubility
Wheat gluten hydrolysate (25 mg/mL) was suspended in water and mixed for
60 min at ambient temperature using a Heidolph MultiReax at 1500 rpm and then
centrifuged at 3900× g for 15 min. The resulting supernatant and pellet were
freeze-dried and weighed. The nitrogen content of both freeze-dried samples was
determined using the Dumas method (N analyzer FlashEA 1112 series, Thermo
Scientific, Interscience) with methionine as a standard. The nitrogen solubility
index (NSI) was taken as the fraction of soluble nitrogen to total nitrogen. All
experiments were performed in duplicate. It has been shown that wheat gluten
solubility is independent of the pH within a pH range of 4–10 for DH% greater
than 5% [70] and scarcely affected within a pH range of 6–8 for DH% of 1.3–
1.9% [23]. Therefore, the pH was not adjusted during the solubility experiments.
Nevertheless, the pH remained between 6 and 7 for all solubility experiments
carried out.
55

Cha
pter
4C
hapt
er4
Cha
pter
4C
hapt
er4
Chapter 4
4.2.7 Foam stability
Wheat gluten hydrolysate was suspended in water at ambient temperature, mixed
for 60 min using a Heidolph MultiReax at 1500 rpm and then centrifuged at
3900× g for 15 min. Thirty milliliters of the resulting supernatant were poured
into a glass column (12 cm in height, 6 cm in diameter) with a porous metal disk
(20–30 µm pore diameter). A foam height of 12 cm was created by bubbling
nitrogen at a constant rate of 400 mL/min into the hydrolysate solution. The
foam height was recorded visually after 5 and 15 min. Two sets of experiments
were conducted to determine the foam stability. First, 4.25 mg/mL wheat gluten
hydrolysate was suspended in water. Therefore, the amount of soluble protein
during the foaming measurements varied for different DH% values. Because foam
stability is mainly determined by soluble protein, a second set of foam stability
tests was performed using a similar soluble protein concentration. Therefore,
wheat gluten hydrolysate was suspended in water in such an amount to achieve
a concentration of water-soluble protein of 2.0 mg/mL. The foam stability results
are means of four determinations.
4.3 Results & Discussion
4.3.1 Influence of the solid concentration on the hydrolysis
reaction
The solid concentration affects the state of wheat gluten–water mixtures to a
significant extent. Fig. 4.1 shows these differences for native and hydrolyzed
wheat gluten at solid concentrations of 10%, 40%, and 60%. Native wheat
gluten formed a suspension in the presence of aggregated gluten lumps for a
solid concentration of 10%; a solid concentration of 40% and 60% resulted in a
dough (Fig. 4.1a–c). At 60%, parts of the powder remained dry. It should be
emphasized that native wheat gluten is transformed from a suspension state to a
dough state at a solid concentration range of 10–40%. At 20%, a suspension was
still formed but the gluten lumps showed a high tendency to aggregate further.
Nevertheless, these aggregates could be disrupted easily compared with breaking
wheat gluten dough at higher solid concentrations. At solid concentrations of
56
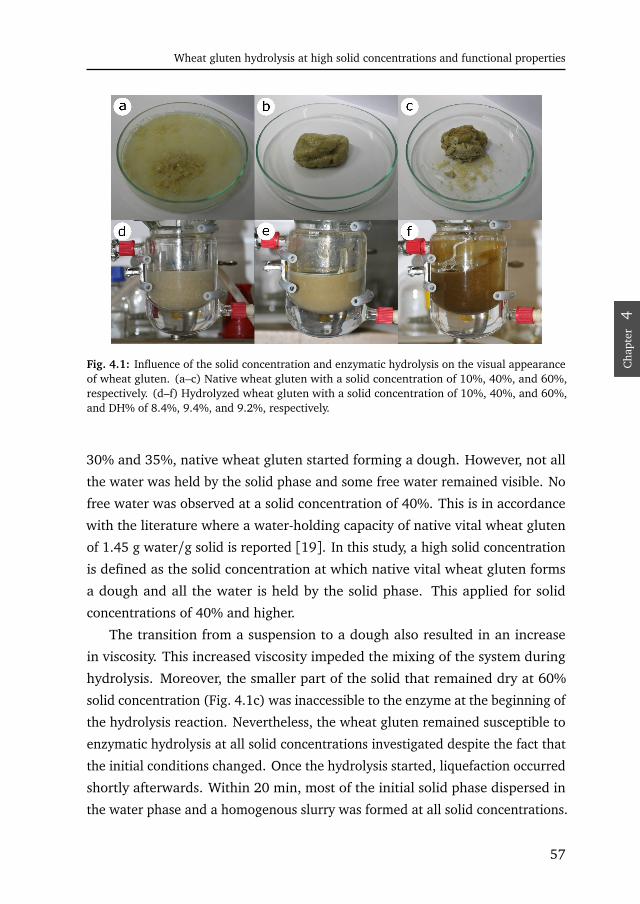
Cha
pter
4C
hapt
er4
Cha
pter
4C
hapt
er4
Wheat gluten hydrolysis at high solid concentrations and functional properties
Fig. 4.1: Influence of the solid concentration and enzymatic hydrolysis on the visual appearanceof wheat gluten. (a–c) Native wheat gluten with a solid concentration of 10%, 40%, and 60%,respectively. (d–f) Hydrolyzed wheat gluten with a solid concentration of 10%, 40%, and 60%,and DH% of 8.4%, 9.4%, and 9.2%, respectively.
30% and 35%, native wheat gluten started forming a dough. However, not all
the water was held by the solid phase and some free water remained visible. No
free water was observed at a solid concentration of 40%. This is in accordance
with the literature where a water-holding capacity of native vital wheat gluten
of 1.45 g water/g solid is reported [19]. In this study, a high solid concentration
is defined as the solid concentration at which native vital wheat gluten forms
a dough and all the water is held by the solid phase. This applied for solid
concentrations of 40% and higher.
The transition from a suspension to a dough also resulted in an increase
in viscosity. This increased viscosity impeded the mixing of the system during
hydrolysis. Moreover, the smaller part of the solid that remained dry at 60%
solid concentration (Fig. 4.1c) was inaccessible to the enzyme at the beginning of
the hydrolysis reaction. Nevertheless, the wheat gluten remained susceptible to
enzymatic hydrolysis at all solid concentrations investigated despite the fact that
the initial conditions changed. Once the hydrolysis started, liquefaction occurred
shortly afterwards. Within 20 min, most of the initial solid phase dispersed in
the water phase and a homogenous slurry was formed at all solid concentrations.
57

Cha
pter
4C
hapt
er4
Cha
pter
4C
hapt
er4
Chapter 4
Furthermore, an insoluble lump, most likely consisting of starch, remained after
termination of the hydrolysis reaction for solid concentrations below 60%. The
hydrolysis of wheat gluten was accompanied by a decrease in viscosity. This
decrease in viscosity has also been reported in the literature [7]. Fig. 4.1d–f
shows the changes in appearance on enzymatic hydrolysis for the different solid
concentrations in a DH% range of 8.4–9.4%.
Table 4.1 shows the influence of the hydrolysis time on the DH% for different
solid concentrations. A DH% of 4.5% was reached within 75 min for solid
concentrations of 10%, 20%, and 40%; the differences in reaction time were
minor. For higher DH%, these differences became progressively greater. For a
solid concentration of 60%, a strong increase in reaction time was observed for
all DH%. Compared with a solid concentration of 10%, a more than twofold
increase in reaction time was required to achieve a DH% of 3.8%, and a threefold
increase to achieve a DH% of 9.2%. Nevertheless, the increase in reaction time
at 60% compared with 10% is in contrast to a sixfold increase in hydrolyzed
substrate.
4.3.2 Molecular mass
Size-exclusion high-performance liquid chromatography experiments were
conducted to reveal the influence of the solid concentration during proteolysis
on the molecular mass distribution of the wheat gluten hydrolysates (Fig. 4.2).
Fig. 4.2a shows the impact of hydrolysis on the molecular mass distribution for
a solid concentration of 10%. According to expectations, the average molecular
mass decreased on hydrolysis as indicated by decreasing ratios of peptides
>10 kDa. These results are similar to those of Wang et al. [143] who found
around 90% of peptides were in a molecular mass range between 5 and 15 kDa
for papain-catalyzed wheat gluten hydrolysis in a DH% range of 3–10%. Linarès
et al. [80] concluded that most peptides had a molecular mass of 15–25 kDa for
DH% below 5%.
The influence of the solid concentration on the molecular mass for
hydrolysates with a DH% of 3.8–5.5% is demonstrated in Fig. 4.2b. No
noticeable differences were observed for solid concentrations of 10% and 20%
in all molecular mass classes in contrast to solid concentrations of 40% and
58

Cha
pter
4C
hapt
er4
Cha
pter
4C
hapt
er4
Wheat gluten hydrolysis at high solid concentrations and functional properties
0 % 3 % 6 % 9 % 1 2 %0 %
5 %
1 0 %
1 5 %
2 0 %
2 5 %
3 0 %
1 0 % s o l i d sD H % : 3 . 2 %
1 0 % s o l i d sD H % : 5 . 9 %
1 0 % s o l i d sD H % : 8 . 4 %
1 0 % s o l i d sD H % : 1 0 . 2 %
0 %
2 0 %
4 0 %
6 0 %
8 0 %
1 0 0 %
awe
ight f
ractio
n > 2 5 k D a 1 0 - 2 5 k D a 2 - 1 0 k D a < 2 k D a
1 0 % s o l i d sD H % : 4 . 4 %
2 0 % s o l i d sD H % : 4 . 9 %
4 0 % s o l i d sD H % : 4 . 5 %
6 0 % s o l i d sD H % : 3 . 8 %
6 0 % s o l i d sD H % : 5 . 5 %
0 %
2 0 %
4 0 %
6 0 %
8 0 %
1 0 0 %
b
weigh
t frac
tion
c
1 0 % 2 0 % 4 0 % 6 0 %we
ight f
ractio
n >2
5 kDa
D H %
Fig. 4.2: Influence of the solid concentration during proteolysis on the molecular mass of wheatgluten hydrolysates soluble in water plus 2% (w/w) SDS. (a) Influence of the DH% on themolecular mass at a solid concentration of 10%. (b) Influence of the solid concentration on themolecular mass in a DH% range of 3.8–5.5%. (c) Influence of the solid concentration and theDH% on the weight fraction of peptides >25 kDa. Horizontal lines are drawn to guide the eye.
60%, for which an increasing concentration of peptides with a molecular mass
of 10–25 kDa and >25 kDa was found concomitant with a decrease in peptides
<10 kDa. More than 25% of all peptides had a molecular mass >25 kDa at a
solid concentration of 60% and a DH% of 5.5%; this figure was only 18.8% at a
solid concentration of 10% and a DH% of 4.4%. Fig. 4.2c shows the influence of
the solid concentration and the DH% on the weight fraction of peptides with a
molecular mass >25 kDa. It can be seen that increasing DH% resulted in a
decrease in peptides with a molecular mass >25 kDa. In addition, high solid
59

Cha
pter
4C
hapt
er4
Cha
pter
4C
hapt
er4
Chapter 4
concentrations resulted in a higher weight fraction of peptides with a molecular
mass >25 kDa than low solid concentrations at any DH% investigated.
The increased weight fraction of peptides with a molecular mass >25 kDa is
most likely related to the increase in viscosity at high solid concentrations. A
higher viscosity influences the mass transfer of the enzyme and the substrate
and it influences the mass transfer of the products away from the reactive site of
the enzyme. Roberts et al. [110] examined the effective diffusivity of
gadolinium-labeled bovine serum albumin (BSA) in high-solid cellulose
suspensions. BSA thereby acted as a model protein approximating cellulase.
The authors demonstrated decreasing effective diffusivities of BSA for increasing
solid concentrations. Hence, if the enzyme mixture and the substrate are less
mobile in the high-solid wheat gluten system discussed here, which could lead
to enzyme attack at the outer parts of the gluten molecules, then this would
lead to a higher number of shorter peptides and longer peptides compared with
a system with a low solid concentration.
4.3.3 Solubility
Fig. 4.3 depicts the influence of the DH% on the nitrogen solubility index (NSI)
for different solid concentrations. The wheat gluten solubility increased during
0 % 3 % 6 % 9 % 1 2 %0 %
1 0 %
2 0 %
3 0 %
4 0 %
5 0 %
6 0 %
7 0 %
n a t i v e w h e a t g l u t e n
1 0 % 2 0 % 4 0 % 6 0 %
nitrog
en so
lubilit
y ind
ex (N
SI)
D H %
Fig. 4.3: Influence of the DH% on the NSI for different solid concentrations. The standarddeviation was maximal 1.6%. The lower dashed line represents the NSI of native vital wheatgluten. The legend indicates the solid concentration during proteolysis.
60

Cha
pter
4C
hapt
er4
Cha
pter
4C
hapt
er4
Wheat gluten hydrolysis at high solid concentrations and functional properties
hydrolysis and depended on the DH%. The NSI increased from 8.1% for native
wheat gluten to 34.8% at a DH% of 3.0% and to 65.5% at a DH% of 10.2%.
Furthermore, the results suggest that the solid concentration during proteolysis
did not affect the water solubility of the wheat gluten hydrolysates.
4.3.4 Foam stability
Fig. 4.4 depicts the influence of the solid concentration during proteolysis on the
foam stability. Fig. 4.4a shows the foam stability of 2.0 mg/mL gluten solutions
0 % 3 % 6 % 9 % 1 2 %0 %
2 0 %
4 0 %
6 0 %
8 0 %
1 0 0 %
0 % 3 % 6 % 9 % 1 2 %0 %
2 0 %
4 0 %
6 0 %
8 0 %
1 0 0 %
n a t i v e g l u t e n 1 0 % 2 0 % 4 0 % 6 0 %
a
remain
ing fo
am
D H %
b
n a t i v e g l u t e n 1 0 % 2 0 % 4 0 % 6 0 %
remain
ing fo
am
D H %
Fig. 4.4: Effect of the solid concentration during proteolysis and the DH% on foam stability. Thelegend indicates the solid concentration during proteolysis or the usage of native vital wheatgluten, respectively. Closed and open symbols represent foam remaining after 5 and 15 min,respectively. Insoluble parts were removed before the measurements. Error bars represent thestandard deviation of four measurements. (a) Foam stability with a constant protein solutionof 2.0 mg/mL wheat gluten after centrifugation. (b) Foam stability at a constant hydrolysateconcentration of 4.25 mg/mL wheat gluten before centrifugation.
after 5 and 15 min. The foams were most stable for native wheat gluten; the
stability decreased with increasing DH% independently of the solid concentration
and the time. These results are in line with other studies. Linarès et al. [80]
reported no significant influence of the DH% on the half drainage times for
constant soluble concentrations in a DH%-range of 0.5–4.7%. This is comparable
with the results in this study, where more than 78% of the foams remained after
5 min up to a DH% of 5.9%. Decreasing foam stabilities for increasing DH%
were reported for higher DH% ranges [37, 70].
61

Cha
pter
4C
hapt
er4
Cha
pter
4C
hapt
er4
Chapter 4
The foam stability was independent of the solid concentration at DH%<7.0%,
but did depend on the solid concentration at higher DH%. The foam stability was
lower for wheat gluten hydrolysates prepared with solid concentrations of 10%
and 20%, whereas hydrolysates from solid concentrations of 40% and 60% led
to more than 60% of the foam remaining after 5 min. These differences in foam
stability were greatly reduced after 15 min. The difference in foam stability is
probably caused by the presence of a higher weight fraction of peptides >25 kDa
with increasing solid concentrations, which is beneficial for stabilizing foams.
Wang et al. [142] separated wheat gluten hydrolysates at a DH% of 2.6% using
ultrafiltration, and found that foam stability decreased with peptide size. The
stability of the foam noticeably diminished, especially for peptide sizes below
50 kDa, in agreement with a study by Popineau et al. [108].
Fig. 4.4b demonstrates the foam stability after 5 min with a constant mass
of hydrolysate suspended in water. The concentration of solubilized wheat
gluten increases with the DH% as illustrated in Fig. 4.3. Native wheat gluten
thus showed poor foam stability due to the low solubility. Foam stability was
enhanced up to a DH% of 3.2% for increasing DH% and remained constant up
to a DH% of 5.9% with more than 79% of the foam remaining after 5 min. For
wheat gluten hydrolysates with a DH% higher than 5.9%, the stability of the foam
depended on the solid concentration during proteolysis, confirming the result in
Fig. 4.4a. Increased foam stability with increasing DH% at constant hydrolysate
concentrations has been reported up to a DH% of 4.7% [80]. Fig. 4.4b shows
that there is an optimum DH% at which the solubility of the protein is enhanced
and the foam stability has not yet deteriorated. The result is a foam that is more
than twice as high as that obtained with native wheat gluten after 5 min. At low
DH%, the solubility of the hydrolysates is not sufficient; at high DH%, peptides
show low foam-stabilizing properties.
4.3.5 Industrial potential of high-solid wheat gluten hydrolysis
Increasing the solid concentration is relevant for new industrial applications that
aim to save water and energy. The water consumption, heat of vaporization,
and reactor productivity were estimated to compare wheat gluten hydrolysis at
low and high solid concentrations on a larger scale. The evaporation energy of
62

Cha
pter
4C
hapt
er4
Cha
pter
4C
hapt
er4
Wheat gluten hydrolysis at high solid concentrations and functional properties
Table 4.2: Water consumption, heat of vaporization, and reactor productivity for wheat glutenhydrolysis at solid concentrations ranging from 10% to 60%; the reactor productivity assumes afinal DH% of 4.5% for wheat gluten hydrolysates.
Solid Water Heat of Reactorconcentration consumption vaporization productivity
(l/kg gluten) (MJ/kg gluten) (kg gluten/m3h)
10% 9.0 20.3 112.320% 4.0 9.0 189.540% 1.5 3.4 446.460% 0.7 1.5 352.2
water is 2257 MJ/kg. For reactor productivity, hydrolysis times of 55, 67, 60,
and 120 min were assumed for solid concentrations of 10%, 20%, 40%, and
60%, respectively, to reach a DH% of 4.5%; the enzyme-to-substrate ratio was
1:100. This was based on the findings in Table 4.1. Furthermore, the density of
wheat gluten was calculated to be 1290 kg/m3 [50]. Table 4.2 illustrates the
water consumption, the heat of vaporization, and the reactor productivity for
solid concentrations of 10–60%.
Hydrolyzing wheat gluten at a solid concentration of 10% requires 9 L of
water per kg of gluten, whereas at a solid concentration of 60% 0.7 L of water
per kg of gluten are consumed. In other words, more than 92% of water can be
saved. Furthermore, the heat of vaporization reduces in the same percentage.
One possibility to dry wheat gluten hydrolysates is spray drying [22]. However,
an energy efficiency of 50% has to be taken into account for wheat gluten drying
[119]. It is clear that a higher solid concentration is always favorable regarding
water and energy consumption. However, an optimum solid concentration was
found for reactor productivity. Although the reactor productivity data give only
an estimation of the actual reactor productivity, they show that the highest
productivity occurs at a solid concentration of 40%. This can be explained by
the observed increase in reaction time for increasing solid concentrations above
40%. A higher reaction rate, and therefore higher reactor productivity, can be
achieved by increasing the enzyme load at a solid concentration of 60%. However,
mixtures of endo- and exoproteases are expensive, which affects the cost of the
process to a large extent [38]. Nevertheless, high solid concentrations show
63

Cha
pter
4C
hapt
er4
Cha
pter
4C
hapt
er4
Chapter 4
great potential with regard to lowering the consumption of water and energy
and increasing reactor productivity compared with low solid concentrations of
10% and 20%.
4.4 Conclusions
Wheat gluten is commonly hydrolyzed enzymatically at solid concentrations
below 20%. The findings of this study show that wheat gluten can be
hydrolyzed at solid concentrations as high as 60%. The solubility of the
resulting wheat gluten hydrolysates was independent of the solid concentration
during proteolysis. Foam stability was only affected at higher DH%. This can be
explained by changes in the molecular mass distribution. Hydrolysis at high
solid concentration leads to enhanced reactor productivity and shows potential
for water and in particular for high energy savings compared with a solid
concentration of 10%. Increased reaction times at very high solid concentrations
result in optimum productivity at 40% solids.
Acknowledgements
The research leading to these results has received funding from the [European
Community’s] Seventh Framework Programme [FP7/2007-2013] under grant
agreement no. 238084. We thank Marc Goedhoop for technical assistance.
64

Cha
pter
5C
hapt
er5
Cha
pter
5C
hapt
er5
Cha
pter
5
CH
AP
TE
R
5Factors impeding enzymatic wheat gluten
hydrolysis at high solid concentrations

Cha
pter
5C
hapt
er5
Cha
pter
5C
hapt
er5
Cha
pter
5
Chapter 5
Abstract
Enzymatic wheat gluten hydrolysis at high solid concentrations is advantageous
from an environmental and economic point of view. However, increased wheat
gluten concentrations result in a concentration effect with a decreased
hydrolysis rate at constant enzyme-to-substrate ratios and a decreased
maximum attainable degree of hydrolysis (DH%). We here identified the
underlying factors causing the concentration effect. Wheat gluten was
hydrolyzed at solid concentrations from 4.4% to 70%. The decreased hydrolysis
rate was present at all solid concentrations and at any time of the reaction.
Mass transfer limitations, enzyme inhibition and water activity were shown to
not cause this hydrolysis rate limitation up to 50% solids. However, the
hydrolysis rate limitation can be, at least partly, explained by a second-order
enzyme inactivation process. Furthermore, mass transfer impeded the
hydrolysis above 60% solids. The addition of enzyme after 24 h at high solid
concentrations scarcely increased the DH%, suggesting that the maximum
attainable DH% decreases at high solid concentrations. Reduced enzyme
activities caused by low water activities can explain this DH% limitation. Finally,
a possible influence of the plastein reaction on the DH% limitation is discussed.
This chapter has been published as:Hardt, N. A., A. E. M. Janssen, R. M. Boom, and A. J. van der Goot (2014). Factorsimpeding enzymatic wheat gluten hydrolysis at high solid concentrations. Biotechnologyand Bioengineering 111(7), 1304–1312.
66

Cha
pter
5C
hapt
er5
Cha
pter
5C
hapt
er5
Cha
pter
5
Factors impeding enzymatic wheat gluten hydrolysis at high solid concentrations
low solid concentration
concentration effect
mass transfer limitationsenzyme inhibition
enzyme inactivationwater availabilityplastein reaction
high solid concentration
hydrolsis rate limitation
high solid concentration
low solid concentration
DH% limitation
wheat gluten hydrolysis
deg
ree
of h
ydro
lysi
s
time
Fig. 5.1: Chapter 5 – graphical table of contents.
5.1 Introduction
Wheat gluten is a high-value plant protein, available in abundance as a by-
product of the wheat starch production. Although native wheat gluten is an
excellent bread improver, its insolubility in water at neutral pH rather limits
further applications in the food industry. Therefore, enzymatic hydrolysis is a
mild and selective process to increase the water solubility and to alter other
functional properties of wheat gluten, such as the foaming and emulsifying
properties [57, 70]. In practice, wheat gluten hydrolysates are used as e.g.
savory flavoring agents, in sports nutrition, and for the production of bioactive
peptides [13, 51].
Currently, wheat gluten is hydrolyzed at rather low solid concentrations. In
literature, the highest wheat gluten concentrations reported ranged between 17–
67

Cha
pter
5C
hapt
er5
Cha
pter
5C
hapt
er5
Cha
pter
5
Chapter 5
22% for enzymatic hydrolysis at neutral pH [22, 84]. Hydrolyzing wheat gluten
at higher solid concentrations, though, provides several benefits. A higher solid
concentration results in smaller reactors and equipment, reducing capital costs
[93]. Furthermore, less energy is required for the process and the consequent
dehydration of the product, thus reducing the processing energy usage and
costs. Finally, hydrolyzing at a high solid concentration requires less water and
produces less wastewater with inherently lower treatment and disposal costs.
On the downside, high-solid hydrolysis also creates new challenges. One
major effect, here denoted as concentration effect, signifies lower degrees of
hydrolysis (DH%) at higher wheat gluten concentrations. The concentration
effect has also been referred to as solids effect [72] and has been reported for
several biopolymeric materials including lignocellulose [72] , cellulose [110],
starch [6], whey protein [16], and wheat gluten [57].
Several factors must be taken into account as possible causes of the
concentration effect. These are: (1) Mass transfer limitations: A higher solid
concentration results in a higher viscosity and therefore higher diffusion times,
especially for substrates that cannot be dissolved completely. The enzyme,
substrate and product diffusion can be hindered, leading to a non-homogeneous
distribution of enzyme and substrate [110]. Furthermore, the ability of the
enzyme to diffuse is reduced above a critical substrate concentration, leading to
decreased reaction rates [20]. (2) Enzyme inhibition: Increasing solid
concentrations can favor product inhibition, since the diffusion of the product
away from the reactive site can be impeded [59] and the total amount of
product increases. Some studies revealed the detrimental influence of product
inhibition at high solid loadings for olive tree biomass and softwood [17, 123].
Other studies, though, excluded product inhibition as a cause of the
concentration effect [16, 72, 110, 130]. (3) Enzyme inactivation might increase
with solid concentration. Additionally, a higher enzyme concentration in the
case of proteases could enhance the inactivation of the enzyme. (4) Water
availability: Increasing solid concentrations and progressive hydrolysis result in
a decline in water activity and thus water availability. This can result in lower
enzyme activities. (5) The water activity influences the thermodynamic
equilibrium of the hydrolysis reaction where higher water activities favor
68

Cha
pter
5C
hapt
er5
Cha
pter
5C
hapt
er5
Cha
pter
5
Factors impeding enzymatic wheat gluten hydrolysis at high solid concentrations
hydrolysis while lower water activities favor peptide synthesis (see e.g. [140]).
Furthermore, in this study, the high-solid wheat gluten hydrolysis is performed
in a concentration range similar to the range where the plastein reaction takes
place. In the plastein reaction, water-insoluble higher molecular mass peptides
are formed out of water-soluble peptides in the presence of proteases.
In a previous study, we showed that wheat gluten can be hydrolyzed at high
solid concentrations without detrimental changes in the water solubility and the
foam stabilizing properties, while the highest productivity was at 40% solids
[57]. In this paper, we report on the underlying factors impeding wheat gluten
hydrolysis at high solid concentrations. Here, high-solid wheat gluten hydrolysis
will be defined as the solid concentration at which native wheat gluten forms a
dough and no free liquid is present, which implies a solid concentration of 40%
or higher.
5.2 Materials & Methods
5.2.1 Materials
Native vital wheat gluten (Roquette) with 74.0±0.5% crude protein content
(N×5.7 [102]) and 8.0±0.6% water content (all by weight) was obtained from
Barentz BV, Hoofddorp, The Netherlands. Protease from Aspergillus oryzae
(Flavourzyme 500 LAPU/g) from Novozymes was purchased from
Sigma-Aldrich, Germany. Flavourzyme contains a mixture of endo- and
exoproteases [38]. Milli-Q water was used in all experiments.
5.2.2 Hydrolysis reaction
The hydrolysis was carried out using 200-mL double-walled glass vessels
connected to a water bath. Each experiment was conducted using a total mass
of 150 g reaction mixture and varying solid concentrations from 4.4% to 70%
(w/w). The solid concentrations, enzyme concentrations, and
enzyme-to-substrate ratios (w/w) used are depicted in Table 5.1.
Only the protein fraction of native wheat gluten was considered as substrate
when calculating the enzyme-to-substrate ratios. Furthermore, the water present
69
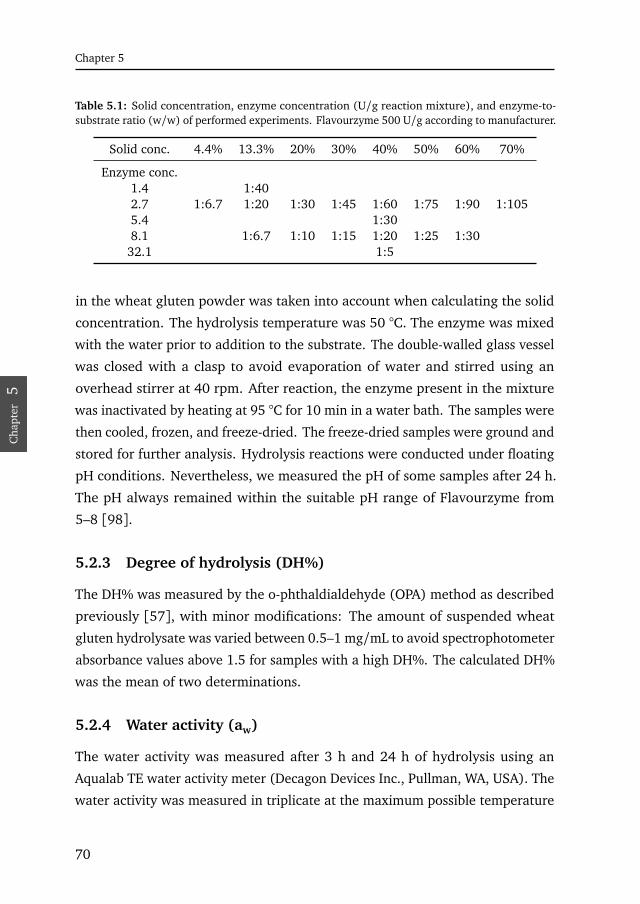
Cha
pter
5C
hapt
er5
Cha
pter
5C
hapt
er5
Cha
pter
5
Chapter 5
Table 5.1: Solid concentration, enzyme concentration (U/g reaction mixture), and enzyme-to-substrate ratio (w/w) of performed experiments. Flavourzyme 500 U/g according to manufacturer.
Solid conc. 4.4% 13.3% 20% 30% 40% 50% 60% 70%
Enzyme conc.1.4 1:402.7 1:6.7 1:20 1:30 1:45 1:60 1:75 1:90 1:1055.4 1:308.1 1:6.7 1:10 1:15 1:20 1:25 1:30
32.1 1:5
in the wheat gluten powder was taken into account when calculating the solid
concentration. The hydrolysis temperature was 50 °C. The enzyme was mixed
with the water prior to addition to the substrate. The double-walled glass vessel
was closed with a clasp to avoid evaporation of water and stirred using an
overhead stirrer at 40 rpm. After reaction, the enzyme present in the mixture
was inactivated by heating at 95 °C for 10 min in a water bath. The samples were
then cooled, frozen, and freeze-dried. The freeze-dried samples were ground and
stored for further analysis. Hydrolysis reactions were conducted under floating
pH conditions. Nevertheless, we measured the pH of some samples after 24 h.
The pH always remained within the suitable pH range of Flavourzyme from
5–8 [98].
5.2.3 Degree of hydrolysis (DH%)
The DH% was measured by the o-phthaldialdehyde (OPA) method as described
previously [57], with minor modifications: The amount of suspended wheat
gluten hydrolysate was varied between 0.5–1 mg/mL to avoid spectrophotometer
absorbance values above 1.5 for samples with a high DH%. The calculated DH%
was the mean of two determinations.
5.2.4 Water activity (aw)
The water activity was measured after 3 h and 24 h of hydrolysis using an
Aqualab TE water activity meter (Decagon Devices Inc., Pullman, WA, USA). The
water activity was measured in triplicate at the maximum possible temperature
70

Cha
pter
5C
hapt
er5
Cha
pter
5C
hapt
er5
Cha
pter
5
Factors impeding enzymatic wheat gluten hydrolysis at high solid concentrations
of 40 °C. The reproducibility was ±0.002 aw units. Samples for water activity
measurements were not inactivated to avoid possible changes on the water
activity during the inactivation.
5.2.5 Sorption isotherms
Adsorption isotherms were measured using the dynamic vapor sorption (DVS)
elevated temperature system (SMS Ltd, London, UK). The measurements were
carried out at 50 °C with a sample mass of 10–15 mg freeze-dried hydrolysate.
The samples were considered to be at equilibrium at a given water activity, once
the sample weight varied for less than 0.002%/min within a timeframe of 30 min
or when a maximum measuring time of 600 min was reached.
To determine the total water uptake in the sorption isotherms, it is necessary
to know the moisture contents of the freeze-dried hydrolysates at ambient
temperature and humidity. These were measured in duplicate using the
Sartorius Moisture Analyzer MA45 at 130 °C. The moisture contents were
11.7%, 13.0%, 14.8%, and 17.5% for hydrolysates hydrolyzed at 60%, 40%,
20%, and 13.3% solids, respectively. The reproducibility was ±0.3%.
Furthermore, it was investigated whether freeze-drying, enzyme inactivation,
and the enzyme itself influenced the sorption isotherms. Otherwise, a clear
comparison between native and hydrolyzed wheat gluten is difficult, since native
wheat gluten contained no Flavourzyme, was not heat-treated after hydrolysis,
and not freeze-dried. To investigate the influence of all these factors, enzyme at a
concentration of 8.1 U/g reaction mixture was dispersed in water and inactivated
for 10 min at 95 °C. Afterwards, this inactivated water-enzyme mixture was mixed
with native wheat gluten at 60% solids and immediately inactivated again for
10 min at 95 °C. The sample was subsequently freeze-dried and used for DVS
analysis. The moisture content was 10.5%.
5.2.6 Size-exclusion high-performance liquid chromatography
Size-exclusion HPLC experiments were performed using a Thermo Surveyor
Plus HPLC system (Thermo Scientific) equipped with a PDA detector. Wheat
gluten hydrolysate (2.5 mg/mL) was suspended in 12.5 mM sodium tetraborate
71

Cha
pter
5C
hapt
er5
Cha
pter
5C
hapt
er5
Cha
pter
5
Chapter 5
decahydrate plus 2% (w/w) SDS, stirred overnight, and then centrifuged at
3900 × g for 15 min. The resulting supernatant was injected onto a TSKGel
G2000 SWXL (300×7.8 mm) column and eluted with 70% / 30% / 0.1% water /
acetonitrile / trifluoroacetic acid at a flow rate of 1.0 mL/min and detected at
a wavelength of 214 nm. All experiments were performed in duplicate. The
molecular mass was determined using molecular mass markers based on carbonic
anhydrase (29,000 Da), α-lactalbumin (14,100 Da), aprotinin (6510 Da), insulin
(5700 Da), bacitracin (1420 Da), and phenylalanine (165 Da).
5.3 Results
5.3.1 The concentration effect
The influence of the solid concentration on the DH% during enzymatic wheat
gluten hydrolysis is depicted in Fig. 5.2. The DH% increased with the reaction
0 6 1 2 1 8 2 40 %
1 0 %
2 0 %
3 0 %
4 0 %
5 0 %
6 0 %
7 0 %
0 6 1 2 1 8 2 40 %
1 0 %
2 0 %
3 0 %
4 0 %
5 0 %
6 0 %
7 0 %
DH%
t i m e ( h )
a 4 0 % 5 0 % 6 0 % 7 0 %
b 4 . 4 % 1 3 . 3 % 2 0 % 3 0 %
DH%
t i m e ( h )
Fig. 5.2: Influence of the solid concentration on the increase in DH% over time. (a) Constantenzyme-to-substrate ratio of 1:30. (b) Constant enzyme concentration of 2.7 U/g reaction mixture.Standard deviations are presented where experiments have been performed in triplicate. Thelegend indicates the solid concentration during proteolysis and is valid for Fig. (a) and (b). Linesare drawn to guide the eye.
time for all samples within 24 h, but this leveled off towards a plateau. Between
24 h and 48 h the increase in DH% was less than 2%. Furthermore, increasing
the solid concentration led to a reduced DH% at every time of the hydrolysis
reaction for a constant enzyme-to-substrate ratio of 1:30 (Fig. 5.2a) and thus
72

Cha
pter
5C
hapt
er5
Cha
pter
5C
hapt
er5
Cha
pter
5
Factors impeding enzymatic wheat gluten hydrolysis at high solid concentrations
also for a constant enzyme concentration of 2.7 U/g reaction mixture (Fig. 5.2b).
The highest DH% reached during this study was 65% at a solid concentration of
4.4% after 48 h.
5.3.2 Addition of water and enzyme
Fig. 5.3 shows the influence of changes in the water and enzyme concentration
on the DH% after 24 h. Hydrolysis reactions were performed for a total of 48 h.
0 2 4 3 0 3 6 4 2 4 80 %
1 0 %
2 0 %
3 0 %
4 0 %
5 0 %
0 2 4 3 0 3 6 4 2 4 80 %
1 0 %
2 0 %
3 0 %
4 0 %
5 0 %
e n z y m e a d d i t i o n( 4 0 % 8 . 1 U / g )
w a t e r a d d i t i o n( 1 3 . 3 % 0 . 9 U / g )
4 0 % 2 . 7 U / g
a
DH%
t i m e ( h )
w a t e r + e n z y m e a d d i t i o n( 1 3 . 3 % 3 . 6 U / g )
1 3 . 3 % 2 . 7 U / g b
DH%
t i m e ( h )
e n z y m e a d d i t i o n( 6 0 % 8 . 1 U / g )
w a t e r a d d i t i o n( 2 0 % 0 . 9 U / g )
6 0 % 2 . 7 U / g
w a t e r + e n z y m e a d d i t i o n( 2 0 % 3 . 6 U / g )
2 0 % 2 . 7 U / g
Fig. 5.3: Influence of dilution and additional enzyme addition on the hydrolysis reaction. Initialreactions were all performed with 2.7 U/g reaction mixture and a solid concentration of (a)40% and (b) 60%. Water addition: Threefold dilution. Enzyme addition: Enzyme addition of5.4 U/g reaction mixture. Water + enzyme addition: Threefold dilution and enzyme addition of2.7 U/g reaction mixture. Data in brackets show resulting solid and enzyme concentration. Forcomparison, 13.3%, 20%, 40%, and 60% 2.7 U/g show the DH% after 48 h when the reaction wasinitially started with the respective solid and enzyme concentration. All other process conditionsbesides water and enzyme addition were not altered throughout the whole 48 h.
After 24 h either water, enzyme, or water and enzyme were added. All other
initial conditions were not altered. The addition of 5.4 U/g reaction mixture at
40% solids increased the DH% from 23.4% after 24 h to 25.3% after 48 h only
(Fig. 5.3a). A threefold dilution, which also resulted into a threefold reduction
of the enzyme concentration, resulted in a higher increase in DH% from 23.4%
to 32.3% after 48 h. The combination of enzyme and water addition led to
the highest increase in DH%. Here, the DH% after 48 h was similar to the
DH% obtained when initially hydrolyzing wheat gluten at 13.3% solids and
73

Cha
pter
5C
hapt
er5
Cha
pter
5C
hapt
er5
Cha
pter
5
Chapter 5
2.7 U/g reaction mixture. Fig. 5.3b displays the same procedure for 60% solids.
A threefold dilution again resulted in a higher increase in DH% than the addition
of enzyme. Furthermore, the combined addition of enzyme and water led again
to the highest increase in DH%.
5.3.3 Molecular mass distribution
The molecular mass distributions of selected gluten hydrolysates are shown
in Fig. 5.4. Samples with a low DH% showed the highest peak after 5.8 min
3 4 5 6 7 8 9 1 0 1 1 1 20
6 0
1 2 0
1 8 0
2 4 0
3 0 0
3 6 0
4 2 0
4 8 0
5 4 0
6 0 0
g
f
e
d
c
b
0 . 1 6 5 k D a1 . 4 k D a5 . 7 k D a1 4 . 1 k D a
D H % : 1 7 . 8 %
D H % : 1 7 . 7 %
D H % : 1 9 . 3 %
D H % : 2 1 . 0 %
D H % : 2 0 . 6 %
D H % : 6 4 . 7 %
mAU
e l u t i o n t i m e ( m i n )
D H % : 2 . 2 %
e n z y m e a d d i t i o n
2 9 k D a
6 0 % , 2 . 7 U / g , 1 h
4 . 4 % , 2 . 7 U / g , 2 4 h
4 . 4 % , 2 . 7 U / g , 0 . 5 h
2 0 % , 2 . 7 U / g , 3 h
6 0 % , 8 . 1 U / g , 2 4 h
6 0 % , 5 . 4 U / g , 4 8 h ,
4 0 % , 2 . 7 U / g , 6 h
a
Fig. 5.4: Molecular mass distributions of selected gluten hydrolysates. Curves were modified in away that all have the same area under the curve. The legend indicates DH%, solid concentration,enzyme concentration, and time of sampling.
elution time (Fig. 5.4a), representing high molecular mass fragments. The
sample with the highest DH% obtained in this study had the maximum peak
after 10.3 min (Fig. 5.4b), representing individual amino acids and oligopeptides.
When comparing samples with similar DH%, the molecular mass distributions
74

Cha
pter
5C
hapt
er5
Cha
pter
5C
hapt
er5
Cha
pter
5
Factors impeding enzymatic wheat gluten hydrolysis at high solid concentrations
were rather independent of the solid concentration up to 40%, but at 60%
solids a distinct peak after 6.7 min (indicative of fragments of around 14 kDa)
was observed (Fig. 5.4c–g). This higher peak after 6.7 min at 60% solids was
reproducible and not a product of peptide aggregation, since the addition of 6M
urea resulted in the same peak area (curve not shown).
5.3.4 Water activity and sorption isotherm
The relation between wheat gluten hydrolysis at different solid concentrations
and the water activity and sorption isotherms is depicted in Fig. 5.5. Differences
0 % 2 0 % 4 0 % 6 0 % 8 0 % 1 0 0 %0 %
2 0 %
4 0 %
6 0 %
8 0 %
1 0 0 %
1 2 0 %ba D H % : 5 0 . 5 % D H % : 4 5 . 8 % D H % : 3 2 . 0 % D H % : 1 9 . 3 % n a t i v e w h e a t g l u t e n n a t i v e w h e a t g l u t e n
+ e n z y m e , f r e e z e - d r i e d
water
conte
nt (d
ry ba
sis)
w a t e r a c t i v i t y a w
1 3 . 3 % 2 0 % 4 0 % 6 0 %0 . 7 5
0 . 8 0
0 . 8 5
0 . 9 0
0 . 9 5
1 . 0 0
s o l i d c o n c e n t r a t i o n
water
activ
ity a w
45.8%
40.3%
33.6%
21.0%
32.0%
23.4%
20.4%
10.5%
19.3%
12.5%
10.8%
5.5%
50.5%
45.2%
38.8%
28.7%
Fig. 5.5: (a) Influence of the DH% on the water activity at different solid concentrations.Percentages in bars show the DH%. (b) Sorption isotherms obtained by DVS for native wheatgluten and wheat gluten hydrolysates. Analyzed samples were hydrolysates after 24 h, hydrolyzedat 13.3%, 20%, 40%, and 60% solids, respectively (from high DH% to low DH%).
in the water activity (aw) were minor for 13.3% and 20% solids and aw
remained higher than 0.95 even at DH% above 45% (Fig. 5.5a). At 40% and
60% solids, the water activity decreased noticeably upon hydrolysis to 0.909 at
a DH% of 32.0% for 40% solids and to 0.795 at a DH% of 19.3% for 60% solids.
The sorption isotherms shown in Fig. 5.5b reveal a higher equilibrium water
content of the hydrolyzed samples compared to native wheat gluten at all water
activities investigated. Furthermore, a higher DH% resulted in higher water
contents. The increase in equilibrium water content for the hydrolyzed samples
was independent of the inactivated enzyme present in the hydrolysate, the
inactivation process, and the freeze-drying of the samples. To test this, the DVS
75

Cha
pter
5C
hapt
er5
Cha
pter
5C
hapt
er5
Cha
pter
5
Chapter 5
result of native wheat gluten was compared with the DVS results of freeze-dried
native wheat gluten that contained inactivated enzyme - the DVS results were
similar at all aw.
5.4 Discussion
In wheat gluten hydrolysis the concentration effect can be divided into a
hydrolysis rate limitation and a DH% limitation (Fig. 5.6). The hydrolysis rate
hydrolsis rate limitation
DH
%
time
high solid concentration
low solid concentration
DH% limitation
Fig. 5.6: Schematic illustration of the concentration effect. The concentration effect refers toa decreased hydrolysis rate at constant enzyme-to-substrate ratios and a decreased maximumattainable DH%.
limitation refers to decreased reaction rates at higher solid concentrations and
constant enzyme-to-substrate ratios meaning that the difference in DH%
between low and high solid concentration increases over time (Fig. 5.2 and
Fig. 5.6). The DH% limitation refers to a decreased maximum attainable DH%
at higher solid concentrations, which could not be corrected for by adding more
enzyme or increasing the reaction time (Fig. 5.3 and Fig. 5.6). Whereas the
hydrolysis rate limitation is most pronounced at the beginning of the hydrolysis
reaction, the DH% limitation impedes the hydrolysis at the end of the reaction.
Below, we will evaluate the possible influencing factors regarding the hydrolysis
rate limitation and the DH% limitation.
76

Cha
pter
5C
hapt
er5
Cha
pter
5C
hapt
er5
Cha
pter
5
Factors impeding enzymatic wheat gluten hydrolysis at high solid concentrations
5.4.1 Mass transfer limitations
Native wheat gluten assumes the consistency of a dough at 30–40% solids,
which is characterized by a high viscosity, difficult mixing and slow diffusion
of enzyme, water and substrate. Nevertheless, liquefaction already occurs at
the initial stages of the hydrolysis [57]. Therefore, the highest mass transfer
limitations at higher solid concentrations would be expected in the beginning
of the hydrolysis, which would then affect the reaction rate. Fig. 5.7 shows the
influence of the solid concentration on the total conversion at constant enzyme
concentrations as function of time. Here, it was considered that the total amount
of cleaved peptide bonds is equal to the DH% (i.e. the percentage of cleaved
bonds) multiplied by the total amount of substrate. Fig. 5.7 demonstrates that
0 . 1 1 1 00
2
4
6
8
1 0
1 2
0 . 1 1 1 00
2
4
6
8
1 0
1 2 4 0 % 5 0 % 6 0 % 7 0 %
a
4 . 4 % 1 3 . 3 % 2 0 % 3 0 %
���
������
����
�����
���
���
� � � �
������
� ����
�����
� ��
�� ��
����
t i m e ( h )
4 0 % 5 0 % 6 0 %
1 3 . 3 % 2 0 % 3 0 %
b���
������
����
�����
���
���
� � � �
������
� ����
�����
� ��
�� ��
����
t i m e ( h )
Fig. 5.7: Influence of the solid concentration on the total number of cleaved peptide bondsat constant enzyme concentrations of (a) 2.7 and (b) 8.1 U/g reaction mixture. The y-axisis proportional to the total number of cleaved peptide bonds. The legend indicates the solidconcentration during hydrolysis. The reader is referred to Fig. 5.2 for standard deviations oftriplicate experiments.
the enzyme activity at a constant enzyme concentration was almost independent
of the solid concentration up to 50% solids at 2.7 and 8.1 U/g reaction mixture:
the total number of bonds cleaved remained almost constant. The reduced
number of peptide bonds cleaved at 2.7 U/g reaction mixture for 4.4% solids
after 1 h and for 13.3% solids after 6 h can be explained by substrate exhaustion:
the DH% for 4.4% solids after 6 h was already 45.9%; even at a theoretical DH%
of 100%, the number of peptide bonds cleaved would have been lower than at
77
Cha
pter
5C
hapt
er5
Cha
pter
5C
hapt
er5
Cha
pter
5
Chapter 5
all other studied solid concentrations. At 8.1 U/g reaction mixture substrate
exhaustion occurred earlier.
At 60% solids the total amount of cleaved peptide bonds was slightly lower
and at 70% solids the total conversion decreased drastically. It can therefore be
concluded that mass transfer limitations are not responsible for the hydrolysis
rate limitation up to 50% solids. However, mass transfer impeded the hydrolysis
above 60% solids. This is in line with Cheng and Prud’homme [20], who stated
that the diffusion of the enzymes controls the process above a certain substrate
concentration. Similarly, Hodge et al. [59] showed that enzymatic lignocellulose
hydrolysis was impaired by mass transfer limitations above a certain solid
concentration.
5.4.2 Enzyme inhibition
Enzyme inhibition has been reported for wheat gluten hydrolysis using
Flavourzyme [51]. Generally, enzyme inhibition originates from the fact that the
enzyme forms complexes with the product or the substrate thereby reducing the
active enzyme concentration. The extent of this effect increases with decreasing
enzyme-to-inhibitor ratios, as shown for example in the case of β-glucosidase
inhibition in cellobiose hydrolysis [151]. Therefore, enzyme inhibition will have
a more pronounced effect at low enzyme concentrations. For example, a low
enzyme concentration and a long hydrolysis time will only result in the same
DH% as a high enzyme concentration and a short hydrolysis time, if no
inhibition takes place. This is schematically shown in Fig. 5.8a for two different
solid concentrations. If inhibition takes place, the DH% will be lower at lower
enzyme concentrations (Fig. 5.8b). Fig. 5.8c depicts the influence of the initial
enzyme concentration multiplied by the reaction time on the DH% for different
solid and enzyme concentrations during gluten hydrolysis. The approach to
exclude enzyme inhibition in concentrated systems by comparing conversion
with enzyme concentration and hydrolysis time has been used previously by
Kristensen et al. [72]. We can see that for each separate solid concentration, the
curve with different enzyme ratios (filled, half-filled and empty symbols) is the
same, which indicates that there was no inhibition in the range studied. Of
course, the curve for each solid concentration still differs from that for other
78

Cha
pter
5C
hapt
er5
Cha
pter
5C
hapt
er5
Cha
pter
5
Factors impeding enzymatic wheat gluten hydrolysis at high solid concentrations
0 1 0 2 00 %
1 0 %
2 0 %
3 0 %
4 0 %
5 0 %
a
4 0 %
1 0 %
1 , 2 , 3
DH%
E 0 × t i m e
1 , 2 , 3
b32
1
DH%
E 0 × t i m e
321 4 0 %
1 0 %
c 1 3 . 3 %2 0 %4 0 %6 0 %
DH%
E 0 × t i m e ( U × h / g r e a c t i o n m i x t u r e )
Fig. 5.8: DH% as a function of the enzyme concentration multiplied by the reaction time.Schematic curves when (a) no enzyme inhibition and (b) enzyme inhibition takes place for(1) high, (2) medium, and (3) low enzyme concentration at solid concentrations of 10% and40%. (c) Wheat gluten hydrolysis. The legend indicates the solid concentration during hydrolysis.Enzyme concentrations of 8.1 (filled symbols) and 2.7 (half-filled symbols) U/g reaction mixture.Corresponding enzyme-to-substrate ratios are shown in Table 5.1. Empty symbols are taken fromHardt et al. [57] and represent 0.8, 1.6, and 2.4 U/g reaction mixture at 20%, 40%, and 60%solids, respectively. One can see that the enzyme concentration does not influence the DH% asfunction of E0 × time, which is in accordance with Fig. (a). Lines are drawn to guide the eye.
solid concentrations, consistent with the hydrolysis rate limitation. Therefore,
enzyme inhibition does not explain the hydrolysis rate limitation.
5.4.3 Enzyme inactivation
Fig. 5.3 shows that some enzyme was still active after 24 h, since the DH%
increased upon further water addition. However, some enzyme inactivation took
place during the hydrolysis reaction, since the DH% after 48 h was at least 10%
higher upon a combined enzyme and water addition compared to when only
water was added. A higher increase in DH% would have been expected in the
79

Cha
pter
5C
hapt
er5
Cha
pter
5C
hapt
er5
Cha
pter
5
Chapter 5
case that no inactivation was present. Instead, the increase in DH% leveled off
upon water addition after 30 h.
Fig. 5.8c gives information on the order of inactivation. Since the DH% is
independent of the enzyme concentration multiplied by hydrolysis time, there is
either no enzyme inactivation present or the enzyme inactivation follows second-
order kinetics. Thus, given the fact that Fig. 5.3 indicates that some inactivation
took place, Fig. 5.8c implies that the inactivation is a second-order process.
Protease inactivation rate has indeed been shown and modeled as second-order
process [53, 87]. This has been explained for whey protein hydrolysis with
Alcalase to be via free enzymes attacking enzyme-substrate complexes [53]. Since
the hydrolysis in general is considered to be a process that is first order, and if
the enzyme inactivation rate follows second-order kinetics, then a hydrolysis rate
limitation must be observed at constant enzyme-to-substrate ratios: increasing
enzyme concentrations result in stronger inactivation of the enzyme than the
increase in hydrolysis rate.
Fig. 5.7 already suggests that the enzyme activity was independent of the
solid concentration up to 50% solids for constant enzyme concentrations of 2.7
and 8.1 U/g reaction mixture. Based on this, Fig. 5.9 depicts the total amount of
hydrolysis per enzyme concentration (calculated as the substrate concentration
multiplied by the DH% and divided by the initial enzyme concentration) as a
function of the initial enzyme concentration. The y-axis is proportional to the
total number of cleaved peptide bonds per enzyme molecule. The number of
peptide bonds cleaved per initial enzyme concentration decreased with increasing
initial enzyme concentration and was independent of the solid concentration.
Only after 3 h the influence of substrate exhaustion at 13.3% and 20% solids
could be observed. Thus, we may conclude that protease self-inactivation is an
important mechanism in the reduction of enzyme activity. Furthermore, we may
conclude that the hydrolysis rate limitation is not directly related to the solid
concentration, but rather to the higher enzyme concentration generally used. A
highly concentrated hydrolysis system should therefore be operated at enzyme
concentrations as low as possible, to avoid excessive enzyme inactivation. This
obviously has consequences for the volumetric productivity – careful optimization
80

Cha
pter
5C
hapt
er5
Cha
pter
5C
hapt
er5
Cha
pter
5
Factors impeding enzymatic wheat gluten hydrolysis at high solid concentrations
0 1 0 2 0 3 00 . 0
0 . 5
1 . 0
1 . 5
2 . 0
2 . 5
1 3 . 3 % 2 0 % 3 0 % 4 0 %
3 h��
�����
��� �
������
���
����
� ����
�������
������
������
�
E 0 ( U / g r e a c t i o n m i x t u r e )
1 h
Fig. 5.9: Influence of the initial enzyme concentration on the total amount of hydrolysis per initialenzyme concentration after 1 h and 3 h. The legend indicates the solid concentration duringhydrolysis.
between avoidance of enzyme inactivation and high volumetric productivity is
therefore important.
5.4.4 Water availability
Water is important as a reactant in the hydrolysis reaction. When the solid
concentration is increased, the amount of water available for reaction decreases.
The availability of water is described by its activity (aw). Upon wheat gluten
hydrolysis, aw decreases, not only since water reacts with the peptides, but also
because more molecules having charged groups (free amino acids and short
peptides) are produced, which will bind more water. Many microbiological and
enzymatic processes cease or slow down considerably at aw below 0.9 [120]. In
non-protein systems, it has been shown that replacing water by other solvents
reduced the enzyme activity for different oxidases [75], alcohol dehydrogenase
[65], and cellulase [115] already at aw below 0.98.
Considering Fig. 5.7, it can be concluded that the water activity cannot
explain the hydrolysis rate limitation up to 50% solids because here the enzyme
activity was found to be independent of the solid concentration. This does not
contradict results reported in literature since the hydrolysis rate limitation was
already present at the beginning of the hydrolysis reaction where the water
activity was still high despite being somewhat lower for higher solid
81

Cha
pter
5C
hapt
er5
Cha
pter
5C
hapt
er5
Cha
pter
5
Chapter 5
concentrations. Nevertheless, the reduced aw depicted in Fig. 5.5a might impact
the DH% limitation, where aw was below 0.91 for 40% and 60% solids. The
sorption isotherms of native wheat gluten in Fig. 5.5b give further insight in the
influence of the water activity on the hydrolysis reaction. It should be noted that
the sorption isotherms were determined using the freeze-dried samples, so the
water contents are not exactly equal to the water contents during hydrolysis.
The sorption isotherms are in line with other studies regarding native wheat
gluten, (e.g. [139]) and similar to other protein hydrolysates [21, 62]. Fig. 5.5b
illustrates that an increase in DH% is only possible with a reduction in aw. For
example, an increase in DH% at 55% water content (dry basis) from 19.3% to
50.5% reduces aw from about 0.9 to about 0.75. Taking together the reduced aw
observed during wheat gluten hydrolysis and the fact that a lower aw noticeably
decreases the enzyme activity, we postulate that the lack of water reduces the
enzyme activity to such an extent that the hydrolysis practically ceases at high
solid concentrations. This conclusion is supported by the fact that the addition
of fresh enzyme after 24 h only slightly increased the DH% whereas dilution
resulted in a far higher increase in DH% (Fig. 5.3). Therefore, the DH%
limitation could be explained by changes in water activity. This argumentation
is also supported by Selig et al. [120], who showed that the formation of soluble
species during concentrated lignocellulose hydrolysis reduced aw and thus the
enzyme activity. The authors also stated that stabilizers commonly present in
commercial enzyme mixtures, e.g. glycerol, sorbitol, and simple sugars, further
depress aw, which led to the conclusion to keep the enzyme concentration as
low as possible. This is in line with Fig. 5.9 and the findings in this study.
5.4.5 Plastein reaction
Enzymatic hydrolysis is a reversible reaction where the equilibrium is strongly
shifted towards hydrolysis at high water activities. Usually, very low water
activities are necessary to shift the equilibrium towards “classical” peptide
synthesis (see e.g. [140]), which were not observed in this study (Fig. 5.5).
Nevertheless, peptide “resynthesis” can occur at higher water activities by
means of the plastein reaction. The plastein reaction is characterized by the
production of water-insoluble peptides when exposing water-soluble hydrolyzed
82

Cha
pter
5C
hapt
er5
Cha
pter
5C
hapt
er5
Cha
pter
5
Factors impeding enzymatic wheat gluten hydrolysis at high solid concentrations
peptides to proteases at elevated substrate concentrations, and has been
attributed to several causes: condensation, transpeptidation, and physical forces
[150]. However, merely in the case of condensation, the overall amount of free
amino groups reduces, which in terms of wheat gluten hydrolysis would be
equivalent to a lower DH%. A reduction in free amino groups has indeed been
reported e.g. for casein hydrolysate using Alcalase at substrate concentrations
above 30% [153] and for bovine serum albumin hydrolysates using
α-chymotrypsin at substrate concentrations above 40% [26]. Peptide formation
by Flavourzyme during porcine hemoglobin hydrolysis has also been suggested
[18]. Since the plastein reaction is taking place in the pH and temperature
range, and at solid concentrations similar to 40% and 60% solids used in this
study, it is possible that the plastein reaction also occurred during wheat gluten
hydrolysis at high solid concentrations. The prerequisite is a sufficiently high
DH%, where the peptides are small enough to be susceptible to the plastein
reaction. The observed peak at 6.7 min elution time that was partly obtained at
40% and especially at 60% solid concentration (Fig. 5.4) could be an indication
that indeed a repolymerized residue formed through the plastein reaction.
Nevertheless, the observed peak could also be peptide residues inaccessible to
hydrolysis and caused by mass transfer limitations.
5.5 Conclusions
We studied the factors that cause two central phenomena in concentrated
enzymatic wheat gluten hydrolysis: (1) the hydrolysis rate limitation, leading to
a lower reaction rate at higher concentrations and constant enzyme-to-substrate
ratios, and (2) the DH% limitation, which implies that the maximum attainable
DH% is reduced as well. Wheat gluten could be enzymatically hydrolyzed at
high solid concentrations up to 50% without a reduction in enzyme activity at
constant enzyme concentration. Only at a high solid concentration above 60%,
the reaction rate decreased due to mass transfer limitations. The hydrolysis rate
limitation up to 50% solids cannot be explained by enzyme inhibition or
changes in water activity, but seems to be mostly caused by second-order
enzyme auto-inactivation rate due to the higher enzyme concentrations used.
83

Cha
pter
5C
hapt
er5
Cha
pter
5C
hapt
er5
Cha
pter
5
Chapter 5
The DH% limitation, we believe, can be explained by reduced enzyme activities
due to a decline in water activity.
The results show that wheat gluten can be hydrolyzed to high DH% of at
least 20% at solid concentrations up to 60%. However, since the enzyme activity
per enzyme concentration decreases with higher enzyme concentrations, future
research in high-solid (gluten) hydrolysis should focus on improving the enzyme
performance at higher enzyme concentrations.
Acknowledgements
The research leading to these results has received funding from the [European
Community’s] Seventh Framework Programme [FP7/2007-2013] under grant
agreement no. 238084. We thank Aikaterini Mantzari and Maurice Strubel for
technical assistance.
84

Cha
pter
6C
hapt
er6
Cha
pter
6C
hapt
er6
Cha
pter
6C
hapt
er6
CH
AP
TE
R
6Starch facilitates enzymatic wheat gluten
hydrolysis

Cha
pter
6C
hapt
er6
Cha
pter
6C
hapt
er6
Cha
pter
6C
hapt
er6
Chapter 6
Abstract
Wheat gluten can be hydrolyzed by either using (vital) wheat gluten or directly
from wheat flour. This study investigates the influence of the presence of starch,
the main component of wheat, on enzymatic wheat gluten hydrolysis. Wheat
gluten present in wheat flour (WFG) and vital wheat gluten (VWG) were
hydrolyzed at constant protein concentrations, but subsequently 5.6 times
higher amounts of wheat flour. Nevertheless, WFG hydrolysis at 40% total solids
resulted in significantly higher degrees of hydrolysis (DH%) than VWG
hydrolysis at 7.2% solids. This difference increased to up to 4.5% in 6 h and
diminished again for longer reaction times. Possible differences in the gluten
composition and the presence of albumins and globulins in wheat flour could
not explain the difference in DH% because the addition of starch to VWG
increased the rate of hydrolysis similarly. Instead, it was concluded that starch
granules impede gluten aggregation, which facilitates the hydrolysis. At higher
solid concentrations of up to 70% wheat flour, the positive effect of starch
disappeared, because WFG hydrolysis was hindered by mass transfer limitations
and lower water activities.
This chapter has been submitted as:Hardt, N. A., R. M. Boom, and A. J. van der Goot. Starch facilitates enzymatic wheatgluten hydrolysis.
86

Cha
pter
6C
hapt
er6
Cha
pter
6C
hapt
er6
Cha
pter
6C
hapt
er6
Starch facilitates enzymatic wheat gluten hydrolysis
6.1 Introduction
Wheat gluten, the major protein of wheat, is a high-value, modestly priced plant
protein, available at increasing amounts [31]. Native vital wheat gluten is an
excellent bread improver and also used to texturize foods [3]. However, native
vital wheat gluten is scarcely water-soluble at neutral pH, which limits further
applications in the food industry. Therefore, enzymatic hydrolysis is used as a
mild process to increase the water solubility at neutral pH and to alter other
functional properties, such as its foaming and emulsifying properties [57, 70, 80].
In practice, wheat gluten hydrolysates are used as savory flavoring agents, in
sports nutrition, and for the production of bioactive peptides, among others
[13, 51].
Hydrolysis of wheat gluten is performed using isolated (vital) wheat gluten
(VWG). Thus, a pre-process step is required to separate gluten from wheat flour
in processes such as the Martin or the batter process. These separation processes
consume copious amounts of water and often require 10 to 15 L of water per
kg of dry matter [119], which has to be removed afterwards. Alternatively,
wheat gluten can be hydrolyzed when still present in the wheat flour (WFG)
[12, 13], thereby omitting the separation step, or separation can take place after
gluten hydrolysis. Currently, mild proteolysis of wheat flour is performed in the
baking industry with the aim to “weaken” the gluten network and to improve the
handling properties of dough [12, 149]. Other possible applications of wheat
flour hydrolysates are cereal-based drinks [100].
Previously, we showed that vital wheat gluten can be hydrolyzed at solid
concentrations of up to 60% at increased reactor productivity compared to the
conventionally used concentration of 20% solids [57]. It is therefore interesting
to investigate the role of the high starch content in wheat flour (around 80%, dry
basis [8]) on the hydrolysis process, since starch replaces water in WFG hydrolysis
compared to VWG hydrolysis at constant protein concentration. Starch in wheat
flour is present as starch granules. Since wheat starch granules absorb up to 50%
of its dry weight of water [52], high starch concentrations might induce mass
transfer limitations or reduce the water activity, which would reduce the enzyme
activity. On the other hand, starch granules might also facilitate the hydrolysis:
87

Cha
pter
6C
hapt
er6
Cha
pter
6C
hapt
er6
Cha
pter
6C
hapt
er6
Chapter 6
Native wheat gluten shows a strong tendency to aggregate in the presence of
water at neutral pH close to its isoelectric point, which then introduces limitations
to the transfer of the enzyme and the hydrolysis products. While hydrated vital
wheat gluten forms gluten aggregates of up to some centimeter length [57], the
gluten aggregates in the presence of wheat starch in wheat flour batters are
millimeter-sized [129] and thus easier accessible for the protease.
In this study, we therefore compare high-solid wheat flour hydrolysis with
vital wheat gluten hydrolysis. First, the influence of starch on wheat gluten
hydrolysis is investigated and the molecular mass distributions and the protein
solubility of the hydrolysates are analyzed. Second, the influence of varying
wheat flour concentrations from 20% to 70% (w/w) on protein hydrolysis is
studied.
6.2 Materials & Methods
6.2.1 Materials
Ibis wheat flour with 12.6±0.4% (N×5.7, Dumas method) crude protein content
and 13.1±0.5% water content (all by weight) was obtained from Meneba
(Rotterdam, The Netherlands). Vital wheat gluten (Roquette) with 73.5±1.3%
crude protein content and 8.9±0.6% water content was obtained from Barentz
BV (Hoofddorp, The Netherlands). Wheat starch with 10.5±0.7% water content
was obtained from Sigma-Aldrich, Steinheim, Germany. Two commercial
protease mixtures from Aspergillus oryzae (Flavourzyme ≥ 500 LAPU/g) and
from Bacillus licheniformis and Bacillus amyloliquefaciens (Protamex ≥1.5 AU-NH/g) were purchased from Sigma-Aldrich, Steinheim, Germany.
Flavourzyme is a mixture of endo- and exopeptidases with mainly
exoproteolytic activity [4] and Protamex is an endoprotease [96]. Borosilicate
glass beads with 1 mm diameter and glass beads with 5 mm diameter were
obtained from Sigma-Aldrich, Steinheim, Germany. Milli-Q water was used in
all experiments unless stated otherwise.
88

Cha
pter
6C
hapt
er6
Cha
pter
6C
hapt
er6
Cha
pter
6C
hapt
er6
Starch facilitates enzymatic wheat gluten hydrolysis
6.2.2 Gluten washing
Ibis wheat flour (200 g) was mixed with 120 g of tap water and allowed to rest for
15 min. Then, the dough ball was gently kneaded, placed in a 500-mL beaker full
of tap water at ambient temperature, and allowed to stand for 5 min. This step
was repeated three times. Afterwards, the remaining starch was continuously
washed out under running tap water until the dough ball mass had approximately
reduced to 16–18% of the initial mass. The dough ball was then freeze-dried,
ground, and used for hydrolysis. The average crude protein and water content
of the self-washed Ibis gluten were 86.6±1.1% and 1.9±0.2%, respectively.
6.2.3 Hydrolysis reaction
The hydrolysis reaction was carried out using 200-mL double-walled glass vessels
connected to a water bath. Each experiment was conducted with a total mass
of 150 g reaction mixture. Table 6.1 shows the process conditions used for
hydrolysis at 5.8% protein concentration. All hydrolysis reactions were performed
Table 6.1: Sampling parameters for standard hydrolysis reactions.
Added Added
Sourcewheat flour Added wheat Added Solid Proteinor gluten water starch enzyme conc. conc.
(g) (g) (g) (g)
vital wheat11.84 138.16 0.087 7.2% 5.8%gluten
(VWG)
wheat flour69.04 80.96 0.087 40% 5.8%
(WFG)
VWG + starch 11.84 83.17 54.99 0.087 40% 5.8%
self-washed10.05 139.95 0.087 6.6% 5.8%Ibis gluten
(SWG)
at an enzyme-to-substrate ratio of 1:100 (w/w). Only the protein fraction was
considered as substrate when calculating the enzyme-to-substrate ratio. The
hydrolysis temperature was 50 °C. The enzyme was mixed with the water prior to
89

Cha
pter
6C
hapt
er6
Cha
pter
6C
hapt
er6
Cha
pter
6C
hapt
er6
Chapter 6
addition to the substrate. The double-walled glass vessel was closed with a clasp
to avoid evaporation of water and stirred using an overhead stirrer at 40 rpm.
After reaction, the enzyme was inactivated by heating at 95 °C for 15 min in a
water bath. The samples were then freeze-dried, ground and stored for further
analysis. Hydrolysis reactions were conducted under floating pH conditions.
Standard experiments with Flavourzyme were performed in quadruplicate and
with Protamex in triplicate, except for all reactions with the self-washed gluten,
which were performed in duplicate. Experiments investigating the influence of
the protein concentration on hydrolysis were single experiments.
6.2.4 Degree of hydrolysis (DH%)
The DH% was measured by the o-phthaldialdehyde (OPA) method as described
previously [57], with minor modifications: The amount of suspended
hydrolysate was varied between 0.6–0.9 mg protein/mL to avoid
spectrophotometer absorbance values above 1.5 for samples with a high DH%.
Thus, the mass of the added wheat flour hydrolysate powder was approximately
5.5 times higher than for the vital wheat gluten hydrolysate powder. The
calculated DH% was the mean of two determinations. The protein
concentration of the dried hydrolysates changed after hydrolysis compared to
the native powders owing to small differences in the moisture content. Crude
protein contents were 74.0±1.2% for vital wheat gluten, 14.2±0.2% for wheat
flour, 79.9±1.8% for self-washed Ibis gluten, and 14.3±0.6% for vital wheat
gluten plus starch hydrolysates, respectively.
6.2.5 Size-exclusion high-performance liquid chromatography
Size-exclusion HPLC experiments were performed using a Dionex UltiMate 3000
HPLC system (Thermo Scientific) equipped with a PDA detector. Hydrolysate
(2.5 mg protein/mL) was suspended in 12.5 mM borax plus 2% (w/w) SDS,
stirred overnight, and then centrifuged at 3900× g for 15 min. The resulting
supernatant was injected onto a TSKGel G2000 SWXL (300×7.8 mm) column
and eluted with 70% / 30% / 0.1% water / acetonitrile / trifluoroacetic acid
at a flow rate of 1.0 mL/min and detected at a wavelength of 214 nm. All
90

Cha
pter
6C
hapt
er6
Cha
pter
6C
hapt
er6
Cha
pter
6C
hapt
er6
Starch facilitates enzymatic wheat gluten hydrolysis
experiments were performed in duplicate. The molecular mass was determined
using molecular mass markers based on carbonic anhydrase (29,000 Da), α-
lactalbumin (14,100 Da), aprotinin (6510 Da), insulin (5700 Da), bacitracin
(1420 Da), and phenylalanine (165 Da).
6.2.6 Solubility
Hydrolysate (10 mg protein/mL) was suspended in water and mixed at ambient
temperature for 60 min using a Heidolph MultiReax at 1500 rpm and then
centrifuged at 3900× g for 15 min. The resulting supernatant and pellet were
freeze-dried and weighed. The nitrogen content of both freeze-dried samples was
determined using the Dumas method (N analyzer FlashEA 1112 series, Thermo
Scientific, Interscience) with methionine as a standard. The nitrogen solubility
index (NSI) was taken as the fraction of soluble nitrogen to total nitrogen. It
has been shown that wheat gluten solubility is independent of the pH within
a pH range of 4–10 for DH% greater than 5% [70]. Therefore, the pH was
not adjusted during the solubility experiments. Nevertheless, the pH remained
between 6 and 7 for all solubility experiments carried out.
6.3 Results
6.3.1 Hydrolysis reaction
Fig. 6.1a depicts the influence of the reaction time on the DH% for gluten present
in wheat flour (WFG) and vital wheat gluten (VWG). All experiments were
performed at a constant protein concentration of 5.8% (w/w), implying that
WFG was hydrolyzed at 40% solids, whereas VWG was hydrolyzed at 7.2% solids
(Table 6.1). Hydrolysis of WFG resulted in higher DH% than VWG hydrolysis at
all reaction times and for both proteases used. Hydrolyses using Flavourzyme
were performed four times to test the significance of the difference in DH%, and t-
tests revealed a significantly (α = 0.05) higher DH% for WFG after 0.5 h, 3 h, and
6 h. Hydrolyses with Protamex were performed in triplicate and t-tests revealed
significantly higher DH% for WFG after 1 h, 3 h, and 6 h. Generally, the use of
Flavourzyme resulted in higher DH% compared to the use of Protamex, which can
91

Cha
pter
6C
hapt
er6
Cha
pter
6C
hapt
er6
Cha
pter
6C
hapt
er6
Chapter 6
P r o t a m e x
0 6 1 2 1 8 2 40 %
5 %
1 0 %
1 5 %
2 0 %
2 5 %
3 0 %
0 6 1 2 1 8 2 40 %
1 %
2 %
3 %
4 %
5 %
F l a v o u r z y m e
DH%
t i m e ( h )
W F G V W G
a b F l a v o u r z y m e P r o t a m e x
∆DH%
t i m e ( h )
Fig. 6.1: (a) Hydrolysis of gluten in wheat flour (WFG, 40% solids, empty symbols) and vitalwheat gluten (VWG, 7.2% solids, filled symbols) hydrolysis as a function of time. Standarddeviations are given for quadruplicate Flavourzyme (upper curves) and triplicate Protamex (lowercurves) experiments. Lines are drawn to guide the eye. (b) The difference in DH% between WFGand VWG as a function of time.
be explained by the exo-activity of Flavourzyme. Fig. 6.1b reveals an increasing
difference in DH% between WFG and VWG up to 6 h for Flavourzyme and
Protamex. This difference became less at longer reaction times. The maximum
absolute difference was 2.5% for Flavourzyme and 4.4% for Protamex, being
29% and 83% relative increase.
To investigate the influence of the gluten source, hydrolysis reactions were
performed, in which either starch was added to vital wheat gluten (VWG +
starch) or self-washed gluten (SWG) from the Ibis wheat flour was used (Fig. 6.2).
Similar to Fig. 6.1a, hydrolysis of VWG+ starch resulted in higher DH% than VWG
alone and hydrolysis of WFG resulted in higher DH% than SWG for Flavourzyme
and Protamex. In all cases, this difference increased up to 6 h and then decreased
again, similar to Fig. 6.1b.
6.3.2 Molecular mass distribution
Fig. 6.3 depicts the molecular mass distributions of WFG, VWG + starch, and
VWG hydrolysates after 3 h, 6 h, and 24 h. The most noticeable difference
between WFG and VWG after 3 h for Flavourzyme and Protamex is the higher
peak for VWG hydrolysates after 6.9 min elution time, representing peptides
92

Cha
pter
6C
hapt
er6
Cha
pter
6C
hapt
er6
Cha
pter
6C
hapt
er6
Starch facilitates enzymatic wheat gluten hydrolysis
0 6 1 2 1 8 2 40 %
5 %
1 0 %
1 5 %
2 0 %
2 5 %
3 0 %
P r o t a m e x
V W G + s t a r c h S W G
DH%
t i m e ( h )
F l a v o u r z y m e
Fig. 6.2: Hydrolysis of VWG + starch and self-washed Ibis gluten (SWG) as function of the reactiontime for Flavourzyme (upper curves) and Protamex (lower curves). The upper and lower borderof each gray area indicate the DH% of WFG and VWG, respectively from Fig. 6.1a.
with molecular masses of around 10 kDa. For longer elution times and smaller
peptide sizes, the peak was higher for WFG, which is in line with the higher DH%
in Fig. 6.1a. In the case of Flavourzyme, the difference in the molecular mass
distributions between WFG and VWG became smaller after 6 h and 24 h. In the
case of Protamex, a difference between WFG and VWG hydrolysates remained
after 6 h and 24 h (see peaks after 9.3 and 10.3 min).
The molecular mass distribution of VWG + starch was in-between the
molecular mass distributions of VWG and WFG after 3 h and 6 h. After 24 h, the
difference between VWG + starch and VWG was negligible. The differences in
the molecular mass distributions between Flavourzyme and Protamex
(especially the peak after 10.6 min) can be explained by the exo-activity of
Flavourzyme.
6.3.3 Solubility
Fig. 6.4 depicts the influence of the DH% on the nitrogen solubility index (NSI)
for WFG, VWG + starch, and VWG for Flavourzyme (Fig. 6.4a) and Protamex
(Fig. 6.4b). The solubility increased with higher DH%, which agrees with other
studies [57, 70]. The highest solubility was 89% for both Flavourzyme and
93

Cha
pter
6C
hapt
er6
Cha
pter
6C
hapt
er6
Cha
pter
6C
hapt
er6
Chapter 6
4 5 6 7 8 9 1 0 1 1 1 20
1 0 0
2 0 0
3 0 0
4 0 0
5 0 0
6 0 0
4 5 6 7 8 9 1 0 1 1 1 20
1 0 0
2 0 0
3 0 0
4 0 0
5 0 0
6 0 0
F l a v o u r z y m e
2 4 h
6 h
mAU
t i m e ( m i n )
3 h
0 . 1 6 5 k D a1 . 4 k D a5 . 7 k D a1 4 . 1 k D a2 9 k D a
P r o t a m e x
2 4 h
6 h
3 h
mAU
t i m e ( m i n )
0 . 1 6 5 k D a1 . 4 k D a5 . 7 k D a1 4 . 1 k D a2 9 k D a
Fig. 6.3: Molecular mass distributions of vital wheat gluten (VWG, light gray), VWG + starch(dark gray), and gluten in wheat flour (WFG, black) after 3 h, 6 h, and 24 h for Flavourzyme (left)and Protamex (right). Molecular mass distributions are averages of triplicate or quadruplicatehydrolysis reactions. Curves were modified in a way that all have the same area under the curve.
94

Cha
pter
6C
hapt
er6
Cha
pter
6C
hapt
er6
Cha
pter
6C
hapt
er6
Starch facilitates enzymatic wheat gluten hydrolysis
0 % 5 % 1 0 % 1 5 % 2 0 % 2 5 % 3 0 % 3 5 %0 %
2 0 %
4 0 %
6 0 %
8 0 %
1 0 0 %
0 % 5 % 1 0 % 1 5 % 2 0 %0 %
2 0 %
4 0 %
6 0 %
8 0 %
1 0 0 %a
W F G V W G + s t a r c h V W G
nitrog
en so
lubilit
y ind
ex (N
SI)
D H %
n a t i v e V W G
b
n a t i v e V W G
W F G V W G + s t a r c h V W G
nitrog
en so
lubilit
y ind
ex (N
SI)
D H %
Fig. 6.4: Influence of the DH% on the nitrogen solubility index (NSI) for different gluten sourcesfor (a) Flavourzyme and (b) Protamex. The lower dashed line represents the NSI of native vitalwheat gluten. The legend indicates the gluten source. Data points are single experiments, takenfrom two different hydrolysis reactions for every gluten source.
Protamex, but in case of Flavourzyme a higher DH% was needed to obtain this
solubility value. The effect on solubility was independent of the gluten source for
WFG and VWG + starch for both proteases. The use of Flavourzyme resulted in a
VWG solubility that was approximately 5–10% lower compared to WFG and VWG
+ starch at DH% above 10%, though the mechanism behind this observation is
not clear. For Protamex no such difference was found.
6.3.4 Influence of the solid content
Fig. 6.5 illustrates the influence of the protein concentration on the DH% for
VWG and WFG after 3 h, 6 h, and 24 h, using Flavourzyme to investigate the
influence of high wheat flour concentrations. The protein concentration of 5.8%
represents the data given in Fig. 6.1. Generally, the DH% for WFG decreased
stronger with increasing protein concentration than the DH% for VWG. This
effect was stronger at longer hydrolysis times. Therefore, the positive effect of
starch on wheat gluten hydrolysis diminished at higher solid concentrations.
The small decrease in DH% for VWG in Fig. 6.5 is related to a concentration
effect present in protein hydrolysis: the DH% decreases for higher protein
concentrations and at constant enzyme-to-substrate ratio. This concentration
effect has been reported for protein concentrations above 10% in wheat gluten
95
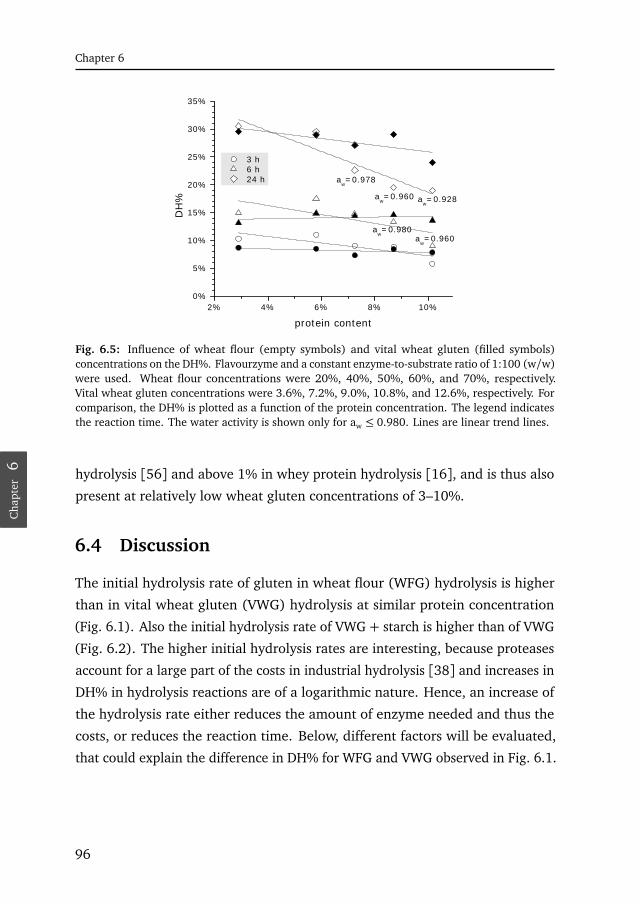
Cha
pter
6C
hapt
er6
Cha
pter
6C
hapt
er6
Cha
pter
6C
hapt
er6
Chapter 6
2 % 4 % 6 % 8 % 1 0 %0 %
5 %
1 0 %
1 5 %
2 0 %
2 5 %
3 0 %
3 5 %
a w = 0 . 9 6 0
a w = 0 . 9 2 8a w = 0 . 9 6 0
3 h 6 h 2 4 h
DH%
p r o t e i n c o n t e n t
a w = 0 . 9 7 8
a w = 0 . 9 8 0
Fig. 6.5: Influence of wheat flour (empty symbols) and vital wheat gluten (filled symbols)concentrations on the DH%. Flavourzyme and a constant enzyme-to-substrate ratio of 1:100 (w/w)were used. Wheat flour concentrations were 20%, 40%, 50%, 60%, and 70%, respectively.Vital wheat gluten concentrations were 3.6%, 7.2%, 9.0%, 10.8%, and 12.6%, respectively. Forcomparison, the DH% is plotted as a function of the protein concentration. The legend indicatesthe reaction time. The water activity is shown only for aw ≤ 0.980. Lines are linear trend lines.
hydrolysis [56] and above 1% in whey protein hydrolysis [16], and is thus also
present at relatively low wheat gluten concentrations of 3–10%.
6.4 Discussion
The initial hydrolysis rate of gluten in wheat flour (WFG) hydrolysis is higher
than in vital wheat gluten (VWG) hydrolysis at similar protein concentration
(Fig. 6.1). Also the initial hydrolysis rate of VWG + starch is higher than of VWG
(Fig. 6.2). The higher initial hydrolysis rates are interesting, because proteases
account for a large part of the costs in industrial hydrolysis [38] and increases in
DH% in hydrolysis reactions are of a logarithmic nature. Hence, an increase of
the hydrolysis rate either reduces the amount of enzyme needed and thus the
costs, or reduces the reaction time. Below, different factors will be evaluated,
that could explain the difference in DH% for WFG and VWG observed in Fig. 6.1.
96
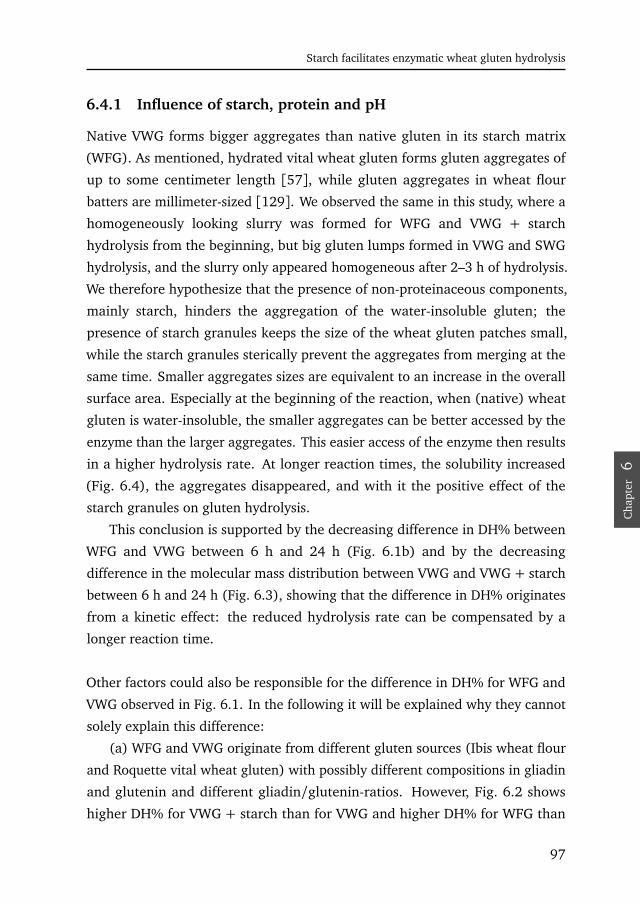
Cha
pter
6C
hapt
er6
Cha
pter
6C
hapt
er6
Cha
pter
6C
hapt
er6
Starch facilitates enzymatic wheat gluten hydrolysis
6.4.1 Influence of starch, protein and pH
Native VWG forms bigger aggregates than native gluten in its starch matrix
(WFG). As mentioned, hydrated vital wheat gluten forms gluten aggregates of
up to some centimeter length [57], while gluten aggregates in wheat flour
batters are millimeter-sized [129]. We observed the same in this study, where a
homogeneously looking slurry was formed for WFG and VWG + starch
hydrolysis from the beginning, but big gluten lumps formed in VWG and SWG
hydrolysis, and the slurry only appeared homogeneous after 2–3 h of hydrolysis.
We therefore hypothesize that the presence of non-proteinaceous components,
mainly starch, hinders the aggregation of the water-insoluble gluten; the
presence of starch granules keeps the size of the wheat gluten patches small,
while the starch granules sterically prevent the aggregates from merging at the
same time. Smaller aggregates sizes are equivalent to an increase in the overall
surface area. Especially at the beginning of the reaction, when (native) wheat
gluten is water-insoluble, the smaller aggregates can be better accessed by the
enzyme than the larger aggregates. This easier access of the enzyme then results
in a higher hydrolysis rate. At longer reaction times, the solubility increased
(Fig. 6.4), the aggregates disappeared, and with it the positive effect of the
starch granules on gluten hydrolysis.
This conclusion is supported by the decreasing difference in DH% between
WFG and VWG between 6 h and 24 h (Fig. 6.1b) and by the decreasing
difference in the molecular mass distribution between VWG and VWG + starch
between 6 h and 24 h (Fig. 6.3), showing that the difference in DH% originates
from a kinetic effect: the reduced hydrolysis rate can be compensated by a
longer reaction time.
Other factors could also be responsible for the difference in DH% for WFG and
VWG observed in Fig. 6.1. In the following it will be explained why they cannot
solely explain this difference:
(a) WFG and VWG originate from different gluten sources (Ibis wheat flour
and Roquette vital wheat gluten) with possibly different compositions in gliadin
and glutenin and different gliadin/glutenin-ratios. However, Fig. 6.2 shows
higher DH% for VWG + starch than for VWG and higher DH% for WFG than
97

Cha
pter
6C
hapt
er6
Cha
pter
6C
hapt
er6
Cha
pter
6C
hapt
er6
Chapter 6
for SWG. Furthermore, Fig. 6.3 indicates that the molecular mass distribution
is independent of the gluten source used and just a function of the DH% and
the enzyme used. Hence, the gluten source did not cause the difference in the
hydrolysis rate.
(b) Wheat flour contains 15% albumins that are water-soluble and 7%
globulins that are soluble in dilute salt solutions [8], and which are not present
in VWG. It has been stated that soluble wheat proteins are easier to degrade
than insoluble proteins [7]. Therefore, the higher DH% for WFG could be
induced by the albumins and globulins. However, Fig. 6.2 shows again that this
effect cannot solely be explained by the globulins and albumins present in WFG,
because higher DH% were obtained for VWG + starch than for VWG without
starch, and no protein was detected in the added starch using the Dumas
method. Furthermore, the protein solubility was just a function of the DH% but
independent of WFG or VWG + starch (Fig. 6.4).
(c) Differences in the pH can also not explain the difference in DH%. We
measured the pH of some samples after 24 h. The pH always remained above
4 for Flavourzyme and Protamex and was approximately 0.5 higher for VWG
than for WFG due to the differences in the water content. Since the optimum
pH range for Flavourzyme is stated to be between 4 and 8 and for Protamex
between 6 and 8 [97], if at all there was a difference in enzyme activity, then a
higher enzyme activity would be expected for VWG than for WFG hydrolysis.
(d) The DH% and molecular weight distributions were measured by first
dissolving the gluten hydrolysate in 12.5 mM borax plus 2% (w/w) SDS. The
solubility of the VWG and WFG hydrolysates in this medium was tested to
exclude the possibility that differences in solubility influenced the DH% and
molecular mass measurements. After 6 h, when the difference in DH% between
WFG and VWG was the highest, 97.9% of WFG and 98.9% of VWG were soluble.
Therefore, the samples were nearly completely soluble in borax plus SDS.
6.4.2 Influence of the solid content
Fig. 6.1 and Fig. 6.4 compare the hydrolysis of vital wheat gluten (VWG) and
gluten in wheat flour (WFG) at 5.8% protein concentration, i.e. 40% wheat
98

Cha
pter
6C
hapt
er6
Cha
pter
6C
hapt
er6
Cha
pter
6C
hapt
er6
Starch facilitates enzymatic wheat gluten hydrolysis
flour and 7.2% VWG. Given the fact that starch enhanced the hydrolysis, we
believe that the starch at 40% wheat flour (i.e. approximately 30% starch) did
not induce any mass transfer limitations. This is in line with a previous study,
where no mass transfer limitations were observed in high-solid VWG hydrolysis
up to 50% solids [56]. Similar observations were done in a high-solid cellulose
hydrolysis, where it was shown that the addition of 15% (w/w) water-insoluble,
non-hydrolyzable dextrans had no effect on the hydrolysis of 5% cellulose slurries
[120], which is comparable to water-insoluble, non-hydrolyzable starch in gluten
hydrolysis.
However, the hydrolysis will be hindered by the starch content at some
concentration. For instance, hydrolysis of 100% wheat flour as an extreme is
not possible, because the enzyme cannot diffuse to the substrate (mass transfer
limitations) and no water is available as reactant (low water activity). Therefore,
Fig. 6.5 demonstrates that the positive effect of starch on wheat gluten hydrolysis
diminishes at higher wheat flour concentrations. Similar to high-solid VWG
hydrolysis [56] mass transfer limitations can explain why the positive effect of
starch disappeared after 3 h and 6 h above 60% wheat flour. Additionally, we
believe that the reduced water activity further impedes WFG hydrolysis at longer
reaction times. Water activities below 0.98 can already reduce that enzyme
activity [56]. Therefore, samples with aw ≤ 0.980 are denoted in Fig. 6.5. The
water activity reduced especially at longer reaction times and higher wheat flour
concentrations down to 0.928 at 70% wheat flour after 24 h. This explains why
VWG hydrolysis became already favorable at 7.3% protein (i.e. 50% wheat flour;
9% VWG) after 24 h.
6.4.3 Prevention of aggregation
If the difference in DH% in Fig. 6.1 originates from reduced gluten aggregation,
then the hydrolysis rate in wheat gluten hydrolysis can be theoretically improved
independent of the starch. One option could be the usage of more sophisticated
mixing devices that disrupt gluten aggregates, such as kneaders, extruders, or
static mixers. Another alternative could be the use of additives other than starch.
Therefore, we conducted duplicate VWG hydrolyses with Flavourzyme where
either 1-mm or 5-mm glass beads were added. Higher DH% compared to VWG
99

Cha
pter
6C
hapt
er6
Cha
pter
6C
hapt
er6
Cha
pter
6C
hapt
er6
Chapter 6
hydrolysis were measured after 1 h and 3 h (1.6% and 1.8% higher, respectively)
for 1-mm glass beads addition. For longer reaction times and for the 5 mm glass
beads no difference in DH% was observed. Hence, the effect of glass beads was
less pronounced than the effect of starch. The reason for this could be related to
the higher density of the glass beads. Another explanation could be the larger
sizes of the beads compared to the starch granules (<0.1 mm). Then, the positive
effect of additives would diminish with increasing size. Nevertheless, the 1-mm
glass beads confirm the results obtained with the starch granules, being that
prevention of gluten aggregation can be a route to facilitate the hydrolysis of
wheat gluten. The concept of adding an inert filler that is easy to separate from
the hydrolyzed mixture seems to be an industrially feasible route.
6.5 Conclusions
We studied the influence of the presence of starch on wheat gluten hydrolysis.
Wheat gluten in wheat flour (WFG) was hydrolyzed at 5.6 times higher solid
concentrations but at the same protein concentrations than vital wheat gluten
(VWG). WFG hydrolysis at 40% solids resulted in higher DH% than VWG
hydrolysis at 7.2% solids. Furthermore, higher DH% were obtained when
hydrolyzing VWG with added starch, compared to VWG alone and for WFG
hydrolysis compared to the washed gluten fraction of the wheat flour. This
showed that differences in the gluten composition and the presence of albumins
and globulins in wheat flour cannot explain the difference in DH%. Instead, we
concluded that starch granules facilitated the hydrolysis reaction by hindering
the gluten aggregation. The final composition of the hydrolysates, though, was
just a function of the enzyme used and the DH%, but not influenced by the
starch. At higher solid concentrations up to 70% wheat flour, the positive effect
of starch disappeared, because WFG hydrolysis was hindered by mass transfer
limitations and lower water activities.
The results show that the understanding and prevention of wheat gluten
aggregation is important in order to improve wheat gluten hydrolysis, and could
be a drive for mixer design or the use of additives other than starch.
100

Cha
pter
6C
hapt
er6
Cha
pter
6C
hapt
er6
Cha
pter
6C
hapt
er6
Starch facilitates enzymatic wheat gluten hydrolysis
Acknowledgements
The research leading to these results has received funding from the [European
Community’s] Seventh Framework Programme [FP7/2007-2013] under grant
agreement no. 2380.
101

Cha
pter
6C
hapt
er6
Cha
pter
6C
hapt
er6
Cha
pter
6C
hapt
er6

Cha
pter
7C
hapt
er7
Cha
pter
7C
hapt
er7
Cha
pter
7C
hapt
er7
Cha
pter
7
CH
AP
TE
R
7General discussion

Cha
pter
7C
hapt
er7
Cha
pter
7C
hapt
er7
Cha
pter
7C
hapt
er7
Cha
pter
7
Chapter 7
7.1 Outline
In the following general discussion, the main findings of the preceding chapters
are summarized. Then, outcomes will be generalized by comparing the effects
of different proteases on concentrated wheat gluten hydrolysis. Afterwards,
the findings of this thesis are used to compare the current status of starch–
gluten separation and gluten hydrolysis with proposed separation and hydrolysis
processes utilizing reduced water contents; the focus is on improvements in water,
energy, and reactor volume usage. In the end, future prospects in high-solid
wheat gluten hydrolysis are briefly discussed.
7.2 Findings
Chapters 2 and 3 describe the possibility of removing water associated with
arabinoxylan to make it available for other wheat components. In chapter 2,
wheat dough rheology at very low water content is studied. Decreasing the water
content from 43.5% (w/w) to 34% results in a non-linear increase in the dough
consistency, elastic modulus G’, and a decrease in the maximum creep compliance
Jc,max of 1–2 orders of magnitude. This is related to a reduction of the free water,
and consequently, a reduced plasticizing effect of the water. The mechanism of
hydration, however, is not affected as indicated by tan δ and the elastic strain
Jel being independent of the water content. The addition of two xylanases,
Grindamyl and Shearzyme, results in a decrease in the dough consistency and
G′ and an increase in Jc,max. The main influence of both xylanases is attributed
to the release of water, but hardly any influence on tan δ and no influence on Jel
are observed, confirming that the mechanism of hydration is hardly influenced
by the water availability.
In chapter 3, the influence of xylanases on the shear-induced starch–gluten
separation is tested with water contents ranging from 34% to 43.5%. Shearing
after addition of xylanase results in a slurry without any separation at the standard
water content of 43.5%. As a result, water contents below 40% are used, which
results in the local formation of gluten clusters with and without xylanase usage.
However, no inward migration of these patches occurs, which is opposed to
shear-induced separation at 43.5% water without xylanase. Nevertheless, gluten
104

Cha
pter
7C
hapt
er7
Cha
pter
7C
hapt
er7
Cha
pter
7C
hapt
er7
Cha
pter
7
General discussion
clusters with up to 60% protein (N×5.7) are formed. Chapters 2 and 3 show
that the amount of water released through xylanases corresponds to about 2–5%
water on a total water basis.
Chapters 4, 5, and 6 report on wheat gluten hydrolysis at high solid
concentrations (≥ 40% solids). Chapter 4 describes the influence of high solid
concentrations on enzymatic wheat gluten hydrolysis and the resulting
functional properties of the gluten hydrolysates. It is possible to hydrolyze
wheat gluten up to 60% solids (w/w). The water solubility of the dried
hydrolysates at similar degrees of hydrolysis (DH%) is independent of the solid
concentration during the hydrolysis, just like the foam stability at DH% below
8%. At DH% higher than 8%, high solid concentrations even increase the foam
stabilizing properties of the resulting hydrolysates, which is related to the
presence of more peptides with a molecular mass >25 kDa. Furthermore, an
increase in solid concentration results in an increase of the volumetric
productivity.
Chapter 4 also shows that the hydrolysis rate decreases at higher solid
concentrations and constant enzyme-to-substrate ratios. The factors causing this
hydrolysis rate limitation are investigated in chapter 5. It is shown that enzyme
inhibition, the water activity, and mass transfer limitations do not cause the
hydrolysis limitation up to 50% solids. However, the hydrolysis rate limitation
can be explained by a second-order enzyme auto-inactivation rate along with
the higher enzyme concentrations used. The hydrolysis rate further decreases at
solid concentrations above 50% due to mass transfer limitations. Furthermore,
the addition of enzyme after 24 h at high solid concentrations hardly increases
the DH%, suggesting that the maximum attainable DH% decreases at high solid
concentrations. This DH% limitation is explained by a reduced enzyme activity
due to a decline in water activity.
In chapter 6, we compare high-solid wheat flour hydrolysis with vital wheat
gluten hydrolysis. For doing so, wheat gluten present in wheat flour is
hydrolyzed, thereby omitting the starch–gluten separation step. At a constant
protein concentration of 5.8% (w/w), the protease activity is higher for wheat
flour hydrolysis (at 40% total solids) than for vital wheat gluten hydrolysis (at
7.2% total solids) in the initial 6 h of hydrolysis, despite the high starch content
105
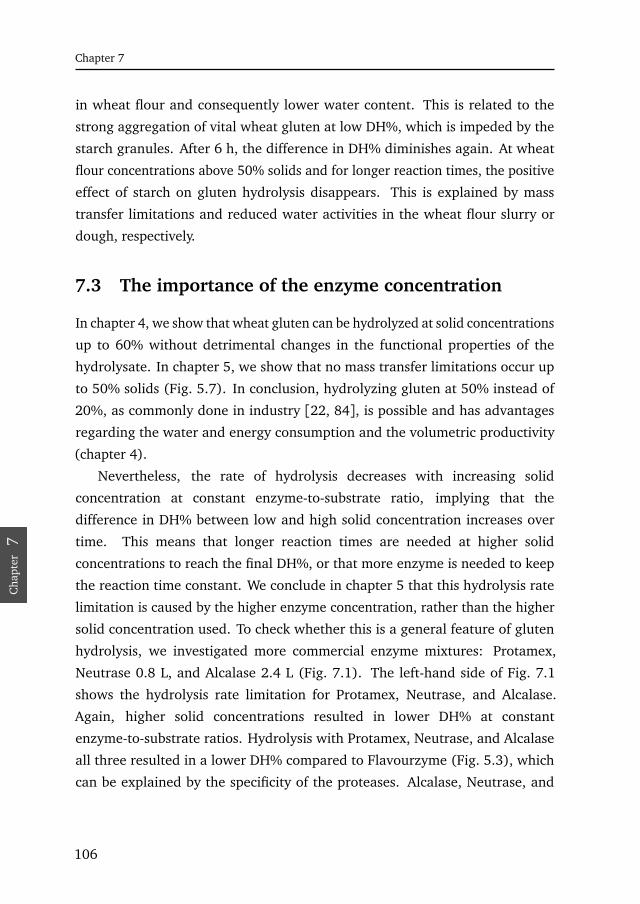
Cha
pter
7C
hapt
er7
Cha
pter
7C
hapt
er7
Cha
pter
7C
hapt
er7
Cha
pter
7
Chapter 7
in wheat flour and consequently lower water content. This is related to the
strong aggregation of vital wheat gluten at low DH%, which is impeded by the
starch granules. After 6 h, the difference in DH% diminishes again. At wheat
flour concentrations above 50% solids and for longer reaction times, the positive
effect of starch on gluten hydrolysis disappears. This is explained by mass
transfer limitations and reduced water activities in the wheat flour slurry or
dough, respectively.
7.3 The importance of the enzyme concentration
In chapter 4, we show that wheat gluten can be hydrolyzed at solid concentrations
up to 60% without detrimental changes in the functional properties of the
hydrolysate. In chapter 5, we show that no mass transfer limitations occur up
to 50% solids (Fig. 5.7). In conclusion, hydrolyzing gluten at 50% instead of
20%, as commonly done in industry [22, 84], is possible and has advantages
regarding the water and energy consumption and the volumetric productivity
(chapter 4).
Nevertheless, the rate of hydrolysis decreases with increasing solid
concentration at constant enzyme-to-substrate ratio, implying that the
difference in DH% between low and high solid concentration increases over
time. This means that longer reaction times are needed at higher solid
concentrations to reach the final DH%, or that more enzyme is needed to keep
the reaction time constant. We conclude in chapter 5 that this hydrolysis rate
limitation is caused by the higher enzyme concentration, rather than the higher
solid concentration used. To check whether this is a general feature of gluten
hydrolysis, we investigated more commercial enzyme mixtures: Protamex,
Neutrase 0.8 L, and Alcalase 2.4 L (Fig. 7.1). The left-hand side of Fig. 7.1
shows the hydrolysis rate limitation for Protamex, Neutrase, and Alcalase.
Again, higher solid concentrations resulted in lower DH% at constant
enzyme-to-substrate ratios. Hydrolysis with Protamex, Neutrase, and Alcalase
all three resulted in a lower DH% compared to Flavourzyme (Fig. 5.3), which
can be explained by the specificity of the proteases. Alcalase, Neutrase, and
106

Cha
pter
7C
hapt
er7
Cha
pter
7C
hapt
er7
Cha
pter
7C
hapt
er7
Cha
pter
7
General discussion
0 6 1 2 1 8 2 40 %
5 %
1 0 %
1 5 %
2 0 %
0 . 1 1 1 00
1
2
3
4
5
6
0 6 1 2 1 8 2 40 %
5 %
1 0 %
1 5 %
2 0 %
0 . 1 1 1 00
1
2
3
4
5
6
0 6 1 2 1 8 2 40 %
5 %
1 0 %
1 5 %
2 0 %
0 . 1 1 1 00
1
2
3
4
5
6
2 0 % 4 0 % 6 0 %
���
t i m e ( h )
P r o t a m e x 2 0 % 4 0 % 6 0 %
���
������
����
�����
���
���
� � � �
������
� ����
�����
� ��
�� ��
����
t i m e ( h )
2 0 % 4 0 % 6 0 %
N e u t r a s e
���
t i m e ( h )
2 0 % 4 0 % 6 0 %
���
������
����
�����
���
���
� � � �
������
� ����
�����
� ��
�� ��
����
t i m e ( h )
2 0 % 4 0 % 6 0 %
A l c a l a s e
���
t i m e ( h )
2 0 % 4 0 % 6 0 %
���
������
����
�����
���
���
� � � �
������
� ����
�����
� ��
�� ��
����
t i m e ( h )
Fig. 7.1: The hydrolysis rate limitation at a constant enzyme-to-substrate ratio of 1:30 (left) andthe influence of the solid concentration on the total conversion (right) for Protamex, Neutrase, andAlcalase. The legend indicates the solid concentration during hydrolysis. Results were obtained inthe same way as described in section 5.2.2 for Flavourzyme.
107

Cha
pter
7C
hapt
er7
Cha
pter
7C
hapt
er7
Cha
pter
7C
hapt
er7
Cha
pter
7
Chapter 7
Protamex are endoproteases [96], while Flavourzyme is a mixture of endo- and
exopeptidases with mainly exoproteolytic activity [4].
The right-hand side of Fig. 7.1 shows the influence of the reaction time on
the total conversion, calculated as the substrate content × DH% at a constant
enzyme concentration of 0.81 g enzyme/g reaction mixture. This total
conversion is proportional to the total number of cleaved peptide bonds. Similar
to Flavourzyme (Fig. 5.7), the enzyme activity was not affected by higher solid
concentrations up to 40%. In fact, the amount of peptide bonds cleaved was
even lower at 20% solids for Protamex, Neutrase, and Alcalase, which can be
explained by substrate exhaustion. At 60% solids, the enzyme activity
decreased, supposedly again due to mass transfer limitations, which is in line
with the results obtained for Flavourzyme.
Fig. 7.1 and Fig. 5.7 show lower total conversions for lower and also for
higher solid concentrations up to 6 h of hydrolysis. Fig. 7.2 shows the same
trend for the initial hydrolysis rate as a function of the solid concentration for
Flavourzyme at enzyme concentrations of 2.7 and 8.1 U/g reaction mixture
(Fig. 7.2a) and for Protamex, Neutrase, and Alcalase at 2.7 U/g reaction mixture
(Fig. 7.2b). The initial hydrolysis rate here refers to the conversion after 0.5 h
hydrolysis. The results in Fig. 7.2 are in line with Cheng and Prud’homme [20],
who demonstrated three concentration regions for high-solid guar hydrolysis: at
very low concentrations (1) the reaction rate is controlled by the substrate or
solid concentration (first-order), at intermediate concentrations (2) the
conversion is controlled by the enzyme cleavage kinetics (zero-order), and at
very high concentrations (3) the diffusion of the enzyme molecules reduces so
much that it controls the process (mass transfer limitations). The same trend is
observed for Flavourzyme at two different enzyme concentrations. For
Protamex, Neutrase, and Alcalase (Fig. 7.2b) only three data points of single
experiments are available for each respective protease, which makes such a clear
distinction in concentration regions difficult. Nevertheless, the initial hydrolysis
rate increased up to 40% solids and then reduced again for all three proteases.
Although it has been questioned whether the standard Michaelis-Menten
model V = Vmax ·Sm
Sm+kmcompletely applies in high-solid hydrolysis [72], the
zero-order concentration regime number 2 in Fig. 7.2a relates to S >> km,
108

Cha
pter
7C
hapt
er7
Cha
pter
7C
hapt
er7
Cha
pter
7C
hapt
er7
Cha
pter
7
General discussion
0 % 2 0 % 4 0 % 6 0 %0
1
2
3
4
0 % 2 0 % 4 0 % 6 0 %0
1
2
3
4
3
2
���
������
����
�����
���
���
� � � �
������
� ����
�����
� ��
�� ��
����
s o l i d c o n c e n t r a t i o n
1
a b P r o t a m e x N e u t r a s e A l c a l a s e
���
������
����
�����
���
���
� � � �
������
� ����
�����
� ��
�� ��
����
s o l i d c o n c e n t r a t i o n
Fig. 7.2: Initial hydrolysis rate as function of the solid concentration. Initial hydrolysis rate hererefers to the conversion after 0.5 h hydrolysis. (a) Flavourzyme hydrolysis at 2.7 (filled symbols)and 8.1 (empty symbols) U/g reaction mixture. The solid concentration regions 1, 2, 3 are markedaccording to Cheng and Prud’homme [20]. For further details see the text. (b) Protamex, Neutrase,and Alcalase hydrolysis at 0.81 g enzyme/g reaction mixture. The legend indicates the proteaseused.
where V becomes Vmax. In this zero-order regime, the influence of the enzyme
concentration on high-solid hydrolysis can be investigated without the influence
of the solid concentration. Therefore, Fig. 7.3 depicts the total amount of
hydrolysis per enzyme molecule (calculated as the substrate content multiplied
by the DH% and divided by the initial enzyme concentration) as a function of
the initial enzyme concentration for Protamex, Neutrase, Alcalase, and
Flavourzyme. Fig. 7.3 is an extension of Fig. 5.9 with more proteases. Higher
initial enzyme concentrations result in a reduced total amount of hydrolysis per
enzyme molecule for Protamex, Neutrase, and Alcalase, which has been related
to protease self-inactivation in case of Flavourzyme (chapter 5). This decrease
cannot be compensated by adding more substrate. This suggests that a lower
total amount of hydrolysis per enzyme molecule at higher enzyme
concentrations is a generic property in gluten hydrolysis for most or all
proteases. Furthermore, it implies that the hydrolysis rate limitation in wheat
gluten hydrolysis is caused by the higher enzyme concentration, independent of
the enzyme used. The same argumentation does not hold true for the solid
concentration. Here, the total conversion per initial solid concentration (i.e. the
DH%) will also decrease with higher solid concentrations (Fig. 5.2b). However,
109

Cha
pter
7C
hapt
er7
Cha
pter
7C
hapt
er7
Cha
pter
7C
hapt
er7
Cha
pter
7
Chapter 7
0 2 4 6 8 1 00 . 0
0 . 2
0 . 4
0 . 6
0 . 8
1 . 0
1 . 2 P r o t a m e x N e u t r a s e A l c a l a s e F l a v o u r z y m e
����
������
����
�����
��
���� ��
�����
�������
������
����
E 0 ( U / g r e a c t i o n m i x t u r e )
Fig. 7.3: Influence of the initial enzyme concentration on the total amount of hydrolysis per initialenzyme concentration after 1 h. The legend indicates the enzyme used. Solid concentrationswere 40–60% for Protamex, Neutrase and Alcalase, and 30–50% for Flavourzyme. Enzymeconcentration was 0.81 g enzyme/g reaction mixture. Results were obtained in the same way asfor Flavourzyme as described in section 5.2.2.
this decrease can be compensated to some extent by adding more enzyme (see
appendix A.3, Fig. A.3).
The hydrolysis rate limitation described in this thesis does not only seem to
be a generic effect in wheat gluten hydrolysis, but also a generic effect for high
protein concentrations at constant enzyme-to-substrate ratios in general. Butré
et al. [16] showed similar results regarding the hydrolysis rate limitation for
whey protein hydrolysis. The finding that the hydrolysis rate limitation is related
to the enzyme and not the substrate indeed suggests that the results of this thesis
for high-solid wheat gluten hydrolysis can be extended to other protein systems
as well.
110

Cha
pter
7C
hapt
er7
Cha
pter
7C
hapt
er7
Cha
pter
7C
hapt
er7
Cha
pter
7
General discussion
7.4 Separation and hydrolysis at high solid contents –
comparison of water, energy and volume
consumption
7.4.1 Qualitative comparison
This thesis describes the separation of wheat starch and gluten and the
subsequent hydrolysis of gluten at concentrated conditions. But what do the
results of this thesis imply when comparing the current standard industrial
separation and hydrolysis with the findings of this study? Fig. 7.4 shows Sankey
diagrams to compare the standard process (Fig. 7.4a) with a shear-induced
starch–gluten separation with a subsequent hydrolysis at 50% solids (Fig. 7.4b)
and the hydrolysis of wheat gluten in wheat flour at 40% solids with a
subsequent separation (Fig. 7.4c). The key figures are given in the following
text to demonstrate the main effect. Besides, only the main components in
wheat flour and derived products thereof are considered, being gluten, starch
and water. An overview of all other assumptions and calculations is given in the
appendix A.4.
Fig. 7.4a shows the standard process in industry, which requires the addition
of 2.6 L water per kg of wheat flour [132]. Here, typically a dough or batter
is formed after which additional water is added to wash out the starch. The
resulting streams consist of: (a) The gluten stream with approximately 80–85%
gluten (on a dry basis), pentosans, starch, and lipids. Approximately 20% of
the added water ends up in the gluten stream [132]. (b) The A-starch stream
contains >99% starch (on a dry basis) and 30% of the added water. (c) The
rest stream contains pentosans, water-soluble proteins, B-starch, and 50% of the
added water. All three streams are dried after separation. The dried A-starch
stream can be used further e.g. for starch hydrolysis. The dried rest stream is
used as feedstuff [90]. The dried gluten stream in Fig. 7.4a is rehydrated and
hydrolyzed at 20% solids, which represents the solid concentration commonly
used in industry [22, 84]. Subsequently, the wheat gluten hydrolysate is dried.
Fig. 7.4b shows the separation and hydrolysis of wheat gluten at concentrated
conditions. Starch and gluten are separated by shear at 42.7% water (i.e. 0.5 L
111
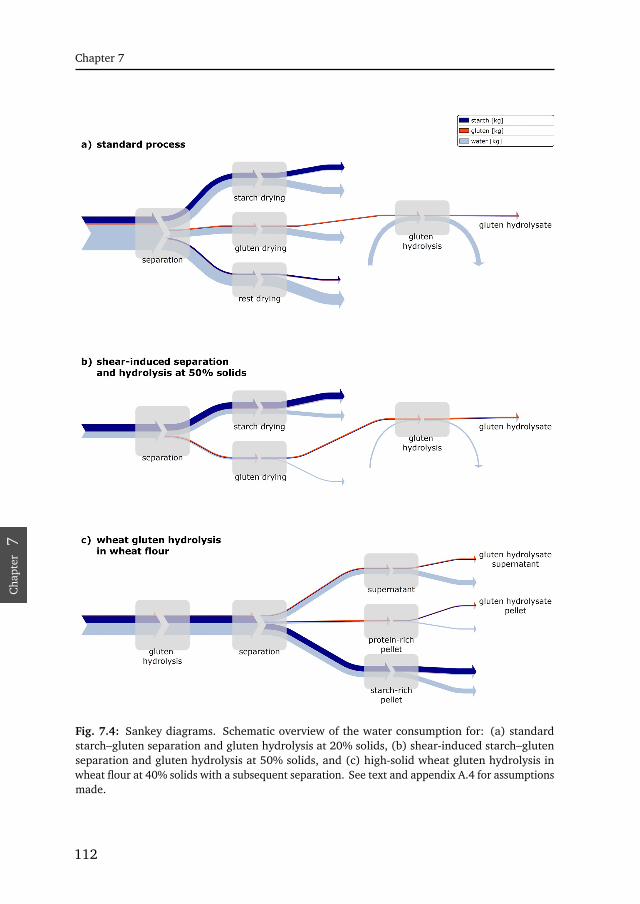
Cha
pter
7C
hapt
er7
Cha
pter
7C
hapt
er7
Cha
pter
7C
hapt
er7
Cha
pter
7
Chapter 7
Fig. 7.4: Sankey diagrams. Schematic overview of the water consumption for: (a) standardstarch–gluten separation and gluten hydrolysis at 20% solids, (b) shear-induced starch–glutenseparation and gluten hydrolysis at 50% solids, and (c) high-solid wheat gluten hydrolysis inwheat flour at 40% solids with a subsequent separation. See text and appendix A.4 for assumptionsmade.
112

Cha
pter
7C
hapt
er7
Cha
pter
7C
hapt
er7
Cha
pter
7C
hapt
er7
Cha
pter
7
General discussion
water addition per kg dry matter). It is assumed that gluten can be concentrated
up to 60% protein (on a dry basis, Fig. 3.5), that 80% protein is recovered and
that consequently the starch-rich layer contains 3.1% protein. After drying, the
gluten-rich phase is hydrolyzed at 50% solids, which is the highest solid content
without any mass transfer limitations (chapter 5).
Fig. 7.4c shows the direct hydrolysis of wheat gluten in wheat flour, thereby
making the pre-separation step superfluous. Instead, starch and gluten are
separated after hydrolysis using a hydrocyclone. The wheat gluten is hydrolyzed
at 40% solids, where centrifugal separation of the starch and the hydrolysate
is possible. After centrifugal separation, the supernatant contains 49.7%, the
protein-rich pellet 30.6%, and the starch-rich pellet 2.0% protein, respectively
(Table 7.1).
Table 7.1: Protein content and yield after centrifugal separation of starch and hydrolyzed wheatgluten. Hydrolysis was performed with Flavourzyme for 1 h and an enzyme-to-substrate ratioof 1:100. The picture shows a wheat flour hydrolysate after centrifugal separation with thesupernatant, protein-rich pellet, and starch-rich pellet from top to bottom.
protein content protein yield(on a wet basis)
supernatant 49.7% 59.3%protein-rich pellet 30.6% 31.0%starch-rich pellet 2.0% 9.6%
7.4.2 Quantitative comparison
Table 7.2 shows the water, energy and volume consumption to quantitatively
compare the standard process, shear-induced separation and hydrolysis at 50%
solids, and high-solid wheat flour hydrolysis outlined in Fig. 7.4. The DH%
of the gluten hydrolysate is assumed to be 5%. Since this thesis focuses on
wheat gluten, Table 7.2 shows the water, energy, and volume consumption in
the separation process in relation to the gluten. For this, only the mass of water,
gluten and starch entering the gluten stream are considered, which is known
for all three processes introduced. For instance, the water consumption in the
standard process is the water entering the gluten drying process divided by
113

Cha
pter
7C
hapt
er7
Cha
pter
7C
hapt
er7
Cha
pter
7C
hapt
er7
Cha
pter
7
Chapter 7
Tabl
e7.
2:W
ater
,ene
rgy,
and
volu
me
cons
umpt
ion
for
the
stan
dard
proc
ess,
shea
r-in
duce
dse
para
tion
and
hydr
olys
isat
50%
solid
s,an
dhi
gh-s
olid
whe
atflo
urhy
drol
ysis
.H
igh-
solid
whe
atflo
urhy
drol
ysis
cons
ider
ssu
pern
atan
tan
dpr
otei
n-ri
chst
ream
sas
glut
enst
ream
s.H
ydro
lysi
sti
mes
for
hydr
olys
isto
DH
%5%
.Se
eap
pend
ixA
.4fo
rot
her
assu
mpt
ions
mad
e.
tim
ew
ater
cons
umpt
ion
ener
gyco
nsum
ptio
nvo
lum
eco
nsum
ptio
n
sepa
rati
onhy
drol
ysis
sepa
rati
onhy
drol
ysis
sepa
rati
onhy
drol
ysis
sepa
rati
onhy
drol
ysis
hh
Lkg
glut
enL
kghy
drol
ysat
eM
Jkg
glut
enM
Jkg
hydr
olys
ate
m3
tonn
egl
uten/h
m3
tonn
ehy
drol
ysat
e/h
stan
dard
proc
ess
(Fig
.7.1
a)1.
251.
257.
14.
935
.224
.710
.07.
4
shea
r-in
duce
dse
para
tion
and
hydr
olys
isat
50%
(Fig
.7.1
b)
0.5
1.75
1.1
(-84
%)
1.3
(-73
%)
6.5
(-81
%)
7.6
(-69
%)
1.1
(-89
%)
4.6
(-39
%)
high
-sol
idw
heat
flour
hydr
olys
is(F
ig.7
.1c)
15.
8(-
51%
)29
.8(-
50%
)7.
4(-
58%
)
114

Cha
pter
7C
hapt
er7
Cha
pter
7C
hapt
er7
Cha
pter
7C
hapt
er7
Cha
pter
7
General discussion
the mass of separated gluten. Since it is unlikely that the starch is not utilized
after separation, an overview of the volume, water, and energy consumption
considering the whole wheat flour is given in the appendix A.4 (Table A.3).
Although the comparison in Table 7.2 can only give an estimation of the actual
water, energy, and volume consumption in a real process, the data is meaningful
when comparing the different processes:
Water consumption: To separate the gluten from the starch and
subsequently hydrolyze it at 20% solids, 7.1 L/kg gluten and 4.9 L/kg gluten
hydrolysate are needed. For shear-induced separation and hydrolysis at 50%
solids, these figures reduce by 84% and 73%, respectively. For high-solid wheat
flour hydrolysis, 6.2 L/kg gluten hydrolysate are required for hydrolysis and
separation. This figure reduces by 51% compared to the separation and the
hydrolysis in the standard process (7.1 L/kg gluten + 4.9 L/kg hydrolysate).
Energy consumption: The standard process consumes 35.2 MJ/kg gluten
during separation and 24.7 MJ/kg hydrolysate during hydrolysis. Since only
short reaction times are necessary for hydrolysis until DH% 5%, the drying of
the gluten, and gluten hydrolysate consumes most of the energy and the mixing
and heating energy is less than 25% of the total energy. Therefore, the savings in
energy consumption for shear-induced separation and hydrolysis at 50% solids
and high-solid wheat flour hydrolysis are closely related to the savings in water
consumption.
Volume consumption: The standard process requires 10.0 m3 to separate
and 7.4 m3 to hydrolyze a tonne of gluten per hour. Again, this figure is smaller
in shear-induced separation and hydrolysis at 50% solids, even though a longer
hydrolysis times is required at 50% solids. The savings in volume consumption
in high-solid wheat flour hydrolysis are 58%.
Table 7.2 shows the volume consumption for a DH% of 5% with relatively short
hydrolysis times up to 105 min. For higher DH%, the hydrolysis time necessary
in the different processes varies more and a different picture regarding the
volume consumption is given. This is shown in Table 7.3 for hydrolysis up
to DH% 15%, which requires hydrolysis times up to 24 h at 50% solids. It
takes approximately 24 h to hydrolyze to DH% 15% at 50% solids because the
115

Cha
pter
7C
hapt
er7
Cha
pter
7C
hapt
er7
Cha
pter
7C
hapt
er7
Cha
pter
7
Chapter 7
Table 7.3: Volume consumption for the standard process, shear-induced separation and hydrolysisat 50% solids, and high-solid wheat flour hydrolysis. High-solid wheat flour hydrolysis considerssupernatant and protein-rich streams as gluten streams. Hydrolysis times for hydrolysis to DH%15%. See appendix A.4 for other assumptions made.
time volume consumption
separation hydrolysis separation hydrolysis
h h m3
tonne gluten/hm3
tonne hydrolysate/h
standardprocess
(Fig. 7.1a)1.25 6 10.0 35.6
shear-inducedseparation and
hydrolysis at 50%(Fig. 7.1b)
0.5 241.1
(-89%)62.6
(75%)
high-solidwheat flourhydrolysis(Fig. 7.1c)
537.0
(-19%)
concentration effect described in chapter 5 plays a prominent role at higher DH%
and solid concentrations. As a result, higher volumes are needed to hydrolyze
one tonne gluten per hour. Regarding high-solid wheat flour hydrolysis, the
volume consumption is only 19% lower when hydrolyzing to DH% 15%. Because
separation of starch and gluten is a rather fast process (1.25 h [46]), long
hydrolysis times will favor the standard process over high-solid wheat flour
hydrolysis regarding the volumetric productivity.
7.4.3 Shear-induced separation and hydrolysis at 50% solids
Fig. 7.4 and Table 7.2 show the great economic and environmental potential of
shear-induced starch–gluten separation and hydrolysis at 50% solids. However,
some challenges remain: while we believe that hydrolysis at 50% solids could
be readily performed in existing equipment, shear-induced starch–gluten
separation is performed in batch on lab scale to this date. However, the
116

Cha
pter
7C
hapt
er7
Cha
pter
7C
hapt
er7
Cha
pter
7C
hapt
er7
Cha
pter
7
General discussion
Table 7.4: Water, energy, and volume consumption for shear-induced separation at 42.7% waterand shear-induced separation with xylanase at 38% water. Separation time = 0.5 h. See appendixA.4 for assumptions made.
water water energy volumecontent consumption consumption consumption
Lkg wheat flour
MJkg wheat flour
m3
tonne wheat flour/h
shear-inducedseparation(Fig. 7.1b)
42.7% 0.50 3.7 0.61
shear-inducedseparation andwith xylanase
38%0.39
(-23%)4.0
(8%)0.56
(-9%)
transition from batch to continuous is not trivial. For example, a material inlet
and an outlet would have to be created, which should influence the shear flow
in the system minimally [132]. Another drawback of shear-induced separation
is the lower protein concentration in the final gluten product: up to 60%
(N×5.7) compared to 72% in the gluten from the standard process. Therefore,
the final hydrolysate will either be lower in protein content than current gluten
hydrolysates commercially available, or another concentration step is required
to increase the protein content. We would like to point out, though, that protein
contents of 60% might be sufficient in many food applications and higher
protein contents not necessary. For instance, in the case of adding the gluten
hydrolysate to cereal products high in starch, the higher starch content in the
hydrolysate is not necessarily detrimental. In addition, it was shown that the
functionality of the shear-induced separated gluten is comparable or improved
compared to commercially available gluten [136].
In chapter 3, we investigated shear-induced starch–gluten separation aided by
xylanases to test the possibility of separating at even more concentrated
conditions. In Table 7.4, the water, energy, and volume consumption for such a
xylanase-aided separation at 38% water is compared to shear-induced
separation at 42.7% water without xylanase. Xylanase addition reduces the
water consumption from 0.50 to 0.39 L water/kg wheat flour (i.e. by 23%).
117

Cha
pter
7C
hapt
er7
Cha
pter
7C
hapt
er7
Cha
pter
7C
hapt
er7
Cha
pter
7
Chapter 7
However, the volume consumption only reduces by 9%, because only the
amount of water changes but not the amount of wheat flour. The energy
consumption even increases by 8% because the lower water content of 38%
leads to an increased viscosity and mixing input (Fig. 3.3). Thus, given the fact
that enzymes are costly, the advantages in water and volume consumption need
to be compared carefully to the enzyme costs and higher energy consumption.
7.4.4 High-solid wheat flour hydrolysis
Fig. 7.4 and Table 7.2 show water, energy, and volume savings of 50–58% for high-
solid wheat flour hydrolysis compared to the standard process when hydrolyzing
to DH% 5%. Higher savings are possible using shear-induced separation and
hydrolysis at 50% solids. However, high-solid wheat flour hydrolysis has the
advantage that it could be readily applied in existing equipment, whereas shear-
induced starch–gluten separation is only available on lab scale so far.
High-solid wheat flour hydrolysis benefits especially from short reaction
times, because it makes use of the increased initial hydrolysis rate (chapter 6).
Furthermore, starch–gluten separation is a relatively fast process. In Table 7.2 it
is assumed that the separation requires 1.25 h in the standard process [46]. This
implies that hydrolysis times longer than 1.25 h in high-solid wheat flour can be
considered as detrimental regarding the volume consumption because hydrolysis
and separation are combined. Therefore, we suggest high-solid hydrolysis as an
alternative to the standard process for short reaction times from the perspective
of the volumetric productivity.
A drawback of high-solid wheat flour hydrolysis is the relative impurity of
the protein hydrolysate. The supernatant stream does not only contain the
hydrolysate but also other water-soluble or dispersible components, such as
pentosans and damaged starch. At a DH% of 5% the dried supernatant had a
protein content of 49.7% (on a wet basis) (Table 7.1). This protein content can be
further increased in a post-process step. However, similar as stated for the shear-
induced separation, a protein content of 50% might already be sufficient in many
food applications. The fact that all the components of the supernatant stream
are water-soluble make them suitable for application in sports drinks, in special
medical diets, or as a supplement in other drinks to enhance the nutritional
118

Cha
pter
7C
hapt
er7
Cha
pter
7C
hapt
er7
Cha
pter
7C
hapt
er7
Cha
pter
7
General discussion
and functional properties [25]. Furthermore, the protein-rich pellet also has
a relatively small protein content of 30.6% and might require an additional
concentration step.
7.5 Future prospects – new scientific challenges and
possible applications
In the future, it is interesting to further investigate high-solid wheat gluten
hydrolysis. From the results presented in this thesis, it can be concluded that
improvements of wheat gluten hydrolysis at high solid concentrations can be
achieved by preventing auto-inactivation or minimizing the enzyme
concentration. The design of specific proteases with no or low specificity for its
own kind might be a future option to decrease protease auto-inactivation.
Alternative paths to improve high-solid wheat gluten hydrolysis could also lead
towards protease immobilization, which also prevents protease
auto-inactivation.
Section 7.4 showed the environmental and economic benefits of concentrated
systems. The scientific challenges are to develop further understanding that
allows the application of these concentrated systems on a larger scale. For
instance, (a) to scale up the shear-induced starch–gluten separation, preferably
to a continuous process, or (b) perform high-solid enzymatic wheat gluten
hydrolysis at larger scales and extend the understanding to other protein systems.
In addition, it is worthwhile to make further use of the properties high-solid
protein systems offer. In chapter 5, it was discussed that the plastein reaction
might take place at high-solid gluten hydrolysis and impedes hydrolysis. The
plastein reaction is characterized by the production of water-insoluble peptides
when exposing water-soluble, hydrolyzed peptides to a protease at elevated
substrate concentrations. Therefore, it was tested, whether plastein products
form for wheat gluten hydrolysates (Fig. 7.5). Wheat gluten was hydrolyzed
to DH% 20% using Flavourzyme and DH% 10% using Alcalase and Protamex.
Subsequently, the plastein reaction was conducted by exposing the freeze-dried
and ground supernatant to freshly added protease at high solid concentration.
The protease during hydrolysis and the plastein reaction were always the same.
119

Cha
pter
7C
hapt
er7
Cha
pter
7C
hapt
er7
Cha
pter
7C
hapt
er7
Cha
pter
7
Chapter 7
Fig. 7.5: Plastein formation after 24 h. The same proteases were used for the hydrolysis and theplastein reaction. Only the freeze-dried supernatant (water-soluble) of the hydrolysis reactionwas used for the plastein reaction. The legend shows the hydrolysate concentration during theplastein reaction for the enzyme and control sample.
Fig. 7.5 shows no evidence for plastein formation for Flavourzyme, probably due
to the exo-activity of Flavourzyme. It has been suggested that short peptides, such
as di- and tripeptides, are not suitable for the plastein reaction [150]. However,
plastein formed for Alcalase and Protamex and more plastein formed for the
protease sample than for the control sample. This suggests that plastein also
forms during high-solid hydrolysis using Alcalase and Protamex. In the future,
we should not only focus on improving high-solid hydrolysis with respect to the
lower hydrolysis rate compared to low-solid hydrolysis. Instead, we should also
try to make use of the unique opportunities that the high-solid systems have to
offer. For instance, high-solid hydrolysis could be used to derive specific peptides,
such as shown for the plastein reaction.
120

Cha
pter
7C
hapt
er7
Cha
pter
7C
hapt
er7
Cha
pter
7C
hapt
er7
Cha
pter
7
General discussion
Acknowledgements
We would like to thank Beatrice Tino for technical assistance and Filippos
Zisopoulos for help with the Sankey diagrams.
121

Cha
pter
RC
hapt
erR
Cha
pter
RC
hapt
erR
Cha
pter
RC
hapt
erR
Cha
pter
R

Cha
pter
RC
hapt
erR
Cha
pter
RC
hapt
erR
Cha
pter
RC
hapt
erR
Cha
pter
R
RReferences

Ref
eren
ces
Ref
eren
ces
Ref
eren
ces
Ref
eren
ces
Ref
eren
ces
Ref
eren
ces
Ref
eren
ces
Ref
eren
ces
References
[1] Adler-Nissen, J. (1986). Enzymic hydrolysis of food proteins. Elsevier Applied
Science Publishers.
[2] Agarwal, U. S., A. Dutta, and R. A. Mashelkar (1994). Migration of
macromolecules under flow: The physical origin and engineering implications.
Chemical Engineering Science 49(11), 1693–1717.
[3] Agyare, K. K., K. Addo, and Y. L. Xiong (2009). Emulsifying and foaming
properties of transglutaminase-treated wheat gluten hydrolysate as influenced
by pH, temperature and salt. Food Hydrocolloids 23(1), 72–81.
[4] Ashie, I. (2007). Methods for flavor enhancement. European Patent
1,855,547.
[5] Atwell, W. A. (1998). Method for reducing syruping in refrigerated doughs.
US Patent 5,792,499.
[6] Baks, T., A. E. M. Janssen, and R. M. Boom (2006). The effect of
carbohydrates on α-amylase activity measurements. Enzyme and Microbial
Technology 39(1), 114–119.
[7] Batey, I. L. (1985). Enzymatic solubilization of wheat gluten. Journal of
Applied Biochemistry 7(6), 423–429.
[8] Belitz, H.-D., W. Grosch, and P. Schieberle (2009). Food chemistry (4 ed.).
Springer.
[9] Berland, S. and B. Launay (1995). Rheological properties of wheat flour
doughs in steady and dynamic shear: Effect of water content and some
additives. Cereal Chemistry 72(1), 48–52.
[10] Berrin, J. and N. Juge (2008). Factors affecting xylanase functionality in
the degradation of arabinoxylans. Biotechnology letters 30(7), 1139–1150.
[11] Bock, J. and K. Seetharaman (2012). Unfolding gluten: An overview of
research on gluten. Cereal Foods World 57(5), 209–214.
124

Ref
eren
ces
Ref
eren
ces
Ref
eren
ces
Ref
eren
ces
Ref
eren
ces
Ref
eren
ces
Ref
eren
ces
Ref
eren
ces
References
[12] Bombara, N., M. C. Añón, and A. Pilosof (1997). Functional properties of
protease modified wheat flours. Lebensmittel-Wissenschaft & Technologie 30(5),
441–447.
[13] Bombara, N., A. M. R. Pilosof, and M. C. Añón (1992). Kinetics of wheat
proteins solubilization with a fungal protease. Lebensmittel-Wissenschaft &
Technologie 25(6), 527–531.
[14] Brijs, K., J. A. Ingelbrecht, C. M. Courtin, L. Schlichting, B. A. Marchylo,
and J. A. Delcour (2004). Combined effects of endoxylanases and reduced
water levels in pasta production. Cereal Chemistry 81(3), 361–368.
[15] Bushuk, W. (1966). Distribution of water in dough and bread. The Baker’s
Digest 40, 38–40.
[16] Butré, C. I., P. A. Wierenga, and H. Gruppen (2012). Effects of ionic strength
on the enzymatic hydrolysis of diluted and concentrated whey protein isolate.
Journal of Agricultural and Food Chemistry 60(22), 5644–5651.
[17] Cara, C., M. Moya, I. Ballesteros, M. J. Negro, A. González, and E. Ruiz
(2007). Influence of solid loading on enzymatic hydrolysis of steam exploded
or liquid hot water pretreated olive tree biomass. Process Biochemistry 42(6),
1003–1009.
[18] Chang, C., K. Wu, and S. Chiang (2007). Antioxidant properties and protein
compositions of porcine haemoglobin hydrolysates. Food Chemistry 100(4),
1537–1543.
[19] Chen, H., G. L. Rubenthaler, and E. G. Schanus (1988). Effect of apple
fiber and cellulose on the physical properties of wheat flour. Journal of Food
Science 53(1), 304–305.
[20] Cheng, Y. and R. K. Prud’homme (2000). Enzymatic degradation of guar
and substituted guar galactomannans. Biomacromolecules 1(4), 782–788.
[21] Chiang, W. D., C. J. Shih, and Y. H. Chu (1999). Functional properties
of soy protein hydrolysate produced from a continuous membrane reactor
system. Food Chemistry 65(2), 189–194.
125
Ref
eren
ces
Ref
eren
ces
Ref
eren
ces
Ref
eren
ces
Ref
eren
ces
Ref
eren
ces
Ref
eren
ces
Ref
eren
ces
References
[22] Chigurupati, S. R., K. G. Parekh, and W. A. May (2001). Method for
producing a savory flavor base. US Patent 6,251,443.
[23] Chobert, J. M., L. Briand, J. Guéguen, Y. Popineau, C. Larré, and T. Haertlé
(1996). Recent advances in enzymatic modifications of food proteins for
improving their functional properties. Food / Nahrung 40(4), 177–182.
[24] Christophersen, C., E. Andersen, T. S. Jakobsen, and P. Wagner (1997).
Xylanases in wheat separation. Starch - Stärke 49(1), 5–12.
[25] Clemente, A. (2000). Enzymatic protein hydrolysates in human nutrition.
Trends in Food Science & Technology 11(7), 254–262.
[26] Combes, D. and P. Lozano (1992). α-chymotrypsin in plastein synthesis -
Influence of water activity. Annals of the New York Academy of Sciences 672(1),
409–414.
[27] Corwin, D. L. and S. A. Bradford (2008). Environmental impacts and
sustainability of degraded water reuse. Journal of Environmental Quality 37(5
Suppl), S1–7.
[28] Courtin, C. M. and J. A. Delcour (2002). Arabinoxylans and endoxylanases
in wheat flour bread-making. Journal of Cereal Science 35(3), 225–243.
[29] Daniels, N. W. R. (1975). Some effects of water in wheat flour doughs.
In Proceedings of an International Symposium on Water Relations of Food, pp.
573–586.
[30] Davé, B. (2004). Sustainable development : Role of industrial water
management. In P. Norling, F. Wood-Black, and T. M. Masciangioli (Eds.),
Water and Sustainable Development: Opportunities for the chemical sciences –
A workshop report to the chemical sciences roundtable (1st ed.)., Chapter 9, pp.
66–74. Washington, D.C., USA: National Academies Press.
[31] Day, L. (2011). Wheat gluten: Production, properties, and application. In
G. O. Phillips and P. A. Williams (Eds.), Handbook of food proteins (1st ed.).,
Chapter 10, pp. 267–288. Woodhead Publishing.
126

Ref
eren
ces
Ref
eren
ces
Ref
eren
ces
Ref
eren
ces
Ref
eren
ces
Ref
eren
ces
Ref
eren
ces
Ref
eren
ces
References
[32] Day, L., M. Augustin, I. L. Batey, and C. Wrigley (2006). Wheat-gluten uses
and industry needs. Trends in Food Science & Technology 17(2), 82–90.
[33] Deeslie, W. D. and M. Cheryan (1981). Continuous enzymatic modification
of proteins in an ultrafiltration reactor. Journal of Food Science 46(4), 1035–
1042.
[34] Dill, K. A. (1979). Theory for the separation of very large DNA molecules
by radial migration. Biophysical Chemistry 10(3-4), 327–334.
[35] Doona, C. J. and M. Y. Baik (2007). Molecular mobility in model dough
systems studied by time-domain nuclear magnetic resonance spectroscopy.
Journal of Cereal Science 45(3), 257–262.
[36] Dornez, E., P. Verjans, F. Arnaut, J. A. Delcour, and C. M. Courtin (2011). Use
of psychrophilic xylanases provides insight into the xylanase functionality in
bread making. Journal of Agricultural and Food Chemistry 59(17), 9553–9562.
[37] Drago, S. R. and R. J. González (2001). Foaming properties of enzymatically
hydrolysed wheat gluten. Innovative Food Science & Emerging Technologies 1(4),
269–273.
[38] Edens, L., P. Schuurhuizen, A. Louis, and M. Simonetti (2002). Method for
producing a protein hydrolysate. US Patent 6,372,282.
[39] Edwards, N. M., J. E. Dexter, M. G. Scanlon, and S. Cenkowski (1999).
Relationship of creep-recovery and dynamic oscillatory measurements to
durum wheat physical dough properties. Cereal Chemistry 76(5), 638–645.
[40] Edwards, N. M., D. Peressini, J. E. Dexter, and S. J. Mulvaney (2001).
Viscoelastic properties of durum wheat and common wheat dough of different
strengths. Rheologica Acta 40(2), 142–153.
[41] FAO (2012). http://faostat.fao.org.
[42] Farahnaky, A. and S. E. Hill (2007). The effect of salt, water and
temperature on wheat dough rheology. Journal of Texture Studies 38(4),
499–510.
127

Ref
eren
ces
Ref
eren
ces
Ref
eren
ces
Ref
eren
ces
Ref
eren
ces
Ref
eren
ces
Ref
eren
ces
Ref
eren
ces
References
[43] Felby, C., L. G. Thygesen, J. B. Kristensen, H. Jørgensen, and T. Elder (2008).
Cellulose–water interactions during enzymatic hydrolysis as studied by time
domain nmr. Cellulose 15(5), 703–710.
[44] Fessas, D. and A. Schiraldi (2001). Water properties in wheat flour dough
I: Classical thermogravimetry approach. Food Chemistry 72(2), 237–244.
[45] Frederix, S. A., C. M. Courtin, and J. A. Delcour (2003). Impact of xylanases
with different substrate selectivity on gluten–starch separation of wheat flour.
Journal of Agricultural and Food Chemistry 51(25), 7338–7345.
[46] Frederix, S. A., C. M. Courtin, and J. A. Delcour (2004a). Influence of
process parameters on yield and composition of gluten fractions obtained in
a laboratory scale dough batter procedure. Journal of Cereal Science 39(1),
29–36.
[47] Frederix, S. A., C. M. Courtin, and J. A. Delcour (2004b). Substrate
selectivity and inhibitor sensitivity affect xylanase functionality in wheat
flour gluten–starch separation. Journal of Cereal Science 40(1), 41–49.
[48] García-Carreño, F. L. (1992). Protease inhibition in theory and practice.
Biotechnology Education 3(4), 145–150.
[49] Georgopoulos, T., H. Larsson, and A.-C. Eliasson (2004). A comparison of
the rheological properties of wheat flour dough and its gluten prepared by
ultracentrifugation. Food Hydrocolloids 18(1), 143–151.
[50] Ghaderi, A., E. H. Everson, and W. T. Yamazaki (1971). Test weight
in relation to the physical and quality characteristics of soft winter wheat
(Triticum aestivum L. em Thell). Crop Science 11(4), 515–518.
[51] Giesler, L., D. Linke, S. Rabe, D. Appel, and R. G. Berger (2013). Hydrolysis
of wheat gluten by combining peptidases of flammulina velutipes and
electrodialysis. Journal of Agricultural and Food Chemistry 61, 8641–8649.
[52] Goesaert, H., K. Brijs, W. S. Veraverbeke, C. M. Courtin, K. Gebruers, and
J. A. Delcour (2005). Wheat flour constituents: How they impact bread
128

Ref
eren
ces
Ref
eren
ces
Ref
eren
ces
Ref
eren
ces
Ref
eren
ces
Ref
eren
ces
Ref
eren
ces
Ref
eren
ces
References
quality, and how to impact their functionality. Trends in Food Science &
Technology 16(1-3), 12–30.
[53] González-Tello, P., F. Camacho, E. Jurado, M. P. Páez, and E. M.
Guadix (1994). Enzymatic hydrolysis of whey proteins: I. Kinetic models.
Biotechnology and Bioengineering 44(4), 523–528.
[54] Grace, G. (1989). Preparation of vital wheat gluten. In T. H. Applewhite
(Ed.), Vegetable Protein Utilization in Human Foods and Animal Feedstuffs, pp.
112–115.
[55] Hardt, N. A., H. Chauhan, R. M. Boom, and A. J. van der Goot (2014).
Shear-induced starch–gluten separation at very low water content aided by
xylanases. Journal of Food Engineering 141(1), 51–57.
[56] Hardt, N. A., A. E. M. Janssen, R. M. Boom, and A. J. van der Goot
(2014). Factors impeding enzymatic wheat gluten hydrolysis at high solid
concentrations. Biotechnology and Bioengineering 111(7), 1304–1312.
[57] Hardt, N. A., A. J. van der Goot, and R. M. Boom (2013). Influence of
high solid concentrations on enzymatic wheat gluten hydrolysis and resulting
functional properties. Journal of Cereal Science 57(3), 531–536.
[58] Hii, S. L., J. S. Tan, T. C. Ling, and A. B. Ariff (2012). Pullulanase: Role in
starch hydrolysis and potential industrial applications. Enzyme Research 2012,
1–14.
[59] Hodge, D. B., M. N. Karim, D. J. Schell, and J. D. McMillan (2009).
Model-based fed-batch for high-solids enzymatic cellulose hydrolysis. Applied
Biochemistry and Biotechnology 152(1), 88–107.
[60] Ingelbrecht, J. A., T. Verwimp, and J. A. Delcour (2000). Endoxylanases in
durum wheat semolina processing: Solubilization of arabinoxylans, action
of endogenous inhibitors, and effects on rheological properties. Journal of
Agricultural and Food Chemistry 48(6), 2017–2022.
129
Ref
eren
ces
Ref
eren
ces
Ref
eren
ces
Ref
eren
ces
Ref
eren
ces
Ref
eren
ces
Ref
eren
ces
Ref
eren
ces
References
[61] Izydorczyk, M. S. and C. G. Biliaderis (1992). Influence of structure
on the physicochemical properties of wheat arabinoxylan. Carbohydrate
Polymers 17(3), 237–247.
[62] Jardim, D. C. P., L. M. B. Candido, and F. M. Netto (1999). Sorption
isotherms and glass transition temperatures of fish protein hydrolysates with
different degrees of hydrolysis. International Journal of Food Properties 2(3),
227–242.
[63] Jekle, M. and T. Becker (2011). Dough microstructure: Novel analysis
by quantification using confocal laser scanning microscopy. Food Research
International 44(4), 984–991.
[64] Jiang, Z., X. Li, S. Yang, L. Li, and S. Tan (2005). Improvement of the
breadmaking quality of wheat flour by the hyperthermophilic xylanase B from.
Food Research International 38(1), 37–43.
[65] Jönsson, A., W. van Breukelen, E. Wehtje, P. Adlercreutz, and B. Mattiasson
(1998). The influence of water activity on the enantioselectivity in the
enzyme-catalyzed reduction of 2-pentanone. Journal of Molecular Catalysis B:
Enzymatic 5(1-4), 273–276.
[66] Khatkar, B. S. and J. D. Schofield (2002a). Dynamic rheology of wheat
flour dough. I. Non-linear viscoelastic behaviour. Journal of the Science of
Food and Agriculture 82(8), 827–829.
[67] Khatkar, B. S. and J. D. Schofield (2002b). Dynamic rheology of wheat flour
dough. II. Assessment of dough strength and bread-making quality. Journal
of the Science of Food and Agriculture 82(8), 823–826.
[68] Kim, J. M., J. H. Whang, K. M. Kim, J. H. Koh, and H. J. Suh
(2004). Preparation of corn gluten hydrolysate with angiotensin I converting
enzyme inhibitory activity and its solubility and moisture sorption. Process
Biochemistry 39(8), 989–994.
[69] Kong, X., H. Zhou, and H. Qian (2007a). Enzymatic hydrolysis of wheat
gluten by proteases and properties of the resulting hydrolysates. Food
Chemistry 102(3), 759–763.
130

Ref
eren
ces
Ref
eren
ces
Ref
eren
ces
Ref
eren
ces
Ref
eren
ces
Ref
eren
ces
Ref
eren
ces
Ref
eren
ces
References
[70] Kong, X., H. Zhou, and H. Qian (2007b). Enzymatic preparation and
functional properties of wheat gluten hydrolysates. Food Chemistry 101(2),
615–620.
[71] Krause, W., M. Partzsch, and J. Koch (1999). Chymosin catalysed hydrolysis
of isolated β-casein in diluted solution and in systems with reduced water
content. Milchwissenschaft 54(10), 569–573.
[72] Kristensen, J. B., C. Felby, and H. Jørgensen (2009). Yield-determining
factors in high-solids enzymatic hydrolysis of lignocellulose. Biotechnology
for Biofuels 2(1), 11.
[73] Larson, R. G. (1992). Flow-induced mixing, demixing, and phase transitions
in polymeric fluids. Rheologica Acta 31(6), 497–520.
[74] Le Roux, D., B. Vergnes, M. Chaurand, and J. Abécassis (1995).
A thermomechanical approach to pasta extrusion. Journal of Food
Engineering 26(3), 351–368.
[75] Lee, S. B. and K.-J. Kim (1995). Effect of water activity on enzyme hydration
and enzyme reaction rate in organic solvents. Journal of Fermentation and
Bioengineering 79(5), 473–478.
[76] Lefebvre, J. (2006). An outline of the non-linear viscoelastic behaviour of
wheat flour dough in shear. Rheologica Acta 45(4), 525–538.
[77] Lefebvre, J. (2009). Nonlinear, time-dependent shear flow behaviour,
and shear-induced effects in wheat flour dough rheology. Journal of Cereal
Science 49(2), 262–271.
[78] Lefebvre, J. and N. Mahmoudi (2007). The pattern of the linear viscoelastic
behaviour of wheat flour dough as delineated from the effects of water content
and high molecular weight glutenin subunits composition. Journal of Cereal
Science 45(1), 49–58.
[79] Létang, C., M. Piau, and C. Verdier (1999). Characterization of wheat
flour–water doughs. Part I: Rheometry and microstructure. Journal of Food
Engineering 41(2), 121–132.
131

Ref
eren
ces
Ref
eren
ces
Ref
eren
ces
Ref
eren
ces
Ref
eren
ces
Ref
eren
ces
Ref
eren
ces
Ref
eren
ces
References
[80] Linarès, E., C. Larré, M. Lemeste, and Y. Popineau (2000). Emulsifying
and foaming properties of gluten hydrolysates with an increasing degree of
hydrolysis: Role of soluble and insoluble fractions. Cereal Chemistry 77(4),
414–420.
[81] López-Otín, C. and J. S. Bond (2008). Proteases: Multifunctional enzymes
in life and disease. Journal of Biological Chemistry 283(45), 30433–30437.
[82] Ma, F., S. Xu, M. Xu, and X. Guo (2012). The influence of water soluble
pentosan on viscoelasticity of gluten. Journal of Food Engineering 111(1),
166–175.
[83] Mani, K., C. Trägårdh, A.-C. Eliasson, and L. Lindahl (1992). Water content,
water soluble fraction, and mixing affect fundamental rheological properties
of wheat flour doughs. Journal of Food Science 57(5), 1198–1209.
[84] Maningat, C. C., L. Nie, S. D. Bassi, G. A. Kelley, and E. E. Trompeter (2005).
Wheat protein isolates and their modified forms and methods of making. US
Patent 2005/0287267.
[85] Maningat, C. C., P. A. Seib, S. D. Bassi, K. S. Woo, and G. D. Lasater
(2009). Wheat starch: Production, properties, modification and uses. In J. N.
BeMiller and R. L. Whistler (Eds.), Starch: Chemistry and technology (3rd ed.).,
Chapter 10, pp. 441–510. Academic Press.
[86] Manski, J. M., A. J. van der Goot, and R. M. Boom (2007).
Formation of fibrous materials from dense calcium caseinate dispersions.
Biomacromolecules 8(4), 1271–1279.
[87] Márquez, M. C. and M. A. Vázquez (1999). Modeling of enzymatic protein
hydrolysis. Process Biochemistry 35(1–2), 111–117.
[88] Mastromatteo, M., M. Guida, A. Danza, J. Laverse, P. Frisullo,
V. Lampignano, and M. A. Del Nobile (2013). Rheological, microstructural
and sensorial properties of durum wheat bread as affected by dough water
content. Food Research International 51(2), 458–466.
132

Ref
eren
ces
Ref
eren
ces
Ref
eren
ces
Ref
eren
ces
Ref
eren
ces
Ref
eren
ces
Ref
eren
ces
Ref
eren
ces
References
[89] Mazza, G., L. Gao, B. D. Oomah, D. O’Connor, and B. Crowe (2001).
Functional, water-soluble protein-fibre products from grains. US Patent
6,261,629.
[90] Meuser, F. (1994). Wheat utilization for the production of starch, gluten and
extruded products. In W. Bushuk and V. F. Rasper (Eds.), Wheat – Production,
properties and quality (1st ed.)., Chapter 13, pp. 179–204. Blackie Academic
& Professional, Chapman & Hall.
[91] Micard, V., M. H. Morel, J. Bonicel, and S. Guilbert (2001). Thermal
properties of raw and processed wheat gluten in relation with protein
aggregation. Polymer 42(2), 477–485.
[92] Mimouni, B., J. Raymond, A. M. Merle-Desnoyers, J. L. Azanza, and
A. Ducastaing (1994). Combined acid deamidation and enzymic hydrolysis
for improvement of the functional properties of wheat gluten. Journal of
Cereal Science 20(2), 153–165.
[93] Modenbach, A. A. and S. E. Nokes (2012). The use of high-solids loadings
in biomass pretreatment – A review. Biotechnology and Bioengineering 109(6),
1430–1442.
[94] Mohagheghi, A., M. Tucker, K. Grohmann, and C. Wyman (1992). High
solids simultaneous saccharification and fermentation of pretreated wheat
straw to ethanol. Applied Biochemistry and Biotechnology 33(2), 67–81.
[95] Nicol, J. M., S. J. Turner, D. L. Coyne, L. D. Nijs, and S. Hockland (2011).
Current nematode threats to world agriculture. In J. Jones, G. Gheysen,
and C. Fenoll (Eds.), Genomics and molecular genetics of plant-nematode
interactions, pp. 21–43. Springer Netherlands.
[96] Nielsen, P. M. (1996). Casein hydrolyzate and method for production of
such casein hydrolyzate. US Patent 5486461.
[97] Nielsen, P. M. and H. S. Olsen (2002). Enzymic modification of food protein.
In R. J. Whitehurst and B. A. Law (Eds.), Enzymes in food technology (1st ed.).,
Chapter 6, pp. 109–143. Sheffield Academic Press.
133

Ref
eren
ces
Ref
eren
ces
Ref
eren
ces
Ref
eren
ces
Ref
eren
ces
Ref
eren
ces
Ref
eren
ces
Ref
eren
ces
References
[98] Nielsen, P. M. and H. S. Olsen (2010). Enzymes in protein modification.
In R. J. Whitehurst and M. van Oort (Eds.), Enzymes in food technology (2nd
ed.)., Chapter 13, pp. 292–319. Wiley-Blackwell.
[99] Nielsen, P. M., D. Petersen, and C. Dambmann (2001). Improved method for
determining food protein degree of hydrolysis. Journal of Food Science 66(5),
642–646.
[100] Nielsen, P. M. and D. Pettersson (2011). Nutritious drink. US Patent
2011/0003030.
[101] Ölmez, H. (2014). Water consumption, reuse and reduction strategies
in food processing. In B. K. Tiwari, T. Norton, and N. M. Holden (Eds.),
Sustainable Food Processing (1st ed.)., Chapter 17, pp. 401–434. Chichester,
UK: John Wiley & Sons, Ltd.
[102] Osborne, T. B. (1907). The proteins of the wheat kernel. Washington, D C:
Carnegie Institution of Washington.
[103] Peighambardoust, S. H., R. J. Hamer, R. M. Boom, and A. J. van der
Goot (2008). Migration of gluten under shear flow as a novel mechanism for
separating wheat flour into gluten and starch. Journal of Cereal Science 48(2),
327–338.
[104] Peighambardoust, S. H. and A. J. van der Goot (2010). Migration of gluten
under shear flow: Influence of process parameters on separation behaviour.
Food Chemistry 118(3), 712–718.
[105] Peighambardoust, S. H., A. J. van Der Goot, T. van Vliet, R. J. Hamer, and
R. M. Boom (2006). Microstructure formation and rheological behaviour of
dough under simple shear flow. Journal of Cereal Science 43(2), 183–197.
[106] Peressini, D., S. H. Peighambardoust, R. J. Hamer, A. Sensidoni, and A. J.
van der Goot (2008). Effect of shear rate on microstructure and rheological
properties of sheared wheat doughs. Journal of Cereal Science 48(2), 426–438.
134

Ref
eren
ces
Ref
eren
ces
Ref
eren
ces
Ref
eren
ces
Ref
eren
ces
Ref
eren
ces
Ref
eren
ces
Ref
eren
ces
References
[107] Petrofsky, K. E. and R. C. Hoseney (1995). Rheological properties of
dough made with starch and gluten from several cereal sources. Cereal
Chemistry 72(1), 53–58.
[108] Popineau, Y., B. Huchet, C. Larré, and S. Bérot (2002). Foaming and
emulsifying properties of fractions of gluten peptides obtained by limited
enzymatic hydrolysis and ultrafiltration. Journal of Cereal Science 35(3),
327–335.
[109] Rasmussen, L. E., J. F. Sørensen, and A. S. Meyer (2010). Kinetics
and substrate selectivity of a Triticum aestivum xylanase inhibitor (TAXI)
resistant D11F/R122D variant of Bacillus subtilis XynA xylanase. Journal of
Biotechnology 146(4), 207–214.
[110] Roberts, K. M., D. M. Lavenson, E. J. Tozzi, M. J. McCarthy, and T. Jeoh
(2011). The effects of water interactions in cellulose suspensions on mass
transfer and saccharification efficiency at high solids loadings. Cellulose 18(3),
759–773.
[111] Robertson, J. A., J. D. Tomlinson, P. I. Short, and L. H. O’Hare (1992).
Modification of the emulsifying activity of gluten by acid hydrolysis. US Patent
5,166,323.
[112] Roels, S. P., P. J. Grobet, and J. A. Delcour (1998). Distribution of
carbohydrates in gluten fractions isolated from European wheats (Triticum
aestivum L.) in a batter System. Journal of Agricultural and Food
Chemistry 46(4), 1334–1343.
[113] Ruan, C. Q., Y. J. Chi, and R.-D. Zhang (2010). Kinetics of hydrolysis of
egg white protein by pepsin. Czech Journal of Food Sciences 28(5), 355–363.
[114] Ruan, R. R., X. Wang, P. L. Chen, R. G. Fulcher, P. Pesheck, and
S. Chakrabarti (1999). Study of water in dough using nuclear magnetic
resonance. Cereal Chemistry 76(2), 231–235.
[115] Salvador, A. C., M. D. C. Santos, and J. A. Saraiva (2010). Effect of the
ionic liquid [bmim]Cl and high pressure on the activity of cellulase. Green
Chemistry 12(4), 632–635.
135

Ref
eren
ces
Ref
eren
ces
Ref
eren
ces
Ref
eren
ces
Ref
eren
ces
Ref
eren
ces
Ref
eren
ces
Ref
eren
ces
References
[116] Santala, O., P. Lehtinen, E. Nordlund, T. Suortti, and K. Poutanen (2011).
Impact of water content on the solubilisation of arabinoxylan during xylanase
treatment of wheat bran. Journal of Cereal Science 54(2), 187–194.
[117] Sato, K., R. Nisimura, Y. Suzuki, H. Motoi, Y. Nakamura, K. Ohtsuki, and
M. Kawabata (1998). Occurrence of indigestible pyroglutamyl peptides in
an enzymatic hydrolysate of wheat gluten prepared on an industrial scale.
Journal of Agricultural and Food Chemistry 46(9), 3403–3405.
[118] Saulnier, L. (1997). A study of the polysaccharide components in gluten.
Journal of Cereal Science 25(2), 121–127.
[119] Schutyser, M. A. I. and A. J. van der Goot (2011). The potential of dry
fractionation processes for sustainable plant protein production. Trends in
Food Science & Technology 22(4), 154–164.
[120] Selig, M. J., C.-W. C. Hsieh, L. G. Thygesen, M. E. Himmel, C. Felby,
and S. R. Decker (2012). Considering water availability and the effect of
solute concentration on high solids saccharification of lignocellulosic biomass.
Biotechnology Progress 28(6), 1478–1490.
[121] Shewry, P. R. (2009). Wheat. Journal of Experimental Botany 60(6),
1537–1553.
[122] Skendi, A., M. Papageorgiou, and C. G. Biliaderis (2010). Influence of
water and barley β-glucan addition on wheat dough viscoelasticity. Food
Research International 43(1), 57–65.
[123] Tengborg, C., M. Galbe, and G. Zacchi (2001). Reduced inhibition of
enzymatic hydrolysis of steam-pretreated softwood. Enzyme and Microbial
Technology 28(9-10), 835–844.
[124] Tester, R. F., J. Karkalas, and X. Qi (2004). Starch-composition, fine
structure and architecture. Journal of Cereal Science 39(2), 151–165.
[125] Usta, O. B., J. E. Butler, and A. J. C. Ladd (2006). Flow-induced migration
of polymers in dilute solution. Physics of Fluids 18(3), 031703.
136

Ref
eren
ces
Ref
eren
ces
Ref
eren
ces
Ref
eren
ces
Ref
eren
ces
Ref
eren
ces
Ref
eren
ces
Ref
eren
ces
References
[126] Uthayakumaran, S., M. Newberry, N. Phan-Thien, and R. I. Tanner (2002).
Small and large strain rheology of wheat gluten. Rheologica Acta 41(1-2),
162–172.
[127] van Bockstaele, F., I. de Leyn, M. Eeckhout, and K. Dewettinck (2008).
Rheological properties of wheat flour dough and the relationship with bread
volume. I. Creep-recovery measurements. Cereal Chemistry 85(6), 753–761.
[128] van Bockstaele, F., I. de Leyn, M. Eeckhout, and K. Dewettinck (2011). Non-
linear creep-recovery measurements as a tool for evaluating the viscoelastic
properties of wheat flour dough. Journal of Food Engineering 107(1), 50–59.
[129] van der Borght, A., H. Goesaert, W. S. Veraverbeke, and J. A. Delcour
(2005). Fractionation of wheat and wheat flour into starch and gluten:
Overview of the main processes and the factors involved. Journal of Cereal
Science 41(3), 221–237.
[130] van der Veen, M. E., A. J. van der Goot, and R. M. Boom (2005). Production
of glucose syrups in highly concentrated systems. Biotechnology Progress 21(2),
598–602.
[131] van der Veen, M. E., S. Veelaert, A. J. van der Goot, and R. M. Boom
(2006). Starch hydrolysis under low water conditions: A conceptual process
design. Journal of Food Engineering 75(2), 178–186.
[132] van der Zalm, E. E. J. (2011). Concentrated separation of wheat flour into
starch and gluten. Ph. D. thesis, Wageningen University.
[133] van der Zalm, E. E. J., J. A. M. Berghout, A. J. van der Goot, and R. M.
Boom (2012). Starch–gluten separation by shearing: Influence of the device
geometry. Chemical Engineering Science 73, 421–430.
[134] van der Zalm, E. E. J., A. J. van der Goot, and R. M. Boom (2009).
Influence of process conditions on the separation behaviour of starch–gluten
systems. Journal of Food Engineering 95(4), 572–578.
137
Ref
eren
ces
Ref
eren
ces
Ref
eren
ces
Ref
eren
ces
Ref
eren
ces
Ref
eren
ces
Ref
eren
ces
Ref
eren
ces
References
[135] van der Zalm, E. E. J., A. J. van der Goot, and R. M. Boom (2010).
Influence of sodium chloride on shear flow induced starch–gluten separation
from Soissons wheat dough. Journal of Food Engineering 99(3), 366–372.
[136] van der Zalm, E. E. J., A. J. van der Goot, and R. M. Boom (2011). Quality
of shear fractionated wheat gluten – Comparison to commercial vital wheat
gluten. Journal of Cereal Science 53(2), 154–159.
[137] van Oort, M. (2010). Enzymes in bread making. In R. J. Whitehurst and
M. van Oort (Eds.), Enzymes in Food Technology (2nd ed.)., Chapter 6, pp.
103–143. Wiley-Blackwell.
[138] Verberne, P. (1977). A new hydrocyclone process for the production of
potato starch with lowest fresh water consumption. Starch - Stärke 29(9),
303–307.
[139] Viollaz, P. E. and C. O. Rovedo (1999). Equilibrium sorption isotherms
and thermodynamic properties of starch and gluten. Journal of Food
Engineering 40(4), 287–292.
[140] Vossenberg, P., H. H. Beeftink, T. Nuijens, M. A. Cohen Stuart, and
J. Tramper (2012). Selecting optimal conditions for Alcalase CLEA-OM for
synthesis of dipeptides in organic media. Journal of Molecular Catalysis B:
Enzymatic 75, 43–49.
[141] Walstra, P. (2002). Physical chemistry of foods. CRC Press.
[142] Wang, J., M. Zhao, X. Yang, and Y. Jiang (2006). Improvement
on functional properties of wheat gluten by enzymatic hydrolysis and
ultrafiltration. Journal of Cereal Science 44(1), 93–100.
[143] Wang, J., M. Zhao, Q. Zhao, Y. Bao, and Y. Jiang (2007). Characterization
of hydrolysates derived from enzymatic hydrolysis of wheat gluten. Journal
of Food Science 72(2), C103–107.
[144] Wang, M., R. J. Hamer, T. van Vliet, and G. Oudgenoeg (2002). Interaction
of water extractable pentosans with gluten protein: Effect on dough properties
and gluten quality. Journal of Cereal Science 36(1), 25–37.
138

Ref
eren
ces
Ref
eren
ces
Ref
eren
ces
Ref
eren
ces
Ref
eren
ces
Ref
eren
ces
Ref
eren
ces
Ref
eren
ces
References
[145] Wang, M., G. Oudgenoeg, T. van Vliet, and R. J. Hamer (2003). Interaction
of water unextractable solids with gluten protein: Effect on dough properties
and gluten quality. Journal of Cereal Science 38(1), 95–104.
[146] Wang, M., T. van Vliet, and R. J. Hamer (2005). Interaction of water
unextractable solids and xylanase with gluten protein: Effect of wheat cultivar.
Journal of Cereal Science 41(3), 251–258.
[147] Weipert, D. (1990). The benefits of basic rheometry in studying dough
rheology. Cereal Chemistry 67(4), 311–317.
[148] Wieser, H. (2007). Chemistry of gluten proteins. Food Microbiology 24(2),
115–119.
[149] Wikström, K. and A.-C. Eliasson (1998). Effects of enzymes and oxidizing
agents on shear stress relaxation of wheat flour dough: Additions of
protease, glucose oxidase, ascorbic acid, and potassium bromate. Cereal
Chemistry 75(3), 331–337.
[150] Williams, R. J. H., V. L. Brownsell, and A. T. Andrews (2001). Application
of the plastein reaction to mycoprotein: I. Plastein synthesis. Food
Chemistry 72(3), 329–335.
[151] Xiao, Z., X. Zhang, D. J. Gregg, and J. N. Saddler (2004). Effects of sugar
inhibition on cellulases and beta-glucosidase during enzymatic hydrolysis
of softwood substrates. Applied Biochemistry and Biotechnology 113-116,
1115–1126.
[152] Yokotsuka, T., T. Iwaasa, T. Okami, M. Noda, and M. Fujii (1976). Process
for producing protein hydrolyzate. US Patent 3,932,671.
[153] Zhao, X.-H. and Y.-Y. Li (2009). An approach to improve ACE-inhibitory
activity of casein hydrolysates with plastein reaction catalyzed by Alcalase.
European Food Research and Technology 229(5), 795–805.
139

Ref
eren
ces
Ref
eren
ces
Ref
eren
ces
Ref
eren
ces
Ref
eren
ces
Ref
eren
ces
Ref
eren
ces
Ref
eren
ces

Ref
eren
ces
Ref
eren
ces
Ref
eren
ces
Ref
eren
ces
Ref
eren
ces
Ref
eren
ces
Ref
eren
ces
Ref
eren
ces
AAppendix

App
endi
xA
ppen
dix
App
endi
xA
ppen
dix
App
endi
xA
ppen
dix
App
endi
xA
ppen
dix
App
endi
x
Appendix
A.1 two-factor ANOVA – detailed results
Table A.1: Two-factor analysis of variance (ANOVA) – influence of the enzyme for sampleswithout xylanase and samples with Grindamyl and Shearzyme. If α≤ 0.05 then two parameters(i.e. no xylanase, Grindamyl or Shearzyme) were significantly different. Experiments wereperformed at water contents from 34% to 43.5–44.8%. See chapter 2 for details.
G′* no xylanase Grindamyl Shearzyme
no xylanase – 0.000 0.000Grindamyl 0.000 – 0.727Shearzyme 0.000 0.727 –
Jc,max* no xylanase Grindamyl Shearzyme
no xylanase – 0.000 0.000Grindamyl 0.000 – 0.415Shearzyme 0.000 0.415 –
tan δ no xylanase Grindamyl Shearzyme
no xylanase – 0.000 0.173Grindamyl 0.000 – 0.000Shearzyme 0.173 0.000 –
Jel** no xylanase Grindamyl Shearzyme
no xylanase – 0.336 0.548Grindamyl 0.336 – 0.508Shearzyme 0.548 0.508 –
*log G′ and Jc,max-values were used.**ANOVA performed at water contents below 40%.
Table A.2: Two-factor analysis of variance (ANOVA) results – influence of the water content forsamples without xylanase and samples with Grindamyl and Shearzyme. If α≤ 0.05 then the watercontent had a statistically significant influence on the respective parameter (i.e. G′, tan δ, Jc,max,or Jel). Experiments were performed at water contents from 34% to 43.5–44.8%. See chapter 2for details.
G′* tan δ Jc,max* Jel <40%** Jel all**
no xylanase 0.000 0.044 0.000 0.204 0.000Grindamyl 0.000 0.000 0.000 0.150 0.000Shearzyme 0.000 0.001 0.000 0.001 0.000
all*** 0.000 0.055 0.000 0.004 0.000
*log G′ and Jc,max-values were used.**<40%: ANOVA performed at water contents below 40% and all: performed at all watercontents up to 43.5%***ANOVA performed using all data points (no xylanase, Grindamyl, and Shearzyme).
142

App
endi
xA
ppen
dix
App
endi
xA
ppen
dix
App
endi
xA
ppen
dix
App
endi
xA
ppen
dix
App
endi
x
Appendix
A.2 Farinograph mixing profiles
Fig. A.1 depicts the Farinograph mixing profiles at water contents from 34% to
44.8% without enzyme and for Grindamyl and Shearzyme addition.
0 5 1 0 1 5 2 0 2 5 3 00
1 0 0 0
2 0 0 0
3 0 0 0
4 0 0 0
0 5 1 0 1 5 2 0 2 5 3 00
1 0 0 0
2 0 0 0
3 0 0 0
4 0 0 0
0 5 1 0 1 5 2 0 2 5 3 00
1 0 0 0
2 0 0 0
3 0 0 0
4 0 0 0
4 4 . 8 %4 1 . 5 %3 9 . 5 %3 8 %
3 6 %
doug
h con
sisten
cy (B
U)
t i m e ( m i n )
3 4 %n o e n z y m e
G r i n d a m y l
doug
h con
sisten
cy (B
U)
t i m e ( m i n )
4 4 . 8 %4 1 . 5 %3 9 . 5 %3 8 %
3 6 %
3 4 %
S h e a r z y m e
doug
h con
sisten
cy (B
U)
t i m e ( m i n )
4 4 . 8 %4 1 . 5 %3 9 . 5 %3 8 %
3 6 %
3 4 %
Fig. A.1: Farinograph mixing profiles at water contents from 34% to 44.8% without enzyme andfor Grindamyl and Shearzyme addition. Percentages next to curves show used water content.Farinograph experiments were performed according to AACC-method 54-21. Supplementary ofFig. 2.1.
143

App
endi
xA
ppen
dix
App
endi
xA
ppen
dix
App
endi
xA
ppen
dix
App
endi
xA
ppen
dix
App
endi
x
Appendix
A.3 Total conversion per initial substrate as function of
the initial substrate
Fig. A.2 illustrates the initial hydrolysis rate of the total amount of hydrolysis
per initial solid concentration (i.e. the DH%) as function of the initial solid
concentration.
1 0 % 2 0 % 3 0 % 4 0 % 5 0 %0 %
5 %
1 0 %
1 5 %
2 0 %
2 5 %
3 0 %
DH%
s o l i d c o n c e n t r a t i o n
8 . 1 U / g 2 . 7 U / g
Fig. A.2: Initial hydrolysis rate of the total amount of hydrolysis per initial solid concentration(i.e. the DH%) as function of the initial solid concentration. Initial hydrolysis rate here refersto the conversion after 0.5 h hydrolysis using Flavourzyme. The legend indicates the enzymeconcentration used.
144

App
endi
xA
ppen
dix
App
endi
xA
ppen
dix
App
endi
xA
ppen
dix
App
endi
xA
ppen
dix
App
endi
x
Appendix
A.4 Assumptions for starch–gluten separation and
wheat gluten hydrolysis
Table A.3 depicts the water, energy, and volume consumption considering the
whole wheat flour. Table A.3 is similar to Table 7.1, where the water, energy, and
volume consumption related to the gluten are considered.
Table A.3: Water, energy, and volume consumption in the separation process, considering thewhole wheat flour for standard process, shear-induced separation and hydrolysis at 50% solids,and high-solid wheat flour hydrolysis. Hydrolysis times for hydrolysis to DH% 5%.
time water consumption energy consumption volume consumption
h Lkg wheat flour
MJkg wheat flour
m3
tonne wheat flour/h
standardprocess
(Fig. 7.1a)1.25 2.6 22.0 4.2
shear-inducedseparation and
hydrolysis at 50%(Fig. 7.1b)
0.50.5
(-81%)3.7
(-83%)0.6
(-85%)
high-solidwheat flourhydrolysis(Fig. 7.1c)
11.2
(-56%)6.5
(-71%)1.9
(-55%)
145

App
endi
xA
ppen
dix
App
endi
xA
ppen
dix
App
endi
xA
ppen
dix
App
endi
xA
ppen
dix
App
endi
x
Appendix
Table A.4 shows the general assumptions for the standard process,
shear-induced starch–gluten separation and gluten hydrolysis at 50% solids, and
high-solid wheat flour hydrolysis with a subsequent separation. Only starch,
gluten, and water are considered. All other minor ingredients are neglected and
included in the starch fraction. Drying times were neglected in the comparison.
Table A.4: General assumptions for starch–gluten separation and wheat gluten hydrolysis.
parameter figure source
separation temperature 30 °Cevaporation temperature separation 80 °C
hydrolysis temperature 50 °Cevaporation temperature hydrolysis 60 °C [54]
water evaporation energy 2.257 MJ/kg waterheat capacity water 4.2 · 10−3 MJ/kg water
heat capacity gluten 0.365 · 10−3 MJ/kg water [91]energy efficiency 50% [119]
density starch 1510 kg/m3 [50]density gluten 1290 kg/m3 [50]
protein content wheat flour 13%starch content wheat flour 73%water content wheat flour 14%
enzyme-to-substrate ratio 1:100
146

App
endi
xA
ppen
dix
App
endi
xA
ppen
dix
App
endi
xA
ppen
dix
App
endi
xA
ppen
dix
App
endi
x
Appendix
Table A.5 shows the specific assumptions for the standard separation and
hydrolysis process. In case of starch dehydration, most of the water is removed
using hydrocyclones. This was ignored in the comparison.
Table A.5: Specific assumptions standard separation and hydrolysis process.
parameter figure source
protein content gluten fraction 72%starch content gluten fraction 18%water content gluten fraction 10%
protein content starch fraction 0.3% [54]starch content starch fraction 87.7% [54]water content starch fraction 12% [129]
water addition separation 2.6 L/kg wheat [132]water addition hydrolysis 4.0 L/kg dry matter chapters 4 & 5
recovery starch 75% [90, 132]recovery gluten 80% [90, 132]
water content starch fraction before drying 60% [90, 132]water content gluten fraction before drying 85% [90, 132]
mixing energy separation 0.05 MJ/kg battermixing energy hydrolysis 0.05 MJ/kg slurry
separation time 1.25 h [46]hydrolysis time to DH% 5% 1.25 h chapters 4 & 5
hydrolysis time to DH% 15% 6 h chapters 4 & 5
147

App
endi
xA
ppen
dix
App
endi
xA
ppen
dix
App
endi
xA
ppen
dix
App
endi
xA
ppen
dix
App
endi
x
Appendix
Table A.6 shows the specific assumptions for the shear-induced separation
and high-solid hydrolysis at 50% solids.
Table A.6: Specific assumptions shear-induced separation and high-solid hydrolysis at 50% solids.
parameter figure source
protein content gluten fraction 60% chapter 3starch content gluten fraction 30%water content gluten fraction 10%
protein content starch fraction 2.3% [134]starch content starch fraction 85.7%water content starch fraction 12% [129]
water addition separation 0.5 L/kg wheat [132]water addition hydrolysis 1.0 L/kg dry matter chapters 4 & 5
recovery gluten 80%water content gluten fraction before drying 43% chapter 3, [132]
mixing energy separation 0.332 MJ/kg dough [105]mixing energy hydrolysis 0.15 MJ/kg slurry
separation time 0.5 h chapter 3hydrolysis time to DH% 5% 1.75 h chapters 4 & 5hydrolysis time to DH% 5% 24 h chapter 5
water addition separation (incl. xylanase) 0.39 L/kg wheatmixing energy separation (incl. xylanase) 0.664 MJ/kg dough chapter 3, [105]
w.c. gluten fraction before drying (incl. xylanase) 38% chapter 3
148

App
endi
xA
ppen
dix
App
endi
xA
ppen
dix
App
endi
xA
ppen
dix
App
endi
xA
ppen
dix
App
endi
x
Appendix
Table A.7 shows specific assumptions for the high-solid wheat flour
hydrolysis.
Table A.7: Specific assumptions high-solid wheat flour hydrolysis.
parameter figure source
protein content gluten fraction 58% Fig. 7.1starch content gluten fraction 42%water content gluten fraction 10%
protein content starch fraction 2% Fig. 7.1starch content starch fraction 86%water content starch fraction 12% [129]
water addition 1.15 L/kg wheat chapter 6recovery gluten (supernatant) 59% Fig. 7.1
recovery gluten (supernatant + protein-rich pellet) 90% Fig. 7.1recovery starch 75%
water cont. gluten fraction before drying (supernatant) 80%water cont. gluten fraction before drying (spnt & pellet) 73%
water content starch fraction before drying 50%
mixing energy separation & hydrolysis 0.08 MJ/kg slurry
separation & hydrolysis time to DH% 5% 1 h chapter 6separation & hydrolysis time to DH% 15% 5 h chapter 6
hydrocyclone separation time neglectedhydrocyclone energy & hydrolysis 0.0216 MJ/kg slurry [138]
149

App
endi
xA
ppen
dix
App
endi
xA
ppen
dix
App
endi
xA
ppen
dix
App
endi
xA
ppen
dix
App
endi
x
Appendix
Fig. A.3 shows the gluten, starch, and water masses used for the Sankey diagram
comparison in section 7.4. Besides the shown masses, Fig. A.3 is the same as
Fig. 7.4.
Fig. A.3: Sankey diagrams. Schematic overview of the water consumption including the gluten,starch, and water masses for: (a) standard starch–gluten separation and gluten hydrolysis at 20%solids, (b) shear-induced starch–gluten separation and gluten hydrolysis at 50% solids, and (c)high-solid wheat gluten hydrolysis in wheat flour at 40% solids with a subsequent separation.
150

App
endi
xA
ppen
dix
App
endi
xA
ppen
dix
App
endi
xA
ppen
dix
App
endi
xA
ppen
dix
App
endi
x
SSummary

Sum
mar
ySu
mm
ary
Sum
mar
ySu
mm
ary
Sum
mar
ySu
mm
ary
Sum
mar
ySu
mm
ary
Sum
mar
ySu
mm
ary
Summary
Summary
The food industry is one of the largest water consumers in industry. Using
large amounts of water, however, is undesirable from an environmental point
of view because freshwater is a scarce good in many regions of the world and
undesirable from an economic point of view because high water loadings require
high amounts of energy for dehydration and signify high amounts of wastewater.
This thesis uses wheat, one of the major crops in human nutrition, to study
the influence of low water concentrations on two relevant processes in wheat
processing:
1. The separation of starch and gluten. Separation is often performed
using 10–15 L water per kg dry matter. Instead, starch and gluten can
be separated by inducing shear using 0.5 L water per kg dry matter. In
this thesis we make use of xylanases to hydrolyze arabinoxylan present
in wheat, thereby releasing the water associated with arabinoxylan. In
doing so, shear-induced starch–gluten separation is performed at even
more concentrated conditions. The influence of arabinoxylan hydrolysis in
wheat dough at low water contents is studied in chapters 2 and 3.
2. The hydrolysis of gluten. Hydrolysis is currently performed using
approximately 4 L water per kg dry mater. In this thesis we perform
gluten hydrolysis at solid concentrations of up to 70%, thereby
investigating the changes in the hydrolysis reaction and the functionality
of the resulting hydrolysates. Wheat gluten hydrolysis at low water
contents is studied in chapters 4, 5 and 6.
This thesis consists of seven chapters. Chapter 1 gives a general introduction
of the thesis. In chapter 2, wheat dough rheology at low water contents below
40% and the influence of xylanases is studied. A reduction in water content
from 43.5–44.8% (representing optimal Farinograph water absorption) to 34%
(the lowest water content where a dough forms) results in a non-linear increase
in the dough consistency, elastic modulus G′, and a decrease in the maximum
creep compliance Jc,max of 1–2 orders of magnitude. Addition of xylanases has
the same effect on the dough consistency, G′ and Jc,max as an increase in water
152

Sum
mar
ySu
mm
ary
Sum
mar
ySu
mm
ary
Sum
mar
ySu
mm
ary
Sum
mar
ySu
mm
ary
Sum
mar
ySu
mm
ary
Summary
content of 2–5% (on a water basis). Tan δ is hardly and Jel not influenced by
xylanase addition showing that the influence of xylanases on the mechanism of
hydration is negligible.
In chapter 3, shear-induced starch–gluten separation with the help of
xylanases is studied at water contents from 43.5% to 34%. Addition of
xylanases at the standard water content of 43.5% results in a slurry without any
separation. As a result, lower water contents are used. At water contents below
40%, the local formation of gluten clusters is observed with and without
xylanases addition. However, opposed to shear-induced separation at 43.5%
water without xylanase, the gluten patches do not migrate to the center of the
cone because of the densely packed dough and an inhomogeneity in the shear
field. Nevertheless, gluten clusters can be concentrated up to 60% (N×5.7)
protein. Similar to chapter 2, xylanase addition allows water savings of 3–5%
(on a water basis).
Chapter 4 introduces enzymatic wheat gluten hydrolysis at high solid
concentrations and describes the influence of high-solid hydrolysis on the
resulting functional properties of the gluten hydrolysates. Wheat gluten can be
hydrolyzed at solid concentrations of up to 60% (w/w). The water solubility of
the dried hydrolysates is independent of the solid concentration during
hydrolysis, just like the foam stabilizing properties at degrees of hydrolysis
(DH%) below 8% At DH% above 8%, high solid concentrations even increase
the foam stabilizing properties of the resulting hydrolysates, which is related to
the presence of more peptides with a molecular mass >25 kDa. Furthermore, an
increase in solid concentration results in an increase of the volumetric
productivity.
Despite the advantages of high-solid gluten hydrolysis, we also observe
lower hydrolysis rates in high-solid gluten hydrolysis compared to low-solid
gluten hydrolysis at constant enzyme-to-substrate ratios. The factors causing
this hydrolysis rate limitation are investigated in chapter 5. It is shown that
enzyme inhibition, the water activity, and mass transfer limitations do not impede
the hydrolysis up to 50% solids. However, the hydrolysis rate limitation can
be explained by a second-order enzyme auto-inactivation rate along with the
higher enzyme concentrations used. At solid concentrations above 50%, the
153

Sum
mar
ySu
mm
ary
Sum
mar
ySu
mm
ary
Sum
mar
ySu
mm
ary
Sum
mar
ySu
mm
ary
Sum
mar
ySu
mm
ary
Summary
hydrolysis rate further decreases due to mass transfer limitations. Furthermore,
the addition of enzyme after 24 h at high solid concentrations hardly increases
the DH%, suggesting that the maximum attainable DH% decreases at high solid
concentrations. This DH% limitation is explained by a reduced enzyme activity
due to a decline in water activity.
Based on the findings in chapters 4 and 5, a direct hydrolysis of gluten present
in wheat flour at high solid concentrations is investigated in chapter 6, thereby
omitting the starch–gluten separation. At a constant protein concentration, the
protease activity is higher for wheat flour hydrolysis (at 40% total solids) than for
vital wheat gluten hydrolysis (at 7.2% total solids) in the initial 6 h of hydrolysis,
despite the high starch content in wheat flour and consequently lower water
content. This is related to the starch granules in wheat flour, preventing the
aggregation of (native) gluten. At wheat flour concentrations above 50% and for
longer reaction times the positive effect of starch disappears. This is explained by
mass transfer limitations and reduced water activities in the wheat flour slurry
or dough, respectively.
Chapter 7 summarizes and generalizes the main findings of this thesis and
compares the current status in starch–gluten separation and gluten hydrolysis
with the concentrated separation and hydrolysis processes developed in this
study. Water and energy savings of at least 50% are possible when separating
and hydrolyzing at concentrated conditions. In the end, future prospects in
high-solid wheat gluten hydrolysis are briefly discussed.
154
Sam
enva
ttin
gSa
men
vatt
ing
Sam
enva
ttin
gSa
men
vatt
ing
Sam
enva
ttin
gSa
men
vatt
ing
Sam
enva
ttin
gSa
men
vatt
ing
Sam
enva
ttin
gSa
men
vatt
ing
Samenvatting
Samenvatting
In de levensmiddelenindustrie wordt veel water verbruikt, wat ongewenst is
vanwege het feit dat dit niet duurzaam is. Zoet water is tegenwoordig een
schaarse grondstof in veel delen van de wereld. Ook is het gebruik van veel
water ongewenst vanuit een economisch perspectief, omdat water meestal weer
verwijderd moet worden door middel van droogprocessen die energie-intensief
zijn. Bovendien wordt veel afvalwater geproduceerd. In dit proefschrift wordt
een onderzoek beschreven naar mogelijke waterbesparingen bij het industrieel
verwerken van tarwe, één van de grootste voedingsgewassen. De
waterbesparingen worden bereikt door het verwerken van tarwe bij een hogere
concentratie droge stof uit te voeren. Twee processen zijn hierbij onderzocht:
1. De scheiding van zetmeel en gluten. Bij het huidige industriële
scheidingsproces van tarwe in zetmeel en gluten wordt 10 tot 15 L water
per kg droge stof gebruikt. Recent onderzoek toonde echter aan dat
zetmeel en gluten ook gescheiden kunnen worden in een proces op basis
van afschuiving, waarin slechts 0,5 L water per kg droge stof nodig is. In
dit proefschrift is onderzocht of door middel van enzymatische hydrolyse
van arabinoxylanen extra water vrij gemaakt kan worden dat anders door
deze polysacchariden wordt geabsorbeerd. Op deze wijze zou het op
afschuiving gebaseerde scheidingsproces met nog minder toegevoegd
water kunnen worden uitgevoerd. Het effect van de hydrolyse van
arabinoxylanen is beschreven in hoofdstukken 2 en 3.
2. De hydrolyse van gluten. Momenteel wordt voor de hydrolyse van
gluten ongeveer 4 L water per kg droge stof gebruikt. In dit proefschrift is
deze hydrolyse van gluten uitgevoerd bij veel hogere
droge-stofconcentratie (tot wel 70% droge stof). De veranderingen in de
reactie en de functionaliteit van de gevormde hydrolysaten zijn daarbij
uitgebreid onderzocht en beschreven in hoofdstukken 4, 5 en 6.
Dit proefschrift bestaat uit 7 hoofstukken. Hoofdstuk 1 geeft een algemene
inleiding. In hoofdstuk 2 wordt het reologisch gedrag van deeg met weinig
water beschreven evenals de veranderingen in reologisch gedrag die ontstaan
155

Sam
enva
ttin
gSa
men
vatt
ing
Sam
enva
ttin
gSa
men
vatt
ing
Sam
enva
ttin
gSa
men
vatt
ing
Sam
enva
ttin
gSa
men
vatt
ing
Sam
enva
ttin
gSa
men
vatt
ing
Samenvatting
door toevoeging van xylanase. Een verlaging in watergehalte van 43,5–44,8 (wat
de optimale Farinograaf waterhoeveelheid is) naar 34% (het laagste watergehalte
waarbij nog een deeg gevormd wordt) resulteerde in een niet lineaire toename
in deegconsistentie, elastische modules G′ en een afname van de maximale
kruip Jc,max die kon oplopen tot 90% van de oorspronkelijke kruipwaarde. Het
toevoegen van xylanase had een vergelijkbaar effect op G′ en Jc,max als het
toevoegen van 2 tot 5% extra water. De tan δ-waarde is nauwelijks en de Jel is
niet beïnvloed door het toevoegen van xylanase, wat aangeeft dat de invloed
van xylanase op de mechanisme van deeghydratatie verwaarloosbaar is.
Hoofdstuk 3 beschrijft hoe de ”shear-induced” (door afschuiving
veroorzaakt) zetmeel-glutenscheiding wordt beïnvloed door xylanase. Het
toevoegen van xylanase aan deeg met 43% vocht (de standaard hoeveelheid)
gaf een slurry waarin geen scheiding werd waargenomen. Daarom werd het
vochtgehalte verlaagd. Onder de 40% vocht werden lokaal glutenclusters
gevormd zowel met als zonder xylanase toevoeging. Echter, in tegenstelling tot
shear-induced scheiding bij 43,5% vocht zonder xylanase, migreerden de
glutenclusters niet naar het midden van de kegel, vanwege de dichte pakking
van het deeg en inhomogeniteit in het stromingsveld. Niettemin, het
eiwitgehalte in de glutenclusters kon oplopen tot 60% (N×5,7). Net als in
hoofdstuk 4 kon het vochtgehalte met ongeveer 3 tot 5% verlaagd worden na
xylanasetoevoeging om vergelijkbare effecten te verkrijgen.
Hoofdstuk 4 introduceert enzymatische hydrolyse bij hoge
drogestofconcentraties en beschrijft de invloed van deze hoge concentratie op
de hydrolyse en de verkregen functionele eigenschappen van de
glutenhydrolysaten. Tarwegluten bleken te kunnen worden gehydrolyseerd
tot 60% droge stof. De wateroplosbaarheid van de gedroogde hydrolysaten
hangt niet af van de drogestofconcentratie tijdens hydrolyse, net als de
schuimstabilisatie-eigenschappen van hydrolysaten met een hydrolysegraad
lager dan 8%. Boven de 8% werden zelfs een hogere schuimstabiliteit gevonden.
Dit effect werd toegeschreven aan de aanwezigheid van peptiden met een
molecuulgewicht boven de 25 kDa. Verder resulteerde een hoger
drogestofgehalte in een verhoogde volumetrische productiviteit.
156

Sam
enva
ttin
gSa
men
vatt
ing
Sam
enva
ttin
gSa
men
vatt
ing
Sam
enva
ttin
gSa
men
vatt
ing
Sam
enva
ttin
gSa
men
vatt
ing
Sam
enva
ttin
gSa
men
vatt
ing
Samenvatting
Naast de genoemde voordelen vonden we ook lagere hydrolysesnelheden bij
hoge drogestofconcentraties. De factoren die deze verlaging veroorzaakten zijn
bestudeerd in hoofdstuk hoofdstuk 5. Het bleek dat enzyminhibitie, de
wateractiviteit en transportlimitaties de reactie niet hinderden tot een
drogestofconcentratie van 50%. Echter de hydrolysesnelheid kon lager worden
doordat het enzym zichzelf inactiveerde. Boven de 50% nam de
hydrolysesnelheid verder af door transportlimitatie. Verder nam de graad van
hydrolyse na 24 uur nauwelijks nog toe, zelfs niet na extra enzymdosering, wat
suggereerde dat de maximaal haalbare graad van hydrolyse afneemt bij hogere
drogestofgehalten. Dit laatste kon worden verklaard door een afname van de
wateractiviteit.
Op basis van de bevindingen in hoofdstukken 4 en 5 is de hydrolyse van
gluten in tarwebloem onderzocht bij hoge concentraties in hoofdstuk 6. Bij een
zelfde eiwitconcentratie bleek de enzymactiviteit hoger bij hydrolyse van eiwit
in tarwebloem (40% droge stof) dan in vitale gluten (7,2% droge stof) in de
eerste 6 uur van de hydrolyse. Dit opmerkelijke resultaat werd verklaard doordat
de zetmeelkorrels in bloem de agglomeratie van gluten vermindert. Bij een
concentratie hoger dan 50% en bij langere reactietijden verdween het positieve
effect van zetmeel. Dit werd verklaard door transportlimitaties en een lagere
wateractiviteit in het hoog geconcentreerde deeg.
Hoofdstuk 7 geeft een samenvatting van de belangrijkste bevindingen van
het proefschrift en plaatst deze in een breder perspectief van de huidige
industriële praktijk van zetmeel-gluten scheiding en de glutenhydrolyse. Als de
resultaten uit dit proefschrift vertaald kunnen worden naar een industriële
schaal, dan zijn water- en energiebesparingen tot wel 50% realiseerbaar indien
erbij de hoogst mogelijke drogestofconcentratie geproduceerd gaat worden. Als
laatste zijn de toekomstperspectieven van het bewerken van hoog
geconcentreeerde tarweglutenhydrolyse beschreven.
157
Sam
enva
ttin
gSa
men
vatt
ing
Sam
enva
ttin
gSa
men
vatt
ing
Sam
enva
ttin
gSa
men
vatt
ing
Sam
enva
ttin
gSa
men
vatt
ing
Sam
enva
ttin
gSa
men
vatt
ing
The research described in this thesis has received funding from the [EuropeanCommunity’s] Seventh Framework Programme [FP7/2007-2013] under grantagreement no. 2380.
This thesis was printed by Ridderprint BV, Ridderkerk, the Netherlands.