enzyme immobilization on electrodes for co reduction was produced during electrolysis in 0.05m...
TRANSCRIPT

Enzyme Immobilization on Electrodes for CO2
Reduction
Bachelor Thesis
to confer the academic degree of
Bachelor of Science (BSc)
in the bachelor program
Technical Chemistry
Author: Annika Wagner
Submission: Institute for Organic Solar Cells / Institute of Physical Chemistry
Thesis supervisor: o.Univ. Prof. Mag. Dr. DDr. h.c. Niyazi Serdar Sariciftci
Assistant Thesis Supervisor: DI Stefanie Schager
December 2013

Statement of Authorship I hereby confirm that this bachelor thesis was written autonomously by me and
without foreign help. No other than the cited references were used.
Linz, December 2013
____________________________

Abstract
Utilization of CO2 as a chemical feedstock offers a way to reduce greenhouse gases and additionally to produce higher energy molecules, especially methanol and other fuels, and therefore to move towards an independence of fossil fuels. The exploitation of dehydrogenase-enzymes as biocatalysts for CO2 reduction enables an attractive way to produce formate, formaldehyde and methanol from CO2. To accomplish stability and reusability, enzymes were immobilized in different matrices. Furthermore, the ambition to replace the expensive cofactor nicotinamide adenine dinucleotide (NADH) as electron donor lead to the idea to immobilize the enzymes on electrode surfaces to directly provide the required electrons from the electrode. A carbonfelt (CF) electrode coated with an alginate-silica hybrid gel containing three different dehydrogenases (formate dehydrogenase, FateDH; formaldehyde dehydrogenase, FaldDH; alcohol dehydrogenase, ADH) was fabricated and methanol was produced during electrolysis in 0.05 M Trizma® buffer solution as electrolyte (pH adjusted to 7.64 with HCl) with a faradaic efficiency of about 90%. Further electrolysis experiments were conducted only for the first reaction step from CO2 to formate, catalyzed by FateDH for simplicity and cost reasons. A Pt-polypyrrole electrode coated with a FateDH modified alginate gel and a Pt-polypyrrole electrode with entrapped FateDH were fabricated. For both electrodes modified with FateDH, formate production could be achieved with faradaic efficiencies of about 40% and 85% respectively. Moreover, a graphite electrode with adsorbed FateDH was fabricated, which was however, not capable of producing formate.
Kurzfassung
Die Nutzung von CO2 als chemischen Rohstoff eröffnet die Möglichkeit, Treibhausgase in der Atmosphäre zu reduzieren und darüber hinaus energiereiche Moleküle zu produzieren, die beispielsweise als Brennstoffe genutzt werden können. Dadurch könnte eine Unabhängigkeit von fossilen Brennstoffen erreicht werden. Dehydrogenasen können verwendet werden, um CO2 zu Formiat, Formaldehyd und Methanol zu reduzieren. Um Stabilität und Wiederverwendbarkeit der Enzyme zu erreichen, wurden verschiedene Methoden der Immobilisierung in unterschiedlichen Matrices untersucht. Zusätzlich hat das Bestreben den teuren Cofaktor Nicotinamid Adenin Dinucleotid (NADH) als Elektronendonor zu ersetzen zu der Idee geführt, die Enzyme auf einer Elektrodenoberfläche zu immobilisieren, um die benötigten Elektronen direkt von der Elektrode zur Verfügung zu stellen. Eine Kohlenstoff-Filz Elektrode wurde mit einem Alginat-Silikat Hybridgel mit drei verschiedenen Dehydrogenasen (Formiat Dehydrogenase, FateDH; Formaldehyd Dehydrogenase, FaldDH; Alkoholdehydrogenase, ADH) überzogenen. Während der Elektrolyse mit dieser Elektrode in 0.05 M Trizma® Pufferlösung (pH eingestellt auf 7.64 mit HCl) als Elektrolyt wurde Methanol mit einer Faradayeffizienz von ca. 90% produziert. Weitere Elektrolyseexperimente wurden aus Kostengründen nur für den ersten Schritt, also die Reduktion von CO2 zu Formiat durchgeführt. Mit FateDH enthaltendem Alginat-Silikat Hybridgel beschichtete Pt-Polypyrrol Elektroden und Pt-Polypyrrol Elektroden mit eingekapselter FateDH wurden hergestellt und mit beiden Elektroden wurde Formiat mit einer Faradayeffizienzen von ca. 40% bzw 85% produziert. Des Weiteren wurden Graphitelektroden mit adsorbierter FateDH hergestellt, welche jedoch kein Formiat produzierten.

Table of contents 1. Introduction .......................................................................................................... 1
1.1. Background....................................................................................................... 1
1.1.1. Severity of rising Atmospheric CO2 ............................................................... 1
1.2. Possibilities of adressing the CO2 problem ....................................................... 3
1.2.1. Carbon Capture and Storage ........................................................................ 3
1.2.1.1. Carbon Capture ............................................................................................. 3
1.2.1.2. Carbon Storage ............................................................................................. 4
1.2.2. Carbon Capture and Utilization ..................................................................... 5
1.2.2.1. Electrochemical conversion ........................................................................... 6
1.2.2.2. Photochemical conversion ............................................................................. 8
1.2.2.3. Biological conversion: Usage of bacteria and enzymes for CO2 reduction .... 8
2. Materials and Methods ....................................................................................... 16
2.1. Chemicals ....................................................................................................... 17
2.2. Apparatus ....................................................................................................... 17
2.3. CF/Alginate/FateDH/FaldDH/ADH – Electrodes ................................................ 18
2.3.1. Fabrication of CF/Alginate/FateDH/FaldDH/ADH-Electrodes ......................... 18
2.3.2. Characterization of CF/Alginate/FateDH/FaldDH/ADH-Electrodes ................. 19
2.3.3. Electrolysis with CF/Alginate/FateDH/FaldDH/ADH-Electrodes...................... 19
2.4. Pt/PPy/Alginate/FateDH – Electrodes .............................................................. 19
2.4.1. Fabrication of Pt/PPy/Alginate/FateDH-Electrodes ....................................... 19
2.4.2. Characterization of Pt/PPy/Alginate/FateDH Electrodes ............................... 20
2.4.3. Electrolysis with Pt/PPy/Alginate/FateDH Electrodes .................................... 20
2.5. Pt/PPy/FateDH – Electrodes ............................................................................ 21
2.5.1. Fabrication of Pt/PPy/FateDH - Electrodes ................................................... 21
2.5.2. Characterization of Pt/PPy/FateDH - Electrodes ........................................... 21
2.5.3. Electrolysis with Pt/PPy/FateDH - Electrodes ............................................... 22
2.6. Physical Adsorption of FateDH on Graphite Rods ............................................ 22
2.6.1. Production of Graphite/FateDH Electrodes ................................................... 22
2.6.2. Characterization of Graphite/FateDH Electrodes .......................................... 22
2.6.3. Electrolysis with Graphite/FateDH Electrodes ............................................... 23
3. Results and Discussion ...................................................................................... 23
3.1. CF/Alginate/FateDH/FaldDH/ADH – Electrodes ................................................ 23
3.1.1. Characterization of CF/Alginate/FateDH/FaldDH/ADH electrodes .................. 23

3.1.2. Electrolysis with CF/Alginate/FateDH/FaldDH/ADH electrodes ...................... 27
3.1.3. Faradaic efficiency of Methanol production at CF/Alginate/FateDH/FaldDH/ADH electrodes .............................................................. 31
3.1.4. Stability of CF/Alginate/FateDH/FaldDH/ADH electrodes ............................... 32
3.2. Pt/PPy/Alginate/FateDH Electrodes ................................................................. 33
3.2.1. Characterization of Pt/PPy/FateDH electrodes ............................................. 33
3.2.2. Electrolysis with Pt/PPy/Alginate/FateDH electrodes .................................... 37
3.2.3. Faradaic efficiency of formate production at Pt/PPy/Alginate/FateDH electrodes ................................................................................................................. 39
3.2.4. Stability of Pt/PPy/Alginate/FateDH electrodes ............................................. 40
3.3. Pt/PPy/FateDH Electrodes ............................................................................... 40
3.3.1. Characterization of Pt/PPy/FateDH electrodes ............................................. 40
3.3.2. Electrolysis with Pt/PPy/FateDH electrodes .................................................. 44
3.3.3. Faradaic efficiency of formate production at Pt/PPy/FateDH electrodes ....... 47
3.3.4. Stability of Pt/PPy/FateDH electrodes ........................................................... 48
3.3.5. Microsopic characterization of the Pt/PPy/FateDH electrodes ...................... 48
3.4. Physical Adsorption of FateDH on Graphite Rods ............................................ 49
3.4.1. Characterization of Graphite/FateDH electrodes........................................... 49
3.4.2. Electrolysis with a Graphite/FateDH electrode .............................................. 52
4. Conclusion ......................................................................................................... 55
5. Acknowledgements ............................................................................................ 56
6. References ......................................................................................................... 56

1
1. Introduction 1.1. Background 1.1.1. Severity of rising Atmospheric CO2 Rising CO2values in the atmosphere and the resulting global warming in the
past decades have made it necessary to develop methods to stop the increase
of or even decrease CO2 levels. Figure 1 shows the trend of atmospheric CO2
from 1959 to 2013 measured at Mauna Loa Observatory, Hawaii [1].
These measurements were started by C.D. Keeling in 1958 [2].
The red curve displays the carbon dioxide values measured as the mole fraction
in dry air in parts per million (ppm). It can be seen that there has been a
dramatic rise in atmospheric CO2 of about 80 ppm in the past 50 years.
Figure 1: Atmospheric CO2 levels measured at Mauna Loa Observatory, Hawaii [1].

2
A method to trace atmospheric CO2 back to several thousand years is offered
by analyzing ice-cores as there are entrapped air inclusions in the ice which
enable direct records of past changes in the atmospheric gas composition.
Such measurements were performed at the Russian Vostok station in east
Antarctica in 1998, where an ice core with a depth of 3623 m was recovered
[3, 4].
In Figure 2 the CO2 concentration in the atmosphere is depicted as a function of
kyr BP (1000 years before present). This graph shows again that the levels of
CO2 in the atmosphere have never been as high as they are at present. The
highest values in Figure 2 are about 100 ppm lower than the present CO2
values.
Those records and observations show the close correlation of temperature and
atmospheric CO2 levels as reported by Barnola et al. [5]. This reveals that
global warming proceeds with increasing CO2 levels in the atmosphere and
should alert humanity to focus on reducing the CO2 emissions and thus achieve
decreasing CO2 values in the atmosphere.
Figure 2: Atmospheric CO2 concentration of the past 400000 years recorded from measurements of the Vostok ice cores, Antarctica [4].
3
1.2. Possibilities of adressing the CO2 problem There are several approaches to reduce atmospheric CO2, which can be
divided in mainly two methods. In the Carbon Capture and Storage approach,
CO2 is captured and afterwards stored for example in geological formations or
in the ocean. In the Carbon Capture and Sequestration approach, the captured
CO2 is recycled to higher energy molecules.
1.2.1. Carbon Capture and Storage In the field of Carbon Capture and Storage (CCS) many technologies are
currently in research and development. A few technologies have already
reached the stage of economic viability but still, most technologies have to be
improved concerning technical capabilities and costs [6].
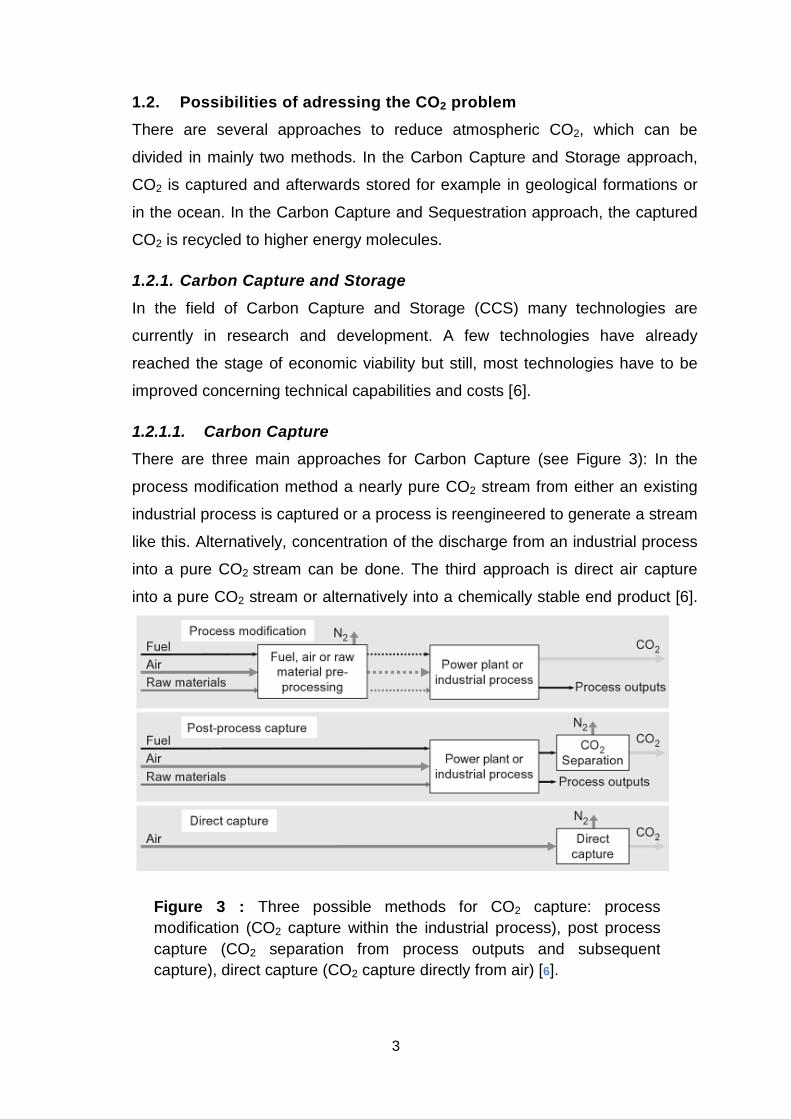
1.2.1.1. Carbon Capture There are three main approaches for Carbon Capture (see Figure 3): In the
process modification method a nearly pure CO2 stream from either an existing
industrial process is captured or a process is reengineered to generate a stream
like this. Alternatively, concentration of the discharge from an industrial process
into a pure CO2 stream can be done. The third approach is direct air capture
into a pure CO2 stream or alternatively into a chemically stable end product [6].
Figure 3 : Three possible methods for CO2 capture: process modification (CO2 capture within the industrial process), post process capture (CO2 separation from process outputs and subsequent capture), direct capture (CO2 capture directly from air) [6].

4
1.2.1.2. Carbon Storage There are several possibilities to store carbon dioxide. In the geological storage
approach, which is currently the most used technique for CO2 storage, direct
injection of Carbon Dioxide into oil-, gas- and water-bearing geological
formations is performed. This method is also utilized on a commercial scale.
Another possibility to store CO2 is ocean storage, which is, however, more
difficult to realize. At the water-surface CO2 is exchanged with the atmosphere
within a time scale of months to years. Therefore the storage has to be done at
great depth to ensure that CO2 is not released back to the atmosphere. A
possibility to achieve long-term storage by direct dissolution is to vent gaseous
CO2 or supercritical fluid at the necessary depth to guarantee dispersal of the
rising plume before it reaches the surface. This model can be realized either
from a fixed pipeline or from a riser appended to a moving ship (See Figure 4).
Figure 4: Ocean Storage. In this CO2 storage approach, CO2 has to be pumped into great depth in the ocean by a fixed pipeline or a ship to make sure that the CO2 will not be released back to the atmosphere [6].
An alternative to the mentioned ocean storage method would be storage of CO2
as a lake of supercritical fluid. This is only feasible if CO2 is injected below the
depth at which it becomes negatively buoyant in seawater, which is in a depth
of about 3000 m [6]. Another method to store CO2 is the storage in terrestrial
ecosystems. The idea of CO2 storage in terrestrial ecosystems is to enhance
natural processes that remove CO2 from the atmosphere, which may be one of
the most cost effective means of reducing atmospheric CO2.Ecosystems which
possess a significant potential for carbon sequestration comprise forest lands,
agricultural lands, deserts and degraded lands. Carbon can be sequestered by
increasing the amount of aboveground biomass in an ecosystem that is for

5
example converting grasslands to forests, as forests contain a big amount of
living biomass. Alternatively, the amount of carbon existing in soils can be
enlarged [7].
1.2.2. Carbon Capture and Utilization Carbon Capture and Utilization is concerned with recycling and conversion of
CO2 to fuels or other valuable organic molecules. Different energies are used to
break the C-O bond in carbon dioxide and convert it into useful products, e.g.
electricity in the electrochemical reduction and light in the photochemical
reduction. There are several possible options which will be discussed briefly in
the following.
G. Olah discusses chemical recycling of CO2 to methanol in his book. Methanol
can be obtained by the reduction of CO2 with H2 gas. The required CO2 can be
isolated from coal- or fossil fuel burning industrial plants or directly from the
atmosphere. However, more efficient methods have to be developed to utilize
CO2 directly from the atmosphere. H2 can be produced by water electrolysis of
sea water. This method would offer a possibility to reach complete
independence of fossil fuel sources. Furthermore, production of methanol out of
CO2 and H2 provides a way to convert the volatile hydrogen gas to a convenient
and safe liquid. Further researches mentioned by G. Olah, focus on
electrochemical and photocatalytic CO2 reduction [8].
In another approach M. Aresta presents possible ways to utilize CO2 as a
building block for higher energy molecules. Potential reaction routes are
depicted in Figure 5. By the routes A and B, carboxylates, carbamates, and
carbonates are obtained by incorporation of the whole CO2molecule. These
reactions have low energy content and occur at room temperature or lower. By
the routes C and D, CO2 is reduced to other C1 or Cn molecules. In comparison
to A and B these reactions require an input of energy [9].

6
Figure 5: Possible routes for CO2 conversion: By the routes A and B, carboxylates, carbamates and carbonates are obtained. By the routes C and D, CO2 is converted to other C1 and Cn molecules. However, in comparison to routes A and B, these reactions require energy and do not occur at room temperature [9].
1.2.2.1. Electrochemical conversion
The reduction of CO2 is performed via one and multi-electron processes. In
electrochemical reduction of carbon dioxide, electrons are provided by electrical
energy. Equation 1 depicts the standard redox potentials of the reduction of CO2
to different products.

7
Equation 1: CO2 reduction reactions and their standard potentials at pH 7 in aqueous solution, versus NHE at 25°C and 1 atm [10].
The electrochemical reduction of CO2 is of special interest, as a carbon neutral
energy cycle can be realized. In this way, CO2 is converted by input of energy to
fuels, which can be burned and energy and CO2 are released again.
The reduction of CO2, however, requires much higher potentials than the
theoretical values in Equation 1. Therefore, to overcome such high
overpotentials and to improve current efficiency and selectivity, catalysts are
utilized. Catalysis in electrochemical processes can be performed
homogenously or heterogeneously. Homogeneous catalysts are in the same
phase as the reaction phase, heterogeneous catalysts are catalyzing reactions
in a different phase. A clear advantage of heterogeneous catalysis is that the
catalyst can be removed from the reaction system after usage and can be
readily reused [10].
Over the last decades a large number of catalysts for electrochemical CO2
reduction have been developed. Especially in the field of transition metal
complexes investigations have been done intensively. The electrocatalytic effect
of Rhenium catalysts for CO2 reduction was first reported by Lehn et al. in 1984
[11]. A great number of transition metal based catalysts were developed, as
reported by Benson et al. and Portenkirchner et al., who present a review of
rhenium and rhodium complexes for electro- and photocatalytic CO2 reduction
[12, 13].
In transition metal complexes, the catalyst center comprises transition metals
based on rhenium, rhodium or ruthenium bound to bipyridine ligands. These
molecules enable stabilization of intermediate states of the CO2 reduction
reaction thereby lowering the required overpotential. Another method for
electrochemical CO2 reduction is presented by Cosnier et al. who used rhenium
catalysts bound to a polypyrrole film on an electrode [14]. The group of Barton-
Cole et al. show the utilization of pyridine alone as catalyst for CO2 reduction
with faradaic efficiencies of 22% [15].

8
Further approaches for electrochemical CO2 reduction have been reported by
the groups of Mizuno et al. [16] who used ultra high temperatures and methanol
as solvent.
1.2.2.2. Photochemical conversion Photochemical CO2 reduction uses light as the energy input for the conversion
of CO2 to higher energy products. Methods inspired by this principle are also
referred to as artificial photosynthesis-methods. In photosynthesis, CO2 and
light is converted via a complex chain of reactions to glucose, starch, oxygen
and water. Recent advances in the field of photochemical CO2 reduction have
been made by Nocera, who has developed a catalyst system to design an
artificial leaf which duplicates the process of photosynthesis [17]. The group of
Gholamkhass et al. report the usage of ruthenium- rhenium- bi- and tetranuclear
complexes for photocatalytic CO2 reduction [18]. Mao et al. present a review of
photocatalytic CO2 reduction over semiconductors [19].
Furthermore, there have also been researches in the field of
photoelectrochemical reduction of CO2, in which the principles of
photochemistry and electrochemistry are combined. T. Arai et al. report the
photoelectrochemical reduction of CO2 to formate by a p-type InP photocathode
modified with an electropolymerised ruthenium complex [ 20 ]. A similar
approach is presented by E. E. Barton et al., who use a p-type GaP
semiconductor electrode with a homogeneous pyridinium ion catalyst for
selective reduction of CO2 to methanol [21].
1.2.2.3. Biological conversion: Usage of bacteria and enzymes for CO2 reduction
In recent works, investigations were made concerning the use of biological
catalysts for CO2 reduction. This approach opens the way to sustainable and
biodegradable methods of CO2 reduction. Several species of bacteria can be
used to turn CO2 into useful chemicals. Ethan I. Lan and James C. Liao [22]
present a way to produce isobutanol, a chemical feedstock and potential fuel,
from cyanobacteria, utilizing CO2 and light. Another example for bacterial CO2
reduction is described by G. Diekert [23]. In this case, homoacetogenic bacteria
where used to convert two molecules of CO2 to acetate. There have also been

9
investigations on combining bacterial and electrochemical CO2 reduction. In this
field M. Kuroda and T. Watanabe [24] report a CO2 reduction to methane or
acetate by immobilized Methanogens and Homoacetogens on electrodes.
Moreover, enzymes also can be used for CO2 conversion to useful chemicals.
In this field, intensive research has been done by M. Aresta, who contributed to
the understanding of the function of carbon monoxide dehydrogenase, which
converts CO2 to CO [25]. He also discovered that 4-OH benzoic acid can be
synthesized from phenol and CO2 using a carboxylase enzyme in aqueous
medium [26].
To reach stability and reusability of enzymes, many immobilization techniques
have been developed. A very widely used technique is entrapment of the
enzymes in a stabilizing matrix. In this field, Heichal-Segal et al. used an
alginate-silicate sol-gel matrix to protect β-Glucosidase against thermal and
chemical denaturation [27]. Immobilization of enzymes by physical adsorption
has been reported by the groups of Kim et al. [28] and Lindgren et al. [29] who
used microcrystalline cellulose and graphite respectively as adsorption
matrices. Other Immobilization techniques include covalent attachment of
enzymes to matrices and affinity immobilization, which is based on the specific
interactions of the enzyme with its stabilizing matrix, which will be described in
more detail below.
For CO2 reduction, dehydrogenases are used. CO2 reduction with
dehydrogenases is already known from biological processes. The utilization of
formate dehydrogenase in solution to reduce CO2 to formate has first been
reported already in 1976 by Ruschig et al. [30] and later by the group of Lu et
al., who achieved an improvement concerning the enzyme stability by
immobilizing formate dehydrogenase in an alginate-silica hybrid gel [31].
Furthermore, methanol production was achieved in a three step reaction with
three dehydrogenases as reported by Obert et al. [ 32]. In each step, one
molecule of the coenzyme nicotinamide adenine dinucleotide (NADH) is
irreversibly oxidized and two electrons are consumed. In the first step of the
reaction, CO2 is reduced to formate, catalyzed by formate dehydrogenase. In
the next step, formate is reduced to formaldehyde, catalyzed by formaldehyde
dehydrogenase and in the last step, formaldehyde is reduced to methanol by
alcohol dehydrogenase (see Figure 6) [32].

10
Figure 6: Enzyme-catalyzed reaction of CO2 to methanol [32].
Dehydrogenases can effectively catalyze these reactions in presence of
suitable electron donors which makes this CO2 reduction feasible.
This work is focused on a combination of enzymatic- and electrochemical CO2
reduction by using dehydrogenases as biocatalysts, which was already reported
in 1994 by Kuwabata et al., who used formate dehydrogenase and methanol
dehydrogenase, whereby methyl viologen or pyrroloquinolinequinone acted as
electron mediators and glassy carbon was used as a working electrode in a
CO2 saturated phosphate buffer solution for formate and methanol production
[33]. Further advances in this field were reached by the group of T. Reda et al.,
who report the reversible interconversion of CO2 and formate by a formate
dehydrogenase adsorbed to a pyrolytic graphite electrode [34].
In comparison to pure electrochemical CO2 reduction, the biocatalyzed CO2
reduction offers great selectivity, as enzymes catalyze only one specific reaction
by binding only to specific substrates. Normally, an enzyme requires a cofactor,
in this case nicotinamide adenine dinucleotide (NADH), which is irreversibly
oxidized during the reaction and delivers two electrons to the enzyme. However,
synthesis and regeneration of NADH is very expensive. Therefore the reason
for using electrochemistry in this process is the purpose to replace the cofactor
or other electron mediators required for an enzymatic reaction by providing the
electrons directly from an electrode. This is realized by immobilizing the enzyme
on an electrode surface as reported by S. Schlager et al. [35].
Using enzymatic catalysis to reduce CO2 offers favorable advantages compared
to using conventional catalysts. Enzyme catalysts are biocompatible and
biodegradable, they show high chemoselectivity, regioselectivity,
diastereoselectivity as well as enantioselectivity, which means that only the
reaction to one selective product is catalyzed.
11
Furthermore, reactions can be performed under relatively mild conditions such
as ambient temperature and pressure. In addition reactions can be carried out
at low temperatures, physiological pH, and mostly in aqueous solution.
When dealing with enzymes, one has to consider several aspects concerning
for example reaction parameters or solvents, which results in more difficult
handling compared to the use of chemical catalysts. Most enzymes only
operate proper if certain conditions with a defined pH range are provided.
Moreover, aqueous solutions as reaction environment are preferred.
Nevertheless, some enzymes also work in organic solvents. To keep the activity
well enzymes should be stabilized in a matrix. The reason therefore is that
every enzyme has a certain folding structure. If this structure is destroyed,
either through mechanical forces, high temperatures, acids or organic solvents,
the enzyme denatures and the function is lost. Sometimes denaturation is
reversible, that is to say, the activity of the enzyme can return, but most of the
time, the full activity of the enzyme cannot be regained. Enzymes can be
protected against thermal and mechanical denaturation by immobilizing them. Immobilization of enzymes results in greater stability and lifetime of the
enzymes and offers a way to reuse these biocatalysts. Thus, the processes can
be designed more cost efficient. A great variety of enzyme immobilization
methods have been reported in the past. Datta et al. present different
immobilization techniques for enzymes [36].
A way to immobilize enzymes is by physical adsorption. In this method, only
weak Van der Vaals interactions, hydrophobic interactions and salt bridges are
built up. For adsorption, either the support for enzyme immobilization is dipped
into enzyme solution or the enzyme is dried on electrode surfaces. Appropriate
materials are for example graphite [29], coconut fibers [37], mesoporous silica
[38] or microcrystalline cellulose [28].
Another possibility for enzyme immobilization is realized by covalent attachment
of the enzymes to a support. The covalent binding of an enzyme to supports
occurs at the amino acid side chains, like arginine, aspartic acid or histidine.
The reactivity is achieved by functional groups, e. g. imidazole, indolyl or
hydroxyl. Using peptide modified supports enables higher specific activity,
stability and a controlled protein orientation [39]. Cyanogen bromide modified
agarose or sepharose containing a carbohydrate moiety and glutaraldehyde as

12
a spacer arm for covalent enzyme immobilization offer a way to make enzymes
thermally stable [40].
Furthermore, affinity immobilization of enzymes can be done. This technique is
based on the specificity of an enzyme with its support under different
physiological conditions. This can be either done by precoupling the matrix to
an affinity ligand for the desired enzyme or by conjugating an enzyme to an
entity which develops an affinity to the matrix. Alkali stable chitosan-coated
porous silica-beads [41] or agarose-linked multilayered concalavin A [42] are
supports which can be used for affinity immobilization of enzymes.
Another method to immobilize enzymes is entrapment in a stabilizing matrix.
The enzyme is catched by covalent or non-covalent bonds in the stabilizing
matrix such as gels or fibers. There is a great variety of materials which can be
used for encapsulation, for example alginate-gelatine-calcium hybrid carriers
[ 43 ], alginate-silica hybrid gels [27], chitosan and chitin carriers [ 44 ].
Entrapment by nanostructured supports like electrospunnanofibers and pristine
materials is also an attractive possibility for enzyme immobilization as it is easily
reproducible and offers good mechanical stability [45]. Moreover, polypyrrole
can be used as entrapment matrix for enzymes, reported by Swann et al. [46].
To conduct an enzymatic reaction successfully, the biological function of
enzymes have to be understood. Therefore, informations about enzymes and
enzymatic reactions will be discussed in more detail in the following.
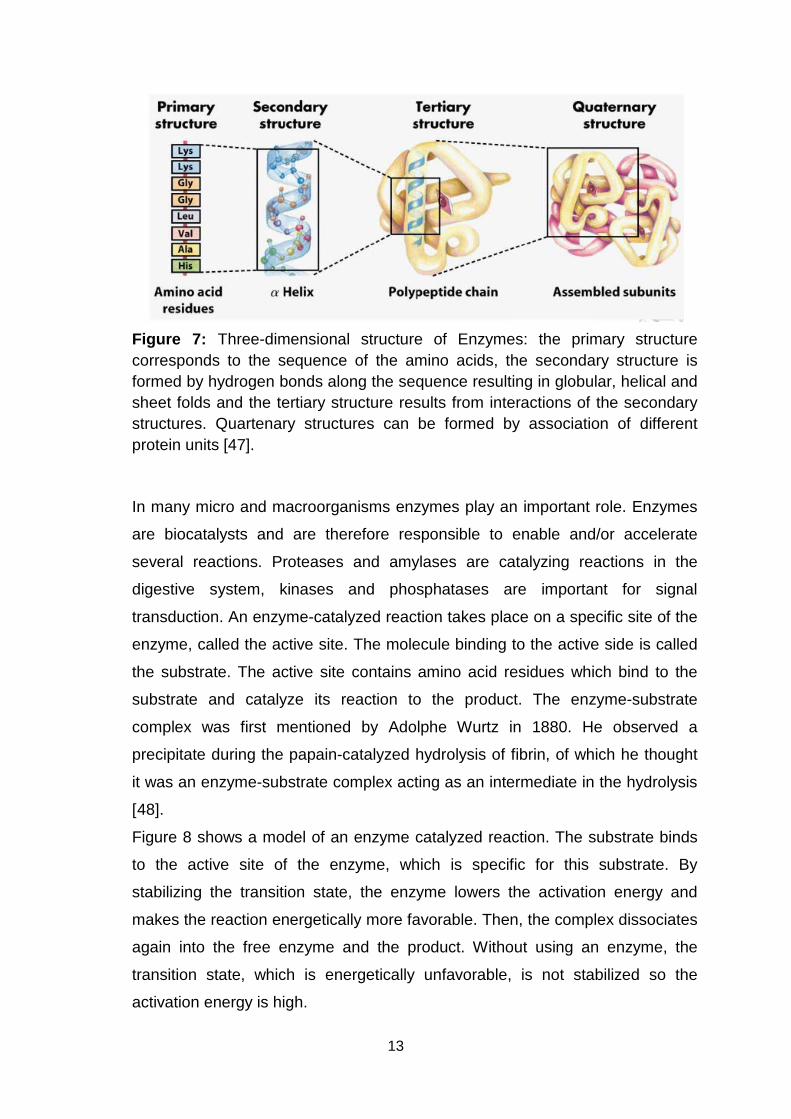
Most enzymes consist of a proteinic backbone and an active site like a metal
center. The primary structure of a protein corresponds to the sequence of
covalently linked amino acids. Along the sequence globular, helical and sheet
folds based on hydrogen bonding, resulting in the secondary structures, are
formed. Tertiary structures are formed by the interactions of secondary
structures like forming salt bridges and hydrophobic interactions. For every
individual enzyme, this structure is specific and determines its activity. In some
cases quaternary structures are formed by non-covalent interactions of multiple
enzyme subunits (see Figure 7) [47].
13
Figure 7: Three-dimensional structure of Enzymes: the primary structure corresponds to the sequence of the amino acids, the secondary structure is formed by hydrogen bonds along the sequence resulting in globular, helical and sheet folds and the tertiary structure results from interactions of the secondary structures. Quartenary structures can be formed by association of different protein units [47].
In many micro and macroorganisms enzymes play an important role. Enzymes
are biocatalysts and are therefore responsible to enable and/or accelerate
several reactions. Proteases and amylases are catalyzing reactions in the
digestive system, kinases and phosphatases are important for signal
transduction. An enzyme-catalyzed reaction takes place on a specific site of the
enzyme, called the active site. The molecule binding to the active side is called
the substrate. The active site contains amino acid residues which bind to the
substrate and catalyze its reaction to the product. The enzyme-substrate
complex was first mentioned by Adolphe Wurtz in 1880. He observed a
precipitate during the papain-catalyzed hydrolysis of fibrin, of which he thought
it was an enzyme-substrate complex acting as an intermediate in the hydrolysis
[48].
Figure 8 shows a model of an enzyme catalyzed reaction. The substrate binds
to the active site of the enzyme, which is specific for this substrate. By
stabilizing the transition state, the enzyme lowers the activation energy and
makes the reaction energetically more favorable. Then, the complex dissociates
again into the free enzyme and the product. Without using an enzyme, the
transition state, which is energetically unfavorable, is not stabilized so the
activation energy is high.

14
Figure 8: Principle of an enzyme-catalyzed reaction: The enzyme binds to a specific substrate, it stabilizes the energetically unfavorable transition state thereby lowering the activation energy of the reaction. Then, the specific product dissociates from the enzyme [47].
Enzymes do not affect the equilibrium of a certain reaction. They can only
enhance the reaction rate by lowering the activation energy of the transition
state.
Figure 9 compares the activation energy of an uncatalyzed (black) reaction with
the activation energy of an enzyme-catalyzed (blue) reaction [47].
Figure 9: Comparison of energy diagrams of an enzyme-catalyzed reaction (blue curve) with an uncatalyzedreaction (black curve). It is apparent that the enzyme-catalyzed reaction has a much lower activation energy as opposed to the uncatalyzed reaction [47].
It is important in enzyme-catalyzed reactions to keep in mind the kinetics of the
reactions. The limiting factor which affects the rate of an enzyme-catalyzed
reaction is the concentration of substrate [S]. As substrate is needed to form the

15
enzyme-substrate complexes, enough substrate must be provided. However, at
a certain concentration of substrate, the initial velocity V0 of an enzymatic
reaction does not increase anymore and a maximum velocity is reached. The
dependence of the initial rate from different substrate concentrations is
illustrated in Figure 10.
Figure 10: Dependence of initial velocity on substrate concentration: At low substrate concentrations [S], there is an almost linear increase of the initial velocity V0 with increasing [S]. At high [S], however, V0 does not rise any more, which means that the maximum velocity Vmax is reached [47].
At low concentrations of substrate, the initial velocity increases almost linearly
with increasing [S]. At high substrate concentrations, the increase in initial
velocity in response to increasing [S] gets smaller until V0 does not rise
anymore. This velocity is called the maximum velocity Vmax. This plateau was
first observed by Henri [49].
The kinetic model which was developed by L. Michaelis and M. Menten in 1913
provides an explanation of this effect. They propose that the enzyme and the
substrate form an enzyme-substrate complex ES in a fast, reversible step. This
complex breaks down in the slow second step into the free enzyme E and the
product P (see Figure 11).

16
Figure 11: Reaction scheme of an enzyme-catalyzed reaction: The enzyme and the substrate are forming the Enzyme-Substrate complex, which is followed by the dissociation of the complex into free enzyme and the product.
The reaction rate is proportional to the concentration of ES, being the species
which reacts in the slowest step. At low substrate concentration most of the
enzyme is in its free form E. The reaction rate is proportional to the substrate
concentration [S] as the equilibrium of the reaction is pushed to the formation of
ES as [S] gets bigger.
The maximum initial rate is reached when all enzymes have already formed the
ES complex, the enzyme is saturated with the substrate and further increase in
substrate concentration does not affect the reaction rate any more, which can
be seen in Figure 10.
The graph describing the relationship between [S] and the initial velocity of the
reaction V0 is similar for most enzymes, which can be mathematically described
by the Michaelis-Menten equation (Equation 5) [47].
V0= Vmax [S]Km+[S]
(5)
[S]…Substrate concentration
V0…Initial velocity
Vmax…Maximum velocity
Km…Michaelis constant
2. Materials and Methods In the first part, a carbonfelt (CF) electrode covered with an alginate layer
modified with the three dehydrogenases was fabricated to produce methanol
from a CO2 saturated buffer-electrolyte solution. In preliminary experiments it has
already been shown that this process was working for the first reaction step from
CO2 to formate.

17
In the second part, other electrode materials (Platinum, Graphite) and
immobilization techniques were investigated for function, efficiency and stability.
For this purpose, only the first step of CO2 reduction to formate catalyzed by
formate dehydrogenase was performed for simplicity and cost reasons.
2.1. Chemicals Formate Dehydrogenase from Candida boidinii (FateDH) (lyophilized powder, 5.0
– 15.0 units / mg protein), Formate Dehydrogenase from Candida boidinii, (liquid
(clear) ~ 50 u/ml), Formaldehyde Dehydrogenase, from Pseudomonas sp.,
(FaldDH) (lyophilized powder, 1.0 – 6.0 units / mg solid), Alcohol Dehydrogenase,
from Saccharomyces cerevisiae (ADH) (activity ≥ 300 units / mg protein), Alginic
acid sodium salt, from brown algae (Alginate), Tetramethylorthosilicate, reagent
grade, 98 % (TEOS), Pyrrole, reagent grade, 98 % and
Tetrabutylammoniumhexafluorophosphate (TBAPF6) were purchased from
Sigma Aldrich.
Trizma® base, also purchased from Sigma Aldrich, was used to prepare 0.05 M
buffer solution which was adapted to pH 7.64 with HCl.
All chemicals were used as received.
2.2. Apparatus Electrochemical measurements were carried out on a Jaissle Potentiostat-
Galvanostat IMP 88 PC-100. Formate was detected on an ICS-5000 Dionex-DC
Capillary Ion Chromatograph with an IonPac® AS19 Analytical Column from
Thermo Scientific. Methanol was detected on a TRACE 1310 Gas
Chromatograph from Thermo Scientific. Microscopic Measurements were done
with Nikon ECLIPSE LV 100 ND optical microscope.
For electrochemical measurements, a standard three electrode system with
separate cathodic and anodic chambers (two compartment cell) shown in Figure
12 was used. For electropolymerisation of pyrrole, a one compartment setup was
used.

18
Figure 12: Experimental setup: electrochemical two compartment cell with different enzyme- modified electrodes as working electrodes (WE), platinum foil as counter electrode (CE) and Ag/AgCl/3M KCl as reference electrode (RE). 0.05 M Trizma®buffer, pH adjusted to 7.64 with HCl is used as electrolyte solution.
2.3. CF/Alginate/FateDH/FaldDH/ADH – Electrodes 2.3.1. Fabrication of CF/Alginate/FateDH/FaldDH/ADH-Electrodes The alginate suspension for immobilizing the enzymes was prepared as
reported from the group of Lu et al. [31]. 0.2 g Alginic Acid Sodium Salt, 1.0 mL
Tetraethyl orthosilicate (TEOS) and 3.0 ml 18 MΩ water were mixed to a
homogeneous suspension. About 5 mg of FateDH, Formaldehyde
Dehydrogenase (FaldDH) and Alcohol Dehydrogenase (ADH) were dissolved in
1 ml 0.05 M TRIS-HCl, pH 7.64 and added to the suspension. A carbonfelt (CF)
Electrode of about 7.5 cm2 surface was soaked in the enzyme suspension for 2-
3 min and subsequently dipped in 0.2 M CaCl2 for 30 min to achieve
congelation. In Figure 13, a CF/Alginate electrode containing three different
dehydrogenases is shown.

19
2.3.2. Characterization of CF/Alginate/FateDH/FaldDH/ADH-Electrodes The characterization of the CF/Alginate/FateDH/FaldDH/ADH Electrode was
performed with a three electrode setup shown in Figure 12. Platinum foil was
used as a counter electrode. 0.05 M TRIS-HCl, pH 7.64 served as electrolyte.
To remove oxygen, the system was purged with N2. The electrode was cycled
between 0.3 V and - 1.6 V vs. a Ag/AgCl reference electrode with a scan rate
of 50 mV/s. Characterization was repeated in a CO2 purged system to
investigate the CO2 reduction ability of the electrode. For saturation, purging
times of about 15 min were chosen.
2.3.3. Electrolysis with CF/Alginate/FateDH/FaldDH/ADH-Electrodes Electrolysis was carried out at -1.2 V and -1.6 V for 1.5 h after the system had
been purged for 30 min with CO2. Samples taken before and after electrolysis
were analyzed by Liquid Gas Chromatography for methanol analysis. For
reference measurements, electrolysis was done with CF/Alginate electrodes
without enzymes and with a blank carbonfelt electrode.
2.4. Pt/PPy/Alginate/FateDH – Electrodes 2.4.1. Fabrication of Pt/PPy/Alginate/FateDH-Electrodes Pyrrole was electropolymerised potentiodynamically on a platinum electrode.
Platinum foil was used as counter electrode and Ag wire coated with AgCl as
Figure 13: Carbonfelt Electrode covered with Enzyme - Alginate layer.

20
quasi-reference electrode. 625 µLPyrrole monomer and 18 mL 0.1 M
Tetrabutylammoniumhexafluorophosphate (TBAPF6) in acetonitrile served as
polymerisation solution. The system was scanned between 0.9 V and -0.8 V
with 100 mV/s for the duration of 70 cycles. The fabricated Pt/Polypyrrole (PPy)
electrode was entirely coated with Alginate/FateDH suspension produced as
indicated in 2.3.1. and dipped in 0.2 M CaCl2 for 30 min.
Figure 14 depicts a Pt/PPy/Alginate/FateDH electrode.
2.4.2. Characterization of Pt/PPy/Alginate/FateDH Electrodes The characterization of the Pt/PPy/Alginate/FateDH Electrode was performed as
mentioned in 2.3.2. The electrode was cycled between 0.3 V and -1.8 V vs. Ag/AgCl.
2.4.3. Electrolysis with Pt/PPy/Alginate/FateDH Electrodes Electrolysis was performed at -1.6 V for 1.5 h after the system had been purged
for 30 min with CO2. Furthermore, electrolysis was done at -1.4 V. Samples
taken before and after electrolysis were analyzed by Capillary Ion
Figure 14: Platinum Electrode covered with a film of polypyrrole and an Alginate - Enzyme layer.

21
Chromatography for formate analysis. For reference measurements, electrolysis
was done with a Pt/PPy/Alginate electrode without enzyme.
2.5. Pt/PPy/FateDH – Electrodes 2.5.1. Fabrication of Pt/PPy/FateDH - Electrodes
The electrodes were made as reported by Swann et al. [46]. The platinum
electrodes were cleaned by flaming and afterwards cycled between -0.2 V and
+ 1.2 V in nitrogen bubbled 0.5 M aqueous H2SO4. The cleaned electrode was
rinsed with 18 MΩ water. Then the electrode was dipped in 2-3 mg / mL FateDH
solution and immediately after immersion (1 – 2 s) the adsorption potential of +
0.5 V vs. Ag/AgCl was applied for 10 min. Within 20 s after adsorption, the
electrode was transferred into the polymerisation solution (0.1 M pyrrole, 0.1 M
KCl, pH 3) and the polymerisation potential of + 0.7 V was applied for 60 s for
potentiostaticelectropolymerisation. After polymerisation the electrode was
rinsed with 18 MΩ water.
In Figure 15, a picture of the Pt/PPy/FateDH electrode is shown.
2.5.2. Characterization of Pt/PPy/FateDH - Electrodes The characterization of the Pt/PPy/FateDH Electrode was performed as
mentioned in 2.3.2. The electrodes were cycled between + 0.3 V and -1.8 V vs.
Ag/AgCl.
Figure 15: Platinum electrode covered with a thin layer of polypyrrole with incorporated enzyme.

22
2.5.3. Electrolysis with Pt/PPy/FateDH - Electrodes Electrolysis was carried out as described in 2.2. A voltage of – 1.8 V was
applied for a duration of 2 h. Furthermore, electrolysis at – 1.4 V was
investigated.
Samples taken before and after electrolysis were analyzed by capillary ion
chromatography for formate analysis.
For reference measurements electrolysis with Pt/PPy electrodes without
enzyme was conducted.
2.6. Physical Adsorption of FateDH on Graphite Rods 2.6.1. Production of Graphite/FateDH Electrodes FateDH was immobilized on Graphite rods according to Lindgren et al. [29].
Graphite with about 2.9 cm2 surface area was polished with wet fine emery
paper and then sonicated for 30 s to remove excess graphite particles.
Afterwards, the electrode was dried with a paper towel and 10 mg FateDH
dissolved in 40 µL 0.05 M Tris-HCl buffer, pH 7.64 was dropped on the graphite
surface. After 30 min drying at room temperature, the electrode was transferred
into a glass beaker, covered with sealing film and stored for 2 h at 4 °C to allow
the immobilization proceed. Then, the electrode was rinsed with 18 MΩ Water.
Furthermore, following modifications of the given procedure were investigated:
- FateDH solution was dropped onto the graphite surface. Afterwards the
electrode was kept in the solution for 20 min, dried for 30 min at room
temperature. Additionally, the graphite surface was not polished before
adsorption.
- The adsorption was carried out 2 h at room temperature, while the electrode
was still kept in the FateDH solution. Subsequently, the electrode was dried over
night at room temperature in a desiccator over silica gel.
The rest of the process was in both cases performed as stated by Lindgren et
al. [29].
- The immobilization process was carried out by using 0.4 mL FateDH, liquid
(clear), ~ 50 u/ml instead of the lyophilized powder.
2.6.2. Characterization of Graphite/FateDH Electrodes

23
Characterization of the Graphite/FateDH electrodes was carried out as described
in 2.3.2. The electrodes were cycled between 0.3 V and – 1.4 V vs. Ag/AgCl.
2.6.3. Electrolysis with Graphite/FateDH Electrodes After the system had been purged for 30 min with CO2, a voltage of – 1.4 V was
applied for 1.5 h. Furthermore, electrolysis was performed at – 1.0 V for 1.5 h.
Samples taken before and after electrolysis were analyzed by Capillary Ion
Chromatography for formate analysis. For reference measurements, electrolysis
with a blank graphite rod was carried out.
3. Results and Discussion 3.1. CF/Alginate/FateDH/FaldDH/ADH – Electrodes
3.1.1. Characterization of CF/Alginate/FateDH/FaldDH/ADH electrodes Cyclic voltammograms (CV) of carbonfelt electrodes modified with an alginate
layer containing three different dehydrogenases
(CF/Alginate/FateDH/FaldDH/ADH) were recorded at different negative sweeping
potentials to figure out the most suitable one for CO2 reduction to methanol.
Potentials of -0.6 V, -1.2 V and -1.6 V vs. Ag/AgCl were examined.
Figure 16 and Figure 17 show the CVs of a CF/Alginate/FateDH/FaldDH/ADH
electrode recorded in a N2 purged system and in a CO2 purged system at
negative sweeping potentials of -1.2 V and -1.6 V. The black curves depict the
CV recorded in a N2 purged system, the red curves show the CV recorded in a
CO2 purged system. The reductive current for CO2 reduction starts to increase
at about -0.4 V. At -1.2 V an increase in the reductive current of about 0.3 mA
for the CO2 purged system in comparison to the N2 purged system is observed.
Comparison of CVs at -1.2 V and -1.6 V shows the same difference in current
density between curves of the N2 and curves of the CO2 purged systems.
However, the current densities are more than four times higher for the CVs with
a negative sweep potential of -1.6V.
Further, CVs were recorded for another negative sweeping potential of -0.6 V,
which, however do only show a slight increase in reductive current for CO2
reduction and small current densities not sufficient for methanol production.
From the theoretical point of view, CO2 reduction to methanol occurs at -0.38 V
vs. NHE, which is about -0.6 V vs. Ag/AgCl. For CO2 reduction at the

24
CF/Alginate/FateDH/FaldDH/ADH electrode obviously a significant overpotential
is required, which is due to a low conductivity of the alginate layer. Moreover, it
is assumed that the thickness of the alginate layer also influences CO2
reduction.
Figure 16: CVs of a CF/Alginate/FateDH/FaldDH/ADH electrode. Comparison of the CV recorded in the N2 purged system (black curve) to the CV recorded in the CO2 purged system (red curve) with increase in reductive current for the CO2 purged system starting at about -0.6 V.

25
Figure 17: CVs of a CF/Alginate/FateDH/FaldDH/ADH electrode at a negative sweeping potential of -1.6 V. The black curve shows the CV of the N2 purged system, the red curve displays the CV recorded in a CO2 purged system. The increase in reductive current for the CO2 purged system starts at about -1.2 V.
Figure 18 shows the CVs of a pristine CF/Alginate electrode without enzyme
modification in N2 and CO2 saturated systems. For this electrode, an increase in
reductive current for the CO2 purged system can be observed as well. However,
methanol production was only observed for CO2 reduction using enzyme
modified electrodes. We assume that the increase in reductive current using the
pristine electrode is attributed to side reactions, such as water splitting, as there
is also an increase after N2 purging.
From the CVs above the potentials for the electrolysis experiments was set at -
1.2 V and -1.6 V. Electrolysis at the lower potential of -1.2 V is favored due to
avoidance of side reactions and therefore concerning faradaic efficiency of
methanol production.

26
Figure 18: CVs of a CF/Alginate electrode without enzyme modification recorded in a N2 purged system (black curve) and in a CO2 purged system (red curve) at a negative sweeping potential of -1.2 V vs. Ag/AgCl. There is an increase in reductive current for the CV measured in the CO2 purged system relative to the CV measured in the N2 purged system.
In Figure 19 the CVs of a blank CF electrode recorded in a N2 purged system
and a CO2 purged system, respectively, at a negative sweeping potential of -
1.2 V are compared. The current densities of the CVs of the blank CF electrode
are in a similar range as in the CVs of the CF/Alginate/FateDH/FaldDH/ADH
electrode (see Figure 16). An increase in reductive current for the N2 purged
system and an even slightly higher reductive current for the CO2 purged system
is observed. However, as for CF/Alginate electrodes, no methanol could be
detected, indicating that other CO2 reduction reactions, which were not
investigated in this work, are occurring at this electrode at this potential.

27
Figure 19: Comparison of CVs of a blank CF electrode at a negative sweeping potential of -1.2 V vs. Ag/AgCl. The black curve shows the N2 purged system, the red curve shows the CO2 purged system. An increase in reductive current for the CO2 purged system can be seen.
Electrolysis with the CF/Alginate/FateDH/FaldDH/ADH electrode at -1.2 V yielded
0.12 mmol/L methanol. Electrolysis experiments using CF and CF/Alginate
electrodes, carried out for reference, did not deliver methanol, as reported
above.
3.1.2. Electrolysis with CF/Alginate/FateDH/FaldDH/ADH electrodes Figure 20 depicts the current-time curves which were recorded during
electrolysis at -1.6 V with a CF/Alginate/FateDH/FaldDH/ADH electrode and with
electrodes without enzyme modification. The assumption was made, that the
enzymes in the CO2 purged system result in a suppression of water splitting
and therefore enable high faradaic efficiency, which will be discussed below.
However, the current-time curves of the enzyme modified electrode shown in
Figure 20 cannot be used to reinforce this presumption, as the carbonfelt was
not fully coated with alginate-enzyme gel therefore allowing water splitting to
occur more dominantly. It can be seen that the current of the blank carbonfelt
electrode and of the CF/Alginate electrode are much lower than the current of

28
the enzyme modified electrode. The current-time curve of the enzyme modified
electrode depicted in Figure 21 shows a much lower current flowing during
electrolysis, and presumably most of the current was used for methanol
production and only little water splitting was occurring.
Figure 20: Current-time curves of a CF/Alginate/FateDH/FaldDH/ADH and a blank carbonfelt electrode as well as of a CF/Alginate electrode. The current of the enzyme modified electrode is much higher than the current of the blank electrodes because the enzyme modified electrode was not fully covered with alginate gel thereby allowing more water splitting.

29
Figure 21: Current-time curve of a CF/Alginate/FateDH/FaldDH/ADH electrode recorded during electrolysis at -1.2 V in a CO2 purged system.
In Figure 22, the gas chromatograms of the electrolyte solutions after
electrolysis with the CF/Alginate/FateDH/FaldDH/ADH electrode at -1.2 V and -
1.6 V are shown.
The peak at 2.06 min was identified as methanol by external standard
calibration. The methanol peak is growing with higher potential used for
electrolysis. The peak close to the retention time of methanol at 2.02 min is
attributed to a side product which could not be identified yet.
During 1.5 h electrolysis at -1.2 V, 0.12 mmol/L methanol, corresponding to a
faradaic efficiency of about 90% were produced. The potential of -1.2 V is
favored for electrolysis because at higher negative potentials the increase of
current density for CO2 reduction is not higher. (See Figure 16 and Figure 17)
Electrolysis was further investigated at -1.6 V, where water splitting occurred at
a higher rate, which resulted in very low faradaic efficiency of about 6%
compared to electrolysis at -1.2 V. Further, electrolysis was carried out with a
CF/Alginate electrode without enzyme modification and with a blank CF
electrode for reference measurements. Nevertheless, methanol was only
detected after electrolysis with the enzyme-modified electrode.

30
Figure 22: Gas chromatogram of the electrolyte solutions after electrolysis at -1.2 V and at -1.6 V for 1.5 h. Methanol elutes at 2.06 min. The methanol peak is growing with higher potential used for electrolysis. The peak at 2.02 min is attributed to a side product and could not be identified yet.
Figure 23 show the gas chromatogram of the electrolyte solution after
electrolysis at -1.6 V with a blank CF/Alginate electrode without enzyme
modification conducted for reference. It can be seen that the methanol peak
does not grow after electrolysis with the electrode without enzyme modification,
so no methanol was produced with this blank electrode. There is already a
methanol peak before electrolysis because methanol was still on the
chromatography column from measurements before.

31
Figure 23: Gas chromatogram recorded after electrolysis at -1.6 V with a CF/Alginate electrode without enzyme modification. The peak at 2.06 min, corresponding to methanol, has not grown during electrolysis. The reason for the peak which is present is that there was still methanol on the chromatography column from measurements before.
3.1.3. Faradaic efficiency of Methanol production at CF/Alginate/FateDH/FaldDH/ADH electrodes
Duration of Electrolysis: 1.5 h = 5400 s
Mean electric current flow during electrolysis: - 2.96 . 10-4 A
The amount of charge is defined by the product of electric current and time of
electrolysis:
Q = I ∙ t = 2.96 ∙ 10-4 A ∙ 5400 s = 1.60 A s = 1.60 C (10)
Q…amount of charge[C]
I…electric current [A]
t…time [s]
The number of moles provided for the reaction can be calculated by dividing the
charges with the faradaic constant F = 96485 C/mol
32
X = QF
= 1.6 C
96485 Cmol
= 1.66 ∙ 10-5 moles of electrons (11)
According to the reaction equation for CO2 reduction to methanol, the
production of each mole of Methanol requires six electrons:
CO2 + 6 H+ + 6 e- CH3OH + H2O (12)
nth= 1.66 ∙ 10-5 moles of electrons6 e- = 2.76 ∙ 10-6 moles (13)
nth…theoretical amount of methanol [mol]
By dividing the practical amount of methanol by the theoretical maximum
amount, the faradaic efficiency 𝜂F is obtained:
ηF= nMeOHnth
= 2.4 ∙ 10-6 mol
2.8 ∙ 10-6 mol= 86 % (14)
ηF…faradaic efficiency [-]
nMeOH…produced amount of methanol [mol]
nth…theoretically achievable amount of methanol [mol]
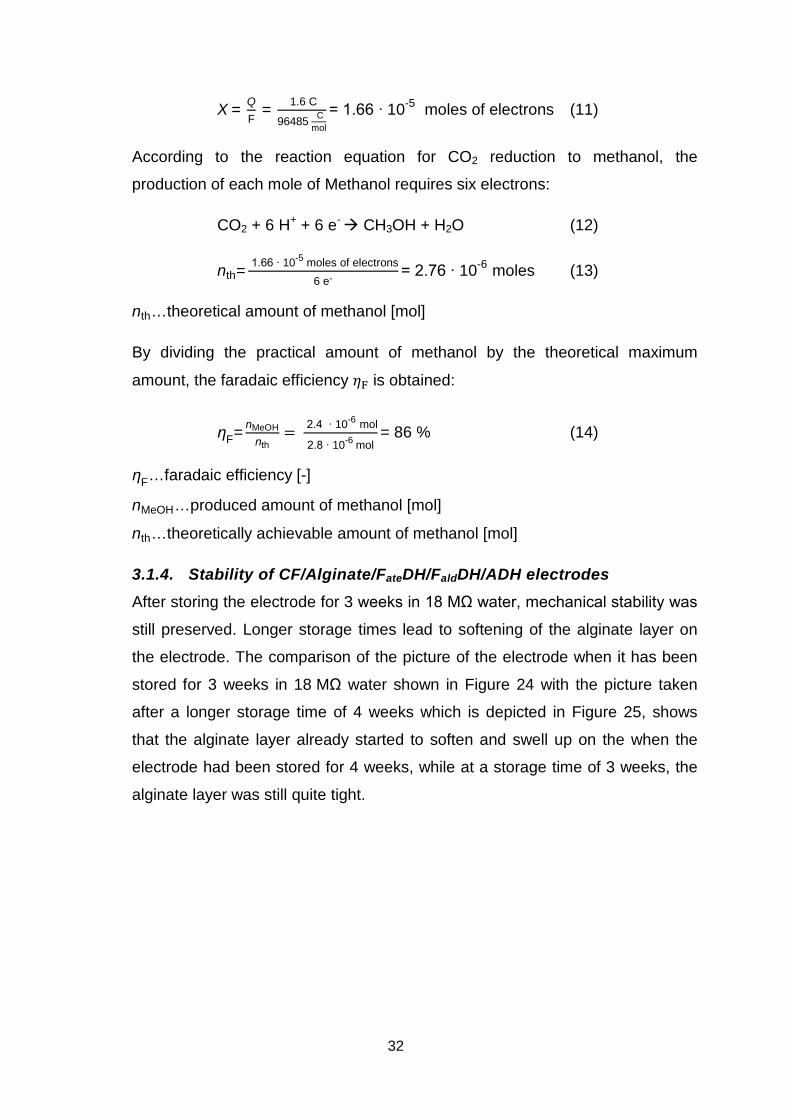
3.1.4. Stability of CF/Alginate/FateDH/FaldDH/ADH electrodes After storing the electrode for 3 weeks in 18 MΩ water, mechanical stability was
still preserved. Longer storage times lead to softening of the alginate layer on
the electrode. The comparison of the picture of the electrode when it has been
stored for 3 weeks in 18 MΩ water shown in Figure 24 with the picture taken
after a longer storage time of 4 weeks which is depicted in Figure 25, shows
that the alginate layer already started to soften and swell up on the when the
electrode had been stored for 4 weeks, while at a storage time of 3 weeks, the
alginate layer was still quite tight.

33
Figure 24: CF/Alginate/FateDH/FaldDH/ADH electrode after 3 weeks storage in 18 MΩ water.
Figure 25: CF/Alginate/FateDH/FaldDH/ADH electrode after 4 weeks storage in 18 MΩ water.
3.2. Pt/PPy/Alginate/FateDH Electrodes 3.2.1. Characterization of Pt/PPy/FateDH electrodes The platinum electrode covered with a polypyrrole film and an alginate layer
modified with FateDH (Pt/PPy/Alginate/FateDH) was characterized by recording
CVs at negative sweeping potentials of -1.4 V, -1.6 V and -1.8 V vs. Ag/AgCl to
find out the optimal potential for CO2 reduction to formate.
Figure 26 and Figure 27 display the CVs of a Pt/PPy/Alginate/FateDH electrode
recorded in a N2 purged system (black curve) and in a CO2 purged system (red

34
curve) at negative sweeping potentials of -1.4 V and -1.6 V. At -1.4 V, the
reductive current of the CO2 purged system is about 0.15 mA higher than the
current in the N2 purged system. However, at -1.6 V the increase in current for
the reduction of CO2 is even higher with more than 0.4 mA, which is why this
should be a decent potential for CO2 reduction to formate.
In both CVs, the reductive current for the CO2 purged system relative to the N2
purged system starts to increase at about -1.1 V.
Figure 26: CVs of a Pt/PPy/Alginate/FateDH electrode at a negative sweeping potential of -1.4 V vs. Ag/AgCl. Comparison of the CVs recorded in the N2 purged system (black curve) and in the CO2 purged system (red curve) with increase in reductive current for the CO2 purged system at -1.1 V.

35
Figure 27: CVs of a Pt/PPy/Alginate/FateDH electrode at a negative sweeping potential of -1.6 V vs. Ag/AgCl. The CVs measured in the N2 purged system (black curve) and the CVs recorded in the CO2 purged system (red curve) are compared. A significant increase in reductive current for the CO2 purged system can be seen starting at about -1.1 V.
The characterization of the Pt/PPy/Alginate/FateDH to a negative sweeping
potential of -1.8 V did not result in a higher difference in reductive current
between CVs recorded in N2 and CO2 purged system, compared to other
potentials.
In Figure 28 the CVs of a Pt/PPy/Alginate electrode without enzyme
modification are depicted. It is apparent that there is a small increase in
reductive current in the CV recorded in the CO2 purged system in comparison to
the CV recorded in the N2 purged system. This is presumably because of other
CO2 reduction reactions catalyzed by the electrode, which where, however, not
investigated in this work, as reported above.
When the CVs of the electrode with formate dehydrogenase modification (see
Figure 27) are compared to the CVs of the blank electrode shown in Figure 28,
it is obvious, that the difference in reductive current is about four times higher
for the system with enzyme modification.

36
Figure 28: CVs of a platinum electrode modified with a polypyrrole film and an alginate layer without enzyme at a negative sweeping potential of -1.6 V. Comparison of CVs of the N2 purged system (black curve) with the CO2 purged system (red curve). A small increase in reductive current for the CO2 purged system can be seen.
Electrolysis experiments with a Pt/PPy/Alginate/FateDH electrode at -1.6 V
delivered 0.44 mmol/L formate. After electrolysis at lower or higher potentials,
no formate could be detected in spite of the reductive current for the CO2
purged systems which can be seen in the CVs. Further, significant amounts of
formate could not be detected after electrolysis with electrodes without enzyme
modification carried out for reference.
In theory, the potential for CO2 reduction to formate is -0.61 V vs. NHE, which is
about -0.8 V vs. Ag/AgCl. However, the potential used for electrolysis is much
higher, because electrolytic resistance and resistance of the alginate layer have
to be taken into account. The overpotential is even higher when using
Pt/PPy/Alginate/FateDH electrodes as opposed to the
CF/Alginate/FateDH/FaldDH/ADH electrodes as the alginate layer is thicker and
the surface area is not as big as in the case of carbonfelt.
37
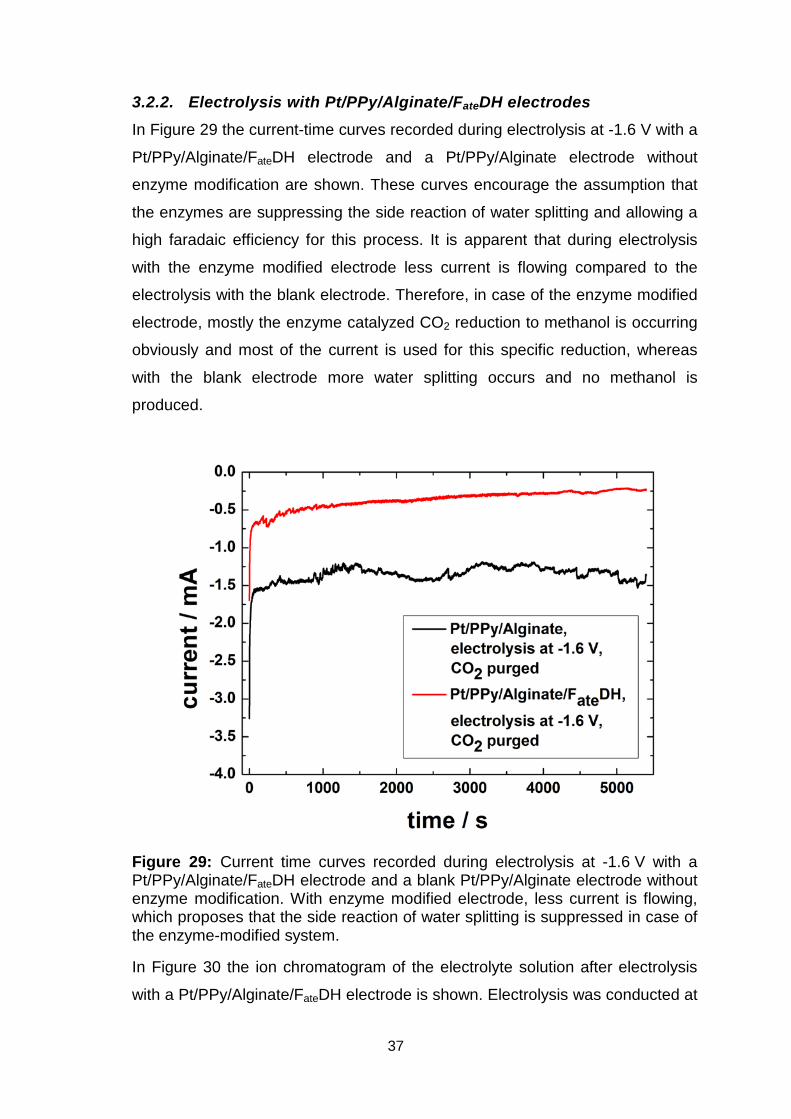
3.2.2. Electrolysis with Pt/PPy/Alginate/FateDH electrodes In Figure 29 the current-time curves recorded during electrolysis at -1.6 V with a
Pt/PPy/Alginate/FateDH electrode and a Pt/PPy/Alginate electrode without
enzyme modification are shown. These curves encourage the assumption that
the enzymes are suppressing the side reaction of water splitting and allowing a
high faradaic efficiency for this process. It is apparent that during electrolysis
with the enzyme modified electrode less current is flowing compared to the
electrolysis with the blank electrode. Therefore, in case of the enzyme modified
electrode, mostly the enzyme catalyzed CO2 reduction to methanol is occurring
obviously and most of the current is used for this specific reduction, whereas
with the blank electrode more water splitting occurs and no methanol is
produced.
Figure 29: Current time curves recorded during electrolysis at -1.6 V with a Pt/PPy/Alginate/FateDH electrode and a blank Pt/PPy/Alginate electrode without enzyme modification. With enzyme modified electrode, less current is flowing, which proposes that the side reaction of water splitting is suppressed in case of the enzyme-modified system.
In Figure 30 the ion chromatogram of the electrolyte solution after electrolysis
with a Pt/PPy/Alginate/FateDH electrode is shown. Electrolysis was conducted at

38
-1.4 V and -1.6 V. From samples after electrolysis at -1.4 V, no formate could be
detected. Only during the electrolysis at -1.6 V formate was produced.
0.44 mmol/L formate, corresponding to a faradaic efficiency of 85%, were
detected after electrolysis at -1.6 V for 1.5 h. Formate eluted at 6.3 min and was
identified by comparison with an external standard calibration with formate
standards of different concentrations. After electrolysis with a Pt/PPy/Alginate
electrode without enzyme modification carried out for reference, no significant
amounts of formate could be detected, which is shown in Figure 31. The peaks
from 5.0 min to 5.9 min correspond to fluoride and acetate, which are impurities
from the environment and from laboratory equipment used to inject the samples
into the ion chromatograph.
Figure 30: Ion chromatogram of the electrolyte solution after electrolysis at -1.6 V for 1.5 h showing a formate peak at 6.3 min. The peaks from 5.0 min to 5.9 min correspond to fluoride and acetate, which are contaminants from the environment and from laboratory equipment.

39
Figure 31: Ion chromatogram of the electrolyte solution after electrolysis at -1.6 V with a blank Pt/PPy/Alginate electrode without enzyme modification carried out for reference. No significant amounts of format were detected.
3.2.3. Faradaic efficiency of formate production at Pt/PPy/Alginate/FateDH electrodes
The faradaic efficiency was calculated analogously to 3.1.3. The moles of
electrons were divided by 2, because formate production out of CO2 is a 2
electron process.
CO2 + H+ + 2 e- HCOO-
Duration of Electrolysis: 1.5 h = 5400 s
Mean electric current flow during electrolysis: - 3.66 . 10-4 A
Q = I ∙ t = 3.66∙10-4 A ∙ 5400 s = 1.98 A s = 1.98 C
X = QF
=1.98 C
96485 Cmol
= 2.05 ∙ 10-5 moles of electrons
nth= moles of electrons
2e- = 2.05∙10-5mol e-
2e- = 1.03 ∙ 10-5 moles

40
ηF= nHCOO-
nth=
8.80 ∙ 10-6 mol1.03 ∙ 10-5 mol
= 85 %
3.2.4. Stability of Pt/PPy/Alginate/FateDH electrodes The stability of platinum electrodes coated with a polypyrrole film and a FateDH-
modified alginate layer is rather low. During electrolysis sometimes cracks on
the electrode surface were formed, which is depicted in Figure 32. The alginate
gel does not stick very tightly to the polypyrrole surface which results in
instability in opposition to the carbonfelt electrodes, where a large sponge-linke
surface is provided for adherence of the alginate gel.
3.3. Pt/PPy/FateDH Electrodes 3.3.1. Characterization of Pt/PPy/FateDH electrodes CVs of platinum electrodes coated with a polypyrrole film containing FateDH
(Pt/PPy/FateDH) were recorded at negative sweeping potentials of -1.4 V and -
1.8 V in N2 and CO2 purged systems to figure out the best potential for formate
production.
Figure 32: Pt electrode modified with polypyrrole film and an alginate layer containing FateDH with crack in the alginate layer formed during electrolysis.

41
Figure 33 and Figure 34 show the CVs of a Pt/PPy/FateDH electrode in N2 (black
curve) and CO2 (red curve) saturated systems at negative sweeping potentials
of -1.4 V and -1.8 V. The increase in current for the reduction of CO2 is about
0.05 mA at -1.4 V and about 0.07 mA at -1.8 V, starting in both cases at about -
1.0 V.
Figure 33: CVs of aPt/PPy/FateDH electrode at a negative sweeping potential of -1.4 V vs. Ag/AgCl. Comparison of CVs of the N2 purged system (black curve) to the CVs recorded in the CO2 purged system (red curve) with a distinct increase in reductive current for the CO2 purged system starting at about -1.0 V.

42
Figure 34: CVs of aPt/PPy/FateDH electrode at a negative sweeping potential of -1.8 V vs. Ag/AgCl. Comparison of CVs recorded in the N2 purged system and in the CO2 purged system with distinct increase in reductive current for the CO2 purged system starting at about -1.0 V.
The CV of a Pt/PPy electrode without enzyme modification in a CO2 saturated
electrolyte solution does not show a higher reductive current flow than when
saturated with N2, which is apparent in Figure 35.

43
Figure 35: CVs of a Platinum electrode modified with polypyrrole film without enzyme modification. Comparison of CVs recorded in N2 (black curve) and CO2 (red curve) purged systems. No increase in reductive current for the CO2 purged system is observed in relation to the N2 purged system.
The comparison of CVs of Pt/PPy/FateDH electrodes to Pt/PPy electrodes
without enzyme modification reveals a much higher reductive current in a CO2
purged system with the enzyme modified electrode in relation to the bare
Pt/PPy electrode (See Figure 36).
Due to this large effect for CO2 reduction for the enzyme modified electrode at
a potential of -1.8 V, this potential was applied for electrolysis and gave the
best results of formate yield, whereas after electrolysis at lower potentials, no
formate could be detected.

44
Figure 36: Comparison of the CVs of a platinum electrode modified with a polypyrrole film without enzyme (grey curve) and a platinum electrode modified with polypyrrole containing FateDH (red curve). The CO2 purged system with FateDH modification shows much higher reductive current at -1.8 V than the CO2 purged system without enzyme modification.
After electrolysis at -1.8 V, 5.4 mmol/L formate were produced. After electrolysis
carried out at -1.4 V no formate could be detected. Furthermore, electrolysis
with Pt/PPy electrodes without enzyme modification at -1.8 V conducted for
reference did not yield formate.
In theory, the potential for CO2 reduction to formate is at -0.61 V vs. NHE, which
is about -0.8 V vs. Ag/AgCl. However, potentials of at least -1.8 V have to be
applied during electrolysis to yield detectable amounts of formate. We assume
that this high overpotential at Pt/PPy/FateDH electrodes results from the fact that
the diffusion of substrate (CO2) to the active centers of the enzymes is limited
as the enzymes are incorporated into the pyrrole polymer and the active centers
are not always available on the surface of the polymer electrode.
3.3.2. Electrolysis with Pt/PPy/FateDH electrodes

45
Figure 37 shows the current-time curves recorded during electrolysis at -1.8 V
with a Pt/PPy/FateDH and a Pt/PPy electrode without enzyme modification.
These curves, however do not allow conclusions about the assumption of
suppression of side reactions by enzymes, as the system was not stable during
electrolysis. At some places of the electrode, delamination of the polypyrrole
film occurred, which revealed the blank platinum surface, allowing water
splitting to occur more dominantly.
Figure 37: Current-time curves recorded during electrolysis at -1.8 V with a Pt/PPy/FateDH electrode and a blank Pt/PPy electrode without enzyme modification. The peaks in the current are due to instability and delamination of the polypyrrole film during electrolysis.
Figure 38 shows the ion chromatogram of the electrolyte solution after
electrolysis with a Pt/PPy/FateDH electrode at -1.8 V for 2 h. The peak at 6.2 min
was identified as formate by external standard calibration. 5.4 mmol/L formate
were produced, which corresponds to a faradaic efficiency of about 40%. The
peak at 5.4 min corresponds to acetate which is an impurity from the plastic in
the syringes, which were used to inject the samples into the ion chromatograph.
For electrolysis with a Pt/PPy electrode without enzyme modification at -1.8 V

46
conducted for reference, a little amount of formate compared to the enzyme
modified system could be detected, which suggests a catalytic effect of
polypyrrole for CO2 reduction (See Figure 39).
Figure 38: Ion Chromatogram of the electrolyte solution after 2 h electrolysis at -1.8 V of a Pt/PPy/FateDH electrode. A formate peak can be seen at 6.3 min. The peak at 5.4 min corresponds to acetate, which is a contaminant from the plastic in the syringes used to inject the samples.

47
Figure 39: Ion chromatogram of the electrolyte solution after electrolysis at -1.8 V with a blank Pt/PPy electrode without enzyme modification carried out for reference. There is a small formate peak at 6.3 min, suggesting a catalytic effect of polypyrrole for CO2 reduction.
3.3.3. Faradaic efficiency of formate production at Pt/PPy/FateDH electrodes
The faradaic efficiency of formate production is calculated analogous to 3.2.3. Duration of electrolysis: 2 h = 7200 s
Mean electric current flow during electrolysis: - 2.89 . 10-3 A
Q = I ∙ t = 2.89∙10-3 A ∙ 7200 s = 20.83 A s = 20.83 C
X=QF
=20.83 C
96485 Cmol
= 2.16∙10-4 moles of electrons
nth = moles of electrons
2 e- =2.16∙10-4mole-
2 e- = 1.08∙10-4 moles
ηF=nHCOO-
nth=
4.05 ∙10-5mol1.08∙10-4mol
= 38 %

48
3.3.4. Stability of Pt/PPy/FateDH electrodes The platinum electrodes coated with a polypyrrole film containing FateDH were
not stable during electrolysis. The polypyrrole film was peeled away at some
places on the electrode, presumably due to hydrogen evolution, which can be
seen in Figure 40.
3.3.5. Microsopic characterization of the Pt/PPy/FateDH electrodes Pt/PPy electrodes modified with FateDH and without enzyme modification were
examined under a microscope. Furthermore, the surface of the blank platinum
electrode was investigated.
Figure 41 depicts a Pt/PPy/FateDH electrode before and after electrolysis at
1000x magnification. Compared to the Pt/PPy/FateDH electrode surface before
electrolysis it is apparent that there is a place where the polypyrrole film was
peeled off during electrolysis. Nonetheless, on the places where polypyrrole is
still there after electrolysis, the polymer film looks unchanged.
Figure 40: Pt/PPy/FateDH electrode after electrolysis. At some places the PPy film was peeled away.

49
Figure 42 displays the Pt/PPy/FateDH electrode at 4000x magnification, which
offers a more detailed look on the surface of the polymer film.
Figure 41: Pt/PPy/FateDH electrode at 1000x magnification. A) electrode surface before electrolysis. B) electrode surface after electrolysis. It is obvious that the polypyrrole film was peeled away at one place during electrolysis.

50
Figure 42: Pt/PPy/FateDH electrode; electrode surface before electrolysis at 4000x magnification.
In Figure 43 the surface of a Pt/PPy electrode without enzyme modification after
electrolysis is depicted. It is obvious that the polypyrrole film was peeled away
during electrolysis.
In contrast to the enzyme modified Pt/PPy/FateDH electrode depicted in Figure 41,
it can be seen that the holes in the polypyrrole film are bigger and in a higher
quantity at the surface of the Pt/PPy electrode without enzyme modification.
Figure 44 shows the Pt/PPy electrode at 4000x magnification, which again
enables a detailed look at the surface composition of the polypyrrole film. The
blue part depicts the polypyrrole film, the red part shows a region where a double
layer of polypyrrole formed as a result of peeling off of the polymer film.

51
Figure 43: Pt/PPy electrode without enzyme modification after electrolysis at 500x magnification (A) and 1000x magnification (B). The polypyrrole film was peeled off during electrolysis at some points of the electrode.

52
Figure 44: Pt/PPy electrode without enzyme modification after electrolysis at 4000x magnification. The blue part depicts the polypyrrole film, the red part shows a region where a double layer of polypyrrole formed as a result of peeling off of the polymer film.
The surface of the cleaned platinum electrode is depicted in Figure 45. The
surface of the electrode shows scratches and irregularities which does not
allow a perfect adsorption of enzymes. Thus, irregular adsorption and
subsequent electropolymerisation of pyrrole onto the electrode occur which
can affect the function of the electrodes.

49
Figure 45: The blank platinum electrode at 1000x magnification shows scratches and irregularities. Therefore irregular adsorption and subsequent electropolymerisation of pyrrole onto the electrode surface occur. This can affect the function of the electrode.
3.4. Physical Adsorption of FateDH on Graphite Rods 3.4.1. Characterization of Graphite/FateDH electrodes CVs of graphite electrodes modified with adsorbed FateDH (graphite/FateDH)
were recorded at different negative sweeping potentials of -1.0 V and -1.4 V vs.
Ag/AgCl. Higher negative potentials were not investigated because the
characterization of blank graphite electrodes to the region above -1.4 V showed
excessive hydrogen evolution, which is in concurrence to CO2 reduction, limiting
the faradaic efficiency of formate production.
Figure 46 shows the CVs of a graphite/FateDH electrode at a negative sweeping
potential of -1.0 V. The CV of the graphite/FateDH electrode exhibits a small
increase in reductive current of for the CO2 purged system relative to the N2
purged system of about 0.04 mA. The increase in current for CO2 reduction
related to the N2 purged system starts at about -0.5 V

50
Figure 46: Comparison of CVs of a Graphite/FateDH electrode recorded in the N2 purged system (black curve) and the CO2 purged system (red curve) at a negative sweeping potential of -1.0 V vs. Ag/AgCl. The CO2 purged system shows an increase in reductive current in relation to the N2 purged system starting at about -0.5 V.
Figure 47 displays the CVs of a graphite/FateDH electrode at a negative
sweeping potential of -1.4 V in N2 and CO2 purged systems. The CV of the
graphite/FateDH electrode shows only about 0.15 mA increase in reductive
current for the CO2 purged system in comparison to the N2 purged system at -
1.4 V.
The current for CO2 reduction in relation to the N2 purged system starts to
increase at about -0.5 V.
A point which has to be considered is that the CV of the blank graphite
electrode also shows a high increase in reductive current of about 0.4 mA for
the CO2 purged system in comparison to the N2 purged system (See Figure 48).
This indicates that the enzymes in the Graphite/FateDH electrode are not
reducing the CO2, as even the blank graphite electrode shows an increase in
reductive current when the system is saturated with CO2.

51
Figure 47: Comparison of CVs of a Graphite/FateDH electrode recorded in the N2 purged system (black curve) and the CO2 purged system (red curve) at a negative sweeping potential of -1.4 V vs. Ag/AgCl with a distinct increase in reductive current for the CO2 purged system starting at about -0.5 V.
After electrolysis with graphite/FateDH electrodes at -1.0 V and -1.4 V no
formate could be detected.
Figure 48 shows the CVs of a blank graphite electrode measured in N2 and CO2
purged systems at a negative sweeping potential of -1.4 V. The characterization
of this graphite electrode shows also an increase in reductive current for the CV
recorded in a CO2 saturated system in relation to the CV recorded in a N2
purged system. Thus, most likely graphite also is reducing CO2 to higher energy
molecules. However, this study is only focused on formate production and other
possible products were not investigated.

52
Figure 48: Comparison of CVs of a blank graphite electrode recorded in N2 purged (black curve) and CO2 purged (red curve) systems. An increase in reductive current for the CO2 purged system in relation to the N2 purged system was observed.
After electrolysis with graphite/liquidFateDH electrodes at -1.0 V and -1.4 V, no
formate could be detected.
3.4.2. Electrolysis with a Graphite/FateDH electrode Figure 49 depicts the current-time curves recorded during electrolysis at -1.4 V
with a Graphite/FateDH electrode and a blank graphite electrode without enzyme
modification. It can again be seen, that during electrolysis with the enzyme
modified electrode, less current is flowing than in the case of the blank graphite
electrode. This suggests again, that the enzymes suppress side reactions and
only the formation of one specific product is favored.
Nonetheless, no significant amounts of formate could be detected after
electrolysis at -1.4 V with enzyme modified graphite electrodes and with blank
graphite electrodes.

53
Figure 49: Current-time curves recorded during electrolysis with a Graphite/FateDH electrode and with a blank graphite electrode. During electrolysis with the enzyme modified electrode less current is flowing than in case of the blank graphite electrode, suggesting the suppression of side reactions in case of the enzyme modified electrode.
After electrolysis at -1.4 V with graphite electrodes modified with FateDH, no
significant amounts of formate could be detected, as shown in the ion
chromatograms recorded after electrolysis with a Graphite/FateDH electrode and
a blank graphite electrode without enzyme modification (See Figure 50 and
Figure 51). The reason might be that the enzyme was only physically adsorbed
onto the graphite surface and no further stabilization was done. We assume that
due to the electric current during electrolysis, the weak Van der Vaals
interactions broke and the three dimensional structure of the enzyme changed
so that the activity was lost.

54
Figure 50: Ion chromatogram of the electrolyte solution after electrolysis at -1.4 V with a Graphite/FateDH electrode. No significant amounts of formate were detected.

55
Figure 51: Ion chromatogram of the electrolyte solution after electrolysis at -1.4 V with a blank graphite electrode without enzyme modification carried out for reference. No significant amounts of formate were detected.
4. Conclusion This work shows the direct electrochemical reduction of CO2 to formate and
methanol catalyzed by dehydrogenases, enabling an attractive way to synthesize
higher energy molecules from CO2. Substitution of the expensive, sacrificial co-
enzyme NADH as well as mild reaction conditions such as moderate
temperatures and low pressures help to reduce the process costs significantly
compared to industrial methods used today where high pressures and
temperatures are required. Furthermore, immobilization of the enzymes on
electrodes enables their re-usage and a sustainable and biodegradable CO2
reduction process is provided.
The most efficient way of CO2 reduction was reached with carbonfelt electrodes
modified with an alginate-enzyme layer as reported by S. Schlager et al. [35].
Carbonfelt provides a big surface area which increased the reaction efficiency
and improved the adhesion of the alginate layer to the electrode. Moreover,
these electrodes showed the highest stability.

56
With Pt/PPy/Alginate/FateDH electrodes and Pt/PPy/FateDH electrodes, formate
production could be achieved with faradaic efficiencies of about 85% and 40%.
However, the stability of the systems was not very promising. In the alginate
layer, cracks were sometimes formed during electrolysis and in the case of
Pt/PPy/FateDH electrodes, at some points of the electrodes, the polypyrrole film
was peeled off.
Moreover, it was realized, that cyclic voltammetry might not be a convincing
method to characterize these enzyme modified electrodes, as even though in
most CVs the effect of CO2 reduction was not very big, high faradaic efficiencies
could be achieved. Further, the assumption has been made, that the enzymes
are suppressing unwanted side reactions like water splitting and thus using the
current more efficiently, which has been suggested by the current-time curves
recorded during electrolysis.
Even though the theoretical potentials for CO2 reduction to formate and methanol
are -0.61 V vs. NHE (-0.8 V vs. Ag/AgCl) and -0.38 V vs. NHE (-0,6 V vs.
Ag/AgCl), for all systems, significant overpotentials of 0.6 V to 1.0 V had to be
considered during electrolysis. Presumably, this is because of the low
conductivity of the alginate layer and diffusion limitations of CO2 to the enzymes
due to the hindrance by the immobilization matrices. Higher overpotentials
applied during electrolysis result in a lower faradaic efficiency because water
splitting starts to get more dominantly.
As a result, the system has to be improved further concerning stability and
faradaic efficiency of the reaction.
Nonetheless, enzyme immobilization on electrodes offers a sustainable and
biodegradable way for CO2 reduction and an independence of fossil fuels.
5. Acknowledgements I wish to express my gratitude to o.Univ. Prof. Mag. Dr. DDr. h.c. Niyazi Serdar
Sariciftci for giving me the opportunity to work at the Linz Institute for Physical
Chemistry. Furthermore I want to thank DI Stefanie Schlager and DI Engelbert
Portenkirchner for practical and content-related support.
6. References
57
[1] Dr. Pieter Tans, NOAA/ESRL: Full Mauna Loa CO2 record,
(http://www.esrl.noaa.gov/gmd/ccgg/trends/mlo.html accessed: 13. Nov. 2013)
[2] C. D. Keeling, R. B. Bacastow, A. E. Bainbridge, C. A. Ekdahl, P. R. Guenther,
L.S. Waterman, Tellus 28 (1976) 538 - 551
[3] J. R. Petit, I. Basile, A. Leruyuet, D. Raynaud, C. Lorius, J. Jouzel, M.
Stievenard, V.Y. Lipenkov, N.I. Barkov, B.B. Kudryashov, M. Davis, E. Saltzman,
V. Kotlyakov, Nature 387(1997) 359 - 360
[4] J. R. Petit, J. Jouzel, D. Raynaud, N. I. Barkov, J. -M. Barnola, I. Basile, M.
Benders, J. Chappellaz, M. Davis, G. Delayque, M. Delmotte, V. M. Kotlyakov, M.
Legrand, V. Y. Lipenkov, C. Lorius, L. Pépin, C. Ritz, E. Saltzman, M. Stievenard,
Nature 399 (1999) 429 - 436
[5] J. M. Barnola, D. Raynaud, Y. S. Korotkevich, C. Lorius, Nature 329 (1987)
408 - 414
[6] S. A. Rackley, Carbon Capture and Storage, (2010), Elsevier Inc.
[7] R. L. Graham, F. B. Metting: Carbon Sequestration in terrestrial ecosystems,
(http://csite.ornl.gov/ accessed: 13. Nov. 2013)
[8] G. A. Olah, Angew. Chem. Int. Ed. 44 (2005) 2636 – 2639
[9] M. Aresta, Carbon Dioxide as a Chemical Feedstock, (2010), WILEY-VCH
GmbH & Co. KG
[10] M. Jitaru, J. Chem. Technol. Metall. 42 (2007) 333 - 344
[11] J. Hawecker, J. Lehn, R. Ziessel, J. Chem. Soc., Chem.Commun. 6 (1984)
328 – 330
[12] E. E. Benson, C. P. Kubiak, A. J. Sathrum, J. M. Smieja, Chem. Soc. Rev. 38
(2008) 89 - 99
[13] E. Portenkirchner, K. Oppelt, D.A.M. Egbe, G. Knör, N. S. Sariciftci,
Nanomaterials andEnergy 2 (2013) 134 - 147
[14] S. Cosnier, A. Deronzier, J. –C. Moutet, J. Mol. Catal. 45 (1988) 381- 391
[15] E. B. Cole, P. S. Lakkaraju, D. M. Rampulla, A. J. Morris, E. Abelev, A. B.
Bocarsly, J. Am. Chem. Soc. 132 (2010) 11539 - 11551
[16] T. Mizuno, A. Naitoh, K. Ohta, J. Electroanal. Chem. 391 (1995) 199 - 201
[17] D. Nocera, Acc. Chem. Res. 45 (2012) 767 - 776
[18] B. Gholamkhass, H. Mametsuka, K. Koike, T. Tanabe, M. Furue, O. Ishitani,
Inorg.Chem. 44 (2005) 2326–2336
[19] J. Mao, K. Li, T. Peng, Catal.Sci.Technol., 3 (2013) 2481 - 2498

58
[20] T. Arai, S. Sato, K. Uemura, T. Morikawa, T. Kajino, T. Motohiro, Chem.
Commun. 46 (2010) 6944 - 6946
[21] E. E. Barton, D. M. Rampulla, A. B. Bocarsly, J. Am. Chem. Soc. 130 (2008)
6342 – 6344
[22] E. I. Lan, J. C. Liao, Metab. Eng. 13 (2011) 353 - 363
[23] G. Diekert, FEMS Microbiol.Lett. 87 (1990) 391 - 395
[24] M. Kuroda, T. Watanabe, Energy Cowers. 36 (1995) 787-790
[25] M. Aresta, E. Quaranta, I. Tommasi, J. Chem. Soc., Chem. Commun. 7
(1988) 450 - 452
[26] M. Aresta, E. Quaranta, R. Liberio, C. Dileo, I. Tommasi, Tetrahedron 54
(1998) 8841 - 8846
[27] O. Heichal-Segal, S. Rappoport, S. Braun, Biotechnol. 13 (1995) 798 - 800
[28] D. W. Kim, J. H. Yang, Y. K. Jeong, Appl. Microbiol.Biotechnol. 28 (1988) 148
- 154
[29] A. Lindgren, O. Gorton, T. Ruzgas, U. Baminger, D. Haltrich, M. Schülein, J.
Electroanal. Chem. 496 (2001) 76 - 81
[30] U. Ruschig, U. Müller, P. Willnow, T. Höpner, Eur. J. Biochem. 70 (1976) 325
- 330
[31] Y. Lu, Z. Jiang, S. Xu, H. Wu, Catal. Today 115 (2006) 263 - 268
[32] R. Obert, B. C. Dave, J. Am. Chem. Soc. 121 (1999) 12192 – 12193
[33] S. Kuwabata, R. Tsuda, H. Yoneyama, J. Am. Chem. Soc. 116 (1994) 5437 -
5443
[34] T. Reda, C. M. Plugge, N. J. Abram, J. Hirst, PNAS 105 (2008) 10654 -
10658
[35] S.Schlager, D. Hiemetsberger, A. Wagner, D. H. Apaydin, E. Portenkirchner,
N.S. Sariciftci, Nature Science (2013), submitted
[36] S. Datta, L. R. Christena, Y. R. S. Rajaram, Biotech. 3 (2013) 1 - 9
[37] J. V. B. Kozan, R. P. Silva, S. H. P. Serrano, A. W. O. Lima, L. Angnes, Anal.
Chim. Acta 591 (2007) 200 - 207
[38] H. Takahashi, B. Li, T. Sasaki, C. Miyazaki, T. Kajino, S. Inagaki, Micropor.
Mesopor. Mat. 44 - 45 (2001) 755 - 762
[39] J. Fu, J. Reinhold, N. W. Woodbury, PLoS One 6 (2011) e18692
[40] H. Hsieh, P. Liu, W. Liao, Biotechnol. Lett. 22 (2000) 1459 - 1464

59
[41] Q. Shi, Y. Tian, X. Dong, S. Bai, Y. Sun, J. Biochem. Eng. 16 (2003) 317 -
322
[42] M. Sardar, M. N. Gupta, Enzyme. Microb.Tech. 37 (2005) 355 - 359
[43] Q. Shen, R. Yang, X. Hua, F. Ye, W. Zhang, W. Zhao, Process. Biochem. 46
(2011) 1565 - 1571
[44] B. Krajewska, Enzyme. Microb. Tech. 35 (2004) 126 - 139
[45] H. Wen, V. Nallathambi, D.Chakraborty, S. C. Barton, Microchim. Acta 175
(2011) 283 - 289
[46] M. J. Swann, D. Bloor, T. Haruyama, M. Aizawa, Biosens. Bioelectron. 12
(1997) 1169 - 1182
[47] D. L. Nelson, Lehninger, Principles of Biochemistry, 4th Edition, W. H.
Freeman ed.
[48] A. Wurtz, Comptes Rendus Hebdomadaires des Séances de l’Académie des
Sciences, Paris 91 (1880) 787 - 791
[49] V. Henri, Lois générales de l’action des diastases, Hermann, Paris 1903