enzyme-immobilized hydrogels to create hypoxia for …
TRANSCRIPT

ENZYME-IMMOBILIZED HYDROGELS TO CREATE HYPOXIA FOR IN
VITRO CANCER CELL CULTURE
A Thesis
Submitted to the Faculty
of
Purdue University
by
Camron Scott Dawes
In Partial Fulfillment of the
Requirements for the Degree
of
Master of Science in Biomedical Engineering
May 2017
Purdue University
Indianapolis, Indiana

ii
THE PURDUE UNIVERSITY GRADUATE SCHOOL
STATEMENT OF THESIS APPROVAL
Dr. Chien-Chi Lin, Chair
Department of Biomedical Engineering
Dr. Hiroki Yokota
Department of Biomedical Engineering
Dr. Heiko Konig
Department of Medicine, IU School of Medicine
Approved by:
Dr. Edward Berbari
Head of Departmental Graduate Program

iii
ACKNOWLEDGMENTS
I would like to thank my thesis advisor, Dr. Chien-Chi Lin. This thesis would
not have been possible without his patient guidance and the challenging learning
environment he provided. He taught me valuable research experience as well as
knowledge and critical thinking skills for which I will always be grateful for.
I would also like to thank my advisory committee members, Dr. Heiko Konig and
Dr. Hiroki Yokota for their feedback at the culmination of this research. Their time
and advice was greatly appreciated.
In addition, I would also like to thank my colleagues; Dr. Tsai-Yu Lin, Dr. Han
Shih, Ms. Tanja Green, Mr. John Bragg, Mr. Hung-Yi Liu, and Mr. Matthew
Arkenberg for technical assistance and advice. Thanks also to Mrs. Sherry Clemens
and Mrs. Summer Layton for assistance and help with the formatting and aesthetics of
this thesis. Finally thanks to my family and friends for their continued encouragement
and support throughout the last two years.
iv
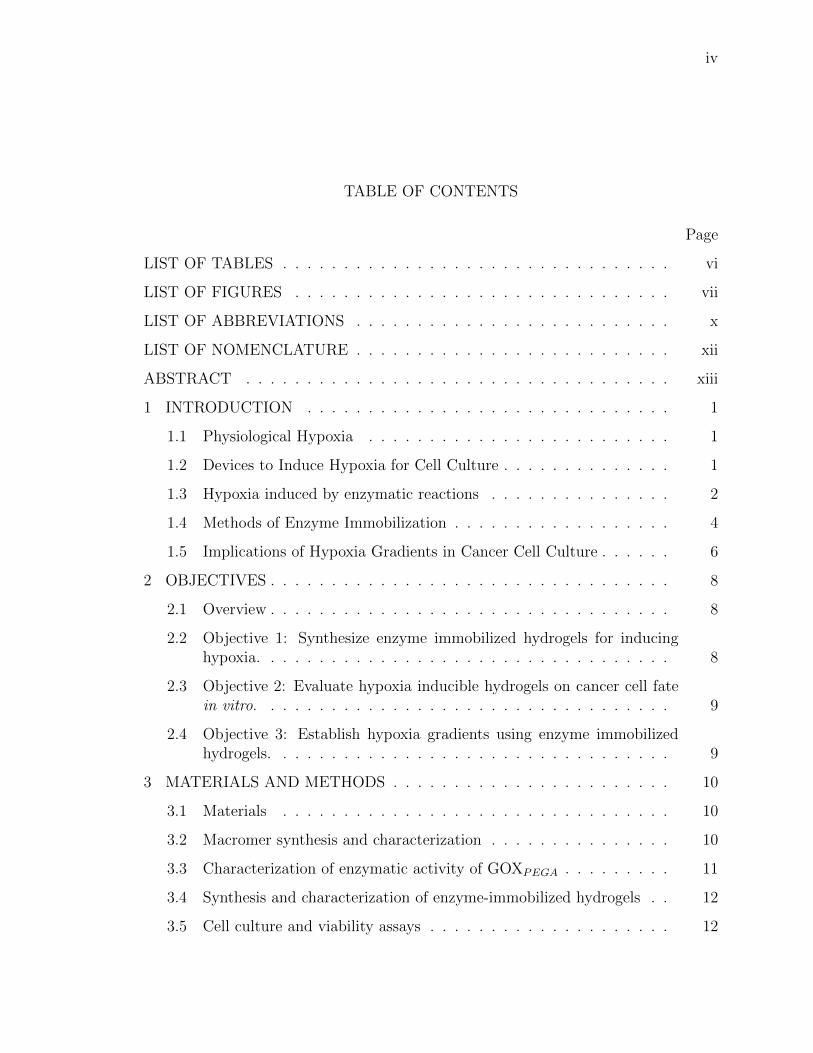
TABLE OF CONTENTS
Page
LIST OF TABLES . . . . . . . . . . . . . . . . . . . . . . . . . . . . . . . . vi
LIST OF FIGURES . . . . . . . . . . . . . . . . . . . . . . . . . . . . . . . vii
LIST OF ABBREVIATIONS . . . . . . . . . . . . . . . . . . . . . . . . . . x
LIST OF NOMENCLATURE . . . . . . . . . . . . . . . . . . . . . . . . . . xii
ABSTRACT . . . . . . . . . . . . . . . . . . . . . . . . . . . . . . . . . . . xiii
1 INTRODUCTION . . . . . . . . . . . . . . . . . . . . . . . . . . . . . . 1
1.1 Physiological Hypoxia . . . . . . . . . . . . . . . . . . . . . . . . . 1
1.2 Devices to Induce Hypoxia for Cell Culture . . . . . . . . . . . . . . 1
1.3 Hypoxia induced by enzymatic reactions . . . . . . . . . . . . . . . 2
1.4 Methods of Enzyme Immobilization . . . . . . . . . . . . . . . . . . 4
1.5 Implications of Hypoxia Gradients in Cancer Cell Culture . . . . . . 6
2 OBJECTIVES . . . . . . . . . . . . . . . . . . . . . . . . . . . . . . . . . 8
2.1 Overview . . . . . . . . . . . . . . . . . . . . . . . . . . . . . . . . . 8
2.2 Objective 1: Synthesize enzyme immobilized hydrogels for inducinghypoxia. . . . . . . . . . . . . . . . . . . . . . . . . . . . . . . . . . 8
2.3 Objective 2: Evaluate hypoxia inducible hydrogels on cancer cell fatein vitro. . . . . . . . . . . . . . . . . . . . . . . . . . . . . . . . . . 9
2.4 Objective 3: Establish hypoxia gradients using enzyme immobilizedhydrogels. . . . . . . . . . . . . . . . . . . . . . . . . . . . . . . . . 9
3 MATERIALS AND METHODS . . . . . . . . . . . . . . . . . . . . . . . 10
3.1 Materials . . . . . . . . . . . . . . . . . . . . . . . . . . . . . . . . 10
3.2 Macromer synthesis and characterization . . . . . . . . . . . . . . . 10
3.3 Characterization of enzymatic activity of GOXPEGA . . . . . . . . . 11
3.4 Synthesis and characterization of enzyme-immobilized hydrogels . . 12
3.5 Cell culture and viability assays . . . . . . . . . . . . . . . . . . . . 12

v
Page
3.6 RNA isolation and real time PCR . . . . . . . . . . . . . . . . . . . 13
3.7 Oxygen Gradient Development & Mathematical Modeling . . . . . 14
3.8 Statistics . . . . . . . . . . . . . . . . . . . . . . . . . . . . . . . . . 17
4 RESULTS AND DISCUSSION . . . . . . . . . . . . . . . . . . . . . . . 18
4.1 Enzyme-mediated hypoxia generation . . . . . . . . . . . . . . . . . 18
4.2 GOXPEGA-immobilized hydrogels for inducing hypoxia . . . . . . . 22
4.3 Combined GOXPEGA-immobilized hydrogels and soluble CAT for in-ducing hypoxia . . . . . . . . . . . . . . . . . . . . . . . . . . . . . 25
4.4 Cytocompatibility of enzyme-immobilized hydrogels . . . . . . . . . 27
4.5 Enzyme-induced hypoxia in the presence of cells . . . . . . . . . . . 29
4.6 Effect of enzyme-induced hypoxia on hypoxic gene expression . . . . 31
4.7 Oxygen Gradient Development . . . . . . . . . . . . . . . . . . . . 32
5 SUMMARY & RECOMMENDATIONS . . . . . . . . . . . . . . . . . . . 38
5.1 Summary . . . . . . . . . . . . . . . . . . . . . . . . . . . . . . . . 38
5.2 Recommendations . . . . . . . . . . . . . . . . . . . . . . . . . . . . 42
LIST OF REFERENCES . . . . . . . . . . . . . . . . . . . . . . . . . . . . 43
A APPENDIX . . . . . . . . . . . . . . . . . . . . . . . . . . . . . . . . . . 48
A.1 PEGDA 1H-NMR . . . . . . . . . . . . . . . . . . . . . . . . . . . . 48
A.2 RT-PCR Gene Sequences . . . . . . . . . . . . . . . . . . . . . . . . 49
A.3 Preliminary Study: Effect of Lyophilization on GOXPEGA Gel InducedHypoxia . . . . . . . . . . . . . . . . . . . . . . . . . . . . . . . . . 50
A.4 Semi-Empirical Prediction of O2 Gradient Development in ChannelSlides . . . . . . . . . . . . . . . . . . . . . . . . . . . . . . . . . . . 52
vi
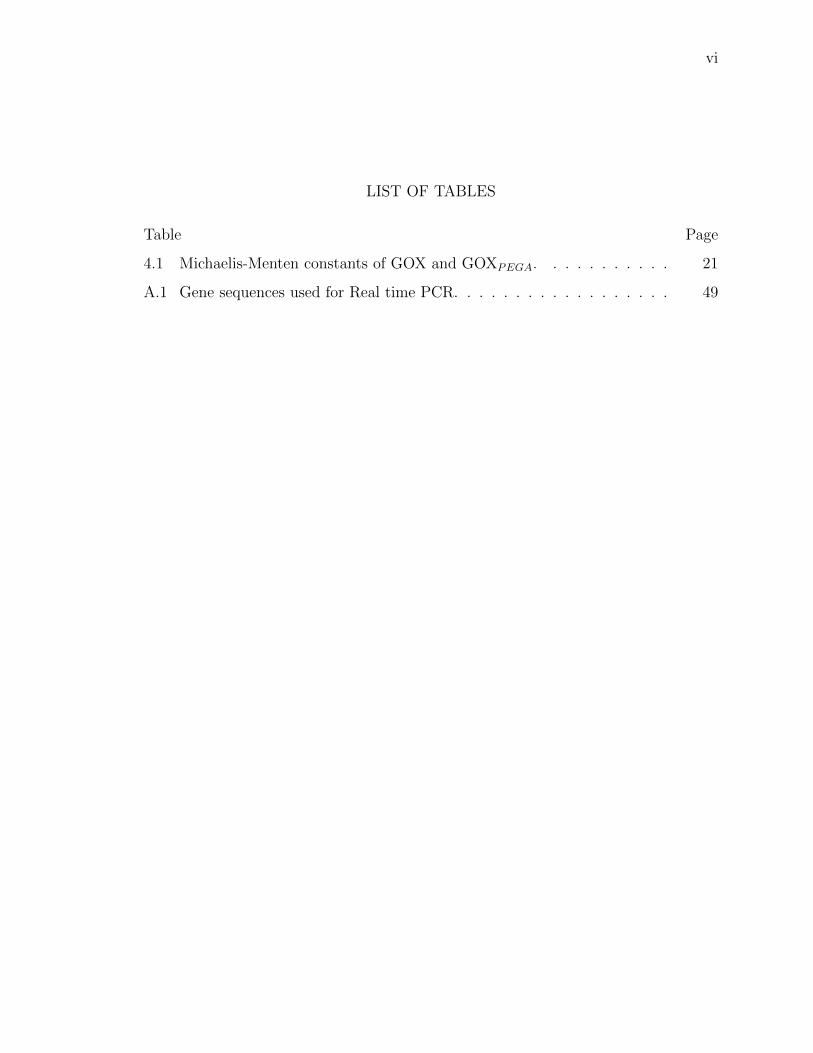
LIST OF TABLES
Table Page
4.1 Michaelis-Menten constants of GOX and GOXPEGA. . . . . . . . . . . 21
A.1 Gene sequences used for Real time PCR. . . . . . . . . . . . . . . . . . 49

vii
LIST OF FIGURES
Figure Page
1.1 Enzymatic reactions of GOX (i), CAT (ii), and GOX/CAT (iii). . . . . 3
1.2 Chemical reactions for hydrogel crosslinking and covalent immobilizationof target molecules. (A) Free radical mediated chain-growth photopoly-merization. (B) Step-growth thiol-ene polymerization. (C) Base catalyzedthiol-maleimide click polymerization. (D) Thiol-vinyl sulfone polymeriza-tion. (R, R1, R2 = polymer functional groups or target molecule moietiesfor immobilization; PI = photoinitiator; hv = light source). . . . . . . . 5
3.1 CAD diagram of the ibidi channel slide with approximate dimensions. (A)Top view. (B) Isometric view. (C) Front view. (D) Side view. Accordingto manufacturer specifications, channel volume is 100 µL and reservoir vol-ume is 600 µL (each). Diagrams were made using PTC Creo Parametric. 14
3.2 Diagram of an ibidi channel slide containing GOXPEGA hydrogels (yellow)and DPBS (red). Diagrams were made using PTC Creo Parametric. . . 15
3.3 Numerical method for simulating oxygen tension within an ibidi channelslide. Initial condition nodes are outlined in blue. Boundary conditionnodes are outlined in yellow. The stacked green boxes represent the nodevalues used for averaging for a given set of time and location O2 concen-trations as describe by Equation 3.5. . . . . . . . . . . . . . . . . . . . 16
4.1 Enzymatic generation of aqueous oxygen tension. (A) O2 consumptionprofile for GOX. (B) O2 consumption profile for GOX in the presence of9.8 µg/mL CAT. All reactions were carried out in PBS, pH 7.4 at roomtemperature with 25 mM β-D-Glucose. (Mean ± SEM, n ≥ 3). . . . . 19
4.2 Reaction scheme of GOX modification using Acryloyl-PEG-SVA. Proteinstructure for GOX was obtained from RCSB PDB (3QVP). . . . . . . 19
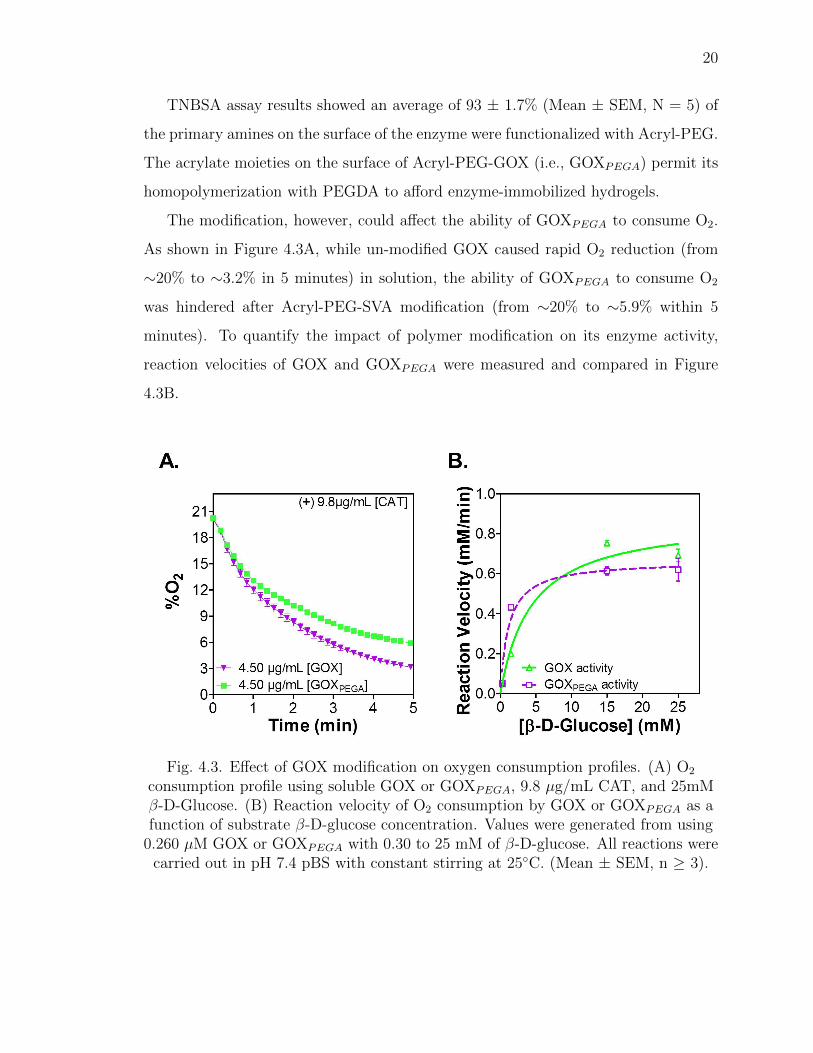
4.3 Effect of GOX modification on oxygen consumption profiles. (A) O2 con-sumption profile using soluble GOX or GOXPEGA, 9.8 µg/mL CAT, and25mM β-D-Glucose. (B) Reaction velocity of O2 consumption by GOX orGOXPEGA as a function of substrate β-D-glucose concentration. Valueswere generated from using 0.260 µM GOX or GOXPEGA with 0.30 to 25mM of β-D-glucose. All reactions were carried out in pH 7.4 pBS withconstant stirring at 25◦C. (Mean ± SEM, n ≥ 3). . . . . . . . . . . . . 20

viii
Figure Page
4.4 Effect of GOX modification on oxygen consumption profiles over extendedtime periods. (A,B) O2 consumption profiles of unmodified and acrylatedGOX in the absence (B) or presence (A) of soluble CAT (450 µg/mL).All reactions were carried out in pH 7.4 PBS, at 25◦C, with 25 mM β-D-Glucose. (**p < 0.01. Mean ± SEM, n ≥ 3). . . . . . . . . . . . . . . 22
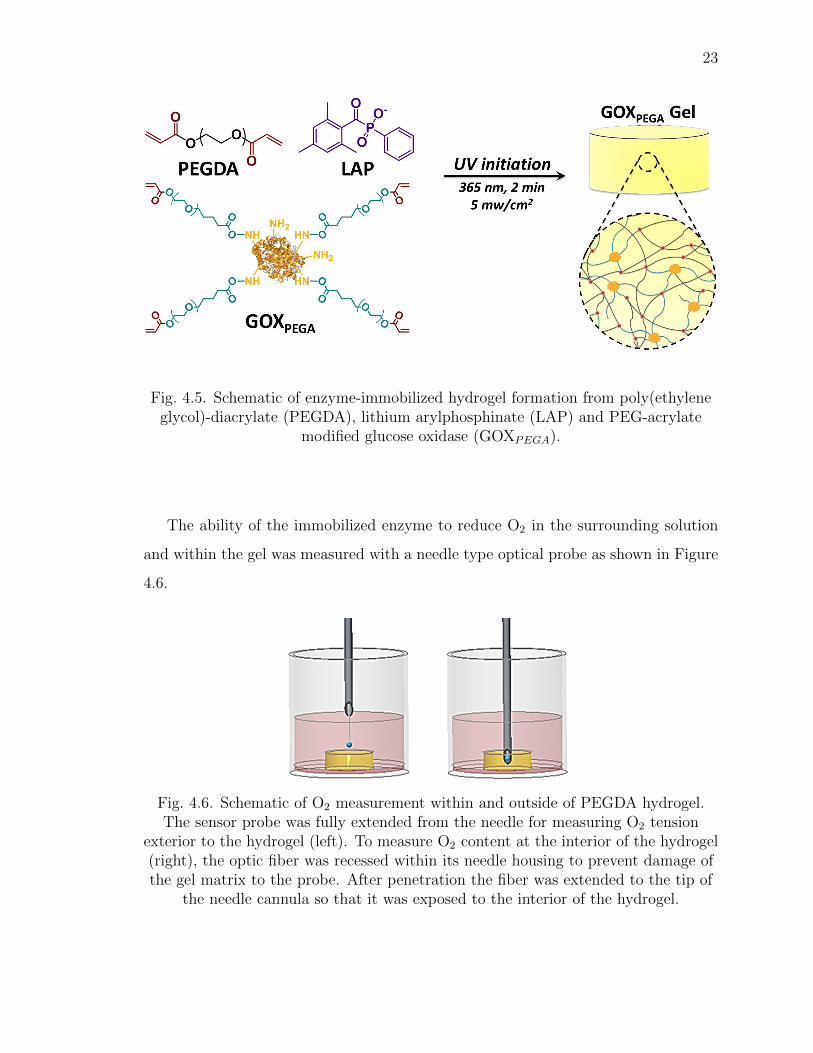
4.5 Schematic of enzyme-immobilized hydrogel formation from poly(ethyleneglycol)-diacrylate (PEGDA), lithium arylphosphinate (LAP) and PEG-acrylate modified glucose oxidase (GOXPEGA). . . . . . . . . . . . . . . 23
4.6 Schematic of O2 measurement within and outside of PEGDA hydrogel.The sensor probe was fully extended from the needle for measuring O2
tension exterior to the hydrogel (left). To measure O2 content at theinterior of the hydrogel (right), the optic fiber was recessed within itsneedle housing to prevent damage of the gel matrix to the probe. Afterpenetration the fiber was extended to the tip of the needle cannula so thatit was exposed to the interior of the hydrogel. . . . . . . . . . . . . . . 23
4.7 Interior and exterior O2 consumption for immobilized GOXPEGA hydro-gels. Hydrogel (120 µL, with or without 4 mg/mL GOXPEGA) was formedby 8 wt% PEGDA using 1 mM LAP as the photoinitiator. (**p < 0.01,***p < 0.001. Mean ± SEM, n ≥ 3). . . . . . . . . . . . . . . . . . . . 24
4.8 Effect of soluble CAT addition on O2 consumption and H2O2 productionby GOXPEGA gels. (A) O2 tension. (B) H2O2 accumulation. Hydrogels(60 µL) were formed by 15 wt% PEGDA co-polymerized with 6 mg/mLGOXPEGA. CAT group was 0.54 mg/mL in solution. All reactions werecarried out in pH 7.4 DPBS at 37◦C. (**p < 0.01. ***p < 0.001. Mean± SEM, n ≥ 3). . . . . . . . . . . . . . . . . . . . . . . . . . . . . . . . 25
4.9 Effect of additional glucose and soluble CAT addition on O2 consumptionand H2O2 production by GOXPEGA gels. (A) O2 tension. (B) H2O2 accu-mulation. Additional bolus injections of glucose (50 µL of 500 mM) weredelivered 5 minutes before measuring O2 at 24 and 48 hour time points.Hydrogels (60 µL) were formed by 15 wt% PEGDA co-polymerized with6 mg/mL GOXPEGA. All reactions were carried out in pH 7.4 DPBS at37◦C with 0.54 mg/mL CAT in solution. (Mean ± SEM, n ≥ 3). . . . 26
4.10 Effect of replacing GOX-immobilized hydrogel on solution O2 tension.Old GOX-immobilized gels were replaced with new GOX-immobilized gelsalong with fresh CAT after 24 hours. Hydrogels (60 µL) were formed by 15wt% PEGDA copolymerized with 6 mg/mL GOXPEGA. All reactions werecarried out in pH 7.4 DPBS at 37◦C with 0.54 mg/mL CAT in solution.(**p < 0.01. Mean ± SEM, n ≥ 6). . . . . . . . . . . . . . . . . . . . . 27

ix
Figure Page
4.11 Cytocompatibility of PEGDA hydrogels with or without immobilizedGOXPEGA. Molm14 cell viability (A, C) and density (B, D) when culturedin the absence (Enzyme-free Gel; A & B) or presence (C, D) of immobilized(6 mg/mL) GOXPEGA Gel + CAT. Hydrogels (60 µL) were formed by 15wt% PEGDA copolymerized with 6 mg/mL GOXPEGA. CAT in mediawas 0.54 mg/mL. (*p < 0.05. ***p < 0.001. Mean ± SEM, n ≥ 3). . . 28
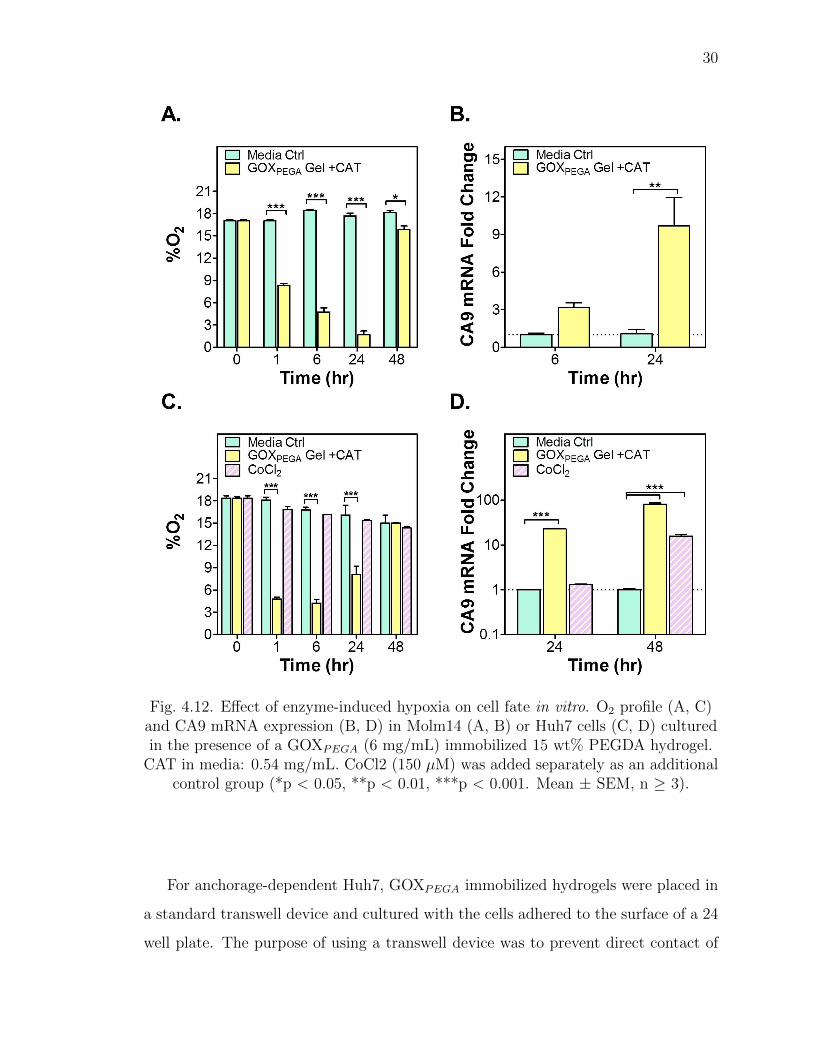
4.12 Effect of enzyme-induced hypoxia on cell fate in vitro. O2 profile (A, C)and CA9 mRNA expression (B, D) in Molm14 (A, B) or Huh7 cells (C,D) cultured in the presence of a GOXPEGA (6 mg/mL) immobilized 15wt% PEGDA hydrogel. CAT in media: 0.54 mg/mL. CoCl2 (150 µM)was added separately as an additional control group (*p < 0.05, **p <0.01, ***p < 0.001. Mean ± SEM, n ≥ 3). . . . . . . . . . . . . . . . . 30
4.13 Effect of GOX-immobilized hydrogel on LOX expression in Huh7 cells.CoCl2 (150 µM) was added separately as a control group. Cell culturemedium was supplemented with 0.54 mg/mL CAT. Hydrogels (60 µL)were formed by 15 wt% PEGDA co-polymerized with 6 mg/mL GOXPEGA.(***p < 0.001. Mean ± SEM, n ≥ 3). . . . . . . . . . . . . . . . . . . 32
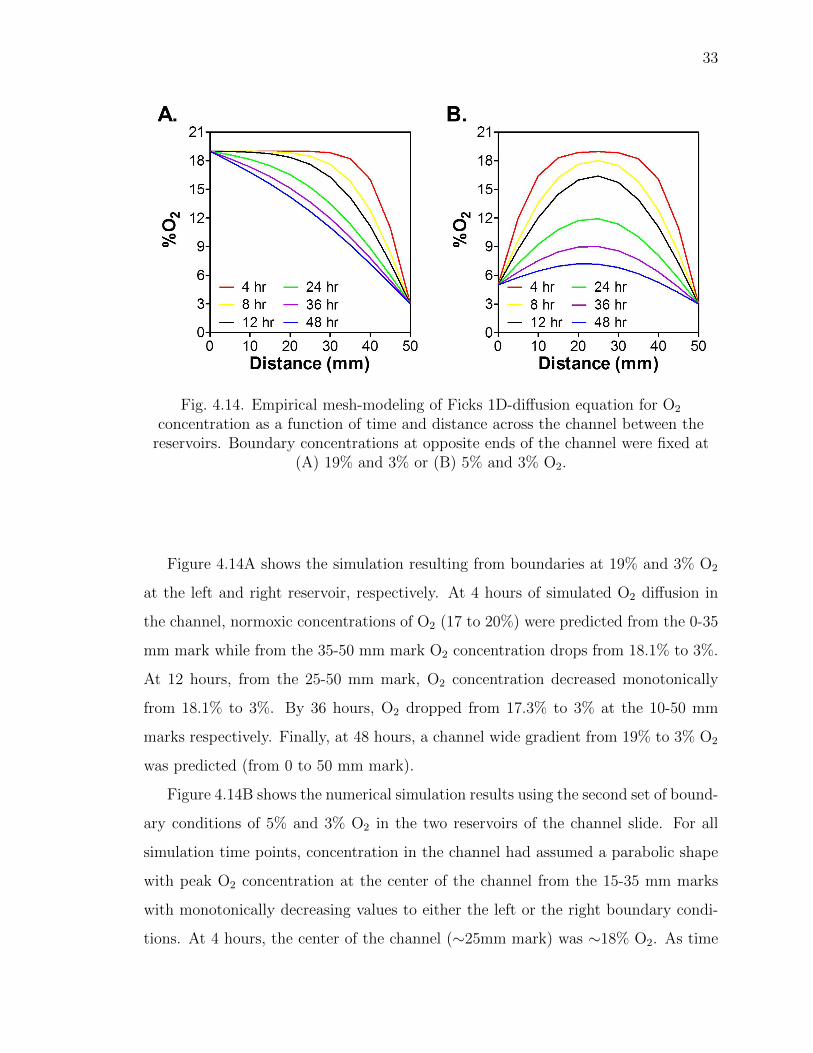
4.14 Empirical mesh-modeling of Ficks 1D-diffusion equation for O2 concen-tration as a function of time and distance across the channel between thereservoirs. Boundary concentrations at opposite ends of the channel werefixed at (A) 19% and 3% or (B) 5% and 3% O2. . . . . . . . . . . . . . 33
4.15 Gradient development using O2 consuming GOXPEGA Gels in channelplates. (A, C) Percent O2 measured as a function of time for GOXPEGA
hydrogels in an ibidi channel slide. Hydrogels were 20 µL total volumeformed by 15 wt% PEGDA and either 0.2 or 0.4 mg/mL GOXPEGA withone gel per channel reservoir. (B, D) Empirical mesh-modeling of Ficks1D-diffusion equation for O2 concentration as a function of time and dis-tance across the channel between the reservoirs. Boundary conditions werefixed at the corresponding measured values for gels (A=B, C=D). (*p <0.05. ***p < 0.001. Mean ± SEM, n ≥ 3). . . . . . . . . . . . . . . . . 35
A.1 1H-NMR spectra of PEGDA. The degree of acrylation was calculated bycomparing the ratio of the integrals of the acrylate group (a-b-c, δ5.8 - 6.4ppm) to the terminal -CH2 of the PEG backbone (d, δ4.3 ppm). . . . . 48
A.2 Effect of lyophilization on O2 consumption by GOXPEGA gels. O2 tensionover time for GOXPEGA gels with (B) and without (A) lyophilization.Hydrogels (20 µL) were formed by 15 wt% PEGDA and 0.2 or 0.4 mg/mLGOXPEGA with one gel per reservoir in the ibidi channel slide. All gelswere added to 37◦C DPBS for swelling overnight before use. (*p < 0.05.Mean ± SEM, n ≥ 3). . . . . . . . . . . . . . . . . . . . . . . . . . . . 50
x
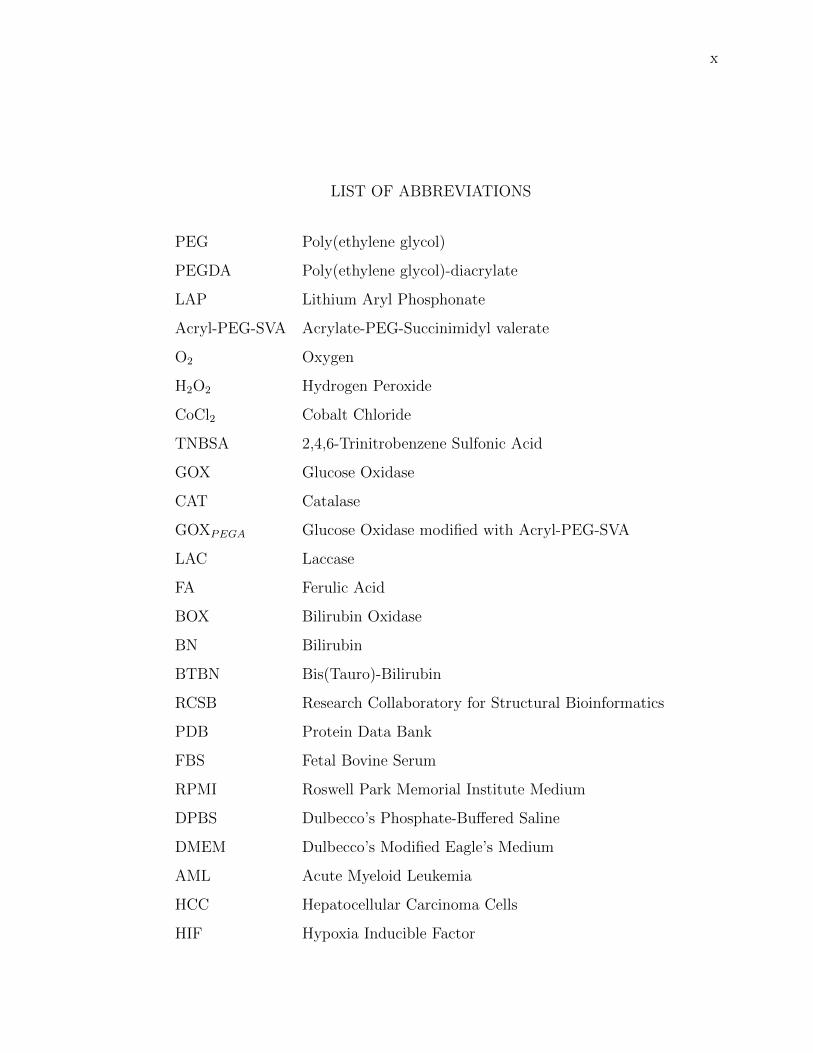
LIST OF ABBREVIATIONS
PEG Poly(ethylene glycol)
PEGDA Poly(ethylene glycol)-diacrylate
LAP Lithium Aryl Phosphonate
Acryl-PEG-SVA Acrylate-PEG-Succinimidyl valerate
O2 Oxygen
H2O2 Hydrogen Peroxide
CoCl2 Cobalt Chloride
TNBSA 2,4,6-Trinitrobenzene Sulfonic Acid
GOX Glucose Oxidase
CAT Catalase
GOXPEGA Glucose Oxidase modified with Acryl-PEG-SVA
LAC Laccase
FA Ferulic Acid
BOX Bilirubin Oxidase
BN Bilirubin
BTBN Bis(Tauro)-Bilirubin
RCSB Research Collaboratory for Structural Bioinformatics
PDB Protein Data Bank
FBS Fetal Bovine Serum
RPMI Roswell Park Memorial Institute Medium
DPBS Dulbecco’s Phosphate-Buffered Saline
DMEM Dulbecco’s Modified Eagle’s Medium
AML Acute Myeloid Leukemia
HCC Hepatocellular Carcinoma Cells
HIF Hypoxia Inducible Factor

xi
CA9 Carbonic Anhydrase 9
LOX Lysyl Oxidase
ANOVA Analysis of Variance
SEM Standard Error of the Mean
n Number of Replicates
< Less Than
≤ Less Than or Equal to
> Greater Than
≥ Greater Than or Equal to
± Plus or Minus
= Is equal to
≈ Is approximately
= Corresponds to
∂ Partial Derivative
∆ Change in Quantity

xii
LIST OF NOMENCLATURE
Symbol Unit Description
Vmax mM·min−1 Maximum enzyme reaction velocity.
Vo mM·min−1 Enzyme reaction velocity.
Km mM Substrate conc. at which half of Vmax is reached.
[S] mM Substrate concentration.
[S]i mM Initial substrate concentration.

xiii
ABSTRACT
Dawes, Camron Scott. M.S.B.M.E., Purdue University, May 2017. Enzyme-ImmobilizedHydrogels to Create Hypoxia for In Vitro Cancer Cell Culture. Major Professor:Chien-Chi Lin.
Hypoxia is a critical condition governing many aspects of cellular fate processes.
The most common practice in hypoxic cell culture is to maintain cells in an incubator
with controlled gas inlet (i.e., hypoxic chamber). This thesis describes the design and
characterization of enzyme-immobilized hydrogels to create solution hypoxia under
ambient conditions for in vitro cancer cell culture. The first objective of this the-
sis was to modify glucose oxidase (GOX) for copolymerization with poly(ethylene
glycol)-diacrylate (PEGDA) to form GOX-immobilized PEG-based hydrogels. The
effect of soluble GOX or acrylated GOX on sustaining hypoxia was evaluated under
ambient air condition (i.e., with constant oxygen diffusion from the air-liquid inter-
face). The second objective of this thesis was to use the GOX-immobilized hydrogel
system to create hypoxia for in vitro culture of cancer cells, including Molm14 (acute
myeloid leukemia (AML) cell line) and Huh7 (hepatocarcinoma cell (HCC) line). Un-
der ambient air conditions required for cell culture, the GOX-immobilized hydrogels
were able to establish and sustain in vitro hypoxic conditions (<5% O2) for 6 to 24
hours. Additionally, cell viability and the expression of hypoxia associated genes,
including carbonic anhydrase 9 (CA9) and lysyl oxidase (LOX), were evaluated in
the presence of GOX-immobilized hydrogels. The third objective of this thesis was
to establish hypoxic gradients using the enzyme immobilized hydrogels, which were
placed in reservoirs of a commercially available channel slide. The combination of the
devices geometry and the enzyme-immobilized hydrogel that served as an O2 sink per-
mitted the generation of an O2-concentration gradient within the channel connecting
the two reservoirs.

1
1. INTRODUCTION
1.1 Physiological Hypoxia
Hypoxia, the lack of adequate oxygen (O2) supply in cells and tissues, is a physi-
ological condition of many healthy and diseased tissues in the body. For example, O2
concentration is around 20% in the lungs; ∼13% in the alveoli; ∼5% in the circulation
system and the bone marrow; and below 5% in multicellular tissues [1,2]. Hypoxia is
implicated in both normal physiological events and pathological conditions, including
ischemia, tumors, and inflamed tissues. As such, O2 concentration should be consid-
ered as a critical experimental condition when performing in vitro cell studies [1,3–5].
Hypoxia stabilizes the expression of hypoxia inducible factors (HIFs) [3], which are
heterodimeric transcription factors that regulate many downstream genes and cell
fate processes [3, 5], including proliferation, metabolism, apoptosis, stress response,
angiogenesis, and migration. Hypoxia is also a key factor regulating tumor growth
and drug resistance [2, 4–6].
1.2 Devices to Induce Hypoxia for Cell Culture
The gold standard to induce hypoxia ([O2]< 5%) for in vitro cell culture is
through using a cell culture chamber with controlled gas supplies (i.e., hypoxic cham-
ber). However, the time needed to reach equilibrium of O2 partial pressure between
the chamber atmosphere and the culture medium could take several hours [7]. An-
other challenge of using a hypoxic chamber is that O2 diffusion from the air to the cell
culture media occurs rapidly once the culture plates are removed from the hypoxic
chamber. Unfortunately, studies have shown that even brief exposure of some cells to
ambient air would cause drastic changes in certain hypoxia-related gene expression [8].
For this reason, a glovebox is required if one wishes to maintain hypoxia throughout
2
the experiment. The high front-end cost and dedicated space required for a hypoxic
chamber system also limit its implementation to selected laboratories. In addition, it
is challenging to perform real-time imaging or other instrument-based live cell assays
under hypoxia even with the use of a glovebox. Furthermore, one hypoxic chamber
system can only provide one fixed O2 tension for one experiment, which significantly
hinders the progress of scientific discovery related to varied O2 tensions (e.g., hypoxia
gradient, multiplex hypoxic drug testing, etc.).
Another method to induce hypoxia for cell culture is through introducing pre-
equilibrated media with lower O2 tension into the cell culture vessels, such as biore-
actors or microfluidic devices. Bioreactors are the standard operation for scale-up
production of cells or biological products but not ideal for mechanistic studies of
hypoxia-induced cellular response. On the other hand, a microfluidic culture system
permits real-time imaging of hypoxic cell culture and allows creation of complex hy-
poxia patterns within the confined microenvironment. For example, Peng et al. used
chemical scavengers to reduce aqueous O2 content within a patterned array of cells in
wells of a microfluidic device with geometry matching that of a 96-well plate [9]. This
method is beneficial in that multiple O2 profiles can be developed rapidly through
pre-equilibrated media in different wells of a single device. However, setting up mi-
crofluidic cell culture requires special instruments and project-specific microfluidic
design. The applicability of such system in higher or enhanced-throughput analysis
is also limited (e.g., drug screening and testing under various hypoxic conditions). It
is also not an easy task to integrate microfluidic system with three-dimensional (3D)
cell cultures.
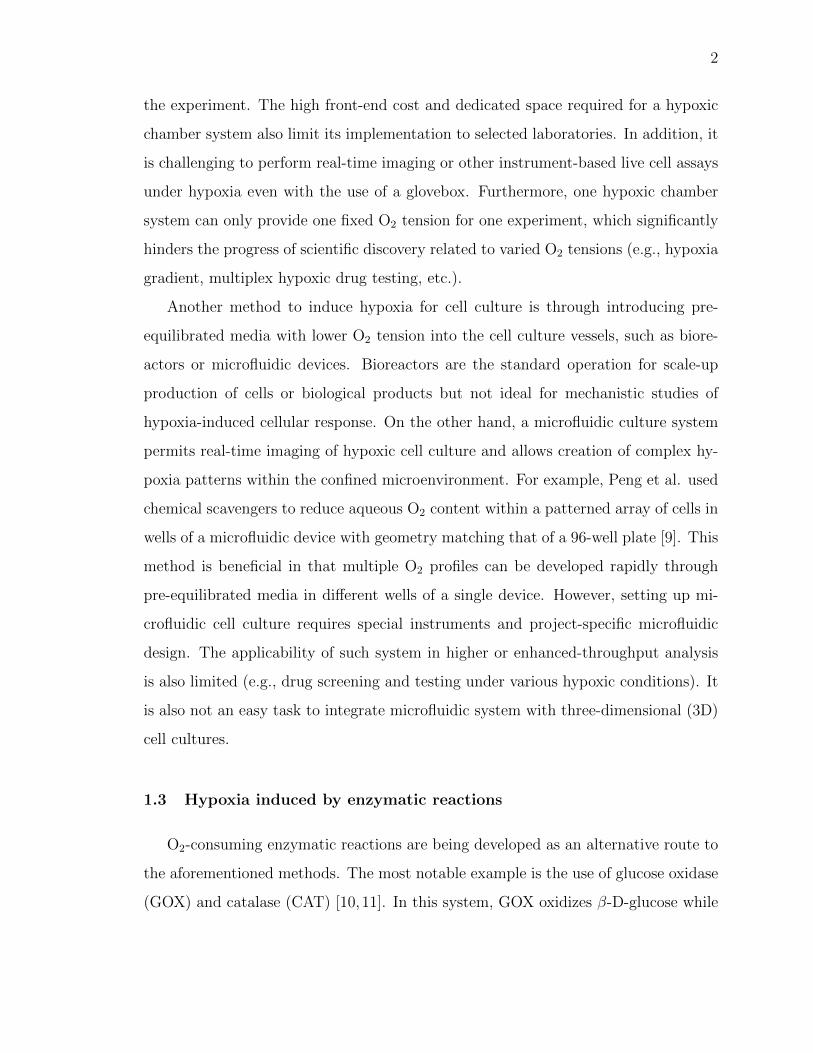
1.3 Hypoxia induced by enzymatic reactions
O2-consuming enzymatic reactions are being developed as an alternative route to
the aforementioned methods. The most notable example is the use of glucose oxidase
(GOX) and catalase (CAT) [10,11]. In this system, GOX oxidizes β-D-glucose while
3
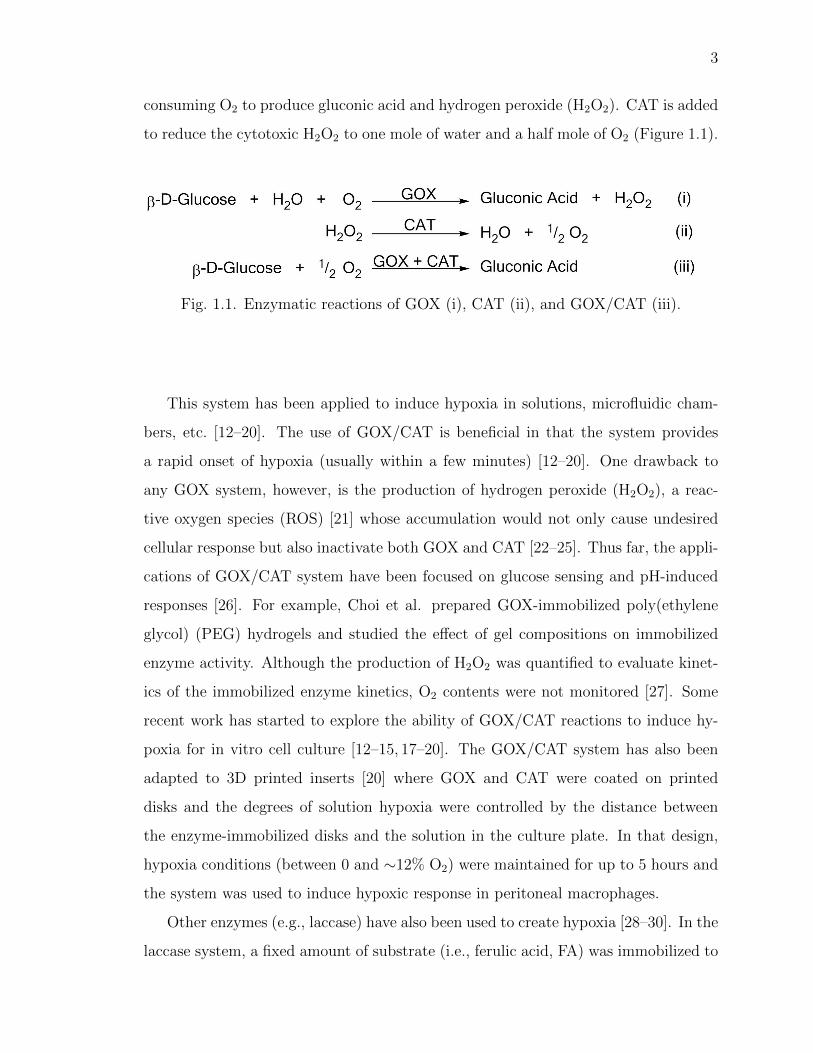
consuming O2 to produce gluconic acid and hydrogen peroxide (H2O2). CAT is added
to reduce the cytotoxic H2O2 to one mole of water and a half mole of O2 (Figure 1.1).
Fig. 1.1. Enzymatic reactions of GOX (i), CAT (ii), and GOX/CAT (iii).
This system has been applied to induce hypoxia in solutions, microfluidic cham-
bers, etc. [12–20]. The use of GOX/CAT is beneficial in that the system provides
a rapid onset of hypoxia (usually within a few minutes) [12–20]. One drawback to
any GOX system, however, is the production of hydrogen peroxide (H2O2), a reac-
tive oxygen species (ROS) [21] whose accumulation would not only cause undesired
cellular response but also inactivate both GOX and CAT [22–25]. Thus far, the appli-
cations of GOX/CAT system have been focused on glucose sensing and pH-induced
responses [26]. For example, Choi et al. prepared GOX-immobilized poly(ethylene
glycol) (PEG) hydrogels and studied the effect of gel compositions on immobilized
enzyme activity. Although the production of H2O2 was quantified to evaluate kinet-
ics of the immobilized enzyme kinetics, O2 contents were not monitored [27]. Some
recent work has started to explore the ability of GOX/CAT reactions to induce hy-
poxia for in vitro cell culture [12–15, 17–20]. The GOX/CAT system has also been
adapted to 3D printed inserts [20] where GOX and CAT were coated on printed
disks and the degrees of solution hypoxia were controlled by the distance between
the enzyme-immobilized disks and the solution in the culture plate. In that design,
hypoxia conditions (between 0 and ∼12% O2) were maintained for up to 5 hours and
the system was used to induce hypoxic response in peritoneal macrophages.
Other enzymes (e.g., laccase) have also been used to create hypoxia [28–30]. In the
laccase system, a fixed amount of substrate (i.e., ferulic acid, FA) was immobilized to

4
a polymer backbone. The FA-immobilized polymer was then crosslinked by laccase-
mediated enzymatic reaction, which also consumes O2. Recently, Lewis textitetal.
extended the timespan of laccase-induced hypoxia by limiting the diffusion of O2 into
the FA-crosslinked hydrogel. Together with the enzymatic O2 depletion, the system
was successfully used to study the impact of hypoxia on sarcoma cell invasion and
migration [31].
1.4 Methods of Enzyme Immobilization
Enzyme immobilization can be accomplished through physical adsorption/entrap-
ment, electrostatic forces, covalent crosslinking, or biomolecule binding. With any
method, it is important to retain a degree of affinity for the enzyme and its substrate
while maintaining enzymatic activity. Additionally it is important for immobilization
methods to be efficient such that the effective concentration of enzyme is sufficient
to produce a desired level of enzymatic product. If immobilized enzymes are used
for cell culture it is also ideal to use chemicals that are mild, thermostable, and bio-
compatible for immobilization so as to not affect cytocompatibility. PEG provides
a polymeric backbone for forming cytocompatible hydrogels. PEG itself is inert and
has no cellular recognition sites; it is easily modifiable with functional groups to pro-
vide crosslinking between monomer chains. Several common crosslinking schemes
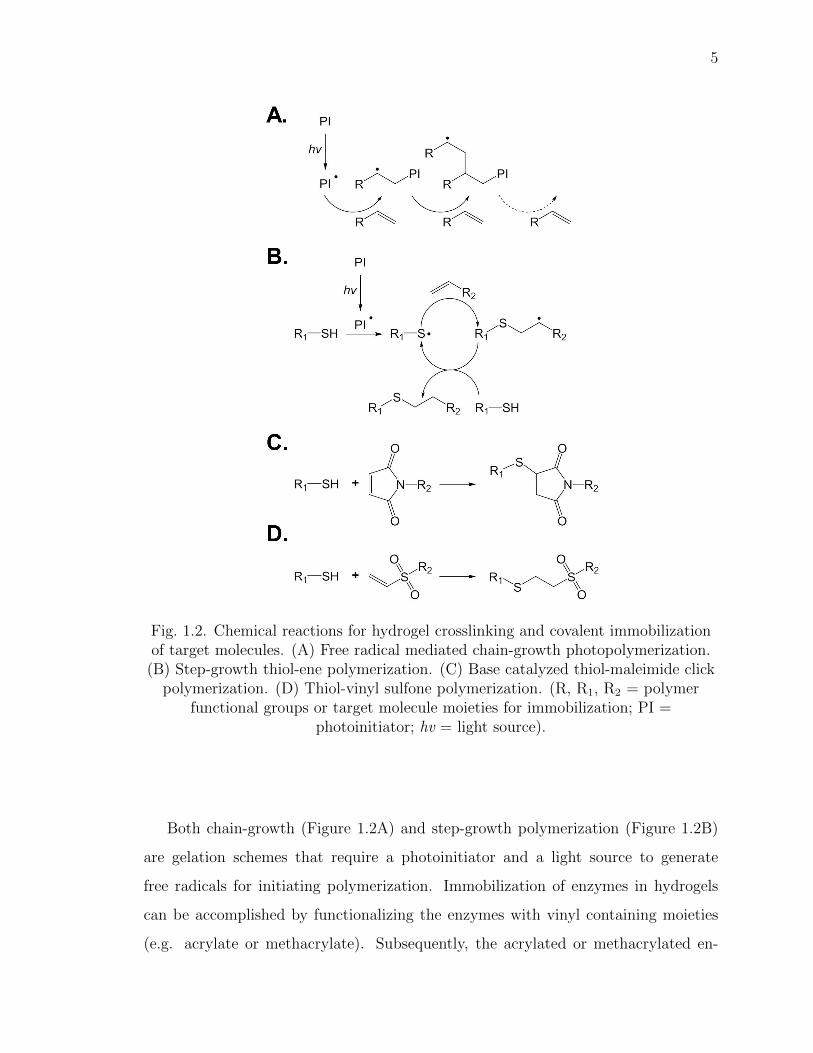
for PEG-based hydrogels are shown in Figure 1.2 [32]. These methods can be read-
ily adapted for enzyme immobilization, as long as appropriate functional groups are
functionalized on the enzyme surface.
5
Fig. 1.2. Chemical reactions for hydrogel crosslinking and covalent immobilizationof target molecules. (A) Free radical mediated chain-growth photopolymerization.
(B) Step-growth thiol-ene polymerization. (C) Base catalyzed thiol-maleimide clickpolymerization. (D) Thiol-vinyl sulfone polymerization. (R, R1, R2 = polymer
functional groups or target molecule moieties for immobilization; PI =photoinitiator; hv = light source).
Both chain-growth (Figure 1.2A) and step-growth polymerization (Figure 1.2B)
are gelation schemes that require a photoinitiator and a light source to generate
free radicals for initiating polymerization. Immobilization of enzymes in hydrogels
can be accomplished by functionalizing the enzymes with vinyl containing moieties
(e.g. acrylate or methacrylate). Subsequently, the acrylated or methacrylated en-

6
zyme can be co-polymerized within chain-growth polymerized hydrogels. Another
class of commonly used gelation method is Michael-type bioorthogonal click chem-
istry, which does not rely on light or photoinitiator (Figure 1.2C & D). Michael-type
chemistries involve the nucleophilic conjugation of an electron donor (called Michael-
donors) with an electrophilic C=C double bond neighboring a carbonyl group (called
Michael-acceptors) [33]. Often, thiol groups (-SH) are used as Michael-donors since
they are easily oxidized and can be found in proteins and peptides in the form of cys-
teine residues. Most proteins however only have a few thiol groups that are surface
accessible for chemical immobilization. To increase protein immobilization efficiency,
chemical modification (e.g., thiolation with Trauts reagent) is necessary to afford
additional thiol groups on the proteins [34].
1.5 Implications of Hypoxia Gradients in Cancer Cell Culture
Hypoxia is commonly implicated with tumor physiology. During tumor devel-
opment, cells rapidly proliferate and form irregular vasculature and structural ge-
ometries. This irregular vasculature combined with cellular O2 consumption and the
diffusion limit of O2 in tissue results in a radial gradient of O2 concentration to exist
within tumors. Often, lowest O2 concentration is found in the tumor core and in-
creases as moving outward towards the periphery. It is also possible tumor growth to
occur next to arteries. O2 also decreases within the tumor the further away from the
artery one inspects. Tumors with sections of tissue having less than ∼1.4% O2 are
correlated to increased risk of metastasis, remission, and resistance to radiotherapy
treatment [35–38]. Understanding the correlation between tumor growth and hypoxia
could lead to better treatment regimens at different stages of cancer physiology. With
this goal, Grimes et al., developed and validated a mathematical model to describe
the diffusion limit of O2 within different sized cancer cell spheroids (a tumor like cell
model) [39]. They found that the diffusion limit of O2 within cell spheroids, and by
extension tumors, was ∼230 µm. It could be inferred that if a tumors mass exceeded
the radial distance of ∼230 µm from an artery there was little or no partial pressure

7
of O2 at the distal locations from the artery. This assumption could also be made for
tumors without close proximity to an artery, where if the tumors radius was larger
than ∼230 µm, pockets of tissue with no partial pressure of O2 would develop in the
center mass.
Within hypoxic areas with O2 less than 1.4%, hypoxia inducible factors can in-
duce the expression of matrix remodeling enzymes. One such enzyme is Lysyl oxidase
(LOX), which crosslinks lysine or hydroxylysine residues on collagen strands which
causes an increase overall ECM stiffness [38,40,41]. A stiffer ECM stimulates migra-
tion of the tumor cells to invade surrounding tissues. With its correlation to tumor
cell metastasis, the expression of LOX is often used as a prognosis indicator [38,40,41].
Carbonic Anhydrase IX (CA9), a transmembrane glycoprotein, is also upregulated
under hypoxia. CA9 catalyzes the reversible transformation of carbon dioxide to car-
bonic acid, whose accumulation leads to environment acidification, which is believed
to contribute to tumor growth and tissue invasion. Currently CA9 expression is used
as a prognostic indicator of intratumoral hypoxia, induced angiogenesis, high cancer
relapse rate and low survival [42,43].

8
2. OBJECTIVES
2.1 Overview
This thesis presents a simple immobilized enzyme strategy for inducing hypoxia
within and surrounding the PEG-based hydrogel for in vitro cancer cell culture. The
ability of GOX, PEG-acrylate modified GOX (i.e., GOXPEGA), and GOX-immobilized
hydrogels to induce solution hypoxia was systematically studied. Furthermore, GOX-
immobilized hydrogels were utilized to induce hypoxia for in vitro cell culture. Anchorage-
independent acute myeloid leukemia cells (Molm14) and adherent hepatocarcinoma
cells (Huh7) were used to evaluate the effect of enzyme induced hypoxia on cancer
cell fate, including cell viability, proliferation, and hypoxia-associated gene expression.
Finally, immobilized GOX hydrogels were used to induce hypoxia within specialized
channel slides for future investigation on the effect of oxygen gradients on cell migra-
tion.
2.2 Objective 1: Synthesize enzyme immobilized hydrogels for inducing
hypoxia.
This objective focuses on the effect of using GOX and CAT to control O2 ten-
sion in solution and in hydrogel. GOX was modified with Acryl-PEG-SVA to yield
GOXPEGA, which permitted its covalent immobilization within PEGDA hydrogels.
O2 tension was characterized both at the interior and exterior of the GOXPEGA hy-
drogels. The effects GOXPEGA gels combined with CAT and additional glucose on
O2 tension and H2O2 production were also examined.
9
2.3 Objective 2: Evaluate hypoxia inducible hydrogels on cancer cell fate
in vitro.
This objective focuses on developing the GOXPEGA gel system for in vitro hy-
poxic cell culture. The cytocompatibility of enzyme-free and GOXPEGA-immobilized
PEGDA hydrogels was evaluated using anchorage-dependent HCC line Huh7 and
anchorage-independent AML line Molm14. The expression of hypoxia associated
genes, including CA9 and LOX, were examined to assess the ability of the GOXPEGA
hydrogels to induce hypoxic cellular response.
2.4 Objective 3: Establish hypoxia gradients using enzyme immobilized
hydrogels.
For the third objective, the goal was to develop a gradient of O2 within a com-
mercially available channel slide suitable for cell culture and in situ monitoring of
cell migration. GOXPEGA gels were placed within two reservoirs connected by a cell
culture channel. O2 content was evaluated in the reservoirs open to ambient air. The
O2 data obtained from the two reservoirs were used in conjunction with a mathemat-
ical model to semi-empirically predict the O2 concentration along the channel as a
function of time.

10
3. MATERIALS AND METHODS
3.1 Materials
Linear PEG (Mn = 2 kDa) was purchased from Sigma-Aldrich. Glucose ox-
idase (0243-500KU) and catalase (LS001847) were purchased from Amresco and
Worthington Biochemical, respectfully. Acrylate-PEG-succinimidyl valerate (Acryl-
PEG-SVA) was obtained from Laysan Bio Inc. Zeba Spin Desalting Columns (7K
MWCO), 2,4,6-trinitrobenzene sulfonic acid (TNBSA), and β-D-glucose were pur-
chased from Thermo Scientific. Penicillin-streptomycin, antibiotic-antimycotics, fetal
bovine serum (FBS), Roswell Park Memorial Institute media (RPMI), and Dulbeccos
modified Eagles medium (DMEM) were acquired from Life Technologies. HEPES and
Dulbeccos phosphate-buffered saline (DPBS) were purchased from Lonza. Membrane
culture plate inserts (PIXP-012-50) were purchased from EMD Millipore. Tryphan
blue and AlamarBlue reagents were purchased from Mediatech and Fisher Scientific,
respectfully.
3.2 Macromer synthesis and characterization
PEG-diacrylate (PEGDA) was synthesized according to an established proto-
col [44] and characterized with 1H-NMR (Bruker 500). The degree of PEGDA func-
tionalization was around 89% (Figure A.1). Photoinitiator lithium aryl phosphonate
(LAP) was synthesized as described elsewhere [45].
For covalent enzyme immobilization within the hydrogel, glucose oxidase was acry-
lated using Acryl-PEG-SVA [27, 46]. Briefly, the enzyme was first dissolved at 20
mg/mL in PBS supplemented with 2 mM EDTA (pH 8.5) and 50 mM sodium car-
bonate. Acryl-PEG-SVA was added at 200x molar excess to enzyme concentration
and the reaction was allowed to proceed at room temperature for 2 hours with stir-

11
ring. During the reaction, primary amines on the surface of the enzyme reacted with
SVA groups to afford PEG-acrylate (PEGA)-modified GOX (GOXPEGA). Unreacted
macromers were removed using size exclusion chromatography columns (Zeba Spin
Desalting column). Un-modified GOX at the same concentration was also passed
through the columns and used as controls to account for any loss/entrapment of
enzyme within the columns. Following synthesis, both GOX and GOXPEGA were
assayed using TNBSA assay to determine the degree of PEGA functionalization. For
each assay, enzyme samples were diluted to 30-35 µg/mL. A series of lysine hydrochlo-
ride solutions (0-10 µg/mL, 200 µL/well) were used as standards. 100 µL of 0.01%
TNBSA reagent was added into wells of a 96-well plate, which was sealed and incu-
bated at 37◦C for 2 hours, followed by cooling for 5 minutes. Absorbance at 335 nm
was measured using a microplate reader (SynergyHT BioTek). The degree of PEGA
functionalization on GOX was determined as the concentration of remaining amine
groups on GOXPEGA over that of the un-modified GOX.
3.3 Characterization of enzymatic activity of GOXPEGA
To examine the enzyme activity of GOXPEGA, O2 consumption in the presence of
the enzyme and glucose was quantified. The changes in substrate (i.e., O2) content
over time in the presence of GOX or GOXPEGA (Vo = ∆[O2] / ∆Time) was defined
as the reaction velocity. Enzyme was dissolved PBS (pH 7.4) at 0.13 µM in a 2 mL
microtube with constant stirring at 25◦C. The O2 consumption reactions were carried
out under ambient air with constant O2 diffusion from the air to mimic actual cell
culture conditions. The Stock β-D-glucose solution was injected at the start of every
measurement to give starting concentrations of 0.30 to 25 mM [S]i. Dissolved O2
concentration was monitored for 3 minutes using an O2 probe and meter (Microx4,
PreSens). O2 contents were plotted as a function of time and the initial linear portion
of the curve was used for Vo calculation (change in substrate concentration over time).
Non-linear regression analysis and curve fitting was applied to paired Vo and [S]i
using the equation Vo =Vmax[S]/(Km + [S]). In the equation, Vmax is the theoretical

12
maximum enzyme reaction velocity and Km is the Michaelis-Menten constant, which
is the substrate concentration at which half of Vmax is reached.
3.4 Synthesis and characterization of enzyme-immobilized hydrogels
All macromer solutions were sterilized by passing through 0.22 µm syringe filters.
PEGDA hydrogels (15 wt%) were polymerized aseptically through radical mediated
photopolymerization in the absence or presence of GOXPEGA monomer (6 mg/mL),
and LAP (1 mM) as the photoinitiator. 60 µL gels were injected between two glass
slides separating by Teflon spacers (2 mm) and gelation was initiated with a UV lamp
(365 nm, 5 mW/cm2, 2 min exposure). Following photopolymerization, hydrogels
(∼3.1 mm diameter x 2 mm thickness) were incubated in DPBS for 24 hours at 37◦C.
O2 concentration in solution was measured with a dipping-type O2 sensor (Mi-
crox4, PreSens). For solution based measurements, the probe was extended to ∼2
mm above the bottom of the 24 well plate or 1 mm above the gel (∼2 mm from
the liquid-air interface). To measure the H2O2 produced during the reactions, 10 µL
aliquots of the solutions were collected and quantified with a Quantichrom Peroxide
Assay Kit following the manufacturers protocol (BioAssay Systems).
3.5 Cell culture and viability assays
A suspension cell type, human acute myeloid leukemia (AML) cells Molm14,
was purchased from Leibniz Institute, German Collection of Microorganisms and
Cell Cultures. Cells were maintained in RPMI media supplemented with 10% fetal
bovine serum (FBS) and 1% penicillin-streptomycin, 25 mM HEPES, and 25 mM
β-D-Glucose. 400,000 cells/mL of Molm14 cells were seeded per well in non-treated
24 well plates. GOXPEGA gels (15 wt% PEGDA, 6 mg/mL GOXPEGA, 60 µL per
gel) were added to half of the wells (one gel per well) containing 0.54 mg/mL CAT.
Remaining wells were placed with gels without immobilized enzyme. In vitro O2 con-
centration was measured ∼1 mm above the hydrogel with a dipping-type O2 sensor
(PreSens). Adherent cell type human hepatocarcinoma cells (Huh7) were grown in

13
high glucose DMEM supplemented with 10% FBS, 1% antibiotic antimycotics, and
25 mM HEPES. Cells were seeded on treated 24 well plates with 1 mL per well of
cell suspension (60,000 cells/mL) and allowed to grow/spread for 48 hours prior to
the onset of the experiments, at which time (labeled as 0 hours) culture media was
refreshed in all wells. At the onset of the experiment, membrane inserts containing
GOXPEGA gels were placed in the wells and the media was supplemented with 0.54
mg/mL CAT. Half of the wells only had media refreshed and were used as control
groups for the experiment (no enzyme added).
Molm14 cell viability and density were characterized by tryphan blue staining
and counting with a hemocytometer. AlamarBlue reagent (10x dilution in media)
was used for assaying metabolic activity of Huh7 cells. After a 90 minute incubation
period, 200 µL from each well was transferred to a clear 96-well microplate and read
for fluorescence (excitation/emission: 560/590 nm).
3.6 RNA isolation and real time PCR
RNA isolation was carried out using NucleoSpin RNA II kit (Clontech). Briefly,
600 µL of lysis buffer was added to each well containing cells. Cell lysates were snap
frozen and stored in -80◦C until assay. After thawing the lysates, 600 µL of 70% RNase
free ethanol was added, pipetted vigorously, and then run through NucleoSpin RNA
columns. After desalting/purification steps, RNA was eluted with DNase/RNase-free
H2O and quantified by spectroscopy (NanoDrop 2000, Thermo Scientific). Isolated
RNA was stored at -80◦C.
Complementary DNA was generated from the isolated total RNA by using Prime-
Script RT reagent kit (Clontech, TaKaRa). Gene expression was analyzed by real time
quantitative PCR using SYBR Premix Ex Taq II Kit (Clontech, TaKaRa). The kit
components, cDNA, and primers were mixed in a PCR plate and analyzed on a 7500
Fast Real-Time PCR machine (Applied Biosystems). Thermocycling parameters were
one cycle at 95◦C for 30s, followed by 95◦C for 3s, 60◦C for 30s, and repeat for 45
cycles. Gene expression results were analyzed using 2−∆∆CT methodology. For each

14
experimental condition, cycle count was first standardized to ribosomal 18S house-
keeping gene (∆CT level) and then normalized with respect to the media control
group for that specific time point (∆∆CT level; media control values were set as
one-fold). Table A.1 lists all primer sequences used for real-time PCR.
3.7 Oxygen Gradient Development & Mathematical Modeling
For O2 gradient experiments, specialized channel slides were purchase from ibidi
(GmbH, Munich, Germany, CAT# 80111, µ-Slide-1). Each slide had two reservoirs
(A and B) connected by a 50 mm long channel (Figure 3.1):
Fig. 3.1. CAD diagram of the ibidi channel slide with approximate dimensions. (A)Top view. (B) Isometric view. (C) Front view. (D) Side view. According to
manufacturer specifications, channel volume is 100 µL and reservoir volume is 600µL (each). Diagrams were made using PTC Creo Parametric.
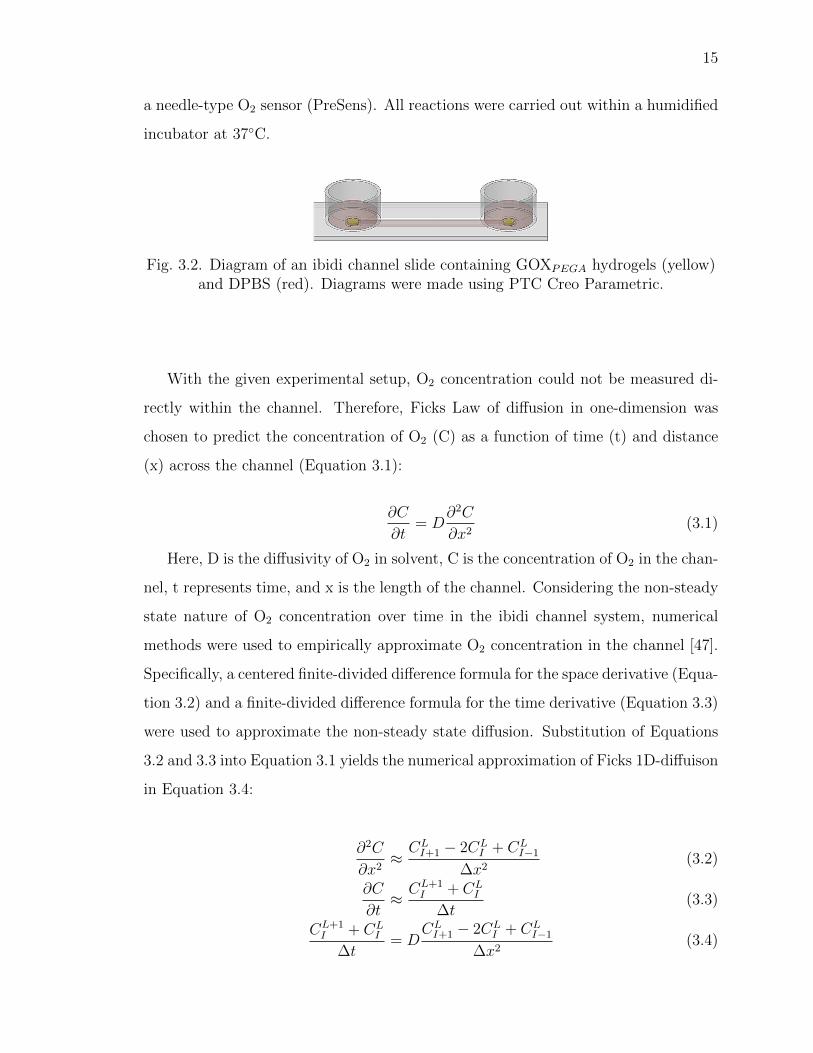
Plates were filled with 25 mM β-D-glucose solution supplemented with 1% antibi-
otic antimycotics, and one GOXPEGA gel was placed in each well (Figure 3.2). O2
concentrations as a function of time were recorded at ∼1 mm above the hydrogel with
15
a needle-type O2 sensor (PreSens). All reactions were carried out within a humidified
incubator at 37◦C.
Fig. 3.2. Diagram of an ibidi channel slide containing GOXPEGA hydrogels (yellow)and DPBS (red). Diagrams were made using PTC Creo Parametric.
With the given experimental setup, O2 concentration could not be measured di-
rectly within the channel. Therefore, Ficks Law of diffusion in one-dimension was
chosen to predict the concentration of O2 (C) as a function of time (t) and distance
(x) across the channel (Equation 3.1):
∂C
∂t= D
∂2C
∂x2(3.1)
Here, D is the diffusivity of O2 in solvent, C is the concentration of O2 in the chan-
nel, t represents time, and x is the length of the channel. Considering the non-steady
state nature of O2 concentration over time in the ibidi channel system, numerical
methods were used to empirically approximate O2 concentration in the channel [47].
Specifically, a centered finite-divided difference formula for the space derivative (Equa-
tion 3.2) and a finite-divided difference formula for the time derivative (Equation 3.3)
were used to approximate the non-steady state diffusion. Substitution of Equations
3.2 and 3.3 into Equation 3.1 yields the numerical approximation of Ficks 1D-diffuison
in Equation 3.4:
∂2C
∂x2≈CL
I+1 − 2CLI + CL
I−1
∆x2(3.2)
∂C
∂t≈ CL+1
I + CLI
∆t(3.3)
CL+1I + CL
I
∆t= D
CLI+1 − 2CL
I + CLI−1
∆x2(3.4)

16
Superscript and subscript within the numerical approximations denote data node
locations of time (I) and space (L). Equation 3.4 can be algebraically rearranged to
solve for the next unknown time increment:
CL+1I = CL
I + λ(CLI+1 − 2CL
I + CLI−1), λ =
D∆t
(∆x)2(3.5)
Equation 3.5 is applicable to all distances between two points and provides an
empirical means to calculate values as a function of time and distance for future
points in the channel (Figure 3.3).
Fig. 3.3. Numerical method for simulating oxygen tension within an ibidi channelslide. Initial condition nodes are outlined in blue. Boundary condition nodes areoutlined in yellow. The stacked green boxes represent the node values used foraveraging for a given set of time and location O2 concentrations as describe by
Equation 3.5.
Initial conditions within the channel were set to normoxic O2 concentration (∼19%)
and boundary O2 concentrations at x = 0 mm and x = 50 mm were set to values
measured experimentally in reservoirs A and B. Diffusivity used for O2 in the aqueous
environment was 2.7x10⁻⁵ cm2/s. Step values were 0.25 hour for time and 5 mm for
distance. O2 values for every replicate in every experimental condition had numerical
mesh data calculated and then averages were calculated for corresponding time and
distance nodes among the replicates.

17
3.8 Statistics
GraphPad Prism 5 was used for all curve fitting and statistical analyses. Sig-
nificance comparison between experimental groups was performed using Two-Way
ANOVA with Bonferroni post testing. Michaelis-Menten parameters for GOX and
GOXPEGA were generated with the non-linear regression suite in GraphPad Prism 5
software. O2 gradient mathematical modeling was done in Matlab and the code can
be found in the appendix section. All experiments were conducted a minimum of
three times with data presentation as the mean ± standard error of the mean (SEM).
One, two, or three asterisks represent p < 0.05, 0.01, or 0.001, respectively.

18
4. RESULTS AND DISCUSSION
4.1 Enzyme-mediated hypoxia generation
GOX/CAT systems have been used to induce pH changes in aqueous environment
due to the production of gluconic acid (Figure 1.1). To gain insights into the capability
of this enzymatic system on inducing hypoxia in solution, the reduction of O2 was
quantified in aqueous buffers supplemented with different concentrations of GOX in
the absence (Figure 4.1A) or presence (Figure 4.1B) or CAT. The O2 tensions of the
buffers were monitored using an O2 sensor and recorded as a function of time. As
expected, higher concentrations of GOX were able to deplete O2 faster. As shown
in Figure 4.1A, O2 tension was reduced within 5 minutes to ∼6% and ∼2.5% when
2.25 µg/mL or 4.5 µg/mL of GOX was added, respectively. With the inclusion of
9.8 µg/mL of CAT in the solution, the rate of O2 consumption was slowed down to
∼9% and 3.2% within 5 minutes (Figure 4.1B). The decrease in O2 consumption is
not surprising as the addition of CAT produces one-half mole of O2 per mole of H2O2
consumed.

19
Fig. 4.1. Enzymatic generation of aqueous oxygen tension. (A) O2 consumptionprofile for GOX. (B) O2 consumption profile for GOX in the presence of 9.8 µg/mLCAT. All reactions were carried out in PBS, pH 7.4 at room temperature with 25
mM β-D-Glucose. (Mean ± SEM, n ≥ 3).
In order to fabricate enzyme-immobilized hydrogels capable of inducing hypoxia,
the primary amine groups on GOX were functionalized with Acryl-PEG-SVA (Figure
4.2) [27, 46]:
Fig. 4.2. Reaction scheme of GOX modification using Acryloyl-PEG-SVA. Proteinstructure for GOX was obtained from RCSB PDB (3QVP).
20
TNBSA assay results showed an average of 93 ± 1.7% (Mean ± SEM, N = 5) of
the primary amines on the surface of the enzyme were functionalized with Acryl-PEG.
The acrylate moieties on the surface of Acryl-PEG-GOX (i.e., GOXPEGA) permit its
homopolymerization with PEGDA to afford enzyme-immobilized hydrogels.
The modification, however, could affect the ability of GOXPEGA to consume O2.
As shown in Figure 4.3A, while un-modified GOX caused rapid O2 reduction (from
∼20% to ∼3.2% in 5 minutes) in solution, the ability of GOXPEGA to consume O2
was hindered after Acryl-PEG-SVA modification (from ∼20% to ∼5.9% within 5
minutes). To quantify the impact of polymer modification on its enzyme activity,
reaction velocities of GOX and GOXPEGA were measured and compared in Figure
4.3B.
Fig. 4.3. Effect of GOX modification on oxygen consumption profiles. (A) O2
consumption profile using soluble GOX or GOXPEGA, 9.8 µg/mL CAT, and 25mMβ-D-Glucose. (B) Reaction velocity of O2 consumption by GOX or GOXPEGA as afunction of substrate β-D-glucose concentration. Values were generated from using
0.260 µM GOX or GOXPEGA with 0.30 to 25 mM of β-D-glucose. All reactions werecarried out in pH 7.4 pBS with constant stirring at 25◦C. (Mean ± SEM, n ≥ 3).

21
Michaelis-Menten enzyme kinetic parameters were listed in Table 4.1. Maximum
reaction velocity, Vmax, was reduced for GOXPEGA to 0.664 mM·min−1, or approx-
imately 75% of that for GOX (0.880 mM·min−1). Additionally, Km, an estimate of
the dissociation constant for enzyme and substrate, was also decreased for GOXPEGA
at 1.1173 mM versus GOX at 4.380 mM.
Table 4.1. Michaelis-Menten constants of GOX and GOXPEGA.
Vmax (mM·min−1) Km (mM)
GOX 0.88 ± 0.05 4.38 ± 0.90
GOXPEGA 0.66 ± 0.03 1.17 ± 0.28
To evaluate the ability of the enzyme system to maintain hypoxia, O2 content
measurements were carried out for 72 hours. Figure 4.4 shows long term solution
hypoxia induced by GOX or GOXPEGA in the absence (Figure 4.4A) and presence
(Figure 4.4B) of CAT. Between GOX and GOXPEGA groups, O2 content was very
similar for all time points. Within the first 24 hours, O2 was maintained below 5%
but gradually increased to ∼13% by 72 hours (Figure 4.4A). The addition of CAT
did not affect O2 content, which was below 5% in the first 24 hours for both GOX
and GOXPEGA. The O2 content in both conditions rose to ∼16% and ∼18% at 50
and 72 hours, respectively.

22
Fig. 4.4. Effect of GOX modification on oxygen consumption profiles over extendedtime periods. (A,B) O2 consumption profiles of unmodified and acrylated GOX inthe absence (B) or presence (A) of soluble CAT (450 µg/mL). All reactions were
carried out in pH 7.4 PBS, at 25◦C, with 25 mM β-D-Glucose. (**p < 0.01. Mean± SEM, n ≥ 3).
4.2 GOXPEGA-immobilized hydrogels for inducing hypoxia
GOXPEGA was covalently immobilized within PEGDA hydrogels to provide a sim-
ple method for inducing solution hypoxia (Figure 4.5) [46]:
23
Fig. 4.5. Schematic of enzyme-immobilized hydrogel formation from poly(ethyleneglycol)-diacrylate (PEGDA), lithium arylphosphinate (LAP) and PEG-acrylate
modified glucose oxidase (GOXPEGA).
The ability of the immobilized enzyme to reduce O2 in the surrounding solution
and within the gel was measured with a needle type optical probe as shown in Figure
4.6.
Fig. 4.6. Schematic of O2 measurement within and outside of PEGDA hydrogel.The sensor probe was fully extended from the needle for measuring O2 tension
exterior to the hydrogel (left). To measure O2 content at the interior of the hydrogel(right), the optic fiber was recessed within its needle housing to prevent damage ofthe gel matrix to the probe. After penetration the fiber was extended to the tip of
the needle cannula so that it was exposed to the interior of the hydrogel.

24
With the needle type O2 probe, it was possible to measure O2 content outside
(left panel) or inside (right panel) the GOXPEGA immobilized hydrogels (Figure
4.7B). Control experiments using hydrogels without enzyme immobilization (i.e., (-)
GOXPEGA) showed that O2 content remained close to normoxia (17-20% O2 , Figure
4.7A). Furthermore, there was no significant difference between O2 content within
or outside of the enzyme-free hydrogels. With the use of GOXPEGA immobilized
PEG hydrogels, however, there was a rapid drop in the exterior (i.e., outside of the
GOXPEGA immobilized hydrogel) O2 tension within one hour, a level similar to that
with soluble enzyme (Figure 4.4A). O2 tension was roughly at ∼8% O2 for 48 hours
in solution with the GOXPEGA hydrogels. Conversely the O2 tension within the
GOXPEGA hydrogel quickly reached and maintained near anoxia (∼0% O2) for 48
hours. The O2 tension at the gel exterior had increased to ∼15% by 120 hours, while
that in the gel interior was still below 2%.
Fig. 4.7. Interior and exterior O2 consumption for immobilized GOXPEGA
hydrogels. Hydrogel (120 µL, with or without 4 mg/mL GOXPEGA) was formed by8 wt% PEGDA using 1 mM LAP as the photoinitiator. (**p < 0.01, ***p < 0.001.
Mean ± SEM, n ≥ 3).

25
4.3 Combined GOXPEGA-immobilized hydrogels and soluble CAT for in-
ducing hypoxia
Next, GOXPEGA-immobilized hydrogels were placed in buffer solution containing
catalase and the solution O2 content was measured (Figure 4.8A). After placing the
GOXPEGA gel, hypoxia was induced and sustained for at least 6 hours. By 24 hours,
the O2 content in solution without CAT returned to ∼14%, whereas it remained ∼6%
in the presence of CAT. By 48 hours, the O2 content returned to ∼14% and ∼16% for
solution with or without CAT, respectively. Increasing percent O2 over time would
indicate that some degree of enzyme activity was lost. Figure 4.8B shows that, in
the presence of CAT, H2O2 concentrations were 2 mM and 5 mM at 24 and 48 hours,
respectively. In the absence of CAT, however, H2O2 concentration increased to ∼9
mM at both time points.
Fig. 4.8. Effect of soluble CAT addition on O2 consumption and H2O2 productionby GOXPEGA gels. (A) O2 tension. (B) H2O2 accumulation. Hydrogels (60 µL)
were formed by 15 wt% PEGDA co-polymerized with 6 mg/mL GOXPEGA. CATgroup was 0.54 mg/mL in solution. All reactions were carried out in pH 7.4 DPBS
at 37◦C. (**p < 0.01. ***p < 0.001. Mean ± SEM, n ≥ 3).

26
To ensure that glucose was not exhausted during the GOX reaction, the solution
was supplemented with additional β-D-glucose at later time points. A 50 µL shot of
β-D-glucose (at 50 mM) was added to the solution (1000 µL) containing GOXPEGA
gel 5 minutes before O2 detection (at 24 and 48 hours). As shown in Figure 4.9A
and 4.9B, bolus addition of glucose did not significantly affect the O2 content or the
H2O2 concentration in solution.
Fig. 4.9. Effect of additional glucose and soluble CAT addition on O2 consumptionand H2O2 production by GOXPEGA gels. (A) O2 tension. (B) H2O2 accumulation.Additional bolus injections of glucose (50 µL of 500 mM) were delivered 5 minutes
before measuring O2 at 24 and 48 hour time points. Hydrogels (60 µL) were formedby 15 wt% PEGDA co-polymerized with 6 mg/mL GOXPEGA. All reactions werecarried out in pH 7.4 DPBS at 37◦C with 0.54 mg/mL CAT in solution. (Mean ±
SEM, n ≥ 3).
To test whether replacing a new GOXPEGA gel would prolong hypoxia in the
solution, the old gel was removed after 24 hours and a freshly prepared GOXPEGA gel
(identical formulation) was placed in the same well. Additionally, freshly prepared
CAT solution was also added. Figure 4.10 shows that the O2 content was maintained
at ∼5% at 30 hours (i.e., 6 hours post gel replacement), whereas the O2 content was

27
∼9% in the control group (i.e., without replacing GOXPEGA gels). However, the O2
content in both conditions increased to above 14% at 48 hours.
Fig. 4.10. Effect of replacing GOX-immobilized hydrogel on solution O2 tension.Old GOX-immobilized gels were replaced with new GOX-immobilized gels along
with fresh CAT after 24 hours. Hydrogels (60 µL) were formed by 15 wt% PEGDAcopolymerized with 6 mg/mL GOXPEGA. All reactions were carried out in pH 7.4
DPBS at 37◦C with 0.54 mg/mL CAT in solution. (**p < 0.01. Mean ± SEM, n ≥6).
4.4 Cytocompatibility of enzyme-immobilized hydrogels
Figure 4.11 shows the cytocompatibility of enzyme-free (i.e., PEGDA only) and
GOX-immobilized hydrogels. Molm14 cell viability was maintained above 95% over
the course of 48 hours in the presence of an enzyme-free PEGDA hydrogel (Figure
4.11A). These cells were also proliferating over time, as indicated by steady increase in
cell density (Figure 4.11B). When a GOXPEGA gel was placed together with Molm14
cells (with media-supplemented CAT), cell viability in the initial 24 hours was com-
parable to that in the media-only control (around 90%, Figure 4.11C). However, after
48 hours of in vitro culture, Molm14 cell viability declined sharply to ∼55%. In

28
addition to the decreased cell viability after 48 hours, a similar trend can be seen
with cell density over time (Figure 4.11D). Specifically, there was no significant dif-
ference in cell density between the control and experimental group at 6 hours (i.e.,
∼3.6 x 10⁵ cells/mL). By 48 hours the Molm14 cell density in the media-only control
group had increased to ∼5.5 x 10⁵ cells/mL, whereas the Molm14 cell density in the
GOX-immobilized hydrogel group decreased significantly to ∼2.2 x 10⁵ cells/mL.
Fig. 4.11. Cytocompatibility of PEGDA hydrogels with or without immobilizedGOXPEGA. Molm14 cell viability (A, C) and density (B, D) when cultured in theabsence (Enzyme-free Gel; A & B) or presence (C, D) of immobilized (6 mg/mL)
GOXPEGA Gel + CAT. Hydrogels (60 µL) were formed by 15 wt% PEGDAcopolymerized with 6 mg/mL GOXPEGA. CAT in media was 0.54 mg/mL. (*p <
0.05. ***p < 0.001. Mean ± SEM, n ≥ 3).

29
4.5 Enzyme-induced hypoxia in the presence of cells
The main focus of this study was to develop an enabling material technology for
facilitating a wide variety of in vitro cancer cell culture. Anchorage-independent acute
myeloid leukemia (AML) cell line Molm14 and anchorage-dependent hepatocarcinoma
cell (HCC) line Huh7 were chosen to test the utility of the hypoxia-inducing hydrogels
[46]. The survival and progression of these cells, just like many other cancer cell types,
were significantly affected by O2 tension. GOXPEGA immobilized hydrogels were
prepared and added to anchorage-independent Molm14 cells and cultured directly.
As shown in Figure 4.12A, solution hypoxia was rapidly induced and maintained
below 5% O2 from 6 to 24 hours. By 48 hours, however, O2 concentration had risen
to near normoxia (17-20% O2), a result consistent with the cell-free measurements
shown in Figure 4.8A and 4.9A.
30
Fig. 4.12. Effect of enzyme-induced hypoxia on cell fate in vitro. O2 profile (A, C)and CA9 mRNA expression (B, D) in Molm14 (A, B) or Huh7 cells (C, D) culturedin the presence of a GOXPEGA (6 mg/mL) immobilized 15 wt% PEGDA hydrogel.
CAT in media: 0.54 mg/mL. CoCl2 (150 µM) was added separately as an additionalcontrol group (*p < 0.05, **p < 0.01, ***p < 0.001. Mean ± SEM, n ≥ 3).
For anchorage-dependent Huh7, GOXPEGA immobilized hydrogels were placed in
a standard transwell device and cultured with the cells adhered to the surface of a 24
well plate. The purpose of using a transwell device was to prevent direct contact of

31
the hydrogel with the cells, which could mechanically disrupt cell attachment. Figure
4.12C shows that O2 profile development was similar to that for Molm14 cells. Low
O2 concentration was reached quickly and maintained up to 24 hours. By 48 hours,
the O2 content had returned to almost normoxia. As expected, the addition of CoCl2
in cell culture media did not change O2 tension (Figure 4.12C).
4.6 Effect of enzyme-induced hypoxia on hypoxic gene expression
In addition to cell viability, the expression of hypoxia associated gene carbonic
anhydrase 9 (CA9) in Molm14 cells was evaluated at 6 and 24 hours of culture in
the presence of GOX-immobilized hydrogel. As shown in Figure 4.12B, the enzyme-
induced hypoxia increased the expression of CA9 significantly compared with control
groups (∼3-fold and ∼10-fold higher at 6 and 24 hours of culture, respectively). For
Huh7 cells, the expression of CA9 and lysyl oxidase (LOX) was characterized after
the cells were exposed to the enzyme-immobilized hydrogel (Note: no detectable
LOX expression was found in Molm14 cells). In selected groups, CoCl2 was added as
another control for chemically stabilized hypoxic response. As shown in Figure 4.12D,
CoCl2 failed to upregulate CA9 expression in the first 24 hours. After the same period
of time in culture, the use of GOXPEGA gels + CAT led to a ∼20-fold increase in
CA9 expression in Huh7 cells. After 48 hours, the addition of CoCl2 caused ∼15-fold
upregulation in CA9 mRNA expression, which was much lower than that induced
by the enzyme-immobilized hydrogel group (∼80-fold higher). In Huh7 cells, LOX
mRNA expression was upregulated only in cells cultured with a GOXPEGA gel (∼2.5
fold, Figure 4.13). The addition of CoCl2 did not increase the expression of LOX in
Huh7 cells.

32
Fig. 4.13. Effect of GOX-immobilized hydrogel on LOX expression in Huh7 cells.CoCl2 (150 µM) was added separately as a control group. Cell culture medium wassupplemented with 0.54 mg/mL CAT. Hydrogels (60 µL) were formed by 15 wt%
PEGDA co-polymerized with 6 mg/mL GOXPEGA. (***p < 0.001. Mean ± SEM, n≥ 3).
4.7 Oxygen Gradient Development
To generate O2 gradients suitable for cell studies, a commercially available channel
slide (Figure 3.2) was chosen for its design that permits accommodation of GOXPEGA
gels and in vitro cell culture. First, O2 diffusion within the channel was simulated
numerically with a finite difference approximation of a one-dimensional diffusion equa-
tion (3.5). For boundary conditions, O2 concentration was held constant at each end
of the channel (i.e., in the reservoirs) to represent either O2-sinks or O2-sources. For
initial conditioning within the channel, O2 concentration was assumed to be normoxic
(∼19% O2) at all locations at 0 hours of the simulation. The results of numerical
simulation for specified boundary and initial conditions are shown in Figure 4.14:
33
Fig. 4.14. Empirical mesh-modeling of Ficks 1D-diffusion equation for O2
concentration as a function of time and distance across the channel between thereservoirs. Boundary concentrations at opposite ends of the channel were fixed at
(A) 19% and 3% or (B) 5% and 3% O2.
Figure 4.14A shows the simulation resulting from boundaries at 19% and 3% O2
at the left and right reservoir, respectively. At 4 hours of simulated O2 diffusion in
the channel, normoxic concentrations of O2 (17 to 20%) were predicted from the 0-35
mm mark while from the 35-50 mm mark O2 concentration drops from 18.1% to 3%.
At 12 hours, from the 25-50 mm mark, O2 concentration decreased monotonically
from 18.1% to 3%. By 36 hours, O2 dropped from 17.3% to 3% at the 10-50 mm
marks respectively. Finally, at 48 hours, a channel wide gradient from 19% to 3% O2
was predicted (from 0 to 50 mm mark).
Figure 4.14B shows the numerical simulation results using the second set of bound-
ary conditions of 5% and 3% O2 in the two reservoirs of the channel slide. For all
simulation time points, concentration in the channel had assumed a parabolic shape
with peak O2 concentration at the center of the channel from the 15-35 mm marks
with monotonically decreasing values to either the left or the right boundary condi-
tions. At 4 hours, the center of the channel (∼25mm mark) was ∼18% O2. As time

34
went on, O2 content at the center of the channel (∼25 mm mark) gradually dropped
to ∼11% and ∼7% at 24 and 48 hours, respectively. At each time point, O2 in the
channel sloped monotonically downward from the center (∼25 mm mark) to the edge
boundary conditions (at 0 and 50 mm marks).
Next, hydrogels with either 0.2 or 0.4 mg/mL GOXPEGA (20 µL volume) were
used within the reservoirs of the channel slide to generate O2 consumption over time.
Shown in Figure 4.15 are measured O2 values for the use of one or two gels within
the reservoirs of the channel slide as well as results of the numerical simulation of the
gradient development within the channel.
35
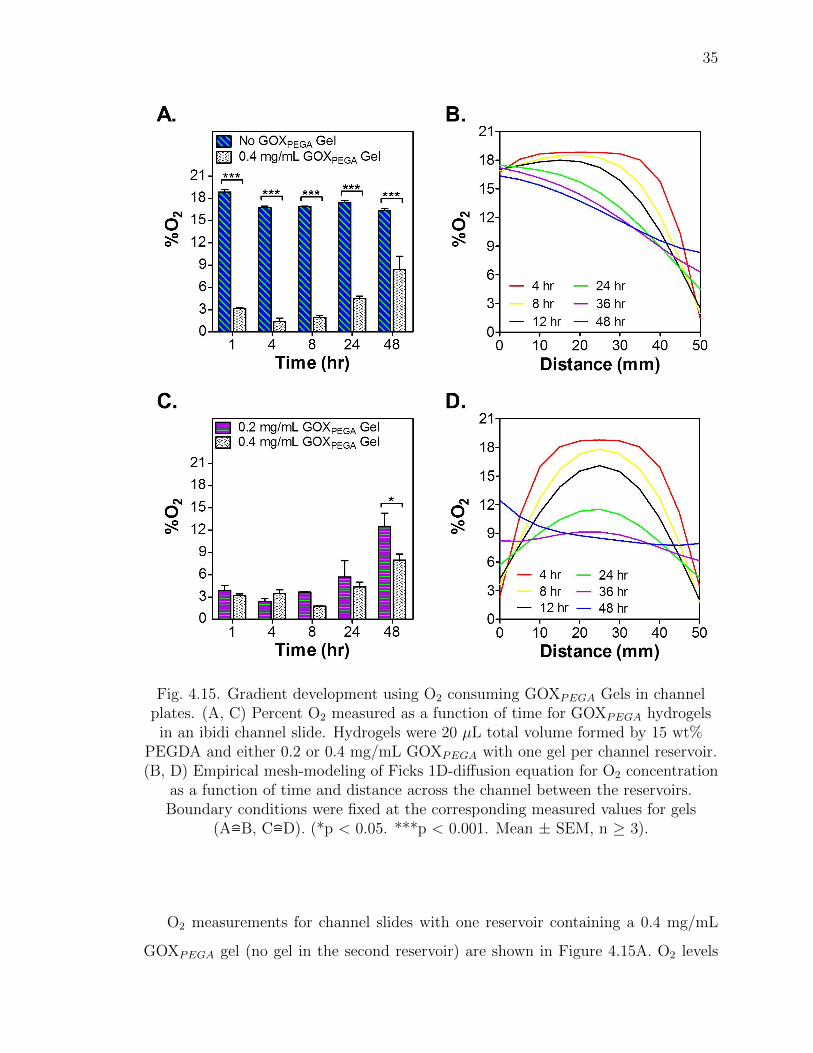
Fig. 4.15. Gradient development using O2 consuming GOXPEGA Gels in channelplates. (A, C) Percent O2 measured as a function of time for GOXPEGA hydrogels
in an ibidi channel slide. Hydrogels were 20 µL total volume formed by 15 wt%PEGDA and either 0.2 or 0.4 mg/mL GOXPEGA with one gel per channel reservoir.(B, D) Empirical mesh-modeling of Ficks 1D-diffusion equation for O2 concentration
as a function of time and distance across the channel between the reservoirs.Boundary conditions were fixed at the corresponding measured values for gels
(A=B, C=D). (*p < 0.05. ***p < 0.001. Mean ± SEM, n ≥ 3).
O2 measurements for channel slides with one reservoir containing a 0.4 mg/mL
GOXPEGA gel (no gel in the second reservoir) are shown in Figure 4.15A. O2 levels

36
for the no GOXPEGA gel reservoir were near normoxia for all time points (16% to
20% O2). For the 0.4 mg/mL GOXPEGA gel, O2 levels initially dropped and were
maintained below ∼4.5% O2 for up to 24 hours, and by 48 hours O2 content had risen
slightly to ∼8.3%. This result was again consistent with trends seen in other previous
cell free measurements shown in Figures 4.8A and 4.9A.
Using the experimentally obtained O2 data as boundary conditions at opposite
ends of the channel (Figure 4.15A), a semi-empirical simulation of O2 concentration
within the channel was developed (Figure 4.15B). Similar to that of Figure 4.14A,
at 4 hours of simulated O2 diffusion within the channel, normoxia (i.e., 17% to 20%)
was obtained from the 0-35 mm mark. On the other hand (again at 4 hours), O2
concentration drops from 18.0% to 1.4% from the 35-50 mm mark. By 12 hours, from
the 25-50 mm mark, O2 concentration monotonically decreased from 17.3% to 2.5%.
By 36 hours, from the 10-50 mm marks, O2 dropped from 17.0% to 4.5%. At 48
hours, the range of the gradient covered the entire channel (from 17.2% (at 0 mm) to
6.3% (at 50 mm)).
For the second case of a channel slide with two gels, Figure 4.15C shows the mea-
sured %O2 over time for reservoirs containing 0.2 mg/mL and 0.4 mg/mL GOXPEGA
gels. O2 levels for both sides within the first 8 hours were fairly similar at ∼4%. By
24 and 48 hours, however, the 0.2 mg/mL GOXPEGA gel had started to show higher
O2 tension (from 5% to 13% O2) compared to the 0.4 mg/mL GOXPEGA gel (from
4% to 8% O2).
Empirical simulation of O2 concentration between the wells is shown in Figure
4.15D. The O2 tension across the channel assumed a parabolic shape, similar to that
of Figure 4.14B. Within the first 4 to 36 hours, O2 concentration within the channel
was highest between the 20-30 mm marks (Figure 4.15D). At 4 and 8 hours, O2
concentration in the channel was predicted to be at ∼18% (20-30 mm marks) at
the center with decreasing concentration to the far ends of the channel where values
were ∼3% (0 and 50 mm marks). By 12 hours, using the same locations, the center
of the channel (20-30 mm marks) was ∼15.5% O2 with decreasing concentration to
either end of the channel at ∼3.2% O2 (0 and 50 mm marks).Then at 24 hours, again
37
using the same locations, O2 concentration at the center of the channel was ∼11.2%
dropping to ∼5.1% at the far ends. However, by 36 hours, O2 in the channel on the
left side was at 8.2% (0 mm mark), while the center was at 9.1% (25 mm mark),
and the right side at 6.2% (50 mm mark). After 36 hours, rising O2 measured in the
reservoirs caused an increase in the predicted %O2 in the channel. At 48 hours, from
the 0-30 mm mark, O2 concentration dropped from ∼12.5% to 8% while the rest of
the channel (30-50 mm mark) was at ∼8% O2.

38
5. SUMMARY & RECOMMENDATIONS
5.1 Summary
This thesis aimed to develop an enabling material strategy to create solution
hypoxia for in vitro cancer cell culture without using complex devices/instrument.
GOX-immobilized hydrogel was used as a proof-of-concept to demonstrate the abil-
ity of enzyme-immobilized gel to induce sustained hypoxia. In the first part of this
thesis, I established the concentration of GOX (4.5 µg in 1 mL buffer) required to
induce hypoxia (<5%) within 5 minutes (Figure 4.1A). As expected, the addition
of CAT partially replenished O2, leading to slight decrease in reaction velocity (Fig-
ure 4.1B). Chemical modification is necessary for the immobilization of GOX into
hydrogels but significant modification might result in the loss of enzymatic activity,
especially when the degree of enzyme modification achieved was more than 90% of
the available amine groups on enzyme surface. Analyses of enzyme reaction kinet-
ics revealed that chemical modification (i.e., PEG-acrylation) of GOX only caused
slight reduction of its O2 consumption ability (Figure 4.3B and Table 4.1) [46]. The
kinetic parameters of GOX obtained from this study were relatively low compared to
values reported in the literature [10]. This could be attributed to the differences in
experimental conditions and the methods for which enzyme activities were measured.
Conventionally, the activity of GOX is assayed by monitoring β-D-glucose concentra-
tion, whereas in the current study O2 concentration was detected. Although the O2
contributed from atmospheric air or from reduced H2O2 (by CAT or natural reduction
with a half-life of ∼10 minutes in cell culture environment, [14]) would complicate the
analysis results, the current detection method was necessary as the main purpose of
this project was to investigate whether enzyme-immobilized hydrogels could induce
solution hypoxia for in vitro cell culture under ambient conditions (i.e., with O2 dif-
fusion from the air). The slight reduction of activity in modified enzyme was likely

39
caused by changes in secondary and tertiary protein structure following significant
GOX surface modification [48]. Nonetheless, both unmodified GOX and GOXPEGA
were able to induce solution hypoxia (O2 < 5%) within a few minutes (Figure 4.3A)
and solution hypoxia was sustained for up to 24 hours (Figure 4.4). Additionally, no
statistically significant difference was observed between GOX and GOXPEGA activity
within the first 24 hours (Figure 4.4). Results seen were consistent to that reported by
Kang et al. where methacryloyl-modified GOX exhibited similar enzymatic activity
in solution compared with unmodified GOX [49]. It was also found that GOXPEGA co-
polymerized in PEGDA hydrogels was able to induce hypoxia rapidly after dropping
the gel in glucose-containing buffer solution. However, GOX-immobilized hydrogel
could only sustain solution hypoxia for 24 hours. The restoration of O2 tension in
the solution was not due to lost of enzyme activity as O2 tension at the interior of
the GOX-immobilized hydrogel was maintained below 2% for up to 5 days (Figure
4.7B). It was likely that constant O2 diffusion from the liquid-air interface supersedes
O2 consuming enzymatic reaction in the hydrogel. This hypothesis was supported by
the fact that replacing the old gel with a freshly prepared GOX-immobilized hydrogel
only prolonged hypoxia for a few hours (Figure 4.10).
Another possible reason was that some enzymes were deactivated by the accumu-
lation of acid by-product gluconic acid and H2O2. To test whether H2O2 deactivated
the enzyme, CAT was introduced in the solution to consume H2O2 (Figure 4.8). The
increase of O2 content in the solution (Figure 4.8A) coincided with the accumulation
of H2O2 levels (Figure 4.8B), supporting the likelihood of enzyme deactivation by ele-
vated H2O2 concentration. This phenomenon has been reported in membrane-bound
GOX and CAT system where both enzyme activities were reduced with increased
H2O2 concentrations over time [22,50]. It was not likely that the enzymatic reactions
depleted most of the substrate (i.e., β-D-glucose) after 24 hours, as the addition of ex-
tra β-D-glucose periodically before O2 tension measurement did not cause further O2
consumption. Whether there was additional glucose addition or not, no statistically
significant difference was found in O2 (Figure 4.9A) or H2O2 concentration (Figure
4.9B).
40
For the second part of this thesis, the utility of the immobilized enzyme system for
in vitro cell culture was demonstrated. Cell viability, proliferation, and the expression
of hypoxia-regulated genes (i.e., CA9 or LOX) in cells cultured in the presence of
GOX-immobilized hydrogels were characterized. Both CA9 and LOX are downstream
targets of HIF1α and are well-established genes associated with cancer metastasis
and metabolism in hypoxic environments [51, 52]. Detecting the expression of these
two genes allowed evaluation of the utility of the hypoxia-inducing hydrogels [46].
Results show that the expression of CA9 and LOX was significantly higher in Huh7
cells cultured with GOX-immobilized hydrogels (Figures 4.12D & 4.13). Molm14
cells also had increased CA9 expression (Figure 4.12B). However, no expression of
LOX was detected (control group included); there is also a lack of literature for LOX
expression with Molm14 cells or the sister Molm13 cell line. Nonetheless, similar data
for both CA9 and LOX expression was reported by Askoxylakis et al. where GOX
and CAT were dissolved in culture media to generate hypoxia for culturing head and
neck squamous carcinoma cells [15].
Hypoxic response in the cells can also be simulated using chemicals that upregu-
late or stabilize the expression of HIF, specifically HIF1α. Cobalt chloride (CoCl2) or
desferrioxamine are two examples of such chemicals [53]. Although this is a relatively
simple strategy to mimic hypoxic response in the cells, the use of chemical only regu-
lates cellular and molecular responses directly downstream of HIF. Furthermore, these
chemicals could affect cell survival, metabolism, and morphology differently compared
to real O2 deprivation [54]. Regardless of this, CoCl2 is often used as a standard
chemical means to induce hypoxic gene response in cells rather than an incubator
with prescribed O2 levels. Figures 4.12D and 4.13 both indicated that the GOXPEGA
hydrogels with CAT were faster at inducing hypoxic gene response as well as able
to induce a higher fold change versus that of CoCl2. Although GOX-immobilized
hydrogel was effective in inducing solution hypoxia under ambient conditions, these
gels appeared to hinder cell viability and proliferation after the cells were exposed to
the hydrogel system for longer than 24 hours. This was most likely attributed to the
accumulation of cytotoxic byproduct, namely gluconic acid and H2O2. This is not a

41
unique problem to my system as other GOX/CAT-induced hypoxia culture systems
(e.g., soluble or membrane-bound enzyme) also exhibited decreased cytocompatibility
after 24 hours of culture [15, 16, 19]. One potential solution for this drawback is to
replace the GOX-immobilized hydrogel and the CAT supplemented media frequently.
Providing fresh media and hydrogel allows hypoxia to quickly be reestablished and
maintained for periods lasting for at least 24 hours. Furthermore, media acidification
by gluconic acid could be reduced by supplementing cell culture media with HEPES,
which provides strong buffering effect without altering normal cell physiology.
Finally, for the third part of this thesis, channel slides were used in conjunction
with GOXPEGA gels to create hypoxia gradient (Figure 4.15). Owing to the geometry
of the slide itself, O2 concentration was only measured at the actual entrance to the
channel on either side within the reservoirs (∼1 mm directly above GOXPEGA gels).
By using a gel in one or both reservoirs in the channel, hypoxia was created at one or
both ends of the channel slide. Data generated for the O2 tension (Figure 4.15A &
C) was very similar to that of previous cell free measurements in that for reservoirs
with gels, O2 tension was ∼5% or less within the first 24 hours and by 48 hours had
risen to more than 10%. From the data generated in the reservoirs of the channel
slides, a mathematical model was applied to semi-empirically predict the O2 within
the channel over time (Figure 4.15B & D). In the first scenario, where one reservoir
was empty and the other reservoir had a gel, a monotonically decreasing gradient
of O2 developed across the width of the channel from 24 to 48 hours (Figure 4.15A
& B). In the second scenario where one gel was placed in each reservoir, simulation
results show bimodal O2 gradients developed within the first 12 hours in the channel
(4.15C & D). In other words, O2 concentration was highest at the center (20-30 mm)
with decreasing concentration to the left and right far ends of the channel (0 and 50
mm).
In summary, immobilized GOX was used to induce O2 tension at less than 10% O2
in solution for up to 24 hours. Secondly, the effect of hypoxia induced by the dual en-
zymes (i.e., immobilized GOX and soluble CAT) on cell culture was studied and found
to be cytocompatible for at least 24 hours. Hypoxia induced by GOX-immobilized

42
hydrogels led to increased expression of hypoxia associated genes CA9 and LOX.
Lastly, immobilized GOX gels were used to induce hypoxia gradients within special-
ized channel slides. Semi-empirical mathematical modeling predicted that monotonic
decreasing (only one GOX-immobilized gel placed in a reservoir) and bimodal (GOX-
immobilized gels placed in both reservoirs) gradients existed within the channel slides
during specific windows of time over the course of the experiment.
5.2 Recommendations
Future work will focus on expanding the window of hypoxia induced by the
enzyme-immobilized hydrogels. With the current GOX/CAT system, a simple method
for prolonged hypoxia would be to supplement with fresh enzyme. Additionally,
GOX/CAT induced hypoxia could also be expanded through the stabilization of the
enzymes from the H2O2 and gluconic acid being produced. Simple buffering chem-
icals like HEPES or glutathione can be used to neutralize the reaction byproducts.
Excipients (stabilizing molecules) represent a second method to stabilize the GOX/-
CAT enzymes. Two such stabilizers, trehalose, a non-reducing disaccharide, and silk
fibroin, a purified protein structure from cocoons of silk worms, have been known to
enhance long term functional activity of enzymes in hydrogels [55,56].
A second avenue of future work should focus on alternative O2-consuming enzymes
which do not produce enzyme-damaging (and often cytotoxic) byproducts like H2O2
and gluconic acid. Examples of O2 consuming enzymes in this category are laccase,
bilirubin oxidase, polyphenol oxidase, and catechol oxidase to name a few. Addi-
tionally, different enzymatic reaction speeds would create different levels of hypoxia
induction within a given time frame.
Finally, future studies should expand the use of enzyme-immobilized hydrogels
for hypoxic gradient creation. Cancer cell lines can be cultured with O2-consuming
immobilized-enzyme hydrogels within a channel slide. Using the semi-empirical mod-
eling, experimental time frames could be determined as to when it is appropriate to
investigate possible O2 gradient induced cellular migration in the channel slides.

LIST OF REFERENCES
43
LIST OF REFERENCES
[1] M. C. Simon and B. Keith, “The role of oxygen availability in embryonic devel-opment and stem cell function,” Nat Rev Mol Cell Biol, vol. 9, no. 4, pp. 285–96,2008.
[2] M. P. De Miguel, Y. Alcaina, D. S. de la Maza, and P. Lopez-Iglesias, “Cellmetabolism under microenvironmental low oxygen tension levels in stemness,proliferation and pluripotency,” Curr Mol Med, vol. 15, no. 4, pp. 343–59, 2015.
[3] G. L. Semenza, “Hif-1: mediator of physiological and pathophysiological re-sponses to hypoxia,” J Appl Physiol (1985), vol. 88, no. 4, pp. 1474–80, 2000.
[4] M. Hockel and P. Vaupel, “Tumor hypoxia: definitions and current clinical,biologic, and molecular aspects,” J Natl Cancer Inst, vol. 93, no. 4, pp. 266–76,2001.
[5] L. Liu and M. C. Simon, “Regulation of transcription and translation by hy-poxia,” Cancer Biol Ther, vol. 3, no. 6, pp. 492–7, 2004.
[6] A. Giaccia, B. G. Siim, and R. S. Johnson, “Hif-1 as a target for drug develop-ment,” Nat Rev Drug Discov, vol. 2, no. 10, pp. 803–11, 2003.
[7] C. B. Allen, B. K. Schneider, and C. W. White, “Limitations to oxygen diffusionand equilibration in in vitro cell exposure systems in hyperoxia and hypoxia,”Am J Physiol Lung Cell Mol Physiol, vol. 281, no. 4, pp. L1021–7, 2001.
[8] H. E. Broxmeyer, H. A. O’Leary, X. Huang, and C. Mantel, “The importance ofhypoxia and extra physiologic oxygen shock/stress for collection and processingof stem and progenitor cells to understand true physiology/pathology of thesecells ex vivo,” Current opinion in hematology, vol. 22, no. 4, pp. 273–278, 2015.
[9] C. C. Peng, W. H. Liao, Y. H. Chen, C. Y. Wu, and Y. C. Tung, “A microfluidiccell culture array with various oxygen tensions,” Lab Chip, vol. 13, no. 16, pp.3239–45, 2013.
[10] Q. H. Gibson, B. E. Swoboda, and V. Massey, “Kinetics and mechanism of actionof glucose oxidase,” J Biol Chem, vol. 239, pp. 3927–34, 1964.
[11] H. N. Kirkman and G. F. Gaetani, “Mammalian catalase: a venerable enzymewith new mysteries,” Trends Biochem Sci, vol. 32, no. 1, pp. 44–50, 2007.
[12] R. P. Baumann, P. G. Penketh, H. A. Seow, K. Shyam, and A. C. Sartorelli,“Generation of oxygen deficiency in cell culture using a two-enzyme system toevaluate agents targeting hypoxic tumor cells,” Radiat Res, vol. 170, no. 5, pp.651–60, 2008.

44
[13] G. Millonig, S. Hegedusch, L. Becker, H. K. Seitz, D. Schuppan, and S. Mueller,“Hypoxia-inducible factor 1 alpha under rapid enzymatic hypoxia: cells sensedecrements of oxygen but not hypoxia per se,” Free Radic Biol Med, vol. 46,no. 2, pp. 182–91, 2009.
[14] S. Mueller, G. Millonig, and G. N. Waite, “The gox/cat system: a novel enzy-matic method to independently control hydrogen peroxide and hypoxia in cellculture,” Adv Med Sci, vol. 54, no. 2, pp. 121–35, 2009.
[15] V. Askoxylakis, G. Millonig, U. Wirkner, C. Schwager, S. Rana, A. Altmann,U. Haberkorn, J. Debus, S. Mueller, and P. E. Huber, “Investigation of tumorhypoxia using a two-enzyme system for in vitro generation of oxygen deficiency,”Radiat Oncol, vol. 6, p. 35, 2011.
[16] K. Zitta, P. Meybohm, B. Bein, Y. Huang, C. Heinrich, J. Scholz, M. Steinfath,and M. Albrecht, “Salicylic acid induces apoptosis in colon carcinoma cells grownin-vitro: influence of oxygen and salicylic acid concentration,” Exp Cell Res, vol.318, no. 7, pp. 828–34, 2012.
[17] N. Rajan, A. Narayan, Z. Wu, P. Wu, C. H. Ahn, R. K. Narayan, and C. Li,“A novel oxygen tension programmable microfluidic system (oproms) for in vitrocell biology studies,” 2013 Transducers and Eurosensors XXVII: The 17th In-ternational Conference on Solid-State Sensors, Actuators and Microsystems, pp.412–415, 2013.
[18] M. C. Sobotta, A. G. Barata, U. Schmidt, S. Mueller, G. Millonig, and T. P.Dick, “Exposing cells to h2o2: a quantitative comparison between continuouslow-dose and one-time high-dose treatments,” Free Radic Biol Med, vol. 60, pp.325–35, 2013.
[19] Y. Huang, K. Zitta, B. Bein, M. Steinfath, and M. Albrecht, “An insert-basedenzymatic cell culture system to rapidly and reversibly induce hypoxia: investi-gations of hypoxia-induced cell damage, protein expression and phosphorylationin neuronal imr-32 cells,” Dis Model Mech, vol. 6, no. 6, pp. 1507–14, 2013.
[20] C. Li, W. Chaung, C. Mozayan, R. Chabra, P. Wang, and R. K. Narayan, “Anew approach for on-demand generation of various oxygen tensions for in vitrohypoxia models,” PLoS One, vol. 11, no. 5, p. e0155921, 2016.
[21] J. P. Fruehauf and J. Meyskens, F. L., “Reactive oxygen species: a breath of lifeor death?” Clin Cancer Res, vol. 13, no. 3, pp. 789–94, 2007.
[22] P. H. Tse and D. A. Gough, “Time-dependent inactivation of immobilized glucoseoxidase and catalase,” Biotechnol Bioeng, vol. 29, no. 6, pp. 705–13, 1987.
[23] P. Pal, S. Datta, and P. Bhattacharya, “Studies on the modeling and simula-tion of a sequential bienzymatic reaction system immobilized in emulsion liquidmembrane,” Biochem Eng J, vol. 5, no. 2, pp. 89–100, 2000.
[24] A. Hielscher and S. Gerecht, “Hypoxia and free radicals: role in tumor progres-sion and the use of engineering-based platforms to address these relationships,”Free Radic Biol Med, vol. 79, pp. 281–91, 2015.
[25] D. Trachootham, J. Alexandre, and P. Huang, “Targeting cancer cells by ros-mediated mechanisms: a radical therapeutic approach?” Nat Rev Drug Discov,vol. 8, no. 7, pp. 579–91, 2009.
45
[26] Q. Wu, L. Wang, H. Yu, J. Wang, and Z. Chen, “Organization of glucose-responsive systems and their properties,” Chem Rev, vol. 111, no. 12, pp. 7855–75, 2011.
[27] D. Choi, W. Lee, J. Park, and W. Koh, “Preparation of poly(ethylene glycol)hydrogels with different network structures for the application of enzyme immo-bilization,” Biomed Mater Eng, vol. 18, no. 6, pp. 345–56, 2008.
[28] M. Blatchley, K. M. Park, and S. Gerecht, “Designer hydrogels for precisioncontrol of oxygen tension and mechanical properties,” J Mater Chem B MaterBiol Med, vol. 3, no. 40, pp. 7939–7949, 2015.
[29] K. M. Park, M. R. Blatchley, and S. Gerecht, “The design of dextran-basedhypoxia-inducible hydrogels via in situ oxygen-consuming reaction,” MacromolRapid Commun, vol. 35, no. 22, pp. 1968–75, 2014.
[30] K. M. Park and S. Gerecht, “Hypoxia-inducible hydrogels,” Nat Commun, vol. 5,p. 4075, 2014.
[31] D. M. Lewis, K. M. Park, V. Tang, Y. Xu, K. Pak, T. S. Eisinger-Mathason,M. C. Simon, and S. Gerecht, “Intratumoral oxygen gradients mediate sarcomacell invasion,” Proc Natl Acad Sci U S A, vol. 113, no. 33, pp. 9292–7, 2016.
[32] C.-C. Lin, “Recent advances in crosslinking chemistry of biomimetic poly (ethy-lene glycol) hydrogels,” RSC advances, vol. 5, no. 50, pp. 39 844–39 853, 2015.
[33] M. A. Azagarsamy and K. S. Anseth, “Bioorthogonal click chemistry: An indis-pensable tool to create multifaceted cell culture scaffolds,” ACS Macro Letters,vol. 2, no. 1, pp. 5–9, 2013.
[34] C.-C. Lin and K. S. Anseth, “Cellcell communication mimicry with poly (ethyleneglycol) hydrogels for enhancing β-cell function,” Proceddings of the NationalAcademy of Sciences, vol. 108, no. 16, pp. 6380–6385, 2011.
[35] L. H. Gray, A. Conger, M. Ebert, S. Hornsey, and O. Scott, “The concentration ofoxygen dissolved in tissues at the time of irradiation as a factor in radiotherapy,”The British journal of radiology, vol. 26, no. 312, pp. 638–648, 1953.
[36] P. Vaupel, A. Mayer, and M. Hckel, “Tumor hypoxia and malignant progression,”Methods in enzymology, pp. 335–354, 2004.
[37] P. Vaupel, “Prognostic potential of the pretherapeutic tumor oxygenation sta-tus,” Oxygen Transport to Tissue XXX, pp. 241–246, 2009.
[38] D. M. Gilkes, G. L. Semenza, and D. Wirtz, “Hypoxia and the extracellularmatrix: drivers of tumour metastasis,” Nature Reviews Cancer, vol. 14, no. 6,pp. 430–439, 2014.
[39] D. R. Grimes, C. Kelly, K. Bloch, and M. Partridge, “A method for estimatingthe oxygen consumption rate in multicellular tumour spheroids,” Journal of TheRoyal Society Interface, vol. 11, no. 92, p. 20131124, 2014.
[40] J. T. Erler, K. L. Bennewith, M. Nicolau, N. Dornhfer, C. Kong, Q.-T. Le,J.-T. A. Chi, S. S. Jeffrey, and A. J. Giaccia, “Lysyl oxidase is essential forhypoxia-induced metastasis,” Nature, vol. 440, no. 7088, pp. 1222–1226, 2006.

46
[41] T. R. Cox, D. Bird, A.-M. Baker, H. E. Barker, M. W. Ho, G. Lang, and J. T.Erler, “Lox-mediated collagen crosslinking is responsible for fibrosis-enhancedmetastasis,” Cancer research, vol. 73, no. 6, pp. 1721–1732, 2013.
[42] C. G. Colpaert, P. B. Vermeulen, S. B. Fox, A. L. Harris, L. Y. Dirix, andE. A. Van Marck, “The presence of a fibrotic focus in invasive breast carcinomacorrelates with the expression of carbonic anhydrase ix and is a marker of hypoxiaand poor prognosis,” Breast cancer research and treatment, vol. 81, no. 2, pp.137–147, 2003.
[43] C. Trastour, E. Benizri, F. Ettore, A. Ramaioli, E. Chamorey, J. Pouyssgur,and E. Berra, “Hif1 and ca ix staining in invasive breast carcinomas: Prognosisand treatment outcome,” International journal of cancer, vol. 120, no. 7, pp.1451–1458, 2007.
[44] Y. Hao and C. C. Lin, “Degradable thiol-acrylate hydrogels as tunable matricesfor three-dimensional hepatic culture,” J Biomed Mater Res A, vol. 102, no. 11,pp. 3813–27, 2014.
[45] B. D. Fairbanks, M. P. Schwartz, C. N. Bowman, and K. S. Anseth,“Photoinitiated polymerization of peg-diacrylate with lithium phenyl-2,4,6-trimethylbenzoylphosphinate: polymerization rate and cytocompatibility,” Bio-materials, vol. 30, no. 35, pp. 6702–7, 2009.
[46] C. S. Dawes, H. Konig, and C.-C. Lin, “Enzyme-immobilized hydrogels to createhypoxia for in vitro cancer cell culture,” Journal of Biotechnology, vol. 248, pp.25–34.
[47] S. Cahpra and R. Canale, “Numerical methods for engineers 5th,” 2006.
[48] P. Pandey, S. P. Singh, S. K. Arya, V. Gupta, M. Datta, S. Singh, and B. D.Malhotra, “Application of thiolated gold nanoparticles for the enhancement ofglucose oxidase activity,” Langmuir, vol. 23, no. 6, pp. 3333–7, 2007.
[49] S. I. Kang and Y. H. Bae, “A sulfonamide based glucose-responsive hydrogelwith covalently immobilized glucose oxidase and catalase,” Journal of ControlledRelease, vol. 86, no. 1, pp. 115–121, 2003.
[50] A. Blandino, M. Macas, and D. Cantero, “Modelling and simulation of a bien-zymatic reaction system co-immobilised within hydrogel-membrane liquid-corecapsules,” Enzyme and microbial technology, vol. 31, no. 4, pp. 556–565, 2002.
[51] C. C. Wykoff, N. J. P. Beasley, P. H. Watson, K. J. Turner, J. Pastorek, A. Sib-tain, G. D. Wilson, H. Turley, K. L. Talks, P. H. Maxwell, C. W. Pugh, P. J.Ratcliffe, and A. L. Harris, “Hypoxia-inducible expression of tumor-associatedcarbonic anhydrases,” Cancer Research, vol. 60, no. 24, pp. 7075–7083, 2000.
[52] J. T. Erler, K. L. Bennewith, M. Nicolau, N. Dornhofer, C. Kong, Q.-T. Le,J.-T. A. Chi, S. S. Jeffrey, and A. J. Giaccia, “Lysyl oxidase is essential forhypoxia-induced metastasis,” Nature, vol. 440, no. 7088, pp. 1222–1226, 2006.
[53] W. G. An, M. Kanekal, M. C. Simon, E. Maltepe, M. V. Blagosklonny, and L. M.Neckers, “Stabilization of wild-type p53 by hypoxia-inducible factor 1alpha,”Nature, vol. 392, no. 6674, pp. 405–8, 1998.

47
[54] Y. H. Han, L. Xia, L. P. Song, Y. Zheng, W. L. Chen, L. Zhang, Y. Huang, G. Q.Chen, and L. S. Wang, “Comparative proteomic analysis of hypoxia-treated anduntreated human leukemic u937 cells,” Proteomics, vol. 6, no. 11, pp. 3262–74,2006.
[55] T. M. O’shea, M. J. Webber, A. A. Aimetti, and R. Langer, “Covalent incorpora-tion of trehalose within hydrogels for enhanced longterm functional stability andcontrolled release of biomacromolecules,” Advanced healthcare materials, vol. 4,no. 12, pp. 1802–1812, 2015.
[56] E. M. Pritchard, P. B. Dennis, F. Omenetto, R. R. Naik, and D. L. Kaplan,“Physical and chemical aspects of stabilization of compounds in silk,” Biopoly-mers, vol. 97, no. 6, pp. 479–498, 2012.

APPENDIX
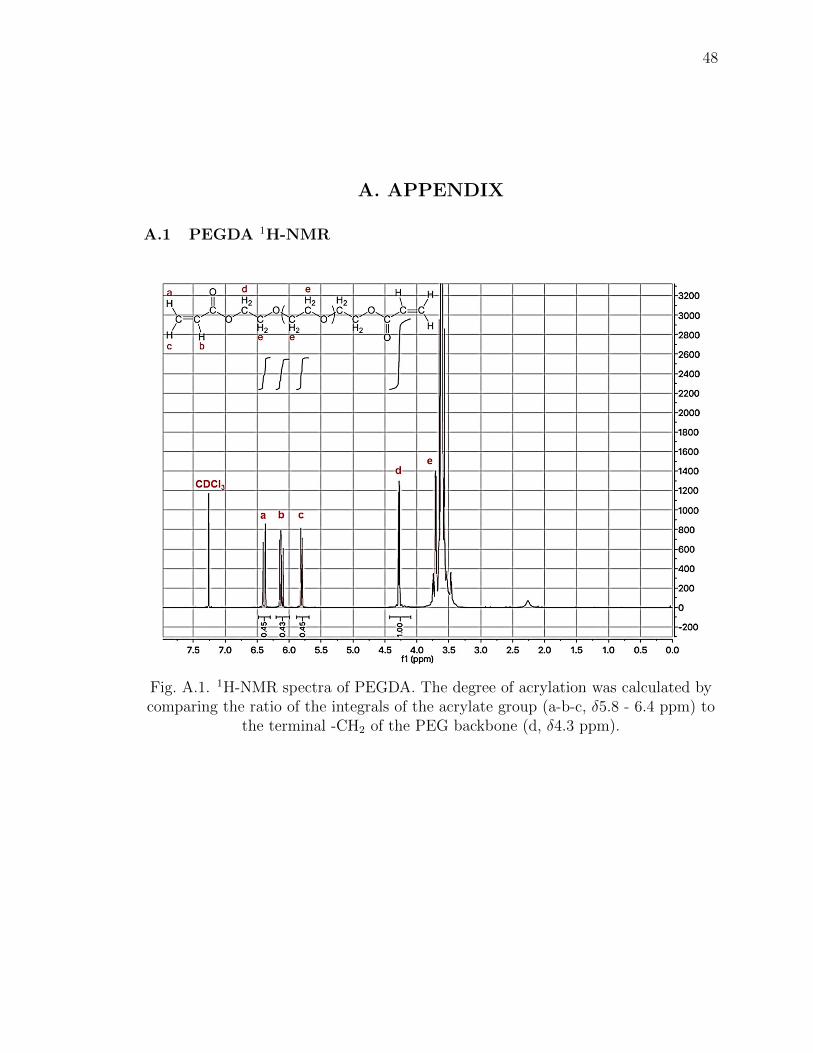
48
A. APPENDIX
A.1 PEGDA 1H-NMR
Fig. A.1. 1H-NMR spectra of PEGDA. The degree of acrylation was calculated bycomparing the ratio of the integrals of the acrylate group (a-b-c, δ5.8 - 6.4 ppm) to
the terminal -CH2 of the PEG backbone (d, δ4.3 ppm).
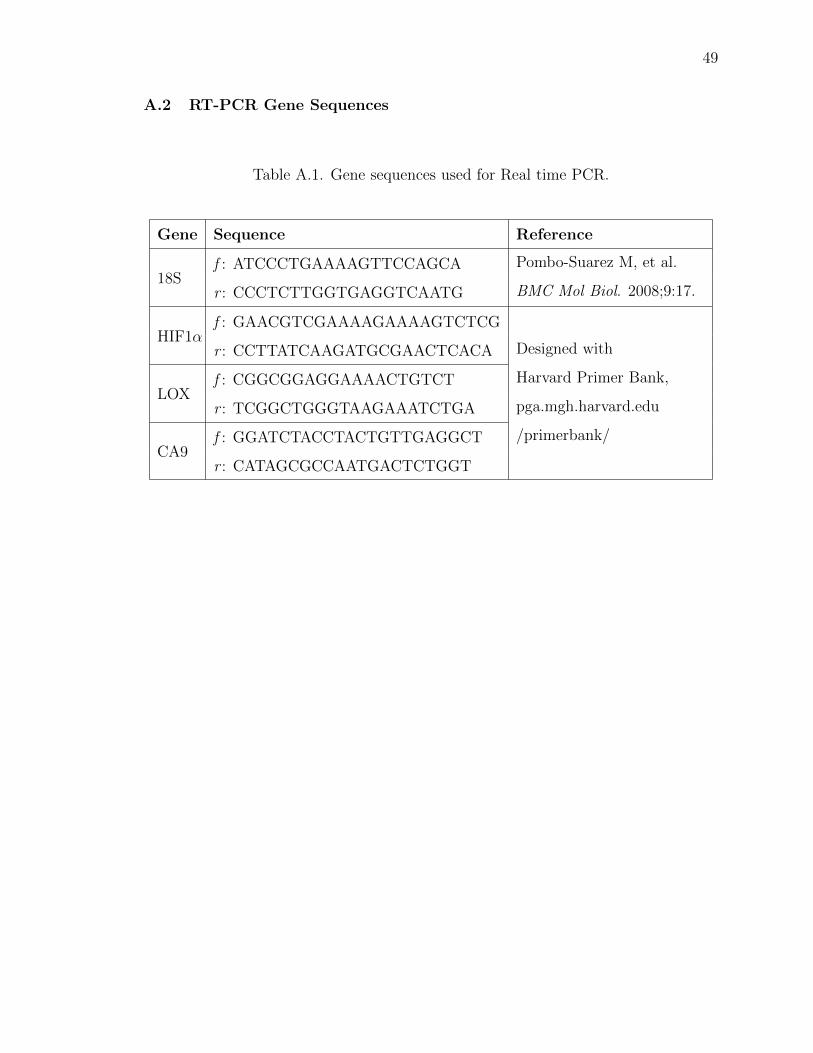
49
A.2 RT-PCR Gene Sequences
Table A.1. Gene sequences used for Real time PCR.
Gene Sequence Reference
18Sf : ATCCCTGAAAAGTTCCAGCA Pombo-Suarez M, et al.
BMC Mol Biol. 2008;9:17.r : CCCTCTTGGTGAGGTCAATG
HIF1αf : GAACGTCGAAAAGAAAAGTCTCG
Designed with
Harvard Primer Bank,
pga.mgh.harvard.edu
/primerbank/
r : CCTTATCAAGATGCGAACTCACA
LOXf : CGGCGGAGGAAAACTGTCT
r : TCGGCTGGGTAAGAAATCTGA
CA9f : GGATCTACCTACTGTTGAGGCT
r : CATAGCGCCAATGACTCTGGT

50
A.3 Preliminary Study: Effect of Lyophilization on GOXPEGA Gel In-
duced Hypoxia
Lyophilization of the hydrogels was done to provide convenience of use of the gels
at a later date post synthesis. The gels are simply frozen and then thawed/rehydrated
at a later date for O2 tension measurements. Shown in Figure A.2 is the O2 tension
development over time within the ibidi channel slide for gels used immediately after
synthesis and swelling (Figure A.2A) versus gels that were synthesized, lyophilized
and then allowed to swell (Figure A.2B):
Fig. A.2. Effect of lyophilization on O2 consumption by GOXPEGA gels. O2 tensionover time for GOXPEGA gels with (B) and without (A) lyophilization. Hydrogels (20µL) were formed by 15 wt% PEGDA and 0.2 or 0.4 mg/mL GOXPEGA with one gel
per reservoir in the ibidi channel slide. All gels were added to 37◦C DPBS forswelling overnight before use. (*p < 0.05. Mean ± SEM, n ≥ 3).
In general, O2 contents were higher for gels that were lyophilized compared to
gels that were used without lyophilization. For the 0.2 mg/mL gels in Figure A.2A
and A.2B, average difference between the two groups was around 1 4% O2 for all
time points. The 0.4 mg/mL gels in Figure A.2A and A.2B also showed a similar

51
average difference between the two groups of 1 5% O2 for all time points. The
average difference of measured O2 between the two gel groups in Figure A.2A (without
lyophilization) was not found to be statistically different from the average difference
of measured O2 between the two gel groups in Figure A.2B (with lyophilization). It
is of note that Figure A.2A is a reproduction of Figure 4.15C.

52
A.4 Semi-Empirical Prediction of O2 Gradient Development in Channel
Slides
Matlab Code A.1: Finite Difference Calculations for One Dimensional Diffusion
1 clear all; close all; clc; format long;
2 sr=['b ';'r ';'g ';'m '];
3 sr2=['bo ';'ro ';'go ';'mo '];
4 sr3=['kd ';'kd ';'kd ';'kd '];
5
6 %%%%
7 % experimental data and corresponding time points
8 t=[1 4 8 24 48]';
9 o2 data=[18.8068 3.4855 19.411 2.9783 18.2602 2.987
10 3.2735 2.966 5.1629 3.6655 3.2735 2.966;
11 17.1425 2.2609 16.3297 1.3149 16.6893 0.647
12 2.831 3.9618 1.501 2.4866 2.831 3.9618;
13 16.9636 1.8467 16.8536 1.6158 16.8278 2.4214
14 3.5878 1.8321 3.7652 1.6929 3.5878 1.8321;
15 17.1678 4.1648 17.3821 4.3081 17.8364 5.1629
16 3.5404 3.7553 10.0435 5.6274 3.5404 3.7553;
17 16.4299 11.9364 15.7061 7.2729 16.8423 5.929
18 11.5356 9.0345 15.9684 8.5443 10.0909 6.3022];
19 [m,n]=size(o2 data);
20
21 %%%%
22 % generating more time points for hermite splines
23 % p t=linspace(min(t),max(t),40); %doesn't change sem later to ...
plot more
24 p t=1:0.25:48; %doesn't change sem later to plot more
25
26 % calculating the average increment of time (used for the mesh later)
27 counter=1;
28 for count=length(t):-1:2
29 del t(counter)=p t(count)-p t(count-1);

53
30 counter=counter+1;
31 end
32 del t=mean(del t); %hr
33
34 %%%%
35 % generating hermite splines between each data point for each well
36 % (represented by columns above)
37 for count=1:1:n
38 s o2 data(:,count)=pchip(t,o2 data(:,count),p t);
39 end
40
41 %%%%
42 % parameters for mesh from centered
43 % finite-divided-difference approximation of the 1D
44 % Diffusion equation with respect to time and distance
45
46 % Oxygen concentration in solution without any enzyme added (Co)
47 normal o2 set=18.826;
48
49 % mesh distance span and increment
50 del x=5; %mm
51 Length=50; %mm
52 x=[0:del x:Length]';
53
54 % diffusivity of oxygen
55 Da=2.7*(10ˆ-9); %oxygen in 37dC water, meter squared per second
56
57 % mesh multiplication factor
58 lambda=Da*(del t/(del xˆ2))*1000*1000*60*60;
59
60 %%%%
61 % generating the mesh matrix, columns from left to right represent
62 % increasing distance (starting with zero), rows from top to bottom
63 % represent timepoints (starting with zero)
64 for count=2:2:n
65 % aside=s o2 data(:,count-1);
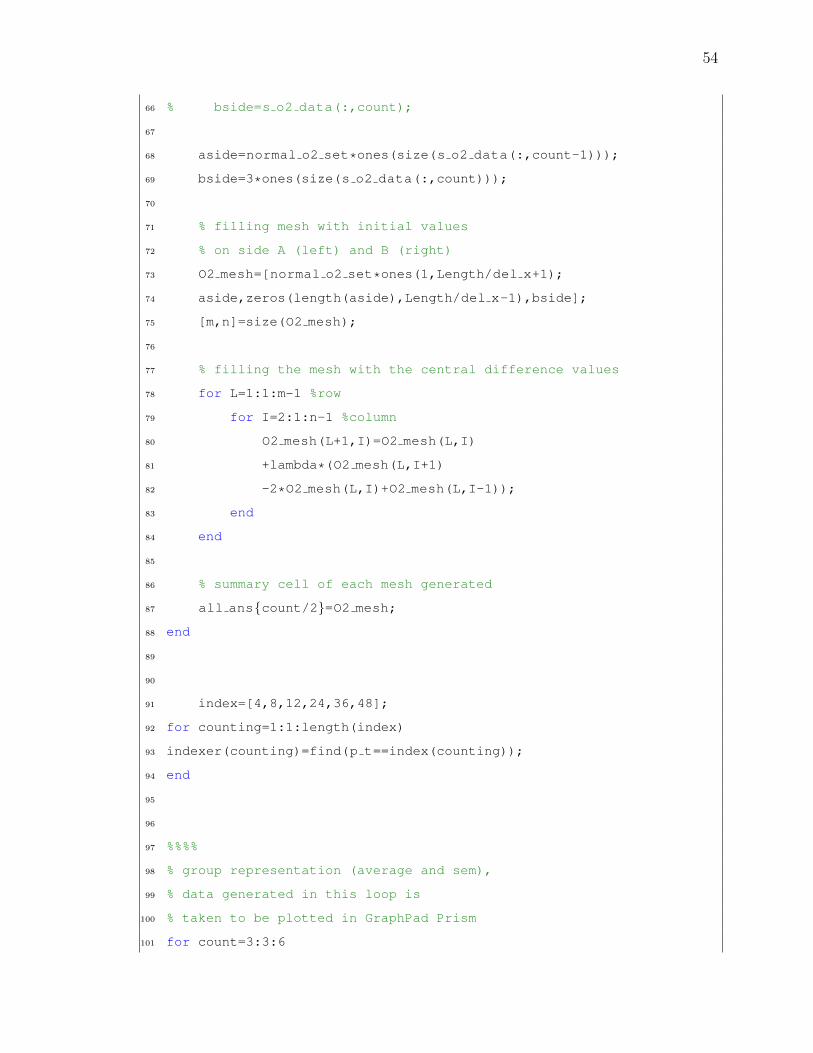
54
66 % bside=s o2 data(:,count);
67
68 aside=normal o2 set*ones(size(s o2 data(:,count-1)));
69 bside=3*ones(size(s o2 data(:,count)));
70
71 % filling mesh with initial values
72 % on side A (left) and B (right)
73 O2 mesh=[normal o2 set*ones(1,Length/del x+1);
74 aside,zeros(length(aside),Length/del x-1),bside];
75 [m,n]=size(O2 mesh);
76
77 % filling the mesh with the central difference values
78 for L=1:1:m-1 %row
79 for I=2:1:n-1 %column
80 O2 mesh(L+1,I)=O2 mesh(L,I)
81 +lambda*(O2 mesh(L,I+1)
82 -2*O2 mesh(L,I)+O2 mesh(L,I-1));
83 end
84 end
85
86 % summary cell of each mesh generated
87 all ans{count/2}=O2 mesh;
88 end
89
90
91 index=[4,8,12,24,36,48];
92 for counting=1:1:length(index)
93 indexer(counting)=find(p t==index(counting));
94 end
95
96
97 %%%%
98 % group representation (average and sem),
99 % data generated in this loop is
100 % taken to be plotted in GraphPad Prism
101 for count=3:3:6

55
102 a=cell2mat(all ans(count-2));
103 b=cell2mat(all ans(count-1));
104 c=cell2mat(all ans(count-0));
105 mesh avg=(a+b+c)/3; %average of the mesh replicates
106
107 for counting=1:1:length(indexer)
108 prism mesh format(:,counting)=
109 mesh avg(indexer(counting),:)';
110 end
111
112 % %[time, mesh o2 distances(avg, sem, n)]
113 mesh val prism{count/3}=[x,prism mesh format];
114 end