enzyme kinetics - delhi university
TRANSCRIPT
CH AP T ER 10Enzyme Kinetics
One of the most fascinating areas of study in chemical kinetics is enzyme catalysis.The phenomenon of enzyme catalysis usually results in a very large increase in reac-tion rate (on the order of 106 to 1018) and high specificity. By specificity, we meanthat an enzyme molecule is capable of selectively catalyzing certain reactants, calledsubstrates, while discriminating against other molecules.
This chapter presents the basic mathematical treatment of enzyme kinetics anddiscusses the topics of enzyme inhibition, allosterism, and the e¤ect of pH on enzymekinetics.
10.1 General Principles of Catalysis
A catalyst is a substance that increases the rate of a reaction without itself beingconsumed by the process. A reaction in which a catalyst is involved is called a cata-
lyzed reaction, and the process is called catalysis. In studying catalysis, keep in mindthe following characteristics:
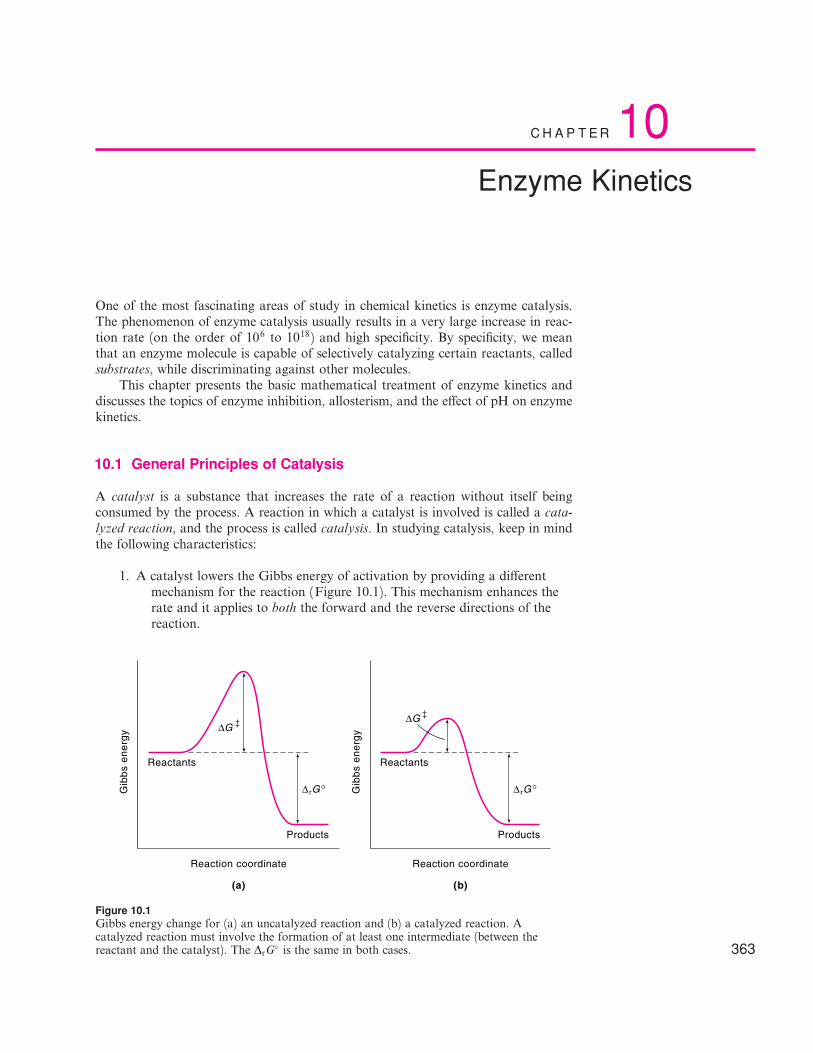
1. A catalyst lowers the Gibbs energy of activation by providing a di¤erentmechanism for the reaction (Figure 10.1). This mechanism enhances therate and it applies to both the forward and the reverse directions of thereaction.
363
Reaction coordinate
Gib
bs
en
erg
y
Reactants
Products
∆G
Reaction coordinate
Gib
bs
en
erg
y
Reactants
Products
∆G
(a) (b)
∆rG° ∆rG°
Figure 10.1Gibbs energy change for (a) an uncatalyzed reaction and (b) a catalyzed reaction. Acatalyzed reaction must involve the formation of at least one intermediate (between thereactant and the catalyst). The DrG
� is the same in both cases.
2. A catalyst forms an intermediate with the reactant(s) in the initial step of themechanism and is released in the product-forming step. The catalyst doesnot appear in the overall reaction.
3. Regardless of the mechanism and the energetics of a reaction, a catalystcannot a¤ect the enthalpies or Gibbs energies of the reactants andproducts. Thus, catalysts increase the rate of approach to equilibrium, butcannot alter the thermodynamic equilibrium constant.
Humans have used catalysts for thousands of years in food preparation and winemaking. Industrially, hundreds of billions of dollars worth of chemicals are producedannually with the aid of catalysts. There are three types of catalysis: heterogeneous,homogeneous, and enzymatic. In a heterogeneously catalyzed reaction, the reactantsand the catalyst are in di¤erent phases (usually gas/solid or liquid/solid). Well-knownexamples are the Haber synthesis of ammonia and the Ostwald manufacture of nitricacid. The bromination of acetone, catalyzed by acids,
CH3COCH3 þ Br2 �!HþCH2BrCOCH3 þHBr
is an example of homogeneous catalysis because the reactants and the catalyst ðHþÞare all present in the aqueous medium. Enzyme catalysis is also mostly homogeneousin nature. However, because it is of biological origin and is the most complex of thethree types of catalysis, enzyme catalysis is treated as a separate category. Whether ornot their mechanisms are well understood, enzymes have been used widely in foodand beverage production, as well as in the manufacture of drugs and other chemicals.
Enzyme Catalysis
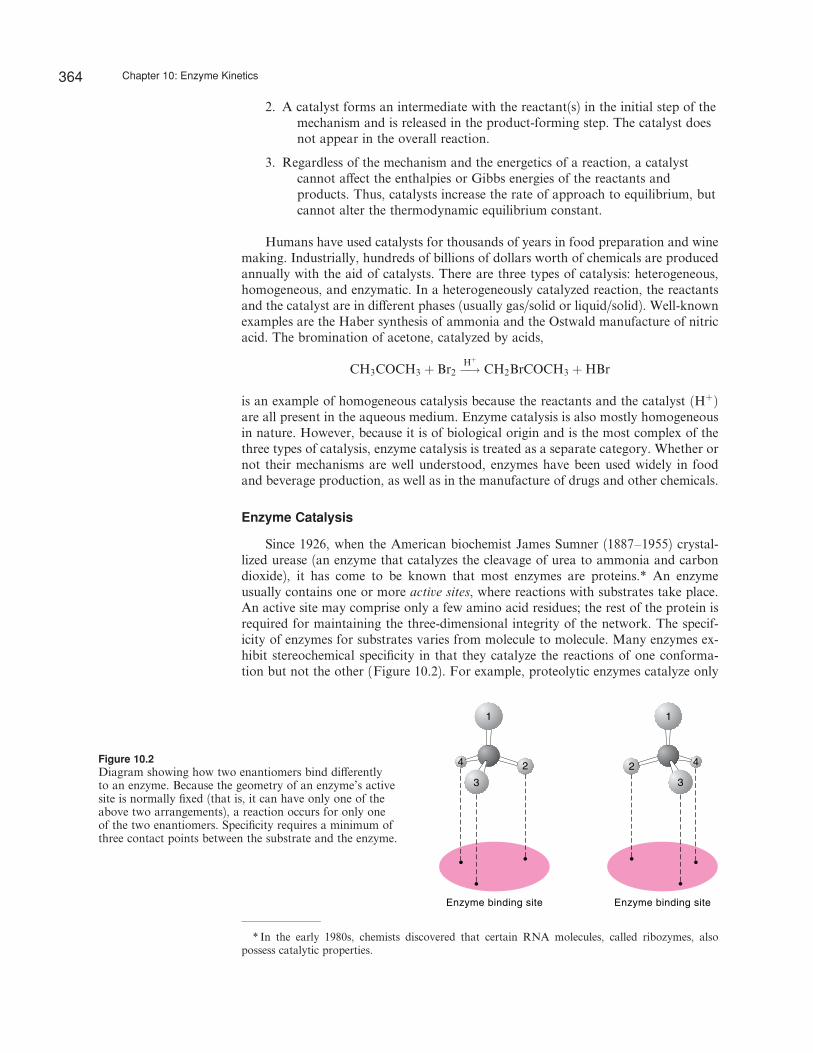
Since 1926, when the American biochemist James Sumner (1887–1955) crystal-lized urease (an enzyme that catalyzes the cleavage of urea to ammonia and carbondioxide), it has come to be known that most enzymes are proteins.* An enzymeusually contains one or more active sites, where reactions with substrates take place.An active site may comprise only a few amino acid residues; the rest of the protein isrequired for maintaining the three-dimensional integrity of the network. The specif-icity of enzymes for substrates varies from molecule to molecule. Many enzymes ex-hibit stereochemical specificity in that they catalyze the reactions of one conforma-tion but not the other (Figure 10.2). For example, proteolytic enzymes catalyze only
* In the early 1980s, chemists discovered that certain RNA molecules, called ribozymes, alsopossess catalytic properties.
Enzyme binding site Enzyme binding site
11
22
33
44Figure 10.2Diagram showing how two enantiomers bind di¤erentlyto an enzyme. Because the geometry of an enzyme’s activesite is normally fixed (that is, it can have only one of theabove two arrangements), a reaction occurs for only oneof the two enantiomers. Specificity requires a minimum ofthree contact points between the substrate and the enzyme.
364 Chapter 10: Enzyme Kinetics
the hydrolysis of peptides made up of l-amino acids. Some enzymes are catalyticallyinactive in the absence of certain metal ions.
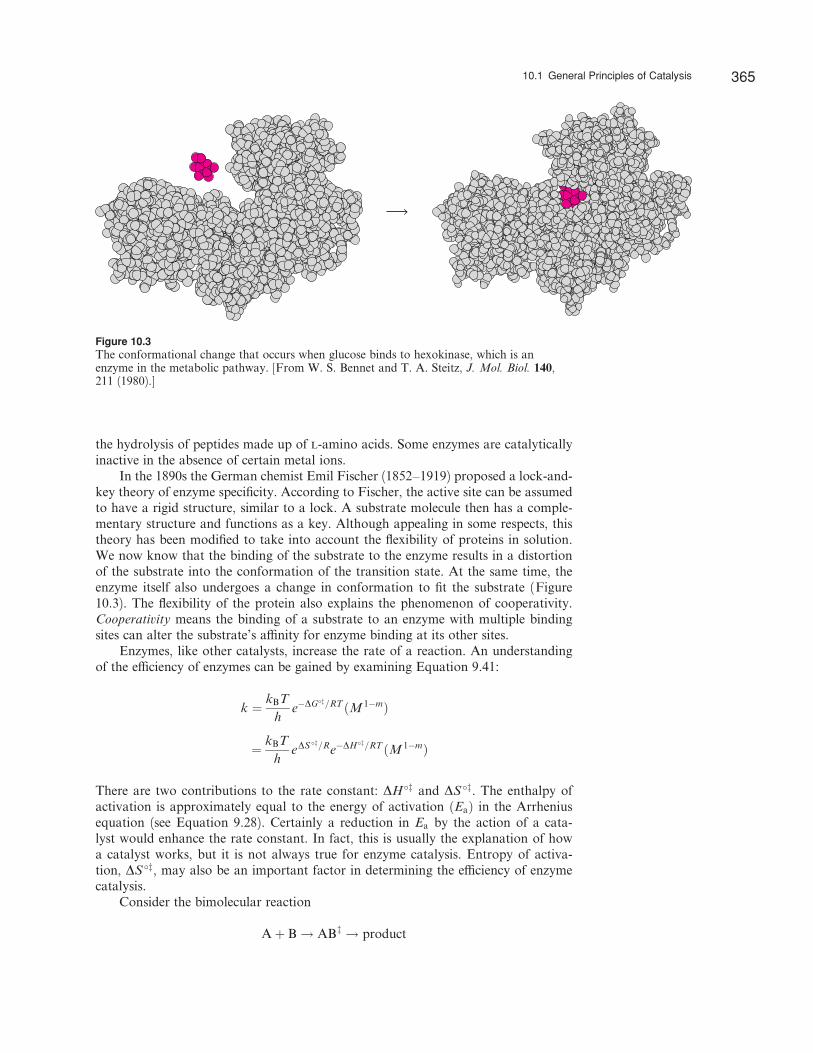
In the 1890s the German chemist Emil Fischer (1852–1919) proposed a lock-and-key theory of enzyme specificity. According to Fischer, the active site can be assumedto have a rigid structure, similar to a lock. A substrate molecule then has a comple-mentary structure and functions as a key. Although appealing in some respects, thistheory has been modified to take into account the flexibility of proteins in solution.We now know that the binding of the substrate to the enzyme results in a distortionof the substrate into the conformation of the transition state. At the same time, theenzyme itself also undergoes a change in conformation to fit the substrate (Figure10.3). The flexibility of the protein also explains the phenomenon of cooperativity.Cooperativity means the binding of a substrate to an enzyme with multiple bindingsites can alter the substrate’s a‰nity for enzyme binding at its other sites.
Enzymes, like other catalysts, increase the rate of a reaction. An understandingof the e‰ciency of enzymes can be gained by examining Equation 9.41:
k ¼ kBT
he�DG�z=RT ðM 1�mÞ
¼ kBT
heDS
�z=Re�DH�z=RT ðM 1�mÞ
There are two contributions to the rate constant: DH�z and DS �z. The enthalpy ofactivation is approximately equal to the energy of activation ðEaÞ in the Arrheniusequation (see Equation 9.28). Certainly a reduction in Ea by the action of a cata-lyst would enhance the rate constant. In fact, this is usually the explanation of howa catalyst works, but it is not always true for enzyme catalysis. Entropy of activa-tion, DS �z, may also be an important factor in determining the e‰ciency of enzymecatalysis.
Consider the bimolecular reaction
Aþ B ! ABz ! product
Figure 10.3The conformational change that occurs when glucose binds to hexokinase, which is anenzyme in the metabolic pathway. [From W. S. Bennet and T. A. Steitz, J. Mol. Biol. 140,211 (1980).]
10.1 General Principles of Catalysis 365
where A and B are both nonlinear molecules. Before the formation of the activatedcomplex, each A or B molecule has three translational, three rotational, and threevibrational degrees of freedom. These motions all contribute to the entropy of themolecule. At 25�C, the greatest contribution comes from translational motion (about120 J K�1 mol�1), followed by rotational motion (about 80 J K�1 mol�1). Vibra-tional motion makes the smallest contribution (about 15 J K�1 mol�1). The transla-tional and rotational entropies of the activated complex are only slightly larger thanthose of an individual A or B molecule (these entropies increase slowly with size);therefore, there is a net loss in entropy of about 200 J K�1 mol�1 when the activatedcomplex is formed. This loss in entropy is compensated for to a small extent by newmodes of internal rotation and vibration in the activated complex. For unimolecularreactions, such as the cis–trans isomerization of an alkene, however, there is verylittle entropy change because the activated complex is formed from a single molecularspecies. A theoretical comparison of a unimolecular reaction with a bimolecular oneshows a di¤erence of as much as 3� 1010 in the eDS
�z=R term, favoring the unim-olecular reaction.
Consider a simple enzyme-catalyzed reaction in which one substrate (S) is trans-formed into one product (P). The reaction proceeds as follows:
Eþ S Ð ES Ð ESz Ð EP Ð Eþ P
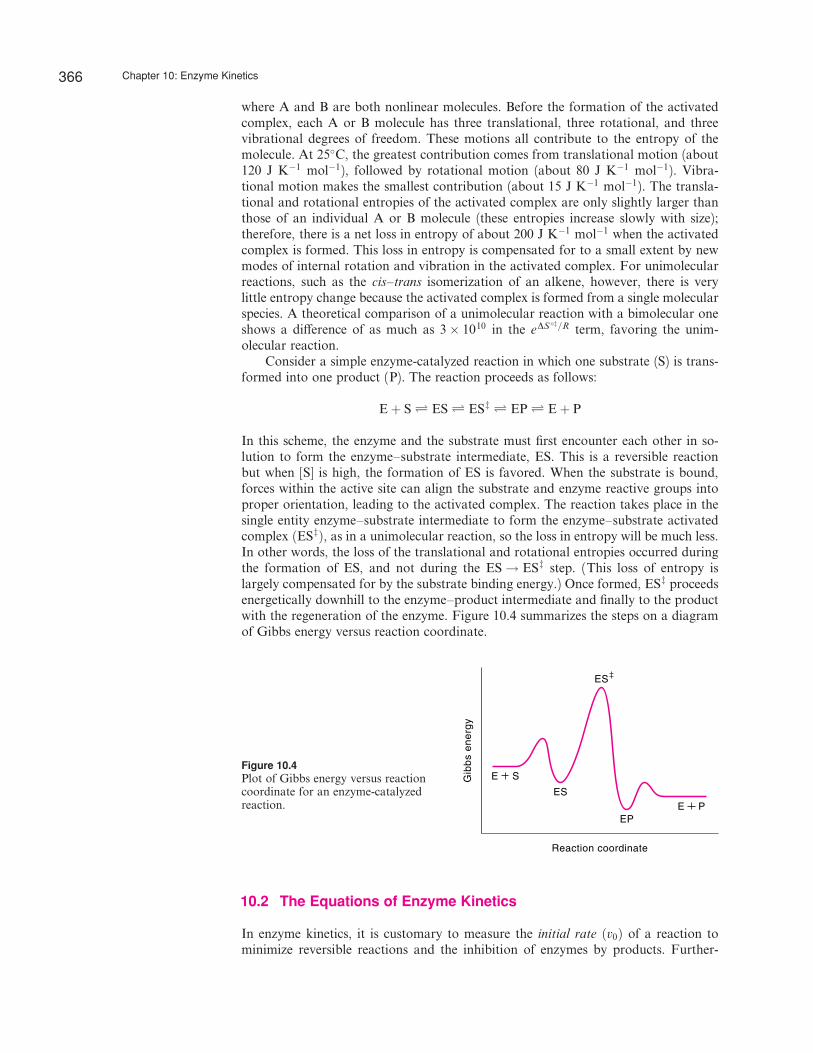
In this scheme, the enzyme and the substrate must first encounter each other in so-lution to form the enzyme–substrate intermediate, ES. This is a reversible reactionbut when [S] is high, the formation of ES is favored. When the substrate is bound,forces within the active site can align the substrate and enzyme reactive groups intoproper orientation, leading to the activated complex. The reaction takes place in thesingle entity enzyme–substrate intermediate to form the enzyme–substrate activatedcomplex ðESzÞ, as in a unimolecular reaction, so the loss in entropy will be much less.In other words, the loss of the translational and rotational entropies occurred duringthe formation of ES, and not during the ES ! ESz step. (This loss of entropy islargely compensated for by the substrate binding energy.) Once formed, ESz proceedsenergetically downhill to the enzyme–product intermediate and finally to the productwith the regeneration of the enzyme. Figure 10.4 summarizes the steps on a diagramof Gibbs energy versus reaction coordinate.
10.2 The Equations of Enzyme Kinetics
In enzyme kinetics, it is customary to measure the initial rate ðv0Þ of a reaction tominimize reversible reactions and the inhibition of enzymes by products. Further-
ES
EP
Reaction coordinate
Gib
bs
en
erg
y
ES
E S
E P
Figure 10.4Plot of Gibbs energy versus reactioncoordinate for an enzyme-catalyzedreaction.
366 Chapter 10: Enzyme Kinetics
more, the initial rate corresponds to a known fixed substrate concentration. As timeproceeds, the substrate concentration will drop.
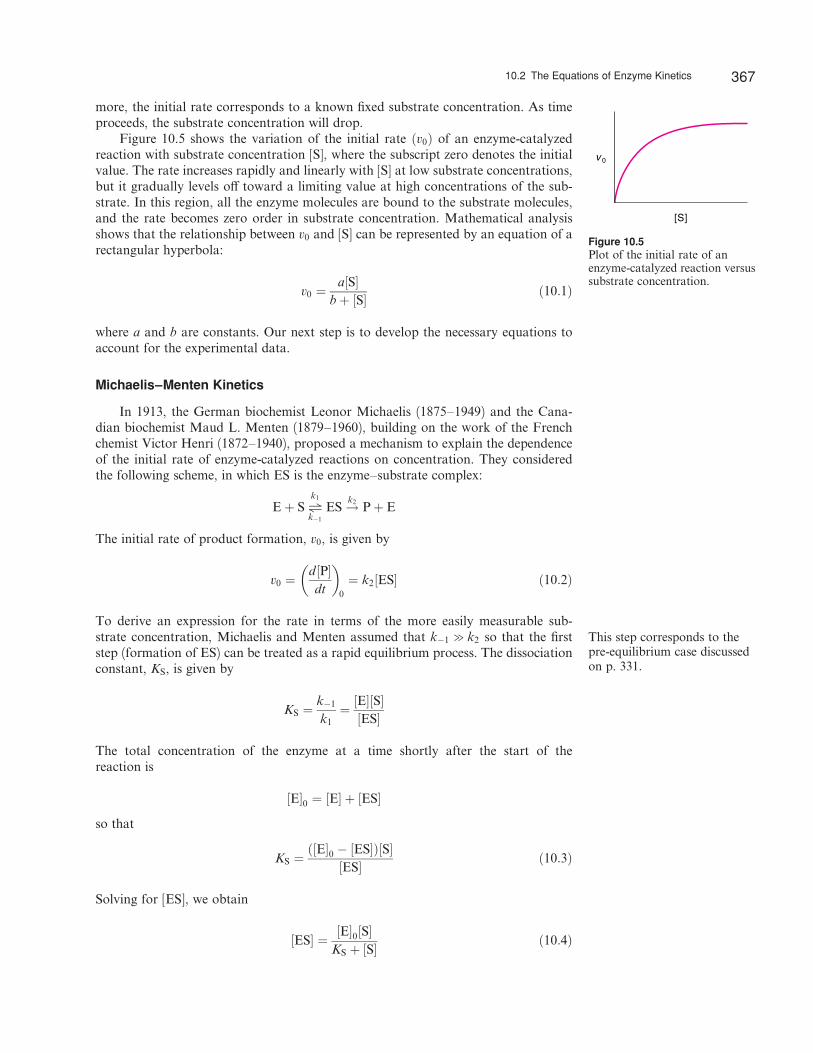
Figure 10.5 shows the variation of the initial rate ðv0Þ of an enzyme-catalyzedreaction with substrate concentration [S], where the subscript zero denotes the initialvalue. The rate increases rapidly and linearly with [S] at low substrate concentrations,but it gradually levels o¤ toward a limiting value at high concentrations of the sub-strate. In this region, all the enzyme molecules are bound to the substrate molecules,and the rate becomes zero order in substrate concentration. Mathematical analysisshows that the relationship between v0 and [S] can be represented by an equation of arectangular hyperbola:
v0 ¼a½S�
bþ ½S� ð10:1Þ
where a and b are constants. Our next step is to develop the necessary equations toaccount for the experimental data.
Michaelis–Menten Kinetics
In 1913, the German biochemist Leonor Michaelis (1875–1949) and the Cana-dian biochemist Maud L. Menten (1879–1960), building on the work of the Frenchchemist Victor Henri (1872–1940), proposed a mechanism to explain the dependenceof the initial rate of enzyme-catalyzed reactions on concentration. They consideredthe following scheme, in which ES is the enzyme–substrate complex:
Eþ S Qk1
k�1
ES !k2 Pþ E
The initial rate of product formation, v0, is given by
v0 ¼d½P�dt
� �0
¼ k2½ES� ð10:2Þ
To derive an expression for the rate in terms of the more easily measurable sub-strate concentration, Michaelis and Menten assumed that k�1 g k2 so that the firststep (formation of ES) can be treated as a rapid equilibrium process. The dissociationconstant, KS, is given by
KS ¼k�1
k1¼ ½E�½S�
½ES�
The total concentration of the enzyme at a time shortly after the start of thereaction is
½E�0 ¼ ½E� þ ½ES�
so that
KS ¼ð½E�0 � ½ES�Þ½S�
½ES� ð10:3Þ
Solving for [ES], we obtain
½ES� ¼ ½E�0½S�KS þ ½S� ð10:4Þ
This step corresponds to thepre-equilibrium case discussedon p. 331.
[S]
v 0
Figure 10.5Plot of the initial rate of anenzyme-catalyzed reaction versussubstrate concentration.
10.2 The Equations of Enzyme Kinetics 367
Substituting Equation 10.4 into Equation 10.2 yields
v0 ¼d½P�dt
� �0
¼ k2½E�0½S�KS þ ½S� ð10:5Þ
Thus, the rate is always proportional to the total concentration of the enzyme.Equation 10.5 has the same form as Equation 10.1, where a ¼ k2½E�0 and
b ¼ KS. At low substrate concentrations ½S�fKS, so Equation 10.5 becomes v0 ¼ðk2=KSÞ½E�0½S�; that is, it is a second-order reaction (first order in ½E�0 and first orderin [S]). This rate law corresponds to the initial linear portion of the plot in Figure10.5. At high substrate concentrations, ½S�gKS, so Equation 10.5 can be written
v0 ¼d½P�dt
� �0
¼ k2½E�0
Under these conditions, all the enzyme molecules are in the enzyme–substrate com-plex form; that is, the reacting system is saturated with S. Consequently, the initialrate is zero order in [S]. This rate law corresponds to the horizontal portion of theplot. The curved portion in Figure 10.5 represents the transition from low to highsubstrate concentrations.
When all the enzyme molecules are complexed with the substrate as ES, themeasured initial rate must be at its maximum value ðVmaxÞ, so that
Vmax ¼ k2½E�0 ð10:6Þ
where Vmax is called the maximum rate. Now consider what happens when ½S� ¼ KS.From Equation 10.5 we find that this condition gives v0 ¼ Vmax=2, so KS equals theconcentration of S when the initial rate is half its maximum value.
Steady-State Kinetics
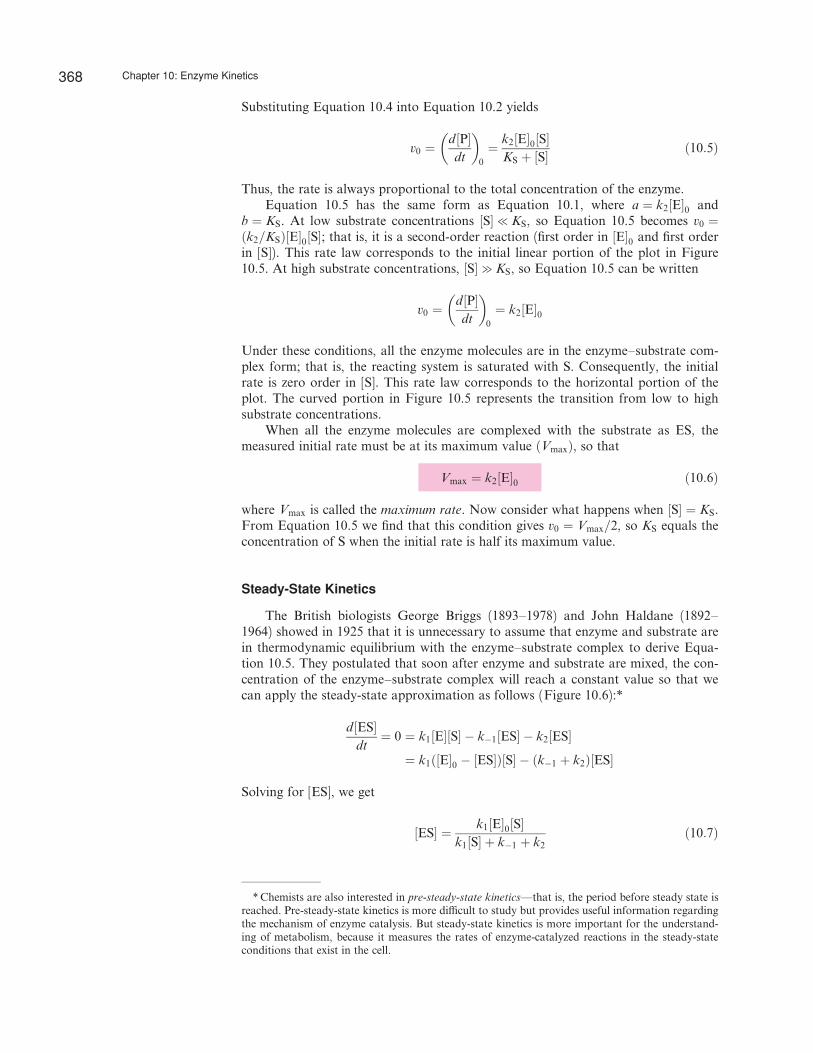
The British biologists George Briggs (1893–1978) and John Haldane (1892–1964) showed in 1925 that it is unnecessary to assume that enzyme and substrate arein thermodynamic equilibrium with the enzyme–substrate complex to derive Equa-tion 10.5. They postulated that soon after enzyme and substrate are mixed, the con-centration of the enzyme–substrate complex will reach a constant value so that wecan apply the steady-state approximation as follows (Figure 10.6):*
d½ES�dt
¼ 0 ¼ k1½E�½S� � k�1½ES� � k2½ES�
¼ k1ð½E�0 � ½ES�Þ½S� � ðk�1 þ k2Þ½ES�
Solving for [ES], we get
½ES� ¼ k1½E�0½S�k1½S� þ k�1 þ k2
ð10:7Þ
*Chemists are also interested in pre-steady-state kinetics—that is, the period before steady state isreached. Pre-steady-state kinetics is more di‰cult to study but provides useful information regardingthe mechanism of enzyme catalysis. But steady-state kinetics is more important for the understand-ing of metabolism, because it measures the rates of enzyme-catalyzed reactions in the steady-stateconditions that exist in the cell.
368 Chapter 10: Enzyme Kinetics
Substituting Equation 10.7 into 10.2 gives
v0 ¼d½P�dt
� �0
¼ k2½ES� ¼k1k2½E�0½S�
k1½S� þ k�1 þ k2
¼ k2½E�0½S�½ðk�1 þ k2Þ=k1� þ ½S�
¼ k2½E�0½S�KM þ ½S� ð10:8Þ
where KM, the Michaelis constant, is defined as
KM ¼ k�1 þ k2
k1ð10:9Þ
Comparing Equation 10.8 with Equation 10.5, we see that they have a similar de-pendence on substrate concentration; however, KM 0KS in general unless k�1 g k2.
The Briggs–Haldane treatment defines the maximum rate exactly as Equation10.6 does. Because ½E�0 ¼ Vmax=k2, Equation 10.8 can also be written as
v0 ¼Vmax½S�KM þ ½S� ð10:10Þ
Equation 10.10 is a fundamental equation of enzyme kinetics, and we shall frequentlyrefer to it. When the initial rate is equal to half the maximum rate, Equation 10.10becomes
Vmax
2¼ Vmax½S�
KM þ ½S�
or
KM ¼ ½S�
Note that the larger the KM
(the weaker the binding), thelarger the [S] needed to reachthe half maximum rate.
ES E
S
P
Steady state
Time
Co
nce
ntr
atio
n
Figure 10.6Plot of the concentrations of the various species in an enzyme-catalyzed reaction Eþ S ÐES ! Pþ E versus time. We assume that the initial substrate concentration is much largerthan the enzyme concentration and that the rate constants k1; k�1, and k2 (see text) are ofcomparable magnitudes.
10.2 The Equations of Enzyme Kinetics 369
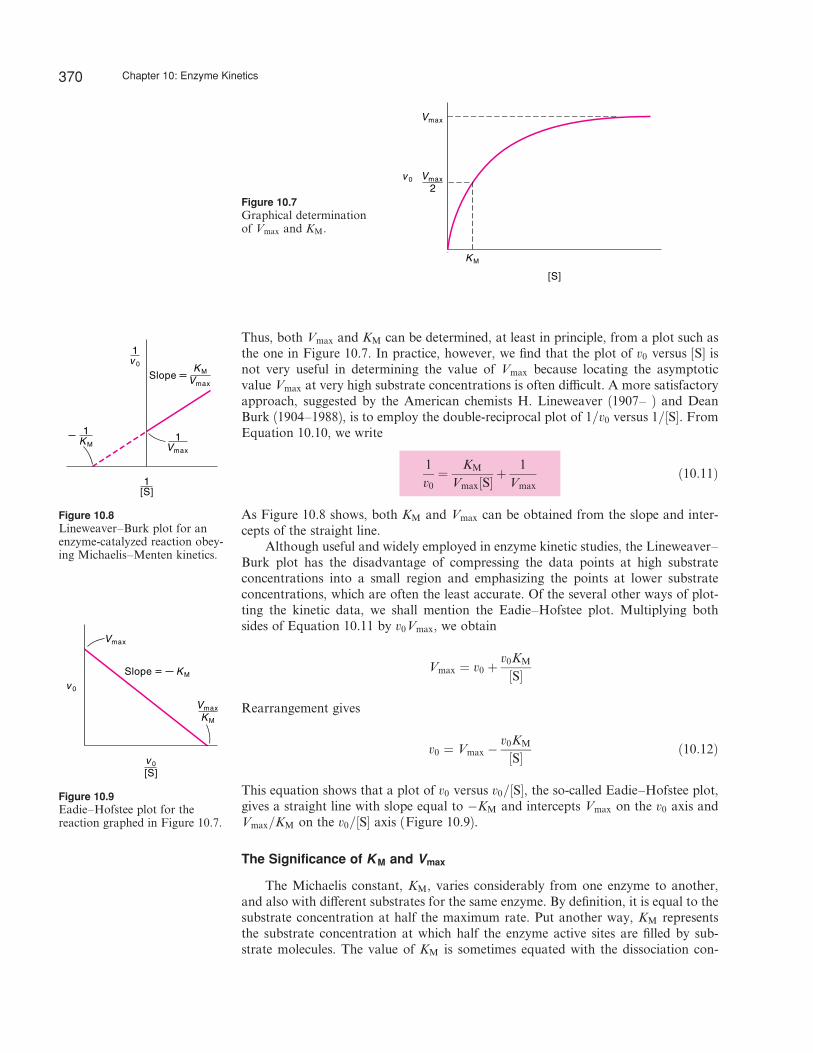
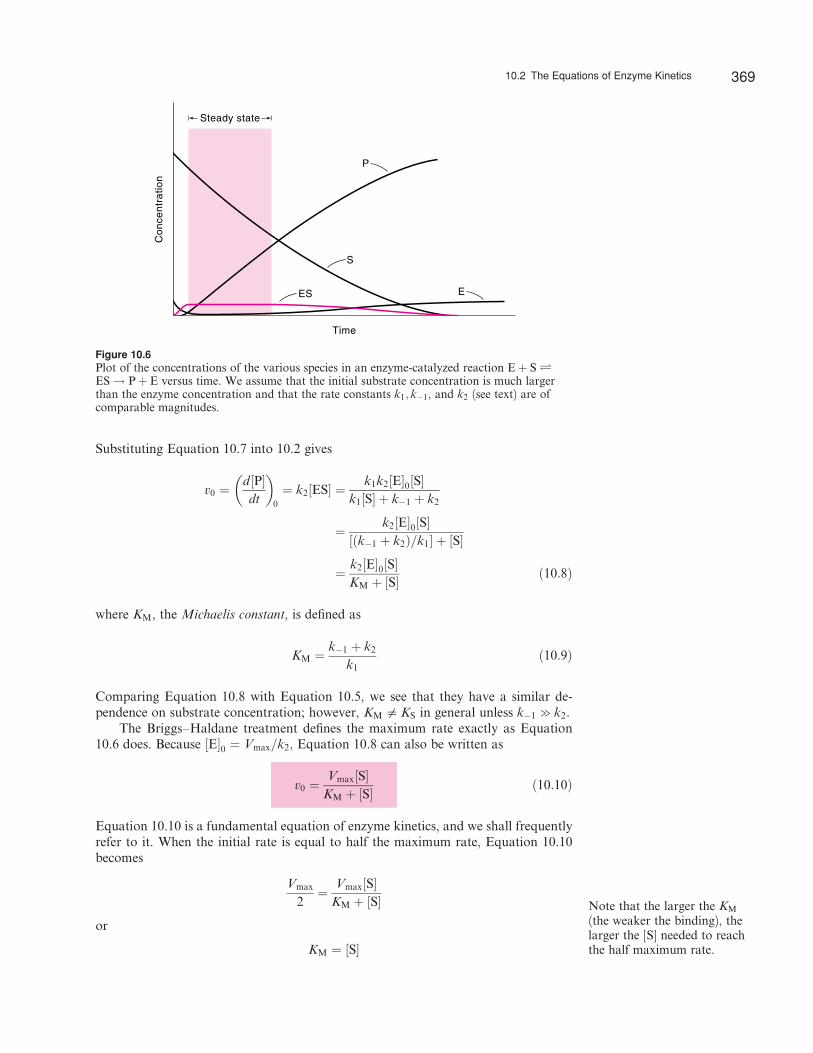
Thus, both Vmax and KM can be determined, at least in principle, from a plot such asthe one in Figure 10.7. In practice, however, we find that the plot of v0 versus [S] isnot very useful in determining the value of Vmax because locating the asymptoticvalue Vmax at very high substrate concentrations is often di‰cult. A more satisfactoryapproach, suggested by the American chemists H. Lineweaver (1907– ) and DeanBurk (1904–1988), is to employ the double-reciprocal plot of 1=v0 versus 1=½S�. FromEquation 10.10, we write
1
v0¼ KM
Vmax½S�þ 1
Vmaxð10:11Þ
As Figure 10.8 shows, both KM and Vmax can be obtained from the slope and inter-cepts of the straight line.
Although useful and widely employed in enzyme kinetic studies, the Lineweaver–Burk plot has the disadvantage of compressing the data points at high substrateconcentrations into a small region and emphasizing the points at lower substrateconcentrations, which are often the least accurate. Of the several other ways of plot-ting the kinetic data, we shall mention the Eadie–Hofstee plot. Multiplying bothsides of Equation 10.11 by v0Vmax, we obtain
Vmax ¼ v0 þv0KM
½S�
Rearrangement gives
v0 ¼ Vmax �v0KM
½S� ð10:12Þ
This equation shows that a plot of v0 versus v0=½S�, the so-called Eadie–Hofstee plot,gives a straight line with slope equal to �KM and intercepts Vmax on the v0 axis andVmax=KM on the v0=½S� axis (Figure 10.9).
The Significance of KM and Vmax
The Michaelis constant, KM, varies considerably from one enzyme to another,and also with di¤erent substrates for the same enzyme. By definition, it is equal to thesubstrate concentration at half the maximum rate. Put another way, KM representsthe substrate concentration at which half the enzyme active sites are filled by sub-strate molecules. The value of KM is sometimes equated with the dissociation con-
[S]
v 0
KM
Vmax
2
Vmax
Figure 10.7Graphical determinationof Vmax and KM.
Vmax
1KM
1
[S]1
v 0
1
Slope Vmax
KM
Figure 10.8Lineweaver–Burk plot for anenzyme-catalyzed reaction obey-ing Michaelis–Menten kinetics.
v 0
Vmax
KMSlope
Vmax
KM
[S]v 0
Figure 10.9Eadie–Hofstee plot for thereaction graphed in Figure 10.7.
370 Chapter 10: Enzyme Kinetics
stant of the enzyme–substrate complex, ES (the larger the KM, the weaker the bind-ing). As can be seen from Equation 10.9, however, this is true only when k2 f k�1 sothat KM ¼ k�1=k1. In general, KM must be expressed in terms of three rate constants.Nevertheless, KM (in units of molarity) is customarily reported together with otherkinetic parameters for enzyme-catalyzed reactions. To begin with, it is a quantity thatcan be measured easily and directly. Furthermore, KM depends on temperature, thenature of the substrate, pH, ionic strength, and other reaction conditions; therefore,its value serves to characterize a particular enzyme–substrate system under specificconditions. Any variation in KM (for the same enzyme and substrate) is often an in-dication of the presence of an inhibitor or activator. Useful information about evo-lution can also be obtained by comparing the KM values of a similar enzyme fromdi¤erent species. For the majority of enzymes, KM lies between 10�1 M and 10�7 M.
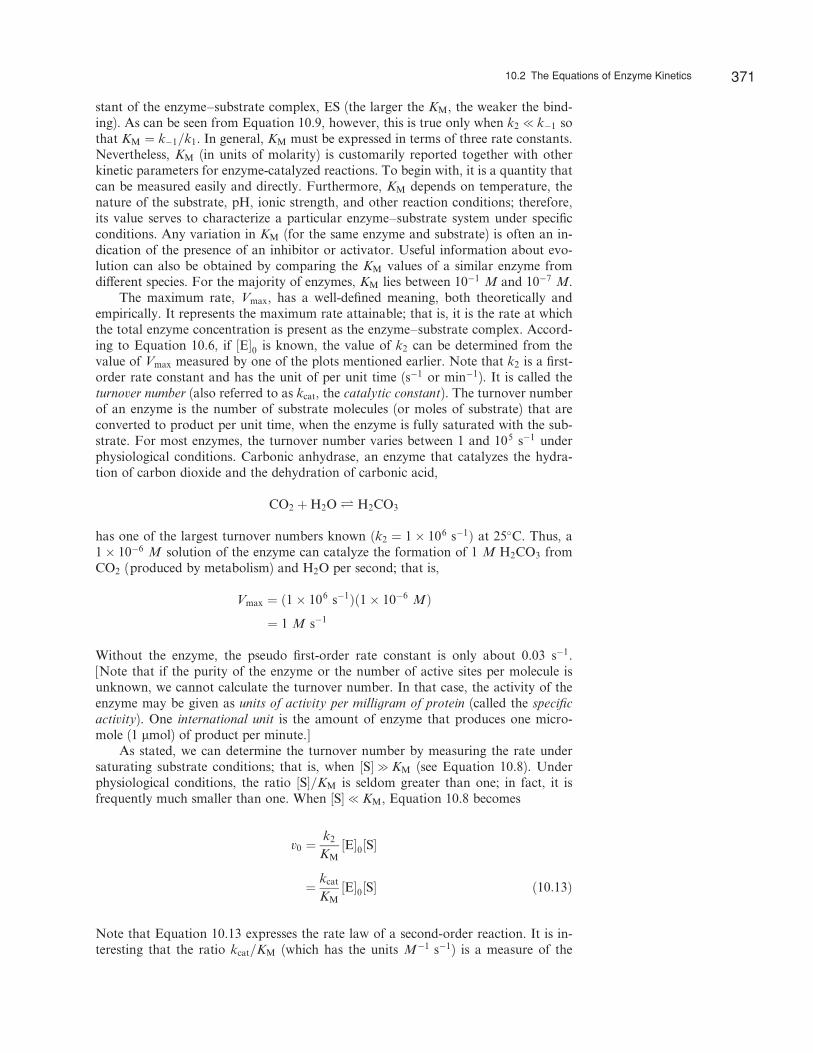
The maximum rate, Vmax, has a well-defined meaning, both theoretically andempirically. It represents the maximum rate attainable; that is, it is the rate at whichthe total enzyme concentration is present as the enzyme–substrate complex. Accord-ing to Equation 10.6, if ½E�0 is known, the value of k2 can be determined from thevalue of Vmax measured by one of the plots mentioned earlier. Note that k2 is a first-order rate constant and has the unit of per unit time (s�1 or min�1). It is called theturnover number (also referred to as kcat, the catalytic constant). The turnover numberof an enzyme is the number of substrate molecules (or moles of substrate) that areconverted to product per unit time, when the enzyme is fully saturated with the sub-strate. For most enzymes, the turnover number varies between 1 and 105 s�1 underphysiological conditions. Carbonic anhydrase, an enzyme that catalyzes the hydra-tion of carbon dioxide and the dehydration of carbonic acid,
CO2 þH2O Ð H2CO3
has one of the largest turnover numbers known ðk2 ¼ 1� 106 s�1Þ at 25�C. Thus, a1� 10�6 M solution of the enzyme can catalyze the formation of 1 M H2CO3 fromCO2 (produced by metabolism) and H2O per second; that is,
Vmax ¼ ð1� 106 s�1Þð1� 10�6 MÞ
¼ 1 M s�1
Without the enzyme, the pseudo first-order rate constant is only about 0.03 s�1.[Note that if the purity of the enzyme or the number of active sites per molecule isunknown, we cannot calculate the turnover number. In that case, the activity of theenzyme may be given as units of activity per milligram of protein (called the specific
activity). One international unit is the amount of enzyme that produces one micro-mole (1 mmol) of product per minute.]
As stated, we can determine the turnover number by measuring the rate undersaturating substrate conditions; that is, when ½S�gKM (see Equation 10.8). Underphysiological conditions, the ratio ½S�=KM is seldom greater than one; in fact, it isfrequently much smaller than one. When ½S�fKM, Equation 10.8 becomes
v0 ¼k2
KM½E�0½S�
¼ kcat
KM½E�0½S� ð10:13Þ
Note that Equation 10.13 expresses the rate law of a second-order reaction. It is in-teresting that the ratio kcat=KM (which has the units M�1 s�1) is a measure of the
10.2 The Equations of Enzyme Kinetics 371
catalytic e‰ciency of an enzyme. A large ratio favors the formation of product. Thereverse holds true for a small ratio.
Finally we ask the question: What is the upper limit of the catalytic e‰ciency ofan enzyme? From Equation 10.9, we find
kcat
KM¼ k2
KM¼ k1k2
k�1 þ k2ð10:14Þ
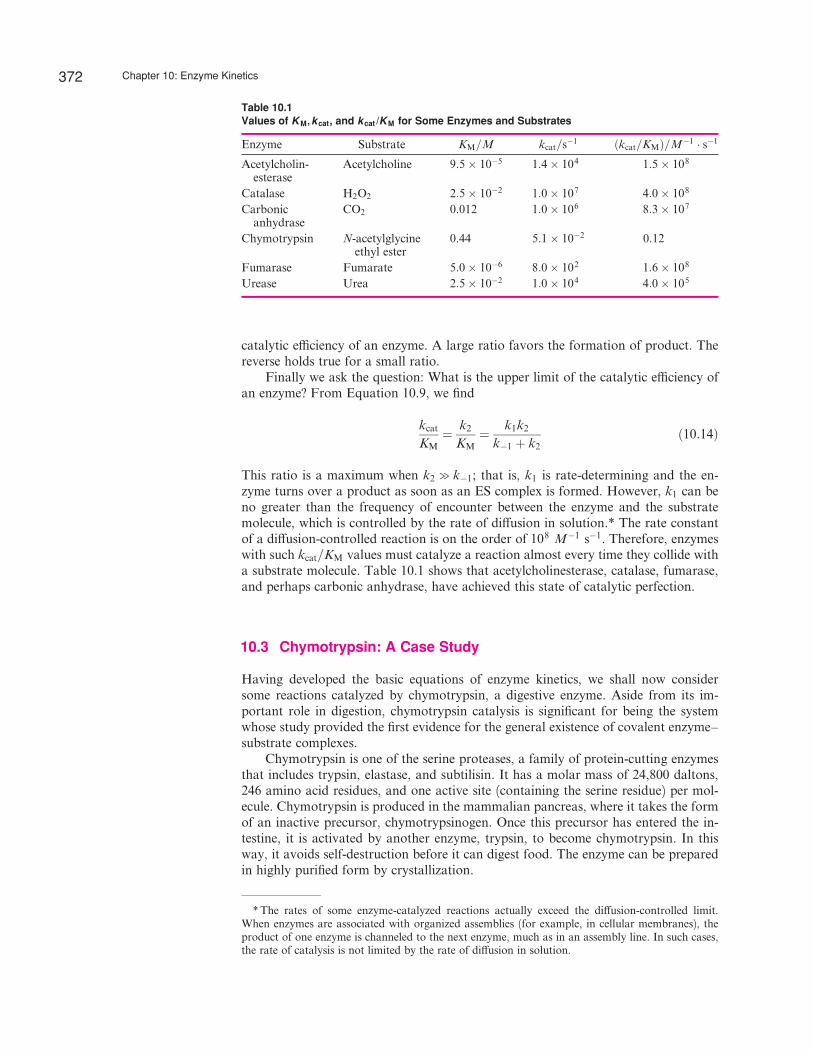
This ratio is a maximum when k2 g k�1; that is, k1 is rate-determining and the en-zyme turns over a product as soon as an ES complex is formed. However, k1 can beno greater than the frequency of encounter between the enzyme and the substratemolecule, which is controlled by the rate of di¤usion in solution.* The rate constantof a di¤usion-controlled reaction is on the order of 108 M�1 s�1. Therefore, enzymeswith such kcat=KM values must catalyze a reaction almost every time they collide witha substrate molecule. Table 10.1 shows that acetylcholinesterase, catalase, fumarase,and perhaps carbonic anhydrase, have achieved this state of catalytic perfection.
10.3 Chymotrypsin: A Case Study
Having developed the basic equations of enzyme kinetics, we shall now considersome reactions catalyzed by chymotrypsin, a digestive enzyme. Aside from its im-portant role in digestion, chymotrypsin catalysis is significant for being the systemwhose study provided the first evidence for the general existence of covalent enzyme–substrate complexes.
Chymotrypsin is one of the serine proteases, a family of protein-cutting enzymesthat includes trypsin, elastase, and subtilisin. It has a molar mass of 24,800 daltons,246 amino acid residues, and one active site (containing the serine residue) per mol-ecule. Chymotrypsin is produced in the mammalian pancreas, where it takes the formof an inactive precursor, chymotrypsinogen. Once this precursor has entered the in-testine, it is activated by another enzyme, trypsin, to become chymotrypsin. In thisway, it avoids self-destruction before it can digest food. The enzyme can be preparedin highly purified form by crystallization.
Table 10.1Values of KM‚kcat, and kcat /KM for Some Enzymes and Substrates
Enzyme Substrate KM=M kcat=s�1 ðkcat=KMÞ=M�1 � s�1
Acetylcholin-esterase
Acetylcholine 9:5� 10�5 1:4� 104 1:5� 108
Catalase H2O2 2:5� 10�2 1:0� 107 4:0� 108
Carbonicanhydrase
CO2 0.012 1:0� 106 8:3� 107
Chymotrypsin N-acetylglycineethyl ester
0.44 5:1� 10�2 0.12
Fumarase Fumarate 5:0� 10�6 8:0� 102 1:6� 108
Urease Urea 2:5� 10�2 1:0� 104 4:0� 105
*The rates of some enzyme-catalyzed reactions actually exceed the di¤usion-controlled limit.When enzymes are associated with organized assemblies (for example, in cellular membranes), theproduct of one enzyme is channeled to the next enzyme, much as in an assembly line. In such cases,the rate of catalysis is not limited by the rate of di¤usion in solution.
372 Chapter 10: Enzyme Kinetics
In 1953, the British chemists B. S. Hartley and B. A. Kilby studied the hy-drolysis of p-nitrophenyl acetate (PNPA), catalyzed by chymotrypsin to yield p-nitrophenolate ion and acetate ion:
H2O
NO2
OOCCH3
2HCH3COO
NO2
O
chymotrypsin
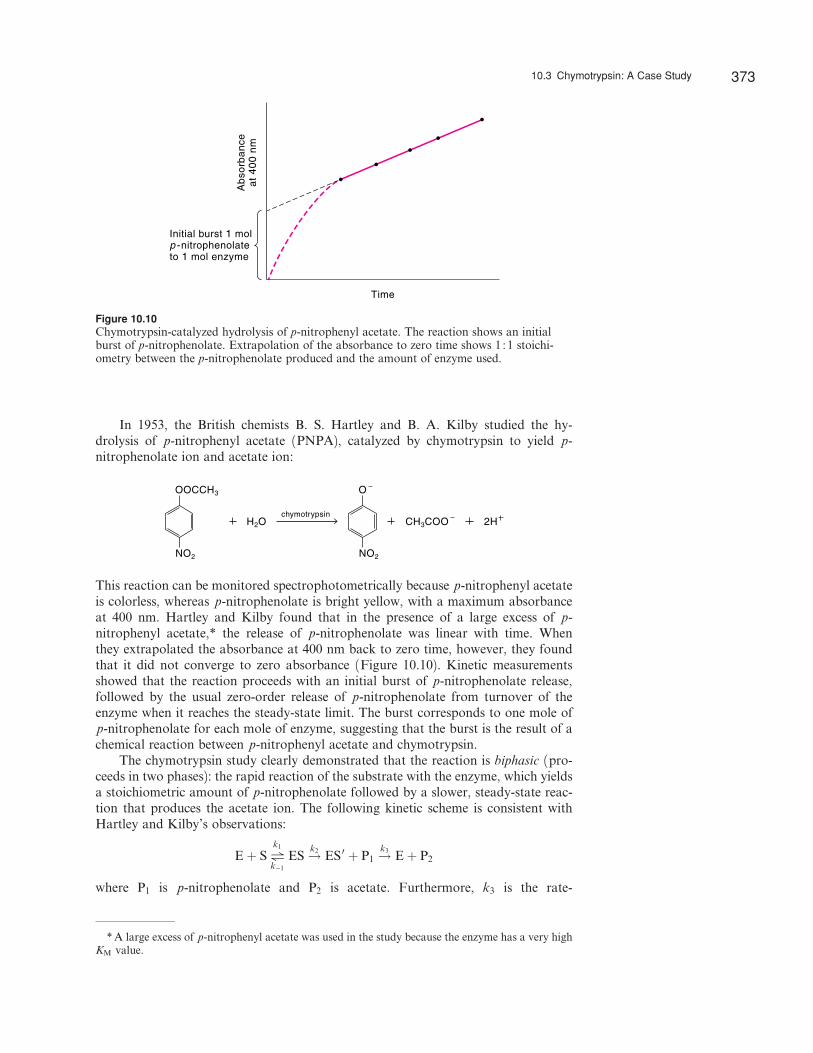
This reaction can be monitored spectrophotometrically because p-nitrophenyl acetateis colorless, whereas p-nitrophenolate is bright yellow, with a maximum absorbanceat 400 nm. Hartley and Kilby found that in the presence of a large excess of p-nitrophenyl acetate,* the release of p-nitrophenolate was linear with time. Whenthey extrapolated the absorbance at 400 nm back to zero time, however, they foundthat it did not converge to zero absorbance (Figure 10.10). Kinetic measurementsshowed that the reaction proceeds with an initial burst of p-nitrophenolate release,followed by the usual zero-order release of p-nitrophenolate from turnover of theenzyme when it reaches the steady-state limit. The burst corresponds to one mole ofp-nitrophenolate for each mole of enzyme, suggesting that the burst is the result of achemical reaction between p-nitrophenyl acetate and chymotrypsin.
The chymotrypsin study clearly demonstrated that the reaction is biphasic (pro-ceeds in two phases): the rapid reaction of the substrate with the enzyme, which yieldsa stoichiometric amount of p-nitrophenolate followed by a slower, steady-state reac-tion that produces the acetate ion. The following kinetic scheme is consistent withHartley and Kilby’s observations:
Eþ S Qk1
k�1
ES !k2 ES 0 þ P1 !k3
Eþ P2
where P1 is p-nitrophenolate and P2 is acetate. Furthermore, k3 is the rate-
*A large excess of p-nitrophenyl acetate was used in the study because the enzyme has a very highKM value.
Ab
sorb
an
cea
t 4
00
nm
Time
Initial burst 1 molp -nitrophenolateto 1 mol enzyme
Figure 10.10Chymotrypsin-catalyzed hydrolysis of p-nitrophenyl acetate. The reaction shows an initialburst of p-nitrophenolate. Extrapolation of the absorbance to zero time shows 1 :1 stoichi-ometry between the p-nitrophenolate produced and the amount of enzyme used.
10.3 Chymotrypsin: A Case Study 373
determining step in the hydrolysis reaction. The reaction mechanism is
CH3COOEnX
NO2
O
O
CH3
C
X En
O
NO2
OCH3C
X EnO
NO2
CH3
O
EnX
CH2O
ESE S
P2
P1
E
ES
H
where X represents a nucleophilic group on the enzyme (En), which is the hydroxylgroup of the serine residue at the active site. The first step is the rapid acylation of Xby p-nitrophenol actetate, with the release of one equivalent mole of p-nitrophenolatein the burst.* Next is the slow hydrolysis of this acyl–enzyme intermediate ðES 0Þ,followed by the fast reacylation of the free enzyme by p-nitrophenol actetate, whichaccounts for the slow turnover of p-nitrophenolate production.
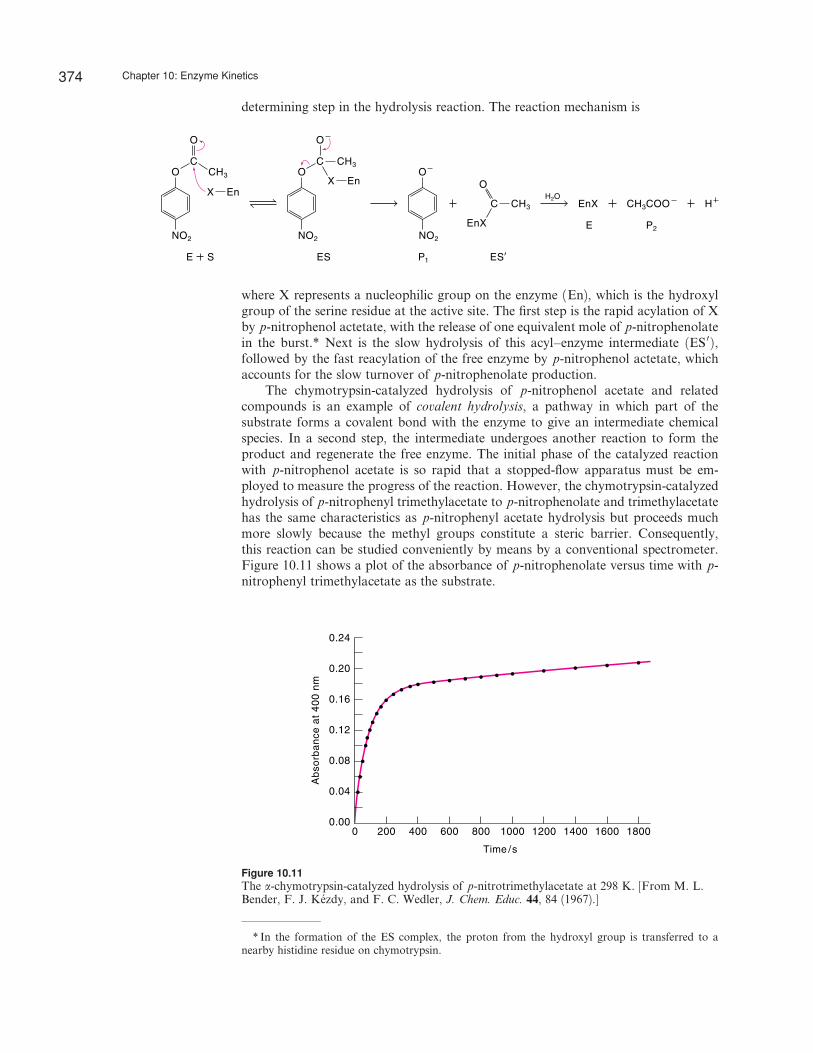
The chymotrypsin-catalyzed hydrolysis of p-nitrophenol acetate and relatedcompounds is an example of covalent hydrolysis, a pathway in which part of thesubstrate forms a covalent bond with the enzyme to give an intermediate chemicalspecies. In a second step, the intermediate undergoes another reaction to form theproduct and regenerate the free enzyme. The initial phase of the catalyzed reactionwith p-nitrophenol acetate is so rapid that a stopped-flow apparatus must be em-ployed to measure the progress of the reaction. However, the chymotrypsin-catalyzedhydrolysis of p-nitrophenyl trimethylacetate to p-nitrophenolate and trimethylacetatehas the same characteristics as p-nitrophenyl acetate hydrolysis but proceeds muchmore slowly because the methyl groups constitute a steric barrier. Consequently,this reaction can be studied conveniently by means by a conventional spectrometer.Figure 10.11 shows a plot of the absorbance of p-nitrophenolate versus time with p-nitrophenyl trimethylacetate as the substrate.
200 400 600 800 1000 1200 1400 16000 1800
0.04
0.00
0.08
0.12
0.16
0.20
0.24
Time /s
Ab
sorb
an
ce a
t 4
00
nm
Figure 10.11The a-chymotrypsin-catalyzed hydrolysis of p-nitrotrimethylacetate at 298 K. [From M. L.Bender, F. J. Kezdy, and F. C. Wedler, J. Chem. Educ. 44, 84 (1967).]
* In the formation of the ES complex, the proton from the hydroxyl group is transferred to anearby histidine residue on chymotrypsin.
374 Chapter 10: Enzyme Kinetics
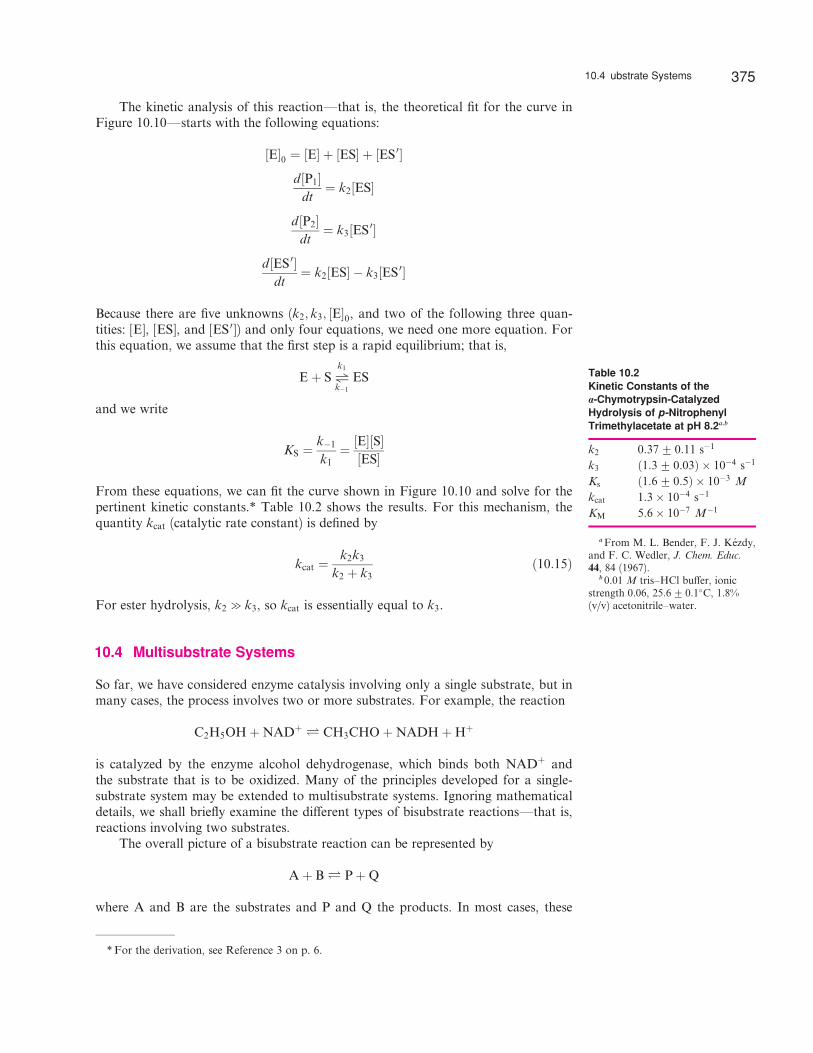
The kinetic analysis of this reaction—that is, the theoretical fit for the curve inFigure 10.10—starts with the following equations:
½E�0 ¼ ½E� þ ½ES� þ ½ES 0�
d½P1�dt
¼ k2½ES�
d½P2�dt
¼ k3½ES 0�
d½ES 0�dt
¼ k2½ES� � k3½ES 0�
Because there are five unknowns (k2; k3; ½E�0, and two of the following three quan-tities: [E], [ES], and [ES 0]) and only four equations, we need one more equation. Forthis equation, we assume that the first step is a rapid equilibrium; that is,
Eþ S Qk1
k�1
ES
and we write
KS ¼k�1
k1¼ ½E�½S�
½ES�
From these equations, we can fit the curve shown in Figure 10.10 and solve for thepertinent kinetic constants.* Table 10.2 shows the results. For this mechanism, thequantity kcat (catalytic rate constant) is defined by
kcat ¼k2k3
k2 þ k3ð10:15Þ
For ester hydrolysis, k2 g k3, so kcat is essentially equal to k3.
10.4 Multisubstrate Systems
So far, we have considered enzyme catalysis involving only a single substrate, but inmany cases, the process involves two or more substrates. For example, the reaction
C2H5OHþNADþ Ð CH3CHOþNADHþHþ
is catalyzed by the enzyme alcohol dehydrogenase, which binds both NADþ andthe substrate that is to be oxidized. Many of the principles developed for a single-substrate system may be extended to multisubstrate systems. Ignoring mathematicaldetails, we shall briefly examine the di¤erent types of bisubstrate reactions—that is,reactions involving two substrates.
The overall picture of a bisubstrate reaction can be represented by
Aþ B Ð PþQ
where A and B are the substrates and P and Q the products. In most cases, these
*For the derivation, see Reference 3 on p. 6.
Table 10.2Kinetic Constants of thea-Chymotrypsin-CatalyzedHydrolysis of p-NitrophenylTrimethylacetate at pH 8.2a,b
k2 0:37G 0:11 s�1
k3 ð1:3G 0:03Þ � 10�4 s�1
Ks ð1:6G 0:5Þ � 10�3 M
kcat 1:3� 10�4 s�1
KM 5:6� 10�7 M�1
aFrom M. L. Bender, F. J. Kezdy,and F. C. Wedler, J. Chem. Educ.
44, 84 (1967).b 0.01 M tris–HCl bu¤er, ionic
strength 0.06, 25:6G 0:1�C, 1.8%(v/v) acetonitrile–water.
10.4 ubstrate Systems 375
reactions involve the transfer of a specific functional group from one substrate (A) tothe other (B). The binding of A and B to the enzyme can take place in di¤erent ways,which can be categorized as sequential or nonsequential mechanisms.
The Sequential Mechanism
In some reactions, the binding of both substrates must take place before therelease of products. A sequential process can be further classified as follows.
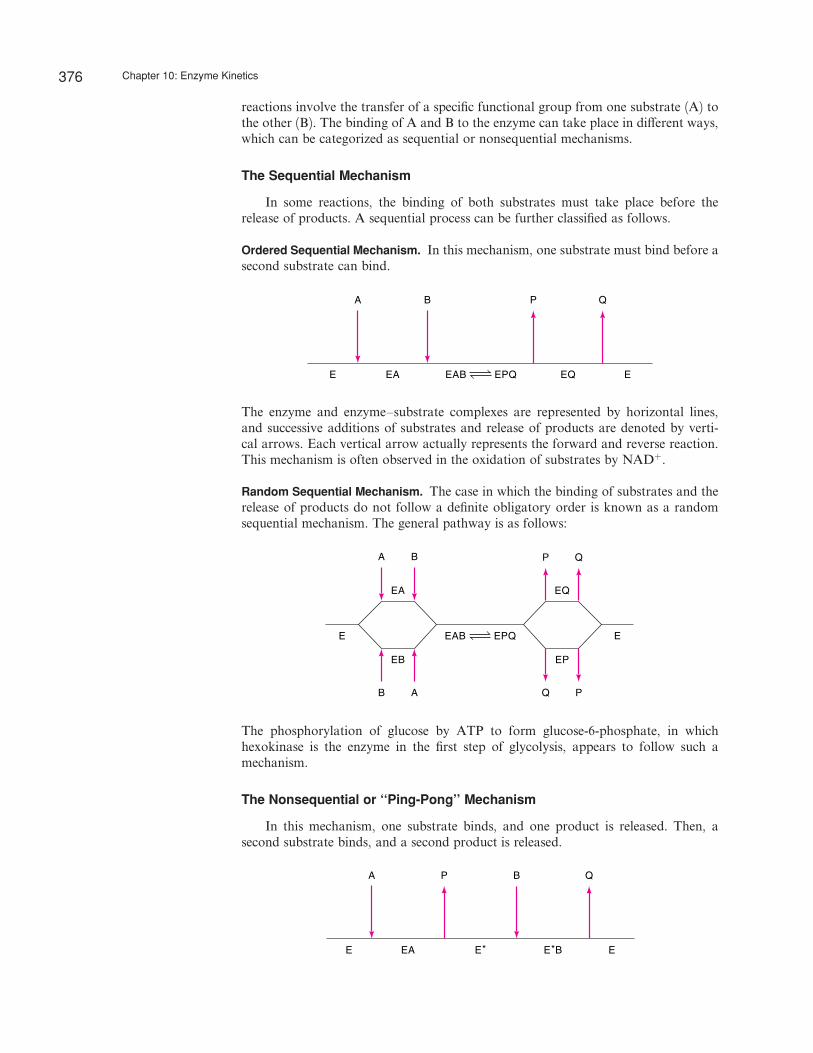
Ordered Sequential Mechanism. In this mechanism, one substrate must bind before asecond substrate can bind.
A B
E EEA EQ
P Q
EAB EPQ
The enzyme and enzyme–substrate complexes are represented by horizontal lines,and successive additions of substrates and release of products are denoted by verti-cal arrows. Each vertical arrow actually represents the forward and reverse reaction.This mechanism is often observed in the oxidation of substrates by NADþ.
Random Sequential Mechanism. The case in which the binding of substrates and therelease of products do not follow a definite obligatory order is known as a randomsequential mechanism. The general pathway is as follows:
A B
E E
EA
EB
EQ
EP
P Q
AB PQ
EAB EPQ
The phosphorylation of glucose by ATP to form glucose-6-phosphate, in whichhexokinase is the enzyme in the first step of glycolysis, appears to follow such amechanism.
The Nonsequential or ‘‘Ping-Pong’’ Mechanism
In this mechanism, one substrate binds, and one product is released. Then, asecond substrate binds, and a second product is released.
E E* EEA E*B
A P B Q
376 Chapter 10: Enzyme Kinetics
This process is called the ‘‘Ping-Pong mechanism’’ to emphasize the bouncing of theenzyme between the two states E and E�, where E� is a modified state of E, whichoften carries a fragment of A. An example of the Ping-Pong mechanism is the actionby chymotrypsin (discussed on p. 372).
10.5 Enzyme Inhibition
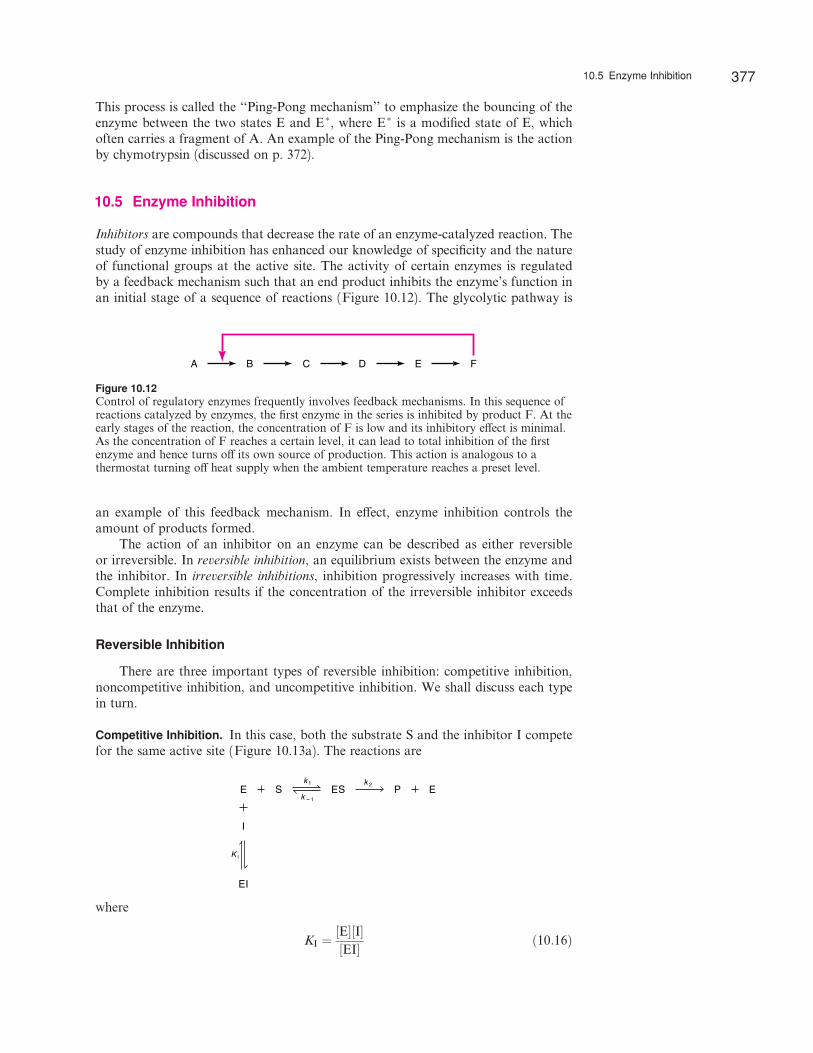
Inhibitors are compounds that decrease the rate of an enzyme-catalyzed reaction. Thestudy of enzyme inhibition has enhanced our knowledge of specificity and the natureof functional groups at the active site. The activity of certain enzymes is regulatedby a feedback mechanism such that an end product inhibits the enzyme’s function inan initial stage of a sequence of reactions (Figure 10.12). The glycolytic pathway is
an example of this feedback mechanism. In e¤ect, enzyme inhibition controls theamount of products formed.
The action of an inhibitor on an enzyme can be described as either reversibleor irreversible. In reversible inhibition, an equilibrium exists between the enzyme andthe inhibitor. In irreversible inhibitions, inhibition progressively increases with time.Complete inhibition results if the concentration of the irreversible inhibitor exceedsthat of the enzyme.
Reversible Inhibition
There are three important types of reversible inhibition: competitive inhibition,noncompetitive inhibition, and uncompetitive inhibition. We shall discuss each typein turn.
Competitive Inhibition. In this case, both the substrate S and the inhibitor I competefor the same active site (Figure 10.13a). The reactions are
ES
EI
EPE S
I
k 1
k 1 k 2
K I
where
KI ¼½E�½I�½EI� ð10:16Þ
A B C D E F
Figure 10.12Control of regulatory enzymes frequently involves feedback mechanisms. In this sequence ofreactions catalyzed by enzymes, the first enzyme in the series is inhibited by product F. At theearly stages of the reaction, the concentration of F is low and its inhibitory e¤ect is minimal.As the concentration of F reaches a certain level, it can lead to total inhibition of the firstenzyme and hence turns o¤ its own source of production. This action is analogous to athermostat turning o¤ heat supply when the ambient temperature reaches a preset level.
10.5 Enzyme Inhibition 377
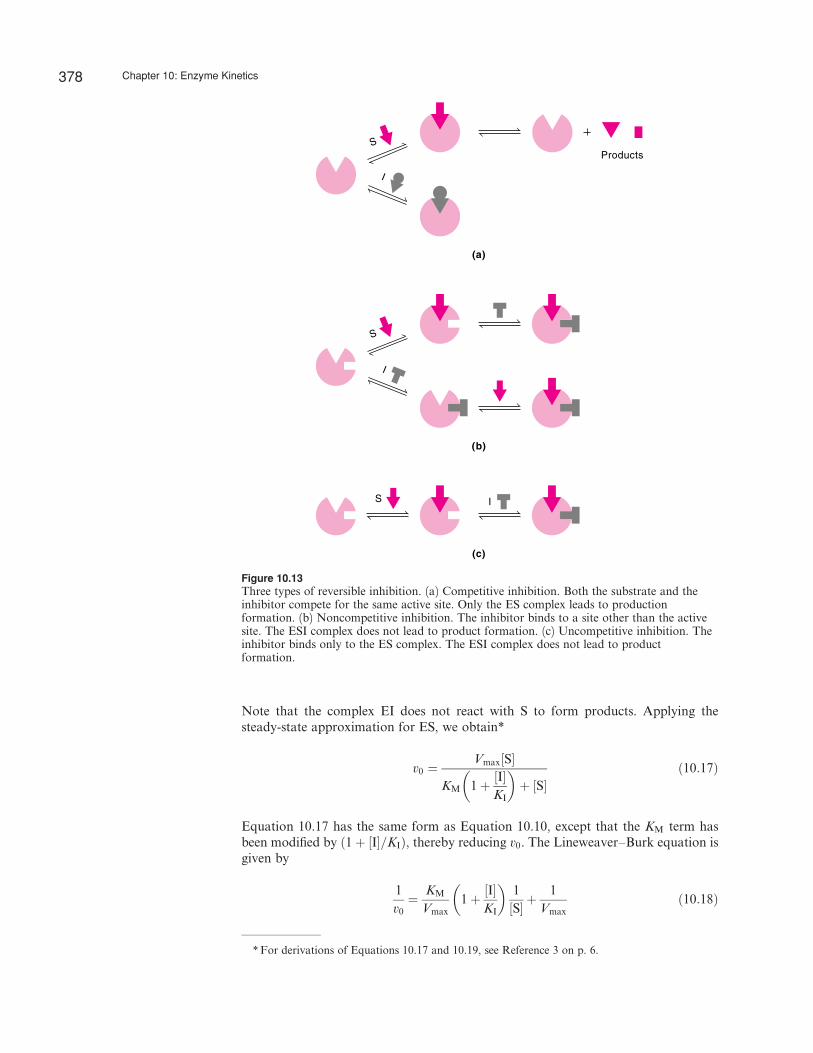
Note that the complex EI does not react with S to form products. Applying thesteady-state approximation for ES, we obtain*
v0 ¼Vmax½S�
KM 1þ ½I�KI
� �þ ½S�
ð10:17Þ
Equation 10.17 has the same form as Equation 10.10, except that the KM term hasbeen modified by ð1þ ½I�=KIÞ, thereby reducing v0. The Lineweaver–Burk equation isgiven by
1
v0¼ KM
Vmax1þ ½I�
KI
� �1
½S� þ1
Vmaxð10:18Þ
*For derivations of Equations 10.17 and 10.19, see Reference 3 on p. 6.
S
S
S
I
I
I
Products
(a)
(b)
(c)
Figure 10.13Three types of reversible inhibition. (a) Competitive inhibition. Both the substrate and theinhibitor compete for the same active site. Only the ES complex leads to productionformation. (b) Noncompetitive inhibition. The inhibitor binds to a site other than the activesite. The ESI complex does not lead to product formation. (c) Uncompetitive inhibition. Theinhibitor binds only to the ES complex. The ESI complex does not lead to productformation.
378 Chapter 10: Enzyme Kinetics
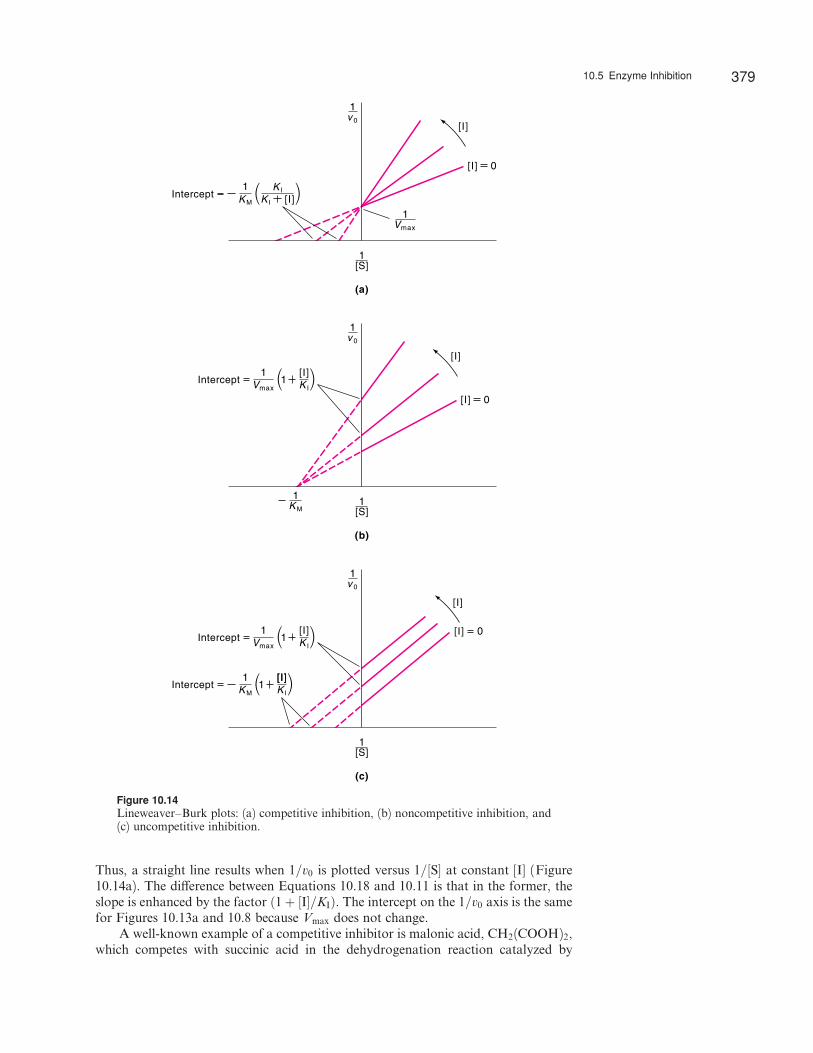
Thus, a straight line results when 1=v0 is plotted versus 1=½S� at constant [I] (Figure10.14a). The di¤erence between Equations 10.18 and 10.11 is that in the former, theslope is enhanced by the factor ð1þ ½I�=KIÞ. The intercept on the 1=v0 axis is the samefor Figures 10.13a and 10.8 because Vmax does not change.
A well-known example of a competitive inhibitor is malonic acid, CH2(COOH)2,which competes with succinic acid in the dehydrogenation reaction catalyzed by
Vmax
1
[S]1
v 0
1
Intercept Vmax
11 KI
[I]
Intercept KM
11 KI
[I][I]
[I]
0[I]
(a)
(b)
(c)
[S]1
v 0
1
Intercept Vmax
11 KI
[I]
[I]
0[I]
KM
1
[S]1
v 0
1
[I]
0[I]
Intercept KM
1[I]
K I
K I
Figure 10.14Lineweaver–Burk plots: (a) competitive inhibition, (b) noncompetitive inhibition, and(c) uncompetitive inhibition.
10.5 Enzyme Inhibition 379
succinic dehydrogenase:
CH2
COOH
COOH
CH2
C
C
COOHH
HHOOC
Succinicdehydrogenase
Succinic acid Fumaric acid
Because malonic acid resembles succinic acid in structure, it can combine with theenzyme, although no product is formed in this reaction.
Dividing Equation 10.10 by Equation 10.17, we obtain
v0
ðv0Þinhibition¼ 1þ KM½I�
KMKI þ ½S�KI
To overcome competitive inhibition, we need to increase the substrate concentrationrelative to that of the inhibitor; that is, at high substrate concentrations, ½S�KI gKMKI, so that
v0
ðv0ÞinhibitionA1þ KM½I�
½S�KIA1
Noncompetitive Inhibition. A noncompetitive inhibitor binds to the enzyme at a sitethat is distinct from the substrate binding site; therefore, it can bind to both the freeenzyme and the enzyme–substrate complex (see Figure 10.13b). The binding of theinhibitor has no e¤ect on the substrate binding, and vice versa. The reactions are
ESIEI S
E S
I
ES
I
E Pk 1
k 1 k 2
K IK I
Neither EI nor ESI forms products. Because I does not interfere with the formationof ES, noncompetitive inhibition cannot be reversed by increasing the substrate con-centration. The initial rate is given by
v0 ¼
Vmax
1þ ½I�KI
� � ½S�
KM þ ½S� ð10:19Þ
Comparing Equation 10.19 with Equation 10.10, we see that Vmax has been reducedby the factor ð1þ ½I�=KIÞ but KM is unchanged. The Lineweaver–Burk equationbecomes
1
v0¼ KM
Vmax1þ ½I�
KI
� �1
½S� þ1
Vmax1þ ½I�
KI
� �ð10:20Þ
380 Chapter 10: Enzyme Kinetics
From Figure 10.14b we see that a plot of 1=v0 versus 1=½S� gives a straight line withan increase in slope and intercept on the 1=v0 axis compared with that in Figure 10.8.Dividing Equation 10.10 by Equation 10.19, we get
v0
ðv0Þinhibition¼ 1þ ½I�
KI
This result confirms our earlier statement that the extent of noncompetitive inhibitionis independent of [S] and depends only on [I] and KI.
Noncompetitive inhibition is very common with multisubstrate enzymes. Otherexamples are the reversible reactions between the sulfhydryl groups of cysteine resi-dues on enzymes with heavy metal ions:
2aSHþHg2þ Ð aSaHgaSa þ 2Hþ
aSHþAgþ Ð aSaAgþHþ
Uncompetitive Inhibition. An uncompetitive inhibitor does not bind to the free en-zyme; instead, it binds reversibly to the enzyme–substrate complex to yield an inac-tive ESI complex (see Figure 10.13c). The reactions are
ESI
E S ES
I
E Pk 1
k 1 k 2
K I
where
KI ¼½ES�½I�½ESI� ð10:21Þ
The ESI complex does not form a product. Again, because I does not interfere withthe formation of ES, uncompetitive inhibition cannot be reversed by increasing thesubstrate concentration. The initial rate is given by (see Problem 10.16)
v0 ¼
Vmax
1þ ½I�KI
� � ½S�
KM
1þ ½I�KI
� �þ ½S�ð10:22Þ
Comparison of Equation 10.22 with Equation 10.10 shows that both Vmax and KM
have been reduced by the factor ð1þ ½I�=KIÞ. The Lineweaver–Burk equation is givenby
1
v0¼ KM
Vmax
1
½S� þ1
Vmax1þ ½I�
KI
� �ð10:23Þ
Thus, a straight line is obtained by plotting 1=v0 versus 1=½S� at constant [I] (seeFigure 10.14c). The di¤erence between Equation 10.23 and 10.11 is that the intercept
10.5 Enzyme Inhibition 381
on the 1=v0 axis is altered by the factor ð1þ ½I�=KIÞ, but the slope remains the same.Dividing Equation 10.10 by Equation 10.22, we get
v0
ðv0Þinhibition¼ KM þ ½S�ð1þ ½I�=KIÞ
KM þ ½S�
If conditions are such that ½S�gKM, then the equation above becomes
v0
ðv0Þinhibition¼ ½S� þ ½S�½I�=KI
½S� ¼ 1þ ½I�KI
Again we see that increasing the substrate concentration cannot overcome the e¤ectof I in uncompetitive inhibition, just as in the case of noncompetitive inhibition.
Uncompetitive inhibition is rarely observed in one-substrate systems. Multisub-strate enzymes, however, often give parallel line plots with inhibitors.
Example 10.1
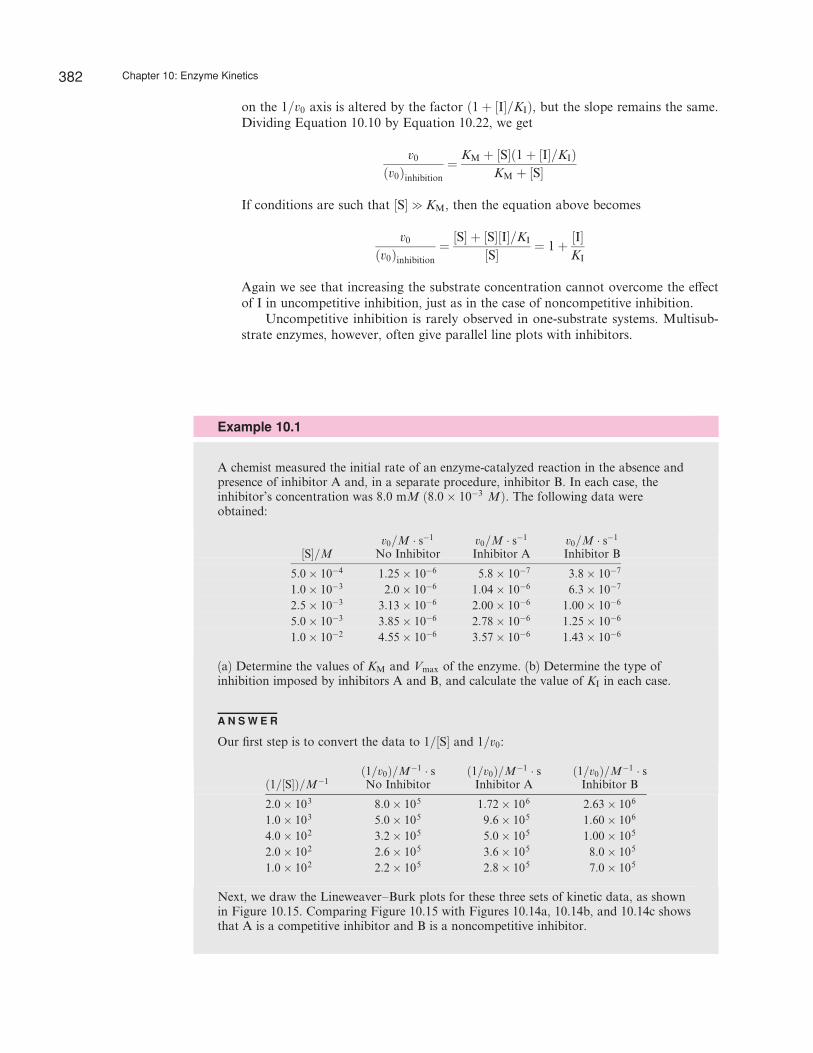
A chemist measured the initial rate of an enzyme-catalyzed reaction in the absence andpresence of inhibitor A and, in a separate procedure, inhibitor B. In each case, theinhibitor’s concentration was 8.0 mM ð8:0� 10�3 MÞ. The following data wereobtained:
½S�=Mv0=M � s�1
No Inhibitorv0=M � s�1
Inhibitor Av0=M � s�1
Inhibitor B
5:0� 10�4 1:25� 10�6 5:8� 10�7 3:8� 10�7
1:0� 10�3 2:0� 10�6 1:04� 10�6 6:3� 10�7
2:5� 10�3 3:13� 10�6 2:00� 10�6 1:00� 10�6
5:0� 10�3 3:85� 10�6 2:78� 10�6 1:25� 10�6
1:0� 10�2 4:55� 10�6 3:57� 10�6 1:43� 10�6
(a) Determine the values of KM and Vmax of the enzyme. (b) Determine the type ofinhibition imposed by inhibitors A and B, and calculate the value of KI in each case.
A N S W E R
Our first step is to convert the data to 1=½S� and 1=v0:
ð1=½S�Þ=M�1ð1=v0Þ=M�1 � sNo Inhibitor
ð1=v0Þ=M�1 � sInhibitor A
ð1=v0Þ=M�1 � sInhibitor B
2:0� 103 8:0� 105 1:72� 106 2:63� 106
1:0� 103 5:0� 105 9:6� 105 1:60� 106
4:0� 102 3:2� 105 5:0� 105 1:00� 105
2:0� 102 2:6� 105 3:6� 105 8:0� 105
1:0� 102 2:2� 105 2:8� 105 7:0� 105
Next, we draw the Lineweaver–Burk plots for these three sets of kinetic data, as shownin Figure 10.15. Comparing Figure 10.15 with Figures 10.14a, 10.14b, and 10.14c showsthat A is a competitive inhibitor and B is a noncompetitive inhibitor.
382 Chapter 10: Enzyme Kinetics
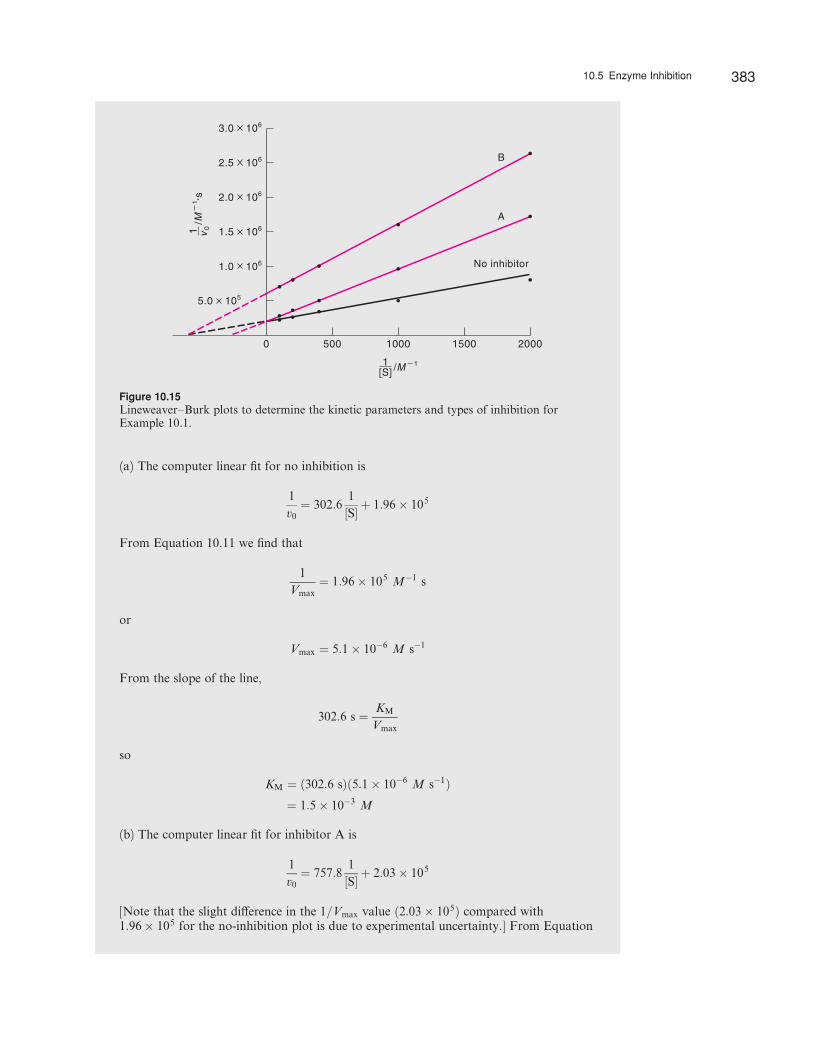
(a) The computer linear fit for no inhibition is
1
v0¼ 302:6
1
½S� þ 1:96� 105
From Equation 10.11 we find that
1
Vmax¼ 1:96� 105 M�1 s
or
Vmax ¼ 5:1� 10�6 M s�1
From the slope of the line,
302:6 s ¼ KM
Vmax
so
KM ¼ ð302:6 sÞð5:1� 10�6 M s�1Þ¼ 1:5� 10�3 M
(b) The computer linear fit for inhibitor A is
1
v0¼ 757:8
1
½S� þ 2:03� 105
[Note that the slight di¤erence in the 1=Vmax value ð2:03� 105Þ compared with1:96� 105 for the no-inhibition plot is due to experimental uncertainty.] From Equation
500 1000 1500 20000
A
B
No inhibitor
5.0 105
1.0 106
1.5 106
2.5 106
2.0 106
3.0 106
[S]1 /M 1
v01/M
s1
Figure 10.15Lineweaver–Burk plots to determine the kinetic parameters and types of inhibition forExample 10.1.
10.5 Enzyme Inhibition 383
10.18 the slope is equated as follows:
757:8 s ¼ KM
Vmax1þ ½I�
KI
� �
¼ 1:5� 10�3 M
5:1� 10�6 M s�11þ ½I�
KI
� �
Because ½I� ¼ 8:0� 10�3 M,
KI ¼ 5:1� 10�3 M
The computer linear fit for inhibitor B is
1
v0¼ 1015:3
1
½S� þ 5:95� 105
From Equation 10.20, we express the slope as
1015:3 s ¼ KM
Vmax1þ ½I�
KI
� �
¼ 1:5� 10�3 M
5:1� 10�6 M s�11þ ½I�
KI
� �
Because ½I� ¼ 8:0� 10�3 M,
KI ¼ 3:3� 10�3 M
Irreversible Inhibition
Michaelis–Menten kinetics cannot be applied to irreversible inhibition. The in-hibitor forms a covalent linkage with the enzyme molecule and cannot be removed.The e¤ectiveness of an irreversible inhibitor is determined not by the equilibriumconstant but by the rate at which the binding takes place. Iodoacetamides and male-imides act as irreversible inhibitors to the sulfhydryl groups:
aSHþ ICH2CONH2 ! aSaCH2CONH2 þHI
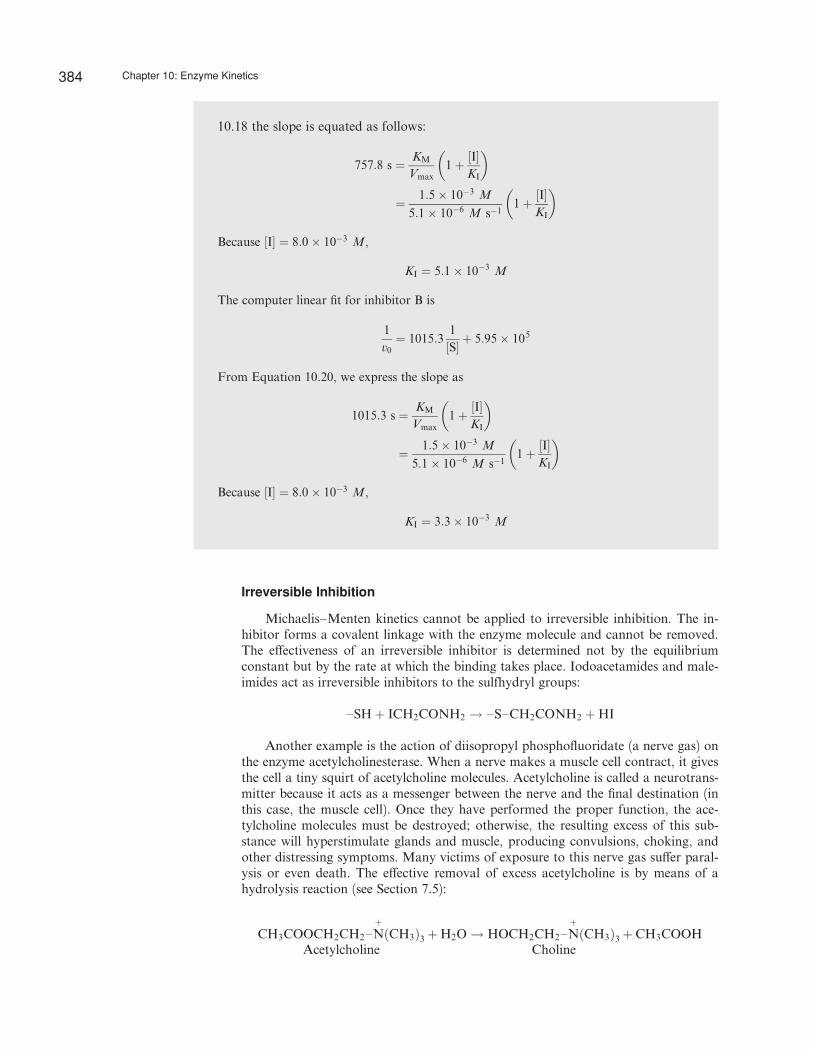
Another example is the action of diisopropyl phosphofluoridate (a nerve gas) onthe enzyme acetylcholinesterase. When a nerve makes a muscle cell contract, it givesthe cell a tiny squirt of acetylcholine molecules. Acetylcholine is called a neurotrans-mitter because it acts as a messenger between the nerve and the final destination (inthis case, the muscle cell). Once they have performed the proper function, the ace-tylcholine molecules must be destroyed; otherwise, the resulting excess of this sub-stance will hyperstimulate glands and muscle, producing convulsions, choking, andother distressing symptoms. Many victims of exposure to this nerve gas su¤er paral-ysis or even death. The e¤ective removal of excess acetylcholine is by means of ahydrolysis reaction (see Section 7.5):
þ þCH3COOCH2CH2aNðCH3Þ3
AcetylcholineþH2O ! HOCH2CH2aNðCH3Þ3
CholineþCH3COOH
384 Chapter 10: Enzyme Kinetics
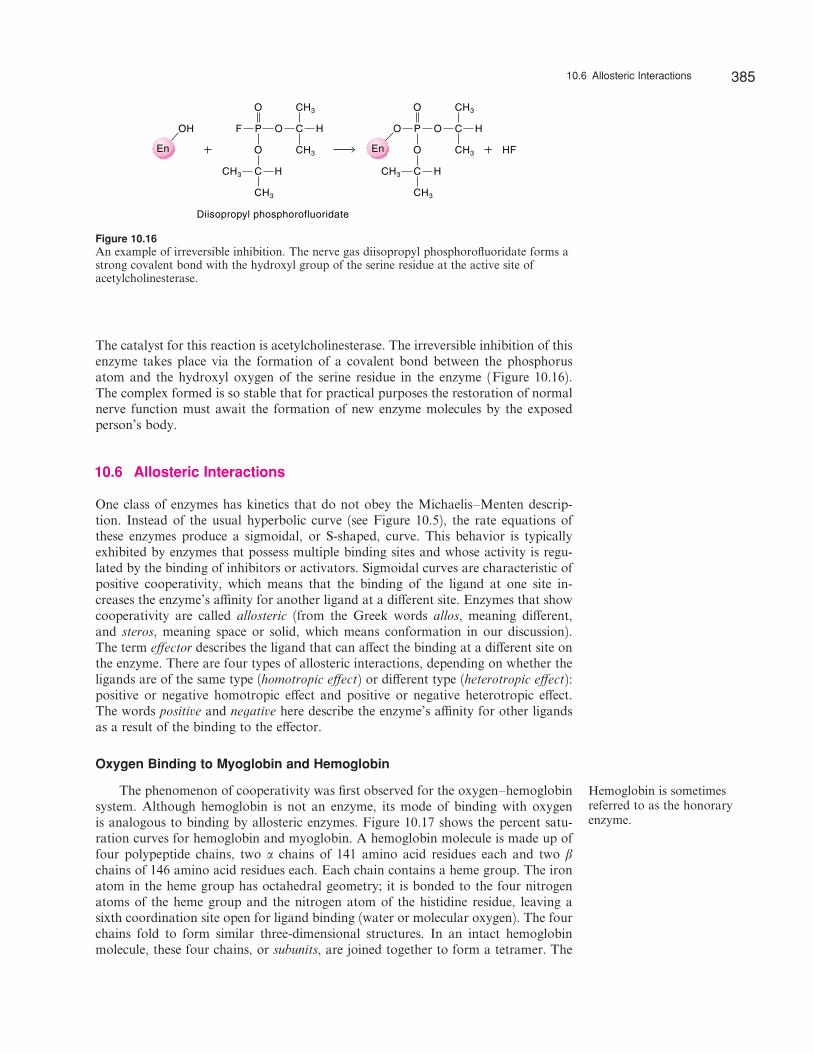
The catalyst for this reaction is acetylcholinesterase. The irreversible inhibition of thisenzyme takes place via the formation of a covalent bond between the phosphorusatom and the hydroxyl oxygen of the serine residue in the enzyme (Figure 10.16).The complex formed is so stable that for practical purposes the restoration of normalnerve function must await the formation of new enzyme molecules by the exposedperson’s body.
10.6 Allosteric Interactions
One class of enzymes has kinetics that do not obey the Michaelis–Menten descrip-tion. Instead of the usual hyperbolic curve (see Figure 10.5), the rate equations ofthese enzymes produce a sigmoidal, or S-shaped, curve. This behavior is typicallyexhibited by enzymes that possess multiple binding sites and whose activity is regu-lated by the binding of inhibitors or activators. Sigmoidal curves are characteristic ofpositive cooperativity, which means that the binding of the ligand at one site in-creases the enzyme’s a‰nity for another ligand at a di¤erent site. Enzymes that showcooperativity are called allosteric (from the Greek words allos, meaning di¤erent,and steros, meaning space or solid, which means conformation in our discussion).The term e¤ector describes the ligand that can a¤ect the binding at a di¤erent site onthe enzyme. There are four types of allosteric interactions, depending on whether theligands are of the same type (homotropic e¤ect) or di¤erent type (heterotropic e¤ect):positive or negative homotropic e¤ect and positive or negative heterotropic e¤ect.The words positive and negative here describe the enzyme’s a‰nity for other ligandsas a result of the binding to the e¤ector.
Oxygen Binding to Myoglobin and Hemoglobin
The phenomenon of cooperativity was first observed for the oxygen–hemoglobinsystem. Although hemoglobin is not an enzyme, its mode of binding with oxygenis analogous to binding by allosteric enzymes. Figure 10.17 shows the percent satu-ration curves for hemoglobin and myoglobin. A hemoglobin molecule is made up offour polypeptide chains, two a chains of 141 amino acid residues each and two b
chains of 146 amino acid residues each. Each chain contains a heme group. The ironatom in the heme group has octahedral geometry; it is bonded to the four nitrogenatoms of the heme group and the nitrogen atom of the histidine residue, leaving asixth coordination site open for ligand binding (water or molecular oxygen). The fourchains fold to form similar three-dimensional structures. In an intact hemoglobinmolecule, these four chains, or subunits, are joined together to form a tetramer. The
Hemoglobin is sometimesreferred to as the honoraryenzyme.
En
OH
CH3
F
CH3
H
O
O
O
P
C
CH3
CH3
HC
HF
CH3
En
O
CH3
H
O
O
O
P
C
CH3
CH3
HC
Diisopropyl phosphorofluoridate
Figure 10.16An example of irreversible inhibition. The nerve gas diisopropyl phosphorofluoridate forms astrong covalent bond with the hydroxyl group of the serine residue at the active site ofacetylcholinesterase.
10.6 Allosteric Interactions 385
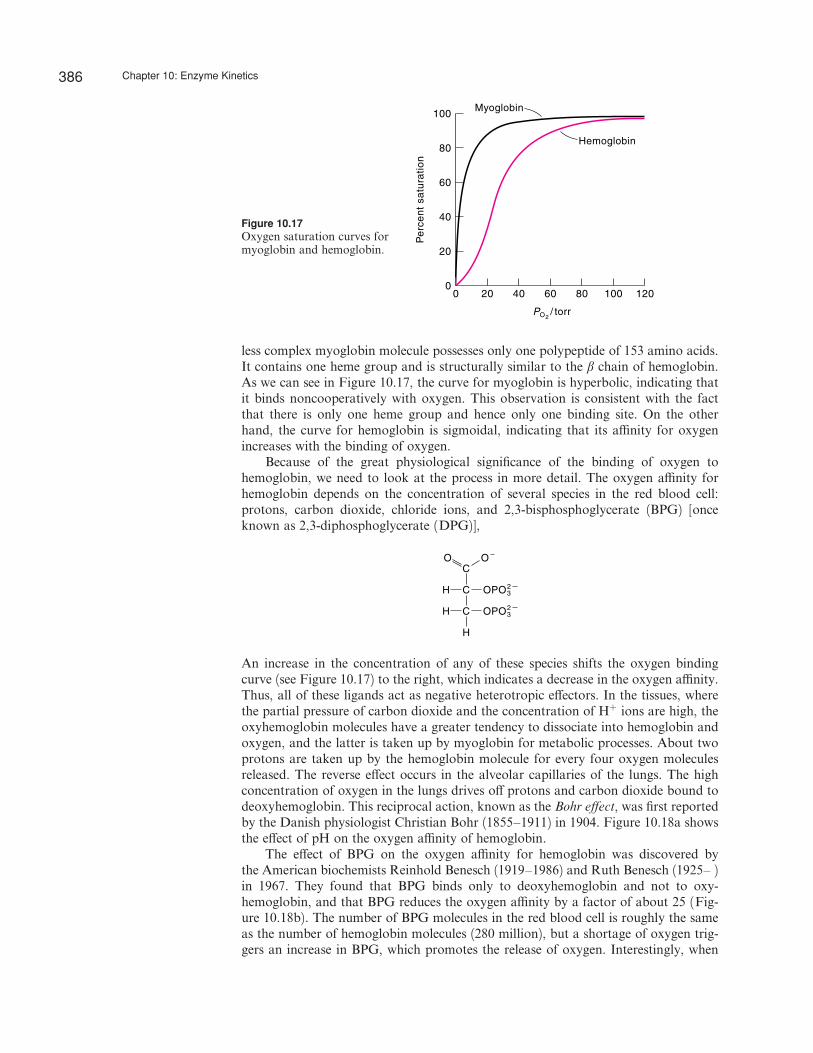
less complex myoglobin molecule possesses only one polypeptide of 153 amino acids.It contains one heme group and is structurally similar to the b chain of hemoglobin.As we can see in Figure 10.17, the curve for myoglobin is hyperbolic, indicating thatit binds noncooperatively with oxygen. This observation is consistent with the factthat there is only one heme group and hence only one binding site. On the otherhand, the curve for hemoglobin is sigmoidal, indicating that its a‰nity for oxygenincreases with the binding of oxygen.
Because of the great physiological significance of the binding of oxygen tohemoglobin, we need to look at the process in more detail. The oxygen a‰nity forhemoglobin depends on the concentration of several species in the red blood cell:protons, carbon dioxide, chloride ions, and 2,3-bisphosphoglycerate (BPG) [onceknown as 2,3-diphosphoglycerate (DPG)],
3OPO2
3OPO2
O
H
O
C
C
H
H
C
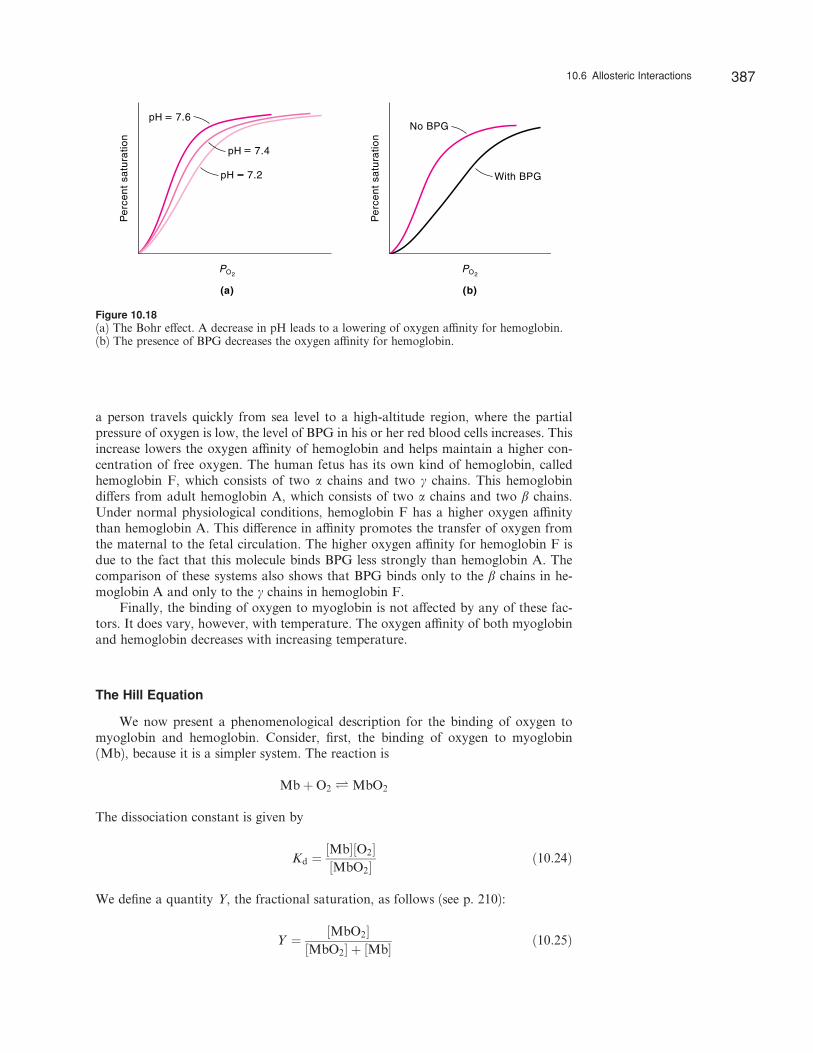
An increase in the concentration of any of these species shifts the oxygen bindingcurve (see Figure 10.17) to the right, which indicates a decrease in the oxygen a‰nity.Thus, all of these ligands act as negative heterotropic e¤ectors. In the tissues, wherethe partial pressure of carbon dioxide and the concentration of Hþ ions are high, theoxyhemoglobin molecules have a greater tendency to dissociate into hemoglobin andoxygen, and the latter is taken up by myoglobin for metabolic processes. About twoprotons are taken up by the hemoglobin molecule for every four oxygen moleculesreleased. The reverse e¤ect occurs in the alveolar capillaries of the lungs. The highconcentration of oxygen in the lungs drives o¤ protons and carbon dioxide bound todeoxyhemoglobin. This reciprocal action, known as the Bohr e¤ect, was first reportedby the Danish physiologist Christian Bohr (1855–1911) in 1904. Figure 10.18a showsthe e¤ect of pH on the oxygen a‰nity of hemoglobin.
The e¤ect of BPG on the oxygen a‰nity for hemoglobin was discovered bythe American biochemists Reinhold Benesch (1919–1986) and Ruth Benesch (1925– )in 1967. They found that BPG binds only to deoxyhemoglobin and not to oxy-hemoglobin, and that BPG reduces the oxygen a‰nity by a factor of about 25 (Fig-ure 10.18b). The number of BPG molecules in the red blood cell is roughly the sameas the number of hemoglobin molecules (280 million), but a shortage of oxygen trig-gers an increase in BPG, which promotes the release of oxygen. Interestingly, when
20 40 60 8000
20
40
60
80
100
100 120
Pe
rce
nt
satu
ratio
n
Myoglobin
Hemoglobin
PO2/ torr
Figure 10.17Oxygen saturation curves formyoglobin and hemoglobin.
386 Chapter 10: Enzyme Kinetics
a person travels quickly from sea level to a high-altitude region, where the partialpressure of oxygen is low, the level of BPG in his or her red blood cells increases. Thisincrease lowers the oxygen a‰nity of hemoglobin and helps maintain a higher con-centration of free oxygen. The human fetus has its own kind of hemoglobin, calledhemoglobin F, which consists of two a chains and two g chains. This hemoglobindi¤ers from adult hemoglobin A, which consists of two a chains and two b chains.Under normal physiological conditions, hemoglobin F has a higher oxygen a‰nitythan hemoglobin A. This di¤erence in a‰nity promotes the transfer of oxygen fromthe maternal to the fetal circulation. The higher oxygen a‰nity for hemoglobin F isdue to the fact that this molecule binds BPG less strongly than hemoglobin A. Thecomparison of these systems also shows that BPG binds only to the b chains in he-moglobin A and only to the g chains in hemoglobin F.
Finally, the binding of oxygen to myoglobin is not a¤ected by any of these fac-tors. It does vary, however, with temperature. The oxygen a‰nity of both myoglobinand hemoglobin decreases with increasing temperature.
The Hill Equation
We now present a phenomenological description for the binding of oxygen tomyoglobin and hemoglobin. Consider, first, the binding of oxygen to myoglobin(Mb), because it is a simpler system. The reaction is
MbþO2 Ð MbO2
The dissociation constant is given by
Kd ¼½Mb�½O2�½MbO2�
ð10:24Þ
We define a quantity Y, the fractional saturation, as follows (see p. 210):
Y ¼ ½MbO2�½MbO2� þ ½Mb� ð10:25Þ
No BPG
With BPG
Pe
rce
nt
satu
ratio
n
(a)
PO2
pH 7.6
pH 7.4
pH 7.2
Pe
rce
nt
satu
ratio
n
(b)
PO2
Figure 10.18(a) The Bohr e¤ect. A decrease in pH leads to a lowering of oxygen a‰nity for hemoglobin.(b) The presence of BPG decreases the oxygen a‰nity for hemoglobin.
10.6 Allosteric Interactions 387
From Equation 10.24 and 10.25,
Y ¼ ½O2�½O2� þ Kd
ð10:26Þ
Because O2 is a gas, expressing its concentration in terms of its partial pressure ismore convenient. Furthermore, if we represent the oxygen a‰nity for myoglobin asP50, which is the partial pressure of oxygen when half, or 50%, of the binding sites arefilled (that is, when ½Mb� ¼ ½MbO2�), it follows that
Kd ¼½Mb�PO2
½MbO2�¼ PO2
¼ P50
and Equation 10.26 becomes
Y ¼ PO2
PO2þ P50
ð10:27Þ
Rearranging, we have
Y
1� Y¼ PO2
P50
Taking the logarithm of both sides of the above equation, we obtain
logY
1� Y¼ logPO2
� logP50 ð10:28Þ
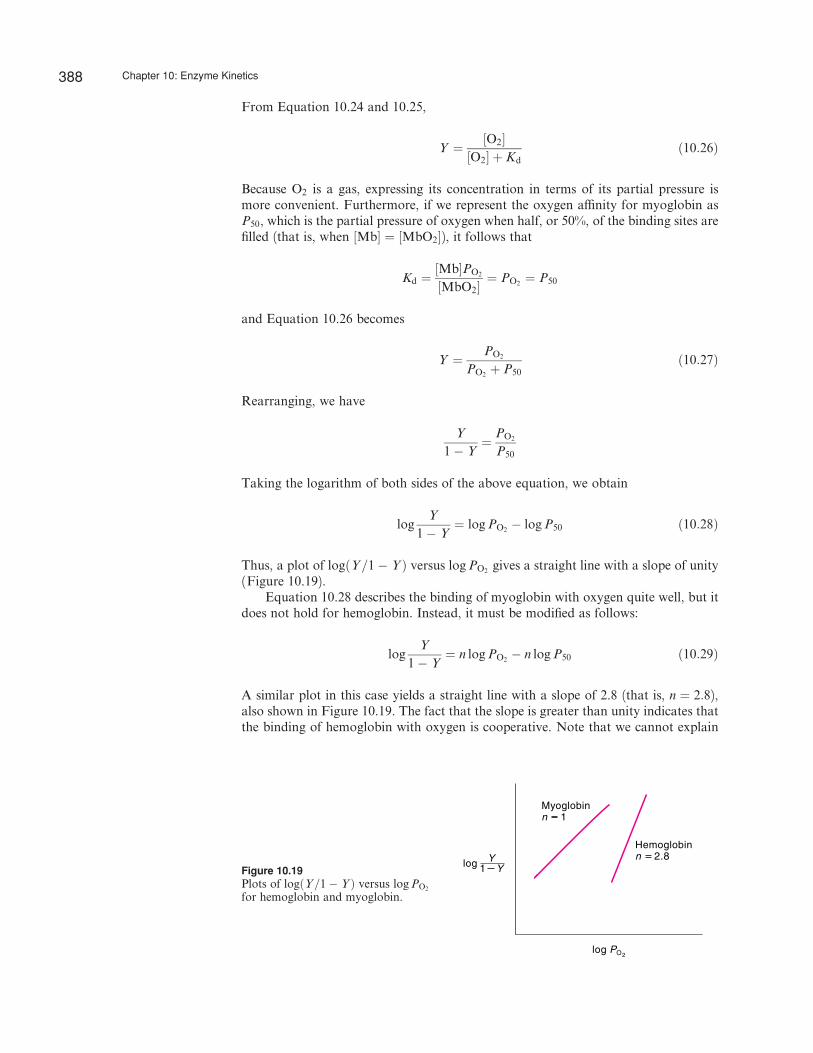
Thus, a plot of logðY=1� YÞ versus logPO2gives a straight line with a slope of unity
(Figure 10.19).Equation 10.28 describes the binding of myoglobin with oxygen quite well, but it
does not hold for hemoglobin. Instead, it must be modified as follows:
logY
1� Y¼ n logPO2
� n logP50 ð10:29Þ
A similar plot in this case yields a straight line with a slope of 2.8 (that is, n ¼ 2:8),also shown in Figure 10.19. The fact that the slope is greater than unity indicates thatthe binding of hemoglobin with oxygen is cooperative. Note that we cannot explain
Myoglobin
Hemoglobin
log PO2
n 1
n 2.8log Y
1 YFigure 10.19Plots of logðY=1� Y Þ versus logPO2
for hemoglobin and myoglobin.
388 Chapter 10: Enzyme Kinetics
the binding phenomenon in this case by assuming that it is a higher-order reaction,because n is not an integer and it is not identical to the number of sites. (If all foursites were equivalent and independent of one another, we would analyze the bindingcurve using Equation 6.30.) Furthermore, the fact that the slope of the line at verylow and very high partial pressures of oxygen tends to unity is inconsistent with ahigh-order mechanism, which predicts a constant slope at all partial pressures ofoxygen. Equation 10.29 is often referred to as the Hill equation (after the Britishbiochemist Archibald Vivian Hill, 1886–1977), and n is known as the Hill coe‰cient.The Hill coe‰cient is a measure of cooperativity—the higher n is, the higher thecooperativity. If n ¼ 1, there is no cooperativity; if n < 1, there is negative coopera-tivity. The upper limit of n is the number of binding sites, which is 4 for hemoglobin.
What is the significance of cooperativity? In essence, it enables hemoglobin to bea more e‰cient oxygen transporter than myoglobin. The partial pressure of oxygen isabout 100 torr in the lungs, compared with about 20 torr in the capillaries of muscle.Furthermore, the partial pressure for 50% saturation of hemoglobin is about 26 torr(see Figure 10.17). From Equation 10.29,
Y
1� Y¼ PO2
P50
� �n
In the lungs,
Ylung
1� Ylung¼ 100
26
� �2:8
or
Ylung ¼ 0:98
In the muscles,
Ymuscle
1� Ymuscle¼ 20
26
� �2:8
Ymuscle ¼ 0:32
The amount of oxygen delivered is proportional to DY , given by
DY ¼ Ylung � Ymuscle ¼ 0:66
What would happen if the binding between hemoglobin and oxygen were notcooperative? In this case, n ¼ 1 and we have, from Equation 10.27,
Ylung ¼100
100þ 26¼ 0:79
In the muscles,
Ymuscle ¼20
20þ 26¼ 0:43
so that DY ¼ 0:36. Thus, almost twice as much oxygen is delivered to the tissueswhen the binding of hemoglobin with oxygen is cooperative.
10.6 Allosteric Interactions 389
Equation 10.29 is an empirical approach to cooperativity; it says nothing aboutthe mechanism involved. Over the past 60 years, several theories have been proposedto explain cooperativity. Next, we shall briefly discuss two theories that have playedimportant roles in our understanding of allosteric interactions.
The Concerted Model
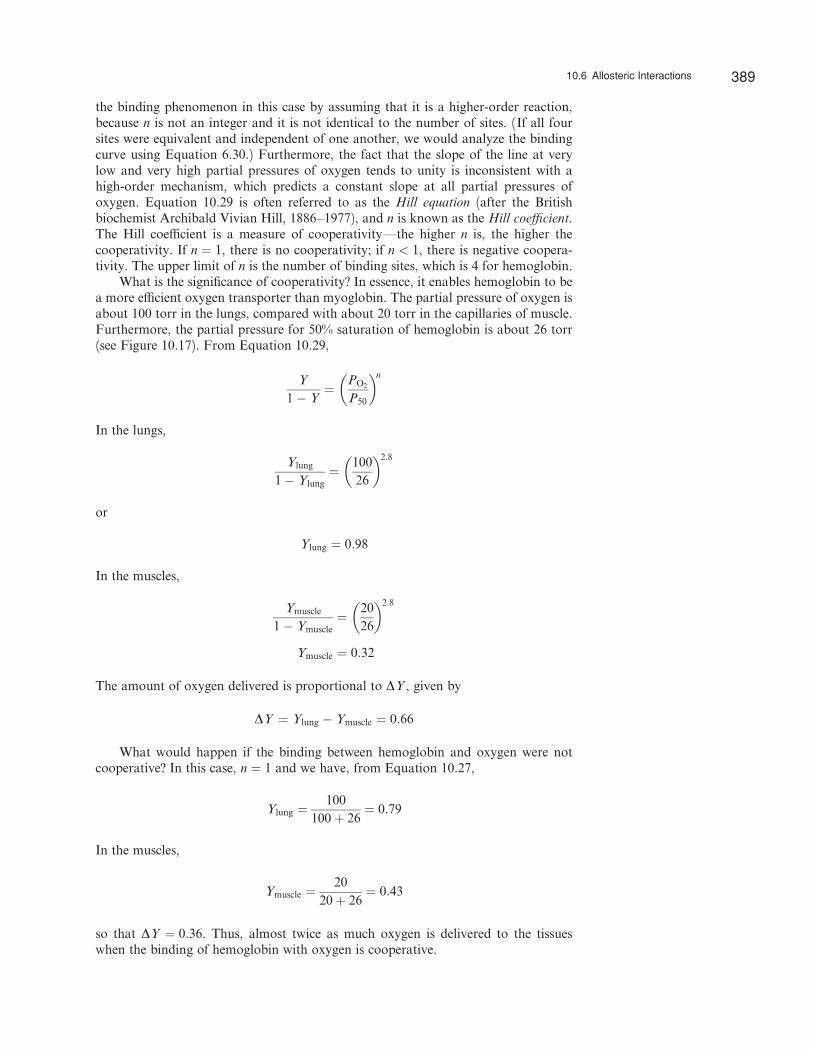
In 1965, Monod, Wyman, and Changeux proposed a theory, called the concertedmodel, to explain cooperativity.* Their theory makes the following assumptions: (1)Proteins are oligomers; that is, they contain two or more subunits. (2) Each proteinmolecule can exist in either of two states, called T (tense) and R (relaxed), which arein equilibrium. (3) In the absence of substrate molecules, the T state is favored. Whensubstrate molecules are bound to the enzyme, the equilibrium gradually shifts to theR state, which has a higher a‰nity for the ligand. (4) All binding sites in each stateare equivalent and have an identical dissociation constant for the binding of ligands(KT for the T state and KR for the R state). Figure 10.20 shows the concerted modelfor the binding of oxygen with hemoglobin.
The equilibrium constant, L0, for the two states in the absence of oxygen(denoted by the subscript 0) is given by
L0 ¼½T0�½R0�
ð10:30Þ
Because the T state is favored in the absence of O2, L0 is large, and only negligibleamounts of the R state are present. When oxygen is present, the equilibrium shiftsgradually to the R state, which has a higher a‰nity for oxygen. When four moleculesof ligand are bound, virtually all of the hemoglobin molecules will be in the R state,which corresponds to the conformation of oxyhemoglobin. We define c as the ratio ofthe dissociation constants:
c ¼ KR
KTð10:31Þ
Because the R state has the higher a‰nity for O2, c must be smaller than 1. Thea‰nity of a subunit for the ligand depends solely on whether it is in the T or R stateand not on whether the sites on neighboring units are occupied; thus, KR and KT arethe same for all stages of saturation. When one ligand is bound, the [T]/[R] ratiochanges by the factor c; when two ligands are bound, the [T]/[R] ratio changes by c2,and so on. We can represent the successive ligand binding depicted in Figure 10.20with the following equations (see Problem 10.28):
K1 ¼ cL0
K2 ¼ cK1 ¼ c2L0
K3 ¼ cK2 ¼ c3L0
K4 ¼ cK3 ¼ c4L0
We see that the equilibrium between T and R shifts to the R form as more O2 mole-cules are bound.
Note that if hemoglobin were always entirely in the T state, its binding of oxy-gen, although weak, would be completely noncooperative and characterized only by
* J. Monod, J. Wyman, and P. P. Changeaux, J. Mol. Biol. 12, 88 (1965).
cL 0K1
c 2L 0K 2
c 3L 0K 3
c 4L 0K 4
L 0
K T O2 KR O2
K T O2 KR O2
K T O2 KR O2
K T O2 KR O2
O2 O2
O2 O2
O2
O2
O2
O2 O2
O2
O2
O2
O2
O2
O2O2
O2
O2
O2
O2
Figure 10.20The concerted model for bindingof oxygen with hemoglobin. Thesquares represent the tense state;the quarter circles represent therelaxed state.
390 Chapter 10: Enzyme Kinetics
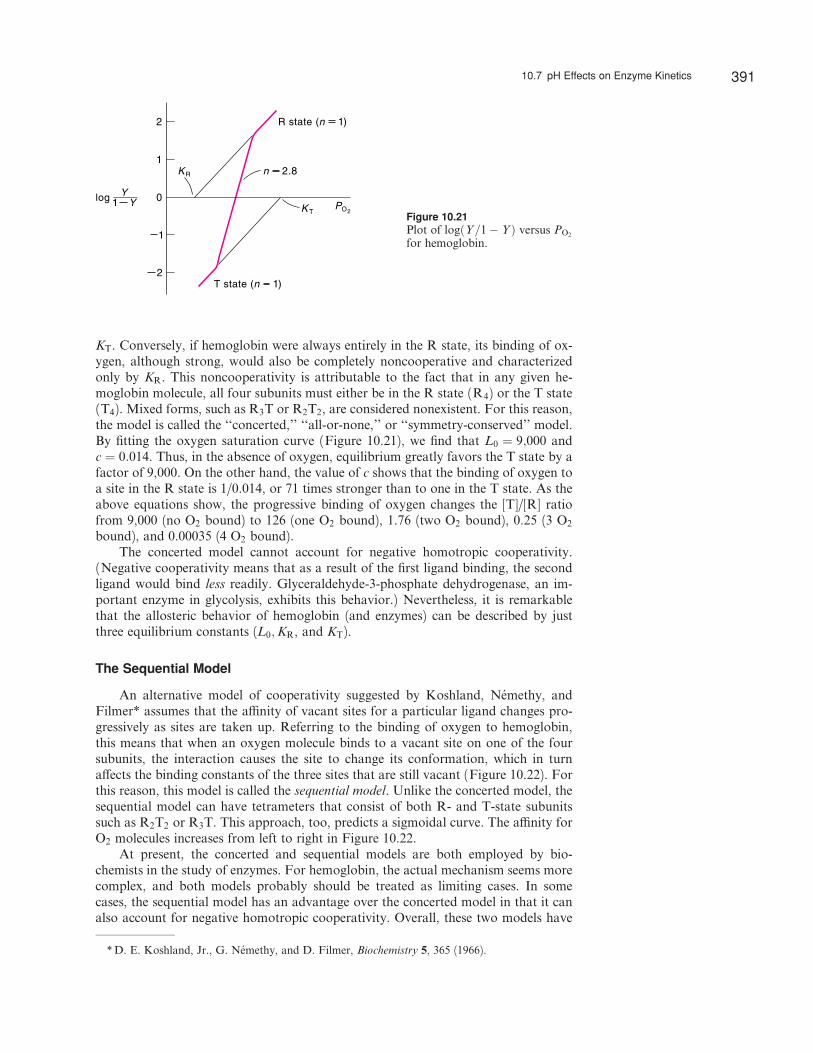
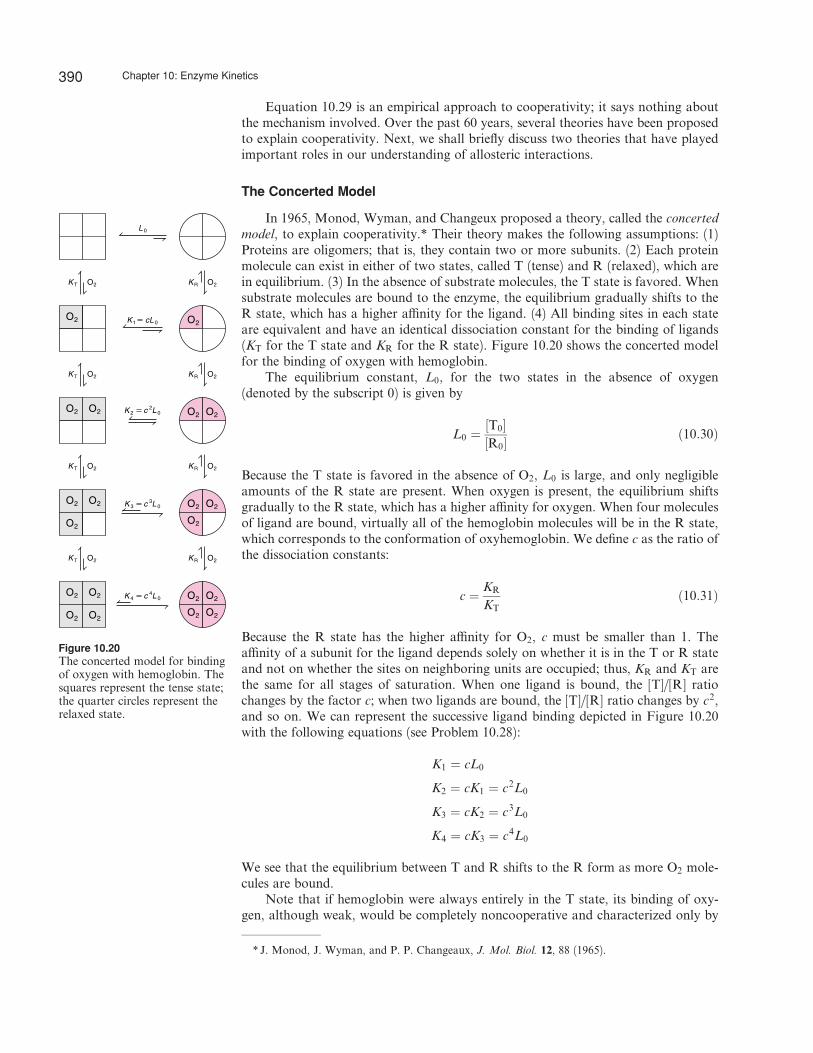
KT. Conversely, if hemoglobin were always entirely in the R state, its binding of ox-ygen, although strong, would also be completely noncooperative and characterizedonly by KR. This noncooperativity is attributable to the fact that in any given he-moglobin molecule, all four subunits must either be in the R state (R4) or the T state(T4). Mixed forms, such as R3T or R2T2, are considered nonexistent. For this reason,the model is called the ‘‘concerted,’’ ‘‘all-or-none,’’ or ‘‘symmetry-conserved’’ model.By fitting the oxygen saturation curve (Figure 10.21), we find that L0 ¼ 9;000 andc ¼ 0:014. Thus, in the absence of oxygen, equilibrium greatly favors the T state by afactor of 9,000. On the other hand, the value of c shows that the binding of oxygen toa site in the R state is 1/0.014, or 71 times stronger than to one in the T state. As theabove equations show, the progressive binding of oxygen changes the [T]/[R] ratiofrom 9,000 (no O2 bound) to 126 (one O2 bound), 1.76 (two O2 bound), 0.25 (3 O2
bound), and 0.00035 (4 O2 bound).The concerted model cannot account for negative homotropic cooperativity.
(Negative cooperativity means that as a result of the first ligand binding, the secondligand would bind less readily. Glyceraldehyde-3-phosphate dehydrogenase, an im-portant enzyme in glycolysis, exhibits this behavior.) Nevertheless, it is remarkablethat the allosteric behavior of hemoglobin (and enzymes) can be described by justthree equilibrium constants (L0;KR, and KT).
The Sequential Model
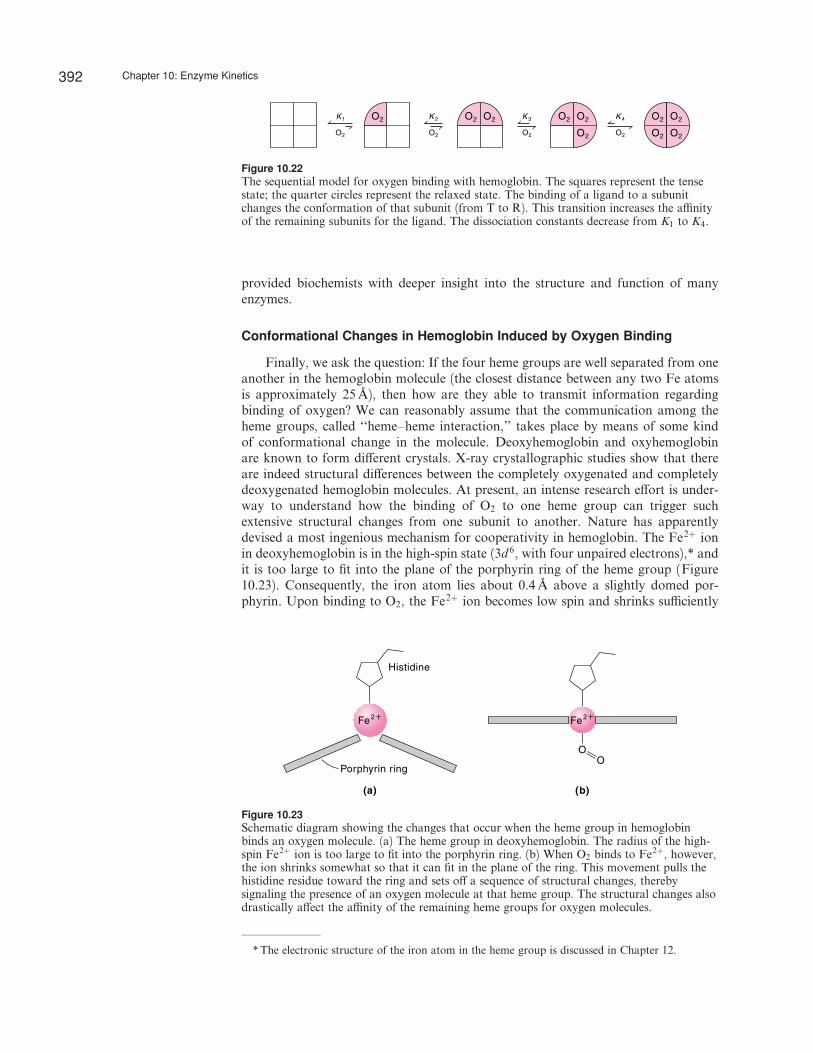
An alternative model of cooperativity suggested by Koshland, Nemethy, andFilmer* assumes that the a‰nity of vacant sites for a particular ligand changes pro-gressively as sites are taken up. Referring to the binding of oxygen to hemoglobin,this means that when an oxygen molecule binds to a vacant site on one of the foursubunits, the interaction causes the site to change its conformation, which in turna¤ects the binding constants of the three sites that are still vacant (Figure 10.22). Forthis reason, this model is called the sequential model. Unlike the concerted model, thesequential model can have tetrameters that consist of both R- and T-state subunitssuch as R2T2 or R3T. This approach, too, predicts a sigmoidal curve. The a‰nity forO2 molecules increases from left to right in Figure 10.22.
At present, the concerted and sequential models are both employed by bio-chemists in the study of enzymes. For hemoglobin, the actual mechanism seems morecomplex, and both models probably should be treated as limiting cases. In somecases, the sequential model has an advantage over the concerted model in that it canalso account for negative homotropic cooperativity. Overall, these two models have
*D. E. Koshland, Jr., G. Nemethy, and D. Filmer, Biochemistry 5, 365 (1966).
0
1
2
PO2
n 2.8
log Y1 Y
1
2
KR
K T
R state (n 1)
T state (n 1)
Figure 10.21Plot of logðY=1� Y Þ versus PO2
for hemoglobin.
10.7 pH Effects on Enzyme Kinetics 391
provided biochemists with deeper insight into the structure and function of manyenzymes.
Conformational Changes in Hemoglobin Induced by Oxygen Binding
Finally, we ask the question: If the four heme groups are well separated from oneanother in the hemoglobin molecule (the closest distance between any two Fe atomsis approximately 25 A), then how are they able to transmit information regardingbinding of oxygen? We can reasonably assume that the communication among theheme groups, called ‘‘heme–heme interaction,’’ takes place by means of some kindof conformational change in the molecule. Deoxyhemoglobin and oxyhemoglobinare known to form di¤erent crystals. X-ray crystallographic studies show that thereare indeed structural di¤erences between the completely oxygenated and completelydeoxygenated hemoglobin molecules. At present, an intense research e¤ort is under-way to understand how the binding of O2 to one heme group can trigger suchextensive structural changes from one subunit to another. Nature has apparentlydevised a most ingenious mechanism for cooperativity in hemoglobin. The Fe2þ ionin deoxyhemoglobin is in the high-spin state (3d 6, with four unpaired electrons),* andit is too large to fit into the plane of the porphyrin ring of the heme group (Figure10.23). Consequently, the iron atom lies about 0.4 A above a slightly domed por-phyrin. Upon binding to O2, the Fe2þ ion becomes low spin and shrinks su‰ciently
O2
K 4K1
O2
K 2
O2
K 3
O2 O2
O2
O2
O2
O2
O2O2O2O2O2
Figure 10.22The sequential model for oxygen binding with hemoglobin. The squares represent the tensestate; the quarter circles represent the relaxed state. The binding of a ligand to a subunitchanges the conformation of that subunit (from T to R). This transition increases the a‰nityof the remaining subunits for the ligand. The dissociation constants decrease from K1 to K4.
OO
Histidine
Porphyrin ring
Fe2 Fe2
(a) (b)
Figure 10.23Schematic diagram showing the changes that occur when the heme group in hemoglobinbinds an oxygen molecule. (a) The heme group in deoxyhemoglobin. The radius of the high-spin Fe2þ ion is too large to fit into the porphyrin ring. (b) When O2 binds to Fe2þ, however,the ion shrinks somewhat so that it can fit in the plane of the ring. This movement pulls thehistidine residue toward the ring and sets o¤ a sequence of structural changes, therebysignaling the presence of an oxygen molecule at that heme group. The structural changes alsodrastically a¤ect the a‰nity of the remaining heme groups for oxygen molecules.
* The electronic structure of the iron atom in the heme group is discussed in Chapter 12.
392 Chapter 10: Enzyme Kinetics
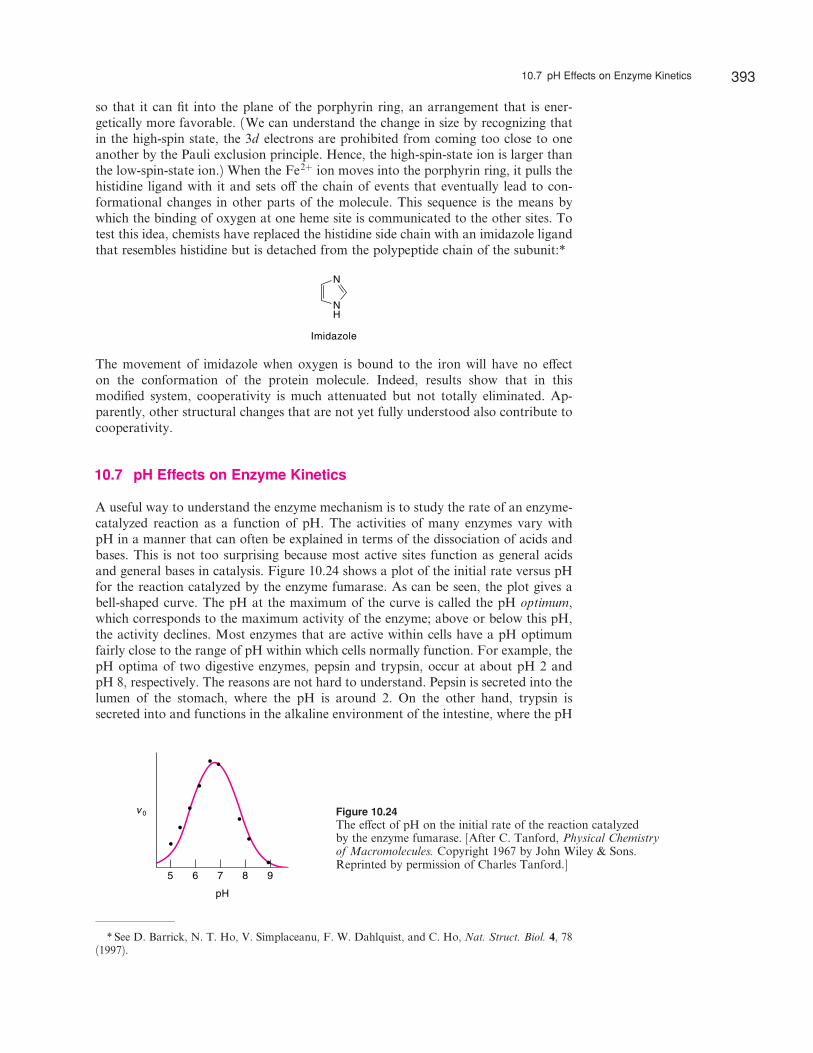
so that it can fit into the plane of the porphyrin ring, an arrangement that is ener-getically more favorable. (We can understand the change in size by recognizing thatin the high-spin state, the 3d electrons are prohibited from coming too close to oneanother by the Pauli exclusion principle. Hence, the high-spin-state ion is larger thanthe low-spin-state ion.) When the Fe2þ ion moves into the porphyrin ring, it pulls thehistidine ligand with it and sets o¤ the chain of events that eventually lead to con-formational changes in other parts of the molecule. This sequence is the means bywhich the binding of oxygen at one heme site is communicated to the other sites. Totest this idea, chemists have replaced the histidine side chain with an imidazole ligandthat resembles histidine but is detached from the polypeptide chain of the subunit:*
N
NH
Imidazole
The movement of imidazole when oxygen is bound to the iron will have no e¤ecton the conformation of the protein molecule. Indeed, results show that in thismodified system, cooperativity is much attenuated but not totally eliminated. Ap-parently, other structural changes that are not yet fully understood also contribute tocooperativity.
10.7 pH Effects on Enzyme Kinetics
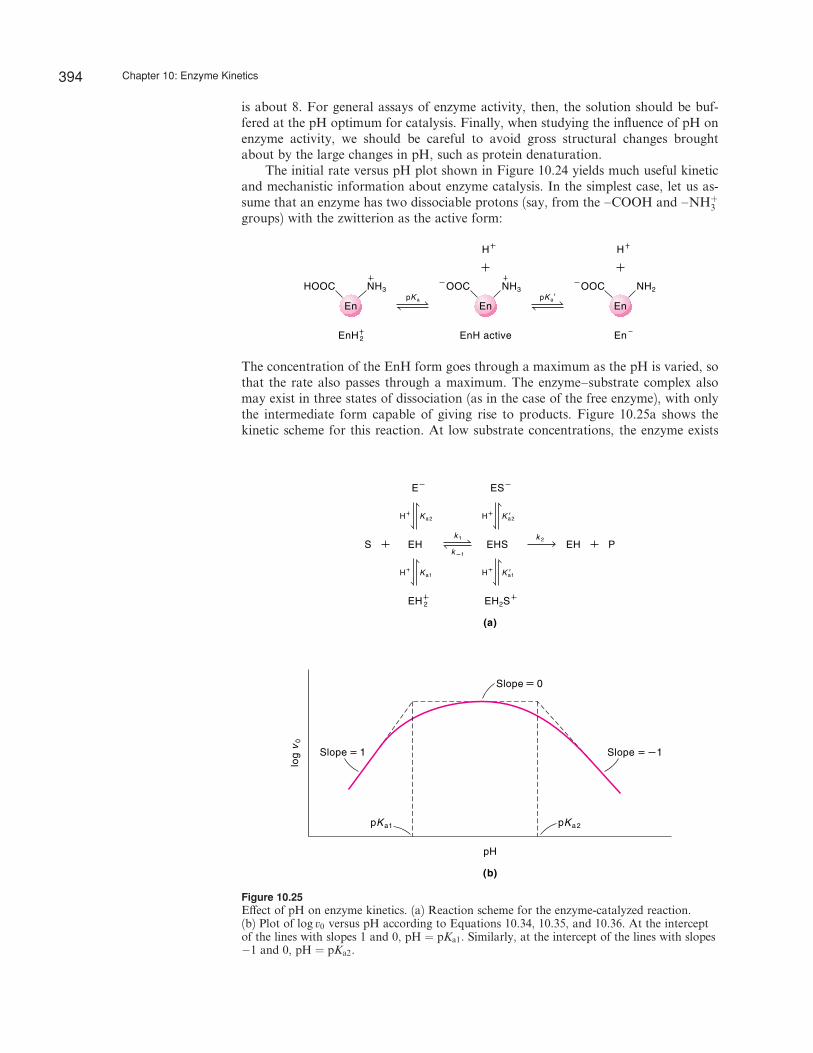
A useful way to understand the enzyme mechanism is to study the rate of an enzyme-catalyzed reaction as a function of pH. The activities of many enzymes vary withpH in a manner that can often be explained in terms of the dissociation of acids andbases. This is not too surprising because most active sites function as general acidsand general bases in catalysis. Figure 10.24 shows a plot of the initial rate versus pHfor the reaction catalyzed by the enzyme fumarase. As can be seen, the plot gives abell-shaped curve. The pH at the maximum of the curve is called the pH optimum,which corresponds to the maximum activity of the enzyme; above or below this pH,the activity declines. Most enzymes that are active within cells have a pH optimumfairly close to the range of pH within which cells normally function. For example, thepH optima of two digestive enzymes, pepsin and trypsin, occur at about pH 2 andpH 8, respectively. The reasons are not hard to understand. Pepsin is secreted into thelumen of the stomach, where the pH is around 2. On the other hand, trypsin issecreted into and functions in the alkaline environment of the intestine, where the pH
*See D. Barrick, N. T. Ho, V. Simplaceanu, F. W. Dahlquist, and C. Ho, Nat. Struct. Biol. 4, 78(1997).
5 6 7 8 9
pH
v 0 Figure 10.24The e¤ect of pH on the initial rate of the reaction catalyzedby the enzyme fumarase. [After C. Tanford, Physical Chemistryof Macromolecules. Copyright 1967 by John Wiley & Sons.Reprinted by permission of Charles Tanford.]
10.7 pH Effects on Enzyme Kinetics 393
is about 8. For general assays of enzyme activity, then, the solution should be buf-fered at the pH optimum for catalysis. Finally, when studying the influence of pH onenzyme activity, we should be careful to avoid gross structural changes broughtabout by the large changes in pH, such as protein denaturation.
The initial rate versus pH plot shown in Figure 10.24 yields much useful kineticand mechanistic information about enzyme catalysis. In the simplest case, let us as-sume that an enzyme has two dissociable protons (say, from the aCOOH and aNHþ
3
groups) with the zwitterion as the active form:
NH3HOOC
En
H
OOC NH3
En
H
NH2OOC
EnpK apK a
EnEnH2 EnH active
The concentration of the EnH form goes through a maximum as the pH is varied, sothat the rate also passes through a maximum. The enzyme–substrate complex alsomay exist in three states of dissociation (as in the case of the free enzyme), with onlythe intermediate form capable of giving rise to products. Figure 10.25a shows thekinetic scheme for this reaction. At low substrate concentrations, the enzyme exists
S PEHEH EHS
ESE
EH2SEH 2
k 1
k 1 k 2
H Ka 2
Ka1HH Ka1
H Ka 2
log
v0
pH
(a)
(b)
pKa1 pKa 2
Slope 1 Slope 1
Slope 0
Figure 10.25E¤ect of pH on enzyme kinetics. (a) Reaction scheme for the enzyme-catalyzed reaction.(b) Plot of log v0 versus pH according to Equations 10.34, 10.35, and 10.36. At the interceptof the lines with slopes 1 and 0, pH ¼ pKa1. Similarly, at the intercept of the lines with slopes�1 and 0, pH ¼ pKa2.
394 Chapter 10: Enzyme Kinetics
mostly in the free form; therefore, the pH is controlled by the dissociation of the freeenzyme. Thus, analysis of the experimental pH dependence of the initial rate at lowsubstrate concentrations provides information about pKa1 and pKa2 of the free en-zyme. On the other hand, at high substrate concentrations, when the enzyme issaturated with substrate, analysis of pH dependence allows the determination of pK 0
a1
and pK 0a2, which relate to the dissociation of the enzyme–substrate complex.
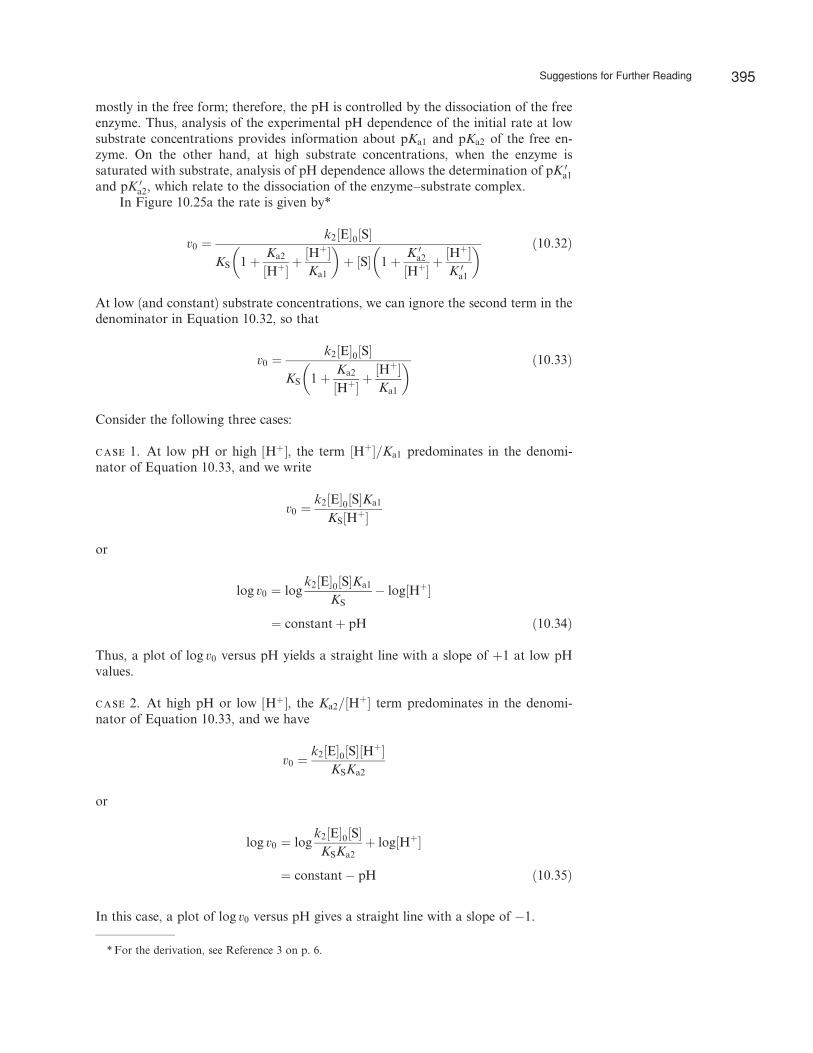
In Figure 10.25a the rate is given by*
v0 ¼k2½E�0½S�
KS 1þ Ka2
½Hþ�þ ½Hþ�
Ka1
� �þ ½S� 1þ K 0
a2
½Hþ�þ ½Hþ�
K 0a1
� � ð10:32Þ
At low (and constant) substrate concentrations, we can ignore the second term in thedenominator in Equation 10.32, so that
v0 ¼k2½E�0½S�
KS 1þ Ka2
½Hþ�þ ½Hþ�
Ka1
� � ð10:33Þ
Consider the following three cases:
case 1. At low pH or high [Hþ], the term ½Hþ�=Ka1 predominates in the denomi-nator of Equation 10.33, and we write
v0 ¼k2½E�0½S�Ka1
KS½Hþ�
or
log v0 ¼ logk2½E�0½S�Ka1
KS� log½Hþ�
¼ constantþ pH ð10:34Þ
Thus, a plot of log v0 versus pH yields a straight line with a slope of þ1 at low pHvalues.
case 2. At high pH or low [Hþ], the Ka2=½Hþ� term predominates in the denomi-nator of Equation 10.33, and we have
v0 ¼k2½E�0½S�½Hþ�
KSKa2
or
log v0 ¼ logk2½E�0½S�KSKa2
þ log½Hþ�
¼ constant� pH ð10:35Þ
In this case, a plot of log v0 versus pH gives a straight line with a slope of �1.
*For the derivation, see Reference 3 on p. 6.
Suggestions for Further Reading 395
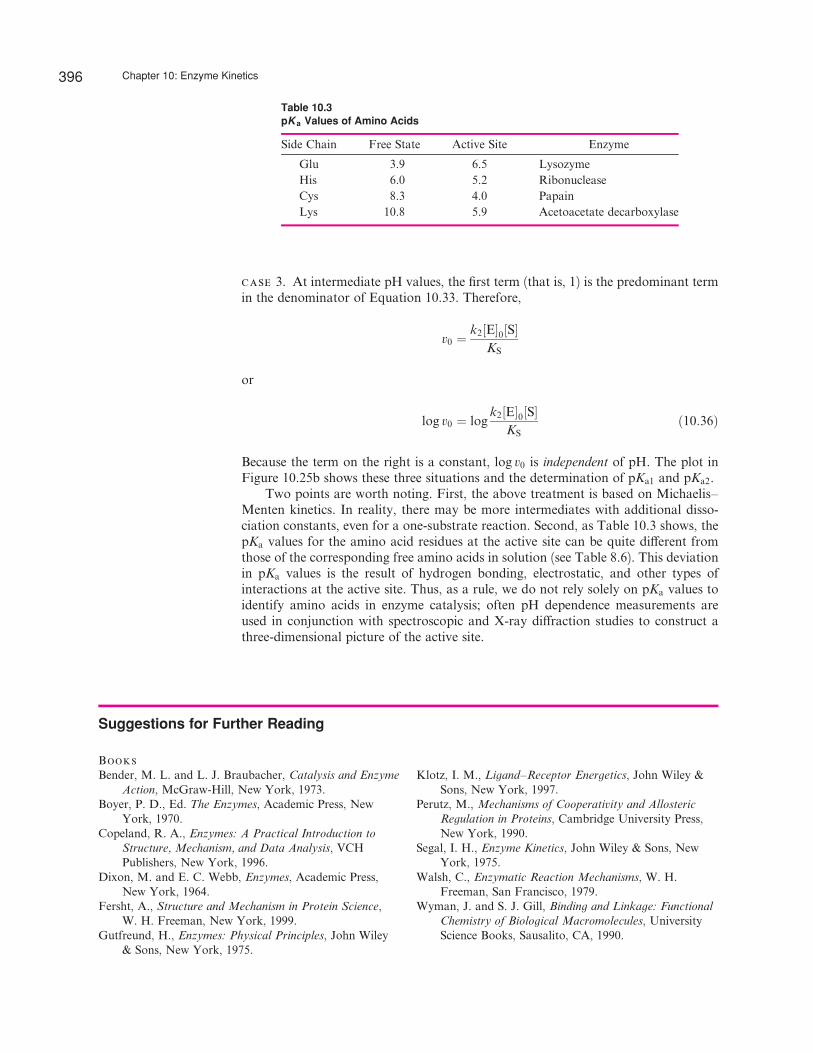
case 3. At intermediate pH values, the first term (that is, 1) is the predominant termin the denominator of Equation 10.33. Therefore,
v0 ¼k2½E�0½S�
KS
or
log v0 ¼ logk2½E�0½S�
KSð10:36Þ
Because the term on the right is a constant, log v0 is independent of pH. The plot inFigure 10.25b shows these three situations and the determination of pKa1 and pKa2.
Two points are worth noting. First, the above treatment is based on Michaelis–Menten kinetics. In reality, there may be more intermediates with additional disso-ciation constants, even for a one-substrate reaction. Second, as Table 10.3 shows, thepKa values for the amino acid residues at the active site can be quite di¤erent fromthose of the corresponding free amino acids in solution (see Table 8.6). This deviationin pKa values is the result of hydrogen bonding, electrostatic, and other types ofinteractions at the active site. Thus, as a rule, we do not rely solely on pKa values toidentify amino acids in enzyme catalysis; often pH dependence measurements areused in conjunction with spectroscopic and X-ray di¤raction studies to construct athree-dimensional picture of the active site.
Suggestions for Further Reading
Books
Bender, M. L. and L. J. Braubacher, Catalysis and Enzyme
Action, McGraw-Hill, New York, 1973.Boyer, P. D., Ed. The Enzymes, Academic Press, New
York, 1970.Copeland, R. A., Enzymes: A Practical Introduction to
Structure, Mechanism, and Data Analysis, VCHPublishers, New York, 1996.
Dixon, M. and E. C. Webb, Enzymes, Academic Press,New York, 1964.
Fersht, A., Structure and Mechanism in Protein Science,W. H. Freeman, New York, 1999.
Gutfreund, H., Enzymes: Physical Principles, John Wiley& Sons, New York, 1975.
Klotz, I. M., Ligand–Receptor Energetics, John Wiley &Sons, New York, 1997.
Perutz, M., Mechanisms of Cooperativity and Allosteric
Regulation in Proteins, Cambridge University Press,New York, 1990.
Segal, I. H., Enzyme Kinetics, John Wiley & Sons, NewYork, 1975.
Walsh, C., Enzymatic Reaction Mechanisms, W. H.Freeman, San Francisco, 1979.
Wyman, J. and S. J. Gill, Binding and Linkage: Functional
Chemistry of Biological Macromolecules, UniversityScience Books, Sausalito, CA, 1990.
Table 10.3pK a Values of Amino Acids
Side Chain Free State Active Site Enzyme
Glu 3.9 6.5 Lysozyme
His 6.0 5.2 Ribonuclease
Cys 8.3 4.0 Papain
Lys 10.8 5.9 Acetoacetate decarboxylase
396 Chapter 10: Enzyme Kinetics
Articles
General
‘‘a-Chymotrypsin: Enzyme Concentration and Kinetics,’’M. L. Bender, F. J. Kezedy, and F. C. Wedler, J.Chem. Educ. 44, 84 (1967).
‘‘Interactions of Enzymes and Inhibitors,’’ B. R. Baker, J.Chem. Educ. 44, 610 (1967).
‘‘Enzyme Catalysis and Transition-State Theory,’’ G. E.Linehard, Science 180, 149 (1973).
‘‘An Introduction to Enzyme Kinetics,’’ A. Ault, J. Chem.
Educ. 51, 381 (1974).‘‘What Limits the Rate of an Enzyme-Catalyzed
Reaction?’’ W. W. Cleland, Acc. Chem. Res. 8, 145(1975).
‘‘Collision and Transition State Theory Approaches toAcid-Base Catalysis,’’ H. B. Dunford, J. Chem. Educ.
52, 578 (1975).‘‘Mechanisms of Action of Naturally Occurring Irrevers-
ible Enzyme Inhibitors,’’ R. R. Rando, Acc. Chem.
Res. 8, 281 (1975).‘‘The Study of Enzymes,’’ G. K. Radda and R. J. P.
Williams, Chem. Brit. 12, 124 (1976).‘‘Free Energy Diagrams and Concentration Profiles for
Enzyme-Catalyzed Reactions,’’ I. M. Klotz, J. Chem.
Educ. 53, 159 (1976).‘‘A Kinetic Investigation of an Enzyme-Catalyzed
Reaction,’’ W. G. Nigh, J. Chem. Educ. 53, 668(1976).
‘‘Determination of the Kinetic Constants in a Two-Substrate Enzymatic Reaction,’’ W. T. Yap, B. F.Howell, and R. Scha¤er, J. Chem. Educ. 54, 254(1977).
‘‘Entropy, Binding Energy, and Enzyme Catalysis,’’ M. I.Page, Angew. Chem. Int. Ed. 16, 449 (1977).
‘‘Km as an Apparent Dissociation Constant,’’ J. A.Cohlberg, J. Chem. Educ. 56, 512 (1979).
‘‘RNA as an Enzyme,’’ T. R. Cech, Sci. Am. November1986.
‘‘RNA’s as Catalysts,’’ G. M. McCorkle and S. Altman, J.Chem. Educ. 64, 221 (1987).
‘‘Enzyme Kinetics,’’ O. Moe and R. Cornelius, J. Chem.
Educ. 65, 137 (1988).‘‘Homogeneous, Heterogeneous, and Enzymatic
Catalysis,’’ S. T. Oyama and G. A. Somorjai, J.Chem. Educ. 65, 765 (1988).
‘‘How Do Enzymes Work?’’ J. Krant, Science 242, 533(1988).
‘‘A Kinetic Study of Yeast Alcohol Dehydrogenase,’’ R. E.Utecht, J. Chem. Educ. 71, 436 (1994).
‘‘Chemical Oscillations in Enzyme Kinetics,’’ K. L.
Queeney, E. P. Marin, C. M. Campbell, and E.Peacock-Lopez, 1996, 1(3): S1430–4171 (96) 03035-X.Avali. URL: http://journals.springer-ny.com/chedr.
‘‘Proteins and Enzymes,’’ H. Bisswanger in Encyclopedia of
Applied Physics, G. L. Trigg, Ed., VCH Publishers,New York, 1996, Vol. 15, p. 185.
‘‘On the Meaning of Km and V=K in Enzyme Kinetics,’’D. B. Northrop, J. Chem. Educ. 75, 1153 (1998).
‘‘Understanding Enzyme Inhibition,’’ R. S. Ochs, J. Chem.
Educ. 77, 1453 (2000).‘‘The Temperature Optima of Enzymes: A New
Perspective on an Old Phenomenon,’’ R. M. Daniel,M. J. Danson, and R. Eisenthal, Trends Biochem. Sci.
26, 223 (2001).‘‘A Perspective on Enzyme Catalysis,’’ S. J. Benkovic and
S. Hammes-Schı¤er, Science 301, 1196 (2003).
Allosteric Interactions
‘‘The Control of Biochemical Reactions,’’ J. P. Changeux,Sci. Am. April 1965.
‘‘Demonstration of Allosteric Behavior,’’ W. H. Sawyer, J.Chem. Educ. 49, 777 (1972).
‘‘Protein Shape and Biological Control,’’ D. E. Koshland,Jr., Sci. Am. October 1973.
‘‘Probe-Dependent Cooperativity in Hill-Plots,’’ L. D.Byers, J. Chem. Educ. 54, 352 (1977).
‘‘Hemoglobin Structure and Respiratory Transport,’’M. F. Perutz, Sci. Am. December 1978.
‘‘Ligand Binding to Macromolecules: Allosteric andSequential Models of Cooperativity,’’ V. L. Hess andA. Szabo, J. Chem. Educ. 56, 289 (1979).
‘‘A Structural Model for the Kinetic Behavior ofHemoglobin,’’ K. Mo¤at, J. F. Deatherage, andD. W. Seybert, Science 206, 1035 (1979).
‘‘The Synthetic Analogs of O2-Binding Heme Proteins,’’K. S. Suslick and T. J. Reinert, J. Chem. Educ. 62,974 (1985).
‘‘An Alternative Analogy for the Dissociation ofOxyhemoglobin,’’ T. S. Rao, R. B. Dabke, and D. B.Patil, J. Chem. Educ. 69, 793 (1992).
‘‘Hemoglobin as a Remarkable Molecular Pump,’’ N. M.Senozan and E. Burton, J. Chem. Educ. 71, 282(1994).
‘‘The Oxygen Dissociation Curve of Hemoglobin: Bridgingthe Gap between Biochemistry and Physiology,’’ J.Gonez-Cambronero, J. Chem. Educ. 78, 757 (2001).
‘‘Cooperative Hemoglobin: Conserved Fold, DiverseQuaternary Assemblies and Allosteric Mechanisms,’’W. E. Royer, Jr., J. E. Knapp, K. Strand, and H. A.Heaslet, Trends Biochem. Sci. 26, 297 (2001).
Problems 397
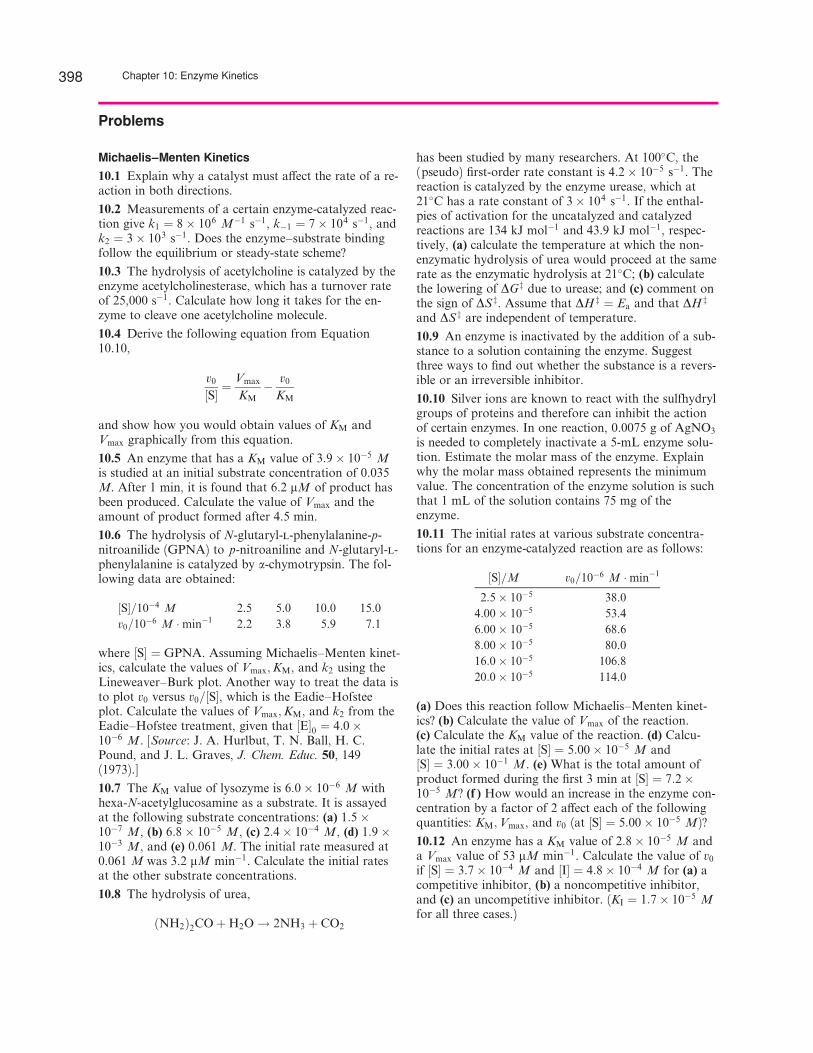
Problems
Michaelis–Menten Kinetics
10.1 Explain why a catalyst must a¤ect the rate of a re-action in both directions.
10.2 Measurements of a certain enzyme-catalyzed reac-tion give k1 ¼ 8� 106 M�1 s�1, k�1 ¼ 7� 104 s�1, andk2 ¼ 3� 103 s�1. Does the enzyme–substrate bindingfollow the equilibrium or steady-state scheme?
10.3 The hydrolysis of acetylcholine is catalyzed by theenzyme acetylcholinesterase, which has a turnover rateof 25,000 s�1. Calculate how long it takes for the en-zyme to cleave one acetylcholine molecule.
10.4 Derive the following equation from Equation10.10,
v0
½S� ¼Vmax
KM� v0
KM
and show how you would obtain values of KM andVmax graphically from this equation.
10.5 An enzyme that has a KM value of 3:9� 10�5 Mis studied at an initial substrate concentration of 0.035M. After 1 min, it is found that 6.2 mM of product hasbeen produced. Calculate the value of Vmax and theamount of product formed after 4.5 min.
10.6 The hydrolysis of N-glutaryl-l-phenylalanine-p-nitroanilide (GPNA) to p-nitroaniline and N-glutaryl-l-phenylalanine is catalyzed by a-chymotrypsin. The fol-lowing data are obtained:
½S�=10�4 M 2.5 5.0 10.0 15.0
v0=10�6 M �min�1 2.2 3.8 5.9 7.1
where ½S� ¼ GPNA. Assuming Michaelis–Menten kinet-ics, calculate the values of Vmax;KM, and k2 using theLineweaver–Burk plot. Another way to treat the data isto plot v0 versus v0=½S�, which is the Eadie–Hofsteeplot. Calculate the values of Vmax;KM, and k2 from theEadie–Hofstee treatment, given that ½E�0 ¼ 4:0�10�6 M. [Source: J. A. Hurlbut, T. N. Ball, H. C.Pound, and J. L. Graves, J. Chem. Educ. 50, 149(1973).]
10.7 The KM value of lysozyme is 6:0� 10�6 M withhexa-N-acetylglucosamine as a substrate. It is assayedat the following substrate concentrations: (a) 1:5�10�7 M, (b) 6:8� 10�5 M, (c) 2:4� 10�4 M, (d) 1:9�10�3 M, and (e) 0.061 M. The initial rate measured at0.061 M was 3.2 mM min�1. Calculate the initial ratesat the other substrate concentrations.
10.8 The hydrolysis of urea,
ðNH2Þ2COþH2O ! 2NH3 þ CO2
has been studied by many researchers. At 100�C, the(pseudo) first-order rate constant is 4:2� 10�5 s�1. Thereaction is catalyzed by the enzyme urease, which at21�C has a rate constant of 3� 104 s�1. If the enthal-pies of activation for the uncatalyzed and catalyzedreactions are 134 kJ mol�1 and 43.9 kJ mol�1, respec-tively, (a) calculate the temperature at which the non-enzymatic hydrolysis of urea would proceed at the samerate as the enzymatic hydrolysis at 21�C; (b) calculatethe lowering of DGz due to urease; and (c) comment onthe sign of DS z. Assume that DH z ¼ Ea and that DH z
and DS z are independent of temperature.
10.9 An enzyme is inactivated by the addition of a sub-stance to a solution containing the enzyme. Suggestthree ways to find out whether the substance is a revers-ible or an irreversible inhibitor.
10.10 Silver ions are known to react with the sulfhydrylgroups of proteins and therefore can inhibit the actionof certain enzymes. In one reaction, 0.0075 g of AgNO3
is needed to completely inactivate a 5-mL enzyme solu-tion. Estimate the molar mass of the enzyme. Explainwhy the molar mass obtained represents the minimumvalue. The concentration of the enzyme solution is suchthat 1 mL of the solution contains 75 mg of theenzyme.
10.11 The initial rates at various substrate concentra-tions for an enzyme-catalyzed reaction are as follows:
½S�=M v0=10�6 M �min�1
2:5� 10�5 38.0
4:00� 10�5 53.4
6:00� 10�5 68.6
8:00� 10�5 80.0
16:0� 10�5 106.8
20:0� 10�5 114.0
(a) Does this reaction follow Michaelis–Menten kinet-ics? (b) Calculate the value of Vmax of the reaction.(c) Calculate the KM value of the reaction. (d) Calcu-late the initial rates at ½S� ¼ 5:00� 10�5 M and½S� ¼ 3:00� 10�1 M. (e) What is the total amount ofproduct formed during the first 3 min at ½S� ¼ 7:2�10�5 M? (f ) How would an increase in the enzyme con-centration by a factor of 2 a¤ect each of the followingquantities: KM;Vmax, and v0 (at ½S� ¼ 5:00� 10�5 M)?
10.12 An enzyme has a KM value of 2:8� 10�5 M anda Vmax value of 53 mM min�1. Calculate the value of v0if ½S� ¼ 3:7� 10�4 M and ½I� ¼ 4:8� 10�4 M for (a) acompetitive inhibitor, (b) a noncompetitive inhibitor,and (c) an uncompetitive inhibitor. (KI ¼ 1:7� 10�5 Mfor all three cases.)
398 Chapter 10: Enzyme Kinetics
10.13 The degree of inhibition i is given by i% ¼ð1� aÞ100%, where a ¼ ðv0Þinhibition=v0. Calculate thepercent inhibition for each of the three cases in Problem10.12.
10.14 An enzyme-catalyzed reaction ðKM ¼ 2:7�10�3 MÞ is inhibited by a competitive inhibitor IðKI ¼ 3:1� 10�5 MÞ. Suppose that the substrate con-centration is 3:6� 10�4 M. How much of the inhibitoris needed for 65% inhibition? How much does the sub-strate concentration have to be increased to reduce theinhibition to 25%?
10.15 Calculate the concentration of a noncompetitiveinhibitor ðKI ¼ 2:9� 10�4 MÞ needed to yield 90% inhi-bition of an enzyme-catalyzed reaction.
10.16 Derive Equation 10.22.
10.17 The metabolism of ethanol in our bodies is cata-lyzed by liver alcohol dehydrogenase (LADH) to acet-aldehyde and finally to acetate. In contrast, methanol isconverted to formaldehyde (also catalyzed by LADH),which can cause blindness or even death. An antidotefor methanol is ethanol, which acts as a competitive in-hibitor for LADH. The excess methanol can then besafely discharged from the body. How much absolute(100%) ethanol would a person have to consume afteringesting 50 mL of methanol (a lethal dosage) to reducethe activity of LADH to 3% of the original value? As-sume that the total fluid volume in the person’s body is38 liters and that the densities of ethanol and methanolare 0.789 g mL�1 and 0.791 g mL�1, respectively. TheKM value for methanol is 1:0� 10�2 M, and the KI val-ue for ethanol is 1:0� 10�3 M. State any assumptions.
Allosteric Interactions
10.18 (a) What is the physiological significance of coop-erative O2 binding by hemoglobin? Why is O2 bindingby myoglobin not cooperative? (b) Compare the con-certed model with the sequential model for the bindingof oxygen with hemoglobin.
10.19 Fatality usually results when more than 50% of ahuman being’s hemoglobin is complexed with carbonmonoxide. Yet a person whose hemoglobin content isdiminished by anemia to half its original content canoften function normally. Explain.
10.20 Competitive inhibitors, when presentin small amounts, often act as activators toallosteric enzymes. Why?
10.21 What is the advantage of having theheme group in a hydrophobic region in themyoglobin and hemoglobin molecule?
10.22 What is the e¤ect of each of the following actionson oxygen a‰nity of adult hemoglobin (Hb A) in vitro?(a) Increase pH, (b) increase partial pressure of CO2,(c) decrease [BPG], (d) dissociate the tetramer intomonomers, and (e) oxidize Fe(II) to Fe(III).
10.23 Although it is possible to carry out X-ray di¤rac-tion studies of fully deoxygenated hemoglobin and fully
oxygenated hemoglobin, it is much more di‰cult, if notimpossible, to obtain crystals in which each hemoglobinmolecule is bound to only one, two, or three oxygenmolecules. Explain.
10.24 When deoxyhemoglobin crystals are exposed tooxygen, they shatter. On the other hand, deoxymyo-globin crystals are una¤ected by oxygen. Explain.
Additional Problems
10.25 An enzyme contains a single dissociable group atits active site. For catalysis to occur, this group must bein the dissociated (that is, negative) form. The substratebears a net positive charge. The reaction scheme can berepresented by
EH Ð Hþ þ E�
E� þ Sþ Ð ES ! Eþ P
(a) What kind of inhibitor is Hþ? (b) Write an expres-sion for the initial rate of the reaction in the presence ofthe inhibitor.
10.26 The discovery in the 1980s that certain RNAmolecules (the ribozymes) can act as enzymes was a sur-prise to many chemists. Why?
10.27 The activation energy for the decomposition ofhydrogen peroxide,
2H2O2ðaqÞ ! 2H2OðlÞ þO2ðgÞ
is 42 kJ mol�1, whereas when the reaction is catalyzedby the enzyme catalase, it is 7.0 kJ mol�1. Calculate thetemperature that would cause the nonenzymatic cataly-sis to proceed as rapidly as the enzyme-catalyzed de-composition at 20�C. Assume the pre-exponential factorto be the same in both cases.
10.28 Referring to the concerted model discussed onp. 390, show that K1 ¼ cL0.
10.29 The following data were obtained for the varia-tion of Vmax with pH for a reaction catalyzed by a-amylase at 24�C. What can you conclude about the pKa
values of the ionizing groups at the active site?
pH 3.0 3.5 4.0 4.5 5.0 5.5
Vmax (arbitrary units) 200 501 1584 1778 3300 5248
pH 6.0 6.5 7.0 7.5 8.0 8.5 9.0
Vmax (arbitrary units) 5250 5251 2818 2510 1585 398 158
10.30 (a) Comment on the following data obtained foran enzyme-catalyzed reaction (no calculations areneeded):
t=�C 10 15 20 25 30 35 40 45
Vmax (arbitrary units) 1.0 1.7 2.3 2.6 3.2 4.0 2.6 0.2
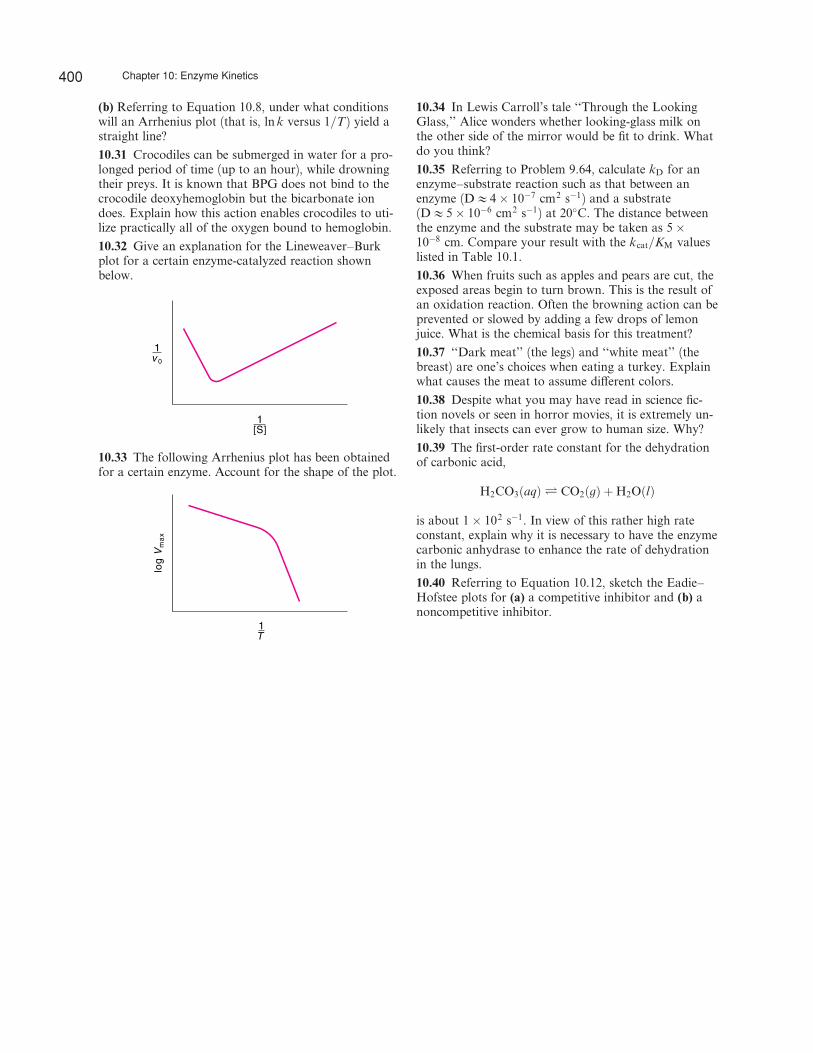
(b) Referring to Equation 10.8, under what conditionswill an Arrhenius plot (that is, ln k versus 1=T) yield astraight line?
10.31 Crocodiles can be submerged in water for a pro-longed period of time (up to an hour), while drowningtheir preys. It is known that BPG does not bind to thecrocodile deoxyhemoglobin but the bicarbonate iondoes. Explain how this action enables crocodiles to uti-lize practically all of the oxygen bound to hemoglobin.
10.32 Give an explanation for the Lineweaver–Burkplot for a certain enzyme-catalyzed reaction shownbelow.
[S]1
v 0
1
10.33 The following Arrhenius plot has been obtainedfor a certain enzyme. Account for the shape of the plot.
log
Vm
ax
T1
10.34 In Lewis Carroll’s tale ‘‘Through the LookingGlass,’’ Alice wonders whether looking-glass milk onthe other side of the mirror would be fit to drink. Whatdo you think?
10.35 Referring to Problem 9.64, calculate kD for anenzyme–substrate reaction such as that between anenzyme (DA4� 10�7 cm2 s�1) and a substrate(DA5� 10�6 cm2 s�1) at 20�C. The distance betweenthe enzyme and the substrate may be taken as 5�10�8 cm. Compare your result with the kcat=KM valueslisted in Table 10.1.
10.36 When fruits such as apples and pears are cut, theexposed areas begin to turn brown. This is the result ofan oxidation reaction. Often the browning action can beprevented or slowed by adding a few drops of lemonjuice. What is the chemical basis for this treatment?
10.37 ‘‘Dark meat’’ (the legs) and ‘‘white meat’’ (thebreast) are one’s choices when eating a turkey. Explainwhat causes the meat to assume di¤erent colors.
10.38 Despite what you may have read in science fic-tion novels or seen in horror movies, it is extremely un-likely that insects can ever grow to human size. Why?
10.39 The first-order rate constant for the dehydrationof carbonic acid,
H2CO3ðaqÞ Ð CO2ðgÞ þH2OðlÞ
is about 1� 102 s�1. In view of this rather high rateconstant, explain why it is necessary to have the enzymecarbonic anhydrase to enhance the rate of dehydrationin the lungs.
10.40 Referring to Equation 10.12, sketch the Eadie–Hofstee plots for (a) a competitive inhibitor and (b) anoncompetitive inhibitor.
400 Chapter 10: Enzyme Kinetics