enzyme-linked immunosorbent assay - mcmaster...
TRANSCRIPT
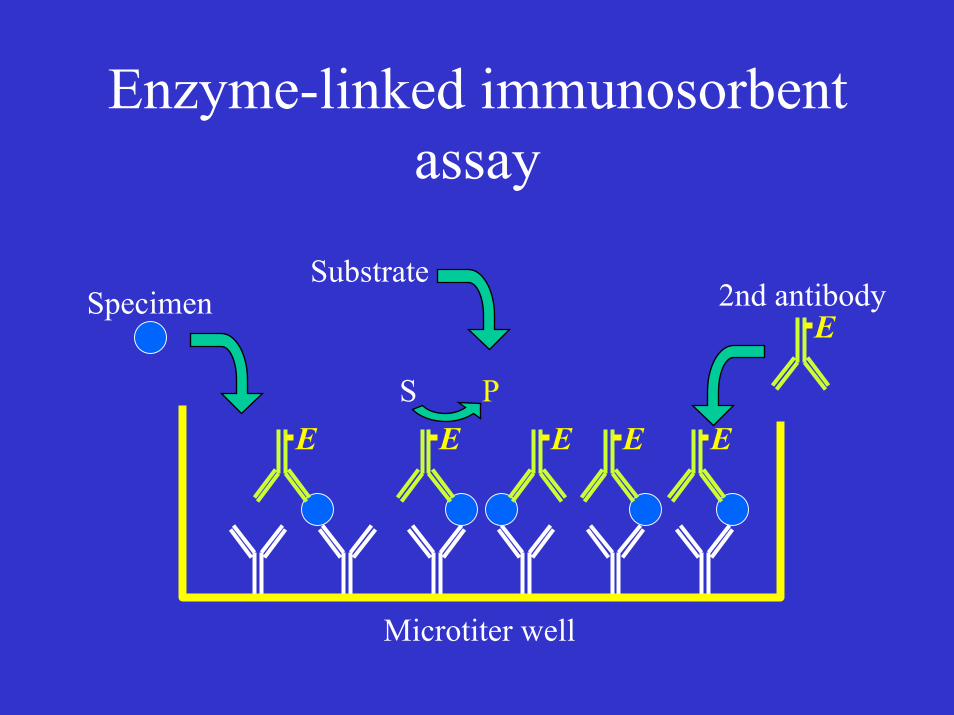
Enzyme-linked immunosorbent assay
Microtiter well
E E E E E
Specimen 2nd antibodyE
Substrate
S P
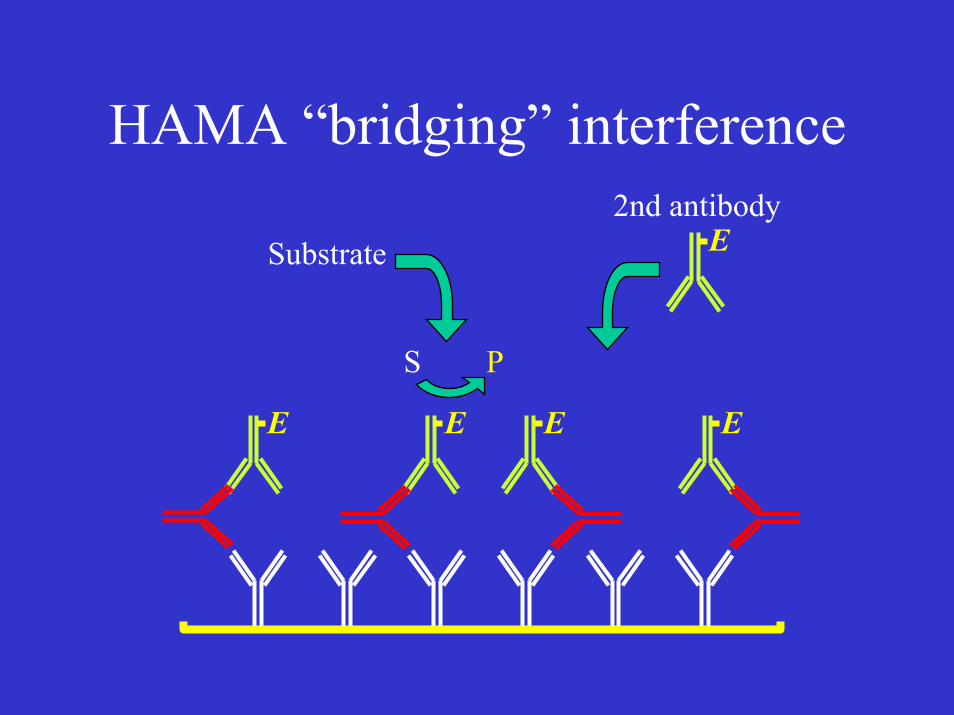
HAMA “bridging” interference
E E E E
2nd antibodyESubstrate
S P
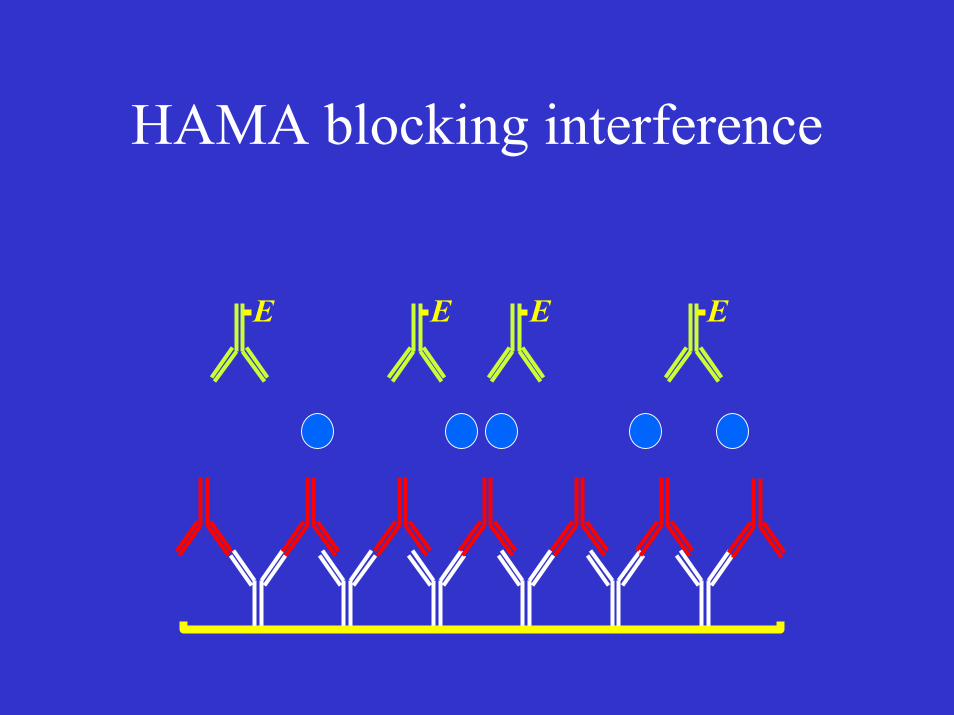
HAMA blocking interference
E E E E

Distinguishing between Health and Disease: The role of the clinical laboratory in the
diagnostic process
Clinical Biochemistry 3H3
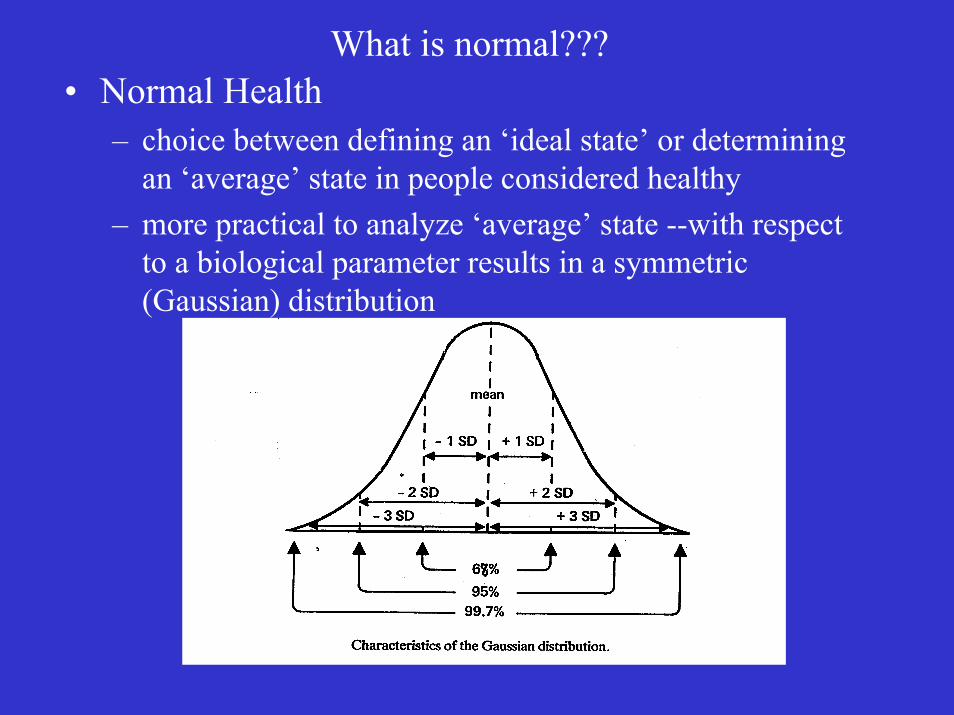
What is normal???• Normal Health
– choice between defining an ‘ideal state’ or determining an ‘average’ state in people considered healthy
– more practical to analyze ‘average’ state --with respect to a biological parameter results in a symmetric (Gaussian) distribution
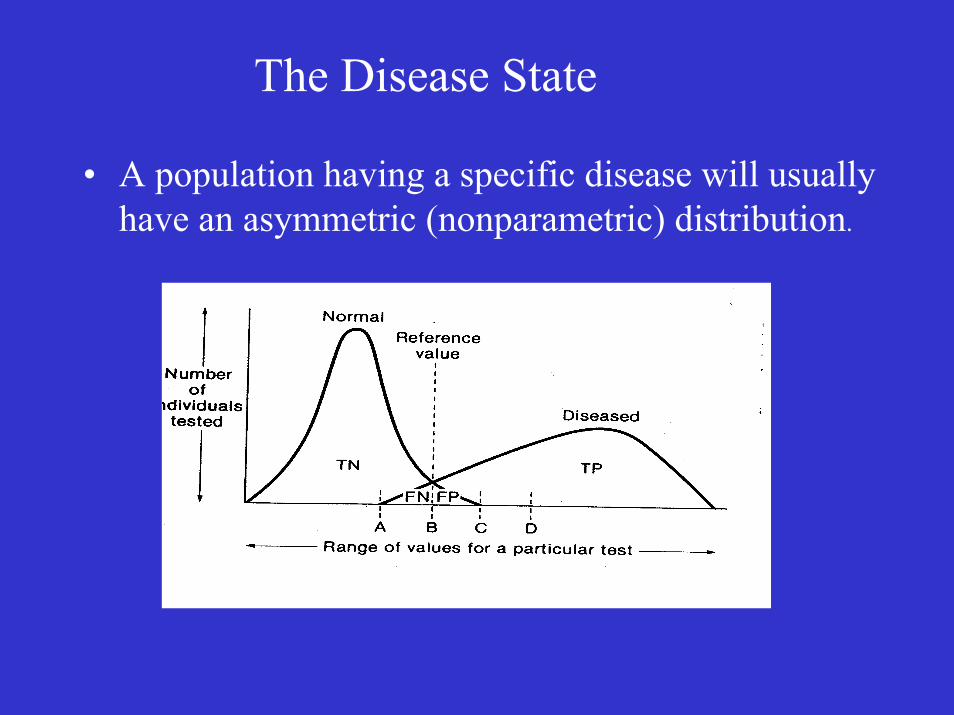
The Disease State
• A population having a specific disease will usually have an asymmetric (nonparametric) distribution.
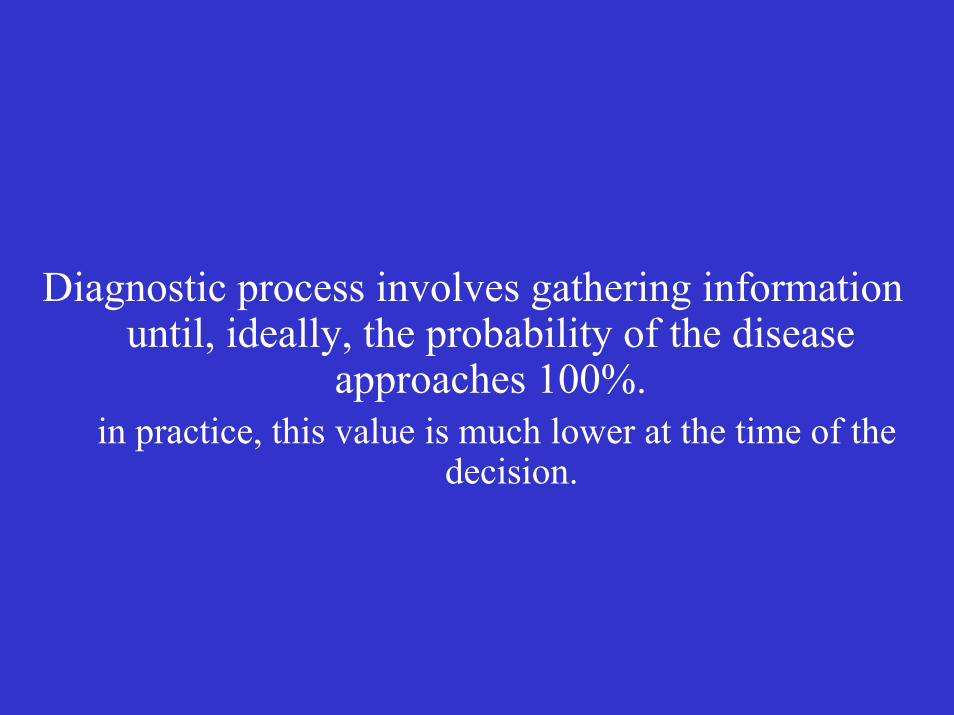
Diagnostic process involves gathering information until, ideally, the probability of the disease
approaches 100%.in practice, this value is much lower at the time of the
decision.
Defining the value of a Diagnostic Test• The clinical performance of a laboratory test defines how
well it predicts disease• The sensitivity of a test indicates the likelihood that it will
be positive when disease is present• The specificity of a test indicates the likelihood that it will
be negative when disease is absent• Distinction between a test being a true positive (TP) or
true negative (TN) is usually determined with reference to a selected “normal range” based on 95% confidence. This range is referred to as a Reference Range (RR). Test focuses on the upper or lower limit often use a Reference Value (RV).
• False Positive (FP) Normal people falling outside RR• False Negative (FN) Diseased individual falling inside RR
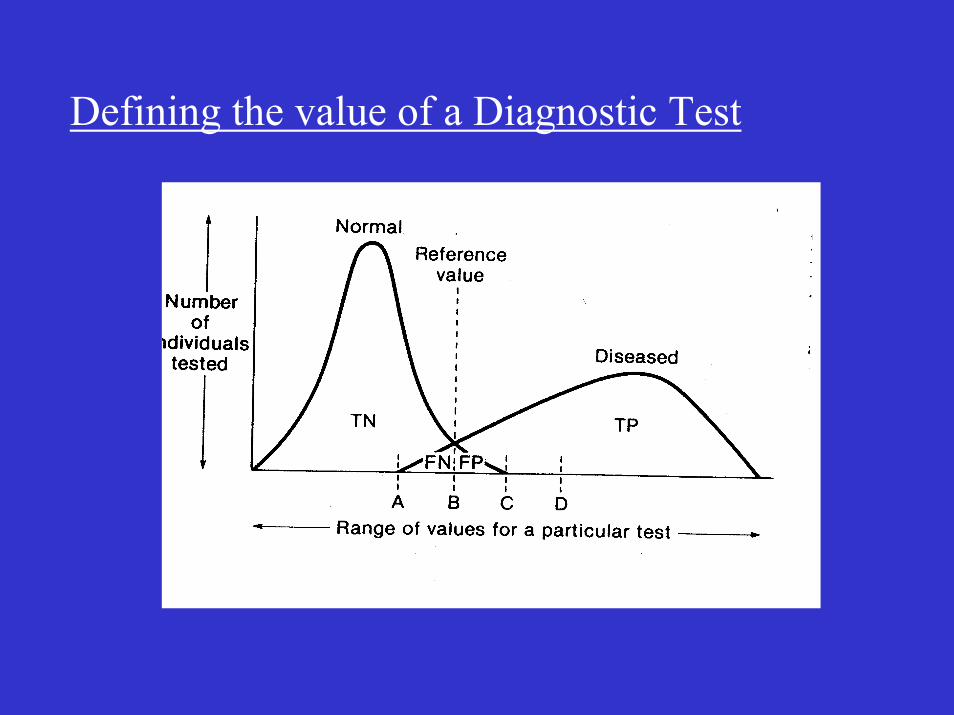
Defining the value of a Diagnostic Test

Defining the value of a Diagnostic Test• Reference state (RS): conditions in which the RR is assumed to apply
– “Ideal world” RS would include sex, ethnicity, weight range, diet – In practice RR are applied to a much larger population
• distinction made between neonate, pediatric, obstetrics and geriatric practices
• Establishing a Reference Range– min 100 subjects – Test should be validated under the following conditions:
• in healthy subjects• in patients with the disease
– no symptoms– full symptoms
• subjects who not have the disease but whose signs and symptoms mimic the disease
• subjects having a pathologic conditions associated with the same organ system
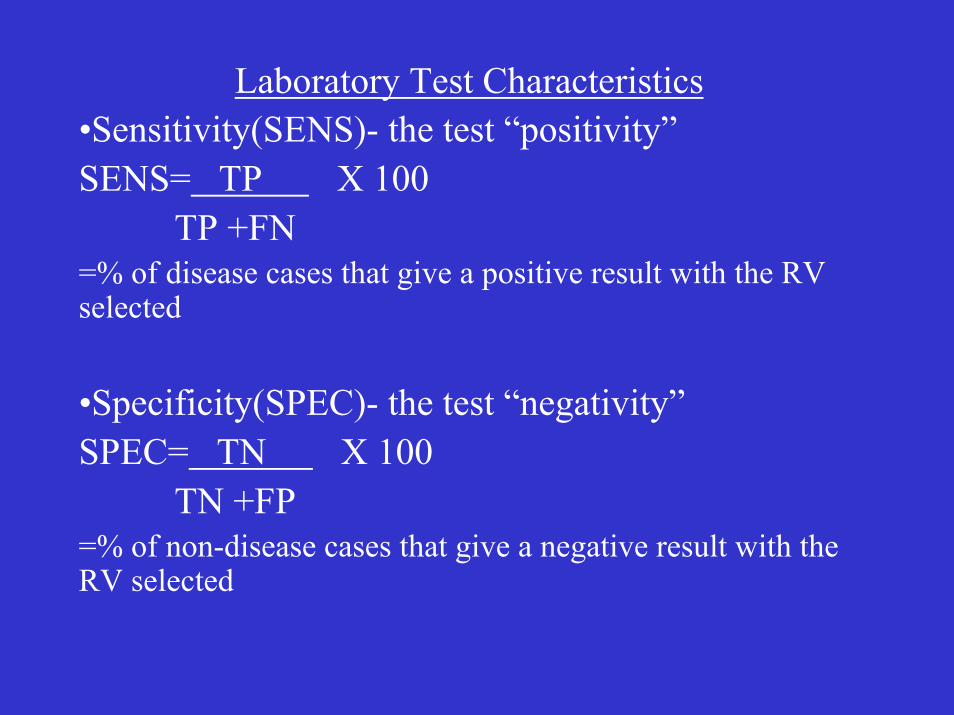
Laboratory Test Characteristics•Sensitivity(SENS)- the test “positivity”SENS= TP X 100
TP +FN=% of disease cases that give a positive result with the RV selected
•Specificity(SPEC)- the test “negativity”SPEC= TN X 100
TN +FP=% of non-disease cases that give a negative result with the RV selected
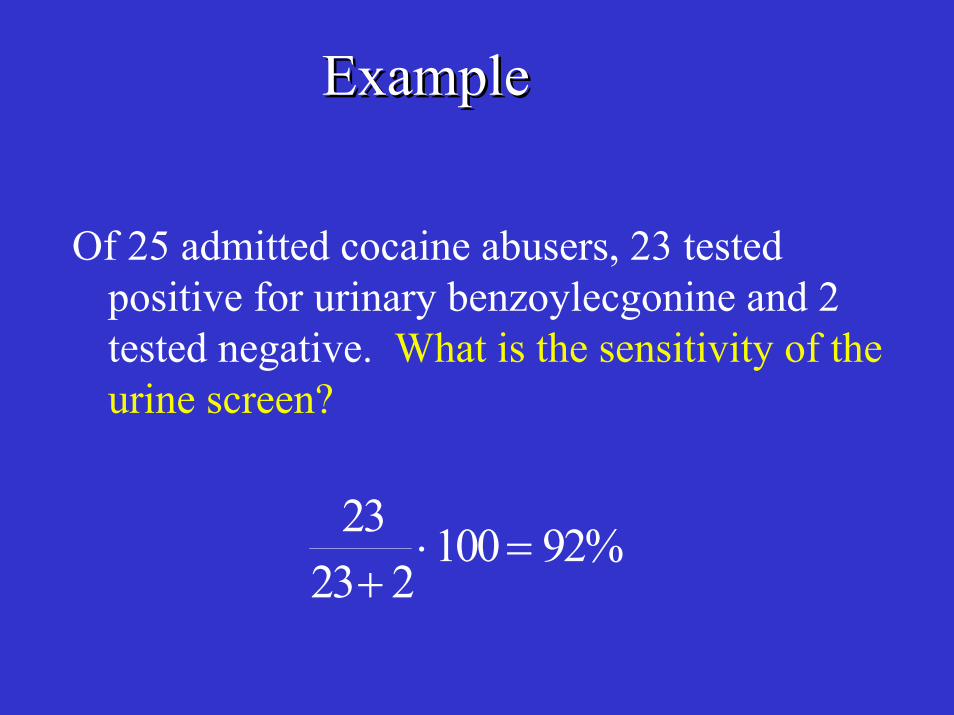
ExampleExample
Of 25 admitted cocaine abusers, 23 tested positive for urinary benzoylecgonine and 2 tested negative. What is the sensitivity of the urine screen?
2323 2
100 92%+
⋅ =
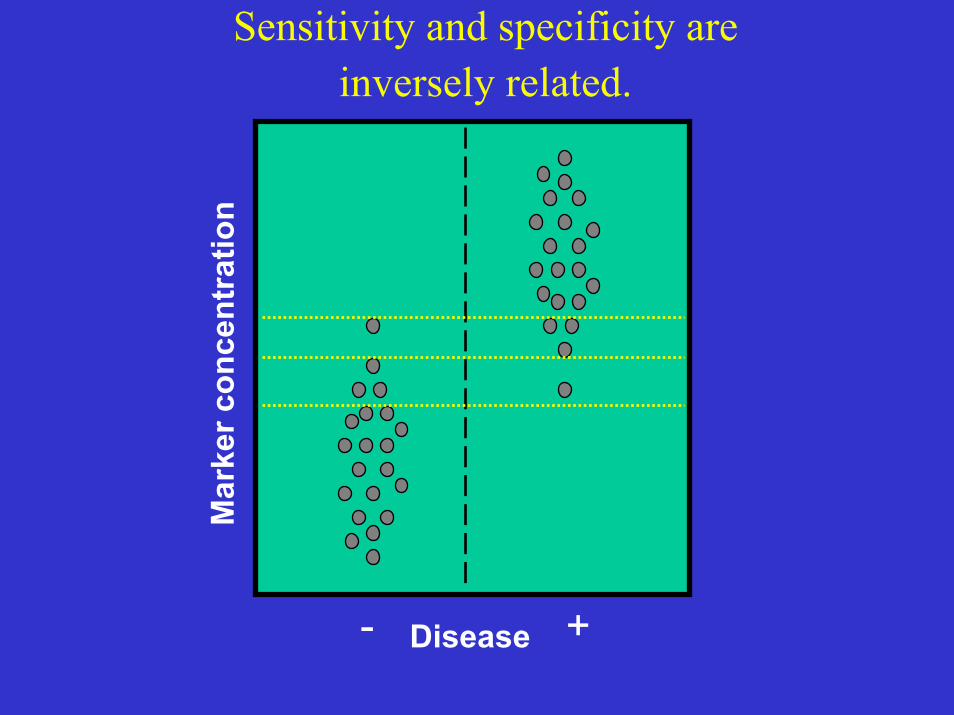
Sensitivity and specificity are inversely related.
Mar
ker c
once
ntra
tion
- +Disease
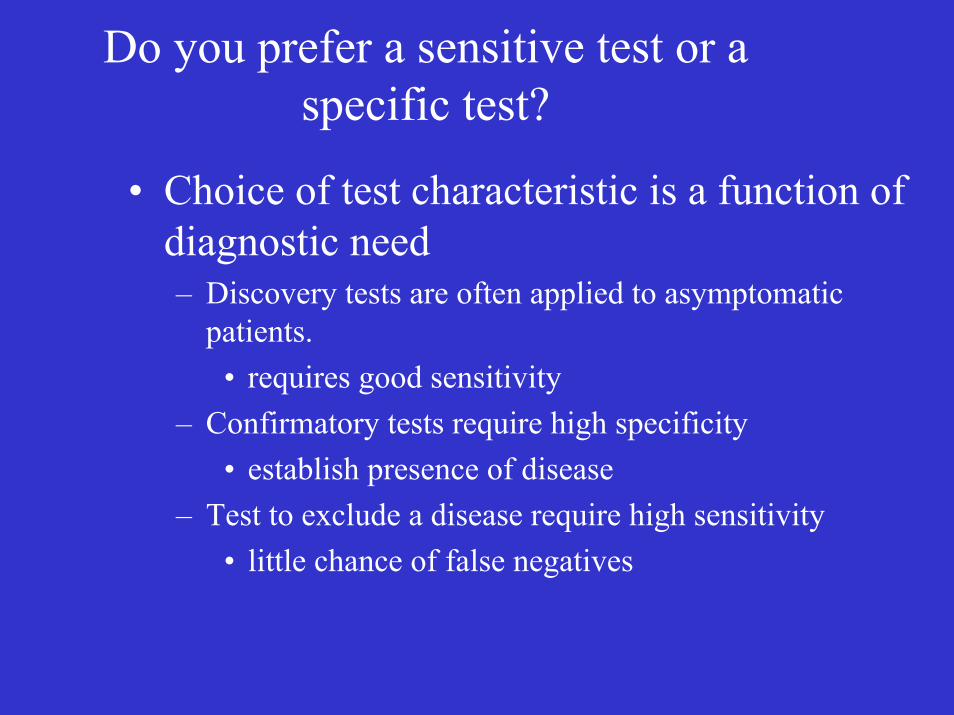
Do you prefer a sensitive test or a specific test?
• Choice of test characteristic is a function of diagnostic need– Discovery tests are often applied to asymptomatic
patients.• requires good sensitivity
– Confirmatory tests require high specificity• establish presence of disease
– Test to exclude a disease require high sensitivity• little chance of false negatives
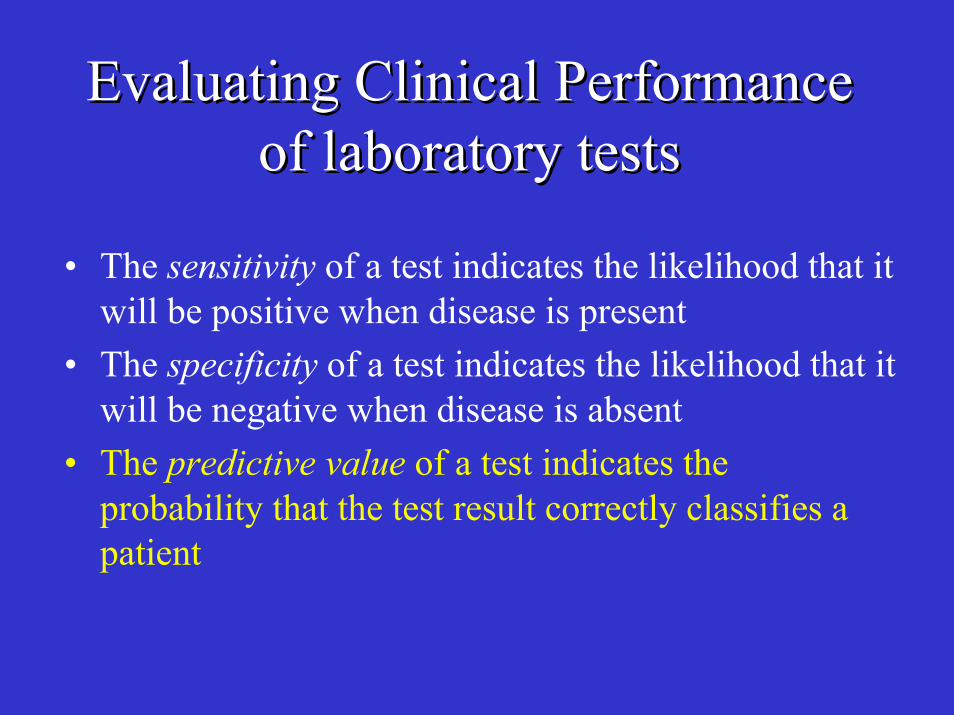
Evaluating Clinical Performance of laboratory tests
Evaluating Clinical Performance of laboratory tests
• The sensitivity of a test indicates the likelihood that it will be positive when disease is present
• The specificity of a test indicates the likelihood that it will be negative when disease is absent
• The predictive value of a test indicates the probability that the test result correctly classifies a patient
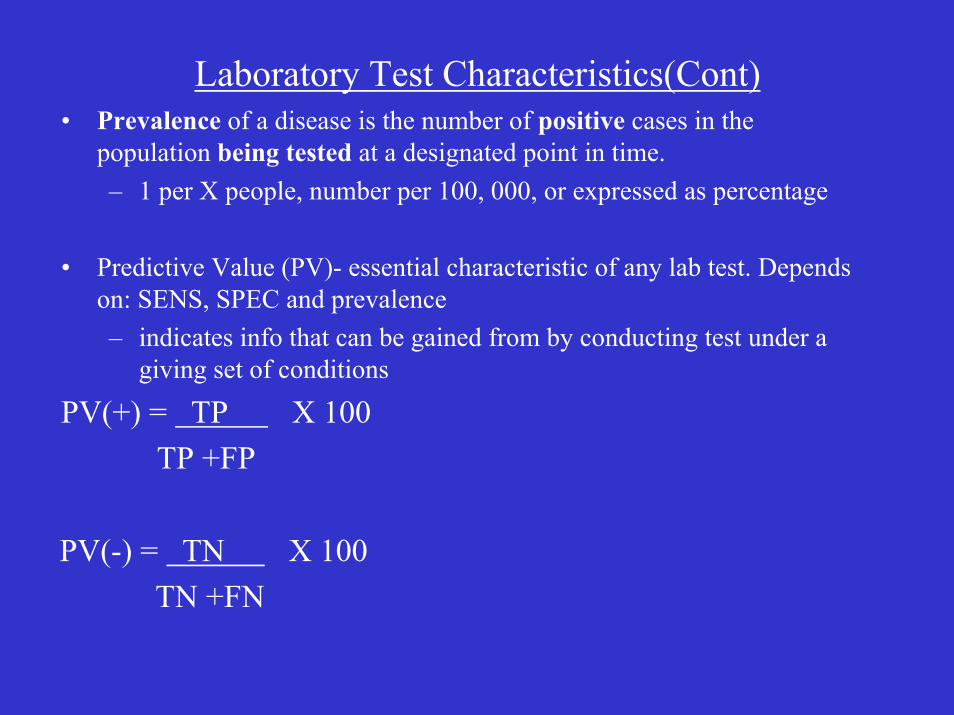
Laboratory Test Characteristics(Cont)• Prevalence of a disease is the number of positive cases in the
population being tested at a designated point in time.– 1 per X people, number per 100, 000, or expressed as percentage
• Predictive Value (PV)- essential characteristic of any lab test. Depends on: SENS, SPEC and prevalence– indicates info that can be gained from by conducting test under a
giving set of conditions
PV(+) = TP X 100TP +FP
PV(-) = TN X 100TN +FN
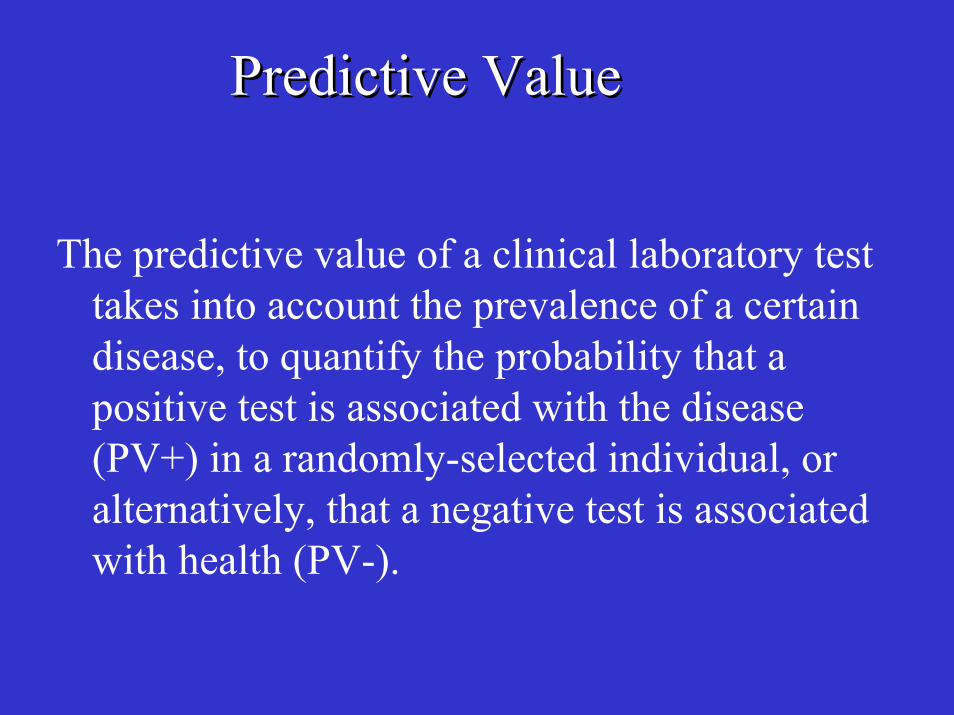
Predictive ValuePredictive Value
The predictive value of a clinical laboratory test takes into account the prevalence of a certain disease, to quantify the probability that a positive test is associated with the disease (PV+) in a randomly-selected individual, or alternatively, that a negative test is associated with health (PV-).
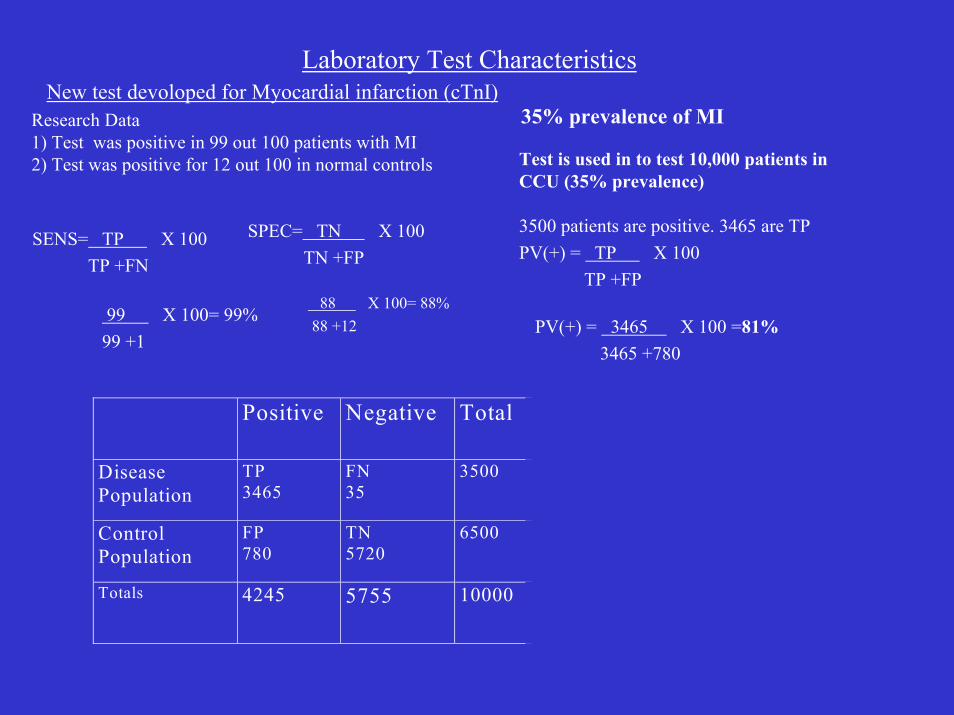
Laboratory Test CharacteristicsNew test devoloped for Myocardial infarction (cTnI)
35% prevalence of MIResearch Data1) Test was positive in 99 out 100 patients with MI2) Test was positive for 12 out 100 in normal controls Test is used in to test 10,000 patients in
CCU (35% prevalence)
3500 patients are positive. 3465 are TPPV(+) = TP X 100
TP +FP
SENS= TP X 100TP +FN
99 X 100= 99%99 +1
SPEC= TN X 100TN +FP
88 X 100= 88%88 +12 PV(+) = 3465 X 100 =81%
3465 +780
Positive Negative Total
Disease Population
TP 3465
FN 35
3500
Control Population
FP 780
TN 5720
6500
Totals 4245 5755 10000
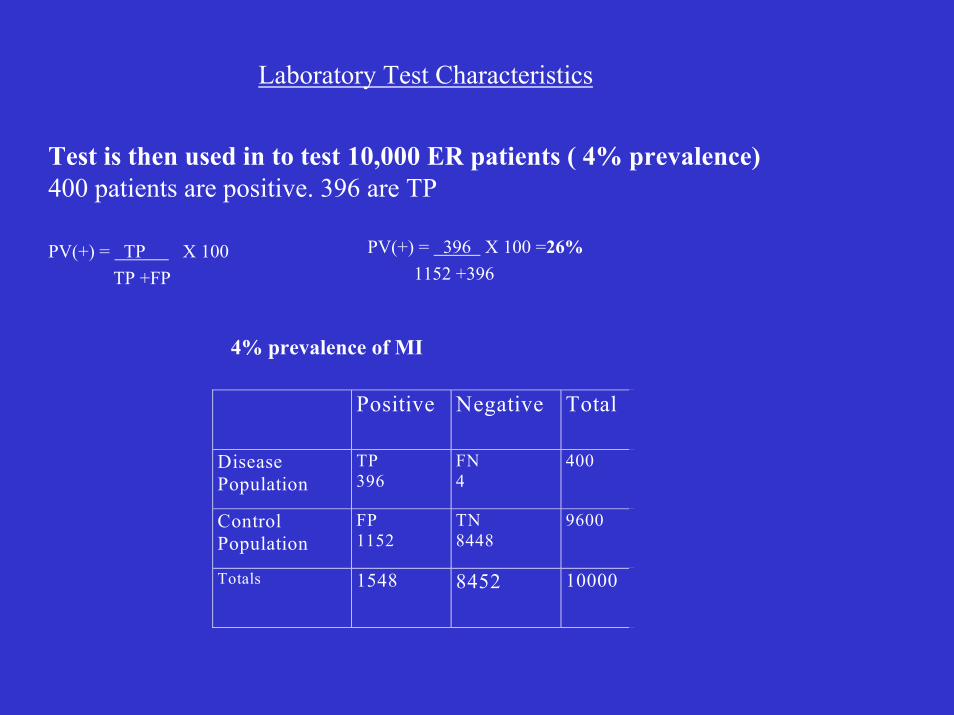
Laboratory Test Characteristics
Test is then used in to test 10,000 ER patients ( 4% prevalence)400 patients are positive. 396 are TP
PV(+) = TP X 100TP +FP
PV(+) = 396 X 100 =26%1152 +396
4% prevalence of MI
Positive Negative Total
Disease Population
TP 396
FN 4
400
Control Population
FP 1152
TN 8448
9600
Totals 1548 8452 10000
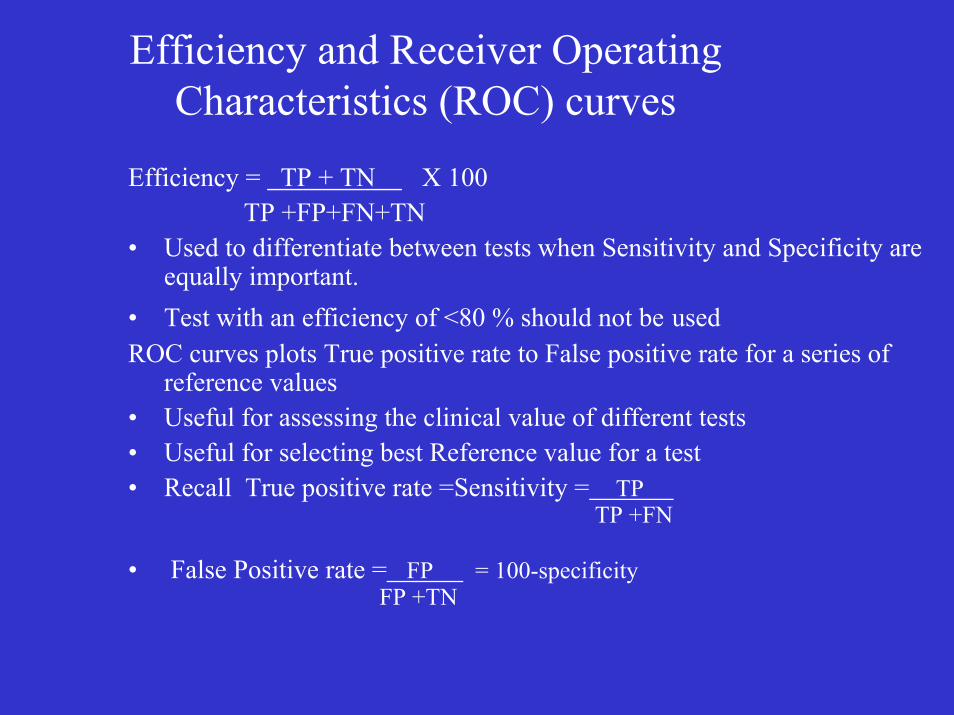
Efficiency and Receiver Operating Characteristics (ROC) curves
Efficiency = TP + TN X 100TP +FP+FN+TN
• Used to differentiate between tests when Sensitivity and Specificity are equally important.
• Test with an efficiency of <80 % should not be usedROC curves plots True positive rate to False positive rate for a series of
reference values• Useful for assessing the clinical value of different tests• Useful for selecting best Reference value for a test• Recall True positive rate =Sensitivity = TP
TP +FN
• False Positive rate = FP = 100-specificityFP +TN
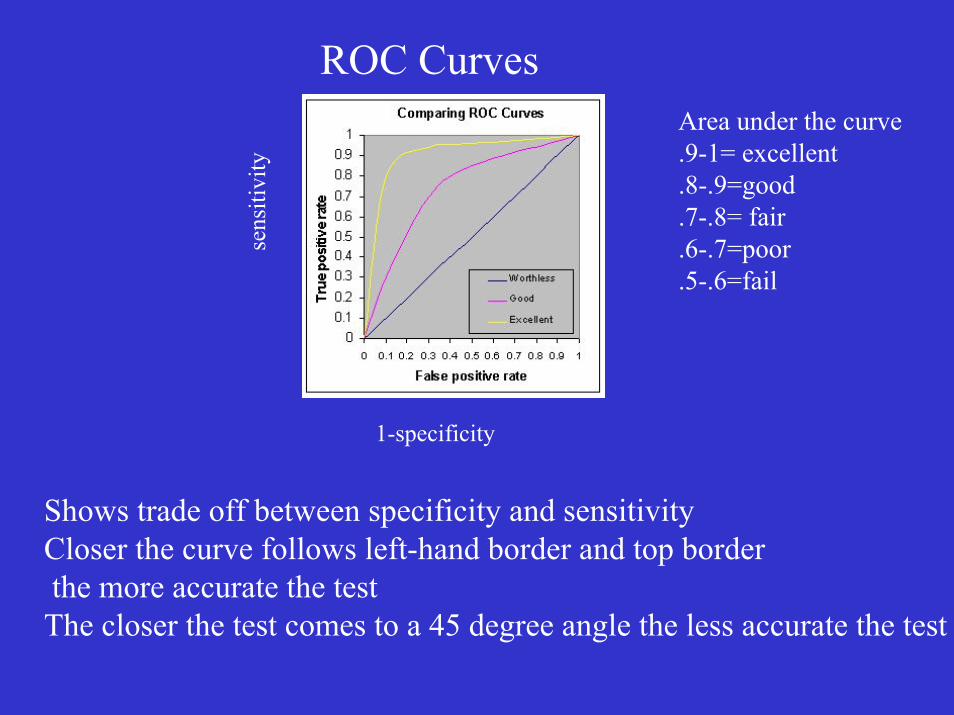
ROC Curves
sens
itivi
ty
Area under the curve.9-1= excellent.8-.9=good.7-.8= fair.6-.7=poor.5-.6=fail
1-specificity
Shows trade off between specificity and sensitivityCloser the curve follows left-hand border and top borderthe more accurate the testThe closer the test comes to a 45 degree angle the less accurate the test
The Diagnostic TestThe view from the laboratory
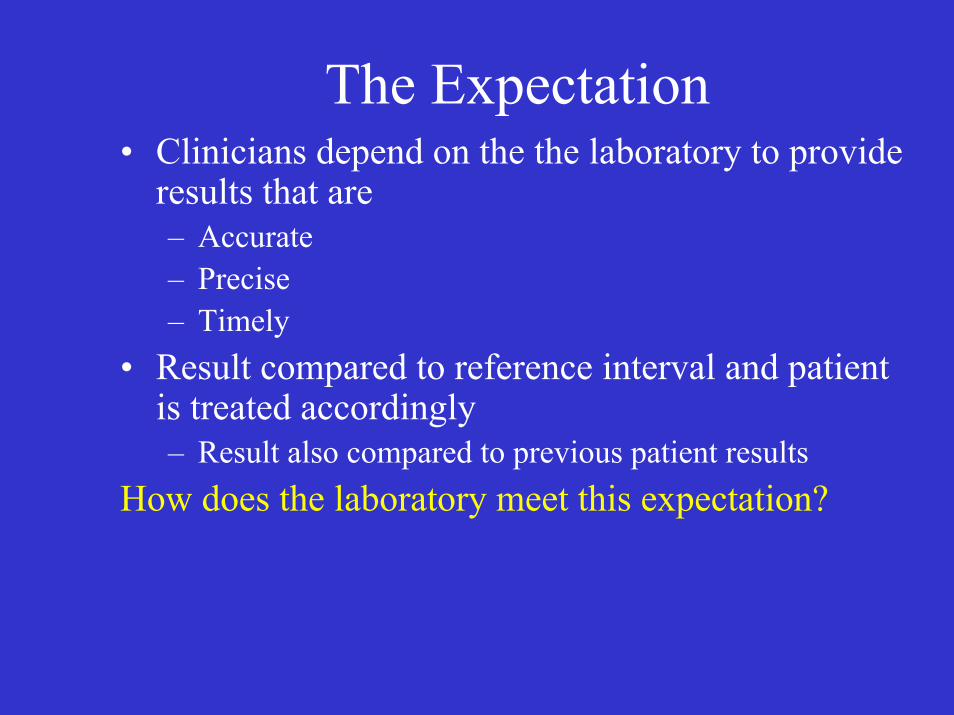
The Expectation• Clinicians depend on the the laboratory to provide
results that are– Accurate– Precise– Timely
• Result compared to reference interval and patient is treated accordingly– Result also compared to previous patient results
How does the laboratory meet this expectation?
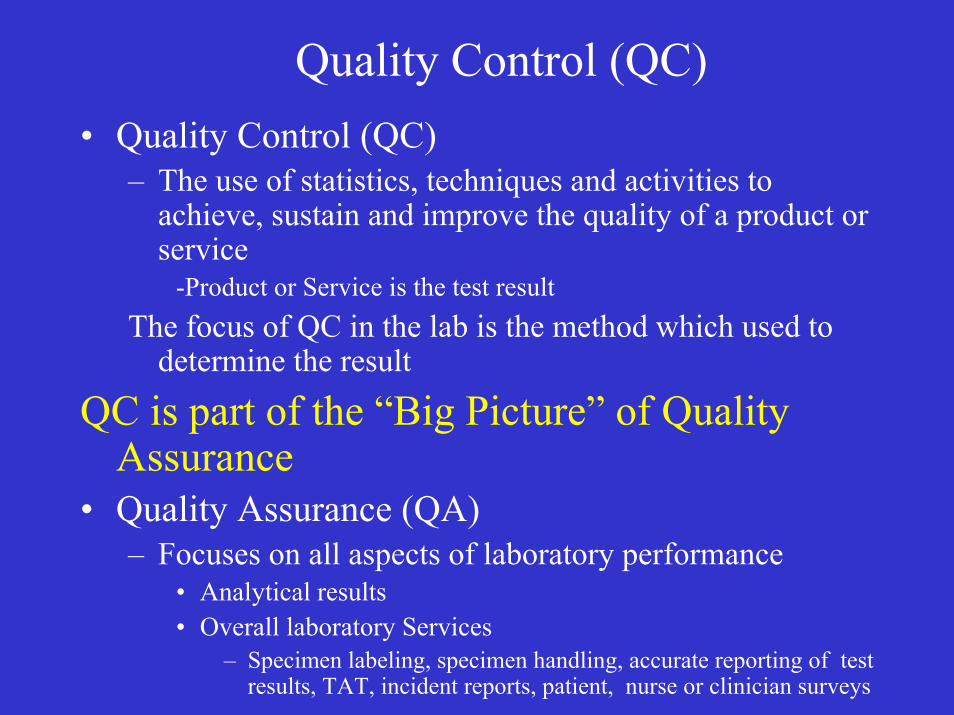
Quality Control (QC)• Quality Control (QC)
– The use of statistics, techniques and activities to achieve, sustain and improve the quality of a product or service
-Product or Service is the test resultThe focus of QC in the lab is the method which used to
determine the result
QC is part of the “Big Picture” of Quality Assurance
• Quality Assurance (QA) – Focuses on all aspects of laboratory performance
• Analytical results• Overall laboratory Services
– Specimen labeling, specimen handling, accurate reporting of test results, TAT, incident reports, patient, nurse or clinician surveys
QC in the Laboratory involves Evaluating method performanceQC in the Laboratory involves
Evaluating method performanceConstant
Long termShort term
So what are we evaluating?
Evaluating method performanceEvaluating method performance
• Accuracy• Precision• Sensitivity• Linearity
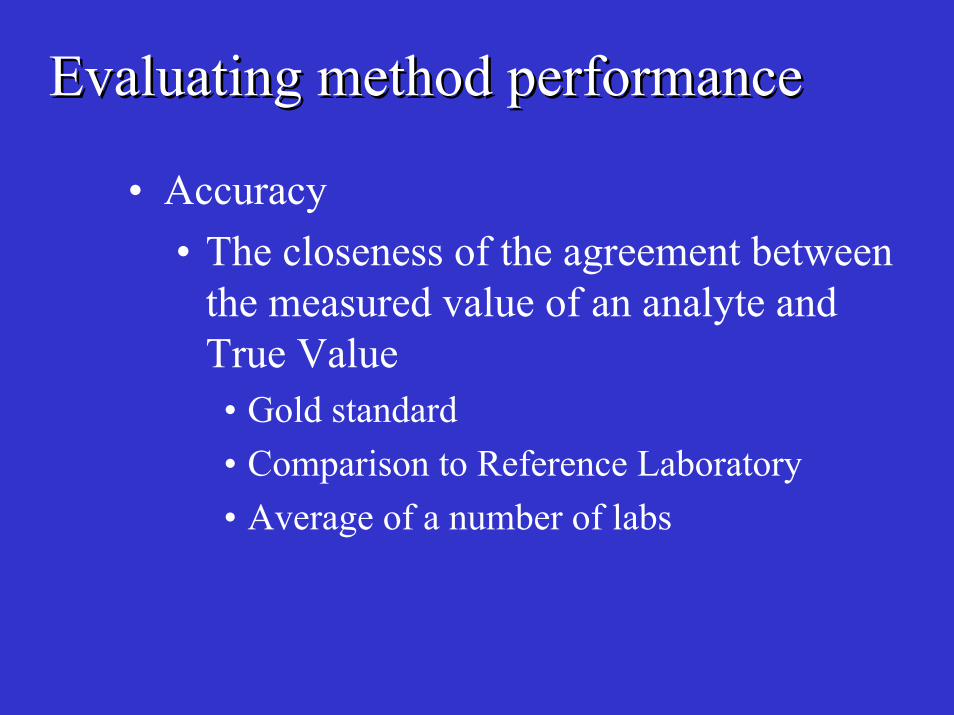
Evaluating method performanceEvaluating method performance
• Accuracy• The closeness of the agreement between
the measured value of an analyte and True Value• Gold standard • Comparison to Reference Laboratory• Average of a number of labs
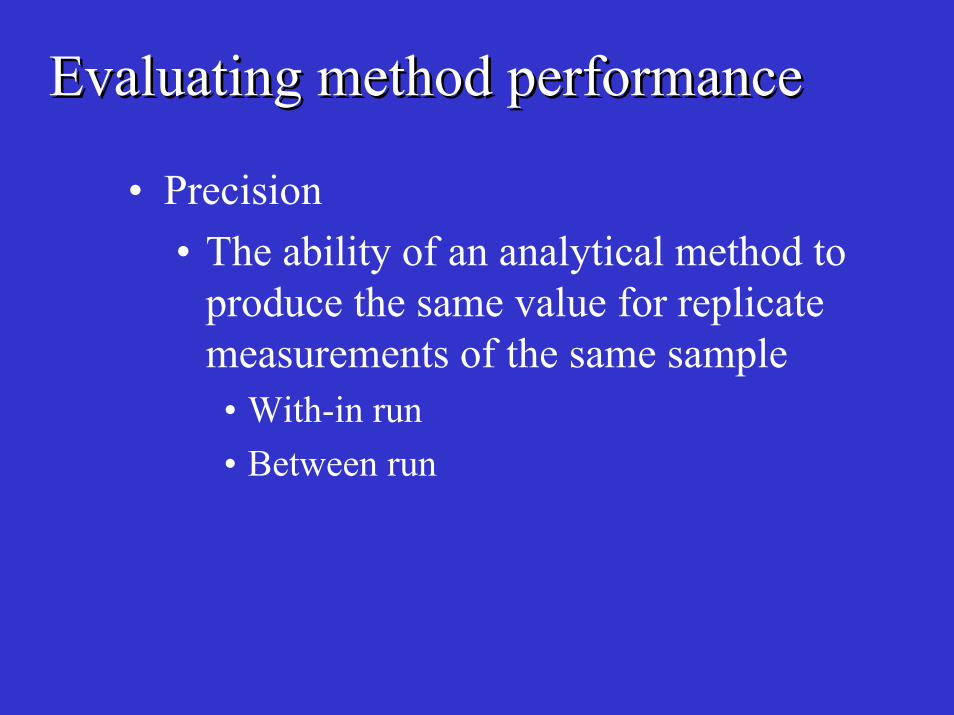
Evaluating method performanceEvaluating method performance
• Precision• The ability of an analytical method to
produce the same value for replicate measurements of the same sample• With-in run• Between run
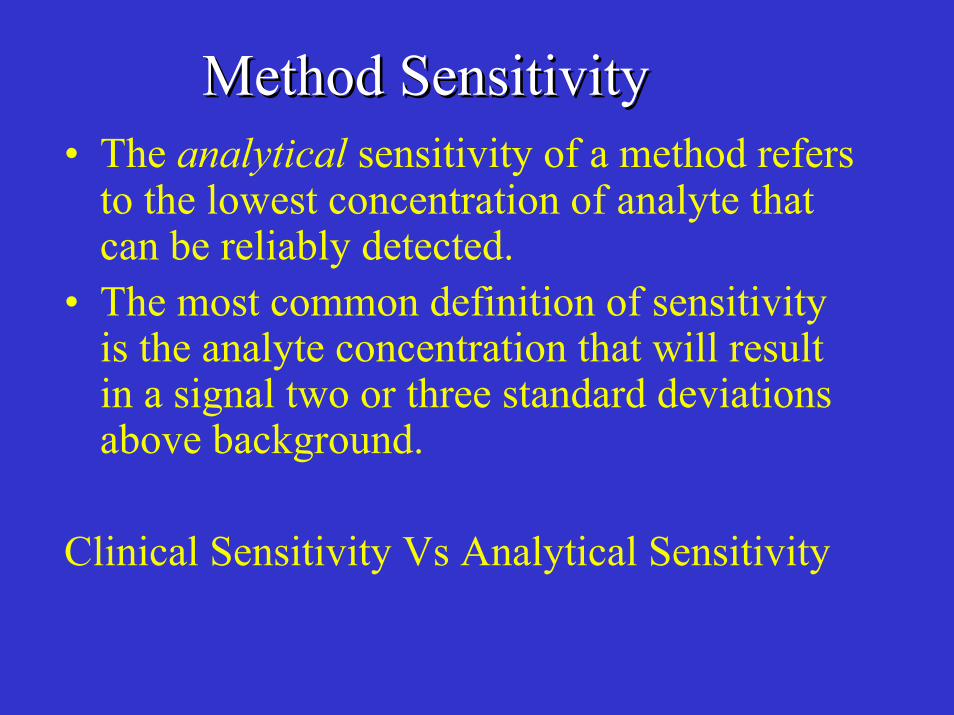
Method SensitivityMethod Sensitivity• The analytical sensitivity of a method refers
to the lowest concentration of analyte that can be reliably detected.
• The most common definition of sensitivity is the analyte concentration that will result in a signal two or three standard deviations above background.
Clinical Sensitivity Vs Analytical Sensitivity
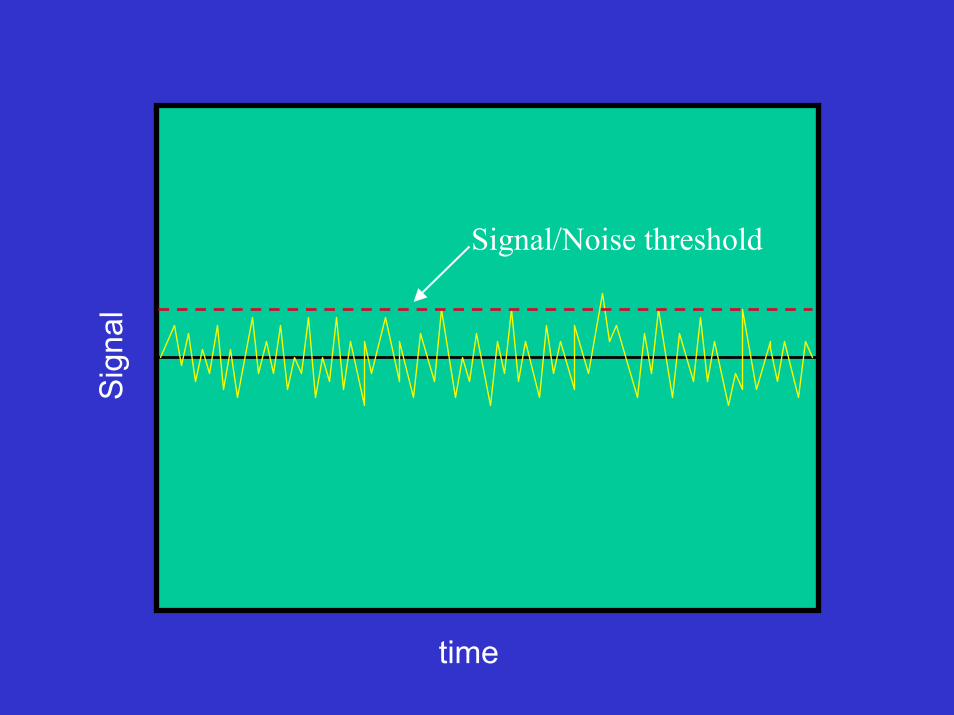
Signal
Signal/Noise threshold
time
Clinical Sensitivity Vs Analytical Sensitivity
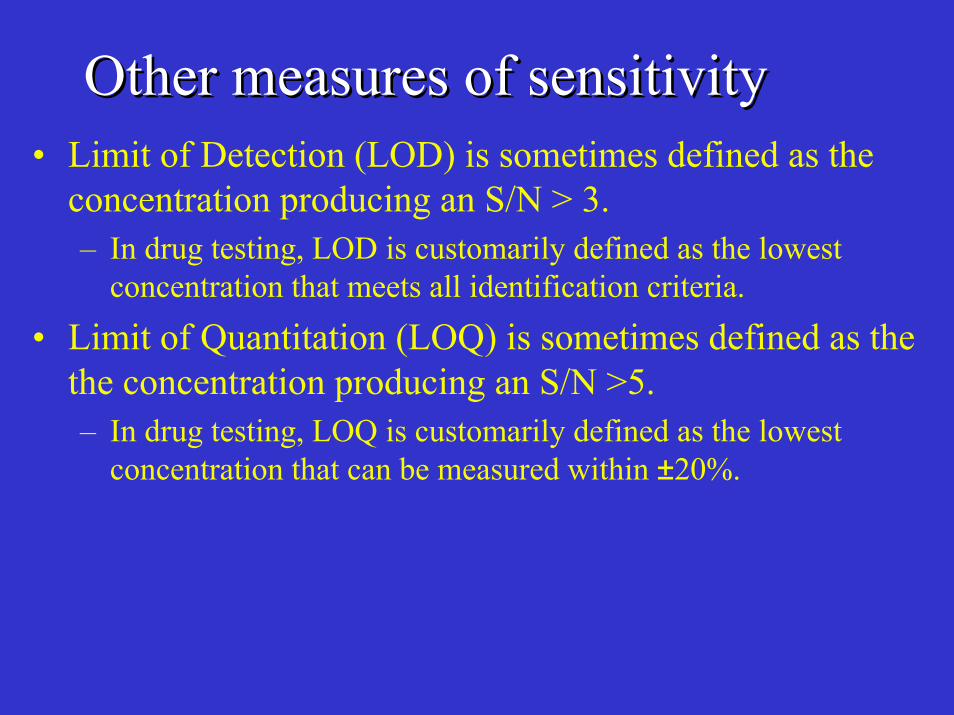
Other measures of sensitivityOther measures of sensitivity• Limit of Detection (LOD) is sometimes defined as the
concentration producing an S/N > 3.– In drug testing, LOD is customarily defined as the lowest
concentration that meets all identification criteria.
• Limit of Quantitation (LOQ) is sometimes defined as the the concentration producing an S/N >5.– In drug testing, LOQ is customarily defined as the lowest
concentration that can be measured within ±20%.
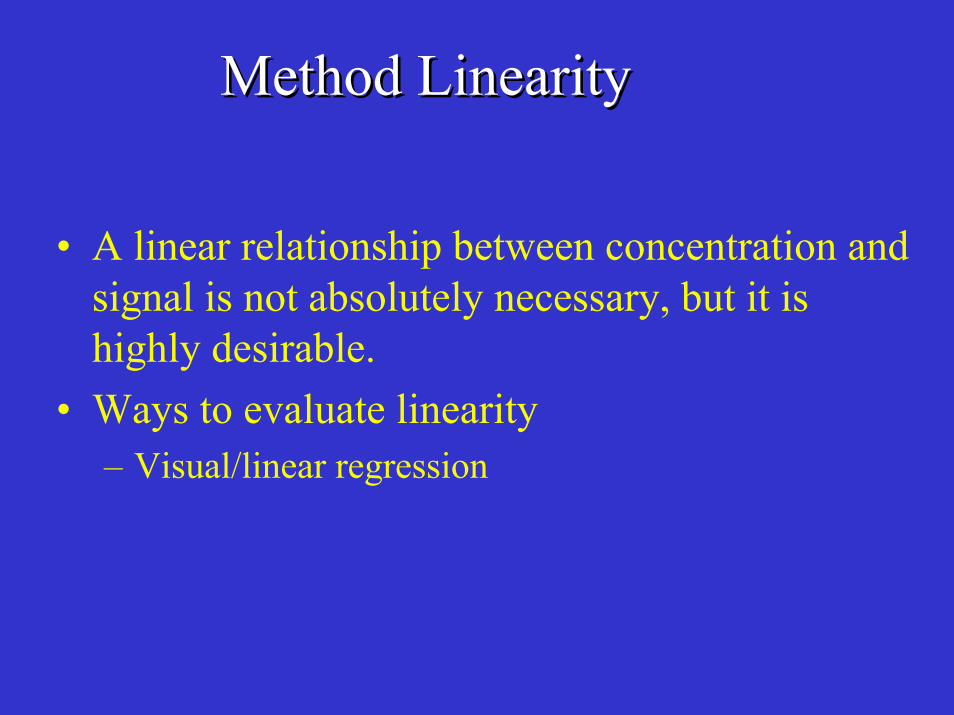
Method LinearityMethod Linearity
• A linear relationship between concentration and signal is not absolutely necessary, but it is highly desirable.
• Ways to evaluate linearity– Visual/linear regression
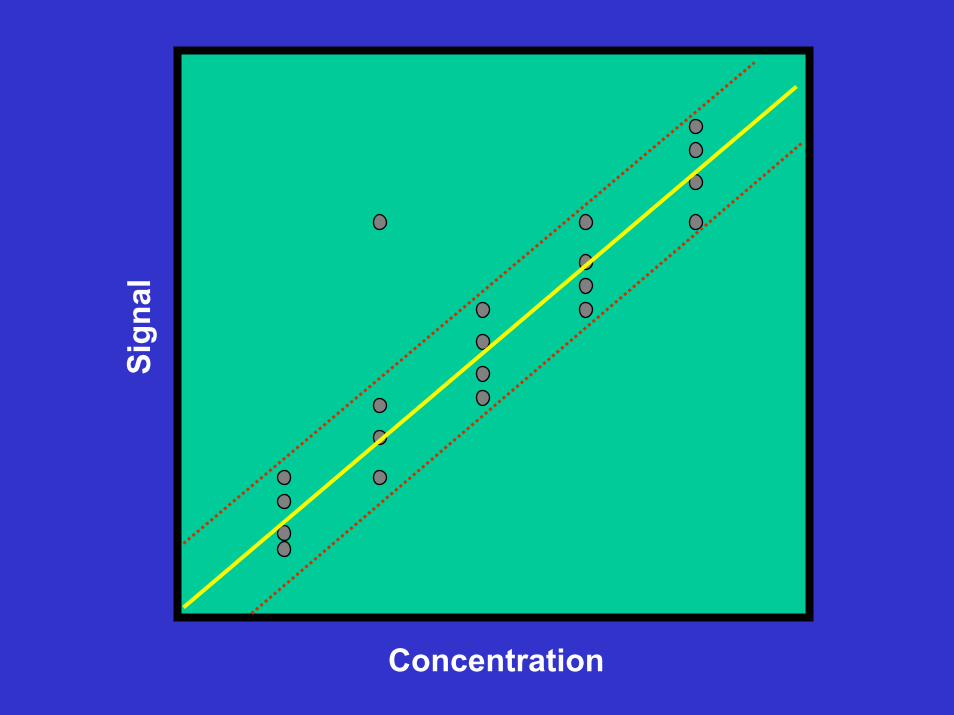
Sign
al
Concentration
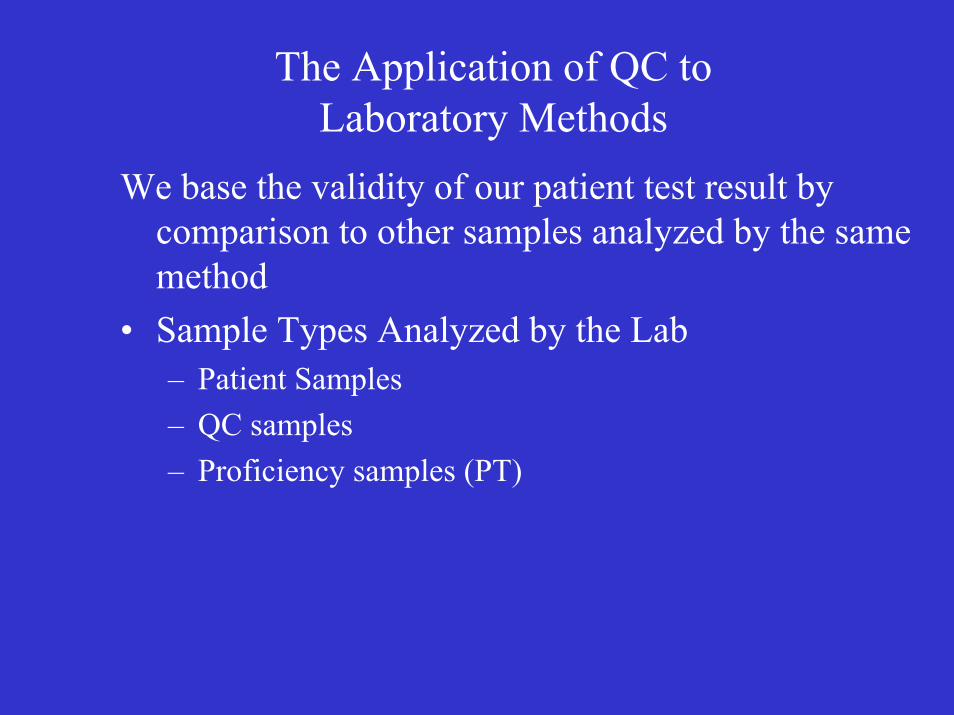
The Application of QC to Laboratory Methods
We base the validity of our patient test result by comparison to other samples analyzed by the same method
• Sample Types Analyzed by the Lab– Patient Samples– QC samples– Proficiency samples (PT)

The Application of QC to Laboratory Methods
• QC Samples• Samples selected by the laboratory and purchased from
an external company• Tested each day of patient testing to mimic patient and
proficiency samples• Indicates if the lab’s analytical processes are
performing in an acceptable manner, thereby producing clinically acceptable patient and proficiency results
• QC samples provide data about accuracy and precision of each methods at the level of analyte present in the control
• We interpret the data when making daily decisions about the acceptability of each batch of patient or PT samples
The Application of QC to Laboratory Methods
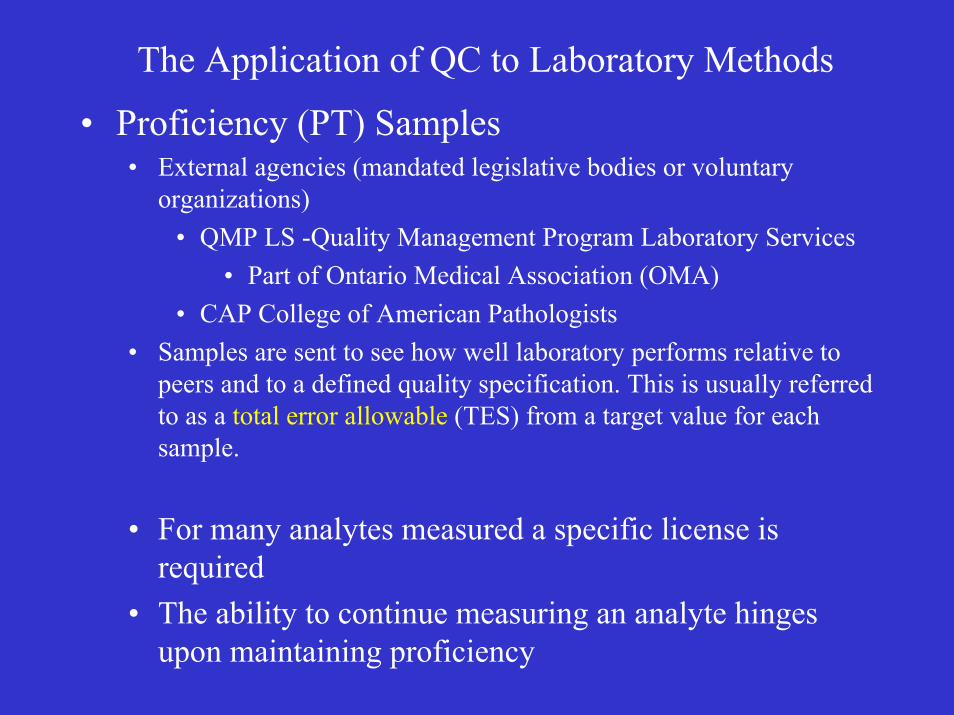
• Proficiency (PT) Samples• External agencies (mandated legislative bodies or voluntary
organizations)• QMP LS -Quality Management Program Laboratory Services
• Part of Ontario Medical Association (OMA)• CAP College of American Pathologists
• Samples are sent to see how well laboratory performs relative topeers and to a defined quality specification. This is usually referred to as a total error allowable (TES) from a target value for each sample.
• For many analytes measured a specific license is required
• The ability to continue measuring an analyte hinges upon maintaining proficiency
The Application of QC to Laboratory Methods
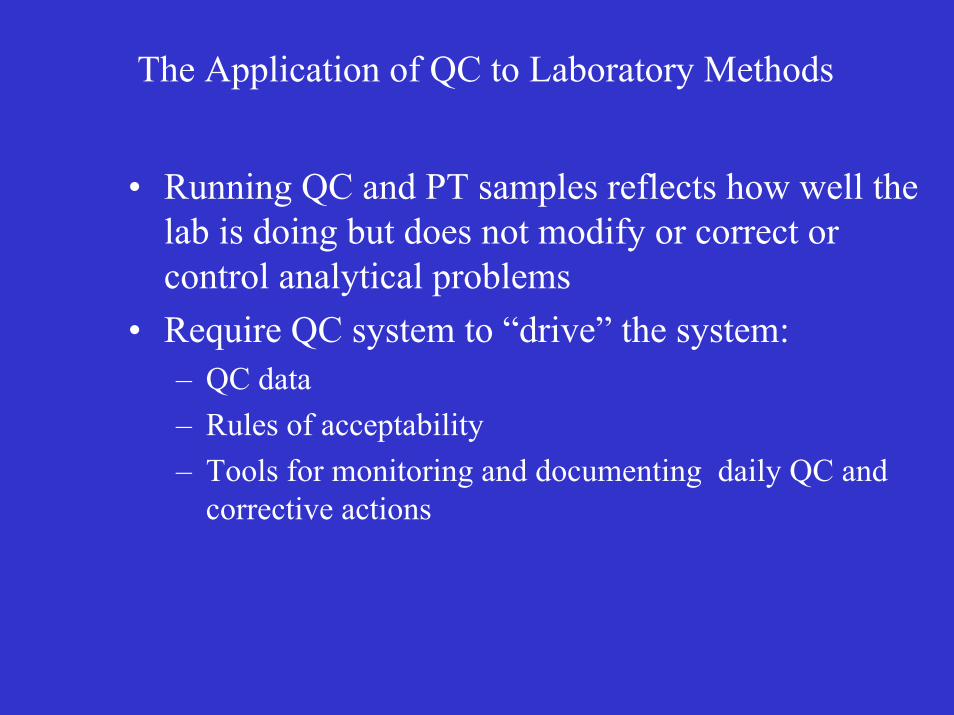
• Running QC and PT samples reflects how well the lab is doing but does not modify or correct or control analytical problems
• Require QC system to “drive” the system:– QC data– Rules of acceptability– Tools for monitoring and documenting daily QC and
corrective actions
The Application of QC to Laboratory Methods
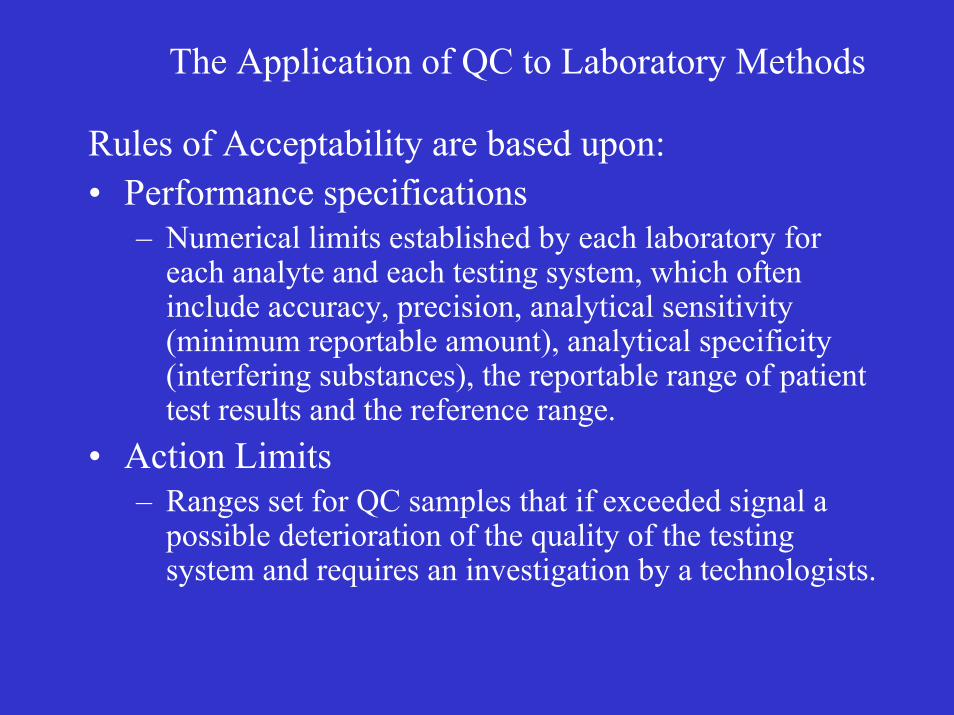
Rules of Acceptability are based upon:• Performance specifications
– Numerical limits established by each laboratory for each analyte and each testing system, which often include accuracy, precision, analytical sensitivity (minimum reportable amount), analytical specificity (interfering substances), the reportable range of patient test results and the reference range.
• Action Limits– Ranges set for QC samples that if exceeded signal a
possible deterioration of the quality of the testing system and requires an investigation by a technologists.
The Application of QC to Laboratory Methods
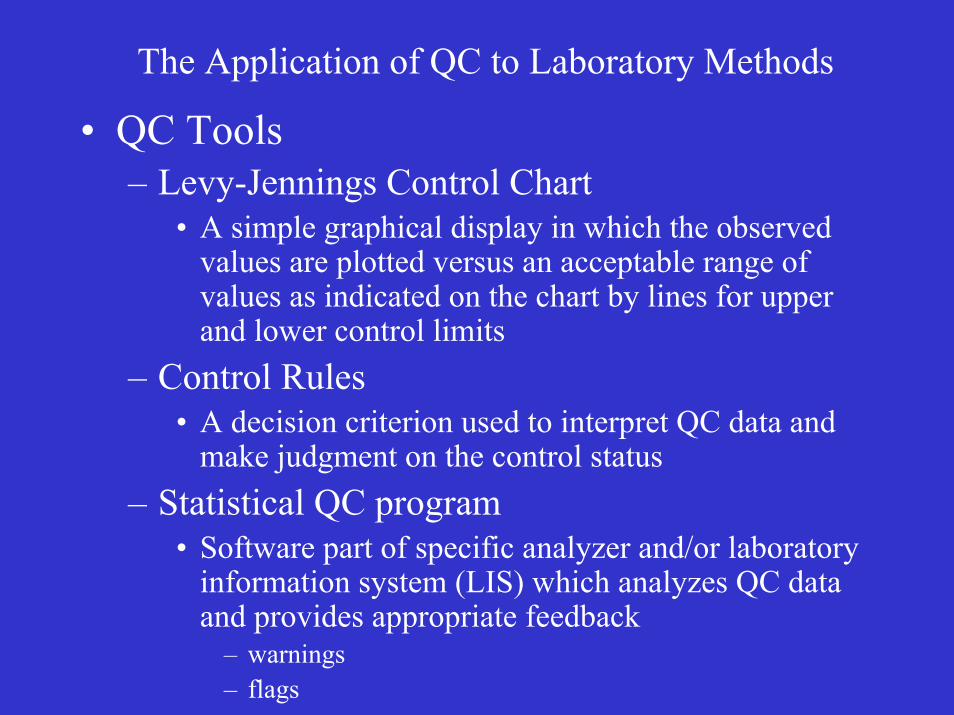
• QC Tools– Levy-Jennings Control Chart
• A simple graphical display in which the observed values are plotted versus an acceptable range of values as indicated on the chart by lines for upper and lower control limits
– Control Rules• A decision criterion used to interpret QC data and
make judgment on the control status– Statistical QC program
• Software part of specific analyzer and/or laboratory information system (LIS) which analyzes QC data and provides appropriate feedback
– warnings– flags
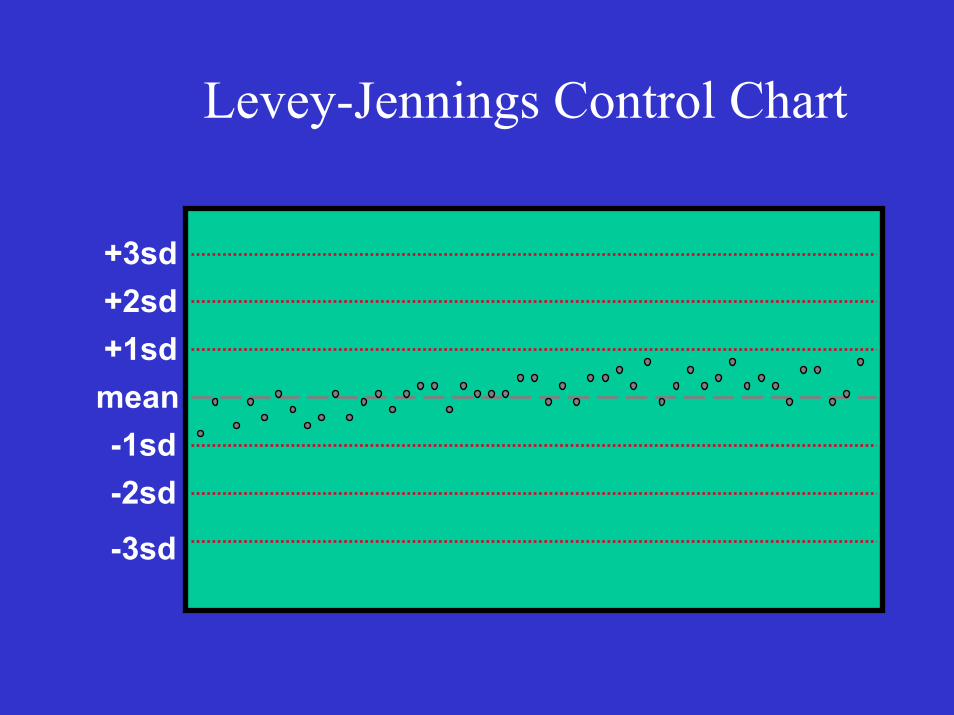
Levey-Jennings Control Chart
+3sd+2sd+1sdmean-1sd-2sd
-3sd

Levey-Jennings Control Chart
+3sd+2sd+1sdmean-1sd-2sd
-3sd

Levey-Jennings Control Chart
+3sd+2sd+1sdmean-1sd-2sd
-3sd
The Application of QC to Laboratory Methods
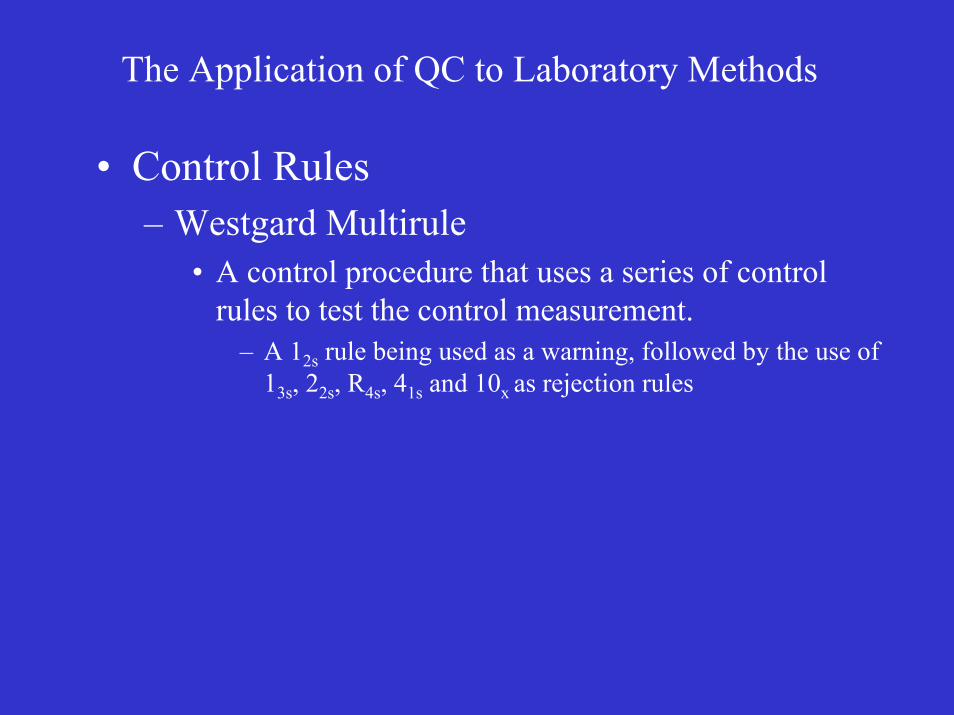
• Control Rules– Westgard Multirule
• A control procedure that uses a series of control rules to test the control measurement.
– A 12s rule being used as a warning, followed by the use of 13s, 22s, R4s, 41s and 10x as rejection rules
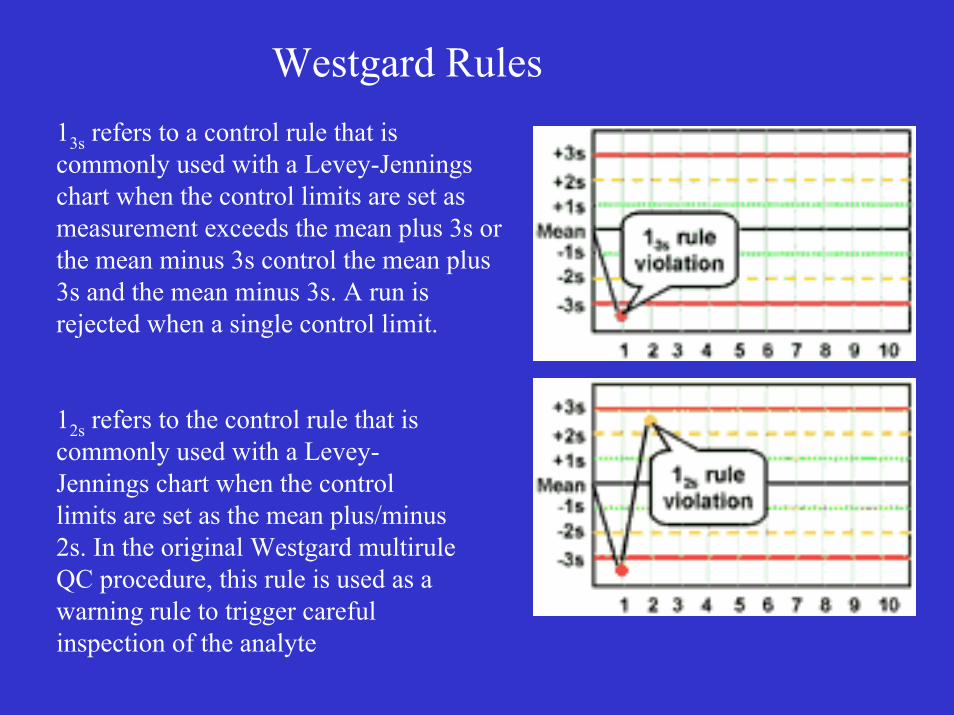
Westgard Rules13s refers to a control rule that is commonly used with a Levey-Jennings chart when the control limits are set as measurement exceeds the mean plus 3s or the mean minus 3s control the mean plus 3s and the mean minus 3s. A run is rejected when a single control limit.
12s refers to the control rule that is commonly used with a Levey-Jennings chart when the control limits are set as the mean plus/minus 2s. In the original Westgard multiruleQC procedure, this rule is used as a warning rule to trigger careful inspection of the analyte
Westgard Rules
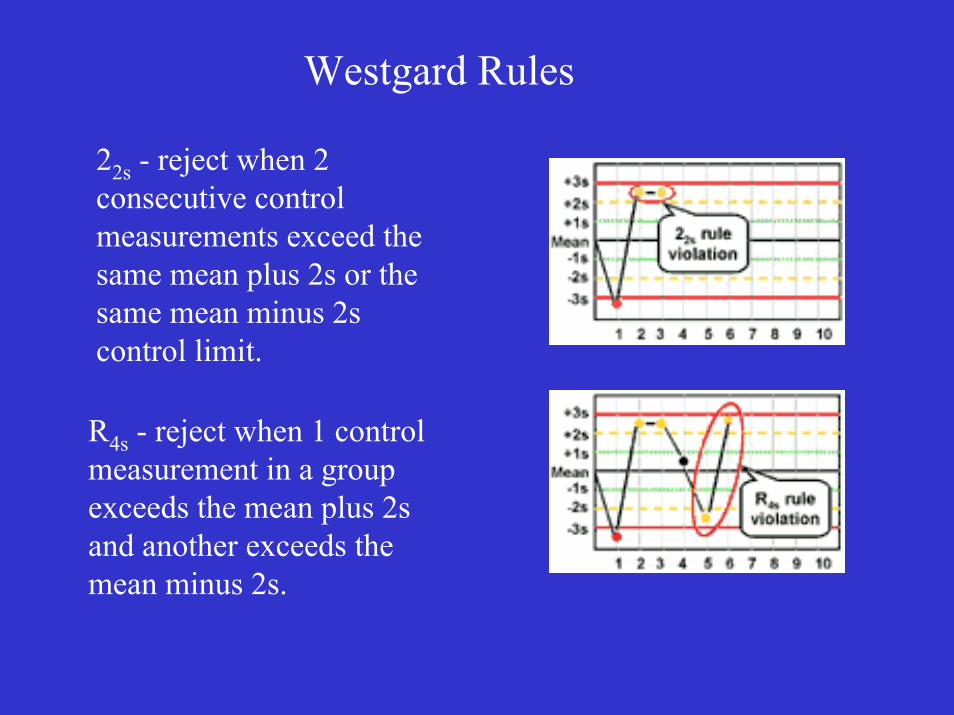
22s - reject when 2 consecutive control measurements exceed the same mean plus 2s or the same mean minus 2s control limit.
R4s - reject when 1 control measurement in a group exceeds the mean plus 2s and another exceeds the mean minus 2s.
Westgard Rules
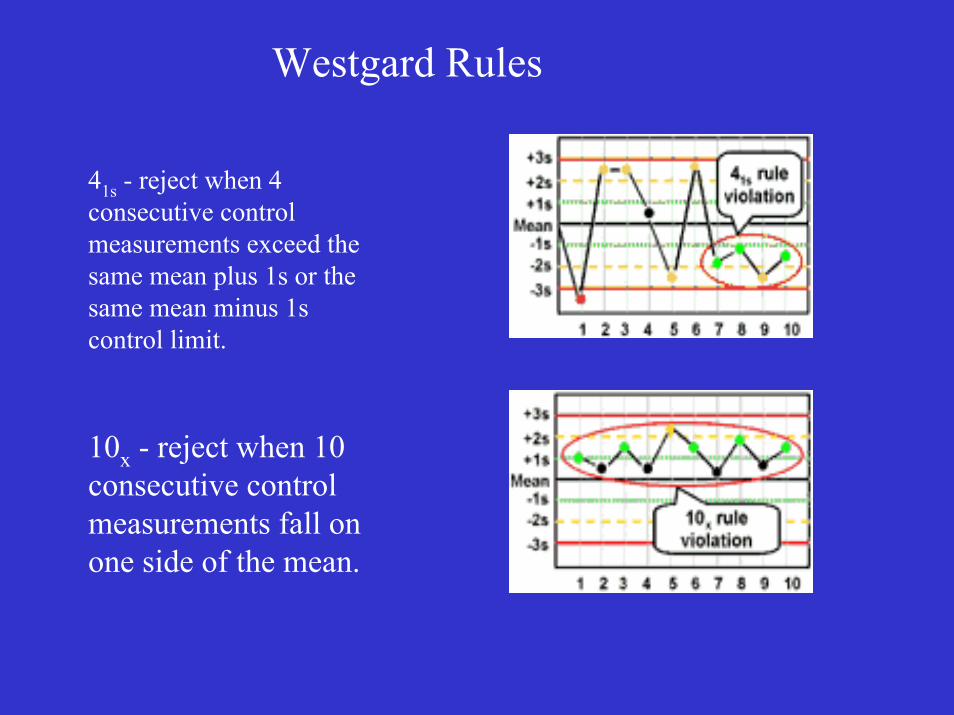
41s - reject when 4 consecutive control measurements exceed the same mean plus 1s or the same mean minus 1s control limit.
10x - reject when 10 consecutive control measurements fall on one side of the mean.
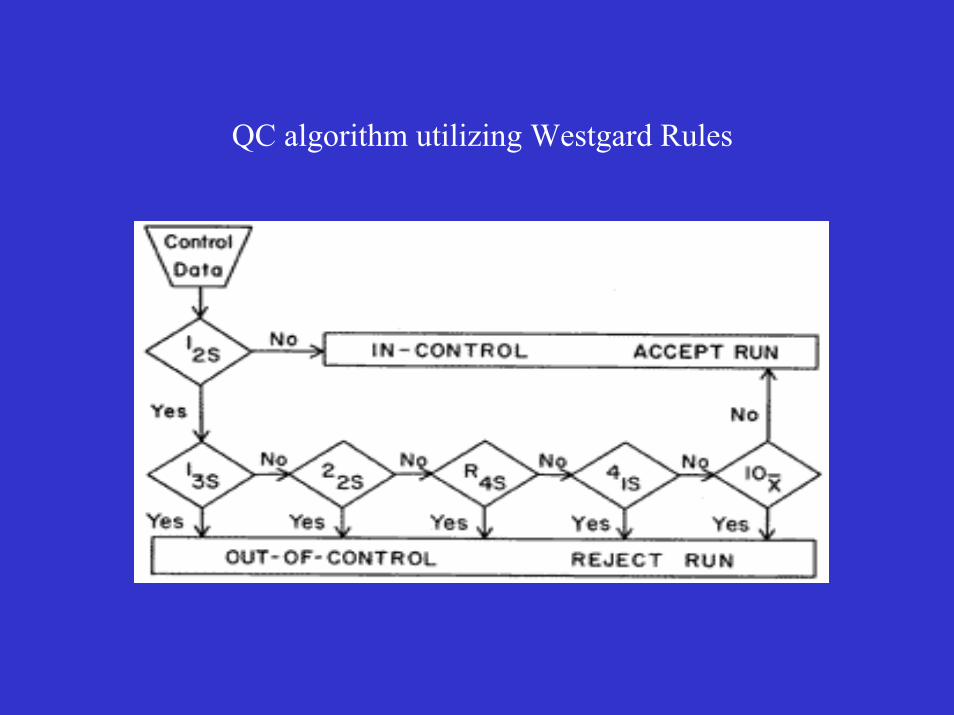
QC algorithm utilizing Westgard Rules