enzyme reaction lab
TRANSCRIPT

Aakash Parikh
Lab report 2
Mr. Veres
11/23/2011
Factors influencing Enzyme activity
Objective:
To see the changes in enzymatic activity through a series of test and condition , under
which cellular respiration would occur most.
Seeing how different stimuli can affect the outcome of how an enzyme works to catalyze
a reaction; whether it will speed the reaction up immensely or slightly.
Materials:
Water tub
100mL graduate cylinder
Ring stand
Thermometer
Reaction chamber
Yeast ( Catalase)
10mL graduated cylinder
Pipettes
3% hydrogen peroxide
Hot plate
Ice
pH buffer 4,7,10
balance
Distilled Water
NaCl (Salt)

Introduction:
Enzymes are a key part to biological functions in organism. Every organism performs a
series of various chemical reactions every day. These reactions helps the human body function.
Normally, these reactions would process very slow and it would years for the body to break down
glucose because there are catalysts that help slow down the reaction. Biological catalysts are
called enzymes. In this lab we discuss how these different stimuli actually affected the way the
yeast solution respired.
Hypothesis:
Part A) If 10 mL of hydrogen peroxide (H2O2) is combined in a reaction chamber with
1.0 mL of stock catalase solution (yeast) and the reaction rate is measured via the
production of oxygen gas over the course of five minutes, then a control group will be
established by which environmental factors can be analyzed for their influence on
enzymatic activity.
Part B) If 10 mL of hydrogen peroxide (H2O2) is combined in a reaction chamber with
varying concentrations of stock catalase solution (yeast) separately and the reaction rate
is measured via the production of oxygen gas over the course of five minutes, then the
reaction rate will increase as enzyme concentration increases because there are more
active sites for which the substrate molecules can bind. Ultimately, the reaction rate will
level off because the substrate is limiting.
Part C) If 10 mL of hydrogen peroxide (H2O2) is combined in a reaction chamber with 1.0
mL of stock catalase solution (yeast) at varying temperatures and the reaction rate is
measured via the production of oxygen gas over the course of five minutes, then the
reaction rate will increase as the enzyme approaches its optimal temperature and decrease
as the enzyme moves away from its optimal temperature.
Part D) If 10 mL of hydrogen peroxide (H2O2) at three pH values is separately combined
in a reaction chamber with 1.0 mL of stock catalase solution (yeast) and the reaction rate
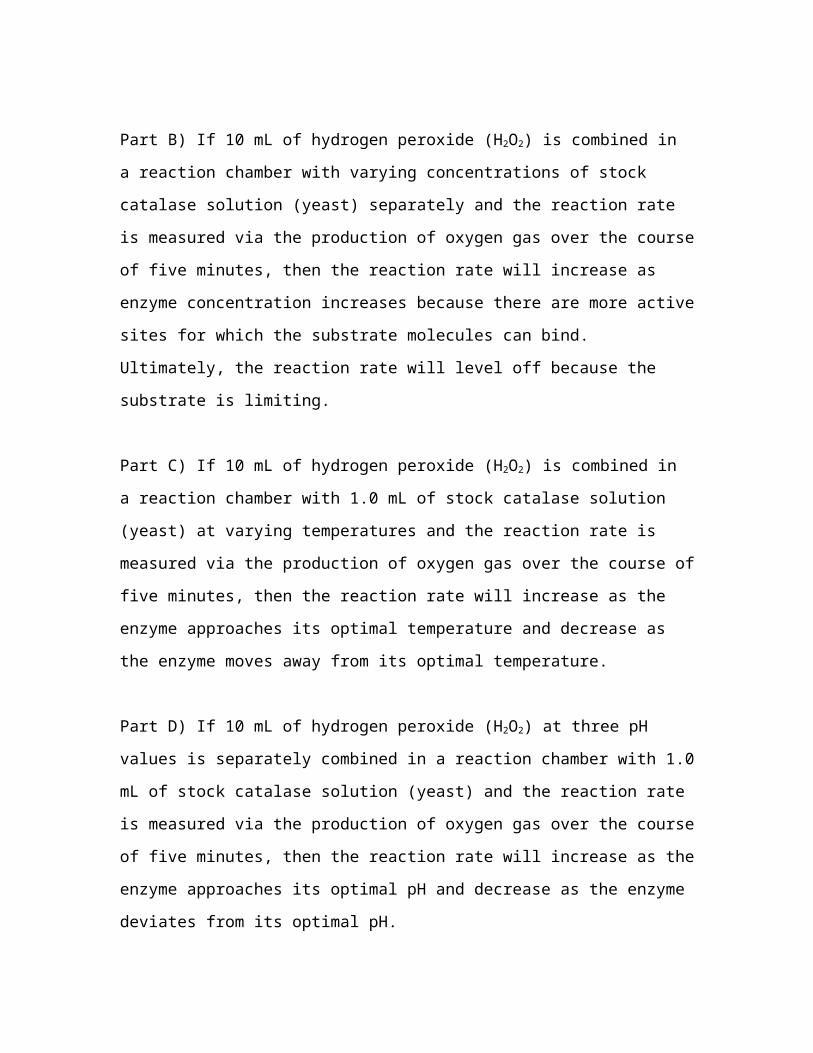
is measured via the production of oxygen gas over the course of five minutes, then the
reaction rate will increase as the enzyme approaches its optimal pH and decrease as the
enzyme deviates from its optimal pH.
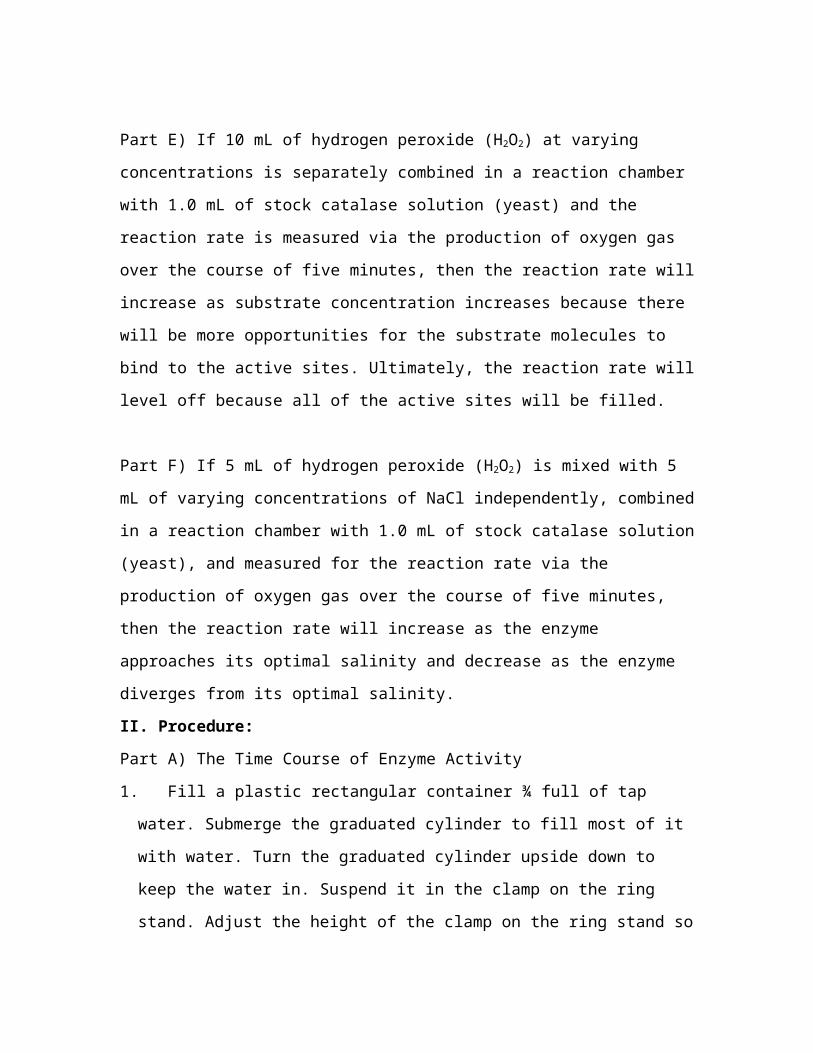
Part E) If 10 mL of hydrogen peroxide (H2O2) at varying concentrations is separately
combined in a reaction chamber with 1.0 mL of stock catalase solution (yeast) and the
reaction rate is measured via the production of oxygen gas over the course of five
minutes, then the reaction rate will increase as substrate concentration increases because
there will be more opportunities for the substrate molecules to bind to the active sites.
Ultimately, the reaction rate will level off because all of the active sites will be filled.
Part F) If 5 mL of hydrogen peroxide (H2O2) is mixed with 5 mL of varying
concentrations of NaCl independently, combined in a reaction chamber with 1.0 mL of
stock catalase solution (yeast), and measured for the reaction rate via the production of
oxygen gas over the course of five minutes, then the reaction rate will increase as the
enzyme approaches its optimal salinity and decrease as the enzyme diverges from its
optimal salinity.
II. Procedure:
Part A) The Time Course of Enzyme Activity
1. Fill a plastic rectangular container ¾ full of tap water. Submerge the graduated
cylinder to fill most of it with water. Turn the graduated cylinder upside down to keep
the water in. Suspend it in the clamp on the ring stand. Adjust the height of the clamp
on the ring stand so the open end of the graduated cylinder is about 3 cm above the
bottom of the container. Record the temperature of the water. Refer to the labeled
diagram to the right for concerns or
questions, but do not submerge the reaction chamber yet.
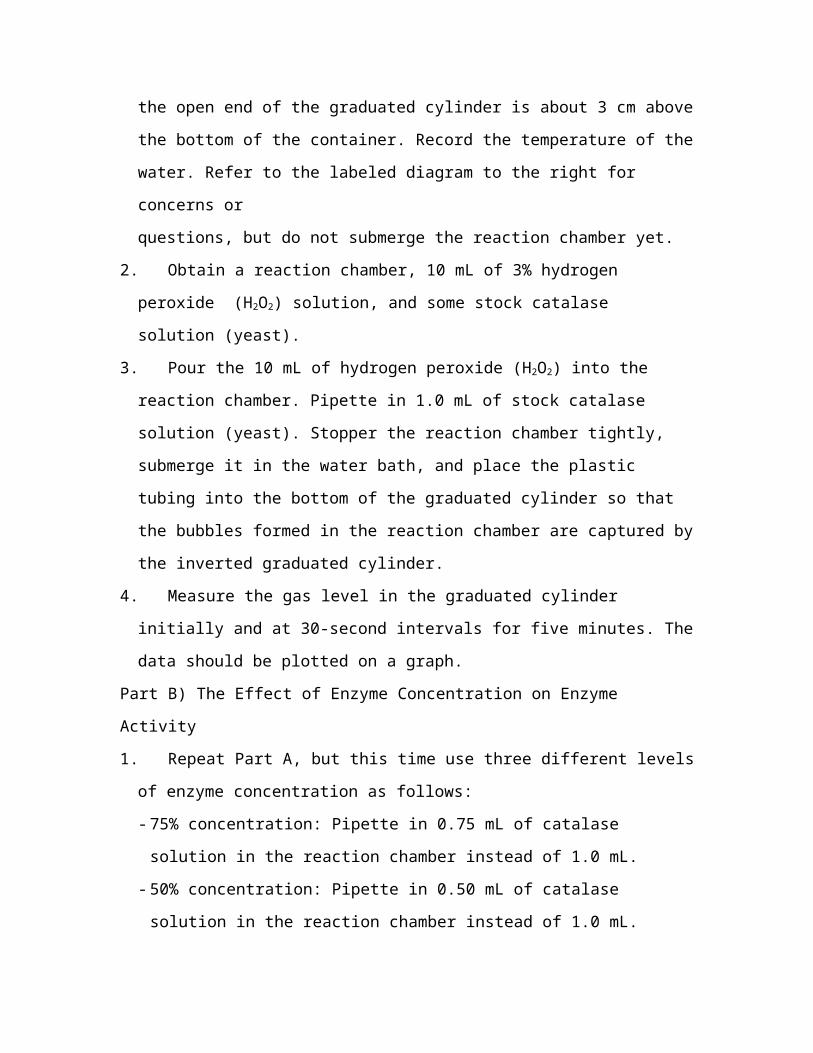
2. Obtain a reaction chamber, 10 mL of 3% hydrogen peroxide (H2O2) solution, and
some stock catalase solution (yeast).
3. Pour the 10 mL of hydrogen peroxide (H2O2) into the reaction chamber. Pipette in 1.0
mL of stock catalase solution (yeast). Stopper the reaction chamber tightly, submerge
it in the water bath, and place the plastic tubing into the bottom of the graduated
cylinder so that the bubbles formed in the reaction chamber are captured by the
inverted graduated cylinder.
4. Measure the gas level in the graduated cylinder initially and at 30-second intervals for
five minutes. The data should be plotted on a graph.
Part B) The Effect of Enzyme Concentration on Enzyme Activity
1. Repeat Part A, but this time use three different levels of enzyme concentration as
follows:
- 75% concentration: Pipette in 0.75 mL of catalase solution in the reaction chamber
instead of 1.0 mL.
- 50% concentration: Pipette in 0.50 mL of catalase solution in the reaction chamber
instead of 1.0 mL.
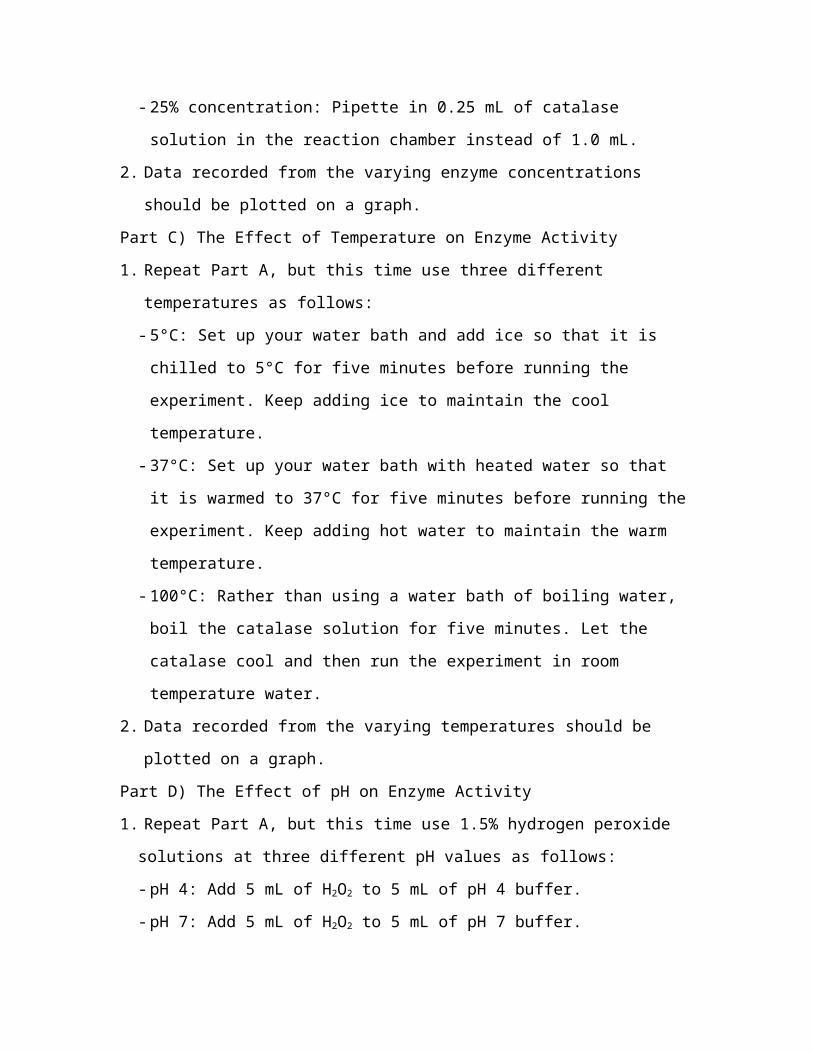
- 25% concentration: Pipette in 0.25 mL of catalase solution in the reaction chamber
instead of 1.0 mL.
2. Data recorded from the varying enzyme concentrations should be plotted on a graph.
Part C) The Effect of Temperature on Enzyme Activity
1. Repeat Part A, but this time use three different temperatures as follows:
- 5°C: Set up your water bath and add ice so that it is chilled to 5°C for five minutes
before running the experiment. Keep adding ice to maintain the cool temperature.
- 37°C: Set up your water bath with heated water so that it is warmed to 37°C for five
minutes before running the experiment. Keep adding hot water to maintain the warm
temperature.
- 100°C: Rather than using a water bath of boiling water, boil the catalase solution for
five minutes. Let the catalase cool and then run the experiment in room temperature
water.
2. Data recorded from the varying temperatures should be plotted on a graph.
Part D) The Effect of pH on Enzyme Activity
1. Repeat Part A, but this time use 1.5% hydrogen peroxide solutions at three different
pH values as follows:
- pH 4: Add 5 mL of H2O2 to 5 mL of pH 4 buffer.
- pH 7: Add 5 mL of H2O2 to 5 mL of pH 7 buffer.
- pH 10: Add 5 mL of H2O2 to 5 mL of pH 10 buffer.
2. Data recorded from the solutions at varying pH values should be plotted on a graph.
Part E) The Effect of Substrate Concentration on Enzyme Activity
1. Repeat Part A, but this time use four different substrate concentrations as follows:
- 0%: Use 10 mL of distilled water only.
- 0.3%: Prepare this by adding 3 mL of H2O2 to 7 mL of distilled water.
- 1.5%: Prepare this by adding 5 mL of H2O2 to 5 mL of distilled water.
- 3.0%: Use the data from Part A.
2. Data recorded from the varying substrate concentrations should be plotted on a graph.
Part F) The Effect of Ionic Concentration on Enzyme Activity
1. Repeat Part A, but this time mix 5 mL of hydrogen peroxide solution with three
different ionic concentrations as follows:
- 10% NaCl: Dissolve 5 g of NaCl in 50 mL of water and add this solution to 5 mL of
H2O2.
- 2% NaCl: Dissolve 1 g of NaCl in 50 mL of water and add this solution to 5 mL of
H2O2.
- 0% NaCl: Add 5 mL of distilled water to 5 mL of H2O2.
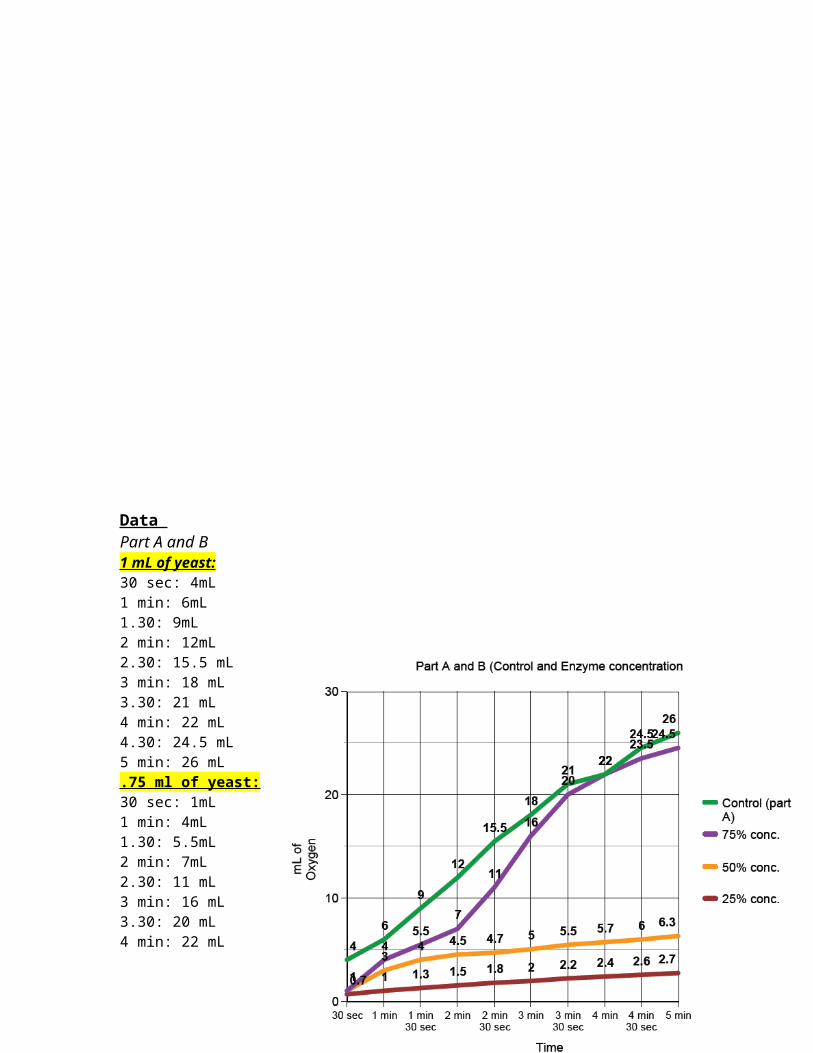
Data Part A and B1 mL of yeast:30 sec: 4mL1 min: 6mL1.30: 9mL2 min: 12mL2.30: 15.5 mL3 min: 18 mL3.30: 21 mL4 min: 22 mL4.30: 24.5 mL5 min: 26 mL.75 ml of yeast:30 sec: 1mL1 min: 4mL1.30: 5.5mL2 min: 7mL2.30: 11 mL3 min: 16 mL3.30: 20 mL4 min: 22 mL4.30: 23.5 mL5 min: 24.5 mL5 ml of yeast:30 sec: 1mL1 min: 3mL1.30: 4mL2 min: 4.5 mL2.30: 4.7 mL3 min: 5 mL3.30: 5.5 mL4 min: 5.7 mL4.30: 6 mL5 min: 6.3 mL.25 mL of yeast30 sec: .7 mL1 min: 1 mL1.30: 1.3 mL2 min: 1.5 mL2.30: 1.8 mL3 min: 2 mL3.30: 2.2 mL4 min: 2.4 mL4.30: 2.6 mL5 min: 2.7 mL
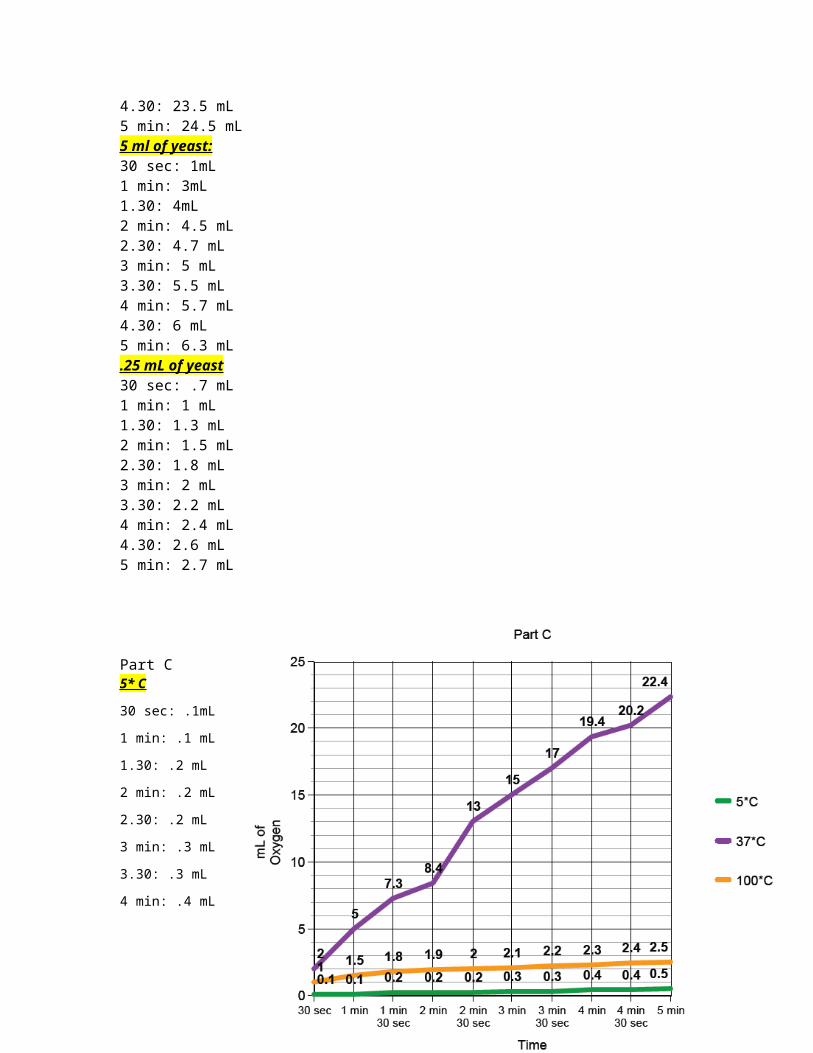
Part C
5* C
30 sec: .1mL
1 min: .1 mL
1.30: .2 mL
2 min: .2 mL
2.30: .2 mL
3 min: .3 mL
3.30: .3 mL
4 min: .4 mL
4.30: .4 mL
5 min: .5 mL
37*C
30 sec: 2 mL
1 min: 5 mL
1.30: 7.3 mL
2 min: 8.4 mL
2.30: 13 mL
3 min: 15 mL
3.30: 17 mL
4 min: 19.4 mL
4.30: 20.2 mL
5 min: 22.4 mL
100*C
30 sec: 1 mL
1 min: 1.5 mL
1.30: 1.8 mL
2 min: 1.9 mL
2.30: 2.0 mL
3 min: 2.1 mL
3.30: 2.2 mL
4 min: 2.3 mL
4.30: 2.4 mL
5 min: 2.5 mL
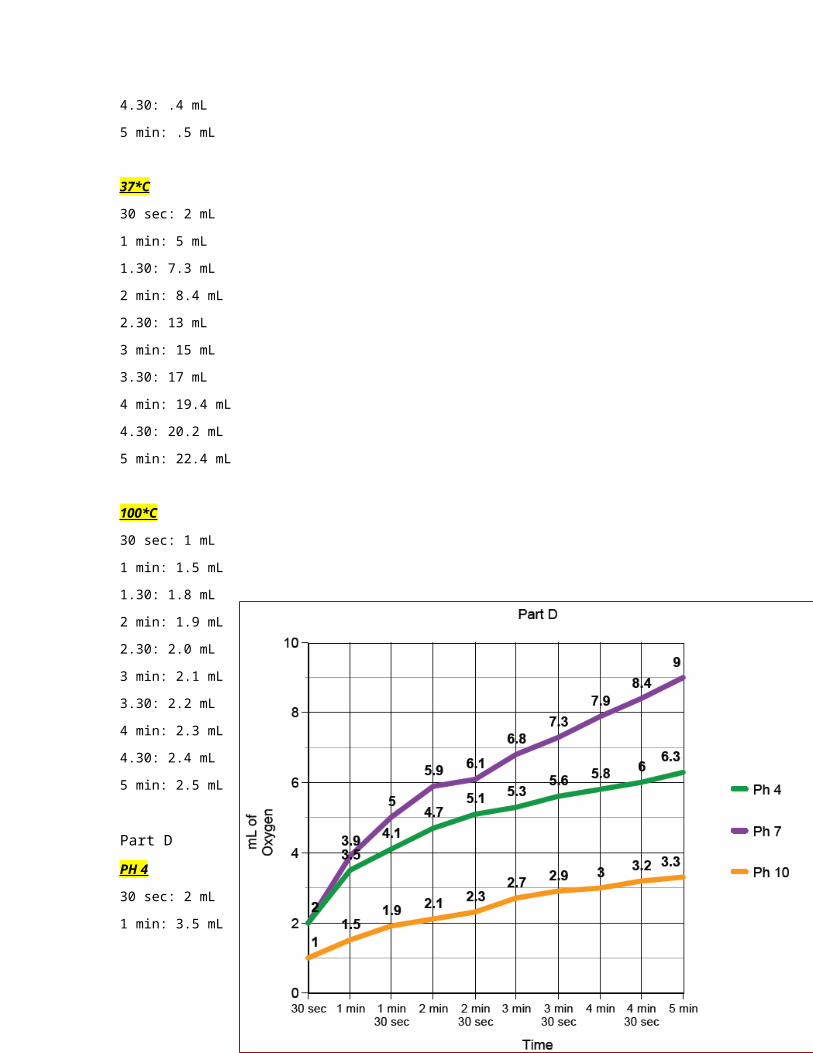
Part D
PH 4
30 sec: 2 mL
1 min: 3.5 mL
1.30: 4.1 mL
2 min: 4.7 mL
2.30: 5.1 mL
3 min: 5.3 mL
3.30: 5.6 mL
4 min: 5.8 mL
4.30: 6 mL
5 min: 6.3 mL
PH 7
30 sec: 2 mL
1 min: 3.9 mL
1.30: 5 mL
2 min: 5.9 mL
2.30: 6.1 mL
3 min: 6.8 mL
3.30: 7.3 mL
4 min: 7.9 mL
4.30: 8.4 mL
5 min: 9 mL
PH 10
30 sec: 1 mL
1 min: 1.5 mL
1.30: 1.9 mL
2 min: 2.1 mL
2.30: 2.3 mL
3 min: 2.7 mL
3.30: 2.9 mL
4 min: 3 mL
4.30: 3.2 mL
5 min: 3.3 mL
Part E
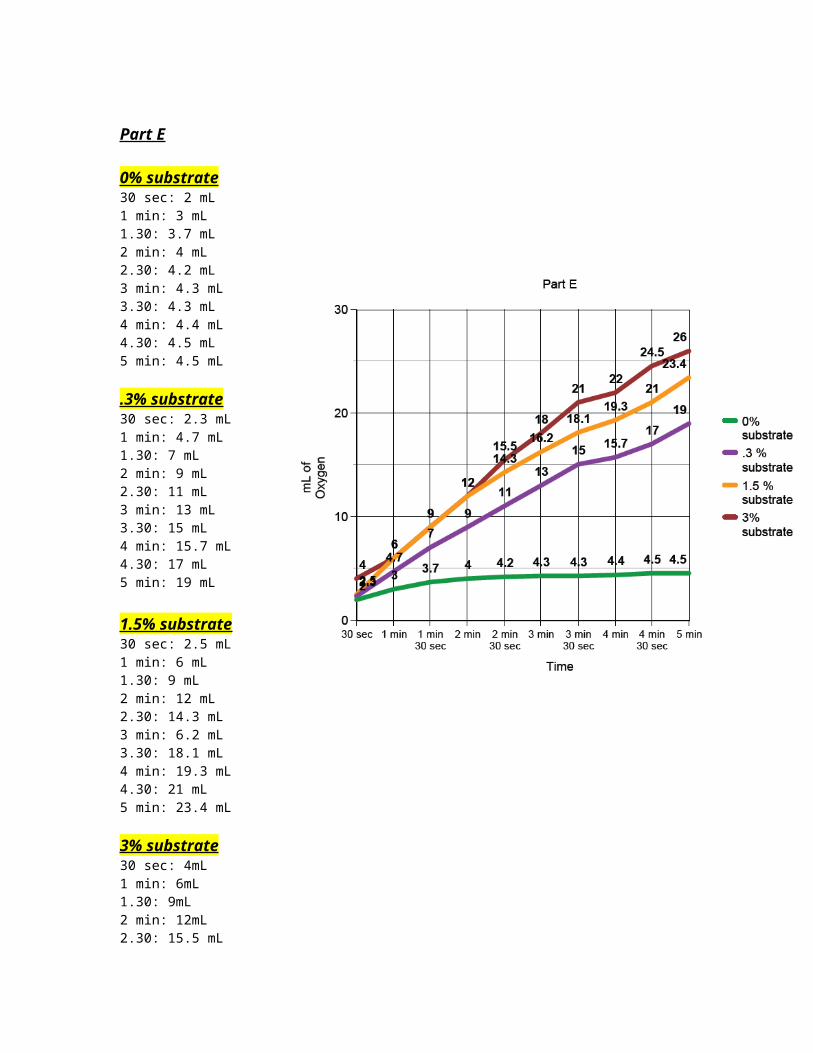
0% substrate30 sec: 2 mL1 min: 3 mL1.30: 3.7 mL2 min: 4 mL2.30: 4.2 mL3 min: 4.3 mL3.30: 4.3 mL4 min: 4.4 mL4.30: 4.5 mL5 min: 4.5 mL
.3% substrate30 sec: 2.3 mL1 min: 4.7 mL1.30: 7 mL2 min: 9 mL2.30: 11 mL3 min: 13 mL3.30: 15 mL4 min: 15.7 mL4.30: 17 mL5 min: 19 mL
1.5% substrate30 sec: 2.5 mL1 min: 6 mL1.30: 9 mL2 min: 12 mL2.30: 14.3 mL3 min: 6.2 mL3.30: 18.1 mL4 min: 19.3 mL4.30: 21 mL5 min: 23.4 mL
3% substrate30 sec: 4mL1 min: 6mL1.30: 9mL2 min: 12mL2.30: 15.5 mL3 min: 18 mL3.30: 21 mL4 min: 22 mL4.30: 24.5 mL5 min: 26 mL
Part F
10% NaCl
30 sec: 1mL
1 min: 1.5mL
1.30: 2mL
2 min: 2.1mL
2.30: 2.2 mL
3 min: 2.3 mL
3.30: 2.4 mL
4 min: 2.8 mL
4.30: 3.0 mL
5 min: 4 mL
2% NaCl
30 sec: 5mL
1 min: 8.5mL
1.30: 13.5mL
2 min: 17mL
2.30: 20 mL
3 min: 23 mL
3.30: 26 mL
4 min: 29 mL
4.30: 31 mL
5 min: 35 mL
0% NaCl
30 sec: 2.5 mL
1 min: 6 mL
1.30: 9 mL
2 min: 12 mL
2.30: 14.3 mL
3 min: 6.2 mL
3.30: 18.1 mL
4 min: 19.3 mL
4.30: 21 mL
5 min: 23.4 mL

Conclusion:
Part A)
The increase in the gas level or the amount of O2 evolved was 8 mL over the course of
five minutes.
The reaction rate, which is the change in gas level divided by the change in time for
this part of the laboratory and all future parts, is the control group for enzyme
concentration (100%), temperature (24°C), and substrate concentration (3.0%).
This part of the laboratory allows us to introduce environmental conditions, or
independent variables, in future parts and conclude how they affect the rate of enzyme
activity.
Part B)
For 100% enzyme concentration, the increase in the gas level or the amount of O2
evolved was 8 mL over the course of five minutes.
For 75% enzyme concentration, the increase in the gas level or the amount of O2
evolved was 6 mL over the course of five minutes.
For 50% enzyme concentration, the increase in the gas level or the amount of O2
evolved was 5 mL over the course of five minutes.
For 25% enzyme concentration, the increase in the gas level or the amount of O2
evolved was 2 mL over the course of five minutes.
The enzyme concentration is directly proportional to the rate of enzyme activity. In
layman’s terms, as the enzyme concentration increases, the rate of the enzyme activity
does as well.
Part C)
For the reaction at 24°C, the increase in the gas level or the amount of O2 evolved was
8 mL over the course of five minutes.
For the reaction at 5°C, the increase in the gas level or the amount of O2 evolved was 2
mL over the course of five minutes.
For the reaction at 37°C, the increase in the gas level or the amount of O2 evolved was
20 mL over the course of five minutes.
For the reaction at 100°C, the increase in the gas level or the amount of O2 evolved
was 2 mL over the course of five minutes.
There is no direct correlation between temperature and the rate of enzyme activity.
Ergo, the stock catalase solution (yeast) has an optimal temperature at which it
operates best. Based on the data, the optimal temperature must be somewhere in the
range of 37°C.
Part D)
For the reaction at the pH of 4, the increase in the gas level or the amount of O2
evolved was 10 mL over the course of five minutes.
For the reaction at the pH of 7, the increase in the gas level or the amount of O2
evolved was 8 mL over the course of five minutes.
For the reaction at the pH of 10, the increase in the gas level or the amount of O2
evolved was 5 mL over the course of five minutes.
The pH value is inversely proportional to the rate of enzyme activity. In layman’s
terms, as the pH value increases (more basic), the rate of enzyme activity decreases.
Keep in mind, however, that the full range of pH values was not tested. Therefore,
there may be no correlation between pH value and the rate of enzyme activity. Instead,
there could be an optimal pH value somewhere in the range of pH 4.
Part E)
For 3.0% substrate concentration, the increase in the gas level or the amount of O2
evolved was 8 mL over the course of five minutes.
For 0% substrate concentration, the increase in the gas level or the amount of O2
evolved was 0 mL over the course of five minutes. This was because there was no
substrate in the form of hydrogen peroxide to decompose into oxygen gas.
For 0.3% substrate concentration, the increase in the gas level or the amount of O2
evolved was 7 mL over the course of five minutes.
For 1.5% substrate concentration, the increase in the gas level or the amount of O2
evolved was 8 mL over the course of five minutes.
The substrate concentration is directly proportional to the rate of enzyme activity. In
layman’s terms, as the substrate concentration increases, the rate of enzyme activity
does as well.
However, the reaction rate for 1.5% substrate concentration and 3.0% substrate
concentration are equal because the total number of enzymes and active sites becomes

a limiting factor.
Part F)
For 10% NaCl concentration, the increase in the gas level or the amount of O2 evolved
was 3 mL over the course of five minutes.
For 2% NaCl concentration, the increase in the gas level or the amount of O2 evolved
was 9 mL over the course of five minutes.
For 0% NaCl concentration, the increase in the gas level or the amount of O2 evolved
was 10 mL over the course of five minutes.
The ionic concentration, or salinity, is inversely proportional to the rate of enzyme
activity. In layman’s terms, as the salinity increases, the rate of the enzyme activity
decreases.
Keep in mind, however, that the full range of salinities was not tested. Therefore, there
may be no correlation between salinity and the rate of enzyme activity. Moreover, the
reaction rate of 2% and 0% are very close to one another. There could be an optimal
salinity somewhere in the range of 0-2%.