eog annual report to...
TRANSCRIPT

2002E N E R G Y O P P O R T U N I T Y G R O W T H
E O G A n n u a l R e p o r t t o S h a r e h o l d e r s
333 Clay Street, Suite 4200
Houston, Texas 77002
P.O. Box 4362
Houston, Texas 77210–4362
(713) 651-7000
www.eogresources.com
EO
G R
es
ou
rce
s, In
c. 2
00
2 A
nn
ua
l Re
po
rt to S
ha
reh
old
ers

2002 Highlights
Financial and Operating Highlights
• EOG’s total reserves increased by 9percent to approximately 4.6 trillioncubic feet equivalent.
• From all sources, EOG replaced 193percent of production at a findingcost of $1.06 per thousand cubic feetequivalent (Mcfe). Reserve replace-ment in North America was 158percent with a total all-in findingcost of $1.42, down 10 percent from2001. From drilling alone, EOGreplaced 160 percent of productionat a finding cost of $1.17 per Mcfe.
• In Canada, EOG increased total pro-duction 23 percent and natural gasproduction 22 percent, compared to2001.
• In Trinidad, EOG announced theParula natural gas discovery, addedtwo new offshore exploration blocks,successfully started up the CNCAmmonia Plant and signed a 25-year extension on the offshore SECCBlock.
• For the eighth consecutive year,EOG reduced the number of sharesoutstanding. After repurchasing 0.7million shares of common stock, netof option exercises, stock plans andother increases, EOG had 114.4 mil-lion basic shares outstanding atDecember 31.
The Company
EOG Resources, Inc. (EOG) isone of the largest independent(non-integrated) oil and gascompanies in the United Statesand is the operator of substan-tial proved reserves in the U.S.,Canada and offshore Trinidad.EOG is listed on the New YorkStock Exchange and is tradedunder the ticker symbol“EOG.”
On the cover
What is EOG Resources? It isenergy. It is opportunity. It isgrowth. Representing our com-pany’s commitment to itsshareholders are Houston-basedemployees Senior ReservoirEngineer Toni Clifton-Woodand Chief Reservoir EngineerChuck Smith. Information regarding forward-looking statements is on page 19 of this annual
report to shareholders.
(In millions, except per share data, unless otherwise indicated) 2002 2001 2000Net Operating Revenues . . . . . . . . . . . . . . . . . . . . . . . . . . . . . . . . . . . . . . . . . . . . . $ 1,095 $ 1,655 $ 1,490Income Before Interest and Taxes . . . . . . . . . . . . . . . . . . . . . . . . . . . . . . . . . . . . . . . $ 179 $ 677 $ 695Net Income Available to Common . . . . . . . . . . . . . . . . . . . . . . . . . . . . . . . . . . . . . . $ 76 $ 388 $ 386Exploration and Development Expenditures* . . . . . . . . . . . . . . . . . . . . . . . . . . . . . $ 821 $ 1,113 $ 687
Wellhead StatisticsNatural Gas Volumes (MMcfd) . . . . . . . . . . . . . . . . . . . . . . . . . . . . . . . . . . . . . . 924 921 908Natural Gas Prices ($/Mcf) . . . . . . . . . . . . . . . . . . . . . . . . . . . . . . . . . . . . . . . . . $ 2.60 $ 3.81 $ 3.49Crude Oil and Condensate Volumes (MBbld) . . . . . . . . . . . . . . . . . . . . . . . . . . . 23.3 25.8 27.5Crude Oil and Condensate Prices ($/Bbl) . . . . . . . . . . . . . . . . . . . . . . . . . . . . . . $ 24.56 $ 24.83 $ 29.57Natural Gas Liquids Volumes (MBbld) . . . . . . . . . . . . . . . . . . . . . . . . . . . . . . . 3.7 4.0 4.7Natural Gas Liquids Prices ($/Bbl) . . . . . . . . . . . . . . . . . . . . . . . . . . . . . . . . . . . $ 14.05 $ 16.89 $ 19.87
NYSE Price Range ($/Share)High . . . . . . . . . . . . . . . . . . . . . . . . . . . . . . . . . . . . . . . . . . . . . . . . . . . . . . . . . . $ 44.15 $ 55.50 $ 56.69Low . . . . . . . . . . . . . . . . . . . . . . . . . . . . . . . . . . . . . . . . . . . . . . . . . . . . . . . . . . . $ 30.02 $ 25.80 $ 13.69Close . . . . . . . . . . . . . . . . . . . . . . . . . . . . . . . . . . . . . . . . . . . . . . . . . . . . . . . . . . $ 39.92 $ 39.11 $ 54.63
Cash Dividends Per Share . . . . . . . . . . . . . . . . . . . . . . . . . . . . . . . . . . . . . . . . . . . . . $ 0.160 $ 0.155 $ 0.135Average Shares Outstanding (Diluted) . . . . . . . . . . . . . . . . . . . . . . . . . . . . . . . . . . . 117.2 117.5 119.1Year-end Basic Shares Outstanding . . . . . . . . . . . . . . . . . . . . . . . . . . . . . . . . . . . . . . 114.4 115.1 116.8*Excludes Deferred Income Tax Gross Up of $15 million, $50 million and $23 million for 2002, 2001 and 2000, respectively.

1
OUR EMPLOYEES Latiff Abdool Gene Abernathy Ismael Abila Linda Abrego Rosie Abrego Maria Acevedo Linda Acosta Tammy Adair Ronnie Adams Mike Adrion Candy Aguilar Melissa AlbertBill Albrecht Joseph Alexander Raymond Allbee Ken Allen Cathy Anderson Joseph Anderson William Anderson Jim Anschutz Barb Anselm Rob Apperson Kerry Archibald Blaine Ardelian AlexArgueta Erick Armentrout Ralph Armentrout Bob Armstrong Don Armstrong Derek Arnold Paul Arnott Carlotta Audain Terry Avery Carmen Badeaux Lanny Baker Twila Baker Maire Baldwin JerryBall John Ball Jimmy Banks Valeria Banks Bijay Banthia Brian Baptiste Judy Barlow Kelley Barnett Emilio Barrera Tony Barrett Curt Bateman Carolyn Baughman Dale Bawol Ana BeasleyMichelle Beauchamp John Becker Barbara Belcher Olynda Bello Adriana Benavides Steven Bennett Steve Benoit Tim Berry Sandeep Bhakhri Jerry Biggs Blaine Bischoff Sidney Bjorlie JohnBlack Brad Blackwood Carolyn Bladek Melanie Blazek Dana Blevins Stan Blundell Ken Boedeker Susie Boedeker David Boerm Tim Boggess Wendy Bone Kelly Bonogofski Alisa Booth VeraBoren Stewart Bosch Tim Bosch James Bouillion Deidra Bourland David Bowdle Jamie Bowman Craig Bowthorpe Ben Boyd John Boyd Mary Bradford Diane Bradley Tom Bradley SharleenBrand-Vivanco Cheryl Brashear Jim Breimayer Sheila Bremer Judy Bretz Susan Bright Ann Brindle Rachel Britt Jolene Brittain Joan Broadley April Brockelmeyer Kim Brooks Michael BrooksBurt Broussard Crystal Brown Elizabeth Brown Glen Brown Jeff Brown Reynold Brown David Brunette Linda Bruster Steve Bryson Jim Bucci Kerry Burdett John Burnette Jamie Burns TinaBurns Cyndy Burris Doug Burt Laurie Burt Craig Burton Tim Butkus Debbie Butler Ken Byrd Travis Byrd Kim Cadena Bob Cahill Gary Cain Mark Cain Carol Cameron Howdy CameronMelany Cammaert Carleen Campbell Cathy Campbell Danny Canales Dave Canales Cee Cee Candler Joe Caputo John Cardin Santos Cardona Kristin Carlisle Charleen Carlos Katy Carlson
We’re the right company, in theright place, at the right time.
Now is the time for North American natural gas and now is the time for
EOG Resources. We’re the right company, in the right place, at the right time.
The North American supply of natural gas continues to decrease while demand for
fuel-efficient, clean burning natural gas is likely to grow. Our persistence and dis-
cipline in concentrating EOG’s exploration and development efforts largely on
North American natural gas are aligned to continue to help the United States
meet its energy needs.
On the supply side of the North American natural gas picture, we foresee a
‘perfect storm’ brewing: a disturbing, unprecedented convergence of market forces
related directly to the three longstanding bases in the North American natural gas
market grid — the U.S., Canada and Mexico. From 1994 through 2001, the U.S.
recorded flat natural gas production of approximately 52 billion cubic feet per day
(Bcfd), while natural gas demand increased to 62 Bcfd. In 2002, we estimate total
U.S. natural gas supply decreased 5 percent, the largest drop in 17 years. In 2003,
we estimate supply could fall another 1 to 3 percent to approximately 47.5 Bcfd.
In the past, natural gas from Canada provided a safety valve, flowing as
needed across the border to fill the 10 Bcfd gap. Those days may be gone, based
on steadily dwindling Canadian natural gas reserves and the increase in inherent
decline rates in mature basins. After reaching a peak in 2001, Canadian produc-
tion declined in 2002, the first time since 1986.
While Mexico was another source of U.S. supply in the past, it currently
imports 0.6 Bcfd of natural gas from the United States. By 2006, estimates pre-
dict that figure will increase to at least 1 Bcfd. This ‘perfect storm’ confluence of
events is expected to be a multi-year phenomenon that pushes natural gas prices
substantially higher than historic levels.
Drilling activity in North America has not yet responded to the recent
higher natural gas prices. Substantial new supplies of natural gas are not expected
to hit the U.S. market until 2007 at the earliest, when a Mackenzie Delta
pipeline from Canada is constructed, or relief is provided by increased liquified
natural gas (LNG) infrastructure and imports.
Mark G. PapaChairman and Chief Executive Officer
Edmund P. Segner, IIIPresident and Chief of Staff
L e t t e r t o S h a r e h o l d e r s

00 01 02
4,602
3,821
4,229
Trinidad
North America
We find natural gas and oil the old-fashioned way — throughdrilling and exploration.
Year-end Reserves (Bcfe)
Daily Natural GasProduction
(MMcfd)
L e t t e r t o S h a r e h o l d e r s
Skip Carnes Ronnie Carney Michelle Carpenter Jacqueline Carr-Brown Noemi Carrillo Bob Carroll Buz Carroll Glenn Carter Dee Cartwright Gary Cartwright Susan Carulli Nanci Cassard JesusCastillo Randall Cate Dennis Cates Janie Cervantes Paula Chaffin Rinu Chahal Kitty Chalfant Shelly Chan Bob Chancey Lewis Chandler Wade Chapman Linda Chenoweth Clara Chiew MyrissaChildress Helen Chin Michael Chong Bev Christensen Louise Clanton John Clark Julie Clay Tammy Clayton Toni Clifton-Wood Gene Clower Jeannie Cluiss April Colbert Ruby Cole CarolynColeman Jim Coleman Steve Coleman Robert Coles Gerald Colley Chuck Colson Christian Combs Traci Conner Paul Connolly Barry Constable Duane Cook Karen Cook Mike Cooksey TylerCoon Lisa Copeland Jo Anne Coppell Neal Cormier Roy Coston Stephen Couch David Covill Jo-ann Cowan Betty Cowart Kim Cowherd Mark Cox Jack Cozart Hal Crabb Logan Craig LisaCraigwell Garth Cramer Bette Cranford Matt Cranmore Nora Crawford Wayland Crawley Steve Crim Paul Cross Barry Crowder Chip Croy Steve Croy Herminia Cruz Don Culpepper ValerieCulpepper Ferdinand Cumberbatch James Cunkelman Peter Cunningham Pamela Currey Louis D'Abadie Diana Dabiedeen Jeff Dahl Lee Dailey Don Daisher Fassil Daniel Robert Daniels CarolDanver Leandro Daponte Judy Dargin Roger Dart Bryan David Bob Davis Don Davis Randall Davis Warren Davis Richard Day Lisa De La Garza Victor De Los Santos David Deal Tessa DeanMelanie Dechert Alma Dehoyos Howard Deis Gloria Del Campo James Del Campo Joseph Del Campo Chris Delcambre Brenda Dellinger Phil Delozier Marie Deslattes Ronald Devoll Curtis DillTrudy Dillon Mark Dixon Amy Dodd Kurt Doerr Danny Domingue Manuel Dominguez Kathy Donaldson Daryl Doodnath Timothy Dort Loretta Doyle Patrick Draves Tim Driggers Denis DufresneCindy Duge Jim Dunford Lane Dunham Kenneth Dunn George Dupre Brian Durman Rick Ealand Louise Earl Karen Ebbert Madeline Edgley Pat Edwards Scott Einerson Cynthia Einkauf
Demand for natural gas, on the other hand, has remained strong. Thus, from
a producer’s perspective, the North American natural gas market is the ‘sweet
spot’ of the entire worldwide energy picture. This reinforces EOG’s belief that
North America is an excellent place to be positioned for the foreseeable future.
Consistency remains our catchphrase
EOG’s business and operations strategy for 2003 and beyond is consistent with
the game plan we have reiterated in prior years. We are heavily weighted
toward North American natural gas, which currently represents 73 percent of
our total production.
We find natural gas and oil the old-fashioned way — through drilling and
exploration.
With our consistent ‘growth through the drillbit’ strategy, we have created a
‘prospect generating franchise’ — a bright, dedicated workforce whose passion is
finding new reserves of natural gas and oil. We continue to add to EOG’s talent
pool, attracting more exceptional men and women to work in the nine decentral-
ized divisions. From time to time, EOG makes tactical acquisitions but has gen-
erally steered away from the purchase of large concentrations of reserves through
major mergers and acquisitions. In 2002, EOG was the fifth most active U.S.
driller and the third most active driller in Canada.
One of the primary growth drivers of natural gas in prior years and again in
2002 was our ongoing shallow natural gas program in Canada. EOG drilled
approximately 1,100 wells in 2002 and the goal in 2003 is to repeat a high level
of activity with the same level of success.
Noteworthy in EOG’s Corpus Christi Division was a 16,000-foot discovery
in the Wilcox Trend that hit a December 2002 exit rate of over 40 million cubic
feet per day (MMcfd), net. EOG also scored several discoveries in the Roleta
Trend. Additionally, EOG achieved significant recent success in the Frio Trend,
where we expect to drill 20 to 30 wells in 2003. In West Texas, EOG holds a
majority interest in a sizeable horizontal Devonian play where a typical well,
00 01 02
924908 921
2

Jerome Ellard Terrence Elliot Ed Elliott Robert Ellis Dirk Ellyson Bill Elmer Jerry Elmlinger Karen Erwin Marc Eschenburg Sandra Estrada Erica Eusek Betty Evans Beverly Fabian Clyde FaggettRoger Falk Mike Fauber Carol Faullon Melanie Fehr Lanny Fenwick Grant Fergeson Len Ferguson Olga Ferrell Marilyn Fish Doug Fiske James Fletcher Cris Flores Dan Flores Jim Folcik GraceFord Larry Formo Terry Foster John Fowler Lonnie Fox Mike Francis Lydia Franco Chris Frank Bill Fraser Danny Frederick Joe Freeman Reggie Freestone Judy Frey Bonnie Friesenhahn DavidFrye Laura Fuentes Barbara Ganong Paul Garber Agustin Garcia Maria Garcia Vic Garcia Michael Gardner Bob Garrison Rich Gauthier Debra Gay Mark Gazette Maria Geerligs Zola GeorgeJohn Gibson Owen Gibson Vic Gilliam Melissa Gillispie David Gilmore David Godsey Paco Gomez Rosa Gonzalez Jo Beth Goodrum Jeff Gordon Casey Gordy Mark Gorski Vickie Graham PatGranger Bonnie Grant Anne Grau Carl Gray Dortha Gray Katherine Gray Eldon Greanya Jayne Green Ruth Green Norma Greenlee Jim Gregory Julie Grey Dana Griffin Murray Grigg LarryGross Nick Groves Joey Guerrero John Guillot Shelly Gummelt Emelia Guzman Laura Guzman Lea Hain Kent Hale Lisa Hale Morris Hall Bob Halverson Teri Halverson Lee Hampton DebbieHamre Susan Hanselman Chris Hansen Kenneth Hansen Andrew Hanson Kevin Hanzel Ricky Hardaway Allen Harp Dorothy Harris Jamie Harris Joe Harris Kristi Harris Anthony Hartley LanceHartwell Mark Hately Michele Hatz Gina Hauck Darcy Hawkins Chris Hawley Gordon Haycraft Mike Heil Billy Helms Jennifer Henderson Bryan Hendricks Bryan Hennigan Carla Henry DanHenry David Henry Jim Henry Eddie Hernandez Irene Herrera Steve Hertig Paul Herzing Jim Hewlett Luigi Heydt Tom Heydt Debbye Hibler Vicki Hietpas Lee Hileman Karen Hill RandyHill Theresa Hilliard Rene Hillman Steve Himes Linda Hoagland Chris Hoefer Deanna Hoffman Myron Hoffman Helen Hosein-Mulloon Glenn Howard Stephen Howell Bill Howells Andy Hoyle
Natural gas is the focal point of
EOG’s energy. Anchored in almost
every major North American
producing area, EOG consistently
builds on its reserve base through
the expertise of employees like
Corpus Christi Division Project
Landman Ron Morgan (foreground),
Project Production Engineer Dan
Flores and Division Geophysical
Specialist Rob Apperson.
energy
3

EOG’s passion for clean, simplefinancials has not changed.
L e t t e r t o S h a r e h o l d e r s
Donna Hradil Frank Hudec John Hudec Brandy Hudson Wan-Hsiang Hung Barry Hunsaker Jackie Hunt Karole Hunt Mike Huntington Ray Ingle Kathleen Insley Mike Isaacs Liz Ivers DianaJablonski Bubba Jackson Ken Jackson Melinda Jackson Ronnie Jackson Camille Jacobs George James Ann Janssen Darryl Janssen Kelli Jarrell Gayle Jenkins Willie Jenkins Lisa Jensen TerriJimenez Craig Jobe Joyce John Bruce Johnson Deborah Johnson Donna Johnson Jo Johnson Rick Johnson John Johnston Pat Johnston Vickie Jolley Calvert Jones Dennis Jones Gregg JonesMatt Jones Sherry Jones Dorothy Jordan Doug Jordan Jon Jorgenson Ricky Joyce Julie Judkins Sheri Jurecek Teresa Kaplan Terry Karka Srinivasulu Karnati Chip Keddie Steve Keenan ThomasKeetley Brenda Keith Ted Kelly Howard Kemp Tammy Kennedy Will Kennedy Brad Kent Sara Kerley Mphatso Khoza Bob Kidney Richard King Rick King Colin Kinniburgh Tim Kirksey DeniseKlatt Gayle Kleinschmidt Ron Knippa Suzanne Koch Dave Kocian Anthony Koester Rosa Korpi Saul Korrodi Joseph Kozeal Nancy Krahn Lynn Krailo Mark Kraus Gene Krieger Anthony KrupaAlbert Kucharski Shrut Kumar Chuck Kunze Sharon Kurzy C.B. Lackey Ernie LaFlure Renee Lagrone Andrew Lai Travis Lain Cori Lambert Joe Landry John Lang Rick Lanning Janice LaugheryJoan Laury Peggy Lavine Felicia Lawal Jill Lawhon Herman Lawson Lugard Layne Kim-Hue Le DonnaMarie Lee Bill Leflar Tom Lehman Loren Leiker Roy Lemasters Heath Lemon Brent LesyHerman Leung Randy Lewellen Julie Lewis Marianne Lewis Neil Lewis Jim Ligon Helen Lim Warren Lindland Steve Lipari Scott Listiak Milford Lockwood Curtis Lodhar Matt Long Rich LongRobert Long Wayne Long Lindy Looger David Looney Annel Lopez Jerome Lopez Robert Love Kathleen Loveday Gloria Loveless Al Luckow Jeanene Lueckemeyer Jennifer Luke PamelaMacDonald Marla Mallett-Davis Scott Mansor Don Manton Tony Maranto Ken Marbach Mara Marchesan Colleen Marples Heather Marshall Jake Marshall Debbie Martin Patricia Martin
the George Weir 14 No. 1H, initially flowed approximately 6 MMcfd of nat-
ural gas with 700 barrels per day of condensate. Eleven out of 12 Mesaverde
wells in the Denver Division proved successful, while in the Oklahoma City
Division, production increased from 65 to 85 MMcfd during 2002. Consist-
ent with our strategy, this was all through the drillbit.
Elsewhere, EOG’s Trinidad operations picked up tremendous momentum in
2002, turning into a dynamic, high growth rate operation. It is now set up for
long-term production increases at a favorable after-tax rate of return. Highlights
of the year include the Parula natural gas discovery with net reserves of 250 bil-
lion cubic feet equivalent (Bcfe) on the offshore SECC Block booked at year-end.
In addition, EOG’s license on the 78,000-acre SECC Block was extended 25
years to 2029. EOG was awarded two new offshore blocks: the 90,000-acre
Lower Reserve “L” and the 96,000-acre Modified U(b). EOG is supplying
approximately 50 MMcfd, net of natural gas to the CNC Ammonia Plant that
commenced operation in 2002. EOG expects to supply a second ammonia plant,
Nitro 2000, with approximately 50 MMcfd, net of natural gas. It is targeted to
come on line in 2005. Because natural gas is the primary feedstock in the pro-
duction of ammonia, Trinidad production may displace U.S. and Canadian
ammonia plant output that could shut down due to high feedstock costs. Along
with LNG, this creates a tie between the natural gas markets in North America
and Trinidad.
Since becoming a wholly independent company in 1999, EOG has consis-
tently posted excellent reserve results. For the three-year period 2000 through
2002, we averaged 182 percent reserve replacement at a worldwide finding cost
of $1.17 per Mcfe.
2002 performance sets the stage
Although a shadow blanketed corporate America with regard to earnings efficacy
in 2002, a major U.S. investment house rated EOG’s financials and reserve book-
ings as the most conservative in our peer group. EOG’s passion for clean, simple
financials has not changed. We have no goodwill on our balance sheet. We use
successful efforts accounting, the more conservative exploration and production
00 01 02
41%
38%
34%
Year-end Debt-to-Total Capitalization Ratio
4
00 01 02
193%
152%
201%
Reserve Replacement

Thelma Martin Sergio Martinez Tony Martinez Cathy Mathias Mark Mathias Beverly Matthews Dave May Jeff May Ron Mc Bee George Mc Bride Kenn Mc Comb Tom Mc Cray Vicki McAteerRobert McAuley Carol McBeath Marilyn McCall Jennifer McCarty Rick McCaslin Rhonda McCracken Karen McDaniel Jeff McDonald Roger McMannis Peyton McNeill Megan McWhorter DaveMeadows John Mears Scott Meeks John Melby David Men Dave Metzner Gail Meyer Tina Meyer Eloise Meza Kenneth Middlemiss Rudy Mikulec Toni Miller Steve Milligan Sheila Mirich KarenMitchell Chris Moffat Terence Mok Lisa Molinar Steve Molitor Tony Monariti Steve Montez Delores Montoya Judith Montoya Aramis Morales Jackie Morgan Ron Morgan Doug Morgareidge BillMorris Drew Morris Rick Morton Mike Moton Pat Moya Ed Mumford Linda Munoz Robert Munoz Daniel Murton Todd Neely Jimmy Nelson Shona Ness Adrian Neumann Kevin Newberry JohnNewman John Nicholas Mark Nicholson Richard Nies Xiaomei Ning Craig Noble Kathy Nobs Ben Nolan Joel Noronha Jack North Lori Nugent Tim Nugent Terry Nunn Martha Nutter Ali OblingerKolton Obritsch Dermot O'Connor Lori Odom John O'Donnell Julie Ogren Karen O'How Michelle Oliver Daniel Olson David O'Neill Carmen Oney D. Alexander Orr Jay Orr Richard Ott JackyOuin Ray Owsley Andrew Pakes David Palmer Debra Palmer Mark Papa Tracy Pape Sherry Parohl Theodore Parrish Curt Parsons Mike Partin Bill Pauly Brenda Payne Debrah Payne AnnettePearsall Richard Pedder Marc Pellow Paul Pendleton Rory Pendleton Katherine Perez Kim Perez Stacy Perez Dave Perkinson Sandy Perko Van Pete Joseph Peter Don Peters Jim PetersonRusty Petry Tim Petta Alan Pettibone Ken Pfau Dorothy Pflughaupt Alec Pham Georgia Phillips Sammy Pickering Silvestre Pineda Karen Pitman Donald Pitts Darcy Poncsak Kyla PorcheChad Pottruff Earnest Powell Ginny Powers Don Presenkowski Debbie Price John Price Susan Price Ralph Proksell Mike Pusley Mike Quinn Shawn Racca Daniel Ramirez Rudy Ramirez
For Project Reservoir Engineer Bob
Long, Project Landman Rob Weeks
and Geologist Shona Ness of EOG
Resources Canada, opportunity
means being in a position to make
things happen. To keep decision
making on a fast track for its
growth through the drillbit, EOG
operates in nine decentralized
divisions where the input of every
employee counts.
opportunity
5

EOG’s focus on performancenever wavers.
Mark G. Papa
Chairman and Chief Executive Officer
March 10, 2003
Edmund P. Segner, III
President and Chief of Staff
Year-end Basic SharesOutstanding (Millions)
L e t t e r t o S h a r e h o l d e r s
Ann Ramlochan Greg Ramsey Keith Rasmussen Rance Rasmussen Jim Redfearn Jean Reed Sherry Reese Tracy Reese Anna Reeves Kathy Reeves Derek Reiber Kelly Reiber Terry RekdalFreddy Rhodes Ron Richard Jerry Rietveld Cris Riley Jeffrey Risinger Earl Ritchie Roy Roach Wilbur Roane Lee Roark Dean Roberts Rita Robicheaux Bettie Robinson Lynita Robinson RobRobinson Samuel Robinson Dawn Rockel Elitha Rocke-Maharaj Jeanne Rodgers David Rolando Linda Romano Rodneia Roque Sarah Rotermann Pat Roufs Janelle Row Kelly Roy Ken RoySteve Ruiz Doug Runkel Paul Sacco David Saldivar Suzanne Saldivar Gina Salinas Linda Samford Inocente Sanchez Bobby Sanders Danny Sandifer Marikay Saranthus Raul Sarmiento MarkSaylor Jim Schaefer Brenda Schamehorn Rick Schatz Troy Schindler Jerry Schmaltz Brian Schmidt Gerald Schneider Shane Schneider Curtis Schoenfeld Jan Schroller Leann Schroller PaulSchuler Bobby Schultz Fred Schultz Alfreda Schulz Randy Schwab Mike Schween Kim Schwoerke Dee Scotka Andy Scott Marion Sczykutowicz Ed Segner Brian Sehn Mel Sehn Mark SennHector Serna Larry Seymour Gregory Shaffer Pam Shaffer Doug Sharp Carroll Shearer John Sheehan Don Shelden Ted Shell Sidney Shepperd Tracy Shipp Dale Short Mike Sickon JackieSides Jay Siebens Teena Simmons Chris Simon Cindy Simon Steve Sinclair Ria Singh Sallie Singleton Shiva Siragusano-Ramnarine Trent Skelton Robert Slavens Gary Slusher Joe SmathersLinda Smedlund Ace Smith Bobby Smith Bubba Smith Chuck Smith Gary Smith Shawn Smith Sheila Smith Steve Smith Cheryle Snow Janie Snyder Katherine Sohns Billie Sowle Debbie SparksDallas Spear Ansiem Spears Debbie Spears Mike Spears Woody Speer Jeff Spencer Nicholas Spencer Timmy Spradley Stephanie Spriggins Robert Springman Terrie Springman Rene St. PierreAlan Stacy Manny Staffero Jack Staley Randy Stanger Bridgett Staples Patti Steely Verna Stein Jason Steinkey Brenda Stephens Gertrude Sterling Rob Sterling Martha Sterner Carrie Stevens
accounting methodology. We have avoided the massive write-downs that the
industry has recorded. External reviews of EOG’s reserves have been within 5
percent of internal estimates for 15 consecutive years, according to the independ-
ent reserve engineering firm of DeGolyer and MacNaughton. In addition, rela-
tive to the industry, EOG has a low percentage of proved undeveloped reserves
on its books.
Also in 2002, EOG achieved full float stock liquidity after the last 10 per-
cent block held by a former shareholder was successfully placed in the market.
For the eighth consecutive year, EOG reduced its total outstanding share count,
from 115.1 million at year-end 2001 to 114.4 million at year-end 2002. EOG
has very strong debt coverage ratios, and compared with the industry, a conser-
vative year-end debt-to-total capitalization ratio of 40.6 percent. Because we
anticipated healthier prices in 2003, we purposely overspent cash flow in 2002.
This sets up EOG for operational success in 2003 and beyond.
For the three-year period, 2000 through 2002, EOG’s stock ranked number 14
among the best performers of the Standard & Poor’s 500. For the five-year period
1998 through 2002, EOG posted a 24.6 percent return on equity. EOG’s focus on
performance never wavers; our goal is to be a solid, responsible and profitable explo-
ration and production company with a consistent long-term strategy.
The best is yet to be
The creative talents, energies and enthusiasm of our 1,000-employee workforce
are in lockstep, right here, right now. With one of the most efficient and effective
organic growth machines in the business, EOG will continue to play a leadership
role in the industry, adding precious natural gas reserves efficiently and cost-
effectively, year-in, year-out.
00 01 02
114117 115
6
00 01 02
$687
$1,113
$821
Trinidad/International
North America
Exploration and DevelopmentExpenditures* (Millions)
* Excludes Deferred Income Tax GrossUp of $23 million, $50 million and$15 million for 2000, 2001 and 2002,respectively.

Phil Stevens Rod Steward Kent Stewart Ty Stillman Rex Stout Wade Stovin Hugh Stowe Cindy Stowell Jeff Strausser John Studt Sue Sule Dale Sunday Gary Superville David Swauger RichardSwimm Sundai Swinney Randy Szenasy Valarie Taber Dara Tatum Edward Taylor Heidi Taylor Jeane Taylor Ken Taylor Jim Terando Marty Thering Eileen Thoede Bill Thomas Gary Thomas KimThomas Melva Thomas Rita Thomas Wayne Thompson Mark Thorne Dewayne Tidwell Maryanne Tidwell Joe Tigner Gina Tobey Brent Tocher Brian Tompkins Kelly Tompkins Ola Tompkins CelerinoTorres Pat Tower Clarissia Towns Linda Tran Nico Tran Van Tran Steven Travis Marcus Trevino David Trice Jonell Trodlier Del Trolinder John Troschinetz Bella Trudel Linda Tucker Valerie TuittCameron Turnbull Linda Turner Lawrence Tuttle Zane Tymrick Steve Uchytil Tull Umphres Sherry Upton Vance Utri David Vague Brian Valencia Mike Van Horn Cindy Van Ranken Mike VargoMartha Varice Terry Vaughn Evelyn Vauthier Jennifer Vega Emiliano Vela Mark Verhoeve Cheryl Vierling Larry Vinson Tim Vogler Prody Vong Bruce Voshall George Vouronikas Dallas WagnerStan Wagner Dennis Wagstaff Roger Wainwright Deborah Wakeford Mike Walden Paula Waldo Amanda Walker Wanda Walls Joseph Walthall Debbie Walther Cynthia Walton Charlie WamplerMartin Wang Allan Wanner Laura Wardlaw Travis Wardlaw Fred Warren Alan Watkins Melvin Watson Steve Weatherl George Weber Robert Weeks KC Weiland Tyson Weinberger Mike Welch BillWeldon Kathy Wells Ron Wells Donald Wendland Steve Wentworth Jeff Wenz Kari Wenz Gary West Robert West James Whaley Kathleen Wharton Bill Wheaton Mike White Steve White JeffWhitehair Alison Whiteley Don Whitmer John Wilkins Nancy Wilkins Cheryl Williams Steve Williams Alicia Wilson Bob Wilson Chris Wilson Dan Wilson Danny Wilson Leila Wilson Rick Wilson EdWinget Sharron Winter Pat Woods Lloyd Woychuk Dave Wright Dave Wright Angela Wysocki Theresa Wysocki Angie Young Craig Young Cissy Yu Angela Yule Jeff Zawila Craig Zempel Barry Zinz
Growth reflects EOG’s penchant for
new ideas, synergies and efficiency.
In 2002, EOG Resources Trinidad
recorded exciting growth in its
offshore operation thanks to the
determination of employees like
Petroleum Engineer Ann Ramlochan
and Exploration Supervisor Brian
Baptiste, who is showing seismic
data to Finance and Administration
Supervisor Jerome Lopez.
growth
7

★
Deep Basin
Shallow Gas Trend
Greater Green River Basin
Uintah Basin
San JoaquinBasin
MorrowAtokaStrawn
Bone Springs MidlandBasin
Lobo/RoletaTrend
WilcoxTrend
DevonianTrend
Sabine Uplift
Offshore Gulfof Mexico
FrioTrend
Mid-Continent
Calgary
Denver
Oklahoma City
MidlandTyler
CorpusChristi
Houston
Denver DivisionOklahoma City
Division
Canada
MidlandDivision
CorpusChristi
Division
OffshoreDivision
TylerDivision
8

9
MississippiSalt Basin
Appalachia
Port of Spain
Pittsburgh
EOG Operations
Canada
• 2002 Production: 170.9 (MMcfed)
• 2002 Reserves: 820.9 (Bcfe)
Corpus Christi Division
• 2002 Production: 169.5 (MMcfed)
• 2002 Reserves: 341.0 (Bcfe)
Denver Division
• 2002 Production: 159.9 (MMcfed)
• 2002 Reserves: 707.0 (Bcfe)
Midland Division
• 2002 Production: 132.9 (MMcfed)
• 2002 Reserves: 445.7 (Bcfe)
Offshore Division
• 2002 Production: 69.8 (MMcfed)
• 2002 Reserves: 95.0 (Bcfe)
Oklahoma City Division
• 2002 Production: 83.4 (MMcfed)
• 2002 Reserves: 205.6 (Bcfe)
Pittsburgh Division
• 2002 Production: 20.8 (MMcfed)
• 2002 Reserves: 222.1 (Bcfe)
Tyler Division
• 2002 Production: 128.9 (MMcfed)
• 2002 Reserves: 369.9 (Bcfe)
Trinidad
• 2002 Production: 149.5 (MMcfed)
• 2002 Reserves: 1,394.7 (Bcfe)
Legend
Areas of Operation
Division Lines
Division Headquarters
Corporate Headquarters★
Pittsburgh Division
Trinidad

10
Management’s Discussion and Analysis of Financial Conditionand Results of Operations 11
Reports of Independent Public Accountants 20
Management’s Responsibility for Financial Reporting 21
Consolidated Statements of Income and Comprehensive Incomefor the years ended December 31, 2002, 2001 and 2000 22
Consolidated Balance Sheets, December 31, 2002 and 2001 23
Consolidated Statements of Shareholders’ Equity for the years ended December 31, 2002, 2001 and 2000 24
Consolidated Statements of Cash Flows for the years ended December 31, 2002, 2001 and 2000 25
Notes to Consolidated Financial Statements 26
Supplemental Information to Consolidated Financial Statements 39
Financial Review

The following review of operations for each of the three yearsin the period ended December 31, 2002 should be read inconjunction with the consolidated financial statements ofEOG Resources, Inc. (EOG) and notes thereto beginningwith page 22.
Results of OperationsNet Operating Revenues. Wellhead volume and price statis-tics for the specified years were as follows:
Year Ended December 31,2002 2001 2000
Natural Gas Volumes (MMcf per day)
United States . . . . . . . . 635 680 654Canada . . . . . . . . . . . . . 154 126 129Trinidad . . . . . . . . . . . . 135 115 125
Total . . . . . . . . . . . . 924 921 908Average Natural Gas Prices
($/Mcf)United States . . . . . . . . $ 2.89 $ 4.26 $ 3.96Canada . . . . . . . . . . . . . 2.67 3.78 3.33Trinidad . . . . . . . . . . . . 1.20 1.22 1.17
Composite . . . . . . . . 2.60 3.81 3.49Crude Oil and Condensate
Volumes (MBbl per day)United States . . . . . . . . 18.8 22.0 22.8Canada . . . . . . . . . . . . . 2.1 1.7 2.1Trinidad . . . . . . . . . . . . 2.4 2.1 2.6
Total . . . . . . . . . . . . 23.3 25.8 27.5Average Crude Oil and
Condensate Prices ($/Bbl)United States . . . . . . . . $ 24.79 $25.06 $29.68Canada . . . . . . . . . . . . . 23.62 22.70 27.76Trinidad . . . . . . . . . . . . 23.58 24.14 30.14
Composite . . . . . . . . 24.56 24.83 29.57Natural Gas Liquids Volumes
(MBbl per day)United States . . . . . . . . 2.9 3.5 4.0Canada . . . . . . . . . . . . . 0.8 0.5 0.7
Total . . . . . . . . . . . . 3.7 4.0 4.7Average Natural Gas Liquids
Prices ($/Bbl)United States . . . . . . . . $ 14.76 $17.17 $20.45Canada . . . . . . . . . . . . . 11.17 15.05 16.75
Composite . . . . . . . . 14.05 16.89 19.87
Management’s Discussion and Analysis of Financial Condition andResults of Operations
Year Ended December 31,2002 2001 2000
Natural Gas Equivalent Volumes (MMcfe per day)
United States . . . . . . . . 765 833 814Canada . . . . . . . . . . . . 171 139 146Trinidad . . . . . . . . . . . 150 128 141
Total . . . . . . . . . . . . 1,086 1,100 1,101
Total Bcfe Deliveries . . . . 396 401 403
2002 compared to 2001. During 2002, net operating revenuesdecreased $560 million to $1,095 million. Total wellhead rev-enues of $1,105 million decreased by $435 million, or 28%,as compared to 2001.
Wellhead natural gas revenues for 2002 decreased approx-imately $405 million primarily due to a general decline inaverage wellhead natural gas prices, partially offset by anincrease in natural gas deliveries in Canada and Trinidad. Theaverage wellhead price for natural gas decreased 32% to $2.60per Mcf for the year 2002 compared to $3.81 per Mcf in 2001.
Natural gas deliveries increased slightly to 924 MMcf perday for the year of 2002 compared to 921 MMcf per day for thecomparable period a year ago. The overall increase in naturalgas deliveries was due to an increase in Canada of 22% to 154MMcf per day in 2002 and an increase in Trinidad of 17% to135 MMcf per day in 2002. The higher production in 2002was attributable to drilling activities and strategic propertyacquisitions in Canada, and the commencement of productionfrom the U(a) Block in Trinidad. This increase was partiallyoffset by the overall decrease in production in the UnitedStates Divisions of 7% or 45 MMcf per day.
Wellhead crude oil and condensate revenues decreasedapproximately $25 million, due primarily to a decline indomestic crude oil and condensate deliveries with essentiallyflat wellhead crude oil and condensate prices. The averagewellhead crude oil and condensate price for 2002 was $24.56per barrel compared to $24.83 per barrel for 2001.
Crude oil and condensate deliveries decreased 10% to 23.3MBbl per day for the year of 2002 compared to 25.8 MBbl perday in 2001. The decrease in volumes was primarily due todecreased crude oil and condensate production in the Offshore,Midland and Tyler Divisions as a result of a natural decline inproduction. This natural decline in production was partiallyoffset by increased production in Trinidad due to the com-mencement of production from the U(a) Block, and drillingactivities and strategic property acquisitions in Canada.
2 0 0 2 A N N U A L R E P O R T T O S H A R E H O L D E R S 11

E O G R E S O U R C E S , I N C .12 E O G R E S O U R C E S , I N C .
Natural gas liquids revenues were $6 million lower thana year ago primarily due to a decrease in prices of 17% and adecrease in deliveries of 8%.
During 2002, EOG recognized losses on mark-to-marketcommodity derivative contracts of $49 million, of which $23million were realized losses.
Other marketing activities associated with sales and pur-chases of natural gas transactions increased net operating rev-enues by $37 million and $16 million in 2002 and 2001,respectively.2001 compared to 2000. During 2001, net operating revenuesincreased $165 million to $1,655 million. Total wellhead rev-enues of $1,540 million increased by $49 million, or 3%, ascompared to 2000.
Average wellhead natural gas prices for 2001 were approx-imately 9% higher than the comparable period in 2000,increasing net operating revenues by $110 million. Averagewellhead crude oil and condensate prices were 16% lower,decreasing net operating revenues by $45 million. NorthAmerica wellhead natural gas deliveries were approximately3% higher than the comparable period in 2000. The increase involumes was primarily due to increased production in theMidland and Pittsburgh Divisions, partially offset by decreasedproduction in the Denver and Corpus Christi Divisions and theimplementation of a production moderation strategy in latethird quarter. Combined with reduced production in Trinidad,the overall natural gas production was 1% higher than thecomparable period in 2000, increasing net operating revenuesby $14 million. Wellhead crude oil and condensate volumeswere 6% lower than in 2000, decreasing net operating revenuesby $20 million. The decrease in wellhead crude oil and con-densate volumes is primarily due to decreased deliveries world-wide. Natural gas liquids prices and deliveries were bothapproximately 15% lower than 2000, decreasing net operatingrevenues by $4 million and $5 million, respectively.
During 2001, EOG recognized mark-to-market gains oncommodity contracts of $98 million, of which $62 millionwere realized gains.
Gains on sales of reserves and related assets and other, nettotaled a gain of $1 million during 2001 compared to a gainof $9 million in 2000. The difference is due primarily to a $7 million gain on sales of certain North America propertiesin 2000.
Other marketing activities associated with sales and pur-chases of natural gas transactions increased net operating rev-enues by $16 million during 2001, compared to a $10 millionreduction in 2000.
Operating Expenses2002 compared to 2001. During 2002, operating expenses of$914 million were approximately $66 million lower than the$980 million incurred in 2001.
Dry hole costs of $47 million decreased $25 million from2001.
Taxes other than income decreased $23 million to $72million as compared to 2001 due to decreased wellhead rev-enue in North America resulting in lower production taxesand decreased ad valorem taxes.
Impairments decreased $11 million to $68 million pri-marily as a result of an improved value-to-cost relationship ona field by field basis and decreased amortization of unprovedleases in 2002.
Exploration costs of $60 million were $7 million lowerthan a year ago primarily due to decreased geological and geo-science expenditures.
Lease and well expenses increased $4 million to $179 mil-lion compared to a year ago primarily due to continuallyexpanding operations and increases in production activity inCanada, partially offset by a fewer number of workovers in theOffshore Division.
Depreciation, depletion and amortization (“DD&A”)expenses increased $6 million to $398 million primarily dueto increased activity in Canada and the Pittsburgh Divisionalong with higher per unit costs related to certain fields in theDenver Division, partially offset by a natural productiondecline in the Midland, Oklahoma City, Tyler and OffshoreDivisions.
General and administrative (“G&A”) expenses increased$9 million to $89 million primarily due to the settlement oflitigation in the second quarter, increased insurance expenseand expanded operations.Interest Expense. The increase in net interest expense of $15million for 2002 as compared to 2001 is primarily due tohigher average debt balance for the year of 2002 (see Note 2 tothe Consolidated Financial Statements) and the one-timeclose-out fees associated with the completion of the Section 29(Tight Gas Sands Federal Income Tax Credits) financing begunin 1999.Per-Unit Costs. The following table presents the operatingcosts per Mcfe for years ended December 31, 2002 and 2001:
Year Ended December 31,2002 2001
Lease and Well . . . . . . . . . . . . . . . $ 0.45 $ 0.44
DD&A . . . . . . . . . . . . . . . . . . . . . 1.00 0.98
G&A . . . . . . . . . . . . . . . . . . . . . . . 0.22 0.20
Taxes Other than Income . . . . . . . 0.18 0.24
Interest Expense . . . . . . . . . . . . . . 0.15 0.11
Total Per-Unit Costs . . . . . . . . $ 2.00 $ 1.97

2 0 0 2 A N N U A L R E P O R T T O S H A R E H O L D E R S 13
The lower per-unit rate of taxes other than income for 2002compared to 2001 is due primarily to decreased average well-head natural gas prices.
The higher per-unit G&A and interest expense rates for2002 compared to 2001 are due to reasons delineated in theabove G&A and interest expense discussions.Income Taxes. Income tax provision decreased approximately$200 million for 2002 as compared to 2001 primarily as aresult of a lower pre-tax income in 2002 and a reduction in theoverall foreign effective tax rate.2001 compared to 2000. During 2001, operating expenses of$980 million, which includes $19 million of charges related tothe bankruptcy of Enron and certain of its affiliates, wereapproximately $187 million higher than the $793 millionincurred in 2000.
Lease and well expenses increased $35 million to $175million primarily due to higher production costs, continuallyexpanding operations and increases in production activity inNorth America. Exploration expenses of $67 million remainedessentially flat compared to 2000. Dry hole expenses of $71million increased $54 million from 2000. Impairmentsincreased $33 million to $79 million primarily as a result ofwrite-down of assets in the United States. DD&A expensesincreased $33 million to $392 million primarily due toincreased DD&A rates. G&A expenses increased $13 millionprimarily due to expanded operations. Taxes other than incomeremained approximately the same as compared to 2000.
Total operating costs per unit of production, whichinclude lease and well, DD&A, G&A, taxes other than incomeand interest expense, increased 9% to $1.97 per Mcfe in 2001from $1.80 in 2000. This increase is primarily due to higherper-unit rates of lease and well, DD&A and G&A expenses,partially offset by a lower per-unit rate of interest expense.
During the fourth quarter of 2001, EOG recorded chargesassociated with the Enron bankruptcies of $19 million, ofwhich $17 million were related to 2001 and 2002 natural gasand oil derivative contracts.Interest Expense. The decrease in net interest expense of $16million for 2001 as compared to 2000 is primarily due tolower long-term debt levels during the year.
Capital Resources and LiquidityCash Flow. The primary sources of cash for EOG during thethree-year period ended December 31, 2002 included cashgenerated from operations, proceeds from the sales of selectedoil and gas reserves and related assets, funds from new bor-rowings and proceeds from stock options exercised. Primarycash outflows included funds used in operations, explorationand development expenditures, common stock repurchasesand dividends paid to EOG shareholders.
Net operating cash flows of $669 million in 2002decreased approximately $529 million as compared to 2001primarily due to lower average natural gas and liquids prices,
partially offset by lower cash operating expenses and lowercurrent income taxes. Changes in working capital and otherliabilities decreased operating cash flows by $145 million ascompared to 2001 primarily due to changes in accounts receiv-able, accrued royalties payable and accrued production taxescaused by fluctuation of commodity prices at each yearend.
Net investing cash outflows of $873 million in 2002decreased by $216 million as compared to 2001 due primari-ly to decreased exploration and development expenditures of$292 million (including producing property acquisitions),partially offset by increased uses of working capital related toinvesting activities and increased equity investments. Changesin components of working capital associated with investingactivities included changes in accounts payable associated withthe accrual of exploration and development expenditures andchanges in inventories which represent materials and equip-ment used in drilling and related activities.
Cash provided by financing activities in 2002 was $211million as compared to cash used of $127 million in 2001.Financing activities in 2002 included funds from new borrow-ings of $289 million, common stock repurchases of $63 million,dividend payments of $29 million and proceeds from stockoptions exercised of $17 million. New borrowings included$120 million of commercial paper borrowings and $250 millionof promissory note issuances, partially offset by a decrease inuncommitted line of credit borrowings of $81 million.
Net operating cash flows of $1,197 million in 2001increased approximately $230 million as compared to 2000primarily due to higher net operating revenues resulting fromhigher natural gas prices, net of increased cash operatingexpenses, and lower current income taxes, partially offset by alower tax benefit from stock options exercised. Changes inworking capital and other liabilities increased operating cashflows by $75 million as compared to 2000 primarily due tochanges in accounts receivable, accrued royalties payable andaccrued production taxes caused by fluctuation of commodityprices at each yearend. Net investing cash outflows of $1,088million in 2001 increased by $421 million as compared to2000 due primarily to increased exploration and developmentexpenditures of $426 million (including producing propertyacquisitions) and decreased proceeds from sales of reserves andrelated assets, partially offset by decreased equity investments.Changes in components of working capital associated withinvesting activities included changes in accounts payable asso-ciated with the accrual of exploration and development expen-ditures and changes in inventories which represent materialsand equipment used in drilling and related activities. Cashused in financing activities in 2001 was $127 million as com-pared to $305 million in 2000. Financing activities in 2001included repayments of debt of $4 million, common stockrepurchases of $127 million and dividend payments of $29million, partially offset by proceeds from stock options exer-cised of $31 million.

Actual Budgeted 2003Expenditure Category (In Millions) 2002 2001 2000 (excluding acquisitions)Capital
Drilling and Facilities . . . . . . . . . . . . . . . . . . . . . . . . . . . . . . . . . $ 595 $ 722 $ 443Leasehold Acquisitions. . . . . . . . . . . . . . . . . . . . . . . . . . . . . . . . . 39 76 51Producing Property Acquisitions . . . . . . . . . . . . . . . . . . . . . . . . . 71 168 102Capitalized Interest . . . . . . . . . . . . . . . . . . . . . . . . . . . . . . . . . . . 9 9 7
Subtotal . . . . . . . . . . . . . . . . . . . . . . . . . . . . . . . . . . . . . . . . . 714 975 603Exploration Costs . . . . . . . . . . . . . . . . . . . . . . . . . . . . . . . . . . . . . . . 60 67 67Dry Hole Costs . . . . . . . . . . . . . . . . . . . . . . . . . . . . . . . . . . . . . . . . . 47 71 17
Subtotal . . . . . . . . . . . . . . . . . . . . . . . . . . . . . . . . . . . . . . . . . 821 1,113 687 $800 - $950Deferred Income Tax Gross Up . . . . . . . . . . . . . . . . . . . . . . . . . . . . . 15 50 23
Total . . . . . . . . . . . . . . . . . . . . . . . . . . . . . . . . . . . . . . . . . . . . $ 836 $ 1,163 $ 710
E O G R E S O U R C E S , I N C .14
Exploration and Development Expenditures. The table below sets out components of exploration and development expendi-tures for the years ended December 31, 2002, 2001 and 2000, along with the total budgeted for 2003, excluding acquisitions:
Total exploration and development expenditures of $836 mil-lion decreased $327 million in 2002 as compared to 2001 pri-marily due to decreased exploration and development activi-ties in the United States and Trinidad along with fewer strate-gic property acquisitions, partially offset by increased explo-ration and development activities in Canada. Included in the2002 expenditures are $545 million in development, $196million in exploration, $71 million in property acquisition,$15 million in deferred income tax gross up and $9 million incapitalized interest.
Derivative Transactions. During 2002, EOG recognized loss-es on mark-to-market commodity derivative contracts of $49million, which included realized losses of $21 million and a $2million collar premium payment (see Note 11 to theConsolidated Financial Statements).
Presented below is a summary of EOG’s 2003 natural gasfinancial collar contracts and natural gas and crude oil finan-cial price swap contracts as of February 19, 2003. EOGaccounts for these collar and swap contracts using mark-to-market accounting.
Natural Gas Financial Collar Contracts Financial Price Swap ContractsFloor Price Ceiling Price Natural Gas Crude Oil
Weighted WeightedFloor Weighted Ceiling Weighted Average Average
Volume Range Average Range Average Volume Price Volume PriceMonth (MMBtud) ($/MMBtu) ($/MMBtu) ($/MMBtu) ($/MMBtu) (MMBtud) ($/MMBtu) (Bbld) ($/Bbl)
Jan 50,000 $3.87 $3.87 $6.09 $6.09 - - 2,000 $27.34Feb 125,000 3.76 - 4.30 4.04 5.05 - 6.30 5.87 - - 2,000 26.91Mar 125,000 3.61 - 4.20 3.93 5.00 - 6.20 5.77 100,000 $5.19 4,000 27.96Apr 125,000 3.59 - 4.02 3.82 4.80 - 6.03 5.33 100,000 4.96 5,000 27.77May 125,000 3.54 - 3.92 3.74 4.70 - 5.92 5.24 100,000 4.82 5,000 27.04Jun 125,000 3.56 - 3.89 3.74 4.70 - 5.90 5.25 100,000 4.77 5,000 26.43Jul 125,000 3.59 - 3.91 3.76 4.73 - 5.91 5.27 100,000 4.77 5,000 25.90
Aug 125,000 3.60 - 3.91 3.76 4.73 - 5.91 5.27 100,000 4.77 5,000 25.49Sep 125,000 3.60 - 3.89 3.75 4.73 - 5.89 5.26 100,000 4.74 5,000 25.19Oct 125,000 3.60 - 3.90 3.75 4.73 - 5.90 5.27 100,000 4.74 5,000 24.90Nov 125,000 3.77 - 4.04 3.90 4.90 - 6.04 5.43 - - 5,000 24.70Dec 125,000 3.92 - 4.18 4.04 5.05 - 6.18 5.57 - - 5,000 24.47

2 0 0 2 A N N U A L R E P O R T T O S H A R E H O L D E R S 15
2009 &Contractual Obligations (1) Total 2003 2004 - 2006 2007 - 2008 beyondLong-Term Debt . . . . . . . . . . . . . . . . . . . . . . . $1,145,132 $ - $ 511,180 $ 273,952 $ 360,000Non-cancelable Operating Leases . . . . . . . . . . . 38,581 11,083 22,755 3,783 960Drilling Rig Commitments . . . . . . . . . . . . . . . 1,470 1,470 - - -Transportation Service Commitments(2) . . . . . . . 37,065 9,255 18,533 5,988 3,289
Total Contractual Obligations. . . . . . . . . . . . . . $1,222,248 $ 21,808 $ 552,468 $ 283,723 $ 364,249
(1) See Notes 2 and 7 to Consolidated Financial Statements.
(2) Amounts shown are based on current transportation rates and foreign currency exchange rate at December 31, 2002. Management does not believe thatany future changes in these rates before the expiration dates of these commitments will have a materially adverse effect on the financial condition or resultsof operations of EOG.
Shelf Registration. During the third quarter of 2000, EOGfiled a shelf registration statement for the offer and sale fromtime to time of up to $600 million of EOG debt securities,preferred stock and/or common stock. The registration state-ment was declared effective by the Securities and ExchangeCommission on October 27, 2000. As of February 19, 2003,EOG had sold no securities pursuant to this shelf registration.When combined with the unused portion of a previously filedregistration statement declared effective in January 1998,these registration statements provide for the offer and salefrom time to time of EOG debt securities, preferred stockand/or common stock by EOG in an aggregate amount up to$688 million.Outlook. Natural gas prices historically have been volatile, andthis volatility is expected to continue. Uncertainty continuesto exist as to the direction of future North America natural gasand crude oil price trends, and there remains a rather widedivergence in the opinions held by some in the industry. Thisdivergence in opinion is caused by various factors includingthe current industrial recession and economic downturn,improvements in the technology used in drilling and com-pleting crude oil and natural gas wells, fluctuations in theavailability and utilization of natural gas storage capacity andever-changing weather patterns. However, the increasingrecognition of natural gas as a more environmentally friendlysource of energy could result in increases in demand. Beingprimarily a natural gas producer, EOG is more significantlyimpacted by changes in natural gas prices than by changes incrude oil and condensate prices.
Financing. EOG’s long-term debt-to-total-capitalization ratiowas 40.6% as of December 31, 2002 compared to 34.3% as ofDecember 31, 2001.
During 2002, total long-term debt increased to $1,145million primarily due to capital expenditures exceeding cashflow from operations (see Note 2 to the Consolidated FinancialStatements). The estimated fair value of EOG’s long-term debtat December 31, 2002 and 2001 was $1,225 million and $838
million, respectively, based upon quoted market prices and,where such prices were not available, upon interest rates cur-rently available to EOG at yearend. EOG’s debt is primarily atfixed interest rates. At December 31, 2002, a 1% decline ininterest rates would result in a $59 million increase in the esti-mated fair value of the fixed rate obligations (see Note 11 tothe Consolidated Financial Statements).
The following table summarizes EOG’s contractual obli-gations at December 31, 2002 (in thousands):
Marketing companies have played an important role inthe North American natural gas market. These companiesaggregate natural gas supplies through purchases from pro-ducers like EOG and then resell the gas to end users, local dis-tribution companies or other buyers. Several of the largest nat-ural gas marketing companies have recently filed for bank-ruptcy or are currently in financial difficulty, and others areexiting this business. EOG does not believe that this will havea material effect on its ability to market its natural gas pro-duction. EOG continues to assess and monitor the credit wor-thiness of partners to whom it sells its production and whereappropriate, to seek new markets.
EOG plans to continue to focus a substantial portion of itsexploration and development expenditures in its major pro-ducing areas in North America. However, in order to diversi-fy its overall asset portfolio and as a result of its overall successrealized in Trinidad, EOG anticipates expending a portion ofits available funds in the further development of opportunitiesoutside North America. In addition, EOG expects to conductlimited exploratory activity in other areas outside of NorthAmerica, including the United Kingdom North Sea, and willcontinue to evaluate the potential for involvement in otherexploitation type opportunities. Budgeted 2003 explorationand development expenditures, excluding acquisitions, are inthe range of $800 - $950 million, addressing the continuinguncertainty with regard to the future of the North Americanatural gas and crude oil and condensate price environment.Budgeted expenditures for 2003 are structured to maintainthe flexibility necessary under EOG’s strategy of funding

E O G R E S O U R C E S , I N C .16
North America exploration, exploitation, development andacquisition activities primarily from available internally gen-erated cash flow.
The level of exploration and development expendituresmay vary in 2003 and will vary in future periods depending onenergy market conditions and other related economic factors.Based upon existing economic and market conditions, EOGbelieves net operating cash flow and available financing alter-natives in 2003 will be sufficient to fund its net investing cashrequirements for the year. However, EOG has significant flex-ibility with respect to its financing alternatives and adjust-ment of its exploration, exploitation, development and acqui-sition expenditure plans if circumstances warrant. While EOGhas certain continuing commitments associated with expendi-ture plans related to operations in Trinidad, such commit-ments are not expected to be material when considered in rela-tion to the total financial capacity of EOG.Environmental Regulations. Various federal, state and locallaws and regulations covering the discharge of materials intothe environment, or otherwise relating to protection of theenvironment, may affect EOG’s operations and costs as a resultof their effect on natural gas and crude oil exploration,exploitation, development and production operations. In addi-tion, EOG has acquired certain oil and gas properties fromthird parties whose actions with respect to the managementand disposal or release of hydrocarbons or other wastes werenot under EOG’s control. Under environmental laws and reg-ulations, EOG could be required to remove or remediatewastes disposed of or released by prior owners or operators.EOG also has acquired or merged with companies that ownand operate oil and gas properties. Any obligations or liabili-ties of these companies under environmental laws would con-tinue as liabilities of the acquired company, or of EOG in theevent of a merger, even if the obligations or liabilities resultedfrom actions that took place before the acquisition or merger.Compliance with such laws and regulations has not had amaterial adverse effect on EOG’s operations or financial condi-tion. It is not anticipated, based on current laws and regula-tions, that EOG will be required in the near future to expendamounts that are material in relation to its total explorationand development expenditure program by reason of environ-mental laws and regulations. However, inasmuch as such lawsand regulations are frequently changed, EOG is unable to pre-dict the ultimate cost of compliance.
EOG also could incur costs related to the clean up of sitesto which it sent regulated substances for disposal and for dam-ages to natural resources or other claims related to releases of
regulated substances at such sites. In this regard, EOG hasbeen named as a potentially responsible party in certain pro-ceedings initiated pursuant to the ComprehensiveEnvironmental Response, Compensation, and Liability Actand may be named as a potentially responsible party in othersimilar proceedings in the future. It is not anticipated that thecosts incurred by EOG in connection with the presently pend-ing proceedings will, individually or in the aggregate, have amaterially adverse effect on the financial condition or results ofoperations of EOG.
Summary of Significant Accounting PoliciesPrinciples of Consolidation. The consolidated financial state-ments of EOG include the accounts of all domestic and foreignsubsidiaries. Investments in unconsolidated affiliates, in whichEOG is able to exercise significant influence, are accounted forusing the equity method. All material intercompany accountsand transactions have been eliminated.
The preparation of financial statements in conformitywith accounting principles generally accepted in the UnitedStates of America requires management to make estimates andassumptions that affect the reported amounts of assets and lia-bilities and disclosure of contingent assets and liabilities at thedate of the financial statements and the reported amounts ofrevenue and expenses during the reporting period. Actualresults could differ from those estimates.
Certain reclassifications have been made to prior periodfinancial statements to conform with the current presentation.Beginning 2001, the “Impairment of Unproved Oil and GasProperties” caption on the Consolidated Statements of Incomewas renamed “Impairments” to include the impairment oflong-lived assets as described in Statement of FinancialAccounting Standards (“SFAS”) No. 121-“Accounting for theImpairment of Long-Lived Assets and for Long-Lived Assets toBe Disposed of ” (“SFAS 121 Impairments”), as superseded bySFAS No. 144-“Accounting for the Impairment or Disposal ofLong-Lived Assets.” As a result, EOG reclassified all priorperiods to reflect such SFAS 121 Impairments in Impairments,instead of DD&A as previously reported. SFAS 121Impairments reclassified from DD&A to Impairments was $11million for 2000. Financial Instruments. EOG’s financial instruments consist ofcash and cash equivalents, marketable securities, accountsreceivable, accounts payable and long-term debt. The carryingvalues of cash and cash equivalents, marketable securities,accounts receivable and accounts payable approximate fairvalue (see Note 2 to the Consolidated Financial Statements forfair value of long-term debt).

2 0 0 2 A N N U A L R E P O R T T O S H A R E H O L D E R S 17
Cash and Cash Equivalents. EOG records as cash equivalentsall highly liquid short-term investments with original maturi-ties of three months or less. Oil and Gas Operations. EOG accounts for its natural gas andcrude oil exploration and production activities under the suc-cessful efforts method of accounting.
Oil and gas lease acquisition costs are capitalized whenincurred. Unproved properties with significant acquisitioncosts are assessed quarterly on a property-by-property basis,and any impairment in value is recognized. Unproved proper-ties with acquisition costs that are not individually significantare aggregated, and the portion of such costs estimated to benonproductive, based on historical experience, is amortizedover the average holding period. If the unproved properties aredetermined to be productive, the appropriate related costs aretransferred to proved oil and gas properties. Lease rentals areexpensed as incurred.
Oil and gas exploration costs, other than the costs ofdrilling exploratory wells, are charged to expense as incurred.The costs of drilling exploratory wells are capitalized pendingdetermination of whether they have discovered proved com-mercial reserves. If proved commercial reserves are not discov-ered, such drilling costs are expensed. Costs to develop provedreserves, including the costs of all development wells andrelated equipment used in the production of natural gas andcrude oil, are capitalized.
Depreciation, depletion and amortization of the cost ofproved oil and gas properties is calculated using the unit-of-production method. Estimated future dismantlement, restora-tion and abandonment costs (classified as long-term liabili-ties), net of salvage values, are taken into account. Certainother assets are depreciated on a straight-line basis.
Periodically, or when circumstances indicate that an assetmay be impaired, EOG compares expected undiscountedfuture cash flows at a producing field level to the unamortizedcapitalized cost of the asset. If the future undiscounted cashflows, based on EOG’s estimate of future crude oil and naturalgas prices and operating costs and anticipated production fromproved reserves, are lower than the unamortized capitalizedcost, the capitalized cost is reduced to fair value. Fair value iscalculated by discounting the future cash flows at an appro-priate risk-adjusted discount rate.
Inventories, consisting primarily of tubular goods andwell equipment held for use in the exploration for, and devel-opment and production of natural gas and crude oil reserves,are carried at cost with adjustments made from time to timeto recognize any reductions in value.
Natural gas and liquids revenues are recorded when pro-duction is delivered. Additionally, natural gas revenues arerecorded on the entitlement method based on EOG’s percent-
age ownership of current production. Each working interestowner in a well generally has the right to a specific percentageof production, although actual production sold may differfrom an owner’s ownership percentage. Under entitlementaccounting, a receivable is recorded when underproductionoccurs and a payable is recorded when overproduction occurs.New Accounting Pronouncements. In June 2001, theFinancial Accounting Standards Board (“FASB”) issued SFASNo. 143-“Accounting for Asset Retirement Obligations”effective for fiscal years beginning after June 15, 2002. SFASNo. 143 requires entities to record the fair value of a liabilityfor legal obligations associated with the retirement of tangiblelong-lived assets and the associated asset retirement costs. Thefair value of the liability is added to the carrying amount of theassociated asset and this additional carrying amount is depre-ciated over the life of the asset. Increase in the liability due topassage of time, as a result of applying an interest method ofallocation to the amount of the liability at the beginning of aperiod, is recognized as an increase in the carrying amount ofthe liability and as an expense classified as an operating itemin the statement of income. If the obligation is settled forother than the carrying amount of the liability, a gain or lossis recognized on settlement. EOG adopted the statement onJanuary 1, 2003. The impact of adopting the statement resultsin an after-tax loss of approximately $6.5 million which willbe reported as cumulative adjustment for change in account-ing principle in the first quarter of 2003.
In April 2002, the FASB issued SFAS No. 145-“Rescissionof FASB Statements No. 4, 44, and 64, Amendment of FASBStatement No. 13, and Technical Corrections” effective forfinancial statements issued on or after May 15, 2002. SFAS No.145 requires gains and losses on the extinguishment of debt tobe classified as income or loss from continuing operations,unless the requirements of Accounting Principles BoardOpinion (“APB Opinion”) No. 30-“Reporting the Results ofOperations - Reporting the effects of Disposal of a Segment ofa Business, and Extraordinary, Unusual and InfrequentlyOccurring Events and Transactions” are met, upon which thegain or loss would be considered unusual and infrequent andclassified as an extraordinary item. Prior to adoption of SFASNo. 145, all gains and losses from extinguishment of debt wereclassified as extraordinary items. SFAS No. 145 also createsconsistency between accounting for sale-leaseback transactionsand certain lease modifications with economic effects similar tosale-leaseback transactions, along with various amendmentswhich make technical corrections and clarifications. EOGadopted this statement on January 1, 2003. The adoption ofSFAS No. 145 did not have any effect on its financial positionor results of operations.

E O G R E S O U R C E S , I N C .18
In June 2002, the FASB issued SFAS No. 146-“Accounting for Costs Associated with Exit or DisposalActivities.” SFAS No. 146 nullifies the guidance of theEmerging Issues Task Force (EITF) Issue No. 94-3, “LiabilityRecognition for Certain Employee Termination Benefits andOther Costs to Exit an Activity (including Certain CostsIncurred in a Restructuring).” SFAS No. 146 requires that aliability for a cost associated with an exit or disposal activitybe recognized only when the liability is incurred and measuredinitially at fair value. SFAS No. 146 is effective for exit or dis-posal activities initiated after December 31, 2002. EOG doesnot expect the impact of SFAS No. 146 to have a materialeffect on its financial position or results of operations.
In October 2002, the FASB issued SFAS No. 147-“Acquisitions of Certain Financial Institutions” effective foracquisitions on or after October 1, 2002. The statement relatesto the application of the purchase method of accounting foracquisitions of financial institutions. The statement is current-ly not applicable to EOG.
In December 2002, the FASB issued SFAS No. 148-“Accounting for Stock-Based Compensation-Transition andDisclosure - an amendment of FASB Statement No. 123.” Thisstatement provides alternative methods of transition for a vol-untary change to the fair value based method of accounting forstock-based employee compensation, along with the require-ment of disclosure in both annual and interim financial state-ments about the method used and effect on reported results.EOG has not decided whether it will utilize the fair valuemethod of accounting for stock-based employee compensationand is currently evaluating the alternative methods providedby SFAS No. 148. Based on EOG’s current level of stock-basedemployee compensation activities and its existing financialstatement footnote disclosure regarding such activities, EOGdoes not expect the impact of implementing any of the alter-native methods to be material. Accounting for Price Risk Management Activities. EOGaccounts for its price risk management activities under theprovisions of SFAS No. 133-“Accounting for DerivativeInstruments and Hedging Activities,” as amended by SFASNo. 137 and No. 138. The statement establishes accountingand reporting standards requiring that every derivative instru-ment be recorded in the balance sheet as either an asset or lia-bility measured at its fair value. The statement requires thatchanges in the derivative’s fair value be recognized currently inearnings unless specific hedge accounting criteria are met.During 2001 and 2002, EOG elected not to designate any ofits price risk management activities as accounting hedgesunder SFAS No. 133, and accordingly, accounted for themusing the mark-to-market accounting method. Under thisaccounting method, the changes in the market value of out-standing financial instruments are recognized as gains or loss-
es in the period of change. The gains or losses are recorded inGains (Losses) on Mark-to-market Commodity DerivativeContracts in the Net Operating Revenues section of theConsolidated Statements of Income. The related cash flowimpact is reflected as cash flows from operating activities inthe Consolidated Statements of Cash Flows (see Note 11 to theConsolidated Financial Statements).Capitalized Interest Costs. Certain interest costs have beencapitalized as a part of the historical cost of unproved oil andgas properties.Income Taxes. EOG accounts for income taxes under the pro-visions of SFAS No. 109-“Accounting for Income Taxes.” SFASNo. 109 requires the asset and liability approach for account-ing for income taxes. Under this approach, deferred tax assetsand liabilities are recognized based on anticipated future taxconsequences attributable to differences between financialstatement carrying amounts of assets and liabilities and theirrespective tax bases (see Note 5 to the Consolidated FinancialStatements).Foreign Currency Translation. For subsidiaries whose func-tional currency is deemed to be other than the United Statesdollar, asset and liability accounts are translated at year-endexchange rates and revenue and expenses are translated at aver-age exchange rates prevailing during the year. Translationadjustments are included in Accumulated OtherComprehensive Loss in the Shareholders’ Equity section of theConsolidated Balance Sheets. Accumulated translation losseswere $50 million and $54 million at December 31, 2002 and2001, respectively. Any gains or losses on transactions or mon-etary assets or liabilities in currencies other than the function-al currency are included in net income in the current period.Net Income Per Share. In accordance with the provisions ofSFAS No. 128-“Earnings per Share,” basic net income pershare is computed on the basis of the weighted-average num-ber of common shares outstanding during the periods. Dilutednet income per share is computed based upon the weighted-average number of common shares plus the assumed issuanceof common shares for all potentially dilutive securities (seeNote 8 to the Consolidated Financial Statements for addition-al information to reconcile the difference between the AverageNumber of Common Shares outstanding for basic and dilutednet income per share).Stock Options. EOG accounts for stock options under theprovisions and related interpretations of APB Opinion No. 25-“Accounting for Stock Issued to Employees.” No compensa-tion expense is recognized for such options. As allowed bySFAS No. 123-“Accounting for Stock-Based Compensation”issued in 1995, EOG has continued to apply APB OpinionNo. 25 for purposes of determining net income and to presentthe pro forma disclosures required by SFAS No. 123.

2 0 0 2 A N N U A L R E P O R T T O S H A R E H O L D E R S 19
Information Regarding Forward-LookingStatementsThis Annual Report includes forward-looking statementswithin the meaning of Section 27A of the Securities Act of1933 and Section 21E of the Securities Exchange Act of 1934.All statements other than statements of historical facts,including, among others, statements regarding EOG’s futurefinancial position, business strategy, budgets, reserve informa-tion, projected levels of production, projected costs and plansand objectives of management for future operations, are for-ward-looking statements. EOG typically uses words such as“expect,” “anticipate,” “estimate,” “strategy,” “intend,” “plan,”“target” and “believe” or the negative of those terms or othervariations of them or by comparable terminology to identifyits forward-looking statements. In particular, statements,express or implied, concerning future operating results, theability to replace or increase reserves or to increase production,or the ability to generate income or cash flows are forward-looking statements. Forward-looking statements are not guar-antees of performance. Although EOG believes its expecta-
tions reflected in forward-looking statements are based on rea-sonable assumptions, no assurance can be given that theseexpectations will be achieved. Important factors that couldcause actual results to differ materially from the expectationsreflected in the forward-looking statements include, amongothers: the timing and extent of changes in commodity pricesfor crude oil, natural gas and related products and interestrates; the extent and effect of any hedging activities engagedin by EOG; the extent of EOG’s success in discovering, devel-oping, marketing and producing reserves and in acquiring oiland gas properties; the accuracy of reserve estimates, which bytheir nature involve the exercise of professional judgment andmay therefore be imprecise; political developments around theworld, including terrorist activities and responses to suchactivities; acts of war; and financial market conditions. In lightof these risks, uncertainties and assumptions, the events antic-ipated by EOG’s forward-looking statements might not occur.EOG undertakes no obligations to update or revise its forward-looking statements, whether as a result of new information,future events or otherwise.

E O G R E S O U R C E S , I N C .20
EOG dismissed Arthur Andersen LLP on February 27, 2002 andsubsequently engaged Deloitte & Touche LLP as its independent audi-tors. The predecessor auditor’s report appearing below is a copy ofArthur Andersen’s previously issued report dated February 21, 2002.Since EOG is unable to obtain a current manually signed auditreport, a copy of Arthur Andersen’s most recent signed and dated reporthas been included to satisfy filing requirements, as permitted underRule 2-02(e) of Regulation S-X.
To EOG Resources, Inc.:
We have audited the accompanying consolidated balancesheets of EOG Resources, Inc. (a Delaware corporation) andsubsidiaries as of December 31, 2001 and 2000, and the relat-ed consolidated statements of income and comprehensiveincome, shareholders’ equity and cash flows for each of thethree years in the period ended December 31, 2001. Thesefinancial statements are the responsibility of the Company’smanagement. Our responsibility is to express an opinion onthese financial statements based on our audits.
We conducted our audits in accordance with auditingstandards generally accepted in the United States. Those stan-dards require that we plan and perform the audit to obtain rea-sonable assurance about whether the financial statements arefree of material misstatement. An audit includes examining,on a test basis, evidence supporting the amounts and disclo-sures in the financial statements. An audit also includes assess-ing the accounting principles used and significant estimatesmade by management, as well as evaluating the overall finan-cial statement presentation. We believe that our audits providea reasonable basis for our opinion.
In our opinion, the financial statements referred to abovepresent fairly, in all material respects, the financial position ofEOG Resources, Inc. and subsidiaries as of December 31, 2001and 2000, and the results of their operations and their cashflows for each of the three years in the period ended December31, 2001, in conformity with accounting principles generallyaccepted in the United States.
ARTHUR ANDERSEN LLP
Houston, TexasFebruary 21, 2002
Reports of Independent Public Accountants
To the Board of Directors and Stockholders ofEOG Resources, Inc.Houston, Texas
We have audited the accompanying balance sheet of EOGResources, Inc. (the “Company”) as of December 31, 2002,and the related statements of income, stockholders’ equity, andcash flows for the year then ended. These financial statementsare the responsibility of the Company’s management. Ourresponsibility is to express an opinion on these financial state-ments based on our audit. The financial statements of EOGResources, Inc. as of December 31, 2001, and for the two yearsthen ended were audited by other auditors who have ceasedoperations. Those auditors expressed an unqualified opinion onthose financial statements in their report dated February 21,2002.
We conducted our audit in accordance with auditingstandards generally accepted in the United States of America.Those standards require that we plan and perform the audit toobtain reasonable assurance about whether the financial state-ments are free of material misstatement. An audit includesexamining, on a test basis, evidence supporting the amountsand disclosures in the financial statements. An audit alsoincludes assessing the accounting principles used and signifi-cant estimates made by management, as well as evaluating theoverall financial statement presentation. We believe that ouraudit provides a reasonable basis for our opinion.
In our opinion, such financial statements present fairly, inall material respects, the financial position of the Company asof December 31, 2002, and the results of its operations and itscash flows for the year then ended in conformity with account-ing principles generally accepted in the United States ofAmerica.
Deloitte & Touche LLPFebruary 19, 2003

Management’s Responsibility for Financial Reporting
The following consolidated financial statements of EOGResources, Inc. and its subsidiaries (EOG) were prepared bymanagement, which is responsible for their integrity, objectiv-ity and fair presentation. The statements have been prepared inconformity with accounting principles generally accepted inthe United States and, accordingly, include some amounts thatare based on the best estimates and judgments of management.
Deloitte & Touche LLP, independent public accountants,was engaged to audit the consolidated financial statements ofEOG and issue a report thereon. In the conduct of the audit,Deloitte & Touche LLP was given unrestricted access to allfinancial records and related data including minutes of allmeetings of shareholders, the Board of Directors and commit-tees of the Board. Their audit was made in accordance withauditing standards generally accepted in the United States ofAmerica and included a review of the system of internal con-trols to the extent considered necessary to determine the auditprocedures required to support their opinion on the consoli-dated financial statements. Management believes that all rep-resentations made to Deloitte & Touche LLP during the auditwere valid and appropriate.
The system of internal controls of EOG is designed toprovide reasonable assurance as to the reliability of financialstatements and the protection of assets from unauthorizedacquisition, use or disposition. This system includes, but is notlimited to, written policies and guidelines including a pub-lished code for the conduct of business affairs, conflicts ofinterest and compliance with laws regarding antitrust, anti-boycott and foreign corrupt practices policies, the carefulselection and training of qualified personnel, and a document-ed organizational structure outlining the separation of respon-sibilities among management representatives and staff groups.
The adequacy of financial controls of EOG and theaccounting principles employed in financial reporting by EOGare under the general oversight of the Audit Committee of theBoard of Directors. No member of this committee is an officeror employee of EOG. The independent public accountants andinternal auditors have full, free, separate and direct access tothe Audit Committee and meet with the committee from timeto time to discuss accounting, auditing and financial reportingmatters. It should be recognized that there are inherent limi-tations to the effectiveness of any system of internal control,including the possibility of human error and circumvention oroverride. Accordingly, even an effective system can provideonly reasonable assurance with respect to the preparation ofreliable financial statements and safeguarding of assets.Furthermore, the effectiveness of an internal control systemcan change with circumstances.
It is management’s opinion that, considering the criteriafor effective internal control over financial reporting and safe-guarding of assets which consists of interrelated componentsincluding the control environment, risk assessment process,control activities, information and communication systems,and monitoring, EOG maintained an effective system of inter-nal control as to the reliability of financial statements and theprotection of assets against unauthorized acquisition, use ordisposition during the year ended December 31, 2002.
Mark G. PapaChairman andChief Executive Officer
Edmund P. Segner, IIIPresident and Chief of Staff
Timothy K. DriggersVice President, Accountingand Land Administration
Houston, TexasFebruary 19, 2003
2 0 0 2 A N N U A L R E P O R T T O S H A R E H O L D E R S 21

E O G R E S O U R C E S , I N C .22
Consolidated Statements of Income and Comprehensive Income
Year Ended December 31,
(In Thousands, Except Per Share Amounts) 2002 2001 2000
Net Operating RevenuesNatural Gas . . . . . . . . . . . . . . . . . . . . . . . . . . . . . . . . . . . . . . . . . . . . . . . . $ 915,129 $ 1,298,102 $ 1,155,804Crude Oil, Condensate and Natural Gas Liquids . . . . . . . . . . . . . . . . . . . . 227,309 258,101 325,726Gains (Losses) on Mark-to-market Commodity Derivative Contracts . . . . . (48,508) 97,750 (1,000)Gains on Sales of Reserves and Related Assets and Other, Net . . . . . . . . . . 1,106 934 9,365
Total . . . . . . . . . . . . . . . . . . . . . . . . . . . . . . . . . . . . . . . . . . . . . . . . . . . . 1,095,036 1,654,887 1,489,895Operating Expenses
Lease and Well . . . . . . . . . . . . . . . . . . . . . . . . . . . . . . . . . . . . . . . . . . . . . . 179,429 175,446 140,915Exploration Costs . . . . . . . . . . . . . . . . . . . . . . . . . . . . . . . . . . . . . . . . . . . . 60,228 67,467 67,196Dry Hole Costs. . . . . . . . . . . . . . . . . . . . . . . . . . . . . . . . . . . . . . . . . . . . . . 46,749 71,360 17,337Impairments . . . . . . . . . . . . . . . . . . . . . . . . . . . . . . . . . . . . . . . . . . . . . . . . 68,430 79,156 46,478Depreciation, Depletion and Amortization . . . . . . . . . . . . . . . . . . . . . . . . . 398,036 392,399 359,265General and Administrative . . . . . . . . . . . . . . . . . . . . . . . . . . . . . . . . . . . . 88,952 79,963 66,932Taxes Other Than Income. . . . . . . . . . . . . . . . . . . . . . . . . . . . . . . . . . . . . . 71,881 95,333 94,909Charges Associated with Enron Bankruptcy . . . . . . . . . . . . . . . . . . . . . . . . - 19,211 -
Total . . . . . . . . . . . . . . . . . . . . . . . . . . . . . . . . . . . . . . . . . . . . . . . . . . . . 913,705 980,335 793,032Operating Income . . . . . . . . . . . . . . . . . . . . . . . . . . . . . . . . . . . . . . . . . . . . . 181,331 674,552 696,863Other Income (Expense) . . . . . . . . . . . . . . . . . . . . . . . . . . . . . . . . . . . . . . . . (2,005) 2,003 (2,300)Income Before Interest Expense and Income Taxes . . . . . . . . . . . . . . . . . 179,326 676,555 694,563Interest Expense
Incurred . . . . . . . . . . . . . . . . . . . . . . . . . . . . . . . . . . . . . . . . . . . . . . . . . . . 68,641 53,756 67,714Capitalized . . . . . . . . . . . . . . . . . . . . . . . . . . . . . . . . . . . . . . . . . . . . . . . . . (8,987) (8,646) (6,708)
Net Interest Expense . . . . . . . . . . . . . . . . . . . . . . . . . . . . . . . . . . . . . . . . 59,654 45,110 61,006Income Before Income Taxes. . . . . . . . . . . . . . . . . . . . . . . . . . . . . . . . . . . . 119,672 631,445 633,557Income Tax Provision . . . . . . . . . . . . . . . . . . . . . . . . . . . . . . . . . . . . . . . . . . 32,499 232,829 236,626Net Income . . . . . . . . . . . . . . . . . . . . . . . . . . . . . . . . . . . . . . . . . . . . . . . . . . 87,173 398,616 396,931Preferred Stock Dividends . . . . . . . . . . . . . . . . . . . . . . . . . . . . . . . . . . . . . . 11,032 10,994 11,028Net Income Available to Common . . . . . . . . . . . . . . . . . . . . . . . . . . . . . . . $ 76,141 $ 387,622 $ 385,903
Net Income Per Share Available to CommonBasic. . . . . . . . . . . . . . . . . . . . . . . . . . . . . . . . . . . . . . . . . . . . . . . . . . . . . . $ 0.66 $ 3.35 $ 3.30Diluted. . . . . . . . . . . . . . . . . . . . . . . . . . . . . . . . . . . . . . . . . . . . . . . . . . . . $ 0.65 $ 3.30 $ 3.24
Average Number of Common SharesBasic. . . . . . . . . . . . . . . . . . . . . . . . . . . . . . . . . . . . . . . . . . . . . . . . . . . . . . 115,335 115,765 116,934Diluted. . . . . . . . . . . . . . . . . . . . . . . . . . . . . . . . . . . . . . . . . . . . . . . . . . . . 117,245 117,488 119,102
Comprehensive IncomeNet Income . . . . . . . . . . . . . . . . . . . . . . . . . . . . . . . . . . . . . . . . . . . . . . . . . . $ 87,173 $ 398,616 $ 396,931Other Comprehensive Income (Loss)
Foreign Currency Translation Adjustment . . . . . . . . . . . . . . . . . . . . . . . . . 4,315 (22,044) (12,338)Available-for-sale Security Transactions . . . . . . . . . . . . . . . . . . . . . . . . . . . 926 (1,318) 392
Comprehensive Income . . . . . . . . . . . . . . . . . . . . . . . . . . . . . . . . . . . . . . . . $ 92,414 $ 375,254 $ 384,985
The accompanying notes are an integral part of these consolidated financial statements.

2 0 0 2 A N N U A L R E P O R T T O S H A R E H O L D E R S 23
Consolidated Balance Sheets
At December 31,
(In Thousands) 2002 2001ASSETSCurrent Assets
Cash and Cash Equivalents . . . . . . . . . . . . . . . . . . . . . . . . . . . . . . . . . . . . . . . . . . . . . . . . . . $ 9,848 $ 2,512Accounts Receivable, net . . . . . . . . . . . . . . . . . . . . . . . . . . . . . . . . . . . . . . . . . . . . . . . . . . . 259,308 194,624Inventories . . . . . . . . . . . . . . . . . . . . . . . . . . . . . . . . . . . . . . . . . . . . . . . . . . . . . . . . . . . . . . 18,928 18,871Assets from Price Risk Management Activities . . . . . . . . . . . . . . . . . . . . . . . . . . . . . . . . . . . - 19,161Federal Income Tax Receivable . . . . . . . . . . . . . . . . . . . . . . . . . . . . . . . . . . . . . . . . . . . . . . . 50,825 19,332Other . . . . . . . . . . . . . . . . . . . . . . . . . . . . . . . . . . . . . . . . . . . . . . . . . . . . . . . . . . . . . . . . . . 55,883 17,921
Total. . . . . . . . . . . . . . . . . . . . . . . . . . . . . . . . . . . . . . . . . . . . . . . . . . . . . . . . . . . . . . . . . . 394,792 272,421Oil and Gas Properties (Successful Efforts Method). . . . . . . . . . . . . . . . . . . . . . . . . . . . . . . . . 6,750,095 6,065,603
Less: Accumulated Depreciation, Depletion and Amortization . . . . . . . . . . . . . . . . . . . . . . . (3,428,547) (3,009,693)Net Oil and Gas Properties . . . . . . . . . . . . . . . . . . . . . . . . . . . . . . . . . . . . . . . . . . . . . . . . 3,321,548 3,055,910
Other Assets. . . . . . . . . . . . . . . . . . . . . . . . . . . . . . . . . . . . . . . . . . . . . . . . . . . . . . . . . . . . . . . 97,666 85,713Total Assets . . . . . . . . . . . . . . . . . . . . . . . . . . . . . . . . . . . . . . . . . . . . . . . . . . . . . . . . . . . . . . . $ 3,814,006 $ 3,414,044
LIABILITIES AND SHAREHOLDERS’ EQUITYCurrent Liabilities
Accounts Payable . . . . . . . . . . . . . . . . . . . . . . . . . . . . . . . . . . . . . . . . . . . . . . . . . . . . . . . . . $ 201,931 $ 219,561Accrued Taxes Payable . . . . . . . . . . . . . . . . . . . . . . . . . . . . . . . . . . . . . . . . . . . . . . . . . . . . . 23,170 40,219Dividends Payable . . . . . . . . . . . . . . . . . . . . . . . . . . . . . . . . . . . . . . . . . . . . . . . . . . . . . . . . 5,007 5,045Liabilities from Price Risk Management Activities . . . . . . . . . . . . . . . . . . . . . . . . . . . . . . 5,939 -Accrued Employee Benefits. . . . . . . . . . . . . . . . . . . . . . . . . . . . . . . . . . . . . . . . . . . . . . . . . . 11,099 16,345Other . . . . . . . . . . . . . . . . . . . . . . . . . . . . . . . . . . . . . . . . . . . . . . . . . . . . . . . . . . . . . . . . . . 29,205 29,677
Total . . . . . . . . . . . . . . . . . . . . . . . . . . . . . . . . . . . . . . . . . . . . . . . . . . . . . . . . . . . . . . . . 276,351 310,847Long-Term Debt . . . . . . . . . . . . . . . . . . . . . . . . . . . . . . . . . . . . . . . . . . . . . . . . . . . . . . . . . . . 1,145,132 855,969Other Liabilities. . . . . . . . . . . . . . . . . . . . . . . . . . . . . . . . . . . . . . . . . . . . . . . . . . . . . . . . . . . . 59,180 53,522Deferred Income Taxes. . . . . . . . . . . . . . . . . . . . . . . . . . . . . . . . . . . . . . . . . . . . . . . . . . . . . . 660,948 551,020Shareholders’ Equity
Preferred Stock, $.01 Par, 10,000,000 Shares Authorized:Series B, 100,000 Shares Issued, Cumulative,
$100,000,000 Liquidation Preference . . . . . . . . . . . . . . . . . . . . . . . . . . . . . . . . . . . . . . . 98,352 98,116Series D, 500 Shares Issued, Cumulative,
$50,000,000 Liquidation Preference . . . . . . . . . . . . . . . . . . . . . . . . . . . . . . . . . . . . . . . . 49,647 49,466Common Stock, $.01 Par, 320,000,000 Shares Authorized and
124,730,000 Shares Issued . . . . . . . . . . . . . . . . . . . . . . . . . . . . . . . . . . . . . . . . . . . . . . . . . 201,247 201,247Unearned Compensation . . . . . . . . . . . . . . . . . . . . . . . . . . . . . . . . . . . . . . . . . . . . . . . . . . . . (15,033) (14,953)Accumulated Other Comprehensive Loss . . . . . . . . . . . . . . . . . . . . . . . . . . . . . . . . . . . . . . . (49,877) (55,118)Retained Earnings. . . . . . . . . . . . . . . . . . . . . . . . . . . . . . . . . . . . . . . . . . . . . . . . . . . . . . . . . 1,723,948 1,668,708Common Stock Held in Treasury, 10,009,740 shares at December 31, 2002
and 9,278,382 shares at December 31, 2001 . . . . . . . . . . . . . . . . . . . . . . . . . . . . . . . . . . . (335,889) (304,780)Total Shareholders’ Equity . . . . . . . . . . . . . . . . . . . . . . . . . . . . . . . . . . . . . . . . . . . . . . . . 1,672,395 1,642,686
Total Liabilities and Shareholders’ Equity . . . . . . . . . . . . . . . . . . . . . . . . . . . . . . . . . . . . . . . $ 3,814,006 $ 3,414,044
The accompanying notes are an integral part of these consolidated financial statements.

E O G R E S O U R C E S , I N C .24
Consolidated Statements of Shareholders’ Equity
Accumulated CommonAdditional Other Stock Total
Preferred Common Paid In Unearned Comprehensive Retained Held In Shareholders’(In Thousands, Except Per Share Amounts) Stock Stock Capital Compensation Income (Loss) Earnings Treasury Equity
Balance at December 31, 1999 . . . . . . . . . . . . . . $ 147,190 $ 201,247 $ - $ (1,618) $ (19,810) $ 930,938 $ (128,336) $ 1,129,611Net Income. . . . . . . . . . . . . . . . . . . . . . . . . . . - - - - - 396,931 - 396,931Amortization of Preferred Stock Discount . . . . 419 - - - - (419) - -Exchange Offer Fees . . . . . . . . . . . . . . . . . . . . (445) - - - - - - (445)Preferred Stock Dividends Paid/Declared . . . . - - - - - (10,609) - (10,609)Common Stock Dividends
Declared, $.14 Per Share . . . . . . . . . . . . . . . - - - - - (15,774) - (15,774)Translation Adjustment. . . . . . . . . . . . . . . . . . - - - - (12,338) - - (12,338)Unrealized Gain on Available-
for-sale Security . . . . . . . . . . . . . . . . . . . . . . - - - - 392 - - 392Treasury Stock Purchased . . . . . . . . . . . . . . . . - - - - - - (272,723) (272,723)Treasury Stock Issued Under
Stock Option Plans . . . . . . . . . . . . . . . . . . . - - (36,701) - - - 163,350 126,649Tax Benefits from Stock Options Exercised . . . - - 41,307 - - - - 41,307Restricted Stock and Units . . . . . . . . . . . . . . . - - 2,805 (3,411) - - 606 -Amortization of Unearned Compensation . . . . - - - 1,273 - - - 1,273Equity Derivative Transactions . . . . . . . . . . . . - - (3,190) - - - - (3,190)Other . . . . . . . . . . . . . . . . . . . . . . . . . . . . . . . - - - - - - (159) (159)
Balance at December 31, 2000 . . . . . . . . . . . . . . 147,164 201,247 4,221 (3,756) (31,756) 1,301,067 (237,262) 1,380,925Net Income. . . . . . . . . . . . . . . . . . . . . . . . . . . - - - - - 398,616 - 398,616Amortization of Preferred Stock Discount . . . . 418 - - - - (418) - -Preferred Stock Dividends Paid/Declared . . . . - - - - - (10,576) - (10,576)Common Stock Dividends
Declared, $.16 Per Share . . . . . . . . . . . . . . . - - - - - (18,523) - (18,523)Translation Adjustment. . . . . . . . . . . . . . . . . . - - - - (22,044) - - (22,044)Unrealized Loss on Available-
for-sale Security . . . . . . . . . . . . . . . . . . . . . . - - - - (1,318) - - (1,318)Treasury Stock Purchased . . . . . . . . . . . . . . . . - - - - - - (126,769) (126,769)Treasury Stock Issued Under
Stock Option Plans . . . . . . . . . . . . . . . . . . . - - (19,097) - - (1,458) 50,403 29,848Treasury Stock Issued Under
Employee Stock Purchase Plan . . . . . . . . . . . - - (104) - - - 1,061 957Tax Benefits from Stock Options Exercised . . . - - 7,332 - - - - 7,332Restricted Stock and Units . . . . . . . . . . . . . . . - - 6,583 (14,467) - - 7,884 -Amortization of Unearned Compensation . . . . - - - 3,270 - - - 3,270Equity Derivative Transactions . . . . . . . . . . . . - - 1,201 - - - - 1,201Other . . . . . . . . . . . . . . . . . . . . . . . . . . . . . . . - - (136) - - - (97) (233)
Balance at December 31, 2001 . . . . . . . . . . . . . . 147,582 201,247 - (14,953) (55,118) 1,668,708 (304,780) 1,642,686Net Income. . . . . . . . . . . . . . . . . . . . . . . . . . . - - - - - 87,173 - 87,173Amortization of Preferred Stock Discount . . . . 417 - - - - (417) - -Preferred Stock Dividends Paid/Declared . . . . - - - - - (10,615) - (10,615)Common Stock Dividends
Declared, $.16 Per Share . . . . . . . . . . . . . . . - - - - - (18,499) - (18,499)Translation Adjustment. . . . . . . . . . . . . . . . . . - - - - 4,315 - - 4,315Available-for-sale Security Transactions . . . . . . - - - - 926 - - 926Treasury Stock Purchased . . . . . . . . . . . . . . . . - - - - - - (63,038) (63,038)Treasury Stock Issued Under
Stock Option Plans . . . . . . . . . . . . . . . . . . . - - (9,457) - - (2,402) 28,565 16,706Treasury Stock Issued Under
Employee Stock Purchase Plan . . . . . . . . . . . - - (39) - - - 2,301 2,262Tax Benefits from Stock Options Exercised . . . - - 5,167 - - - - 5,167Restricted Stock and Units . . . . . . . . . . . . . . . - - 4,329 (4,951) - - 622 -Amortization of Unearned Compensation . . . . - - - 4,871 - - - 4,871Other . . . . . . . . . . . . . . . . . . . . . . . . . . . . . . . - - - - - - 441 441
Balance at December 31, 2002 . . . . . . . . . . . . . . $ 147,999 $ 201,247 $ - $ (15,033) $ (49,877) $ 1,723,948 $ (335,889) $ 1,672,395
The accompanying notes are an integral part of these consolidated financial statements.

2 0 0 2 A N N U A L R E P O R T T O S H A R E H O L D E R S 25
Consolidated Statements of Cash Flows
Year Ended December 31,
(In Thousands) 2002 2001 2000Cash Flows from Operating ActivitiesReconciliation of Net Income to Net Operating Cash Inflows:
Net Income . . . . . . . . . . . . . . . . . . . . . . . . . . . . . . . . . . . . . . . . . . . . . . . . $ 87,173 $ 398,616 $ 396,931Items Not Requiring Cash
Depreciation, Depletion and Amortization. . . . . . . . . . . . . . . . . . . . . . . . 398,036 392,399 359,265Impairments . . . . . . . . . . . . . . . . . . . . . . . . . . . . . . . . . . . . . . . . . . . . . . 68,430 79,156 46,478Deferred Income Taxes . . . . . . . . . . . . . . . . . . . . . . . . . . . . . . . . . . . . . . . 82,179 164,945 97,729Charges Associated with Enron Bankruptcy . . . . . . . . . . . . . . . . . . . . . . . - 19,211 -Other, Net . . . . . . . . . . . . . . . . . . . . . . . . . . . . . . . . . . . . . . . . . . . . . . . . 17,333 10,423 6,693
Exploration Costs . . . . . . . . . . . . . . . . . . . . . . . . . . . . . . . . . . . . . . . . . . . . 60,228 67,467 67,196Dry Hole Costs. . . . . . . . . . . . . . . . . . . . . . . . . . . . . . . . . . . . . . . . . . . . . . 46,749 71,360 17,337Mark-to-market Commodity Derivative Contracts
Total (Gains) Losses . . . . . . . . . . . . . . . . . . . . . . . . . . . . . . . . . . . . . . . . . 48,508 (97,750) 1,000Realized Gains (Losses) . . . . . . . . . . . . . . . . . . . . . . . . . . . . . . . . . . . . . . (21,136) 66,731 (1,438)Collar Premium . . . . . . . . . . . . . . . . . . . . . . . . . . . . . . . . . . . . . . . . . . . . (1,825) (4,621) -
Losses (Gains) on Sales of Reserves and Related Assets and Other, Net. . . . (70) 835 (5,539)Tax Benefits from Stock Options Exercised. . . . . . . . . . . . . . . . . . . . . . . . . 5,168 7,332 41,307Other, Net . . . . . . . . . . . . . . . . . . . . . . . . . . . . . . . . . . . . . . . . . . . . . . . . . (1,908) (3,127) (8,935)Changes in Components of Working Capital and Other Liabilities
Accounts Receivable . . . . . . . . . . . . . . . . . . . . . . . . . . . . . . . . . . . . . . . . (61,580) 146,235 (191,492)Inventories . . . . . . . . . . . . . . . . . . . . . . . . . . . . . . . . . . . . . . . . . . . . . . . . (57) (2,248) 2,345Accounts Payable . . . . . . . . . . . . . . . . . . . . . . . . . . . . . . . . . . . . . . . . . . . (19,012) (26,949) 97,374Accrued Taxes Payable . . . . . . . . . . . . . . . . . . . . . . . . . . . . . . . . . . . . . . . (84,666) (38,619) 54,556Other Liabilities. . . . . . . . . . . . . . . . . . . . . . . . . . . . . . . . . . . . . . . . . . . . 7,816 (3,422) 348Other, Net . . . . . . . . . . . . . . . . . . . . . . . . . . . . . . . . . . . . . . . . . . . . . . . . (5,578) (16,442) 11,378
Changes in Components of Working Capital Associated with Investing and Financing Activities . . . . . . . . . . . . . . . . . 42,782 (34,105) (25,123)
Net Operating Cash Inflows . . . . . . . . . . . . . . . . . . . . . . . . . . . . . . . . . . . . 668,570 1,197,427 967,410
Investing Cash FlowsAdditions to Oil and Gas Properties. . . . . . . . . . . . . . . . . . . . . . . . . . . . . . (714,127) (974,016) (602,638)Exploration Costs . . . . . . . . . . . . . . . . . . . . . . . . . . . . . . . . . . . . . . . . . . . . (60,228) (67,467) (67,196)Dry Hole Costs. . . . . . . . . . . . . . . . . . . . . . . . . . . . . . . . . . . . . . . . . . . . . . (46,749) (71,360) (17,337)Proceeds from Sales of Reserves and Related Assets . . . . . . . . . . . . . . . . . . 8,089 8,032 26,189Changes in Components of Working Capital
Associated with Investing Activities . . . . . . . . . . . . . . . . . . . . . . . . . . . . (43,246) 32,405 22,798Other, Net . . . . . . . . . . . . . . . . . . . . . . . . . . . . . . . . . . . . . . . . . . . . . . . . . (16,277) (15,649) (28,977)
Net Investing Cash Outflows . . . . . . . . . . . . . . . . . . . . . . . . . . . . . . . . . . . . (872,538) (1,088,055) (667,161)
Financing Cash FlowsLong-Term Debt Borrowings (Repayments) . . . . . . . . . . . . . . . . . . . . . . . . 289,163 (4,155) (131,306)Dividends Paid . . . . . . . . . . . . . . . . . . . . . . . . . . . . . . . . . . . . . . . . . . . . . . (29,152) (28,580) (26,071)Treasury Stock Purchased . . . . . . . . . . . . . . . . . . . . . . . . . . . . . . . . . . . . . . (63,038) (126,769) (272,723)Proceeds from Stock Options Exercised . . . . . . . . . . . . . . . . . . . . . . . . . . . 17,339 30,805 127,090Other, Net . . . . . . . . . . . . . . . . . . . . . . . . . . . . . . . . . . . . . . . . . . . . . . . . . (3,008) 1,687 (1,923)
Net Financing Cash Inflows (Outflows) . . . . . . . . . . . . . . . . . . . . . . . . . . . 211,304 (127,012) (304,933)
Increase (Decrease) in Cash and Cash Equivalents. . . . . . . . . . . . . . . . . . . 7,336 (17,640) (4,684)
Cash and Cash Equivalents at Beginning of Year . . . . . . . . . . . . . . . . . . . . 2,512 20,152 24,836
Cash and Cash Equivalents at End of Year . . . . . . . . . . . . . . . . . . . . . . . . . $ 9,848 $ 2,512 $ 20,152
The accompanying notes are an integral part of these consolidated financial statements.

E O G R E S O U R C E S , I N C .26
Notes to Consolidated Financial Statements
1. Summary of Significant Accounting PoliciesPrinciples of Consolidation. The consolidated financial state-ments of EOG Resources, Inc. (EOG), a Delaware corporation,include the accounts of all domestic and foreign subsidiaries.Investments in unconsolidated affiliates, in which EOG is ableto exercise significant influence, are accounted for using theequity method. All material intercompany accounts and trans-actions have been eliminated.
The preparation of financial statements in conformitywith accounting principles generally accepted in the UnitedStates of America requires management to make estimates andassumptions that affect the reported amounts of assets and lia-bilities and disclosure of contingent assets and liabilities at thedate of the financial statements and the reported amounts ofrevenue and expenses during the reporting period. Actualresults could differ from those estimates.
Certain reclassifications have been made to prior periodfinancial statements to conform with the current presentation.Beginning 2001, the “Impairment of Unproved Oil and GasProperties” caption on the Consolidated Statements of Incomewas renamed “Impairments” to include the impairment of long-lived assets as described in Statement of Financial AccountingStandards (“SFAS”) No. 121-“Accounting for the Impairment ofLong-Lived Assets and for Long-Lived Assets to Be Disposed of ”(“SFAS 121 Impairments”), as superseded by SFAS No. 144-“Accounting for the Impairment or Disposal of Long-LivedAssets.” As a result, EOG reclassified all prior periods to reflectsuch SFAS 121 Impairments in Impairments, instead ofDepreciation, Depletion and Amortization (“DD&A”) as previ-ously reported. SFAS 121 Impairments reclassified from DD&Ato Impairments was $11 million for 2000. Financial Instruments. EOG’s financial instruments consist ofcash and cash equivalents, marketable securities, accountsreceivable, accounts payable and long-term debt. The carryingvalues of cash and cash equivalents, marketable securities,accounts receivable and accounts payable approximate fairvalue (see Note 2 “Long-Term Debt” for fair value of long-term debt).Cash and Cash Equivalents. EOG records as cash equivalentsall highly liquid short-term investments with original maturi-ties of three months or less. Oil and Gas Operations. EOG accounts for its natural gas andcrude oil exploration and production activities under the suc-cessful efforts method of accounting.
Oil and gas lease acquisition costs are capitalized whenincurred. Unproved properties with significant acquisitioncosts are assessed quarterly on a property-by-property basis,
and any impairment in value is recognized. Unproved proper-ties with acquisition costs that are not individually significantare aggregated, and the portion of such costs estimated to benonproductive, based on historical experience, is amortizedover the average holding period. If the unproved properties aredetermined to be productive, the appropriate related costs aretransferred to proved oil and gas properties. Lease rentals areexpensed as incurred.
Oil and gas exploration costs, other than the costs ofdrilling exploratory wells, are charged to expense as incurred.The costs of drilling exploratory wells are capitalized pendingdetermination of whether they have discovered proved com-mercial reserves. If proved commercial reserves are not discov-ered, such drilling costs are expensed. Costs to develop provedreserves, including the costs of all development wells andrelated equipment used in the production of natural gas andcrude oil, are capitalized.
Depreciation, depletion and amortization of the cost ofproved oil and gas properties is calculated using the unit-of-production method. Estimated future dismantlement, restora-tion and abandonment costs (classified as long-term liabili-ties), net of salvage values, are taken into account. Certainother assets are depreciated on a straight-line basis.
Periodically, or when circumstances indicate that an assetmay be impaired, EOG compares expected undiscountedfuture cash flows at a producing field level to the unamortizedcapitalized cost of the asset. If the future undiscounted cashflows, based on EOG’s estimate of future crude oil and naturalgas prices and operating costs and anticipated production fromproved reserves, are lower than the unamortized capitalizedcost, the capitalized cost is reduced to fair value. Fair value iscalculated by discounting the future cash flows at an appro-priate risk-adjusted discount rate.
Inventories, consisting primarily of tubular goods andwell equipment held for use in the exploration for, and devel-opment and production of natural gas and crude oil reserves,are carried at cost with adjustments made from time to timeto recognize any reductions in value.
Natural gas and liquids revenues are recorded when pro-duction is delivered. Additionally, natural gas revenues arerecorded on the entitlement method based on EOG’s percent-age ownership of current production. Each working interestowner in a well generally has the right to a specific percentageof production, although actual production sold may differfrom an owner’s ownership percentage. Under entitlementaccounting, a receivable is recorded when underproductionoccurs and a payable is recorded when overproduction occurs.

2 0 0 2 A N N U A L R E P O R T T O S H A R E H O L D E R S 27
New Accounting Pronouncements. In June 2001, theFinancial Accounting Standards Board (“FASB”) issued SFASNo. 143-“Accounting for Asset Retirement Obligations”effective for fiscal years beginning after June 15, 2002. SFASNo. 143 requires entities to record the fair value of a liabilityfor legal obligations associated with the retirement of tangiblelong-lived assets and the associated asset retirement costs. Thefair value of the liability is added to the carrying amount of theassociated asset and this additional carrying amount is depre-ciated over the life of the asset. Increase in the liability due topassage of time, as a result of applying an interest method ofallocation to the amount of the liability at the beginning of aperiod, is recognized as an increase in the carrying amount ofthe liability and as an expense classified as an operating itemin the statement of income. If the obligation is settled forother than the carrying amount of the liability, a gain or lossis recognized on settlement. EOG adopted the statement onJanuary 1, 2003. The impact of adopting the statement result-ed in an after-tax loss of approximately $6.5 million whichwill be reported as cumulative adjustment for change inaccounting principle in the first quarter of 2003.
In April 2002, the FASB issued SFAS No. 145-“Rescissionof FASB Statements No. 4, 44, and 64, Amendment of FASBStatement No. 13, and Technical Corrections” effective forfinancial statements issued on or after May 15, 2002. SFAS No.145 requires gains and losses on the extinguishment of debt tobe classified as income or loss from continuing operations,unless the requirements of Accounting Principles BoardOpinion (“APB Opinion”) No. 30-“Reporting the Results ofOperations - Reporting the effects of Disposal of a Segment ofa Business, and Extraordinary, Unusual and InfrequentlyOccurring Events and Transactions” are met, upon which thegain or loss would be considered unusual and infrequent andclassified as an extraordinary item. Prior to adoption of SFASNo. 145, all gains and losses from extinguishment of debt wereclassified as extraordinary items. SFAS No. 145 also createsconsistency between accounting for sale-leaseback transactionsand certain lease modifications with economic effects similar tosale-leaseback transactions, along with various amendmentswhich make technical corrections and clarifications. EOGadopted this statement on January 1, 2003. The adoption ofSFAS No. 145 did not have any effect on its financial positionor results of operations.
In June 2002, the FASB issued SFAS No. 146-“Accounting for Costs Associated with Exit or DisposalActivities.” SFAS No. 146 nullifies the guidance of theEmerging Issues Task Force (EITF) Issue No. 94-3, “LiabilityRecognition for Certain Employee Termination Benefits andOther Costs to Exit an Activity (including Certain CostsIncurred in a Restructuring).” SFAS No. 146 requires that aliability for a cost associated with an exit or disposal activitybe recognized only when the liability is incurred and measuredinitially at fair value. SFAS No. 146 is effective for exit or dis-
posal activities initiated after December 31, 2002. EOG doesnot expect the impact of SFAS No. 146 to have a materialeffect on its financial position or results of operations.
In October 2002, the FASB issued SFAS No. 147-“Acquisitions of Certain Financial Institutions” effective foracquisitions on or after October 1, 2002. The statement relatesto the application of the purchase method of accounting foracquisitions of financial institutions. The statement is current-ly not applicable to EOG.
In December 2002, the FASB issued SFAS No. 148-“Accounting for Stock-Based Compensation-Transition andDisclosure - an amendment of FASB Statement No. 123.” Thisstatement provides alternative methods of transition for a vol-untary change to the fair value based method of accounting forstock-based employee compensation, along with the require-ment of disclosure in both annual and interim financial state-ments about the method used and effect on reported results.EOG has not decided whether it will utilize the fair valuemethod of accounting for stock-based employee compensationand is currently evaluating the alternative methods providedby SFAS No. 148. Based on EOG’s current level of stock-basedemployee compensation activities and its existing financialstatement footnote disclosure regarding such activities, EOGdoes not expect the impact of implementing any of the alter-native methods to be material.Accounting for Price Risk Management Activities. EOGaccounts for its price risk management activities under theprovisions of SFAS No. 133-“Accounting for DerivativeInstruments and Hedging Activities,” as amended by SFASNo. 137 and No. 138. The statement establishes accountingand reporting standards requiring that every derivative instru-ment be recorded in the balance sheet as either an asset or lia-bility measured at its fair value. The statement requires thatchanges in the derivative’s fair value be recognized currently inearnings unless specific hedge accounting criteria are met.During 2001 and 2002, EOG elected not to designate any ofits price risk management activities as accounting hedgesunder SFAS No. 133, and accordingly, accounted for themusing the mark-to-market accounting method. Under thisaccounting method, the changes in the market value of out-standing financial instruments are recognized as gains or loss-es in the period of change. The gains or losses are recorded inGains (Losses) on Mark-to-market Commodity DerivativeContracts in the Net Operating Revenues section of theConsolidated Statements of Income. The related cash flowimpact is reflected as cash flows from operating activities inthe Consolidated Statements of Cash Flows (see Note 11“Prices and Interest Rate Risk Management Activities”).Capitalized Interest Costs. Certain interest costs have beencapitalized as a part of the historical cost of unproved oil andgas properties.Income Taxes. EOG accounts for income taxes under the pro-visions of SFAS No. 109-“Accounting for Income Taxes.” SFAS

E O G R E S O U R C E S , I N C .28
No. 109 requires the asset and liability approach for account-ing for income taxes. Under this approach, deferred tax assetsand liabilities are recognized based on anticipated future taxconsequences attributable to differences between financialstatement carrying amounts of assets and liabilities and theirrespective tax bases (see Note 5 “Income Taxes”).Foreign Currency Translation. For subsidiaries whose func-tional currency is deemed to be other than the United Statesdollar, asset and liability accounts are translated at year-endexchange rates and revenue and expenses are translated at aver-age exchange rates prevailing during the year. Translationadjustments are included in Accumulated Other Compre-hensive Loss in the Shareholders’ Equity section of theConsolidated Balance Sheets. Accumulated translation losseswere $50 million and $54 million at December 31, 2002 and2001, respectively. Any gains or losses on transactions or mon-etary assets or liabilities in currencies other than the function-al currency are included in net income in the current period.Net Income Per Share. In accordance with the provisions ofSFAS No. 128-“Earnings per Share,” basic net income pershare is computed on the basis of the weighted-average num-ber of common shares outstanding during the periods. Dilutednet income per share is computed based upon the weighted-average number of common shares plus the assumed issuanceof common shares for all potentially dilutive securities (seeNote 8 “Net Income Per Share Available to Common” foradditional information to reconcile the difference between theAverage Number of Common Shares outstanding for basic anddiluted net income per share).Stock Options. EOG accounts for stock options under theprovisions and related interpretations of APB Opinion No. 25-“Accounting for Stock Issued to Employees.” No compensa-tion expense is recognized for such options. As allowed bySFAS No. 123-“Accounting for Stock-Based Compensation”issued in 1995, EOG has continued to apply APB OpinionNo. 25 for purposes of determining net income and to presentthe pro forma disclosures required by SFAS No. 123.
2. Long-Term DebtLong-Term Debt at December 31 consisted of the following(in thousands):
2002 2001
Commercial Paper. . . . . . . . . . . . . $ 120,000 $ -Uncommitted Credit Facilities . . . 14,310 95,147Senior Unsecured Term Loan
Facility due 2005. . . . . . . . . . . 150,000 -6.50% Notes due 2004 . . . . . . . . . 100,000 100,0006.70% Notes due 2006 . . . . . . . . . 126,870 126,8706.50% Notes due 2007 . . . . . . . . . 100,000 100,0006.00% Notes due 2008 . . . . . . . . . 173,952 173,9526.65% Notes due 2028 . . . . . . . . . 140,000 140,0007.00% Subsidiary Debt due 2011 . 220,000 120,000
Total . . . . . . . . . . . . . . . . . . . $ 1,145,132 $ 855,969
EOG maintains two credit facilities with different expira-tion dates. In July 2002, the $300 million credit facility thatwas scheduled to expire was renewed at the same commitmentlevel for a period of one year, which is the same period as thelast renewal of this facility. Credit facility expirations are asfollows: $300 million in July 2003 and $300 million in July2004. With respect to the $300 million expiring in 2003,EOG may, at its option, extend the final maturity date of anyadvances made under the facility by one full year from theexpiration date of the facility, effectively qualifying such debtas long term. Advances under both agreements bear interest,at the option of EOG, based upon a base rate or a Eurodollarrate. No amounts were borrowed on these committed creditfacilities at December 31, 2002.
On October 30, 2002, EOG entered into a SeniorUnsecured Term Loan Facility (the “Facility”) with a group ofbanks whereby the banks agreed to lend EOG $150 millionwith a maturity of three years. EOG used the loan proceedsunder this Facility to reduce outstanding commercial paperand uncommitted bank line borrowings. This Facility calls forinterest to be charged at a spread over LIBOR (LondonInterBank Offering Rate) or the base rate at EOG’s option, andcontains substantially the same covenants as those in EOG’s$300 million Long-Term Revolving Credit Agreement. Theapplicable interest rate for this Facility was 2.35% atDecember 31, 2002.
During 2002 and 2001, EOG utilized commercial paperand short-term funding from uncommitted credit facilities,bearing market interest rates, for various corporate financingpurposes. Commercial paper and uncommitted credit borrow-ings are classified as long-term debt based on EOG’s intentand ability to ultimately replace such amounts with otherlong-term debt.
The 6.00% to 6.70% Notes due 2004 to 2028 wereissued through public offerings and have effective interestrates of 6.14% to 6.83%. The Subsidiary Debt due 2011 bearsinterest at a fixed rate of 7.00% and is guaranteed by EOG.
At December 31, 2002, the aggregate annual maturitiesof long-term debt outstanding were none for 2003, $100 mil-lion for 2004, $150 million for 2005, $127 million in 2006and $100 million for 2007.
EOG’s credit facilities contain certain restrictivecovenants, including a maximum debt-to-total capitalizationratio of 65% and a minimum ratio of EBITDAX (earningsbefore interest, taxes, DD&A, and exploration expense) tointerest expense of at least three times. Other than thesecovenants, EOG does not have any other financial covenants inits financing agreements. EOG continues to comply with thesetwo covenants and does not view them as materially restrictive.Shelf Registration. During the third quarter of 2000, EOGfiled a shelf registration statement for the offer and sale fromtime to time of up to $600 million of EOG debt securities,preferred stock and/or common stock. The registration state-

2 0 0 2 A N N U A L R E P O R T T O S H A R E H O L D E R S 29
ment was declared effective by the Securities and ExchangeCommission on October 27, 2000. As of February 19, 2003,EOG had sold no securities pursuant to this shelf registration.When combined with the unused portion of a previously filedregistration statement declared effective in January 1998,these registration statements provide for the offer and salefrom time to time of EOG debt securities, preferred stockand/or common stock by EOG in an aggregate amount up to$688 million.Fair Value Of Long-Term Debt. At December 31, 2002 and2001, EOG had $1,145 million and $856 million, respective-ly, of long-term debt which had fair values of approximately$1,225 million and $838 million, respectively. The fair valueof long-term debt is the value EOG would have to pay to retirethe debt, including any premium or discount to the debthold-er for the differential between the stated interest rate and theyear-end market rate. The fair value of long-term debt is basedupon quoted market prices and, where such quotes were notavailable, upon interest rates available to EOG at yearend.
3. Shareholders’ EquityEOG purchases its common stock from time to time in theopen market to be held in treasury for the purpose of, but notlimited to, fulfilling any obligations arising under EOG’sstock plans and any other approved transactions or activitiesfor which such common stock shall be required. In September2001, EOG’s Board of Directors authorized the purchase of anaggregate maximum of 10 million shares of common stock ofEOG which superseded all previous authorizations. AtDecember 31, 2002, 6,917,000 shares remain available forrepurchases under this authorization.
To supplement its share repurchase program, EOG entersinto equity derivative transactions from time to time. Thesetransactions are accounted for as equity transactions with pre-miums received recorded to Additional Paid In Capital in theConsolidated Balance Sheets. Settlement alternatives under allcircumstances are at the option of EOG and include physicalshare, net share and net cash settlement. During the secondquarter of 2001, EOG sold put options for $1.2 million obli-gating EOG to purchase up to 0.6 million shares of its com-mon stock at an average price of $33.42 per share. Theseoptions expired unexercised in December 2001. During thefirst half of 2000, EOG entered into a series of equity deriva-tive transactions receiving $0.6 million. During the thirdquarter of 2000, EOG closed substantially all of its equityderivative contracts which were to expire in April 2001 bypaying $3.75 million. EOG had one million put optionswhich it had written which were outstanding at December 31,2000. The strike price of these options was $18.00 per share,and they expired unexercised in April 2001.
The following summarizes shares of common stock out-standing (in thousands):
Common Shares
2002 2001 2000
Outstanding at January 1 . . . . . . . . . . 115,452 116,904 119,105
Repurchased . . . . . . . . . . (1,700) (3,281) (8,910)Issued Pursuant
to Stock Options and Stock Plans . . . . . 968 1,829 6,709
Outstanding at December 31 . . . . . . . 114,720 115,452 116,904
Series A. On December 10, 1999, EOG issued 100,000 sharesof Fixed Rate Cumulative Perpetual Senior Preferred Stock,Series A, with a $1,000 Liquidation Preference per share, in aprivate transaction. Dividends will be payable on the sharesonly if declared by EOG’s Board of Directors and will becumulative. If declared, dividends will be payable at a rate of$71.95 per share, per year on March 15, June 15, September15, and December 15 of each year beginning March 15, 2000.EOG may redeem all or a part of the Series A preferred stockat any time beginning on December 15, 2009 at $1,000 pershare, plus accrued and unpaid dividends. The shares may alsobe redeemable, in whole but not in part, in the event that cer-tain amendments are made to the Dividend ReceivedPercentage. The Series A preferred shares are not convertibleinto, or exchangeable for, common stock of EOG.Series C. On December 22, 1999, EOG issued 500 shares ofFlexible Money Market Cumulative Preferred Stock, Series C,with a liquidation preference of $100,000 per share, in a pri-vate transaction. Dividends will be payable on the shares onlyif declared by EOG’s Board of Directors and will be cumula-tive. The initial dividend rate on the shares will be 6.84%until December 15, 2004 (the “Initial Period-End DividendPayment Date”). Through the Initial Period-End DividendPayment Date dividends will be payable, if declared, on March15, June 15, September 15, and December 15 of each yearbeginning March 15, 2000. The cash dividend rate for eachsubsequent dividend period will be determined pursuant toperiodic auctions conducted in accordance with certain auctionprocedures. The first auction date will be December 14, 2004.After December 15, 2004 (unless EOG has elected a “Non-Call Period” for a subsequent dividend period), EOG mayredeem the shares, in whole or in part, on any dividend pay-ment date at $100,000 per share plus accumulated and unpaiddividends. The shares may also be redeemable, in whole butnot in part, in the event that certain amendments are made tothe Dividend Received Percentage. The Series C preferredshares are not convertible into, or exchangeable for, commonstock of EOG.

E O G R E S O U R C E S , I N C .30
During the third quarter of 2000, EOG completed twoexchange offers for its preferred stock whereby shares of EOG’sSeries A preferred stock were exchanged for shares of EOG’sSeries B preferred stock, and shares of EOG’s Series C preferredstock were exchanged for shares of EOG’s Series D preferredstock. All preferred shares were validly tendered and not with-drawn prior to expiration of the offers. EOG accepted all of thetendered shares and issued the respective series in exchange.Both exchange offers were registered under the Securities Actof 1933. The Series B preferred stock has substantially thesame terms as Series A and the Series D preferred stock hassubstantially the same terms as Series C.
On February 14, 2000, EOG’s Board of Directors declareda dividend of one preferred share purchase right (a “Right,”and the agreement governing the terms of such Rights, the“Rights Agreement”) for each outstanding share of commonstock, par value $.01 per share. The Board of Directors hasadopted this Rights Agreement to protect stockholders fromcoercive or otherwise unfair takeover tactics. The dividend wasdistributed to the stockholders of record on February 24,2000. Each Right, expiring February 24, 2010, represents aright to buy from EOG one hundredth (1/100) of a share ofSeries E Junior Participating Preferred Stock (“PreferredShare”) for $90, once the Rights become exercisable. This por-tion of a Preferred Share will give the stockholder approxi-mately the same dividend, voting, and liquidation rights aswould one share of common stock. Prior to exercise, the Rightdoes not give its holder any dividend, voting, or liquidationrights. If issued, each one hundredth (1/100) of a PreferredShare (i) will not be redeemable; (ii) will entitle holders toquarterly dividend payments of $.01 per share, or an amountequal to the dividend paid on one share of common stock,whichever is greater; (iii) will entitle holders upon liquidationeither to receive $1 per share or an amount equal to the pay-ment made on one share of common stock, whichever isgreater; (iv) will have the same voting power as one share ofcommon stock; and (v) if shares of EOG’s common stock areexchanged via merger, consolidation, or a similar transaction,will entitle holders to a per share payment equal to the pay-ment made on one share of common stock.
The Rights will not be exercisable until ten days after thepublic announcement that a person or group has become anacquiring person (“Acquiring Person”) by obtaining beneficialownership of 10% or more of EOG’s common stock, or if ear-lier, ten business days (or a later date determined by EOG’sBoard of Directors before any person or group becomes anAcquiring Person) after a person or group begins a tender orexchange offer which, if consummated, would result in thatperson or group becoming an Acquiring Person. On December10, 2002, the Rights Agreement was amended to create an
exception to the definition of Acquiring Person to permit aqualified institutional investor to beneficially own 10% ormore but less than 15% of EOG’s common stock withoutbeing deemed an Acquiring Person if the institutional investormeets the following requirements: (i) the institutional investoris described in Rule 13d-1(b)(1) promulgated under theSecurities Exchange Act of 1934 and is eligible to report (anddoes in fact report) beneficial ownership of common stock onSchedule 13G; (ii) the institutional investor is not required tofile a Schedule 13D (or any successor or comparable report)with respect to its beneficial ownership of EOG’s commonstock; and (iii) the institutional investor does not beneficiallyown 15% or more of EOG’s common stock then outstanding.
If a person or group becomes an Acquiring Person, allholders of Rights except the Acquiring Person may, for $90,purchase shares of EOG’s common stock with a market valueof $180, based on the market price of the common stock priorto such acquisition. If EOG is later acquired in a merger orsimilar transaction after the Rights become exercisable, allholders of Rights except the Acquiring Person may, for $90,purchase shares of the acquiring corporation with a marketvalue of $180 based on the market price of the acquiring cor-poration’s stock, prior to such merger.
EOG’s Board of Directors may redeem the Rights for $.01per Right at any time before any person or group becomes anAcquiring Person. If the Board of Directors redeems anyRights, it must redeem all of the Rights. Once the Rights areredeemed, the only right of the holders of Rights will be toreceive the redemption price of $.01 per Right. The redemp-tion price will be adjusted if EOG has a stock split or stockdividends of EOG’s common stock. After a person or groupbecomes an Acquiring Person, but before an Acquiring Personowns 50% or more of EOG’s outstanding common stock, theBoard of Directors may exchange the Rights for common stockor equivalent security at an exchange ratio of one share of com-mon stock or an equivalent security for each such Right, otherthan Rights held by the Acquiring Person.
4. Enron Corp. BankruptcyIn December 2001, Enron Corp. and certain of its affiliates,including Enron North America Corp., filed voluntary peti-tions for reorganization under Chapter 11 of the United StatesBankruptcy Code. EOG recorded $19.2 million in chargesassociated with the Enron bankruptcies in the fourth quarterof 2001 related to certain contracts with Enron affiliates,including 2001 and 2002 natural gas and crude oil derivativecontracts. Based on EOG’s review of all matters related toEnron Corp. and its affiliates, EOG believes that Enron Corp.’sChapter 11 proceedings will not have a material adverse effecton EOG’s financial position.

2 0 0 2 A N N U A L R E P O R T T O S H A R E H O L D E R S 31
By an order entered on June 21, 2002, the bankruptcyjudge in the Enron bankruptcy case authorized the sale of 11.5million shares of EOG common stock held by an affiliate ofEnron. On November 22, 2002, the entire 11.5 million shareswere sold by the Enron affiliate to an unaffiliated broker. EOGpurchased one million shares of EOG common stock from thebroker, and the remaining 10.5 million shares were sold by thebroker to third parties.
5. Income TaxesThe principal components of EOG’s net deferred income taxliability at December 31, 2002 and 2001 were as follows (inthousands):
2002 2001
Deferred Income Tax AssetsNon-Producing
Leasehold Costs . . . . . . . . . . . . $ 29,574 $ 26,727Seismic Costs Capitalized
for Tax . . . . . . . . . . . . . . . . . . . 18,657 17,828Alternative Minimum Tax
Credit Carryforward. . . . . . . . . 20,200 -Other . . . . . . . . . . . . . . . . . . . . . 12,589 26,325
Total Deferred Income Tax Assets . . . . . . . 81,020 70,880
Deferred Income Tax LiabilitiesOil and Gas Exploration and
Development Costs Deducted for Tax Over Book Depreciation, Depletion and Amortization . . 731,189 599,945
Capitalized Interest . . . . . . . . . . 10,779 8,373Mark-to-market . . . . . . . . . . . . . - 10,107Other . . . . . . . . . . . . . . . . . . . . . - 3,475
Total Deferred Income Tax Liabilities . . . . 741,968 621,900
Net Deferred Income Tax Liability. . . . . . $660,948 $551,020
The components of income before income taxes were asfollows (in thousands):
2002 2001 2000
United States . . . . . . $ 37,354 $ 488,741 $491,823Foreign . . . . . . . . . . 82,318 142,704 141,734
Total. . . . . . . . $119,672 $ 631,445 $633,557
Total income tax provision was as follows (in thousands):
2002 2001 2000
Current:Federal . . . . . . . . . . $ (61,013) $ 36,737 $ 81,912State . . . . . . . . . . . . (5,130) 5,475 7,528Foreign . . . . . . . . . . 16,463 25,672 49,457
Total . . . . . . . . . . . (49,680) 67,884 138,897Deferred:
Federal . . . . . . . . . . 57,232 131,127 78,833State . . . . . . . . . . . . (358) 10,411 10,324Foreign . . . . . . . . . . 25,305 23,407 8,572
Total . . . . . . . . . . . 82,179 164,945 97,729Income Tax Provision . . $ 32,499 $ 232,829 $ 236,626
The differences between taxes computed at the U.S. fed-eral statutory tax rate and EOG’s effective rate were as follows:
2002 2001 2000
Statutory Federal Income Tax Rate . . . . . . . 35.00% 35.00% 35.00%
State Income Tax, Net of Federal Benefit . . . . . . 0.22 1.64 1.83
Income Tax Provision Related to Foreign Operations . . . . . . . . . . . . (3.54) 0.36 1.32
Tight Gas Sands Federal Income Tax Credits . . . . . (3.57) (0.83) (0.90)
Other . . . . . . . . . . . . . . . . (0.95) 0.70 0.10Effective Income Tax Rate . . 27.16% 36.87% 37.35%
EOG’s foreign subsidiaries’ undistributed earnings ofapproximately $543 million at December 31, 2002 are con-sidered to be indefinitely invested outside the U.S. and,accordingly, no U.S. federal or state income taxes have beenprovided thereon. Upon distribution of those earnings in theform of dividends, EOG may be subject to both foreign with-holding taxes and U.S. income taxes, net of allowable foreigntax credits. Determination of any potential amount of unrec-ognized deferred income tax liabilities is not practicable.
In 1999 and 2000, EOG entered into arrangements witha third party whereby certain Section 29 credits (Tight GasSands Federal Income Tax Credits) were sold by EOG to thethird party, and payments for such credits have been receivedon an as-generated basis. As a result of these transactions, forthe period of 2000 through 2002, EOG recorded a deferred taxasset representing a tax gain on the sale of the Section 29 cred-it properties, which has reversed as the results of operations ofsuch properties were recognized for book purposes. In January2003, these arrangements were terminated.
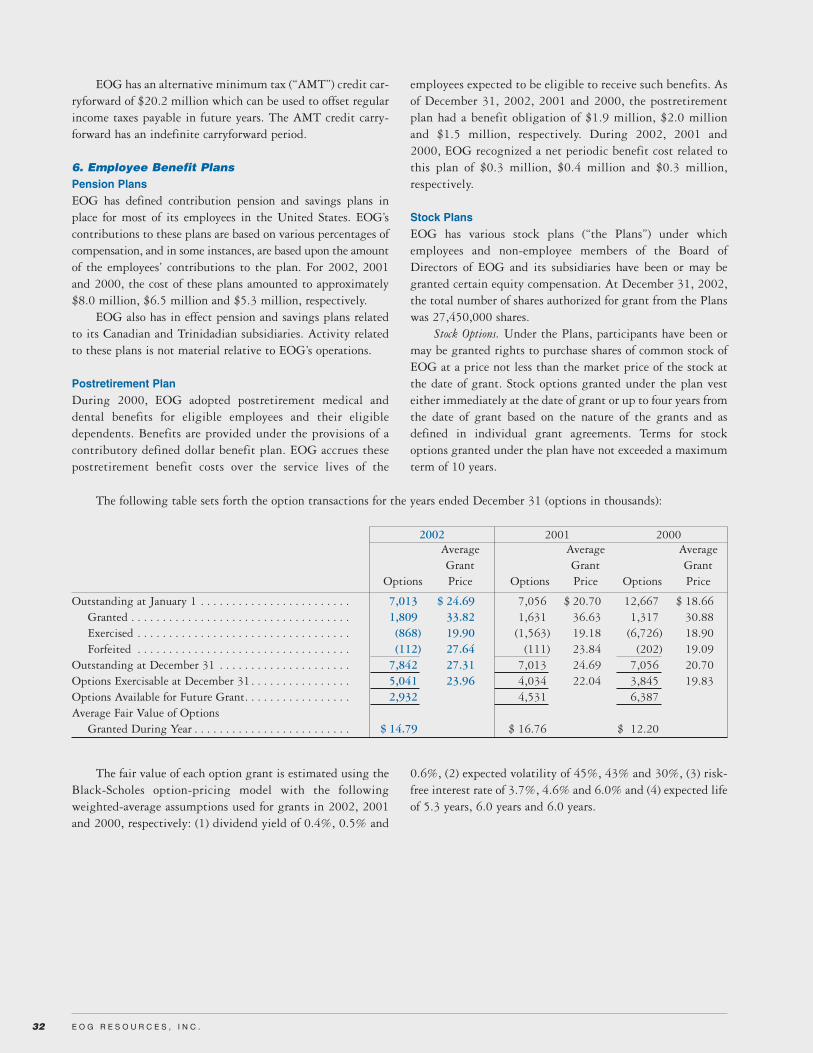
E O G R E S O U R C E S , I N C .32
EOG has an alternative minimum tax (“AMT”) credit car-ryforward of $20.2 million which can be used to offset regularincome taxes payable in future years. The AMT credit carry-forward has an indefinite carryforward period.
6. Employee Benefit Plans Pension PlansEOG has defined contribution pension and savings plans inplace for most of its employees in the United States. EOG’scontributions to these plans are based on various percentages ofcompensation, and in some instances, are based upon the amountof the employees’ contributions to the plan. For 2002, 2001and 2000, the cost of these plans amounted to approximately$8.0 million, $6.5 million and $5.3 million, respectively.
EOG also has in effect pension and savings plans relatedto its Canadian and Trinidadian subsidiaries. Activity relatedto these plans is not material relative to EOG’s operations.
Postretirement PlanDuring 2000, EOG adopted postretirement medical anddental benefits for eligible employees and their eligibledependents. Benefits are provided under the provisions of acontributory defined dollar benefit plan. EOG accrues thesepostretirement benefit costs over the service lives of the
employees expected to be eligible to receive such benefits. Asof December 31, 2002, 2001 and 2000, the postretirementplan had a benefit obligation of $1.9 million, $2.0 millionand $1.5 million, respectively. During 2002, 2001 and2000, EOG recognized a net periodic benefit cost related tothis plan of $0.3 million, $0.4 million and $0.3 million,respectively.
Stock PlansEOG has various stock plans (“the Plans”) under whichemployees and non-employee members of the Board ofDirectors of EOG and its subsidiaries have been or may begranted certain equity compensation. At December 31, 2002,the total number of shares authorized for grant from the Planswas 27,450,000 shares.
Stock Options. Under the Plans, participants have been ormay be granted rights to purchase shares of common stock ofEOG at a price not less than the market price of the stock atthe date of grant. Stock options granted under the plan vesteither immediately at the date of grant or up to four years fromthe date of grant based on the nature of the grants and asdefined in individual grant agreements. Terms for stockoptions granted under the plan have not exceeded a maximumterm of 10 years.
The following table sets forth the option transactions for the years ended December 31 (options in thousands):
2002 2001 2000Average Average AverageGrant Grant Grant
Options Price Options Price Options Price
Outstanding at January 1 . . . . . . . . . . . . . . . . . . . . . . . . 7,013 $ 24.69 7,056 $ 20.70 12,667 $ 18.66Granted . . . . . . . . . . . . . . . . . . . . . . . . . . . . . . . . . . . 1,809 33.82 1,631 36.63 1,317 30.88Exercised . . . . . . . . . . . . . . . . . . . . . . . . . . . . . . . . . . (868) 19.90 (1,563) 19.18 (6,726) 18.90Forfeited . . . . . . . . . . . . . . . . . . . . . . . . . . . . . . . . . . (112) 27.64 (111) 23.84 (202) 19.09
Outstanding at December 31 . . . . . . . . . . . . . . . . . . . . . 7,842 27.31 7,013 24.69 7,056 20.70Options Exercisable at December 31. . . . . . . . . . . . . . . . 5,041 23.96 4,034 22.04 3,845 19.83Options Available for Future Grant. . . . . . . . . . . . . . . . . 2,932 4,531 6,387Average Fair Value of Options
Granted During Year . . . . . . . . . . . . . . . . . . . . . . . . . $ 14.79 $ 16.76 $ 12.20
The fair value of each option grant is estimated using theBlack-Scholes option-pricing model with the followingweighted-average assumptions used for grants in 2002, 2001and 2000, respectively: (1) dividend yield of 0.4%, 0.5% and
0.6%, (2) expected volatility of 45%, 43% and 30%, (3) risk-free interest rate of 3.7%, 4.6% and 6.0% and (4) expected lifeof 5.3 years, 6.0 years and 6.0 years.
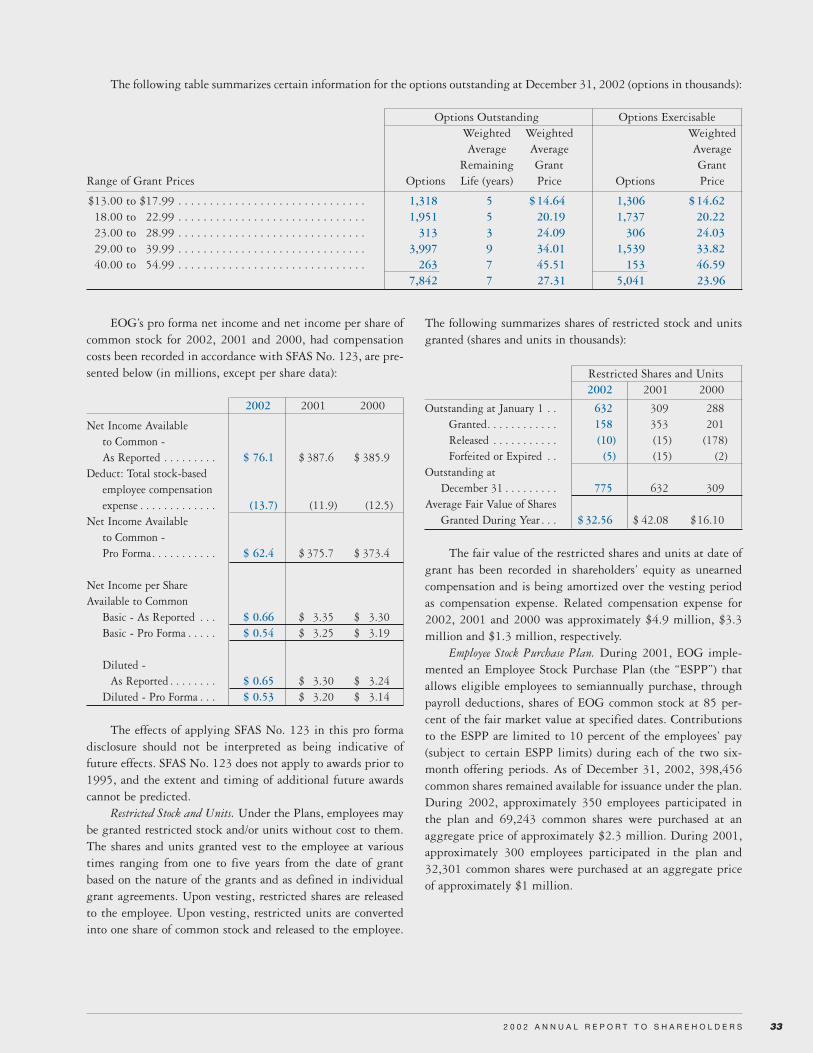
2 0 0 2 A N N U A L R E P O R T T O S H A R E H O L D E R S 33
The following table summarizes certain information for the options outstanding at December 31, 2002 (options in thousands):
Options Outstanding Options ExercisableWeighted Weighted WeightedAverage Average Average
Remaining Grant GrantRange of Grant Prices Options Life (years) Price Options Price
$13.00 to $17.99 . . . . . . . . . . . . . . . . . . . . . . . . . . . . . . 1,318 5 $14.64 1,306 $14.6218.00 to 22.99 . . . . . . . . . . . . . . . . . . . . . . . . . . . . . . 1,951 5 20.19 1,737 20.2223.00 to 28.99 . . . . . . . . . . . . . . . . . . . . . . . . . . . . . . 313 3 24.09 306 24.0329.00 to 39.99 . . . . . . . . . . . . . . . . . . . . . . . . . . . . . . 3,997 9 34.01 1,539 33.8240.00 to 54.99 . . . . . . . . . . . . . . . . . . . . . . . . . . . . . . 263 7 45.51 153 46.59
7,842 7 27.31 5,041 23.96
EOG’s pro forma net income and net income per share ofcommon stock for 2002, 2001 and 2000, had compensationcosts been recorded in accordance with SFAS No. 123, are pre-sented below (in millions, except per share data):
2002 2001 2000
Net Income Available to Common - As Reported . . . . . . . . . $ 76.1 $ 387.6 $ 385.9
Deduct: Total stock-based employee compensation expense . . . . . . . . . . . . . (13.7) (11.9) (12.5)
Net Income Available to Common - Pro Forma. . . . . . . . . . . $ 62.4 $ 375.7 $ 373.4
Net Income per Share Available to Common
Basic - As Reported . . . $ 0.66 $ 3.35 $ 3.30Basic - Pro Forma . . . . . $ 0.54 $ 3.25 $ 3.19
Diluted - As Reported . . . . . . . . $ 0.65 $ 3.30 $ 3.24
Diluted - Pro Forma . . . $ 0.53 $ 3.20 $ 3.14
The effects of applying SFAS No. 123 in this pro formadisclosure should not be interpreted as being indicative offuture effects. SFAS No. 123 does not apply to awards prior to1995, and the extent and timing of additional future awardscannot be predicted.
Restricted Stock and Units. Under the Plans, employees maybe granted restricted stock and/or units without cost to them.The shares and units granted vest to the employee at varioustimes ranging from one to five years from the date of grantbased on the nature of the grants and as defined in individualgrant agreements. Upon vesting, restricted shares are releasedto the employee. Upon vesting, restricted units are convertedinto one share of common stock and released to the employee.
The following summarizes shares of restricted stock and unitsgranted (shares and units in thousands):
Restricted Shares and Units2002 2001 2000
Outstanding at January 1 . . 632 309 288Granted. . . . . . . . . . . . 158 353 201Released . . . . . . . . . . . (10) (15) (178)Forfeited or Expired . . (5) (15) (2)
Outstanding at December 31 . . . . . . . . . 775 632 309
Average Fair Value of Shares Granted During Year . . . $ 32.56 $ 42.08 $16.10
The fair value of the restricted shares and units at date ofgrant has been recorded in shareholders’ equity as unearnedcompensation and is being amortized over the vesting periodas compensation expense. Related compensation expense for2002, 2001 and 2000 was approximately $4.9 million, $3.3million and $1.3 million, respectively.
Employee Stock Purchase Plan. During 2001, EOG imple-mented an Employee Stock Purchase Plan (the “ESPP”) thatallows eligible employees to semiannually purchase, throughpayroll deductions, shares of EOG common stock at 85 per-cent of the fair market value at specified dates. Contributionsto the ESPP are limited to 10 percent of the employees’ pay(subject to certain ESPP limits) during each of the two six-month offering periods. As of December 31, 2002, 398,456common shares remained available for issuance under the plan.During 2002, approximately 350 employees participated inthe plan and 69,243 common shares were purchased at anaggregate price of approximately $2.3 million. During 2001,approximately 300 employees participated in the plan and32,301 common shares were purchased at an aggregate priceof approximately $1 million.

E O G R E S O U R C E S , I N C .34
Treasury SharesDuring 2002, 2001 and 2000, EOG repurchased 1,700,000,3,281,000 and 8,910,000 of its common shares, respectively.Approximately 968,000, 1,829,000 and 6,709,000 of thesecommon shares were repurchased during 2002, 2001 and2000, respectively, to offset the dilution resulting from sharesissued under the EOG employee stock plans. The differencebetween the cost of the treasury shares and the exercise price ofthe options, net of federal income tax benefit of $5.2 million,$7.3 million and $41.3 million, for the years 2002, 2001 and2000, respectively, is reflected as an adjustment to additionalpaid in capital to the extent EOG has accumulated additionalpaid in capital relating to treasury stock and retained earningsthereafter.
7. Commitments and ContingenciesLetters Of Credit. At December 31, 2002 and 2001, EOG hadletters of credit and guarantees outstanding totaling approxi-mately $234 million and $136 million, respectively; however,of these amounts, $220 million and $120 million, respective-ly, represent guarantees of subsidiary indebtedness includedunder Note 2 “Long-Term Debt.”Minimum Commitments. At December 31, 2002, total mini-mum commitments from foreign equity investments, long-term non-cancelable operating leases, drilling rig commit-ments and transportation service commitments, based on cur-rent transportation rates and the foreign currency exchangerate applicable to Canadian dollars at December 31, 2002, areas follows (in thousands):
Total MinimumCommitments
2003 . . . . . . . . . . . . . . . . . . . . . . . . . . . . . . $ 23,9022004 - 2006 . . . . . . . . . . . . . . . . . . . . . . . . 41,2882007 - 2008 . . . . . . . . . . . . . . . . . . . . . . . . 9,7712009 and thereafter. . . . . . . . . . . . . . . . . . . 4,249
$ 79,210
Included in the table above are leases for buildings, facil-ities and equipment with varying expiration dates through2009. Rental expenses associated with these leases amountedto $21 million, $20 million and $15 million for 2002, 2001and 2000, respectively.Contingencies. EOG and numerous other companies in thenatural gas industry are named as defendants in various law-suits alleging violations of the Civil False Claims Act. Theselawsuits have been consolidated for pre-trial proceedings inthe United States District Court for the District of Wyoming.The plaintiffs contend that defendants have underpaid royal-ties on natural gas and natural gas liquids produced on feder-al and Indian lands through the use of below-market prices,improper deductions, improper measurement techniques andtransactions with affiliated companies. Plaintiffs allege that
the royalties paid by defendants were lower than the royaltiesrequired to be paid under federal regulations and that theforms filed by defendants with the Minerals ManagementService reporting these royalty payments were false, therebyviolating the Civil False Claims Act. The United States hasintervened in certain of the cases as to some of the defendants,but has not intervened as to EOG. The plaintiffs in one of thetwo lawsuits in which EOG is involved recently dismissedEOG from that case without prejudice. Based on EOG’s pres-ent understanding of the remaining case in which it is a defen-dant, EOG believes that it has substantial defenses to theplaintiff’s claims and intends to vigorously assert these defens-es. However, if EOG is found to have violated the Civil FalseClaims Act, EOG could be subject to a variety of sanctions,including treble damages and substantial monetary fines.
There are various other suits and claims against EOG thathave arisen in the ordinary course of business. However, man-agement does not believe these suits and claims will individu-ally or in the aggregate have a material adverse effect on thefinancial condition or results of operations of EOG. EOG hasbeen named as a potentially responsible party in certainComprehensive Environmental Response Compensation andLiability Act proceedings. However, management does notbelieve that any potential assessments resulting from such pro-ceedings will individually or in the aggregate have a materialadverse effect on the financial condition of EOG.
8. Net Income Per Share Available to CommonThe following table sets forth the computation of basic anddiluted earnings from net income available to common for theyears ended December 31 (in thousands, except per shareamounts):
2002 2001 2000
Numerator for basic and diluted earnings per share -
Net income available to common . . . . . . . . $ 76,141 $387,622 $385,903
Denominator for basic earnings per share -
Weighted average shares. . . . . 115,335 115,765 116,934
Potential dilutive common shares -
Stock options . . . . . . . 1,633 1,453 2,038Restricted stock
and units . . . . . . . . 277 270 130Denominator for diluted
earnings per share - Adjusted weighted
average shares. . . . . 117,245 117,488 119,102Net income per share
of common stockBasic . . . . . . . . . . . . . $ 0.66 $ 3.35 $ 3.30Diluted . . . . . . . . . . . $ 0.65 $ 3.30 $ 3.24

2 0 0 2 A N N U A L R E P O R T T O S H A R E H O L D E R S 35
9. Supplemental Cash Flow InformationCash paid for interest and income taxes was as follows for theyears ended December 31 (in thousands):
2002 2001 2000
Interest (net of amountcapitalized) . . . . . . . . . $ 54,432 $ 45,715 $ 61,679
Income taxes . . . . . . . . . . . 15,946 106,312 87,285
10. Business Segment InformationEOG’s operations are all natural gas and crude oil explorationand production related. SFAS No. 131, “Disclosures aboutSegments of an Enterprise and Related Information,” estab-lishes standards for reporting information about operating seg-ments in annual financial statements and requires selectedinformation about operating segments in interim financial
reports. Operating segments are defined as components of anenterprise about which separate financial information is avail-able and evaluated regularly by the chief operating decisionmaker, or decision making group, in deciding how to allocateresources and in assessing performance. EOG’s chief operatingdecision making process is informal and involves theChairman and Chief Executive Officer and other key officers.This group routinely reviews and makes operating decisionsrelated to significant issues associated with each of EOG’smajor producing areas in the United States and each signifi-cant international location. For segment reporting purposes,the major United States producing areas have been aggregatedas one reportable segment due to similarities in their opera-tions as allowed by SFAS No. 131. Financial information byreportable segment is presented below for the years endedDecember 31, or at December 31 (in thousands):
United States Canada Trinidad Other Total
2002Net Operating Revenues . . . . . . . . . . . . . . . . . . . . . . . . . . . $ 846,071)
(1) $ 169,365)(1) $ 79,551 $ 49 $ 1,095,036)
(1)
Depreciation, Depletion and Amortization . . . . . . . . . . . . . . 334,318 49,622 14,085 11 398,036Operating Income (Loss) . . . . . . . . . . . . . . . . . . . . . . . . . . . . 93,681 40,846 49,450 (2,646) 181,331Interest Income. . . . . . . . . . . . . . . . . . . . . . . . . . . . . . . . . . . 765 229 348 - 1,342Other Income (Expense) . . . . . . . . . . . . . . . . . . . . . . . . . . . . (3,747) 2 394 4 (3,347)Interest Expense . . . . . . . . . . . . . . . . . . . . . . . . . . . . . . . . . . 53,345 6,097 211 1 59,654Income (Loss) Before Income Taxes . . . . . . . . . . . . . . . . . . . . 37,354 34,980 49,981 (2,643) 119,672Income Tax Provision (Benefit) . . . . . . . . . . . . . . . . . . . . . . . (7,684) 20,359 20,974 (1,150) 32,499Additions to Oil and Gas Properties . . . . . . . . . . . . . . . . . . . 517,578 160,840 35,689 20 714,127Total Assets . . . . . . . . . . . . . . . . . . . . . . . . . . . . . . . . . . . . . 2,864,990 665,490 283,395 131 3,814,006
2001Net Operating Revenues . . . . . . . . . . . . . . . . . . . . . . . . . . . $ 1,394,457)
(1) $ 191,219))(1) $ 69,140 $ 71 $ 1,654,887)
(1)
Depreciation, Depletion and Amortization . . . . . . . . . . . . . . 348,539 31,821 12,031 8 392,399Operating Income (Loss) . . . . . . . . . . . . . . . . . . . . . . . . . . . . 536,671 107,524 36,761 (6,404) 674,552Interest Income. . . . . . . . . . . . . . . . . . . . . . . . . . . . . . . . . . . 415 2,943 1,702 - 5,060Other Income (Expense) . . . . . . . . . . . . . . . . . . . . . . . . . . . . (3,284) 71 154 2 (3,057)Interest Expense . . . . . . . . . . . . . . . . . . . . . . . . . . . . . . . . . . 45,061 750 (701) - 45,110Income (Loss) Before Income Taxes . . . . . . . . . . . . . . . . . . . . 488,741 109,788 39,318 (6,402) 631,445Income Tax Provision (Benefit) . . . . . . . . . . . . . . . . . . . . . . . 187,285 28,438 20,166 (3,060) 232,829Additions to Oil and Gas Properties . . . . . . . . . . . . . . . . . . . 729,655 176,101 68,260 - 974,016Total Assets . . . . . . . . . . . . . . . . . . . . . . . . . . . . . . . . . . . . . 2,676,160 510,476 227,229 179 3,414,044
2000Net Operating Revenues . . . . . . . . . . . . . . . . . . . . . . . . . . . $ 1,223,315)
(1) $ 184,092)(1) $ 82,430 $ 58 $ 1,489,895)
(1)
Depreciation, Depletion and Amortization . . . . . . . . . . . . . . 310,685 34,621 13,959 - 359,265Operating Income (Loss) . . . . . . . . . . . . . . . . . . . . . . . . . . . . 552,091 103,229 41,974 (431) 696,863Interest Income. . . . . . . . . . . . . . . . . . . . . . . . . . . . . . . . . . . 354 2,186 915 382 3,837Other Income (Expense) . . . . . . . . . . . . . . . . . . . . . . . . . . . . (6,343) 302 31 (127) (6,137)Interest Expense . . . . . . . . . . . . . . . . . . . . . . . . . . . . . . . . . . 54,279 11,140 (4,413) - 61,006Income (Loss) Before Income Taxes . . . . . . . . . . . . . . . . . . . . 491,823 94,577 47,333 (176) 633,557Income Tax Provision (Benefit) . . . . . . . . . . . . . . . . . . . . . . . 181,506 31,159 24,076 (115) 236,626Additions to Oil and Gas Properties . . . . . . . . . . . . . . . . . . . 499,207 69,157 33,223 1,051 602,638Total Assets . . . . . . . . . . . . . . . . . . . . . . . . . . . . . . . . . . . . . 2,465,642 374,476 159,872 1,263 3,001,253
(1) EOG had sales activity with a certain purchaser in the United States and Canada segments in 2002 and 2001 that totaled approximately $141.9 millionand $224.5 million, respectively, of the Consolidated Net Operating Revenues. Sales activity with another purchaser in the United States and Canada seg-ments in 2000 totaled approximately $183.2 million of the Consolidated Net Operating Revenues.
283,395
227,229
159,872

E O G R E S O U R C E S , I N C .36
11. Price and Interest Rate Risk ManagementActivitiesEOG engages in price risk management activities from time totime. These activities are intended to manage EOG’s exposureto fluctuations in commodity prices for natural gas and crudeoil. EOG utilizes derivative financial instruments, primarilyprice swaps and collars, as the means to manage this price risk.
During 2002, 2001 and 2000, EOG elected not to desig-nate any of its derivative contracts as accounting hedges andaccordingly, accounted for these derivative contracts usingmark-to-market accounting. During 2002, EOG recognizedmark-to-market losses on commodity contracts of $49 million,
which included realized losses of $21 million and a $2 millioncollar premium payment. During 2001, EOG recognizedmark-to-market gains on commodity contracts of $98 million,of which $62 million were realized gains. During 2000, EOGrecognized and realized approximately $1 million mark-to-market losses on commodity contracts.
Presented below is a summary of EOG’s 2003 natural gasfinancial collar contracts and crude oil financial price swapcontracts as of December 31, 2002. The fair value of the natu-ral gas financial collar contracts and the crude oil financialprice swap contracts at December 31, 2002 was negative $4.3million and negative $1.6 million, respectively.
Natural Gas Financial Collar Contracts Crude Oil FinancialFloor Price Ceiling Price Swap Contracts
Weighted Weighted WeightedVolume Floor Range Average Ceiling Range Average Volume Average Price
Month (MMBtud) ($/MMBtu) ($/MMBtu) ($/MMBtu) ($/MMBtu) (Bbld) ($/Bbl)
Jan 50,000 $3.87 $3.87 $6.09 $6.09 2,000 $27.34Feb 75,000 3.76 - 4.19 3.90 5.05 - 5.98 5.67 2,000 26.91Mar 75,000 3.61 - 4.08 3.76 5.00 - 5.83 5.55 2,000 26.57Apr 75,000 3.59 - 3.88 3.69 4.80 - 4.97 4.91 2,000 26.16May 75,000 3.54 - 3.78 3.62 4.70 - 4.92 4.84 2,000 25.75Jun 75,000 3.56 - 3.78 3.63 4.70 - 4.94 4.86 2,000 25.39Jul 75,000 3.59 - 3.79 3.66 4.73 - 4.97 4.89 2,000 25.07
Aug 75,000 3.60 - 3.79 3.66 4.73 - 4.98 4.90 2,000 24.84Sep 75,000 3.60 - 3.77 3.65 4.73 - 4.98 4.89 2,000 24.63Oct 75,000 3.60 - 3.77 3.65 4.73 - 4.98 4.90 2,000 24.41Nov 75,000 3.77 - 3.91 3.81 4.90 - 5.15 5.06 2,000 24.28Dec 75,000 3.92 - 4.04 3.96 5.05 - 5.30 5.22 2,000 24.10
Presented below is a summary of EOG’s 2003 natural gas financial collar contracts and natural gas and crude oil financialprice swap contracts as of February 19, 2003:
Natural Gas Financial Collar Contracts Financial Price Swap ContractsFloor Price Ceiling Price Natural Gas Crude Oil
Weighted WeightedFloor Weighted Ceiling Weighted Average Average
Volume Range Average Range Average Volume Price Volume PriceMonth (MMBtud) ($/MMBtu) ($/MMBtu) ($/MMBtu) ($/MMBtu) (MMBtud) ($/MMBtu) (Bbld) ($/Bbl)
Jan 150,000 $3.87 $3.87 $6.09 $6.09 - - 2,000 $27.34Feb 125,000 3.76 - 4.30 4.04 5.05 - 6.30 5.87 - - 2,000 26.91Mar 125,000 3.61 - 4.20 3.93 5.00 - 6.20 5.77 100,000 $5.19 4,000 27.96Apr 125,000 3.59 - 4.02 3.82 4.80 - 6.03 5.33 100,000 4.96 5,000 27.77May 125,000 3.54 - 3.92 3.74 4.70 - 5.92 5.24 100,000 4.82 5,000 27.04Jun 125,000 3.56 - 3.89 3.74 4.70 - 5.90 5.25 100,000 4.77 5,000 26.43Jul 125,000 3.59 - 3.91 3.76 4.73 - 5.91 5.27 100,000 4.77 5,000 25.90
Aug 125,000 3.60 - 3.91 3.76 4.73 - 5.91 5.27 100,000 4.77 5,000 25.49Sep 125,000 3.60 - 3.89 3.75 4.73 - 5.89 5.26 100,000 4.74 5,000 25.19Oct 125,000 3.60 - 3.90 3.75 4.73 - 5.90 5.27 100,000 4.74 5,000 24.90Nov 125,000 3.77 - 4.04 3.90 4.90 - 6.04 5.43 - - 5,000 24.70Dec 125,000 3.92 - 4.18 4.04 5.05 - 6.18 5.57 - - 5,000 24.47

2 0 0 2 A N N U A L R E P O R T T O S H A R E H O L D E R S 37
During 2001 and 2000, EOG recognized in natural gasand crude oil and condensate revenues hedge losses of $1 mil-lion and $17 million, respectively, related to closed hedgepositions.Interest Rate Swap Agreements and Foreign CurrencyContracts. At December 31, 2000, a subsidiary of EOG andEOG were parties to offsetting foreign currency and interestrate swap agreements with an aggregate notional principalamount of $210 million. Such swap agreements terminated inJanuary 2001. Presently, EOG is not a party to any foreigncurrency or interest rate swap agreement.
The following table summarizes the estimated fair valueof financial instruments and related transactions at December31, 2002 and 2001 (in millions):
2002 2001Carrying Estimated Carrying EstimatedAmount Fair Value(1) Amount Fair Value(1)
Long-Term Debt(2) $ 1,145.1 $ 1,224.9 $ 856.0 $ 838.3NYMEX-Related
Commodity Market Positions (5.9) (5.9) 19.2 19.2
(1) Estimated fair values have been determined by using available marketdata and valuation methodologies. Judgment is necessarily required ininterpreting market data and the use of different market assumptions orestimation methodologies may affect the estimated fair value amounts.
(2) See Note 2 “Long-Term Debt.”
Credit Risk. While notional contract amounts are used toexpress the magnitude of commodity price and interest rateswap agreements, the amounts potentially subject to creditrisk, in the event of nonperformance by the other parties, aresubstantially smaller. EOG evaluates its exposure to all coun-terparties on an ongoing basis, including those arising fromphysical and financial transactions. In some instances, EOGrequires collateral from its counterparties to minimize anyrisk, and EOG is actively considering other means of reducingits exposure to individual companies. At December 31, 2002,approximately 13% of EOG’s net accounts receivable balancerelated to natural gas, crude oil and condensate sales was duefrom a major utility company. This amount was collected dur-ing early 2003. The amount due from this utility company atDecember 31, 2001, which approximated 11% of the netaccounts receivable balance, was collected during 2002. Noother individual purchaser accounted for 10% or more of thenet accounts receivable balance at December 31, 2002 and2001. At December 31, 2002, EOG had an allowance fordoubtful accounts of $20.3 million, of which $19.2 million isassociated with the Enron bankruptcies.
12. Concentration of Credit RiskSubstantially all of EOG’s accounts receivable at December 31,2002 and 2001 result from crude oil and natural gas salesand/or joint interest billings to third party companies includ-ing foreign state-owned entities in the oil and gas industry.This concentration of customers and joint interest owners mayimpact EOG’s overall credit risk, either positively or negative-ly, in that these entities may be similarly affected by changesin economic or other conditions. In determining whether ornot to require collateral from a customer or joint interestowner, EOG analyzes the entity’s net worth, cash flows, earn-ings, and credit ratings. Receivables are generally not collater-alized. Historical credit losses incurred on receivables by EOGhave been immaterial except for those associated with theEnron bankruptcies.
13. Accounting for Certain Long-Lived AssetsPeriodically, EOG reviews its oil and gas properties for impair-ment purposes by comparing the expected undiscountedfuture cash flows at a producing field level to the unamortizedcapitalized cost of the asset. During 2002, 2001 and 2000,such reviews indicated that unamortized capitalized costs ofcertain properties were higher than their expected undiscount-ed future cash flows due primarily to downward reserve revi-sions and lower natural gas and crude oil prices. As a result,EOG recorded in Impairments pre-tax charges of $30 million,$39 million and $11 million, respectively, for 2002, 2001 and2000 in the United States operating segment. The carryingvalues for assets determined to be impaired were adjusted toestimated fair values based on projected future net cash flowsdiscounted using EOG’s risk-adjusted discount rate.Amortization expenses of acquisition costs of unproved prop-erties, including amortization of capitalized interest, were $38million, $40 million and $35 million for 2002, 2001 and2000, respectively.
14. Investment in Caribbean Nitrogen CompanyLimited and Nitrogen (2000) UnlimitedEOG, through a subsidiary, owns an approximate 16% equityinterest in a Trinidadian company named Caribbean NitrogenCompany Limited (“CNCL”) which has constructed an ammo-nia plant in Pt. Lisas, Trinidad. The other shareholders inCNCL are subsidiaries of Ferrostaal AG, Duke Energy,Halliburton and CL Financial Ltd. At December 31, 2002,investment in CNCL was approximately $14 million. CNCLcommenced production in June 2002 and currently producesapproximately 1,850 metric tons of ammonia daily. AtDecember 31, 2002, CNCL had a long-term debt balance ofapproximately $219 million, which is non-recourse to CNCL’s

E O G R E S O U R C E S , I N C .38
shareholders. EOG will be liable for its share of any post-com-pletion deficiency funds loans to fund the costs of operation,payment of principal and interest to the principal creditor andother cash deficiencies of CNCL up to $30 million, approxi-mately $5 million of which is net to EOG’s interest. TheShareholders’ Agreement requires the consent of the holders of90% or more of the shares to take certain material actions.Accordingly, given its current level of equity ownership, EOGis able to exercise significant influence over the operating andfinancial policies of CNCL and therefore, it accounts for theinvestment using the equity method. During 2002, EOG rec-ognized equity income of $0.3 million.
Secondly, EOG, through a subsidiary, owns an approxi-mate 31% equity interest in a Trinidadian company namedNitrogen (2000) Unlimited (“N2000”). The other sharehold-ers in N2000 are subsidiaries of Ferrostaal AG, Halliburtonand CL Financial Ltd. At December 31, 2002, investment inN2000 was approximately $18 million. N2000 is construct-ing an ammonia plant in Trinidad, at an expected cost ofapproximately $320 million, and is expected to commenceproduction in 2005. At December 31, 2002, N2000 had along-term debt balance of approximately $7 million, which iscurrently recourse to N2000’s shareholders. Upon receipt of anamendment to N2000’s certificate of environmental clearance,this long-term debt will become non-recourse to N2000’s
shareholders. N2000 has applied for the amendment andbelieves that it will be received in the near future. EOG willbe liable for its share of any pre-completion deficiency fundsloans to fund plant cost overruns up to $15 million, approxi-mately $5 million of which is net to EOG’s interest. EOG willalso be liable for its share of any post-completion deficiencyfunds loans to fund the costs of operation, payment of princi-pal and interest to the principal creditor and other cash defi-ciencies of N2000 up to $30 million, approximately $9 mil-lion of which is net to EOG’s interest. The Shareholders’Agreement requires the consent of the holders of 90% or moreof the shares to take certain material actions. Accordingly,given its current level of equity ownership, EOG is able toexercise significant influence over the operating and financialpolicies of N2000 and therefore, it accounts for the investmentusing the equity method.
In November 2002, the EOG subsidiaries along with theFerrostaal subsidiaries entered into share purchase agreementsfor the sale of a portion of their shareholdings in CNCL andN2000 with a third party energy company. EOG expects theEOG subsidiaries to close these transactions during the firstquarter of 2003 once certain conditions precedent haveoccurred. EOG does not expect these transactions to result inany gains or losses.

2 0 0 2 A N N U A L R E P O R T T O S H A R E H O L D E R S 39
Oil and Gas Producing ActivitiesThe following disclosures are made in accordance with SFASNo. 69-“Disclosures about Oil and Gas Producing Activities”:Oil and Gas Reserves. Users of this information should beaware that the process of estimating quantities of “proved,”“proved developed” and “proved undeveloped” crude oil andnatural gas reserves is very complex, requiring significant sub-jective decisions in the evaluation of all available geological,engineering and economic data for each reservoir. The data fora given reservoir may also change substantially over time as aresult of numerous factors including, but not limited to, addi-tional development activity, evolving production history, andcontinual reassessment of the viability of production undervarying economic conditions. Consequently, material revisionsto existing reserve estimates occur from time to time.Although every reasonable effort is made to ensure that reserveestimates reported represent the most accurate assessmentspossible, the significance of the subjective decisions requiredand variances in available data for various reservoirs make theseestimates generally less precise than other estimates presentedin connection with financial statement disclosures.
Proved reserves represent estimated quantities of naturalgas, crude oil, condensate, and natural gas liquids that geolog-ical and engineering data demonstrate, with reasonable cer-tainty, to be recoverable in future years from known reservoirsunder economic and operating conditions existing at the timethe estimates were made.
Proved developed reserves are proved reserves expected tobe recovered, through wells and equipment in place and underoperating methods being utilized at the time the estimateswere made.
Proved undeveloped reserves are reserves that are expect-ed to be recovered from new wells on undrilled acreage, orfrom existing wells where a relatively major expenditure isrequired for completion. Reserves on undrilled acreage arelimited to those drilling units offsetting productive units thatare reasonably certain of production when drilled. Provedreserves for other undrilled units can be claimed only where itcan be demonstrated with certainty that there is continuity ofproduction from the existing productive formation. Estimates
for proved undeveloped reserves are not attributed to anyacreage for which an application of fluid injection or otherimproved recovery technique is contemplated, unless suchtechniques have been proved effective by actual tests in thearea and in the same reservoir.
Canadian provincial royalties are determined based on agraduated percentage scale which varies with prices and pro-duction volumes. Canadian reserves, as presented on a netbasis, assume prices and royalty rates in existence at the timethe estimates were made, and EOG’s estimate of future pro-duction volumes. Future fluctuations in prices, productionrates, or changes in political or regulatory environments couldcause EOG’s share of future production from Canadian reservesto be materially different from that presented.
Estimates of proved and proved developed reserves atDecember 31, 2002, 2001 and 2000 were based on studiesperformed by the engineering staff of EOG for reserves in theUnited States, Canada and Trinidad. Opinions by DeGolyerand MacNaughton (“D&M”), independent petroleum consult-ants, for the years ended December 31, 2002, 2001 and 2000covered producing areas containing 73%, 71% and 49%,respectively, of proved reserves of EOG on a net-equivalent-cubic-feet-of-gas basis. D&M’s opinions indicate that the esti-mates of proved reserves prepared by EOG’s engineering stafffor the properties reviewed by D&M, when compared in totalon a net-equivalent-cubic-feet-of-gas basis, do not differ mate-rially from the estimates prepared by D&M. Such estimates byD&M in the aggregate varied by not more than 5% from thoseprepared by the engineering staff of EOG. All reports by D&Mwere developed utilizing geological and engineering data pro-vided by EOG.
No major discovery or other favorable or adverse eventsubsequent to December 31, 2002 is believed to have caused amaterial change in the estimates of proved or proved devel-oped reserves as of that date.
The following table sets forth EOG’s net proved andproved developed reserves at December 31 for each of the fouryears in the period ended December 31, 2002, and the changesin the net proved reserves for each of the three years in the peri-od then ended as estimated by the engineering staff of EOG.
Supplemental Information to Consolidated Financial Statements
(In Thousands, Except Per Share Amounts, Unless Otherwise Indicated)
(Unaudited Except for Results of Operations for Oil and Gas Producing Activities)

E O G R E S O U R C E S , I N C .40
Net Proved and Proved Developed Reserve Summary
Net Proved ReservesUnited States Canada Trinidad TOTAL
Natural Gas (Bcf)Net proved reserves at December 31, 1999 . . . . . . . . . . 1,657.2 523.5 994.6 3,175.3
Revisions of previous estimates. . . . . . . . . . . . . . . . . 47.2 6.4 (0.4) 53.2Purchases in place. . . . . . . . . . . . . . . . . . . . . . . . . . . 188.8 39.4 - 228.2Extensions, discoveries and other additions. . . . . . . . 255.4 23.8 65.1 344.3Sales in place . . . . . . . . . . . . . . . . . . . . . . . . . . . . . . (84.2) (0.1) - (84.3)Production . . . . . . . . . . . . . . . . . . . . . . . . . . . . . . . . (243.0) (47.3) (45.8) (336.1)
Net proved reserves at December 31, 2000 . . . . . . . . . . 1,821.4 545.7 1,013.5 3,380.6Revisions of previous estimates. . . . . . . . . . . . . . . . . 15.0 (26.8) (121.6) (133.4)Purchases in place. . . . . . . . . . . . . . . . . . . . . . . . . . . 66.1 111.5 - 177.6Extensions, discoveries and other additions. . . . . . . . 358.3 59.7 295.2 713.2Sales in place . . . . . . . . . . . . . . . . . . . . . . . . . . . . . . (1.0) - - (1.0)Production . . . . . . . . . . . . . . . . . . . . . . . . . . . . . . . . (252.5) (46.0) (42.0) (340.5)
Net proved reserves at December 31, 2001 . . . . . . . . . . 2,007.3 644.1 1,145.1 3,796.5Revisions of previous estimates. . . . . . . . . . . . . . . . . 9.4 4.7 (21.7) (7.6)Purchases in place. . . . . . . . . . . . . . . . . . . . . . . . . . . 9.9 102.9 - 112.8Extensions, discoveries and other additions. . . . . . . . 217.0 83.9 232.4 533.3Sales in place . . . . . . . . . . . . . . . . . . . . . . . . . . . . . . (0.8) (1.5) - (2.3)Production . . . . . . . . . . . . . . . . . . . . . . . . . . . . . . . . (236.6) (56.2) (49.3) (342.1)
Net proved reserves at December 31, 2002 . . . . . . . . . . 2,006.2 777.9 1,306.5 4,090.6
Liquids (MBbl)Net proved reserves at December 31, 1999 . . . . . . . . . . 47,847 8,896 15,763 72,506
Revisions of previous estimates. . . . . . . . . . . . . . . . . (1,951) 46 28 (1,877)Purchases in place. . . . . . . . . . . . . . . . . . . . . . . . . . . 3,948 - - 3,948Extensions, discoveries and other additions. . . . . . . . 12,433 404 738 13,575Sales in place . . . . . . . . . . . . . . . . . . . . . . . . . . . . . . (484) (2,474) - (2,958)Production . . . . . . . . . . . . . . . . . . . . . . . . . . . . . . . . (9,780) (1,055) (957) (11,792)
Net proved reserves at December 31, 2000 . . . . . . . . . . 52,013 5,817 15,572 73,402Revisions of previous estimates. . . . . . . . . . . . . . . . . (3,111) 1,294 (3,691) (5,508)Purchases in place. . . . . . . . . . . . . . . . . . . . . . . . . . . 586 35 - 621Extensions, discoveries and other additions. . . . . . . . 12,380 361 1,967 14,708Sales in place . . . . . . . . . . . . . . . . . . . . . . . . . . . . . . (192) (35) - (227)Production . . . . . . . . . . . . . . . . . . . . . . . . . . . . . . . . (9,293) (820) (749) (10,862)
Net proved reserves at December 31, 2001 . . . . . . . . . . 52,383 6,652 13,099 72,134Revisions of previous estimates. . . . . . . . . . . . . . . . . 3,543 396 (572) 3,367Purchases in place. . . . . . . . . . . . . . . . . . . . . . . . . . . 624 865 - 1,489Extensions, discoveries and other additions. . . . . . . . 14,763 279 3,041 18,083Sales in place . . . . . . . . . . . . . . . . . . . . . . . . . . . . . . (33) - - (33)Production . . . . . . . . . . . . . . . . . . . . . . . . . . . . . . . . (7,925) (1,026) (874) (9,825)
Net proved reserves at December 31, 2002 . . . . . . . . . . 63,355 7,166 14,694 85,215

2 0 0 2 A N N U A L R E P O R T T O S H A R E H O L D E R S 41
United States Canada Trinidad TOTAL
Bcf Equivalent (Bcfe)Net proved reserves at December 31, 1999 . . . . . . . . . . 1,944.3 576.9 1,089.2 3,610.4
Revisions of previous estimates. . . . . . . . . . . . . . . . . 35.5 6.8 (0.2) 42.1Purchases in place. . . . . . . . . . . . . . . . . . . . . . . . . . . 212.5 39.4 - 251.9Extensions, discoveries and other additions. . . . . . . . 330.0 26.2 69.5 425.7Sales in place . . . . . . . . . . . . . . . . . . . . . . . . . . . . . . (87.1) (15.0) - (102.1)Production . . . . . . . . . . . . . . . . . . . . . . . . . . . . . . . . (301.7) (53.7) (51.6) (407.0)
Net proved reserves at December 31, 2000 . . . . . . . . . . 2,133.5 580.6 1,106.9 3,821.0Revisions of previous estimates. . . . . . . . . . . . . . . . . (3.7) (19.1) (143.7) (166.5)Purchases in place. . . . . . . . . . . . . . . . . . . . . . . . . . . 69.7 111.6 - 181.3Extensions, discoveries and other additions. . . . . . . . 432.5 62.0 307.0 801.5Sales in place . . . . . . . . . . . . . . . . . . . . . . . . . . . . . . (2.2) (0.2) - (2.4)Production . . . . . . . . . . . . . . . . . . . . . . . . . . . . . . . . (308.2) (50.9) (46.5) (405.6)
Net proved reserves at December 31, 2001 . . . . . . . . . . 2,321.6 684.0 1,223.7 4,229.3Revisions of previous estimates. . . . . . . . . . . . . . . . . 30.7 7.1 (25.1) 12.7Purchases in place. . . . . . . . . . . . . . . . . . . . . . . . . . . 13.6 108.1 - 121.7Extensions, discoveries and other additions. . . . . . . . 305.6 85.6 250.6 641.8Sales in place . . . . . . . . . . . . . . . . . . . . . . . . . . . . . . (1.0) (1.5) - (2.5)Production . . . . . . . . . . . . . . . . . . . . . . . . . . . . . . . . (284.2) (62.4) (54.5) (401.1)
Net proved reserves at December 31, 2002 . . . . . . . . . . 2,386.3 820.9 1,394.7 4,601.9
Net Proved Developed Reserves at:United States Canada Trinidad TOTAL
Natural Gas (Bcf)December 31, 1999 . . . . . . . . . . . . . . . . . . . . . . . . . 1,446.5 451.1 250.2 2,147.8December 31, 2000 . . . . . . . . . . . . . . . . . . . . . . . . . 1,498.6 479.4 207.0 2,185.0December 31, 2001 . . . . . . . . . . . . . . . . . . . . . . . . . 1,588.4 587.6 620.6 2,796.6December 31, 2002 . . . . . . . . . . . . . . . . . . . . . . . . . 1,658.7 683.3 555.2 2,897.2
Liquids (MBbl)December 31, 1999 . . . . . . . . . . . . . . . . . . . . . . . . . 41,717 7,041 3,833 52,591December 31, 2000 . . . . . . . . . . . . . . . . . . . . . . . . . 42,132 5,695 2,967 50,794December 31, 2001 . . . . . . . . . . . . . . . . . . . . . . . . . 41,205 6,532 8,435 56,172December 31, 2002 . . . . . . . . . . . . . . . . . . . . . . . . . 47,476 7,045 7,135 61,656
Bcf Equivalents (Bcfe)December 31, 1999 . . . . . . . . . . . . . . . . . . . . . . . . . 1,696.8 493.3 273.2 2,463.3December 31, 2000 . . . . . . . . . . . . . . . . . . . . . . . . . 1,751.4 513.6 224.8 2,489.8December 31, 2001 . . . . . . . . . . . . . . . . . . . . . . . . . 1,835.7 626.8 671.1 3,133.6December 31, 2002 . . . . . . . . . . . . . . . . . . . . . . . . . 1,943.6 725.5 598.0 3,267.1

E O G R E S O U R C E S , I N C .42
Capitalized Costs Relating to Oil and Gas ProducingActivities. The following table sets forth the capitalized costsrelating to EOG’s natural gas and crude oil producing activi-ties at December 31, 2002 and 2001:
2002 2001
Proved Properties . . . . . . . . . . . $ 6,527,716 $ 5,847,053Unproved Properties. . . . . . . . . 222,379 218,550
Total . . . . . . . . . . . . . . 6,750,095 6,065,603Accumulated depreciation,
depletion and amortization . (3,428,547) (3,009,693)Net capitalized costs. . . . . . . . . $ 3,321,548 $ 3,055,910
Costs Incurred in Oil and Gas Property Acquisition,Exploration and Development Activities. The acquisition,exploration and development costs disclosed in the followingtables are in accordance with definitions in SFAS No. 19-“Financial Accounting and Reporting by Oil and GasProducing Companies.”
Acquisition costs include costs incurred to purchase,lease, or otherwise acquire property.
Exploration costs include exploration expenses and addi-tions to exploration wells including those in progress.
Development costs include additions to production facil-ities and equipment and additions to development wellsincluding those in progress.
The following tables set forth costs incurred related to EOG’s oil and gas activities for the years ended December 31:
United States Canada Trinidad Other TOTAL
2002Acquisition Costs of Properties
Unproved . . . . . . . . . . . . . . . . . . . . . . . . . . . . . . . . . . . $ 28,232 $ 4,754 $ 5,629 $ - $ 38,615Proved . . . . . . . . . . . . . . . . . . . . . . . . . . . . . . . . . . . . . 22,589 48,487 - - 71,076
Subtotal . . . . . . . . . . . . . . . . . . . . . . . . . . . . . . . . 50,821 53,241 5,629 - 109,691Exploration Costs . . . . . . . . . . . . . . . . . . . . . . . . . . . . . . . 120,058 25,866 18,117 2,384 166,425Development Costs . . . . . . . . . . . . . . . . . . . . . . . . . . . . . . 423,436 107,952 13,600 - 544,988
Subtotal . . . . . . . . . . . . . . . . . . . . . . . . . . . . . . . . 594,315 187,059 37,346 2,384 821,104Deferred Income Tax Gross Up . . . . . . . . . . . . . . . . . . . . . - 14,938 - - 14,938
Total . . . . . . . . . . . . . . . . . . . . . . . . . . . . . . . . . . . $ 594,315 $ 201,997 $ 37,346 $ 2,384 $ 836,042
2001Acquisition Costs of Properties
Unproved . . . . . . . . . . . . . . . . . . . . . . . . . . . . . . . . . . . $ 69,308 $ 6,967 $ - $ - $ 76,275Proved . . . . . . . . . . . . . . . . . . . . . . . . . . . . . . . . . . . . . 95,646 72,660 - - 168,306
Subtotal . . . . . . . . . . . . . . . . . . . . . . . . . . . . . . . . 164,954 79,627 - - 244,581Exploration Costs . . . . . . . . . . . . . . . . . . . . . . . . . . . . . . . 163,602 16,708 13,695 8,739 202,744Development Costs . . . . . . . . . . . . . . . . . . . . . . . . . . . . . . 512,175 92,374 60,969 - 665,518
Subtotal . . . . . . . . . . . . . . . . . . . . . . . . . . . . . . . . 840,731 188,709 74,664 8,739 1,112,843Deferred Income Tax Gross Up . . . . . . . . . . . . . . . . . . . . . 19,411 30,845 - - 50,256
Total . . . . . . . . . . . . . . . . . . . . . . . . . . . . . . . . . . . $ 860,142 $ 219,554 $ 74,664 $ 8,739 $1,163,099
2000Acquisition Costs of Properties
Unproved . . . . . . . . . . . . . . . . . . . . . . . . . . . . . . . . . . . $ 45,456 $ 5,741 $ - $ - $ 51,197Proved . . . . . . . . . . . . . . . . . . . . . . . . . . . . . . . . . . . . . 88,473 13,965 - - 102,438
Subtotal . . . . . . . . . . . . . . . . . . . . . . . . . . . . . . . . 133,929 19,706 - - 153,635Exploration Costs . . . . . . . . . . . . . . . . . . . . . . . . . . . . . . . 98,654 9,711 10,849 3,581 122,795Development Costs . . . . . . . . . . . . . . . . . . . . . . . . . . . . . . 335,053 46,000 29,688 - 410,741
Subtotal . . . . . . . . . . . . . . . . . . . . . . . . . . . . . . . . 567,636 75,417 40,537 3,581 687,171Deferred Income Tax Gross Up . . . . . . . . . . . . . . . . . . . . . 18,744 3,685 - - 22,429
Total . . . . . . . . . . . . . . . . . . . . . . . . . . . . . . . . . . . $ 586,380 $ 79,102 $ 40,537 $ 3,581 $ 709,600

2 0 0 2 A N N U A L R E P O R T T O S H A R E H O L D E R S 43
Results of Operations for Oil and Gas Producing Activities(1). The following tables set forth results of operations for oil and gasproducing activities for the years ended December 31:
United States Canada Trinidad SUBTOTAL Other(2) TOTAL
2002Natural Gas, Crude Oil and
Condensate Revenues . . . . . . . . . . . . . . . . . $ 891,960 $ 170,875 $ 79,551 $ 1,142,386 $ 52 $ 1,142,438Gains (Losses) on Sales of Reserves and
Related Assets and Other, Net . . . . . . . . . . 2,616 (1,510) - 1,106 - 1,106Total . . . . . . . . . . . . . . . . . . . . . . . . . . . . . 894,576 169,365 79,551 1,143,492 52 1,143,544
Exploration Expenses, including Dry Hole. . . . 78,937 26,171 1,656 106,764 213 106,977Production Costs . . . . . . . . . . . . . . . . . . . . . . . 186,024 48,261 9,977 244,262 88 244,350Impairments. . . . . . . . . . . . . . . . . . . . . . . . . . . 65,813 2,619 - 68,432 (2) 68,430Depreciation, Depletion and Amortization. . . . 334,318 49,622 14,085 398,025 11 398,036Income (Loss) before Income Taxes . . . . . . . . . . 229,484 42,692 53,833 326,009 (258) 325,751Income Tax Provision (Benefit). . . . . . . . . . . . . 82,136 10,319 23,971 116,426 (90) 116,336Results of Operations . . . . . . . . . . . . . . . . . . . . $ 147,348 $ 32,373 $ 29,862 $ 209,583 $ (168) $ 209,415
2001Natural Gas, Crude Oil and
Condensate Revenues . . . . . . . . . . . . . . . . . $ 1,295,894 $ 191,096 $ 69,141 $ 1,556,131 $ 72 $ 1,556,203Gains on Sales of Reserves and
Related Assets and Other, Net . . . . . . . . . . 811 123 - 934 - 934Total . . . . . . . . . . . . . . . . . . . . . . . . . . . . . 1,296,705 191,219 69,141 1,557,065 72 1,557,137
Exploration Expenses, including Dry Hole. . . . 113,419 12,596 6,405 132,420 6,407 138,827Production Costs . . . . . . . . . . . . . . . . . . . . . . . 219,504 34,426 10,308 264,238 49 264,287Impairments. . . . . . . . . . . . . . . . . . . . . . . . . . . 76,801 2,355 - 79,156 - 79,156Depreciation, Depletion and Amortization. . . . 348,397 31,821 12,031 392,249 9 392,258Income (Loss) before Income Taxes . . . . . . . . . . 538,584 110,021 40,397 689,002 (6,393) 682,609Income Tax Provision (Benefit). . . . . . . . . . . . . 198,243 32,663 22,218 253,124 (2,238) 250,886Results of Operations . . . . . . . . . . . . . . . . . . . . $ 340,341 $ 77,358 $ 18,179 $ 435,878 $ (4,155) $ 431,723
2000Natural Gas, Crude Oil and
Condensate Revenues . . . . . . . . . . . . . . . . . $ 1,215,051 $ 183,989 $ 82,431 $ 1,481,471 $ 59 $ 1,481,530Gains on Sales of Reserves and
Related Assets and Other, Net . . . . . . . . . . 9,262 103 - 9,365 - 9,365Total . . . . . . . . . . . . . . . . . . . . . . . . . . . . . 1,224,313 184,092 82,431 1,490,836 59 1,490,895
Exploration Expenses, including Dry Hole. . . . 72,000 4,881 7,314 84,195 337 84,532Production Costs . . . . . . . . . . . . . . . . . . . . . . . 181,266 31,784 15,669 228,719 129 228,848Impairments. . . . . . . . . . . . . . . . . . . . . . . . . . . 39,775 6,703 - 46,478 - 46,478Depreciation, Depletion and Amortization. . . . 310,612 34,621 13,959 359,192 2 359,194Income (Loss) before Income Taxes . . . . . . . . . . 620,660 106,103 45,489 772,252 (409) 771,843Income Tax Provision (Benefit). . . . . . . . . . . . . 226,657 41,274 25,019 292,950 (143) 292,807Results of Operations . . . . . . . . . . . . . . . . . . . . $ 394,003 $ 64,829 $ 20,470 $ 479,302 $ (266) $ 479,036
(1) Excludes mark-to-market gains or losses on commodity derivative contracts, interest charges and general corporate expenses for each of the three years inthe period ended December 31, 2002.
(2) Other includes other international operations.

E O G R E S O U R C E S , I N C .44
Standardized Measure of Discounted Future Net Cash FlowsRelating to Proved Oil and Gas Reserves. The followinginformation has been developed utilizing procedures pre-scribed by SFAS No. 69 and based on crude oil and natural gasreserve and production volumes estimated by the engineeringstaff of EOG. It may be useful for certain comparison purpos-es, but should not be solely relied upon in evaluating EOG orits performance. Further, information contained in the follow-ing table should not be considered as representative of realis-tic assessments of future cash flows, nor should theStandardized Measure of Discounted Future Net Cash Flowsbe viewed as representative of the current value of EOG.
The future cash flows presented below are based on salesprices, cost rates, and statutory income tax rates in existence asof the date of the projections. It is expected that material revi-
sions to some estimates of crude oil and natural gas reservesmay occur in the future, development and production of thereserves may occur in periods other than those assumed, andactual prices realized and costs incurred may vary significantlyfrom those used.
Management does not rely upon the following informa-tion in making investment and operating decisions. Such deci-sions are based upon a wide range of factors, including esti-mates of probable as well as proved reserves, and varying priceand cost assumptions considered more representative of a rangeof possible economic conditions that may be anticipated.
The following table sets forth the standardized measure ofdiscounted future net cash flows from projected production ofEOG’s crude oil and natural gas reserves for the years endedDecember 31:
United States Canada Trinidad TOTAL
2002Future cash inflows. . . . . . . . . . . . . . . . . . . . . . . . . . $ 9,826,571 $ 2,989,000 $ 2,303,930 $ 15,119,501Future production costs . . . . . . . . . . . . . . . . . . . . . . (2,212,357) (586,166) (433,029) (3,231,552)Future development costs . . . . . . . . . . . . . . . . . . . . . (359,787) (43,876) (177,275) (580,938)Future net cash flows before income taxes . . . . . . . . 7,254,427 2,358,958 1,693,626 11,307,011Future income taxes . . . . . . . . . . . . . . . . . . . . . . . . . (2,214,072) (653,425) (558,788) (3,426,285)Future net cash flows . . . . . . . . . . . . . . . . . . . . . . . . 5,040,355 1,705,533 1,134,838 7,880,726Discount to present value at 10% annual rate . . . . . (2,265,700) (766,567) (629,024) (3,661,291)Standardized measure of discounted
future net cash flows relatingto proved oil and gas reserves(1) . . . . . . . . . . . . . . $ 2,774,655 $ 938,966 $ 505,814 $ 4,219,435
2001Future cash inflows. . . . . . . . . . . . . . . . . . . . . . . . . . $ 5,677,824 $ 1,490,552 $ 1,472,197 $ 8,640,573Future production costs . . . . . . . . . . . . . . . . . . . . . . (1,528,474) (371,124) (335,395) (2,234,993)Future development costs . . . . . . . . . . . . . . . . . . . . . (387,048) (31,232) (110,331) (528,611)Future net cash flows before income taxes . . . . . . . . 3,762,302 1,088,196 1,026,471 5,876,969Future income taxes . . . . . . . . . . . . . . . . . . . . . . . . . (930,505) (295,739) (265,709) (1,491,953)Future net cash flows . . . . . . . . . . . . . . . . . . . . . . . . 2,831,797 792,457 760,762 4,385,016Discount to present value at 10% annual rate . . . . . (1,121,771) (321,980) (413,876) (1,857,627)Standardized measure of discounted
future net cash flows relatingto proved oil and gas reserves . . . . . . . . . . . . . . . $ 1,710,026 $ 470,477 $ 346,886 $ 2,527,389
2000Future cash inflows. . . . . . . . . . . . . . . . . . . . . . . . . . $ 18,500,822 $ 4,704,243 $ 1,860,366 $ 25,065,431Future production costs . . . . . . . . . . . . . . . . . . . . . . (2,766,579) (389,819) (668,549) (3,824,947)Future development costs . . . . . . . . . . . . . . . . . . . . . (279,407) (44,011) (194,741) (518,159)Future net cash flows before income taxes . . . . . . . . 15,454,836 4,270,413 997,076 20,722,325Future income taxes . . . . . . . . . . . . . . . . . . . . . . . . . (5,074,986) (1,451,776) (230,712) (6,757,474)Future net cash flows . . . . . . . . . . . . . . . . . . . . . . . . 10,379,850 2,818,637 766,364 13,964,851Discount to present value at 10% annual rate . . . . . (4,368,717) (1,304,886) (377,811) (6,051,414)Standardized measure of discounted
future net cash flows relatingto proved oil and gas reserves . . . . . . . . . . . . . . . $ 6,011,133 $ 1,513,751 $ 388,553 $ 7,913,437
(1) Natural gas prices have changed since December 31, 2002; consequently, the discounted future net cash flows would be different if the standardized meas-ure was calculated in the first quarter of 2003.

2 0 0 2 A N N U A L R E P O R T T O S H A R E H O L D E R S 45
Changes in Standardized Measure of Discounted Future Net Cash Flows. The following table sets forth the changes in thestandardized measure of discounted future net cash flows at December 31, for each of the three years in the period endedDecember 31, 2002:
United States Canada Trinidad TOTALDecember 31, 1999. . . . . . . . . . . . . . . . . . . . . . . . . . . . $ 1,727,232 $ 377,891 $ 288,933 $ 2,394,056
Sales and transfers of oil and gas produced, net of production costs . . . . . . . . . . . . . . . . . . . . (1,048,804) (152,602) (66,761) (1,268,167)
Net changes in prices and production costs . . . . . . . 5,459,629 1,850,021 153,961 7,463,611Extensions, discoveries, additions and
improved recovery net of related costs . . . . . . . . . 1,502,377 94,379 20,544 1,617,300Development costs incurred . . . . . . . . . . . . . . . . . . . 77,000 24,100 29,600 130,700Revisions of estimated development costs. . . . . . . . . (19,055) 39 (39,590) (58,606)Revisions of previous quantity estimates . . . . . . . . . 153,862 30,376 (129) 184,109Accretion of discount . . . . . . . . . . . . . . . . . . . . . . . . 190,045 48,912 45,192 284,149Net change in income taxes . . . . . . . . . . . . . . . . . . . (2,436,834) (606,556) 8,566 (3,034,824)Purchases of reserves in place . . . . . . . . . . . . . . . . . . 671,604 136,138 - 807,742Sales of reserves in place . . . . . . . . . . . . . . . . . . . . . . (331,960) (22,454) - (354,414)Changes in timing and other . . . . . . . . . . . . . . . . . . 66,037 (266,493) (51,763) (252,219)
December 31, 2000. . . . . . . . . . . . . . . . . . . . . . . . . . . . 6,011,133 1,513,751 388,553 7,913,437Sales and transfers of oil and gas produced,
net of production costs . . . . . . . . . . . . . . . . . . . . (1,060,926) (156,787) (58,832) (1,276,545)Net changes in prices and production costs . . . . . . . (6,400,910) (1,822,229) (194,995) (8,418,134)Extensions, discoveries, additions and
improved recovery net of related costs . . . . . . . . . 347,088 48,271 114,871 510,230Development costs incurred . . . . . . . . . . . . . . . . . . . 101,900 27,500 71,088 200,488Revisions of estimated development cost . . . . . . . . . (5,296) 2,931 10,947 8,582Revisions of previous quantity estimates . . . . . . . . . (3,563) (12,536) 47,418 31,319Accretion of discount . . . . . . . . . . . . . . . . . . . . . . . . 862,118 223,154 54,297 1,139,569Net change in income taxes . . . . . . . . . . . . . . . . . . . 2,313,068 592,322 15,087 2,920,477Purchases of reserves in place . . . . . . . . . . . . . . . . . . 35,686 78,790 - 114,476Sales of reserves in place . . . . . . . . . . . . . . . . . . . . . . (6,165) (303) - (6,468)Changes in timing and other . . . . . . . . . . . . . . . . . . (484,107) (24,387) (101,548) (610,042)
December 31, 2001. . . . . . . . . . . . . . . . . . . . . . . . . . . . 1,710,026 470,477 346,886 2,527,389Sales and transfers of oil and gas produced,
net of production costs . . . . . . . . . . . . . . . . . . . . (705,938) (122,614) (69,574) (898,126)Net changes in prices and production costs . . . . . . . 1,561,946 460,977 223,614 2,246,537Extensions, discoveries, additions and
improved recovery net of related costs . . . . . . . . . 499,257 123,700 110,415 733,372Development costs incurred . . . . . . . . . . . . . . . . . . . 84,300 18,100 13,600 116,000Revisions of estimated development cost . . . . . . . . . 35,255 (11,418) (20,574) 3,263Revisions of previous quantity estimates . . . . . . . . . 51,227 11,470 (15,634) 47,063Accretion of discount . . . . . . . . . . . . . . . . . . . . . . . . 200,701 59,594 48,622 308,917Net change in income taxes . . . . . . . . . . . . . . . . . . . (692,670) (135,888) (87,229) (915,787)Purchases of reserves in place . . . . . . . . . . . . . . . . . . 28,851 117,958 - 146,809Sales of reserves in place . . . . . . . . . . . . . . . . . . . . . . (715) (2,827) - (3,542)Changes in timing and other . . . . . . . . . . . . . . . . . . 2,415 (50,563) (44,312) (92,460)
December 31, 2002. . . . . . . . . . . . . . . . . . . . . . . . . . . . $ 2,774,655 $ 938,966 $ 505,814 $ 4,219,435

E O G R E S O U R C E S , I N C .46
Quarter EndedMarch 31 June 30 Sept. 30 Dec. 31
2002Net Operating Revenues . . . . . . . . . . . . . . . . . . . . $ 186,503 $ 290,503 $ 279,869 $ 338,161Operating Income (Loss). . . . . . . . . . . . . . . . . . . . . $ (20,706) $ 69,640 $ 61,700 $ 70,697
Income (Loss) Before Income Taxes . . . . . . . . . . . . . $ (35,860) $ 55,555 $ 42,866 $ 57,111Income Tax Provision (Benefit) . . . . . . . . . . . . . . . . (11,619) 17,447 13,979 12,692Net Income (Loss). . . . . . . . . . . . . . . . . . . . . . . . . . (24,241) 38,108 28,887 44,419Preferred Stock Dividends . . . . . . . . . . . . . . . . . . . 2,758 2,758 2,758 2,758Net Income (Loss) Available to Common . . . . . . . . $ (26,999) $ 35,350 $ 26,129 $ 41,661Net Income (Loss) per Share
Available to CommonBasic (1) . . . . . . . . . . . . . . . . . . . . . . . . . . . . . $ (0.23) $ 0.31 $ 0.23 $ 0.36Diluted(1) . . . . . . . . . . . . . . . . . . . . . . . . . . . $ (0.23) $ 0.30 $ 0.22 $ 0.36
Average Number of Common SharesBasic . . . . . . . . . . . . . . . . . . . . . . . . . . . . . . 115,485 115,737 115,621 114,742Diluted . . . . . . . . . . . . . . . . . . . . . . . . . . . . 115,485 117,689 117,078 116,908
2001Net Operating Revenues . . . . . . . . . . . . . . . . . . . . $ 597,253 $ 466,048 $ 354,172 $ 237,414Operating Income (Loss). . . . . . . . . . . . . . . . . . . . . $ 354,024 $ 234,239 $ 123,947 $ (37,658)
Income (Loss) Before Income Taxes . . . . . . . . . . . . . $ 340,096 $ 224,865 $ 114,977 $ (48,493)Income Tax Provision (Benefit) . . . . . . . . . . . . . . . . 124,849 88,662 43,014 (23,696)Net Income (Loss). . . . . . . . . . . . . . . . . . . . . . . . . . 215,247 136,203 71,963 (24,797)Preferred Stock Dividends . . . . . . . . . . . . . . . . . . . 2,721 2,757 2,759 2,757Net Income (Loss) Available to Common . . . . . . . . $ 212,526 $ 133,446 $ 69,204 $ (27,554)Net Income (Loss) per Share
Available to CommonBasic (1) . . . . . . . . . . . . . . . . . . . . . . . . . . . . . $ 1.83 $ 1.15 $ 0.60 $ (0.24)Diluted(1) . . . . . . . . . . . . . . . . . . . . . . . . . . . $ 1.79 $ 1.13 $ 0.59 $ (0.24)
Average Number of Common SharesBasic . . . . . . . . . . . . . . . . . . . . . . . . . . . . . . 116,384 115,870 115,692 115,115Diluted . . . . . . . . . . . . . . . . . . . . . . . . . . . . 118,952 118,047 117,141 115,115
(1) The sum of quarterly net income per share available to common may not agree with total year net income per share available to common as each quarterlycomputation is based on the weighted average of common shares outstanding.
Unaudited Quarterly Financial Information

2 0 0 2 A N N U A L R E P O R T T O S H A R E H O L D E R S 47
Selected Financial Data
Year Ended December 31,(In Thousands, Except Per Share Amounts) 2002 2001 2000
Statement of Income Data:Net Operating Revenues . . . . . . . . . . . . . . . . . . . . . . . . . . . . . . . . . . . . . . . . . . . $ 1,095,036 $ 1,654,887 $ 1,489,895Operating Expenses
Lease and Well . . . . . . . . . . . . . . . . . . . . . . . . . . . . . . . . . . . . . . . . . . . . . . . . 179,429 175,446 140,915Exploration Costs . . . . . . . . . . . . . . . . . . . . . . . . . . . . . . . . . . . . . . . . . . . . . . 60,228 67,467 67,196Dry Hole Costs. . . . . . . . . . . . . . . . . . . . . . . . . . . . . . . . . . . . . . . . . . . . . . . . 46,749 71,360 17,337Impairments. . . . . . . . . . . . . . . . . . . . . . . . . . . . . . . . . . . . . . . . . . . . . . . . . . 68,430 79,156 46,478Depreciation, Depletion and Amortization. . . . . . . . . . . . . . . . . . . . . . . . . . . 398,036 392,399 359,265General and Administrative . . . . . . . . . . . . . . . . . . . . . . . . . . . . . . . . . . . . . . 88,952 79,963 66,932Taxes Other Than Income . . . . . . . . . . . . . . . . . . . . . . . . . . . . . . . . . . . . . . . 71,881 95,333 94,909Charges Associated with Enron Bankruptcy . . . . . . . . . . . . . . . . . . . . . . . . . . - 19,211 -
Total . . . . . . . . . . . . . . . . . . . . . . . . . . . . . . . . . . . . . . . . . . . . . . . . . . . . . 913,705 980,335 793,032Operating Income . . . . . . . . . . . . . . . . . . . . . . . . . . . . . . . . . . . . . . . . . . . . . . . . 181,331 674,552 696,863Other Income (Expense), Net . . . . . . . . . . . . . . . . . . . . . . . . . . . . . . . . . . . . . . . (2,005) 2,003 (2,300)Interest Expense (Net of Interest Capitalized) . . . . . . . . . . . . . . . . . . . . . . . . . . . 59,654 45,110 61,006Income Before Income Taxes . . . . . . . . . . . . . . . . . . . . . . . . . . . . . . . . . . . . . . . . 119,672 631,445 633,557Income Tax Provision (Benefit) . . . . . . . . . . . . . . . . . . . . . . . . . . . . . . . . . . . . . . 32,499 232,829 236,626Net Income . . . . . . . . . . . . . . . . . . . . . . . . . . . . . . . . . . . . . . . . . . . . . . . . . . . . . 87,173 398,616 396,931Preferred Stock Dividends . . . . . . . . . . . . . . . . . . . . . . . . . . . . . . . . . . . . . . . . . . 11,032 10,994 11,028Net Income Available to Common . . . . . . . . . . . . . . . . . . . . . . . . . . . . . . . . . . . $ 76,141 $ 387,622 $ 385,903Net Income Per Share Available to Common
Basic. . . . . . . . . . . . . . . . . . . . . . . . . . . . . . . . . . . . . . . . . . . . . . . . . . . . . . . . $ 0.66 $ 3.35 $ 3.30Diluted. . . . . . . . . . . . . . . . . . . . . . . . . . . . . . . . . . . . . . . . . . . . . . . . . . . . . . $ 0.65 $ 3.30 $ 3.24
Average Number of Common SharesBasic. . . . . . . . . . . . . . . . . . . . . . . . . . . . . . . . . . . . . . . . . . . . . . . . . . . . . . . . 115,335 115,765 116,934Diluted. . . . . . . . . . . . . . . . . . . . . . . . . . . . . . . . . . . . . . . . . . . . . . . . . . . . . . 117,245 117,488 119,102
At December 31,(In Thousands) 2002 2001 2000
Balance Sheet Data:Net Oil and Gas Properties . . . . . . . . . . . . . . . . . . . . . . . . . . . . . . . . . . . . . . . . . $ 3,321,548 $ 3,055,910 $ 2,525,007Total Assets . . . . . . . . . . . . . . . . . . . . . . . . . . . . . . . . . . . . . . . . . . . . . . . . . . . . 3,814,006 3,414,044 3,001,253Long-Term Debt . . . . . . . . . . . . . . . . . . . . . . . . . . . . . . . . . . . . . . . . . . . . . . . . . 1,145,132 855,969 859,000Shareholders’ Equity . . . . . . . . . . . . . . . . . . . . . . . . . . . . . . . . . . . . . . . . . . . . . . 1,672,395 1,642,686 1,380,925

E O G R E S O U R C E S , I N C .48
The following table sets forth, for the periods indicated, the high and low sales prices per share for the common stock of EOG,as reported on the New York Stock Exchange Composite Tape, and the amount of cash dividends declared per share:
Quarterly Stock Data and Related Shareholder Matters
Glossary Of Terms
Bcf Billion cubic feet
Bcfe Billion cubic feet equivalent
Bbld Barrels per day
CEO Chief Executive Officer
CNC Caribbean Nitrogen Company
Division Generic term for regional EOG office and/or
subsidiary(ies)
$/Bbl Dollars per barrel
$/Mcf Dollars per thousand cubic feet
$/MMBtu Dollars per million British thermal units
MBbl Thousand barrels
MBbld Thousand barrels per day
Mcf Thousand cubic feet
Mcfe Thousand cubic feet equivalent
MMBtud Million British thermal units per day
MMcf Million cubic feet
MMcfe Million cubic feet equivalent
MMcfd Million cubic feet per day
MMcfed Million cubic feet equivalent per day
NYMEX New York Mercantile Exchange
SECC South East Coast Consortium (Trinidad)
Price Range CashHigh Low Dividend
2002First Quarter . . . . . . . . . . . . . . . . $41.32 $30.50 $0.040Second Quarter . . . . . . . . . . . . . . 44.15 37.11 0.040Third Quarter . . . . . . . . . . . . . . . 39.68 30.02 0.040Fourth Quarter . . . . . . . . . . . . . . 42.00 32.40 0.040
2001First Quarter . . . . . . . . . . . . . . . . $55.50 $39.30 $0.035Second Quarter . . . . . . . . . . . . . . 49.86 34.91 0.040Third Quarter . . . . . . . . . . . . . . . 36.99 25.80 0.040Fourth Quarter . . . . . . . . . . . . . . 39.66 27.65 0.040
As of March 10, 2003, there were approximately 400 record holders of EOG’s common stock, including individual partici-pants in security position listings. There are an estimated 62,500 beneficial owners of EOG’s common stock, including sharesheld in street name.
EOG currently intends to continue to pay quarterly cash dividends on its outstanding shares of common stock. However,the determination of the amount of future cash dividends, if any, to be declared and paid will depend upon, among other things,the financial condition, funds from operations, level of exploration, exploitation and development expenditure opportunities andfuture business prospects of EOG.

2 0 0 2 A N N U A L R E P O R T T O S H A R E H O L D E R S 49
Officers and Directors
Directors
George A. Alcorn (1)
Houston, TexasPresident, Alcorn Exploration, Inc.
Charles R. Crisp (2)
Houston, TexasInvestments
Mark G. PapaChairman and CEOEOG Resources, Inc.
Edward Randall, III (3)
Houston, TexasInvestments
Edmund P. Segner, IIIPresident and Chief of StaffEOG Resources, Inc.
Donald F. Textor (4)
Locust Valley, New YorkFormer Partner/Managing DirectorGoldman Sachs
Frank G. Wisner (5)
New York, New YorkVice ChairmanAmerican International Group, Inc. and former Ambassador to India,Philippines, Egypt and Zambia
Executive Committee
Mark G. PapaChairman and CEO
Edmund P. Segner, IIIPresident and Chief of Staff
Loren M. LeikerExecutive Vice President, Exploration and Development
Gary L. ThomasExecutive Vice President, Operations
Barry Hunsaker, Jr.Senior Vice President and General Counsel
Sandeep BhakhriVice President and Chief InformationOfficer
Officers (including key subsidiaries)
Lewis Chandler, Jr.Senior Vice President, Law
Lawrence E. FenwickSenior Vice President and GeneralManager, EOG Resources Canada Inc.
William R. ThomasSenior Vice President and GeneralManager, Midland Division
William E. AlbrechtVice President, Acquisitions andEngineering
Maire A. BaldwinVice President, Investor Relations
Ben B. BoydVice President, Finance and Accounting,EOG Resources International, Inc.
James R. BreimayerVice President and General Manager, Tyler Division
Steven B. ColemanVice President and General Manager,Oklahoma City Division
Gerald R. ColleyVice President and General Manager,International DivisionPresident, EOG Resources International, Inc.
Phil C. DeLozierVice President, Business Development
Kurt DoerrVice President and General Manager,Denver Division
Timothy K. DriggersVice President, Accounting and LandAdministration
Patricia L. Edwards Vice President, Human Resources,Administration and Corporate Secretary
Robert K. GarrisonVice President and General Manager,Corpus Christi Division
Kevin S. HanzelVice President, Audit
Andrew N. HoyleVice President, Marketing and Regulatory Affairs
Lindell L. LoogerVice President and General Manager, EOG Resources Trinidad Ltd.
David R. LooneyVice President, Finance and Treasurer
Richard A. OttVice President, Tax
Earl J. Ritchie, Jr.Vice President and General Manager,Offshore Division
Gary L. SmithVice President and General Manager,Pittsburgh Division
Ann D. JanssenController, Financial Reporting andPlanning
(1) Chairman, Nominating Committee;Member, Audit, Compensation andCorporate Governance Committees
(2) Member, Audit, Compensation, CorporateGovernance and Nominating Committees
(3) Chairman, Compensation Committee;Member, Audit, Corporate Governance and Nominating Committees
(4) Chairman, Audit Committee; Member,Compensation, Corporate Governance and Nominating Committees
(5) Chairman, Corporate GovernanceCommittee; Member, Audit, Compensationand Nominating Committees

E O G R E S O U R C E S , I N C .50
Corporate Headquarters 333 Clay Street, Suite 4200Houston, Texas 77002P.O. Box 4362Houston, Texas 77210-4362(713) 651-7000 Toll Free: (877) 363-EOGR www.eogresources.com
Common Stock Exchange Listing New York Stock Exchange Ticker Symbol: EOG Common Stock Outstanding at
December 31, 2002: 114,720,260
Principal Transfer Agent EquiServe Trust Company, N.A.P.O. Box 2500 Jersey City, New Jersey 07303-2500 Toll Free: (800) 519-3111 Outside U.S.: (201) 324-1225 www.equiserve.com Hearing Impaired: TDD (201) 222-4955
Additional Information The Annual Meeting of Shareholders will be held at 2 p.m. CDT inthe La Salle “A” Room of the Doubletree Hotel, 400 Dallas Street,Houston, Texas 77002 on Tuesday, May 6, 2003. Information withrespect to this meeting is contained in the Proxy Statement sentwith this Annual Report to holders of record of EOG Resources, Inc.Common Stock. The Annual Report is not to be considered a part ofthe proxy soliciting material.
Additional copies of the Annual Report and the Form 10-Kare available upon request by calling (877) 363-EOGR or through the EOG Resources website at www.eogresources.com. Quarterlyearnings press release information and SEC filings also can beaccessed through the website.
Financial analysts and investors who need additionalinformation should visit the EOG website, www.eogresources.com,or contact Investor Relations at (713) 651-7000.
Shareholder Information

2002 Highlights
Financial and Operating Highlights
• EOG’s total reserves increased by 9percent to approximately 4.6 trillioncubic feet equivalent.
• From all sources, EOG replaced 193percent of production at a findingcost of $1.06 per thousand cubic feetequivalent (Mcfe). Reserve replace-ment in North America was 158percent with a total all-in findingcost of $1.42, down 10 percent from2001. From drilling alone, EOGreplaced 160 percent of productionat a finding cost of $1.17 per Mcfe.
• In Canada, EOG increased total pro-duction 23 percent and natural gasproduction 22 percent, compared to2001.
• In Trinidad, EOG announced theParula natural gas discovery, addedtwo new offshore exploration blocks,successfully started up the CNCAmmonia Plant and signed a 25-year extension on the offshore SECCBlock.
• For the eighth consecutive year,EOG reduced the number of sharesoutstanding. After repurchasing 0.7million shares of common stock, netof option exercises, stock plans andother increases, EOG had 114.4 mil-lion basic shares outstanding atDecember 31.
The Company
EOG Resources, Inc. (EOG) isone of the largest independent(non-integrated) oil and gascompanies in the United Statesand is the operator of substan-tial proved reserves in the U.S.,Canada and offshore Trinidad.EOG is listed on the New YorkStock Exchange and is tradedunder the ticker symbol“EOG.”
On the cover
What is EOG Resources? It isenergy. It is opportunity. It isgrowth. Representing our com-pany’s commitment to itsshareholders are Houston-basedemployees Senior ReservoirEngineer Toni Clifton-Woodand Chief Reservoir EngineerChuck Smith. Information regarding forward-looking statements is on page 19 of this annual
report to shareholders.
(In millions, except per share data, unless otherwise indicated) 2002 2001 2000Net Operating Revenues . . . . . . . . . . . . . . . . . . . . . . . . . . . . . . . . . . . . . . . . . . . . . $ 1,095 $ 1,655 $ 1,490Income Before Interest and Taxes . . . . . . . . . . . . . . . . . . . . . . . . . . . . . . . . . . . . . . . $ 179 $ 677 $ 695Net Income Available to Common . . . . . . . . . . . . . . . . . . . . . . . . . . . . . . . . . . . . . . $ 76 $ 388 $ 386Exploration and Development Expenditures* . . . . . . . . . . . . . . . . . . . . . . . . . . . . . $ 821 $ 1,113 $ 687
Wellhead StatisticsNatural Gas Volumes (MMcfd) . . . . . . . . . . . . . . . . . . . . . . . . . . . . . . . . . . . . . . 924 921 908Natural Gas Prices ($/Mcf) . . . . . . . . . . . . . . . . . . . . . . . . . . . . . . . . . . . . . . . . . $ 2.60 $ 3.81 $ 3.49Crude Oil and Condensate Volumes (MBbld) . . . . . . . . . . . . . . . . . . . . . . . . . . . 23.3 25.8 27.5Crude Oil and Condensate Prices ($/Bbl) . . . . . . . . . . . . . . . . . . . . . . . . . . . . . . $ 24.56 $ 24.83 $ 29.57Natural Gas Liquids Volumes (MBbld) . . . . . . . . . . . . . . . . . . . . . . . . . . . . . . . 3.7 4.0 4.7Natural Gas Liquids Prices ($/Bbl) . . . . . . . . . . . . . . . . . . . . . . . . . . . . . . . . . . . $ 14.05 $ 16.89 $ 19.87
NYSE Price Range ($/Share)High . . . . . . . . . . . . . . . . . . . . . . . . . . . . . . . . . . . . . . . . . . . . . . . . . . . . . . . . . . $ 44.15 $ 55.50 $ 56.69Low . . . . . . . . . . . . . . . . . . . . . . . . . . . . . . . . . . . . . . . . . . . . . . . . . . . . . . . . . . . $ 30.02 $ 25.80 $ 13.69Close . . . . . . . . . . . . . . . . . . . . . . . . . . . . . . . . . . . . . . . . . . . . . . . . . . . . . . . . . . $ 39.92 $ 39.11 $ 54.63
Cash Dividends Per Share . . . . . . . . . . . . . . . . . . . . . . . . . . . . . . . . . . . . . . . . . . . . . $ 0.160 $ 0.155 $ 0.135Average Shares Outstanding (Diluted) . . . . . . . . . . . . . . . . . . . . . . . . . . . . . . . . . . . 117.2 117.5 119.1Year-end Basic Shares Outstanding . . . . . . . . . . . . . . . . . . . . . . . . . . . . . . . . . . . . . . 114.4 115.1 116.8*Excludes Deferred Income Tax Gross Up of $15 million, $50 million and $23 million for 2002, 2001 and 2000, respectively.

2002E N E R G Y O P P O R T U N I T Y G R O W T H
E O G A n n u a l R e p o r t t o S h a r e h o l d e r s
333 Clay Street, Suite 4200
Houston, Texas 77002
P.O. Box 4362
Houston, Texas 77210–4362
(713) 651-7000
www.eogresources.com
EO
G R
es
ou
rce
s, In
c. 2
00
2 A
nn
ua
l Re
po
rt to S
ha
reh
old
ers