eor/ior technology, incentives and broadening of...
TRANSCRIPT

EOR/IOR Technology, Incentives and Broadening of the E&P Industry
Session 1:00 - 4:30 pmSunday, May 15, 2016
IOGCC 2016 Midyear Business Meeting
Denver Mariott City Center Hotel
Downtown Denver, Colorado
EOR/IOR Technology, Incentives and Broadening of the On-shore E&P Industry
• Trends in the O/G Upstream Sector
• Prudent Development, Conservation Considerations
• Factors Which Affect Development and Capacity (Incl per Bbl Costs, Carbon Intensity, Emission and Disposal Reductions)
• Incentives (“Carrots”) at the State and Federal Level
2
Oil and Gas Upstream Developments
• Limited (Peak) Oil Ideas Replaced and with a New ‘Plentiful Paradigm’
• Industry Has Moved Well Beyond Just Mobile Oil and Gas Zones– …to Deep Water– …to the Shales– …to the Residual Oil Zones
• New Resources Come with New Challenges
3
A Baseline for Discussion
NPC Report
4

Where We Were in 2011 at the Time of the NPC Study“First Signs of the Big Change”
EIA Forecast
Decline
Decline
Steady
Growing
Growing

WOW!.....A Changed World Today

A New, Modern Frame of Reference for the Changed Times
Fractional (Water) Flow as a Function of Oil or Water Saturation
7
All Water
All Oil
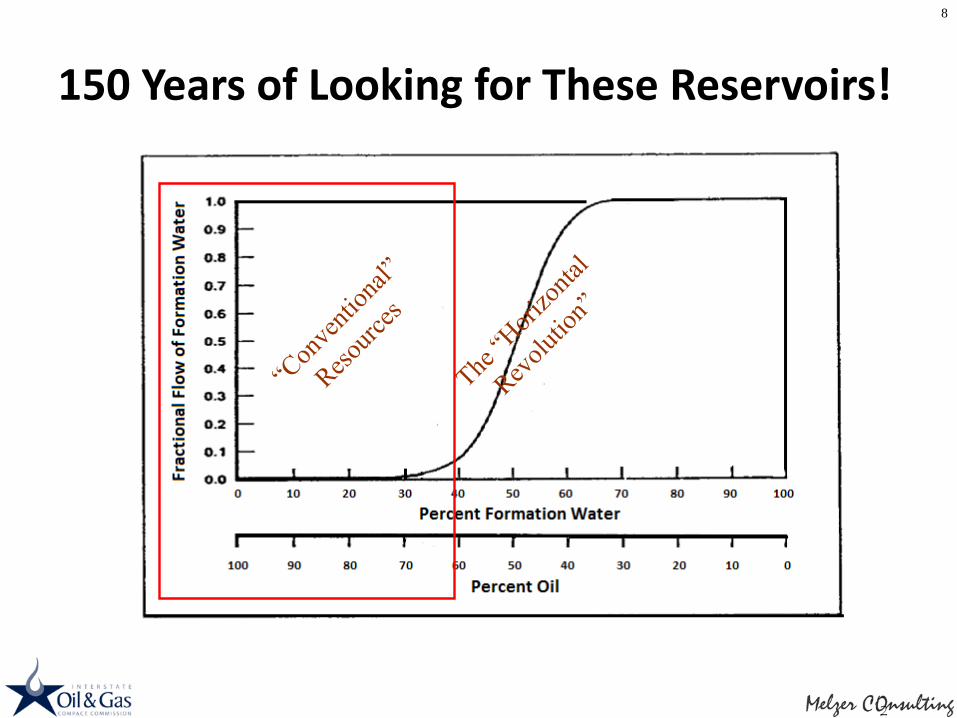
150 Years of Looking for These Reservoirs!
8
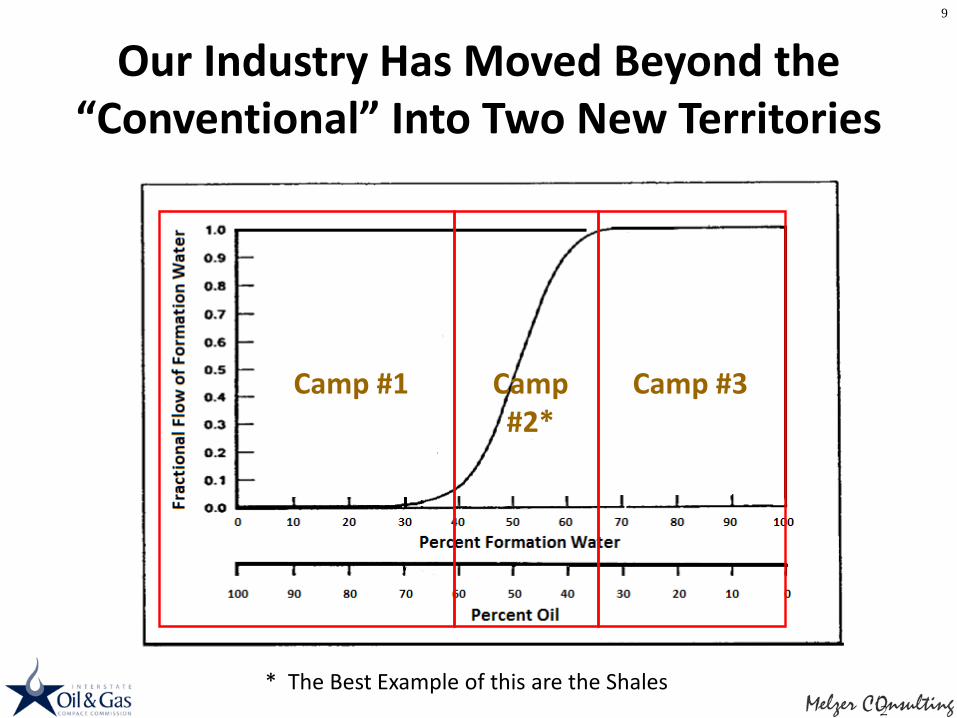
Our Industry Has Moved Beyond the “Conventional” Into Two New Territories
Camp #1 Camp #2*
Camp #3
9
* The Best Example of this are the Shales
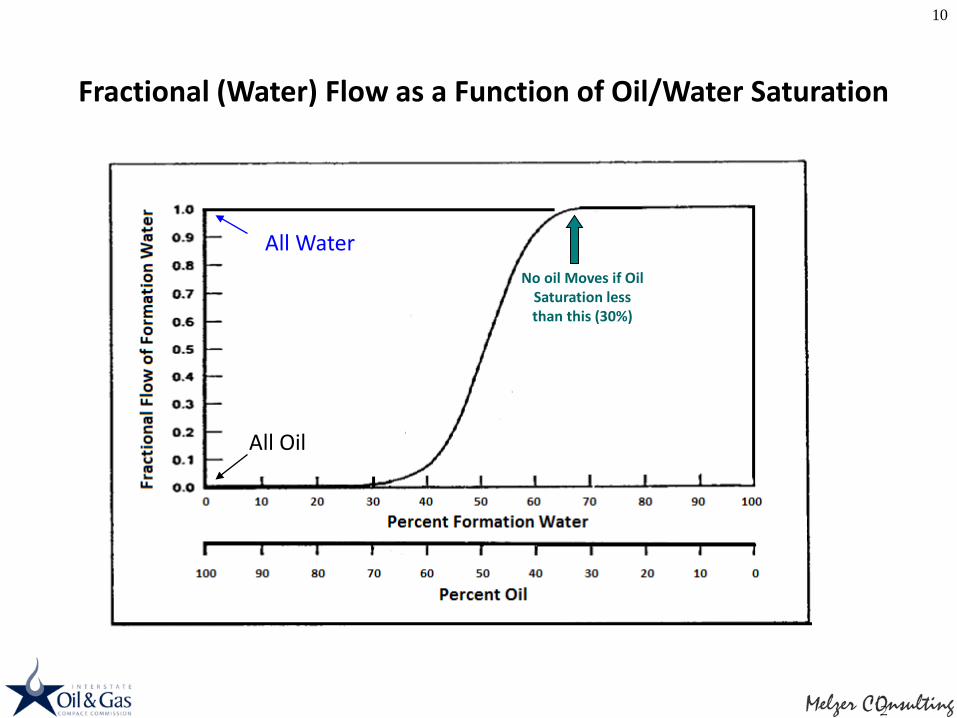
Fractional (Water) Flow as a Function of Oil/Water Saturation
10
All Water
All Oil
No oil Moves if Oil Saturation less than this (30%)

What Ever Would Possess Us to Look to Camp #3?
Camp #3
11
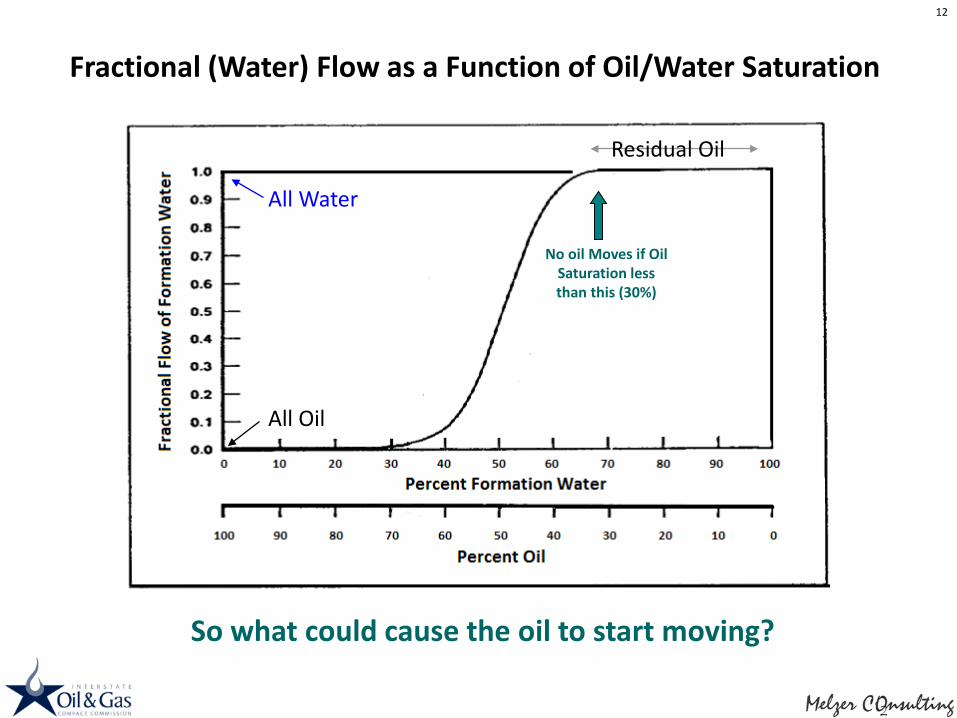
Fractional (Water) Flow as a Function of Oil/Water Saturation
12
All Water
All Oil
No oil Moves if Oil Saturation less than this (30%)
So what could cause the oil to start moving?
Residual Oil

DUROZ area
GEORGE ALLENPeripheral
Greenfield CO2 Flood
TALL COTTONPure Greenfield
CO2 Flood
GOLDSMITHBrownfield
ROZ CO2 Flood& Gas Lift
SEMINOLEBrownfield
ROZ CO2 Flood
13Mobilizing Residual Oil Via CO2 EOR Four of the 15 Active Residual Oil Zone CO2 EOR Projects
Just These Four ROZ Projects Alone are
Making >12,000 bopd!

There is a Second Method to Mobilize Residual Oil: Horizontal Wells and Dewatering*
Rock
Pore Space
Pi = 2000 psi (in-situ)
Oil
Water
Pi = 2000 psi (in-situ)
The Pore Fluids
Oil
Water
Pn = 1000 psi (in-situ)
De-pressured State
* We prefer the Term “Depressuring”
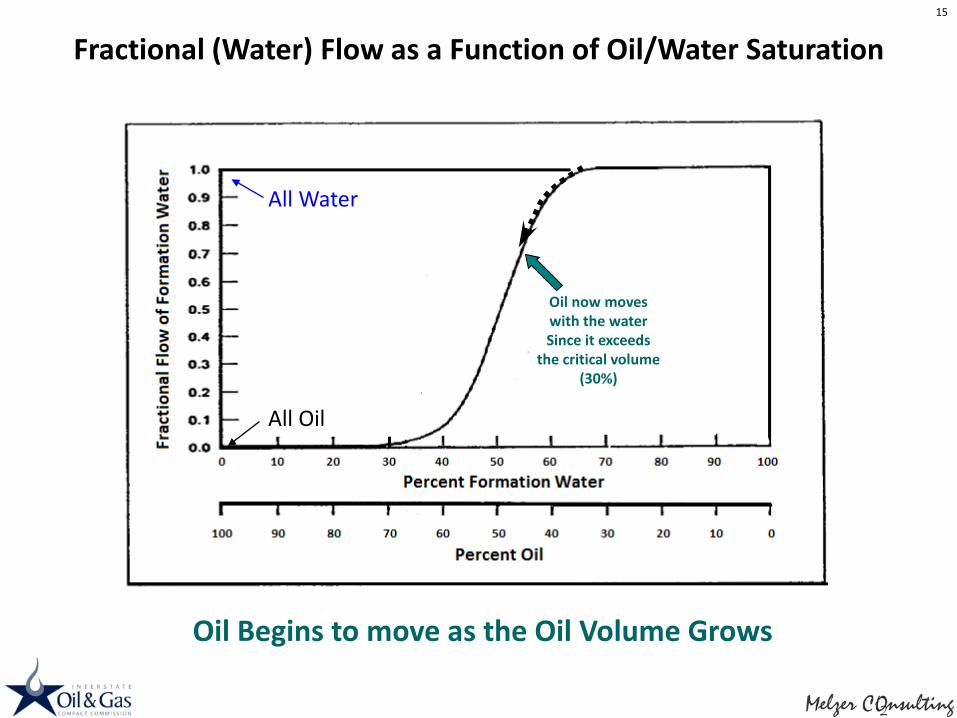
Fractional (Water) Flow as a Function of Oil/Water Saturation
All Water
All Oil
Oil now moves with the water Since it exceeds
the critical volume (30%)
Oil Begins to move as the Oil Volume Grows
15
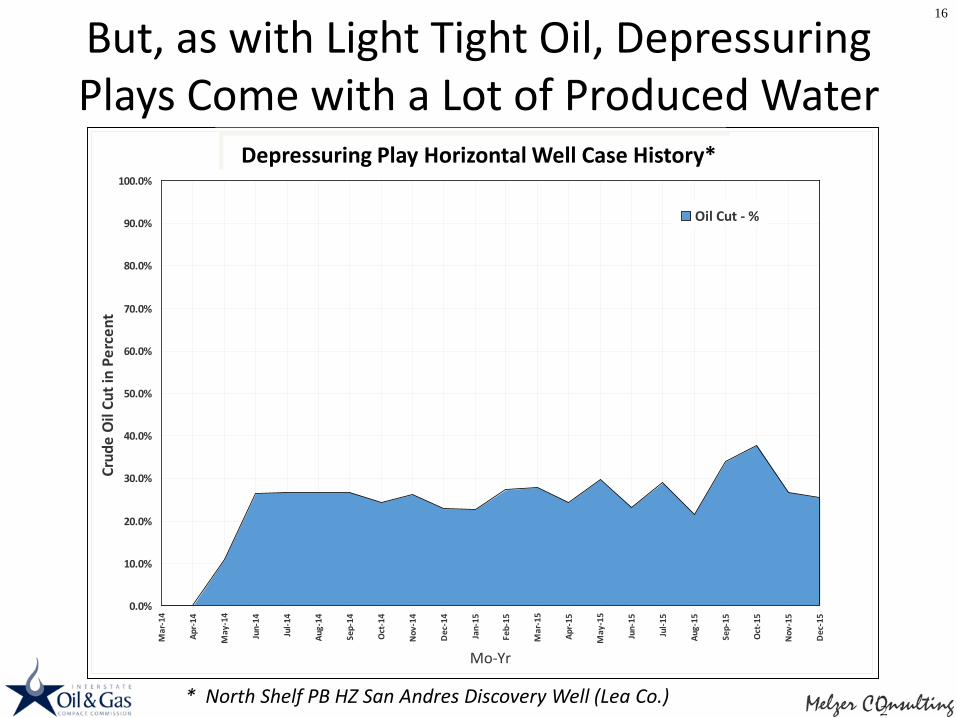
But, as with Light Tight Oil, Depressuring Plays Come with a Lot of Produced Water
* North Shelf PB HZ San Andres Discovery Well (Lea Co.)
16
Broken Spoke 2 State Case History*
0.0%
10.0%
20.0%
30.0%
40.0%
50.0%
60.0%
70.0%
80.0%
90.0%
100.0%
Mar
-14
Apr-
14
May
-14
Jun-
14
Jul-1
4
Aug-
14
Sep-
14
Oct
-14
Nov
-14
Dec
-14
Jan-
15
Feb-
15
Mar
-15
Apr-
15
May
-15
Jun-
15
Jul-1
5
Aug-
15
Sep-
15
Oct
-15
Nov
-15
Dec
-15
Mo-Yr
Crud
e O
il Cu
t in
Perc
ent
Oil Cut - %
Depressuring Play Horizontal Well Case History*
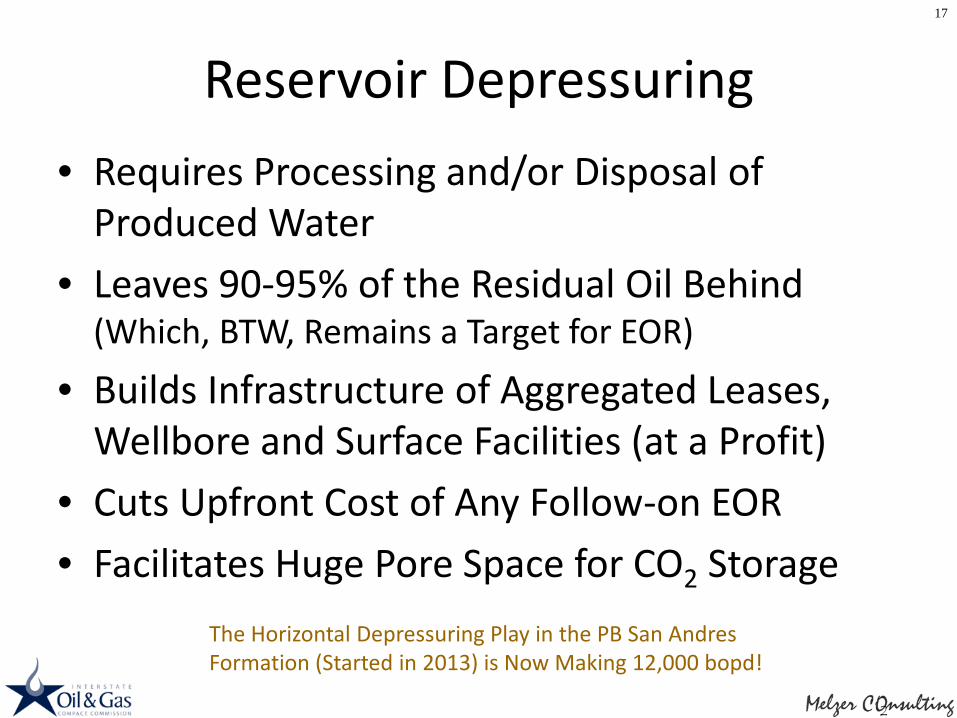
Reservoir Depressuring • Requires Processing and/or Disposal of
Produced Water• Leaves 90-95% of the Residual Oil Behind
(Which, BTW, Remains a Target for EOR)
• Builds Infrastructure of Aggregated Leases, Wellbore and Surface Facilities (at a Profit)
• Cuts Upfront Cost of Any Follow-on EOR• Facilitates Huge Pore Space for CO2 Storage
17
The Horizontal Depressuring Play in the PB San Andres Formation (Started in 2013) is Now Making 12,000 bopd!
Let’s Return to the NPC Report
Published in 2012
18
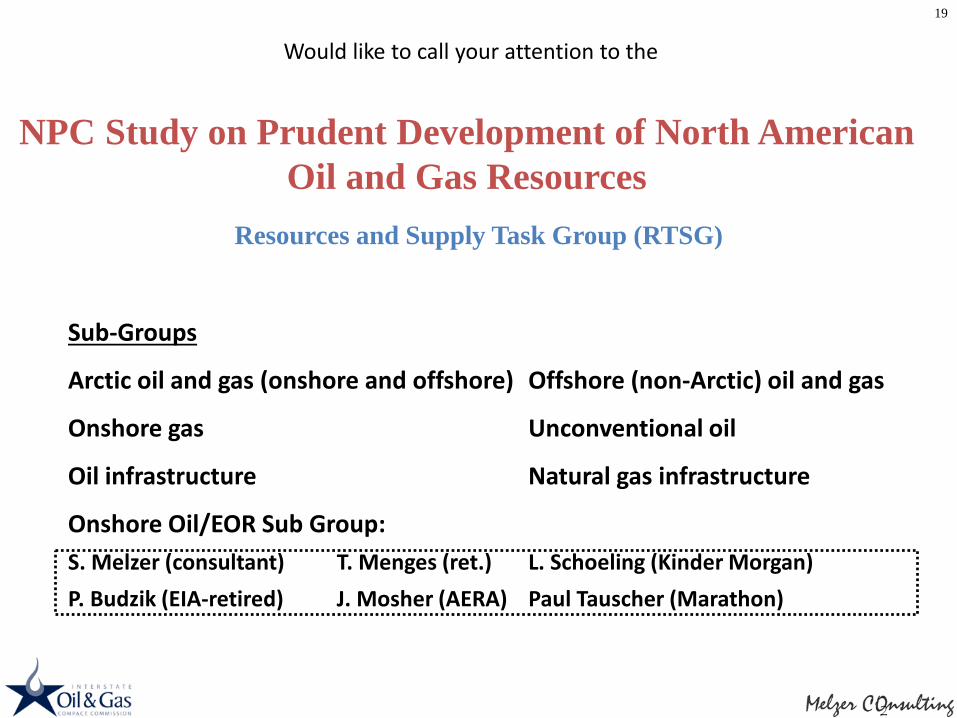
NPC Study on Prudent Development of North American Oil and Gas Resources
Resources and Supply Task Group (RTSG)
Sub-Groups
Arctic oil and gas (onshore and offshore) Offshore (non-Arctic) oil and gas
Onshore gas Unconventional oil
Oil infrastructure Natural gas infrastructure
Onshore Oil/EOR Sub Group:S. Melzer (consultant) T. Menges (ret.) L. Schoeling (Kinder Morgan) P. Budzik (EIA-retired) J. Mosher (AERA) Paul Tauscher (Marathon)
19
Would like to call your attention to the
NPC Study on Prudent Development of North American Oil and Gas Resources
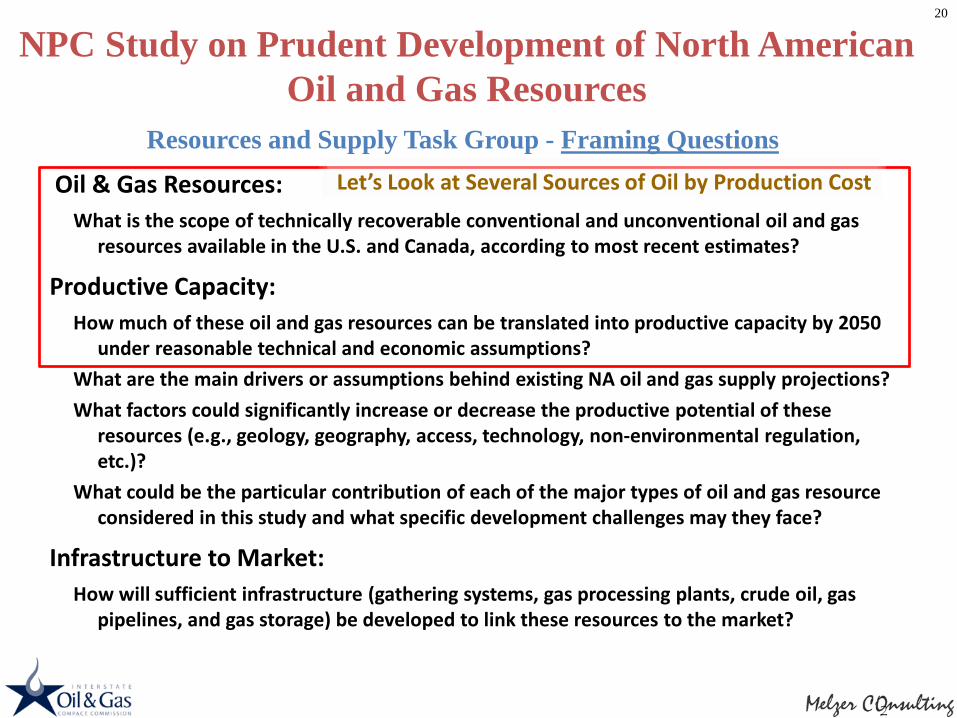
Resources and Supply Task Group - Framing Questions
Oil & Gas Resources:What is the scope of technically recoverable conventional and unconventional oil and gas
resources available in the U.S. and Canada, according to most recent estimates?
Productive Capacity:How much of these oil and gas resources can be translated into productive capacity by 2050
under reasonable technical and economic assumptions? What are the main drivers or assumptions behind existing NA oil and gas supply projections?What factors could significantly increase or decrease the productive potential of these
resources (e.g., geology, geography, access, technology, non-environmental regulation, etc.)?
What could be the particular contribution of each of the major types of oil and gas resource considered in this study and what specific development challenges may they face?
Infrastructure to Market:How will sufficient infrastructure (gathering systems, gas processing plants, crude oil, gas
pipelines, and gas storage) be developed to link these resources to the market?
20
Let’s Look at Several Sources of Oil by Production Cost
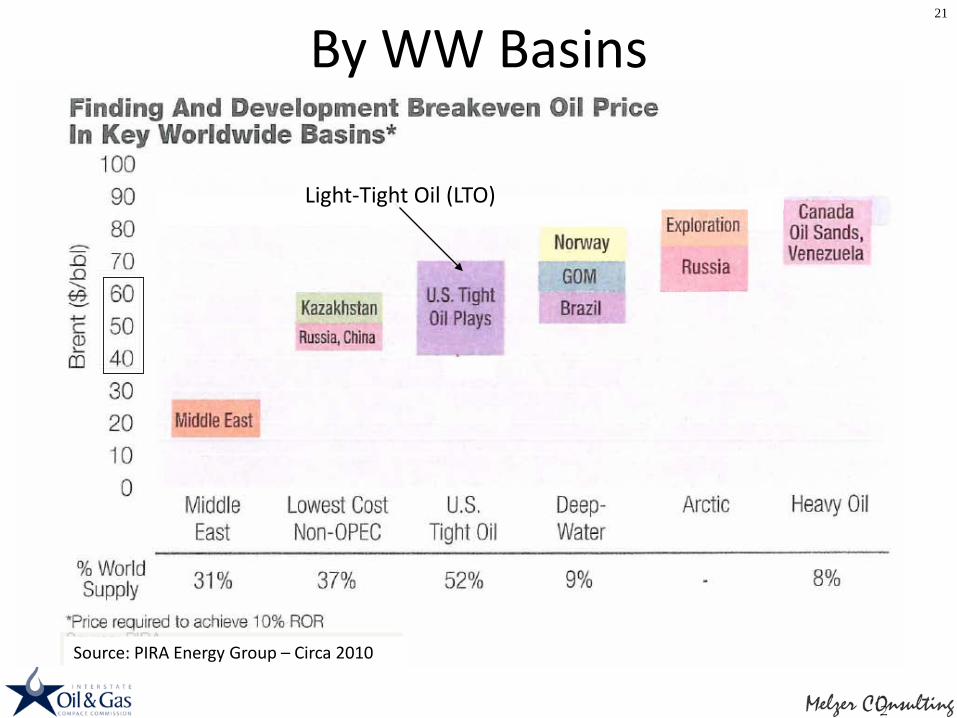
By WW Basins21
Light-Tight Oil (LTO)
Source: PIRA Energy Group – Circa 2010
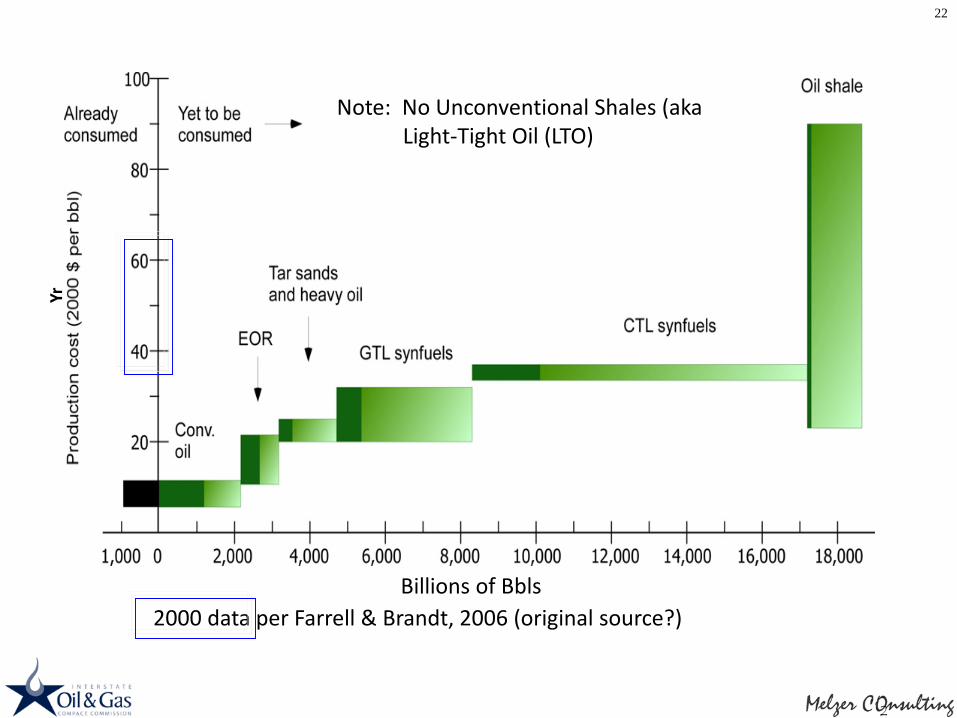
2000 data per Farrell & Brandt, 2006 (original source?)
22
Yr
Note: No Unconventional Shales (aka Light-Tight Oil (LTO)
Billions of Bbls

2004 IEA Data
23
………And Yet Another Look (EIA 2004)
Note: No Unconventional Tight Oil (aka Light-Tight Oil (LTO)
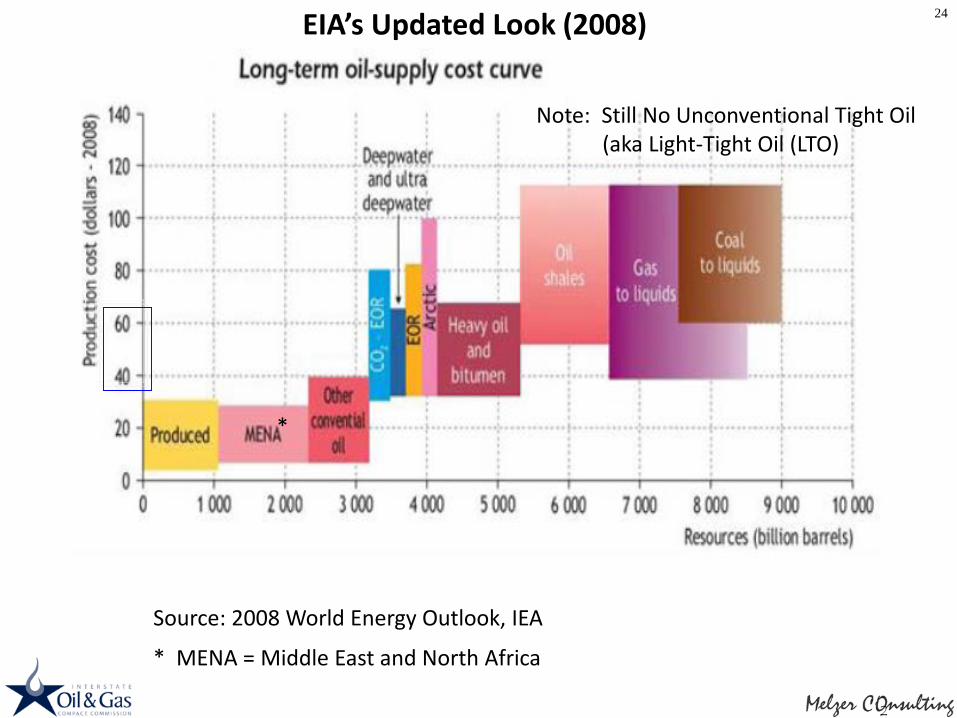
Source: 2008 World Energy Outlook, IEA
* MENA = Middle East and North Africa
24
*
EIA’s Updated Look (2008)
Note: Still No Unconventional Tight Oil (aka Light-Tight Oil (LTO)
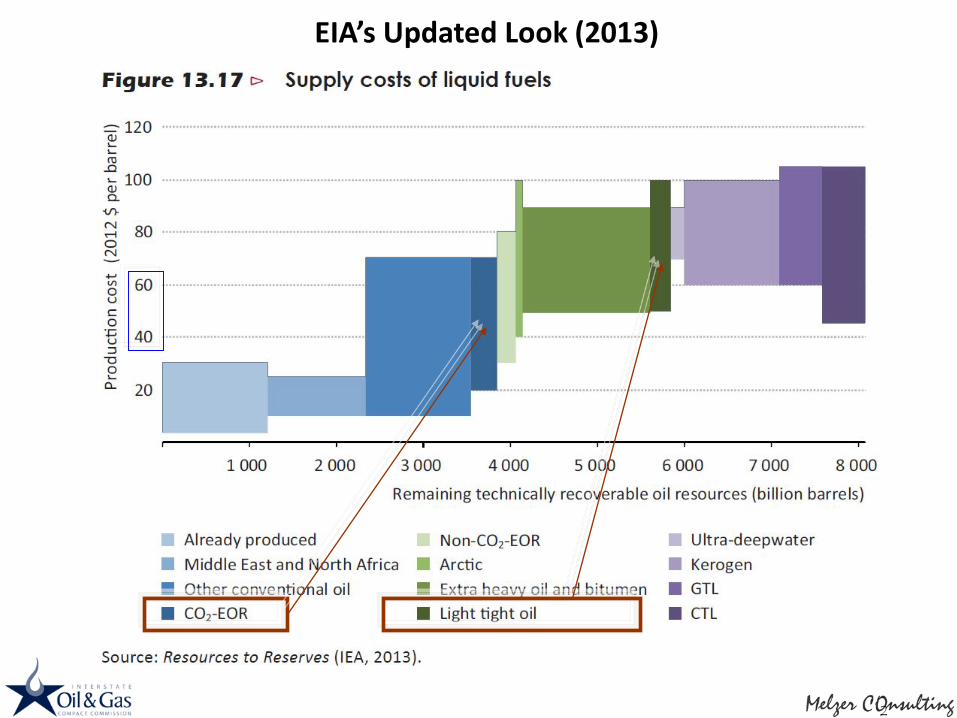
EIA’s Updated Look (2013)
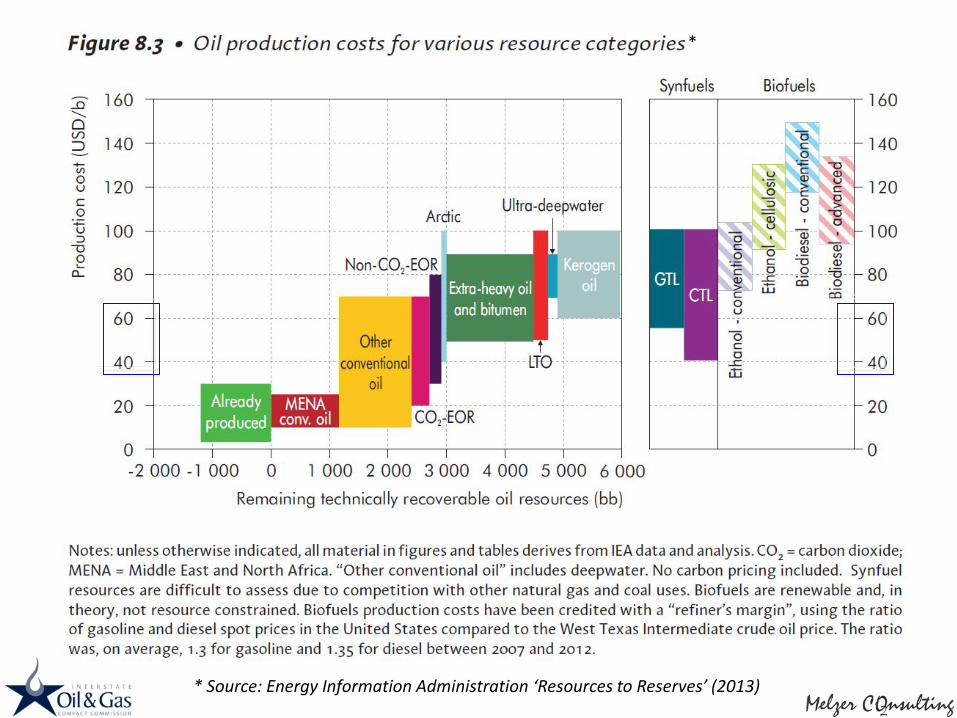
* Source: Energy Information Administration ‘Resources to Reserves’ (2013)
*

For the Future, Maybe it is Not Just Per Bbl CostsDoes Oil’s Carbon Footprint Play Into Our Future?

0 200 400 600 800 1000 1200
CO2 EORUK
Saudi (Light)CTL (Low)
CanadaImported crude oil
U.S. status quoU.S. domestic
VenezuelaMexicoSynbit
Dilbit ASCO oil sands (in-situ process)
SCO oil sands (mining process)Dilbit B
SCO oil shale in-situ (Low)SCO oil shale in-situ (High)SCO oil shale mining (Low)
Synthetic crude oil (SCO) oil shale mining (High)Coal-to-liquid (CTL) (High)
kg CO2e/bbl
Extraction Port-to-Port Port-to-refinery Refinery Combustion Upstream electricity
Comparing CO2 EOR to “Regular” Oil GhG EmissionsLife Cycle Analysis (LCA)
Mangmeechai, A. (2009) Life Cycle Greenhouse Gas Emissions, Consumptive Water Use and Levelized Costs of Unconventional Oil in N. America. Dissertation, Carnegie Mellon University: Pittsburgh, PA.
CO2 EOR
‘Unconventional’ *
‘Conventional’ *
* Author’s Definition of Conventional and Unconventional

NPC Study on Prudent Development of North American Oil and Gas Resources
Resources and Supply Task Group - Framing Questions
Oil & Gas Resources:What is the scope of technically recoverable conventional and unconventional oil and gas
resources available in the U.S. and Canada, according to most recent estimates?
Productive Capacity:How much of these oil and gas resources can be translated into productive capacity by 2050
under reasonable technical and economic assumptions? What are the main drivers or assumptions behind existing NA oil and gas supply projections?What factors could significantly increase or decrease the productive potential of these
resources (e.g., geology, geography, access, technology, non-environmental regulation, etc.)?
What could be the particular contribution of each of the major types of oil and gas resource considered in this study and what specific development challenges may they face?
Infrastructure to Market:How will sufficient infrastructure (gathering systems, gas processing plants, crude oil, gas
pipelines, and gas storage) be developed to link these resources to the market?
29
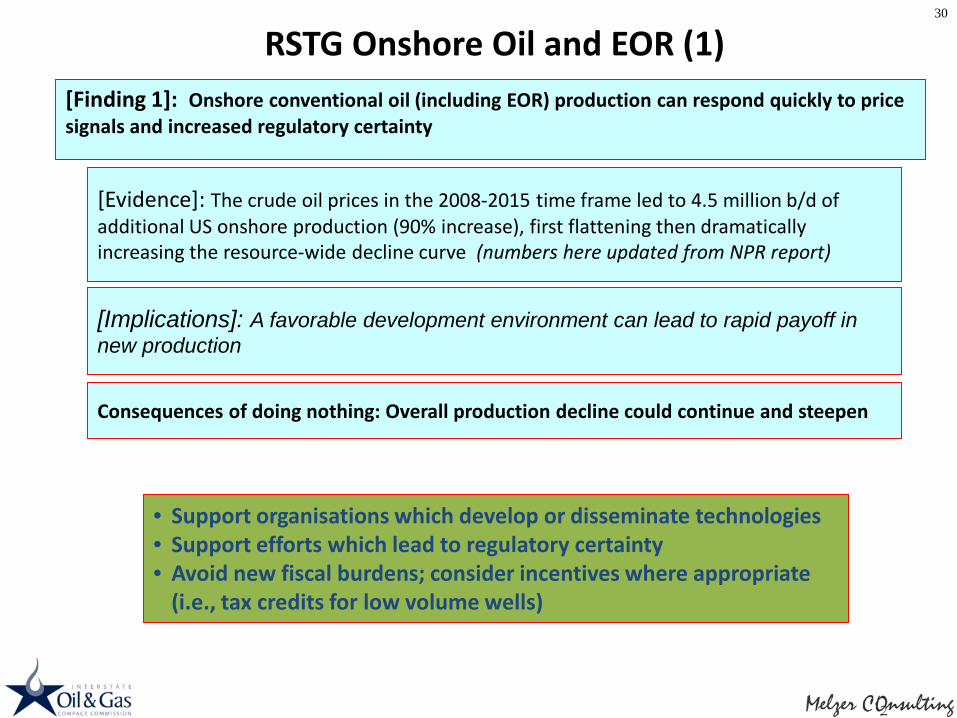
[Evidence]: The crude oil prices in the 2008-2015 time frame led to 4.5 million b/d of additional US onshore production (90% increase), first flattening then dramatically increasing the resource-wide decline curve (numbers here updated from NPR report)
[Finding 1]: Onshore conventional oil (including EOR) production can respond quickly to price signals and increased regulatory certainty
RSTG Onshore Oil and EOR (1)
[Implications]: A favorable development environment can lead to rapid payoff in new production
Consequences of doing nothing: Overall production decline could continue and steepen
• Support organisations which develop or disseminate technologies• Support efforts which lead to regulatory certainty• Avoid new fiscal burdens; consider incentives where appropriate
(i.e., tax credits for low volume wells)
30

[Evidence]: CO2 EOR production has been increasing since 1986 and now accounts for 0.3 million b/d in US and Canada, primarily using naturally occurring pure CO2. Forecasted growth (up to 1+ million b/d by 2030) will require economic supply from a variety of new sources with high CO2 content by-products such as natural gas processing and other industrial processes.
[Finding 2]: CO2 EOR oil production is critical to onshore oil production growth. It is the only component of onshore conventional oil which is increasing, with future growth dependent on the availability of affordable CO2 supplies. New Reservoir Targets Abound
RSTG Onshore Oil and EOR (2)
[Implications]: Actions which add costs, increase regulatory burdens or reduce development opportunities should be avoided. Actions which help enable new sources of CO2 supply to become viable can be pursued; this will improve oil supply from the sector.
Consequence(s) of doing nothing: no growth in production potential from CO2 EOR
• Ensure new carbon regs do not impact existing EOR• Avoid rules which incent premature abandonment of old fields• Maintain flexible transport options for new supply• Codify liability rules
31
IOGCC Very Active Here!!! USDOE Also
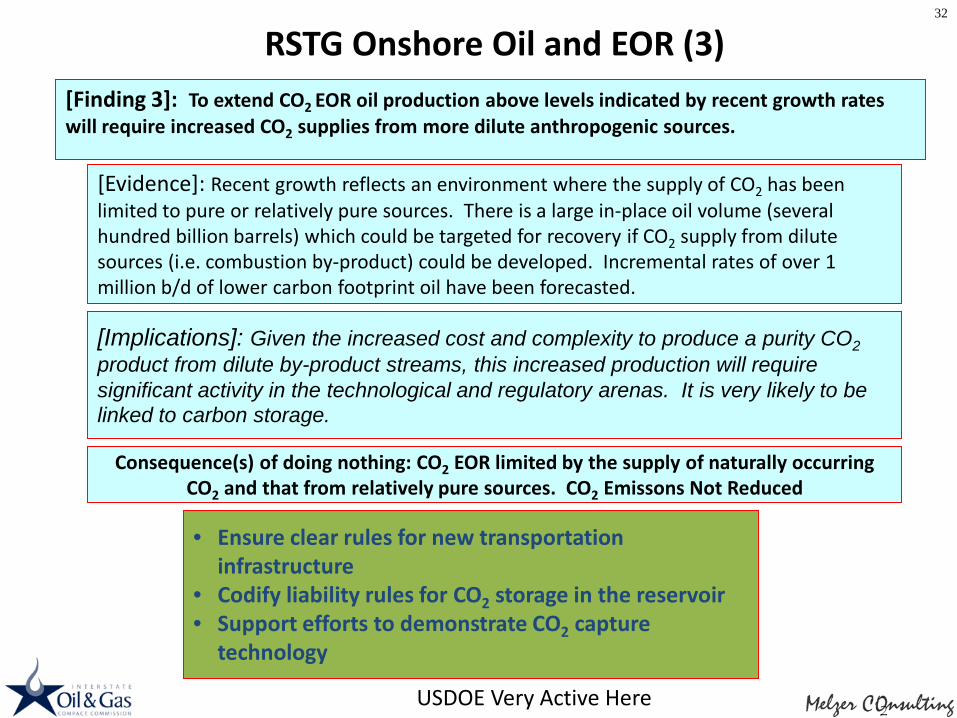
[Evidence]: Recent growth reflects an environment where the supply of CO2 has been limited to pure or relatively pure sources. There is a large in-place oil volume (several hundred billion barrels) which could be targeted for recovery if CO2 supply from dilute sources (i.e. combustion by-product) could be developed. Incremental rates of over 1 million b/d of lower carbon footprint oil have been forecasted.
[Finding 3]: To extend CO2 EOR oil production above levels indicated by recent growth rates will require increased CO2 supplies from more dilute anthropogenic sources.
RSTG Onshore Oil and EOR (3)
[Implications]: Given the increased cost and complexity to produce a purity CO2product from dilute by-product streams, this increased production will require significant activity in the technological and regulatory arenas. It is very likely to be linked to carbon storage.
Consequence(s) of doing nothing: CO2 EOR limited by the supply of naturally occurring CO2 and that from relatively pure sources. CO2 Emissons Not Reduced
• Ensure clear rules for new transportation infrastructure
• Codify liability rules for CO2 storage in the reservoir• Support efforts to demonstrate CO2 capture
technology
32
USDOE Very Active Here

[Evidence]: Besides in-place oil remaining after current production processes (including depressuring), there are known “oil-water transition zones” beneath existing fields. Commercial production tests are advancing but still in an early stage of development.
[Finding 4]: Residual oil zones (ROZs) in existing oil fields could have 10s of billions of barrels of recoverable resources, greenfield even more, making huge targets for CO2 and other technologies
RSTG Onshore Oil and EOR (4)
[Implications]: CO2 flooding is (was at the time) the only currently demonstrated recovery technology for ROZs. Besides additional experience, existing infrastructure and CO2 supply sources likely to be needed for viable development
Consequence(s) of doing nothing: 80-300 billion barrels of in-place oil not targeted
• Support efforts to better identify and delineate the target• ROZ technology R&D support (DOE is working this under a CCUS Flag)• ROZ tax credits for R&D or pilot work
33
Sadly, RPSEA was Very Active Here and Deserves a Lot of the Credit
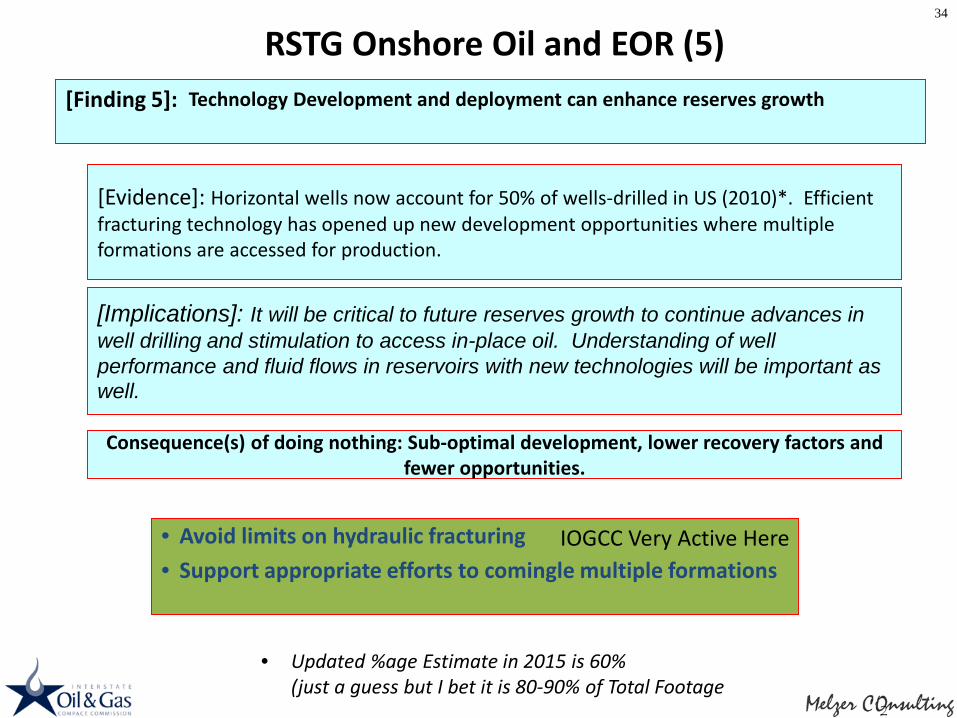
[Evidence]: Horizontal wells now account for 50% of wells-drilled in US (2010)*. Efficient fracturing technology has opened up new development opportunities where multiple formations are accessed for production.
[Finding 5]: Technology Development and deployment can enhance reserves growth
RSTG Onshore Oil and EOR (5)
[Implications]: It will be critical to future reserves growth to continue advances in well drilling and stimulation to access in-place oil. Understanding of well performance and fluid flows in reservoirs with new technologies will be important as well.
Consequence(s) of doing nothing: Sub-optimal development, lower recovery factors and fewer opportunities.
• Avoid limits on hydraulic fracturing• Support appropriate efforts to comingle multiple formations
34
• Updated %age Estimate in 2015 is 60% (just a guess but I bet it is 80-90% of Total Footage
IOGCC Very Active Here
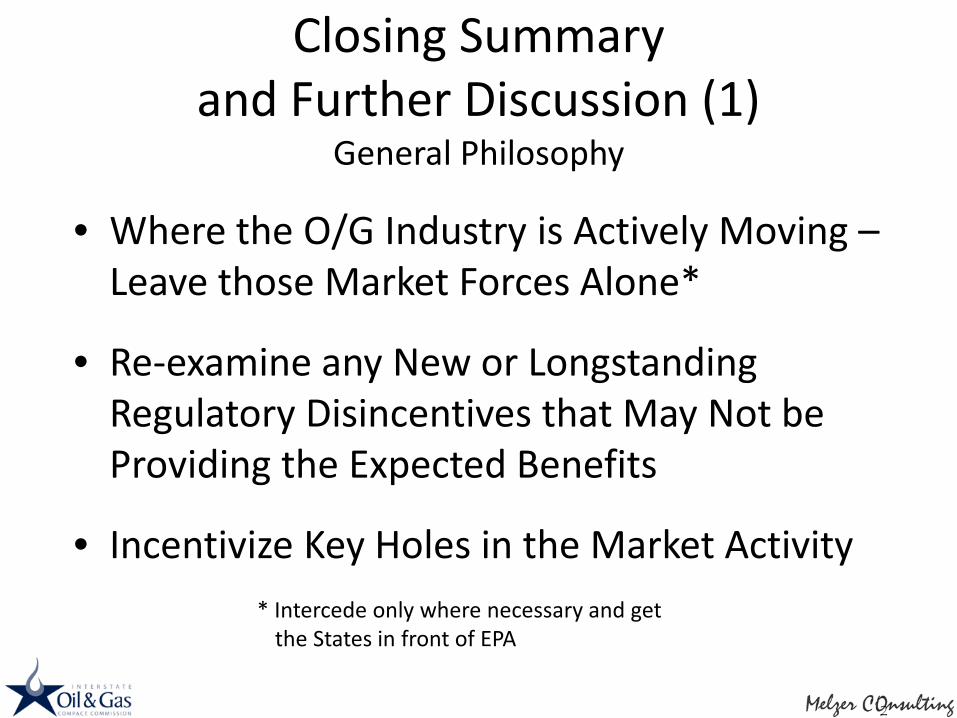
Closing Summary and Further Discussion (1)
General Philosophy
• Where the O/G Industry is Actively Moving –Leave those Market Forces Alone*
• Re-examine any New or Longstanding Regulatory Disincentives that May Not be Providing the Expected Benefits
• Incentivize Key Holes in the Market Activity* Intercede only where necessary and get
the States in front of EPA
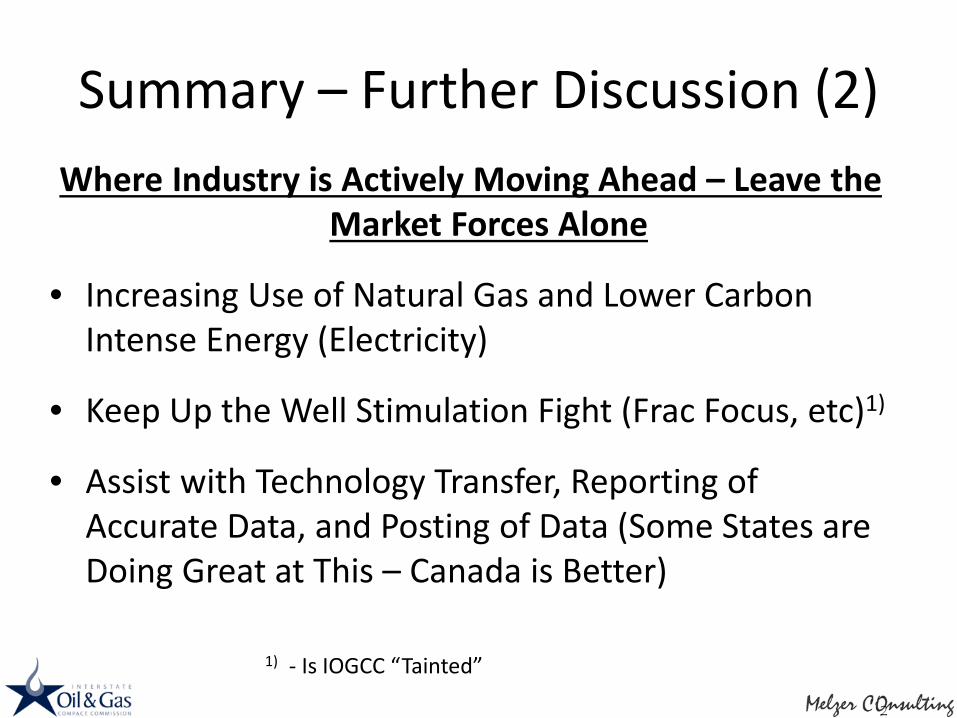
Summary – Further Discussion (2)Where Industry is Actively Moving Ahead – Leave the
Market Forces Alone
• Increasing Use of Natural Gas and Lower Carbon Intense Energy (Electricity)
• Keep Up the Well Stimulation Fight (Frac Focus, etc)1)
• Assist with Technology Transfer, Reporting of Accurate Data, and Posting of Data (Some States are Doing Great at This – Canada is Better)
1) - Is IOGCC “Tainted”
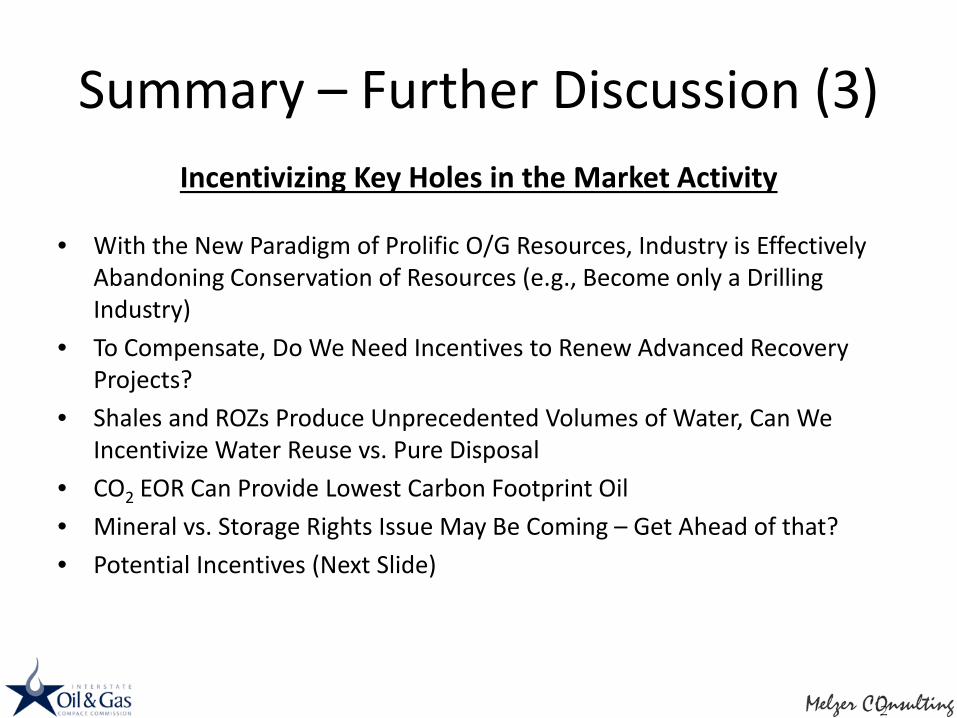
Summary – Further Discussion (3)Incentivizing Key Holes in the Market Activity
• With the New Paradigm of Prolific O/G Resources, Industry is Effectively Abandoning Conservation of Resources (e.g., Become only a Drilling Industry)
• To Compensate, Do We Need Incentives to Renew Advanced Recovery Projects?
• Shales and ROZs Produce Unprecedented Volumes of Water, Can We Incentivize Water Reuse vs. Pure Disposal
• CO2 EOR Can Provide Lowest Carbon Footprint Oil• Mineral vs. Storage Rights Issue May Be Coming – Get Ahead of that?• Potential Incentives (Next Slide)
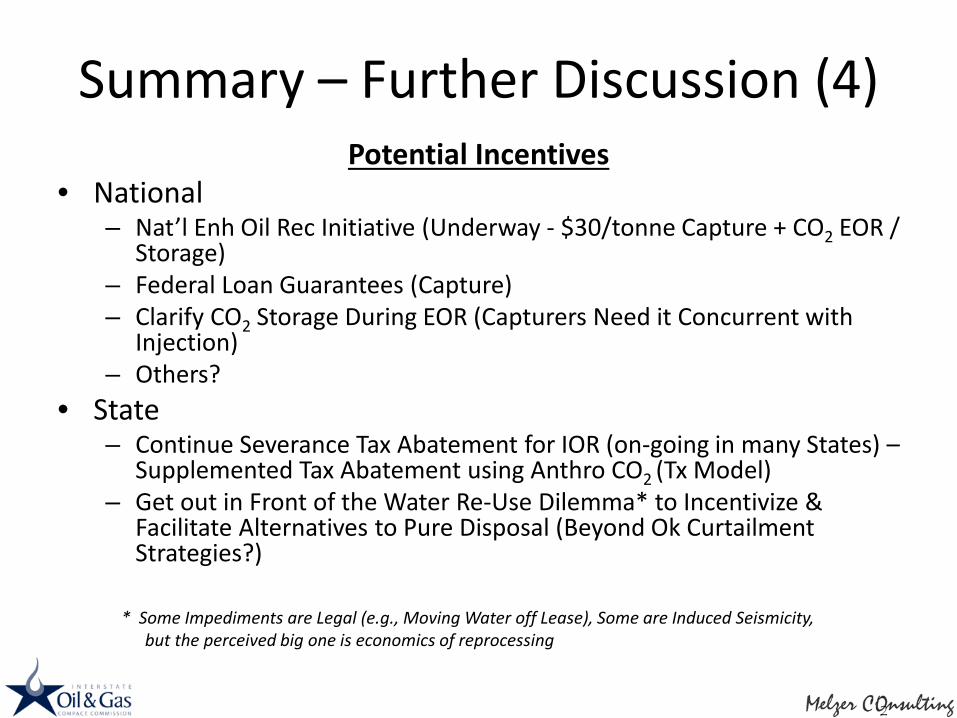
Summary – Further Discussion (4)Potential Incentives
• National– Nat’l Enh Oil Rec Initiative (Underway - $30/tonne Capture + CO2 EOR /
Storage)– Federal Loan Guarantees (Capture) – Clarify CO2 Storage During EOR (Capturers Need it Concurrent with
Injection)– Others?
• State– Continue Severance Tax Abatement for IOR (on-going in many States) –
Supplemented Tax Abatement using Anthro CO2 (Tx Model)– Get out in Front of the Water Re-Use Dilemma* to Incentivize &
Facilitate Alternatives to Pure Disposal (Beyond Ok Curtailment Strategies?)
* Some Impediments are Legal (e.g., Moving Water off Lease), Some are Induced Seismicity, but the perceived big one is economics of reprocessing

Summary – Further Discussion (5)
More Incentives Discussion (General)
• Carrots and Sticks
• Texas SACROC Improved Oil Recovery Model
• Turn the Induced Seismicity Issue into an Opportunity?– Current Approach: Disposal Injection Permits as a Lever? (‘Stick’)– Find a Broad Incentive (‘Carrot’) to Encourage Water Processing (is
the use of Nat Gas and NGL streams going to help here and also Contribute to Reduced Flaring?)

Producing excessive
volumes of water are a big part of our Energy
Future.How Best to
Proceed?

From Lanny’s ReviewEmphasize these Priorities
• Ensure new carbon regs do not impact existing EOR
• Avoid rules which incent premature abandonment of old fields
• Maintain flexible transport options for new supply
• Codify liability rules

Thank you
I’d Like to Take this Opportunity to Recognize Bill Lemay – Former OCD (NM) Director, a Wonderful
IOGCC and Regulation Community Contributor who Passed Away Last Month
www.melzerconsulting.comSee also www.residualoilzones.com
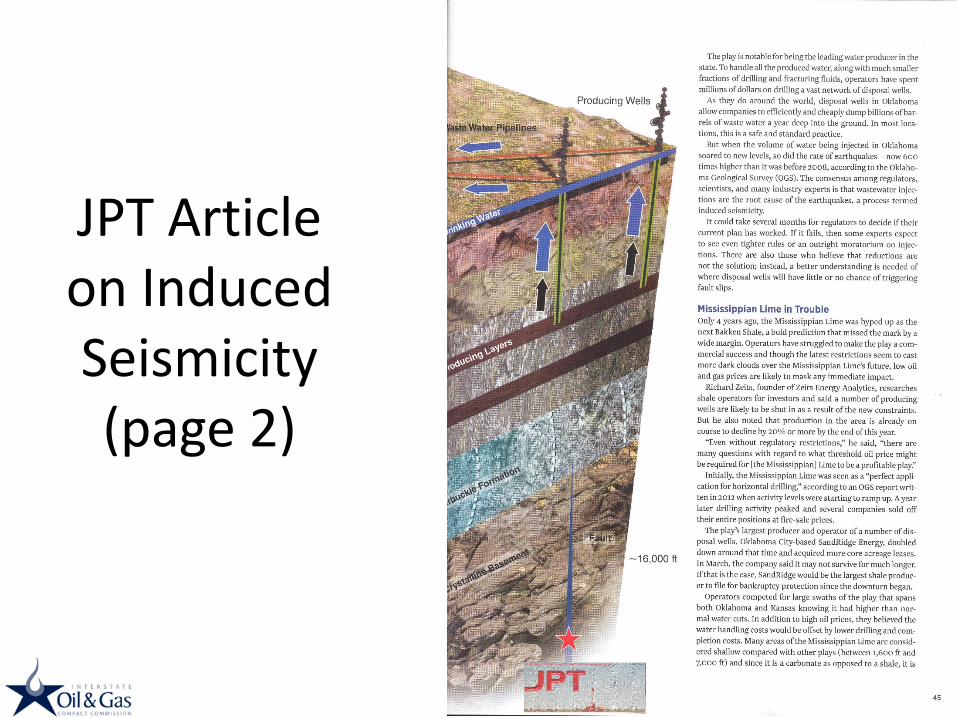
JPT Article on Induced Seismicity (page 2)
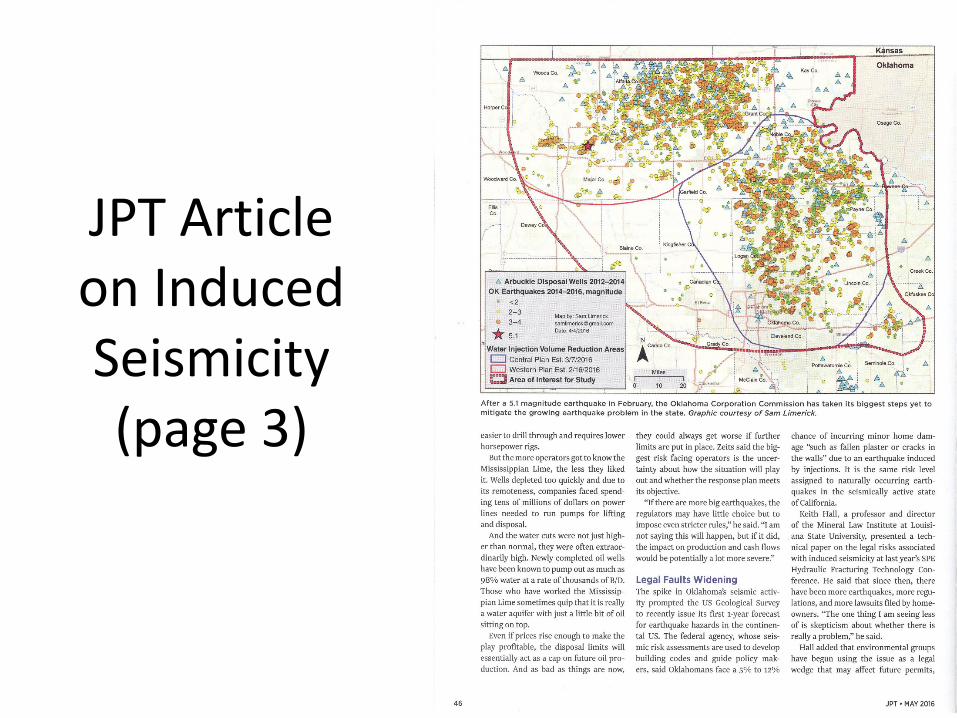
JPT Article on Induced Seismicity (page 3)
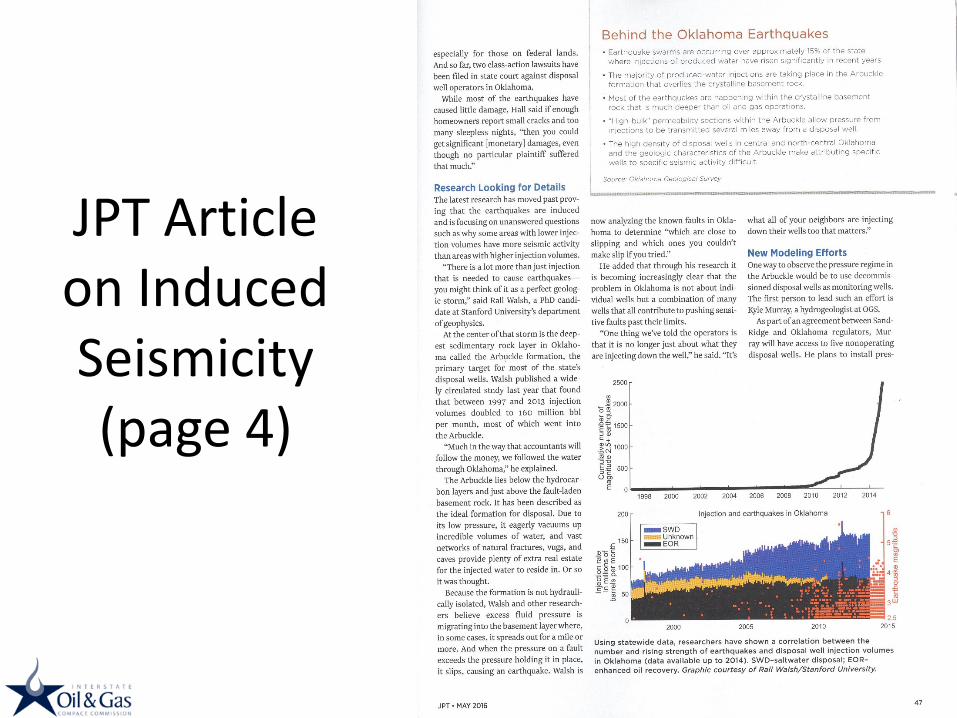
JPT Article on Induced Seismicity (page 4)
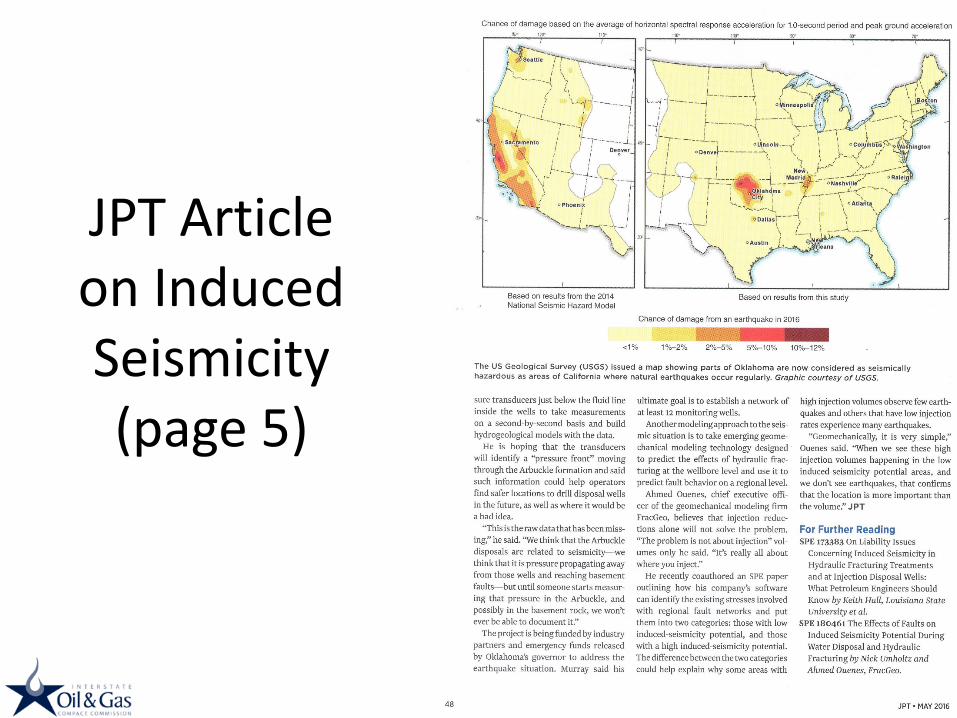
JPT Article on Induced Seismicity (page 5)