epa-600/r-06/057 february 2006 epa u.s. national markal
TRANSCRIPT

EPA-600/R-06/057February 2006
EPA U.S. NationalMARKAL Database:Database Documentation

EPA-600/R-06/057February 2006
EPA U.S. National MARKAL Database
U.S. Environmental Protection AgencyOffice of Research and Development
Washingtion, DC 20460
Database Documentation
by
Carol Shay, Joseph DeCarolis, Dan Loughlin, and Cynthia GageU.S. EPA Air Pollution Prevention and Control Division
Sonia Yeh and Samudra VijayORISE Post-Doctoral Fellows
Evelyn L. WrightFormerly with the EPA
EPA Project Officer: Carol L. ShayOffice of Research and Development (ORD)
National Risk Management Research Laboratory (NRMRL)Air Pollution Prevention and Control Division (APPCD)
Research Triangle Park, North Carolina.

ii
Abstract
This document describes the database used in EPA’s National Model, which is a MARKAL model developed toaid in technology assessment as part of a larger Air Quality Assessment being performed by EPA’s Office ofResearch and Development. The MARKAL (MARket ALlocation) model was developed in the late 1970s atBrookhaven National Laboratory. In 1978, the International Energy Agency adopted MARKAL and created theEnergy Technology and Systems Analysis Program (ETSAP), which is a group of modelers and developers thatmeet every six months to discuss model developments, extensions, and applications. MARKAL is a dynamic,data-driven energy/economic model of a region over a time span of several decades. The economy is modeled asa system of processes that have material, energy, and monetary flows between them and that represent all activi-ties necessary to provide products and services for that region. Each process can choose from among a set ofalternate technologies to complete the process, and each technology is characterized quantitatively by energy,emission, and monetary characteristics. Both the supply and demand sides are integrated, so that one side re-sponds automatically to changes in the other. The model selects that combination of technologies that minimizestotal energy system cost.
The characteristics and constraints associated with the alternate technologies for each process are put into themodel as a database, which is defined by the user. This document describes that database for the U.S. EPAMARKAL model. Constraints are determined by the demand for products and services, the maximum introduc-tion rate of new technologies, the availability of resources, environmental policy goals for energy use and emis-sions, and so forth. Processes are characterized by their physical inputs and outputs of energy and material, bytheir costs, and by their environmental impacts such as emissions of carbon dioxide and oxides of nitrogen andsulfur.

iii
Foreword
The U.S. Environmental Protection Agency (EPA) is charged by Congress with protecting the Nation’sland, air, and water resources. Under a mandate of national environmental laws, the Agency strives toformulate and implement actions leading to a compatible balance between human activities and theability of natural systems to support and nurture life. To meet this mandate, EPA’s research program isproviding data and technical support for solving environmental problems today and building a scienceknowledge base necessary to manage our ecological resources wisely, understand how pollutantsaffect our health, and prevent or reduce environmental risks in the future.
The National Risk Management Research Laboratory (NRMRL) is the Agency’s center forinvestigation of technological and management approaches for preventing and reducing risks frompollution that threaten human health and the environment. The focus of the Laboratory’s researchprogram is on methods and their cost-effectiveness for prevention and control of pollution to air, land,water, and subsurface resources; protection of water quality in public water systems; remediation ofcontaminated sites, sediments and ground water; prevention and control of indoor air pollution; andrestoration of ecosystems. NRMRL collaborates with both public and private sector partners to fostertechnologies that reduce the cost of compliance and to anticipate emerging problems. NRMRL’s researchprovides solutions to environmental problems by: developing and promoting technologies that protectand improve the environment; advancing scientific and engineering information to support regulatoryand policy decisions; and providing the technical support and information transfer to ensureimplementation of environmental regulations and strategies at the national, state, and community levels.
This publication has been produced as part of the Laboratory’s strategic long-term research plan.It is published and made available by EPA’s Office of Research and Development to assist the usercommunity and to link researchers with their clients.
Sally Gutierrez, DirectorNational Risk Management Research Laboratory

iv
EPA Review Notice
The U.S. Environmental Protection Agency through its Office of Research and Development funded and man-aged the research described here as an in-house project. It has been subjected to Agency review and has beenapproved for publication as an EPA document. Mention of trade names or commercial products does not consti-tute endorsement or recommendation for use.
This document is available to the public through the National Technical Information Service, Springfield, Vir-ginia 22161.

v
Abstract ............................................................................................................................................................. iiForeword .......................................................................................................................................................... iiiEPA Review Notice ......................................................................................................................................... ivList of Figures ................................................................................................................................................. viiList of Tables ................................................................................................................................................. viiiAcronyms and Abbreviations .......................................................................................................................... xi
1 Introduction ............................................................................................................................................... 12 MARKAL .................................................................................................................................................. 1
2.1 Description of MARKAL .................................................................................................................... 12.2 Data Needs ........................................................................................................................................... 2
3 The MARKAL EPANMD ......................................................................................................................... 43.1 The ANSWER Framework and Corresponding Excel Spreadsheets ................................................... 43.2 Software ............................................................................................................................................... 43.3 Developing the EPA’s National MARKAL Database .......................................................................... 43.4 Future Technologies for Scenario Analysis ......................................................................................... 53.5 Detailed Model Descriptions ............................................................................................................... 5
4 MARKAL Naming Conventions ............................................................................................................... 54.1 Introduction ......................................................................................................................................... 54.2 Naming Convention Guidelines .......................................................................................................... 5
5 System-Wide Variables .............................................................................................................................. 95.1 System-Wide Variable Data Sources ................................................................................................... 95.2 System-Wide Parameters ..................................................................................................................... 9
6 Energy Carriers .......................................................................................................................................... 96.1 Energy Carrier Data Sources ............................................................................................................... 96.2 Energy Carrier Parameters ................................................................................................................... 9
7 Resource Supply ...................................................................................................................................... 107.1 Parameter Definitions ........................................................................................................................ 107.2 Crude Oil ............................................................................................................................................117.3 Imported Refined Products ................................................................................................................ 137.4 Natural Gas ........................................................................................................................................ 147.5 Coal .................................................................................................................................................... 177.6 Renewables ........................................................................................................................................ 197.7 Export Technologies .......................................................................................................................... 20
8 Process Technologies ............................................................................................................................... 208.1 Process Technology Parameters ........................................................................................................ 208.2 Refineries ........................................................................................................................................... 218.3 Coal Gasification ............................................................................................................................... 228.4 Other Natural Gas Process Technologies ........................................................................................... 238.5 Coke ................................................................................................................................................... 24
9 Conversion Technologies ......................................................................................................................... 259.1 Electricity Generation ........................................................................................................................ 25
Table of Contents
Section Page

vi
Table of Contents (concluded)
Section Page9.2 Conventional LWR Nuclear Technology ........................................................................................... 31
10 Demand Technologies and End-Use Demands ........................................................................................ 3410.1 Demand Sector Parameters .............................................................................................................. 3410.2 Residential Sector ............................................................................................................................ 3510.3 Commercial Sector .......................................................................................................................... 4010.4 Transportation Sector ....................................................................................................................... 4510.5 Industrial Sector ............................................................................................................................... 52
11 Emissions Data ........................................................................................................................................ 5811.1 Emissions from Electricity Generation ....................................................................................... 5811.2 Biomass Emissions ...................................................................................................................... 6211.3 Commercial and Residential Emissions ........................................................................................... 6311.4 Industrial Emissions ......................................................................................................................... 6311.5 Transportation Emissions ................................................................................................................. 63
12 Hydrogen Use in the Transportation Sector ............................................................................................. 6712.1 Hydrogen RES............................................................................................................................. 6712.2 Hydrogen Production Technologies ................................................................................................ 6712.3 Additional Model Configuration ................................................................................................. 69
13 Model Quality Control Processes ............................................................................................................ 7013.1 Data Quality ................................................................................................................................ 7013.2 Data Documentation ........................................................................................................................ 7113.3 Peer Review ..................................................................................................................................... 71
14 Calibration ............................................................................................................................................... 7215 References ............................................................................................................................................... 75
Appendix A: Data Source Characterization .................................................................................................... 79Appendix B: Detailed Sector Data ................................................................................................................. 81Appendix C: Peer Review Comments and Responses .................................................................................. 127

vii
List of Figures
Figure Page1 Example of a Simple Reference Energy System ....................................................................................... 22 Crude Oil RES in the EPANMD.............................................................................................................. 123 Imported GSL, NGL, and LPG RES in the EPANMD ............................................................................ 134 Imported Fuel Oil (DSH) RES in the EPANMD ..................................................................................... 135 Imported Jet Fuel RES in the EPANMD ................................................................................................. 146 Imported Kerosene RES in the EPANMD ............................................................................................... 147 Imported Petroleum Feedstocks RES in the EPANMD ........................................................................... 148 Imported Methanol RES in the EPANMD .............................................................................................. 149 Imported Diesel RES in the EPANMD .................................................................................................... 1410 Price/Supply Curves for Years 2007, 2010, 2015, 2020, and 2026 from the NANGAS Model ............. 1511 Cost/Supply Curves Used in the EPANMD ............................................................................................ 1612 Natural Gas RES in the EPANMD .......................................................................................................... 1613 High Sulfur Bituminous Coal RES in the EPANMD .............................................................................. 1814 Biomass Resource RES ........................................................................................................................... 1915 Wind, Solar, Hydro, and Geothermal Resource RES .............................................................................. 2016 Oil and NGA Exports in the RES ............................................................................................................ 2017 Coal Export RES Example ...................................................................................................................... 2018 Refinery RES ........................................................................................................................................... 2119 Coal Gasification RES ............................................................................................................................. 2320 Pipeline Quality NGA RES ..................................................................................................................... 2421 CNG RES ................................................................................................................................................ 2422 Methanol from NGA RES ....................................................................................................................... 2423 Coke RES ................................................................................................................................................ 2424 Electrical Generation Sector RES ............................................................................................................ 2525 Imported Electricity Resource Technologies ........................................................................................... 2526 Diesel (DSL) to Electric Sector Emissions Accounting RES .................................................................. 2927 Natural gas (NGA) to Electric Sector Emissions Accounting RES ......................................................... 2928 Fuel Oil (DSH) to Electric Sector Emissions Accounting RES............................................................... 3029 Methanol (MTH) to Electric Sector Emissions Accounting RES............................................................ 3030 New Steam Electric Emissions Accounting RES .................................................................................... 3031 Nuclear RES ............................................................................................................................................ 3132 Residential Sector RES ............................................................................................................................ 3633 Commercial Sector RES .......................................................................................................................... 4134 Transportation Sector RES ...................................................................................................................... 4635 Transportation “Dummy” Collector Process Technologies ..................................................................... 4836 Industrial Sector RES .............................................................................................................................. 5337 RES for Coal Retrofits ............................................................................................................................. 6038 Hydrogen RES ......................................................................................................................................... 6839 Comparison of EPANMD to AEO2002: Sector Specific Energy Use in PJ ............................................ 7340 Comparison of EPANMD to AEO2002: System-Wide Coal, Natural Gas, Gasoline,
and Diesel Use in PJ ................................................................................................................................ 7441 Comparison of EPANMD to AEO2002: System-Wide Fuel Oil, Renewables, Liquid
Petroleum Gas, and Nuclear Use in PJ .................................................................................................... 75

viii
List of Tables
Table Page1 Energy Carriers in the EPANMD .............................................................................................................. 52 Resource Technologies in the EPANMD - Examples ................................................................................ 83 Example Naming Convention for Process, Conversion, and Demand Technologies ................................ 84 Emissions Commodities in the EPANMD ................................................................................................. 95 Naming Convention for User-Defined Constraints ................................................................................... 96 QHR(Z)(Y) Values in the EPANMD ......................................................................................................... 97 Electricity Specific Energy Carrier Parameters Values in the EPANMD ................................................ 108 Low-Temperature Heat Specific Energy Carrier Parameters Values in the EPANMD ........................... 109 Data Sources for Domestic Oil in the EPANMD......................................................................................1110 Naming Convention for Crude Oil Resource Technologies .....................................................................1111 Naming Convention for Crude Oil Energy Carriers .................................................................................1112 Naming Convention for Crude Oil “Dummy” Collector Process Technologies ......................................1113 Petroleum Products in the EPANMD ...................................................................................................... 1314 Naming Convention for Imported Refined Products Resource Technologies ......................................... 1315 Naming Convention for Imported Refined Products Energy Carriers ..................................................... 1316 Naming Convention for Imported Refined Products “Dummy” Collector Process Technologies .......... 1317 Natural Gas Supply Domestic Production/Imports Ratios Used in the EPANMD.................................. 1518 Naming Convention for Natural Gas Resource Technologies ................................................................. 1519 Naming Convention for Natural Gas Energy Carriers ............................................................................. 1620 Naming Convention for Natural Gas “Dummy” Collector Process Technologies .................................. 1621 BOUND(BD)Or for Domestic and Import NGA Supply Curves ............................................................ 1722 Domestic and Import NGA Supply Costs ................................................................................................ 1723 Domestic and Import NGA Supply Constraints ...................................................................................... 1724 MARKAL Coal Regions ......................................................................................................................... 1825 Examples of Coal Resource Technologies ............................................................................................... 1826 Naming Convention for Coal Resource Technologies ............................................................................. 1827 Naming Convention for Coal Energy Carriers ........................................................................................ 1828 Examples of Coal Energy Carriers .......................................................................................................... 1829 Naming Convention for Coal “Dummy” Collector Process Technologies .............................................. 1830 BOUND(BD)Or on Gasoline and NGA Exports ..................................................................................... 2031 Coal Export BOUND(BD)Or .................................................................................................................. 2032 Cost and Availability Parameters for Refinery Types .............................................................................. 2133 Input Energy Carrier INP(ENC)p Values ................................................................................................ 2234 Output Energy Carrier OUT(ENC)p Values ............................................................................................ 2235 Existing Refinery Residual Capacity and Bound on Capacity, High Conversion Bound on Capacity ... 2336 Emission factors of Existing Refinery (S28) and High Conversion Refinery (S27) ............................... 2337 Cost and Availability Parameters for Gasification ................................................................................... 2338 Bounds on Gasification Capacity in PJ per Year ..................................................................................... 2439 Data Sources for Electric Sector Technologies ........................................................................................ 2540 Electricity Conversion Technologies ....................................................................................................... 2641 Availability Values for Electric Sector Technologies .............................................................................. 2742 Electric Sector Energy Carriers ............................................................................................................... 29

ix
43 Naming Convention for Electric Sector Emissions Tracking .................................................................. 3044 Residential Sector End-Use Demands ..................................................................................................... 3645 Residential Sector Demand Values in the EPANMD............................................................................... 3646 Residential Demand Calculations ............................................................................................................ 3647 Residential End-Use Technology Naming Convention ........................................................................... 3748 Residential Sector Cost and Efficiency Units .......................................................................................... 3749 Residential Sector IBOND Example ....................................................................................................... 3850 Residential Sector LIFE Values ............................................................................................................... 3851 Residential Sector Energy Carriers .......................................................................................................... 3952 Residential Emissions “Dummy” Process Technologies ......................................................................... 4053 Residential Space and Water Heating Fuel Splits .................................................................................... 4054 Residential Space and Water Heating Constraints ................................................................................... 4055 Commercial Sector End-Use Demands ................................................................................................... 4156 Commercial Sector Demand Values ........................................................................................................ 4157 Sample portion of KSDOUT ................................................................................................................... 4258 Commercial Sector Conversion Factors .................................................................................................. 4259 Commercial Sector End-Use Technology Naming Convention .............................................................. 4260 Commercial Sector IBOND example ...................................................................................................... 4361 Commercial Sector Energy Carriers ........................................................................................................ 4462 Commercial Sector Emission “Dummy” Process Technologies .............................................................. 4563 Commercial Space and Water Heating Fuel Splits .................................................................................. 4564 Commercial Space and Water Heating Constraints ................................................................................. 4565 Transportation Sector End-Use Demands ................................................................................................ 4666 Transportation Sector Demands ............................................................................................................... 4667 Naming Convention for Light Duty Vehicle Demand Technologies ....................................................... 4768 Naming Convention for Heavy Duty Vehicle Demand Technologies ..................................................... 4769 Naming Convention for Bus Demand Technologies ............................................................................... 4770 Naming Convention for Air Transport Demand Technologies ................................................................ 4871 Naming Convention for Shipping Demand Technologies ....................................................................... 4872 Naming Convention for Public Transportation Demand Technologies ................................................... 4873 Naming Convention for Rail Demand Technologies ............................................................................... 4874 Transportation Sector Process Technologies ........................................................................................... 4875 Transportation IBOND Example ............................................................................................................. 4976 Transportation Sector Energy Carriers .................................................................................................... 5277 Transportation Car Class Percentages ..................................................................................................... 5278 Industrial Sector End-Use Demands ........................................................................................................ 5379 Industrial Sector Demand Values in the EPANMD ................................................................................. 5380 Industrial Sector Demand Technologies .................................................................................................. 5481 Industrial Sector Demand Tech Energy Needs ........................................................................................ 5482 Industrial Sector Naming Convention ..................................................................................................... 5483 Industrial Sector “Dummy” Process Technologies .................................................................................. 5584 Autoproduction Technologies in the Industrial Sector ............................................................................ 5585 CHP Technologies in Industrial Sector .................................................................................................... 5686 Industrial Sector Energy Carriers ............................................................................................................ 5887 Industrial Emissions “Dummy” Process Technologies ............................................................................ 5888 CO2, PM10, VOC, and NOX Emission Factors from Generating Electricity as Used in the EPANMD ... 5989 SO2 Emission Factors from Generating Electricity as Used in the EPANMD ........................................ 5990 Emission Factors from Coke as Used in the EPANMD........................................................................... 5991 Emission Factors from Coal Gasification as Used in the EPANMD ....................................................... 5992 SOX Control Data Summary .................................................................................................................... 6293 Biomass CO2 Emission Factors in the EPANMD .................................................................................... 6294 Residential Emission Factors in (lb/MMBtu) used in the EPANMD ...................................................... 63
List of Tables (continued)
Table Page

x
List of Tables (concluded)
Table Page95 Commercial Emission Factors (in lb/MMBtu) used in the EPANMD .................................................... 6396 Industrial CO2 Emission Factors in the EPANMD .................................................................................. 6397 Additional Industrial EPANMD Emission Factors (in lb/MMBtu) ......................................................... 6398 Airplane Emission Factors ....................................................................................................................... 6499 Bus Emission Factors .............................................................................................................................. 64100 Passenger Rail Emission Factors ............................................................................................................. 64101 Shipping Emission Factors ...................................................................................................................... 64102 Heavy Truck Emission Factors ................................................................................................................ 64103 Light Duty Vehicle Emission Factors ...................................................................................................... 64104 Hydrogen Production Pathways .............................................................................................................. 68105 Energy Inputs and Investment Costs for Hydrogen Production Technologies ........................................ 68106 Emissions Associated with Hydrogen Production Technologies ............................................................. 69107 ETL Parameters ....................................................................................................................................... 69108 Primary Data Sources Used in Developing the Database ........................................................................ 70109 Sector Peer Reviewers ............................................................................................................................. 72

xi
Acronyms and Abbreviations
Acronym DefinitionAEO U.S. Department of Energy’s Annual Energy Outlook reportAPB Atmospheric Protection BranchAPPCD Air Pollution Prevention and Control DivisionBtu British thermal unitCAIR Clean Air Interstate RuleCCAR Climate Change Action ReportCCS carbon capture and sequestrationCNG compressed natural gasDOE U.S. Department of EnergyEE/RE DOE’s Energy Energy Efficiency and Renewable Energy programsEIA Energy Information AdministrationEPA U.S. Environmental Protection AgencyEPANMD EPA National MARKAL databaseEPRI Electric Power Research InstituteETSAP Energy Technology and Systems Analysis ProgramFGD flue gas desulfurizationGHG green house gasGW gigawattsIEA International Energy AgencyICE internal combustion engineIGCC integrated gasification combined cycleIHM initial heavy metal (enriched uranium)IPM EPA’s Integrated Planning ModelISA-W Integrated Strategic Assessment WorkgroupLBL Lawrence Berkley LaboratoriesLDC local distribution centerLDV light duty vehiclesLEV low emissions vehiclesLNB low-NOX burnersLPG liquid propane gasLWR light water reactorMARKAL MARKet ALlocation modelmpg miles per gallonNANGAS North American Natural Gas Analysis SystemNEI Nuclear Energy InstituteNEMS U.S. EIA’s National Energy Modeling SystemNESCAUM Northeast States for Coordinated Air Use ManagementNMOCs non-methane organic compoundsNOX oxides of nitrogenNREL National Renewable Energy LaboratoryNRMRL ORD’s National Risk Management Research LaboratoryOECD Organization for Economic Co-operation and Development

xii
ORD U.S. EPA’s Office of Research and DevelopmentORNL Oak Ridge National LaboratoriesOTT DOE’s Office of Transportation TechnologiesPJ petajoulesPJ/a petajoules per annumPM10 fine particulate matterQM quality metricsRES reference energy systemSAGE System for Analysis of Global EnergySAIC Science Applications International CorporationSCR selective catalytic reductionSMR steam methane reformingSOX oxides of sulfurSULEV super ultra low emissions vehiclesSUV sports utility vehicleTAG EPRI’s Technological Assessment GuideULEV ultra low emissions vehiclesUSGCRP U.S. Global Change Research ActVMT vehicle miles traveledVOC volatile organic compounds
Acronyms and Abbreviations (concluded)
Acronym Definition

1
EPA U.S. National MARKAL Database
1. IntroductionThe purpose of this document is to describe in detail theU.S. Energy System database developed by the EPA’s In-tegrated Strategic Assessment Workgroup (ISA-W) for usewith the MARKAL model. The ISA-W is part of the Of-fice of Research and Development (ORD), located in theNational Risk Management Research Laboratory(NRMRL), Air Pollution Prevention and Control Division’s(APPCD) Atmospheric Protection Branch (APB). Thedocumentation is designed to help users of the database,hereafter referred to as the EPA National MARKAL Data-base (EPANMD). The EPANMD was developed to aid intechnology assessment as part of a larger Air Quality As-sessment being performed by EPA ORD. For a completeunderstanding of the Air Quality Assessment approach see,“Demonstration of a Scenario Approach for TechnologyAssessment: Transportation Sector” (EPA-600/R-04/135,January 2004).
2. MARKAL
2.1 Description of MARKALThe MARKAL (MARket ALlocation) model was devel-oped in the late 1970s at Brookhaven National Laboratory.In 1978, the International Energy Agency adoptedMARKAL and created the Energy Technology and Sys-tems Analysis Program (ETSAP), which is a group ofmodelers and developers that meet every 6 months to dis-cuss model developments, extensions, and applications.MARKAL therefore benefits from an unusually active andinteractive group of users and developers. MARKAL iscurrently in use by more than 40 countries for researchand energy planning. For a detailed description ofMARKAL, see the ETSAP MARKAL users manual athttp://www.etsap.org/documentation.asp .
MARKAL is a data-driven, energy systems economic-op-timization model. The user inputs the structure of the en-ergy system to be modeled, including resource supplies,
energy conversion technologies, end use demands, and thetechnologies used to satisfy these demands. The user mustalso provide data to characterize each of the technologiesand resources used, including fixed and variable costs, tech-nology availability and performance, and pollutant emis-sions. MARKAL then calculates, using straightforward lin-ear programming techniques, the least cost way to satisfythe specified demands, subject to any constraints the userwishes to impose. Outputs of the model include a determi-nation of the technological mix at intervals into the future,estimates of total system cost, energy services (by typeand quantity), estimates of criteria and greenhouse gas(GHG) emissions, and estimates of energy commodityprices.
The basis of the MARKAL model framework is a networkdiagram called a Reference Energy System (RES), whichdepicts an energy system from resource to end-use demand(Figure 1). The RES divides an energy system up intostages. The four technology stages represented are resource,process, conversion, and demand technologies. These tech-nologies feed into a final stage consisting of end-use de-mands for useful energy services. End-use demands in-clude items such as residential lighting, commercial spaceconditioning, and automobile passenger miles traveled.Energy carriers interconnect the stages.
The first technology stage, resource technologies, repre-sents all flows of energy carriers into and out of the energysystem. These include imports and exports, mining andextraction, and renewable energy resources. The secondtechnology stage, transformation technologies, is subdi-vided into two classes: conversion technologies, whichmodel electricity generation, and process technologies,which change the form, characteristics, or location of en-ergy carriers. Process technologies include oil refineries,hydrogen production technologies, and pipelines. Processtechnologies are also used in the model as “dummy” tech-nologies, where emissions are tracked or resources of vary-ing qualities are collected. They are referred to as “dummy”

2
Resource Conversion Demand End-use
Technologies Technologies Technologies Demand
Oil Well 1
Oil Oil1 Oil2 Oil3
Oil Well 2 Oil Collector Refinery Emissions Tracking Power Plant
Oil Well 3Electricity
Residential Air Conditioner
Residential Space Cooling
Gas Well 1Gas Gas1 Gas2
Gas Collector
Emissions Tracking Power Plant
Gas Well 2
ProcessTechnologies
Figure 1. Example of a Simple Reference Energy System.
technologies because they are not an actual process withcosts associated with them. The final technology stage,demand technologies, are those devices that are used todirectly satisfy the final RES stage, end-use service de-mands. Demand technologies include vehicles, furnaces,and electrical devices.
Energy carriers are the various forms of energy consumedand produced in the RES. These can include coal variants(e.g., with different sulfur contents), crude oil, refined pe-troleum products, electricity to different grids, and renew-able energy (e.g., biomass, solar, geothermal, hydro). Themodel requires that the total amount of energy producedbe at least as much as that consumed. The inter-connec-tions between the various technologies in a MARKALmodel are accomplished by energy carriers flowing out ofone or more technologies and into others.
The MARKAL RES concept offers a significant enhance-ment over single sector energy technology models becauseit allows technologies and sectors to interact through theinterconnections in the RES. For example, the residentialair conditioner in the RES above can use either oil or gas.If it were to switch its fuel usage from heavily oil to heavilygas, it may shift the relative prices of gas to the industrial,and transportation sectors, potentially leading to a shiftaway from gas for some end uses.
2.2 Data NeedsA MARKAL database uses a variety of data parameters todescribe each element of the Reference Energy System.
The general categories of data required for a MARKALmodel are:
• System-wide global parameters,• Energy service demands,• Energy carriers,• Resource technologies,• Process and demand technology profiles, and• Environmental emission factors.
2.2.1 System-Wide ParametersSystem-wide, otherwise known as global, parameters areassumptions that apply to the entire model. Two importantsystem-wide aspects of the model are:
• Cost discounting - All costs must be entered in the samemonetary unit and discounted to a common year; U.S.$1995 for the EPANMD, and
• Subdivision of the year into load fractions - MARKALsubdivides the year into three seasons Z (Z = Summer,Winter, Intermediate) and two times of day Y (Y =Day, Night).
2.2.2 Energy Service DemandsEnergy service demands describe the requirement for spe-cific end-use energy services to be delivered to individualsand the economy. Examples of energy services include resi-dential lighting, personal automotive transport, and indus-trial process heat. The demand for an energy service doesnot refer to the consumption of a particular energy com-modity, but rather to the provision of services such as manu-facturing steel, transportation, lighting offices, and heat-ing homes. These energy services are measured in units of

3
useful energy, which may vary with sector. For example,in the U.S. model, demand for the majority of transportservices is specified in miles traveled, while the demandfor industrial process energy is specified in petajoules (PJ).
Key demand related data include:• Projections for useful energy demand services by sec-
tor, and• The load shape of the demand pattern by season/day-
night (for end use demands that use electricity or low-temperature heat).
2.2.3 Energy CarriersEnergy carriers are the various forms of energy producedand consumed in the Reference Energy System depictedin a MARKAL model. Energy carriers can include fossilfuels, such as coal with different sulfur content, crude oiland oil products, electricity to different grids, synthetic fuelsproduced by model processes, and renewable energy (e.g.,biomass, solar, geothermal, hydro). Energy carriers pro-vide the interconnections between the various technolo-gies in a MARKAL model by flowing out of one or moretechnologies and into others. The model requires that thetotal amount of each energy carrier produced is greater thanor equal to the total amount consumed.
Key energy carrier related data include:• Overall transmission efficiency for all energy carriers,• For electricity and low-temperature heat -N Investment and operation and maintenance cost for
transmission and distribution systems, andN Reserve margin, or amount of installed capacity
above the highest average annual demand.
2.2.4 Resource TechnologiesResource technologies are the entry points for raw fuelsinto and out of the energy system and include imports andexports, mining and extraction, and renewable energy.These technologies are generally characterized usingstepwise supply curves that indicate how much of a re-source can be obtained at a given price during each modelperiod. In the EPANMD, imported electricity is modeledusing a three-step curve, while the mining of various gradesof coal is represented using eight-step curves.
Key resource technology data include:• Bounds indicating the size of each step on each re-
source supply curve. (These bounds might arise fortechnical reasons, such as a limitation on the amountof oil that can be produced from a particular reservoirin a given year, or for economic reasons),
• A corresponding resource supply cost for each supplystep, and
• Cumulative resources limits indicating the total amountof a resource at a particular supply step that can bedelivered over the entire modeling horizon (e.g., totalproven size of a petroleum reservoir).
2.2.5 Process and Demand TechnologiesProcess technologies are those that change the form, char-acteristics, or location of energy carriers. Examples of pro-cess technologies in the U.S. model include oil refineries andhydrogen production technologies. A sub-category of theprocess technologies is the conversion technologies, whichmodel electricity and low-temperature heat production.Demand technologies are those devices that are used todirectly satisfy end-use service demands, including vehicles,furnaces, and electrical devices. These technologies arecharacterized using parameters that describe technologycosts, fuel consumption and efficiency, and availability.
Key process and demand technology data include:• Technology costs-" The cost of investing in new capacity," Fixed operating and maintenance (O&M) costs for
installed capacity," Variable O&M costs according to the operation of
installed capacity, and" Fuel delivery costs corresponding to any sectoral
difference in the price of an energy carrier;• Energy carriers into and out of each technology;• The technical efficiency (usually defined as the ratio
between the sum of energy carrier or useful energyservice outputs to the sum of energy carrier inputs);
• The model year in which the technology first becomesavailable for investment;
• Availability factors (for process technologies) and ca-pacity utilization factors (for demand technologies) thatdescribe the maximum percent annual (or season/day-night) availability for operation or a fixed percent an-nual (or season/day-night) capacity utilization per unitof installed capacity;
• The current existing installed capacity;• Limits on capacity in the form of incremental new in-
vestment (absolute or growth rate) or total installedcapacity. Such bounds may be set for economic, tech-nical, behavioral, or other reasons; and
• “Hurdle” rates, or technology specific discount rates,that can be used to represent non-economic, behav-ioral aspects of investment choices (e.g., consumerpreferences, expectation of very rapid rates of return,or information gaps). Often the “real world” does not

4
make decisions based strictly upon the least-cost per-spective that MARKAL uses. These impediments tothe market can be represented to MARKAL as tech-nology-specific discount rates, higher than thesystemwide discount rate, for such technologies.
2.2.6 Environmental EmissionsMARKAL has the capacity to track the production of emis-sions according to the activity, installed capacity, or newinvestment in capacity of a resource or technology. In theEPANMD this capacity is used to track emissions such ascarbon, NOX, sulfur, VOCs, and particulates. The EPANMDtracks these emissions by sector.
Key environmental variable related data (expressed in termsof pollutant emissions) include:
• Emissions per unit of technology activity, installed ca-pacity, or new investment.
• Emission constraints, which can take the form of a capon total emissions in a year, or a cumulative cap onemissions over the entire modeling horizon.
3. The MARKAL EPANMD
3.1 The ANSWER Framework and Corre-sponding Excel SpreadsheetsThe EPANMD was developed using the ANSWER frame-work. ANSWER is a Windows interface to MARKAL de-veloped using MS Visual Basic, MS Access, MS Excel,and requiring the GAMS mathematical modeling languagesoftware. For a complete description of ANSWER see,“ANSWER MARKAL, An Energy Optimization Tool ver-sion 5” (available from Ken Noble of [email protected]). All data for the EPANMDwas organized and transformed from raw data toMARKAL-ready data in Excel spreadsheets that are avail-able along with the database.
3.2 SoftwareAll results referenced in this document were based on:
• ANSWER version 5.5.3• GAMS version 21.3, and• EPANMD version 1.0
3.3 Developing the EPA’s National MARKALDatabaseThe goal for the development of the national model was tofocus on five key sectors: transportation, commercial, resi-dential, industrial, and electricity generation.
The database was initially based on a MARKAL databaseproduced in 1997 by Brookhaven National Laboratory forthe U.S. Department of Energy (hereafter referred to as the“1997 DOE MARKAL database”). Over time, all sectorshave been thoroughly revised and updated, although theoriginal values were maintained for several technologiesthat were outside this study’s focus areas. Wherever pos-sible, the data for updating the database was drawn fromDOE’s Annual Energy Outlook (AEO) and the input datato the National Energy Modeling System (NEMS), whichis used to produce the AEO.
AEO data were selected for the RES because it is a nation-ally recognized source of technology data and widely usedwhere reference or default data are required. It presentsmid-term forecasts of energy prices, supply, and demand.The projections are based on results from NEMS and takeinto account federal, state, and local laws and regulationsin effect at the time of the model run.
Where AEO data were not available in a form appropriateto the MARKAL needs, data were derived from otherwidely recognized authoritative sources:
• In the transportation sector, personal vehicle technol-ogy data were drawn from the U.S. Department ofEnergy (DOE) Office of Transportation Technologies(OTT) Quality Metrics assessment. Quality Metrics(QM) describes the analytical process used in estimat-ing future energy, environmental, and economic ben-efits of U.S. DOE Energy Efficiency and RenewableEnergy (EE/RE) programs. Two additional vehicletechnology characterizations were derived from thereport by DeCicco et al., 2001;
• Data for the electricity sector were drawn from NEMSwith supplemental data pulled from the Electric PowerResearch Institute (EPRI) Technical Assessment Guide(TAG). The TAG is a standard reference work for theenergy industry that characterizes key electric genera-tion technologies and their operation, costs, environ-mental impacts, and so forth.
The database is divided into five year time periods. Thecurrent database runs from 1995 to 2035. Subsequent up-dates will drop historical time periods such as 1995 and2000, and extend the time horizon out to 2055.
As each sector of the model was completed, data charac-terizing the associated technologies was peer-reviewed bysector experts for appropriateness of the data source, com-pleteness of the technology options, and correctness of themethodology in converting the data from the original sourceto MARKAL inputs.

5
After assembling a complete representation of the energysystem, the model was calibrated against the AEO 2002report and peer reviewed by US Energy System expertswith MARKAL experience. The goals of the calibrationand peer review were to: (i) ensure that the model wasproducing reasonable results, given its input assumptions,(ii) determine whether the model was providing a plau-sible, consistent representation of the key features of theU.S. energy system, (iii) be able to identify why differ-ences exist in cases where our results differ from AEO re-sults, and (iv) identify any significant errors in the con-struction or characterization of the RES. It should be notedthat an exact calibration of MARKAL to the AEO is notpractical or desirable since the models are very different instructure and purpose.
3.4 Future Technologies for Scenario Analy-sisIn order to evaluate various technological pathways to 2050,future technologies for the transportation and energy pro-duction sectors will be added to the EPANMD databaseover time. Specific technologies in the transportation sec-tor include biofuels and hydrogen fuel. Specific technolo-gies in the electricity production sector are still being de-veloped. Technology characterizations will be added orupdated as deemed necessary.
3.5 Detailed Model DescriptionsThe remaining pages of this document give a detailed de-scription of the data in the EPANMD and the calibrationsteps the model went through to verify its accuracy. It isdivided into twelve sections: naming conventions (section4), system-wide parameters (section 5), energy carriers (sec-tion 6), resource supply technologies (section 7), processtechnologies (section 8), conversion technologies (section9), demand technologies and end-use demands (section 10),emissions accounting (section 11), the hydrogen sector (sec-tion 12), model quality control processes (section 13),model calibration (section 14), and preliminary model re-sults (section 15).
Appendix B at the end of the report is detailed data foreach sector.
4. MARKAL Naming Conventions
4.1 IntroductionNaming conventions help the user to organize the infor-mation and to have some idea where in the RES a particu-lar component belongs.
4.2 Naming Convention GuidelinesThe naming convention guidelines are laid out below bysector.
4.2.1 Energy Carrier and Material CommodityNamesEnergy carriers are named with up to 10 characters suchthat:
• The first one to five characters signifying the energytype,
• The remaining characters added on to specify the pro-cess it is coming from or going to,
• Energy carriers used in the Industrial Sector are an ex-ception to these guidelines, starting with ‘I’ for Indus-trial and followed by letters that specify the processtype and the industrial sub-sector.
The list of energy carriers in the EPANMD is provided inTable 1.
Table 1. Energy Carriers in the EPANMD.
continued
metI noitpircseD0-CHOIB sesudnellaotsecruosllamorfsporcsuoecabreH0-DWOIB sesoprupllaotdooW0-XWSMB HTMrofdeddaX(etsawdiloslapicinuM a)
SHBAC .ppAmorflaocsuonimutibruflushgiH b ecafrus,UHBAC .drgrednu,.ppAmorflaocsuonimutibruflushgiHSLBAC ecafrus,,.ppAmorflaocsuonimutibrufluswoLULBAC .drgrednu,.ppAmorflaocsuonimutibrufluswoLSMBAC ecafrus,.ppAmorflaocsuonimutibruflus.deMUMBAC .drgrednu,.ppAmorflaocsuonimutibruflus.deMSHGAC .ppAmorflaocelipbogruflushgiHSMLAC ecafrus,.ppAmorflaocetingil,ruflus.deMULMAC .drrednu,.ppAmorflaoclacigrullatem,rufluswoLUMMAC .drrednu,.ppAmorflaoclacigrullatem,ruflus.deM
PFCC rewopderif-laocotlaocllASMLDC ecafrusatokaDmorf,laocetingil,ruflus.deMSHLGC ecafrus,tsaoCfluGmorflaocetingil,ruflushgiHSMLGC ecafrus,tsaoCfluGmorflaocetingil,ruflus.deM
SHBIC ecafrus,roiretnImorflaoc.tib,ruflushgiHUHBIC .drgrednu,roiretnImorflaoc.tib,ruflushgiHSMBIC ecafrus,roiretnImorflaoc.tib,ruflus.deMUMBIC .drgrednu,roiretnImorflaoc.tib,ruflus.deMTEMC gnikocotlaoclacigrullateM
0-PMITEMC gnikocotlaoclacigrullateMdetropmIGNC saglarutandesserpmoC
HTGNC skcurtotGNCLTGNC selcihevytudthgilotGNC
XGNC selcihevleufibenilosag-GNCrofleuFSMSNC ecafrus,WNmorflaoc.tib-bus,ruflus.deM
PFCAOC rewopderif-laocotlaoCRPFCAOC derewoper-rewopderif-laocotlaoCBFAEAOC debdezidiulfcirehpsomtaotlaoC
CGIEAOC CCGIotyltceridlaoC c
CFCMEAOC sllecleufedibracnetlomotlaoCBFPEAOC debdezidiulfdezirusserpotlaoC

6
Table 1 (continued). Energy Carriers in the EPANMD.
metI noitpircseDHSAGAOC noitacifisagutBhgihotlaoCSISAGAOC noitacifisaglaocuts-niotlaoCMSAGAOC noitacifisaglaocot)utBdem(laoC
IAOC gnitnuoccasnoissimeotroirpyrtsudniotlaoCAEIAOC .gntcca.simeretfarotceslairtsudnieritneotlaoC
0-HBLAOC utBmmbl76.1>(ruflushgih.tib:laoC d)0-LBLAOC )utBmmbl8.0-4.0(rufluswol.tib:laoC0-MBLAOC )utBmmbl76.1-8.0(ruflusmuidem.tib:laoC
XELAOC tropxeotlaocfosepytllA0-HLLAOC )utBmmbl76.1>(ruflushgihetingil:laoC0-LLLAOC )utBmmbl8.0-6.0(rufluswoletingil:laoC0-MLLAOC )utBmmbl76.1-8.0(ruflusmuidemetingil:laoC0-LMLAOC )utBmmbl6.0<(rufluswollacigrullatem:laoC0-MMLAOC )utBmmsbl6.0>(ruflusdemlacigrullatem:laoC
0-LSLAOC )utBmmsbl4.0<(rufluswol.tibbus:laoC0-MSLAOC )utBmmsbl4.0>(ruflusdem.tibbus:laoC
EKOC snoitacilppalairtsudniotnitupniekoC0-PMIEKOC snoitacilppalairtsudniotnitupniekoC
ULBPC BRPmorflaoc.tib,rufluswoL e .drgrednu,SLSPC ecafrus,BRPmorflaoc.tib-bus,rufluswoLSMSPC ecafrus,BRPmorflaoc.tib-bus,ruflus.deMULBRC .drgrednu,.sntMykcoR,laoc.tib,rufluswoLSLSRC ecafrus,.sntMykcoR,laoc.tib-bus,rufluswoLSLBSC ecafrus,tsewhtuoSmorflaoc.tib,rufluswoLSMSSC ecafrus,tsewhtuoSmorflaoc.tib-bus,ruflus.deM
1EHBMTSC SH f xOSotroirp.cele.mtsotlaoc.tib g slortnocETIBMTSC cirtcelemaetsgnitsixeotlaoctiB
2ETIBMTSC xONotroirp.celemtsotlaoc.tiB h snoitpolortnoc
3ETIBMTSC BNLneewteblaoc.tiB i RCNS/RCSdna j rofstiforterlortnocxON
1ELBMTSC SL k slortnocxOSotroirp.cele.mtsotlaoctib1EMBMTSC SM l slortnocxOSotroirp.cele.mtsotlaoctib1EHLMTSC slortnocxOSotroirp.cele.mtsotetingilSH
EGILMTSC cirtcelemaetsgnitsixeotetingiL2EGILMTSC snoitpolortnocxONotroirpcele.mtsotetingiL
3EGILMTSC rofRNCS/RCSdnaBNLneewteb.cele.mtsotetingiLlortnocxON
1ELLMTSC slortnocxOSotroirp.cele.mtsotetingilSL1EMLMTSC slortnocxOSotroirpcele.mtsotetingilSM1ELSMTSC slortnocxOSotroirp.cele.mtsot.tib-busSL1EMSMTSC slortnocxOSotroirp.cele.mtsot.tib-busSMEBUSMTSC cirtcelemaetsgnitsixeotlaoc.tib-buS
2EBUSMTSC snoitpolortnocxONotroirp.cele.mtsot.tib-buS
3EBUSMTSC rofRCNS/RCSdnaBNLneewteb.cele.mtsot.tib-buSlortnocxON
0-OHD liognitaeh,leseiDGLD HGIH-LEUFDIUQILYMMUDHSD etallitsidyvaehfosecruosllA
AECHSD .gtcca.simeretfarotceslaicremmocotlioleuFAEEHSD noitarenegyticirtceleotlioleuf:snoissimE
NAEEHSD snoissimexONretfacirtcelemaetsotlioleuFSAEEHSD snoissimexOSretfacirtcelemaetsotlioleuF
0-HHSD lioleufruflushgihdetropmIAEIHSD rotceslairtsudniehtotlioleuf:snoissimE0-LHSD lioleufrufluswoldetropmI
THSD gnippihsrof)leufreknub(lioleuFLSD liognitaehdnaleufleseidfosecruosllA
AECLSD sesulaicremmocrof.gtccasnoissimeretfaleseiDAEELSD noitarenegyticirtceleehtotleseiD
continued continued
metI noitpircseDNPELSD AEerofebnoitarenegyticirtceleehtotleseiD m
AEILSD esulairtsudnirof.slrtnoc.simexONretfaleseiD0-LLSD leseidyawhgihrufluswoldetropmI
AERLSD snoissimeretfalaitnediserotleseiDTLSD leseidnoitatropsnarT
2HTLSD tropsnart2HrofleseidnoitatropsnarT0-ULSD leseidyawhgihrufluswolartludetropmI
58E leuf58ECLE sesoprupllaotyticirtcelE
2HVPCLE VPmorfyticirtcelE n noitcudorp2Hot2HTWCLE noitcudorp2HotdniwmorfyticirtcelE
HTE sesoprupllaroflonahtELTHTE tropsnartotlonahtE
XHTE selcihevxelfenilosag-58ErofleuFQEF tnelaviuqelissoF
0-MHTOEG sesudnellaotygrenelamrehtoeGLSG sesudnellaotenilosaG
AEILSG rotceslairtsudniotenilosaG0-PMILSG enilosagdetropmILGNRLSG GNdnaseirenifermorfenilosaG o sdiuqil
TLSG tropsnartllaotenilosaG0-ORDYH noitarenegyticirtcelerofcirtceleordyH
NEGORDYH20 rotcesnoitatropsnartehtotnegordyH
HCEI slacimehcssecorplacimehc-ortcelelairtsudnISIEI leetsdnanorissecorplacimehc-ortcelelairtsudnIPLEI repapdnaplupssecorplacimehc-ortcelelairtsudnIFNEI latemsuorref-nonssecorplacimehc-ortcelelairtsudnIMNEI slatem-nonssecorplacimehc-ortcelelairtsudnIIOEI yrtsudnirehtossecorplacimehc-ortcelelairtsudnIHCFI HCFI p
SIFI kcotsdeefleetsdnanorilairtsudnIHCMI slacimehcevirdenihcamlairtsudnI
SIMI leetsdnanorievirdenihcamlairtsudnIPLMI repapdnaplupevirdenihcamlairtsudnIFNMI slatemsuorref-nonevirdenihcamlairtsudnIMNMI slatem-nonevirdenihcamlairtsudnIIOMI yrtsudnirehtoevirdenihcamlairtsudnI
GFBDNI DNI(saGecanruFtsalB q)OIBDNI )DNI(sleufoiB
AOCDNI )DNI(laoCKOCDNI )DNI(ekocnevOCLEDNI )DNI(yticirtcelEHTEDNI )DNI(enahtETEHDNI )DNI(taeHOFHDNI )DNI(lioleufyvaeHDYHDNI )DNI(ordyHGPLDNI )DNI(sesagmuelortepdeifiuqiLPANDNI )DNI(ahthpaNAGNDNI )DNI(ximsaglarutaNCUNDNI )DNI(raelcuN
LIODNI )DNI(stcudorpmuelortepdenifeRCTPDNI )DNI(ekocmuelortePLOSDNI )DNI(raloS
NIWDNI )DNI(dniWHCOI slacimehcrehtolairtsudnI
SIOI leetSdnanorIrehtOlairtsudnIPLOI repapdnapluprehtolairtsudnIFNOI slatemsuorref-nonrehtolairtsudnI
Table 1 (continued). Energy Carriers in the EPANMD.

7
Table 1 (continued). Energy Carriers in the EPANMD.
continued
metI noitpircseDMNOI slatem-nonrehtolairtsudnIIOOI yrtsudnirehtollarehtolairtsudnIHCPI slacimehctaehssecorplairtsudnI
SIPI leetsdnanoritaehssecorplairtsudnIPLPI repapdnapluptaehssecorplairtsudnIFNPI slatemsuorref-nontaehssecorplairtsudnIMNPI slatem-nontaehssecorplairtsudnIIOPI yrtsudnirehtotaehssecorplairtsudnIHCSI slacimehcmaetslairtsudnI
SISI leetsdnanorimaetslairtsudnIPLSI repapdnaplupmaetslairtsudnIFNSI slatemsuorref-nonmaetslairtsudnIMNSI slatem-nonmaetslairtsudnIIOSI yrtsudnirehtomaetslairtsudnI
FTJ sesudnellaotsecruosllamorfleufteJ0-PMIFTJ leuftejdetropmI
REK sesudnellaotsecruosllamorfenesoreK0-PMIREK enesorekdetropmI
AERREK snoissimeretfalaitnediserotenesoreKGPL secruosllamorfsagmuelortepdiuqiL
AECGPL GPL r .gntccasnoissimeretfarotceslaicremmocotAEIGPL .gntccasnoissimeretfarotceslairtsudniotGPL
0-PMIGPL GPLdetropmIAERGPL snoissimeretfalaitnediserotGPL
TGPL noitatropsnartotGPLXGPL selcihevleufibenilosag-GPLrofleuF
HTL taeherutarepmet-woL59M leuf59MHTM sesoprupllaroflonahteM
EHTM noitarenegyticirtceleotlonahteM0-PMIHTM lonahtemdetropmI
THTM noitatropsnartotlonahteMXHTM selcihevxelfenilosag-59MrofleuF
CSIMEN stcudorpmuelortepsuoenallecsiMAGN secruosllamorfsaglarutaN
AECAGN .simerof.gntccaretfa.ceslaicremmocotsagenilepiPCDLCAGN CDLhguorhtrotceslaicremmocotsagenilepiP s
AEEAGN .gntca.simeretfanoitarenegyticirtceleotsag.taNMTSNEAGN noitarenegyticirtcelemaets-nonotsagtaN
MTSEAGN rotcesyticirtceleotsagtaNAEIAGN .gtcasnoissimeretfarotceslairtsudniotsag.taN
N_AEIAGN .gtcasnoissimeonrotceslairtsudniotsag.taNZAEIAGN etagorrus-.gtcasnoissimeretfalairtsudniotAGNCDLIAGN sCDLhguorhtrotcesyrtsudniotsaglarutaN0-PMIAGN AGNdetropmI0-NIMAGN AGNdeniM
AERAGN snoissimeretfalaitnediserotAGNCDLRAGN CDLhguorhtlaitnediserotAGN
LGN secruosllamorfsdiuqiLsaGlarutaN0-PMILGN LGNdetropmI0-NIMLGN LGNdeniM
QPGN sagytilauqenilepiPLEUFCUN ygolonhcetleufraelcunymmuD
LIO secruosllamorflioedurCHHLIO ytivargyvaeh,ruflushgihlioedurcdetropmILHLIO ytivargwol,ruflushgih,lioedurcdetropmIVHLIO ytivarghgihyrev,ruflushgih,lioedurc.pmI
0-PMILIO lioedurcdetropmILLLIO ytivargwol,rufluswol,lioedurcdetropmI
Table 1 (concluded). Energy Carriers in the EPANMD.
metI noitpircseDHMLIO ytivargyvaeh,ruflusmuidem,lioedurcdetropmI
0-NIMLIO secruoscitsemodmorflioedurCTSDFP skcotsdeeflacimehcortepnobracordyH
0-PMITSDFP TSDFPdetropmICCR gnilooc,noitavresnoclaitnediseRHCR gnitaeh,noitavresnoclaitnediseR
0-RALOS secruosllaotygreneraloS0-NIW sesudnellaotdniW
a lonahtem=HTMb aihcalappA=.ppAc elcycdenibmocnoitacifisagdetargetni=CCGId utBM=utBmme nisaBreviRredwoP=BRPf ruflushgih=SHg ruflusfosedixo=xOSh negortinfosedixo=xONi srenrubxONwol=BNLj citylatacnonevitceles/noitcudercitylatacevitceles=RCNS/RCS
noitcuderk rufluswol=SLl ruflusmuidem=SMm gnitnuoccasnoissime=AEn ciatlovotohp=VPo saglarutan=GNp kcotsdeeflacimehclairtsudni=HCFIq lairtsudni=DNIr sagmuelortepdiuqil=GPLs retnecnoitubirtsidlacol=CDL
4.2.2 Resource TechnologiesResource technologies are given an up to 10 character namesuch that:
• The 1st three characters of the name should use thepre-defined prefixes ofC" MIN – domestic extraction of conventional re-
sources (e.g., coal mining, oil/gas wells)," IMP – imports of energy and materials," EXP – exports of energy and materials," RNW – renewable energy carriers with physical lim-
its (e.g., municipal solid waste, biomass), and" STK – stockpiling of energy and materials between
periods (e.g., nuclear fuel);• The next up to six (6) characters should specify the
name of the commodity produced and correspond tothe name of the energy carrier output by the resource;
• The final character should correspond to a price step.
Examples of Resource Technologies are in Table 2.
Table 2. Resource Technologies in the EPANMD -Examples.
continued
metI noitpircseD1SHBACNIM laoC C .ppA a 1ptS,ecafrus,ruflushgih,.tib,8SLBACNIM laoC C 8ptS,ecafrus,rufluswol,.mutib,.ppA5UMBACNIM laoC C 5ptS,dnrgrednu,ruflus.dem,.tib,.ppA
1UHBICNIM laoC C 1ptS,drgrednu,.lushgih,.tib,roiretnI

8
Table 2 (concluded). Resource Technologies in theEPANMD - Examples.
4.2.3 Process, Conversion, and Demand Technol-ogy NamesThe following naming conventions are defined to help fur-ther organize the RES and to allow the user to quicklydetermine the general function of a process from the tech-nology name:
• P (transformation) = Processes that transform an en-ergy or material through a physical, chemical or othertype operation,
• SC (collector) = Processes that collect energy carriersor materials from multiple sources to provide a singlesupply to downstream technologies. Such processesare called “dummy” processes, and their main pur-pose is to change the names of like commodities.Therefore, they usually have no associated price ortechnical implications,
• SE (emission accounting) = Processes that are used tocharacterize the emissions from a particular energycarrier stream,
• E (electricity and coupled production) = Conversionplants that produce electricity, and possibly heat, and
• H (heat production) = Conversion plants that produceonly heat.
The naming convention for process, conversion, and de-mand technologies is summarized in Table 3.
metI noitpircseD1AGNNIM 1petS-saglarutanyrdcitsemoD2AGNNIM 2petS-saglarutanyrdcitsemoD3AGNNIM 3petS-saglarutanyrdcitsemoD
1LIONIM 1petS-84rewoL-lioedurccitsemoD2LIONIM 2petS-84rewoL-lioedurccitsemoD3LIONIM 3petS-84rewoL-lioedurccitsemoD
1EKOCPMI EKOCTROPMI1HHSDPMI lioleufruflushgihdetropmI C 1petS3LHSDPMI lioleufrufluswoldetropmI C 3petS1LLSDPMI leseidrufluswoldetropmI C 1petS3ULSDPMI leseidrufluswol-artludetropmI C 3petS
1CLEPMI 1YTICIRTCELETROPMI2LSGPMI enilosaglanoitnevnocdna.mroferdetropmI C 2petS1REKPMI .dorpdeniferrehtodnaenesorekdetropmI C 1petS1AGNPMI 1petS-saglarutandetropmI
2HHLIOPMI liodetropmI C ytivargyvaeh,ruflushgih C 2petS3HHLIOPMI liodetropmI C ytivargyvaeh,ruflushgih C 3petS3LHLIOPMI liodetropmI C ytivargwol,ruflushgih C 3petS1VHLIOPMI liodetropmI C varghgihyrev,ruflushgih C 1petS1TSDFPPMI skcotsdeefmuelortepdetropmI C 1petS
1CHOIBWNR SPORCYGRENESUOECABREHADWOIBWNR 1EVRUCYLPPUSSSAMOIB59OEAFDWOIBWNR 6EVRUCYLPPUSSSAMOIB59OEAMHTOEGWNR secruoserelbawenerlamrehtoeG
ORDYHWNR secruoserelbawenerordyHRALOSWNR secruoserelbawenerRALOS
NIWWNR secruoserelbawenerDNIWa aihcalappA=.ppA
Table 3. Example Naming Convention for Process, Conversion, and Demand Technologies.
seigolonhceTsrotceSretcarahCrofsrotangiseD
1 ts retcarahC 2 dn 4ot ht
sretcarahC 2txeN SSSSS sretcarahC4 2tsaL SSSSS sretcarahC4
ssecorPseigolonhceT
noitamrofsnarT tahtsessecorprofProygrenemrofsnart
lairetam
retcarahc3tupnirofeman
reirracygrene
tuptuorofnoitaiverbbaretcarahc3ro2ssecorptxenroreirracygrene
egatnivretcarahc2niraeyehtotsdnopserroc
siygolonhcetehthcihwrof00,.g.e(elbaliavatsrif
)0002noitcelloC petsylppusrehtorofS
sessecorprotcellocrofC reirracygrenetupnirofemanretcarahc3 rotpircsedretcarahc3ro2
epytygrenetuptuoehtrofsnoissimEgnitnuoccA
petsylppusrehtorofSsessecorp
noissimerofEgnitnuocca
reirracygrenerofemanretcarahc3 rotpircsedretcarahc3ro2ygrenetuptuoehtrof
rotces/esunoisrevnoC
seigolonhceTstnalprewopcirtcelerofE
dna)PHCgnidulcni(
stnalpgnitaehtcirtsidrofH)tuptuocirtceleon(
retcarahc3ot1nekatrotangisedyramirpehtmorf
reirracygreneeman
rotpircsednesohc-resuretcarahc4ot1noitacifisaGdetargetnIrofCGI,.g.e(
rofBFA,stnalprewopelcycdenibmoC)stnalprewopdeBdezidiulFcirehpsomtA
roehtredrootdesurotangisedretcarahc2
esutahtseigolonhcetnoisrevnocfotsilytidommocralucitrapeht
egatnivretcarahc2raeyehtotgnidnopserrocsiygolonhcetehthcihwnirof00,.g.e(elbaliavatsrif
).cte,5002rof50,0002
dnameDseigolonhceT
T,R,I,C1ehT( ts 3ehtforetcarahc
ehtrofrotangisedretcarahc)rotcesdnamedLAKRAM
-busretcarahc1rotpircsedrotces
ecaps,.g.e(ro;C,gnilooc,gnitaehretaw
)W
ehtrofrotpircsedretcarahc3ro2ygolonhcetdnamed
roehtredrootdesurotangisedretcarahc2ecivrestahtseigolonhcetdnamedfotsil
dnamedralucitrapeht
egatnivretcarahc2raeyehtotgnidnopserrocsiygolonhcetehthcihwni
rof00(elbaliavatsrif).cte,5002rof50,0002

9
4.2.4 Emission NamesThe names for emission commodities in a MARKAL modelgenerally consist of one to three characters describing theemissions type, with additional characters added for sectoralbreakdowns, as listed in Table 4.
4.2.5 User-Defined ConstraintsUser-defined constraints are usually introduced to reflectconsiderations beyond the scope of the model and to avoidabrupt, unrealistic changes over time. Such constraints maybe defined to control the investment, capacity or operationof a set of processes in absolute (noted A_*) terms (e.g.,capacity of all nuclear plants) or as a share (noted S_*) ofa larger set (e.g., percent of total electricity that must comefrom renewable sources). Table 5 describes the namingconvention typically used in the EPANMD for user de-fined constraints.
5. System-Wide VariablesAs previously stated, system-wide parameters are assump-tions that apply to the entire model.
Table 4. Emissions Commodities in the EPANMD.
metI noitpircseDNOBRAC snoissimenobracediw-metsyS
SER_C seigolonhceTecruoseR:snoissimenobraCCOC rotceSlaicremmoC:snoissimenobraCEOC rotceScirtcelE:snoissimenobraCOOC rehtO:snoissimenobraCROC rotceSlaitnediseR:snoissimenobraCTOC rotceSnoitatropsnarT:snoissimenobraC
N4HCDNI snoissimeenahtemlairtsudnIN2OCDNI snoissime2OClairtsudnINO2NDNI snoissimeO2NlairtsudnI
EON rotceScirtcelE:snoissimexONION rotceSlairtsudnI:snoissimexONRON rotceSlaitnediseR:snoissimexONTON rotceSnoitatropsnarT:snoissimexON
RUFLUS snoissimeruflusediw-metsySEOS rotceScirtcelE:snoissimerufluSIOS rotceSlairtsudnI:snoissimerufluSROS rotceSlaitnediseR:snoissimerufluSTOS rotceSnoitatropsnarT:snoissimerufluS01P snoissime01MPediw-metsySCOV snoissimeCOVediw-metsyS
Table 5. Naming Convention for User-Defined Constraints.
5.1 System-Wide Variable Data SourcesData were taken from the 1997 DOE MARKAL database.
5.2 System-Wide ParametersDISCOUNT: Specifies the long-term annual discount ratefor the economy as a whole. For the EPANMD the dis-count rate is 5%.
QHR(Z)(Y): Specifies the fraction of the year by season(Z) and time-of-day (Y) that best describes the electricalload through the typical year.
Table 6. QHR(Z)(Y) Values in the EPANMD.
denifeD-resUtniartsnoC
srotceSretcarahCrofsrotangiseD1 ts 2dna dn
retcarahC 3 dr 5ot ht sretcarahC 6 ht 8otpu ht sretcarahC sretcarahC2tsaL
etulosbA
erahS
_A
_S
rotpircsedretcarahc3ot1ygreneehtotgnidnopserroc
dnamedehtro,devlovnireirrac)s(rotces-bus
ehtrofrotpircsedretcarahc5ot2ygolonhcet/ytidommocrotniartsnoc
devlovni
otgnidnopserrocegatnivretcarahc2sitniartsnocehthcihwniraeyehtrof00,.g.e()elbacilppafi(deilppa
).cte,5002rof50,0002
6. Energy CarriersAs previously stated, energy carriers provide the intercon-nections between the various technologies in a MARKALmodel by flowing out of one or more technologies and intoothers. For a complete list of energy carriers in theEPANMD, see Table 1.
6.1 Energy Carrier Data SourcesData were taken from the 1997 DOE MARKAL database.
6.2 Energy Carrier ParametersTE(ENT): Specifies the average transmission and distri-bution efficiency of each energy carrier in each specifiedperiod. With the exception of electricity, the transmissionefficiencies of all energy carriers in the model is 100%.Due to losses during transmission, the transmission effi-ciency of electricity in the model is 93.5%.
6.2.1 Electricity Only ParametersThere are a series of parameters that apply only to electric-ity, covering the cost of distribution and transmission of
metI noitpircseD eulaVDI yaddetaidemretnI 52.0NI thginetaidemretnI 52.0DS yadremmuS 521.0
`NS thginremmuS 521.0DW yadretniW 521.0NW thginretniW 521.0

10
electricity as well as the base load and reserve capacity.The parameters and their values in the EPANMD are listedin Table 7.
Table 7. Electricity Specific Energy Carrier ParametersValues in the EPANMD.
metI eulaVVNITSID)E( WGrepnoillim694$
MOTSID)E( JPrep637.0$QEFCL)E( 521.3
EVRESER)E( 2.0VNINART)E( WGrepnoillim57.822$MONART)E( JPrepnoillim1.0$DAOL)E(SAB 59.0
(E)DISTINV: Specifies the investment cost for the distri-bution systems constructed for all electricity conversiontechnologies, including labor costs, material costs, andequipment costs. It is measured as the average annual in-vestment cost per unit of additional conversion capacity.
(E)DISTOM: Specifies the distribution system operatingand maintenance costs for all electricity conversion tech-nologies. It is measured as the average annual O&M costper unit of conversion production.
(E)LCFEQ: Specifies the fossil fuel equivalent of any im-ported or exported electricity and is measured from theconversion efficiency of a standard fossil fueled powerplant.
(E)RESERVE: Specifies the Reserve Capacity Fraction,which is equal to the reserve capacity (the amount by whichthe installed electricity generation capacity exceeds theaverage load of the season and time-of-day division of peakdemand) divided by the capacity required to meet the av-erage load of the season/time-of-day of peak load.
(E)TRANINV: Specifies the investment cost for the trans-mission systems for centralized electricity conversion tech-nologies, including labor costs, material costs, and equip-ment costs. It is measured as the average annual invest-ment cost per unit of additional conversion capacity.
(E)TRANOM: Specifies the transmission system operat-ing and maintenance costs for centralized electricity con-version technologies. It is measured as the average annualO&M cost per unit of conversion production.
BAS(E)LOAD: Specifies the baseload capacity of the elec-tricity generation system as a fraction of the total nightproduction of electricity.
6.2.2 Low-Temperature Heat Only ParametersThere are a series of parameters that cover the cost of dis-tribution and the distribution efficiency that apply only tothe low-temperature heat produced by electricity co-gen-eration technologies. The parameters and their values inthe EPANMD are listed in Table 8.
Table 8. Low-Temperature Heat Specific Energy CarrierParameters Values in the EPANMD.
metI eulaVEVRESERH 5.0
VNINARTD WGrepnoillim57.822$MONARTD JPrepnoillim637.0$
)Z(EDHD snosaesehtfohcaerof%29
HRESERVE: Specifies the reserve capacity fraction,which is equal to the reserve capacity (the amount by whichthe installed low-temperature heat production capacity ex-ceeds the average load of the season and time-of-day divi-sion of peak demand) divided by the capacity required tomeet the average load of the season/time-of-day of peakload.
DTRANINV: Specifies the investment cost for the trans-mission systems for centralized low-temperature heat con-version technologies, including labor costs, material costs,and equipment costs. It is measured as the average annualinvestment cost per unit of additional conversion capacity.
DTRANOM: Specifies the transmission system operat-ing and maintenance costs for centralized low-temperatureheat conversion technologies. It is measured as the aver-age annual O&M cost per unit of conversion production.
DHDE(Z): Specifies the distribution efficiency for low-temperature heat in each season: intermediate, summer, andwinter.
7. Resource SupplyThere are six major energy resource categories representedin the model: Crude Oil, Imported Refined Products, Natu-ral Gas, Coal, Nuclear Power, and Renewables. MARKALcharacterizes the resource supplies for each of these usinga series of stepped supply curves.
7.1 Parameters DefinitionsBOUND(BD)Or: Specifies the maximum additional an-nual production or availability of a resource at each stepcost and is expressed in units of the energy carrier.
COST: Specifies the cost at which each step’s quantity isavailable to the model.

11
CUM: Specifies a limit on the total availability of a re-source from its source to the energy system over the entiremodel time horizon.
START: Specifies the first time period of availability.
7.2 Crude OilBoth imported and domestic crude oil are represented inthe model. For imported oil, there are five crude grades,each of which have three steps characterized in each modelyear by a cost and the amount that is available to the modelat that cost. The domestic oil is characterized by two do-mestic oil supply curves: one for the lower 48 states andone for Alaska. Again, each have three steps characterizedin each model year by a cost and the additional amountthat is available to the model at that cost. All oil feeds di-rectly into the three refineries characterized in MARKAL.A detailed description of refineries is given in Section 8.2.
7.2.1 Crude Oil Data SourcesOriginal data for imported crude oil was taken from theAEO2002 Reference Supply Curves for Imported CrudeOil provided by Han-Lin Lee of EIA. These curves supplydata for MARKAL years 1995 through 2020. For the yearsafter 2020, the values were linearly extrapolated.
Original data for domestic oil were obtained from the 1996,1999, and 2002 Annual Energy Outlooks. The specificAEO tables from which the data was gathered is outlinedin Table 9.
Table 9. Data Sources for Domestic Oil in the EPANMD.
5991 5002,0002 ,5102,01020202
,0302,52025302
dna6991OEA-feR9991OEA
esaCecnereelbaTtsaceroFmuelorteP:11A
dnaylppuSnoitisopsiD
ecnalaB
-feR2002OEAesaCecnere
elbaTtsaceroFmuelorteP:11A
dnaylppuSnoitisopsiD
ecnalaB
liO2002OEA-rapmoCecirP
sesaCnosi-teP:11CelbaT
ylppuSmuelornoitisopsiDdna
ecnalaB
-ercnieasercnI-repybyllatnem
desabegatnechtworgehtno
morfegnahc.0202ot5102
7.2.2 Crude Oil RESThe naming conventions used for crude oil are describedin Tables 10 – 13. The RES diagram is shown in Figure 2.It starts with imported and domestic oil resource technolo-gies, which output oil energy carriers into collectors, whichthen deliver oil to the refineries. (For a specific descriptionof the refinery types, see Section 8.2.)
7.2.3 Crude Oil ParametersAll costs are expressed in millions of 1995 dollars (95m$).All energy quantities are expressed in petajoules (PJ).
Table 10. Naming Convention for Crude Oil ResourceTechnologies.
rebmunretcarahC
noitpircseD
1 2 3 4 5 6 7epytygolonhceT epytecruoseR pets
I M P O I L 1 )1S(1pets,detropmI
2 )2S(2pets,detropmI
3 )3S(3pets,detropmI
M I N 1 1S,84rewol,denim
2 2S,84rewol,denim
3 3S,84rewol,denim
A 1S,aksalA,denim
B 2S,aksalA,denim
C 3S,aksalA,denim
Table 11. Naming Convention for Crude Oil EnergyCarriers.
rebmunretcarahC
noitpircseD1 2 3 4 5 6
epytecruoseR edargedurCO I L H H SH a ytivargyvaeh,
H L ytivargwol,SHL L SL b ytivargwol,M H SM c ytivargyvaeh,H V ytivargyvaehyrev,SH
epytygolonhceTM I N yllacitsemoddenimI M P detropmi
a ruflushgih=SHb rufluswol=SLc ruflusmuidem=SM
ehtfodneehtta'0-‘aevahsreirracygreneecruoseremoS:etoN.ledomehtnisesoprupgnitnuoccaleufrofenodsisihT.eman
Table 12. Naming Convention for Crude Oil “Dummy”Collector Process Technologies.
rebmunretcarahC
noitpircseD1 2 3 4 5 6 7 8
rotcelloC epytecruoseR edargedurCS C O I L H H SH a ytivargyvaeh,
H L ytivargwol,SHL L SL b ytivargwol,M H SM c ytivargyvaeh,H V ytivargyvaehyrev,SH
ygolonhceTM I N yllacitsemoddenimI M P detropmi
a ruflushgih=SHb rufluswol=SLc ruflusmuidem=SM
BOUND(BD)Or:For Imported crude oil - The upper bound on availableimported crude oil has been calculated from the AEO 2002Supply Curves for Imported Crude Oil by summing thequantities by step in each of five regions: East Coast, Mid-

12
IMPOILHH1
IMPOILHH2 SCOILHH
IMPOILHH3
IMPOILHL1
IMPOILHL2 SCOILHL
IMPOILHL3
IMPOILLL1OILIMP-0
IMPOILLL2 SCOILLL SCOILIMP
IMPOILLL3
IMPOILMH1
IMPOILMH2 SCOILMHDLG
IMPOILMH3 S27: HIGH CONVERSION REFINERY S29: HIGH LIMIT REFINERYOIL
IMPOILHV1S28: EXISTING CONVERSION REFINERY
IMPOILHV2 SCOILHV
IMPOILHV3
MINOIL1
MINOIL2
MINOIL3 OILMIN-0SCOILMIN
MINOILA
MINOILB
MINOILC
OILHH
OILHL
OILLL
OILMH
OILHV
Figure 2. Crude Oil RES in the EPANMD.
west, Gulf Coast, Rocky Mountains, and West Coast; tak-ing a 5-year average centered on the MARKAL model yearand converting to petajoules. BOUND(BD)Or for 2020 usesthe 2020 source data only and is not a five-year average.For the years after 2020, it has been extrapolated using thepercentage change from 2015 to 2020.
For domestic crude oil - The year 1995 was calculated byaveraging the quantities for the years 1993 through 1997.The values for 1993, 1994, and 1995 came from the 1996AEO Reference Case Forecast Table A11: Petroleum Sup-ply and Disposition Balance. The values for 1996 and 1997came from the 1999 AEO version of the same table. Forthe years 2000 through 2020 the quantity came directlyfrom the 2002 AEO, Tables A11 and C11 (see table 9). Forthe years 2025 through 2035 the quantity and price wereobtained by using the percent change from 2015 through2020 on the 2002 AEO.
COST:For imported crude oil - Calculated by taking a quantity-weighted average of AEO step prices across the five AEO
regions, then taking a quantity weighted five-year averagecentered on the MARKAL model year, and converting tomillions of 1995 dollars per petajoule. (COST for 2020uses the 2020 source data only and is not a five-year aver-age.) For the years after 2020, it was extrapolated usingthe percentage change from 2015 to 2020.
For domestic crude oil - The year 1995 was calculated byaveraging the costs for the years 1993 through 1997. Thevalues for 1993, 1994, and 1995 came from the 1996 AEOReference Case Forecast Table A11: Petroleum Supply andDisposition Balance. The values for 1996 and 1997 camefrom the 1999 AEO version of the same table. For the years2000 through 2020 the costs came directly from the 2002AEO, tables A11 and C11 (see Table 9). For the years 2025through 2035 the costs were obtained by applying the per-cent change from 2015 through 2020 to each subsequenttime period.
START:The start year specifies the first time period of availability.All crude oil grades, both imported and domestic, are as-

13
sumed to be available at the beginning of the model timehorizon, 1995.
7.3 Imported Refined ProductsThere are 10 imported refined products represented in theEPANMD. These are imports of the same products pro-duced by the oil refineries. For each product, three stepsare characterized in each model year by a cost and the ad-ditional amount that is available to the model at that cost.Table 13 lists the sub-categories of petroleum and how theyare represented in the model.
Table 13. Petroleum Products in the EPANMD.
7.3.1 Imported Refined Products Data SourcesOriginal data for imported refined products were taken fromthe AEO2002 Supply Curves for Imported Refined Prod-ucts provided by Han-Lin Lee of EIA.
7.3.2 Imported Refined Products RESThe naming conventions used for imported refined prod-ucts are described in Tables 14 – 16. The RES diagramsare shown in Figures 3 – 9.
tcudorP noitidnoCleseiD deniferdnadetropmIlioleuF deniferdnadetropmIenilosaG deniferdnadetropmI
)LGN(sdiuqilsaglarutaN deniferdnadetropmIleufteJ deniferdnadetropmI
enesoreK deniferdnadetropmIsagmuelortepdiuqiL deniferdnadetropmIskcotsdeefmuelorteP detropmI
lonahteM deniferdnadetropmImuelortepsuoenallecsiM denifeR
Table 14. Naming Convention for Imported RefinedProducts Resource Technologies.
rebmunretcarahC
noitpircseD
1 2 3 4 5 6 7 8 laniFepytygolonhceT epytliO petS
I M P D S H H lioleufruflushgih 1
D S H L lioleufrufluswol 2
D S L L leseidrufluswol 3
D S L U leseidrufluswolartlu
D H O liognitaehleseid
G S L enilosag
N G L sdiuqilsaglarutan
L P G sagmuelortepdiuqil
J T F leuftej
K E R enesorek
P F D S T skcotsdeefmuelortep
M E T H lonahtem
Table 15. Naming Convention for Imported RefinedProducts Energy Carriers.
rebmunretcarahC
noitpircseD
1 2 3 4 5 6/5/4 7/6/5 8/7/6epytliO epytygolonhceT
)41elbaTees( I M P detropmiehtfodneehtta'0-‘aevahsreirracygreneecruoseremoS:etoN
.ledomehtnisesoprupgnitnuoccaleufrofenodsisihT.eman
Table 16. Naming Convention for Imported RefinedProducts “Dummy” Collector Process Technologies.
rebmunretcarahC1 2 3 4 5 6 7 8 3laniF
rotcelloC epytliO epytygolonhceTS C )41elbaTees( PMI
Figure 3. Imported GSL, NGL, and LPG RES in theEPANMD.
REFINERIES
IMPGSL1
IMPGSL2 SCGSLIMP GSL
IMPGSL3
IMPNGLZ SCNGLIMPNGL
SCNGLMINNGL1
MINNGL2 SCNGLMIN
MINNGL3 LPG
IMPLGP1
IMPLPG2 SCLPGIMP
IMPLPG3 REFINERIES
GSLIMP-0
NGLMIN-0
LPGIMP-0
NGLIMP-0
Figure 4. Imported Fuel Oil (DSH) RES in the EPANMD.
IMPDSHH1
IMPDSHH2 SCDSHH
IMPDSHH3
DSHIMPDSHL1
IMPDSHL2 SCDSHL
IMPDSHL3
REFINERIES
DSHH-0
DSHL-0

14
Figure 5. Imported Jet Fuel RES in the EPANMD.
IMPJTF1
IMPJTF2 SCJTFIMP JTF
IMPJTF3 REFINERIES
JTFIMP-0
Figure 9. Imported Diesel RES in the EPANMD.
IMPDSLL1
IMPDSLL2 SCDSLL
IMPDSLL3
IMPDSLU1
IMPDSLU2 SCDSLU DSL
IMPDSLU3
IMPDHO1
IMPDHO2 SCDHO
IMPDHO3
REFINERIES
DSLL-0
DSLU-0
DHO-0
Figure 8. Imported Methanol RES in the EPANMD.
IMPMETH1
IMPMETH2 SCMETH MTH
IMPMETH3 PNGAMTH
MTHIMP-0
Figure 7. Imported Petroleum Feedstocks RES in theEPANMD.
IMPPFDST1
IMPPFDST2 SCPFDSTIMP PFDST
IMPPFDST3 REFINERIES
PFDSTIMP-0
Figure 6. Imported Kerosene RES in the EPANMD.
IMPKER1
IMPKER2 SCKERIMP KER
IMPKER3 REFINERIES
KERIMP-0
7.3.3 Imported Refined Products Parameters.All costs are expressed in millions of 1995 dollars. All en-ergy quantities are expressed in petajoules.
BOUND(BD)Or: For all imported refined products, theupper quantity bound has been calculated from theAEO2002 Supply Curves for Imported Refined Productsby summing the imported quantities by step across the fiveAEO regions: East Coast, Midwest, Gulf Coast, RockyMountains, and West Coast; taking a five-year averagecentered on the MARKAL model year, and converting topetajoules. For the years 2021–2035, yearly bounds weregenerated by extrapolation using the average percentagechange from 2016–2020, and then five-year averages werecalculated.
COST: For all imported refined products, the cost has beencalculated from the AEO2002 Supply Curves for ImportedRefined Products by taking a quantity-weighted averageof AEO step prices across the five AEO regions, taking aquantity weighted five-year average centered on theMARKAL model year, and converting to millions of 1995dollars per petajoule. For years 2021–2035, yearly COSTswere generated by extrapolation using the average percent-age change from 2016–2020, and then five-year averageswere calculated.
START: For imported refined products and natural gas,all resources are assumed to be available at the beginningof the model time horizon, 1995.
7.4 Natural GasThe natural gas supply curves were developed to estimatethe future prices of natural gas corresponding to the pro-jected future supply and demand levels. The natural gasresource supplies are characterized using a series of fivestepped curves representing the incremental cost increasesassociated with increased demands in different time peri-ods.
7.4.1 Natural Gas Data SourcesData for the natural gas price/supply curves primarily comesfrom the North American Natural Gas Analysis System(NANGAS) Model used by the EPA’s Integrated PlanningModel (IPM). The resources in NANGAS model includeover 20,000 individual reservoirs and undiscovered accu-mulations, frontier resources (which include Alaska NorthSlope, Mackenzie Delta, Sable Island, and LNG), and oilsands recovery in Western Canada. The resulting price/sup-ply curves from the NANGAS model are plotted in Figure10.

15
2.5
3.5
4.5
5.5
3.0
4.0
5.0
6.0
22,000 24,000 26,000 28,000 30,000 32,000 34,000
2007 2010 20152020 2026
Total Natural Gas Supply (TBtu)
Nat
ural
Gas
Pric
e (1
999
$/M
MB
tu)
Figure 10. Price/Supply Curves for Years 2007, 2010, 2015, 2020, and 2026 from the NANGAS Model.
Note that the supply curves in NANGAS for the early yearsare steeper compared to later year supply curves. This isdue to the fact that a substantial increase in gas demandand gas price for early modeling years will not easily re-sult in any substantial increase in production and imports,etc, as substantial supply increases need lead times (U.S.EPA 2005). For example, according to EPA (2005), a newLNG terminal takes over 4 years to get certificated andbuilt.
The price/supply curves from the NANGAS model aretranslated to a series of time dependent five step cost/sup-ply curves and extrapolated to 2035. This cost/supply curveis different from the price/supply curve in that other fac-tors, such as transportation, distribution, and sector-spe-cific mark-ups will be added later to the system on top ofthe cost/supply curves. The final “price” will be the totalcost that consumers paid at the system equilibrium.
The cost/supply curves for 2030 and 2035 are extrapolatedbased on the 2025 curve, assuming the same cost/supplycurve will be applied for 2025, 2030, and 2035 except thecurves for 2030 and 2035 reach much farther out to havemore resources available at higher prices. The 2000 and2005 points were based on the reported natural gas totalconsumption and well-head price from the Annual EnergyOutlook 2006 (Energy Information Administration 2006).
The same cost/supply curves are applied for both domes-tic natural gas production and imports based on the ratio-nale that, at market equilibrium, natural gas should have
the same unit price regardless of its origin. Therefore, anADRATIO is added to the database to constrain the ratioof domestic production and imports of natural gas basedon EIA’s AEO projections. The ratios used are listed inTable 17.
ecruoSsaG%niOITARDA
5002 0102 5102 0202 5202 0302 5302.dorpcitsemoD 1.18 3.97 3.87 1.97 4.77 1.67 1.67
stropmI 9.81 7.02 7.12 9.02 6.22 9.32 9.32
7.4.2 Natural Gas RESThe naming conventions used for natural gas are describedin Tables 18 – 20. The RES diagram is shown in Figure 12.
Table 17. Natural Gas Supply Domestic Production/ImportsRatios Used in the EPANMD.
Table 18. Naming Convention for Natural Gas ResourceTechnologies.
rebmunretcarahC
noitpircseD
1 2 3 4 5 6 7epytygolonhceT epytecruoseR pets
I M P N G A 1 1pets,detropmI
2 2pets,detropmI
3 3pets,detropmI
4 4pets,detropmI
5 5pets,detropmI
M I N 1 1pets,denim
2 2pets,denim
3 3pets,denim
4 4pets,denim
5 5pets,denim

16
4
5
6
7
8
9
10
11
12
22,000 26,000 30,000 34,000 38,000 42,000 46,000
20052010 2015
2020
2025
2030
2035
Total Natural Gas Supply (PJ)
Nat
ural
Gas
Cos
t (19
95 m
illio
n $/
PJ)
Figure 11. Cost/Supply Curves Used in the EPANMD.
7.4.3 Natural Gas ParametersAll costs are expressed in millions of 1995 dollars. All en-ergy quantities are expressed in petajoules.
BOUND(BD)Or: The bounds for natural gas supply arederived from the five step cost/supply curves illustratedabove. The 2000 and 2005 data are one-step upper boundsbased on the reported natural gas supply from the AEO2003 and 2006 (EIA 2003, EIA 2006). The cost/supplycurves are further broken down to domestic production/
Table 19. Naming Convention for Natural Gas EnergyCarriers.
rebmunretcarahC
noitpircseD
1 2 3 4 5 6epytecruoseR epytygolonhceT
O I L M I N AGNdenim
I M P AGNdetropmiehtfodneehtta'0-‘aevahsreirracygreneecruoseremoS:etoN
.ledomehtnisesoprupgnitnuoccaleufrofenodsisihT.eman
Table 20. Naming Convention for Natural Gas “Dummy”Collector Process Technologies.
rebmunretcarahC
noitpircseD1 2 3 4 5 6 7 8
rotcelloC epytecruoseR ygolonhceTS C N G A M I N AGNdenim
I M P AGNdetreopmi
NGA
IMPNGA1
IMPNGA2
IMPNGA3 SCNGAIMP
IMPNGA4
IMPNGA5NGA
MINNGA1
MINNGA2
MINNGA3SCNGAMIN
MINNGA4
MINNGA5
NGAIMP-0
NGAMIN-0
Figure 12. Natural Gas RES in the EPANMD.
imports based on the domestic production/import ratio pro-jected by the AEO 2006. The resulting bounds for the do-mestic and import supply curves are listed in Table 21.
COST: Similar to BOUND(BD)Or, the costs for naturalgas supply are derived from the five step cost/supply curves.The 2000 and 2005 data are based on the reported naturalgas well-head price from the reference case Table 1 (TotalEnergy Supply and Disposition Summary) of AEO 2003and 2006. The resulting costs for the domestic and importsupply curves are listed in Table 22.

17
START: For natural gas, all resources are assumed to beavailable at the beginning of the model time horizon, 1995.
ADRATIO: As shown in Table 16, constraints are addedto constrain the ratio of domestic production and importsof natural gas. The constraint values listed in Table 23 arein line with EIA’s AEO projections.
7.5 CoalThere are 25 coal types represented in the EPANMD. Foreach of the 25 types, eight steps are characterized in eachmodel year by a cost and the amount that can be producedat that cost. A cumulative amount that can be extractedfrom each type over the entire model horizon has also beenassigned.
Table 21. BOUND(BD)Or for Domestic and Import NGA Supply Curves.
ygolonhceT dnuoBsraeYrofretemaraPrO)DB(DNUOBfoeulaV
0002 5002 0102 5102 0202 5202 0302 53021AGNNIM PU 724,02 865,91 091,02 321,22 392,32 989,22 726,22 114,22
2AGNNIM PU 0 0 889 073,1 764,1 215,1 995,2 877,3
3AGNNIM PU 0 0 889 073,1 764,1 215,1 995,2 877,3
4AGNNIM PU 0 0 889 073,1 764,1 215,1 995,2 877,3
5AGNNIM PU 0 0 889 073,1 764,1 215,1 995,2 877,3
1AGNPMI PU 340,4 645,4 507,4 325,5 534,5 018,5 530,6 123,6
2AGNPMI PU 0 0 032 243 243 283 396 660,1
3AGNPMI PU 0 0 032 243 243 283 396 660,1
4AGNPMI PU 0 0 032 243 243 283 396 660,1
5AGNPMI PU 0 0 032 243 243 283 396 660,1
Table 22. Domestic and Import NGA Supply Costs.
ygolonhceTsraeYrofretemaraPTSOCfoeulaV
0002 5002 0102 5102 0202 5202 0302 53021AGNNIM 91.3 50.6 53.4 57.4 43.4 03.4 62.4 82.4
2AGNNIM 0 0 95.4 79.4 95.4 45.4 07.4 49.4
3AGNNIM 0 0 31.5 44.5 31.5 90.5 37.5 36.6
4AGNNIM 0 0 57.5 59.5 47.5 17.5 00.7 78.8
5AGNNIM 0 0 54.6 15.6 34.6 04.6 35.8 77.11
1AGNPMI 91.3 50.6 53.4 57.4 43.4 03.4 62.4 82.4
2AGNPMI 0 0 95.4 79.4 95.4 45.4 07.4 49.4
3AGNPMI 0 0 31.5 44.5 31.5 90.5 37.5 36.6
4AGNPMI 0 0 57.5 59.5 47.5 17.5 00.7 78.8
5AGNPMI 0 0 54.6 15.6 34.6 04.6 35.8 77.11
Table 23. Domestic and Import NGA Supply Constraints.
retemaraP ygolonhceT tniartsnoC dnuoBsraeYrofretemaraPrO)DB(DNUOBfoeulaV
0002 5002 0102 5102 0202 5202 0302 5302SHR__TAR --- PMIAGN_A XF 0 0 0 0 0 0
TCA_TAR PMIAGNCS PMIAGN_A --- 118.0- 2008.0- 8018.0- 3897.0- 4987.0- 87.0-
TCA_TAR NIMAGNCS PMIAGN_A --- 981.0 8991.0 2981.0 7102.0 6012.0 22.0
7.5.1 Coal Data SourcesData for supply curves was taken from the coal supplycurves underlying the AEO 2002 reference case, suppliedby Mike Mellish of EIA. The reserves data were taken fromEIA, 1999.
7.5.2 Coal AssumptionsSome AEO regions have been added together to produceMARKAL regions as illustrated in Table 24.
7.5.3 Coal RESThere are 25 supply curves for coal and, therefore, 25 en-ergy carriers that the supply curve steps feed into. Thereare 10 coal collector process technologies and, therefore,10 energy carriers that come from them. The naming con-

18
ventions used for coal are described in Tables 25–29. Fig-ure 13 shows an example RES flow chart for one of thecoal resources: high sulfur surface bituminous coal fromthe Appalachian region.
7.5.4 Coal ParametersAll costs are expressed in millions of 1995 dollars. All en-ergy quantities are expressed in petajoules.
BOUND(BD)Or: Bounds are calculated by multiplyingthe period averaged quantity by step from the AEO 2002Coal Supply Curves by the average BTU content and con-verting to petajoules. This procedure produces the boundsfor the years covered by the AEO source data, 2000–2020.The value for 1995 has been set equal to that for 2000, andthe values for 2025–2035 have been set equal to that for2020.
COST: Costs are calculated by dividing the period aver-aged AEO Step Price by the average BTU content. Thisprocedure produces the costs for the years covered by the
Table 26. Naming Convention for Coal Resource Technologies.
Table 24. MARKAL Coal Regions.noigeRLAKRAM noigeROEA
aihcalappA aihcalappAnrehtroN
aihcalappAlartneC
aihcalappAnrehtuoS
roiretnI roiretnInretsaE
roiretnInretseW
Table 25. Examples of Coal Resource Technologies.
emaN noitpircseD1SHBACNIM 1pets,ecafrus,ruflushgih,.tib,aihcalappA-laoc3SMLACNIM 3pets,ecafrus,ruflus.dem,etingil,aihcalappA-laoc
5SHBICNIM 5pets,ecafrus,ruflushgih,.tib,roiretni-laoc8SMSPCNIM 8pets,ecafrus,ruflus.dem,.tibbus,.RredwoP-laoc5SMSSCNIM 5pets,ecafrus,ruflus.dem,tibbus,tsewhtuoS-laoc6SMSSCNIM 6pets,ecafrus,ruflus.dem,.tibbus,tsewhtuoS-laoc7SMSSCNIM 7pets,ecafrus,ruflus.dem,.tibbus,tsewhtuoS-laoc8SMSSCNIM 8pets,ecafrus,ruflus.dem,.tibbus,tsewhtuoS-laoc
Table 28. Examples of Coal Energy Carriers.
rebmuNretcarahC1 2 3 4 5 6 7 8
epyTygolonhceT laoC noigeR noitpircseD epyTlaoC noitpircseD tnetnoCS noitpircseD epyTeniM noitpircseDM I N C A aihcalappA B suonimutib H hgih S ecafrus
D atokaD G BOG M muidem U dnuorgrednuG fluG L etingil L wolI roiretni M lacigrullatemN tsewhtroN S suonimutibbusP reviRredwoPR niatnuoMykcoRS tsewhtuoS
emaN noitpircseDUMBAC laocdnuorgrednuruflusmuidemsuonimutibnaihcalappASMLGC laocecafrusruflusmuidemetingilfluG
SHBIC laocecafrusruflushgihsuonimutibroiretniSMSNC laocecafrusrufrusmuidemsuonimutibbustsewhtroN
SLSPC laocecafrusrufluswolsuonimutibbusreviRredwoP
Table 29. Naming Convention for Coal “Dummy” CollectorProcess Technologies.
rebmuNretcarahC1 2 3 4 5 6 7S C C noiger epytlaoc tnetnocS epytenim
Figure 13. High Sulfur Bituminous Coal RES in theEPANMD.
COAL
MINCABHS1
MINCABHS2
MINCABHS3
MINCABHS4 COALBH-0SCCABHS
MINCABHS5
MINCABHS6
MINCABHS7
MINCABHS8
CABHS
Table 27. Naming Convention for Coal Energy Carriers.
seigolonhceTrotcelloCerofebsreirraCygrenErebmuNretcarahC
1 2 3 4 5laoc noiger epytlaoc tnetnocS epytenim
seigolonhceTrotcelloCretfasreirraCygrenE1 2 3 4 5 6C O A L epytlaoc tnetnocS

19
AEO source data, 2000–2020. The value for 1995 has beenset equal to that for 2000, and the values for 2025–2035have been set equal to that for 2020.
CUM: Total recoverable reserves by state, by grade andsource, from the EIA report on the update of U.S. CoalReserves for 1997 (EIA,1999) are summed into MARKALregions and converted into petajoules. Reserve percentagesby sulfur content derived from the EIA report are used toapportion reserves by sulfur content and by step. For eachstep in each resource curve, the fraction of the total re-source belonging to that step is calculated by dividing thesum of its 2000–2020 quantity bounds by the sum of thebounds for all eight steps. This fraction is then multipliedby the total reserves for the appropriate coal type to get tothe CUM for that step.
START: For coal, all resources are assumed to becomeavailable in the first model year, 1995.
7.6 Renewables
7.6.1 BiomassBiomass resources are utilized in MARKAL for fuel andheat production as well as electricity generation. Biomassresources are organized in three separate categories: woody,herbaceous, and landfill gas from municipal solid waste.
Data SourcesData on biomass resources were taken from the 1997 DOEMARKAL database.
RESWith respect to biomass, MARKAL includes renewableresources, energy carriers, processes, and conversion tech-nologies. The sector uses the following naming conven-tions: RNW denotes renewable, BIOHC denotes herba-ceous crop biomass, BMSWX denotes municipal solidwaste, and BIOWD denotes woody biomass. Processes thatconvert biomass resources to other fuels are named start-ing with a P, followed by the type of biomass resource, andending with the three letter description of the energy car-rier the biomass is converted into. Figure 14 is the RESflowchart.
ParametersCosts for biomass resources are expressed in millions of1995 dollars per petajoule. Investment costs for biomass-related process technologies are expressed in million dol-lars per petajoule per year, the exception being biomasscombined cycle electricity generation technologies, which
Figure 14. Biomass Resource RES.
PBIOHCETH ETHRNWBIOHC1
PBIOHCNGA NGA
PNGAMSW NGARNWBMSWX1
EBMSWLG ELC
RNWBIOWDA PBIOWDDSH DSH
RNWBIOWDB PBIOWDETH ETH
RNWBIOWDC BIOWD-0 PBIOWDMTH MTH
RNWBIOWDD PBIOWDNGA NGPQ
RNWBIOWDE RH54 RH
RNWBIOWDF EBIOCC ELC
RNWBIOWDG
BIOHC-0
BMSWX-0
are expressed in million dollars per gigawatt. Resourcesupply is defined in units of petajoule.
BOUND(BD)Or: With respect to woody biomass, this pa-rameter specifies the maximum annual production avail-able at each step cost. Annual limits were derived from the1997 DOE MARKAL database.
COST: For woody biomass, costs were defined at eachstep according to data drawn from the 1997 DOEMARKAL database.
7.6.2 Wind, Solar, Hydro, and GeothermalWind, hydro, and geothermal resources are utilized inMARKAL for electricity production. Solar resources areutilized in MARKAL for both residential water heatingand electricity production.
Data SourcesThere are no costs associated with these resources. Geo-thermal has an upper bound in activity of 2500 PJ, whichis based on the AEO2002 projection of geothermal use.
RESFigure 15 shows the reference energy system for wind,hydro, and geothermal resources.

20
7.7 Export Technologies
7.7.1 Oil and Natural Gas ExportsMARKAL uses resource technologies to allow the exportof some of the resource supplies. In the EPANMD, thereare export technologies for coal, diesel, gasoline, and natu-ral gas. Each technology has an input energy carrier, a costequal to zero, and a fixed bound, listed in Table 30. Thesevalues are fixed to the export values found in the AEO2002.There is no fixed bound for diesel because there are nodiesel exports in the AEO2002. The RES for oil and natu-ral gas exports is shown in Figure 16.
Figure 15. Wind, Solar, Hydro, and Geothermal ResourceRES.
WIN-0RNWWIN
SOLAR-0RNWSOLAR
GEOTHM-0RNWGEOTHM
HYDRO-0RNWHYDRO
DSLEXPDSL1
GSLEXPGSL1
NGAEXPNGA
Figure 16. Oil and NGA Exports in the RES.
Table 30. BOUND(BD)Or on Gasoline and NGA Exports.
ygolonhceT 5991 0002 5002 0102 5102 0202 5202 0302 53021LSGPXE 8622 8622 7971 2102 9212 3222 3222 3222 3222
AGNPXE 162 162 824 666 396 595 595 595 595
7.7.2 Coal ExportsThere are 10 “dummy” collector process technologies usedto collect coal for exporting. The collectors are used tocollect export coal based on the distinctions by coal type(bituminous, sub-bituminous, metallurgical, and lignite)and sulfur content (low, medium, and high). Figure 17shows one example of how the RES represents coal being
collected and transported for export. The bounds for coalexport, listed in Table 31, are set to the values in theAEO2002.
8 Process TechnologiesGeneral process technologies are discussed below. Sectorspecific process technologies are discussed in the demandsector sections.
8.1 Process Technology ParametersAF: Specifies the total annual availability of a technology.It is equal to the annual hours of actual availability dividedby the total hours in a year.
INVCOST: Specifies the cost of investment in one incre-mental unit of new capacity.
INP(ENT)p: Specifies the amount of an energy carrier thatis input to a process technology.
OUT(ENC)p: Specifies the amount of an energy carrierthat is output from a process technology.
VAROM: Specifies the annual variable operating andmaintenance costs associated with the installed capacityof a technology expressed as base year monetary units perunit of activity.
FIXOM: Specifies the annual fixed operating and mainte-nance costs associated with the installed capacity of a tech-nology expressed as base year monetary units per unit ofcapacity.
LIFE: Specifies the lifetime of a technology in years.
START: Specifies the first time period of availability.
RESID: Specifies the residual capacity in each model yearfor technology stock already existing at the beginning ofthe modeling horizon (1995). Since the technology stock
COALBH-0 COALEXSCCEXBHS EXPCOALEXX
Figure 17. Coal Export RES Example.
Table 31. Coal Export BOUND(BD)Or.
ygolonhceT 5991 0002 5002 0102 5102 0202 5202 0302 5302XXELAOCPXE 2161 2161 2941 6341 4141 6541 8941 0451 2851

21
has been installed before the model start year, the invest-ment cost is assumed to have already been expended andis therefore not included in the model.
BOUND(BD): Specifies a lower, upper, or fixed limit on aprocess technology’s installed capacity in a specified pe-riod.
8.2 RefineriesThe EPANMD representation of the refinery sector hasthree refinery types. S28 represents existing refinery con-version practices. S27 represents a high conversion refin-ery that can produce up to 50% of a dummy liquid inter-mediate that feeds S29, the high limit refinery, which canproduce very high proportions of diesel and gasoline. Thiscascaded implementation of the refinery processes permitsmore flexibility within the sector.
8.2.1 Refinery RESThe reference energy system for refineries is illustrated inFigure 18.
8.2.2 Refinery ParametersAll costs are expressed in millions of 1995 dollars. Energyquantities are expressed in petajoules.
Cost and availability parametersTable 32 lists the availability and cost parameters for thethree refinery types. Data come from the 97 DOEMARKAL database.
Input and output parametersINP(ENC)p: Refinery Energy consumption factors are cal-culated based on output of the reference case from EIA’sAEO2002 by dividing the total refinery energy consump-tion (NEMS Table 35, Refining Industry Energy Consump-tion) by the sum of the total refinery production (Table 69,
DSH: Heavy Distillate
DSL: Diesel
Oil S29: High Limit Refinery GSLRNGL: Gasoline
NGA S27: High Conversion Refinery JTF: Jet Fuel
Electricity S28: Existing Refinery KER: Kerosene
PFDST: Petrochem Feedstocks
NEMISC: Misc Petroleum
LPG: Liquid Petroleum Gas
Figure 18. Refinery RES.
Table 32. Cost and Availability Parameters for RefineryTypes.
retemaraP72ShgiH
noisrevnoCyrenifeR
82SgnitsixE
noisrevnoCyrenifeR
92StimiLhgiH
yrenifeR
FA 00.1 00.1 00.1TSOCVNI 433.5 530.3 00.1
MORAV 932.0 612.0 1.0MOXIF 0 170.0 0
EFIL 52 52 52TRATS 5991 5991 5991
Domestic Refinery Production). The unit is in petajoulesinput per petajoules output. This simple approach assumesthe same mix of energy input for all types of final productmix. Table 33 lists the energy demand for each of the re-fineries. The energy demands of the refineries increaseslightly over time. This is due to the fact that more energywill be needed at the refinery in order to fuel emissionsreduction retrofits to comply with more stringent environ-mental regulations.
OUT(ENC)p: The energy output (production per unit crudeoil) is also modified from the AEO 2002. NEMS Table 31.Refinery Production, MBCD, PADD6 is divided by thetotal annual crude oil production of the AEO 2002 Table 1.Total Energy Supply and Disposition Summary.
The sum of energy carrier output, OUT(ENC)p, for eachrefinery is greater than one, and therefore, LIMIT=1 isimposed as the maximum sum of all output carrier unitsper unit of activity. When LIMIT is used, OUT(ENC)pthen represents the maximum production of each carrierinstead of the fixed proportional production of each car-rier. This allows MARKAL (and thus, the refineries) tovary that output of the facility to meet demands. In thisway, the blend and output of the refinery can be chosen bythe MARKAL optimization procedure. Table 34 lists the

22
product mixes and maximum production for each of therefineries.
Table 33. Input Energy Carrier INP(ENC)p Values (units are in PJ/PJ).
yrenifeR retemaraP 5991 0002 5002 0102 5102 0202 5202 0302 530272S LIO 1 1 1 1 1 1 1 1 1
72S CLEDNI 4300.0 4300.0 8300.0 8400.0 1500.0 1500.0 1500.0 1500.0 1500.0
72S AEIAGN 4520.0 4520.0 1720.0 2720.0 7420.0 8320.0 6520.0 7520.0 7520.0
82S LIO 1 1 1 1 1 1 1 1 1
82S CLEDNI 4300.0 4300.0 8300.0 8400.0 1500.0 1500.0 1500.0 1500.0 1500.0
82S AEIAGN 4520.0 4520.0 1720.0 2720.0 7420.0 8320.0 6520.0 7520.0 7520.0
92S GLD 1 1 1 1 1 1 1 1 1
Other parametersRESID: The Existing Conversion refinery has residual ca-pacity starting in 1995 that is set equal to its bound oncapacity. In other words, the stated RESID, is the only ca-pacity that will be available for Existing Conversion refin-eries. No new capacity will be installed. The RESID datafor the Existing Conversion refinery, S28, comes from twosources: EIA AEO (2004) Figure 100 (Domestic refiningcapacity in three cases) and Table 68 (Domestic RefineryDistillation Base Capacity, Expansion, and Utilization). TheRESID equals the existing capacity minus the expectedretirement by year.
BOUND(BD): The High Conversion refinery has a capac-ity bound starting in the year 2010. Therefore, there willalways be a limit to the amount of refinery capacity avail-able to the model.
According to the EIA, new refinery construction is threeto four times more expensive than capacity expansion atan existing site. However, there is no easy way in MARKALto allow capacity expansion at the same facility. There-fore, the only expansion allowed in MARKAL is new ca-
Table 34. Output Energy Carrier OUT(ENC)p Values (unitsare in PJ/PJ).
retemaraP72ShgiH
noisrevnoCyrenifeR
82SgnitsixE
noisrevnoCyrenifeR
92StimiLhgiH
yrenifeR
GLD 5.0 C C
HSD 2550.0 60.0 6.0LSD 213.0 32.0 3.0
LGNRLSG 468.0 15.0 3.0FTJ 612.0 1.0 1REK 2700.0 10.0 40.0GPL 2550.0 50.0 50.0
CSIMEN 42.0 21.0 2.0TSDFP 840.0 30.0 1.0
pacity at an existing refinery plant (i.e., S27 and its exten-sion S29). Bound on domestic capacity of S27 is calcu-lated based on the extrapolation of the Figure 100 highgrowth scenario. The relevant capacity upper bound andresidual capacity for existing and high conversion refiner-ies are listed in Table 35. All values are expressed inpetajoules per year.
8.2.3 Refinery EmissionsThe refinery process emission factor calculations are basedon a model for refinery emissions developed by Delucchi(2003). The emission factor change over time is based onassumptions about the fraction of equipment that includesemission controls. The assumptions used for this analysisare defaults from Delucchi 2003, reflecting his judgementon best values for reproducing EPA estimates. These emis-sions are all process emissions (i.e., emissions NOT due tocombustion of fuels). However, they do include combus-tion of some by-products—e.g., CO and non-methane or-ganic compounds (NMOCs). Process emissions tend todecrease over time due to increased use of control tech-nologies. CO and NMOCs emissions are controlled byburning the CO or NMOC, which produces CO2. There-fore, increased controls of CO and NMOC will lead to in-creased CO2 emissions. The unit of emission factors listedin Table 36 is thousand tones per petajoule, excepting CO2
emission factors, which is in million tones per petajoule.
8.3 Coal GasificationThe EPANMD has three process technologies for coal gas-ification: high BTU coal gasification, medium BTU coalgasification, and in-situ gasification.
8.3.1 Gasification RESEach coal type passes through a “dummy” process tech-nology which tracks the emissions and then through thegasification process. Each process produces pipeline qual-ity natural gas (NGPQ). The reference energy system forcoal gasification is shown in Figure 19.

23
Table 35. Existing Refinery Residual Capacity and Bound on Capacity, High Conversion Bound on Capacity.
yrenifeR retemaraP 5991 0002 5002 0102 5102 0202 5202 0302 530272S )DB(DNUOB PU 0 581 323,3 033,9 262,31 601,71 453,91 206,12 058,3282S )DB(DNUOB PU 042,43 088,63 763,53 010,43 010,43 924,33 948,23 862,23 786,1382S DISER C 042,43 088,63 763,53 010,43 010,43 924,33 948,23 862,23 786,13
Table 36. Emission factors of Existing Refinery (S28) and High Conversion Refinery (S27).
yrenifeR retemaraP 5991 0002 5002 0102 5102 0202 5202 0302 530272S 2OC b,a 2000.0 2000.0 2000.0 2000.0 2000.0 2000.0 2000.0 2000.0 2000.072S IOC 6991.0 9202.0 8402.0 9502.0 5602.0 9602.0 4802.0 9902.0 3112.072S ION 0200.0 1200.0 1200.0 1200.0 2200.0 2200.0 2200.0 2200.0 2200.072S 01P 7000.0 6000.0 6000.0 6000.0 6000.0 6000.0 5000.0 5000.0 5000.072S 2OS c 7400.0 1400.0 7300.0 4300.0 2300.0 1300.0 8200.0 5200.0 3200.072S IOS 7400.0 1400.0 7300.0 4300.0 2300.0 1300.0 8200.0 5200.0 3200.072S COV 2110.0 5700.0 3500.0 1400.0 4300.0 1300.0 2200.0 5100.0 0100.082S 2OC 2000.0 2000.0 2000.0 2000.0 2000.0 2000.0 2000.0 2000.0 2000.082S IOC 6991.0 9202.0 8402.0 9502.0 5602.0 9602.0 4802.0 9902.0 3112.082S ION 0200.0 1200.0 1200.0 1200.0 2200.0 2200.0 2200.0 2200.0 2200.082S 01P 7000.0 6000.0 6000.0 6000.0 6000.0 6000.0 5000.0 5000.0 5000.082S 2OS 7400.0 1400.0 7300.0 4300.0 2300.0 1300.0 8200.0 5200.0 3200.082S IOS 7400.0 1400.0 7300.0 4300.0 2300.0 1300.0 8200.0 5200.0 3200.082S COV 2110.0 5700.0 3500.0 1400.0 4300.0 1300.0 2200.0 5100.0 0100.0
a .eluojateprepsennotnoillimnisihcihw,2OCgnitpecxeeluojateprepsennotdnasuohtnierasrotcafnoissimellAb OC 2 OCnahtrehtarnobracsennotnoillimnierasrotcafnoissime 2.c OS 2 OSnahtrehtarruflussennotdnasuohtnierasrotcafnoissime 2.
8.3.2 Gasification ParametersAll data came from the 1997 DOE MARKAL database.All costs, listed in Table 37, are expressed in millions of1995 dollars, and energy quantities, listed in Table 38, arein petajoules.
8.4 Other Natural Gas Process Technolo-giesThere are three additional process technologies that trans-form in some way the natural gas energy carrier (NGA).
COALBH-0 SECGASBH
COALBL-0 SECGASBL PCOAGASH
COALBM-0 SECGASBM
COALBH-0 SECISGBH
COALBL-0 SECISGBL
COALBM-0 SECISGBM PCOAGASIS
COALSL-0 SECISGSL
COALSM-0 SECISGSM
COALSL-0 SECGASSLPCOAGASM
COALSM-0 SECGASSM
COAGASH
COAGASIS
COAGASM
NGPQ
Figure 19. Coal Gasification RES.
Table 37. Cost and Availability Parameters for Gasification.
retemaraPHSAAGAOCP
laoCutBhgiHnoitacifisaG
MSAGAOCPlaoCutBmuideM
noitacifisaG
SISAGAOCPutis-nI
noitacifisaGFA 09.0 09.0 09.0
TSOCVNI 300.04 940.84 966.63MORAV 605.7 274.7 605.7
EFIL 03 03 02TRATS 0002 0002 5002

24
Table 38. Bounds on Gasification Capacity in PJ per Year.
ygolonhceT 5991 0002 5002 0102 5102 0202 5202 0302 5302noitacifisaGutBhgiH C 821 821 352 873 365 565 565 565
noitacifisaGutBmuideM C 505 0001 0081 0062 0043 0024 0064 0005
noitacifisaGutis-nI C C 5.26 001 523 055 577 5.788 0001
The cost values all come from the 1997 DOE MARKALdatabase. All costs are expressed in millions of 1995 dol-lars, and energy quantities are expressed in petajoules.
8.4.1 Pipeline Quality NGABefore going to the demand sectors, NGA passes througha process, shown in Figure 20, to transform it into pipelinequality Natural Gas (NGPQ), and there are some costs as-sociated with this. The parameters associated with pipe-line quality natural gas are
• INVCOST: 14.369• RESID: 21000• LIFE: 45• INP(ENT)p: 1.0417 (it is assumed that there is some
gas loss in the pipeline)
Figure 20. Pipeline Quality NGA RES.
NGA NGPQPNGANGAP
8.4.2 Natural Gas CompressionPipeline quality natural gas is compressed (CNG), Figure21, for use in CNG fueled vehicles. The parameters asso-ciated with compressing natural gas are
• INP(ENT)p: 1.0753• AF: 0.75
8.4.3 Methanol from Natural GasPipeline quality natural gas is processed into methanol,Figure 22, for the transportation and electric generationsectors. The parameters associated with processing metha-nol from natural gas are
• INVCOST: 36.681• VAROM: 4.713• BOUND(BD): 325• AF: 0.9• LIFE: 30• INP(ENT)p: 1.0
Figure 21. CNG RES.
NGPQ CNGPNAGCNG
8.5 CokeCoke is fuel produced by partially burning coal in a re-duced oxygen atmosphere. This removes most of the gas-ses, leaving a solid that burns at a higher temperature thancoal. There are two grades of coke in the EPANMD. Chemi-cal grade coke is a lower grade and is used for reducingphosphate rock in electric furnaces and in the productionof calcium carbide. In the EPANMD this is referred to asCOKE. Metallurgical grade coke produces a much highertemperature and is used as the heat source in blast furnacesprimarily for making iron and steel. In the EPANMD thisis referred to as COMET.
8.5.1 Coke RESImported COMET is put into a “dummy” collector pro-cess, SCCMETIMP. Metallurgical low- and medium- sul-fur coal pass through a “dummy” emissions accountingprocess. All three resources are then fed into a coking fur-nace process, PCOKE, which produces the energy carrierCOKE. Imported coke is put into a “dummy” collectorprocess, SCCOKEIMP, which can then become the emis-sions carrier COKE. The reference energy system for cokeis shown in Figure 23.
Figure 22. Methanol from NGA RES.
NGPQ MTHPNGAMTH
8.5.2 Coke ParametersThe emissions and collector “dummy” process technolo-gies have no costs associated with them. The only processparameters are for the coking process, PCOKE. The costvalues all come from the 1997 DOE MARKAL database
Figure 23. Coke RES.
CMET
COKE
CMETIMP-0
COALML-0 COALMM-0
COKEIMP-0
IMPCOMETZ SCCMETIMP
SECOKML
SECOKMM
IMPCOKE1
PCOKE
SCCOKEIMP

25
and are expressed in millions of 1995 dollars. Energy quan-tities are expressed in petajoules.
• INP(ENT)p: 1.4286• INVCOST: 16.208• FIXOM: 2.586• LIFE: 30• RESID: The RESID is 2200 in 1995 and is linearly
decreased by 367 each time period until all the RESIDis gone.
9 Conversion Technologies
9.1 Electricity GenerationThis section describes the parameters and sources of dataused to characterize electricity generation technologies inthe EPANMD. Cogeneration, a specific type of electricgeneration process, is discussed in the Industrial Sectordescription.
9.1.1 Electricity Data SourcesOriginal data for this sector was taken from the six sourcesthat are listed below in order of the priority they were used:
• EIA Annual Energy Outlook (AEO) 2002 Tables 38,45, and 69;
• EIA Annual Energy Outlook 2002 Reference Case Per-formance Characteristics;
• National Energy Technology Laboratory;• “Supporting Analysis for the Comprehensive Electric-
ity Competition Act”, DOE/PO-0059;• 1993 EPRI TAG guide; and• 1997 DOE MARKAL database.
These data sources are applied in MARKAL as listed inTable 39.
9.1.2 Electricity RESThe Electric Generation RES, shown in Figure 24, con-sists of conversion technologies and import electricity re-source technologies that all output electricity to the sys-tem. At the front end of the conversion technologies, emis-sions are tracked through “dummy” emissions trackingprocess technologies.
Table 39. Data Sources for Electric Sector Technologies.
Figure 24. Electrical Generation Sector RES.
continued
9.1.3 Electricity Resource TechnologiesThe EPANMD has three resource steps for import elec-tricity as shown in Figure 25. Each step has an upper boundand a cost for each unit of available electricity (similar tothe step curves for other resource technologies). The val-ues for cost and upper bound were taken from the 1997DOE MARKAL database.
9.1.4 Electricity Conversion TechnologiesThe first letter in the name reflects the technology sector.In this case ‘E’ is used for ‘Electricity’. The next three orfour characters represent the fuel type and the remaining
Figure 25. Imported Electricity Resource Technologies.
LAKRAM emaNygolonhceT ecruoStsoC.paC ecruoSM&O ecruoSetaRtaeHTWLNIWE enibrutdniwlacoL LAKRAM7991 LAKRAM7991 LAKRAM7991
CFCMAOCE llecleuf.bracnetlomnoitacifisaglaoC LAKRAM7991 LAKRAM7991 LAKRAM7991CFHTME llecleuflonahteM LAKRAM7991 LAKRAM7991 LAKRAM7991ECILSDE enignenoitsubmoclanretnileseiD LAKRAM7991 LAKRAM7991 LAKRAM7991
ECGAGNE elcycdenibmocsaglarutangnitsixE 2002OEA 2002OEA 2002OEAMTSAGNE maetssaglarutaN 2002OEA 2002OEA 2002OEAETCAGNE enibrutnoitsubmocsaglarutangnitsixE 2002OEA 2002OEA 2002OEA
VNOCCUNE raelcunlanoitnevnoC 2002OEA 2002OEA 2002OEAMTSHSDE maetslioleuflaudiseR 2002OEA 2002OEA 2002OEA
TCLSDE enibrutnoitsubmoclioetallitsiD 2002OEA 2002OEA 2002OEASPORDYHE egarotsdepmupcirtceleordyH 2002OEA 2002OEA 2002OEA
ORDYHE cirtceleordyH 2002OEA 2002OEA 2002OEARVPLOSE laitnediser—ciatalovotohP 21elbaT,2002OEA LAKRAM7991 83elbaT,2002OEA
50BGDAGNE 5002—esab—noitarenegdetubirtsiD 83elbaT,2002OEA 83elbaT,2002OEA 83elbaT,2002OEA01BGDAGNE 0102—esab—noitarenegdetubirtsiD 83elbaT,2002OEA 83elbaT,2002OEA 83elbaT,2002OEA
ELC
IMPELC1
IMPELC2 IMPELC3

26
Table 40. Electricity Conversion Technologies.
Table 39 (concluded). Data Sources for Electric Sector Technologies.LAKRAM emaNygolonhceT ecruoStsoC.paC ecruoSM&O ecruoSetaRtaeH
PGDAGNE kaep—noitarenegdetubirtsiD 83elbaT,2002OEA 83elbaT,2002OEA 83elbaT,2002OEACFAGNE llecleufsaG 83elbaT,2002OEA 83elbaT,2002OEA 83elbaT,2002OEA
VDACUNE raelcundecnavdA 83elbaT,2002OEA 83elbaT,2002OEA 83elbaT,2002OEA00CGIAOCE 0002—elcycdenibmoc.fisaglaocdetargetnI 54elbaT,2002OEA 83elbaT,2002OEA 54elbaT,2002OEA50CGIAOCE 5002—elcycdenibmoc.fisaglaocdetargetnI 54elbaT,2002OEA 83elbaT,2002OEA 54elbaT,2002OEA01CGIAOCE 0102—elcycdenibmoc.fisaglaocdetargetnI 54elbaT,2002OEA 83elbaT,2002OEA 54elbaT,2002OEA00ESNAOCE 0002—laocdezirevluP 54elbaT,2002OEA 83elbaT,2002OEA 54elbaT,2002OEA50ESNAOCE 5002—laocdezirevluP 54elbaT,2002OEA 83elbaT,2002OEA 54elbaT,2002OEA01ESNAOCE 0102—laocdezirevluP 54elbaT,2002OEA 83elbaT,2002OEA 54elbaT,2002OEA
00CGAGNE 0002—elcycdenibmocsaglarutaN 54elbaT,2002OEA 83elbaT,2002OEA 54elbaT,2002OEA50CGAGNE 5002—elcycdenibmocsaglarutaN 54elbaT,2002OEA 83elbaT,2002OEA 54elbaT,2002OEA01CGAGNE 0102—elcycdenibmocsaglarutaN 54elbaT,2002OEA 83elbaT,2002OEA 54elbaT,2002OEA
50CGAAGNE 5002—elcycdenibmocdecnavdasaglarutaN 54elbaT,2002OEA 83elbaT,2002OEA 54elbaT,2002OEA01CGAAGNE 0102—elcycdenibmocdecnavdasaglarutaN 54elbaT,2002OEA 83elbaT,2002OEA 54elbaT,2002OEA
00TCAGNE 0002—enibrutnoitsubmocsaglarutaN 54elbaT,2002OEA 83elbaT,2002OEA 54elbaT,2002OEA50TCAGNE 5002—enibrutnoitsubmocsaglarutaN 54elbaT,2002OEA 83elbaT,2002OEA 54elbaT,2002OEA01TCAGNE 0102—enibrutnoitsubmocsaglarutaN 54elbaT,2002OEA 83elbaT,2002OEA 54elbaT,2002OEA
50TCAAGNE 5002—enibrutnoitsubmocdecnavdasaglarutaN 54elbaT,2002OEA 83elbaT,2002OEA 54elbaT,2002OEA01TCAAGNE 0102—enibrutnoitsubmocdecnavdasaglarutaN 54elbaT,2002OEA 83elbaT,2002OEA 54elbaT,2002OEA
CCOIBE elcycdenibmocnoitacifisagssamoiB 96elbaT,2002OEA 83elbaT,2002OEA 83elbaT,2002OEASFCBOEGE maetsdehsalfdnaelcycyraniblamrehtoeG 96elbaT,2002OEA 83elbaT,2002OEA 83elbaT,2002OEA
GLWSMBE sagllifdnal-etsawdiloslapicinuM 96elbaT,2002OEA 83elbaT,2002OEA 83elbaT,2002OEATCLOSE lamrehtlartnecraloS 96elbaT,2002OEA 83elbaT,2002OEA 83elbaT,2002OEA
VPCLOSE ciatlovotohplartneC 96elbaT,2002OEA 83elbaT,2002OEA 83elbaT,2002OEACLECNIWE cirtcelelartnecdniW 96elbaT,2002OEA 83elbaT,2002OEA 83elbaT,2002OEA
BFPAOCE debdezidiulfdezirusserP LTEN LTEN LTENBMTSAOCE maetslaocsuonimutibgnitsixE GAT 2002OEA 2002OEASMTSAOCE maetslaocsuonimutib-busgnitsixE GAT 2002OEA 2002OEALMTSAOCE maetsetingilgnitsixE GAT 2002OEA 2002OEARESNAOCE seitilicafderewoplaocgnitsixederewopeR GAT 2002OEA 2002OEA
characters are used to represent the technology type. Num-bers are then used to refer to the vintage, the first year ofavailability. Table 40 lists the electricity conversion tech-nologies.
Table 40 (concluded). Electricity Conversion Technologies.
continued
emaN ygolonhceTnoisrevnoCyticirtcelE00CGIAOCE elcycdenibmoc.fisaglaocdetargetni C 000250CGIAOCE elcycdenibmoc.fisaglaocdetargetni C 500201CGIAOCE elcycdenibmoc.fisaglaocdetargetni C 0102
BFPAOCE debdezidiulfdezirusserpBMTSAOCE maetslaocsuonimutibgnitsixeSMTSAOCE maetslaocsuonimutib-busgnitsixeLMTSAOCE maetsetingilgnitsixe00PFCAOCE laocdezirevlup C 000250PFCAOCE laocdezirevlup C 500201PFCAOCE laocdezirevlup C 0102
RPFCAOCE seitilicafderewoplaocgnitsixederewoper50BGDAGNE noitarenegdetubirtsid C esab C 500201BGDAGNE noitarenegdetubirtsid C esab C 0102
PGDAGNE noitarenegdetubirtsid C kaepRVPLOSE ciatalovotohp C laitnediserTWLNIWE enibrutdniwlacol
CFCMAOCE llecleufbracnetlomnoitacifisaglaocCFAGNE llecleufenilosagCFHTME llecleuflonahtem
ECGAGNE elcycdenibmocsaglarutangnitsixe
emaN ygolonhceTnoisrevnoCyticirtcelEECGAGNE elcycdenibmocsaglarutangnitsixe
00CGAGNE elcycdenibmocsaglarutan C 000250CGAGNE elcycdenibmocsaglarutan C 500201CGAGNE elcycdenibmocsaglarutan C 0102
50CGAAGNE elcycdenibmocdecnavdasaglarutan C 500201CGAAGNE elcycdenibmocdecnavdasaglarutan C 0102
MTSAGNE maetssaglarutanETCAGNE enibrutnoitsubmocsaglarutangnitsixe
00TCAGNE enibrutnoitsubmocsaglarutan C 000250TCAGNE enibrutnoitsubmocsaglarutan C 500201TCAGNE enibrutnoitsubmocsaglarutan C 0102
50TCAAGNE enibrutnoitsubmocdecnavdasaglarutan C 500201TCAAGNE enibrutnoitsubmocdecnavdasaglarutan C 0102
VNOCCUNE raelcunlanoitnevnocVDACUNE raelcundecnavda
ECILSDE enignenoitsubmoclanretnileseidMTSHSDE maetslioleuflaudiser
TCLSDE enibrutnoitsubmoclioetallitsidSPORDYHE egarotsdepmupcirtceleordyh
CCOIBE elcycdenibmocnoitacifisagssamoibSFCBOEGE maetsdehsalfdnaelcycyraniblamrehtoeg
ORDYHE cirtceleordyhGLWSMBE sagllifdnal-etsawdiloslapicinum
TCLOSE lamrehtlartnecralosVPCLOSE ciatlovotohplartnecCLECNIWE cirtcelelartnecdniw

27
9.1.5 Electricity Process TechnologiesThe only process technologies used in the electricity gen-eration sector are “dummy” technologies for tracking emis-sions. Those processes are described in Section 9.1.8, Elec-tricity Emissions Accounting.
9.1.6 Electricity ParametersAll costs are expressed in millions of 1995 dollars. All en-ergy quantities are expressed in petajoules. Capacities areexpressed in gigawatts, while activities (production of elec-tricity) are expressed in petajoules.
Availability parametersSTART: The start year specifies the first time period ofavailability of a technology within the model time hori-zon.
LIFE: Specifies the number of years for which atechnology’s capacity may be utilized. The data for thisparameter comes from the 1997 DOE MARKAL database,and its value is listed in Table 41.
AF: Specifies the total annual availability of a technologyin each period. The data for this parameter comes from“Supporting Analysis for the Comprehensive ElectricityCompetition Act”, Table C4 and the 1997 DOE MARKALdatabase, and its value is listed in Table 41.
AF_TID: Specifies the fraction of the total unavailabilityof a technology that is forced outage. The remaining un-availability is assumed to be scheduled outage. The datafor this parameter comes from “Supporting Analysis forthe Comprehensive Electricity Competition Act”, Table C4and the 1997 DOE MARKAL database, and its value islisted in Table 41.
AF(Z)(Y): Specifies the availability for technologies whoseavailabilities vary by season (Z) and time-of-day (Y). Theavailability accounts for both forced and scheduled out-ages in each time division. In MARKAL, Z refers to sea-son, S = summer, I = intermediate (spring and autumn),and W = winter. Y refers to time-of-day, D = day, and N =night. AF(Z)(Y) is a fraction calculated as the hours ofavailability in the specified season and time-of-day dividedby the total hours in the specified season and time-of-day.The data for this parameter comes from the 1997 DOEMARKAL database.
CF(Z)(Y): Specifies the capacity utilization rate of a fixedcapacity utilization technology in each season (Z) and time-of-day (Y). The utilization rate applies to fixed capacityutilization technologies that can have seasonal or diurnalvariations in capacity utilization. It is generally measuredas the average of the utilization for each season and time-of-day division in each year over the period. The data forthis parameter comes from the 1997 DOE MARKAL data-base.
PEAK(CON): Specifies the fraction of a generationtechnology’s capacity that can be counted on to be avail-able to meet peak demand and reserve margin requirementsbased on its availability, reliability, and other consider-ations. The data for this parameter come from the 1997DOE MARKAL database, and its value is listed in Table41.
IBOND(BD): This parameter can be used to place an up-per (UP), lower (LO), or fixed (FX) bound on investmentin new capacity. In this sector, it has primarily been usedto prevent investment in an older vintage technology oncea newer vintage has become available (upper bound ofzero).
Table 41. Availability Values for Electric Sector Technologies.
LAKRAM ygolonhceT
EFIL FA DIT_FA )NOC(KAEP
lacinhceTemitefiL
ytilibaliavAnoitcarF
fonoitcarFtahtytilibaliavanU
decroFsi
fonoitcarFkaeProfyticapaC
evreseRdna00CGIAOCE 0002—elcycdenibmoc.fisaglaocdetargetnI 03 648.0 7273.0 998.050CGIAOCE 5002—elcycdenibmoc.fisaglaocdetargetnI 03 648.0 7273.0 998.001CGIAOCE 0102—elcycdenibmoc.fisaglaocdetargetnI 03 648.0 7273.0 998.0
BFPAOCE debdezidiulfdezirusserP 04 58.0 5.0 8.0BMTSAOCE maetslaocsuonimutibgnitsixE 04 648.0 7273.0 69.0SMTSAOCE maetslaocsuonimutib-busgnitsixE 04 648.0 7273.0 69.0LMTSAOCE maetsetingilgnitsixE 04 648.0 7273.0 69.000PFCAOCE 0002—laocdezirevluP 04 58.0 7273.0 69.050PFCAOCE 5002—laocdezirevluP 04 58.0 7273.0 69.001PFCAOCE 0102—laocdezirevluP 04 58.0 7273.0 69.0
RPFCAOCE seitilicafderewoplaocgnitsixederewopeR 03 648.0 7273.0 568.0
continued

28
Cost parametersAEO2002: Cost and performance characteristics from EIA’sAEO2002 Reference Case. These inputs represent EIA’sassumptions about costs and heat rates.Assumptions to the AEO 2002 Table 38: AEO 2002 Costand Performance Characteristics of New Electricity Gen-erating TechnologiesAssumptions to the AEO 2002 Table 45: Cost and Perfor-mance Characteristics for Fossil-Fueled Generating Tech-nologies: Three CasesAssumptions to the AEO 2002 Table 69: Cost and Perfor-mance Characteristics for Renewable Energy GeneratingTechnologies: Two Cases
INVCOST: Specifies the cost of investment in one incre-mental unit of new capacity. Values were taken directlyfrom these sources and converted from their original units
Table 41 (concluded). Availability Values for Electric Sector Technologies.
LAKRAM ygolonhceT
EFIL FA DIT_FA )NOC(KAEP
lacinhceTemitefiL
ytilibaliavAnoitcarF
fonoitcarFtahtytilibaliavanU
decroFsi
fonoitcarFkaeProfyticapaC
evreseRdna50BGDAGNE 5002—esab—noitarenegdetubirtsiD 03 538.0 36.0 69.001BGDAGNE 0102—esab—noitarenegdetubirtsiD 03 538.0 36.0 69.0
PGDAGNE kaep—noitarenegdetubirtsiD 03 538.0 36.0 69.0RVPLOSE laitnediser—ciatalovotohP 02 —a — 3.0TWLNIWE enibrutdniwlacoL 02 — — 3.0
CFCMAOCE llecleuf.bracnetlomnoitacifisaglaoC 03 78.0 7597.0 6.0CFAGNE llecleufenilosaG 03 78.0 7597.0 6.0CFHTME llecleuflonahteM 03 78.0 7597.0 6.0
ECGAGNE elcycdenibmocsaglarutangnitsixE 03 609.0 9275.0 100CGAGNE 0002—elcycdenibmocsaglarutaN 03 609.0 9275.0 49.050CGAGNE 5002—elcycdenibmocsaglarutaN 03 609.0 9275.0 49.001CGAGNE 0102—elcycdenibmocsaglarutaN 03 609.0 9275.0 49.0
50CGAAGNE 5002—elcycdenibmocdecnavdasaglarutaN 03 609.0 9275.0 268.001CGAAGNE 0102—elcycdenibmocdecnavdasaglarutaN 03 609.0 9275.0 268.0
MTSAGNE maetssaglarutaN 04 648.0 7273.0 69.0ETCAGNE enibrutnoitsubmocsaglarutangnitsixE 03 429.0 5764.0 69.0
00TCAGNE 0002—enibrutnoitsubmocsaglarutaN 03 429.0 5764.0 69.050TCAGNE 5002—enibrutnoitsubmocsaglarutaN 03 429.0 5764.0 69.001TCAGNE 0102—enibrutnoitsubmocsaglarutaN 03 429.0 5764.0 69.0
50TCAAGNE 5002—enibrutnoitsubmocdecnavdasaglarutaN 03 429.0 5764.0 449.001TCAAGNE 0102—enibrutnoitsubmocdecnavdasaglarutaN 03 429.0 5764.0 449.0
VNOCCUNE raelcunlanoitnevnoC 04 8.0 2614.0 58.0VDACUNE raelcundecnavdA 04 58.0 8383.0 58.0
ECILSDE enignenoitsubmoclanretnileseiD 02 538.0 36.0 69.0MTSHSDE maetslioleuflaudiseR 04 648.0 7273.0 5289.0
TCLSDE enibrutnoitsubmoclioetallitsiD 03 429.0 5764.0 69.0SPORDYHE egarotsdepmupcirtceleordyH 05 — 1 59.0
CCOIBE elcycdenibmocnoitacifisagssamoiB 03 8.0 8.0 48.0SFCBOEGE maetsdehsalfdnaelcycyraniblamrehtoeG 03 536.0 1 36.0
ORDYHE cirtceleordyH 06 44.0 1.0 449.0GLWSMBE sagllifdnal-etsawdiloslapicinuM 03 — — 9.0
TCLOSE lamrehtlartnecraloS 03 — — 3.0VPCLOSE ciatlovotohplartneC 03 — — 5.0CLECNIWE cirtcelelartnecdniW 03 — — 3.0
a retemarapehtybdeificepssidnanosaesro/dnayadfoemitybseiravtuptuoesohwseigolonhcettneserperseirtnedehsaD.daetsni)Y()Z(FA
to the MARKAL units of millions of 1995 dollars per gi-gawatt.
VAROM: Specifies the annual variable operating and main-tenance coasts. Values were taken directly from thesesources and converted from their original units to theMARKAL units of millions of 1995 dollars per petajoule.
FIXOM: Specifies the fixed operating and maintenancecosts for a technology. Values were taken directly fromthese sources and converted from their original units to theMARKAL units of millions of 1995 dollars per gigawatt.
Input and output parametersINP(ENT)c: The Heat rate. Specifies the amount of en-ergy input needed to produce one unit of electricity out-put. Values were taken directly from these sources and con-

29
verted from their original units of British thermal units perkilowatt and converted to the MARKAL units of petajoulesper petajoule.
OUT(ELC)_TID: Specifies that electricity is produced bythe technology. The value of 1 indicates that each technol-ogy only produces electricity.
Other MARKAL parametersCAPUNIT: This parameter is used to provide MARKALwith the conversion factor for converting from atechnology’s capacity unit (gigawatts) to its activity unit(petajoules). The value is 31.536 PJ/GW for all technolo-gies in this sector.
RESID: Specifies the residual installed technology stockin place at the beginning of the model horizon and its pro-jection over time. 1995 data for this parameter comes from1995 EIA Form 860 utility data (net summer capability)and the 1995 Electric Power Annual Volume II, Table 52,Summary Statistics for U.S. Nonutility Power Producers.Residual stocks are then assumed to depreciate accordingto their technical lifetimes (LIFE parameter).
9.1.7 Electricity Energy CarriersTwenty energy carriers go to the electricity conversion tech-nologies. Two of them are universal and go to all sectors:woody biomass (BIOWD-0) and municipal solid waste(BSMWX-0). Table 42. lists the other energy carriers.
9.1.8 Electricity Emission AccountingThere are 90 “dummy” process technologies used to trackemissions in the electric generation sector. All emissions
Table 42. Electric Sector Energy Carriers.
LAKRAM sreirraCygrenEnoitareneGyticirtcelEBFAEAOC debdezidiulfcirehpsomtaotlaoC
CGIEAOC elcycdenibmocnoitacifisagdetargetniotlaoCCFCMEAOC sllecleufedibracnetlomotlaoC
GFCEAOC noitarenegderif-laocderewoperdnawenotlaoCBFPEAOC debdezidiulfdezirusserpotlaoCETIBMTSC cirtcelemaetsgnitsixeotlaocsuonimutiBEGILMTSC cirtcelemaetsgnitsixeotetingiL
EBUSMTSC cirtcelemaetsgnitsixeotlaocsuonimutibbuSNMTSHSD cirtcelemaetsotlioleuF
AEELSD noitarenegyticirtceleotleseiD0-MHTOEG lamrehtoeG
0-ORDYH cirtceleordyHEHTEM noitarenegyticirtceleotlonahteM
MTSNEAGN AGN a noitarenegyticirtcelemaets-nonotCDLCAGN sCDLhguorhtlaicremmocotsagenilepiP b
AEEAGN .gntccasnoissimeretfanoitarenegyticirtceleotAGNMTSEAGN noitarenegyticirtceleotAGN
a saglarutan=AGNb retnecnoitubirtsidlacol=CDL
tracking process technology names begin with the letters‘SE’ followed by a three letter description of the energycarrier and a several character description of the processstep.
DSLDiesel going to the electricity generation sector passesthrough an initial process technology that tracks CO2, SOX,PM10, and VOCs. After that it passes through one of twooptions for NOX, either an existing NOX emissions or im-proved NOX control. There is an investment cost associ-ated with the improved NOX process.
For the diesel naming convention, the ‘SE’ is followed byDSL and then ‘ELC’ for diesel going to the electrical sec-tor. As shown in Figure 26, there are an additional twoletters for the second pass: ‘EN’ for existing NOX controlsand ‘IN’ for improved NOX controls.
NGAEEA SENGAELC NGA
SENGANSTIN SENGANSTEN
SENGASTMIN
SENGASTMEN
NGAENSTM
NGAESTM
Figure 26. Diesel (DSL) to Electric Sector EmissionsAccounting RES.
NGASimilar to diesel, natural gas goes through two processesto track emissions. The first dummy process tracks CO2,SOX, PM10, and VOCs. The second dummy process tracksNOX.
In the naming convention for NGA, the ‘SE’ is followedby NGA and then three letters representing the type of tech-nology: NST for non steam electric and STM for steamelectric. For the second pass there are an additional twoletters: ‘EN’ for existing NOX controls and ‘IN’ for im-proved NOX controls. The RES representations for each ofthese fuels are given in Figure 27.
Figure 27. Natural gas (NGA) to Electric Sector EmissionsAccounting RES.
DSLEEASEDSLELCEN
SEDSLELCIN
DSLEPN DSL SEDSLELC

30
DSHFuel oil goes through three dummy processes to track emis-sions. The first pass tracks CO2, PM10, and VOCs. The sec-ond process tracks SOX and the third process tracks NOX.
In the naming convention for fuel oil, the ‘SE’ is followedby DSH and then ELC representing fuel oil going to elec-tric. For the second pass, there are two letters: ‘ES’ forexisting SOX controls and ‘IS’ for improved SOX controls.For the third pass, there are an additional two letters: ‘EN’for existing NOX controls and ‘IN’ for improved NOX con-trols. The RES representations for each of these fuels aregiven in Figure 28.
MTHAs illustrated in Figure 29, methanol passes through oneprocess technology that tracks all emissions.
Figure 28. Fuel Oil (DSH) to Electric Sector Emissions Accounting RES.
CoalThe naming convention for electrical generation from coalcombustion is outlined in Table 43. For example,SECIGCBL identifies emissions from low sulfur bitumi-nous coal going through IGCC, and SECPFBLM identi-fies emissions from medium sulfur lignite coal goingthrough a pressurized fluid bed.
New Steam Electric TechnologiesNew steam electric technologies pass through two stagesfor emissions tracking. The first stage tracks CO2, SOX,
Figure 29. Methanol (MTH) to Electric Sector EmissionsAccounting RES.
Table 43. Naming Convention for Electric Sector Emissions Tracking.
NOX, and PM10. The second stage tracks VOCs. All newplants are assumed to be built with the best emissions re-ductions processes available.
The first seven characters of the new steam electric tech-nologies follow the naming convention in Table 43. Thesecond stage tracks the VOCs by sulfur type, dropping thesulfur content. Figure 30 represents the RES diagram.
9.1.9 Constraints1 Hydro and pumped hydro capacity constrained to ap-
proximate AEO2002 values.2 Constrained investment in distributed wind, central so-
lar thermal, and photovoltaic to low levels, based onanalysis by in-house researchers and AEO 2002 esti-mates.
3 Set RESID for existing NUC to AEO 2002 capacity .4 Growth constraints placed on landfill gas based on AEO
growth rate.
COACFPR
SCCCFPR
SCCCFPRN
CCFP
SECCFPBH Coal BH
Coal BL SECCFPBL
Coal SM SECCFPSM
Coal SL SECCFPSL
Coal LM SECCFPLM
Coal LL SECCFPLL
Coal LH SECCFPLH
Coal BM SECCFPBM
COACFP SCCCFP
Figure 30. New Steam Electric Emissions Accounting RES.
noitpircseDdnarebmuNretcarahCemaN1 2 3 4 5 6 7 8/7 9/8
snoissimE epyTssecorP noitpircseD laoCepyT noitpircseD rufluS
tnetnoC noitpircseD
S E C A F B debdezidiulfcirehpsomta B suonimutib H hgihI G C elcycdenibmocnoitacifisagdetargetni L etingil M muidem
M C F C llecleufnobracnetlom S suonimutibbus L wolP F B debdezidiulfdezirusserpS T M cirtcelemaetsgnitsixeC F P rewopderif-laoc

31
5 No investment in EDSLCT (DSL combustion turbine)in 1995.
6 Limited investment in IGCC to AEO2002 levels.
9.2 Conventional LWR Nuclear Technology
9.2.1 Nuclear Data Sources• OECD, 2002.• Ansolabehere, S. et al., 2003.• Nuclear Energy Institute: http://www.nei.org/docu-
ments/OM_Costs_1981_2003.pdf• EIA, 1998, Table 10.• DOE, 2001.
9.2.2 Nuclear RESThe nuclear conversion technology RES, shown in Figure31, consists of mined uranium, stockpiled spent and de-pleted uranium, and stockpiled plutonium resource tech-nologies which feed materials (instead of energy carriers)into two process technologies—one that enriches the ura-nium and one for plutonium uranium recovery extraction.These processes create the materials needed for the reac-tors. The reactors then output either electricity or spentmaterials to be stockpiled.
9.2.3 Nuclear MaterialsMined raw uranium does not have an implicit energy con-tent (like coal) because it depends on the ultimate level ofenrichment. Different nuclear technologies required ura-nium enriched to different levels but draw on the samesupply of global raw uranium. As a result, mined uranium,and the other nuclear resources, must be defined as a mate-rial with a cost per unit mass rather than per unit energy.The materials used are:
• MOX – Mixed (Uranium and Plutonium) oxide fuel,
UWSTSTKUSPT1 USPT PWST
PUREX
STKPU1 MOXSPTPU MOX PMOXSPT
PPUMOX ENUCMOXURD
STKURD1 ELC
MINNURN1 EU45LWR95USPT
MINNURN2 PNURNU45 EU45LWR05 MINNURN3 EU45LWR10
NURN
Figure 31. Nuclear RES.
• MOXSPT – Spent MOX fuel,• MOXWST – Waste from MOX fabrication,• NURN – mined natural uranium,• PU – Plutonium,• U45 – Uranium enriched to 4.5% U-235 for light wa-
ter reactors (LWR),• URD – Depleted uranium generated during enrichment,• USPT – Spent fuel from LWRs, and• UWST – Waste from PUREX process.
9.2.4 Nuclear Parameters
Resource technologies• MINNURN1 – Extraction of uranium, Step 1.• MINNURN2 – Extraction of uranium, Step 2.• MINNURN3 – Extraction of uranium, Step 3.
COST and CUM data taken from OECD, 2002, Page 21,Table 1.
StockpilesStockpiles are treated like mining processes in that theyhave no apparent input when looking at the RES diagram.The name of the input and output energy or material carri-ers must be the same. The naming convention for stock-piles (this must be followed) is:
• First three placeholders: STK,• Fourth through nineth placeholders: name of outgoing
energy/material carrier, and• Last placeholder must be a number.
If this naming convention is followed, then the energy/material carrier with the same name as that outputted bythe stockpile will find its way to the stockpile. Only theparameter OUT(MAT)r = 1 for URD (Tonne/tonne) is then

32
defined, otherwise material balance equations will bewrong.
• STKURD1: Depleted uranium from the enrichmentprocesses.
• STKPU1: Plutonium recovered from spent uranium.• STKUSPT1: Spent uranium fuel from LWRs.
Spent uranium can be drawn from the stockpile for Single-Pass Plutonium Recycling. USPT from EU45LWR95,EU45LWR05, EU45LWR10 all end up in this stockpile.
Process technologiesPNURNU45: Process technology for uranium enrichmentto 4.5% U235 for LWRs. (Data taken from page 146 ofAnsolabehere, S. et al., 2003.) The parameters forPNURNU45 are
• INP(MAT)p: This refers to the natural uranium input,which is the only material put into this process. In theEPANMD it is equal to 1 tonne/tonne.
• VAROM: Equal to $0.158 million/tonne natural U. Allcosts associated with enrichment are included, exceptthe cost of natural uranium.The overall cost for conversion, enrichment, and fab-rication given as
$2.038 × 10⁶/tonne IHM or ($2.038 × 10⁶/10.2) = 1.998× 10⁵ $/tonne natural U.
To avoid double counting, the cost of natural (raw)uranium must be factored out. The cost of raw ura-nium is given as:
($30/kg U) × (103 kg/1 tonne) = $3.0 × 10⁴ $/tonnenatural U.
So the cost for fabrication minus the cost of electricityand raw uranium, is:
$1.998 × 10⁵ - $3.0 × 104 = 0.170 M$/tonne natural U.In $1995: 0.158 M$/tonne natural U.
• OUT(MAT)p of enriched uranium: 0.098 (tonne/tonne)• OUT(MAT)p of depleted uranium: 0.902 (tonne/tonne)
Since it takes 10.2 tonnes of natural uranium to make1 tonne of enriched uranium (4.5% U-235 suitable forlight water reactors —LWRs),
1 tonne IHM /10.2 tonne U = 0.098 = 9.8%
Therefore, the amount of depleted uranium is 90.2%.
PUREX: Plutonium uranium recovery by extraction. Thisprocess recovers 99.9% of the plutonium content from spenturanium, which is 1.33% by weight. (Data taken fromAnsolabehere, S. et al., 2003, pages 121–122, Figure A-4.4, and text on bottom of page 122). The parameters forPUREX are
• INP(MAT)p: 1, refers to USPT (tonne/tonne).• OUT(MAT)p: 0.0133, refers to PU (tonne/tonne). (See
Deutsch et al., 2003, MOX (mixed oxide) cycle dia-gram, page 147.) 5.26 kg of spent OX fuel produces0.07 kg Pu. So, normalized by input, output is 0.07/5.26 = 0.0133. (This is highly enriched weapons gradeplutonium and, therefore, is regarded unfavorably,given potential security concerns.)
• OUT(MAT)p: 0.9867, refers to waste from MOX pro-cessing.
PPUMOX: Fabrication of MOX fuel for LWRs. MOX fab-rication requires 0.07 kg of plutonium and 5.26 kg of de-pleted uranium. (Data taken from Ansolabehere, S. et al.,2003, MOX cycle diagram, page 121 and 147). The pa-rameters for PPUMOX are
• INP(MAT)p: 0.0131 for PU [calculation: 0.07/(0.07 +5.26) = 0.0131]
• INP(MAT)p: 0.987 for URD [calculation: 5.26/(0.07+ 5.26) = 0.987]. Depleted uranium is required to blenddown the highly enriched plutonium.
• OUT(MAT)p: 1 of fresh MOX (IHM).• VAROM: 1.266 M$/tonne. According to Ansolabehere,
S. et al., 2003, cost of MOX reprocessing is $8,886/kgof fresh MOX fuel. In the MIT (Ansolabehere, S. etal., 2003) report, no distinction in costs made betweenPUREX and MOX fabrication, so all costs for MOXproduction included here. In MARKAL units,
($8886/kg)×(1 tonne/103 kg)×(1 m$/$106) = 8.886 M$/tonne.
The credit for the storage and disposal fee associatedwith once-through spent uranium is (-0.310 M$/tonne).The storage and disposal fee for once-through spenturanium was already assessed at PNURNU45, and soit must be subtracted here to avoid double counting.)The net cost is:
8.886 – 0.310 = 8.576 M$/tonne.In $1995: 7.975 M$/tonne.
PWST: Dummy process for disposal of waste from PUREXprocess. The parameter for PWST is
• INP(MAT)p: 1 for UWST (tonne/tonne)

33
But this is thermal energy, so electrical output, assum-ing a thermal efficiency of 33%, 0.231/0.33 = 0.7MTIHM/PJ.
• AF_TID: 0.4162• OUT(ELC)_TID: 1. Simply specifies that this con-
version technology produces electricity.• OUT(MAT)c: 0.701. Material output per unit of elec-
tricity produced (tonnes/petajoule). The fissioning ofuranium produces spent uranium (URNSPT), whichconsists of several material byproducts. The conver-sion of mass into energy through fission is neglected,since the mass of the spent fuel is only 0.0047% lessthan the initial heavy metal.
To determine the composition of spent fuel from LWRs,use Ansolabehere, S. et al., 2003, page 120, Table A-4.1. Spent Fuel Composition:
U (all isotopes) 93.4%Fissionable products (FP)= 5.15%Pu = 1.33%Minor Actinides (MA) = 0.12%Since 0.7 MTIHM are required to produce 1
PJ of electricity:U = 0.934×0.7 = 0.6538 tonnes/PJFP = 0.0515×0.7 = 0.03605 tonnes/PJPu = 0.0133×0.7 = 0.00931 tonnes/PJMA = 0.0012×0.7 = 0.00084 tonnes/PJLIFE = 40 years.Start = 1995.
EU45LWR05: New conventional nuclear (LWR) technol-ogy available in 2005. Parameters are the same asEU45LWR95, except
• FIXOM: 58.6 M$/GW• VAROM: 0.13 M$/PJ ($0.00047/kWh) × (277.78 kWh/GJ) × (106 GJ/PJ) ×
(1 M$/$106) = 0.13 M$/PJ• INVCOST: 1860 m$/GW; START = 2005• INVBLOCK: 0.8 GW (lower bound on capacity).
Costs were taken from Ansolabehere, S. et al., 2003,page 135, Table A-5.A.4. All costs discounted to 1995$.
EU45LWR10: Advanced nuclear (LWR) technology avail-able in 2010. Costs were taken from DOE (2001), pages71-75. Parameters are the same as EU45LWR95, except
• AF: 90%• VAROM: 1.29 M$/PJ (includes all O&M)
($0.005/kWh) × (277.78 kWh/GJ) × (106 GJ/PJ) × (1m$/$106) = 1.39 M$/PJIn $1995: 1.29 M$/PJ
PMOXSPT: Dummy process for disposal of waste fromENUCMOX. The parameter for PMOXSPT is
• INP(MAT)p: 1 for MOXSPT (tonne/tonne)
Nuclear reactorsEU45LWR95: Pre-Existing Conventional Nuclear (LWR).This technology only exists as residual capacity. Data takenfrom
• Nuclear Energy Institute: http://www.nei.org/docu-ments/OM_Costs_1981_2003.pdf Average O&M from1999–2003 is 0.0135 $/kWh,
• Ansolabehere, S. et al., 2003, Table A-5.C.2, page 44,and
• EIA (1998), Table 10, page 30.
The parameters for EU45LWR95 are• VAROM: 3.48 M$/PJ: O&M costs are not broken
down into fixed and variable and are given in cents /kWh (MIT, NEI, and EIA). Since NEI data were ex-pressed as an annual average instead of by quartiles,annual averages were averaged to obtain a rough aver-age composite over last 5 years:
5 year average O&M for existing nuclear = ($0.0135/kWh) × (277.78 kWh/GJ) × (106 GJ/1 PJ) = 3.75 M$/PJ.In $1995: 3.48 M$/PJ.
• IBOND(BD): 0: This insures no new capacity will bebuilt.
• RESID: It is assumed that existing nuclear capacityremains constant at ~100 GW (99 GW in 2003) overthe model horizon. This is a reasonable assumptionbecause retirements (3% by 2025) will be roughly com-pensated by uprating of other existing plants. See EIA,2004, page 70, Figure 69.
• AF: 85%. In recent years, capacity factor at existingnuclear plants has been roughly 85–90%, and this per-formance is expected to continue over the next 20 years.See EIA, 2004, page 70 and EIA Annual Energy Re-view 2004, page 270, Figure 9.2 (bottom right).
• INP(MAT)c: 0.701 for U45. Tonnes of enriched ura-nium (MTIHM) required to produce 1 PJ of electric-ity. According to Ansolabehere, S. et al., 2003, page117, the average burnup of U.S. LWRs is currently 50GWd/MTIHM (metric tonne initial heavy metal).
(50 GWd/1 MTIHM) × (1×10⁶ kW/1 GW) × (24 hours/1 day) × (1 GJ/277.78 kWh) × (1 PJ/106 GJ) = 4.32PJ/MTIHM = 0.231 MTIHM/PJ.

34
• INVCOST: 1340 M$/GWAccording to DOE (2001), 1440 M$/GW.In $1995: 1340 M$/GW.
• INVBLOCK: 0.8 GW (lower bound on capacity)• START: 2005• INP(MAT)c: 0.651. Tons of enriched uranium
(MTIHM) required to produce 1 PJ of electricity. Ac-cording to Ansolabehere, S. et al., 2003, page 117, theaverage burnup of U.S. LWRs is currently 50 GWd/MTIHM (metric tonne initial heavy metal).
(50 GWd/1 MTIHM) × (1×10⁶ kW/1 GW) × (24 hours/1 day) × (1 GJ/277.78 kWh) × (1 PJ/106 GJ) = 4.32PJ/MTIHM = 0.231 MTIHM/PJ.
But this is thermal energy, so electrical output, assum-ing a thermal efficiency of 35%, 0.231 / 0.355 = 0.651MTIHM/PJ.
• OUT(MAT)c: 0.651 tonne/PJ.
ENUCMOX: New MOX nuclear technology. Identical toEU45LWR05, but accepts MOX as input fuel and outputis MOXSPT rather than USPT. There appears to be no ap-preciable difference in cost or performance between LWRsoperating on UOX or MOX.
Note that the separated uranium could theoretically be re-processed for plutonium extraction also. As of 2002, no-where in the world is MOX fuel reprocessed, in part due tothe isotopic composition of plutonium in spent MOX. It ispossible that MOX recycling could take place in the fu-ture, but very little cost data exist with any operationalexperience. See Ansolabehere, S. et al., 2003, page 129.
10 Demand Technologies and End-Use DemandsThere are four major demand sectors represented in themodel: Residential, Commercial, Transportation, and In-dustrial. The end-use demands along with the technolo-gies to meet these demands are described in each sector.
10.1 Demand Sector Parameters
10.1.1 Availability and Utilization Parameters• CF: Specifies the maximum capacity utilization of a
technology (i.e., the maximum fraction of the year inwhich the technology may operate).
• IBOND(BD): Specifies a user imposed bound on in-vestment in new capacity.
• LIFE: Specifies the lifetime of a technology in years.• START: The start year specifies the first time period
of availability of a technology within the model timehorizon.
10.1.2 Efficiency and Cost Parameters• EFF: Specifies the efficiency of a technology where
efficiency is measured as units of end-use demand sat-isfied per unit of input energy carrier consumed.
• INVCOST: Specifies the cost of investment in oneincremental unit of new capacity.
• FIXOM: Specifies the fixed operating and mainte-nance (O&M) costs for a technology.
• VAROM: Specifies the annual variable (or running)operating and maintenance costs such as technologyrepairs.
10.1.3 Input and Output Parameters• MA(ENT): Specifies the amount of each energy car-
rier that is input to a demand technology.
• OUT(DM): Specifies the end-use demand (DM) ser-viced by the technology and is expressed as units ofend-use demand satisfied per unit of demand technol-ogy activity.
10.1.4 Other MARKAL Parameters• CAPUNIT: Specifies the conversion factor between
units of activity and units of capacity. The value for allDemand technologies is 1.0.
• RESID: Specifies the residual capacity in each modelyear for technology stock already existing at the be-ginning of the modeling horizon (1995). Having beeninstalled before the model start year, the investmentcost is assumed to have already been expended on thispre-existing capacity.
• DISCRATE: Specifies user defined technology-spe-cific discount rates (hurdle rates) to represent a reluc-tance to invest.
10.1.5 Constraints• RAT_RHS: Specifies the right hand side (RHS) co-
efficient of a constraint equation and the relationshiptype (i.e., >, =, or <).
• RAT_ACT: Specifies the left hand side coefficientfor the specified process technology’s activity variable.
• RAT_CAP: Specifies the left hand side coefficient forthe specified conversion, process, or demandtechnology’s capacity variable.

35
10.1.6 Electricity Generation “Only” TechnologyParameters
• AF: Specifies the total annual availability of a tech-nology in each period.
• AF_TID: Specifies the fraction of the total unavail-ability of a technology that is forced outage.
• AF(Z)(Y): Specifies the availability for technologieswhose availabilities vary by season (Z) and time-of-day (Y). The availability accounts for both forced andscheduled outages in each time division. In MARKAL,Z refers to season, S = summer, I = intermediate (springand autumn), and W = winter, and Y refers to time-of-day, D = day, and N = night. AF(Z)(Y) is a fractioncalculated as the hours of availability in the specifiedseason and time-of-day divided by the total hours inthe specified season and time-of-day.
• CF(Z)(Y): Specifies the capacity utilization rate of afixed capacity utilization technology in each season(Z) and time-of-day (Y). The utilization rate applies tofixed capacity utilization technologies that can haveseasonal or diurnal variations in capacity utilizationsuch as cogeneration plants. It is generally measuredas the average of the utilization for each season andtime-of-day division in each year over the period.
• PEAK(CON): Specifies the fraction of a generationtechnology’s capacity that can be counted on to beavailable to meet peak demand and reserve margin re-quirements, based on its availability, reliability, andother considerations.
• INP(ENT)c: The heat rate. Specifies the amount ofenergy input needed to produce one unit of electricityoutput.
• INP(ENC)_TID: Specifies the initial fuel core require-ments for nuclear power plants expressed as units ofthe energy carrier per unit of the technology capacity.
• OUT(ELC)_TID: Specifies that electricity is producedby the technology. The value of 1 indicates that eachtechnology only produces electricity.
10.2 Residential SectorThe residential sector consists of demands technologiesneeded to meet residential demands for space heating andcooling, cooking, refrigeration, water heating, lighting, andvarious other energy use technologies.
10.2.1 Residential Data SourcesData for most residential sector technologies was takenfrom EIA, 2002e. Data for existing capital stocks of thesetechnologies was taken from NEMS Vintage Program datafor the AEO 2002 Reference Case Tables and Technology
Files for the Building Sector, also provided by JohnCymbalsky. Data for lighting technologies was retainedfrom the 1997 DOE MARKAL database.
Additional data sources include:• EIA 2002e Table 4: Residential Sector Key Indicators
and Consumption,• EIA 2002e Table 21: Residential Sector Equipment
Stock and Efficiency, and• EIA 2002c: Residential Sector Key Indicators and As-
sumptions.
10.2.2 Residential Assumptions1.Technology specific hurdle rates (DISCRATE param-
eter) have been applied differentially to base and ad-vanced technologies to simulate the consumer’s reluc-tance to purchase newer technology.
2.Heating technologies (space heating and water heat-ing) fuel use splits have been implemented to be equiva-lent in 2000 to the AEO 2002, with a 3% relaxationrate each subsequent time period.
3.A growth rate constraint (GROWTH parameter) of 10%has been applied to gas heat pumps to limit the rate ofpenetration (based on AEO 2000 Table 4 2000-2020growth rate).
4.The capacity of various heating and cooling technolo-gies is assumed to be the following (based on inputfrom Jim Cymbalsky of EIA):• Radiators and furnaces 50000 btu/hr• Heat pumps 36000 btu/hr• Room air conditioners 10000 btu/hr• Central air 36000 btu/hr
5.The model assumes that for solar water heaters solarenergy provides 55% of the energy needed to satisfyhot water demand, and the remaining 45% is satisfiedby an electric back-up unit.
10.2.3 Residential RESThe Residential Sector RES, Figure 32, consists of demandtechnologies that are capable of meeting end-use demands.All energy carriers going to the Residential Sector passthrough an emissions tracking “dummy” process technol-ogy on the front end of the demand technology.
10.2.4 Residential End-Use DemandsThe residential sector’s eight end-use demands, listed inTable 44, are derived from Table A4 of EIA, 2002d, andTable 21 of EIA, 2002e. Demand values are listed in Table45. Overall, residential heating (RH) constitutes the larg-est demand, followed by residential cooling (RC), miscel-

36
Figure 32. Residential Sector RES.
laneous electric (RME), and residential water heating (RW).RC and RME have the largest growth rates (177% and194%, respectively) within the modeling period, while RFhas the smallest increase (15%) among all residential de-mands.
Table 46. shows the calculation of residential demands ac-cording to various AEO tables. These calculations yield(except for lighting) service demands matching the AEO2002 time horizon: every year from 2000–2020. Valuesfor 2000 and 2020 were each used for the correspondingMARKAL model years. Values for MARKAL model years2005, 2010, and 2015 are five-year averages of the AEOcalculated demands, centered on the corresponding modelyears. For example, for the year 2005, the average of 2003through 2007 was taken. Values for 1995 and years be-yond 2020 were extrapolated. For 1995, the percent changefor years 2000 through 2005 was calculated and used toadjust 1995 down from 2000. For 2025–2035, the percentchange was calculated for 2015-2020 and adjusted by time
Table 44. Residential Sector End-Use Demands.emaN noitinifeD
CR gnilooclaitnediseRFR srezeerflaitnediseRHR gnitaehlaitnediseRLR gnithgillaitnediseR
EMR cirtcelesuoenallecsimlaitnediseRGMR sagsuoenallecsimlaitnediseR
RR noitaregirferlaitnediseRWR gnitaehretawlaitnediseR
Table 45. Residential Sector Demand Values in the EPANMD.dnameD stinU 5991 0002 5002 0102 5102 0202 5202 0302 5302
CR JP 6851 2971 4202 5822 4062 9692 4833 8583 8934FR ry/stinunoillim 43 43 43 43 43 53 73 83 93HR JP 5234 9964 6015 4135 6355 3285 6216 3446 8776LR JP 374 305 206 836 276 496 617 047 467
EMR JP 8941 9781 8532 6562 9692 5723 3163 5893 6934GMR JP 573 404 534 944 764 684 505 425 545
RR ry/stinunoillim 411 911 421 031 631 241 841 551 261WR JP 2811 2421 5031 1731 6341 4051 4751 8461 5271
Table 46. Residential Demand Calculations.
dnameD ecruoS stinU stnemmoC
CR 4AelbaT,d2002,AIE12elbaT,e2002,AIE JP 3 leufrofnoitpmusnocygrenedereviled( i ygolonhcetdna ji H ycneiciffetnempiuqeegarevakcots i
j) H 01/JP 51 utB
FR:12elbaT,e2002,AIE
ygolonhceTlatoTkcotS
noillimry/stinu
HR 4AelbaT,d2002,AIE12elbaT,e2002,AIE JP 3 leufrofnoitpmusnocygrenedereviled( i ygolonhcetdna ji H ycneiciffetnempiuqeegarevakcots i
j) H 01/JP 51 utB
LRLAKRAMEOD8991
4AelbaT,8991,AIE4AelbaT,d2002,AIE
JPfooitarehtgniylppaybesabatadLAKRAMEOD8991ehtmorfdetadpuneebsahdnamedsihT
asa4elbaT,8991,AIEmorftahtot4elbaT,d2002,AIEmorfgnithgilrofnoitpmusnocyticirtcele.reilpitlum
EMR4AelbaT,d2002,AIE
ygrenEderevileDnoitpmusnoC
JP rehtodna,snaf,sretupmoc,noisivelet,gnihsawhsid,gniyrddnagnihsawsehtolc,gnikoocsedulcnI
GMR4AelbaT,d2002,AIE
ygrenEderevileDnoitpmusnoC
JP rehtodna,gniyrdsehtolc,gnikoocsedulcnI
RR:12elbaT,e2002,AIE
ygolonhceTlatoTkcotS
noillimry/stinu
WR 4AelbaT,d2002,AIE12elbaT,e2002,AIE JP )stinunoillim(kcotsretaehretaW H retaehretawrepnoisivorpecivresygreneesu-dneegareva
)JP78.11(
constraints
emissions
Process TechnologiesEnergy carriers
Energy carriers Demand Technologies Energy
carriers End-Use Demands

37
period. The 1995 value for lighting was taken directly fromthe 1997 DOE MARKAL database.
10.2.5 Residential Demand TechnologiesDemand technologies consume fuels (energy carriers) tomeet the end-use demands. Examples of end-use technolo-gies in the residential sector include air conditioners, freez-ers, clothes washers, and water heaters.
There are 155 demand technologies in the residential sec-tor, broken down into 8 sub-categories. Within each sub-category are different technologies powered by a varietyof energy carriers with different efficiency levels. The sub-categories are:
The naming convention for residential end-use technolo-gies is outlined in Table 47, and examples are:
RH01 space heating, electric furnace, existingRH27 space heating, gas radiator #2 – 2010RC05 space cooling, room a/c #2 – 2020RW23 water heating, distillate #2 – 1995RR03 refrigeration #1 – 2005RF01 freezing, existingRL01 Incandescent lightingRME01 Miscellaneous electric
Heat pumps service two kinds of demands—heating andcooling—and have different efficiencies and capacity fac-tors for each of those demands. Therefore, two technolo-
Table 47. Residential End-Use Technology NamingConvention.
yrogetaC
noitpircseD1 3&2/2 5&4/4&3
rotceS yrogetaC derebmuNgnitsil
R H 10 gnitaehC gniloocW gnitaehretawL gnithgilR noitaregirferF gnizeerfEM cirtcele-suoenallecsimGM sag-suoenallecsim
gies were created to model each heat pump. For example,RH04 is the 1995 typical electric heat pump for heating,and RC19 is the 1995 typical electric heat pump for cool-ing. The technologies are linked by constraints that forcethe model to invest in the appropriate amount of one whenit buys the other. Capital costs for all heat pumps for cool-ing have been set to zero to avoid double counting.
10.2.6 Residential Process TechnologiesThere are five process technologies in the residential sec-tor. Four of them are used for emissions accounting andwill be explained later. The other one is used to representthe distribution of natural gas through a local distributioncompany.
PNGALDCR = NGA to residential through LDCs
A natural gas local distribution company does not earn aprofit on the buying and reselling of the natural gas itself.An LDC is allowed to earn a fair return on the money thatthe LDC has invested in the system that delivers the gas tocustomers. Therefore, PNGALDCR has an investment cost(INVCOST) associated with it as well as variable operat-ing and maintenance costs (VAROM).
10.2.7 Residential ParametersThis section describes the parameters used to characterizeresidential demand and process technologies in MARKALand the calculations required to transform source data intoMARKAL form. This is a summary of all parameters usedand not meant to indicate that all technologies have eachof these parameters in their description.
UnitsAs detailed in Table 48, all costs are expressed in millionsof 1995 dollars. Energy quantities are expressed inpetajoules, with the exception of refrigerators and freez-ers, which are expressed in terms of million units.
AEO 2002 Residential Technology Equipment TypeDescription file (Res Tech File)
Table 48. Residential Sector Cost and Efficiency Units.
yrogetaCLAKRAM ygolonhceT stinUTSOCVNI srotaregirfeR stinunoillim/$noillim59
srezeerF stinunoillim/$noillim59srehtollA munna/JP/$noillim59
FFE srotaregirfeR stinunoillim H JP/rysrezeerF stinunoillim H JP/rysrehtollA JP/JP
gnitaeHecapSgnilooCecapSgnitaeHretaW
noitaregirfeRsrezeerF
gnithgiLsaG-suoenallecsiM
cirtcelE-suoenallecsiM
365353017311

38
This AEO Residential Demand Module file (EIA, 2002e)represents a “menu” of efficiency levels and installed costcombinations by technology type projected by year avail-able. Installed costs given represent the capital cost of theequipment plus the cost to install it, excluding any financecosts. The efficiency measurements vary by equipmenttype. Electric heat pumps and central air conditioners arerated for cooling performance using the Seasonal EnergyEfficiency Ratio (SEER); natural gas furnaces are basedon Annual Fuel Utilization Efficiency; room air condition-ers are based on Energy Efficiency Ratio (EER); refrigera-tors are based on kilowatt-hours per year; and water heat-ers are based on energy factor (delivered Btu divided byinput Btu).
Availability and utilization parametersCF: These values were retained from the 1997 DOEMARKAL database. The values are as follows:
Heating = 0.16Cooling = 0.15Water Heating = 0.10Refrigeration = 1.00Freezing = 1.00Lighting = 1.00
Most lights are not used 100% of the time, but the costs forlighting in MARKAL are based on the life of a light bulbwhich is directly related to when the light bulb is on.
IBOND(BD): Specifies a user imposed bound on invest-ment in new capacity. This parameter has been used to placean upper bound of zero, preventing investment in new ca-pacity, for all technologies past the “Last year” value speci-fied in the Res Tech File. This “Last year” is the year be-yond which the technology in question becomes obsolete.For example, when the efficiency of a particular heat pumpis improved and introduced to the market, the less efficientversion is no longer available. It has also been used to pre-vent investment in new capacity for all “existing” tech-nologies which represent residual installed capacity at thebeginning of the model horizon. An example of how thisparameter is used is given in Table 49.
Table 49. Residential Sector IBOND Example.
LAKRAM noitpircseDLAKRAM raeYtsaL 5991 0002 5002 0102 5102 0202 5202 0302 5302
30HR cirtcele,gnitaehecapsgnitsixe,pmuptaeh 5991 0 0 0 0 0 0 0 0 0
40HR cirtcele,gnitaehecaps5991,1#pmuptaeh 5002 0 0 0 0 0 0
60HR cirtcele,gnitaehecaps5991,2#pmuptaeh 5002 0 0 0 0 0 0
70HR cirtcele,gnitaehecaps0102,2#pmuptaeh 9102 0 0 0 0
LIFE: Specifies the lifetime of a technology in years. Thevalues for this parameter, listed in Table 50. were retainedfrom the 1997 DOE MARKAL database.
START: For all technologies except lighting technologies,data for this parameter came from the Res. Tech. File (EIA,2002e). Lighting data was taken directly from the 1997DOE MARKAL database.
Efficiency and cost parametersEFF: For all technologies except lighting, data for this pa-rameter came from the Res. Tech. File (EIA, 2002e).
For RC, RH, and RW: The AEO efficiency data are pro-vided in units of British thermal units output per Britishthermal units input. These values are converted MARKALunits of petajoules out per petajoules in.
For RR and RF: The efficiency is given in units of kilo-watt-hour per year per unit, which are converted to millionunits per year per petajoule.
For RL: Data were taken directly from the 1997 DOEMARKAL database.
INVCOST: For all technologies except lighting, data forthis parameter came directly from the Res. Tech. File (EIA,2002e).
Table 50. Residential Sector LIFE Values.
dnameDLAKRAM ygolonhceT efiL)ry(
CR lla 51FR lla 51HR spmuptaeh 51HR srehtolla 03LR lla 51RR lla 51WR lla 01

39
For RC and RH: The Res. Tech. File lists capital costs in2001 dollars per unit and capacity per unit in British ther-mal units per hour. The capital costs were divided by thecapacities and the results converted to millions of 1995dollars per petajoule.
INVCOST = Capital Cost/Capacity
For RW: For each of the water heater fuel types (electric,NGA, diesel, and LPG), the energy output (in petajoules)per million units was calculated using the fuel specific en-ergy consumption found in EIA, 2002d, Table A-4, Resi-dential Sector Key Indicators and Consumption, and thefuel specific stock average efficiency and total stock unitsfound in EIA, 2002e, Table 21. Those values were used tocalculate a stock-weighted average annual useful energyservice output in petajoules. The investment cost was thencalculated by dividing the capital costs in 2001 dollars perunit found in the Res. Tech. File (EIA, 2002e) by theweighted average annual useful energy service and thenmultiplying by a water heater Capacity Factor of 0.1.
INVCOST = Capital Cost ) Average Annual UsefulEnergy Service H Capacity Factor
For RR and RF: The Res. Tech. File (EIA, 2002e) listscapital costs in 2001 dollars per unit, which were convertedto millions of 1995 dollars per unit.
For RL: Lighting data were taken directly from the 1997DOE MARKAL database.
VAROM: In the residential sector, VAROM is only speci-fied for lighting technologies, and the values used weretaken directly from the 1997 DOE MARKAL database.
Input and output parametersMA(ENT): In the residential sector, most technologies onlyuse one energy carrier, and therefore MA(ENT) is equal to1.0. Solar water heaters, the exception, have a solar energyinput and an electricity backup. For those technologies,MA(ENT) for solar energy is 0.55 (55% of total energyinput) and MA(ENT) for electricity is 0.45 (45% of totalenergy input).
OUT(DM): For the residential sector, these units arepetajoules per petajoule. For all residential demand tech-nologies, all of the energy activity of the technology con-tributes to a single end-use demand, and thereforeOUT(DM) equals 1.0.
Other MARKAL parametersCAPUNIT: The value for all residential technologies is1.0.
RESID: Specifies the residual capacity in each model yearfor technology stock already existing at the beginning ofthe modeling horizon (1995). Having been installed be-fore the model start year, the investment cost is assumed tohave already been expended and is therefore not includedin the model.
For RC, RH, RR, RF, and RW: Data for residual capacityand average efficiency of residual capacity were taken fromthe Vintage Program data for the AEO 2002 Reference CaseTables and Technology Files for Building Sector. Thesegive surviving capacities from historical model years andthe average efficiency of shipments in each model year.Five-year averages were taken around each MARKALmodel year for years 1995 through 2025. (For distillateheaters, the Vintage Program data are inconsistent with EIA2002e, Table 21 data. Vintage Program data show 4.4 mil-lion distillate furnaces and 21 million distillate radiators in1995, while Table 21 shows 9.04 million combined distil-late units in 2000. The Vintage Program stocks for distil-late radiators have been reduced by 75 percent to accountfor this discrepancy.)
For RL: RESID values were retained from the 1997 DOEMARKAL database.
10.2.8 Residential Energy CarriersEight fuels go directly to the residential sector end-use tech-nologies as indicated in Table 51. Three of the fuels—elec-tricity (ELC), solar (SOLAR), and biomass (BIOWD-0)—are universal and go to all sectors. For the other five, thefirst three letters of the name refer to the fuel type, thefourth letter is an ‘R’ for Residential, and the final lettersindicate the path: EA is after Emissions Accounting andLDC is after passing through LDC (NGA only).
Table 51. Residential Sector Energy Carriers.
emaN noitinifeDCLE yticirtcelE
0-DWOIB ssamoiB0-RALOS raloS
AERLSD gnitnuoccasnoissimeretfalaitnediserotleseiDAERREK nitnuoccasnoissimeretfalaitnediserotenesoreKAERGPL nitnuoccasnoissimeretfalaitnediserotGPLAERAGN nitnuoccasnoissimeretfalaitnediserotAGN
CDLRAGN sCDLhguorhtlaitnediserotAGN

40
10.2.9 Residential Emissions AccountingAll fuels with residential-specific emission factors passthrough a “dummy” process technology which tracks emis-sions from a particular fuel type going to residential de-mand technologies. There are no costs associated with these“technologies”. They simply have an incoming energy car-rier and an outgoing energy carrier. There are four of thesefor the residential sector. As delineated in Table 52, thefirst two letters in the names of these process technologiesare ‘SE’ for Emissions. The last three letters are ‘RES’ forresidential. The letters in-between represent the fuel type.The emissions data assumptions and calculations are ex-plained in Section 11.
10.2.3 Residential ConstraintsThere are twenty-one constraints in the residential sectorthat are used to tie together the two separate technologiesthat were created to describe each heat pump, one technol-ogy for space heating and one technology for space cool-ing. The cooling capacity of specific heat pump technol-ogy is subtracted from the heating capacity of the sameheat pump with the fixed result of zero. This ensures thatif a technology is invested in for cooling, it will also beused for heating. These constraints are absolute constraintsand are named A_RHP1 through A_RHP21.
Table 52. Residential Emissions “Dummy” ProcessTechnologies.
emaN noitinifeDSERLSDES laitnediserotleseiD:snoissimESERREKES laitnediserotenesorek:snoissimESERGPLES laitnediserotGPL:snoissimESERAGNES laitnediserotAGN:snoissimE
Table 53. Residential Space and Water Heating Fuel Splits.
Delivered Energy Consumption by Fuel 2000 2000
Space Heating (Quads) (%)Electricity 0.42 0.0771
Natural Gas 3.44 0.6312Distillate 0.7 0.1284
Liquid Petroleum Gas 0.33 0.0606Biomass 0.43 0.0789
Other 0.13 0.0239Total 5.45Water Heating
Electricity 0.41 0.2103Natural Gas 1.32 0.6769
Distillate 0.12 0.0615Liquid Petroleum Gas 0.1 0.0513
Total 1.95
AEO 2002 Table A4 Residential Sector Key Indicators and Consumption
There are twelve constraints in the residential sector usedto apply specific fuel use splits to heating and water heat-ing technologies. The initial fuel use splits were taken fromthe EIA, 2002d, Table A4: Delivered Energy Consump-tion by Fuel and are listed in Table 53. Splits are relaxedover time to allow the model more variation in technolo-gies to choose from.
These constraints are share splits so the name begins withS_. The second letter in the constraint name reflects thetechnology sector, which in this case is ‘R’ for ‘Residen-tial’. The third letter represents the technology type, andthe 4th—7th letters represent the energy carrier. The fuelsplit constraints are listed in Table 54.
Table 54. Residential Space and Water HeatingConstraints.
10.3 Commercial SectorThe commercial sector includes businesses not engaged inmanufacturing, transportation, agriculture, mining, con-struction, or other industrial activity.
10.3.1 Commercial Data SourcesData for commercial sector technologies was taken fromthe AEO 2002 Commercial Technology Cost and Perfor-mance File (EIA, 2002f) for the Commercial Model, pro-vided by Erin Boedecker of the Energy Information Ad-ministration. AEO 2002 commercial sector service demandreports were also used to characterize 1995 residual tech-nology stocks.
10.3.2 Commercial Assumptions1.Technology-specific discount rates, or hurdle rates,
(DISCRATE parameter) have been applied differen-tially to base and advanced technologies.
2.All installed technologies are BOUND to force RESIDto be used.
3.Heating technologies (space heating and water heat-ing) fuel splits have been implemented to be equiva-
emaN noitinifeDTIBHR_S gnitaeh-tilpsleufssamoiBCLEHR_S gnitaeh-tilpsleufyticirtcelESAGHR_S gnitaeh-tilpsleufsaGGPLHR_S gnitaeh-tilpsleufGPLLIOHR_S gnitaeh-tilpsleufliOHTOHR_S gnitaeh-tilpsleufrehtOTIBWR_S gnitaehretaw-tilpsleufssamoiBCLEWR_S gnitaehretaw-tilpsleufyticirtcelESAGWR_S gnitaehretaw-tilpsleufsaGGPLWR_S gnitaehretaw-tilpsleufGPLLIOWR_S gnitaehretaw-tilpsleufliOHTOHR_S gnitaehretaw-tilpsleufrehtO

41
lent in 2000 to the AEO 2002, with a 3% relaxationrate each subsequent time period.
10.3.3 Commercial RESThe Commercial Sector RES, illustrated in Figure 33, con-sists of demand technologies that are capable of meetingend-use demands. All energy carriers going to the Com-mercial Sector pass through an emissions tracking“dummy” process technology on the front end of the de-mand technology.
10.3.4 Commercial End-Use DemandsThe commercial sector is characterized by thirteen end-use demand technologies. Table 55 lists the end-use de-mands in the EPANMD.
Figure 33. Commercial Sector RES.
constraints
emissions
Process TechnologiesEnergy carriers
Energy carriers Demand Technologies Energy
carriers End-Use Demands
The commercial demands are derived from the AEO 2002NEMS Commercial Sector Demand module output file‘KSDOUT’. Demand values are listed in Table 56. Over-all, commercial lighting (CL) constitutes the largest de-mand, followed by miscellaneous electric (CME) and com-mercial cooling (CC).
Demand calculationsEach row of the KSDOUT file contains the forecast of ser-vice demand for each year of the NEMS forecast period(1996-2020) that is satisfied by a particular type of equip-ment, for a particular service, in a particular area. The areadata covers the 9 census divisions and data for nationaltotals (Area 11). For our demands, we used the nationaldata. Table 57 shows a small portion of the output file.
To calculate the demand, service demand data by servicetype and energy carrier was summed up by year. The de-mands for each year (2005–2020) were then converted toMARKAL units using the conversion factors listed in Table58.
Demands by MARKAL model time horizonThe above calculations yield service demands matchingthe AEO 2002 time horizon for every year from 2000–2020. Values for 2000, 2005, 2010, 2015, and 2020 wereeach used for the corresponding MARKAL model years.For 1995, the percent change for years 2000 through 2005was calculated and used to adjust 1995 down from 2000.
Table 56. Commercial Sector Demand Values.
sdnameD stinU 5991 0002 5002 0102 5102 0202 5202 0302 5302CC JP 6421 3831 5351 5661 9971 7291 5602 3122 1732EC JP 853 994 207 588 6501 6911 3631 1651 9971HC JP 9811 8421 9231 0931 0541 6051 4651 4261 6861KC JP 521 831 151 261 471 581 791 012 422LC JP 9971 7791 7812 2632 6452 9172 5092 3013 4133
DMC JP 75 37 39 59 69 89 001 201 401EMC JP 839 5011 2031 2751 5881 5122 3062 8503 4953GMC JP 698 9401 8221 4231 0541 5261 1281 1402 7822LMC JP 98 88 78 39 99 501 111 811 521RMC JP 271 541 221 921 731 141 541 941 451
RC JP 532 852 282 103 913 533 253 073 983VC JP 36 07 77 48 19 89 601 411 321WC JP 445 206 766 427 387 048 109 769 7301
Table 55. Commercial Sector End-Use Demands.
emaN noitinifeDCC gniloocecapslaicremmoCEC tnempiuqeeciffodnaretupmoclaicremmoCHC gnitaehecapslaicremmoCKC gnikooclaicremmoCLC gnithgillaicremmoC
DMC leseiD-suoenallecsimlaicremmoCEMS cirtcele-suoenallecsimlaicremmoCGMC sag-suoenallecsimlaicremmoCLMC GPL-suoenallecsimlaicremmoCRMC leuflaudiser-suoenallecsimlaicremmoC
RC noitaregirferlaicremmoCVC noitalitnevlaicremmoCWC gnitaehretawlaicremmoC

42
Table 57. Sample portion of KSDOUT.
aerA ecivreS ygrenE epyT t v 6991 7991 8991 9991 000211 a gnitaeH cirtcelE weN pmuPtaeH tnerruC 685.0 616.0 506.0 436.0 236.011 gnitaeH cirtcelE tnemecalpeR pmuPtaeH tnerruC 8.1 138.1 456.1 137.1 157.111 gnitaeH cirtcelE tiforteR pmuPtaeH tnerruC 38.0 707.3 770.6 490.8 779.911 gnitaeH cirtcelE weN pmuPtaeH lacipyT 0 0 0 0 011 gnitaeH cirtcelE tnemecalpeR pmuPtaeH lacipyT 0 0 0 0 011 gnitaeH cirtcelE tiforteR pmuPtaeH lacipyT 0 0 0 0 011 gnitaeH cirtcelE weN pmuPtaeH .ffEhgiH 0 0 230.0 430.0 330.011 gnitaeH cirtcelE tnemecalpeR pmuPtaeH .ffEhgiH 0 0 122.0 741.0 671.011 gnitaeH cirtcelE tiforteR pmuPtaeH .ffEhgiH 0 0 192.0 386.0 589.0
a .TUODSKnislatotlanoitaNehtsi11aerA
For 2025-2035, the percent change was calculated for 2015-2020 and adjusted by time period.
10.3.5 Commercial Demand TechnologiesThere are 328 end-use technologies in the commercial sec-tor, broken down into 12 sub-categories. Within each sub-category are different technologies powered by a varietyof energy carriers at different efficiency levels. The sub-categories are:
Table 58. Commercial Sector Conversion Factors.
noisrevnoC ybdnameDylpitluMUTBQrepJP 650.5501
tfreputBfonoitazilamroN 3 nim/ 57003578.1nimulrepsttawfonoitazilamroN 37862710.0
sruohttawnoillibrepJP 635.13
The naming convention for the commercial sector end-usetechnologies is outlined in Table 59. The following areexamples of commercial end-use technology names:
CC01 Air Source heat pump for cooling – Installedbase
CC08 Air Source heat pump for cooling – 2010 highCK02 Range, Electric-induction, 4 burner, ovenCH10 Air source heat pump for heating – 2020 highCW21 Oil water heater – Installed baseCL01 Incandescent 1150 lumens, 75 wattsCR04 Central Rfg. Sys. w/ Ambient SubcoolingCV25 VAV 30,000 ft3/min Systme – 1995 High
gnitaeHecapSgnilooCecapS
gnikooCgnitaeHretaW
noitaregirfeRnoitalitneV
gnithgiL.piuqEretupmoCdnaeciffO
leseiD-suoenallecsiMcirtcelE-suoenallecsiM
GPL-suoenallecsiMleuFlaudiseR-suoenallecsiM
050842297355311111
Table 59. Commercial Sector End-Use Technology NamingConvention.
sretcarahC
noitpircseD1 3/2 gniniameR
rotceS yrogetaC derebmuNgnitsiL
C C 10 gniloocK gnikoocH gnitaehW gnitaehretawL gnithgilR noitaregirferV noitalitnevDM leseiD-.csimEM cirtcele-.csimGM sag-.csimLM GPL-.csimRM leuflaudiser-.csim
Heat pumps service two kinds of demands—heating andcooling—and have different efficiencies and capacity fac-tors for each of those demands. Therefore, two technolo-gies were created to model each heat pump. For example,CC03 is the 2000 typical air source heat pump for cooling,and CH03 is the 2000 typical air source heat pump forheating. The technologies are linked by constraints thatforce the model to invest in the appropriate amount of onewhen it buys the other. Capital costs and fixed operatingand maintenance costs for all heat pumps for cooling havebeen set to zero to avoid double counting.
10.3.6 Commercial Process TechnologiesProcess technologies convert one energy carrier into an-other. There are five process technologies in the commer-cial sector. Four of them are used for emissions accountingand will be explained in section 11.3, but the other one is
PNGALDCC = NGA to commercial through LDCs
A natural gas local distribution company does not earn aprofit on the buying and reselling of the natural gas itself.An LDC is allowed to earn a fair return on the money that

43
the LDC has invested in the system that delivers the gas tocustomers. Therefore, PNGALDCR has an investment cost(INVCOST) associated with it as well as variable operat-ing and maintenance costs (VAROM). These costs camefrom the 1997 DOE MARKAL database.
10.3.7 Commercial ParametersThis section describes the parameters used to characterizecommercial demand and process technologies in MARKALand the calculations required to transform source data intoMARKAL form. This is a summary of all parameters usedand is not meant to indicate that all technologies have eachof these parameters in their description.
UnitsAll costs are expressed in millions of 1995 dollars. All en-ergy quantities are expressed in petajoules. End-use de-mands for cooling, cooking, heating, water heating, andrefrigeration technologies are expressed in petajoules.Lighting services are measured in billion lumen years, andventilation services are measured in trillion cubic foot perminute (cfm)-hours.
EIA (2002f)—Technology Cost and Performance file forthe AEO2002 commercial model (KTECH File)Each record of the KTECH file provides specifications fora specific model of a specific technology in a specific Cen-sus Division. For the EPANMD, the technology data forRegion 4, West North Central, was chosen as representa-tive of national data. Data in the file that was used forMARKAL data includes First Calendar Year of Availabil-ity, Life, Capital Costs, Efficiencies, Operating and Main-tenance Costs, and Initial Market Shares.
Capacity Factor file (KCAPFAC)This AEO file is used by the Technology Choice subrou-tine of the National Energy Modeling System CommercialSector Demand Module. The file lists equipment capacityfactor values for each Census Division by building end
use demand type. The capacity factor is the ratio of actualannual equipment output to output if equipment were run100% of the time at full capacity.
Availability and utilization parametersCF: The Capacity Factor value for each Census Divisionby building type and end use demand was taken from theKCAPFAC file. Energy consumption data for each Cen-sus Division by building type and end use demand wastaken from the 1999 Commercial Buildings Energy Con-sumption Survey (CBECS). A national weighted averageCF for each end use demand was determined from thesevalues.
The calculated national average CF numbers by end useare:
Heating = 0.28Cooling = 0.17Water Heating = 0.44Ventilation = 0.85Cooking = 0.35Lighting = 0.42Refrigeration = 1.00
IBOND(BD): Specifies a user imposed bound on invest-ment in new capacity. As detailed in Table 60, this param-eter has been used to place an upper bound of zero, pre-venting investment in new capacity, for any technologiesonce they have been replaced by a new vintage on themarket. It has also been used to prevent investment in newcapacity for all “existing” technologies, which representresidual installed capacity at the beginning of the modelhorizon.
LIFE: The data for this parameter came directly from theKTECH file.
START: The data for this parameter came directly fromthe KTECH file.
Table 60. Commercial Sector IBOND example.
LAKRAM noitpircseDLAKRAM raeYtsaL 5991 0002 5002 0102 5102 0202 5202 0302 5302
21CC pmuptaehecruosdnuorGlacipyt0002-gniloocrof 0002 0 0 0 0 0 0 0
31CC pmuptaehecruosdnuorGhgih0002-gniloocrof 0002 0 0 0 0 0 0 0
41CC pmuptaehecruosdnuorGlacipyt5002-gniloocrof 5002 0 0 0 0 0 0
51CC pmuptaehecruosdnuorGhgih5002-gniloocrof 5002 0 0 0 0 0 0
61CC pmuptaehecruosdnuorGlacipyt0102-gniloocrof 5102 0 0 0 0
71CC pmuptaehecruosdnuorGhgih0102-gniloocrof 5102 0 0 0 0

44
Efficiency and cost parameters
EFF: The data for this parameter came directly from theKTECH file.
For CC, CH, CK, CW, and CR: The AEO efficiency dataare provided in units of British thermal units of output perBritish thermal units of input, and these values are con-verted to MARKAL units of petajoules output perpetajoules input.
For CL: Lighting efficiency data are provided in units oflumens per watt. These values were converted to billionlumen years per petajoule
For CV: Ventilation efficiency data are provided in unitsof 1000 cfm-hours per 1000 Btu. These values were con-verted to 1012 cfm-hours per petajoule.
For CMD, CME, CMG, CML, CMR: Efficiencies are as-sumed to be 1.
INVCOST: The data for this parameter came directly fromthe KTECH file.
For CC, CH, CK, CW, and CR: The AEO capital cost dataare provided in units of 2001 dollars per 1000 Btu/hr. Thesevalues were converted to units of millions of 1995 dollarsper petajoule per year.
For CL: Lighting capital cost data are provided in units of2001 dollars per 1000 lumens. These values were convertedto millions of 1995 dollars per billion lumens.
For CV: Ventilation capital cost data are provided in unitsof 2001 dollars per 1000 CFM. These values were con-verted to millions of 1995 dollars per trillion CFM per yr.
FIXOM: The data for this parameter came directly fromthe KTECH file. Operation and & maintenance cost dataare provided in the same units as the capital costs and re-quires the same conversions as the INVCOST.
Input and output parametersMA(ENT): In the Commercial sector, each technologiesuse one energy carrier, and therefore MA(ENT) is equal to1.0.
OUT(DM): For the Commerical sector, these units arepetajoules per petajoules. For all Commercial demand tech-
nologies, all of the energy activity of the technology con-tributes to a single end-use demand, and thereforeOUT(DM) equals 1.0.
Other MARKAL parametersCAPUNIT: The value is 1 for all commercial technolo-gies.
RESID: AEO 2002 market shares by technology type weretaken directly from the KTECH file. These market shareswere then applied to the 1995 service demands and dividedby the CF to calculate the total residual technology stockfor each technology in 1995. For all technology catego-ries, RESID values for subsequent years were calculatedusing straight line projections.
DISCRATE: Specifies user defined technology-specificdiscount rates (hurdle rates) to represent a perceived hesi-tation on investment. All currently available commercialtechnology has a discount rate of 0.18. All new commer-cial technology that departs from conventional technology,for example a higher efficient heat pump that would re-quire a greater up-front capital cost investment over tradi-tionally used technology, carries a discount rate of 0.44.
10.3.8 Commercial Energy CarriersSix energy carriers are used by the commercial sector end-use technologies. Electricity (ELC) is universal and goesto all sectors. For the five Commercial-specific carriers (seeTable 61), the first three letters of the name refer to the fueltype, the fourth letter is a ‘C’ for Commercial, and the finalletters indicate the path: EA = after emissions accountingand LDC = after passing through LDC (NGA only).
Table 61. Commercial Sector Energy Carriers.emaN noitinifeD
AECHSD snoissimeretfalaicremmocotlioleuFAECLSD snoissimeretfalaicremmocotleseiDAECGPL snoissimeretfalaicremmocotGPLAECAGN snoissimeretfalaicremmocotAGN
CDLCAGN CDLhguorhtlaicremmocotAGN
10.3.9 Commercial Emissions AccountingAll fuels with commercial specific emissions factors passthrough a “dummy” process technology which tracks emis-sions from a particular fuel type going to commercial tech-nologies. There are no costs associated with these “tech-nologies”. They simply have an incoming energy carrierand an outgoing energy carrier. As illustrated in Table 62,the first two letters of the names of these process technolo-gies are ‘SE’ for Emissions. The last three letters are ‘COM’for Commercial. The letters in-between represent the fuel

45
type. The emissions data assumptions and calculations areexplained in Section 11.
10.3.10 Commercial ConstraintsThere are 21 constraints in the commercial sector that areused to tie together the two technologies that were createdto describe each heat pump, one for space heating and onefor space cooling. The cooling capacity of a specific heatpump technology is subtracted from the heating capacityof the same heat pump with the fixed result of zero. Thisensures that if a technology is invested in for cooling, itwill also be used for heating. These constraints are abso-lute constraints and are named A_CHP1 through A_CHP21.
There are eight constraints in the commercial sector usedto apply specific fuel use splits to heating and water heat-ing technologies. The initial fuel use splits were taken fromthe AEO 2002 Table A5: Commercial Sector Key Indica-tors and Consumption, which is included here as Table 63.Splits are relaxed over time to allow the model more varia-tion in technologies to choose from.
Table 62. Commercial Sector Emission “Dummy” ProcessTechnologies.
emaN noitinifeDMOCHSDES laicremmocotleseiD:snoissimEMOCLSDES laicremmocotleseiD:snoissimEMOCGPLES laicremmocotGPL:snoissimEMOCAGNES laicremmocotAGN:snoissimE
These eight constraints are percentage splits, so the namebegins with S_. The second letter in the constraint namereflects the technology sector, which in this case is ‘C’ for‘Commercial’. The third letter represents the technology
Table 63. Commercial Space and Water Heating FuelSplits.
(QBtu per Year)
Delivered Energy Consumption by Fuel Year 2000 2000Space Heating %
Electricity 0.15 0.0798Natural Gas 1.5 0.7979
Distillate 0.23 0.1223Total 1.88
Water Heating Electricity 0.15 0.1705
Natural Gas 0.65 0.7386Distillate 0.08 0.0909
Total 0.88
AEO Table A5 Commercial Sector Key Indicators and Consumption
type and the fourth through seventh letters represent theenergy carrier. The fuel split constraints are listed in Table
64.
10.4 Transportation SectorThe transportation sector has eight sub-sectors: Light DutyVehicles (LDV), Heavy trucks, Buses, Non-Highway, Air,Passenger rail, Freight rail, and Waterborne transport.
10.4.1 Transportation Data SourcesData for the set of light duty vehicles were extracted fromthe 2003 Quality Metrics Report (DOE, 2003). The Qual-ity Metrics Report is published annually by DOE under aCongressional mandate. These data were supplemented bydata from Transportation Energy Data Book: Edition 21(Davis, 2001), prepared on an annual basis by Oak RidgeNational Laboratory, and from the Annual Energy Outlook2002 (EIA, 2002d). Data for heavy trucks and buses wasderived from draft Climate Change Action Report (CCAR)data (2001). Data for other forms of transport, includingair, ship, and rail, was retained from the 1997 DOEMARKAL database.
10.4.2 Transportation Assumptions1.Five classes of personal vehicles (LDVs) are repre-
sented: compacts, full-size, minivans, pick-up trucks,and sports utility vehicles (SUV). Market shares forthese classes are exogenously determined based on theprojections by AEO 2002 (EIA, 2002d) and cannot bechanged from scenario to scenario. They are fixed at25%, 27%, 7%, 20%, and 21%, respectively.
2.Average vehicle miles traveled (VMT) per year pervehicle are fixed at their 1995 values of 11,203 forcars and 12,018 for trucks and SUVs. All data are fromDavis (2001), Tables 7.1 and 7.2.
3.Heavy trucks are those greater than 26,000 pounds(Classes 7 and 8). Medium trucks (10,000–26,000pounds), which consume less than five percent of totalhighway energy use, are omitted from this study.
Table 64. Commercial Space and Water HeatingConstraints.
emaN noitinifeDHSDHC_S gnitaeh-tilpsleuflioleuFCLEHC_S gnitaeh-tilpsleufyticirtcelEAGNHC_S gnitaeh-tilpsleufsaglarutaN
CNILC_S tilpsleufgnithgiltnecsednacnIGAMLC_S tilpsleufgnithgilcitengaMHSDWC_S gnitaehretaw-tilpsleuflioleuFCLEWC_S gnitaehretaw-tilpsleufyticirtcelEAGNWC_S gnitaehretaw-tilpsleufsaglarutaN

46
Process TechnologiesEnergy carriers
Energy carriers
constraints
emissions
Demand Technologies Energy carriers End-Use Demands
Figure 34. Transportation Sector RES.
10.4.3 Transportation RESThe Transportation Sector RES, illustrated in Figure 34,consists of demand technologies that are capable of meet-ing end-use demands. Prior to the demand technologiesare a number of process technologies that make transpor-tation ready fuel (i.e., the mixing of ethanol and gasolineto make E85 fuel). Emissions for transportation are trackedat the demand technology.
10.4.4 Transportation End-Use DemandsThe transportation sector is characterized by seven end-use demand technologies, listed in Table 65. Demands arederived from the 1997 DOE MARKAL database with aratio adjustment based on the changes in transportation usefrom 1998 to 2002 predicted by the AEO.
Demand calculationsA ratio of use by transportation demand type was calcu-lated using EIA (1998) Table 32 (Assumptions to the AEO1998) and EIA (2002c) Table 33, Transportation EnergyUse by Mode and Type. For example, Table 32 of EIA(1998) lists the use of water transport for year 2000 at 1501
Table 65. Transportation Sector End-Use Demands.
emaN noitinifeDAT tropsnartriABT tropsnartsuBHT )bl000,01nahtretaerg(skcurtyvaeHLT sVDL-evitomotualanosreP
1RT liarybsecivresthgierF2RT liarybsecivresregnessaP
ST secivresygreneeniraMOT rehtonoitatropsnarT
Table 66. Transportation Sector Demands.
dnameD stinU 5991 0002 5002 0102 5102 0202 5202 0302 5302AT selimregnessapnoillib 843 374 935 066 397 358 589 9311 6031BT delevartselimelcihevnoillib 01 9 9 01 11 11 11 11 21HT delevartselimelcihevnoillib 022 272 713 073 124 964 125 085 446LT delevartselimelcihevnoillib 7222 0432 9562 1892 8133 1363 0793 0434 5474
1RT selimnotnoillib 521 141 751 761 971 591 112 032 8422RT delevartselimelcihevnoillib 52 52 82 13 43 83 14 54 05
ST selimnotnoillib 361 002 381 771 571 371 371 371 371OT JP 7502 5722 5252 9482 5413 5933 9063 7483 2014
trillion Btu. Table 33 of EIA (2002c) lists the year 2000use of water transport at 1713 trillion Btu, creating a ratioof 1.14. This ratio was then applied to the 1997 DOEMARKAL database demand for water transport of 176 bil-lion ton miles to calculate the revised demand of 200 bil-lion ton miles shown in Table 66.
Off-highway transportationOff-highway transportation covers a wide range of sec-tors, including agriculture, industrial & commercial, con-struction, personal & recreational, and other. According toDavis and Diegel (2004) (Table 2.8), off-highway gaso-line consumption increased from 5797 million gallons in1997 to 5870 million gallons in 2001 at a rate of 0.31% peryear. On the other hand, diesel consumption increased from9424 million gallons in 1997 to 10596 million gallons in2001 at a rate of 2.97% per year. The projected off-high-way gasoline and off-highway diesel consumption is pro-jected to grow at 0.18% and 4.08% per year, respectivelybetween 2000 and 2005. At these rates, off-highway gaso-line and diesel consumption is projected to increase by 1.08and 6.0 times, respectively, between 2005 and 2050. It wasdecided for EPANMD use that the projection for dieselconsumption to 2050 should be adjusted downward. There-fore, off-highway diesel consumption was correlated withGDP projections, and the resulting diesel consumption isprojected to growth by 2.5 times between 2005 and 2050.
10.4.5 Demand TechnologiesThere are 349 end-use technologies in the transportationsector. They are broken down into subcategories as fol-lows:

47
The first character in the names of transportation demandtechnologies is a “T.” The second character identifies thesubcategory, which is “L” for light duty vehicles (LDVs)as shown in Table 67. The following are examples of LDVend-use technologies.
TLECGSL — Car, gasoline, existing fleet of compactsTLCCONV15 — Car, gasoline, conventional, compacts
(2015 technology)TLCADSL25 — Car, advanced diesel, compact (2025
technology)TLFMMPG15 — Car, gasoline, moderate miles per gal-
lon for full size (2015 technology)TLS2HYB30 — SUV, hybrid, twice the gas mileage of
conventional SUV (2X) (2030 technology)TLMMTHX00 — Minivan, flex methanol (2000 tech-
nology)TLPADSL05 — Pickups and large vans, advanced die-
sel (2005 technology)
For heavy duty vehicles, the second letter is “H.” The nextthree to four letters represent the fuel type and the finaltwo letters represent the model year as illustrated in Table68. Diesel trucks are also divided up into efficiency im-provements represented as follows:
10P = 10% efficiency improvement,
selcihevytudthgiLskcurtyvaeH
sesuBriA
tropsnartcilbuPliaRpihS
yawhgih-ffO
213510123322
Table 67. Naming Convention for Light Duty Vehicle Demand Technologies.noitpircseDdnarebmuNretcarahCemaN
1 2 3 4 5 6 7 laniF
rotceS thgiLytuD
raCssalC noitpircseD epyTygolonhceT noitpircseD rYledoM
T L E VDLgnitsixe C O N V lanoitnevnoc 00C VDLtcapmoc M M P G gpmetaredom 50F VDLezis-lluf A M P G gpmdecnavda 01S VDLVUS A D S L leseiddecnavda 51M VDLnavinim 2 H Y dirbyhX2 02P VDLpu-kcip 3 H Y dirbyhX3 52
E T H X leufxelflonahte 03M T H X leufxelflonahtem 53C N G detacidedGNCC N G X leufibGNCE L C cirtceleF C H negordyh-llecleufF C G enilosag-llecleufF C M lonahtem-llecleufL P G X leufibGPL
20P = 20% efficiency improvement, and40P = 40% efficiency improvement.
The second letter in the demand technology name for busesis “B.” The remaining letters and numbers follow the sameconvention as the heavy trucks, as illustrated in Table 69.
Table 68. Naming Convention for Heavy Duty VehicleDemand Technologies.
emaN noitinifeD00LSDHT 0002-leseiD,yvaeh,kcurT
00P02LSDHT 0002-gpm%02+leseiD,yvaeh,kcurT00P04LSDHT 0002-gpm%04+leseiD,yvaeh,kcurT
LSDEHT teelfleseiDgnitsixe,yvaeh,kcurTLSGHT enilosag,yvaeh,kcurT
LSGEHT teelfenilosaggnitsixe,yvaeh,kcurTGNCHT saglarutandesserpmoc,yvaeh,kcurTCLAHT leuflohocla,yvaeh,kcurTGPLHT GPL,yvaeh,kcurT
01LSDHT 0102-leseiD,yvaeh,kcurT01P01LSDHT 0102-gpm%01+leseiD,yvaeh,kcurT01P02LSDHT 0102-gpm%02+leseiD,yvaeh,kcurT
02LSDHT 0202-leseiD,yvaeh,kcurT02P01LSDHT 0202-gpm%01+leseiD,yvaeh,kcurT02P02LSDHT 0202-gpm%02+leseiD,yvaeh,kcurT
Table 69. Naming Convention for Bus DemandTechnologies.
emaN noitinifeDLSGBT enilosag,suB
P01LSGBT gpm%01+enilosag,suBP02LSGBT gpm%02+enilosag,suB
LSGEBT teelfenilosaggnitsixe,suBLSDBT leseiD,suB
P01LSDBT gpm%01+leseiD,suBP02LSDBT gpm%02+leseiD,suB
LSDEBT teelfleseiDgnitsixe,suBGNCBT saglarutandesserpmoc,suBCLABT leuflohocla,suB

48
10.4.7 Transportation ParametersThis section describes the parameters used to characterizetransportation demand and process technologies inMARKAL and the calculations required to transform thesource data into MARKAL form. This is a summary of allparameters used and is not meant to indicate that all tech-
Table 70. Naming Convention for Air Transport DemandTechnologies.
Table 71. Naming Convention for Shipping DemandTechnologies.
Table 72. Naming Convention for Public TransportationDemand Technologies.
Table 73. Naming Convention for Rail DemandTechnologies.
Figure 35. Transportation “Dummy” Collector ProcessTechnologies.
Table 74. Transportation Sector Process Technologies.
emaN noitinifeD10AT regnessaptej,enalpriA20AT noitaivalareneg,enalpriA
emaN noitinifeDLSDST leseiD,tropsnartretaWHSDST liolaudiser,tropsnartretaW
emaN noitinifeDTPCLEPT yticirtceleybderewoptisnartcilbuPRCCLEPT yticirtcele,liarretummoCRCLSDPT leseiD,liarretummoC
emaN noitinifeDTPCLEPT yticirtceleybderewoptisnartcilbuPRCCLEPT yticirtcele,liarretummoCRCLSDPT leseiD,liarretummoC
Table 70 illustrates the naming convention for air trans-port, Table 71 for shipping, Table 72 for public transporta-tion, and Table 73 for Rail.
10.4.6 Transportation Process TechnologiesThere are 19 process technologies in the transportationsector. Six of these are simply “dummy” collector processtechnologies used to collect fuels going to the transporta-tion sector as illustrated in Figure 35. The other 13 pro-cess technologies are used to transform certain fuelsfor use in bi-fuel and flex-fuel vehicles AND aremapped out in Table 74.
DSH DSHTSCDSHT
DSL DSLTSCDSLT
GSL GSLTSCGSLT
MTH MTHTSCMTHT
LPG LPGTSCLPGT
ETH ETHTSCETHT

49
nologies have each of these parameters in their descrip-tion.
UnitsDemand for light duty transport, heavy trucks, and busesis expressed in billions of vehicle miles traveled (bvmt).Capacity is expressed in billions of vehicle miles traveledper annum (bvmt/a). Activities for air passenger services,commuter rail, and intercity passenger rail are expressedin billions of passenger miles traveled (bpmt), and capaci-ties are expressed in billions of passenger miles traveledper annum. Activities for freight services by intercity railand water borne modes are measured in billions of tonmiles, and capacities in billions of ton miles per annum.
Light duty vehicle capital cost and efficiency data weretaken from the following sources.Quality Metrics Report 2003 (QM2003CPatterson et al.,2002):
• Conventional• Advanced diesel• Hybrid with twice the miles per gallon fuel consump-
tion of the conventional vehicle of the same type (2X)• Hybrid (3X)• Flex ethanol• CNG dedicated• Electric• Fuel cell, hydrogen• Fuel cell, gasoline
Annual Energy Outlook 2002 (EIA, 2002d):• Flex methanol• CNG Bi-fuel• LPG Bi-fuel
DeCicco et al. (2001):• Gasoline, moderate miles per gallon improvements• Gasoline, advanced miles per gallon improvements
Availability and utilization parametersCF: All vehicles are assumed to be used at a fixed averageannual capacity, so CF values are simply set to 1.
IBOND: This parameter has been used to place an invest-ment upper bound of zero, preventing investment in newcapacity, on all technologies once a new vintage year forthat technology becomes available. It has also been usedto prevent investment in new capacity for all “existing”technologies, which represent residual installed capacityat the beginning of the model time horizon. An example ofhow this parameter is used is shown in Table 75.
LIFE: Values for light duty vehicles were taken from Table6.10 of AEO2002 (Davis, 2001). All LDVs are assumed tohave a lifetime of 15 years. Values for heavy trucks weretaken from Table 6.11 of Davis, 2001. Values for buseswere taken from the draft Climate Change Action Report(CCAR) data (draft of U.S. GCRIO, 2002).
START: For transport technologies, the start year repre-sents the assumed first year of commercial availability (nottechnical viability) of a technology. For this initial efforton transport, the start date was taken from each of the pri-mary sources for a given technology characterization. Startyear data for heavy trucks and buses was taken from draftCCAR data.
Efficiency and cost parametersEFF: Light duty vehicle efficiencies are expressed in bil-lions of vehicle miles traveled per petajoule of energy in-put. As with INVCOST, new vehicle efficiency data fromsources other than QM2003 was taken in the form of ratiosof alternative technology efficiencies to conventional ve-hicle efficiencies which were then applied to the QM2003-derived conventional vehicles. The conversion from effi-ciencies in source units of miles per gallon gasoline equiva-lent to MARKAL units is
Table 75. Transportation IBOND Example.
LAKRAM noitpircseDLAKRAM 5991 0002 5002 0102 5102 0202 5202 0302 5302
01GPMMCLT ,gpmetaredom,enilosag,raC0102-tcapmoc 0 0 0 0 0
51GPMMCLT ,gpmetaredom,enilosag,raC5102-tcapmoc 0 0 0 0
02GPMMCLT ,gpmetaredom2,enilosag,raC0102-tcapmoc 0 0 0
52GPMMCLT ,gpmetaredom,enilosag,raC5202-tcapmoc 0 0
03GPMMCLT ,gpmetaredom,enilosag,raC0302-tcapmoc 0

50
Because efficiencies for gasoline vehicles have beenbroadly constant within size classes since 1990, EFF forexisting gasoline vehicles was set equal to the value forthe “Conventional” vehicle in each size class. Efficienciesfor existing diesel cars and light trucks were taken fromAEO 1997 Supplemental Table 46, Summary of New Light-Duty Vehicle Size Class Attributes (EIA, 1997b). Efficien-cies for methanol fuel cell vehicles were set equal to thatfor gasoline fuel cell vehicles in the same size class.
All values given by the data sources are EPA rated effi-ciencies. Efficiencies were adjusted to on road efficienciesusing the AEO 2002 fuel efficiency degradation factorsfrom Assumptions to AEO 2002, Table 29, Car and LightTruck Degradation Factors, (EIA, 2002c). Degradationfactors are used by the AEO to convert EPA-rated fueleconomy to actual “on the road” fuel economy. It takesinto account three factors: increases in city/highway driv-ing, increasing congestion levels, and rising highwayspeeds. The average degradation factors for cars are 0.74in 2000 and 0.81 in 2025. For light trucks the value is 0.8.
Efficiency data for heavy trucks and buses were derivedfrom draft CCAR data, expressed in miles per gallon gaso-line equivalent. These values were transformed toMARKAL units of billion vehicle miles traveled perpetajoule as described above for light-duty vehicles.
INVCOST: For light duty vehicles, investment costs referto the average price that a consumer would pay for a ve-hicle.
Investment cost data from the QM2003 (Patterson, et al.,2002) were taken as given in Table A-30 and transformedas described below. To eliminate differences that could beintroduced from different sources using different charac-terizations of conventional vehicles, values from othersources were converted into ratios of purchase price foralternative technologies to purchase price for the conven-tional vehicle in that size class. These ratios were then ap-
wherempgt = miles per gallon, from source data,
= million Btu per gallon of fuel, and
= petajoules per million Btu.
plied as multipliers to the conventional vehicle data de-rived from QM2003.
These sources provide investment costs in thousands ofdollars per vehicle. These values are translated to the aver-age cost in millions of 1995 dollars per billion vehicle milestraveled per annum capacity as described above usingmeasures of average vehicle miles traveled by vehicle typeextracted from Davis, 2001 Tables 7.1 and 7.2. These av-erage vehicle miles traveled values are for 1995, and in thebase EPANMD are assumed to be constant over the fore-cast horizon. (The user may choose to assume differentaverage vmt measures by vehicle type over time and exog-enously recalculate these measures based on those assump-tions.)
The following relationship illustrates the calculation ofINVCOST.
wheredeflator = appropriate GDP implicit deflator,costv = purchase price of a given vehicle type, v,
from source data in thousands od dollars, andvmt/av = average measure of vehicle miles trav-
eled per year for a given vehicle type, v.
INVCOSTs for “existing” vehicles are set identical to thosefor “conventional” vehicles in each size class in the year2000. INVCOST for existing diesel cars and light trucks isset to 1.07 times that for existing compact and pickup, re-spectively. This value is the 1996 average ratio of diesel togasoline new vehicle purchase price in AEO 1998 Table50 (the first year this table was published). Because theseare RESID vehicles and new investment is prohibited, thisparameter does not affect model results and indeed is notused by the model for standard MARKAL runs.
Investment cost data for heavy trucks and buses were de-rived from draft CCAR data, expressed in 1999 dollars pervehicle. These values were converted to MARKAL unitsof millions of 1995 dollars per bvmt per annum using afixed average yearly VMT as described above for light-duty vehicles.
FIXOM: Fixed operating and maintenance (O&M) costsordinarily refer to those expenses which do not vary withlevels of activity or use. However, because all light dutyvehicles are assumed to be used at a fixed yearly activity
EFFmpg
MMBTUgal
PJMMBTU
bvmt PJt=×
× =−10 9
INVCOST deflatort
vmt amil bvmt av
v= × × =
cos. $
1010
19959
3
MMBTUgalPJ
MMBTU

51
level, FIXOM costs may also include those which may bethought of as varying with activity levels. For example,fixed O&M for personal transport would include routinemaintenance such as oil changes, tune-ups, licensing feesand emissions tests, and routine insurance.
Data for most vehicle types were taken from the QualityMetrics reports as described above for INVCOST. To main-tain compatibility of costs across vehicle types, FIXOMvalues for other vehicle types were set equal to those ofQuality Metrics-derived vehicles:
• Flex methanol = Flex ethanol,• CNG Bi-fuel = CNG dedicated,• LPG Bi-fuel = CNG dedicated,• Fuel Cell – methanol = Fuel cell – gasoline,• Gasoline, moderate MPG improvements = Conven-
tional,• Gasoline, advanced MPG improvements = Conven-
tional.
Fixed O&M values are converted to millions of 1995 dol-lars per billion vehicle miles traveled per annum as de-scribed above for INVCOST and illustrated in the rela-tionship
whereO&Mv = fixed O&M costs for a given vehicle type,
v, from source data.
Fixed O&M cost data for heavy trucks and buses werederived from draft CCAR data, expressed in 1999 dollarsper vehicle. These values were transformed to MARKALunits of millions of 1995 dollars per vehicle miles traveledper annum using a fixed average yearly VMT as describedabove for light-duty vehicles.
Input and output parametersMA(ENT): These types include (1) conventional gasoline,with existing and improved emissions controls; (2) diesel;(3) methanol, E85, and M95; (4) CNG and LPG; (5) elec-tric; and (6) hydrogen. For dedicated, single-fuel vehicles,the value of this parameter is set to 1, and the energy car-rier used is specified. For flexible and bi-fuel vehicles, anextra layer of process technologies is set up before the ve-hicles to allow the vehicle stock to use varying fractions ofthe permissible fuels:
• Flex ethanol – E85 and gasoline,• Flex methanol – M95 and gasoline,
FIXOM deflatorO Mvmt a
mil bvmt av
v= × × =
&. $
1010
19959
6
• CNG bi-fuel – CNG and gasoline, and• LPG bi-fuel – LPG and gasoline.
OUT(DM): All light-duty vehicles service the demand TL,light duty vehicle transport.
Other MARKAL parametersCAPUNIT: Activities for all light duty vehicles are mea-sured in billions of vehicle miles traveled and capacitiesare measured in billions of vehicle miles traveled per an-num, so CAPUNIT is set to 1.
RESID: RESID values are specified for the following light-duty vehicles:
• Car, gasoline, existing fleet of compacts,• Car, diesel, existing fleet of full size,• Car, gasoline, existing fleet of full size,• SUV, gasoline, existing fleet,• Minivan, gasoline, existing fleet,• Pickup trucks and large vans, gasoline, existing fleet,
and• Light truck, Diesel, existing fleet.
RESID values for 1995 are based on billion vehicle milestraveled in 1995, taken from Edition 21 of the Transporta-tion Energy Data Book (Davis, 2001), Tables 7.1 and 7.2.Total miles traveled were apportioned by fuel type usingshares of total vehicle miles traveled derived fromAEO1997 (EIA, 1997b) Supplemental Table 47. Becausethe fleet was assumed to be at the midpoint of its lifespanon average, sales shares from 1990 were used to apportionmiles traveled among size classes (Edition 21 of the Trans-portation Energy Data Book Tables 7.5 and 7.6). Straightline projection was used to determine RESIDs for latermodel years.
RESID values are specified for the following heavy trucksand buses:
• Truck, heavy, existing diesel fleet,• Truck, heavy, existing gasoline fleet,• Truck, heavy, LPG,• Bus, existing gasoline fleet,• Bus, existing Diesel fleet,• Bus, compressed natural gas, and• Bus, alcohol fuel.
RESID values for 1995 are based on billions of vehiclemiles traveled in 1995 or the nearest available year. Forheavy trucks, this value (1997) is taken directly from Edi-

52
tion 21 of the Transportation Energy Data Book Table 8.6.Total miles traveled were apportioned by fuel type usingshares of energy consumption by fuel taken from Edition21 of the Transportation Energy Data Book Table 2.4.
For buses, billions of vehicle miles traveled was availableonly for transit buses, taken from Edition 21 of the Trans-portation Energy Data Book Table 8.12. Miles traveled forschool and intercity buses were imputed from transit busbillions of vehicle miles traveled using ratios of energyconsumption for transit, school, and intercity buses takenfrom Edition 21 of the Transportation Energy Data BookTables 8.12 and 8.13. Values for all three bus types werethen summed to get total bus billions of vehicle miles trav-eled. As with heavy trucks, total miles traveled were thenapportioned by fuel type using shares of energy consump-tion by fuel taken from Edition 21 of the TransportationEnergy Data Book Table 2.4.
Straight line projection was used to determine RESIDs forlater model years.
10.4.8 Transportation Energy Carriers
Ten energy carriers go to the transportation sector end-usetechnologies. One of them, electricity (ELC), is universaland goes to all sectors.
10.4.9 Transportation Emissions AccountingThe emissions are tracked a little differently in the trans-portation sector than in the residential and commercial sec-tor. Whereas in those sectors the emissions were trackedthrough a “dummy” process technology for each fuel typegoing to those sectors, in the transportation sector the emis-sions are tracked individually for each of the technologies.
10.4.10 Transportation ConstraintsThere are five constraints in the transportation sector thatare used to apply specific car class splits to light duty ve-hicle demands. The splits were taken from Transportation
Table 76. Transportation Sector Energy Carriers.emaN noitinifeD
CLE yticirtcelEFTJ leufteF59M leuf59M
XHTM selcihevxelfenilosag/59MrofleuF58E leuf58E
LTHTE noitatropsnartotlonahtEXHTE selcihevxelfenilosag/58ErofleuFXGPL selcihevxelfenilosag/GPLrofleuF
LTGNC noitatropsnartotGNCXGNC selcihevleuf-ibenilosag/GNCrofleuF
Energy Data Book, Edition 21 (Davis, 2001) Table 7.5,Period Sales, Market Shares, and Sales Weighted FuelEconomies of New Domestic and Import Automobiles,Selected Sales Periods, 1976-2000. The percentage of to-tal sales in units was calculated for compact cars, full sizecars, SUVs, minivans, and pickups.
These constraints are percentage splits so their names be-gin with S_. The second and third letters in the constraintname are ‘TL’ for light duty transportation. The fourth let-
ter represents the car class. The fuel split constraints withtheir values are listed in Table 77.
10.5 Industrial SectorThe industrial sector was developed based on the UnitedStates region of the U.S. EIA’s System for Analysis of Glo-bal Energy Markets (SAGE) model (EIA, 2003a), used byEIA to produce their International Energy Outlook 2002.SAGE model data were recalibrated to the EPA MARKALmodel base year of 1995. The reader is referred to the EIA-DOE documentation of the SAGE model for a completedescription of the industrial module. See the Section 2 fora general description of the model and Section 5 for detailson the industrial sector in EIA, 2003a.
10.5.1 Industrial Data SourcesOriginal data for industrial sector technologies were takenfrom the EIA SAGE database; from Energy Statistics:OECD and Non-OECD Countries, and Energy Balances:OECD and Non-OECD Countries (IEA, 2003); from theEIA’s 1998 Manufacturing Energy Consumption Survey(MECS) (EIA, 1998c); from the EIA’s International En-ergy Outlook 2002 (EIA, 2002g); from EIA’s National En-ergy Modeling System (NEMS) input data; from UnitedNations, “Statistical Yearbook (45th edition)” (UN, 1999);and from technical judgment by EIA modelers and Sci-ence Applications International Corporation (SAIC), con-sultants to EIA.
IEA Data contains data for the different industries, the othernon-specified energy uses and the non-energy uses:
• IRONSTL: Iron and steel• NONFERR: Non ferrous metals
Table 77. Transportation Car Class Percentages.emaN noitinifeD egatnecreP
CLT_S tilpsractcapmoC 52FLT_S tilpsracezis-lluF 72MLT_S tilpsnaviniM 02PLT_S tilpspukciP 7SLT_S tilpsVUS 12

53
• CHEMICAL: Chemicals• PAPERPRO: Paper products• NONMET: Non metal materials• OTHER: Others industries (not from IEA but calcu-
lated)• TOTIND: Total industry sector• NECHEM: Feedstocks in petrochemicals• ONONSPEC: Other non-specified• NEINTREN: Non energy uses in industries• NEOTHER: Non energy uses in other sectors
10.5.2 Industrial RESUnlike most of the end-use sectors in the EPA MARKALmodel, which consist of an end-use service demand layerand a layer of technologies that compete to service thosedemands, the industrial sector has a three layer structureconsisting of one end-use demand layer and two technol-ogy layers. The RES for the industrial Sector is shown inFigure 36.
10.5.3 Industrial End-Use DemandsThere are seven industrial end-use demands, listed in Table78.
constraints
emissions
Process TechnologiesEnergy carriers
Energy carriers Demand Technologies Energy
carriers End-Use Demands
Figure 36. Industrial Sector RES.
• Chemicals,• Iron and steel,• Non-ferrous metals,• Non-metal minerals,• Pulp and paper, and• Other industries (including transport equipment, ma-
chinery, mining, food and tobacco, construction, andtextiles).
• Non-energy
The end-use demands are denoted in units of millions oftons, representing the physical output of the subsector, orpetajoules, representing the total energy requirements.
Demand data, detailed in Table 79, are derived from theIEA database (IEA, 2003) and from UN, 1999, and valuesare projected using the EIA’s International Energy Out-look 2002 (EIA, 2002g).
10.5.4 Industrial Demand Technologies.The end-use demands are directly serviced by the first tech-nology layer, which is a layer of dummy demand tech-nologies representing the relative contributions of variousenergy services—including process heat, steam, machinedrive, electrochemical, feedstock, and other—to the out-put (tons) or total energy requirements (petajoules) of theindustry. Each end-use demand is serviced by only onedummy technology at any one time. However, this tech-nology may change over time, representing structuralchange in the industry. In the current database, these tech-nologies do not change over time.
Table 78. Industrial Sector End-Use Demands.
emaN noitinifeDSII leetsdnanorIFNI slatemsuorrefnoNHCI slacimehCPLI repapdnapluPMNI slarenimlatemnoNIOI seirtsudnirehtOOEN sesuygrenenonrehtodnalairtsudnI
Table 79. Industrial Sector Demand Values in the EPANMD.
dnameD stinU 5991 0002 5002 0102 5102 0202 5202 0302 530200I JP 0 1 1 1 1 1 1 1 1
SII sennotnoillim 09 69 201 011 911 721 631 441 251FNI sennotnoillim 7 7 8 8 9 01 11 21 31HCI JP 7538 9869 33211 79721 58041 16351 35661 98771 27781PLI sennotnoillim 08 58 98 69 301 901 611 221 721MNI JP 9651 2661 1671 7681 7691 4602 8512 9322 8032IOI JP 8276 3937 4218 8609 0899 82901 83911 57821 43731OEN JP 5063 6373 2783 1004 9014 3124 6134 5044 1844

54
There are six “dummy” demand technologies, listed inTable 80.
Table 81 lists the relative contributions of various energyservices.
10.5.5 Industrial Process TechnologiesThe second technology layer consists of the actual processtechnologies that provide these energy services. Many tech-nologies, fueled by many different fuels, compete to pro-vide the inputs to the first technology layer. For example,machine drive to the pulp and paper industry is suppliedby the following set of technologies:
• Coal existing• Distillate oil new
Table 80. Industrial Sector Demand Technologies.emaN noitinifeD
590SII leetsdnanorI590FNI slairetamsuorrefnoN590HCI slacimehclairtsudnI590PLI repapdnapluP590MNI slatemnoN
590IOI lairtsudnirehtO
• Distillate oil existing• Electric new• Electric existing• Electric high efficiency• Electric improved efficiency• Heavy oil new• Heavy oil existing• LPG existing• Natural gas new• Natural gas existing
Currently these technologies are very abstract, linking fu-els to services. Only a few improved and high efficiencytechnologies are available. However, this structure is veryflexible and could allow a user with sufficient data to char-acterize physical technologies of interest to include suchtechnologies at this level of the structure. There are 289 ofthese process technologies in the industrial sector.
The naming convention for the industrial sector is illus-trated in Table 82.
Table 81. Industrial Sector Demand Tech Energy Needs.yrtsudnI -ortcelE
lacimehclairtsudnIskcotsdeef
enihcaMsevirD
lairtsudnIrehtO
ssecorPtaeH
lairtsudnImaetS
slacimehC 10.0 24.0 80.0 12.0 41.0 41.0
leetsdnanorI 80.0 62.1 42.1 60.3 80.7 19.0
repapdnapluP 36.5 29.32 39.1 75.1
suorrefnoN 98.34 72.1 44.11 31.84 53.7
slatemnoN 70.0 61.0 57.0 20.0
rehtolairtsudnI 10.0 91.0 26.0 31.0 40.0
Table 82. Industrial Sector Naming Convention.
noitpircseDdnarebmuNretcarahCemaNepyTygolonhceT rotceSlairtsudnI reirraCygrenE raeY
1 2 noitpircseD 3 4 5 6 7 01,9,8I E lacimehcortcele C H lacimehc B I O ssamoib 590
F kcotsdeef I S leetsdnanori B F G sagecanruftsalb 000
M sevirdenihcam L P repapdnaplup C O A laoc
O rehto N F suorrefnon C O K ekoc
P taehssecorp N M latemnon D S T etallitsid
S maets O I rehto E L C cirtcele
E L H cirtcele.ffehgih
E L I cirtcele.ffedevorpmi
E T H enahte
H E T taeh
H F O lioleuf
L P G GPL
N A P ahthpan
N G A AGN
P T C ekocmuelortep

55
Examples of industrial process technologies areIELPELC095 Electrochemical process pulp and paper
electric, existingIFCHETH095 Technology to convert ethane to non-
energy petrochemicalIFCHNGA095 Technology to convert natural gas to
non-energy, existingIMCHELH000 Machine drive chemicals electric, high
efficiencyIMISCOA095 Machine drive iron and steel coal,
existingIMLPLPG095 Machine drive pulp and paper LPG,
existingIONFCOA000 Other nonferrous metals coal, newIONMDST095 Other nonmetals distillate oil, existingIPLPBIO095 Process heat pulp and paper biomass,
existingIPNFCOK095 Process heat nonferrous metals coke,
existingISCHHET095 Steam chemicals heat, existingISISNGA000 Steam iron and steel natural gas, newISNFDST000 Steam non-ferrous metals distillate oil,
new
In addition, there are process technologies, listed in Table83, that represent “dummy” processes that simply “con-vert” (or rename) energy carriers into industrial energycarriers. The remaining are process technologies that sat-isfy demand technology needs.
Table 83. Industrial Sector “Dummy” Process Technologies.
ssecorP noitpircseDgnimocnI
ygrenEreirraC
noitcarfgniogtuO
ygrenEreirraC
590GFBDNI sagecanruftsalB TEMC 8.0 GFBDNIAEIAOC 2.0
590OIBDNI sleufoiB 0-DWOIB 1 OIBDNI590AOCDNI laoC AEIAOC 1 AOCDNI590KOCDNI ekoC EKOC 1 KOCDNI590CLEDNI yticirtcelE CLEDNI590HTEDNI enahtE TSDFP 1 HTEDNI590TEHDNI taeH TEHDNI590OFHDNI lioleufyvaeH AEIHSD 1 OFHDNI590DYHDNI ordyH 0-ORDYH 1 DYHDNI590GPLDNI GPL AEIGPL 1 GPLDNI590PANDNI ahthpaN TSDFP 1 PANDNI590AGNDNI AGN AEIAGN 1 AGNDNI590CUNDNI raelcuN 0-RWLCUN 1 CUNDNI
590LIODNI muelortePdenifeR AEILSD 58.0 LIODNIILSG 51.0
590CTPDNI ekocmuelorteP CSIMEN 1 CTPDNI590LOSDNI raloA 0-RALOS 1 LOSDNI590NIWDNI dniW 0-NIW 1 NIWDNI
10.5.6 Conversion TechnologiesAuto-production of ELC has been allocated to the indus-trial sector. These technologies, listed in Table 84, produceelectricity for use in the industrial sector.
The CHP processes refer to all electricity production andto heat production only if the heat is sold to third parties.In case of a CHP plant that is owned by a refinery or apetrochemical industry, the CHP line does not cover theheat production or the fuel use for this heat production.Consequently, auto-production of electricity and heat hasbeen directly allocated to industry and refinery, based onsome exogenous assumptions needed to recalculate the fueluse and heat production from CHP. It is not easy to recon-struct the fuel use and heat production by CHP from thesedata because there is no fixed power to heat ratio. Conse-quently, only heat sold to third parties can be calibrated tothe IEA database. In order to model the fuel use and heatproduction by industrial CHP from these data, the follow-ing assumptions have been made:
• Inputs and outputs of auto-CHP, as provided by IEA,were shared between sectors (exogenous ratios), in-cluding refineries.
• Heat production associated with electricity production,as provided by IEA, has been calculated based on theelectricity/heat ratio (REH). These are exogenous val-ues from IEA (Table 223).
• Energy inputs associated with heat production havebeen calculated based on the efficiency of CHP (exog-enous 0.8 for all sectors, all regions).
• Energy inputs to auto-CHP related to electricity pro-duction have been added to the industrial energy in-puts (energy inputs related to heat auto-production donot need to be added as they are already included withinthe appropriate consuming sector).
Industrial sector CHP technologies are listed in Table 85.
Table 84. Autoproduction Technologies in the IndustrialSector.
emaN noitinifeD00GFBCLEAE GFBhtiwCLEfonoitcudorpotuA
00OIBCLEAE OIBhtiwCLEfonoitcudorpotuA00AOCCLEAE AOChtiwCLEfonoitcudorpotuA00KOCCLEAE KOChtiwCLEfonoitcudorpotuA00HTECLEAE HTEhtiwCLEfonoitcudorpotuA00OFHCLEAE OFHhtiwCLEfonoitcudorpotuA00GPLCLEAE GPLhtiwCLEfonoitcudorpotuA00PANCLEAE PANhtiwCLEfonoitcudorpotuA00AGNCLEAE AGNhtiwCLEfonoitcudorpotuA
00LIOCLEAE LIOhtiwCLEfonoitcudorpotuA00CTPCLEAE CTPhtiwCLEfonoitcudorpotuA
00CLETUAE noitarenegocnahtrehtohtiwCLEfonoitcudorpotuA

56
10.5.7 Industrial ParametersThis section describes the parameters used to characterizeindustrial demand and process technologies in MARKALand the calculations required to transform source data intoMARKAL form. This is a summary of all parameters usedand is not meant to indicate that all technologies have eachof these parameters in their description.
All costs are expressed in millions of 1995 dollars. All en-ergy quantities are expressed in petajoules. Capacities forCHP technologies are in gigawatts. Capacities for all othertechnologies are in petajoules per annum (PJ/a).
For demands denoted in million tons (IIS, ILP, and INF),the values for each input service are the number ofpetajoules needed to contribute to one million tons of out-put for the subsector. Data characterizing new technolo-gies were developed for EIA by Science Applications In-ternational Corporation (SAIC).
Availability and utilization parametersAF: Specifies the maximum annual availability fractionof a technology.
Table 85. CHP Technologies in Industrial Sector.
emaN noitinifeD000GFBMTSE gnitsixeGFBhtiwPHCotuA
000OIBMTSE gnitsixeOIBhtiwPHCotuA000AOCMTSE gnitsixeAOChtiwPHCotuA000KOCMTSE gnitsixeKOChtiwPHCotuA000HTEMTSE gnitsixeHTEhtiwPHCotuA000OFHMTSE gnitsixeOFHhtiwPHCotuA000GPLMTSE gnitsixeGPLhtiwPHCotuA000PANMTSE gnitsixePANhtiwPHCotuA000AGNMTSE gnitsixeAGNhtiwPHCotuA
000LIOMTSE gnitsixeLIOhtiwPHCotuA000CTPMTSE gnitsixeCTPhtiwPHCotuA
CF: All technologies are assumed to be used at a fixedaverage annual capacity, so CF values are simply set to 1.
IBOND: This parameter has been used to prevent invest-ment in new capacity for all “existing” technologies, whichrepresent residual installed capacity at the beginning ofthe model time horizon.
noitcudorPotuAPHC
lacimehcortcelEskcotsdeeF
sevirDrotoMrehtO
taeHssecorPmaetS
7.07.08.0
152.0
8.08.08.0
LIFE: Existing technologies are retired after a lifetime of30 years. Existing CHP technologies are retired after a life-time of 25 years, and existing electricity auto-productiontechnologies after a lifetime of 50 years.
START: All new technologies become available in modelyear 2000.
Efficiency and cost parametersEFF: Data characterizing technology efficiency was de-veloped for EIA by SAIC.
INVCOST: Data characterizing technology investmentcost were developed for EIA by SAIC. Units are millionsof dollars per gigawatt for CHP technologies and millionsof dollars per petajoule per annum for other technologies.
FIXOM: Data characterizing technology fixed operatingand maintenance costs were developed for EIA by SAIC.Units are millions of dollars per gigawatt for CHP tech-nologies and millions of dollars per petajoule per annumfor other technologies.
Input and output parametersMA(ENT): This parameter specifies the input energy car-rier (ENT).
OUT(DM): This parameter specifies the end-use demand(DM) serviced by the technology.
INP(ENT)p: Efficiencies for most existing technologiesare set to 1, so that these technologies are essentially sim-ply accounting for the corresponding energy consumptionfor each service. Efficiencies for existing steam technolo-gies are set to 0.81 (corresponding to INP values of 1.235.)
Other MARKAL parametersCAPUNIT: Activities for all technologies are measuredin petajoules and capacities are measured in petajoules perannum, so CAPUNIT is set to 1.
RESID: Calculated by multiplying the 1995 final energyby the efficiency and dividing by the availability.
REH: Specifies the ratio of electricity to heat output forCHP technologies. For new technologies, this value is setto 0.5.
10.5.8 Industrial Energy CarriersThere are 56 industrial-specific fuel carriers, which arelisted in Table 86.

57
10.5.9 Industrial Emissions AccountingIndustrial emissions are tracked in two different ways: CO2,CH4, and NOX emissions are tracked at the technology level.
Table 86. Industrial Sector Energy Carriers.
emaN noitinifeDIAOC gnitnuoccasnoissimeotroirpyrtsudniotlaoC
AEIAOC gnitnuocca.simeretfarotceslairtsudnieritneotlaoCAEIHSD rotceslairtsudniotlioleuf:snoissimEAEILSD ONretfaleseiD X esulairtsudnirofslortnoc.simeAEILSG rotceslairtsudniotenilosaGAEIGPL gnitnuoccasnoissimeretfarotceslairtsudniotGPLAEIAGN gnitnuocca.simeretfarotceslairtsudniotsag.taN
HCEI slacimehcssecorplacimehcortcelelairtsudnISIEI leetsdnanorissecorplacimehcortcelelairtsudnIPLEI repapdnaplupssecorplacimehcortcelelairtsudnIFNEI slatemsuorrefnonssecorplacimehcortcelelairtsudnIMNEI slatemnonssecorplacimehcortcelelairtsudnIIOEI yrtsudnirehtossecorplacimehcortcelelairtsudnIHCFI kcotsdeeflacimehclairtsudnI
SIFI kcotsdeefleetsdnanorilairtsudnIHCMI slacimehcevirdenihcamlairtsudnI
SIMI leetsdnanorievirdenihcamlairtsudnIPLMI repapdnaplupevirdenihcamlairtsudnIFNMI slatemsuorrefnonevirdenihcamlairtsudnIMNMI slatemnonevirdenihcamlairtsudnIIOMI yrtsudnirehtoevirdenihcamlairtsudnIHCOI slacimehcrehtolairtsudnI
SIOI leetsdnanorirehtolairtsudnIPLOI repapdnapluprehtolairtsudnIFNOI slatemsuorrefnonrehtolairtsudnIMNOI slatemnonrehtolairtsudnIIOOI yrtsudnirehtollarehtolairtsudnIHCPI slacimehctaehssecorplairtsudnI
SIPI leetsdnanoritaehssecorplairtsudnIPLPI repapdnapluptaehssecorplairtsudnIFNPI slatemsuorrefnontaehssecorplairtsudnIMNPI slatemnontaehssecorplairtsudnIIOPI yrtsudnirehtotaehssecorplairtsudnIHCSI slacimehcmaetslairtsudnI
SISI leetsdnanorimaetslairtsudnIPLSI repapdnaplupmaetslairtsudnIFNSI slatemsuorrefnonmaetslairtsudnIMNSI slatemnonmaetslairtsudnIIOSI yrtsudnirehtomaetslairtsudnI
GFBDNI )lairtsudni(sagecanruftsalBOIBDNI )lairtsudni(sleufoiB
AOCDNI )lairtsudni(laoCKOCDNI )lairtsudni(ekocnevOCLEDNI )lairtsudni(yticirtcelEHTEDNI )lairtsudni(enahtETEHDNI )lairtsudni(taeHOFHDNI )lairtsudni(lioleufyvaeHDYHDNI )lairtsudni(ordyHGPLDNI )lairtsudni(sagmuelortepdeifiuqiLPANDNI )lairtsudni(ahthpaNAGNDNI )lairtsudni(ximsaglarutaNCUNDNI )lairtsudni(raelcuN
LIODNI )lairtsudni(stcudorpmuelortepdenifeRCTPDNI )lairtsudni(ekocmuelortePLOSDNI )lairtsudni(raloS
NIWDNI )lairtsudni(dniW
SOX, PM10, and VOC emissions are tracked by fuel goinginto the industrial sector. All fuels with industrial-specificemission factors pass through a “dummy” process tech-nology that tracks emissions. There are no costs associ-ated with these “technologies;” they simply have an in-coming energy carrier and an outgoing energy carrier. Thereare six of these for the industrial sector, as listed in Table87. The first two letters in the names of these process tech-nologies are ‘SE’ for Emissions. The last three letters are‘IND for industrial. The letters in between represent thefuel type.
The emissions data assumptions and calculations are ex-plained in Section 11.
Data were taken from Jaques (1992) and Jaques et al.(1997).
10.5.10 Industrial ConstraintsA set of fuel switching constraints is used to force fuelswitching to take place gradually over time. These con-straints force a minimum share of each fuel for each en-ergy service. 1995 minimum shares are set at 1995 actualvalues derived from the IEA database. The minimum sharesthen relax over time so that the 2000 values are 99.5% ofthe 1995 values; 2020 values are 80% of 1995 values; and2045 values are 60% of 1995 values. Values for intermedi-ate years are interpolated.
11 Emissions DataAn important capability of MARKAL is the ability to esti-mate the emissions that result from the various activitiesrepresented in the RES. MARKAL has the capability toestimate both the emissions of criteria pollutants as well asgreenhouse gas emissions.
11.1 Emissions from Electricity GenerationEmission factors associated with generating electricity arelisted in Tables 88–91. The CO2 emission factors used inthe model were taken from Table A-15 of EPA (2003). SO2,NOX, PM10, and VOC values were taken from the 1997
Table 87. Industrial Emissions “Dummy” ProcessTechnologies.
emaN noitinifeDDNIAOCES lairtsudniotlaoc:snoissimEDNIHSDES lairtsudniotlioleuf:snoissimEDNILSDES lairtsudniotleseiD:snoissimEDNILSGES lairtsudniotenilosag:snoissimEDNIGPLES lairtsudniotGPL:snoissimEDNIAGNES lairtsudniotAGN:snoissimE

58
DOE MARKAL database with updates by the EPA’s TimJohnson, Joseph DeCarolis, and Samudra Vijay.
ygolonhceT OC 2 MP 01 COV ON XON X cirtcelEot
BNL a tiforter RCS b tifortercirtcelEmaetSgnitsixE 2.52 20.7 4471.1 5391.0 5531.0 3910.0
cirtcelEmaetSweN 2.52 20.7 4471.1 5120.0 C C
CCGI 2.52 20.7 2920.0 0340.0 C C
deBdezidiulFcirehpsomtA 2.52 20.7 2920.0 5120.0 C C
deBdezidiulFdezirusserP 2.52 20.7 2920.0 5120.0 C C
lleCleuFetanobraCnetloM 2.52 20.7 2920.0 0000.0 C Ca ONwol=BNL X .srenrubb .noitcudercitylatacevitceles=RCS
Table 88. CO2, PM
10, VOC, and NO
X Emission Factors from Generating Electricity as Used in the EPANMD.
tnetnoCrufluSlaoCygolonhceT epyTlaoC hgiH muideM woL
cirtcelEmaetSweN suonimutiB 21.0 50.0 20.0
cirtcelEmaetSweN etingiL 90.0 50.0 20.0
cirtcelEmaetSweN suonimutibbuS 40.0 20.0cirehpsomtAdeBdezidiulF suonimutiB 13.2 09.0 64.0
cirehpsomtAdeBdezidiulF etingiL 97.1 89.0 04.0
cirehpsomtAdeBdezidiulF suonimutibbuS 17.0 33.0
CCGI suonimutiB 13.2 09.0 64.0
CCG etingiL 97.1 89.0 04.0
CCG suonimutibbuS 17.0 33.0etanobraCnetloM
lleCleuF llA
dezirusserPdeBdezidiulF suonimutiB 13.2 09.0 64.0
dezirusserPdeBdezidiulF etingiL 97.1 89.0 04.0
dezirusserPdeBdezidiulF suonimutibbuS 17.0 33.0
Table 89. SO2 Emission Factors from Generating Electricityas Used in the EPANMD.
Table 90. Emission Factors from Coke as Used in theEPANMD.
Table 91. Emission Factors from Coal Gasification as Usedin the EPANMD.
ygolonhceT OC 2
noitacifisaGutBhgiH 2.52
noitacifisaGutBmuideM 2.52
noitacifisaGutiS-nI 2.52
Both the Clean Air Act and more recent CAIR (Clean AirInterstate Rule) impose emissions constraints on SOX andNOX emissions from the electric power sector. Because coalplants accounted for roughly 41% of total installed elec-tric generation capacity in 1995 and account for the bulkof electric sector SOX/NOX emissions, characterizing theamount of coal capacity with pre-existing controls as wellas the cost and removal efficiency of new retrofits is ex-tremely important to the overall performance of U.S. EPA’sMARKAL model.
11.1.1 Data Sources• Energy Information Administration (EIA) Form 767.
See http://www.eia.doe.gov/cneaf/electricity/page/eia767.html
• EPA Clean Air Markets—Data and Maps.See http://cfpub.epa.gov/gdm/
• For estimating abatement cost of the residual coal-based power generation capacity, Coal Utility Envi-ronmental Cost, Version 3.0 (CUECost, Ver 3.0), anengineering-economic modeling tool developed byNational Risk Management Laboratory of EPA, wasused. CUECost can be used to estimate cost of retro-fitting existing plants with NOX and SOX controls. TheCUECost estimates are claimed to be within rough-order-of-magnitude (ROM) ±30% (accepted range forbudgetary estimates). More details of CueCost can befound athttp://www.epa.gov/ttn/catc/products.html#cccinfo
11.1.2 Modeling StructureIn U.S. EPA MARKAL, there are three coal types (bitumi-nous, sub-bituminous, and lignite) as well as three sulfurlevels (high, medium, and low). Because the cost and per-formance of SOX control technologies varies by both coaltype and sulfur levels, nine flue gas desulfurization (FGD)processes are provided in the model. Because NOX emis-sions are insensitive to sulfur level, each NOX control pro-cess was specified separately for each of the three coaltypes as illustrated in Figure 37.
ygolonhceT epyTlaoC tnetnocrufluS OC 2 OS 2
ekoC .teM woL 0.52 024.0ekoC teM muideM 0.52 035.0
ekoCdetropmI 7.42

59Figure 37. RES for Coal Retrofits

60
Note that no high-sulfur subbituminous coal exists and nolow sulfur lignite coal exists.
The set of processes on the left hand side of Figure 37represent sulfur control. For each level of sulfur content(high, medium, low), there are two options: FGD or a passthrough (no control). The process naming convention is
• First 3 letters: SEC, emissions accounting for coal-re-lated processes.
• Letters 4–6: STM, because the retrofits are part of asteam-based generation technology.
• Letter 7: Coal type, B=bituminous, S=subbituminous,L=lignite.
• Letter 8: Sulfur level, H=high, M=medium, L=low.• Letters 9–10: control technology, FG=FGD, PT=pass
through (no control).
After passing through the SOX control processes, the coalenergy carriers (CSTMBITE2, CSTMSUBE2,CSTMLIGE2) enter the NOX control processes. There arethree NOX retrofit technologies explicitly captured in themodel: Low NOX burners (LNB), Selective Catalytic Re-duction (SCR), and Selective Non-Catalytic Reduction(SNCR). LNB is a boiler retrofit, while SCR and SNCRoperate on the flue gas. As a result, LNB can be used inconjunction with SCR or SNCR.
As of 2000, significant LNB retrofits to coal steam plantsexisted, but negligible amounts of SCR/SNCR were in-stalled. As a result, residual LNB is characterized in themodel while residual SCR/SNCR is not. In a given timeperiod, if LNB is already installed, then SCR or SNCR canalso be installed. See the upper right of the MARKAL dia-grams above. The naming convention for these NOX retro-fits is
• First 3 letters: SEC, emissions accounting for coal-re-lated processes.
• Letters 4–6: STM, because the retrofits are part of asteam-based generation technology.
• Letter 7: Coal type, B=bituminous, S=subbituminous,L=lignite.
• Letters 8–10: control technology, LNB=LNB,SCR=SCR to supplement LNB, SNC=SNCR tosupplement LNB, PT=pass through (LNB only).
For the coal steam capacity that does not have LNB in-stalled, there are several possible new retrofits: SCR only,SNCR only, pass through, an LNB-SCR combination, andan LNB-SNCR combination. The naming convention forthese NOX retrofits is
• First 3 letters: SEC, emissions accounting for coal-re-lated processes.
• Letters 4–6: STM, because the retrofits are part of asteam-based generation technology.
• Letter 7: Coal type, B=bituminous, S=subbituminous,L=lignite.
• Letters 8–10: control technology, SC2=new SCR,SN2=new SNCR, PT2=pass through (no control),LS2=new LNB-SCR combination, and LN2=newLNB-SNCR combination.
It is important to note that there are two possible pathwaysto achieve combinations of LNB and SCR/SNCR. If LNBis already installed, SCR and SNCR can be retrofitted later.For example, in the case of bituminous coal, this possibil-ity is represented by a combination of SECSTMBLNB andSECSTMBSCR or SECSTMBSNC. Or LNB and SCR/SNCR can be installed at the same time, which reduces thecost through integrated planning.
After the NOX retrofits, the coal energy carrier(bituminous=CSTMBITE, sub-bituminous=CSTMSUBE,lignite=CSTMLIGE) proceeds to the coal steam plants,ECOASTMB=bituminous, ECOASTMS=subbituminous,and ECOASTML=lignite.
11.1.3 MethodologyCost (capital and O&M) and emissions reductions for SOX
and NOX retrofit technologies were estimated and includedin the MARKAL representation shown above. Because thedata had to be sorted by coal type and sulfur level, severaldata sources were required. The EPA Clean Air Marketsdata included boiler-level emissions data, capacity, and adescription of installed control technology (if any) but didnot include coal type or sulfur content. EIA-Form 860 con-tained the generator-level coal type and sulfur level, butnot the emissions data. Because EIA Form 860 containsdata on the generator level and EPA contains data on theboiler level, it is not possible to make a one-to-one map-ping between EIA and EPA data. Instead, the coal type andcoal sulfur content were drawn from the first generatorlisted under each unique plant ID in the EIA data, thenassociated with each of the boilers with the same plant IDin the EPA data: a Java script was implemented to do thematching, and the combined data set was saved as a comma-delimited file.
SOX ControlResidual FGD/non-FGD capacity and emissions were es-timated according to coal type, sulfur content, and pres-ence of FGD using the autofilter feature in Excel. Sulfur

61
content was divided into three categories: high (1.68 lbsSOX/MBtu), medium (between 0.6 and 1.68 lbs SOX /MBtu), and low ( 0.6 lbs SOX/MBtu). Average SOX rateswere found by dividing the sum of the SOX emissions (tons)from all boilers by the total heat generated by all boilers.FGD/non-FGD capacity was determined by summing thecorresponding boiler capacities in millions of Btu per hourand converting to petajoules per year.
NOX controlResidual LNB/non-LNB capacity and emissions were es-timated according to coal type and the presence of LNBusing the autofilter feature in Excel. Negligible amountsof SCR and SNCR existed prior to 2000, so their residualcapacity was not included. Any boiler capacity with retro-fits not explicitly captured as a separate NOX control pro-cesses in MARKAL—such as over-fire air and water in-jection —were included under the “pass through” charac-terization. Average NOX rates and NOX control capacitywere determined using the methodology described in thepreceding paragraph.
11.1.4 Estimating the Cost and Removal Efficiencyof New SOX/NOX RetrofitsTo estimate both the capital and operating costs for newretrofit capacity, the CueCost model was used. A script was
written to estimate the retrofit costs for various SOX andNOX control technologies for every boiler listed in the EPAClean Air Markets data. The script took the data for eachboiler listed in the EIA-EPA dataset and returned the retro-fit cost and emissions rate for each of the SOX/NOX retro-fits according to coal type and sulfur level (for SOX retro-fits). Emissions rates and variable O&M costs wereweighted by the heat produced by each of the boilers, andthe capital costs were weighted by boiler capacities to cal-culate representative values.
11.1.5 SOX Retrofit Data SummaryA summary of all the data associated with SOX retrofit isshown in Table 89.
11.2 Biomass EmissionsThe biomass emission factors used in the EPANMD andlisted in Table 93 were taken from the 1997 MARKALdatabase.
Table 92. SOX Control Data Summary.
retemaraP
laoCsuonimutiBrufluShgiH rufluSmuideM rufluSwoL
DGF)GFHBMTSCES(
ssaP)TPHBMTSCES(
DGF)GFMBMTSCES(
ssaP)TPMBMTSCES(
DGF)GFLBMTSCES(
ssaP)TPLBMTSCES(
)ry/JP(yticapaClaudiseR5991 1162 6221 3211
)ry/JP(yticapaClaudiseR0002 0613 3131 3901
)JP/Tk(etaRsnoissimEmuirbiliuqE 430.0 76.0 20.0 93.0 5900.0 91.0
)ry/JP/$M(tsoClatipaC 55.2 11.2 92.2
)JP/$M(M&OelbairaV 723.0 462.0 613.0
retemaraP
laoCsuonimutibbuSrufluShgiH rufluSmuideM rufluSwoL
DGF ssaP DGF)GFMSMTSCES(
ssaP)TPMSMTSCES(
DGF)GFLSMTSCES(
ssaP)TPLSMTSCES(
)ry/JP(yticapaClaudiseR5991 A/N 164 0531
)ry/JP(yticapaClaudiseR0002 A/N 4861 8171
)JP/Tk(etaRsnoissimEmuirbiliuqE A/N A/N 210.0 32.0 5700.0 31.0
)ry/JP/$M(tsoClatipaC A/N 38.1 79.1
)JP/$M(M&OelbairaV A/N 291.0 542.0
retemaraP
etingiLrufluShgiH rufluSmuideM rufluSwoL
DGF)GFHLMTSCES(
ssaP)TPHLMTSCES(
DGF)GFMLMTSCES(
ssaP)TPMLMTSCES(
DGF ssaP
)ry/JP(yticapaClaudiseR5991 36 603 A/N)ry/JP(yticapaClaudiseR0002 941 7401 A/N
)JP/Tk(etaRsnoissimEmuirbiliuqE 320.0 17.0 610.0 63.0 A/N A/N)ry/JP/$M(tsoClatipaC 58.1 96.1 A/N
)JP/$M(M&OelbairaV 732.0 732.0 A/N
Table 93. Biomass CO2 Emission Factors in the EPANMD..
ygolonhceT OC 2 rotcaFnoissimEAGNotnissamoiB B 2.51
lonahteMotnissamoiB B 1.91
lonahteMotniAGN 635.8
enilepiPehtotAGN 436.0

62
11.3 Commercial and Residential EmissionsFor SO2, NOX, PM10, and VOCs, the actual pollutant emis-sions in 1999 were taken from the EPA national inventoryalong with the actual energy consumption from EIA in1999. Emission factors were obtained by dividing actualemissions by actual energy consumption. Where no pol-lutant information was provided, default IPCC emissionfactors were used. For LPG, AP-42 emission factors wereused. For CO2, IPCC emissions factors were used. The resi-dential emission factors are listed in Table 94 and the com-mercial in Table 95.
11.4 Industrial EmissionsFor CO2 emission factors, listed in Table 96, data weretaken from Jaques, A.P., 1992, and Jaques, A., et al., 1997.Emission factors for SO2, NOX, PM10, and VOCs, listed inTable 97, the actual pollutant emissions in 1999 were takenfrom the EPA national inventory along with the actual en-ergy consumption from EIA in 1999. Emission factors wereobtained by dividing actual emission by actual energy con-sumption. Where no pollutant information was provided,default IPCC emission factors were used. For LPG, AP-42emission factors were used.
11.5 Transportation EmissionsVehicle emissions depend on fuel, propulsion technology(e.g., internal combustion engine or fuel cell), emissions
Table 94. Residential Emission Factors (in lb/MMBtu) usedin the EPANMD.
Table 95. Commercial Emission Factors (in lb/MMBtu) usedin the EPANMD.
leuF OS 2 ON X MP 01 sCOV OC 2
saGlarutaN 7600.0 6571.0 1500.0 3900.0 0947.921laoC 8539.5 8801.1 0025.0 8720.0 9394.512
liOleuFetallitsiD 4741.0 3462.0 5130.0 0900.0 4457.861GPL 1100.0 12410.0 9100.0 5500.0 0216.631
enesoreK 4741.0 3462.0 5130.0 0900.0 4457.861dooW 9720.0 1991.0 7021.2 4699.2 0000.0
leuF OS 2 ON X MP 01 sCOV OC 2
saGlarutaN 7600.0 0861.0 1500.0 3900.0 0947.921laoC 8539.5 8801.1 0025.0 8720.0 9394.512
liOleuFetallitsiD 2628.0 2562.0 5130.0 0900.0 4457.861GPL 0000.0 7702.0 4400.0 3300.0 0216.631
liOleuFlaudiseR 7223.4 6019.0 7062.0 0770.0 4457.861ssamoiB 9720.0 1991.0 7021.2 4699.2 0000.0
control devices, and vehicle age (cumulative miles trav-eled) through degradation of control equipment. Becausethe existing vehicles represented the fleet as of the modelstart year, emissions from these vehicles will also changeover time due to the earlier retirement of older, more pol-luting vehicles.
Emissions factors for existing vehicles were calculated fromactual 1995 light-duty vehicle fleet emissions based on theEPA, 2000b. Vehicle stock turnover and annual VMT byvintage were calculated based on information from theEnergy Information Administration (EIA, 1998, 2003a) andthe Transportation Energy Data Book, Edition 21 (Davis,2001). Degradation estimates were based on a variety ofsources, depending on the pollutant, including the EPAFederal Test Procedure, EPA’s Mobile 6 model (EPA, 1999,2001a), and the American Council for an Energy EfficientEconomy (ACEEE) Green Book methodology (DeCicco,J. and Kliesch, J., 2001).
For new internal combustion engine and hybrid vehicles,emissions factors were based on standards specificationsfor Tier 1, Low Emissions Vehicles (LEV), Ultra LowEmissions Vehicles (ULEV), Super Ultra Low EmissionsVehicles (SULEV), and Tier 2 compliant vehicles (EPA,2000a). For Tier 2 compliant vehicles, emissions factorswere derived from the Greenhouse Gases, Regulated Emis-sions, and Energy Use in Transportation (GREET) model,developed by the Argonne National Laboratory (ArgonneNational Labs, 2001). All hybrid vehicles were assumedto be SULEV compliant. For all other internal combustion
Table 96. Industrial CO2 Emission Factors in the EPANMD.
ytidommoC noitpircseD stinU AGNDNI GPLDNI AOCDNI KOCDNI GFBDNI OFHDNI LIODNI HTEDNI PANDNI CTPDNI OIBDNIN2OCDNI OClairtsudni 2 ennotk 002.51 463.61 002.52 002.52 002.52 281.02 071.91 002.51 972.91 003.72 485.0N4HCDNI HClairtsudnI 4 ennot 031.0 081.1 245.0 245.0 245.0 027.0 341.2 721.0 023.1 245.0 020.0NO2NDNI NlairtsudnI 2O ennot 026.0 000.9 508.1 508.1 508.1 011.3 638.3 026.0 063.3 508.1 746.8
OC 2 OCI 2 CennotM 510.0 610.0 520.0 520.0 520.0 020.0 910.0 510.0 910.0 720.0 100.0
Table 97. Additional Industrial EPANMD Emission Factors(in lb/MMBtu).
9991 leuF OS 2 ON X MP 01 sCOVlaoC 2705.1 5226.0 9480.0 9700.0
gnikoCotlaoC.teM A/N A/N A/N A/NliOleuFlaudiseR 7223.4 6019.0 7062.0 0770.0
)etallitsid(leseiD 3123.0 4841.0 3110.0 1501.0enilosaG 3123.0 4841.0 3110.0 1501.0
GPL 0000.0 7702.0 6600.0 3300.0muelorteP.csiM 3123.0 4841.0 3110.0 1501.0
saGlarutaN 9041.0 0492.0 4010.0 7410.0.mehcorteP.bracordyH
kcotsdeeF A/N A/N A/N A/N
ssamoiB 0000.0 6232.0 8070.0 3611.0

63
engine (ICE) vehicles, a mix of compliance levels was as-sumed based on national and state regulations. Degrada-tion estimates were based on the Mobile 6 model, EPA,sTier 2/Sulfur analysis (EPA 2001b), and the ACEEE GreenBook methodology. The various transportation emissionfactors are listed in Tables 98 through 103.Table 98. Airplane Emission Factors.
Table 99. Bus Emission Factors.
leuF OC 2mpb/tM a
ON Xmpb/tk
OS Xmpb/tk
COVmpb/tk
leuFteJ 911.0 46.0 4400.0 40.0enilosaG 291.0 81.0 4400.0 91.1
a selimregnessapnoillib=mpb
leuF OC 2tmvb/tM a
ON Xtmvb/tk
OS Xtmvb/tk
COVtmvb/tk
lonahteM 910.0 900.0GNC 200.0 517.51 460.0 960.3LSD 020.0 210.0 955.26LSG 910.0 900.0
a delevartselimelcihevnoillib=tmvb
Table 100. Passenger Rail Emission Factors.
Table 101. Shipping Emission Factors.
leuFLSD OC 2tmvb/tM a
ON Xtmvb/tk
OS Xtmvb/tk
COVtmvb/tk
liaRretummoC 821.0 541.0 300.0 327.3liaRytic-retnI 490.0 541.0 300.0 327.3
a delevartselimelcihevnoillib=tmvb
leuF OC 2tmvb/tM a
ON Xtmvb/tk
OS Xtmvb/tk
COVtmvb/tk
LSD,thgierFliaR 680.0 541.0 300.0 327.3liOleuF,gnippihS 961.0 861.0 575.0 631.5
LSD,gnippihS 261.0 052.0 710.0 648.9a delevartselimelcihevnoillib=tmvb
Table 102. Heavy Truck Emission Factors.
leuF OC 2tmvb/tM a
ON Xtmvb/tk
MP 01tmvb/tk
OS Xtmvb/tk
COVtmvb/tk
gnitsixe,LSG 544.0 384.11 752.0 471.0 430.6wen,LSG 514.0 568.01 030.0 627.1
gnitsixe,LSD 674.0 790.61 125.0 041.0 794.10002,LSD 444.0 101.41 602.0 258.0
)%02(gpmpmi,0002,LSD 073.0 101.41 602.0 258.0)%04(gpmpmi,0002,LSD 713.0 101.41 602.0 258.0
0102,LSD 614.0 924.0 900.0 852.0)%01(gpmpmi,0102,LSD 083.0 924.0 900.0 852.0)%02(gpmpmi,0102,LSD 643.0 924.0 900.0 852.0
0202,LSD 683.0 924.0 900.0 852.0)%01(gpmpmi,0202,LSD 053.0 924.0 900.0 852.0)%02(gpmpmi,0202,LSD 123.0 924.0 900.0 852.0
GPL 383.0 517.51 840.0 851.4lonahteM 000.0 517.51 460.0 358.4
GNC 123.0 517.51 230.0 960.3a delevartselimelcihevnoillib=tmvb
Table 103. Light Duty Vehicle Emission Factors.
continued
leuF OC 2tmvb/tM a
ON Xtmvb/tk
MP 01tmvb/tk
OS Xtmvb/tk
COVtmvb/tk
50BYH2CLT 170.0 650.0 200.0 510.0 330.001BYH2CLT 750.0 650.0 200.0 510.0 330.051BYH2CLT 250.0 650.0 200.0 510.0 330.002BYH2CLT 840.0 650.0 200.0 510.0 330.052BYH2CLT 440.0 650.0 200.0 510.0 330.003BYH2CLT 440.0 650.0 200.0 510.0 330.053BYH2CLT 340.0 650.0 200.0 510.0 330.051BYH3CLT 930.0 650.0 200.0 510.0 330.002BYH3CLT 330.0 650.0 200.0 510.0 330.052BYH3CLT 030.0 650.0 200.0 510.0 330.003BYH3CLT 920.0 650.0 200.0 510.0 330.053BYH3CLT 920.0 650.0 200.0 510.0 330.050LSDACLT 670.0 562.0 020.0 950.0 065.001LSDACLT 270.0 562.0 020.0 950.0 065.051LSDACLT 170.0 562.0 020.0 950.0 065.002LSDACLT 170.0 562.0 020.0 950.0 065.052LSDACLT 070.0 562.0 020.0 950.0 065.003LSDACLT 960.0 562.0 020.0 950.0 065.053LSDACLT 960.0 562.0 020.0 950.0 065.001GPMACLT 850.0 782.0 910.0 510.0 321.051GPMACLT 750.0 782.0 910.0 510.0 321.002GPMACLT 750.0 782.0 910.0 510.0 321.052GPMACLT 650.0 882.0 810.0 510.0 221.003GPMACLT 650.0 882.0 810.0 510.0 221.053GPMACLT 550.0 882.0 810.0 510.0 221.0
50GNCCLT 870.0 842.0 100.0 100.0 540.001GNCCLT 470.0 842.0 100.0 100.0 540.000XNCCLT 980.0 563.0 500.0 400.0 021.001XNCCLT 970.0 752.0 500.0 400.0 460.002XNCCLT 870.0 990.0 600.0 400.0 570.0
00VNOCCLT 301.0 717.0 910.0 510.0 543.050VNOCCLT 690.0 782.0 910.0 510.0 321.001VNOCCLT 190.0 782.0 910.0 510.0 321.051VNOCCLT 090.0 782.0 910.0 510.0 321.002VNOCCLT 980.0 782.0 910.0 510.0 321.052VNOCCLT 980.0 882.0 810.0 510.0 221.003VNOCCLT 880.0 882.0 810.0 510.0 221.053VNOCCLT 780.0 882.0 810.0 510.0 221.0
50CLECLT 000.0 000.0 000.0 000.0 000.001CLECLT 000.0 000.0 000.0 000.0 000.0
a delevartselimelcihevnoillib=tmvb

64
Table 103 (continued). Light Duty Vehicle EmissionFactors.
continuedcontinued
Table 103 (continued). Light Duty Vehicle EmissionFactors.
leuF OC 2tmvb/tM a
ON Xtmvb/tk
MP 01tmvb/tk
OS Xtmvb/tk
COVtmvb/tk
50XHTECLT 990.0 842.0 500.0 500.0 671.001XHTECLT 490.0 842.0 500.0 500.0 671.051XHTECLT 490.0 842.0 500.0 500.0 671.002XHTECLT 490.0 842.0 500.0 500.0 671.052XHTECLT 490.0 842.0 500.0 500.0 671.003XHTECLT 490.0 842.0 500.0 500.0 671.053XHTECLT 490.0 842.0 500.0 500.0 671.0
02HCFCLT 000.0 000.0 000.0 000.0 000.052HCFCLT 000.0 000.0 000.0 000.0 000.001MCFCLT 540.0 700.0 000.0 000.0 830.002MCFCLT 040.0 700.0 000.0 000.0 830.000XGPLCLT 101.0 563.0 600.0 400.0 441.001XGPLCLT 090.0 752.0 600.0 400.0 880.002XGPLCLT 780.0 990.0 600.0 400.0 080.001GPMMCLT 460.0 782.0 910.0 510.0 321.051GPMMCLT 460.0 782.0 910.0 510.0 321.002GPMMCLT 360.0 782.0 910.0 510.0 321.052GPMMCLT 260.0 882.0 810.0 510.0 221.003GPMMCLT 260.0 882.0 810.0 510.0 221.053GPMMCLT 160.0 882.0 810.0 510.0 221.000XHTMCLT 101.0 842.0 500.0 500.0 671.001XHTMCLT 980.0 842.0 500.0 500.0 671.002XHTMCLT 580.0 630.0 600.0 300.0 521.0
LSGCELT 401.0 257.1 030.0 230.0 949.2LSDFELT 511.0 135.3 376.0 522.0 219.0LSGFELT 911.0 257.1 030.0 230.0 949.2LSGMELT 021.0 413.1 130.0 830.0 359.2LSDPELT 841.0 135.3 757.0 352.0 972.2LSGPELT 541.0 758.1 930.0 040.0 214.3LSGSELT 251.0 043.1 810.0 630.0 219.2
50BYH2FLT 470.0 650.0 200.0 510.0 330.001BYH2FLT 560.0 650.0 200.0 510.0 330.051BYH2FLT 950.0 650.0 200.0 510.0 330.002BYH2FLT 450.0 650.0 200.0 510.0 330.052BYH2FLT 050.0 650.0 200.0 510.0 330.003BYH2FLT 050.0 650.0 200.0 510.0 330.053BYH2FLT 050.0 650.0 200.0 510.0 330.001BYH3FLT 250.0 650.0 200.0 510.0 330.051BYH3FLT 540.0 650.0 200.0 510.0 330.002BYH3FLT 830.0 650.0 200.0 510.0 330.053BYH3FLT 430.0 650.0 200.0 510.0 330.003BYH3FLT 330.0 650.0 200.0 510.0 330.053BYH3FLT 330.0 650.0 200.0 510.0 330.050LSDAFLT 480.0 562.0 020.0 950.0 065.001LSDAFLT 080.0 562.0 020.0 950.0 065.051LSDAFLT 970.0 562.0 020.0 950.0 065.002LSDAFLT 870.0 562.0 020.0 950.0 065.052LSDAFLT 770.0 562.0 020.0 950.0 065.003LSDAFLT 670.0 562.0 020.0 950.0 065.053LSDAFLT 670.0 562.0 020.0 950.0 065.001PMMAFLT 060.0 782.0 910.0 510.0 321.051PMMAFLT 950.0 782.0 910.0 510.0 321.002PMMAFLT 850.0 782.0 910.0 510.0 321.052PMMAFLT 850.0 782.0 910.0 510.0 321.003PMMAFLT 750.0 782.0 910.0 510.0 321.053PMMAFLT 750.0 782.0 910.0 510.0 321.0
a delevartselimelcihevnoillib=tmvb
leuF OC 2tmvb/tM a
ON Xtmvb/tk
MP 01tmvb/tk
OS Xtmvb/tk
COVtmvb/tk
50GNCFLT 090.0 842.0 100.0 100.0 540.001GNCFLT 580.0 842.0 100.0 100.0 540.0
00XGNCFLT 890.0 563.0 500.0 400.0 021.001XGNCFLT 090.0 563.0 500.0 400.0 021.002XGNCFLT 090.0 602.0 600.0 400.0 031.000VNOCFLT 811.0 717.0 910.0 510.0 543.050VNOCFLT 011.0 782.0 910.0 510.0 321.001VNOCFLT 501.0 782.0 910.0 510.0 321.051VNOCFLT 301.0 782.0 910.0 510.0 321.002VNOCFLT 201.0 782.0 910.0 510.0 321.052VNOCFLT 101.0 882.0 810.0 510.0 221.003VNOCFLT 001.0 882.0 810.0 510.0 221.053VNOCFLT 990.0 882.0 810.0 510.0 221.001CLECFLT 000.0 000.0 000.0 000.0 000.000XHTEFLT 221.0 842.0 500.0 500.0 671.001XHTEFLT 801.0 842.0 500.0 500.0 671.0
01GCFFLT 150.0 700.0 000.0 000.0 750.002GCFFLT 540.0 700.0 000.0 000.0 750.052GCFFLT 830 700.0 000.0 000.0 750.002HCFFLT 000.0 000.0 000.0 000.0 000.052HCFFLT 000.0 000.0 000.0 000.0 000.001MCFFLT 250.0 700.0 000.0 000.0 830.002MCFFLT 640.0 700.0 000.0 000.0 830.000XGPLFLT 801.0 842.0 100.0 000.0 770.001XGPLFLT 301.0 842.0 100.0 000.0 770.002XGPLFLT 001.0 630.0 200.0 000.0 560.001GPMMFLT 760.0 782.0 910.0 510.0 321.051GPMMFLT 660.0 782.0 910.0 510.0 321.002GPMMFLT 560.0 782.0 910.0 510.0 321.052GPMMFLT 560.0 882.0 810.0 510.0 221.003GPMMFLT 460.0 882.0 810.0 510.0 221.053GPMMFLT 360.0 882.0 810.0 510.0 221.000XHTMFLT 611.0 842.0 500.0 500.0 671.001XHTMFLT 201.0 842.0 500.0 500.0 671.002XHTMFLT 890.0 630.0 600.0 300.0 521.001BYH2MLT 270.0 750.0 200.0 120.0 961.051BYH2MLT 460.0 750.0 200.0 120.0 961.002BYH2MLT 850.0 750.0 200.0 120.0 961.052BYH2MLT 450.0 750.0 200.0 120.0 961.003BYH2MLT 550.0 750.0 200.0 120.0 961.053BYH2MLT 550.0 750.0 200.0 120.0 961.051BYH3MLT 450.0 750.0 200.0 120.0 961.002BYH3MLT 740.0 750.0 200.0 120.0 961.052BYH3MLT 630.0 750.0 200.0 120.0 961.003BYH3MLT 630.0 750.0 200.0 120.0 961.053BYH3MLT 630.0 750.0 200.0 120.0 961.001LSDAMLT 780.0 394.0 440.0 080.0 278.051LSDAMLT 580.0 394.0 440.0 080.0 278.002LSDAMLT 380.0 394.0 440.0 080.0 278.052LSDAMLT 380.0 394.0 440.0 080.0 278.003LSDAMLT 380.0 394.0 440.0 080.0 278.053LSDAMLT 480.0 394.0 440.0 080.0 278.001GPMAMLT 260.0 691.0 820.0 120.0 545.051GPMAMLT 060.0 691.0 820.0 120.0 545.002GPMAMLT 850.0 691.0 820.0 120.0 545.052GPMAMLT 950.0 491.0 720.0 120.0 545.0
a delevartselimelcihevnoillib=tmvb

65
Table 103 (continued). Light Duty Vehicle EmissionFactors.
continued
Table 103 (continued). Light Duty Vehicle EmissionFactors.
continued
leuF OC 2tmvb/tM a
ON Xtmvb/tk
MP 01tmvb/tk
OS Xtmvb/tk
COVtmvb/tk
03GPMAMLT 950.0 491.0 720.0 120.0 545.053GPMAMLT 950.0 491.0 720.0 120.0 545.0
50GNCMLT 690.0 145.0 100.0 100.0 580.051GNCMLT 090.0 060.0 200.0 100.0 260.0
00XGNCMLT 401.0 425.0 800.0 600.0 673.001XGNCMLT 301.0 454.0 800.0 600.0 002.002XGNCMLT 890.0 361.0 900.0 600.0 953.000VNOCMLT 021.0 274.0 820.0 120.0 942.150VNOCMLT 811.0 691.0 820.0 120.0 545.001VNOCMLT 511.0 691.0 820.0 120.0 545.051VNOCMLT 111.0 691.0 820.0 120.0 545.002VNOCMLT 801.0 691.0 820.0 120.0 545.052VNOCMLT 901.0 491.0 720.0 120.0 545.003VNOCMLT 901.0 491.0 720.0 120.0 545.053VNOCMLT 901.0 491.0 720.0 120.0 545.0
01CLEMLT 000.0 000.0 000.0 000.0 000.002CLEMLT 000.0 000.0 000.0 000.0 000.0
00XHTEMLT 521.0 994.0 600.0 700.0 862.001XHTEMLT 911.0 994.0 600.0 700.0 862.002XHTEMLT 211.0 994.0 600.0 700.0 862.0
01GCFMLT 060.0 210.0 000.0 000.0 060.051GCFMLT 450.0 210.0 000.0 000.0 060.002GCFMLT 840.0 210.0 000.0 000.0 060.051HCFMLT 000.0 000.0 000.0 000.0 000.002HCFMLT 000.0 000.0 000.0 000.0 000.052HCFMLT 000.0 000.0 000.0 000.0 000.001MCFMLT 160.0 210.0 000.0 000.0 040.002MCFMLT 940.0 210.0 000.0 000.0 040.000XGPLMLT 811.0 994.0 200.0 000.0 271.001XGPLMLT 511.0 994.0 200.0 000.0 271.002XGPLMLT 601.0 060.0 200.0 000.0 170.001GPMMMLT 470.0 691.0 820.0 120.0 545.051GPMMMLT 470.0 691.0 820.0 120.0 545.002GPMMMLT 070.0 691.0 820.0 120.0 545.052GPMMMLT 070.0 491.0 720.0 120.0 545.003GPMMMLT 070.0 491.0 720.0 120.0 545.053GPMMMLT 170.0 491.0 720.0 120.0 545.000XHTMMLT 811.0 994.0 600.0 700.0 862.001XHTMMLT 211.0 994.0 600.0 700.0 862.002XHTMMLT 301.0 060.0 700.0 400.0 331.0
01BYH2PLT 180.0 301.0 200.0 120.0 823.051BYH2PLT 670.0 301.0 200.0 120.0 823.002BYH2PLT 960.0 301.0 200.0 120.0 823.052BYH2PLT 560.0 301.0 200.0 120.0 823.003BYH2PLT 560.0 301.0 200.0 120.0 823.053BYH2PLT 560.0 301.0 200.0 120.0 823.002BYH3PLT 350.0 301.0 200.0 120.0 823.052BYH3PLT 340.0 301.0 200.0 120.0 823.003BYH3PLT 340.0 301.0 200.0 120.0 823.053BYH3PLT 340.0 301.0 200.0 120.0 823.050LSDAPLT 801.0 394.0 440.0 080.0 278.001LSDAPLT 401.0 394.0 440.0 080.0 278.051LSDAPLT 101.0 394.0 440.0 080.0 278.002LSDAPLT 890.0 394.0 440.0 080.0 278.052LSDAPLT 990.0 394.0 440.0 080.0 278.003LSDAPLT 990.0 394.0 440.0 080.0 278.0
a delevartselimelcihevnoillib=tmvb
leuF OC 2tmvb/tM a
ON Xtmvb/tk
MP 01tmvb/tk
OS Xtmvb/tk
COVtmvb/tk
53LSDAPLT 001.0 394.0 440.0 080.0 278.001GPMAPLT 580.0 902.0 820.0 120.0 115.051GPMAPLT 280.0 902.0 820.0 120.0 115.002GPMAPLT 080.0 902.0 820.0 120.0 115.052GPMAPLT 080.0 802.0 720.0 120.0 315.003GPMAPLT 180.0 802.0 720.0 120.0 315.053GPMAPLT 180.0 802.0 720.0 120.0 315.0
50GNCPLT 611.0 239.0 100.0 100.0 951.051GNCPLT 701.0 601.0 300.0 100.0 860.0
00XGNCPLT 721.0 218.0 800.0 600.0 783.001XGNCPLT 021.0 218.0 800.0 600.0 783.002XGNCPLT 511.0 391.0 010.0 600.0 023.000VNOCPLT 641.0 454.0 820.0 120.0 470.150VNOCPLT 141.0 902.0 820.0 120.0 115.001VNOCPLT 631.0 902.0 820.0 120.0 115.051VNOCPLT 231.0 902.0 820.0 120.0 115.002VNOCPLT 921.0 902.0 820.0 120.0 115.052VNOCPLT 921.0 802.0 720.0 120.0 315.003VNOCPLT 031.0 802.0 720.0 120.0 315.053VNOCPLT 031.0 802.0 720.0 120.0 315.0
50CLEPLT 000.0 000.0 000.0 000.0 000.051CLEPLT 000.0 000.0 000.0 000.0 000.052CLEPLT 000.0 000.0 000.0 000.0 000.0
50XHTEPLT 641.0 708.0 600.0 700.0 764.001XHTEPLT 141.0 708.0 600.0 700.0 764.002XHTEPLT 431.0 708.0 600.0 700.0 764.0
51HCFPLT 000.0 000.0 000.0 000.0 000.002HCFPLT 000.0 000.0 000.0 000.0 000.052HCFPLT 000.0 000.0 000.0 000.0 000.001MCFPLT 370.0 120.0 000.0 000.0 440.002MCFPLT 260.0 120.0 000.0 000.0 440.000XGPLPLT 441.0 708.0 200.0 000.0 843.001XGPLPLT 531.0 708.0 200.0 000.0 843.002XGPLPLT 621.0 601.0 300.0 000.0 180.001GPMMPLT 001.0 902.0 820.0 120.0 115.051GPMMPLT 790.0 902.0 820.0 120.0 115.002GPMMPLT 490.0 902.0 820.0 120.0 115.052GPMMPLT 490.0 802.0 720.0 120.0 315.003GPMMPLT 590.0 802.0 720.0 120.0 315.053GPMMPLT 590.0 802.0 720.0 120.0 315.000XHTMPLT 441.0 708.0 600.0 700.0 764.001XHTMPLT 431.0 708.0 600.0 700.0 764.002XHTMPLT 321.0 601.0 010.0 400.0 841.050BYH2SLT 801.0 651.0 200.0 020.0 450.001BYH2SLT 880.0 651.0 200.0 020.0 450.051BYH2SLT 870.0 651.0 200.0 020.0 450.002BYH2SLT 170.0 651.0 200.0 020.0 450.052BYH2SLT 760.0 651.0 200.0 020.0 450.003BYH2SLT 760.0 651.0 200.0 020.0 450.053BYH2SLT 860.0 651.0 200.0 020.0 450.051BYH3SLT 860.0 651.0 200.0 020.0 450.002BYH3SLT 850.0 651.0 200.0 020.0 450.052BYH3SLT 540.0 651.0 200.0 020.0 450.003BYH3SLT 540.0 651.0 200.0 020.0 450.053BYH3SLT 540.0 651.0 200.0 020.0 450.050LSDASLT 211.0 394.0 440.0 080.0 278.0
a delevartselimelcihevnoillib=tmvb
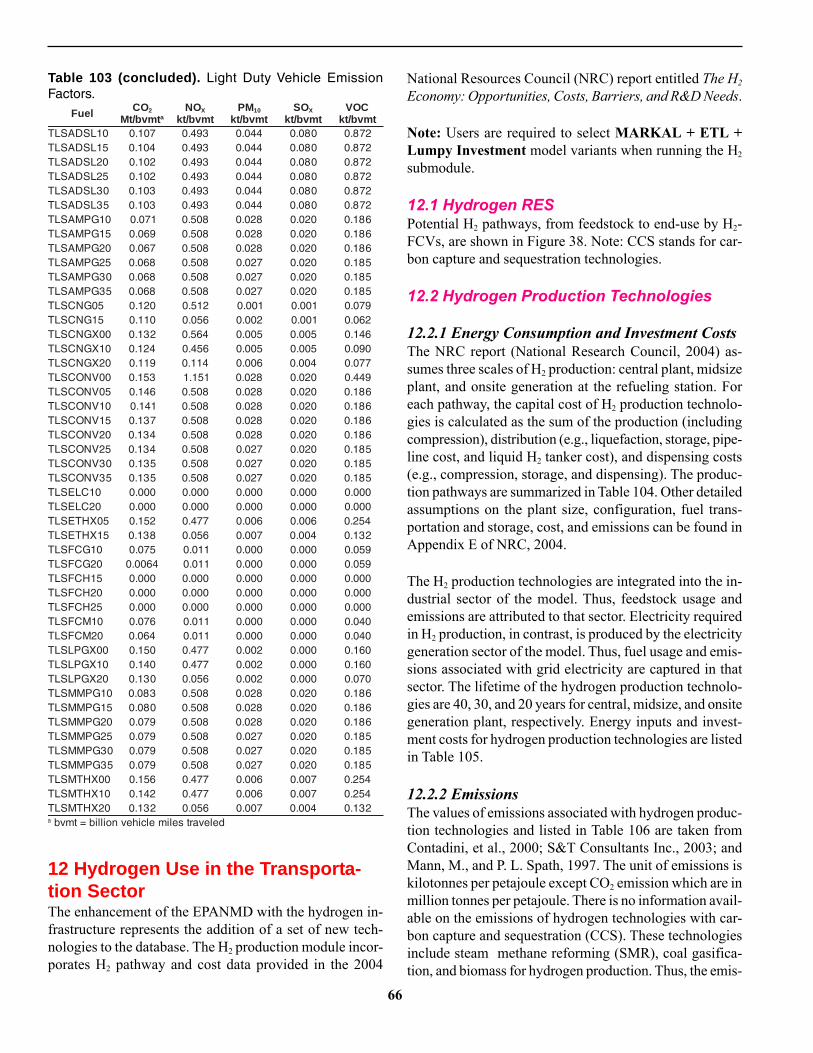
66
Table 103 (concluded). Light Duty Vehicle EmissionFactors.
leuF OC 2tmvb/tM a
ON Xtmvb/tk
MP 01tmvb/tk
OS Xtmvb/tk
COVtmvb/tk
01LSDASLT 701.0 394.0 440.0 080.0 278.051LSDASLT 401.0 394.0 440.0 080.0 278.002LSDASLT 201.0 394.0 440.0 080.0 278.052LSDASLT 201.0 394.0 440.0 080.0 278.003LSDASLT 301.0 394.0 440.0 080.0 278.053LSDASLT 301.0 394.0 440.0 080.0 278.001GPMASLT 170.0 805.0 820.0 020.0 681.051GPMASLT 960.0 805.0 820.0 020.0 681.002GPMASLT 760.0 805.0 820.0 020.0 681.052GPMASLT 860.0 805.0 720.0 020.0 581.003GPMASLT 860.0 805.0 720.0 020.0 581.053GPMASLT 860.0 805.0 720.0 020.0 581.0
50GNCSLT 021.0 215.0 100.0 100.0 970.051GNCSLT 011.0 650.0 200.0 100.0 260.0
00XGNCSLT 231.0 465.0 500.0 500.0 641.001XGNCSLT 421.0 654.0 500.0 500.0 090.002XGNCSLT 911.0 411.0 600.0 400.0 770.000VNOCSLT 351.0 151.1 820.0 020.0 944.050VNOCSLT 641.0 805.0 820.0 020.0 681.001VNOCSLT 141.0 805.0 820.0 020.0 681.051VNOCSLT 731.0 805.0 820.0 020.0 681.002VNOCSLT 431.0 805.0 820.0 020.0 681.052VNOCSLT 431.0 805.0 720.0 020.0 581.003VNOCSLT 531.0 805.0 720.0 020.0 581.053VNOCSLT 531.0 805.0 720.0 020.0 581.0
01CLESLT 000.0 000.0 000.0 000.0 000.002CLESLT 000.0 000.0 000.0 000.0 000.0
50XHTESLT 251.0 774.0 600.0 600.0 452.051XHTESLT 831.0 650.0 700.0 400.0 231.0
01GCFSLT 570.0 110.0 000.0 000.0 950.002GCFSLT 4600.0 110.0 000.0 000.0 950.051HCFSLT 000.0 000.0 000.0 000.0 000.002HCFSLT 000.0 000.0 000.0 000.0 000.052HCFSLT 000.0 000.0 000.0 000.0 000.001MCFSLT 670.0 110.0 000.0 000.0 040.002MCFSLT 460.0 110.0 000.0 000.0 040.000XGPLSLT 051.0 774.0 200.0 000.0 061.001XGPLSLT 041.0 774.0 200.0 000.0 061.002XGPLSLT 031.0 650.0 200.0 000.0 070.001GPMMSLT 380.0 805.0 820.0 020.0 681.051GPMMSLT 080.0 805.0 820.0 020.0 681.002GPMMSLT 970.0 805.0 820.0 020.0 681.052GPMMSLT 970.0 805.0 720.0 020.0 581.003GPMMSLT 970.0 805.0 720.0 020.0 581.053GPMMSLT 970.0 805.0 720.0 020.0 581.000XHTMSLT 651.0 774.0 600.0 700.0 452.001XHTMSLT 241.0 774.0 600.0 700.0 452.002XHTMSLT 231.0 650.0 700.0 400.0 231.0
a delevartselimelcihevnoillib=tmvb
12 Hydrogen Use in the Transporta-tion SectorThe enhancement of the EPANMD with the hydrogen in-frastructure represents the addition of a set of new tech-nologies to the database. The H2 production module incor-porates H2 pathway and cost data provided in the 2004
National Resources Council (NRC) report entitled The H2
Economy: Opportunities, Costs, Barriers, and R&D Needs.
Note: Users are required to select MARKAL + ETL +Lumpy Investment model variants when running the H2
submodule.
12.1 Hydrogen RESPotential H2 pathways, from feedstock to end-use by H2-FCVs, are shown in Figure 38. Note: CCS stands for car-bon capture and sequestration technologies.
12.2 Hydrogen Production Technologies
12.2.1 Energy Consumption and Investment CostsThe NRC report (National Research Council, 2004) as-sumes three scales of H2 production: central plant, midsizeplant, and onsite generation at the refueling station. Foreach pathway, the capital cost of H2 production technolo-gies is calculated as the sum of the production (includingcompression), distribution (e.g., liquefaction, storage, pipe-line cost, and liquid H2 tanker cost), and dispensing costs(e.g., compression, storage, and dispensing). The produc-tion pathways are summarized in Table 104. Other detailedassumptions on the plant size, configuration, fuel trans-portation and storage, cost, and emissions can be found inAppendix E of NRC, 2004.
The H2 production technologies are integrated into the in-dustrial sector of the model. Thus, feedstock usage andemissions are attributed to that sector. Electricity requiredin H2 production, in contrast, is produced by the electricitygeneration sector of the model. Thus, fuel usage and emis-sions associated with grid electricity are captured in thatsector. The lifetime of the hydrogen production technolo-gies are 40, 30, and 20 years for central, midsize, and onsitegeneration plant, respectively. Energy inputs and invest-ment costs for hydrogen production technologies are listedin Table 105.
12.2.2 EmissionsThe values of emissions associated with hydrogen produc-tion technologies and listed in Table 106 are taken fromContadini, et al., 2000; S&T Consultants Inc., 2003; andMann, M., and P. L. Spath, 1997. The unit of emissions iskilotonnes per petajoule except CO2 emission which are inmillion tonnes per petajoule. There is no information avail-able on the emissions of hydrogen technologies with car-bon capture and sequestration (CCS). These technologiesinclude steam methane reforming (SMR), coal gasifica-tion, and biomass for hydrogen production. Thus, the emis-

67
ELC
Personal Autom
otiveEnd U
se Dem
and
H2 FCV - Minivan
H2 FCV - Pickup
H2 FCV - SUV
H2 FCV - Full
H2 FCV - Compact
Hydrogen toTrans. Sector
SteamReforming
CoalGasification
BioGasification
Electrolysis/
SteamReforming
SteamReforming
Electrolysis
CCS(optional)
Natural Gas
Coal
Biomass
Solar
Wind
ELC Nuclear
ELC
ELC
ELC
ELC
Oil
Diesel
ELC
ELC
Central
Midsize
Onsite
Energy
Process
Demand
Figure 38. Hydrogen RES.
elacS ecruoSygrenEyramirP dohteMnoitcudorP nobraCrofsnoitpOerutpaC noitaiverbbA
2HG(noitatSlatrtneC b)saglarutaN gnimrofermaetS seY SCCRMSC,RMSC c
laoC noitacifisaG seY SCCGCC,GCC
2HL(ezisdiM d)saglarutaN gnimrofermaetS seY SCCRMSM,RMSM
ssamoiB noitacifisaG seY SCCOIBM,OIBM)dirg(yticirtcelE sisylortcelE ELEM
)2HG(detubirtsiD
saglarutaN gnimrofermaetS RSMD)dirg(yticirtcelE sisylortcelE ELED
dniW sisylortcelE TWDdirbyhdirgdnadniW sisylortcelE ELETWD
raloS sisylortcelE VPDdirbyhdirgdnaraloS sisylortcelE ELEVPD
a .4002,licnuoChcraeseRlanoitaNmorfdeifidom:ecruoSb Hsuoesag=2HG 2.c .noitartseuqesdnaerutpacnobrac=SCCd Hdiuqil=2HL 2.
Table 104. Hydrogen Production Pathways.
ygolonhceT FATSOCVNI
ry/JP(/$5991noilliM())yticapac
MOXIFnoilliM(
))ry/JP(/$5991p)TNE(PNI
)JP/JP(
RMSC2H 89.0 80.43 05.2 N_AEIAGN 40.1 CELE 24.0
SCCRMSC2H 9.0 73.63 22.3 N_AEIAGN 01.1 CELE 54.0
GCC2H 9.0 77.44 62.3 IAOC 93.1 CELE 74.0
SCCGCC2H 9.0 31.64 16.4 IAOC 93.1 CELE 15.0
RMSM2H 89.0 33.76 84.5 N_AEIAGN 01.1 CELE 93.0 2HTLSD 10.0
SCCRMSM2H 89.0 51.47 34.6 N_AEIAGN 51.1 CELE 24.0 2HTLSD 10.0
OIBM2H 9.0 30.551 34.11 0-DWOIB 96.2 CELE 55.0 2HTLSD 10.0
SCCOIBM2H 9.0 65.751 95.31 0-DWOIB 96.2 CELE 36.0 2HTLSD 10.0
ELEM2H 9.0 70.321 92.9 CELE 99.1 2HTLSD 10.0
RMSD2H 9.0 36.28 57.2 N_AEIAGN 23.1 CELE 70.0
ELED2H 9.0 00.211 37.3 CELE 56.1
TWD2H 72.0 16.98 69.9 2HTWCLE 56.1
VPD2H 81.0 33.68 93.41 2HVPCLE 56.1
ELETWD2H 9.0 42.021 10.4 2HTWCLE 05.0 CELE 61.1
ELEVPD2H 9.0 55.021 20.4 2HVPCLE 33.0 CELE 43.1
Table 105. Energy Inputs and Investment Costs for Hydrogen Production Technologies.

68
sions of these technologies with CCS are assumed to bethe same as the corresponding technologies without CCS,except sulfur emissions are 50% lower in those technolo-gies with CCS.
12.3 Additional Model ConfigurationAdditional modeling techniques and constraints are appliedwithin the H2 module of the EPANMD MARKAL tech-nology database.
12.3.1 Endogenous Technological Learning (ETL)Technological learning refers to the phenomenon by whichthe performance, productivity, and cost of a technologyimproves as the technology is applied and knowledge andexperience accumulate. In energy system models with ETL,learning is generally represented by a “learning curve” or“experience curve”, where the unit cost of production de-clines at a constant rate as experience with the technologygrows. A common form for a learning curve is
Y = a x–b
Where Y is the estimated average direct unit cost for thefirst x units; a is the direct unit cost needed to make thefirst unit; and b (b>0) is a parametric constant.
An 80 percent “progress ratio”, corresponding to a valueof 0.32 for b, is a typical value that has been used in manyapplications. This implies that the cost of technology willbe reduced to 80 percent of its original value for each cu-mulative capacity doubling. We use a relatively conserva-tive progress ratio of 90 percent for all H2 production tech-nologies, and 92 percent for H2 technologies with CCS.The maturity of each type of H2 production technology ischaracterized by its current cumulative capacity, which is
ygolonhceT)JP/tk(snoissimE
IOC a OC 2b ION a MP 01 COV IOS a OS 2
c
RMSC2H 97.51 8510.0 6500.0 2000.0 1000.0
SCCRMSC2H 76.1 7100.0 6500.0 2000.0 1000.0
GCC2H 59.43 0530.0 9231.0 0100.0 4241.0 1530.0 1530.0
SCCGCC2H 05.3 5300.0 9231.0 0100.0 4241.0 0700.0 0700.0
RMSM2H 17.61 7610.0 6500.0 2000.0 1000.0
SCCRMSM2H 47.1 7100.0 6500.0 2000.0 1000.0
OIBM2H 9231.0 0100.0 4241.0 1530.0 1530.0
SCCOIBM2H 46.85- 6850.0- 9231.0 0100.0 4241.0 0700.0 0700.0
RMSD2H 40.02 0020.0 6500.0 2000.0 1000.0a .rotceslairtsudniehtmorFb OCnahtrehtarnobracsaJP/tM 2.c OStahtrehtarruflussA 2.
Table 106. Emissions Associated with Hydrogen Production Technologies.
Table 107. ETL Parameters.
ygolonhceTRMSC2H 5.9 00.000,01 1 7080.43 6 9.0
SCCRMSC2H 5.9 00.000,01 1 1373.63 6 29.0
GCC2H 4.0 00.000,01 1 9268.54 6 9.0
SCCGCC2H 4.0 00.000,01 1 9031.64 6 29.0
RMSM2H 50.0 00.000,01 1 4823.76 6 9.0
SCCRMSM2H 50.0 00.000,01 1 8841.47 6 29.0
OIBM2H 10.0 00.000,01 1 3330.551 6 9.0
SCCOIBM2H 10.0 00.000,01 1 575.751 6 29.0
ELEM2H 10.0 00.000,01 1 1370.321 6 9.0
RMSD2H 50.0 00.000,01 1 9236.28 6 9.0
ELED2H 10.0 00.000,01 1 7899.111 6 9.0
TWD2H 10.0 00.000,01 1 7606.98 6 9.0
VPD2H 10.0 00.000,01 1 1523.68 6 9.0
CLETWD2H 10.0 00.000,01 1 5732.021 6 9.0
CLEVPD2H 10.0 00.000,01 1 6055.021 6 9.0
ET
L-C
UM
CA
P0
ET
L-C
UM
CA
PM
AX
ET
L-IN
DIC
ET
L-IN
VC
OS
T0
ET
L-N
UM
SE
G
ET
L-P
RO
GR
ATIO
obtained from Suresh, et al., 2001. ETL parameters arelisted in Table 107.
12.3.2 Lumpy InvestmentH2 production technologies, especially SMR, exhibit sub-stantial economies-of-scale. For example, the unit cost ofH2 production at a central plant is much less than that ofdistributed production. On the other hand, a large capitalinvestment is required to build the central plant and thesupporting infrastructure to deliver fuel to refueling sta-tions. MARKAL, in its standard configuration, is a linearprogramming (LP) model, and thus represents the capaci-ties of various technologies as continuous values. Conse-quently, the model may produce a result in which only a

69
fraction of a central plant and the supporting infrastructureare built, producing an unrealistic solution. To provide morerealistic investments, a mixed-integer programming-based“lumpy investment” option is used. Each time a new lumpof investment is made for a central plant or a midsize plant,the cost would include the necessary infrastructure (e.g.,pipeline, tanker, trucks, driver hours, cryo-liquefaction,storage, and refueling stations), as described by the NRCreport (2004). The sizes of investments in new capacityare assumed to be 394×106 kg of H2 per year (52.6 PJ/yr)for a central plant and 7.9×10⁶ kg per year (1.05 PJ/yr) fora midsize plant.
12.3.3 Constraints Added to Address H2 TransitionIssuesDue to the substantial transportation and distribution in-frastructure barriers faced by central and midsize plants,some experts predict that distributed generation at refuel-ing stations will likely be used to meet initial demandsbefore a full-scale H2 infrastructure is established. Thesestations could serve remote, less populated areas whereweak economies-of-scale are justified by high H2 deliverycosts and low demand. Thus, constraints are added to themodel to require that for the first year at least 20% and 5%of yearly H2 demand must be provided by distributed andmidsize plants, respectively. The minimum share con-straints are relaxed gradually and approach zero by 2030.
13 Model Quality Control ProcessesTo ensure an accurate representation the EPANMD, thedatabase has been constructed and evaluated in the fol-lowing ways:
1 Data were chosen using the established quality guide-lines outlined in the Quality Assurance Project Plandeveloped for this project. See Appendix A: DataSource Characterizations.
2 Data are fully documented and have been run throughquality control checks to ensure accurate transmissionof raw data into the MARKAL database.
3 Database was subject to a sector-by-sector peer reviewand a full model peer review.
4 A base EPANMD MARKAL run was assessed againstthe results of the AEO 2002. The run was set up usingthe same assumptions as those used in the AEO.
13.1 Data QualityWherever possible, data were taken from NEMS input dataunderlying the AEO 2002 (EIA, 2002d). AEO data wereselected for the Reference Energy System because it is anationally recognized source of technology data, widelyused where reference or default data are required. In somecases, AEO data were not available in a form that could beutilized for the EPANMD. Table 108, below, lists the datasources used for each sector, as well as the number of tech-nologies/resources in each sector.
For cases where metadata exist that describe precision,accuracy, completeness, or other uncertainty measures withrespect to the data, the data collector can use this informa-tion to assess data quality. In cases where no QA descrip-tions are available, the data collector must accept the dataon an as-is basis. The primary sources of the informationare ultimately responsible for the quality of their data.However, it is recognized that each source organizationmay have different levels of resources available to accom-plish their mission or may have differing commitments toquality assurance within their organization, and conse-quently data quality may vary from place to place in waysthat we cannot quantify.
As the majority of the EPANMD Base Case data comefrom EIA, the quality level of the data drawn from them isof particular interest. EIA has performance standards toensure the quality (i.e., objectivity, utility, and integrity)of information it disseminates to the public. Quality is en-sured and maximized at levels appropriate to the natureand timeliness of the disseminated information. EIA alsostrives for transparency about information and methods in
Table 108. Primary Data Sources Used in Developing the Database.
rotceS ecruoSataD ytilauQataD a secruoseR/seigolonhceTforebmuN
noitatropsnarTscirteMytilauQTTO A thgierfdnaregnessaprehto04;sessalcezis5niselcihevlanosrep51
seigolonhcet1002,.lateocciCeD B
laicremmoC SMEN A 003
laitnediseR SMEN A 531
lairtsudnI EGAS A 001~
yticirtcelESMEN A
54GATIRPE C
ylppuSecruoseR SMEN A detropmidnacitsemod,stcudorpmuelortepdetropmi01,sepytlaoc52saglarutandnalio
.AxidneppAnidnuofebnacsnoitinifedytilauqataDa

70
order to improve understanding and to facilitate reproduc-ibility of the information. For a complete description ofEIA’s Quality Guidelines see EIA, 2002h.
For the transportation base case sector the data are drawnfrom the U.S. Department of Energy’s Office of Transpor-tation Technologies Quality Metrics assessment. QM de-scribes the analytical process used in estimating futureenergy, environmental, and economic benefits of U.S. DOEEnergy Efficiency and Renewable Energy programs. QMseeks to monitor and measure the impacts of all DOE EE/RE programs and to summarize their overall national ef-fects. QM has been an active annual DOE EE/RE-wideanalysis and review procedure since 1995 (DOE, 2003).
Data for the electricity sector were drawn from NEMS withsupplemental data pulled from the Electric Power ResearchInstitute Technical Assessment Guide (EPRI, 1993). EPRIis a non-profit energy research consortium providing sci-entific research, technology development, and productimplementation for the energy industry. The TAG is a stan-dard reference work for the energy industry that character-izes key electric generation technologies and their opera-tion, costs, environmental impacts, etc.
The industrial sector representation was adapted from thecharacterization used in EIA’s SAGE model (EIA, 2003b).
13.2 Data DocumentationA primary concern of ISA-W is that the data are fully docu-mented, are translated properly into the database with re-quired units properly calculated, and are an accurate rep-resentation of the information provided in the referencesource. ISA-W is committed to using conversion method-ologies that are consistent with generally accepted profes-sional standards. In all work to transform original data intothe units and form needed for the MARKAL model, theconversion factors used are available in the supportingdocumentation.
The database manager followed a standard procedure tovalidate the data in each workbook. The procedure is:
1 Build MARKAL bulk upload sheets. Bulk upload is afeature of the MARKAL that enables data to be di-rectly taken from Excel spreadsheets into the modeldatabase.
2 Put workbook spreadsheets in standardized format withthe raw data spreadsheet at the end and the bulk up-load sheets at the front. In between, the spreadsheetsare ordered so that the flow from raw data form to theMARKAL form can be easily followed.
3 Clean up individual spreadsheets to make them easyto understand, including naming cells used in calcula-tions and re-ordering the placement of cells.
4 Check all links used in the spreadsheets.5 Check all calculations.
Completed workbooks were given to an ISA-W team mem-ber for review before distribution. During that review, ran-dom checks of 5% of the data were done to check for er-rors. Additionally, during the peer review process, review-ers were asked to confirm that the original data were accu-rately carried through the conversions to the finalMARKAL format.
Upon completion the bulk upload of each workbook intothe database, a random check of 10% of the data param-eters, comparing the EPANMD with the Excel documentswas done by an ISA-W team member to ensure that thebulk upload was performed correctly.
13.3 Peer ReviewEach sector’s data and documentation were then sent toseveral experts in that sector for review. Peer review ques-tions included:
• Has an appropriate data source for the sector been used?• Has that data been used appropriately?• Do the relative costs and performance of the technolo-
gies/resources look reasonable?• Are there technologies that should be included that
have not, or that have been included that should not?
Table 109 lists the peer reviewers by sector.
In general, peer review responses indicated that the datasources and ISA-W use of the data were appropriate. Sev-eral minor errors and omissions were identified and cor-rected. The reviewers also made several suggestions forfuture technologies that could be examined through sce-nario analysis in sectors beyond transportation.
Additionally, a full-model peer review was performed bytwo seasoned MARKAL users:
• Paul Friley of the Energy, Environmental, and Eco-nomic Analysis Group of Brookhaven National Labo-ratory
• Lessly Goudarzi, President, OnLocation/Energy Sys-tems Consulting
Peer review comments and responses are summarized inAppendix C.

71
Table 109. Sector Peer Reviewers.rotceS detivnI detpeccA dednopseR slaudividnI
laitnediseR 11 7 3)EOD/AIE(ykslabmyCnhoJ
)LNBL(yemooKnohtanoJ)DPPC/APE(yrenihCnnelG/navilluSmiJ
noitatropsnarT 9 6 5
)QATO/APE(mahroGregoR)EEECA(regnaLeserehT
)LNA(niktolPevetS)FDE(occiCiDnhoJ
)hciM.U(anialeMcraM/)LNA(nosnaHnoD
ylppuSecruoseR 31 4 4
)LTEN/EOD(regnalioBdyolF)DPPC/APE(latohleDyesaC
)IPA(senoJllessuR)EOD/AIE(sedyaK/itnoCnhoJ
yticirtcelE 61 9 3)LTEN/EOD(regnalioBdyolF
)FFR(wartruBsallaD)seinapmoCnrehtuoS(elboNllessuR
laicremmoC 11 5 4
)DPPC/APE(navilluSmiJ)EEECA(shcaSyevraH
)EOD/AIE(rekcedeoBnirE)LNBL(yemooKnohtanoJ
14 CalibrationFollowing the incorporation of peer review comments andany necessary changes into the Reference Energy Systemdatabase, the model was run for comparison and calibra-tion to AEO 2002 results. AEO 2002 was selected as acalibration benchmark for two reasons. First, the AnnualEnergy Outlook is a nationally recognized short- to mid-term energy technology and consumption forecast whichis widely used where a reference forecast is required. Sec-ond, much of our Reference Energy System data were de-rived from AEO 2002 input data.
The goals of the calibration were• to ensure that the model was producing reasonable re-
sults, given its input assumptions,• to determine whether the model was providing a plau-
sible, consistent representation of the key features ofthe U.S. energy system,
• in cases where our results differed from AEO results,to be able to identify why the differences exist, and
• to identify any significant errors in the construction orcharacterization of the Reference Energy System.
The results from the EPANMD for total energy consump-tion, consumption by sector, and within sector by use werecompared to the AEO 2002, Table A1, Table A2, and TablesA4-A9, respectively. Broad trends (upward, downward,or changing over the time horizon) were also compared tosee if the EPANMD results tracked with the AEO trends.Finally, the degree of quantitative match between theEPANMD results and AEO 2002 were compared.
The model used to produce AEO 2002, the National En-ergy Modeling System (NEMS), differs in many respects
from MARKAL. In general, sectors are modeled in moredetail, more aspects of consumer and producer behaviorare simulated, and NEMS is generally more conservativeabout switching fuels and technology types than isMARKAL. Therefore, unconstrained MARKAL results arenot expected to match AEO results exactly.
In some cases, constraints were added to force MARKALto track AEO more closely. The decision to use constraintsto force MARKAL to track AEO involves trade-offs be-tween desired model characteristics. On the one hand, it isdesirable that the EPANMD’s behavior is realistic in that itrepresents real constraints and inflexibilities in the energysystem. On the other hand, AEO results are a simulation ofNEMS modelers’ judgment about the most likely direc-tion of the energy system, whereas the EPANMD is beingused to explore a variety of scenarios for the system’s fu-ture evolution. Therefore the EPANMD should not beforced to track AEO so closely that it lacks the flexibilityto respond with different outcomes to differing input as-sumptions.
Constraints have been added where there is an underlyingfeature of the energy system that an unconstrainedMARKAL run does not represent. These constraints arehighlighted within the model to make them easily adjust-able by the user.
Examples of these constraints include• Commercial and residential heating technology fuel
splits were implemented equivalent to AEO 2002 shareswith a 3% relaxation rate,
• Growth constraint placed on wind electricity genera-tion based on AEO 2002 growth rate, and

72
• Added Transportation LDV class splits.
The next step in the calibration process was to comparefuel prices in each sector and add price mark-ups whereneeded. Fuel markups reflect any additional taxes or costsassociated with fuels that are not captured by the MARKALmodel.
The markups are currently in the EPANMD are
pukraM tnuomAJP/$5991M
dna,lairtsudnI,cirtcelE,laicremmoCotHSDsrotceSnoitatropsnarT 1
srotceSlaitnediseRdna,lairtsudnI,laicremmoCotLSD 2rotceScirtcelEotLSD 5
rotceSnoitatropsnarTotLSD 3rotceSnoitatropsnarTotLSG 6
noitatropsnarTdna,laitnediseR,lairtsudnIotGPLsrotceS 5
Total Energy Use
100000
105000
110000
115000
120000
125000
130000
135000
140000
2000 2005 2010 2015 2020
AEOEPANMD
Electric Sector Total Energy Use
30000
35000
40000
45000
50000
55000
2000 2005 2010 2015 2020
AEOEPANMD
Commercial Sector Total Energy Use
6000
7000
8000
9000
10000
11000
12000
13000
2000 2005 2010 2015 2020
AEOEPANMD
Industrial Sector Total Energy Use
25000
27000
29000
31000
33000
35000
37000
39000
2000 2005 2010 2015 2020
AEOEPANMD
Residential Sector Total Energy Use
1000010500110001150012000125001300013500140001450015000
2000 2005 2010 2015 2020
AEOEPANMD
Transportation Sector Total Energy Use
25000270002900031000330003500037000390004100043000
2000 2005 2010 2015 2020
AEOEPANMD
Figure 39. Comparison of EPANMD to AEO2002: Sector Specific Energy Use in PJ.

73
As illustrated in Figure 39, total energy consumption inthe EPANMD is within 20% of AEO2002 values. The larg-est deviation from the AEO occurs with gasoline (GSL)consumption. Looking at sector specific use, the differ-ence occurs in the transportation sector.
Figures 40 and 41 show the comparison between theAEO2002 and the EPANMD in system-wide consumptionof fuels.
The 2002 AEO transportation results are very pessimisticand only allow a small penetration of non-conventional
technologies. As the transportation sector is one of the sec-tors that is the focus of this research, it is desirable to notrestrict the EPANMD model to the level that the AEO isrestricted, which caused the deviation of EPANMD fromthe AEO 2002 in the transportation sector. So as one lastcalibration step, the EPANMD was run with a new sce-nario in which the constraints on the transportation vehicleswere limited to the technology penetration levels in theAEO 2002. This brought the EPANMD gasoline consump-tion numbers to within 10% of the AEO numbers. Withthis result, the EPA MARKALmodel is deemed to be “cali-brated”.
Total Coal Use - System Wide
20000
22000
24000
26000
28000
30000
32000
34000
2000 2005 2010 2015 2020
AEOEPANMD
Total NGA Use: System Wide
15000
20000
25000
30000
35000
40000
2000 2005 2010 2015 2020
AEOEPANMD
Total GSL Use System Wide
13000
15000
17000
19000
21000
23000
25000
2000 2005 2010 2015 2020
AEOEPANMD
Total DSL Use System Wide
7000
9000
11000
13000
15000
17000
19000
2000 2005 2010 2015 2020
AEOEPANMD
Figure 40. Comparison of EPANMD to AEO2002: System-Wide Coal, Natural Gas, Gasoline, and Diesel Use in PJ.

74
Figure 41. Comparison of EPANMD to AEO2002: System-Wide Fuel Oil, Renewables, Liquid Petroleum Gas, andNuclear Use in PJ.
Total DSH Use System Wide
0
500
1000
1500
2000
2500
3000
3500
4000
2000 2005 2010 2015 2020
AEOEPANMD
Total Renewables Use System Wide
5000550060006500700075008000850090009500
10000
2000 2005 2010 2015 2020
AEOEPANMD
Total LPG Use System Wide
20002200240026002800300032003400360038004000
2000 2005 2010 2015 2020
AEOEPANMD
Total Nuclear Use System Wide
7500
7700
7900
8100
8300
8500
8700
2000 2005 2010 2015 2020
AEOEPANMD
15 ReferencesAnsolabehere, S. et al., 2003. The Future of Nuclear Power:An Interdisciplinary MIT Study. Massachusetts Institute of Tech-nology, (ISBN 0-615-12420-8), available online athttp://web.mit.edu/nuclearpower/ (accessed February, 2006).
Argonne National Labs, 2001. The Greenhouse Gases, Regu-lated Emissions, and Energy Use in Transportation (GREET)Model, available online athttp://www.transportation.anl.gov/software/GREET/index.html(accessed February, 2006).
Contadini, J.F., et al., 2000. Hydrogen Production Plants: Emis-sions and Thermal Efficiency Analysis, Second InternationalSymposium on Technological and Environmental Topics inTransports, Milan, Italy.
Davis, S.C., 2001. Transportation Energy Data Book, Edition21; Center for Transportation Analysis, Energy Division, OakRidge National Lab, for Office of Transportation Technologies,U.S. Department of Energy; October, ORNL-6966 (Edition 21of ORNL-5198), available online athttp://cta.ornl.gov/cta/Publications/Reports/ORNL-6966.pdf.(accessed February, 2006).
Davis, S.C., and Diegel, S.W., 2004. Transportation Energy DataBook, Edition 24; Center for Transportation Analysis, EnergyDivision, Oak Ridge National Lab, for Office of TransportationTechnologies, U.S. Department of Energy; December, ORNL-6973 (Edition 24 of ORNL-5198), available online athttp://cta.ornl.gov/cta/Publications/Reports/TEDB_Edition24_ORNL_6973.pdf(accessed February, 2006).
DeCicco, J., and Kliesch, J. 2001. Rating the EnvironmentalImpacts of Motor Vehicles: ACEEE’s Green Book® Methodol-ogy, 2001 Edition, Report No. T011, American Council for anEnergy-Efficient Economy.
DeCicco, J., 2003. An, F., and Ross, M.. Technical Options forImproving the Fuel Economy of U.S. Cars and Light Trucks by2010-2015, The Energy Foundation.
Delucchi, M.A., 2003. A Lifecycle Emissions Model (LEM):Lifecycle Emissions from Transportation Fuels, Motor Vehicles,Transportation Modes, Electricity Use, Heating and CoolingFuels, and Materials–Documentation of methods and data-

75
MAIN REPORT, Institute of Transportation Studies, Universityof California, December, available online athttp://www.its.ucdavis.edu/publications/2003/UCD-ITS-RR-03-17-MAIN.pdf(accessed February, 2006).
DOE, 1999. Supporting Analysis for the Comprehensive Elec-tricity Competition Act, DOE/PO-0059, Office of Economic,Electricity and Natural Gas Analysis, U.S. Department of En-ergy, Washington, DC, May, available online athttp://www.pi.energy.gov/pdf/library/electricity/execsumb.pdf(accessed February, 2006).
DOE, 2001. A Roadmap to Deploy New Nuclear Power Plantsin the United States by 2010, Office of Nuclear Energy, Scienceand Technology, U.S. Department of Energy, Washington, DC,available online at http://np2010.ne.doe.gov/NP2010Pubs.asp(accessed February, 2006).
EIA Form 767. available online athttp://www.eia.doe.gov/cneaf/electricity/page/eia767.html (ac-cessed February, 2006).
EIA Form 860. available online athttp://www.eia.doe.gov/cneaf/electricity/page/eia860.html (ac-cessed February, 2006).
EIA, 1995. Electric Power Annual 1995 Volume II, DOE/EIA-0348(95), Energy Information Administration, U.S. Departmentof Energy, Washington, DC, December 1996, available onlineat http://tonto.eia.doe.gov/FTPROOT/electricity/0348952.pdf(accessed February, 2006).
EIA, 1996, Annual Energy Outlook 1996 with Projections to2015, DOE/EIA-0383(96), Energy Information Administration,U.S. Department of Energy, Washington, DC, January, avail-able online athttp://tonto.eia.doe.gov/FTPROOT/forecasting/038396.pdf (ac-cessed February, 2006).
EIA, 1997a, Natural Gas Annual 1997, DOE/EIA-0131(97),Energy Information Administration, U.S. Department of Energy,Washington, DC, October 1998, available online athttp://tonto.eia.doe.gov/FTPROOT/natgas/013197.pdf (accessedFebruary, 2006).
EIA, 1997b, AEO Supplement for 1997, Energy InformationAdministration, U.S. Department of Energy, Washington, DC,available online at http://www.eia.doe.gov/oiaf/archive.html (ac-cessed February, 2006).
EIA, 1998. Challenges of Electric Power Industry Restructur-ing for Fuel Suppliers, DOE/EIA-0623, Energy InformationAdministration, U.S. Department of Energy, Washington, DC,September, available online athttp://tonto.eia.doe.gov/FTPROOT/electricity/0623.pdf (ac-cessed February, 2006).
EIA, 1998. Annual Energy Outlook 1998 with Projections to2020, DOE/EIA-0383(98), Energy Information Administration,U.S. Department of Energy, Washington, DC, available onlineat http://tonto.eia.doe.gov/FTPROOT/forecasting/038398.pdf(accessed February, 2006).
EIA, 1998c. Manufacturing Energy Consumption Survey(MECS), Energy Information Administration, U.S. Departmentof Energy, Washington, DC, available online athttp://www.eia.doe.gov/emeu/mecs/contents.html (accessed Feb-ruary, 2006).
EIA, 1999. U.S. Coal Reserves: 1997 Update, DOE/EIA-0529(1997), Energy Information Administration, U.S. Depart-ment of Energy, Washington, DC, February, available online athttp://tonto.eia.doe.gov/FTPROOT/coal/052997.pdf (accessedFebruary, 2006).
EIA, 2001. Natural Gas Annual 2001, DOE/EIA-0131(2001),Energy Information Administration, U.S. Department of Energy,Washington, DC, February, 2003, available online athttp://tonto.eia.doe.gov/FTPROOT/natgas/013101.pdf (accessedFebruary, 2006).
EIA, 2002a, AEO 2002 Supply Curves for Imported RefinedProducts (provided by Han-Lin Lee of EIA, Energy Informa-tion Administration, U.S. Department of Energy.
EIA, 2002b. AEO 2002 Supply Curves for Imported Crude Oil(provided by Han-Lin Lee of EIA), Energy Information Admin-istration, U.S. Department of Energy.
EIA, 2002c. Assumptions to the Annual Energy Outlook 2002,DOE/EIA-0554, Energy Information Administration, U.S. De-partment of Energy, Washington, DC, December 2001, avail-able online athttp://tonto.eia.doe.gov/FTPROOT/forecasting/0554(2002).pdf(accessed February, 2006).
EIA, 2002d. Annual Energy Outlook 2002 with Projections to2020, DOE/EIA-0383(2002), Energy Information Administra-tion, U.S. Department of Energy, Washington, DC, December2001, available online athttp://tonto.eia.doe.gov/FTPROOT/forecasting/0383(2002).pdf(accessed February, 2006).
EIA, 2002e. AEO 2002 Residential Technology Equipment TypeDescription File (provided by John Cymbalsky of EIA), EnergyInformation Administration, U.S. Department of Energy.
EIA, 2002f. AEO 2002 Commercial Technology Cost and Per-formance File (provided by Erin Boedecker of EIA), EnergyInformation Administration, U.S. Department of Energy.
EIA, 2002g. International Energy Outlook 2002, DOE/EIA-0484(2002), Energy Information Administration, U.S. Depart-ment of Energy, Washington, DC, March 2002, available at

76
http://tonto.eia.doe.gov/FTPROOT/forecasting/0484(2002).pdf(accessed February, 2006).
EIA, 2002h. Energy Information Administration InformationQuality Guidelines, Energy Information Administration, U.S.Department of Energy, Washington, DC, available online athttp://www.eia.doe.gov/smg/EIA-IQ-Guidelines.html (accessedFebruary, 2006).
EIA, 2003a. Model Documentation Report: System for the Analy-sis of Global Energy Markets (SAGE), Volumes 1 and 2, DOE/EIA-M072(2003), Volume 1 available online athttp://tonto.eia.doe.gov/FTPROOT/modeldoc/m072(2003)1.pdfand Volume 2 available online athttp://tonto.eia.doe.gov/FTPROOT/modeldoc/m072(2003)2.pdf(both accessed February, 2006).
EIA, 2003b. The National Energy Modeling System: An Over-view, DOE/EIA-0581(2003), Energy Information Administra-tion, U.S. Department of Energy, Washington, DC, March, avail-able online athttp://tonto.eia.doe.gov/FTPROOT/forecasting/05812003.pdf(accessed February, 2006).
EIA, 2004. Annual Energy Outlook 2004 with Projections to2025, DOE/EIA-0383(2004), Energy Information Administra-tion, U.S. Department of Energy, Washington, DC, January, avail-able online athttp://tonto.eia.doe.gov/FTPROOT/forecasting/0383(2004).pdf(accessed February, 2006).
EPA, AP 42, Fifth Edition Compilation of Air Pollutant Emis-sion Factors, Volume 1: Stationary Point and Area Sources,Office of Air Quality Planning & Standards, U.S. Environmen-tal Protection Agency, Washington, DC, available online athttp://www.epa.gov/ttn/chief/ap42/ (accessed February, 2006).
EPA Clean Air Markets – Data and Maps, Clean Air MarketsDivision, U.S. Environmental Protection Agency, Washington,DC, available online at http://cfpub.epa.gov/gdm/ (accessed Feb-ruary, 2006).
EPA, 1999. Determination of CO Basic Emission Rates, OBDand I/M Effects for Tier 1 and Later LDVs and LDTs (DRAFT),EPA420-P-99-017, Office of Transportation and Air Quality, U.S.Environmental Protection Agency, Washington, DC, availableat http://www.epa.gov/otaq/models/mobile6/m6exh009.pdf (ac-cessed February, 2006).
EPA, 2000a. National Air Pollutant Emission Trends Report,1900-1998, EPA-454/R-00-002 [NTIS PB2000-108054], Of-fice of Air Quality Planning and Standards, Research TrianglePark, NC, Environmental Protection Agency, March, available athttp://www.epa.gov/ttn/chief/trends/trends98/trends98.pdf (ac-cessed February, 2006).
EPA, 2000b. National Air Quality and Emission Trends Report,1999, EPA-454/R-01/004 [NTIS PB2002-100137], Office of AirQuality Planning and Standards, U.S. Environmental Protec-tion Agency, Research Triangle Park, NC, March, available athttp://www.epa.gov/air/airtrends/aqtrnd99/ (accessed February,2006).
EPA, 2000. Coal Utility Environmental Cost (CUECost, Ver 3.0),Office of Air Quality Planning and Standards, U.S. Environ-mental Protection Agency, Research Triangle Park, NC, avail-able online at http://www.epa.gov/ttn/catc/products.html#cccinfo(accessed February, 2006).
EPA, 2001a. MOBILE6 Vehicle Emission Modeling Software,Office of Transportation and Air Quality, U.S. EnvironmentalProtection Agency, Washington, DC, available online athttp://www.epa.gov/OMS/m6.htm#m60 (accessed February,2006).
EPA, 2001b. Fuel Sulfur Effects on Exhaust Emissions: Recom-mendations for MOBILE6, EPA-420/R-01/039, Office of Trans-portation and Air Quality, U.S. Environmental Protection Agency,Washington, DC, July, available online athttp://www.epa.gov/otaq/models/mobile6/r01039.pdf (accessedFebruary, 2006).
EPA, 2003. Inventory of U.S. Greenhouse Gas Emissions andSinks: 1990-2001, [FRL-7449-1], U.S. Environmental Protec-tion Agency, Washington, DC, July, available online athttp://www.epa.gov/fedrgstr/EPA-AIR/2003/February/Day-07/a3063.htm(accessed February, 2006).
EPA, 2004. Demonstration of a Scenario Approach for Tech-nology Assessment, EPA-600/R-04/135, Air Pollution reventionand Control Division, U.S. Environmental Protection Agency,Research Triangle Park, NC, July.
EPA, 2005. Stand alone Documentation for EPA Base Case 2004(V.2.1.9) Using the Integrated Planning Model. Chapter 8: Ap-pendices, Clean Air Markets Division, U.S. Environmental Pro-tection Agency, Washington, DC, available online athttp://www.epa.gov/airmarkets/epa-ipm/bc8appendix.pdf (ac-cessed February, 2006).
EPRI, 1993. TAG Technical Assessment Guide, Vol. 2: Electric-ity End Use, Pt. 2: Commercial Electricity Use, Electric PowerResearch Institute, Palo Alto, CA.
ETSAP, 2004. Documentation for the MARKAL Family of Mod-els, The Energy Technology Systems Analysis Programme(ETSAP), available online athttp:///www.etsap.org/MrklDoc-I_StdMARKAL.pdf (accessedFebruary, 2006).
IEA, 2003. Energy Statistics: OECD and Non-OECD Countries,and Energy Balances: OECD and Non-OECD Countries, Inter-national Energy Agency, Paris, France, available online at

77
http://195.200.115.136/dbtw-wpd/Textbase/stats/index.asp (ac-cessed February, 2006).
Jaques, A.P. 1992. Canada’s Greenhouse Gas Emissions: Esti-mates for 1990, Report EPS 5/AP/4, Environment Canada, Ot-tawa.
Jaques, A., F. Neitzert, and P. Boileau. 1997. Trends in Canada’sGreenhouse Gas Emissions: 1990-1995, Cat. No. En49-5/5-8E;ISBN 0662256433, Environment Canada, Ottawa, January.
Mann, M., and P.L. Spath, 1997. Life-Cycle Assessment of a Bio-mass Gasification Combined-Cycle Power System, NREL re-port number TP-430-23076, National Renewable Energy Labo-ratory, Golden, CO, December, available online athttp://www.nrel.gov/docs/legosti/fy98/23076.pdf (accessed Feb-ruary, 2006).
National Research Council, 2004. The Hydrogen Economy:Opportunities, Costs, Barriers, and R&D Needs, The NationalAcademies Press, Washington, DC.
Nobel-Soft, 2003. ANSWER MARKAL, An Energy Policy Opti-mization Tool version 5 (provided by Ken Noble of [email protected] ), Nobel-Soft Systems Ltd.
OECD, 2002. Uranium 2001: Resources, Production, and De-mand, Nuclear Energy Agency/International Atomic EnergyAgency, Organisation for Economic Co-operation and Devel-opment.
Patterson, P., J. Moore, M. Singh, E. Steiner, 2002. Programanalysis methodology, Office of Transportation Technologies2003 quality metrics final report, ANL/ES/RP-108642, March.
S&T Consultants Inc., 2003. The Addition of Coal and Biomassto Hydrogen Pathways to GHGenius. (S&T)2 Consultants Inc.,Delta, BC, Canada, prepared for Natural Resources Canada,Office of Energy Efficiency, August.
Suresh, B., et al., 2001. Chemical Economics Handbook: Hy-drogen. Menlo Park, CA, SRI International.
UN, 1999. Statistical Yearbook 1998. Forty-fifth issue, UnitedNations, Department for Economic and Social Information andPolicy Analysis Statistics Division, New York, available athttps://unp.un.org/details.aspx?entry=E01SYD&title=Statistical+Yearbook+1998+(CD-ROM)(accessed February, 2006).
U.S. GCRIO, 2002. U.S. Climate Action Report, U.S. GlobalChange Research Information Office, available online athttp://www.gcrio.org/CAR2002/ (accessed February, 2006).

78

79
Appendix AData Source Characterization

80
Sources that may be used when gathering secondary datafall under seven general classifications.
a) Federal Organizations and Labora-toriesA variety of Federal organizations collect data that may beapplicable to the assessments that will be performed underthis project. The two primary organizations are the EnergyInformation Administration (EIA) for energy and technol-ogy data to be used in MARKAL and the EnvironmentalProtection Agency for emissions data. EIA was establishedin 1977 as an independent authority from DOE for datacollection and from the rest of the Federal government withrespect to the context of the EIA reports. EIA is mandatedto collect, assemble, evaluate, and analyze energy infor-mation and to provide energy information and projectionsto the Federal and state governments and the public. EIAauthority was expanded in the Energy Policy Act of 1992to data collection and analysis of several additional areasincluding energy consumption, alternative fuels and alter-natively fueled vehicles, and electricity production fromrenewable energy sources.
Federal labs that have data appropriate to the transporta-tion and energy sectors include National Renewable En-ergy Laboratory (NREL), Lawrence Berkley Laboratories(LBL), Oak Ridge National Laboratories (ORNL), theTransportation Research Board (National Academy of Sci-ences), and others.
b) State AgenciesState agencies collect data that may be applicable to theassessments like Federal organizations do. Examples in-clude Southern California Air Quality Management Dis-trict, various energy and state transportation departments,and NESCAUM (Northeast States for Coordinated Air UseManagement).
c) Academic StudiesAcademic institutions collect data that may be applicableto the assessments. An example is the University of Cali-fornia –Davis, Transportation Studies Department.
d) Research Studies from Non-Gov-ernmental OrganizationsExample organizations include The Pew Center, TyndallCenter, Cato Institute, and the Stockholm EnvironmentalInstitute.
e) Journal Articles and ConferenceProceedingsJournal articles that are peer-reviewed are more desirablethan non-peer-reviewed articles. Journals may be publishedindependently or in association with an industry or tradeorganization. Independently published journals such asEnergy Policy and Nature are considered more desirablethan peer-reviewed journals of trade associations. Confer-ence proceedings, such as the Annual Conference of theTransportation Research Board and the Annual U.S. Hy-drogen Meeting and Exposition, may be of a lower qualitysince many have not been peer-reviewed.
f) Manufacturer or Trade LiteratureIn some cases manufacturer product literature may be theprimary source for technology performance and cost in-formation. Other trade literature may provide statisticalinformation on new products. Literature from trade societ-ies or industry associations provides another format forgathering technology information. Examples of such groupsinclude the Society of Automotive Engineers and the Elec-tric Vehicle Association of America.
g) Individual EstimatesThere may be some instances where there are insufficientdata from the above sources to fully specify a future tech-nology as required in MARKAL. Thus a value must beestimated. When this occurs, documentation of the ap-proach that clearly shows the derivation of the value willbe required.
All data sources are reviewed for any known bias towardsany technology or any obvious corporate influence in theresearch. Documentation of data source will include thestudy objective and the researchers involved. For the pur-poses of this project, data quality of the sources listed inSection 3.1 are ranked as follows:
knaR ytilauQ ecruoSA tsehgiH seirotarobaldnaseicnegaetatsdnalaredeF
B dnoceS dna,seidutscimedaca,selcitralanruojtnednepednIerutaretiltcudorprerutcafunam
C drihT lanruojedart,snoitazinagrolatnemnrevog-n0Ndeweiverreep:sgnideecorpecnerefnocdna,selcitra
D htruoF :erutaretiledartrehtodnasgnideecorpecnerefnoCdeweiverreepton
E tsewoL setamitselaudividnI

81
Appendix BDetailed Sector Data

COAL RESOURCE SUPPLY
continued
START CUM COST year PJ 95USmillion$/PJ MARKAL Technology Name 1995 2000 2005 2010 2015 2020 2025 2030 2035 MINCABHS1 Coal --App., Bit., High Sulfur, Surface, Stp 1 1995 53774 0.806 0.806 0.749 0.743 0.736 0.728 0.728 0.728 0.728 MINCABHS2 Coal --App., Bit., High Sulfur, Surface, Stp 2 1995 4388 0.827 0.827 0.769 0.763 0.756 0.748 0.748 0.748 0.748 MINCABHS3 Coal --App., Bit., High Sulfur, Surface, Stp 3 1995 4586 0.849 0.849 0.790 0.783 0.776 0.768 0.768 0.768 0.768 MINCABHS4 Coal --App., Bit., High Sulfur, Surface, Stp 4 1995 3825 0.867 0.867 0.806 0.799 0.792 0.783 0.783 0.783 0.783 MINCABHS5 Coal --App., Bit., High Sulfur, Surface, Stp 5 1995 1957 0.875 0.875 0.814 0.807 0.800 0.791 0.791 0.791 0.791 MINCABHS6 Coal --App., Bit., High Sulfur, Surface, Stp 6 1995 4035 0.893 0.893 0.830 0.823 0.816 0.807 0.807 0.807 0.807 MINCABHS7 Coal --App., Bit., High Sulfur, Surface, Stp 7 1995 5222 0.915 0.915 0.850 0.843 0.835 0.827 0.827 0.827 0.827 MINCABHS8 Coal --App., Bit., High Sulfur, Surface, Stp 8 1995 5450 0.936 0.936 0.871 0.863 0.855 0.846 0.846 0.846 0.846 MINCABHU1 Coal --App., Bit., High Sulfur, Undergrd, Stp 1 1995 279273 0.801 0.801 0.747 0.742 0.736 0.728 0.728 0.728 0.728 MINCABHU2 Coal --App., Bit., High Sulfur, Undergrd, Stp 2 1995 28070 0.823 0.823 0.767 0.763 0.756 0.748 0.748 0.748 0.748 MINCABHU3 Coal --App., Bit., High Sulfur, Undergrd, Stp 3 1995 29956 0.844 0.844 0.787 0.783 0.776 0.768 0.768 0.768 0.768 MINCABHU4 Coal --App., Bit., High Sulfur, Undergrd, Stp 4 1995 25383 0.862 0.862 0.803 0.799 0.792 0.783 0.783 0.783 0.783 MINCABHU5 Coal --App., Bit., High Sulfur, Undergrd, Stp 5 1995 13152 0.870 0.870 0.811 0.807 0.800 0.791 0.791 0.791 0.791 MINCABHU6 Coal --App., Bit., High Sulfur, Undergrd, Stp 6 1995 27337 0.888 0.888 0.827 0.823 0.816 0.807 0.807 0.807 0.807 MINCABHU7 Coal --App., Bit., High Sulfur, Undergrd, Stp 7 1995 36065 0.909 0.909 0.847 0.843 0.835 0.827 0.827 0.827 0.827 MINCABHU8 Coal --App., Bit., High Sulfur, Undergrd, Stp 8 1995 38237 0.931 0.931 0.867 0.863 0.855 0.846 0.846 0.846 0.846 MINCABLS1 Coal --App., Bitum., Low Sulfur, Surface, Stp 1 1995 64693 0.909 0.909 0.845 0.811 0.802 0.783 0.783 0.783 0.783 MINCABLS2 Coal --App., Bitum., Low Sulfur, Surface, Stp 2 1995 5491 0.936 0.936 0.869 0.833 0.824 0.806 0.806 0.806 0.806 MINCABLS3 Coal --App., Bitum., Low Sulfur, Surface, Stp 3 1995 5759 0.960 0.960 0.892 0.855 0.846 0.827 0.827 0.827 0.827 MINCABLS4 Coal --App., Bitum., Low Sulfur, Surface, Stp 4 1995 19974 0.980 0.980 0.847 0.873 0.864 0.844 0.844 0.844 0.844 MINCABLS5 Coal --App., Bitum., Low Sulfur, Surface, Stp 5 1995 2462 0.991 0.991 0.920 0.882 0.872 0.851 0.851 0.851 0.851 MINCABLS6 Coal --App., Bitum., Low Sulfur, Surface, Stp 6 1995 5082 1.010 1.010 0.939 0.899 0.890 0.870 0.870 0.870 0.870 MINCABLS7 Coal --App., Bitum., Low Sulfur, Surface, Stp 7 1995 6605 1.035 1.035 0.961 0.922 0.911 0.890 0.890 0.890 0.890 MINCABLS8 Coal --App., Bitum., Low Sulfur, Surface, Stp 8 1995 6891 1.060 1.060 0.984 0.943 0.933 0.912 0.912 0.912 0.912 MINCABLU1 Coal --App., Bitum., Low Sulfur, Undergrd, Stp 1 1995 111482 0.872 0.872 0.841 0.845 0.831 0.806 0.806 0.806 0.806 MINCABLU2 Coal --App., Bitum., Low Sulfur, Undergrd, Stp 2 1995 14246 0.894 0.894 0.873 0.881 0.867 0.839 0.839 0.839 0.839 MINCABLU3 Coal --App., Bitum., Low Sulfur, Undergrd, Stp 3 1995 15479 0.918 0.918 0.898 0.906 0.891 0.862 0.862 0.862 0.862 MINCABLU4 Coal --App., Bitum., Low Sulfur, Undergrd, Stp 4 1995 13316 0.936 0.936 0.917 0.926 0.911 0.881 0.881 0.881 0.881 MINCABLU5 Coal --App., Bitum., Low Sulfur, Undergrd, Stp 5 1995 6966 0.946 0.946 0.927 0.936 0.921 0.891 0.891 0.891 0.891 MINCABLU6 Coal --App., Bitum., Low Sulfur, Undergrd, Stp 6 1995 14623 0.965 0.965 0.946 0.955 0.940 0.909 0.909 0.909 0.909 MINCABLU7 Coal --App., Bitum., Low Sulfur, Undergrd, Stp 7 1995 19569 0.989 0.989 0.970 0.980 0.964 0.933 0.933 0.933 0.933 MINCABLU8 Coal --App., Bitum., Low Sulfur, Undergrd, Stp 8 1995 21049 1.012 1.012 0.994 1.005 0.988 0.956 0.956 0.956 0.956 MINCABMS1 Coal --App., Bitum., Med Sulfur, Surface, Stp 1 1995 97229 0.807 0.807 0.774 0.768 0.758 0.747 0.747 0.747 0.747 MINCABMS2 Coal --App., Bitum., Med Sulfur, Surface, Stp 2 1995 6951 0.828 0.828 0.795 0.789 0.779 0.768 0.768 0.768 0.768 MINCABMS3 Coal --App., Bitum., Med Sulfur, Surface, Stp 3 1995 7241 0.850 0.850 0.816 0.810 0.800 0.788 0.788 0.788 0.788
82

continued
START CUM COST year PJ 95USmillion$/PJ MARKAL Technology Name 1995 2000 2005 2010 2015 2020 2025 2030 2035 MINCABMS4 Coal --App., Bitum., Med Sulfur, Surface, Stp 4 1995 6007 0.868 0.868 0.833 0.827 0.816 0.804 0.804 0.804 0.804 MINCABMS5 Coal --App., Bitum., Med Sulfur, Surface, Stp 5 1995 3069 0.876 0.876 0.841 0.835 0.824 0.813 0.813 0.813 0.813 MINCABMS6 Coal --App., Bitum., Med Sulfur, Surface, Stp 6 1995 6292 0.894 0.894 0.858 0.851 0.841 0.829 0.829 0.829 0.829 MINCABMS7 Coal --App., Bitum., Med Sulfur, Surface, Stp 7 1995 8136 0.915 0.915 0.879 0.872 0.861 0.849 0.849 0.849 0.849 MINCABMS8 Coal --App., Bitum., Med Sulfur, Surface, Stp 8 1995 8440 0.937 0.937 0.900 0.893 0.882 0.869 0.869 0.869 0.869 MINCABMU1 Coal --App., Bitum., Med Sulfur, Undergrd, Stp 1 1995 199260 0.782 0.782 0.755 0.737 0.723 0.705 0.705 0.705 0.705 MINCABMU2 Coal --App., Bitum., Med Sulfur, Undergrd, Stp 2 1995 19904 0.804 0.804 0.776 0.758 0.743 0.724 0.724 0.724 0.724 MINCABMU3 Coal --App., Bitum., Med Sulfur, Undergrd, Stp 3 1995 21249 0.825 0.825 0.797 0.778 0.763 0.743 0.743 0.743 0.743 MINCABMU4 Coal --App., Bitum., Med Sulfur, Undergrd, Stp 4 1995 18002 0.842 0.842 0.813 0.474 0.779 0.758 0.758 0.758 0.758 MINCABMU5 Coal --App., Bitum., Med Sulfur, Undergrd, Stp 5 1995 9321 0.851 0.851 0.821 0.802 0.787 0.765 0.765 0.765 0.765 MINCABMU6 Coal --App., Bitum., Med Sulfur, Undergrd, Stp 6 1995 19382 0.868 0.868 0.838 0.818 0.802 0.781 0.781 0.781 0.781 MINCABMU7 Coal --App., Bitum., Med Sulfur, Undergrd, Stp 7 1995 25570 0.889 0.889 0.858 0.838 0.822 0.800 0.800 0.800 0.800 MINCABMU8 Coal --App., Bitum., Med Sulfur, Undergrd, Stp 8 1995 27117 0.868 0.868 0.878 0.857 0.841 0.819 0.819 0.819 0.819 MINCAGHS1 Coal --App., Gob, High Sulfur, Stp 1 1995 14545 0.841 0.841 0.895 0.890 0.904 0.914 0.914 0.914 0.914 MINCAGHS2 Coal --App., Gob, High Sulfur, Stp 2 1995 952 0.864 0.864 0.919 0.914 0.928 0.939 0.939 0.939 0.939 MINCAGHS3 Coal --App., Gob, High Sulfur, Stp 3 1995 988 0.887 0.887 0.943 0.938 0.953 0.964 0.964 0.964 0.964 MINCAGHS4 Coal --App., Gob, High Sulfur, Stp 4 1995 817 0.905 0.905 0.962 0.958 0.972 0.984 0.984 0.984 0.984 MINCAGHS5 Coal --App., Gob, High Sulfur, Stp 5 1995 419 0.914 0.914 0.972 0.967 0.982 0.993 0.993 0.993 0.993 MINCAGHS6 Coal --App., Gob, High Sulfur, Stp 6 1995 852 0.932 0.932 0.991 0.987 1.002 1.013 1.013 1.013 1.013 MINCAGHS7 Coal --App., Gob, High Sulfur, Stp 7 1995 1100 0.955 0.955 1.016 1.011 1.026 1.038 1.038 1.038 1.038 MINCAGHS8 Coal --App., Gob, High Sulfur, Stp 8 1995 1137 0.978 0.978 1.040 1.035 1.051 1.063 1.063 1.063 1.063 MINCALMS1 Coal --App., Lignite, Med. Sulfur, Surface, Stp 1 1995 2622 0.677 0.677 0.716 0.740 0.760 0.774 0.774 0.774 0.774 MINCALMS2 Coal --App., Lignite, Med. Sulfur, Surface, Stp 2 1995 116 0.706 0.706 0.736 0.760 0.781 0.795 0.795 0.795 0.795 MINCALMS3 Coal --App., Lignite, Med. Sulfur, Surface, Stp 3 1995 118 0.725 0.725 0.755 0.780 0.801 0.816 0.816 0.816 0.816 MINCALMS4 Coal --App., Lignite, Med. Sulfur, Surface, Stp 4 1995 98 0.739 0.739 0.771 0.796 0.818 0.832 0.832 0.832 0.832 MINCALMS5 Coal --App., Lignite, Med. Sulfur, Surface, Stp 5 1995 49 0.747 0.747 0.778 0.804 0.826 0.841 0.841 0.841 0.841 MINCALMS6 Coal --App., Lignite, Med. Sulfur, Surface, Stp 6 1995 98 0.762 0.762 0.794 0.820 0.842 0.858 0.858 0.858 0.858 MINCALMS7 Coal --App., Lignite, Med. Sulfur, Surface, Stp 7 1995 128 0.780 0.780 0.813 0.840 0.863 0.878 0.878 0.878 0.878 MINCALMS8 Coal --App., Lignite, Med. Sulfur, Surface, Stp 8 1995 128 0.799 0.799 0.832 0.860 0.883 0.899 0.899 0.899 0.899 MINCAMLU1 Coal --App., Met., Low Sul., Undergrd, Stp 1 1995 1372 1.299 1.299 1.253 1.243 1.187 1.160 1.160 1.160 1.160 MINCAMLU2 Coal --App., Met., Low Sul., Undergrd, Stp 2 1995 153 1.334 1.334 1.287 1.277 1.219 1.192 1.192 1.192 1.192 MINCAMLU3 Coal --App., Met., Low Sul., Undergrd, Stp 3 1995 165 1.369 1.369 1.321 1.310 1.251 1.223 1.223 1.223 1.223 MINCAMLU4 Coal --App., Met., Low Sul., Undergrd, Stp 4 1995 140 1.397 1.397 1.348 1.337 1.277 1.248 1.248 1.248 1.248 MINCAMLU5 Coal --App., Met., Low Sul., Undergrd, Stp 5 1995 73 1.411 1.411 1.361 1.350 1.290 1.260 1.260 1.260 1.260 MINCAMLU6 Coal --App., Met., Low Sul., Undergrd, Stp 6 1995 152 1.439 1.439 1.388 1.377 1.315 1.286 1.286 1.286 1.286 MINCAMLU7 Coal --App., Met., Low Sul., Undergrd, Stp 7 1995 201 1.474 1.474 1.422 1.411 1.347 1.317 1.317 1.317 1.317 MINCAMLU8 Coal --App., Met., Low Sul., Undergrd, Stp 8 1995 215 1.509 1.509 1.456 1.445 1.379 1.348 1.348 1.348 1.348 MINCAMMU1 Coal --App., Met., Med Sul., Undergrd, Stp 1 1995 1978 0.881 0.881 0.839 0.825 0.816 0.809 0.809 0.809 0.809 MINCAMMU2 Coal --App., Met., Med Sul., Undergrd, Stp 2 1995 256 0.916 0.916 0.874 0.859 0.849 0.840 0.840 0.840 0.840
83

continued
START CUM COST year PJ 95USmillion$/PJ MARKAL Technology Name 1995 2000 2005 2010 2015 2020 2025 2030 2035 MINCAMMU3 Coal --App., Met., Med Sul., Undergrd, Stp 3 1995 278 0.941 0.941 0.898 0.882 0.872 0.863 0.863 0.863 0.863 MINCAMMU4 Coal --App., Met., Med Sul., Undergrd, Stp 4 1995 240 0.961 0.961 0.917 0.901 0.891 0.881 0.881 0.881 0.881 MINCAMMU5 Coal --App., Met., Med Sul., Undergrd, Stp 5 1995 125 0.971 0.971 0.927 0.911 0.900 0.891 0.891 0.891 0.891 MINCAMMU6 Coal --App., Met., Med Sul., Undergrd, Stp 6 1995 263 0.991 0.991 0.946 0.930 0.919 0.909 0.909 0.909 0.909 MINCAMMU7 Coal --App., Met., Med Sul., Undergrd, Stp 7 1995 352 1.016 1.016 0.970 0.953 0.942 0.932 0.932 0.932 0.932 MINCAMMU8 Coal --App., Met., Med Sul., Undergrd, Stp 8 1995 378 1.041 1.041 0.994 0.977 0.965 0.955 0.955 0.955 0.955 MINCDLMS1 Coal --Dakota, Lignite, Med. Sulf., Surface, Stp 1 1995 76571 0.497 0.497 0.469 0.457 0.451 0.448 0.448 0.448 0.448 MINCDLMS2 Coal --Dakota, Lignite, Med. Sulf., Surface, Stp 2 1995 5185 0.511 0.511 0.481 0.469 0.463 0.461 0.461 0.461 0.461 MINCDLMS3 Coal --Dakota, Lignite, Med. Sulf., Surface, Stp 3 1995 5390 0.524 0.524 0.494 0.481 0.475 0.473 0.473 0.473 0.473 MINCDLMS4 Coal --Dakota, Lignite, Med. Sulf., Surface, Stp 4 1995 4461 0.535 0.535 0.504 0.491 0.485 0.482 0.482 0.482 0.482 MINCDLMS5 Coal --Dakota, Lignite, Med. Sulf., Surface, Stp 5 1995 2265 0.540 0.540 0.509 0.496 0.489 0.487 0.487 0.487 0.487 MINCDLMS6 Coal --Dakota, Lignite, Med. Sulf., Surface, Stp 6 1995 4665 0.551 0.551 0.519 0.506 0.499 0.497 0.497 0.497 0.497 MINCDLMS7 Coal --Dakota, Lignite, Med. Sulf., Surface, Stp 7 1995 6016 0.565 0.565 0.532 0.518 0.511 0.509 0.509 0.509 0.509 MINCDLMS8 Coal --Dakota, Lignite, Med. Sulf., Surface, Stp 8 1995 6234 0.578 0.578 0.545 0.531 0.524 0.521 0.521 0.521 0.521 MINCGLHS1 Coal --Gulf, Lignite, High Sulfur, Surface, Stp 1 1995 8104 0.740 0.740 0.709 0.700 0.681 0.673 0.673 0.673 0.673 MINCGLHS2 Coal --Gulf, Lignite, High Sulfur, Surface, Stp 2 1995 635 0.760 0.760 0.729 0.718 0.699 0.691 0.691 0.691 0.691 MINCGLHS3 Coal --Gulf, Lignite, High Sulfur, Surface, Stp 3 1995 663 0.780 0.780 0.748 0.737 0.717 0.709 0.709 0.709 0.709 MINCGLHS4 Coal --Gulf, Lignite, High Sulfur, Surface, Stp 4 1995 552 0.796 0.796 0.763 0.752 0.732 0.724 0.724 0.724 0.724 MINCGLHS5 Coal --Gulf, Lignite, High Sulfur, Surface, Stp 5 1995 282 0.804 0.804 0.771 0.760 0.739 0.731 0.731 0.731 0.731 MINCGLHS6 Coal --Gulf, Lignite, High Sulfur, Surface, Stp 6 1995 581 0.819 0.819 0.786 0.775 0.754 0.745 0.745 0.745 0.745 MINCGLHS7 Coal --Gulf, Lignite, High Sulfur, Surface, Stp 7 1995 754 0.839 0.839 0.805 0.794 0.773 0.764 0.764 0.764 0.764 MINCGLHS8 Coal --Gulf, Lignite, High Sulfur, Surface, Stp 8 1995 784 0.859 0.859 0.824 0.813 0.791 0.782 0.782 0.782 0.782 MINCGLMS1 Coal --Gulf, Lignite, Med. Sulfur, Surface, Stp 1 1995 36365 0.859 0.859 0.836 0.779 0.740 0.726 0.726 0.726 0.726 MINCGLMS2 Coal --Gulf, Lignite, Med. Sulfur, Surface, Stp 2 1995 2921 0.883 0.883 0.859 0.800 0.760 0.746 0.746 0.746 0.746 MINCGLMS3 Coal --Gulf, Lignite, Med. Sulfur, Surface, Stp 3 1995 3059 0.906 0.906 0.881 0.821 0.780 0.765 0.765 0.765 0.765 MINCGLMS4 Coal --Gulf, Lignite, Med. Sulfur, Surface, Stp 4 1995 2546 0.925 0.925 0.900 0.838 0.796 0.781 0.781 0.781 0.781 MINCGLMS5 Coal --Gulf, Lignite, Med. Sulfur, Surface, Stp 5 1995 1301 0.934 0.934 0.909 0.846 0.804 0.789 0.789 0.789 0.789 MINCGLMS6 Coal --Gulf, Lignite, Med. Sulfur, Surface, Stp 6 1995 2680 0.952 0.952 0.927 0.863 0.820 0.805 0.805 0.805 0.805 MINCGLMS7 Coal --Gulf, Lignite, Med. Sulfur, Surface, Stp 7 1995 3478 0.976 0.976 0.949 0.884 0.840 0.824 0.824 0.824 0.824 MINCGLMS8 Coal --Gulf, Lignite, Med. Sulfur, Surface, Stp 8 1995 3622 0.999 0.999 0.972 0.905 0.860 0.844 0.844 0.844 0.844 MINCIBHS1 Coal --Interior, Bit., High Sulfur, Surface, Stp 1 1995 218250 0.799 0.799 0.787 0.793 0.777 0.768 0.768 0.768 0.768 MINCIBHS2 Coal --Interior, Bit., High Sulfur, Surface, Stp 2 1995 16508 0.820 0.820 0.808 0.814 0.797 0.788 0.788 0.788 0.788 MINCIBHS3 Coal --Interior, Bit., High Sulfur, Surface, Stp 3 1995 17215 0.841 0.841 0.829 0.836 0.818 0.809 0.809 0.809 0.809 MINCIBHS4 Coal --Interior, Bit., High Sulfur, Surface, Stp 4 1995 14313 0.859 0.859 0.846 0.853 0.835 0.826 0.826 0.826 0.826 MINCIBHS5 Coal --Interior, Bit., High Sulfur, Surface, Stp 5 1995 7312 0.868 0.868 0.854 0.861 0.843 0.834 0.834 0.834 0.834 MINCIBHS6 Coal --Interior, Bit., High Sulfur, Surface, Stp 6 1995 15011 0.885 0.885 0.871 0.878 0.860 0.850 0.850 0.850 0.850 MINCIBHS7 Coal --Interior, Bit., High Sulfur, Surface, Stp 7 1995 19452 0.906 0.906 0.893 0.900 0.881 0.871 0.871 0.871 0.871 MINCIBHS8 Coal --Interior, Bit., High Sulfur, Surface, Stp 8 1995 20249 0.928 0.928 0.914 0.921 0.902 0.892 0.892 0.892 0.892 MINCIBHU1 Coal --Interior, Bit., High Sul., Undergrd, Stp 1 1995 545253 0.725 0.725 0.712 0.710 0.697 0.692 0.692 0.692 0.692
84

continued
START CUM COST year PJ 95USmillion$/PJ MARKAL Technology Name 1995 2000 2005 2010 2015 2020 2025 2030 2035 MINCIBHU2 Coal --Interior, Bit., High Sul., Undergrd, Stp 2 1995 50352 0.745 0.745 0.731 0.730 0.716 0.711 0.711 0.711 0.711 MINCIBHU3 Coal --Interior, Bit., High Sul., Undergrd, Stp 3 1995 53464 0.764 0.764 0.750 0.749 0.734 0.729 0.729 0.729 0.729 MINCIBHU4 Coal --Interior, Bit., High Sul., Undergrd, Stp 4 1995 45116 0.780 0.780 0.765 0.764 0.749 0.744 0.744 0.744 0.744 MINCIBHU5 Coal --Interior, Bit., High Sul., Undergrd, Stp 5 1995 23285 0.788 0.788 0.773 0.772 0.757 0.752 0.752 0.752 0.752 MINCIBHU6 Coal --Interior, Bit., High Sul., Undergrd, Stp 6 1995 48319 0.804 0.804 0.788 0.787 0.772 0.767 0.767 0.767 0.767 MINCIBHU7 Coal --Interior, Bit., High Sul., Undergrd, Stp 7 1995 63514 0.823 0.823 0.808 0.806 0.791 0.786 0.786 0.786 0.786 MINCIBHU8 Coal --Interior, Bit., High Sul., Undergrd, Stp 8 1995 67069 0.843 0.843 0.827 0.825 0.810 0.804 0.804 0.804 0.804 MINCIBMS1 Coal --Interior, Bit., Med Sulfur, Surface, Stp 1 1995 57046 0.801 0.801 0.776 0.758 0.742 0.737 0.737 0.737 0.737 MINCIBMS2 Coal --Interior, Bit., Med Sulfur, Surface, Stp 2 1995 6068 0.822 0.822 0.797 0.778 0.762 0.757 0.757 0.757 0.757 MINCIBMS3 Coal --Interior, Bit., Med Sulfur, Surface, Stp 3 1995 6432 0.844 0.844 0.818 0.799 0.782 0.777 0.777 0.777 0.777 MINCIBMS4 Coal --Interior, Bit., Med Sulfur, Surface, Stp 4 1995 5431 0.861 0.861 0.835 0.815 0.798 0.793 0.793 0.793 0.793 MINCIBMS5 Coal --Interior, Bit., Med Sulfur, Surface, Stp 5 1995 2803 0.870 0.870 0.843 0.823 0.806 0.801 0.801 0.801 0.801 MINCIBMS6 Coal --Interior, Bit., Med Sulfur, Surface, Stp 6 1995 5794 0.887 0.887 0.860 0.840 0.822 0.817 0.817 0.817 0.817 MINCIBMS7 Coal --Interior, Bit., Med Sulfur, Surface, Stp 7 1995 7621 0.909 0.909 0.881 0.860 0.842 0.837 0.837 0.837 0.837 MINCIBMS8 Coal --Interior, Bit., Med Sulfur, Surface, Stp 8 1995 8010 0.930 0.930 0.902 0.881 0.862 0.857 0.857 0.857 0.857 MINCIBMU1 Coal --Interior, Bit., Med. Sulfur, Undergrd Stp 1 1995 39197 0.808 0.808 0.773 0.743 0.729 0.720 0.720 0.720 0.720 MINCIBMU2 Coal --Interior, Bit., Med. Sulfur, Undergrd Stp 2 1995 4201 0.829 0.829 0.794 0.763 0.749 0.739 0.739 0.739 0.739 MINCIBMU3 Coal --Interior, Bit., Med. Sulfur, Undergrd Stp 3 1995 4506 0.851 0.851 0.815 0.783 0.768 0.759 0.759 0.759 0.759 MINCIBMU4 Coal --Interior, Bit., Med. Sulfur, Undergrd Stp 4 1995 3828 0.869 0.869 0.832 0.800 0.784 0.774 0.774 0.774 0.774 MINCIBMU5 Coal --Interior, Bit., Med. Sulfur, Undergrd Stp 5 1995 1985 0.877 0.877 0.840 0.808 0.792 0.782 0.782 0.782 0.782 MINCIBMU6 Coal --Interior, Bit., Med. Sulfur, Undergrd Stp 6 1995 4140 0.895 0.895 0.857 0.824 0.808 0.798 0.798 0.798 0.798 MINCIBMU7 Coal --Interior, Bit., Med. Sulfur, Undergrd Stp 7 1995 5478 0.917 0.917 0.878 0.844 0.827 0.817 0.817 0.817 0.817 MINCIBMU8 Coal --Interior, Bit., Med. Sulfur, Undergrd Stp 8 1995 5827 0.938 0.938 0.899 0.864 0.847 0.837 0.837 0.837 0.837 MINCNSMS1 Coal --Northwest: Sub-bit, Med Sul., Surface. Stp 1 1995 56020 1.377 1.377 1.380 1.387 1.394 1.396 1.396 1.396 1.396 MINCNSMS2 Coal --Northwest: Sub-bit, Med Sul., Surface. Stp 2 1995 6191 1.413 1.413 1.417 1.424 1.431 1.434 1.434 1.434 1.434 MINCNSMS3 Coal --Northwest: Sub-bit, Med Sul., Surface. Stp 3 1995 6586 1.450 1.450 1.455 1.462 1.469 1.472 1.472 1.472 1.472 MINCNSMS4 Coal --Northwest: Sub-bit, Med Sul., Surface. Stp 4 1995 5563 1.480 1.480 1.484 1.492 1.499 1.502 1.502 1.502 1.502 MINCNSMS5 Coal --Northwest: Sub-bit, Med Sul., Surface. Stp 5 1995 2862 1.495 1.495 1.499 1.507 1.514 1.517 1.517 1.517 1.517 MINCNSMS6 Coal --Northwest: Sub-bit, Med Sul., Surface. Stp 6 1995 5938 1.525 1.525 1.529 1.537 1.544 1.547 1.547 1.547 1.547 MINCNSMS7 Coal --Northwest: Sub-bit, Med Sul., Surface. Stp 7 1995 7822 1.562 1.562 1.567 1.574 1.582 1.585 1.585 1.585 1.585 MINCNSMS8 Coal --Northwest: Sub-bit, Med Sul., Surface. Stp 8 1995 8223 1.599 1.599 1.604 1.612 1.620 1.623 1.623 1.623 1.623 MINCPBLU1 Coal --Power River, Bit., Low Sul, Undergrd, Stp 1 1995 23225 6.314 6.314 0.795 0.748 0.729 0.705 0.705 0.705 0.705 MINCPBLU2 Coal --Power River, Bit., Low Sul, Undergrd, Stp 2 1995 2649 0.725 0.725 0.795 0.767 0.748 0.724 0.724 0.724 0.724 MINCPBLU3 Coal --Power River, Bit., Low Sul, Undergrd, Stp 3 1995 2949 0.743 0.743 0.816 0.789 0.770 0.743 0.743 0.743 0.743 MINCPBLU4 Coal --Power River, Bit., Low Sul, Undergrd, Stp 4 1995 2749 0.759 0.759 0.833 0.804 0.785 0.758 0.758 0.758 0.758 MINCPBLU5 Coal --Power River, Bit., Low Sul, Undergrd, Stp 5 1995 1150 0.754 0.754 0.842 0.812 0.791 0.766 0.766 0.766 0.766 MINCPBLU6 Coal --Power River, Bit., Low Sul, Undergrd, Stp 6 1995 2299 0.752 0.752 0.857 0.829 0.809 0.781 0.781 0.781 0.781 MINCPBLU7 Coal --Power River, Bit., Low Sul, Undergrd, Stp 7 1995 3099 0.771 0.771 0.879 0.849 0.827 0.800 0.800 0.800 0.800 MINCPBLU8 Coal --Power River, Bit., Low Sul, Undergrd, Stp 8 1995 2333 0.789 0.789 0.899 0.870 0.847 0.820 0.820 0.820 0.820
85

continued
START CUM COST year PJ 95USmillion$/PJ MARKAL Technology Name 1995 2000 2005 2010 2015 2020 2025 2030 2035 MINCPSLS1 Coal --Power R, Sub-Bit, Low Sul, Surface, Stp 1 1995 325906 0.254 0.254 0.224 0.211 0.220 0.230 0.230 0.230 0.230 MINCPSLS2 Coal --Power R, Sub-Bit, Low Sul, Surface, Stp 2 1995 21541 0.261 0.261 0.230 0.216 0.226 0.236 0.236 0.236 0.236 MINCPSLS3 Coal --Power R, Sub-Bit, Low Sul, Surface, Stp 3 1995 22374 0.267 0.267 0.236 0.222 0.232 0.243 0.243 0.243 0.243 MINCPSLS4 Coal --Power R, Sub-Bit, Low Sul, Surface, Stp 4 1995 18509 0.273 0.273 0.241 0.227 0.237 0.248 0.248 0.248 0.248 MINCPSLS5 Coal --Power R, Sub-Bit, Low Sul, Surface, Stp 5 1995 9357 0.276 0.276 0.243 0.229 0.239 0.250 0.250 0.250 0.250 MINCPSLS6 Coal --Power R, Sub-Bit, Low Sul, Surface, Stp 6 1995 19303 0.281 0.281 0.248 0.233 0.244 0.255 0.255 0.255 0.255 MINCPSLS7 Coal --Power R, Sub-Bit, Low Sul, Surface, Stp 7 1995 24904 0.288 0.288 0.254 0.239 0.250 0.261 0.261 0.261 0.261 MINCPSLS8 Coal --Power R, Sub-Bit, Low Sul, Surface, Stp 8 1995 25776 0.295 0.295 0.260 0.245 0.256 0.267 0.267 0.267 0.267 MINCPSMS1 Coal --Power R, Sub-Bit, Med Sul, Surface, Stp 1 1995 173838 0.372 0.372 0.315 0.305 0.300 0.310 0.310 0.310 0.310 MINCPSMS2 Coal --Power R, Sub-Bit, Med Sul, Surface, Stp 2 1995 24880 0.379 0.379 0.323 0.313 0.308 0.319 0.319 0.319 0.319 MINCPSMS3 Coal --Power R, Sub-Bit, Med Sul, Surface, Stp 3 1995 26931 0.388 0.388 0.332 0.321 0.316 0.327 0.327 0.327 0.327 MINCPSMS4 Coal --Power R, Sub-Bit, Med Sul, Surface, Stp 4 1995 23044 0.396 0.396 0.338 0.328 0.323 0.334 0.334 0.334 0.334 MINCPSMS5 Coal --Power R, Sub-Bit, Med Sul, Surface, Stp 5 1995 11943 0.400 0.400 0.342 0.331 0.326 0.337 0.337 0.337 0.337 MINCPSMS6 Coal --Power R, Sub-Bit, Med Sul, Surface, Stp 6 1995 25085 0.408 0.408 0.349 0.337 0.332 0.344 0.344 0.344 0.344 MINCPSMS7 Coal --Power R, Sub-Bit, Med Sul, Surface, Stp 7 1995 33332 0.418 0.418 0.357 0.346 0.340 0.352 0.352 0.352 0.352 MINCPSMS8 Coal --Power R, Sub-Bit, Med Sul, Surface, Stp 8 1995 35560 0.427 0.427 0.366 0.354 0.349 0.361 0.361 0.361 0.361 MINCRBLU1 Coal --Rocky Mtns, Bit., Low Sul., Undergrd, Stp 1 1995 69411 0.604 0.604 0.607 0.583 0.574 0.564 0.564 0.564 0.564 MINCRBLU2 Coal --Rocky Mtns, Bit., Low Sul., Undergrd, Stp 2 1995 5828 0.620 0.620 0.623 0.598 0.589 0.579 0.579 0.579 0.579 MINCRBLU3 Coal --Rocky Mtns, Bit., Low Sul., Undergrd, Stp 3 1995 6160 0.637 0.637 0.640 0.614 0.605 0.594 0.594 0.594 0.594 MINCRBLU4 Coal --Rocky Mtns, Bit., Low Sul., Undergrd, Stp 4 1995 5173 0.650 0.650 0.653 0.627 0.617 0.607 0.607 0.607 0.607 MINCRBLU5 Coal --Rocky Mtns, Bit., Low Sul., Undergrd, Stp 5 1995 2662 0.656 0.656 0.659 0.633 0.624 0.613 0.613 0.613 0.613 MINCRBLU6 Coal --Rocky Mtns, Bit., Low Sul., Undergrd, Stp 6 1995 5507 0.669 0.669 0.672 0.645 0.636 0.625 0.625 0.625 0.625 MINCRBLU7 Coal --Rocky Mtns, Bit., Low Sul., Undergrd, Stp 7 1995 7211 0.686 0.686 0.689 0.661 0.651 0.640 0.640 0.640 0.640 MINCRBLU8 Coal --Rocky Mtns, Bit., Low Sul., Undergrd, Stp 8 1995 7585 0.702 0.702 0.705 0.677 0.667 0.655 0.655 0.655 0.655 MINCRSLS1 Coal --Rocky Mtn, Sub-Bit, Low Sul., Surface. Stp 1 1995 101 0.817 0.817 0.702 0.606 0.547 0.537 0.537 0.537 0.537 MINCRSLS2 Coal --Rocky Mtn, Sub-Bit, Low Sul., Surface. Stp 2 1995 7 0.839 0.839 0.721 0.622 0.562 0.552 0.552 0.552 0.552 MINCRSLS3 Coal --Rocky Mtn, Sub-Bit, Low Sul., Surface. Stp 3 1995 7 0.861 0.861 0.740 0.639 0.576 0.566 0.566 0.566 0.566 MINCRSLS4 Coal --Rocky Mtn, Sub-Bit, Low Sul., Surface. Stp 4 1995 6 0.879 0.879 0.755 0.652 0.588 0.578 0.578 0.578 0.578 MINCRSLS5 Coal --Rocky Mtn, Sub-Bit, Low Sul., Surface. Stp 5 1995 3 0.887 0.887 0.762 0.659 0.594 0.584 0.584 0.584 0.584 MINCRSLS6 Coal --Rocky Mtn, Sub-Bit, Low Sul., Surface. Stp 6 1995 6 0.905 0.905 0.778 0.671 0.606 0.595 0.595 0.595 0.595 MINCRSLS7 Coal --Rocky Mtn, Sub-Bit, Low Sul., Surface. Stp 7 1995 8 0.927 0.927 0.797 0.688 0.621 0.610 0.610 0.610 0.610 MINCRSLS8 Coal --Rocky Mtn, Sub-Bit, Low Sul., Surface. Stp 8 1995 8 0.949 0.949 0.816 0.704 0.635 0.624 0.624 0.624 0.624 MINCSBLS1 Coal --Southwest, Bit, Low Sul., Surface. Stp 1 1995 6959 0.792 0.792 0.748 0.742 0.746 0.746 0.746 0.746 0.746 MINCSBLS2 Coal --Southwest, Bit, Low Sul., Surface. Stp 2 1995 471 0.813 0.813 0.768 0.762 0.766 0.766 0.766 0.766 0.766 MINCSBLS3 Coal --Southwest, Bit, Low Sul., Surface. Stp 3 1995 488 0.834 0.834 0.788 0.783 0.786 0.786 0.786 0.786 0.786 MINCSBLS4 Coal --Southwest, Bit, Low Sul., Surface. Stp 4 1995 404 0.852 0.852 0.804 0.799 0.803 0.802 0.802 0.802 0.802 MINCSBLS5 Coal --Southwest, Bit, Low Sul., Surface. Stp 5 1995 206 0.860 0.860 0.812 0.807 0.811 0.811 0.811 0.811 0.811 MINCSBLS6 Coal --Southwest, Bit, Low Sul., Surface. Stp 6 1995 423 0.877 0.877 0.828 0.823 0.827 0.827 0.827 0.827 0.827 MINCSBLS7 Coal --Southwest, Bit, Low Sul., Surface. Stp 7 1995 545 0.899 0.899 0.849 0.843 0.847 0.847 0.847 0.847 0.847
86

BOUND(BD)Or PJ MARKAL Technology Name 1995 2000 2005 2010 2015 2020 2025 2030 2035 MINCABHS1 Coal --App., Bit., High Sulfur, Surface, Stp 1 327.23 327.23 269.85 267.70 249.05 236.61 236.61 236.61 236.61 MINCABHS2 Coal --App., Bit., High Sulfur, Surface, Stp 2 26.39 26.39 22.03 21.93 20.39 19.47 19.47 19.47 19.47 MINCABHS3 Coal --App., Bit., High Sulfur, Surface, Stp 3 27.56 27.56 23.06 22.95 21.36 20.24 20.24 20.24 20.24 MINCABHS4 Coal --App., Bit., High Sulfur, Surface, Stp 4 23.00 23.00 19.21 19.16 17.78 16.91 16.91 16.91 16.91 MINCABHS5 Coal --App., Bit., High Sulfur, Surface, Stp 5 11.78 11.78 9.84 9.84 9.07 8.62 8.62 8.62 8.62 MINCABHS6 Coal --App., Bit., High Sulfur, Surface, Stp 6 24.18 24.18 20.29 20.13 18.80 17.93 17.93 17.93 17.93 MINCABHS7 Coal --App., Bit., High Sulfur, Surface, Stp 7 31.35 31.35 26.28 26.08 24.28 23.14 23.14 23.14 23.14 MINCABHS8 Coal --App., Bit., High Sulfur, Surface, Stp 8 32.69 32.69 27.46 27.26 25.31 24.17 24.17 24.17 24.17 MINCABHU1 Coal --App., Bit., High Sulfur, Undergrd, Stp 1 826.91 826.91 741.96 822.14 848.27 851.84 851.84 851.84 851.84 MINCABHU2 Coal --App., Bit., High Sulfur, Undergrd, Stp 2 82.59 82.59 74.65 82.69 85.46 85.82 85.82 85.82 85.82 MINCABHU3 Coal --App., Bit., High Sulfur, Undergrd, Stp 3 88.07 88.07 79.67 88.33 91.14 91.62 91.62 91.62 91.62 MINCABHU4 Coal --App., Bit., High Sulfur, Undergrd, Stp 4 74.60 74.60 67.47 74.80 77.26 77.70 77.70 77.70 77.70 MINCABHU5 Coal --App., Bit., High Sulfur, Undergrd, Stp 5 38.63 38.63 34.99 38.78 39.96 40.30 40.30 40.30 40.30 MINCABHU6 Coal --App., Bit., High Sulfur, Undergrd, Stp 6 80.28 80.28 72.70 80.54 83.25 83.68 83.68 83.68 83.68 MINCABHU7 Coal --App., Bit., High Sulfur, Undergrd, Stp 7 105.90 105.90 95.91 106.31 109.79 110.41 110.41 110.41 110.41 MINCABHU8 Coal --App., Bit., High Sulfur, Undergrd, Stp 8 112.25 112.25 101.65 112.71 116.45 117.07 117.07 117.07 117.07 MINCABLS1 Coal --App., Bitum., Low Sulfur, Surface, Stp 1 829.22 829.22 736.29 659.68 630.21 581.92 581.92 581.92 581.92 MINCABLS2 Coal --App., Bitum., Low Sulfur, Surface, Stp 2 69.45 69.45 62.39 56.13 53.85 49.92 49.92 49.92 49.92 MINCABLS3 Coal --App., Bitum., Low Sulfur, Surface, Stp 3 72.90 72.90 65.42 58.84 56.45 52.40 52.40 52.40 52.40 MINCABLS4 Coal --App., Bitum., Low Sulfur, Surface, Stp 4 60.84 60.84 860.06 49.28 47.21 43.90 43.90 43.90 43.90 MINCABLS5 Coal --App., Bitum., Low Sulfur, Surface, Stp 5 31.37 31.37 27.88 25.22 24.11 22.22 22.22 22.22 22.22 MINCABLS6 Coal --App., Bitum., Low Sulfur, Surface, Stp 6 64.24 64.24 57.72 51.94 49.81 46.29 46.29 46.29 46.29 MINCABLS7 Coal --App., Bitum., Low Sulfur, Surface, Stp 7 83.67 83.67 74.92 67.60 64.73 60.01 60.01 60.01 60.01 MINCABLS8 Coal --App., Bitum., Low Sulfur, Surface, Stp 8 87.22 87.22 78.27 70.42 67.55 62.67 62.67 62.67 62.67 MINCABLU1 Coal --App., Bitum., Low Sulfur, Undergrd, Stp 1 744.32 744.32 749.76 735.64 735.30 644.64 644.64 644.64 644.64
continued
START CUM COST year PJ 95USmillion$/PJ MARKAL Technology Name 1995 2000 2005 2010 2015 2020 2025 2030 2035 MINCSBLS8 Coal --Southwest, Bit, Low Sul., Surface. Stp 8 1995 565 0.920 0.920 0.869 0.863 0.867 0.867 0.867 0.867 0.867 MINCSSMS1 Coal --Southwest, Sub-bit, Med Sul., Surface. Stp 1 1995 22215 0.927 0.927 0.916 0.923 0.905 0.898 0.898 0.898 0.898 MINCSSMS2 Coal --Southwest, Sub-bit, Med Sul., Surface. Stp 2 1995 1493 0.952 0.952 0.941 0.948 0.930 0.922 0.922 0.922 0.922 MINCSSMS3 Coal --Southwest, Sub-bit, Med Sul., Surface. Stp 3 1995 1552 0.978 0.978 0.966 0.973 0.954 0.947 0.947 0.947 0.947 MINCSSMS4 Coal --Southwest, Sub-bit, Med Sul., Surface. Stp 4 1995 1284 0.998 0.998 0.986 0.993 0.974 0.966 0.966 0.966 0.966 MINCSSMS5 Coal --Southwest, Sub-bit, Med Sul., Surface. Stp 5 1995 655 1.008 1.008 0.996 1.003 0.984 0.976 0.976 0.976 0.976 MINCSSMS6 Coal --Southwest, Sub-bit, Med Sul., Surface. Stp 6 1995 1341 1.028 1.028 1.015 1.023 1.003 0.995 0.995 0.995 0.995 MINCSSMS7 Coal --Southwest, Sub-bit, Med Sul., Surface. Stp 7 1995 1732 1.053 1.053 1.040 1.048 1.028 1.020 1.020 1.020 1.020 MINCSSMS8 Coal --Southwest, Sub-bit, Med Sul., Surface. Stp 8 1995 1794 1.078 1.078 1.065 1.072 1.052 1.044 1.044 1.044 1.044
87

BOUND(BD)Or PJ MARKAL Technology Name 1995 2000 2005 2010 2015 2020 2025 2030 2035 MINCABLU2 Coal --App., Bitum., Low Sulfur, Undergrd, Stp 2 91.77 91.77 95.37 95.04 95.26 83.83 83.83 83.83 83.83 MINCABLU3 Coal --App., Bitum., Low Sulfur, Undergrd, Stp 3 99.35 99.35 103.64 103.40 103.73 91.07 91.07 91.07 91.07 MINCABLU4 Coal --App., Bitum., Low Sulfur, Undergrd, Stp 4 85.19 85.19 89.11 89.04 89.32 78.52 78.52 78.52 78.52 MINCABLU5 Coal --App., Bitum., Low Sulfur, Undergrd, Stp 5 44.61 44.61 46.59 46.51 46.78 41.07 41.07 41.07 41.07 MINCABLU6 Coal --App., Bitum., Low Sulfur, Undergrd, Stp 6 93.35 93.35 97.64 97.77 98.26 86.46 86.46 86.46 86.46 MINCABLU7 Coal --App., Bitum., Low Sulfur, Undergrd, Stp 7 124.58 124.58 130.70 130.97 131.58 115.78 115.78 115.78 115.78 MINCABLU8 Coal --App., Bitum., Low Sulfur, Undergrd, Stp 8 133.65 133.65 140.50 141.03 141.68 124.69 124.69 124.69 124.69 MINCABMS1 Coal --App., Bitum., Med Sulfur, Surface, Stp 1 1947.42 1947.42 1924.82 1966.21 1866.14 1795.75 1795.75 1795.75 1795.75 MINCABMS2 Coal --App., Bitum., Med Sulfur, Surface, Stp 2 138.88 138.88 137.62 140.65 133.57 128.43 128.43 128.43 128.43 MINCABMS3 Coal --App., Bitum., Med Sulfur, Surface, Stp 3 144.68 144.68 143.32 146.51 139.16 133.88 133.88 133.88 133.88 MINCABMS4 Coal --App., Bitum., Med Sulfur, Surface, Stp 4 120.06 120.06 118.90 121.61 115.37 111.03 111.03 111.03 111.03 MINCABMS5 Coal --App., Bitum., Med Sulfur, Surface, Stp 5 61.32 61.32 60.82 62.10 58.93 56.70 56.70 56.70 56.70 MINCABMS6 Coal --App., Bitum., Med Sulfur, Surface, Stp 6 125.81 125.81 124.55 127.32 120.92 116.22 116.22 116.22 116.22 MINCABMS7 Coal --App., Bitum., Med Sulfur, Surface, Stp 7 162.51 162.51 161.17 164.67 156.32 150.33 150.33 150.33 150.33 MINCABMS8 Coal --App., Bitum., Med Sulfur, Surface, Stp 8 168.58 168.58 167.18 170.91 162.07 155.96 155.96 155.96 155.96 MINCABMU1 Coal --App., Bitum., Med Sulfur, Undergrd, Stp 1 2838.37 2838.37 3014.43 2973.15 2903.93 2977.40 2977.40 2977.40 2977.40 MINCABMU2 Coal --App., Bitum., Med Sulfur, Undergrd, Stp 2 283.62 283.62 301.19 296.71 290.07 297.52 297.52 297.52 297.52 MINCABMU3 Coal --App., Bitum., Med Sulfur, Undergrd, Stp 3 302.90 302.90 321.45 316.67 309.61 317.74 317.74 317.74 317.74 MINCABMU4 Coal --App., Bitum., Med Sulfur, Undergrd, Stp 4 256.57 256.57 272.34 268.32 262.30 269.20 269.20 269.20 269.20 MINCABMU5 Coal --App., Bitum., Med Sulfur, Undergrd, Stp 5 132.92 132.92 141.07 138.91 135.80 139.25 139.25 139.25 139.25 MINCABMU6 Coal --App., Bitum., Med Sulfur, Undergrd, Stp 6 276.22 276.22 293.18 288.86 282.43 289.87 289.87 289.87 289.87 MINCABMU7 Coal --App., Bitum., Med Sulfur, Undergrd, Stp 7 364.55 364.55 386.89 381.05 372.46 382.38 382.38 382.38 382.38 MINCABMU8 Coal --App., Bitum., Med Sulfur, Undergrd, Stp 8 386.63 386.63 410.22 404.09 395.12 405.41 405.41 405.41 405.41 MINCAGHS1 Coal --App., Gob, High Sulfur, Stp 1 100.09 100.09 126.71 127.05 126.42 126.33 126.33 126.33 126.33 MINCAGHS2 Coal --App., Gob, High Sulfur, Stp 2 6.53 6.53 8.29 8.34 8.26 8.26 8.26 8.26 8.26 MINCAGHS3 Coal --App., Gob, High Sulfur, Stp 3 6.77 6.77 8.60 8.66 8.60 8.57 8.57 8.57 8.57 MINCAGHS4 Coal --App., Gob, High Sulfur, Stp 4 5.61 5.61 7.13 7.16 7.08 7.08 7.08 7.08 7.08 MINCAGHS5 Coal --App., Gob, High Sulfur, Stp 5 2.86 2.86 3.65 3.67 3.65 3.67 3.67 3.67 3.67 MINCAGHS6 Coal --App., Gob, High Sulfur, Stp 6 5.82 5.82 7.42 7.48 7.42 7.39 7.39 7.39 7.39 MINCAGHS7 Coal --App., Gob, High Sulfur, Stp 7 7.53 7.53 9.60 9.60 9.57 9.57 9.57 9.57 9.57 MINCAGHS8 Coal --App., Gob, High Sulfur, Stp 8 7.79 7.79 9.91 9.94 9.91 9.88 9.88 9.88 9.88 MINCALMS1 Coal --App., Lignite, Med. Sulfur, Surface, Stp 1 25.99 25.99 33.14 35.14 35.14 35.28 35.28 35.28 35.28 MINCALMS2 Coal --App., Lignite, Med. Sulfur, Surface, Stp 2 1.00 1.00 1.49 1.57 1.62 1.62 1.62 1.62 1.62 MINCALMS3 Coal --App., Lignite, Med. Sulfur, Surface, Stp 3 1.03 1.03 1.52 1.62 1.62 1.62 1.62 1.62 1.62 MINCALMS4 Coal --App., Lignite, Med. Sulfur, Surface, Stp 4 0.87 0.87 1.25 1.35 1.35 1.35 1.35 1.35 1.35 MINCALMS5 Coal --App., Lignite, Med. Sulfur, Surface, Stp 5 0.43 0.43 0.62 0.68 0.68 0.68 0.68 0.68 0.68 MINCALMS6 Coal --App., Lignite, Med. Sulfur, Surface, Stp 6 0.87 0.87 1.25 1.35 1.35 1.35 1.35 1.35 1.35 MINCALMS7 Coal --App., Lignite, Med. Sulfur, Surface, Stp 7 1.14 1.14 1.65 1.76 1.76 1.76 1.76 1.76 1.76 MINCALMS8 Coal --App., Lignite, Med. Sulfur, Surface, Stp 8 1.14 1.14 1.65 1.76 1.76 1.76 1.76 1.76 1.76
continued
88

continued
BOUND(BD)Or PJ MARKAL Technology Name 1995 2000 2005 2010 2015 2020 2025 2030 2035 MINCAMLU1 Coal --App., Met., Low Sul., Undergrd, Stp 1 103.66 103.66 92.57 90.09 75.50 68.14 68.14 68.14 68.14 MINCAMLU2 Coal --App., Met., Low Sul., Undergrd, Stp 2 11.42 11.42 10.29 9.95 8.48 7.82 7.82 7.82 7.82 MINCAMLU3 Coal --App., Met., Low Sul., Undergrd, Stp 3 12.22 12.22 11.08 10.80 9.10 8.39 8.39 8.39 8.39 MINCAMLU4 Coal --App., Met., Low Sul., Undergrd, Stp 4 10.41 10.41 9.44 9.10 7.80 6.97 6.97 6.97 6.97 MINCAMLU5 Coal --App., Met., Low Sul., Undergrd, Stp 5 5.43 5.43 4.86 4.75 4.02 3.68 3.68 3.68 3.68 MINCAMLU6 Coal --App., Met., Low Sul., Undergrd, Stp 6 11.31 11.31 10.24 9.95 8.43 7.63 7.63 7.63 7.63 MINCAMLU7 Coal --App., Met., Low Sul., Undergrd, Stp 7 14.93 14.93 13.46 13.18 11.25 10.08 10.08 10.08 10.08 MINCAMLU8 Coal --App., Met., Low Sul., Undergrd, Stp 8 16.06 16.06 14.42 14.14 11.93 10.93 10.93 10.93 10.93 MINCAMMU1 Coal --App., Met., Med Sul., Undergrd, Stp 1 1140.58 1140.58 1059.99 1042.97 1033.98 1028.29 1028.29 1028.29 1028.29 MINCAMMU2 Coal --App., Met., Med Sul., Undergrd, Stp 2 145.45 145.45 137.48 135.67 134.53 133.65 133.65 133.65 133.65 MINCAMMU3 Coal --App., Met., Med Sul., Undergrd, Stp 3 157.89 157.89 149.63 147.60 146.30 145.34 145.34 145.34 145.34 MINCAMMU4 Coal --App., Met., Med Sul., Undergrd, Stp 4 135.72 135.72 128.65 126.96 126.00 125.17 125.17 125.17 125.17 MINCAMMU5 Coal --App., Met., Med Sul., Undergrd, Stp 5 71.03 71.03 67.41 66.56 65.88 65.50 65.50 65.50 65.50 MINCAMMU6 Coal --App., Met., Med Sul., Undergrd, Stp 6 148.79 148.79 141.21 139.45 138.38 137.23 137.23 137.23 137.23 MINCAMMU7 Coal --App., Met., Med Sul., Undergrd, Stp 7 199.00 199.00 189.05 186.62 185.09 183.79 183.79 183.79 183.79 MINCAMMU8 Coal --App., Met., Med Sul., Undergrd, Stp 8 213.76 213.76 203.53 200.81 199.12 197.74 197.74 197.74 197.74 MINCDLMS1 Coal --Dakota, Lignite, Med. Sulf., Surface, Stp 1 369.81 369.81 385.21 387.80 391.56 392.20 392.20 392.20 392.20 MINCDLMS2 Coal --Dakota, Lignite, Med. Sulf., Surface, Stp 2 25.06 25.06 26.07 26.24 26.52 26.57 26.57 26.57 26.57 MINCDLMS3 Coal --Dakota, Lignite, Med. Sulf., Surface, Stp 3 26.07 26.07 27.14 27.28 27.53 27.60 27.60 27.60 27.60 MINCDLMS4 Coal --Dakota, Lignite, Med. Sulf., Surface, Stp 4 21.58 21.58 22.45 22.59 22.79 22.83 22.83 22.83 22.83 MINCDLMS5 Coal --Dakota, Lignite, Med. Sulf., Surface, Stp 5 10.95 10.95 11.39 11.48 11.56 11.60 11.60 11.60 11.60 MINCDLMS6 Coal --Dakota, Lignite, Med. Sulf., Surface, Stp 6 22.56 22.56 23.49 23.60 23.85 23.85 23.85 23.85 23.85 MINCDLMS7 Coal --Dakota, Lignite, Med. Sulf., Surface, Stp 7 29.10 29.10 30.28 30.48 30.73 30.78 30.78 30.78 30.78 MINCDLMS8 Coal --Dakota, Lignite, Med. Sulf., Surface, Stp 8 30.14 30.14 31.38 31.57 31.85 31.90 31.90 31.90 31.90 MINCGLHS1 Coal --Gulf, Lignite, High Sulfur, Surface, Stp 1 261.51 261.51 248.88 242.06 217.07 208.49 208.49 208.49 208.49 MINCGLHS2 Coal --Gulf, Lignite, High Sulfur, Surface, Stp 2 20.35 20.35 19.48 18.99 17.05 16.46 16.46 16.46 16.46 MINCGLHS3 Coal --Gulf, Lignite, High Sulfur, Surface, Stp 3 21.25 21.25 20.35 19.81 17.84 17.14 17.14 17.14 17.14 MINCGLHS4 Coal --Gulf, Lignite, High Sulfur, Surface, Stp 4 17.68 17.68 16.94 16.51 14.84 14.28 14.28 14.28 14.28 MINCGLHS5 Coal --Gulf, Lignite, High Sulfur, Surface, Stp 5 9.03 9.03 8.65 8.43 7.58 7.28 7.28 7.28 7.28 MINCGLHS6 Coal --Gulf, Lignite, High Sulfur, Surface, Stp 6 18.58 18.58 17.79 17.38 15.66 15.05 15.05 15.05 15.05 MINCGLHS7 Coal --Gulf, Lignite, High Sulfur, Surface, Stp 7 24.12 24.12 23.11 22.51 20.30 19.51 19.51 19.51 19.51 MINCGLHS8 Coal --Gulf, Lignite, High Sulfur, Surface, Stp 8 25.10 25.10 24.01 23.38 21.12 20.33 20.33 20.33 20.33 MINCGLMS1 Coal --Gulf, Lignite, Med. Sulfur, Surface, Stp 1 345.20 345.20 334.67 268.91 224.11 206.11 206.11 206.11 206.11 MINCGLMS2 Coal --Gulf, Lignite, Med. Sulfur, Surface, Stp 2 27.37 27.37 26.67 21.69 18.22 16.83 16.83 16.83 16.83 MINCGLMS3 Coal --Gulf, Lignite, Med. Sulfur, Surface, Stp 3 28.64 28.64 27.94 22.71 19.06 17.64 17.64 17.64 17.64 MINCGLMS4 Coal --Gulf, Lignite, Med. Sulfur, Surface, Stp 4 23.85 23.85 23.20 18.90 15.89 14.71 14.71 14.71 14.71 MINCGLMS5 Coal --Gulf, Lignite, Med. Sulfur, Surface, Stp 5 12.16 12.16 11.86 9.66 8.12 7.54 7.54 7.54 7.54 MINCGLMS6 Coal --Gulf, Lignite, Med. Sulfur, Surface, Stp 6 25.07 25.07 24.42 19.90 16.76 15.48 15.48 15.48 15.48 MINCGLMS7 Coal --Gulf, Lignite, Med. Sulfur, Surface, Stp 7 32.54 32.54 31.73 25.83 21.71 20.08 20.08 20.08 20.08
89

BOUND(BD)Or PJ MARKAL Technology Name 1995 2000 2005 2010 2015 2020 2025 2030 2035 MINCGLMS8 Coal --Gulf, Lignite, Med. Sulfur, Surface, Stp 8 33.90 33.90 33.03 26.91 22.63 20.89 20.89 20.89 20.89 MINCIBHS1 Coal --Interior, Bit., High Sulfur, Surface, Stp 1 694.92 694.92 717.78 766.16 709.97 692.09 692.09 692.09 692.09 MINCIBHS2 Coal --Interior, Bit., High Sulfur, Surface, Stp 2 52.44 52.44 54.21 57.96 53.79 52.45 52.45 52.45 52.45 MINCIBHS3 Coal --Interior, Bit., High Sulfur, Surface, Stp 3 54.67 54.67 56.59 60.47 56.07 54.66 54.66 54.66 54.66 MINCIBHS4 Coal --Interior, Bit., High Sulfur, Surface, Stp 4 45.43 45.43 47.07 50.24 46.64 45.46 45.46 45.46 45.46 MINCIBHS5 Coal --Interior, Bit., High Sulfur, Surface, Stp 5 23.29 23.29 24.03 25.64 23.84 23.16 23.16 23.16 23.16 MINCIBHS6 Coal --Interior, Bit., High Sulfur, Surface, Stp 6 47.62 47.62 49.39 52.66 48.87 47.76 47.76 47.76 47.76 MINCIBHS7 Coal --Interior, Bit., High Sulfur, Surface, Stp 7 61.76 61.76 63.95 68.31 63.34 61.80 61.80 61.80 61.80 MINCIBHS8 Coal --Interior, Bit., High Sulfur, Surface, Stp 8 64.19 64.19 66.58 71.13 66.01 64.34 64.34 64.34 64.34 MINCIBHU1 Coal --Interior, Bit., High Sul., Undergrd, Stp 1 650.99 650.99 690.16 775.67 810.30 841.56 841.56 841.56 841.56 MINCIBHU2 Coal --Interior, Bit., High Sul., Undergrd, Stp 2 60.07 60.07 63.67 71.67 74.85 77.77 77.77 77.77 77.77 MINCIBHU3 Coal --Interior, Bit., High Sul., Undergrd, Stp 3 63.81 63.81 67.65 76.08 79.49 82.51 82.51 82.51 82.51 MINCIBHU4 Coal --Interior, Bit., High Sul., Undergrd, Stp 4 53.86 53.86 57.08 64.14 67.03 69.72 69.72 69.72 69.72 MINCIBHU5 Coal --Interior, Bit., High Sul., Undergrd, Stp 5 27.81 27.81 29.51 33.07 34.63 35.92 35.92 35.92 35.92 MINCIBHU6 Coal --Interior, Bit., High Sul., Undergrd, Stp 6 57.70 57.70 61.11 68.74 71.82 74.61 74.61 74.61 74.61 MINCIBHU7 Coal --Interior, Bit., High Sul., Undergrd, Stp 7 75.80 75.80 80.39 90.34 94.41 98.06 98.06 98.06 98.06 MINCIBHU8 Coal --Interior, Bit., High Sul., Undergrd, Stp 8 80.06 80.06 84.84 95.41 99.67 103.59 103.59 103.59 103.59 MINCIBMS1 Coal --Interior, Bit., Med Sulfur, Surface, Stp 1 146.72 146.72 135.59 123.84 107.48 105.20 105.20 105.20 105.20 MINCIBMS2 Coal --Interior, Bit., Med Sulfur, Surface, Stp 2 15.25 15.25 14.29 13.24 11.61 11.43 11.43 11.43 11.43 MINCIBMS3 Coal --Interior, Bit., Med Sulfur, Surface, Stp 3 16.12 16.12 15.16 14.10 12.33 12.07 12.07 12.07 12.07 MINCIBMS4 Coal --Interior, Bit., Med Sulfur, Surface, Stp 4 13.62 13.62 12.81 11.85 10.41 10.23 10.23 10.23 10.23 MINCIBMS5 Coal --Interior, Bit., Med Sulfur, Surface, Stp 5 7.05 7.05 6.57 6.14 5.37 5.28 5.28 5.28 5.28 MINCIBMS6 Coal --Interior, Bit., Med Sulfur, Surface, Stp 6 14.48 14.48 13.67 12.61 11.13 10.95 10.95 10.95 10.95 MINCIBMS7 Coal --Interior, Bit., Med Sulfur, Surface, Stp 7 18.99 18.99 17.94 16.60 14.68 14.47 14.47 14.47 14.47 MINCIBMS8 Coal --Interior, Bit., Med Sulfur, Surface, Stp 8 20.00 20.00 18.80 17.46 15.44 15.19 15.19 15.19 15.19 MINCIBMU1 Coal --Interior, Bit., Med. Sulfur, Undergrd Stp 1 402.55 402.55 370.94 343.56 351.95 366.36 366.36 366.36 366.36 MINCIBMU2 Coal --Interior, Bit., Med. Sulfur, Undergrd Stp 2 42.69 42.69 39.57 36.93 37.94 39.57 39.57 39.57 39.57 MINCIBMU3 Coal --Interior, Bit., Med. Sulfur, Undergrd Stp 3 45.66 45.66 42.45 39.62 40.72 42.53 42.53 42.53 42.53 MINCIBMU4 Coal --Interior, Bit., Med. Sulfur, Undergrd Stp 4 38.80 38.80 36.02 33.67 34.63 36.13 36.13 36.13 36.13 MINCIBMU5 Coal --Interior, Bit., Med. Sulfur, Undergrd Stp 5 20.10 20.10 18.66 17.51 17.99 18.71 18.71 18.71 18.71 MINCIBMU6 Coal --Interior, Bit., Med. Sulfur, Undergrd Stp 6 41.97 41.97 38.95 36.40 37.46 39.09 39.09 39.09 39.09 MINCIBMU7 Coal --Interior, Bit., Med. Sulfur, Undergrd Stp 7 55.45 55.45 51.56 48.20 49.59 51.72 51.72 51.72 51.72 MINCIBMU8 Coal --Interior, Bit., Med. Sulfur, Undergrd Stp 8 58.95 58.95 54.82 51.22 52.76 55.08 55.08 55.08 55.08 MINCNSMS1 Coal --Northwest: Sub-bit, Med Sul., Surface. Stp 1 72.15 72.15 80.77 82.39 84.05 85.31 85.31 85.31 85.31 MINCNSMS2 Coal --Northwest: Sub-bit, Med Sul., Surface. Stp 2 8.02 8.02 8.94 9.08 9.24 9.44 9.44 9.44 9.44 MINCNSMS3 Coal --Northwest: Sub-bit, Med Sul., Surface. Stp 3 8.51 8.51 9.54 9.71 9.87 9.94 9.94 9.94 9.94 MINCNSMS4 Coal --Northwest: Sub-bit, Med Sul., Surface. Stp 4 7.19 7.19 8.05 8.18 8.32 8.45 8.45 8.45 8.45 MINCNSMS5 Coal --Northwest: Sub-bit, Med Sul., Surface. Stp 5 3.68 3.68 4.14 4.27 4.27 4.31 4.31 4.31 4.31 MINCNSMS6 Coal --Northwest: Sub-bit, Med Sul., Surface. Stp 6 7.69 7.69 8.58 8.75 8.88 9.00 9.00 9.00 9.00
continued
90

continued
BOUND(BD)Or PJ MARKAL Technology Name 1995 2000 2005 2010 2015 2020 2025 2030 2035 MINCNSMS7 Coal --Northwest: Sub-bit, Med Sul., Surface. Stp 7 10.17 10.17 11.33 11.50 11.69 11.82 11.82 11.82 11.82 MINCNSMS8 Coal --Northwest: Sub-bit, Med Sul., Surface. Stp 8 10.67 10.67 11.89 12.06 12.36 12.42 12.42 12.42 12.42 MINCPBLU1 Coal --Power River, Bit., Low Sul, Undergrd, Stp 1 14.59 14.59 2.27 2.14 1.36 0.76 0.76 0.76 0.76 MINCPBLU2 Coal --Power River, Bit., Low Sul, Undergrd, Stp 2 1.32 1.32 0.18 0.45 0.23 0.23 0.23 0.23 0.23 MINCPBLU3 Coal --Power River, Bit., Low Sul, Undergrd, Stp 3 1.45 1.45 0.18 0.50 0.32 0.23 0.23 0.23 0.23 MINCPBLU4 Coal --Power River, Bit., Low Sul, Undergrd, Stp 4 1.36 1.36 0.18 0.45 0.27 0.23 0.23 0.23 0.23 MINCPBLU5 Coal --Power River, Bit., Low Sul, Undergrd, Stp 5 0.50 0.50 0.09 0.23 0.23 0.00 0.00 0.00 0.00 MINCPBLU6 Coal --Power River, Bit., Low Sul, Undergrd, Stp 6 0.82 0.82 0.23 0.50 0.32 0.23 0.23 0.23 0.23 MINCPBLU7 Coal --Power River, Bit., Low Sul, Undergrd, Stp 7 1.14 1.14 0.27 0.73 0.45 0.23 0.23 0.23 0.23 MINCPBLU8 Coal --Power River, Bit., Low Sul, Undergrd, Stp 8 0.23 0.23 0.32 0.77 0.50 0.30 0.30 0.30 0.30 MINCPSLS1 Coal --Power R, Sub-Bit, Low Sul, Surface, Stp 1 5558.13 5558.13 6888.87 7972.84 9068.54 9991.33 9991.33 9991.33 9991.33 MINCPSLS2 Coal --Power R, Sub-Bit, Low Sul, Surface, Stp 2 369.08 369.08 455.16 525.43 598.82 660.94 660.94 660.94 660.94 MINCPSLS3 Coal --Power R, Sub-Bit, Low Sul, Surface, Stp 3 383.39 383.39 472.78 545.73 621.90 686.50 686.50 686.50 686.50 MINCPSLS4 Coal --Power R, Sub-Bit, Low Sul, Surface, Stp 4 317.19 317.19 391.13 451.38 514.50 567.98 567.98 567.98 567.98 MINCPSLS5 Coal --Power R, Sub-Bit, Low Sul, Surface, Stp 5 160.61 160.61 197.68 227.99 260.02 287.20 287.20 287.20 287.20 MINCPSLS6 Coal --Power R, Sub-Bit, Low Sul, Surface, Stp 6 330.91 330.91 407.90 470.68 536.52 592.32 592.32 592.32 592.32 MINCPSLS7 Coal --Power R, Sub-Bit, Low Sul, Surface, Stp 7 427.05 427.05 526.24 607.19 692.17 764.23 764.23 764.23 764.23 MINCPSLS8 Coal --Power R, Sub-Bit, Low Sul, Surface, Stp 8 441.99 441.99 544.74 628.40 716.36 790.96 790.96 790.96 790.96 MINCPSMS1 Coal --Power R, Sub-Bit, Med Sul, Surface, Stp 1 484.53 484.53 328.49 329.68 281.69 344.52 344.52 344.52 344.52 MINCPSMS2 Coal --Power R, Sub-Bit, Med Sul, Surface, Stp 2 61.30 61.30 47.80 49.81 43.36 50.89 50.89 50.89 50.89 MINCPSMS3 Coal --Power R, Sub-Bit, Med Sul, Surface, Stp 3 65.73 65.73 51.75 54.10 47.20 55.24 55.24 55.24 55.24 MINCPSMS4 Coal --Power R, Sub-Bit, Med Sul, Surface, Stp 4 55.89 55.89 44.33 46.42 40.49 47.35 47.35 47.35 47.35 MINCPSMS5 Coal --Power R, Sub-Bit, Med Sul, Surface, Stp 5 28.86 28.86 22.97 24.09 21.07 24.55 24.55 24.55 24.55 MINCPSMS6 Coal --Power R, Sub-Bit, Med Sul, Surface, Stp 6 60.37 60.37 48.25 50.71 44.30 51.64 51.64 51.64 51.64 MINCPSMS7 Coal --Power R, Sub-Bit, Med Sul, Surface, Stp 7 79.72 79.72 64.21 67.56 59.02 68.67 68.67 68.67 68.67 MINCPSMS8 Coal --Power R, Sub-Bit, Med Sul, Surface, Stp 8 84.56 84.56 68.53 72.22 63.20 73.33 73.33 73.33 73.33 MINCRBLU1 Coal --Rocky Mtns, Bit., Low Sul., Undergrd, Stp 1 1054.46 1054.46 1420.54 1454.27 1509.43 1527.51 1527.51 1527.51 1527.51 MINCRBLU2 Coal --Rocky Mtns, Bit., Low Sul., Undergrd, Stp 2 88.74 88.74 119.61 122.09 126.62 127.87 127.87 127.87 127.87 MINCRBLU3 Coal --Rocky Mtns, Bit., Low Sul., Undergrd, Stp 3 93.81 93.81 126.37 129.10 133.82 135.17 135.17 135.17 135.17 MINCRBLU4 Coal --Rocky Mtns, Bit., Low Sul., Undergrd, Stp 4 78.76 78.76 106.17 108.41 112.35 113.51 113.51 113.51 113.51 MINCRBLU5 Coal --Rocky Mtns, Bit., Low Sul., Undergrd, Stp 5 40.60 40.60 54.67 55.69 57.78 58.42 58.42 58.42 58.42 MINCRBLU6 Coal --Rocky Mtns, Bit., Low Sul., Undergrd, Stp 6 83.88 83.88 113.08 115.32 119.56 120.81 120.81 120.81 120.81 MINCRBLU7 Coal --Rocky Mtns, Bit., Low Sul., Undergrd, Stp 7 109.87 109.87 148.09 151.05 156.56 158.13 158.13 158.13 158.13 MINCRBLU8 Coal --Rocky Mtns, Bit., Low Sul., Undergrd, Stp 8 115.62 115.62 155.73 158.89 164.64 166.41 166.41 166.41 166.41 MINCRSLS1 Coal --Rocky Mtn, Sub-Bit, Low Sul., Surface. Stp 1 189.11 189.11 138.46 100.34 80.09 76.61 76.61 76.61 76.61 MINCRSLS2 Coal --Rocky Mtn, Sub-Bit, Low Sul., Surface. Stp 2 12.36 12.36 8.98 6.42 5.12 4.84 4.84 4.84 4.84 MINCRSLS3 Coal --Rocky Mtn, Sub-Bit, Low Sul., Surface. Stp 3 12.79 12.79 9.37 6.63 5.33 4.99 4.99 4.99 4.99 MINCRSLS4 Coal --Rocky Mtn, Sub-Bit, Low Sul., Surface. Stp 4 10.62 10.62 7.72 5.51 4.38 4.12 4.12 4.12 4.12 MINCRSLS5 Coal --Rocky Mtn, Sub-Bit, Low Sul., Surface. Stp 5 5.42 5.42 3.95 2.86 2.17 2.17 2.17 2.17 2.17
91

BOUND(BD)Or PJ MARKAL Technology Name 1995 2000 2005 2010 2015 2020 2025 2030 2035 MINCRSLS6 Coal --Rocky Mtn, Sub-Bit, Low Sul., Surface. Stp 6 11.10 11.10 8.02 5.77 4.51 4.34 4.34 4.34 4.34 MINCRSLS7 Coal --Rocky Mtn, Sub-Bit, Low Sul., Surface. Stp 7 14.22 14.22 10.36 7.42 5.90 5.64 5.64 5.64 5.64 MINCRSLS8 Coal --Rocky Mtn, Sub-Bit, Low Sul., Surface. Stp 8 14.79 14.79 10.67 7.72 6.07 5.85 5.85 5.85 5.85 MINCSBLS1 Coal --Southwest, Bit, Low Sul., Surface. Stp 1 343.76 343.76 306.43 299.39 299.61 297.60 297.60 297.60 297.60 MINCSBLS2 Coal --Southwest, Bit, Low Sul., Surface. Stp 2 23.26 23.26 20.71 20.21 20.26 20.17 20.17 20.17 20.17 MINCSBLS3 Coal --Southwest, Bit, Low Sul., Surface. Stp 3 24.11 24.11 21.51 21.02 21.06 20.84 20.84 20.84 20.84 MINCSBLS4 Coal --Southwest, Bit, Low Sul., Surface. Stp 4 20.03 20.03 17.79 17.39 17.39 17.26 17.26 17.26 17.26 MINCSBLS5 Coal --Southwest, Bit, Low Sul., Surface. Stp 5 10.17 10.17 9.10 8.87 8.87 8.74 8.74 8.74 8.74 MINCSBLS6 Coal --Southwest, Bit, Low Sul., Surface. Stp 6 20.93 20.93 18.60 18.15 18.15 18.15 18.15 18.15 18.15 MINCSBLS7 Coal --Southwest, Bit, Low Sul., Surface. Stp 7 26.98 26.98 23.98 23.49 23.44 23.31 23.31 23.31 23.31 MINCSBLS8 Coal --Southwest, Bit, Low Sul., Surface. Stp 8 27.92 27.92 24.87 24.34 24.29 24.20 24.20 24.20 24.20 MINCSSMS1 Coal --Southwest, Sub-bit, Med Sul., Surface. Stp 1 311.10 311.10 306.94 310.98 293.49 282.75 282.75 282.75 282.75 MINCSSMS2 Coal --Southwest, Sub-bit, Med Sul., Surface. Stp 2 20.88 20.88 20.58 20.92 19.77 19.01 19.01 19.01 19.01 MINCSSMS3 Coal --Southwest, Sub-bit, Med Sul., Surface. Stp 3 21.77 21.77 21.46 21.69 20.54 19.71 19.71 19.71 19.71 MINCSSMS4 Coal --Southwest, Sub-bit, Med Sul., Surface. Stp 4 17.99 17.99 17.72 17.99 16.95 16.31 16.31 16.31 16.31 MINCSSMS5 Coal --Southwest, Sub-bit, Med Sul., Surface. Stp 5 9.17 9.17 9.13 9.17 8.63 8.28 8.28 8.28 8.28 MINCSSMS6 Coal --Southwest, Sub-bit, Med Sul., Surface. Stp 6 18.76 18.76 18.53 18.80 17.69 17.08 17.08 17.08 17.08 MINCSSMS7 Coal --Southwest, Sub-bit, Med Sul., Surface. Stp 7 24.24 24.24 23.93 24.27 22.89 22.03 22.03 22.03 22.03 MINCSSMS8 Coal --Southwest, Sub-bit, Med Sul., Surface. Stp 8 25.12 25.12 24.81 25.12 23.73 22.80 22.80 22.80 22.80
DOMESTIC OIL AND GAS RESOURCE SUPPLY
START COST 1995 2000 2005 2010 2015 2020 2025 2030 2035 MINOIL1 Domestic crude oil -Lower 48-Step1 1995 2.941 3.180 3.409 2.646 2.646 2.646 2.721 2.798 2.877 MINOIL2 Domestic crude oil -Lower 48-Step2 1995 0.000 0.000 0.000 3.503 3.599 3.701 3.806 3.914 4.025 MINOIL3 Domestic crude oil -Lower 48-Step3 1995 0.000 0.000 0.000 4.501 4.565 4.586 4.716 4.850 4.987 MINOILA Domestic crude oil - Alaska - Step1 1995 2.941 3.180 3.409 2.646 2.646 2.646 2.721 2.798 2.877 MINOILB Domestic crude oil - Alaska - Step2 1995 0.000 0.000 0.000 3.503 3.599 3.701 3.806 3.914 4.025 MINOILC Domestic crude oil - Alaska - Step3 1995 0.000 0.000 0.000 4.501 4.565 4.586 4.716 4.850 4.987 MINNGA1 Domestic Dry Natural Gas- Step 1 1995 1.835 2.517 2.255 2.255 2.442 2.493 2.647 2.811 2.985 MINNGA2 Domestic Dry Natural Gas- Step 2 1995 0.000 0.000 0.000 2.416 2.603 2.764 2.935 3.117 3.310 MINNGA3 Domestic Dry Natural Gas- Step 3 1995 0.000 0.000 0.000 2.806 2.849 3.095 3.286 3.489 3.705 MINNGL1 Domestic Natural Gas Plant Liquids- Step 1 1995 3.411 3.688 3.954 3.069 3.069 3.069 3.156 3.245 3.337 MINNGL2 Domestic Natural Gas Plant Liquids- Step 2 1995 0.000 0.000 0.000 4.064 4.175 4.294 4.415 4.540 4.669 MINNGL3 Domestic Natural Gas Plant Liquids- Step 3 1995 0.000 0.000 0.000 5.221 5.296 5.320 5.471 5.626 5.785
92

BOUND(BD)Or 1995 2000 2005 2010 2015 2020 2025 2030 2035 MINOIL1 Domestic crude oil -Lower 48-Step1 11467.064 10972.332 10229.675 9068.227 9023.556 8621.517 8399.026 8182.277 7971.121 MINOIL2 Domestic crude oil -Lower 48-Step2 0.000 0.000 0.000 714.737 1362.468 1496.481 1457.862 1420.240 1383.588 MINOIL3 Domestic crude oil -Lower 48-Step3 0.000 0.000 0.000 871.086 1183.783 1764.507 1718.972 1674.611 1631.395 MINOILA Domestic crude oil - Alaska - Step1 3265.455 2328.480 1786.843 1541.152 1987.863 2412.238 2948.291 3603.466 4404.237 MINOILB Domestic crude oil - Alaska - Step2 0.000 0.000 0.000 22.336 22.336 44.671 54.598 66.731 81.560 MINOILC Domestic crude oil - Alaska - Step3 0.000 0.000 0.000 44.671 44.671 44.671 54.598 66.731 81.560 MINNGA1 Domestic Dry Natural Gas- Step 1 20179.731 20764.816 22439.965 24888.771 27399.804 29520.467 31945.011 34568.686 37407.846 MINNGA2 Domestic Dry Natural Gas- Step 2 0.000 0.000 0.000 559.180 1118.359 1339.921 1449.970 1569.058 1697.926 MINNGA3 Domestic Dry Natural Gas- Step 3 0.000 0.000 0.000 611.932 654.135 495.876 536.603 580.675 628.366 MINNGL1 Domestic Natural Gas Plant Liquids- Step 1 2677.324 2781.342 3210.980 3557.705 3904.431 4175.781 4492.128 4832.441 5198.535 MINNGL2 Domestic Natural Gas Plant Liquids- Step 2 0.000 0.000 0.000 30.150 75.375 105.525 113.519 122.119 131.371 MINNGL3 Domestic Natural Gas Plant Liquids- Step 3 0.000 0.000 0.000 15.075 30.150 60.300 64.868 69.783 75.069
IMPORTED CRUDE OIL
START COST year $95million/PJ 1995 2000 2005 2010 2015 2020 2025 2030 2035 IMPOILHH1 Imported Oil--high sulfur, heavy gravity--Step 1 FHH 1995 2.420 2.745 2.986 3.088 3.156 3.293 3.429 3.572 3.720 IMPOILHH2 Imported Oil--high sulfur, heavy gravity--Step 2 FHH 1995 2.563 2.912 3.214 3.359 3.543 3.695 3.846 4.004 4.168 IMPOILHH3 Imported Oil--high sulfur, heavy gravity--Step 3 FHH 1995 2.699 3.098 3.406 3.413 3.592 3.743 3.895 4.052 4.215 IMPOILHL1 Imported Oil--high sulfur, low gravity--Step 1 FHL 1995 2.580 2.930 3.156 3.302 3.449 3.603 3.758 3.920 4.088 IMPOILHL2 Imported Oil--high sulfur, low gravity--Step 2 FHL 1995 2.731 3.106 3.323 3.400 3.520 3.677 3.834 3.998 4.169 IMPOILHL3 Imported Oil--high sulfur, low gravity--Step 3 FHL 1995 2.890 3.306 3.530 3.567 3.780 3.936 4.091 4.253 4.421 IMPOILHV1 Imported Oil--high sulfur, very high grav--Step 1 FHV 1995 1.916 2.241 2.536 2.626 2.718 2.853 2.989 3.130 3.279 IMPOILHV2 Imported Oil--high sulfur, very high grav--Step 2 FHV 1995 2.042 2.391 2.643 2.730 2.898 3.043 3.188 3.340 3.499 IMPOILHV3 Imported Oil--high sulfur, very high grav--Step 3 FHV 1995 2.172 2.535 2.808 2.854 3.055 3.147 3.240 3.335 3.434 IMPOILLL1 Imported Oil--low sulfur, low gravity--Step 1 FLL 1995 2.951 3.239 3.532 3.678 3.880 4.065 4.249 4.442 4.644 IMPOILLL2 Imported Oil--low sulfur, low gravity--Step 2 FLL 1995 3.128 3.445 3.783 4.033 4.243 4.470 4.697 4.936 5.187 IMPOILLL3 Imported Oil--low sulfur, low gravity--Step 3 FLL 1995 3.285 3.661 3.957 4.058 4.336 4.574 4.812 5.063 5.326 IMPOILMH1 Imported Oil--medium sulfur, heavy gravity--Step 1 FMH 1995 2.718 3.031 3.335 3.488 3.616 3.748 3.880 4.017 4.159 IMPOILMH2 Imported Oil--medium sulfur, heavy gravity--Step 2 FMH 1995 2.873 3.202 3.508 3.617 3.746 3.870 3.993 4.121 4.253 IMPOILMH3 Imported Oil--medium sulfur, heavy gravity--Step 3 FMH 1995 3.031 3.442 3.745 3.827 4.101 4.284 4.468 4.660 4.860
93

BOUND(BD)Or PJ 1995 2000 2005 2010 2015 2020 2025 2030 2035 IMPOILHH1 Imported Oil--high sulfur, heavy gravity--Step 1 FHH 2254.3 2444.3 2659.1 3047.1 4502.1 6015.0 8036.3 10736.9 14345.0 IMPOILHH2 Imported Oil--high sulfur, heavy gravity--Step 2 FHH 2126.0 2305.4 2483.5 2873.7 4245.5 5671.9 7577.4 10123.0 13524.0 IMPOILHH3 Imported Oil--high sulfur, heavy gravity--Step 3 FHH 2332.0 2559.1 2795.3 3186.8 4701.3 6276.6 8379.6 11187.4 14935.9 IMPOILHL1 Imported Oil--high sulfur, low gravity--Step 1 FHL 2918.2 4539.8 5650.1 6774.8 9947.2 13537.8 18424.5 25075.2 34126.5 IMPOILHL2 Imported Oil--high sulfur, low gravity--Step 2 FHL 2751.2 4280.3 5327.0 6387.6 9378.4 12763.6 17370.8 23641.0 32174.6 IMPOILHL3 Imported Oil--high sulfur, low gravity--Step 3 FHL 3025.6 4691.1 5827.5 6991.8 10205.9 13873.8 18860.1 25638.5 34852.9 IMPOILHV1 Imported Oil--high sulfur, very high grav--Step 1 FHV 680.0 785.7 867.7 1016.5 1483.0 1998.0 2691.9 3626.7 4886.1 IMPOILHV2 Imported Oil--high sulfur, very high grav--Step 2 FHV 638.5 741.4 818.4 958.7 1398.2 1883.5 2537.3 3418.0 4604.4 IMPOILHV3 Imported Oil--high sulfur, very high grav--Step 3 FHV 694.3 813.9 899.8 1053.5 1538.7 2073.9 2795.1 3767.1 5077.2 IMPOILLL1 Imported Oil--low sulfur, low gravity--Step 1 FLL 2302.7 2373.6 2485.9 2772.8 4105.8 5412.6 7135.2 9406.2 12399.9 IMPOILLL2 Imported Oil--low sulfur, low gravity--Step 2 FLL 2171.1 2224.0 2343.7 2614.4 3871.1 5103.3 6727.9 8869.5 11693.0 IMPOILLL3 Imported Oil--low sulfur, low gravity--Step 3 FLL 2393.6 2550.0 2658.5 3012.2 4151.7 5412.3 7055.8 9198.3 11991.5 IMPOILMH1 Imported Oil--medium sulfur, heavy gravity--Step 1 FMH 993.4 1048.4 1115.3 1263.3 1855.3 2440.6 3210.6 4223.5 5556.0 IMPOILMH2 Imported Oil--medium sulfur, heavy gravity--Step 2 FMH 937.6 989.6 1031.9 1219.6 1741.4 2301.5 3041.9 4020.5 5313.8 IMPOILMH3 Imported Oil--medium sulfur, heavy gravity--Step 3 FMH 1071.7 1220.5 1457.5 1497.3 2100.8 2727.6 3541.4 4598.0 5969.8
IMPORTED REFINED PRODUCTS
continued
START COST year 95m$/PJ 1995 2000 2005 2010 2015 2020 2025 2030 2035 IMPDHO1 Imported Diesel, Heating Oil--Step 1 1995 3.460 3.894 4.243 4.385 4.665 4.771 4.879 4.987 5.098 IMPDHO2 Imported Diesel, Heating Oil--Step 2 1995 3.697 4.181 4.519 4.645 4.761 4.870 4.980 5.091 5.204 IMPDHO3 Imported Diesel, Heating Oil--Step 3 1995 3.917 4.457 4.821 4.976 5.127 5.244 5.363 5.482 5.603 IMPDSLL1 Imported Low Sulfur Diesel--Step 1 1995 3.700 3.974 4.064 4.550 4.672 4.771 4.885 5.011 5.140 IMPDSLL2 Imported Low Sulfur Diesel--Step 2 1995 3.973 4.285 4.492 4.970 5.126 5.234 5.359 5.498 5.639 IMPDSLL3 Imported Low Sulfur Diesel--Step 3 1995 4.248 4.655 4.877 5.282 5.432 5.546 5.679 5.826 5.976 IMPDSLU1 Imported Ultra-low Sulfur Diesel--Step 1 2005 0.000 34.969 45.034 21.928 22.064 22.064 22.064 22.064 22.064 IMPDSLU2 Imported Ultra-low Sulfur Diesel--Step 2 2005 0.000 32.980 43.880 20.299 22.064 22.064 22.064 22.064 22.064 IMPDSLU3 Imported Ultra-low Sulfur Diesel--Step 3 2005 0.000 31.989 49.562 50.000 77.223 77.223 77.223 77.223 77.223 IMPPFDST1 Imported Petroleum Feedstocks--Step 1 1995 2.818 3.207 3.531 3.559 3.611 3.680 3.737 3.801 3.866 IMPPFDST2 Imported Petroleum Feedstocks--Step 2 1995 3.036 3.451 3.817 3.906 4.015 4.092 4.155 4.226 4.298 IMPPFDST3 Imported Petroleum Feedstocks--Step 3 1995 3.246 3.702 4.100 4.187 4.292 4.374 4.442 4.518 4.595 IMPGSL1 Imported Reform. and Conventional Gasoline--Step 1 1995 7.508 5.851 6.395 9.044 10.140 10.350 10.888 11.435 12.010 IMPGSL2 Imported Reform. and Conventional Gasoline--Step 2 1995 8.000 6.194 6.796 9.898 11.011 11.239 11.824 12.418 13.043 IMPGSL3 Imported Reform. and Conventional Gasoline--Step 3 1995 8.494 7.596 9.607 12.026 11.987 12.235 12.872 13.520 14.201 IMPJTF1 Imported Jet Fuel--Step 1 1995 3.618 4.163 4.361 4.452 4.547 4.663 4.794 4.927 5.064 IMPJTF2 Imported Jet Fuel--Step 2 1995 3.847 4.470 4.700 4.796 4.892 5.018 5.158 5.302 5.449
94

continued
START COST year 95m$/PJ 1995 2000 2005 2010 2015 2020 2025 2030 2035 IMPJTF3 Imported Jet Fuel--Step 3 1995 4.128 4.758 5.000 5.086 5.207 5.340 5.490 5.643 5.800 IMPKER1 Imported Kerosene and Other Refined Prod.--Step 1 1995 2.490 2.944 3.335 3.393 3.475 3.567 3.650 3.731 3.814 IMPKER2 Imported Kerosene and Other Refined Prod.--Step 2 1995 2.694 3.157 3.554 3.675 3.752 3.851 3.941 4.028 4.118 IMPKER3 Imported Kerosene and Other Refined Prod.--Step 3 1995 2.898 3.429 3.818 3.917 4.072 4.180 4.278 4.373 4.470 IMPLPG1 Imported Liquified Petroleum Gas--Step 1 1995 3.035 3.769 4.281 4.249 4.315 4.394 4.470 4.553 4.638 IMPLPG2 Imported Liquified Petroleum Gas--Step 2 1995 3.273 4.032 4.571 4.663 4.817 4.904 4.989 5.082 5.177 IMPLPG3 Imported Liquified Petroleum Gas--Step 3 1995 3.547 4.292 4.836 4.894 5.020 5.111 5.199 5.296 5.395 IMPMETH1 Imported Methanol--Step 1 1995 3.992 4.410 4.843 5.000 5.175 5.346 5.529 5.716 5.911 IMPMETH2 Imported Methanol--Step 2 1995 4.270 4.715 5.155 5.330 5.547 5.731 5.927 6.128 6.336 IMPMETH3 Imported Methanol--Step 3 1995 4.548 5.022 5.489 5.716 5.935 6.132 6.341 6.557 6.779 IMPDSHH1 Imported High Sulfur Fuel Oil--Step 1 1995 1.567 1.889 2.189 2.216 2.310 2.387 2.484 2.584 2.687 IMPDSHH2 Imported High Sulfur Fuel Oil--Step 2 1995 1.701 2.063 2.375 2.425 2.473 2.555 2.660 2.767 2.878 IMPDSHH3 Imported High Sulfur Fuel Oil--Step 3 1995 1.827 2.206 2.537 2.594 2.708 2.797 2.912 3.029 3.150 IMPDSHL1 Imported Low Sulfur Fuel Oil--Step 1 1996 1.997 2.340 2.654 2.716 2.809 2.877 2.946 3.016 3.087 IMPDSHL2 Imported Low Sulfur Fuel Oil--Step 2 1997 2.155 2.526 2.839 2.914 3.000 3.074 3.147 3.222 3.298 IMPDSHL3 Imported Low Sulfur Fuel Oil--Step 3 1998 2.314 2.706 3.017 3.120 3.214 3.293 3.371 3.451 3.533 IMPNGA1 Imported Natural Gas- Step1 1995 1.761 3.337 2.270 2.372 2.549 2.668 2.898 3.148 3.420 IMPNGA2 Imported Natural Gas- Step2 1995 0.000 0.000 0.000 2.465 2.651 2.880 3.128 3.398 3.691 IMPNGA3 Imported Natural Gas- Step3 1995 0.000 0.000 0.000 2.609 2.812 3.125 3.395 3.688 4.006
BOUND(BD)Or 1995 2005 2010 2015 2020 2025 2030 2035 IMPDHO1 Imported Diesel, Heating Oil--Step 1 197.3 312.1 464.6 700.8 953.9 1272.5 1696.5 2261.7 IMPDHO2 Imported Diesel, Heating Oil--Step 2 187.8 295.1 438.9 661.8 900.8 1201.7 1602.1 2135.9 IMPDHO3 Imported Diesel, Heating Oil--Step 3 182.1 286.5 425.9 641.8 873.6 1165.4 1553.7 2071.3 IMPDSLL1 Imported Low Sulfur Diesel--Step 1 477.3 198.3 585.7 1811.8 2523.3 3455.2 4751.8 6534.8 IMPDSLL2 Imported Low Sulfur Diesel--Step 2 450.3 198.3 554.1 1707.9 2378.5 3257.0 4479.1 6159.9 IMPDSLL3 Imported Low Sulfur Diesel--Step 3 436.9 281.3 581.3 1656.7 2307.3 3159.5 4345.0 5975.4 IMPDSLU1 Imported Ultra-low Sulfur Diesel--Step 1 0.0 63.6 62.6 64.5 63.6 62.7 61.5 60.4 IMPDSLU2 Imported Ultra-low Sulfur Diesel--Step 2 0.0 68.8 68.5 69.9 68.9 67.8 66.6 65.4 IMPDSLU3 Imported Ultra-low Sulfur Diesel--Step 3 0.0 72.4 72.0 74.4 73.3 72.2 70.9 69.7 IMPPFDST1 Imported Petroleum Feedstocks--Step 1 419.7 436.5 515.9 749.3 1030.2 1406.8 1914.8 2606.2 IMPPFDST2 Imported Petroleum Feedstocks--Step 2 396.2 412.7 494.3 716.6 985.1 1345.2 1831.0 2492.2 IMPPFDST3 Imported Petroleum Feedstocks--Step 3 384.5 402.8 477.6 691.3 950.4 1297.8 1766.4 2404.2 IMPGSL1 Imported Reform. and Conventional Gasoline--Step 1 763.3 659.2 906.7 1386.8 1907.5 2688.9 3783.1 5322.5 IMPGSL2 Imported Reform. and Conventional Gasoline--Step 2 721.9 623.7 877.7 1328.0 1826.6 2574.9 3622.6 5096.8 IMPGSL3 Imported Reform. and Conventional Gasoline--Step 3 700.9 808.5 1003.4 1315.2 1809.1 2550.2 3588.0 5048.2
95

ELECTRIC GENERATION
LIFE AF AF_TID PEAK(CON) Fraction of Fraction of Technical Availability unavailability capacity for
START HEAT RATE VAROM FIXOM Lifetime Fraction that is forced peak and reserve
MARKAL Technology Name year Btu/kwh 95mills/kwh 95$/KW years dec
fraction dec fraction dec fraction ECOAIGC00 Integrated Coal Gasif. Combined Cycle -- 2000 2000 7969 0.73 29.98 30 0.85 0.37 0.90 ECOAIGC05 Integrated Coal Gasif. Combined Cycle -- 2005 2005 7469 0.73 29.98 30 0.85 0.37 0.90 ECOAIGC10 Integrated Coal Gasif. Combined Cycle -- 2010 2010 6968 0.73 29.98 30 0.85 0.37 0.90 ECOAPFB Pressurized Fluidized Bed 2010 9228 3.10 38.11 40 0.85 0.50 0.80 ECOASTMB Existing Bituminous Coal Steam 1995 11990 2.78 14.21 40 0.85 0.37 0.96 ECOASTMS Existing Sub-Bituminous Coal Steam 1995 11990 2.78 14.21 40 0.85 0.37 0.96 ECOASTML Existing Lignite Steam 1995 11990 2.78 14.21 40 0.85 0.37 0.96 ECOACFP00 Pulverized Coal -- 2000 2000 9419 3.10 21.48 40 0.85 0.37 0.96
continued
BOUND(BD)Or 1995 2005 2010 2015 2020 2025 2030 2035 IMPJTF1 Imported Jet Fuel--Step 1 179.6 549.9 800.8 1221.4 1711.4 2406.4 3381.5 4751.6 IMPJTF2 Imported Jet Fuel--Step 2 171.1 518.4 754.1 1150.7 1612.3 2267.1 3185.6 4476.4 IMPJTF3 Imported Jet Fuel--Step 3 166.4 502.9 731.6 1116.0 1563.7 2198.7 3089.6 4341.5 IMPKER1 Imported Kerosene and Other Refined Prod.--Step 1 65.3 95.2 139.8 212.4 269.5 357.4 474.2 629.2 IMPKER2 Imported Kerosene and Other Refined Prod.--Step 2 63.8 91.8 150.9 215.4 273.4 362.5 481.1 638.3 IMPKER3 Imported Kerosene and Other Refined Prod.--Step 3 62.2 143.6 195.2 206.7 262.4 347.9 461.6 612.5 IMPLPG1 Imported Liquified Petroleum Gas--Step 1 129.7 223.2 286.5 432.3 593.6 811.5 1111.3 1521.8 IMPLPG2 Imported Liquified Petroleum Gas--Step 2 123.9 212.0 271.6 409.5 562.3 768.7 1052.7 1441.6 IMPLPG3 Imported Liquified Petroleum Gas--Step 3 120.6 206.0 264.0 397.7 546.1 746.5 1022.3 1400.0 IMPMETH1 Imported Methanol--Step 1 51.4 51.4 51.4 51.4 51.4 51.4 51.4 51.4 IMPMETH2 Imported Methanol--Step 2 50.4 50.4 50.4 50.4 50.4 50.4 50.4 50.4 IMPMETH3 Imported Methanol--Step 3 49.4 49.4 49.4 49.4 49.4 49.4 49.4 49.4 IMPDSHH1 Imported High Sulfur Fuel Oil--Step 1 433.7 558.8 564.4 795.8 1118.6 1573.4 2207.7 3097.9 IMPDSHH2 Imported High Sulfur Fuel Oil--Step 2 409.6 531.7 532.3 750.8 1055.3 1484.3 2082.8 2922.6 IMPDSHH3 Imported High Sulfur Fuel Oil--Step 3 397.2 522.2 532.4 728.6 1024.1 1440.5 2021.3 2836.3 IMPDSHL1 Imported Low Sulfur Fuel Oil--Step 1 360.8 478.7 643.4 984.4 1340.6 1808.0 2435.6 3280.9 IMPDSHL2 Imported Low Sulfur Fuel Oil--Step 2 341.6 452.6 607.6 929.0 1265.3 1706.4 2298.6 3096.4 IMPDSHL3 Imported Low Sulfur Fuel Oil--Step 3 331.6 439.4 589.7 901.8 1228.1 1656.3 2231.2 3005.6 IMPNGA1 Imported Natural Gas- Step1 2977.4 5285.6 5675.9 6045.2 5992.4 6151.1 6314.1 6481.3 IMPNGA2 Imported Natural Gas- Step2 0.0 0.0 274.3 327.1 548.6 563.1 578.0 593.4 IMPNGA3 Imported Natural Gas- Step3 0.0 0.0 474.8 738.5 812.4 833.9 856.0 878.6
96

LIFE AF AF_TID PEAK(CON) Fraction of Fraction of Technical Availability unavailability capacity for
START HEAT RATE VAROM FIXOM Lifetime Fraction that is forced
peak and reserve
MARKAL Technology Name year Btu/kwh 95mills/kwh 95$/KW years dec fraction dec fraction dec fraction ECOACFP05 Pulverized Coal -- 2005 2005 9253 3.10 21.48 40 0.85 0.37 0.96 ECOACFP10 Pulverized Coal -- 2010 2010 9087 3.10 21.48 40 0.85 0.37 0.96 ECOACFPR Repowered Existing Coal Powered Facilities 2000 11990 3.10 32.73 30 0.85 0.37 0.87 ENGADGB05 Distributed Generation--Base--2005 2005 10991 13.87 3.69 30 0.84 0.63 0.96 ENGADGB10 Distributed Generation--Base--2010 2010 9210 13.87 3.69 30 0.84 0.63 0.96 ENGADGP Distributed Generation--Peak 2005 10620 21.20 11.53 30 0.84 0.63 0.96 ESOLPVR Photovolataic--Residential 1995 10280 0.00 118.28 20 see Timeslice see Timeslice 0.30 EWINLWT Local Wind Turbine 1995 10263 7.45 8.51 20 see Timeslice see Timeslice 0.30 ECOAMCFC Coal Gasification Molten Carb Fuel Cell 2005 7575 24.83 34.49 30 0.87 0.80 0.60 ENGAFC Gas Fuel Cell 2005 5744 1.91 13.75 20 0.87 0.80 0.60 EMTHFC Methanol Fuel Cell 2000 8530 12.00 8.39 20 0.87 0.80 0.60 ENGAGCE Existing Natural Gas Combined Cycle 1995 8030 0.48 14.31 30 0.91 0.57 1.00 ENGAGC00 Natural Gas Combined Cycle--2000 2000 7687 0.48 14.33 30 0.91 0.57 0.94 ENGAGC05 Natural Gas Combined Cycle--2005 2005 7343 0.48 14.33 30 0.91 0.57 0.94 ENGAGC10 Natural Gas Combined Cycle--2010 2010 7000 0.48 14.33 30 0.91 0.57 0.94 ENGAAGC05 Natural Gas Advanced Combined Cycle--2005 2005 6639 0.48 13.27 30 0.91 0.57 0.86 ENGAAGC10 Natural Gas Advanced Combined Cycle--2010 2010 6350 0.48 13.27 30 0.91 0.57 0.86 ENGASTM Natural Gas Steam 1995 9500 0.48 28.61 40 0.85 0.37 0.96 ENGACTE Existing Natural Gas Combustion Turbine 1995 11900 0.09 5.91 30 0.92 0.47 0.96 ENGACT00 Natural Gas Combustion Turbine--2000 2000 11467 0.09 5.92 30 0.92 0.47 0.96 ENGACT05 Natural Gas Combustion Turbine--2005 2005 11033 0.09 5.92 30 0.92 0.47 0.96 ENGACT10 Natural Gas Combustion Turbine--2010 2010 10600 0.09 5.92 30 0.92 0.47 0.96 ENGAACT05 Natural Gas Advanced Combustion Turbine--2005 2005 8567 0.09 8.41 30 0.92 0.47 0.94 ENGAACT10 Natural Gas Advanced Combustion Turbine--2010 2010 8000 0.09 8.41 30 0.92 0.47 0.94 ENUCCONV Conventional Nuclear 1995 10800 0.29 77.05 40 0.80 0.42 0.85 ENUCADV Advanced Nuclear 2005 10400 0.39 52.52 40 0.85 0.38 0.85 EDSLICE Diesel internal combustion engine 1995 13648 8.07 0.78 20 0.84 0.63 0.96 EDSHSTM Residual Fuel Oil Steam 1995 9500 0.48 28.61 40 0.85 0.37 0.98 EDSLCT Distillate Oil Combustion Turbine 1995 11900 0.09 5.91 30 0.92 0.47 0.96 EHYDROPS Hydroelectric Pumped Storage 1995 10280 2.40 15.18 50 see Timeslice 1.00 0.95 EBIOCC Biomass Gasification Combined Cycle 1995 8911 2.66 41.25 30 0.80 0.80 0.84 EGEOBCFS Geothermal Binary Cycle and Flashed Steam 1995 32173 0.00 64.31 30 0.64 1.00 0.63 EHYDRO Hydroelectric 1995 10280 4.07 12.90 60 0.44 0.10 0.94 EBMSWLG Municipal Solid Waste-Landfill Gas 1995 13648 0.01 88.39 30 see Timeslice see Timeslice 0.90 ESOLCT Solar Central Thermal 1995 10280 0.00 43.93 30 see Timeslice see Timeslice 0.30 ESOLCPV Central Photovoltaic 1995 10280 0.00 9.04 30 see Timeslice see Timeslice 0.50 EWINCELC Wind Central Electric 1995 10280 0.00 23.44 30 see Timeslice see Timeslice 0.30
97

CAPITAL COST 95$/KW 95$/KW 95$/KW 95$/KW 95$/KW MARKAL Technology Name 2000 2005 2010 2015 2020 ECOAIGC00 Integrated Coal Gasif. Combined Cycle -- 2000 1338 0 0 0 0 ECOAIGC05 Integrated Coal Gasif. Combined Cycle -- 2005 0 1315 0 0 0 ECOAIGC10 Integrated Coal Gasif. Combined Cycle -- 2010 0 0 1287 1260 1221 ECOAPFB Pressurized Fluidized Bed 1570 1570 1570 1570 1570 ECOASTMB Existing Bituminous Coal Steam 1710 1710 1710 1710 1710 ECOASTMS Existing Sub-Bituminous Coal Steam 1761 1761 1761 1761 1761 ECOASTML Existing Lignite Steam 1572 1572 1572 1572 1572 ECOACFP00 Pulverized Coal -- 2000 1119 0 0 0 0 ECOACFP05 Pulverized Coal -- 2005 0 1110 0 0 0 ECOACFP10 Pulverized Coal -- 2010 0 0 1083 1068 1056 ECOACFPR Repowered Existing Coal Powered Facilities 510 510 510 510 510 ENGADGB05 Distributed Generation--Base--2005 0 623 0 0 0 ENGADGB10 Distributed Generation--Base--2010 0 0 623 623 623 ENGADGP Distributed Generation--Peak 0 559 559 559 559 ESOLPVR Photovolataic--Residential 7519 6380 5240 3891 3891 EWINLWT Local Wind Turbine 1246 1246 1246 1246 1246 ECOAMCFC Coal Gasification Molten Carb Fuel Cell 2683 2683 2683 2683 2683 ENGAFC Gas Fuel Cell 2091 2091 2091 2091 2091 EMTHFC Methanol Fuel Cell 1290 1290 1290 1290 1290 ENGAGCE Existing Natural Gas Combined Cycle 434 434 434 434 434 ENGAGC00 Natural Gas Combined Cycle--2000 456 0 0 0 0 ENGAGC05 Natural Gas Combined Cycle--2005 0 453 0 0 0 ENGAGC10 Natural Gas Combined Cycle--2010 0 0 448 443 438 ENGAAGC05 Natural Gas Advanced Combined Cycle--2005 0 572 0 0 0 ENGAAGC10 Natural Gas Advanced Combined Cycle--2010 0 0 526 505 493 ENGASTM Natural Gas Steam 959 959 959 959 959 ENGACTE Existing Natural Gas Combustion Turbine 322 322 322 322 322 ENGACT00 Natural Gas Combustion Turbine--2000 339 0 0 0 0 ENGACT05 Natural Gas Combustion Turbine--2005 0 336 0 0 0 ENGACT10 Natural Gas Combustion Turbine--2010 0 0 333 329 326 ENGAACT05 Natural Gas Advanced Combustion Turbine--2005 0 446 0 0 0 ENGAACT10 Natural Gas Advanced Combustion Turbine--2010 0 0 384 365 362 ENUCCONV Conventional Nuclear 3445 3445 3445 3445 3445 ENUCADV Advanced Nuclear 2144 2144 2144 2144 2144 EDSLICE Diesel internal combustion engine 376 376 376 376 376 EDSHSTM Residual Fuel Oil Steam 959 959 959 959 959 EDSLCT Distillate Oil Combustion Turbine 322 322 322 322 322 EHYDROPS Hydroelectric Pumped Storage 1615 1615 1615 1615 1615 EBIOCC Biomass Gasification Combined Cycle 1725 1556 1424 1376 1303
continued
98

CAPITAL COST 95$/KW 95$/KW 95$/KW 95$/KW 95$/KW MARKAL Technology Name 2000 2005 2010 2015 2020 EGEOBCFS Geothermal Binary Cycle and Flashed Steam 1746 1695 1586 1680 2026 EHYDRO Hydroelectric 929 929 929 929 929 EBMSWLG Municipal Solid Waste-Landfill Gas 1429 1417 1402 1387 1373 ESOLCT Solar Central Thermal 2539 2454 2348 2243 2137 ESOLCPV Central Photovoltaic 3830 2722 2404 2293 2219 EWINCELC Wind Central Electric 982 921 907 876 826 *A capital cost of zero indicates that the technology is not available for purchase in that model year.
COMMERCIAL SECTOR
INVCOST FIXOM EFFICIENCY 2001$/1000Btu/hr 2001$/1000Btu/hr Btu/Btu START CV: /1000cfm CV: /1000cfm CV: 1000cfm hrs/1000Btu LIFE MARKAL Technology Name year CL: /1000lumen CL: /1000lumen CL: lumens/watt years CC01 Air Source heat pump for cooling - Installed base 1995 0.00 0.00 2.78 14 CC02 Air Source heat pump for cooling - current standard 1995 0.00 0.00 2.93 14 CC03 Air Source heat pump for cooling - 2000 typical 2000 0.00 0.00 2.93 14 CC04 Air Source heat pump for cooling - 2000 high 2000 0.00 0.00 4.40 14 CC05 Air Source heat pump for cooling - 2005 typical 2005 0.00 0.00 3.52 14 CC06 Air Source heat pump for cooling - 2005 high 2005 0.00 0.00 5.28 14 CC07 Air Source heat pump for cooling - 2010 typical 2010 0.00 0.00 3.52 14 CC08 Air Source heat pump for cooling - 2010 high 2010 0.00 0.00 5.28 14 CC09 Air Source heat pump for cooling - 2020 typical 2020 0.00 0.00 3.81 14 CC10 Air Source heat pump for cooling - 2020 high 2020 0.00 0.00 5.28 14 CC11 Ground Source HP for cooling - installed base 1995 0.00 0.00 3.96 20 CC12 Ground Source heat pump for cooling -2000 typical 2000 0.00 0.00 3.96 20 CC13 Ground Source heat pump for cooling - 2000 high 2000 0.00 0.00 6.15 20 CC14 Ground Source heat pump for cooling - 2005 typical 2005 0.00 0.00 3.96 20 CC15 Ground Source heat pump for cooling - 2005 high 2005 0.00 0.00 6.15 20 CC16 Ground Source heat pump for cooling - 2010 typical 2010 0.00 0.00 3.96 20 CC17 Ground Source heat pump for cooling - 2010 high 2010 0.00 0.00 6.15 20 CC18 Ground Source heat pump for cooling - 2020 typical 2020 0.00 0.00 4.40 20 CC19 Ground Source heat pump for cooling - 2020 high 2020 0.00 0.00 6.15 20 CC20 Elec. reciprocating chiller-Installed base-stnd 1995 51.04 2.75 2.50 24 CC21 Electric reciprocating chiller - 2000 typical 2000 51.04 2.75 2.86 24 CC22 Electric reciprocating chiller - 2000 high 2000 61.04 2.75 3.50 24 CC23 Electric reciprocating chiller - 2005 typical 2005 51.04 2.75 2.86 24
continued
99

INVCOST FIXOM EFFICIENCY 2001$/1000Btu/hr 2001$/1000Btu/hr Btu/Btu START CV: /1000cfm CV: /1000cfm CV: 1000cfm hrs/1000Btu LIFE MARKAL Technology Name year CL: /1000lumen CL: /1000lumen CL: lumens/watt years CC24 Electric reciprocating chiller - 2005 high 2005 61.04 2.75 3.60 24 CC25 Electric reciprocating chiller - 2010 typical 2010 51.04 2.75 2.86 24 CC26 Electric reciprocating chiller - 2010 high 2010 61.04 2.75 3.60 24 CC27 Electric reciprocating chiller - 2020 typical 2020 51.04 2.75 2.90 24 CC28 Electric reciprocating chiller - 2020 high 2020 61.04 2.75 3.80 24 CC29 Electric centrifugal chillers - Installed base 1995 39.58 1.88 4.60 24 CC30 Electric centrifugal chillers - Current standard 1995 39.58 1.88 4.80 24 CC31 Electric centrifugal chillers - 2000 typical 2000 39.58 1.88 5.90 24 CC32 Electric centrifugal chillers - 2000 high 2000 52.92 1.88 7.30 24 CC33 Electric centrifugal chillers - 2005 typical 2005 43.75 1.88 6.40 24 CC34 Electric centrifugal chillers - 2005 high 2005 56.25 1.88 7.30 24 CC35 Electric centrifugal chillers - 2010 typical 2010 43.75 1.88 6.40 24 CC36 Electric centrifugal chillers - 2010 high 2010 56.25 1.88 7.30 24 CC37 Electric centrifugal chillers - 2020 typical 2020 43.75 1.88 7.00 24 CC38 Electric centrifugal chillers - 2020 high 2020 47.92 1.88 7.30 24 CC39 Elec. rooftop AC - Installed base 1995 83.33 1.39 2.60 15 CC40 Elec. rooftop AC - 2000 typical - standard 1995 83.33 1.39 2.60 15 CC41 Electric rooftop air conditioner - 2000 high 2000 161.11 1.39 4.30 15 CC42 Electric rooftop air conditioner - 2005 typical 2005 83.33 1.39 2.60 15 CC43 Electric rooftop air conditioner - 2005 high 2005 161.11 1.39 4.40 15 CC44 Electric rooftop air conditioner - 2010 typical 2010 94.44 1.39 3.00 15 CC45 Electric rooftop air conditioner - 2010 high 2010 161.11 1.39 4.40 15 CC46 Electric rooftop air conditioner - 2020 typical 2020 94.44 1.39 3.00 15 CC47 Electric rooftop air conditioner - 2020 high 2020 161.11 1.39 4.40 15 CC48 Wall/Window - Room A/C - Installed base 1995 47.14 0.95 2.40 12 CC49 Wall/Window - Room A/C - 2000 Low 1995 47.14 0.95 2.64 12 CC50 Wall/Window - Room A/C - 2000 typical 2000 50.43 0.95 2.93 12 CC51 Wall/Window - Room A/C - 2000 high Efficiency 2000 72.38 0.95 3.37 12 CC52 Wall/Window - Room A/C - 2005 Typical 2005 50.43 0.95 2.93 12 CC53 Wall/Window - Room A/C - 2005 High Efficiency 2005 72.38 0.95 3.52 12 CC54 Wall/Window - Room A/C - 2020 Typical 2020 58.33 0.95 3.22 12 CC55 Central A/C - Res. type - Installed base 1995 49.52 2.86 2.81 14 CC56 Central A/C - Res. type - Current standard 1995 49.52 2.86 2.93 14 CC57 Central A/C - Res. type - 2000 typical 2000 49.52 2.86 2.93 14 CC58 Central A/C - Res. type - 2000 high Efficiency 2000 83.33 2.86 5.28 14 CC59 Central A/C - Res. type - 2005 Typical 2005 54.76 2.86 3.52 14 CC60 Central A/C - Res. type - 2005 High 2005 83.33 2.86 5.28 14 CC61 Central A/C - Res. type - 2010 Typical 2010 54.76 2.86 3.52 14
continued
100

INVCOST FIXOM EFFICIENCY 2001$/1000Btu/hr 2001$/1000Btu/hr Btu/Btu
START CV: /1000cfm CV: /1000cfm CV: 1000cfm hrs/1000btu LIFE MARKAL Technology Name year CL: /1000lumen CL: /1000lumen CL: lumens/watt years CC62 Central A/C - Res. type - 2010 High 2010 83.33 2.86 5.28 14 CC63 Central A/C - Res. type - 2020 Typical 2020 54.76 2.86 3.81 14 CC64 Central A/C - Res. type - 2020 High 2020 83.33 2.86 5.28 14 CC65 Gas heat pump for cooling - 1995 engine driven 1995 243.19 4.98 7.57 13 CC66 Gas heat pump for cooling - 2005 absorption 2005 173.61 4.17 0.70 15 CC67 Gas engine rooftop AC - installed base 1995 104.17 4.58 0.59 30 CC68 Gas engine rooftop AC - 2000 typical 2000 104.17 4.58 0.70 30 CC69 Gas engine rooftop AC - 2000 high 2000 150.00 4.58 1.30 30 CC70 Gas engine rooftop AC - 2005 typical 2005 104.17 4.58 0.70 30 CC71 Gas engine rooftop AC - 2005 high 2005 141.67 4.58 1.30 30 CC72 Gas engine rooftop AC - 2010 typical 2010 104.17 4.58 0.70 30 CC73 Gas engine rooftop AC - 2010 high 2010 141.67 4.58 1.30 30 CC74 Gas-fired chiller - Installed base 1995 52.08 0.63 1.00 20 CC75 Gas-fired chiller - 2000 absorption 1995 78.75 1.33 1.00 20 CC76 Gas-fired chiller - 2000 engine driven 2000 69.38 2.50 2.00 25 CC77 Gas-fired chiller - 2005 absorption 2005 78.75 1.33 1.00 20 CC78 Gas-fired chiller - 2005 engine driven 2005 66.67 2.50 2.10 25 CC79 Gas-fired chiller - 2020 absorption 2020 78.75 1.33 1.00 20 CC80 Gas-fired chiller - 2020 engine driven 2020 66.67 2.50 2.20 25 CK01 Range, Electric, 4 burner, oven, 11" griddle 1995 35.21 0.29 0.70 10 CK02 Range, Electric-induction, 4 burner, oven, 11" gri 2000 41.17 0.29 0.80 10 CK03 Range, Gas, 4 burner, oven, 11" griddle 1995 25.26 0.29 0.45 10 CK04 Range, Gas, 4 powered burners, convect. oven, 11" 1995 34.41 0.29 0.60 10 CH01 Air Source heat pump for heating - Installed Base 1995 81.39 3.33 1.88 14 CH02 Air Source heat pump for heating - current standard 1995 81.39 3.33 1.99 14 CH03 Air Source heat pump for heating - 2000 typical 2000 97.92 3.33 2.20 14 CH04 Air Source heat pump for heating - 2000 high 2000 155.56 3.33 2.87 14 CH05 Air Source heat pump for heating - 2005 typical 2005 97.22 3.33 2.20 14 CH06 Air Source heat pump for heating - 2005 high 2005 155.56 3.33 2.89 14 CH07 Air Source heat pump for heating - 2010 typical 2010 97.22 3.33 2.20 14 CH08 Air Source heat pump for heating - 2010 high 2010 155.56 3.33 2.87 14 CH09 Air Source heat pump for heating - 2020 typical 2020 97.22 3.33 2.29 14 CH10 Air Source heat pump for heating - 2020 high 2020 150.00 3.33 2.93 14 CH11 Ground Source HP for heating - Installed Base 1995 187.50 1.46 3.40 20 CH12 Ground Source heat pump for heating -2000 typical 2000 187.50 1.46 3.40 20 CH13 Ground Source heat pump for heating - 2000 high 2000 229.17 1.46 4.00 20 CH14 Ground Source heat pump for heating - 2005 typical 2005 166.67 1.46 3.40 20 CH15 Ground Source heat pump for heating - 2005 high 2005 229.17 1.46 4.30 20
continued
101

INVCOST FIXOM EFFICIENCY 2001$/1000Btu/hr 2001$/1000Btu/hr Btu/Btu START CV: /1000cfm CV: /1000cfm CV: 1000cfm hrs/1000btu LIFE MARKAL Technology Name year CL: /1000lumen CL: /1000lumen CL: lumens/watt years CH16 Ground Source heat pump for heating - 2010 typical 2010 166.67 1.46 3.40 20 CH17 Ground Source heat pump for heating - 2010 high 2010 208.33 1.46 4.30 20 CH18 Ground Source heat pump for heating - 2020 typical 2020 166.67 1.46 3.80 20 CH19 Ground Source heat pump for heating - 2020 high 2020 197.92 1.46 4.50 20 CH20 Electric boiler - Installed Base 1995 21.83 0.14 0.94 21 CH21 Other electric packaged spc heat 1995 19.77 3.49 0.93 18 CH22 Other electric packaged spc heat - new 1995 14.92 3.49 0.96 18 CH23 Gas heat pump for heating - 1995 engine driven 1995 243.19 4.98 4.10 13 CH24 Gas heat pump for heating - 2005 absorption 2005 173.61 4.17 1.40 15 CH25 Gas heat pump for heating - 2020 absorption 2020 173.61 4.17 1.50 15 CH26 Gas furnace - Installed Base 1995 9.76 1.07 0.70 15 CH27 Gas furnace - current standard 1995 9.11 1.00 0.75 15 CH28 Gas furnace - 2000 high 2000 14.82 0.88 0.86 15 CH29 Gas furnace - 2003 standard 2005 8.81 0.97 0.78 15 CH30 Gas furnace - 2005 high 2005 14.16 0.84 0.90 15 CH31 Gas furnace - 2010 typical 2010 8.70 0.96 0.79 15 CH32 Gas furnace - 2010 high 2010 14.16 0.84 0.90 15 CH33 Gas boiler - Installed Base 1995 19.40 0.59 0.70 25 CH34 Gas boiler - Current standard 1995 18.11 0.55 0.75 25 CH35 Gas boiler - 2000 high 2000 33.82 0.69 0.82 25 CH36 Gas boiler - 2005 typical 2005 17.87 0.55 0.76 25 CH37 Gas boiler - 2005 high 2005 31.68 0.67 0.85 25 CH38 Gas boiler - 2010 typical 2010 17.87 0.55 0.76 25 CH39 Gas boiler - 2010 high 2010 31.68 0.67 0.85 25 CH40 Oil furnace - Installed Base 1995 14.25 1.00 0.70 15 CH41 Oil furnace - Current standard 1995 14.25 1.00 0.76 15 CH42 Oil furnace - 1998 intro 2000 23.46 1.00 0.77 15 CH43 Oil furnace - 2000 intro 2000 23.75 1.00 0.82 15 CH44 Oil furnace - Meets 2003 standard 2005 14.25 1.00 0.79 15 CH45 Oil furnace - 2010 intro 2010 22.69 1.00 0.85 15 CH46 Oil boiler - Installed base 1995 16.84 0.14 0.73 20 CH47 Oil boiler - 2000 typical and stnd 1995 15.76 0.13 0.78 20 CH48 Oil boiler - 2000 high 2000 18.83 0.12 0.83 20 CH49 Oil boiler - 2005 typical 2005 15.76 0.13 0.78 20 CH50 Oil boiler - 2005 high 2005 18.83 0.12 0.83 20 CW01 Res. style solar water heater - 1995 1995 270.98 1.96 2.08 20 CW02 Heat pump water heater - 2000 typical 1995 200.00 10.71 2.00 12 CW03 Heat pump water heater - 2000 high 2000 300.00 10.71 2.50 12 CW04 Heat pump water heater - 2005 typical 2005 200.00 10.71 2.00 12
continued
102

INVCOST FIXOM EFFICIENCY 2001$/1000Btu/hr 2001$/1000Btu/hr Btu/Btu START CV: /1000cfm CV: /1000cfm CV: 1000cfm hrs/1000btu LIFE MARKAL Technology Name year CL: /1000lumen CL: /1000lumen CL: lumens/watt years CW05 Heat pump water heater - 2005 high 2005 189.29 10.71 2.60 12 CW06 Heat pump water heater - 2010 typical 2010 200.00 10.71 2.00 12 CW07 Heat pump water heater - 2020 typical 2020 167.86 10.71 2.20 12 CW08 Elec. resistance water heater - Installed base 1995 13.71 0.34 0.95 14 CW09 Elec. resistance water heater - typical-standard 1995 13.43 0.34 0.97 14 CW10 Elec. resistance water heater - typical-standard 2005 20.81 0.34 0.97 14 CW11 Gas water heater - Installed base 1995 14.86 1.01 0.74 12 CW12 Gas water heater - Current standard 1995 15.13 0.99 0.76 12 CW13 Gas water heater - 2000 typical 2000 14.74 0.96 0.78 12 CW14 Gas water heater - 2000 high 2000 22.58 0.54 0.93 20 CW15 Gas water heater - 2005 typical 2005 14.74 0.96 0.78 12 CW16 Gas water heater - 2005 high 2005 21.51 0.54 0.93 20 CW17 Gas water heater - 2010 typical 2010 14.74 0.96 0.78 12 CW18 Gas water heater - 2010 high 2010 21.51 0.54 0.93 20 CW19 Gas water heater - 2020 typical 2020 14.74 0.96 0.78 12 CW20 Gas water heater - 2020 high 2020 21.51 0.54 0.93 20 CW21 Oil water heater - installed base 1995 25.67 0.51 0.73 15 CW22 Oil water heater - current high effic 1995 39.38 0.79 0.78 15 CL01 Incandescent 1150 lumens, 75 watts 1995 53.26 30.65 15.30 12 CL02 CFL-low end 1200 lumens 20 watts 1995 60.87 7.92 59.50 12 CL03 CFL 1200 lumens, 20 watts 1995 61.46 7.22 67.10 12 CL04 Halogen 1280 lumens, 90 watts 1995 56.82 6.94 14.20 12 CL05 Halogen IR 60 Watt 1995 69.03 18.74 19.20 12 CL06 Hafnium carbide filament 1550 lumens, 23 watts 2005 65.07 2.53 30.30 12 CL07 Coated filament 1150 lumens, 24 watts 2010 65.07 2.53 47.90 12 CL08 F40T12 - Standard Magnetic 1995 27.69 0.73 49.20 14 CL09 F40T12 - Efficient Magnetic 1995 18.95 0.56 59.00 14 CL10 F40T12 - Efficient Magnetic ES 1995 24.93 0.79 55.70 14 CL11 Halogen 4024 Lumens 209 Watts 1995 11.89 3.50 20.00 12 CL12 F40T12 - Electronic ES 1995 27.36 0.74 65.30 14 CL13 F32T8 - Magnetic 1995 21.86 0.74 65.50 14 CL14 F32T8 - Electronic 1995 25.59 0.80 76.80 14 CL15 F32T8 -Electronic -Controls 1995 37.92 0.80 109.70 14 CL16 F32T8 -Electronic -Reflector 1995 26.96 0.69 88.30 14 CL17 Scotopic Lighting 1995 38.99 0.90 123.00 14 CL18 Electrodeless Lamp 2015 29.72 0.41 152.80 20 CL19 F96T12 - Standard Magnetic 1995 15.89 0.91 55.00 14 CL20 F96T12 - Efficient Magnetic 1995 12.25 0.45 66.70 14
continued
103

INVCOST FIXOM EFFICIENCY 2001$/1000Btu/hr 2001$/1000Btu/hr Btu/Btu START CV: /1000cfm CV: /1000cfm CV: 1000cfm hrs/1000btu LIFE MARKAL Technology Name year CL: /1000lumen CL: /1000lumen CL: lumens/watt years CL21 F96T12 - Efficient Magnetic ES 1995 14.87 0.57 70.60 14 CL22 F96T12 - Electronic 1995 15.50 0.49 73.90 14 CL23 F96T12 - Electronic ES 1995 17.23 0.57 81.80 14 CL24 F96T12 - Standard Magnetic HO 1995 13.71 0.86 49.00 12 CL25 F96T12 - Efficient Magnetic HO/ES 1995 13.31 0.72 61.20 12 CL26 F96T12 - Electronic HO 1995 13.33 0.50 67.30 12 CL27 F96T12 - Electronic HO ES 1995 14.93 0.74 69.40 12 CL28 Scotopic Lamp 1995 40.61 0.86 123.00 12 CL29 Electrodeless Lamp 2015 31.43 1.19 152.80 20 CL30 Mercury Vapor 1995 33.81 0.82 40.20 15 CL31 Metal Halide 1995 16.98 0.40 69.60 15 CL32 High Pressure Sodium 1995 19.63 0.56 89.70 15 CL33 Sulfur Lamp 2005 15.84 0.29 100.00 15 CL34 F40T12 - Efficient Magnetic ES 1995 24.93 0.74 55.70 14 CL35 F32T8 - Magnetic 1995 21.86 0.74 65.50 14 CR01 Centralized Refrig. Base System 1995 909.63 30.70 1.82 10 CR02 Centrl Rfg Sys w/Evaporative Condenser 1995 916.09 33.98 1.88 10 CR03 Centrl Rfg Sys w/Floating Head Pressure 1995 916.91 30.70 1.88 10 CR04 Centrl Rfg Sys w/Ambient Subcooling 1995 915.18 30.70 1.83 10 CR05 Centrl Rfg Sys w/Mechanical Subcooling 1995 916.91 30.70 1.85 10 CR06 Centrl Rfg Sys w/Hot Gas Defrost 1995 913.08 35.25 1.88 10 CR07 Centrl Rfg Sys w/Antisweat Htr Controls 1995 916.46 30.70 1.90 10 CR08 Centrl Rfg Sys w/Hi-Eff Lighting 1995 913.14 30.70 1.86 10 CR09 Centrl Rfg Sys w/Hi-Eff Fan Blades 1995 909.89 30.70 1.88 10 CR10 Centrl Rfg Sys w/PSC Evap Fan Motors 1995 916.54 30.70 1.95 10 CR11 Centrl Rfg Sys w/ECM Evap Fan Motors 2005 921.09 30.70 1.99 10 CR12 Walk-In Cooler-Installed Base 1995 729.54 6.42 2.46 18 CR13 Walk-In Cooler w/Floating Head Pressure 2005 734.23 6.42 3.01 18 CR14 Walk-In Cooler w/Ambient Subcooling 1995 743.70 6.42 2.70 18 CR15 Walk-In Cooler w/Antisweat Heat Controls 1995 743.03 6.42 2.52 18 CR16 Walk-In Cooler w/Evap Fan Shutdown 1995 732.24 6.42 2.57 18 CR17 Walk-In Cooler w/PSC Evap Fan Motor 1995 733.85 6.42 2.59 18 CR18 Walk-In Cooler w/ECM Evap Fan Motor 2005 739.03 6.42 2.68 18 CR19 Walk-In Cooler w/ECM Condns Fan Motor 2005 731.15 6.42 2.51 18 CR20 Walk-In Cooler w/Elec. Ballasts 1995 731.69 6.42 2.48 18 CR21 Walk-In Cooler w/High-Eff. Fan Blades 1995 732.78 6.42 2.62 18 CR22 Walk-In Cooler w/FHP,ECM Fans, Shutdown & Ambnt 2010 759.50 6.42 3.59 18 CR23 Walk-In Freezer-Installed Base 1995 2399.11 21.19 0.73 18 CR24 Walk-In Fzr w/Hot Gas Defrost 1995 2419.44 21.19 0.76 18
continued
104

INVCOST FIXOM EFFICIENCY 2001$/1000btu/hr 2001$/1000btu/hr btu/btu START CV: /1000cfm CV: /1000cfm CV: 1000cfm hrs/1000btu LIFE MARKAL Technology Name year CL: /1000lumen CL: /1000lumen CL: lumens/watt years CR25 Walk-In Fzr w/Antisweat Heat Controls 1995 2522.14 21.19 0.78 18 CR26 Walk-In Fzr w/Evap Fan Shutdown 1995 2423.71 21.19 0.76 18 CR27 Walk-In Fzr w/PSC Evap Fan Motor 1995 2413.87 21.19 0.82 18 CR28 Walk-In Fzr w/ECM Evap Fan Motor 2005 2423.71 21.19 0.85 18 CR29 Walk-In Fzr w/PSC Condns Fan Motor 1995 2404.52 21.19 0.77 18 CR30 Walk-In Fzr w/ECM Condns Fan Motor 2005 2410.92 21.19 0.79 18 CR31 Walk-In Fzr w/High-Eff. Fan Blades 1995 2407.22 21.19 0.77 18 CR32 Walk-In Fzr w/HER,ECM Fans, Shutdown & HG Dfst 2005 2677.40 21.19 1.09 18 CR33 Reach-In Refrig-Installed Base 1995 3377.97 8.11 0.48 10 CR34 Reach-In Rfg w/Thicker Insulation 1995 3513.13 8.11 0.49 10 CR35 Reach-In Rfg w/Improved Insulation 1995 3940.97 8.11 0.48 10 CR36 Reach-In Rfg w/ECM Evap Fan Motor 1995 3442.83 8.11 0.52 10 CR37 Reach-In Rfg w/ECM Condns Fan Motor 1995 3407.69 8.11 0.50 10 CR38 Reach-In Rfg w/High-Eff. Compressor 1995 3399.59 8.11 0.54 10 CR39 Reach-In Rfg w/ECM Compressor Motor 2005 3513.09 8.11 0.53 10 CR40 Reach-In Rfg w/High-Eff. Fan Blades 1995 3382.02 8.11 0.50 10 CR41 Reach-In Freezer-Installed Base 1995 2118.06 8.18 0.56 10 CR42 Reach-In Fzr w/Thicker Insulation 1995 2198.99 8.18 0.58 10 CR43 Reach-In Fzr w/Improved Insulation 1995 2719.79 8.18 0.57 10 CR44 Reach-In Fzr w/ECM Evap Fan Motor 1995 2141.18 8.18 0.57 10 CR45 Reach-In Fzr w/ECM Condns Fan Motor 1995 2141.18 8.18 0.58 10 CR46 Reach-In Fzr w/High-Eff. Compressor 1995 2141.18 8.18 0.67 10 CR47 Reach-In Fzr w/ECM Compressor Motor 2005 2223.97 8.18 0.66 10 CR48 Reach-In Fzr w/Hot Gas Defrost 2005 2197.98 8.18 0.60 10 CR49 Reach-In Fzr w/Liquid-Suction Ht Xchng 1995 2190.28 8.18 0.58 10 CR50 Reach-In Fzr w/High-Eff. Fan Blades 1995 2119.99 8.18 0.57 10 CR51 Ice Machine-Installed Base 1995 2190.44 128.85 0.44 8 CR52 Ice Machine w/Thicker Insulation 1995 2241.98 128.85 0.46 8 CR53 Ice Machine w/Improved Insulation 1995 2221.36 128.85 0.45 8 CR54 Ice Machine w/ECM Evap Fan Motor 1995 2249.71 128.85 0.46 8 CR55 Ice Machine w/ECM Condns Fan Motor 1995 2242.37 128.85 0.45 8 CR56 Ice Machine w/High-Eff. Compressor 1995 2319.28 128.85 0.46 8 CR57 Ice Machine w/ECM Compressor Motor 2005 2216.21 128.85 0.45 8 CR58 Ice Machine w/High-Eff. Fan Blades 1995 2194.31 128.85 0.44 8 CR59 Beverage Merchandiser-Installed Base 1995 1428.74 8.11 0.70 10 CR60 Bvg Mrchsr w/PSC Evap Fan Motor 1995 1502.22 8.11 0.91 10 CR61 Bvg Mrchsr w/ECM Evap Fan Motor 1995 1551.20 8.11 0.98 10 CR62 Bvg Mrchsr w/PSC Condns Fan Motor 1995 1465.48 8.11 0.72 10 CR63 Bvg Mrchsr w/ECM Condns Fan Motor 1995 1489.97 8.11 0.73 10
continued
105

INVCOST FIXOM EFFICIENCY 2001$/1000Btu/hr 2001$/1000Btu/hr Btu/Btu START CV: /1000cfm CV: /1000cfm CV: 1000cfm hrs/1000btu LIFE MARKAL Technology Name year CL: /1000lumen CL: /1000lumen CL: lumens/watt years CR64 Bvg Mrchsr w/High-Eff. Compressor 1995 1445.07 8.11 0.77 10 CR65 Bvg Mrchsr w/ECM Compressor Motor 2005 1530.79 8.11 0.75 10 CR66 Bvg Mrchsr w/Electronic Ballasts 1995 1459.36 8.11 0.77 10 CR67 Bvg Mrchsr w/High-Eff. Fan Blades 1995 1431.80 8.11 0.75 10 CR68 Bvg Mrchsr w/ECM Evap Fan Motor&Hi-Eff Cmprsr 1995 1567.53 8.11 1.08 10 CR69 Refrigerated Vending Machine-Installed Base 1995 3348.66 15.63 0.48 8 CR70 Rfg Vend Mach w/Thicker Insulation 1995 3456.58 15.63 0.51 8 CR71 Rfg Vend Mach w/PSC Evap Fan Motor 1995 3419.57 15.63 0.54 8 CR72 Rfg Vend Mach w/ECM Evap Fan Motor 1995 3458.97 15.63 0.55 8 CR73 Rfg Vend Mach w/PSC Condns Fan Motor 1995 3419.57 15.63 0.49 8 CR74 Rfg Vend Mach w/ECM Condns Fan Motor 1995 3458.97 15.63 0.50 8 CR75 Rfg Vend Mach w/High-Eff. Compressor 1995 3380.18 15.63 0.53 8 CR76 Rfg Vend Mach w/ECM Compressor Motor 2005 3545.64 15.63 0.51 8 CR77 Rfg Vend Mach w/Electronic Ballasts 1995 3407.75 15.63 0.53 8 CR78 Rfg Vend Mach w/High-Eff. Fan Blades 1995 3352.60 15.63 0.50 8 CR79 Rfg Vend Mach w/ECM Evap Fan Motor&Hi-Eff Cmprsr 1995 3490.49 15.63 0.65 8 CV01 CAV 7000 cfm System - 1992 Installed Base 1995 3068.42 47.02 0.56 15 CV02 CAV 7000 cfm System - 1995 Typical 1995 3089.12 49.06 0.59 15 CV03 CAV 7000 cfm System - 1995 High 1995 3649.49 49.06 0.61 20 CV04 CAV 7000 cfm System - 2000 High 2000 3672.06 53.84 0.62 20 CV05 CAV 7000 cfm System - 2005 Typical 2005 3074.92 59.16 0.59 15 CV06 CAV 7000 cfm System - 2005 High 2005 3662.32 59.16 0.63 20 CV07 CAV 7000 cfm System - 2010 Typical 2010 3061.25 64.95 0.61 15 CV08 CAV 7000 cfm System - 2010 High 2010 3642.49 64.95 0.63 20 CV09 CAV 7000 cfm System - 2015 Typical 2015 3018.52 71.45 0.61 15 CV10 CAV 7000 cfm System - 2015 High 2015 3584.19 71.45 0.63 20 CV11 CAV 15,000 cfm System - 1992 Installed Base 1995 4273.54 94.46 0.22 15 CV12 CAV 15,000 cfm System - 1995 Typical 1995 4305.53 98.45 0.25 15 CV13 CAV 15,000 cfm System - 1995 High 1995 4688.78 98.45 0.32 20 CV14 CAV 15,000 cfm System - 2000 Typical 2000 3848.72 95.80 0.32 15 CV15 CAV 15,000 cfm System - 2000 High 2000 4732.50 108.18 0.33 20 CV16 CAV 15,000 cfm System - 2005 Typical 2005 4345.26 118.88 0.31 15 CV17 CAV 15,000 cfm System - 2005 High 2005 4728.27 118.84 0.35 20 CV18 CAV 15,000 cfm System - 2010 Typical 2010 4340.62 130.60 0.32 15 CV19 CAV 15,000 cfm System - 2010 High 2010 4716.86 130.60 0.36 20 CV20 CAV 15,000 cfm System - 2015 Typical 2015 4320.69 143.51 0.33 15 CV21 CAV 15,000 cfm System - 2015 High 2015 4686.86 143.51 0.36 20 CV22 Multi-Zone - 1992 Installed Base 1995 8300.37 19.99 0.21 20 CV23 VAV 30,000 cfm System - 1992 Installed Base 1995 3025.17 80.38 0.24 15
continued
106

INVCOST FIXOM EFFICIENCY 2001$/1000Btu/hr 2001$/1000Btu/hr Btu/Btu START CV: /1000cfm CV: /1000cfm CV: 1000cfm hrs/1000btu LIFE MARKAL Technology Name year CL: /1000lumen CL: /1000lumen CL: lumens/watt years CV24 VAV 30,000 cfm System - 1995 Typical 1995 3037.66 83.81 0.27 15 CV25 VAV 30,000 cfm System - 1995 High 1995 3611.63 83.81 0.50 20 CV26 VAV 30,000 cfm System - 2000 Typical 2000 3332.67 92.12 0.48 15 CV27 VAV 30,000 cfm System - 2005 Typical 2005 3310.89 101.16 0.48 15 CV28 VAV 30,000 cfm System - 2005 High 2005 3522.35 101.15 0.50 20 CV29 VAV 30,000 cfm System - 2010 Typical 2010 3284.69 111.14 0.50 15 CV30 VAV 30,000 cfm System - 2010 High 2010 3559.87 111.13 0.56 20 CV31 VAV 30,000 cfm System - 2015 Typical 2015 3243.60 122.10 0.50 15 CV32 VAV 30,000 cfm System - 2015 High 2015 3448.40 122.10 0.56 20 CV33 Multi-Zone - 1992 Installed Base 1995 8300.37 19.99 0.21 20 CV34 VAV 55,000 cfm System - 1992 Installed Base 1995 3641.55 126.62 0.26 15 CV35 VAV 55,000 cfm System - 1995 Typical 1995 3663.25 132.01 0.32 15 CV36 VAV 55,000 cfm System - 1995 High 1995 4054.35 132.01 0.56 20 CV37 VAV 55,000 cfm System - 2000 Typical 2000 3827.41 145.08 0.54 15 CV38 VAV 55,000 cfm System - 2005 Typical 2005 3830.21 159.38 0.54 15 CV39 VAV 55,000 cfm System - 2005 High 2005 4061.00 159.38 0.56 20 CV40 VAV 55,000 cfm System - 2010 Typical 2010 3821.13 175.11 0.55 15 CV41 VAV 55,000 cfm System - 2010 High 2010 4026.37 175.09 0.60 20 CV42 VAV 55,000 cfm System - 2015 Typical 2015 3788.78 192.37 0.55 15 CV43 VAV 55,000 cfm System - 2015 High 2015 3995.29 192.37 0.67 20 CV44 Fan Coil Unit - 1992 Installed Base 1995 5228.23 198.65 0.56 20 CV45 Fan Coil Unit - 1995 Current Standard 1995 5295.27 207.04 0.39 20 CV46 Fan Coil Unit - 1995 Typical 1995 5295.27 207.04 0.77 20 CV47 Fan Coil Unit - 1995 High 1995 6994.52 207.02 0.83 20 CV48 Fan Coil Unit - 2005 Typical 2005 5282.09 250.11 0.77 20 CV49 Fan Coil Unit - 2005 High 2005 7020.84 250.11 0.91 20 CV50 Fan Coil Unit - 2010 Typical 2010 5209.09 275.24 0.77 20 CV51 Fan Coil Unit - 2010 High 2010 6916.74 275.24 0.91 20 CV52 Fan Coil Unit - 2015 Typical 2015 5177.99 302.75 0.83 20 CV53 Fan Coil Unit - 2015 High 2015 6840.16 302.75 1.00 20
107

RESIDENTIAL SECTOR
START LIFE CF Capital cost Efficiency
MARKAL Technology Name year years dec
fraction 98$/unit RH01 space heating, electric furnace, existing 1995 30 0.16 1351 RH02 space heating, electric furnace 1995 30 0.16 1351 1 RH03 space heating, electric heat pump, existing 1995 15 0.16 1963 RH04 space heating, electric heat pump #1 - 1995 1995 15 0.16 1963 1.99 RH05 space heating, electric heat pump #1 - 2010 2010 15 0.16 2345 2.2 RH06 space heating, electric heat pump #2 - 1995 1995 15 0.16 2362 2.2 RH07 space heating, electric heat pump #2 - 2010 2010 15 0.16 2580 2.38 RH08 space heating, electric heat pump #2 - 2020 2020 15 0.16 2600 2.46 RH09 space heating, electric heat pump #3 - 1995 1995 15 0.16 3057 2.54 RH10 space heating, electric heat pump #3 - 2020 2020 15 0.16 2982 2.61 RH11 space heating, electric heat pump #4 - 1995 1995 15 0.16 3752 2.87 RH12 space heating, electric heat pump #4 - 2020 2020 15 0.16 3618 2.93 RH13 space heating, gas furnace, existing 1995 30 0.16 1200 RH14 space heating, gas furnace #1 - 1995 1995 30 0.16 1200 0.78 RH15 space heating, gas furnace #2 - 1995 1995 30 0.16 1300 0.8 RH16 space heating, gas furnace #3 - 1995 1995 30 0.16 1400 0.82 RH17 space heating, gas furnace #4 - 1995 1995 30 0.16 1900 0.92 RH18 space heating, gas furnace #4 - 2005 2005 30 0.16 1800 0.92 RH19 space heating, gas furnace #4 - 2010 2010 30 0.16 1700 0.92 RH20 space heating, gas furnace #4 - 2020 2020 30 0.16 1600 0.92 RH21 space heating, gas furnace #5 - 1995 1995 30 0.16 2700 0.97 RH22 space heating, gas furnace #5 - 2005 2005 30 0.16 2200 0.97 RH23 space heating, gas furnace #5 - 2010 2010 30 0.16 1950 0.97 RH24 space heating, gas furnace #5 - 2020 2020 30 0.16 1700 0.97 RH25 space heating, gas radiator #1 - 1995 1995 30 0.16 2480 0.8 RH26 space heating, gas radiator #2 - 1995 1995 30 0.16 3065 0.87 RH27 space heating, gas radiator #2 - 2010 2010 30 0.16 3065 0.89 RH28 space heating, gas radiator #3 - 1995 1995 30 0.16 3650 0.95 RH29 space heating, gas radiator #3 - 2010 2010 30 0.16 3650 0.97 RH30 space heating, kerosene furnace #1 - 1995 1995 30 0.16 2052 0.65 RH31 space heating, kerosene furnace #2 - 1995 1995 30 0.16 2661 0.7 RH32 space heating, kerosene furnace #3 - 1995 1995 30 0.16 4217 0.8 RH33 space heating, LPG furnace #1 - 1995 1995 30 0.16 1200 0.78 RH34 space heating, LPG furnace #2 - 1995 1995 30 0.16 1300 0.8 RH35 space heating, LPG furnace #3 - 1995 1995 30 0.16 1400 0.82 RH36 space heating, LPG furnace #4 - 1995 1995 30 0.16 1900 0.92 RH37 space heating, LPG furnace #4 - 2005 2005 30 0.16 1800 0.92 RH38 space heating, LPG furnace #4 - 2010 2010 30 0.16 1700 0.92 RH39 space heating, LPG furnace #4 - 2020 2020 30 0.16 1600 0.92
continued
108

START LIFE CF Capital cost Efficiency
MARKAL Technology Name year years dec
fraction 98$/unit RH40 space heating, LPG furnace #5 - 1995 1995 30 0.16 2700 0.97 RH41 space heating, LPG furnace #5 - 2005 2005 30 0.16 2200 0.97 RH42 space heating, LPG furnace #5 - 2010 2010 30 0.16 1950 0.97 RH43 space heating, LPG furnace #5 - 2020 2020 30 0.16 1700 0.97 RH44 space heating, Dist furnace, existing 1995 30 0.16 1300 RH45 space heating, Dist furnace #1 - 1995 1995 30 0.16 1300 0.8 RH46 space heating, Dist furnace #2 - 1995 1995 30 0.16 1400 0.82 RH47 space heating, Dist furnace #3 - 1995 1995 30 0.16 1900 0.87 RH48 space heating, Dist radiator, existing 1995 30 0.16 2480 RH49 space heating, Dist radiator #1 - 1995 1995 30 0.16 2480 0.8 RH50 space heating, Dist radiator #2 - 1995 1995 30 0.16 3065 0.87 RH51 space heating, Dist radiator #2 - 2010 2010 30 0.16 3065 0.89 RH52 space heating, Dist radiator #3 - 1995 1995 30 0.16 3650 0.95 RH53 space heating, Dist radiator #3 - 2010 2010 30 0.16 3650 0.97 RH54 space heating, Wood heater 1995 30 0.16 1700 1 RH55 space heating, Geothermal heat pump #1 - 1995 1995 15 0.16 7410 3.4 RH56 space heating, Geothermal heat pump #1 - 2005 2005 15 0.16 6760 3.4 RH57 space heating, Geothermal heat pump #1 - 2020 2020 15 0.16 6760 3.8 RH58 space heating, Geothermal heat pump #2 - 1995 1995 15 0.16 8541 4 RH59 space heating, Geothermal heat pump #2 - 2010 2010 15 0.16 7891 4.3 RH60 space heating, Geothermal heat pump #2 - 2020 2020 15 0.16 7735 4.5 RH61 space heating, Gas heat pump - 1995 1995 15 0.16 4355 1.4 RH62 space heating, Gas heat pump - 2020 2020 15 0.16 4355 1.5 RH63 space heating, gas radiator, existing 1995 30 0.16 2480 RC01 space cooling, room a/c, existing 1995 15 0.15 540 RC02 space cooling, room a/c #1 - 1995 1995 15 0.15 540 2.55 RC03 space cooling, room a/c #1 - 2005 2005 15 0.15 540 2.83 RC04 space cooling, room a/c #2 - 1995 1995 15 0.15 584 2.93 RC05 space cooling, room a/c #2 - 2020 2020 15 0.15 575 3.22 RC06 space cooling, room a/c #3 - 1995 1995 15 0.15 760 3.37 RC07 space cooling, room a/c #3 - 2005 2005 15 0.15 760 3.52 RC08 space cooling, central a/c, existing 1995 15 0.15 2080 RC09 space cooling, central air #1 - 1995 1995 15 0.15 2080 2.93 RC10 space cooling, central air #1 - 2010 2010 15 0.15 2300 3.52 RC11 space cooling, central air #2 - 1995 1995 15 0.15 2435 3.52 RC12 space cooling, central air #2 - 2010 2010 15 0.15 2500 3.81 RC13 space cooling, central air #2 - 2020 2020 15 0.15 2540 4.1 RC14 space cooling, central air #3 - 1995 1995 15 0.15 2968 4.4 RC15 space cooling, central air #3 - 2005 2005 15 0.15 2900 4.4 RC16 space cooling, central air #3 - 2020 2020 15 0.15 3020 4.69
continued
109

START LIFE CF Capital cost Efficiency
MARKAL Technology Name year years dec
fraction 98$/unit RC17 space cooling, central air #4 - 1995 1995 15 0.15 3500 5.28 RC18 space cooling, electric heat pump, existing 1995 15 0.15 0 RC19 space cooling, electric heat pump #1 - 1995 1995 15 0.15 0 2.93 RC20 space cooling, electric heat pump #1 - 2010 2010 15 0.15 0 3.52 RC21 space cooling, electric heat pump #2 - 1995 1995 15 0.15 0 3.52 RC22 space cooling, electric heat pump #2 - 2010 2010 15 0.15 0 3.81 RC23 space cooling, electric heat pump #2 - 2020 2020 15 0.15 0 4.1 RC24 space cooling, electric heat pump #3 - 1995 1995 15 0.15 0 4.4 RC25 space cooling, electric heat pump #3 - 2020 2020 15 0.15 0 4.69 RC26 space cooling, electric heat pump #4 - 1995 1995 15 0.15 0 5.28 RC27 space cooling, electric heat pump #4 - 2020 2020 15 0.15 0 5.28 RC28 space cooling, geothermal heat pump #1 -1995 1995 15 0.15 0 13.5 RC29 space cooling, geothermal heat pump #1 -2005 2005 15 0.15 0 13.5 RC30 space cooling, geothermal heat pump #1 -2020 2020 15 0.15 0 15.8 RC31 space cooling, geothermal heat pump #2 -1995 1995 15 0.15 0 21 RC32 space cooling, geothermal heat pump #2 - 2010 2010 15 0.15 0 21 RC33 space cooling, geothermal heat pump #2 -2020 2020 15 0.15 0 21 RC34 space cooling, gas heat pump - 1995 1995 15 0.15 0 1.4 RC35 space cooling, gas heat pump - 2020 2020 15 0.15 0 1.5 RW01 water heater, gas, existing 1995 20 0.1 326 RW02 water heater, gas #1 - 1995 1997 20 0.1 326 0.54 RW03 water heater, gas #1 - 2005 2005 20 0.1 380 0.59 RW04 water heater, gas #2 - 1995 1995 20 0.1 370 0.58 RW05 water heater, gas #2 - 2005 2005 20 0.1 380 0.59 RW06 water heater, gas #3 - 1995 1995 20 0.1 500 0.6 RW07 water heater, gas #3 - 2005 2005 20 0.1 390 0.6 RW08 water heater, gas #4 - 1995 1995 20 0.1 2100 0.86 RW09 water heater, gas #4 - 2005 2005 20 0.1 2000 0.86 RW10 water heater, electric, existing 1995 20 0.1 337 RW11 water heater, electric #1 - 1995 1995 20 0.1 337 0.86 RW12 water heater, electric #1 - 2005 2005 20 0.1 500 0.9 RW13 water heater, electric #2 - 1995 1995 20 0.1 337 0.88 RW14 water heater, electric #2 - 2005 2005 20 0.1 500 0.9 RW15 water heater, electric #3 - 1995 1995 20 0.1 590 0.95 RW16 water heater, electric #3 - 2005 2005 20 0.1 550 0.95 RW17 water heater, electric #4 - 1995 1995 20 0.1 1175 2 RW18 water heater, electric #4 - 2020 2020 20 0.1 950 2.2 RW19 water heater, electric #5 - 1995 1995 20 0.1 1200 2.6 RW20 water heater, electric #5 - 2005 2005 20 0.1 1100 2.6
Continued
110

START LIFE CF Capital cost Efficiency
MARKAL Technology Name year years dec
fraction 98$/unit RW21 water heater, distillate, existing 1995 20 0.1 725 RW22 water heater, distillate #1 - 1995 1995 20 0.1 725 0.53 RW23 water heater, distillate #2 - 1995 1995 20 0.1 779 0.58 RW24 water heater, LPG #1 - 1995 1995 20 0.1 326 0.54 RW25 water heater, LPG #1 - 2005 2005 20 0.1 480 0.59 RW26 water heater, LPG #2 - 1995 1995 20 0.1 370 0.58 RW27 water heater, LPG #2 - 2005 2005 20 0.1 480 0.59 RW28 water heater, LPG #3 - 1995 1995 20 0.1 500 0.6 RW29 water heater, LPG #3 - 2005 2005 20 0.1 490 0.6 RW30 water heater, LPG #4 - 1995 1995 20 0.1 1860 0.86 RW31 water heater, LPG #4 - 2005 2005 20 0.1 1610 0.86 RW32 water heater, solar #1 - 1995 1995 20 0.1 3200 2 RW33 water heater, solar #1 - 2005 2005 20 0.1 2867 2 RW34 water heater, solar #1 - 2010 2010 20 0.1 2533 2 RW35 water heater, solar #1 - 2020 2020 20 0.1 2200 2 RR01 refrigeration, existing 1995 15 1 600 RR02 refrigeration #1 - 1995 1995 15 1 600 690 RR03 refrigeration #1 - 2005 2005 15 1 600 478 RR04 refrigeration #2 - 1995 1995 15 1 650 660 RR05 refrigeration #2 - 2005 2005 15 1 650 460 RR06 refrigeration #3 - 1995 1995 15 1 950 515 RR07 refrigeration #3 - 2000 2000 15 1 650 460 RR08 refrigeration #3 - 2005 2005 15 1 950 400 RR09 refrigeration TID - 1995 1995 15 1 1314 843 RR10 refrigeration TID - 2005 2005 15 1 1314 577 RF01 freezing, existing 1995 15 1 381 RF02 freezing #1 – 1995 1995 15 1 381 472 RF03 freezing #1 - 2005 2005 15 1 381 394 RF04 freezing #2 - 1995 1995 15 1 420 350 RF05 freezing #3 - 1995 1995 15 1 500 302 RF06 freezing UP - 1995 1995 15 1 381 617 RF07 freezing UP - 2005 2005 15 1 381 520
111

TRANSPORTATION SECTOR – LDV
Capital Costs FIXOM EFF (Thousands of 1999$/vehicle)
(1999$/vehicle) (mpg) 1995 2000 2005 2010 2015 2020 2025 2030 2035 TLECGSL Car, Gasoline, Existing fleet of compacts 400 31.0 19.25 19.25 20.24 20.64 20.96 21.21 21.21 21.21 21.21 TLEFDSL Car, Diesel, Existing fleet 450 29.9 20.60 20.60 21.66 22.08 22.43 22.69 22.69 22.69 22.69 TLEFGSL Car, Gasoline, Existing fleet of full size 450 27.0 25.36 25.36 26.40 26.82 27.14 27.39 27.39 27.39 27.39 TLESGSL SUV, Gasoline, Existing Fleet 450 20.0 26.91 26.91 27.78 28.14 28.47 28.69 28.69 28.69 28.69 TLEMGSL Minivan, Gasoline, Existing Fleet 450 25.5 24.69 24.69 25.54 25.85 26.16 26.41 26.41 26.41 26.41 TLEPGSL Pickups and large vans, Gasoline, Existing Fleet 500 21.0 19.94 19.94 20.69 21.01 21.30 21.50 21.50 21.50 21.50 TLEPDSL Light truck, Diesel, Existing fleet 450 22.1 21.34 21.34 22.14 22.48 22.79 23.01 23.01 23.01 23.01 TLCCONV00 Car, Gasoline, Conventional, Compacts - 2000 400 31.0 19.25 19.25 20.24 20.64 20.96 21.21 21.21 21.21 21.21 TLCCONV05 Car, Gasoline, Conventional, Compacts - 2005 400 33.0 19.25 19.25 20.24 20.64 20.96 21.21 21.21 21.21 21.21 TLCCONV10 Car, Gasoline, Conventional, Compacts - 2010 400 34.5 19.25 19.25 20.24 20.64 20.96 21.21 21.21 21.21 21.21 TLCCONV15 Car, Gasoline, Conventional, Compacts - 2015 400 34.4 19.25 19.25 20.24 20.64 20.96 21.21 21.21 21.21 21.21 TLCCONV20 Car, Gasoline, Conventional, Compacts - 2020 400 34.4 19.25 19.25 20.24 20.64 20.96 21.21 21.21 21.21 21.21 TLCCONV25 Car, Gasoline, Conventional, Compacts - 2025 400 34.4 19.25 19.25 20.24 20.64 20.96 21.21 21.21 21.21 21.21 TLCCONV30 Car, Gasoline, Conventional, Compacts - 2030 400 34.4 19.25 19.25 20.24 20.64 20.96 21.21 21.21 21.21 21.21 TLCCONV35 Car, Gasoline, Conventional, Compacts - 2035 400 34.4 19.25 19.25 20.24 20.64 20.96 21.21 21.21 21.21 21.21 TLCMMPG10 Car, Gasoline, Moderate MPG, Compact -2010 400 49.0 0.00 0.00 0.00 22.00 22.34 22.61 22.61 22.61 22.61 TLCMMPG15 Car, Gasoline, Moderate MPG, Compact -2015 400 48.9 0.00 0.00 0.00 22.00 22.34 22.61 22.61 22.61 22.61 TLCMMPG20 Car, Gasoline, Moderate MPG, Compact -2020 400 48.9 0.00 0.00 0.00 22.00 22.34 22.61 22.61 22.61 22.61 TLCMMPG25 Car, Gasoline, Moderate MPG, Compact -2025 400 48.9 0.00 0.00 0.00 22.00 22.34 22.61 22.61 22.61 22.61 TLCMMPG30 Car, Gasoline, Moderate MPG, Compact -2030 400 48.9 0.00 0.00 0.00 22.00 22.34 22.61 22.61 22.61 22.61 TLCMMPG35 Car, Gasoline, Moderate MPG, Compact -2035 400 48.9 0.00 0.00 0.00 22.00 22.34 22.61 22.61 22.61 22.61 TLCAMPG10 Car, Gasoline, Advanced MPG, Compact -2010 400 54.2 0.00 0.00 0.00 22.25 22.59 22.86 22.86 22.86 22.86 TLCAMPG15 Car, Gasoline, Advanced MPG, Compact -2015 400 54.1 0.00 0.00 0.00 22.25 22.59 22.86 22.86 22.86 22.86 TLCAMPG20 Car, Gasoline, Advanced MPG, Compact -2020 400 54.0 0.00 0.00 0.00 22.25 22.59 22.86 22.86 22.86 22.86
continued
112
Lighting START LIFE CFMARKAL Technology Name year years dec fractionRL01 Incandescent Lighting 1995 15 1RL02 Baseline Fluorescent 1995 15 1RL03 Fluorescent, elec ballast, rapid start 2000 15 1
Relative Variable O&M Variable O&MEfficiency cents/kwh out cents/kwh in
RL01 Incandescent Lighting 1 0.699424046 0.7RL02 Baseline Fluorescent 4.6 0.322894168 0.1RL03 Fluorescent, elec ballast, rapid start 5.4 0.322894168 0.1

Capital Costs FIXOM EFF (Thousands of 1999$/vehicle) (1999$/vehicle) (mpg) 1995 2000 2005 2010 2015 2020 2025 2030 2035 TLCAMPG25 Car, Gasoline, Advanced MPG, Compact -2025 400 54.0 0.00 0.00 0.00 22.25 22.59 22.86 22.86 22.86 22.86 TLCAMPG30 Car, Gasoline, Advanced MPG, Compact -2030 400 54.0 0.00 0.00 0.00 22.25 22.59 22.86 22.86 22.86 22.86 TLCAMPG35 Car, Gasoline, Advanced MPG, Compact -2035 400 54.0 0.00 0.00 0.00 22.25 22.59 22.86 22.86 22.86 22.86 TLCADSL05 Car, Advanced diesel, Compact - 2005 400 44.5 0.00 0.00 21.66 22.08 22.43 22.70 22.70 22.70 22.70 TLCADSL10 Car, Advanced diesel, Compact - 2010 400 46.6 0.00 0.00 21.66 22.08 22.43 22.70 22.70 22.70 22.70 TLCADSL15 Car, Advanced diesel, Compact - 2015 400 46.5 0.00 0.00 21.66 22.08 22.43 22.70 22.70 22.70 22.70 TLCADSL20 Car, Advanced diesel, Compact - 2020 400 46.5 0.00 0.00 21.66 22.08 22.43 22.70 22.70 22.70 22.70 TLCADSL25 Car, Advanced diesel, Compact - 2025 400 46.5 0.00 0.00 21.66 22.08 22.43 22.70 22.70 22.70 22.70 TLCADSL30 Car, Advanced diesel, Compact - 2030 400 46.5 0.00 0.00 21.66 22.08 22.43 22.70 22.70 22.70 22.70 TLCADSL35 Car, Advanced diesel, Compact - 2035 400 46.5 0.00 0.00 21.66 22.08 22.43 22.70 22.70 22.70 22.70 TLCFCH20 Car, Fuel cell-Hydrogen, Compact - 2020 420 92.9 0.00 0.00 0.00 0.00 0.00 27.58 24.40 24.40 24.40 TLCFCH25 Car, Fuel cell-Hydrogen, Compact - 2025 420 103.2 0.00 0.00 0.00 0.00 0.00 27.58 24.40 24.40 24.40 TLCCNG05 Car, CNG dedicated, Compact - 2005 360 33.0 0.00 0.00 21.86 22.29 22.64 22.91 22.91 22.91 22.91 TLCCNG10 Car, CNG dedicated, Compact - 2010 360 34.5 0.00 0.00 21.86 22.29 22.64 22.91 22.91 22.91 22.91 TLCELC05 Car, Electric, Compact - 2005 240 131.8 0.00 0.00 54.65 39.22 31.44 31.82 31.82 31.82 31.82 TLCELC10 Car, Electric, Compact - 2010 240 138.0 0.00 0.00 54.65 39.22 31.44 31.82 31.82 31.82 31.82 TLC2HYB05 Car, Hybrid (2X), Compact - 2005 420 44.5 0.00 0.00 25.31 24.77 24.10 23.76 22.27 22.27 22.27 TLC2HYB10 Car, Hybrid (2X), Compact - 2010 420 55.2 0.00 0.00 25.31 24.77 24.10 23.76 22.27 22.27 22.27 TLC2HYB15 Car, Hybrid (2X), Compact - 2015 420 60.3 0.00 0.00 25.31 24.77 24.10 23.76 22.27 22.27 22.27 TLC2HYB20 Car, Hybrid (2X), Compact - 2020 420 64.5 0.00 0.00 25.31 24.77 24.10 23.76 22.27 22.27 22.27 TLC2HYB25 Car, Hybrid (2X), Compact - 2025 420 68.8 0.00 0.00 25.31 24.77 24.10 23.76 22.27 22.27 22.27 TLC2HYB30 Car, Hybrid (2X), Compact - 2030 420 68.8 0.00 0.00 25.31 24.77 24.10 23.76 22.27 22.27 22.27 TLC2HYB35 Car, Hybrid (2X), Compact - 2035 420 68.8 0.00 0.00 25.31 24.77 24.10 23.76 22.27 22.27 22.27 TLC3HYB15 Car, Hybrid (3X), Compact - 2015 420 79.2 0.00 0.00 0.00 0.00 26.20 25.46 23.34 23.34 23.34 TLC3HYB20 Car, Hybrid (3X), Compact – 2020 420 92.9 0.00 0.00 0.00 0.00 26.20 25.46 23.34 23.34 23.34 TLC3HYB25 Car, Hybrid (3X), Compact – 2025 420 103.2 0.00 0.00 0.00 0.00 26.20 25.46 23.34 23.34 23.34 TLC3HYB30 Car, Hybrid (3X), Compact – 2030 420 103.2 0.00 0.00 0.00 0.00 26.20 25.46 23.34 23.34 23.34 TLC3HYB35 Car, Hybrid (3X), Compact – 2035 420 103.2 0.00 0.00 0.00 0.00 26.20 25.46 23.34 23.34 23.34 TLCETHX05 Car, Flex Ethanol, Compact - 2005 400 33.0 19.44 19.44 20.44 20.85 21.17 21.42 21.42 21.42 21.42 TLCETHX10 Car, Flex Ethanol, Compact - 2010 400 34.5 19.44 19.44 20.44 20.85 21.17 21.42 21.42 21.42 21.42 TLCETHX15 Car, Flex Ethanol, Compact - 2015 400 34.4 19.44 19.44 20.44 20.85 21.17 21.42 21.42 21.42 21.42 TLCETHX20 Car, Flex Ethanol, Compact - 2020 400 34.4 19.44 19.44 20.44 20.85 21.17 21.42 21.42 21.42 21.42 TLCETHX25 Car, Flex Ethanol, Compact - 2025 400 34.4 19.44 19.44 20.44 20.85 21.17 21.42 21.42 21.42 21.42 TLCETHX30 Car, Flex Ethanol, Compact - 2030 400 34.4 19.44 19.44 20.44 20.85 21.17 21.42 21.42 21.42 21.42 TLCETHX35 Car, Flex Ethanol, Compact - 2035 400 34.4 19.44 19.44 20.44 20.85 21.17 21.42 21.42 21.42 21.42 TLCMTHX00 Car, Flex Methanol, Compact - 2000 400 31.6 21.52 21.52 22.52 22.93 23.24 23.47 23.47 23.47 23.47 TLCMTHX10 Car, Flex Methanol, Compact - 2010 400 35.1 21.52 21.52 22.52 22.93 23.24 23.47 23.47 23.47 23.47 TLCMTHX20 Car, Flex Methanol, Compact - 2020 400 35.3 21.52 21.52 22.52 22.93 23.24 23.47 23.47 23.47 23.47 TLCCNGX00 Car. CNG Bi-fuel, Compact - 2000 360 30.9 25.78 25.78 26.88 27.40 27.84 28.19 28.19 28.19 28.19
continued
113

Capital Costs FIXOM EFF (Thousands of 1999$/vehicle) (1999$/vehicle) (mpg) 1995 2000 2005 2010 2015 2020 2025 2030 2035 TLCCNGX10 Car. CNG Bi-fuel, Compact - 2010 360 34.0 25.78 25.78 26.88 27.40 27.84 28.19 28.19 28.19 28.19 TLCCNGX20 Car. CNG Bi-fuel, Compact - 2020 360 33.6 25.78 25.78 26.88 27.40 27.84 28.19 28.19 28.19 28.19 TLCLPGX00 Car, LPG Bi-fuel, Compact -2000 360 31.0 24.13 24.13 25.18 25.65 26.03 26.33 26.33 26.33 26.33 TLCLPGX10 Car, LPG Bi-fuel, Compact -2010 360 34.3 24.13 24.13 25.18 25.65 26.03 26.33 26.33 26.33 26.33 TLCLPGX20 Car, LPG Bi-fuel, Compact -2020 360 34.2 24.13 24.13 25.18 25.65 26.03 26.33 26.33 26.33 26.33 TLCFCM10 Car, Fuel Cell Methanol, Compact - 2010 420 67.0 0.00 0.00 0.00 28.68 28.68 28.63 25.45 25.45 25.45 TLCFCM20 Car, Fuel Cell Methanol, Compact - 2020 420 74.6 0.00 0.00 0.00 28.68 28.68 28.63 25.45 25.45 25.45 TLFCONV00 Car, Gasoline, Conventional, Full size - 2000 450 27.0 25.36 25.36 26.40 26.82 27.14 27.39 27.39 27.39 27.39 TLFCONV05 Car, Gasoline, Conventional, Full size - 2005 450 28.7 25.36 25.36 26.40 26.82 27.14 27.39 27.39 27.39 27.39 TLFCONV10 Car, Gasoline, Conventional, Full size - 2010 450 30.0 25.36 25.36 26.40 26.82 27.14 27.39 27.39 27.39 27.39 TLFCONV15 Car, Gasoline, Conventional, Full size - 2015 450 30.1 25.36 25.36 26.40 26.82 27.14 27.39 27.39 27.39 27.39 TLFCONV20 Car, Gasoline, Conventional, Full size - 2020 450 30.2 25.36 25.36 26.40 26.82 27.14 27.39 27.39 27.39 27.39 TLFCONV25 Car, Gasoline, Conventional, Full size - 2025 450 30.2 25.36 25.36 26.40 26.82 27.14 27.39 27.39 27.39 27.39 TLFCONV30 Car, Gasoline, Conventional, Full size - 2030 450 30.2 25.36 25.36 26.40 26.82 27.14 27.39 27.39 27.39 27.39 TLFCONV35 Car, Gasoline, Conventional, Full size - 2035 450 30.2 25.36 25.36 26.40 26.82 27.14 27.39 27.39 27.39 27.39 TLFMMPG10 Car, Gasoline, Moderate MPG for full size -2010 450 46.8 0.00 0.00 0.00 28.24 28.58 28.84 28.84 28.84 28.84 TLFMMPG15 Car, Gasoline, Moderate MPG for full size -2015 450 46.9 0.00 0.00 0.00 28.24 28.58 28.84 28.84 28.84 28.84 TLFMMPG20 Car, Gasoline, Moderate MPG for full size -2020 450 47.0 0.00 0.00 0.00 28.24 28.58 28.84 28.84 28.84 28.84 TLFMMPG25 Car, Gasoline, Moderate MPG for full size -2025 450 47.0 0.00 0.00 0.00 28.24 28.58 28.84 28.84 28.84 28.84 TLFMMPG30 Car, Gasoline, Moderate MPG for full size -2030 450 47.0 0.00 0.00 0.00 28.24 28.58 28.84 28.84 28.84 28.84 TLFMMPG35 Car, Gasoline, Moderate MPG for full size -2035 450 47.0 0.00 0.00 0.00 28.24 28.58 28.84 28.84 28.84 28.84 TLFAMMP10 Car, Gasoline, Advanced MPG for full size -2010 450 52.5 0.00 0.00 0.00 28.59 28.93 29.20 29.20 29.20 29.20 TLFAMMP15 Car, Gasoline, Advanced MPG for full size -2015 450 52.6 0.00 0.00 0.00 28.59 28.93 29.20 29.20 29.20 29.20 TLFAMMP20 Car, Gasoline, Advanced MPG for full size -2020 450 52.8 0.00 0.00 0.00 28.59 28.93 29.20 29.20 29.20 29.20 TLFAMMP25 Car, Gasoline, Advanced MPG for full size -2025 450 52.8 0.00 0.00 0.00 28.59 28.93 29.20 29.20 29.20 29.20 TLFAMMP30 Car, Gasoline, Advanced MPG for full size -2030 450 52.8 0.00 0.00 0.00 28.59 28.93 29.20 29.20 29.20 29.20 TLFAMMP35 Car, Gasoline, Advanced MPG for full size -2035 450 52.8 0.00 0.00 0.00 28.59 28.93 29.20 29.20 29.20 29.20 TLFADSL05 Car, Advanced diesel, Full size - 2005 450 40.2 0.00 0.00 28.24 28.16 28.50 28.76 28.76 28.76 28.76 TLFADSL10 Car, Advanced diesel, Full size - 2010 450 42.0 0.00 0.00 28.24 28.16 28.50 28.76 28.76 28.76 28.76 TLFADSL15 Car, Advanced diesel, Full size - 2015 450 42.1 0.00 0.00 28.24 28.16 28.50 28.76 28.76 28.76 28.76 TLFADSL20 Car, Advanced diesel, Full size - 2020 450 42.2 0.00 0.00 28.24 28.16 28.50 28.76 28.76 28.76 28.76 TLFADSL25 Car, Advanced diesel, Full size - 2025 450 42.2 0.00 0.00 28.24 28.16 28.50 28.76 28.76 28.76 28.76 TLFADSL30 Car, Advanced diesel, Full size - 2030 450 42.2 0.00 0.00 28.24 28.16 28.50 28.76 28.76 28.76 28.76 TLFADSL35 Car, Advanced diesel, Full size - 2035 450 42.2 0.00 0.00 28.24 28.16 28.50 28.76 28.76 28.76 28.76 TLFETHX00 Car, Flex Ethanol, Full size - 2000 450 27.0 25.61 25.61 26.66 27.09 27.41 27.66 27.66 27.66 27.66 TLFETHX10 Car, Flex Ethanol, Full size - 2010 450 30.0 25.61 25.61 26.66 27.09 27.41 27.66 27.66 27.66 27.66 TLFFCH20 Car, Fuel cell-Hydrogen, Full size - 2020 473 75.4 0.00 0.00 0.00 0.00 0.00 34.24 31.50 31.50 31.50 TLFFCH25 Car, Fuel cell-Hydrogen, Full size - 2025 473 90.5 0.00 0.00 0.00 0.00 0.00 34.24 31.50 31.50 31.50 TLFFCG10 Car, Fuel Cell-gasoline, Full size - 2010 473 58.3 0.00 0.00 0.00 37.27 37.13 36.98 32.87 0.00 0.00 TLFFCG20 Car, Fuel Cell-gasoline, Full size - 2020 473 64.9 0.00 0.00 0.00 37.27 37.13 36.98 32.87 0.00 0.00
continued
114

Capital Costs FIXOM EFF (Thousands of 1999$/vehicle) (1999$/vehicle) (mpg) 1995 2000 2005 2010 2015 2020 2025 2030 2035 TLFFCG25 Car, Fuel Cell-gasoline, Full size - 2025 473 75.4 0.00 0.00 0.00 37.27 37.13 36.98 32.87 0.00 0.00 TLFCNG05 Car, CNG Dedicated, Full size - 2005 405 28.7 0.00 0.00 28.16 27.89 28.23 28.49 28.49 28.49 28.49 TLFCNG10 Car, CNG Dedicated, Full size - 2010 405 30.0 0.00 0.00 28.16 27.89 28.23 28.49 28.49 28.49 28.49 TLFELC10 Car, Electric, Full size - 2010 270 120.0 0.00 0.00 0.00 47.82 40.71 40.96 40.96 40.96 40.96 TLF2HYB05 Car, Hybrid (2X), Full size - 2005 473 43.1 0.00 0.00 33.00 32.18 31.21 29.99 28.76 28.76 28.76 TLF2HYB10 Car, Hybrid (2X), Full size - 2010 473 48.0 0.00 0.00 33.00 32.18 31.21 29.99 28.76 28.76 28.76 TLF2HYB15 Car, Hybrid (2X), Full size - 2015 473 52.6 0.00 0.00 33.00 32.18 31.21 29.99 28.76 28.76 28.76 TLF2HYB20 Car, Hybrid (2X), Full size - 2020 473 56.6 0.00 0.00 33.00 32.18 31.21 29.99 28.76 28.76 28.76 TLF2HYB25 Car, Hybrid (2X), Full size - 2025 473 60.3 0.00 0.00 33.00 32.18 31.21 29.99 28.76 28.76 28.76 TLF2HYB30 Car, Hybrid (2X), Full size - 2030 473 60.3 0.00 0.00 33.00 32.18 31.21 29.99 28.76 28.76 28.76 TLF2HYB35 Car, Hybrid (2X), Full size - 2035 473 60.3 0.00 0.00 33.00 32.18 31.21 29.99 28.76 28.76 28.76 TLF3HYB10 Car, Hybrid (3X), Full size - 2010 473 60.0 0.00 0.00 0.00 34.87 32.57 31.35 30.13 30.13 30.13 TLF3HYB15 Car, Hybrid (3X), Full size - 2015 473 69.1 0.00 0.00 0.00 34.87 32.57 31.35 30.13 30.13 30.13 TLF3HYB20 Car, Hybrid (3X), Full size - 2020 473 81.4 0.00 0.00 0.00 34.87 32.57 31.35 30.13 30.13 30.13 TLF3HYB25 Car, Hybrid (3X), Full size - 2025 473 90.5 0.00 0.00 0.00 34.87 32.57 31.35 30.13 30.13 30.13 TLF3HYB30 Car, Hybrid (3X), Full size - 2030 473 90.5 0.00 0.00 0.00 34.87 32.57 31.35 30.13 30.13 30.13 TLF3HYB35 Car, Hybrid (3X), Full size - 2035 473 90.5 0.00 0.00 0.00 34.87 32.57 31.35 30.13 30.13 30.13 TLFMTHX00 Car, Flex Methanol, Full Size - 2000 450 27.6 27.80 27.80 28.85 29.28 29.62 29.89 29.89 29.89 29.89 TLFMTHX10 Car, Flex Methanol, Full Size - 2010 450 30.8 27.80 27.80 28.85 29.28 29.62 29.89 29.89 29.89 29.89 TLFMTHX20 Car, Flex Methanol, Full Size - 2020 450 30.8 27.80 27.80 28.85 29.28 29.62 29.89 29.89 29.89 29.89 TLFCNGX00 Car. CNG Bi-fuel, Full Size - 2000 405 26.9 31.88 31.88 33.15 33.78 34.31 34.70 34.70 34.70 34.70 TLFCNGX10 Car. CNG Bi-fuel, Full Size - 2010 405 29.1 31.88 31.88 33.15 33.78 34.31 34.70 34.70 34.70 34.70 TLFCNGX20 Car. CNG Bi-fuel, Full Size - 2020 405 28.5 31.88 31.88 33.15 33.78 34.31 34.70 34.70 34.70 34.70 TLFLPGX00 Car, LPG Bi-fuel, Full Size -2000 405 26.9 30.55 30.55 31.73 32.27 32.70 33.00 33.00 33.00 33.00 TLFLPGX10 Car, LPG Bi-fuel, Full Size -2010 405 29.7 30.55 30.55 31.73 32.27 32.70 33.00 33.00 33.00 33.00 TLFLPGX20 Car, LPG Bi-fuel, Full Size -2020 405 29.5 30.55 30.55 31.73 32.27 32.70 33.00 33.00 33.00 33.00 TLFFCM10 Car, Fuel Cell Methanol, Full Size - 2010 473 58.3 0.00 0.00 0.00 37.27 37.13 36.98 32.87 32.87 32.87 TLFFCM20 Car, Fuel Cell Methanol, Full Size - 2020 473 64.9 0.00 0.00 0.00 37.27 37.13 36.98 32.87 32.87 32.87 TLSCONV00 SUV, Conventional - 2000 450 20.0 26.91 26.91 27.78 28.14 28.47 28.69 28.69 28.69 28.69 TLSCONV05 SUV, Conventional - 2005 450 21.0 26.91 26.91 27.78 28.14 28.47 28.69 28.69 28.69 28.69 TLSCONV10 SUV, Conventional - 2010 450 21.9 26.91 26.91 27.78 28.14 28.47 28.69 28.69 28.69 28.69 TLSCONV15 SUV, Conventional - 2015 450 22.7 26.91 26.91 27.78 28.14 28.47 28.69 28.69 28.69 28.69 TLSCONV20 SUV, Conventional - 2020 450 23.3 26.91 26.91 27.78 28.14 28.47 28.69 28.69 28.69 28.69 TLSCONV25 SUV, Conventional - 2025 450 23.3 26.91 26.91 27.78 28.14 28.47 28.69 28.69 28.69 28.69 TLSCONV30 SUV, Conventional - 2030 450 23.3 26.91 26.91 27.78 28.14 28.47 28.69 28.69 28.69 28.69 TLSCONV35 SUV, Conventional - 2035 450 23.3 26.91 26.91 27.78 28.14 28.47 28.69 28.69 28.69 28.69 TLSMMPG10 SUV, Moderate MPG - 2010 450 37.3 0.00 0.00 0.00 29.46 29.81 30.04 30.04 30.04 30.04 TLSMMPG15 SUV, Moderate MPG - 2015 450 38.6 0.00 0.00 0.00 29.46 29.81 30.04 30.04 30.04 30.04 TLSMMPG20 SUV, Moderate MPG - 2020 450 39.6 0.00 0.00 0.00 29.46 29.81 30.04 30.04 30.04 30.04 TLSMMPG25 SUV, Moderate MPG - 2025 450 39.6 0.00 0.00 0.00 29.46 29.81 30.04 30.04 30.04 30.04
continued
115

Capital Costs FIXOM EFF (Thousands of 1999$/vehicle) (1999$/vehicle) (mpg) 1995 2000 2005 2010 2015 2020 2025 2030 2035 TLSMMPG30 SUV, Moderate MPG - 2030 450 39.6 0.00 0.00 0.00 29.46 29.81 30.04 30.04 30.04 30.04 TLSMMPG35 SUV, Moderate MPG - 2035 450 39.6 0.00 0.00 0.00 29.46 29.81 30.04 30.04 30.04 30.04 TLSAMPG10 SUV, Advanced MPG - 2010 450 43.4 0.00 0.00 0.00 30.11 30.46 30.70 30.70 30.70 30.70 TLSAMPG15 SUV, Advanced MPG - 2015 450 44.9 0.00 0.00 0.00 30.11 30.46 30.70 30.70 30.70 30.70 TLSAMPG20 SUV, Advanced MPG - 2020 450 46.2 0.00 0.00 0.00 30.11 30.46 30.70 30.70 30.70 30.70 TLSAMPG25 SUV, Advanced MPG - 2025 450 46.2 0.00 0.00 0.00 30.11 30.46 30.70 30.70 30.70 30.70 TLSAMPG30 SUV, Advanced MPG - 2030 450 46.2 0.00 0.00 0.00 30.11 30.46 30.70 30.70 30.70 30.70 TLSAMPG35 SUV, Advanced MPG - 2035 450 46.2 0.00 0.00 0.00 30.11 30.46 30.70 30.70 30.70 30.70 TLSADSL05 SUV, Advanced diesel - 2005 450 29.4 0.00 0.00 29.96 30.11 30.44 30.66 30.66 30.66 30.66 TLSADSL10 SUV, Advanced diesel - 2010 450 30.7 0.00 0.00 29.96 30.11 30.44 30.66 30.66 30.66 30.66 TLSADSL15 SUV, Advanced diesel - 2015 450 31.8 0.00 0.00 29.96 30.11 30.44 30.66 30.66 30.66 30.66 TLSADSL20 SUV, Advanced diesel - 2020 450 32.6 0.00 0.00 29.96 30.11 30.44 30.66 30.66 30.66 30.66 TLSADSL25 SUV, Advanced diesel - 2025 450 32.6 0.00 0.00 29.96 30.11 30.44 30.66 30.66 30.66 30.66 TLSADSL30 SUV, Advanced diesel - 2030 450 32.6 0.00 0.00 29.96 30.11 30.44 30.66 30.66 30.66 30.66 TLSADSL35 SUV, Advanced diesel - 2035 450 32.6 0.00 0.00 29.96 30.11 30.44 30.66 30.66 30.66 30.66 TLSETHX05 SUV, Flex Ethanol - 2005 450 21.0 0.00 0.00 28.06 28.42 28.75 28.98 28.98 28.98 28.98 TLSETHX15 SUV, Flex Ethanol - 2015 450 22.7 0.00 0.00 28.06 28.42 28.75 28.98 28.98 28.98 28.98 TLSFCH15 SUV, Fuel Cell-Hydrogen - 2015 473 52.2 0.00 0.00 0.00 0.00 38.18 35.86 32.99 32.99 32.99 TLSFCH20 SUV, Fuel Cell-Hydrogen - 2020 473 58.3 0.00 0.00 0.00 0.00 38.18 35.86 32.99 32.99 32.99 TLSFCH25 SUV, Fuel Cell-Hydrogen - 2025 473 69.9 0.00 0.00 0.00 0.00 38.18 35.86 32.99 32.99 32.99 TLSFCG10 SUV, Fuel cell-Gasoline - 2010 473 39.3 0.00 0.00 0.00 39.12 38.93 38.73 0.00 0.00 0.00 TLSFCG20 SUV, Fuel cell-Gasoline - 2020 473 46.6 0.00 0.00 0.00 39.12 38.93 38.73 0.00 0.00 0.00 TLSCNG05 SUV, CNG dedicated - 2005 405 21.0 0.00 0.00 29.17 29.53 29.86 30.08 30.08 30.08 30.08 TLSCNG15 SUV, CNG dedicated - 2015 405 22.7 0.00 0.00 29.17 29.53 29.86 30.08 30.08 30.08 30.08 TLSELC10 SUV, Electric - 2010 270 87.7 0.00 0.00 0.00 42.21 41.19 40.17 40.17 40.17 40.17 TLSELC20 SUV, Electric - 2020 270 93.2 0.00 0.00 0.00 42.21 41.19 40.17 40.17 40.17 40.17 TLS2HYB05 SUV, Hybrid (2X) - 2005 473 28.4 0.00 0.00 34.02 33.77 32.74 31.43 30.13 30.13 30.13 TLS2HYB10 SUV, Hybrid (2X) - 2010 473 35.1 0.00 0.00 34.02 33.77 32.74 31.43 30.13 30.13 30.13 TLS2HYB15 SUV, Hybrid (2X) - 2015 473 39.7 0.00 0.00 34.02 33.77 32.74 31.43 30.13 30.13 30.13 TLS2HYB20 SUV, Hybrid (2X) - 2020 473 43.7 0.00 0.00 34.02 33.77 32.74 31.43 30.13 30.13 30.13 TLS2HYB25 SUV, Hybrid (2X) - 2025 473 46.6 0.00 0.00 34.02 33.77 32.74 31.43 30.13 30.13 30.13 TLS2HYB30 SUV, Hybrid (2X) - 2030 473 46.6 0.00 0.00 34.02 33.77 32.74 31.43 30.13 30.13 30.13 TLS2HYB35 SUV, Hybrid (2X) - 2035 473 46.6 0.00 0.00 34.02 33.77 32.74 31.43 30.13 30.13 30.13 TLS3HYB15 SUV, Hybrid (3X) - 2015 473 45.4 0.00 0.00 0.00 0.00 35.58 34.43 31.56 31.56 31.56 TLS3HYB20 SUV, Hybrid (3X) - 2020 473 53.6 0.00 0.00 0.00 0.00 35.58 34.43 31.56 31.56 31.56 TLS3HYB25 SUV, Hybrid (3X) - 2025 473 69.9 0.00 0.00 0.00 0.00 35.58 34.43 31.56 31.56 31.56 TLS3HYB30 SUV, Hybrid (3X) - 2030 473 69.9 0.00 0.00 0.00 0.00 35.58 34.43 31.56 31.56 31.56 TLS3HYB35 SUV, Hybrid (3X) - 2035 473 69.9 0.00 0.00 0.00 0.00 35.58 34.43 31.56 31.56 31.56 TLSMTHX00 SUV, Flex Methanol - 2000 450 20.4 31.94 29.32 30.16 30.50 30.84 31.06 31.06 31.06 31.06 TLSMTHX10 SUV, Flex Methanol - 2010 450 22.5 31.94 29.32 30.16 30.50 30.84 31.06 31.06 31.06 31.06
continued
116

Capital Costs FIXOM EFF (Thousands of 1999$/vehicle) (1999$/vehicle) (mpg) 1995 2000 2005 2010 2015 2020 2025 2030 2035 TLSMTHX20 SUV, Flex Methanol - 2020 450 23.9 31.94 29.32 30.16 30.50 30.84 31.06 31.06 31.06 31.06 TLSCNGX00 SUV. CNG Bi-fuel - 2000 405 20.0 32.65 29.32 30.16 30.50 30.84 31.06 31.06 31.06 31.06 TLSCNGX10 SUV. CNG Bi-fuel - 2010 405 21.4 32.65 29.32 30.16 30.50 30.84 31.06 31.06 31.06 31.06 TLSCNGX20 SUV. CNG Bi-fuel - 2020 405 22.3 32.65 29.32 30.16 30.50 30.84 31.06 31.06 31.06 31.06 TLSLPGX00 SUV, LPG Bi-fuel -2000 405 20.0 31.80 31.80 32.71 33.16 33.58 33.83 33.83 33.83 33.83 TLSLPGX10 SUV, LPG Bi-fuel -2010 405 21.7 31.80 31.80 32.71 33.16 33.58 33.83 33.83 33.83 33.83 TLSLPGX20 SUV, LPG Bi-fuel -2020 405 23.0 31.80 31.80 32.71 33.16 33.58 33.83 33.83 33.83 33.83 TLSFCM10 SUV, Fuel Cell Methanol - 2010 473 39.3 0.00 0.00 0.00 39.12 38.93 38.73 38.73 38.73 38.73 TLSFCM20 SUV, Fuel Cell Methanol - 2020 473 46.6 0.00 0.00 0.00 39.12 38.93 38.73 38.73 38.73 38.73 TLMCONV00 Minivan, Conventional - 2000 450 25.5 24.69 24.69 25.54 25.85 26.16 26.41 26.41 26.41 26.41 TLMCONV05 Minivan, Conventional - 2005 450 26.2 24.69 24.69 25.54 25.85 26.16 26.41 26.41 26.41 26.41 TLMCONV10 Minivan, Conventional - 2010 450 27.0 24.69 24.69 25.54 25.85 26.16 26.41 26.41 26.41 26.41 TLMCONV15 Minivan, Conventional - 2015 450 27.8 24.69 24.69 25.54 25.85 26.16 26.41 26.41 26.41 26.41 TLMCONV20 Minivan, Conventional - 2020 450 28.8 24.69 24.69 25.54 25.85 26.16 26.41 26.41 26.41 26.41 TLMCONV25 Minivan, Conventional - 2025 450 28.8 24.69 24.69 25.54 25.85 26.16 26.41 26.41 26.41 26.41 TLMCONV30 Minivan, Conventional - 2030 450 28.8 24.69 24.69 25.54 25.85 26.16 26.41 26.41 26.41 26.41 TLMCONV35 Minivan, Conventional - 2035 450 28.8 24.69 24.69 25.54 25.85 26.16 26.41 26.41 26.41 26.41 TLMMMPG10 Minivan, Moderate MPG - 2010 450 41.8 0.00 0.00 0.00 27.01 27.34 27.60 27.60 27.60 27.60 TLMMMPG15 Minivan, Moderate MPG - 2015 450 41.8 0.00 0.00 0.00 27.01 27.34 27.60 27.60 27.60 27.60 TLMMMPG20 Minivan, Moderate MPG - 2020 450 44.6 0.00 0.00 0.00 27.01 27.34 27.60 27.60 27.60 27.60 TLMMMPG25 Minivan, Moderate MPG - 2025 450 44.6 0.00 0.00 0.00 27.01 27.34 27.60 27.60 27.60 27.60 TLMMMPG30 Minivan, Moderate MPG - 2030 450 44.6 0.00 0.00 0.00 27.01 27.34 27.60 27.60 27.60 27.60 TLMMMPG35 Minivan, Moderate MPG - 2035 450 44.6 0.00 0.00 0.00 27.01 27.34 27.60 27.60 27.60 27.60 TLMAMPG10 Minivan, Advanced MPG - 2010 450 49.9 0.00 0.00 0.00 27.53 27.86 28.13 28.13 28.13 28.13 TLMAMPG15 Minivan, Advanced MPG - 2015 450 51.5 0.00 0.00 0.00 27.53 27.86 28.13 28.13 28.13 28.13 TLMAMPG20 Minivan, Advanced MPG - 2020 450 53.2 0.00 0.00 0.00 27.53 27.86 28.13 28.13 28.13 28.13 TLMAMPG25 Minivan, Advanced MPG - 2025 450 53.2 0.00 0.00 0.00 27.53 27.86 28.13 28.13 28.13 28.13 TLMAMPG30 Minivan, Advanced MPG - 2030 450 53.2 0.00 0.00 0.00 27.53 27.86 28.13 28.13 28.13 28.13 TLMAMPG35 Minivan, Advanced MPG - 2035 450 53.2 0.00 0.00 0.00 27.53 27.86 28.13 28.13 28.13 28.13 TLMADSL10 Minivan, Advanced diesel - 2010 450 37.7 0.00 0.00 0.00 27.66 27.96 28.22 28.22 28.22 28.22 TLMADSL15 Minivan, Advanced diesel - 2015 450 39.0 0.00 0.00 0.00 27.66 27.96 28.22 28.22 28.22 28.22 TLMADSL20 Minivan, Advanced diesel - 2020 450 40.3 0.00 0.00 0.00 27.66 27.96 28.22 28.22 28.22 28.22 TLMADSL25 Minivan, Advanced diesel - 2025 450 40.3 0.00 0.00 0.00 27.66 27.96 28.22 28.22 28.22 28.22 TLMADSL30 Minivan, Advanced diesel - 2030 450 40.3 0.00 0.00 0.00 27.66 27.96 28.22 28.22 28.22 28.22 TLMADSL35 Minivan, Advanced diesel - 2035 450 40.3 0.00 0.00 0.00 27.66 27.96 28.22 28.22 28.22 28.22 TLMETHX00 Minivan, Flex Ethanol - 2000 450 25.5 24.94 24.94 25.80 26.11 26.42 26.67 26.67 26.67 26.67 TLMETHX10 Minivan, Flex Ethanol - 2010 450 27.0 24.94 24.94 25.80 26.11 26.42 26.67 26.67 26.67 26.67 TLMETHX20 Minivan, Flex Ethanol - 2020 450 28.8 24.94 24.94 25.80 26.11 26.42 26.67 26.67 26.67 26.67 TLMFCH15 Minivan, Fuel cell-Hydrogen - 2015 495 58.0 0.00 0.00 0.00 0.00 34.86 33.01 30.37 30.37 30.37 TLMFCH20 Minivan, Fuel cell-Hydrogen - 2020 495 72.0 0.00 0.00 0.00 0.00 34.86 33.01 30.37 30.37 30.37
continued
117

Capital Costs FIXOM EFF (Thousands of 1999$/vehicle) (1999$/vehicle) (mpg) 1995 2000 2005 2010 2015 2020 2025 2030 2035 TLMFCH25 Minivan, Fuel cell-Hydrogen - 2025 495 86.4 0.00 0.00 0.00 0.00 34.86 33.01 30.37 30.37 30.37 TLMFCG10 Minivan, Fuel cell-Gasoline - 2010 450 49.0 0.00 0.00 0.00 34.66 34.49 34.33 0.00 0.00 0.00 TLMFCG15 Minivan, Fuel cell-Gasoline - 2015 450 55.2 0.00 0.00 0.00 34.66 34.49 34.33 0.00 0.00 0.00 TLMFCG20 Minivan, Fuel cell-Gasoline - 2020 450 61.9 0.00 0.00 0.00 34.66 34.49 34.33 0.00 0.00 0.00 TLMCNG05 Minivan, CNG dedicated - 2005 405 26.2 0.00 0.00 26.82 27.14 27.46 27.73 27.73 27.73 27.73 TLMCNG15 Minivan, CNG dedicated - 2015 405 27.8 0.00 0.00 26.82 27.14 27.46 27.73 27.73 27.73 27.73 TLMELC10 Minivan, Electric - 2010 270 107.8 0.00 0.00 0.00 46.11 39.23 39.49 39.49 39.49 39.49 TLMELC20 Minivan, Electric - 2020 270 115.1 0.00 0.00 0.00 46.11 39.23 39.49 39.49 39.49 39.49 TLM2HYB10 Minivan, Hybrid (2X) - 2010 473 43.1 0.00 0.00 0.00 31.02 30.08 28.90 27.73 27.73 27.73 TLM2HYB15 Minivan, Hybrid (2X) - 2015 473 48.7 0.00 0.00 0.00 31.02 30.08 28.90 27.73 27.73 27.73 TLM2HYB20 Minivan, Hybrid (2X) - 2020 473 54.0 0.00 0.00 0.00 31.02 30.08 28.90 27.73 27.73 27.73 TLM2HYB25 Minivan, Hybrid (2X) - 2025 473 57.6 0.00 0.00 0.00 31.02 30.08 28.90 27.73 27.73 27.73 TLM2HYB30 Minivan, Hybrid (2X) - 2030 473 57.6 0.00 0.00 0.00 31.02 30.08 28.90 27.73 27.73 27.73 TLM2HYB35 Minivan, Hybrid (2X) - 2035 473 57.6 0.00 0.00 0.00 31.02 30.08 28.90 27.73 27.73 27.73 TLM3HYB15 Minivan, Hybrid (3X) - 2015 495 57.1 0.00 0.00 0.00 0.00 32.33 30.90 29.05 29.05 29.05 TLM3HYB20 Minivan, Hybrid (3X) - 2020 495 66.2 0.00 0.00 0.00 0.00 32.33 30.90 29.05 29.05 29.05 TLM3HYB25 Minivan, Hybrid (3X) - 2025 495 86.4 0.00 0.00 0.00 0.00 32.33 30.90 29.05 29.05 29.05 TLM3HYB30 Minivan, Hybrid (3X) - 2030 495 86.4 0.00 0.00 0.00 0.00 32.33 30.90 29.05 29.05 29.05 TLM3HYB35 Minivan, Hybrid (3X) - 2035 495 86.4 0.00 0.00 0.00 0.00 32.33 30.90 29.05 29.05 29.05 TLMMTHX00 Minivan, Flex Methanol - 2000 450 26.2 26.90 26.90 27.73 28.02 28.34 28.59 28.59 28.59 28.59 TLMMTHX10 Minivan, Flex Methanol - 2010 450 27.7 26.90 26.90 27.73 28.02 28.34 28.59 28.59 28.59 28.59 TLMMTHX20 Minivan, Flex Methanol - 2020 450 29.6 26.90 26.90 27.73 28.02 28.34 28.59 28.59 28.59 28.59 TLMCNGX00 Minivan. CNG Bi-fuel - 2000 405 25.4 30.15 30.15 31.22 31.73 32.21 32.54 32.54 32.54 32.54 TLMCNGX10 Minivan. CNG Bi-fuel - 2010 405 25.9 30.15 30.15 31.22 31.73 32.21 32.54 32.54 32.54 32.54 TLMCNGX20 Minivan. CNG Bi-fuel - 2020 405 27.2 30.15 30.15 31.22 31.73 32.21 32.54 32.54 32.54 32.54 TLMLPGX00 Minivan, LPG Bi-fuel -2000 405 25.4 29.34 29.34 30.33 30.74 31.09 31.37 31.37 31.37 31.37 TLMLPGX10 Minivan, LPG Bi-fuel -2010 405 26.5 29.34 29.34 30.33 30.74 31.09 31.37 31.37 31.37 31.37 TLMLPGX20 Minivan, LPG Bi-fuel -2020 405 28.3 29.34 29.34 30.33 30.74 31.09 31.37 31.37 31.37 31.37 TLMFCM10 Minivan, Fuel Cell Methanol - 2010 450 49.0 0.00 0.00 0.00 34.66 34.49 34.33 34.33 34.33 34.33 TLMFCM20 Minivan, Fuel Cell Methanol - 2020 450 61.9 0.00 0.00 0.00 34.66 34.49 34.33 34.33 34.33 34.33 TLPCONV00 Pickups and large vans, Conventional - 2000 500 21.0 19.94 19.94 20.69 21.01 21.30 21.50 21.50 21.50 21.50 TLPCONV05 Pickups and large vans, Conventional - 2005 500 21.8 19.94 19.94 20.69 21.01 21.30 21.50 21.50 21.50 21.50 TLPCONV10 Pickups and large vans, Conventional - 2010 500 22.7 19.94 19.94 20.69 21.01 21.30 21.50 21.50 21.50 21.50 TLPCONV15 Pickups and large vans, Conventional - 2015 500 23.4 19.94 19.94 20.69 21.01 21.30 21.50 21.50 21.50 21.50 TLPCONV20 Pickups and large vans, Conventional - 2020 500 24.2 19.94 19.94 20.69 21.01 21.30 21.50 21.50 21.50 21.50 TLPCONV25 Pickups and large vans, Conventional - 2025 500 24.2 19.94 19.94 20.69 21.01 21.30 21.50 21.50 21.50 21.50 TLPCONV30 Pickups and large vans, Conventional - 2030 500 24.2 19.94 19.94 20.69 21.01 21.30 21.50 21.50 21.50 21.50 TLPCONV35 Pickups and large vans, Conventional - 2035 500 24.2 19.94 19.94 20.69 21.01 21.30 21.50 21.50 21.50 21.50 TLPMMPG10 Pickups and large vans, Moderate MPG - 2010 500 31.0 0.00 0.00 0.00 22.38 22.68 22.90 22.90 22.90 22.90 TLPMMPG15 Pickups and large vans, Moderate MPG - 2015 500 32.1 0.00 0.00 0.00 21.96 22.26 22.47 22.90 22.90 22.90
continued
118

Capital Costs FIXOM EFF (Thousands of 1999$/vehicle) (1999$/vehicle) (mpg) 1995 2000 2005 2010 2015 2020 2025 2030 2035 TLPMMPG20 Pickups and large vans, Moderate MPG - 2020 500 33.1 0.00 0.00 0.00 22.00 22.30 22.51 22.90 22.90 22.90 TLPMMPG25 Pickups and large vans, Moderate MPG - 2025 500 33.1 0.00 0.00 0.00 0.00 0.00 0.00 22.90 22.90 22.90 TLPMMPG30 Pickups and large vans, Moderate MPG - 2030 500 33.1 0.00 0.00 0.00 0.00 0.00 0.00 22.90 22.90 22.90 TLPMMPG35 Pickups and large vans, Moderate MPG - 2035 500 33.1 0.00 0.00 0.00 22.65 22.96 23.18 22.90 22.90 22.90 TLPAMPG10 Pickups and large vans, Advanced MPG - 2010 500 36.5 0.00 0.00 0.00 23.07 23.39 23.61 23.61 23.61 23.61 TLPAMPG15 Pickups and large vans, Advanced MPG - 2015 500 37.7 0.00 0.00 0.00 22.38 22.68 22.90 23.61 23.61 23.61 TLPAMPG20 Pickups and large vans, Advanced MPG - 2020 500 38.9 0.00 0.00 0.00 22.48 22.79 23.01 23.61 23.61 23.61 TLPAMPG25 Pickups and large vans, Advanced MPG - 2025 500 38.9 0.00 0.00 0.00 0.00 0.00 0.00 23.61 23.61 23.61 TLPAMPG30 Pickups and large vans, Advanced MPG - 2030 500 38.9 0.00 0.00 0.00 0.00 0.00 0.00 23.61 23.61 23.61 TLPAMPG35 Pickups and large vans, Advanced MPG - 2035 500 38.9 0.00 0.00 0.00 23.34 23.62 23.80 23.61 23.61 23.61 TLPADSL05 Pickups and large vans, Advanced diesel - 2005 500 30.5 0.00 0.00 22.28 22.49 22.79 23.01 23.01 23.01 23.01 TLPADSL10 Pickups and large vans, Advanced diesel - 2010 500 31.7 0.00 0.00 22.28 22.49 22.79 23.01 23.01 23.01 23.01 TLPADSL15 Pickups and large vans, Advanced diesel - 2015 500 32.8 0.00 0.00 22.28 22.49 22.79 23.01 23.01 23.01 23.01 TLPADSL20 Pickups and large vans, Advanced diesel - 2020 500 33.8 0.00 0.00 22.28 22.49 22.79 23.01 23.01 23.01 23.01 TLPADSL25 Pickups and large vans, Advanced diesel - 2025 500 33.8 0.00 0.00 22.28 22.49 22.79 23.01 23.01 23.01 23.01 TLPADSL30 Pickups and large vans, Advanced diesel - 2030 500 33.8 0.00 0.00 22.28 22.49 22.79 23.01 23.01 23.01 23.01 TLPADSL35 Pickups and large vans, Advanced diesel - 2035 500 33.8 0.00 0.00 22.28 22.49 22.79 23.01 23.01 23.01 23.01 TLPETHX05 Pickups and large vans, Flex Ethanol - 2005 500 21.8 0.00 0.00 20.90 21.22 21.51 21.72 21.72 21.72 21.72 TLPETHX10 Pickups and large vans, Flex Ethanol - 2010 500 22.7 0.00 0.00 20.90 21.22 21.51 21.72 21.72 21.72 21.72 TLPETHX20 Pickups and large vans, Flex Ethanol - 2020 500 24.2 0.00 0.00 20.90 21.22 21.51 21.72 21.72 21.72 21.72 TLPFCH15 Pickups and large vans, Fuel cell-Hydrogen - 2015 525 51.3 0.00 0.00 0.00 0.00 27.91 26.88 24.73 24.73 24.73 TLPFCH20 Pickups and large vans, Fuel cell-Hydrogen - 2020 525 60.4 0.00 0.00 0.00 0.00 27.91 26.88 24.73 24.73 24.73 TLPFCH25 Pickups and large vans, Fuel cell-Hydrogen - 2025 525 72.5 0.00 0.00 0.00 0.00 27.91 26.88 24.73 24.73 24.73 TLPCNG05 Pickups and large vans, CNG dedicated - 2005 450 21.8 0.00 0.00 22.76 23.12 23.43 23.65 23.65 23.65 23.65 TLPCNG15 Pickups and large vans, CNG dedicated - 2015 450 23.4 0.00 0.00 22.76 23.12 23.43 23.65 23.65 23.65 23.65 TLPELC05 Pickups and large vans, Electric - 2005 300 87.3 0.00 0.00 55.86 39.93 31.94 32.26 32.26 32.26 32.26 TLPELC15 Pickups and large vans, Electric - 2015 300 93.7 0.00 0.00 55.86 39.93 31.94 32.26 32.26 32.26 32.26 TLPELC25 Pickups and large vans, Electric - 2025 300 96.6 0.00 0.00 55.86 39.93 31.94 32.26 32.26 32.26 32.26 TLP2HYB10 Pickups and large vans, Hybrid (2X) - 2010 525 37.9 0.00 0.00 0.00 24.90 24.49 23.53 22.58 22.58 22.58 TLP2HYB15 Pickups and large vans, Hybrid (2X) - 2015 525 41.0 0.00 0.00 0.00 24.90 24.49 23.53 22.58 22.58 22.58 TLP2HYB20 Pickups and large vans, Hybrid (2X) - 2020 525 45.3 0.00 0.00 0.00 24.90 24.49 23.53 22.58 22.58 22.58 TLP2HYB25 Pickups and large vans, Hybrid (2X) - 2025 525 48.3 0.00 0.00 0.00 24.90 24.49 23.53 22.58 22.58 22.58 TLP2HYB30 Pickups and large vans, Hybrid (2X) - 2030 525 48.3 0.00 0.00 0.00 24.90 24.49 23.53 22.58 22.58 22.58 TLP2HYB35 Pickups and large vans, Hybrid (2X) - 2035 525 48.3 0.00 0.00 0.00 24.90 24.49 23.53 22.58 22.58 22.58 TLP3HYB20 Pickups and large vans, Hybrid (3X) - 2020 525 59.1 0.00 0.00 0.00 0.00 0.00 25.34 23.65 23.65 23.65 TLP3HYB25 Pickups and large vans, Hybrid (3X) - 2025 525 72.5 0.00 0.00 0.00 0.00 0.00 25.34 23.65 23.65 23.65 TLP3HYB30 Pickups and large vans, Hybrid (3X) - 2030 525 72.5 0.00 0.00 0.00 0.00 0.00 25.34 23.65 23.65 23.65 TLP3HYB35 Pickups and large vans, Hybrid (3X) - 2035 525 72.5 0.00 0.00 0.00 0.00 0.00 25.34 23.65 23.65 23.65 TLPMTHX00 Pickups and large vans, Flex Methanol - 2000 500 21.5 22.30 22.30 23.05 23.34 23.64 23.85 23.85 23.85 23.85
continued
119

Capital Costs FIXOM EFF (Thousands of 1999$/vehicle) (1999$/vehicle) (mpg) 1995 2000 2005 2010 2015 2020 2025 2030 2035 TLPMTHX10 Pickups and large vans, Flex Methanol - 2010 500 23.3 22.30 22.30 23.05 23.34 23.64 23.85 23.85 23.85 23.85 TLPMTHX20 Pickups and large vans, Flex Methanol - 2020 500 24.8 22.30 22.30 23.05 23.34 23.64 23.85 23.85 23.85 23.85 TLPCNGX00 Pickups and large vans. CNG Bi-fuel - 2000 450 20.9 24.65 24.65 25.47 25.88 26.35 26.65 26.65 26.65 26.65 TLPCNGX10 Pickups and large vans. CNG Bi-fuel - 2010 450 22.2 24.65 24.65 25.47 25.88 26.35 26.65 26.65 26.65 26.65 TLPCNGX20 Pickups and large vans. CNG Bi-fuel - 2020 450 23.1 24.65 24.65 25.47 25.88 26.35 26.65 26.65 26.65 26.65 TLPLPGX00 Pickups and large vans, LPG Bi-fuel -2000 450 21.0 24.53 24.53 25.32 25.69 26.09 26.32 26.32 26.32 26.32 TLPLPGX10 Pickups and large vans, LPG Bi-fuel -2010 450 22.5 24.53 24.53 25.32 25.69 26.09 26.32 26.32 26.32 26.32 TLPLPGX20 Pickups and large vans, LPG Bi-fuel -2020 450 23.7 24.53 24.53 25.32 25.69 26.09 26.32 26.32 26.32 26.32 TLPFCM10 Pickups and large vans, Fuel Cell Methanol - 2010 525 40.6 0.00 0.00 0.00 29.21 29.13 29.03 29.03 29.03 29.03 TLPFCM20 Pickups and large vans, Fuel Cell Methanol - 2020 525 48.3 0.00 0.00 0.00 29.21 29.13 29.03 29.03 29.03 29.03
TRANSPORTATION – OTHER
START LIFE INVCOST FIXOM EFF (1999$/vehicle) (1999$/vehicle) (mpg) THDSL00 Truck, Heavy, Diesel - 2000 1995 29 133311 6667 6.0 THDSL20P00 Truck, Heavy, Diesel + 20% MPG - 2000 2000 29 134213 6712 7.2 THDSL40P00 Truck, Heavy, Diesel + 40% MPG - 2000 2005 29 136919 6845 8.4 THEDSL Truck, Heavy, Existing Diesel Fleet 1995 29 133311 6667 5.6 THGSL Truck, Heavy, Gasoline 1995 29 133311 6667 6.0 THEGSL Truck, Heavy, Existing Gasoline Fleet 1995 29 133311 6667 5.6 THCNG Truck, Heavy, Compressed Natural Gas 1995 29 133311 6667 5.6 THALC Truck, Heavy, Alcohol Fuel 1995 29 133311 6667 5.6 THLPG Truck, Heavy, LPG 1995 29 133311 6667 5.6 THDSL10 Truck, Heavy, Diesel - 2010 2010 29 135023 6750 6.4 THDSL10P10 Truck, Heavy, Diesel + 10% MPG - 2010 2010 29 138654 6932 7.0 THDSL20P10 Truck, Heavy, Diesel + 20% MPG - 2010 2010 29 144291 7216 7.7 THDSL20 Truck, Heavy, Diesel - 2020 2020 29 139086 6956 6.9 THDSL10P20 Truck, Heavy, Diesel + 10% MPG - 2020 2020 29 145173 7258 7.6 THDSL20P20 Truck, Heavy, Diesel + 20% MPG - 2020 2020 29 153425 7673 8.3
continued
120

START LIFE INVCOST FIXOM EFF (1999$/vehicle) (1999$/vehicle) (mpg) TBGSL Bus, Gasoline 1995 15 134717 6736 6.1 TBGSL10P Bus, Gasoline + 10% MPG 2000 15 161667 8083 7.3 TBGSL20P Bus, Gasoline + 20% MPG 2005 15 188601 9431 8.6 TBEGSL Bus, Existing Gasoline Fleet 1995 15 134717 6736 6.1 TBDSL Bus, Diesel 1995 15 134717 6736 6.7 TBDSL10P Bus, Diesel + 10% MPG 2000 15 161667 8083 8.0 TBDSL20P Bus, Diesel + 20% MPG 2005 15 188601 9431 9.5 TBEDSL Bus, Existing Diesel Fleet 1995 15 134717 6736 6.7 TBCNG Bus, Compressed Natural Gas 1995 15 134717 6736 6.1 TBALC Bus, Alcohol Fuel 1995 15 134717 6736 4.0
INDUSTRIAL SECTOR
RESID FIXOM INVCOST LIFE PJ/a 95million$/PJ/a 95million$/PJ/a yrs IECHELC095 149.0178738 1 10 30 IEISELC095 8.636712775 17.80524207 144.7271013 30 IELPELC095 0 0 0 30 IENFELC095 360.6244699 5.280005828 81.47506288 30 IENMELC095 0 0 0 30 IEOIELC095 83.233584 0 0 30 IMCHCOA095 0 0.55 25.64060403 20 IMCHDST095 0 0.55 1.824540844 20 IMCHELC095 2316.163525 0.7425 2.46313014 20 IMCHHFO095 0 0.66 2.189449013 20 IMCHLPG095 0 1 10 20 IMCHNGA095 272.8648467 1 10 20 IMISCOA095 0 0.55 28.48956003 20 IMISDST095 0 2.564060403 25.64060403 20 IMISELC095 436.6721979 0.182454084 1.824540844 20 IMISHFO095 0 1 10 20 IMISLPG095 0 1 10 20 IMISNGA095 8.392043243 2.848956003 28.48956003 20 IMLPDST095 0 2.564060403 25.64060403 20 IMLPELC095 1733.695265 0.182454084 1.824540844 20 IMLPHFO095 0 1 10 20 IMLPNGA095 74.3008107 2.848956003 28.48956003 20 IMNFDST095 0 2.564060403 25.64060403 20 IMNFELC095 33.35255213 0.182454084 1.824540844 20
continued
121

RESID FIXOM INVCOST LIFE PJ/a 95million$/PJ/a 95million$/PJ/a yrs IMNFHFO095 0 1 10 20 IMNFLPG095 0 2.848956003 28.48956003 20 IMNMDST095 0 2.564060403 25.64060403 20 IMNMELC095 398.415888 0.182454084 1.824540844 20 IMNMHFO095 0 1 10 20 IMNMNGA095 40.31251601 2.848956003 28.48956003 20 IMOIDST095 302.1947616 2.564060403 25.64060403 20 IMOIELC095 4661.080704 0.182454084 1.824540844 20 IMOIHFO095 0 1 10 20 IMOILPG095 9.7384968 1 10 20 IMOINGA095 227.1881068 2.848956003 28.48956003 20 IOCHBIO095 0 0.532883935 3.086336814 30 IOCHCOA095 0 0.532883935 3.086336814 30 IOCHCOK095 0 0.532883935 3.086336814 30 IOCHDST095 250.08 0.532883935 2.939368394 30 IOCHELC095 172.4349683 0.435995946 2.777703132 30 IOCHETH095 0 0.532883935 3.086336814 30 IOCHHFO095 141.52 0.532883935 3.086336814 30 IOCHLPG095 0 0.435995946 2.658792759 30 IOCHNAP095 0 0.532883935 3.086336814 30 IOCHNGA095 1585.80828 0.479595541 2.658792759 30 IOISBFG095 191.8548765 0.532883935 3.256085339 30 IOISBIO095 0 0.532883935 3.086336814 30 IOISCOA095 0 0.532883935 3.256085339 30 IOISDST095 4.106666667 0.532883935 3.256085339 30 IOISELC095 34.5468511 0.479595541 2.805026361 30 IOISHFO095 43.74 0.532883935 3.256085339 30 IOISNGA095 69.49660811 0.532883935 3.101033656 30 IOLPBIO095 809.8652844 1.332209836 3.517353333 30 IOLPCOA095 167.2779209 1.332209836 3.517353333 30 IOLPCOK095 0 1.332209836 3.517353333 30 IOLPDST095 73.9648 0.532883935 2.791550265 30 IOLPELC095 63.7387965 0.343960653 2.29307102 30 IOLPHFO095 193.5576 0.532883935 2.931127778 30 IOLPLPG095 11.042685 0.479595541 2.522378122 30 IOLPNGA095 1082.980754 0.479595541 2.522378122 30 IONFBIO095 0 0.532883935 3.086336814 30 IONFCOA095 0 0.308633681 3.086336814 30 IONFCOK095 0 0.308633681 3.086336814 30 IONFDST095 61.49333333 0.293936839 2.939368394 30
continued
122

RESID FIXOM INVCOST LIFE PJ/a 95million$/PJ/a 95million$/PJ/a yrs IONFELC095 10.42267254 0.370360418 3.703604177 30 IONFHFO095 0 0.308633681 3.086336814 30 IONFNGA095 22.087975 0.265879276 2.658792759 30 IONMBIO095 0 0.532883935 3.086336814 30 IONMCOA095 229.3279507 0.532883935 3.708288202 30 IONMCOK095 0 0.532883935 3.708288202 30 IONMDST095 17.728 0.532883935 3.53170305 30 IONMELC095 15.25101468 0.437088148 2.913920989 30 IONMHFO095 0 0.532883935 3.708288202 30 IONMLPG095 3.7942875 0.479595541 3.205313088 30 IONMNGA095 46.19142459 0.479595541 3.205313088 30 IOOIBIO095 1413.273181 0.532883935 3.086336814 30 IOOICOA095 229.0242978 1.332209836 3.703604177 30 IOOICOK095 0 1.332209836 3.703604177 30 IOOIDST095 314.78621 0.532883935 2.939368394 30 IOOIELC095 312.12594 0.506239738 2.932019973 30 IOOIHFO095 195.12 0.532883935 3.086336814 30 IOOILPG095 18.2596815 0.479595541 2.658792759 30 IOOINGA095 2768.855051 0.479595541 2.658792759 30 IOOIPTC095 0 1.332209836 3.703604177 30 IPCHCOA095 0 0.55 3.438622354 30 IPCHCOK095 0 0.55 3.438622354 30 IPCHDST095 0 0.55 3.118931841 30 IPCHELC095 44.70536215 0.55 3.111134511 30 IPCHHFO095 0 0.55 3.274878433 30 IPCHLPG095 0 0.55 2.947390589 30 IPCHNGA095 1394.934072 0.55 2.947390589 30 IPISBFG095 82.2235185 2.637627067 20.9512423 30 IPISCOA095 44.4481155 2.637627067 20.9512423 30 IPISDST095 1.026666667 2.392405503 19.00339438 30 IPISELC095 134.7327193 2.386424489 18.95588589 30 IPISHFO095 8.1 2.512025778 19.9535641 30 IPISLPG095 4.867155 0.55 5.5 30 IPISNGA095 519.2576757 2.2608232 17.95820769 30 IPLPBIO095 0 5.426002005 122.9897887 30 IPLPCOA095 0 5.426002005 122.9897887 30 IPLPDST095 0 4.921543769 111.5553639 30 IPLPELC095 31.86939825 4.909239909 111.2764755 30 IPLPHFO095 28.9224 5.167620957 117.1331321 30 IPLPLPG095 0 4.650858861 105.4198189 30 IPLPNGA095 133.2770792 4.650858861 105.4198189 30
continued
123

RESID FIXOM INVCOST LIFE PJ/a 95million$/PJ/a 95million$/PJ/a yrs IPNFCOA095 0 23.52764423 235.2764423 30 IPNFCOK095 0 23.52764423 235.2764423 30 IPNFDST095 15.37333333 21.34026688 213.4026688 30 IPNFELC095 0 21.28691621 212.8691621 30 IPNFHFO095 0 22.40728022 224.0728022 30 IPNFLPG095 4.60548 0.4 201.665522 30 IPNFNGA095 375.495575 20.1665522 201.665522 30 IPNMCOA095 767.7500957 3.362440329 37.36044811 30 IPNMCOK095 0 3.362440329 37.36044811 30 IPNMDST095 141.824 3.049832498 33.88702776 30 IPNMELC095 24.900993 3.042207917 33.80231019 30 IPNMHFO095 9.68 3.202324123 35.58137915 30 IPNMLPG095 3.7942875 2.882091711 32.02324123 30 IPNMNGA095 516.5041114 2.882091711 32.02324123 30 IPNMPTC095 0 3.362440329 37.36044811 30 IPOICOA095 0 2.23001031 22.0998663 30 IPOICOK095 0 2.23001031 22.0998663 30 IPOIDST095 157.393105 2.022685088 20.0452302 30 IPOIELC095 208.08396 2.017628376 19.99511713 30 IPOIHFO095 0 2.123819343 21.04749171 30 IPOILPG095 30.4328025 1.911437408 18.94274254 30 IPOINGA095 709.9628336 1.911437408 18.94274254 30 ISCHCOA095 213.21279 0.55 3.703604177 30 ISCHDST095 0 0.55 2.939368394 30 ISCHELC095 17.03061415 0.55 2.777703132 30 ISCHHFO095 0 0.55 3.086336814 30 ISCHNGA095 1077.247676 0.55 2.658792759 30 ISISBFG095 0 1.332209836 3.907302406 30 ISISCOA095 2.3393745 1.332209836 3.907302406 30 ISISDST095 1.026666667 0.532883935 3.101033656 30 ISISHFO095 2.16 0.532883935 3.256085339 30 ISISNGA095 87.8542027 0.479595541 2.805026361 30 ISLPBIO095 0 4.157909991 13.85969997 30 ISLPCOA095 14.54590616 1.332209836 3.517353333 30 ISLPDST095 7.3152 0.532883935 2.791550265 30 ISLPELC095 0 0.343960653 2.29307102 30 ISLPHFO095 0 0.532883935 2.931127778 30 ISLPNGA095 93.29395544 0.479595541 2.522378122 30 ISNFCOA095 0 1.332209836 3.703604177 30 ISNFDST095 15.37333333 0.532883935 2.939368394 30 ISNFHFO095 0 0.532883935 3.086336814 30
continued
124

RESID FIXOM INVCOST LIFE PJ/a 95million$/PJ/a 95million$/PJ/a yrs ISNFNGA095 44.17595 0.479595541 2.658792759 30 ISNMCOA095 0 1.332209836 4.449945842 30 ISNMDST095 17.728 0.532883935 3.53170305 30 ISNMELC095 1.349647317 0.437088148 2.913920989 30 ISNMHFO095 0 0.532883935 3.708288202 30 ISNMNGA095 27.99480278 0.479595541 3.205313088 30 ISOICOA095 28.30637388 1.332209836 3.703604177 30 ISOIDST095 220.350347 0.532883935 2.939368394 30 ISOIELC095 20.808396 0.506239738 2.932019973 30 ISOIHFO095 0 0.532883935 3.086336814 30 ISOILPG095 9.12984075 0.479595541 2.658792759 30 ISOINGA095 0 0.479595541 2.658792759 30
INDUSTRIAL COGEN
LIFE RESID yrs gw EAELCBFG00 50 0.0244618 EAELCBIO00 50 3.9328115 EAELCCOA00 50 1.4758643 EAELCCOK00 50 0 EAELCETH00 50 0 EAELCHFO00 50 0.2349967 EAELCLPG00 50 0 EAELCNAP00 50 0 EAELCNGA00 50 2.0622962 EAELCOIL00 50 0 EAELCPTC00 50 0 EAUTELC00 50 3.0631115 ESTMBFG000 25 0.3937748 ESTMBIO000 25 59.970291 ESTMCOA000 25 9.2036518 ESTMCOK000 25 0 ESTMETH000 25 0 ESTMHFO000 25 0 ESTMLPG000 25 0 ESTMNAP000 25 0 ESTMNGA000 25 30.996367 ESTMOIL000 25 0 ESTMPTC000 25 0
125

126

127
Appendix CPeer Review Comments and Responses
128
General and DocumentationCOMMENT: Update data and calibration on a regular ba-sis (every 2 years) and adjust the starting year from 1995to 2000.RESPONSE: The model is currently being updated from2002 NEMS data to 2005 NEMS data, with the model timeframe running from 2000 to 2040. Once this is complete,the model data will be updated and the model will berecalibrated every 2 years.
COMMENT: Growth bounds should be imposed on majortechnologiesRESPONSE: In our base model we are attempting to con-strain the model runs as little as possible. In certain caseswe have bound the growth of classes of technologies; forexample, car classes are constrained over the model timehorizon so that subcompact cars do not take over the wholesector. We have also implemented constraints in the elec-tric sector to keep IGCC plants from coming on too fast.Where appropriate, as we do technology assessment, wewill add constraints to certain technologies based on ourresearch results. Current model runs with a minimum ofconstraints calibrate well to the AEO 2002.
COMMENT: Include nuclear energy supply in primaryenergy tables so that there will be proper accounting in thetotal primary energy supply tables in ANSWER.RESPONSE: Nuclear tracking has been added to the pri-mary energy supply table.
COMMENT: Documentation• Provide link to ETSAP’s MARKAL documentation
web page to our documentation• Add “systems and software” requirements section• Add data summaries as an appendix• Correct table numbering errors• Too much variation in style
RESPONSE: Corrected and improved document accord-ing to comments.
COMMENT: In certain model run, the model is importinga large volume of electricity.RESPONSE: Our imported electricity is represented inthree cost steps with three import technologies. In addi-tion, we have a dummy imported electricity technology inthe model which is used to debug any problems. It wasfound that the cost was set too low on this dummy technol-ogy, and under certain emissions constraints the model wasusing a large volume of this dummy import. We reset the
cost to a much higher value, causing the model to stopimporting this resource.
COMMENT: The SOX limit is set at 4,500 thousand met-ric tons after 2010. What is the basis for this limit?RESPONSE: This limit is based on the CAAA90 (CleanAir Amendment Acts of 1990).
Electric SectorCOMMENT: Existing steam coal capacity is, on average,dispatched at a very low rate.RESPONSE: We have since done a major overhaul ofour representation of the existing steam coal technologieswhich has resulted in the model now dispatching these tech-nologies at an appropriate rate. We found two main causesfor the low dispatch which we have since resolved.
1 We had residual capacity for existing steam electrictechnologies, but not for the retrofit technologies thatwere needed to minimize the NOX and SOX emissions.In order for the model to utilize these retrofits, it washaving to pay the capital costs, and thus, it was findingother electric generation technologies more cost effec-tive. Our model now includes residual capacity for boththe existing steam electric plants and their retrofits.
2 Our representation of the existing steam electric plantretrofits was very limited. Our model now includes awide variety of retrofit options along with the appro-priate residual capacities and costs.
COMMENT: Results lean towards baseload generatingtechnologies in meeting seasonal demands.RESPONSE: This is a weakness of MARKAL in gen-eral; the limitation to 6 time slices tends to wash out sea-sonal demands. One option we considered was to treat theseasonal/day-night slices in MARKAL as slabs of a loadduration curve. Instead, we have decided to push develop-ment in MARKAL to include more time slices, in order tobetter capture the variation in dispatch associated with sea-son and time of day.
COMMENT: Not clear how FR(z)(y) electricity shape loaddata were derivedRESPONSE: The current electricity load data were fromthe original 1997 DOE database. However, with the ex-pansion of time slices in MARKAL, we will be mappingNEMS demand data into the new MARKAL time slices.At that time, we will carefully assess different ways to per-form this NEMS to MARKAL data mapping.

129
COMMENT: There are no carbon sequestering technolo-gies.RESPONSE: Carbon sequestration was not a focus ofour base model development. We are currently doing anintensive technology assessment of the electric sector, andin that assessment carbon sequestration will be closelylooked at and added as an alternative scenario to our basescenario.
Demand SideCOMMENT: Use the EFF_I (efficiency tied to investmentvintage) parameter for end-use technologies.RESPONSE: This parameter would help to minimize thenumber of technologies needed to represent different effi-ciencies of the same technology type, mainly in the trans-portation sector where we have a different technology foreach time period. The problem with using EFF_I in thiscase is although it ties efficiency to investment vintage, itdoes not tie emissions, which change over time. If we werecounting our emissions at the fuel level, this would not bea problem, but we account for emissions at the technologylevel. Therefore, EFF_I would not be useful.
COMMENT: Reduce the level of technology detail in mi-nor energy demands in the Commercial Sector.RESPONSE: We had a large variety of technologieswithin the smaller Commercial sub-demands that werecompeting with each other inappropriately. For example,Walk-In Freezers were competing with Ice Machines tomeet the Commercial Freezing demand. We have sinceimplemented constraints that line up with the AEO distrib-uted results for each sub-demand area. In our example, wenow have various Walk-In Freezers competing against eachother for the share of Freezing demand that the AEO saysis met by Walk-In Freezers only. We have implementedthese constraints in the following sub-demands: Lighting,Refrigeration, Freezing, Cooking, and Ventillation.
COMMENT: The Residential and Commercial shell/con-servation packages are not modeled in the database. Whileimprovements in new and existing building shells over timemay be implicit in the specification of the service demands,it may be more transparent to represent them separatelyand allow the model to endogenously respond to changesin fuel prices.RESPONSE: As stated in the reviewers comment, thebuilding shell improvements are implicit in the calculationof the service demands. As the Residential and Commer-cial sectors are not our areas of focus for our current tech-
nology assessment, we prefer to keep the model as is. Wewill look into this in future model development.
COMMENT: Add compact fluorescent lighting in the resi-dential sectorRESPONSE: Our model currently represents three typesof residential lighting: incandescent, baseline fluorescent,and electric ballast fluorescent. The data for these tech-nologies came from the 1997 DOE MARKAL model. Infuture model development, we will develop more up-to-date technology representations for Residential Lighting
COMMENT: Investigate sources other than NEMS/AEOfor emerging technologiesRESPONSE: Our base model is set up primarily usingdata from the NEMS AEO. As we do in-depth technologyassessment, alternative data sources are investigated andused. This is evidenced in our hydrogen fuel cell technol-ogy assessment in the transportation sector, where the bulkof the hydrogen data came from sources other than the AEO.
Supply SideCOMMENT: Examine reducing the number of coal sup-ply steps for the single region model or including appro-priate coal delivery costs to enable the different coal sup-ply regions to correctly compete.RESPONSE: We are developing the coal delivery coststo input into our model.
COMMENT: Increase the number of supply steps for natu-ral gas, both domestic and importRESPONSE: The data we currently have available to uslimit the number of supply steps we are able to develop fornatural gas. Our future model development includes in-vesting the resources needed to develop better supply steprepresentations for natural gas and renewables.
COMMENT: Expand representation of renewable genera-tion technologies
• Geothermal: no capacity or growth constraints• Wind resources: low average capacity factors, is the
set of technologies to smallRESPONSE: We are in the process of updating and re-viewing our representation of renewables. We are investi-gating novel techniques for representing intermittentrenewables coupled with storage in MARKAL. In addi-tion, we are reviewing and updating the geothermal andbiomass resource supply.
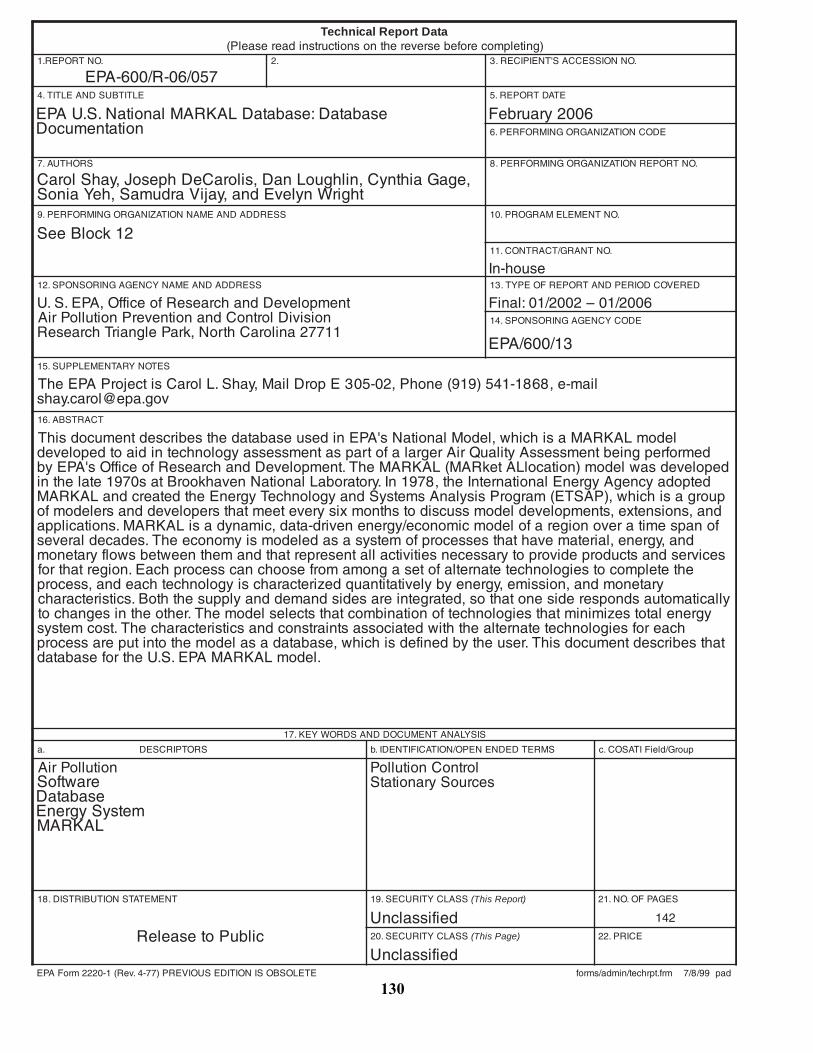
130
ataDtropeRlacinhceT)gnitelpmocerofebesreverehtnosnoitcurtsnidaeresaelP(
.ONTROPER.1 .2 .ONNOISSECCAS'TNEIPICER.3
750/60-R/006-APEELTITBUSDNAELTIT.4 ETADTROPER.5
esabataD:esabataDLAKRAMlanoitaN.S.UAPEnoitatnemucoD
6002yraurbeFEDOCNOITAZINAGROGNIMROFREP.6
SROHTUA.7 .ONTROPERNOITAZINAGROGNIMROFREP.8
,egaGaihtnyC,nilhguoLnaD,siloraCeDhpesoJ,yahSloraCthgirWnylevEdna,yajiVardumaS,heYainoS
SSERDDADNAEMANNOITAZINAGROGNIMROFREP.9 .ONTNEMELEMARGORP.01
21kcolBeeS.ONTNARG/TCARTNOC.11
esuoh-nISSERDDADNAEMANYCNEGAGNIROSNOPS.21 DEREVOCDOIREPDNATROPERFOEPYT.31
tnempoleveDdnahcraeseRfoeciffO,APE.S.UnoisiviDlortnoCdnanoitneverPnoitulloPriA
11772aniloraChtroN,kraPelgnairThcraeseR
6002/10–2002/10:laniFEDOCYCNEGAGNIROSNOPS.41
31/006/APESETONYRATNEMELPPUS.51
liam-e,8681-145)919(enohP,20-503EporDliaM,[email protected]
TCARTSBA.61
ledomLAKRAMasihcihw,ledoMlanoitaNs'APEnidesuesabatadehtsebircsedtnemucodsihTdemrofrepgniebtnemssessAytilauQriAregralafotrapsatnemssessaygolonhcetnidiaotdepoleved
depolevedsawledom)noitacolLAtekRAM(LAKRAMehT.tnempoleveDdnahcraeseRfoeciffOs'APEybdetpodaycnegAygrenElanoitanretnIeht,8791nI.yrotarobaLlanoitaNnevahkoorBtas0791etalehtni
puorgasihcihw,)PASTE(margorPsisylanAsmetsySdnaygolonhceTygrenEehtdetaercdnaLAKRAMdna,snoisnetxe,stnempolevedledomssucsidotshtnomxisyreveteemtahtsrepoleveddnasreledomfofonapsemitarevonoigerafoledomcimonoce/ygrenenevird-atad,cimanydasiLAKRAM.snoitacilppa
dna,ygrene,lairetamevahtahtsessecorpfometsysasadeledomsiymonoceehT.sedacedlarevessecivresdnastcudorpedivorpotyrassecenseitivitcallatneserpertahtdnamehtneewtebswolfyratenom
ehtetelpmocotseigolonhcetetanretlafotesagnomamorfesoohcnacssecorphcaE.noigertahtrofyratenomdna,noissime,ygreneybylevitatitnauqdeziretcarahcsiygolonhcethcaedna,ssecorp
yllacitamotuasdnopseredisenotahtos,detargetnierasedisdnameddnaylppusehthtoB.scitsiretcarahcygrenelatotseziminimtahtseigolonhcetfonoitanibmoctahtstcelesledomehT.rehtoehtnisegnahcot
hcaerofseigolonhcetetanretlaehthtiwdetaicossastniartsnocdnascitsiretcarahcehT.tsocmetsystahtsebircsedtnemucodsihT.resuehtybdenifedsihcihw,esabatadasaledomehtotnituperassecorp
.ledomLAKRAMAPE.S.Uehtrofesabatad
SISYLANATNEMUCODDNASDROWYEK.71
SROTPIRCSED.a SMRETDEDNENEPO/NOITACIFITNEDI.b puorG/dleiFITASOC.c
noitulloPriAerawtfoSesabataD
metsySygrenELAKRAM
lortnoCnoitulloPsecruoSyranoitatS
TNEMETATSNOITUBIRTSID.81 SSALCYTIRUCES.91 )tropeRsihT( SEGAPFO.ON.12
cilbuPotesaeleRdeifissalcnU 241
SSALCYTIRUCES.02 )egaPsihT( ECIRP.22
deifissalcnUETELOSBOSINOITIDESUOIVERP)77-4.veR(1-0222mroFAPE dap99/8/7mrf.tprhcet/nimda/smrof