epa pbt monitoring workshop a noaa perspective? richard s. artz and jawed hameedi national oceanic...
TRANSCRIPT

EPA PBT MONITORING WORKSHOP
A NOAA PERSPECTIVE?
Richard S. Artz and Jawed Hameedi
National Oceanic and Atmospheric Administration
Silver Spring, Maryland
NOAA Generally Subscribes to a Multi-Tier Measurement Philosophy to Fuel a Targeted Modeling Program
– Intensive measurements– Routine measurements– Remote sensing– Closely coupled with NWS– One member of a large partnership

Interagency and International Cooperation
• Major ions– NADP– CASTNet
• International Joint Commission
• North American Commission for Environmental Cooperation
• International POPs Treaty
Particulate Sulfate Concentrations
1997-1999

Atmospheric Program• Most NOAA air toxics programs are housed in
one of the six divisions of the Air Resources Lab or at the Climate Monitoring and Diagnostics Lab
• ARL Atmospheric Sciences and Modeling Division program is driven by EPA
• ARL HQ and Atmospheric Turbulence and Diffusion Divisions provide surface and aircraft deposition technology to multiple agencies
• Several ARL divisions simulate transport and deposition of toxics using various meteorological modeling tools

NOAA / CMDL Baseline Measurement Sites

ARL/ATDD Relaxed Eddy Accumulation
Direct measurements of DRY DEPOSITION for Ammonia, Mercury, and potentially anything that can
be measured using filters or denuders
0.0
0.5
1.0
1.5
2.0
2.5
0:00 6:00 12:00 18:00 0:00
Time (March 17, 2000)
Hg
0 (n
g/m
3 )
UV
-B (
ce
nti
wa
tt/m
2 )
0
100
200
300
400
500
RG
M (p
g/m
3)
UV-B
Hg°
RGM

Type DeHavilland DHC-6 Twin Otter Series 300Ceiling 7500 m; 3500 m this studyCruise Speed 55 m/sScientific Payload 1100 kgElectrical (2) 250A Starter GeneratorsScientific Power 3KVA @ 115VAC/60 Hz; 70A@ 28VDCCrew 2 Flight, 3-4 ScientificEndurance 4.5 Hours with VFR Reserves
EPA Measurements of Mercury on the NOAA Twin Otter
Species Method LODResponse
Time
Hg0 Cold Vapor AtomicFluorescence (CVAS) 0.5 ng m-3 5 min
RGM Denuder/CVAS 5 pg m-3 90 min
p-Hg Filter/CVAS 5 pg m-3 90 min
An Airborne Investigation of Local and Regional Sources of Atmospheric Mercury Deposition to the Everglades
NOAA DeHavilland Twin Otter Aircraft

Atmospheric Sciences Modeling Division • Modeling effort driven by National Air Toxic
Assessments addressing human health issues• Fate and transport simulated using CMAQ Chemical
Transport Model– Atrazine– 17 dioxins and furans– Benzene– Mercury– Formaldehyde/acetaldehyde
• Neighborhood Scale– Linking emissions-based models with ambient and exposure
monitors as inputs to human exposure models at ~1 km.– Involves collaboration with ARL/ATDD LESchem system

EPA\OAQPS List of the 33 Urban Air Toxics• acetaldehyde• acrolein• acrylonitrile• arsenic compounds• benzene• beryllium Compounds • 1,3- butadiene• cadmium Compounds• carbon tetrachloride• chloroform• chromium compounds• coke oven emissions• dioxin• ethylene dibromide• propylene dichloride• 1,3-dichloropropene• ethylene dichloride
• ethylene oxide
• formaldehyde
• hexachlorobenzene
• hydrazine
• lead compounds
• manganese compounds
• mercury compounds
• methylene chloride
• nickel compounds
• polychlorinated biphenyls
• polycyclic organic matter
• puinoline
• 1,1,2,2-tetrachloroethane
• perchlorethylene
• vinyl chloride

ARL/HQ READY System
Real-time Environmental Applications and Display sYstem
www.arl.noaa.gov/ready.htmlHYSPLIT transport and dispersion modelMeteorological data (forecast/archive)Air quality productsVolcanic ash model (VAFTAD)Emergency response products

Meteorological Analysis Tools
• Maps– Pre-defined loops
– Interactive (Java-based)
• Cross-sections• Meteograms• Stability/mixing height• Vertical profiles
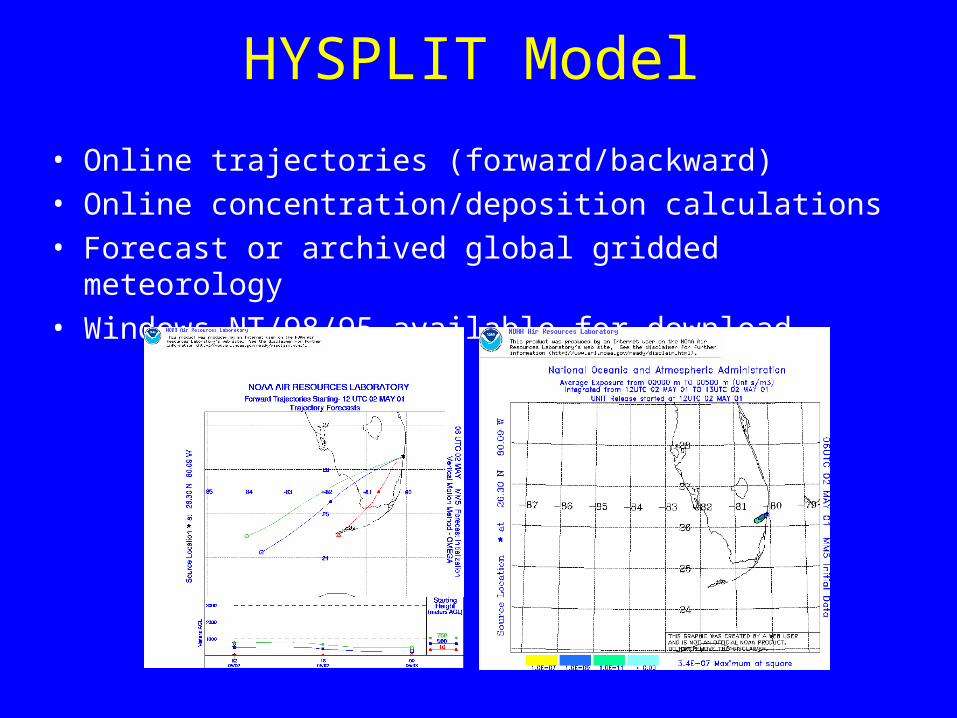
HYSPLIT Model
• Online trajectories (forward/backward)
• Online concentration/deposition calculations
• Forecast or archived global gridded meteorology
• Windows NT/98/95 available for download

Gridded Meteorological Data
• Forecast– Local (4-16 km): RAMS, MM5
– Regional (40-91 km): MM5, Eta, NGM, RUC
– Hemispheric (111-191 km): AVN, MRF
• Archived– Regional (40-180 km): EDAS, NGM
– Hemispheric (191–381 km): MRF, FNL, Re-analysis

Urban Test-Bed Concept
Urban Observations– High resolution winds,
temperature and humidity
– Wind profilers, temperature/humidity profilers
– radar – SPY-1, WS88D
– In situ temperature and humidity
– ACARS (commercial aviation data)
– Chemical/biological sensing
– In situ Chem/Bio sensors
Partnership with Army, Navy, DTRA, UCAR, DOD-JPO

Examples of Efforts to track Specific Events

Atmospheric Deposition of Mercury to the Great Lakes

Primary Factors Affecting the Transport Range of Mercury Emissions to Air
• Chemical and physical forms of emission
• Physicochemical reactions in clouds
• Gas-particle partitioning of oxidized Hg
• Dry deposition of RGM and aerosol Hg
• Wet deposition
• Meteorology

Atmospheric Program – Closing Thoughts• ARL programs are well integrated with several
other agencies at state, federal and international levels.
• QA efforts are becoming more rigorous.
• Modelers participate in well organized comparison efforts.
• ARL programs could be better linked with NOAA ocean and freshwater programs.