epa q.a hand book for environmental quality assurance
TRANSCRIPT

7/27/2019 EPA Q.A hand book for Environmental Quality Assurance
http://slidepdf.com/reader/full/epa-qa-hand-book-for-environmental-quality-assurance 1/54

7/27/2019 EPA Q.A hand book for Environmental Quality Assurance
http://slidepdf.com/reader/full/epa-qa-hand-book-for-environmental-quality-assurance 2/54
7/27/2019 EPA Q.A hand book for Environmental Quality Assurance
http://slidepdf.com/reader/full/epa-qa-hand-book-for-environmental-quality-assurance 3/54
Quality Assu'rance Handbook
for
EPA-600/R-94/038a
A ~ . r Pollut ion M_easurement Systems
Volume I - A Field Guide toEnvironmental Quality Assurance
1993
by
Monica Nees
U.S. Environmental Prot-ection AgencyOffice of Research and Development
Atmospheric Research and Exposure Assessment LaboratoryResearch Triangle Park, NC 27711
@ Printed on Recycled Paper
7/27/2019 EPA Q.A hand book for Environmental Quality Assurance
http://slidepdf.com/reader/full/epa-qa-hand-book-for-environmental-quality-assurance 4/54
OVERVIEW OF THE INTERIM EDITION OF VOLUME I
The Qual i ty Assurance (QA) Handbook i s comprised o f f i v e
volumes: volume I (Pr inc ip les ) , Volume I I (Ambient A ir Methocs ,
Volume I I I (Sta t ionary Source Methods), Volume IV ( M e t e o ~ o l o g i ~ ~ lMeasurements) , and Volume V (Prec ip i t a t ion Measurement Systems)_
Much of t he ma te r i a l in Volumes I I , I I I and V a re o u t -o f -d a t e a:.dsome por t ions o f these volumes have long been o u t -o f -p r i n t .
EPA i s now prepar ing an updated vers ion o f , t h e QA Handboc-::
s e r i e s which w i l l be ava i l ab le in September 1995: To meet the
needs of the u se r community un t i l th e updated ver s ion i sav a i l ab l e , EPA has publ ished Inter im Edi t ions of Volumes I , I I ,
I I I , IV and V. Each volume of the Inter im Edi t ions , i s be ing
i s sued as a complete u n i t with out -of -da te sec t io n s e i t h e rde le ted o r modif ied using addendum sheets and handwr i t t en
nota t ions in th e t ex t .
This volume and th e o the r four volumes o f the In te r im
Edi t ion of th e QA Handbook are ava i l ab le a t no charge from:USEPA/ORD
Center fo r Environmental Research Informat ion
26 West Mart in Luther King DriveCinc inna t i , Ohio' 45268
Since t h i s volume was updated in 1993, only minor changesw i l l be done to it in the updat ing process . The updated v e r s i c ~w i l l be av a i l ab l e in s e p t e ~ e r 1995.
Th e u se r of the QA Handbook i s caut ioned to bear i n mindt h a t the informat ion provided i n t h e handbook i s fo r guidance
purposes on ly . EPA regu la t ions a re publ ished in the Code of
Federal Regulat ions (CFR). When informat ion in the CFR c o n f l i ~ - : swith informat ion in the QA Handbook, the CFR s h a l l be c o n s i d e r e ~the au t h o r i t a t i v e and l ega l ly bonding document.
William J . Mitche l l
ChiefQual i ty Assurance Suppor t Branc t
7/27/2019 EPA Q.A hand book for Environmental Quality Assurance
http://slidepdf.com/reader/full/epa-qa-hand-book-for-environmental-quality-assurance 5/54
,......--.. ACKNOWLEDGEMENTS
This completely new version ~ f Volume 1 of the Ouality Assurance Handbook
fo r Air Pol/ution Measurement Systems was prepared by Dr. Monica Nees underthree affil iations. First, as a chemist enrollee of the Senior Environmental
Employment program of NCB A and tbe U.S. Environmental Protection Agency (EPA), .
she developed the initial drafts under the direction of Dr. BilrMitchell, Chie.f, Quality
Assurance Support Branch, Atmospheric Research and Exposure Assessment
laboratory, U.S. EPA, Research Triangle Park, North Carolina. Then, as a senior
scientistat ManTech Environmental Technology, Inc., Research Triangle Park, North
Carolina, she completed work for publication under the direction of Kenneth J.
Caviston, Supervisor, Quality Assurance and Other Support, under EPA contract 68-
00-0106 .
DISCLAIMER
This document has been reviewed in accordance with the U.S. Environmental
Protection Agency's peer review policy and has been approved for publication.
Mention of trade names or commercial products does not constitute EPA
endorsement or recommendation for use.
iii
7/27/2019 EPA Q.A hand book for Environmental Quality Assurance
http://slidepdf.com/reader/full/epa-qa-hand-book-for-environmental-quality-assurance 6/54
FOREWORD
Throughout the world, air quality is a critical concern. In the United States and
Canada, air monitoring is no t the responsibility of just the federal governments.States and provinces, local governments, private industries, and environmental
organizations are also par tic ipating. Elsewhere, especially in those countries in
which air quality is beginning to be addressed,' nat ional 'governments are th'e
principal monitors.
The purpose of these monitoring efforts is not to collect data, because data are
only the beginning, not the end, of environmental investigations. Data should not
be stored and forgotten, but should be used to make informed decisions affecting
the health and well-being of planet Earth. Application of the principles of quality
assurance ailows decision makers to know the quality of the data on which their. . . .
actions are based.
William Zinsser in his book On Writing Well calls the instructional manual "one
of the most forbidding swamps in the English language." I hope that this field guide
is not. It focuses on the fundamentals that transcend national borders, academic
disciplines, and even specific envi'ronmenial media. Like a fie ld guide used in
birdwatching, it does not tell everything, but only the most important things. It is
designed to be used in the field or laboratory, no t stored on a shelf. And, although
the examples are chosen from air monitoring, the principles can readily be applied toany type of environmental monitoring.
This field guide does not give detailed instructions for preparing a quality
assurance plan. Instead, it emphasizes the thought processes and rationales for
designing any good data collection program with quality assurance as an integral
part. Once this occurs, preparing a quality assurance plan using the format specified
by any sponsoring organization wi.ll be straightforward.
iv
Monica Nees
1993
7/27/2019 EPA Q.A hand book for Environmental Quality Assurance
http://slidepdf.com/reader/full/epa-qa-hand-book-for-environmental-quality-assurance 7/54
HOW TO USE THIS FIELD GUIDE
This field guide replaces Volume I, Principles, of the Ouality Assurance
Handbook fo r Air Pollution Measurement tv" t h o d s , first published in the late 1970s .and updated in 1984. Using a common-sense approach, it explains the unifying
concepts underlying all environmental quality assurance, in about one- tenth the
-number of pages of its predecessors.
Such a massive reduction was possible by the elimination of duplication of
numerous definitions, examples, appendices, and details also found in Volumes II
through V. of the handbook. Then the basic principles could be revealed and
studied. Once the user understands the principles, he or she can consult the other
volumes for necessary details. Volume 1/, AmbientAir Specific Methods, for instance,
includes b.oth a lengthy intr«:>ductory chapter on quality assurance fo r ambient air
methods and detailed guidance on nearly a ozen individual test methods.
By design, the field guide covers only the "Big Picture_" Written fo r a broad
audience, it is intended fo r use both byfield and laboratory personnel and by their
managers in planning all aspects of environmental data collection. Its sections cover
all phases of the life cycle of any such project, from planning through final report
writing. Throughout, the importance of planning is stressed again and again. Each
section is self- contained, fo r ease in future reference. The best way to use the field
guide, however, is first to read it completely to get an overview and then to consult
individual sections as needed.
By applying the principles described in ·the field guide to his or her own
projects, the user will make certain that all data collected will meet project n-eeds.
Because that data will be of known and documented quality, others will be able to
use it with confidence too_ And that is what quality assurance is all about.
For additional information, contact:
Chief, Quality Assurance Support BranchQuality Assurance and Technical Support DivisionAtmospheric Research and Exposure Assessment Laboratory
U.S. Environmental Protection AgencyResearch Triangle Park, North Carolina 27711
USA
v

7/27/2019 EPA Q.A hand book for Environmental Quality Assurance
http://slidepdf.com/reader/full/epa-qa-hand-book-for-environmental-quality-assurance 8/54

7/27/2019 EPA Q.A hand book for Environmental Quality Assurance
http://slidepdf.com/reader/full/epa-qa-hand-book-for-environmental-quality-assurance 9/54
CONTENTS
SECTION PAGE
Acknowledgements •••••• . ••••••••••• : . . . . . . . . . . . . . . . . . . . . . . . . . . . . . . . . . . . . . . . . . iii
Disclaimer . • . . • . . • • • • . . • • • ••••••••••• . • • •••••••• . • • •••••• . • • ••• . • • . • • •• . • • •• . . • iii
Foreword ••••••••••••••••••••••••••••••••• • • • • • • • • • • • • • . . • • • • • • • • • • • • • • • • • . • . • iv
How to Use This Field Guide . . . . . . . . . . . . .. . . . . . . . . . . . . . .. . . . . . . . . . . . . . .. . . . . • . • • v
PLANNINGANDORGANIZATION . . . . ; . . . . . . . . . . . . . . . . . . . . . . . . . . . . . . . . . . . . . . . . . . . . . 1-1
1.1 PROJ ECT DESCRIPTION • • • • • • • • • • • • • • • • • • • • • • • • • • • • • • • • . • • . . . . • • • • • . . . . . . . • 1-1
1.2 ORGANIZATIONAL CHART • . • • ••••• . • • ••••••• . • • • . • • ••• . • . • • • •• •.•• • •• • • . • • . 1-1
1.3 JOB DESCRIPTIONS ••••• . . • • • • . • • •••••• . • • ••• . • • • . • • • . . • • • •••••• . • • . • • •• . . • 1-2
1.3 .1 Project Manager • . . • . . . . . • • • . • • • . • • • • . . . . . . . . . . . . • . • • • • . . • • • • • • • • • • 1-3
1.3.2 Quality Assurance Manager ••• . • • ••••••••••••••••••••• . • • • . • • ••••• . • • 1-3
2 PLANS AND REPORTS •••• . • • •••••••••••••••••••••••••••••••••••••••• . • . • • • . . . • . 2-1
2.1 BEFORE DATA COLLECTION •••• . • • •• . • • •••••••••• . • • •• . . • • • ••••• . • • •••••• . . 2-1
2.2 DURING DATA COLLECTION ••••.••• ; . . . . . . . . . . . . . . . . . . . . . . . . . . . . . . . . . . . . . . . 2-2
2.3 AFTER DATA COLLECTION •••••••••• . •• . . . . . . . . . . . . . . . . . . . . . . . . . . . . . . . . . . . . 2-2
3 STANDARD OPERATING PROCEDURES . . . . . . . . . . . . . . . . . . . . . . . . . . . . . . . . . . . . . . . . . . . 3- '
3.1 PURPOSE. . . . . . . . . . . . . . . . . . . . . . . . . . . . . . . . . . . . . . . . . . . . . . . . . . . . . . . . . . . . . . . . . 3-1
3.2 CONTENTS ••••••••.••••• ; . . . . . . . . . . . . . . . . . . . . . . . . . . . . . . . . . . . . . . . . . . . . . . . . 3-2
3.3 HOUSEKEEPING DETAILS • • . • • • • • • • . . • • . . . . . • . . . . . . . . . . . . . . . . . . . • . . . . . . . . . . 3-3
4 PREVENTIVE MAINTENANCE.. . . . . . . . . . . . . . . . . . . . . . . . . . . . . . . . . . . . . . . . . . . . . . . . . . . 4-1
4.1 EXAMPLES • • • • • • • • • • • • • . .• . . • . • . . •. • . • • • . . • • •• • • • • • • • • • • • • • • • • •• • • • • • • . . . 4-14.2 REQUIREMENTS • • • • . • • • • • . . • • • • • • . . • . . . • • • • • • . • • • • • • • . • • • • • • • • • . . • • • . . . . • 4-2
5 SAMPLE COLLECTION, HANDLING, AND ANALYSIS . . . . . . . . . . . . . . . . . . . . . . . . . . . . . . . . . 5-1
5.1 SELECT SAMPLING SITES BASED ON DATA QUALITY NEEDS . . . • . . . . • • . . • . . . . . . . 5-1
S.2 UNDERSTAND THE REASONS BEHIND THE PROCEDURES • • . . • • • . . . • • . . • • . . • . • . 5-1
S.3 USE THE SAME CONDITIONS FOR STANDARDS AND SAMPLES •••••••••••••• . . . 5-25.4 USE QUALITY CONTROL CHECKS AND STANDARDS ••••••• . • . • . • • • . • • . • • ••• 5-2
5.5 KNOWWHERETHESAMPLESAREANDBEABLETOPROVEIT ••••••••••••••••• 5-2
6 DATACOLLECTIONANDHANDLING . . . . . ' . . . . . . . . . . . . . . . . . . . . . . . . . . . . . . . . . . . . . . . . . 6-1
6.1 KNOWWHYTHEDATAMUSTBECOLLECTED : . . . . . . . . . . . . . . . . . . . . . . . . . . . . . . . 6-1
6.2 DOCUMENT EVERYTHING THOROUGHLY .; ..•••••• . . . . . . . . . . . . . . . . . . . . . . . . . 6-16.3 CALIBRATE INSTRUMENTSANDTESTSOFTWARE ••••••• ••••••• ••••• •••••••••• 6-2
6.4 PRESERVETHEORIGINALDATA . . . . . . . . . . . . . . . . . . . . . . . . . . . . . . . . . . . . . . . . . . . . 6-2
(continu@d)
vii

7/27/2019 EPA Q.A hand book for Environmental Quality Assurance
http://slidepdf.com/reader/full/epa-qa-hand-book-for-environmental-quality-assurance 10/54
CONTENTS
SECTION
6 DATA COLLECTION AND HANDLING (Continued) . . . . . . . . . . . . . . . . . . . . . . . . . . . . . . . .6.5 USE ONLY VALIDATED DATA . . . . . . . . . . . . . . . . . . . . . . . . . . . . . . . . . . . . . . . . . . . . . .6.6 USE TABLES OR GRAPHS TO PRESENT SUMMARY STATISTICS • . . . . • • • • • . . • • • . . .6.7 LEAVE SOPHISTICATED DATA HANDLING TECHNIQUES TO THE STATISTICIANS "
6.8 BEWARE OF USING DATA COLLECTED FORANOTHER PURPOSE . • • • • . . • . . • • . . . •
7 STATISTICAL TERMS AND DATA QUALITY INDICATORS •• . • • . . • •••• . . • • ••• . . . • • ••
7.1 STATISTICAL TERMS • . . . • • . • • •• . . • • ••••• . • ••••••••••••••• . . • • •••••••••••• . •7.1.1 Arithmetic Mean .•••••••••. ••••••••••••••• . . •••• . . . • . . •••• .• . . . ••• .7.1.2 Standard Deviation and Variance . . . . . . . . . . . . . . . . . . . . . . . . . . . . . . . . . . . . .
7.1.3 Geometric Mean ••••••••••••••••••••••• .••• .• . . . . . • •• . . . • . . •• . . . . . . .7.1.4 Geometric Standard Deviation • .•••••••• .••••• .•• . . . . • • . •• . . . ••• . . . . •
7.2 DATA QUALITY INDICATORS • .• . . ••• . . ••• . •••• . . •• . •••• .••••••• . . . •••• . . . . •
7.2.1 Precision . • •• . . ••••••• . . . ••• . . •• . ••••• . . •••••••• .• . • . ••••• . . . ••••• . .7.2.2 Accuracy ••••• . . • • • . • , • • • . • • • • • • • • • • • • • ',' • • . • • • • . • . . • • • • • • • . • • • • • • • .7.2.3 Completeness . • . . . • • • • • • • • • • • • • • • . • • • • • • • . . • • • • • • • . . • • • • • • • . . . • • • . .7.2.4 Method Detection Li'mit ••••• . • ••••••••••••••• . • •••••••• . • . • • ••• . . • • .7.2.5 Representativeness . • . . • . •••• . . . . • •••• . . . ••• ••• . . • . •• ••• . . . ••• . •• . . .7.2.6 Comparability . • • • • • • • . . .• • • • • • • • . . • •• • • . • . . • • • • •• • . . • • • • • • • • .• • • • • •
8 AUDITS • . . • . . . • •••• . . •••••••• .•• . ••• . . . ••• . ••• .••••• .• . . . . • • . . •• . . •••••••• . . ••
8.1 DOCUMENTATION . . • •• . . ••• . . ••• . ••• . . ••• •• . . . •••••• . . •• . •••• . . . •••• ••• . .8.2 AUDIT TYPES ••••• . . • • •• . • •• . • •••••• . . • • • • • • • . . . • • • • • • . . . . . . • • • . . . . • • • • . .
8.2.' Technical Systems Audit . . . . . . . . . . . . . . . . . . . . . . . . . . . . . . . . . . . . . . . . . . . . .8.2.2 Performance Evaluation Audit • • • . . • • • • • • . • . . . • • . • . . . . . • • . . • . . . . • • . . .8.2.3 Audit of Data Quality • . . . • • • • • • • . . • • • . • • . . . . . • . • • • . . . . . . • • • • . . • • • . • •8.2.4 Management Systems Audit . • • • • • • . • . • • • • • . .. • . . • • . . .. • . • • • • • • . • . • .•
8.3 AUDIT PROCEDURES • • . • . • • • . • • • . • •• • . . • • • . . • • • • . •• . . . • • . • • • . .. . . • • • • . . .• •8.3.' preaudit Activiti es . • • . . . • • .. • . . • • • • • . • • •. • • • • • . . • . .• • • • • . • • • . • • • • . ..8.3.2 Conducting the Audit • . . . ••••• .• . . ••••••• . . •••••• . . . • . ••••• . . . . • •• •
8.3.3 Preparation of the Audit Report •••••••••••••• , • . • • • . . . . . • • • • • . . . . . . • •8.3.4 Postaudit Report Activities • • • • • • . . . • • • • • • • . . • . • . . • . . . . . . . • • • . . . . . . . • •
9 CORRECTIVE ACTION ••••••• . . •••• .•• . . ••• . . ••••• .• . . ••••• . . . ••••• . . •• . . ••••••• .
9.1 ROUTINE MEASUREMENTS •• . . • . . •••• .• . . ••••••• .•• . •••••• . . • . . ••••••• . . •••9.2 MAJOR PROBLEMS ••••••••• . . •• ••••••••••••••••••••••••••• .. • • • ••• . . • ••••
10 BIBLIOGRAPHY
viii
~ " - -
PAGE
6-1
6-2
6·2
6-2
6-3·
7-1
7- '
7-1
7·'
7·2
7·2
7-3
7-37-3
7-4
7-4
7-5
7-5
8-1
8-1
8-2
8·2
8-2
8-2
8-3
8·3
8-3
8·4
8·5
8·5
9-'
9·1
9·1
10·'
7/27/2019 EPA Q.A hand book for Environmental Quality Assurance
http://slidepdf.com/reader/full/epa-qa-hand-book-for-environmental-quality-assurance 11/54
FIGURES
FIGURE PAGE
1-1 Example of Organizational Chart •••••••••••••••••••••• . . • • • . . • • • . • ••• . • . • • . . . . • . 1-2
9-1 Corrective Action Form 9-3
TABLES
TABLE PAGE
3-1 Suggested Format fo r a Field or Laboratory
Standard Operating Procedure .•••• ; . . . . . . . . . . . . . . . . . . . . . . . . . . . . . . . . . . . . . . . . . . . . 3-2
3-2 Tracking System fo r Standard Operating Procedures " . .• . . . . •. . . • . . .••• . . . . . . .. • . 3-3
3-3 Document Control Format . . . . . • • . . . • . • . . . . • • . • • . . . . • . . . • • . . . • . . . . • • . . . . . . . • . • . . 3-4
5-1 Principles6fSampleColiection,Handling,andAnalysis ••• . • ••• . • •••••••• . • ••• . . • • • 5-1
6-1 Principles of Data Collection and Handling 6-1
ix

7/27/2019 EPA Q.A hand book for Environmental Quality Assurance
http://slidepdf.com/reader/full/epa-qa-hand-book-for-environmental-quality-assurance 12/54
7/27/2019 EPA Q.A hand book for Environmental Quality Assurance
http://slidepdf.com/reader/full/epa-qa-hand-book-for-environmental-quality-assurance 13/54
SECTION 1
PLANNING AND ORGANIZATION
Projects brilliantly conceived will not be brilliantly executed without good
planning and organization. Project success depends on the leadership and
organizational skills of the proJect manager. The m a h ~ g ! ! r notonly must knowwhat
needs to be done, but also must share that -knowledge so that all staff membe·rs
understand precisely how they fit into the "Big Picture."
1.1 PROJECT DESCRIPTION
A detailed project description forms the basis fo r all other planning and
organizational activities. The critical personnel and resource needs should arise from
the project description - and no t the otherway around.
The project manager and other key personnel jointly develop the project
description, which must contain the following six components.
• What is going to be done
• Why it is necessary to qo it
• Who will do it
• How itwill be accomplished
• Where it will be done
• When it will be carried out
Unless all six are addressed in test and' qual ity assurance (QA) plans; the project
description is incomplete and subject to misinterpretation. Section 2 describes these
components in more detail, in the context of reports required before, during, and
after data collection.
1.2 ORGANIZATIONAL CHART
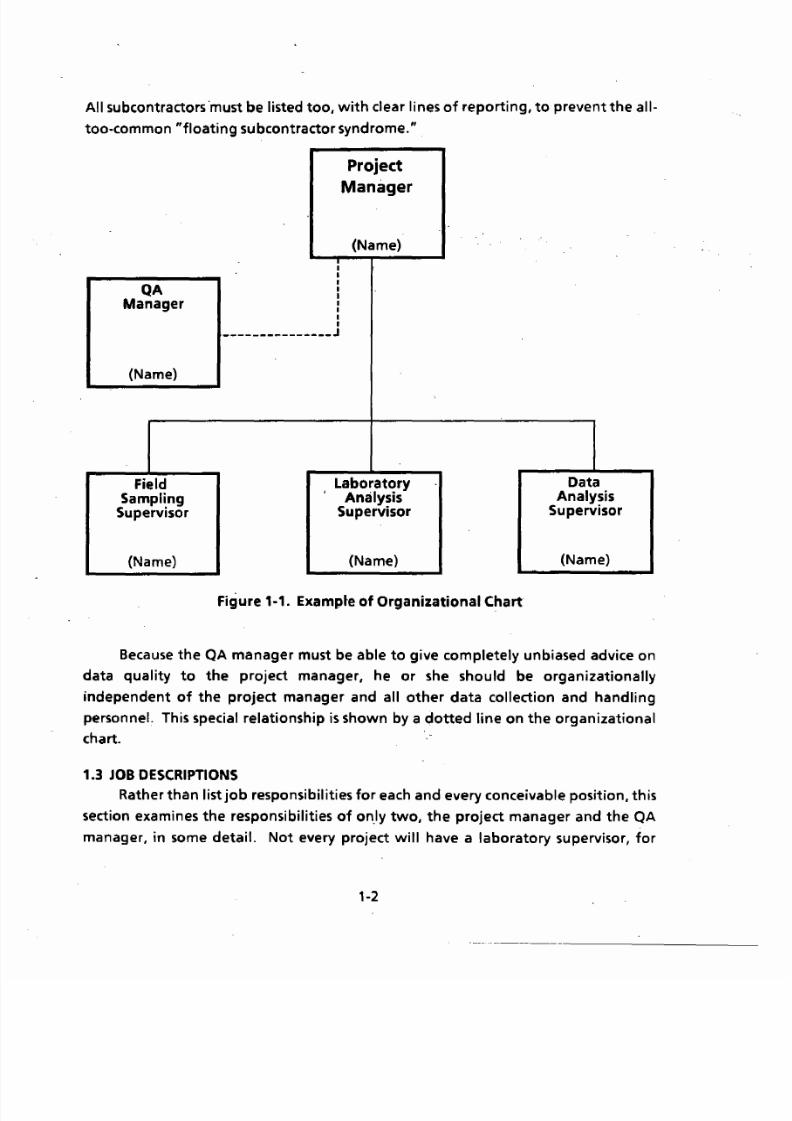
A clearly presented organizational chart is one of the most important productsof the planning process because it names all key individuals in charge of every major
activity of the project. Figure 1 1 shows a simple organizat ional chart. If possible,
the names of all team members h ~ u l d be included; t h ~ s e of all supervisors must be.
1p1
7/27/2019 EPA Q.A hand book for Environmental Quality Assurance
http://slidepdf.com/reader/full/epa-qa-hand-book-for-environmental-quality-assurance 14/54
All subcontractors ·must be listed too, with clear lines of reporting, to prevent the all
too-common "floating subcontractor syndrome."
QAManager
(Name)
FieldSampling
Supervisor
(Name)
IIIIIIIII______________ J
Project
Manager
(Name)
Laboratory, Analysis
Supervisor
(Name)
Figure 1·1. E x a m p ~ e of Organizational Chart
DataAnalysis
Supervisor
(Name)
Because the QA manager must be able to give completely unbiased advice on
data quality to the project manager, he or she should be organizationally
independent of the project manager and all other data collection and handling
personnel. This special relationship is shown by a dotted line on the organizational
chart.
1.3 JOB DESCRIPTIONS
Rather than list job responsibilities fo r each and every conceivable position, this
section examines the responsibilities of on.ly two, the project manager and the QA
manager, in some detail. Not every project will have a laboratory supervisor, for
1-2

7/27/2019 EPA Q.A hand book for Environmental Quality Assurance
http://slidepdf.com/reader/full/epa-qa-hand-book-for-environmental-quality-assurance 15/54
instance, because it may entail only analysis of data already collected. But every
project will have a manager and a QA manager, even if they are one and the same
person on small projects.
, .3.1 Project ManagerLike the captain of a sllip, the project manager is ultimately responsible fo r
-everything that happens in his or her project, induding the QA necessary to achieve
the data quality required by the project's sponscir: The . manager's primary
responsibilities are liaison with the sponsor, planning, budgeting, staffing, and
overall coordination and review. Just as no one would expect a ship's captain to
perform every operation on board, no one expects the project manager to do
everything single-handedly. That is why a staff is hired. Frequently, the project
manager appoints a QA manager fo r assistance in developing and implementing the
QAlquality control (QC) needed to achieve the required data quality. The ultimate
responsibility fo r QAlQC, however, as for any other project function, still resides with
the project manager.
1.3.2 Quality Assurance Manager
Two definitions will help in understanding, the duties of the QA manager:
QUALITY CONTROL is everything YOU do to make certain thatyour project is performing"up to specs."
QUALITY ASSURANCE is everything you have SOMEONE ELSE do
to assure you that your QC is being done "according to specs."
Thus, if the same" individual who, performs the work also does the checking for
quality, that checking is quality control. Running duplicate samples in the laboratory
is a common QC procedure. If a different individual does the checking, that is an
example of quality assurance. A project review by auditors from another company is
a typical QA activity.
A review, however, need not be performed by a different company; more
commonly, it is done by the QA manager: within the same organization but
completely independent of the data- collecting staff. The QA manager protects theproject manager from poor quality data that do not fulfill project needs. Thus,
anything that affects data quality comes under the purview of the QA manager.
Most of the activities of a QA manager involve the review of project activities
and the preparation or review of reports. The mix depends on the wishes of the
1-3
7/27/2019 EPA Q.A hand book for Environmental Quality Assurance
http://slidepdf.com/reader/full/epa-qa-hand-book-for-environmental-quality-assurance 16/54
project manager. Frequently. the OA manager is assigned to prepare the QA plan,
review all other documents generated during the project. and carry out other tasks
specified by the project manager.
The following sections describe various project funct ions in detail : reports;
standard operating procedures (SOPs); preventive maintenance; sample collection,
handling, and analysis; data collection and handling; audits; and corrective action.
Because all impact on data quality, all must be addressed by the QA ma'nager. '.Not addressed in these sections, however, is one other important function
often assigned to the QA manager, that of training coordinator. Everyone must be
trained well enough to produce the highest quality of data needed by the project.
A common mistake is to provide training only fo r field and laboratory
personnel, while neglecting the clerical staff and managers. Anything that affects
data quality is a suitable topic fo r training. Thus, the clerical staff must be trained
continuously to take full advantage of the ever-changing enhancements in word
processing systems and managers need training on topics ranging from financial
information systems to handling personnel problems.
Hiring staff with appropriate formal education is only the first step in building
a competent team. Next comes' on-the-job training under the guidance of a
knowledgeable mentor who teaches the skills and nuances specific to the particular
task and organization. Short courses, both on-site and off-site. develop well-defined
sets of skills in a specific area. Formal courses at a college or university give a morein-depth mastery of a subject.
A combination of training activities will be needed fo r most projects. Some
form oftraining will be needed fo r someone throughout the life ofthe project.
1-4
7/27/2019 EPA Q.A hand book for Environmental Quality Assurance
http://slidepdf.com/reader/full/epa-qa-hand-book-for-environmental-quality-assurance 17/54
SECTION 2
PLANS AND REPORTS
Anyone -aliergicR to writing anything on paper will not thrive in
environmental data collection. Sponsors and supervisors require a steady stream of
reports, from before a project beg'insuntil after it is completed. Writing a' good
report is not that much different from writing a good newspaper article. 'Both
processes concentrate on the six key principles of Who, What, Where. When. Why.
and How, but the relative emphasis given to each depends on where the report fits
into the life cycle ofthe project.
Rare, indeed, is the project that spawns only one report; instead, many
different types are usually produced. The beginning of data collection in the field or
laboratory is the benchmark. Planning docume,nts are written before data collection
begins, progress reports while it is under way, and final reports after it is completed.
Nobody wants to read a report that is t09 long and incoherent. Applying the six
principles can prevent such a report from ever being written. The best "mix of the
six" depends on whether the report comes before, during, or after data collection.
2.1 BEFORE DATA COLLECTION
The most important project reports are those written before the first piece of
data is collected. These planning documents include all six principles, but the most
important are Who, What, and How. They specify, by name, Who is in charge of
What part of the project and How, in detail, the work will be accomplished. Each
and every part must be included because success of the project depends on how well
all of the parts fi t together. A simple organizational chart is mandatory. If the
relationships are difficult to draw, they will be even more difficult to execute.
Examples oftypical planning documents include the following.
• Data qual ity objectives reports
• Work or test plans
• Quality assurance plans
• Site selection, sampling, and analytical procedures (i f not included inthe work plan) , .
• Standard operating procedures
2-1

7/27/2019 EPA Q.A hand book for Environmental Quality Assurance
http://slidepdf.com/reader/full/epa-qa-hand-book-for-environmental-quality-assurance 18/54
• Data handl ing protocols
• Corrective action plans
• Others, as necessary
Although Who, What, and How predominate, Where, When, and Why cannot
be neglected. Geographical location (the Where) can be a critical vari"able in field. .
work. The When includes' not only the spe-cific ~ o u r s , days, months, 'or years of.
project duration but als'o such important topics as seasonal and diurnal variation$,
Although the Why is more subtle than the other principles, knowing Why the
data have to be collected is critical to the success of any project. The reason is quite
simple: data m'ust be collected fo r a purpose, Different purposes require different
data collection plans. P r o j ~ c t planners can devise the best one only if they know the
enduses
of the data, Planning documents must clearly state the purposes behinddata col'lection, so that both current and future users understand the limitations on
using the data fo r decision making. They also establish the competence of the
project team to do the job right the first time, on time, and within budget. They
describe what is anticipated and thus serve as yardsticks by which to measure
progress.
The QA manager reviews and approves the QA plans, which include key
- sections from many other planning documents, but the project manager must sign
off on all documents. Although each staff member is responsible fo r the quality of
his or her part of the project, the project manager is responsible fo r the quality of
the entire undertaking.
2.2 DURING DATA COLLECTION
Progress reports, the most commonly written reports during the data collection
phase of a project, continuously answer the question, "How are we doing?" The
standards used are the ones previously stipulated in the planning documents. Audit
reports and corrective action reports are also prepared in this phase. Audits,
whether performed internally or by outside organilations, assess What is being done
and How well. Whenever corrective actionis
taken, the report describes What theproblem was and How it was solved.
2.3 AFTER DATA COLLECTION
If planning and progress reports are well prepared, writing the final report
should not be an overwhelming burden. Its purpose is to summarize and analyze -
7/27/2019 EPA Q.A hand book for Environmental Quality Assurance
http://slidepdf.com/reader/full/epa-qa-hand-book-for-environmental-quality-assurance 19/54
to say What happened and Why, but not to meditate on every single data point.
Appendices and references to earlier reports can take care of that.
The final report, which frequently mirrors the test or work plan in sequence
and approach. covers all six principles. It is also a self-audit, assessing How well the
standards spelled out in the planning documents were met, and clearly explaining
any limitations on data use fo r both p r ~ s e n t and future users. This careful analysis in
a final repor t fo r n ~ project may also serve as a springboard toa new one in which
currently unresolved problems may be solved.

7/27/2019 EPA Q.A hand book for Environmental Quality Assurance
http://slidepdf.com/reader/full/epa-qa-hand-book-for-environmental-quality-assurance 20/54
------------------------------------------
7/27/2019 EPA Q.A hand book for Environmental Quality Assurance
http://slidepdf.com/reader/full/epa-qa-hand-book-for-environmental-quality-assurance 21/54
SECTION 3
STANDARD OPERATING PROCEDURES
When should a manager decide that an SOP needs to be written? The answer is
deceptively simple: as soon as the procedure becomes standardized - and not
before. The argument that no procedure, is ever standardized, however, is used all
too frequently only to avoid putting anyth ing on paper.
Although the time and effort spent in preparing an SOP can be significant,
there are important long-term benefits. No longer will the same procedure have to
be described again and again in test plans, QA project plans, audits, and other
reports. Instead, it can be incorporated by reference, with a copy ·attached to the
report. But saving data, not merely saving time, is the main reason fo r preparing an
. SOP. Data collected using fully documented procedures have much higher credibility
and defensibility. Because well-written SOPs focus on routine operations, their users
can concentrate primarily on nonroutine problem solving.
3.1 PURPOSE
An SOP is written so thai the procedure will be performed consistently by
everyone, every time. Deciding whether a particular procedure is a candidate fo r an
SOP is helped by answering two questions:
• Does the procedure significantly affect data quality?
• Is the procedure repetitive or routine?
Preparing an SOP is indicated i fthe answer to both questions is YES.
Targeting the proper audience can be the most difficult task. Obviously, the
SOP should be written at a level of detail appropriate to the end users. If
backgrounds of the users are unknown, target the SOP fo r a nnew hire, n a technician
with at least two years of college and _ ne year of experience in the appropriate
field. This approach usually ensures that the SOP has enough detail without
becoming overwhelming.
Few routine laboratory or field projects can be described completely in just one
SOP. Several will be needed, and deciding how best to divide the topics will take
careful planning. In general, an SOP for each of several smaller segments is much
bet ter and easier to write than one large SOP for an entire operation.
3-1
7/27/2019 EPA Q.A hand book for Environmental Quality Assurance
http://slidepdf.com/reader/full/epa-qa-hand-book-for-environmental-quality-assurance 22/54
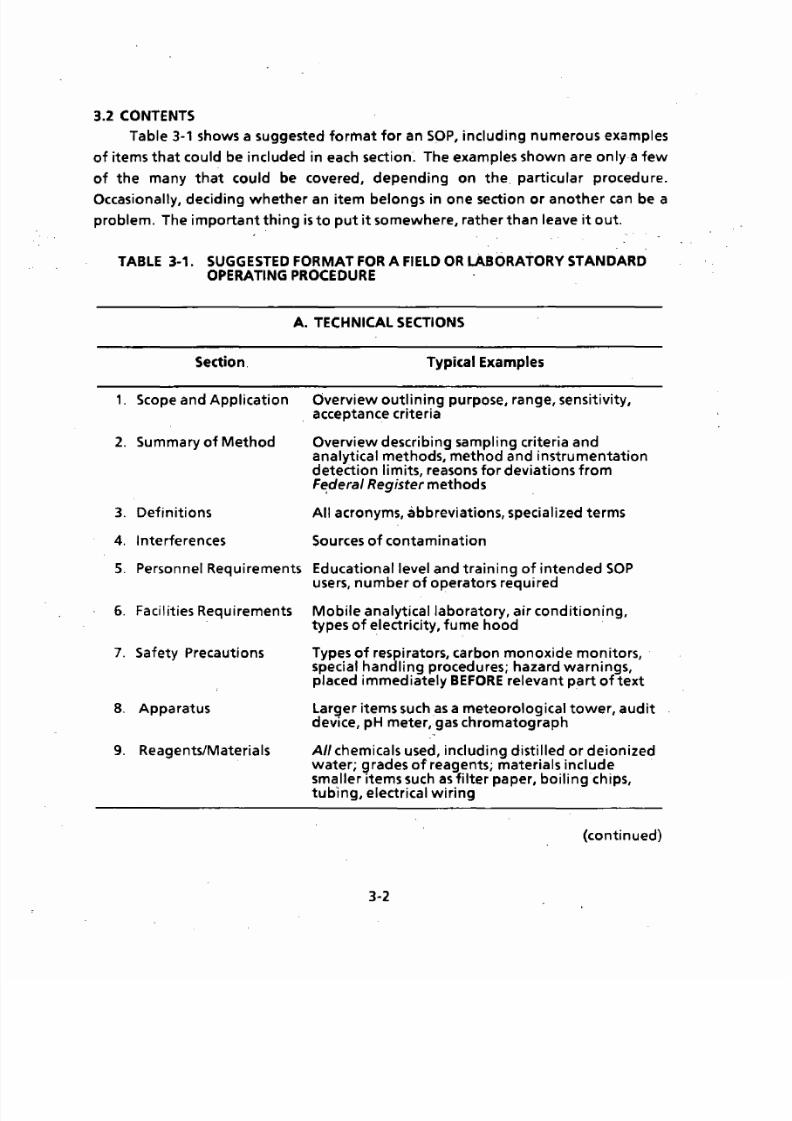
3.2 CONTENTS
Table 3-1 shows a suggested format for an SOP, including numerous examples
of items that could be included in each section-. The examples shown are onlya few
of the many that could be covered, depending on the, particular procedure.
Occasionally, deciding whether an item belongs in one section or another can be a
problem. The important thing is to put it somewhere, rather than leave it out.
TABLE 3-1. SUGGESTED FORMAT FOR A FIELD OR LABORATORY STANDARDOPERATING PROCEDURE
Section,
1. Scope and Application
2. Summary of Method
3. Definitions
4. Interferences
A. TECHNICAL SECTIONS
Typical Examples
Overview outlining purpose, range, sensitivity,acceptance criteria
Overview describing sampling criteria andanalytical methods, method and instrumentationdetection limits, reasons fo r deviations fromFederal Register methods
All acronyms, abbreviat ions, specialized terms
Sources of contamination
5. Personnel Requirements Educational level and training of intended SOPusers, number of operators required
6. Facilities Requirements
7. Safety Precautions
8. Apparatus
9. Reagents/Materials
Mobile analytical laboratory, air conditioning,types of electricity, fume hood -
Types of respirators, carbon monoxide monitors,special handling procedures; hazard warnings,placed immediately BEFORE relevant part of text
larger items such as a meteorological tower, auditdevice, pH meter, gas chromatograph
All chemicals used, including distilled or deionizedwater; grades of reagents; materials includesmaller i tems such as filter paper, boiling chips,tub'ing, electrical wiring
(continued)
3-2
7/27/2019 EPA Q.A hand book for Environmental Quality Assurance
http://slidepdf.com/reader/full/epa-qa-hand-book-for-environmental-quality-assurance 23/54
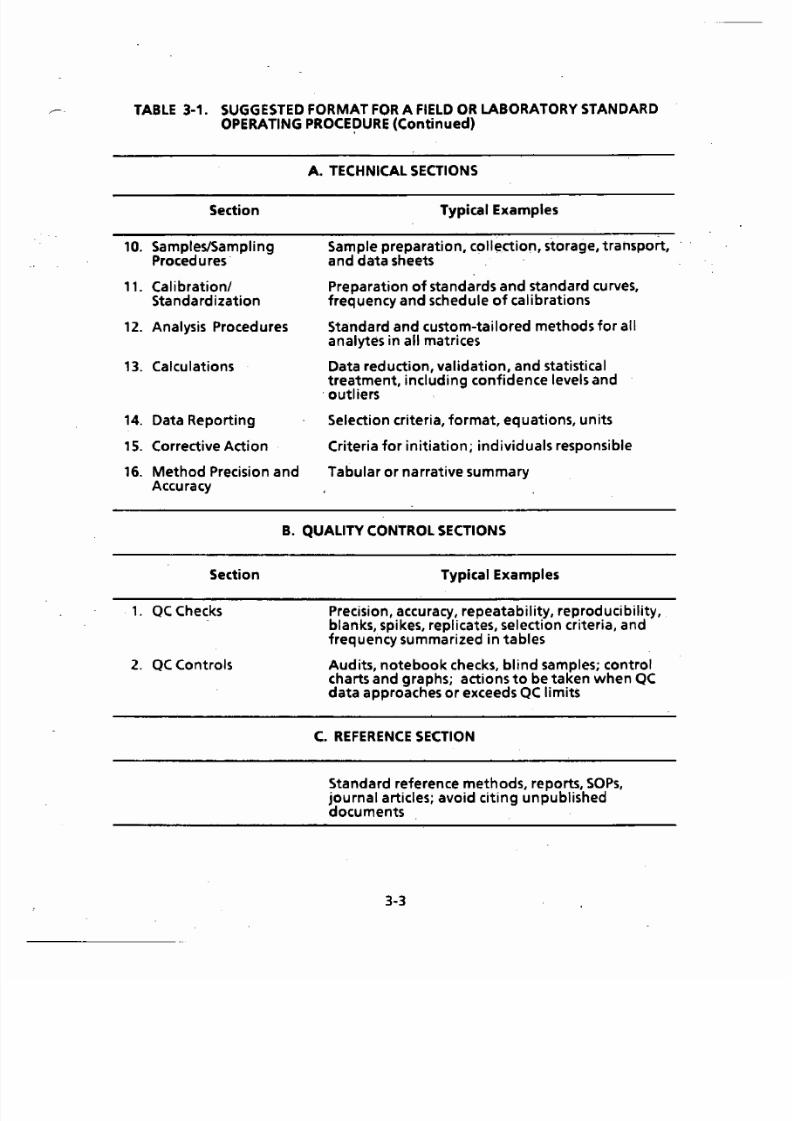
----- TABLE 3-1. SUGGESTED FORMAT FOR A FIELD OR LABORATORY STANDARDOPERATING P R O C E ~ U R E (Continued)
Section
10. SampleslSamplingProced ures -
11. CalibrationlStanda rd ization
12. Analysis Procedures
13. Calculations
14. Data Reporting
, 5. Corrective Action
16. Method Precision andAccuracy
A. TECHNICAL SECTIONS
Typical Examples
Sample preparation, col lection, storage, transport,and data sheets
Preparation of standards and standard curves,frequency and schedule of calibrations
Standard and custom-tailored methods for allanalytes in all matrices
Data reduction, validation, and statisticaltreatment, including confidence levels and
-outliers
Selection criteria, format, equations, units
Criteria for initiation; individuals responsible
Tabular or narrative summary
B. QUALITY CONTROL SECTIONS
Section
1. QC Checks
2. QC Controls
Typical Examples
Precision, accuracy, repeatability, reproducibility,blanks, spikes, replicates, selection criteria, andfrequency summarized in tables
Audits, notebook checks, blind samples; controlcharts and graphs; actions to be taken when QCdata approaches or exceeds QC limits
C. REFERENCE SECTION
Standard reference methods, reports, SOPs,journal articles; avoid citing unpublisheddocuments -
7/27/2019 EPA Q.A hand book for Environmental Quality Assurance
http://slidepdf.com/reader/full/epa-qa-hand-book-for-environmental-quality-assurance 24/54
3.3 HOUSEKEEPING DETAILS
Once an organization commits to SOPs, many new SOPS will be prepared in the
same length. of time it took to do the first one. And, as refinements become
available, older SOPs will need to be updated, preferably without having to rekey
the enti re text. A tracking system is a must in handling this ever-increasing
workload.
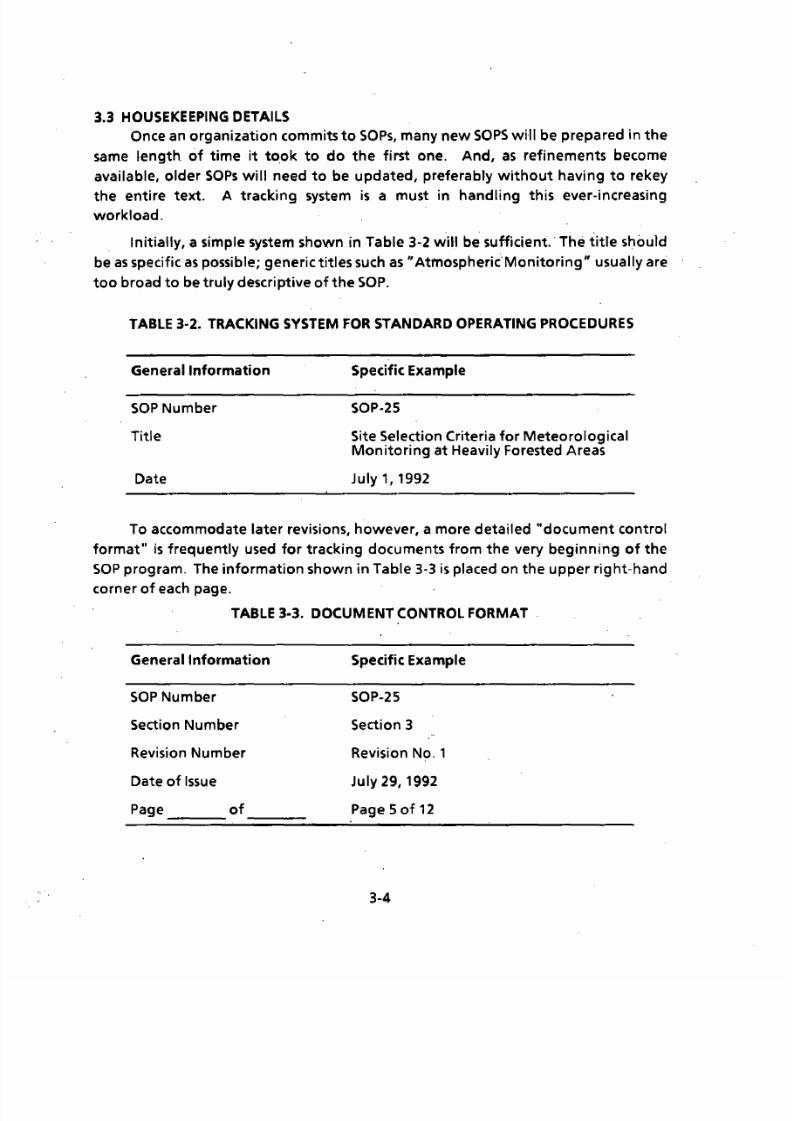
. Ini tially, a simple system shown in Table 3-2 will be sufficient.· The title should
be as specific as possible; generic titles such as "Atmospheric·Monitoring" usually are
too broad to be truly descri ptive of the SOP.
TABLE 3-2. TRACKING SYSTEM FOR STANDARD OPERATING PROCEDURES
General Information
SOP Number
Title
Date
Specific Example
Site Selection Criteria for MeteorologicalMonitoring at Heavily Forested Areas
July 1, 1992
To accommodate later revisions, however, a more detailed "document control
format" is frequently used fo r tracking documents from the very beginning of the
SOP program. The information shown in Table 3-3 is placed on the upper right-handcorner of each page.
TABLE 3·3. DOCUMENT CONTROL FORMAT
General Information
SOP Number
Section Number
Revision Number
Date of Issue
Page of
Specific Example
SOP-25
Section 3
Revision NO.1
July 29, 1992
Page 5 of 12
3-4

7/27/2019 EPA Q.A hand book for Environmental Quality Assurance
http://slidepdf.com/reader/full/epa-qa-hand-book-for-environmental-quality-assurance 25/54
The original version is always labeled as Revision O. If, fo r example, page 5 of
Section 3 needs to be updated, the changes are made and issued as Revision 1,
together .with instructions to replace page 5 of Revision 0 with the new page 5 of
Revision 1. Thus, the value of a ring-binder format becomes obvious.
A complete set of SOPs is stored fo r reference in one place, usually the office of
the QA manager. The most important copies, however, are the dog-eared, coffee
stained ones in the field and laboratory; SOPs are meant to be used, riotj"ust tilea.
3-5

7/27/2019 EPA Q.A hand book for Environmental Quality Assurance
http://slidepdf.com/reader/full/epa-qa-hand-book-for-environmental-quality-assurance 26/54
7/27/2019 EPA Q.A hand book for Environmental Quality Assurance
http://slidepdf.com/reader/full/epa-qa-hand-book-for-environmental-quality-assurance 27/54
SECTION 4
PREVENTIVE MAINTENANCE
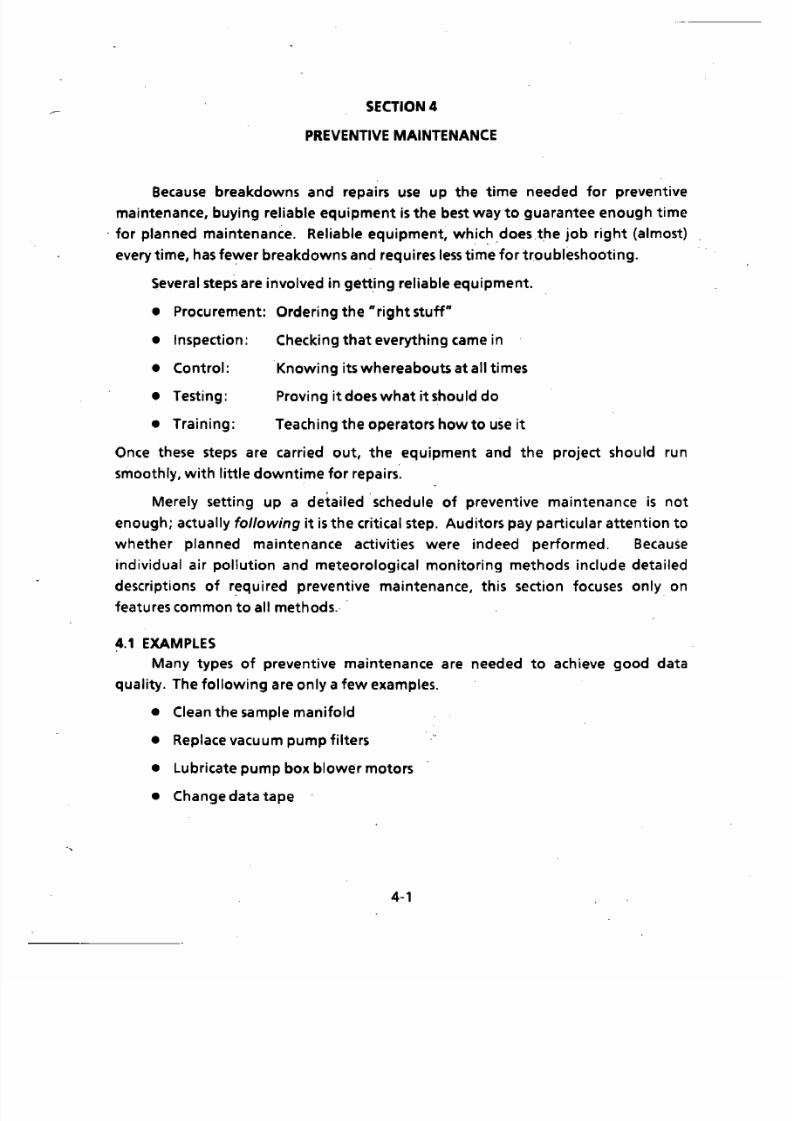
Because breakdowns and repairs use up the time needed for preventive
maintenance, buying reliabl.e equipment is the best way to guarantee enough time
. for planned maintenance. Reliable equipment, which does the job right (almost)
every time, has fewer breakdowns and requires less time fo r troubleshooting.
Several steps are involved in getting reliable equipment.
• Procurement: Ordering the Rright stuffR
• Inspection: Checking that everything came in
• Control: Knowing its whereabouts at all times
• Testing: Proving it does what it should do
• Training: Teaching the operators how to use it
Once these steps are carried out, the equipment and the project should run
smoothly, with little downtime for repairs·., .
Merely setting up a detailed schedule of preventive maintenance is not
enough; actually following it is the critical step. Auditors pay particular attention to
whether planned maintenance activities were indeed performed. Because
individual air pollution and meteorological monitoring methods include detaileddescriptions of r ~ q u i r e d preventive maintenance, this section focuses only on
features common to all methods.·
4.1 EXAMPLES
Many types of preventive maintenance are needed to achieve good data
quality. The following are only a few examples.
• Clean the sample manifold
• Replace vacuum pump filters
• Lubricate pump box blower motors
• Change data tape
4-1
7/27/2019 EPA Q.A hand book for Environmental Quality Assurance
http://slidepdf.com/reader/full/epa-qa-hand-book-for-environmental-quality-assurance 28/54
Each activity by itself may seem insignificant, but, when coupled with dozens of
others, the net result is a program with more reliable data, less downtime, and much
less cost in dollars, time, and grief.
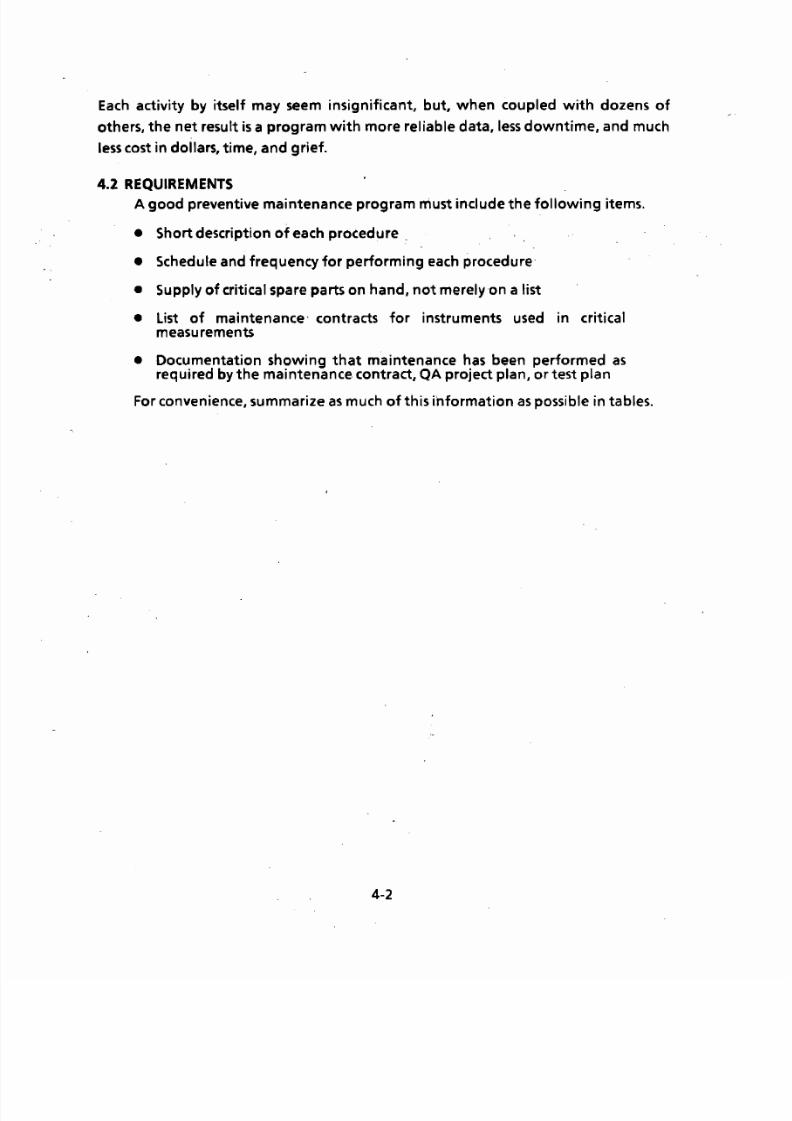
4.2 REQUIREMENTSA good preventive maintenance program must include the following items.
• Short description of each procedure _
• Schedule and frequency for performing each procedure
• Supply of critical spare parts on hand, no t merely on a list
• List of maintenance' contracts fo r instruments used in criticalmeasurements
• Documentation showing that maintenance has been performed as
required by the maintenance. contract, QA project plan, or test plan
For convenience, summarize as much of this information as possible in tables.
4-2
7/27/2019 EPA Q.A hand book for Environmental Quality Assurance
http://slidepdf.com/reader/full/epa-qa-hand-book-for-environmental-quality-assurance 29/54
SECTION 5
SAMPLE COLLECTION, HANDLING, AND ANALYSIS
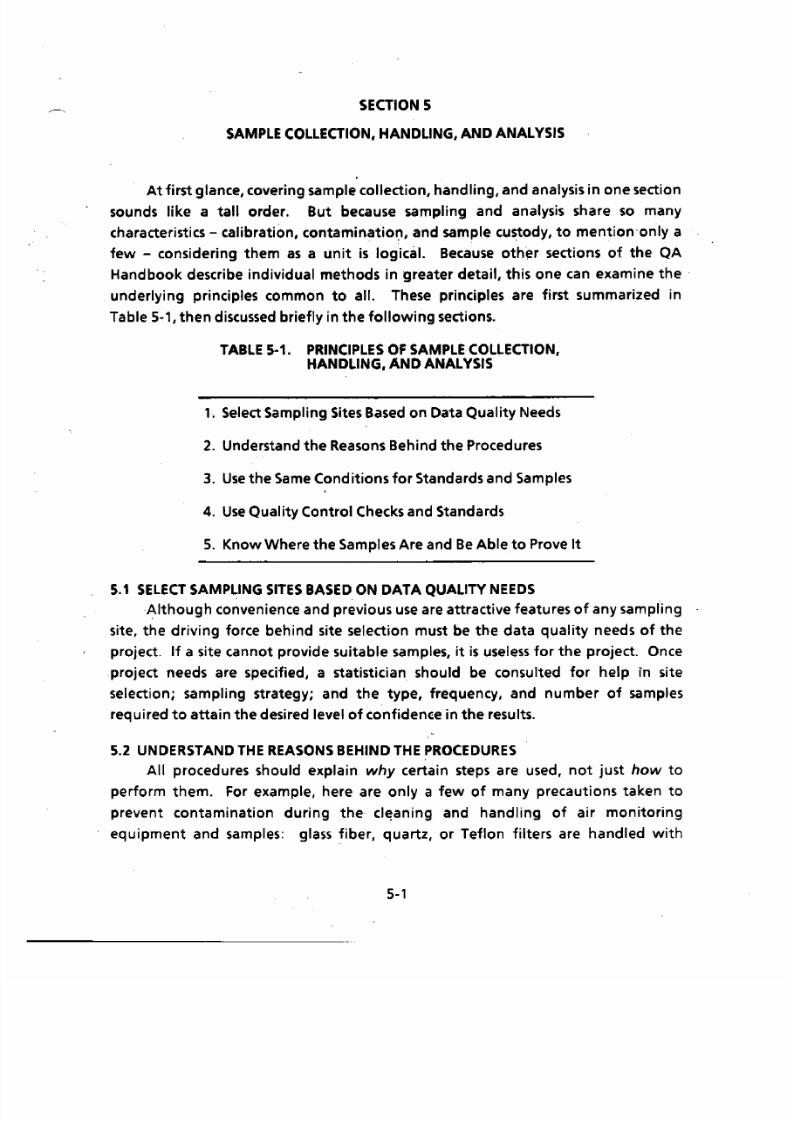
At first glance, covering sample collection, handling, and analysis in one sectionsounds like a tall order. But because sampling and analysis share so many
characteristics - calibration, contaminatioD, and sample custody, to mention-only a
few - considering them as a unit is logical. Because o t h ~ r sections of the QA
Handbook describe individual methods in greater detail, this one can examine the -
underlying principles common to all. These principles are first summarized in
Table 5-1, then discussed briefly in the following sections.
TABLE 5·1. PRINCIPLES OF SAMPLE COLLECTION,HANDLING, AND ANALYSIS
1. Select Sampling Sites Based on Data Quality Needs
2. Understand the Reasons Behind the Procedures
3. Use the Same Conditions fo r Standards and Samples
4. Use Quality Control Checks and Standards
5. Know Where the Samples Are and Be Able to Prove It
5.1 SELECT SAMPLING SITES BASED ON DATA QUALITY NEEDS
Although convenience and previous use are attractive features of any sampling
site, the driving force behind site selection must be the data quality needs of the
project. If a site cannot provide suitable samples, it is useless fo r the project. Once
project needs are specified, a statistician should be consulted fo r help In site
selection; sampling strategy; and the type, frequency, and number of samples
required to attain the desired level of confidence in the results.
5.2 UNDERSTAND THE REASONS BEHIND THE PROCEDURESAll procedures should explain why certain steps are used, not just how to
perform them. For example, here are only a few of many precautions taken to
prevent contamination during the c I ~ a n i n g and handling of air monitoring
equipment and samples: glass fiber, quartz, or Teflon filters are handled with
5·'
7/27/2019 EPA Q.A hand book for Environmental Quality Assurance
http://slidepdf.com/reader/full/epa-qa-hand-book-for-environmental-quality-assurance 30/54
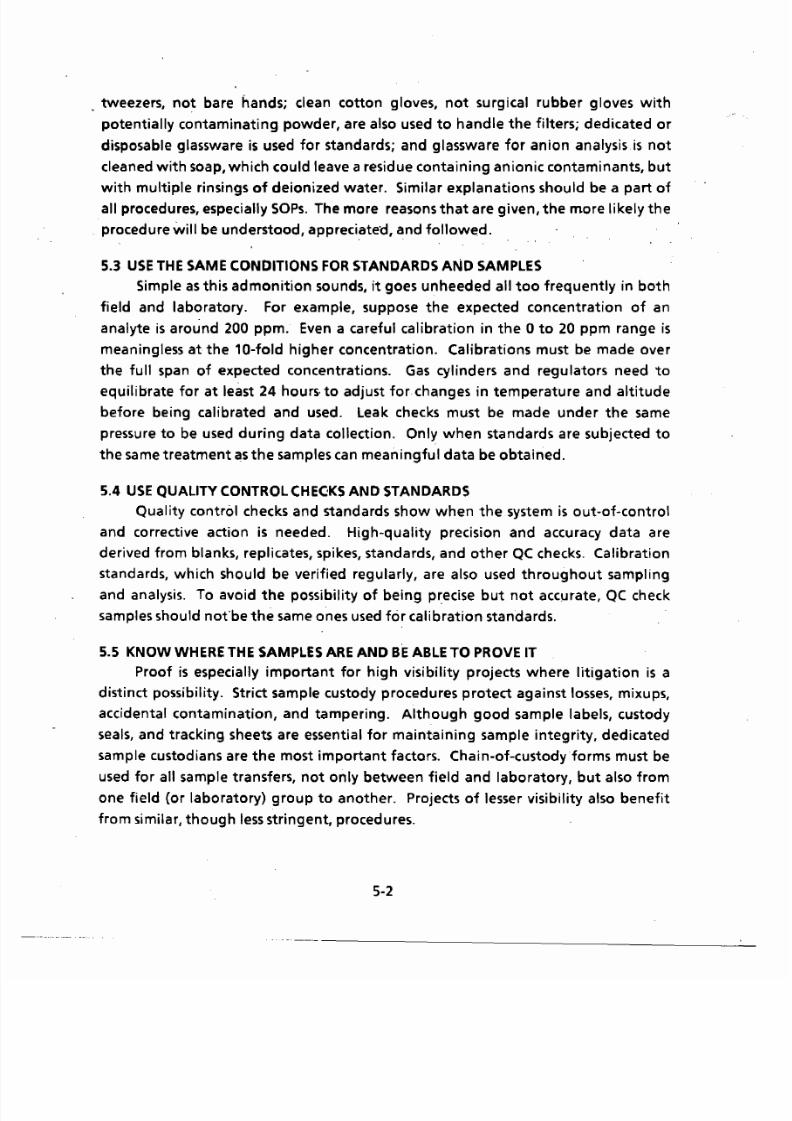
· tweezers, not bare hands; clean cotton gloves, not surgical rubber gloves with
potentially contaminating powder, are also used to handle the filters; dedicated or
disposable glassware is used fo r standards; and glassware for anion analysis is not
cleaned with soap, which could leave a residue contain ing anionic contaminants, but
with multiple rinsings of deionized water. Similar explanations should be a part ofall procedures, especially SOPs. The more reasons that are given, the more likely the
procedure will be understood, appreciated, and followed.
5.3 USE THE SAME CONDITIONS FOR STANDARDS AND SAMPLES
Simple as this admonition sounds, it goes unheeded all too frequently in both
fie ld and laboratory. For example, suppose the expected concentration of an
analyte is around 200 ppm. Even a careful calibration in the 0 to 20 ppm range is
meaningless at the 10-fold higher concentration. Calibrations must be made over
the full span of expected concentrations. Gas cylinders and regulators need toequilibrate for at least 24 hours· to adjust fo r changes in temperature and altitude
before being calibrated and used. Leak checks must be made under the same
pressure to be used during data collection. Only when standards are subjected to
the same treatment as the samples can meaningful data be obtained.
5.4 USE QUALITY CONTROL CHECKS AND STANDARDS
Quality control checks and standards show when the system is out-of-control
and corrective action is needed. High-quality precision and accuracy data are
derived from blanks, replicates, spikes, standards, and other QC checks. Calibration
standards, which should be verified regularly, are also used throughout sampling
and analysis. To avoid the possibility of being precise but not accurate, QC check
samples should nofbe the same ones used fo r calibration standards.
5.5 KNOW WHERE THE SAMPLES ARE AND B'E ABLE TO PROVE IT
Proof is especially important for high visibility projects where litigation is a
distinct possibility. Strict sample custody procedures protect against losses, mixups,
accidental contamination, and tampering. Although good sample labels, custody
seals, and tracking sheets are essential fo r maintaining sample integrity, dedicated
sample custodians are the most important factors. Chain-of-custodyforms must beused fo r all sample transfers, not only between field and laboratory, but also from
one field (or laboratory) group to another. Projects of lesser visibility also benefit
from similar, though less stringent, procedures.
5-2
- .---------------------------..:.
7/27/2019 EPA Q.A hand book for Environmental Quality Assurance
http://slidepdf.com/reader/full/epa-qa-hand-book-for-environmental-quality-assurance 31/54
SECTION 6
DATA COLLECTION AND HANDLING
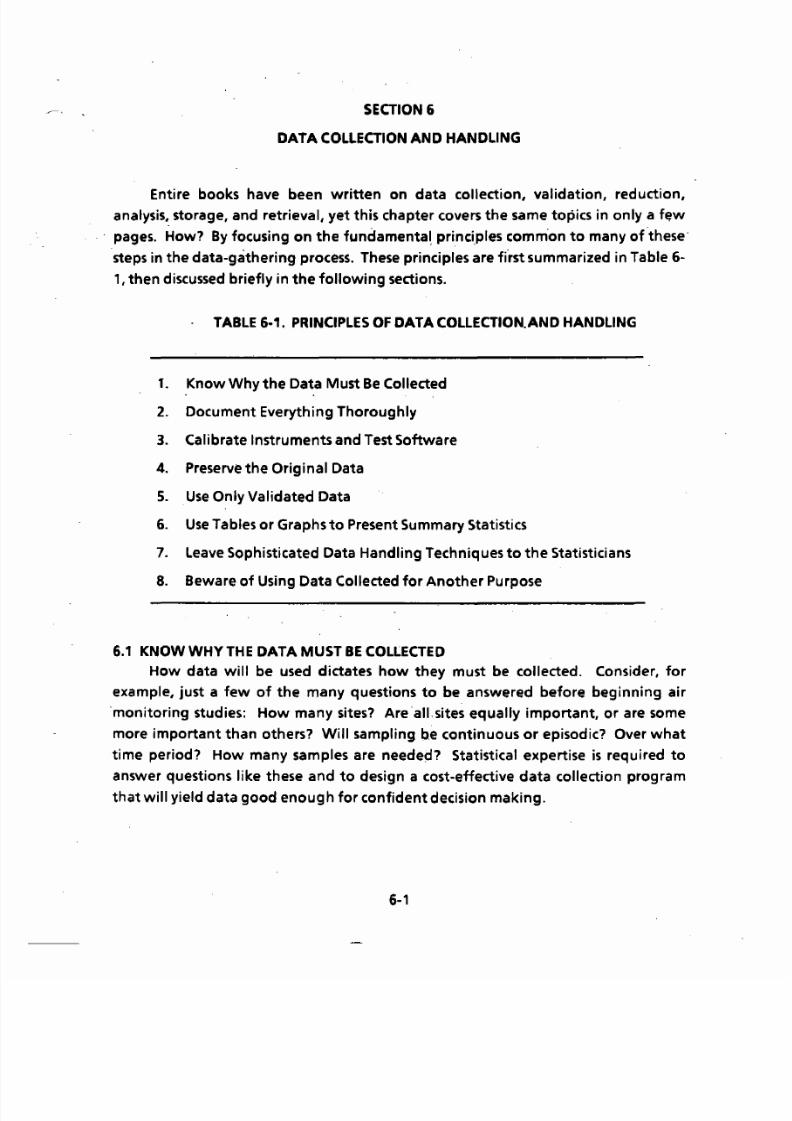
Entire books have been written on data collection, validation, reduction,
analysis, storage, and retrieval, yet this chapter covers the same topics in only a f ~ wpages. How? By focusing on the fundamental, princi,ples comm'on to many of these"
steps in the data-gathering process. These principles are ffrst summarized in Table 6-
1, then discussed briefly in the following sections.
TABLE 6·1. PRINCIPLES OF DATA COLLECTION.AND HANDLING
1. Know Why the Data Must Be Collected
2. Document Everything Thoroughly
3. Calibrate Instruments and Test Software
4. Preserve the Original Data
5. Use Only Validated Data
6. Use Tables or Graphs to Present Summary Statistics
7. Leave Sophisticated Data Handling Techniques to the Statisticians
8. Beware of Using Data Collected fo r Another Purpose
6.1 KNOWWHYTHE DATA MUST BE COLLECTED
How data will be used dictates how they must be collected. Consider, fo r
example, just a few of the many questions to be answered before beginning air
'monitoring studies: How many sites? Are "all, sites equally important, or are some
more important than others? Will sampling be continuous or episodic? Over what
time period? How many samples are n e e d e ~ ? Statistical expertise is required to
answer questions like these and to design a cost-effective data collection program
that will yield data good enough fo r confident decision making.
6-1
7/27/2019 EPA Q.A hand book for Environmental Quality Assurance
http://slidepdf.com/reader/full/epa-qa-hand-book-for-environmental-quality-assurance 32/54
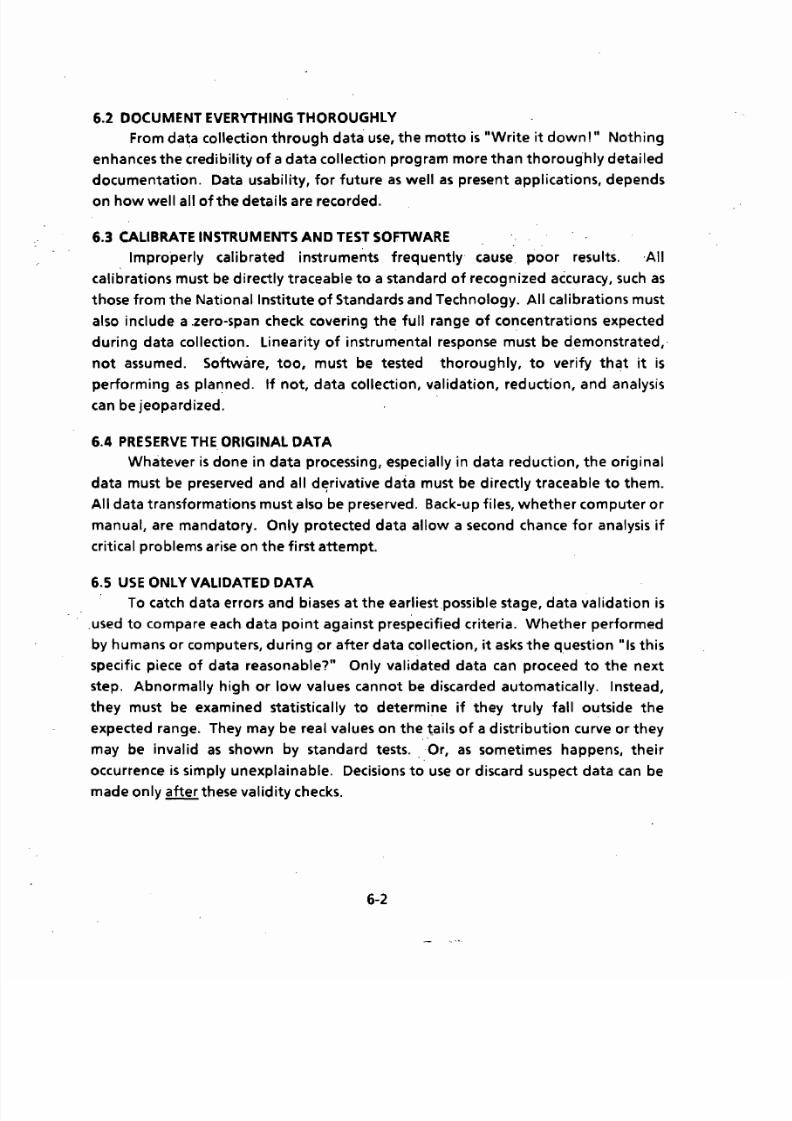
6.2 DOCUMENT EVERYTHING THOROUGHLY
From data collection through data use, the motto is "Write it down!" Nothing
enhances the credibility of a data collection program more than thoroug'hly detailed
documentation. Data usability, fo r future as well as present applications, depends
on how well all ofthe details are recorded.
6.3 CALIBRATE INSTRUMENTS AND TEST SOFTWARE
Improperly calibrated instruments frequently cause, poor results. ,All
calibrations must be directly traceable to a standard of recognized accuracy, such as
those from the National Institute of Standards and Technology. All cal ibrations must
also include a .zero-span check covering the full range of concentrations expected
during data collection. Linearity of instrumental response must be demonstrated,
not assumed. Software, too, must be tested thoroughly, to verify that it is
performing as planned. If not, data collection, validation, reduction, and analYSis
can be jeopardized.
6.4 PRESERVE THE ORIGINAL DATA
Whatever is done in data processing, especially in data reduction, the original
data must be preserved and all derivative data must be directly traceable to them.
All data transformations must also be preserved. Back-up files, whether computer or
manual, are mandatory. Only protected data allow a second chance fo r analysis i f
critical problems arise on the first attempt.
6.5 USE ONLY VALIDATED DATA
To catch data errors and biases at the earliest_possible stage, data val idation is
,used to compare each data point against prespecified criteria. Whether performed
by humans or computers, during or after data collection, it asks the question "Is this
specific piece of data reasonable?" Only validated data can proceed to the next
step. Abnormally high or low values cannot be discarded automat ical ly. Instead,
they must be examined statistically to determine if they truly fall outside the
expected range. They may be real values on the .tails of a distribution curve or they
may be invalid as shown by standard tests. ,Or, as sometimes happens, theiroccurrence is simply unexplainable. Decisions to use or discard suspect data can be
made only after these validity checks.
6-2
7/27/2019 EPA Q.A hand book for Environmental Quality Assurance
http://slidepdf.com/reader/full/epa-qa-hand-book-for-environmental-quality-assurance 33/54
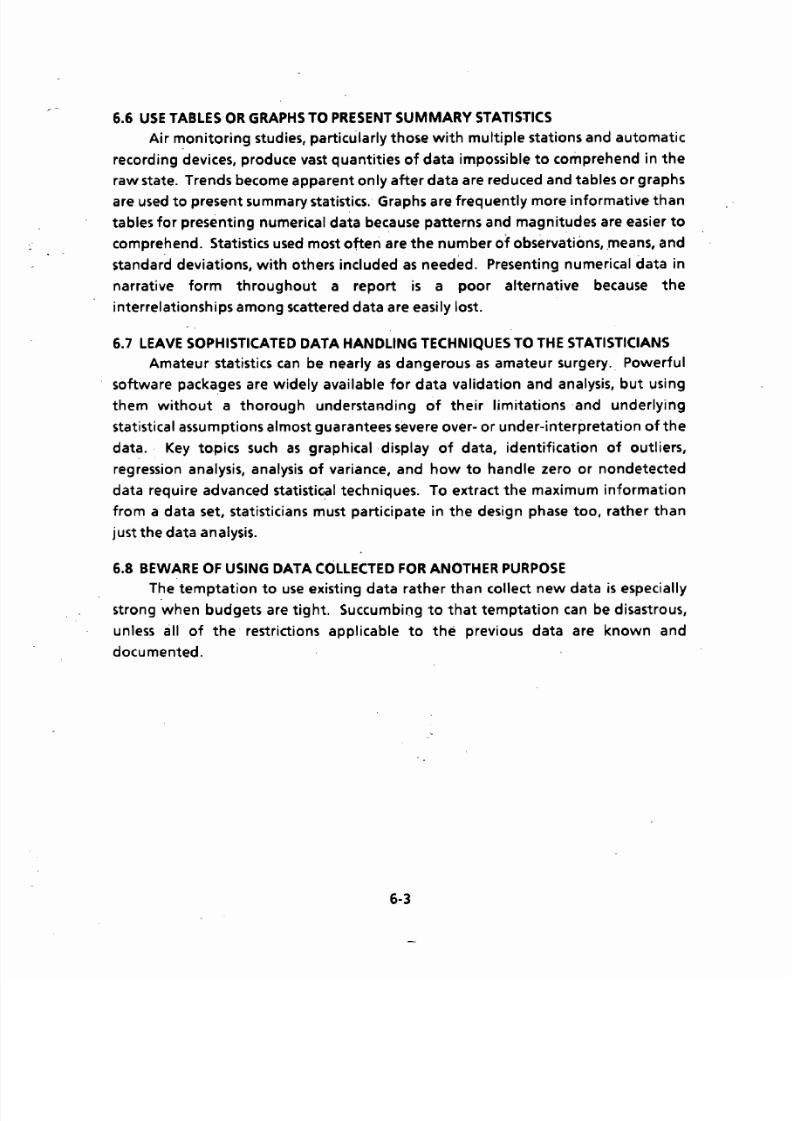
6.6 USE TABLES OR GRAPHS TO PRESENT SUMMARY STATISTICS
Air monitoring studies, particular ly those with mUltiple stations and automatic
recording devices, produce vast quantities of data impossible to comprehend in the
raw state. Trends become apparent only after data are reduced and tables or graphs
are used to present summary statistics. Graphs are frequently more informative than
tables fo r presenting numerical data bec.ause patterns and magnitudes are easier to
comprehend. Statistics used most often are the number of observations, means, and
standard deviations, with others included as needed. Presenting numerical data in
narrative form throughout a report is a poor alternative because the
interrelationships among scattered data are easily lost.
6.7 LEAVE SOPHISTICATED DATA HANDLING TECHNIQUES TO THE STATISTICIANS
Amateur statistics can be nearly as dangerous as amateur surgery. Powerful
software packa.ges are widely available fo r data validation and analysis, but using
them without a thorough understanding of their limitations and underlying
statistical assumptions almost guarantees severe over- or under-interpretation of the
data. Key topics such as graphical display of data, identification of outliers,
regression analysis, analysis of variance, and how to handle zero or nondetected
data require advanced s t a t i s t i ~ a l techniques. To extract the maximum information
from a data set, statisticians must participate in the design phase too, rather than
just the data analysis.
6.8 BEWARE OF USING DATA COLLECTED FOR ANOTHER PURPOSE
The temptation to use existing data rather than collect new data is especially
strong when budgets are tight. Succumbing to that temptation can be disastrous,
unless all of the restrictions applicable to the previous data are known and
documented.
6-3

7/27/2019 EPA Q.A hand book for Environmental Quality Assurance
http://slidepdf.com/reader/full/epa-qa-hand-book-for-environmental-quality-assurance 34/54
7/27/2019 EPA Q.A hand book for Environmental Quality Assurance
http://slidepdf.com/reader/full/epa-qa-hand-book-for-environmental-quality-assurance 35/54
SECTION 7
STATISTICAL TERMS'AND DATA QUALITY INDICATORS
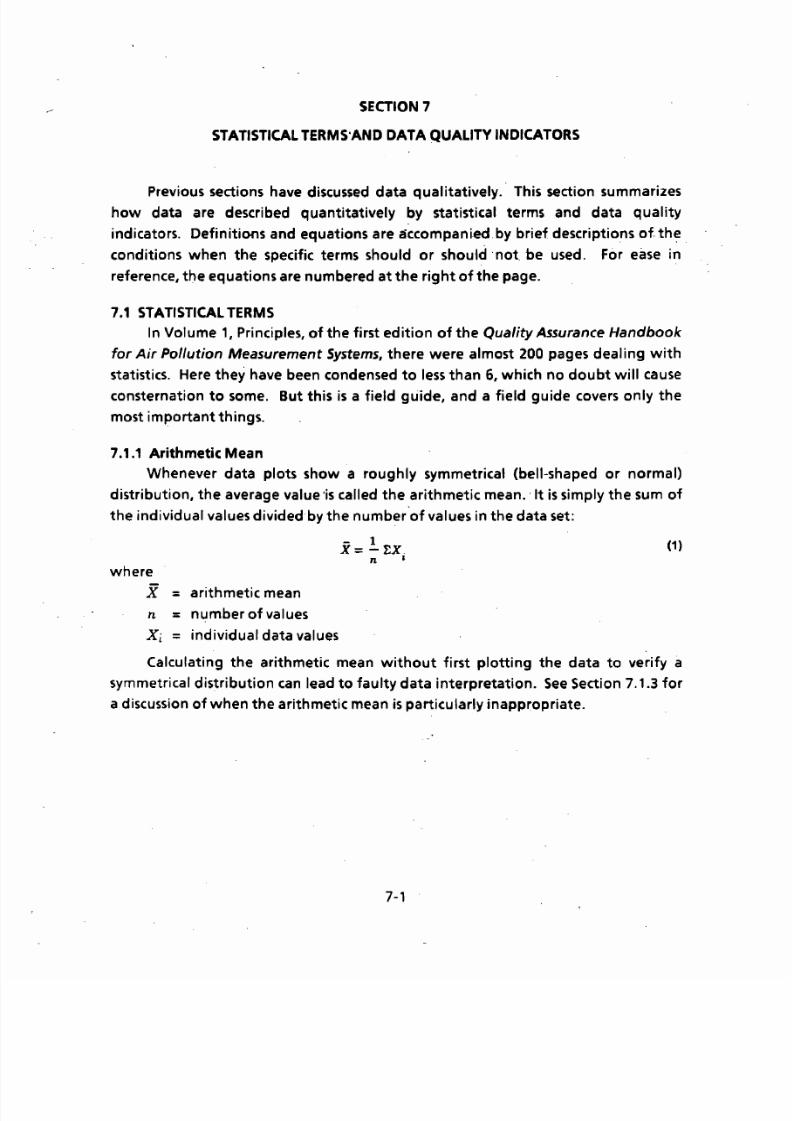
Previous sections have discussed data qualitatively. This section summarizes
how data are described quantitatively by statistical terms and data quality
indicators. Defin itions and equations are ~ c c o m p a n i e d . b y brief descriptions of h ~conditions when the specific terms should or should ·not be used. For ease in
reference, the equations are numbered at the right of the page.
7.1 STATISTICAL TERMS
In Volume 1, Principles, of the first edition of the Quality Assurance Handbook
fo r Air Pollution Measurement Systems, there were almost 200 pages dealing with
statistics. Here they have been condensed to less than 6, which no doubt will causeconsternation to some. But this is a field guide, and a field guide covers only the
most important things.
7.1.1 Arithmetic Mean
Whenever data plots show a roughly symmetrical (bell-shaped or normal)
distribution, the average value 'is called the arithmetic mean. ·I t is simply the sum of
the individual values divided by the number of values in the data set:
where
X = arithmetic mean
n = number of values
Xi = individual data values
- 1x= - !:X_
(1)n l
Calculating the arithmetic mean without first plotting the data to verify a
symmetrical distribution can lead to faulty data interpretation. See Section 7.1.3 for
a discussion of when the arithmetic mean is particularly inappropriate.
7-1
7/27/2019 EPA Q.A hand book for Environmental Quality Assurance
http://slidepdf.com/reader/full/epa-qa-hand-book-for-environmental-quality-assurance 36/54
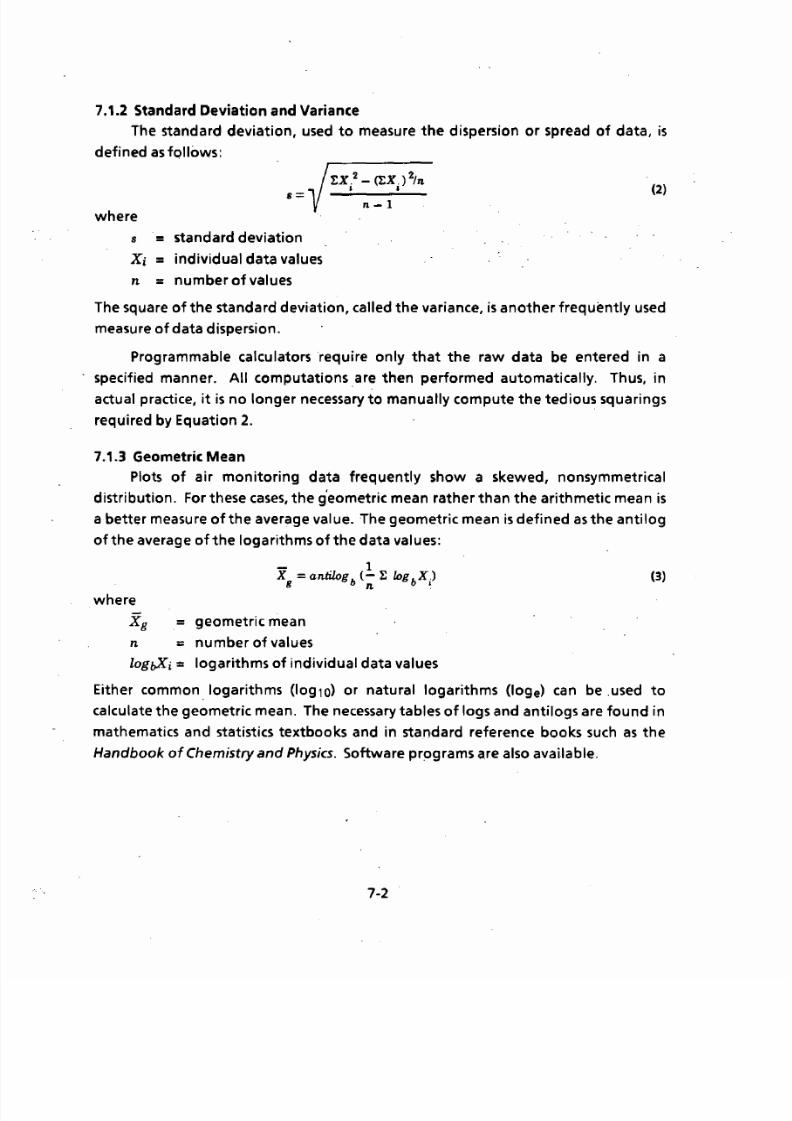
7.1.2 Standard Deviation and Variance
The standard deviation, used to measure the dispersion or spread of data, is
defined as fqllows:
8 =
where
s = standard deviation
Xi = individual data values
n = number of values
2 2EX. - (tX,) In
, , (2)n-l
The square of the standard devi'ation, called the variance, is another frequently used
measure of data dispersion.
Programmable calculators require only that the raw data be entered in a
specified manner. All computations are then performed automatically. Thus, inactual practice, it is no longer necessary to manually compute the tedious squarings
required by Equation 2.
7.1.3 Geometric Mean
Plots of air monitoring data frequently show a skewed, nonsymmetrical
distr ibution. For these cases, the g'eometric mean rather than the arithmet ic mean is
a better measure ofthe average value. The geometric mean is defined as the antilog
ofthe average of the logarithms of the data values:
- 1X = antilog
b(- E logbX,)
g n I(3)
where
Xg = geometric mean
n = number of values
logtXi = logarithms of individual data values
Either common, logarithms (log10) or natural logarithms (loge) can be .used to
calculate the geometric mean. The necessary tables of logs and antilogs are found in
mathematics and statistics textbooks and in standard reference books such as the
Handbook of Chemistry and PhYSics. Software p r ~ g r a m s are also available.
7-2
7/27/2019 EPA Q.A hand book for Environmental Quality Assurance
http://slidepdf.com/reader/full/epa-qa-hand-book-for-environmental-quality-assurance 37/54
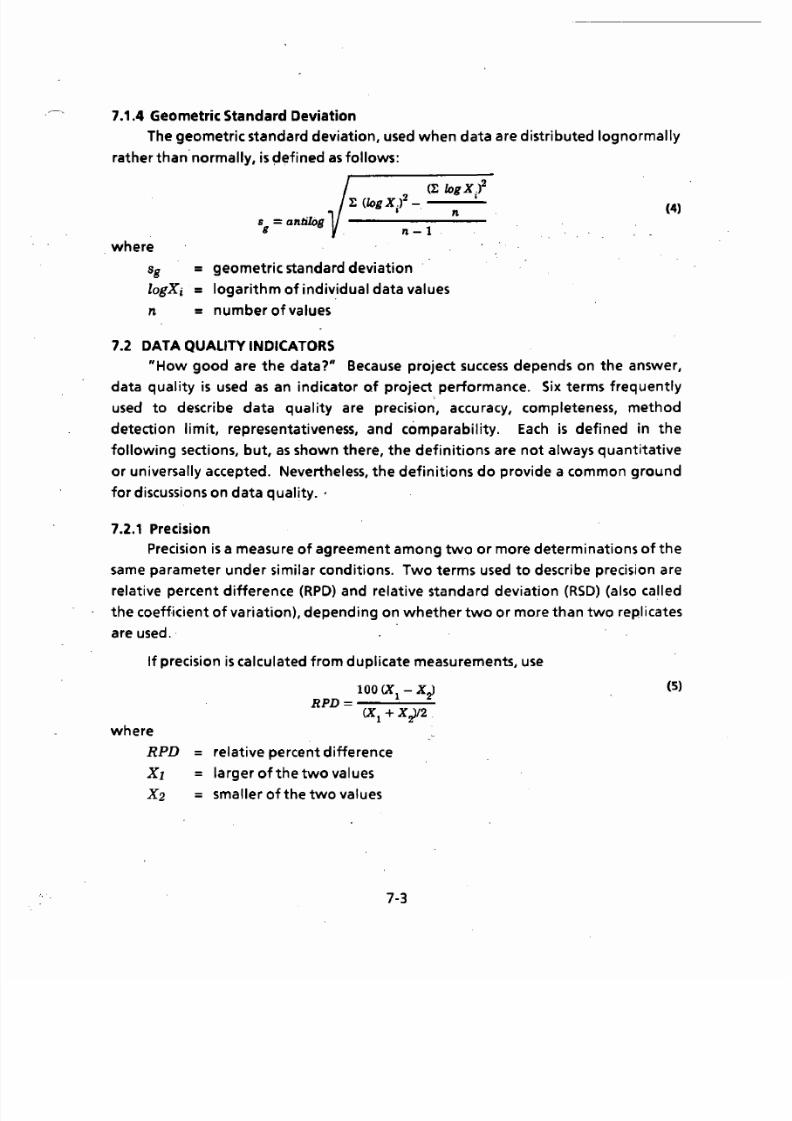
7.1.4 Geometric Standard Deviation
Th@ geometric standard deviat ion, used when data are distributed lognormally
rather than' normally, is ~ e f i n @ d as follows:
. where
s = antilOg8
Sg = geometric standard deviation
logXi = logarithm of indiv,idual data values
n = numberofvalues
7.2 DATA QUALITY INDICATORS
(4)
"How good are the data?" Because project success depends on the answer,
data quality is used as an indicator of project performance. Six terms frequently
used to describe data quality are precision, accuracy, completeness, method
detection limit, representativeness, and comparability. Each is defined in the
following sections, but, as shown there, the definitions are not always quantitat ive
or universally accepted. Nevertheless, the definitions do provide a common ground
fo r discussions on data quality. '
7.2.1 Precision
Precision is a measure of agreement among two or more determinations of the
same parameter under similar conditions. Two terms used to describe precision are
relative percent difference (RPD) and relative standard deviation (RSD) (also called
the coeff.icient of variation), depending on whether two or mOJe than two replicates
are used. '
If precision is calculated from duplicate measurements, use
where
RPDXIX2
100 (X l - X.)RPD=---
(Xl + X.}/2 .
= relative percent difference= larger of the two values
= smaller of the two values
7-3
(5)
7/27/2019 EPA Q.A hand book for Environmental Quality Assurance
http://slidepdf.com/reader/full/epa-qa-hand-book-for-environmental-quality-assurance 38/54
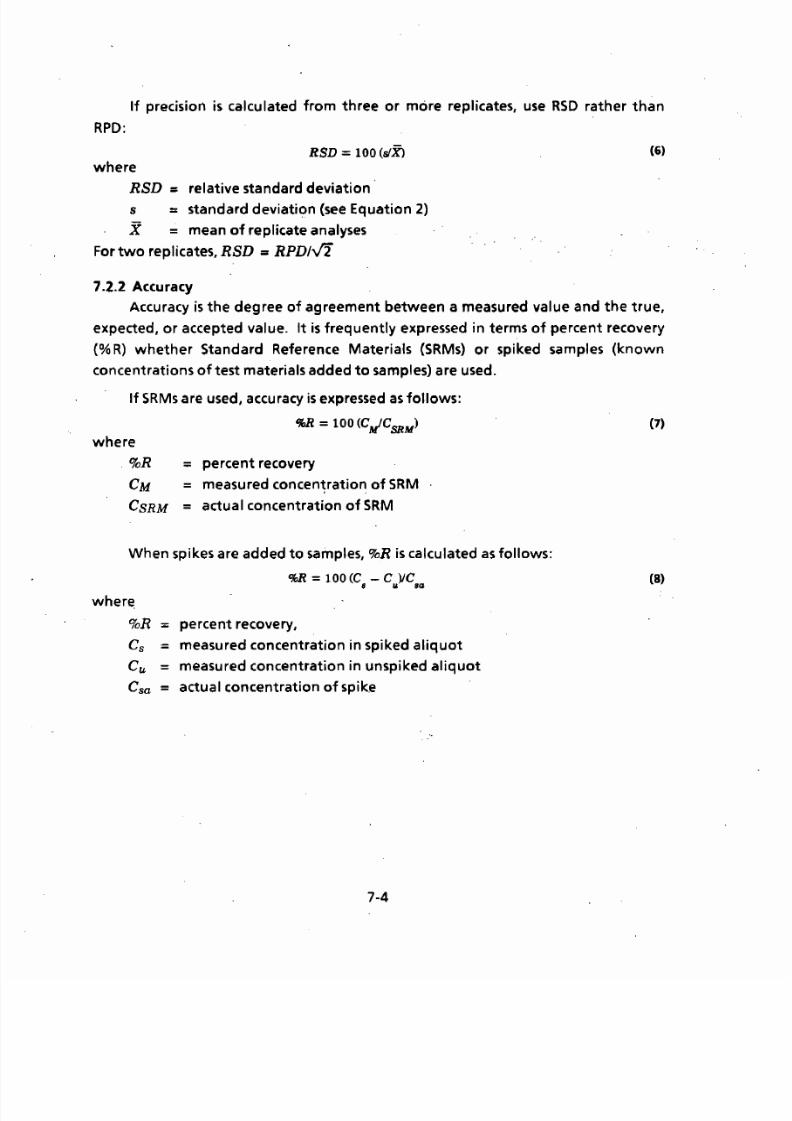
If precision is calculated from three or more replicates, use RSD rather than
RPD:
RSD = 100 (siX> (6)
where
RSD = relative standard deviation
s = standard deviation (see Equation 2)
X = mean of replicate analyses
For two replicates, RSD =RPD/V2
7.2.2 Accuracy
Accuracy is the degree of agreement between a measured value and the true,
expected, or accepted value. It is frequently expressed in terms of percent recovery
(% R) whether Standard Reference Materials (SRMs) or spiked samples (known
concentrations of test materials added to samples) are used.If SRMs are used, accuracy is expressed as follows:
where
%R
CM
CSRM
= percent recovery
= measured concentration of SRM. .
= actua I concentration of SRM
When spikes are added to samples, %R is calculated as follows:
%R = 100 (C - C )lC, U BO
w h e r ~%R :; ; percent recovery,
Cs = measured concentration in spiked aliquot
Cu = measured concentration in unspiked aliquot
Csa = actual concentration of spik.e
7-4
(7)
(8)

7/27/2019 EPA Q.A hand book for Environmental Quality Assurance
http://slidepdf.com/reader/full/epa-qa-hand-book-for-environmental-quality-assurance 39/54
When measurement systems fo r ambient air monitoring are audited, accuracy
is expressed as follows:
RPD = 100 (C - c)lem II II
where
RPl) = relative percent difference
Cm . - measured value of audit standard
Co. = actual value of audit standard
7.2.3 Completeness
(9)
Completeness is a measure of the amount of valid data obtained compared
with that expected to be obtained under normal operating conditions. It is defined
as follows fo r all measurements:
%C = 100 (n In ).11
(10)
where
%C = percent completeness
nv = number of valid measurements
n = total number of planned measurements
The above equation is a simplified definition. In actuality, %C must be tied to the
specific statistical level of confidence needed'for decision making. Obviously, a
decision needing, saY,a 99% confidence level needs more valid data than one
requiring only an 80% level. A statistician should be consulted fo r guidance on this
topic.
7.2.4 Method Detection Limi t
. The method detection l imit (MOL), the lowest concentration of an analytethat
can be measured by a given procedure, is as much a statistical as an analytical
concept, and there are numerous definitions. One definition favored by statisticians
is as follows:
where
MDL
s
t(n-I, I -a = 0,99)
MDL = t(Il-l. I -a"" 0.99)
(11)
L
= method detection liniit
= standard deviation' of the replicates at the lowestconcentration
= Student's t-value appropriate to a 99% confidence leveland a standard deViation estimate with n-1 degrees offreedom
7-5

7/27/2019 EPA Q.A hand book for Environmental Quality Assurance
http://slidepdf.com/reader/full/epa-qa-hand-book-for-environmental-quality-assurance 40/54
Field and laboratory personnel frequent ly use a much simpler version:
MDL = (N)(s) (12)
where
MDL = method detection limit
N = a multiplier between 3' and 10s :: standard deviation
7.2.5 Representativeness
Representativeness expresses how closely a sample reflects the characteristics
of the substance fo r which it is a surrogate. Ideally, the representativeness of the
sample would be 100%; practically, however, the quantitative value is rarely known.
Every effort is made to ensure that the sample is truly representative, by using such
techniques as thorough mixing to obtain homogeneity, duplicate analyses, and such.
Problems with uniformity are not so great with air samples as with liquids or solids
because of the nature of the air media.
7.2.6 Comparability
Comparability refers to how confidently one data set can be compared with
another. Ideally, all data would be completely comparable, so comparability would
be 100%. Practically, because t ~ e data were collected under different conditions
and fo r different purposes, comparing data sets must be done very cautiously. See
Section 6_8 fo r more details.
7-6

7/27/2019 EPA Q.A hand book for Environmental Quality Assurance
http://slidepdf.com/reader/full/epa-qa-hand-book-for-environmental-quality-assurance 41/54
SECTIONS
AUDITS
Managers need to know how well things are going on their projects. Is a
particular project performing according to specifications? An audit, a management
tool used to answer that question, is a formal, detailed .study of one or more aspects
of a project by independent auditors. The ·project is not audited at random, bu t
against specific criteria previously determined by the manager to be critical to
project success. Many audits are held shortly after the project has become
operational, to detect and correct problems before they affect data quality
adversely.
A cooperative effort of auditors and auditees (to gather the needed
information efficiently and completely) gives the best results. There is no room fo r
"Gotcha!" in any audit.
The audit report describes any problems found and may suggest appropriate
corrective actions. Equally important, it also covers those aspects that were
operating as specified. Thus, t ~ e manager learns what is going well, not just what
needs attention.
An audit focuses on one or more of the following components of a project.
• People
• Proced ures
• Equipment
• Data
• Documentation
The success of any project depends on how well the people follow procedures,
operate equipment, collect and interpret data, and carefully document their
activities.
8.1 DOCUMENTATION
A poor paper trail can lead to even poorer audit results. During their on-site
visit, auditors can observe only the cUrrer.1t operations first hand; fo r previous ones,
they must depend on written documentation. Verbal assurances from the auditees
8-1
7/27/2019 EPA Q.A hand book for Environmental Quality Assurance
http://slidepdf.com/reader/full/epa-qa-hand-book-for-environmental-quality-assurance 42/54
are not enough to convince the auditors that proper procedures had, indeed, been
-followed. Only clear, complete, written documentation can do that.
8.2 AUDIT TYPES
The QA project plan is the basis fo r all four audit types described in thefollowing sections. Although the audit is used to determine w ~ e t h e r criteria
stipulated 1n the plan are being met, any. additional findings are also included in the'
report.
8.2.1 Technical Systems Audit
The technical systems audit, a qualitative on-site evaluation of an entire
measurement'system, is used frequently in an air monitoring program, It looks at
everything - all facilities, equipment, systems, record keeping, data validation,
operations, maintenance, calibration procedures, reporting requirements, and QC
procedures. ,Findings from this,global r e v i e ~ c a ~ then be used to focus efforts on
specific parts of the measurement system that need attention to obtain the desired
data quality. Systems audits are normally done immediately before, or shortly after,
measurement systems are operational, and should also be performed on a regularly
scheduled basis throughout the lifetime of the project.
8.2.2 Performance-Evaluation Audit
The performance evaluation audit, also used frequently in air monitoring
studies, is a quantitative evaluation of a part or parts of a measurement system,
including all associated data acquisition and reduction procedures. It involves the
analysis of a reference material of known value or composition and critical to the
success of the project. -The reference material is usually disguised as a typical p r o j ~ c tsample so that the operator or analyst will riot give it any undue special attention,
Long-term projects require regularly scheduled performance audits. Although a
performance audit may show that a system is out-of-control, a systems audit may be
needed to pinpoint the cause and target the corrective action.
8.2.3 Audit of Data Quality
An audit of data quality exhaustively evaluates the methods used to collect,interpret, and report data quality. The following criteria are evaluated against the
QA project plan and other pertinent guidelines:
8-2

7/27/2019 EPA Q.A hand book for Environmental Quality Assurance
http://slidepdf.com/reader/full/epa-qa-hand-book-for-environmental-quality-assurance 43/54
• Recording and transfer of raw data
• Calculations, including equations used fo r presentation of data
• Documentation of data-handling procedures
• Selection and discussionofdata-quality indicators, including precision,accuracy, representativeness, comparabi lity, and completeness
8.2.4 Management Systems Audit ,
A management systems audit (or review) examines the structures and processes
used by management to achieve the desired data quality. Broad in scope, it
frequently covers multiple projects within a larger program. laboratory and field
personnel rarely participate directly in this type of audit.
8.3 AUDIT PROCEDURES
Detailed planning is the essence of any good audit. Without it , the resulting
chaos causes short tempers and sloppy work; with it, the ensuing cooperation fosters
harmony and success. In addition to auditor and auditee, a third party, the sponsor,
plays a key role. As commonly occurs in government and industry, a sponsor funds
the project and requests the audit. The following sections describe critical
interactions among these three,parties. If only auditor and auditee are involved, the
audit procedure is simpler because the auditor assumes the functions of the sponsor.
8.3.1 Preaudit Activities
Decisions made by the sponsor in the preaudit planning phase determine the
course of the audit. As shown in the following summary, all, three parties
communicate extensively to ensure that there will be no hidden agendas and no
surprises.
A. RESPONSIBILITIES OF THE SPONSOR
The sponsor's project manager and QA manager decide on the following
audit details.
(1) Intent, scope, cost, and frequency o-f auditing activities
(2) Parts of project to be audited
(3) Audit schedule
(4) Qualifications needed fo r auditors
8-3
7/27/2019 EPA Q.A hand book for Environmental Quality Assurance
http://slidepdf.com/reader/full/epa-qa-hand-book-for-environmental-quality-assurance 44/54
(5) Action to be taken by auditors if they discover out-of-controlsituations
(6) Potential fo r organizational conflict of interest between auditors,and auditees
(7) Selection of proposed auditors
Of these items, (5) is the most critical. Out-at-control ,situations can arise, '
in the tield, the laboratory, or in data handling operations, What shoutd
the auditors do? Correct the problem immediately and cite it in the
report? Take no corrective action and cite the problem in the report?
Use some other approach? Whatever the answer, it must be spelled out
and agreed upon by all parties before the audit can begin. The sponsor's
project manager then notifies the auditee of the purpose and scope of
the audit and requests comments on the following items.
(8) Acceptability of preceding points (1) through (7)
(9) Actual or perceived, current or potential, conflicts of interest
(10) Necessity fo r a preaudit, face-to-face meeting of auditor, auditee,and sponsor
(11) Location, date, and time of meeting, i f requested in item (10)
B. RESPONSIBILITIES OF THE AUDITEE
The auditee or the sponsor's project manager then sends the following
information to the auditor.
(1) Details of project operation (SOPs, site locations, QA project plan,operator proficiency and training, sampling schedule, etc.)
(2) Name of person to contact fo r additional information
C. RESPONSIBILITIES OF THE AUDITOR
The auditor responds by sending the following information to the auditee.
(1) Standard operating procedures to be, used in the audit
(2) Parts of the project to be audited, and by whom
(3) Qualifications of the auditors
8-4
7/27/2019 EPA Q.A hand book for Environmental Quality Assurance
http://slidepdf.com/reader/full/epa-qa-hand-book-for-environmental-quality-assurance 45/54
(4) Name of person to contact fo r additional information
(5) Authority and responsibility of the auditors to take action if aproblem is found . .
Note: All parties must address all of the above points and cometo an agreement on them before the audit begins.
8.3.2 Conducting the Audit
The audit should proceed smoothly because of the preaudit agreements. Steps
in the actual audit are as follows.
A. The audit is conducted according to the preaudi t agreements. If anyparty feels that changes are needed, it must then notify all otherparties and gain approval before deviat ing from the agreements.
B. Auditor informs auditee (on site or by phone/faX/E-Mail, asappropriate) of preliminary audit findings and recommendations fo rcorrective action. .
C. Auditor tries to resolve any disagreements before feaving the site.
D. If disagreements between auditee and auditor cannot be resolved,auditor contacts spon.sor's project manager, QA manager, or theauditee's project manager, depending on the preaudit agreements.
E. In the audit report, the auditor includes the outcome of thispostaudit discussion and identifies still unresolved disagreements.
8.3.3 Preparation of the Audit Report
An audit report is the last step in the auditing process. As shown in the
sequence below, the auditee has significant input.
A. Auditor briefs sponsor's project manager and QA manager on theaudit findings.
B. Auditor prepares draft audit report and submits it, and all support ingdata, to the QA manager.
C. The QA manager determines i f report meets the sponsor'sguidelines fo r clarity, accuracy, completeness, etc. (I f not, the reportis returned fo r revision.) ' .
D. Once the draft report is accepted by the QA manager, it is sent toboth the sponsor's project manager and to the auditee.
8-5

7/27/2019 EPA Q.A hand book for Environmental Quality Assurance
http://slidepdf.com/reader/full/epa-qa-hand-book-for-environmental-quality-assurance 46/54
E. The sponsor's project manager and the auditee send their writtencomments to the QA manager, not to the auditor.
F. After reviewing the comments, the QA manager discusses them withthe auditor, and, 'if necessary, arranges a meeting of all appropriateparties. If disagreements remain, the QA manager will recommendto the sponsor a course of action such as
(1) Repeat the part of the audit in question;
(2) Issue the audit report, but include a statemtmtthat the auditeehas questioned a particular audit finding; or '
(3) Delete the item(s) under question from the report.
If disagreements still remain, the sponsor's project manager receives the final,
report only after the sponsor has approved the proposed course of action. If
there are no disagreements, the QA manager releases the final report to the
sponsor's project manager, with a copy to the sponsor and the auditee.
8.3;4 Postaudit Report Activit ies
The audit report is not the end of the audit. If major problems were
discovered, the auditee must institute corrective action (see Section 9). If the
problems were critically compromising to data quality, a special follow-up audit
might be necessary to verify that the corrective action was adequate to allow data
collection to resume. Corrective actions for minor problems are checked at the next
regularly scheduled audit.
8-6
7/27/2019 EPA Q.A hand book for Environmental Quality Assurance
http://slidepdf.com/reader/full/epa-qa-hand-book-for-environmental-quality-assurance 47/54
SECTION 9
CORRECTIVE ACTION
Few projects run perfectly; fewer still automatically correct the many problems,
large and small, that inevitably arise. For that, competent, responsible people are
required. Both assigning and accepting responsibility are critical to the succe5s of
. any corrective action plan ..
9.1 ROUTINE MEASUREMENTS
Many corrective action plans are already embedded in the QC checks used fo r
all routine measurements. Acceptance criteria or tolerance limits are contingency
plans that state that "If this happens, then WE will do the following:". The nWEn
cannot be left unspecified in the corrective action plan; a person or persons(chemical analyst, stack sampling operator, etc.) must be designated by title or
function, and, if possible, by name. A statement such as nl f this measurement
activity is out of control, all sampling will be stoppednis unacceptable because it
does not indicate who is responsible for making that decision.
Field and laboratory personnel will be able to make most of the corrective
actions needed. They must then document these actions in the appropriate
notebooks or logbooks so that a record exists of the problems encountered and the
solutions discovered.
9.2 MAJOR PROBLEMS
Sometimes, however, problems occur that field and labt?ratory staff members
are u n a b ~ e to solve, despite their best efforts. ,These problems can a r i s ~ during
routine operations or as a result of performance evaluation and technical systems
audits. Staff members must immediately bring these major problems to the
attention of their supervisor or other individuals designated in their test or QA
project plans to handle the problem. Because many individuals could become
involved in the corrective action, the notification is best done by a standard
corrective action form, a copy of which is shown in Figure 9-1.
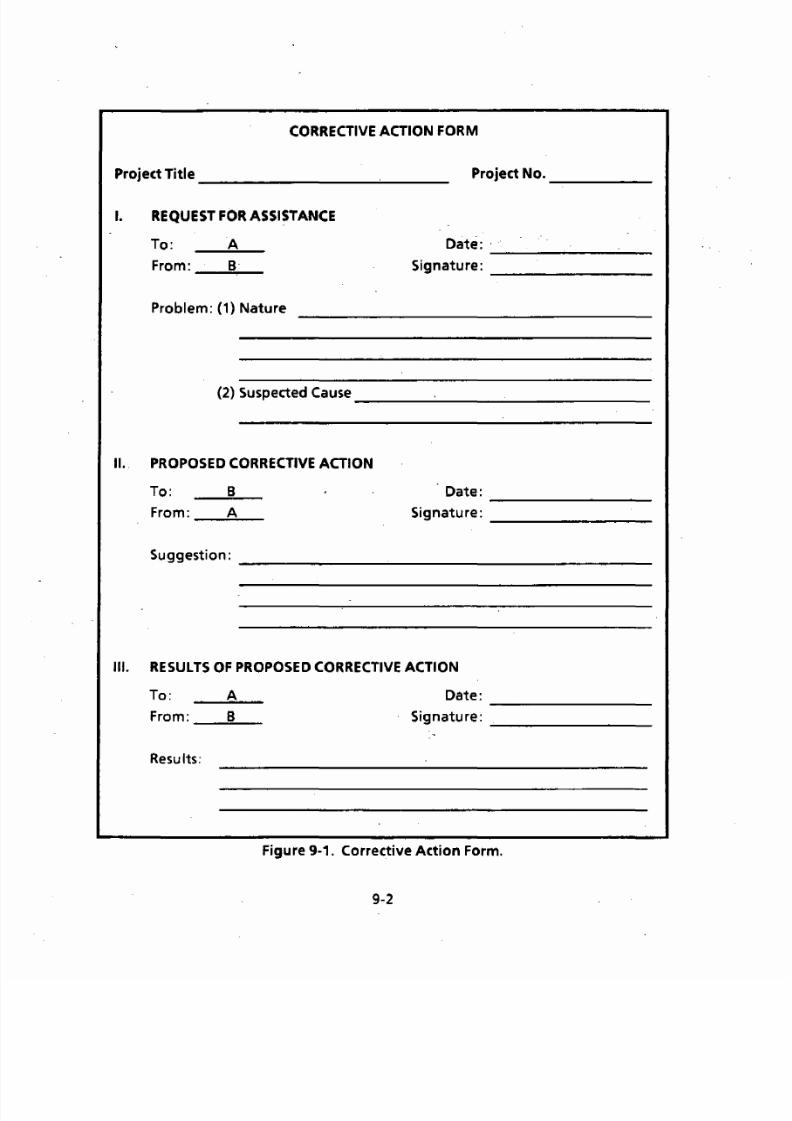
7/27/2019 EPA Q.A hand book for Environmental Quality Assurance
http://slidepdf.com/reader/full/epa-qa-hand-book-for-environmental-quality-assurance 48/54
CORRECTIVE ACTION FORM
Project Title_________ '- -__ Project No.-----I. REQUEST FOR ASSISTANCE
To: A Date: _ .- - - - - - - - - -From: _--=B:,...-_ Signature: ________
Problem: (1) Nature
(2) Suspected Cause--------------------II.. PROPOSED CORRECTIVE ACTION
To: B Date: - - - - - - - - - -From: _---.A..:....-_ Signature: _______
Suggestion: _________ --'-______________
III. RESULTS OF PROPOSED CORRECTIVE ACTION
To: A Date: ---------From: _---=B;......._ Signature: ~ - - - - - - -Results:
Figure 9·1. Corrective Action Form.
9-2
7/27/2019 EPA Q.A hand book for Environmental Quality Assurance
http://slidepdf.com/reader/full/epa-qa-hand-book-for-environmental-quality-assurance 49/54
The form has three parts:
• Request for Assistance
• Proposed Corrective Action
• Results of Proposed Corrective Action
A three-part, no-carbon:-required, corrective action form is highly recommended,
especially for field use, where photocopiers are rarely available. Space is provided
fo r signatures and a brief outline of the problem, the proposed solution, and the
results. Each person signing the form should feel free to attach any other needed
material, but must also keep a copy of the complete packet in his or her own filesfor
ready access should a similar problem arise.
9-3

7/27/2019 EPA Q.A hand book for Environmental Quality Assurance
http://slidepdf.com/reader/full/epa-qa-hand-book-for-environmental-quality-assurance 50/54
7/27/2019 EPA Q.A hand book for Environmental Quality Assurance
http://slidepdf.com/reader/full/epa-qa-hand-book-for-environmental-quality-assurance 51/54
SECTION 10
BIBLIOGRAPHY
1. American National Standard: Generic Guidelines fo r Auditing of QualitySystems. ANSI/ASQC Standard Q1-1986. American Society fo r Quality Control,Milwaukee, Wisconsin. 1986. 13 pp.
Detailed description and flow charts of the entire auditing process.
2. Dixon, W,J. and F,J. Massey, Jr. 1969 Introduction to Statistical Analysis, Third-Edition. New York, NY: McGraw-Hili, Inc. -
-A clearly written basic textbook, still a standard fo r statistical analysis.
3. Interim Guidelines and Specifications for Preparing Quality Assurance ProjectPlans. QAMS-005/80. U.S. Environmental Protection Agency, Washington, DC.
1980.
The ancestor of all U.S. EPA guidance' documents for preparing QAproject plans. Still the standard, but will be replaced in 1993 by acompletely new document consistent with recommendations of theAmerican Society fo r Quality Control and the American NationalStandards Institute.
4. Porter, L.F. Guideline. for Design, Installation, Operation, and QualityAssurance fo r Dry Deposition Monitoring Networks. EPA/600/3-88/047. U.S.Environmental Protection Agency, Research Triangle Park, NC. 1988. 500 + pp_
Practical guidance on the design of monitoring projects andassociated QA/QC. Lengthy and detai led, but a readable format.Covers all phases from design to installation to implementation ofmonitoring networks.
5. Simes, G.F. Preparing Perfect Project Plans: A Pocket Guide fo r thePreparation of Quality Assurance Project Plans. EPA/600/9-89/087. U. S.
Environmental Protection Agency, Cincinnati, OH. 1989.62 pp.
A companion document to those listed in item (6) below. Uses four-category approach to project classification and associated QA. Foreach category, provides hints and checklists fo r preparing QA projectplans. ,
6. Simes, G.F. Preparation Aids fo r the Development of Category I (II, III, IV)
Quality Assurance Project Plans. ,EPAl600/8-911003, EPA/600/8-91/004,EPAl600/S-91/005, EPAl600/S-91/006. U. S. Environmental Protection Agency,Cincinnati,OH. 1991.65,63,57,35 pp., respectively.
Companion documents to that listed in item (5) above. Uses a four-category approach to project c1assification and associated QA. For
10-1
7/27/2019 EPA Q.A hand book for Environmental Quality Assurance
http://slidepdf.com/reader/full/epa-qa-hand-book-for-environmental-quality-assurance 52/54
each category, gives more detail than the Pocket Guide. Includesmany examples of summary tables fo r presenting QA requirements.
7. Quality A$surance Handbook fo r Air Pollution Measurement Systems. U.S.Environmental Protection Agency, Research Triangle Park, NC. Dates variable.
Volume I Now: A Field Guide to Environmental Qual ity Assurance.1993. Replacement for: Principles.EPA-600/9-76-00S,1976.
Volume II Ambient Air Spedfic Methods.EPA-600/4-77-027a,1977.
Volume III Stationery Source Specific Methods.EPAl600/4-77-027b,1977.
Volume IV Meteorological Methods.EPA/600/4-90/003, 1989.
Volume V Manual fo r Precipitation Measurement Systems.
EPA-600/4-82-042a &b, 1983.
A large 5-volume compendium of all things related to ambient airmeasurements, including, but not restricted to, test methods,sampling, analysis, and QA. Individual methods revised occasionallysince 1976, but many are both out of date and out of print. Use theEPA document numbers shown above to obtain the most recentupdates if available. Major revisions are planned fo r the entireHandbook. Those fo r Volume I are completed with publication ofthis field guide. Work on Volumes II and III has begun. Volumes IVand V, published more recently, will be addressed later. Pendingfunding, the target for completing all revisions is the mid-1990s.
8. Quality Assurance Project Plan fo r the Atmospheric Research and ExposureAssessment Laboratory. U.S. Environmental Protection Agency, ResearchTriangle Park, NC. 1990.
Example of a 'broad gUidance document fo r an entire laboratoryrather than a single project. Emphasizes job descriptions, QAoversight requirements, and protocols for the preparation andreview of a wide variety of documents. Other U.S. EPA laboratorieshave similar plans tailored to their special needs.
*U.S. GOVERNMENT PRINTING OFFICE: 1994 • 550-00IIII03U
10-2

7/27/2019 EPA Q.A hand book for Environmental Quality Assurance
http://slidepdf.com/reader/full/epa-qa-hand-book-for-environmental-quality-assurance 53/54

7/27/2019 EPA Q.A hand book for Environmental Quality Assurance
http://slidepdf.com/reader/full/epa-qa-hand-book-for-environmental-quality-assurance 54/54