epa's ports initiative -...
TRANSCRIPT

EPA's Ports Initiative
June 8, 2016
May 17, 2016
U.S. Environmental Protection Agency
1
Reema Loutan
Mobile Source Section
US EPA Region 2

Why Focus on Ports?• Compelling public health need
– Concentrated emissions
– Urban high population density settings that are often also EJ areas
– Located in virtually every state that borders ocean, lake or major internal
seaway
• Freight Movement Emissions are increasing nationally
– A small annual percent growth translates into significant new port activity
• Increasing community pressure/interest
– Potential for conflict, long litigation
– Communities want to be more involved in the planning & decision process
• Need for better quantification/inventories for decision-making
• Need for dedicated sustainable funding
June 8, 2016 U.S. Environmental Protection Agency 2

Source: Jari Kauppila
Senior Economist, Head of Outlook and Statistics, OECD
Smart Freight Leadership, Leipzig, 26 May 2015
Global freight will more thanquadruple by 2050(by a factor of 4.3)
U.S. Environmental Protection Agency 3June 8, 2016
EPA’s Ports Initiative Background
• National Conversation With Port Stakeholders
Webinar Listening Sessions
– Sept 24, 2013 - Promoting Port Stakeholder Success
– Jan 14, 2014 - Goods Movement and Ports:
Collaborative Solutions & Community Impacts
– Mar 4, 2014 - Advancing Sustainable Solutions
• Port Stakeholders Summit—April 8, 2014
• Formed Ports Initiative Workgroup under Mobile Source FACA
(MSTRS/CAAAC) – May 2014
U.S. Environmental Protection Agency 4June 8, 2016
MSTRS Ports Initiative Workgroup Charge
• EPA asked MSTRS for recommendations on:
– Development of EPA-led voluntary environmental port initiative
– How to effectively measure AQ and GHG performance of ports
• The workgroup should consider:
– Past MSTRS and other recommendations
– Existing port environmental improvement programs
– Ports in the context of the broader transportation supply chain
– Information from EPA’s Assessments as available
U.S. Environmental Protection Agency 5June 8, 2016
MSTRS Port Workgroup Status
• Workgroup includes ports and port associations, shipping lines, environmental
organizations, manufacturers, retailers, transportation providers and state
government
• Workgroup is in the process of finalizing recommendations – Presentation to MSTRS on June 16
– Presentation to CAAAC at Fall meeting
• Many areas of consensus, but perspectives differ on: – What good looks like (inventory types, community engagement practices, appropriate emissions
reductions goals, measures for different ports)
– How voluntary program can ensure accountability, continued progress at ports
U.S. Environmental Protection Agency 6June 8, 2016

Supportive Materials
• Community-Port Capacity Building Tools
• Macro Assessment
• Port-Specific Assessment with Port Everglades
• Diesel Emission Reduction Program
• Collaboration with Regions and other EPA offices
• Federal Coordination through Committee on Marine
Transportation Systems
U.S. Environmental Protection Agency 7June 8, 2016

Near-port Community Capacity Building
• Pilot tools/resource materials promoting port/community decision-making
• Ports Primer for Communities
– Characterizes port sector – overview of planning & operations, environmental
& community health impacts
• Community Action Roadmap
– Companion for Ports Primer – Step by Step guide preparing community to
engage with port and local/regional stakeholders
• Environmental Justice Primer for Ports
• Post for Public Comment and Solicit Interest for Pilot Locations to Test Tools –
June 2016
• Announce Pilots - Fall 2016
U.S. Environmental Protection Agency 8June 8, 2016

Macro Port Assessment
• Purpose:
– Update our understanding of future national port-related
emissions for criteria, air toxics, and climate pollutants
– Assess the effectiveness of technological and
operational emission reduction strategies across ports
with different emissions profiles
– Inform national policy discussion for port initiatives
• Status:
– Draft final report under development
– Target release in summer 20169
U.S. Environmental Protection Agency

Macro Design
• Estimate 2011 baseline emissions for PM2.5, NOx, VOC, SO2, CO2, BC, and air toxics
• Estimate business-as-usual (BAU) inventories for 2020, 2030, and 2050 (CO2 only)
• Subtract emission reductions from BAU inventories under 2 scenarios: – Scenario A: Enhanced fleet turnover with existing
technologies and operational improvements
– Scenario B: More aggressive suite of strategies than Scenario A
10
U.S. Environmental Protection Agency

Non-OGV Strategies Modeled
Sector Strategy Specific Equipment
Drayage Trucks
Enhanced Fleet
TurnoverOn-road Trucks
Operational
Improvements
Rail
Enhanced Fleet
Turnover
Line Haulers,
Switchers
Operational
ImprovementsLine Haulers
Cargo Handling
Equipment
Enhanced Fleet
Turnover
Yard Trucks, RTG
Cranes, Container
Handlers
Harbor Craft Enhanced Fleet
TurnoverTugs, Ferries
11U.S. Environmental Protection Agency

OGV StrategiesSector Strategy Specifics
OGV
Fuel Changes
(lower sulfur levels,
LNG)
Propulsion & Auxiliary
Engines
Shore Power
Frequent Callers Only
(>5 calls for passenger,
>6 calls for container &
reefer)
Stack BonnetsNon-frequent Callers Only
(container & tanker)
Reduced Hotelling Container
12U.S. Environmental Protection Agency

Drayage Strategy Results
0
1,000
2,000
3,000
4,000
5,000
6,000
2020 2030
NOX Emissions (tons/year)
BAU Scenario A Scenario B
13U.S. Environmental Protection Agency

Background on Port-specific Assessment
• EPA’s Office of Transportation and Air Quality issued a call for interest:
U.S. EPA is Seeking to Partner with a Seaport to Assess
Port-Related Emissions Reduction Strategies
The objective of this opportunity is to refine and demonstratequantitative methodologies that ports, their stakeholders,researchers and others could use to assess the potential for futurecriteria pollutant and greenhouse gas (GHG) emissions reductionsunder various technology and operational implementationscenarios.
• Port Everglades submitted a letter to EPA and was selected in 2014

Overview of Assessment
• EPA and Port Everglades will work together to develop:– Future year emission inventories for 2020, 2030, and 2050
– Emission reduction strategy scenarios for:• Trucks
• Locomotives
• Cargo handling equipment
• Harbor craft
• Ocean-going vessels
– Emissions analysis of road, rail, and/or marine corridors
• This work will also inform future data and methods, lessons learned, and practical examples to share with other ports and stakeholders to support sustainable development

$80M in DERA Grant Funds Awarded to Ports
• $80 million in grants awarded to
projects focused entirely on
ports
– Includes $9.2M awarded for
2013 & 2014 DERA Port RFPs
• Another $68M in grants
awarded to projects that involve
ports
U.S. Environmental Protection Agency 16June 8, 2016

U.S. Environmental Protection Agency
• 2013: $750k awarded to Virginia Port Authority to replace Tier 1
shuttle carriers with Tier 4 hybrids
• 2014: $550k awarded to MARAMA to assist in replacement of
19 drayage trucks in DE and VA
• 2015: $1M awarded to PANYNJ to assist in replacement of 26
drayage trucks serving the Port of New York and New Jersey
Examples of DERA Funds at Ports
17June 8, 2016

Moving Freight
Sustainability Forward
While Reducing Costs and Enhancing
Energy Security
June 8, 2016
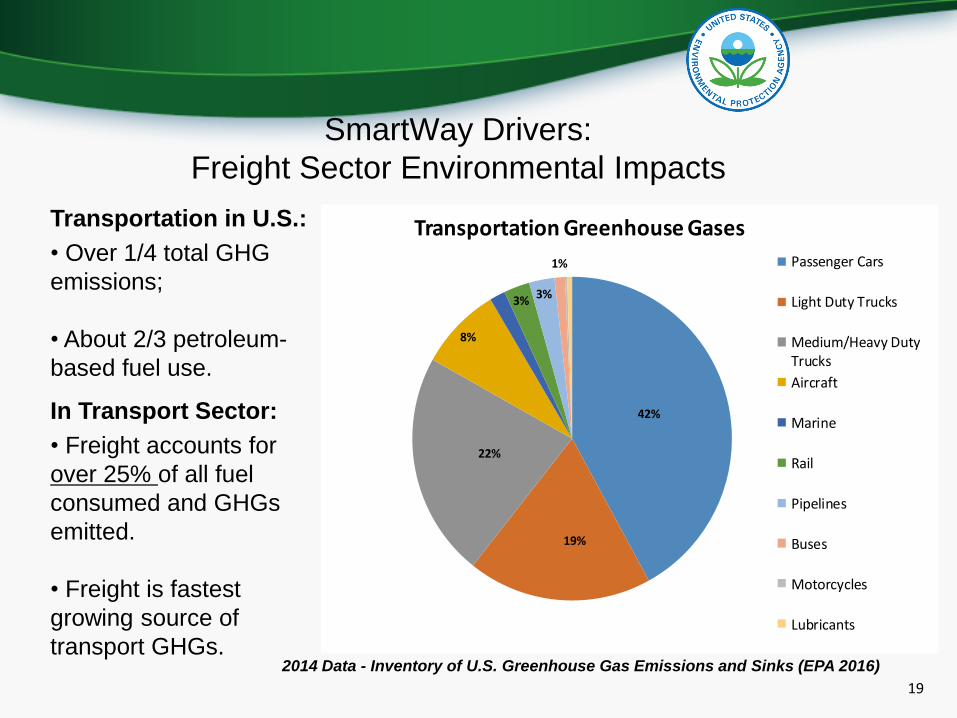
Transportation in U.S.:
• Over 1/4 total GHG
emissions;
• About 2/3 petroleum-
based fuel use.
19
SmartWay Drivers:
Freight Sector Environmental Impacts
In Transport Sector:
• Freight accounts for
over 25% of all fuel
consumed and GHGs
emitted.
• Freight is fastest
growing source of
transport GHGs.2014 Data - Inventory of U.S. Greenhouse Gas Emissions and Sinks (EPA 2016)
42%
19%
22%
8%
3%3%
1%
Transportation Greenhouse Gases
Passenger Cars
Light Duty Trucks
Medium/Heavy DutyTrucks
Aircraft
Marine
Rail
Pipelines
Buses
Motorcycles
Lubricants

2020
Source: National Oceanic and Atmosphere Administration
SmartWay Drivers: Climate Awareness

21
Changing Needs of Industry
Customer and Consumer awareness
Demanding corporate citizenship and accountability
Investor, Lender and Insurer requirements
Assessing climate risk and business opportunities
Rising and volatile energy prices
Fuel and driver wages are largest cost centers for truck
carriers: 64% of operating costs (2013)
Globalization of supply chains
Increasing global opportunities and global competition
Other countries’ carbon reporting requirements
ATRI: An Analysis of the Operational Costs of Trucking: A 2012 Update

22
SmartWay Snapshot
• Since 2004, SmartWay has grown to about 3,000 partners
with broad freight industry support in U.S. and Canada
Top 100 U.S. truck carriers
All Class 1 rail lines
Fortune 500 shippers from key economic sectors
Major logistics firms
• Since 2004, SmartWay Partners saved:
72.8 million metric tons of CO2
1,458,000 tons NOx and 59,000 tons PM
170.3 million barrels of oil and 7.2 billion gallons of fuel
$24.9 billion dollars in fuel costs
• Equivalent to eliminating annual energy use in over 6 million homes

23
Partner Spotlights

24
For more information:
www.epa.gov/smartway
SmartWay Helpline
734-214-4767
Reema Loutan
Mobile Source Section
US EPA Region 2
212-637-3760