epd enterprise product partners jan 2010 presentation
TRANSCRIPT

8/14/2019 EPD Enterprise Product Partners Jan 2010 Presentation
http://slidepdf.com/reader/full/epd-enterprise-product-partners-jan-2010-presentation 1/25
All rights reserved. Enterprise Products Partners L.P. All rights reserved. Enterprise Products Partners L.P.
UBS Wealth ManagementConference
January 27, 2010
Michael A. CreelPresident and CEO

8/14/2019 EPD Enterprise Product Partners Jan 2010 Presentation
http://slidepdf.com/reader/full/epd-enterprise-product-partners-jan-2010-presentation 2/25

8/14/2019 EPD Enterprise Product Partners Jan 2010 Presentation
http://slidepdf.com/reader/full/epd-enterprise-product-partners-jan-2010-presentation 3/25
All rights reserved. Enterprise Products Partners L.P. All rights reserved. Enterprise Products Partners L.P. 3
Key Investment Considerations
Largest publicly traded partnership based on market capitalization in the U.S.with a diversified, integrated midstream energy system serving producersand consumers of natural gas, NGLs, crude oil, petrochemicals and refined
products Approximately $31 billion enterprise value, $26 billion in assets and $19 billion
equity market capitalization
Accesses some of the most prolific natural gas, NGL and crude oil supply basins in
the U.S. including non-conventional and shale plays: Jonah / Pinedale, Piceance,Barnett Shale, Eagle Ford and Haynesville
Handles natural gas volumes equivalent to almost 20% of total U.S. demand
Serves 100% of U.S. ethylene steam cracking capacity, the largest market for NGLs
Large asset footprint generates growth opportunitiesInvestment grade credit rating; focus on cost of capital and financial flexibility;demonstrated access to capital in difficult markets
Balance distribution growth and retention of capital
Significant management ownership and industry experience

8/14/2019 EPD Enterprise Product Partners Jan 2010 Presentation
http://slidepdf.com/reader/full/epd-enterprise-product-partners-jan-2010-presentation 4/25 All rights reserved. Enterprise Products Partners L.P. All rights reserved. Enterprise Products Partners L.P. 4
Significant Management OwnershipInterests Aligned with Investors
One of the largest ownership positionsby management in the sector
EPCO has purchased approximately$900 million of new equity since IPO inJuly 1998; includes approximately$440 million purchased since 3Q 2008
EPCO has consistently supportedEPD’s growth including the eliminationof the GP’s 50% incentive distribution
right in 2002
Note: Percent ownership as of November 30, 2009.
* The 0.7% G.P. interest in DEP, 2% G.P. interest in EPD, and the 0.01% G.P. interest in EPE represents a 100% ownership of the respective G.P.
Enterprise Products
Partners L.P.
(NYSE: EPD)
2% G.P.Interest*
3.4% L.P.Interest
27.9% L.P.Interest
0.01% G.P.Interest*
77.9% L.P.Interest
58.6% L.P.Interest
NoIDRs
0.7% G.P.Interest*
Enterprise GP
Holdings L.P.
(NYSE: EPE)
Dan Duncan,
Enterprise Products
Company and
Affi liates
Duncan Energy
Partners L.P.
(NYSE: DEP)
1.0% L.P.Interest
No
IDRs

8/14/2019 EPD Enterprise Product Partners Jan 2010 Presentation
http://slidepdf.com/reader/full/epd-enterprise-product-partners-jan-2010-presentation 5/25 All rights reserved. Enterprise Products Partners L.P. All rights reserved. Enterprise Products Partners L.P. 5
Enterprise System MapExpanding into Refined Products & Crude Oil Logistics
Approximately 48,000 miles of natural gas, NGL, crudeoil, refined products and petrochemical pipelines
200 MMBbls of NGL, refined products and crude oilstorage capacity
27 Bcf of natural gas storage capacity25 natural gas processing plants
17 fractionation facilities
6 offshore hub platforms
NGL import / export terminals
Butane isomerization complex
Octane enhancement facility
One of the largest inland tank barge companies in U.S.
Asset Overview

8/14/2019 EPD Enterprise Product Partners Jan 2010 Presentation
http://slidepdf.com/reader/full/epd-enterprise-product-partners-jan-2010-presentation 6/25 All rights reserved. Enterprise Products Partners L.P. All rights reserved. Enterprise Products Partners L.P. 6
6%
4%
13%
57%
20%
$2.0 BillionGross Operating Margin
Nine Months Ended 09/30/09
Geographic and Business DiversificationProvide Multiple Earnings Streams
NGL Pipelines & Services (57%)
Natural gas processing & related NGL marketing activities
NGL fractionation plants
NGL pipelines and storage
Onshore Natural Gas Pipelines & Services (20%)
Natural gas pipelines & related marketing
Natural gas storage facilities
Petrochemical and Refined Products & Services (13%)
Refined products and petrochemical pipelines Butane isomerization facilities
Propylene fractionation facilities
Octane enhancement facility
Marine terminals & transportation
Onshore Crude Oil Pipelines & Services (6%) Crude oil pipelines, storage terminals & related marketing
Offshore Pipelines & Services (4%)
Natural gas pipelines
Crude oil pipelines
Platform services

8/14/2019 EPD Enterprise Product Partners Jan 2010 Presentation
http://slidepdf.com/reader/full/epd-enterprise-product-partners-jan-2010-presentation 7/25 All rights reserved. Enterprise Products Partners L.P. All rights reserved. Enterprise Products Partners L.P. 7
Trinity River Pipeline
ShermanExtension
Dependable cash flow
4.1 Bcf/d of subscribed capacity(including Sherman Extension)
Approximately 80% of capacity
subscribed by third parties withdemand charges; majority areproducers, utilities and powerplants
Little direct exposure to west /east basin spreads
Sherman Extension / TrinityRiver Lateral
Sherman Extension: 1.1 Bcf/dpipeline interconnects with Gulf
Crossing; began collectingdemand charges under 10-yearcommitments on August 1 for950 MMcf/d
Trinity River Lateral: 1 Bcf/d pipeline that extends from Sherman Extension into Trinity River Basin andNewark East Field producing areas
– Expected in-service: partial 4Q 2009; full 2Q 2010
Texas Intrastate Natural Gas P/L SystemSherman Extension Began Service August 2009

8/14/2019 EPD Enterprise Product Partners Jan 2010 Presentation
http://slidepdf.com/reader/full/epd-enterprise-product-partners-jan-2010-presentation 8/25 All rights reserved. Enterprise Products Partners L.P. All rights reserved. Enterprise Products Partners L.P. 8
Eagle Ford (“EF”) is more than a gas play; hasoil, associated gas and condensate, rich gasand lean gas
Rich gas has NGLs averaging 4–9 gallons per
thousand cubic feet of natural gasEPD’s system has access to more than700,000 acres of EF properties, with400,000 dedicated to EPD
EPD is constructing White Kitchen lateral
which will add more than 200 MMcf/d ofcapacity in 2Q 2010 Some segments already in service
Producers actively developing the play include Apache, Pioneer, ConocoPhillips, Lewis,
Murphy, EnCana, Anadarko, PetroHawk andEOG
Producers success and acceleration of theirdrilling programs has led EPD to exploreadditional investments in natural gas, NGL
and crude oil infrastructure to supportexpected production growth
EPD’s network of assets is well-situated tomaximize value of EF hydrocarbon production
White KitchenLateral
Eagle Ford Shale OpportunityPotentially 10 Million Acres Adjacent to EPD System

8/14/2019 EPD Enterprise Product Partners Jan 2010 Presentation
http://slidepdf.com/reader/full/epd-enterprise-product-partners-jan-2010-presentation 9/25 All rights reserved. Enterprise Products Partners L.P. All rights reserved. Enterprise Products Partners L.P. 9
Haynesville Shale OpportunityExtension of Acadian Gas Pipeline
Industry sources state Haynesville Shalehas potential to cover 2 million acres andto be 4th largest natural gas field in theworld with approximately 200 Tcf of
reservesInitial production rates are as high as30 MMcf/d; with estimated recoverablereserves of 4.5–8.5 Bcf per well
Haynesville pipeline project: 249-mile pipewith up to 2.1 Bcf/d of capacity; will provideproducers access to additional marketsoutside Perryville Hub
Provides Haynesville producers access to Acadian System, which has 150 end-use
markets, a storage facility and connection toHenry Hub
Additionally provides access to 9 interstatepipelines
Supported by long-term agreements with
7 producersExpected in service: September 2011
Acadian
TETCO
FGT
TGC
ANR
Transco
Cypress
Tennessee
Texas Gas
ColumbiaGulf
Sonat
Pipeline Interconnects
8/14/2019 EPD Enterprise Product Partners Jan 2010 Presentation
http://slidepdf.com/reader/full/epd-enterprise-product-partners-jan-2010-presentation 10/25 All rights reserved. Enterprise Products Partners L.P. All rights reserved. Enterprise Products Partners L.P. 10
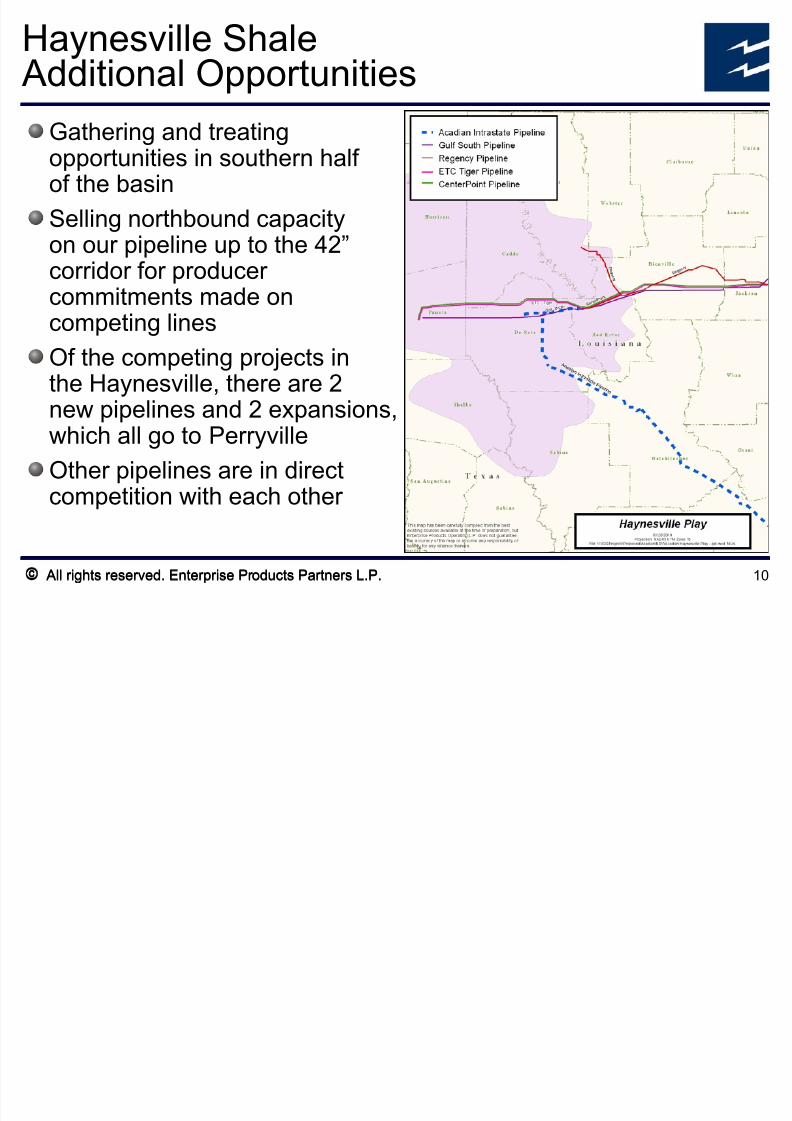
Haynesville Shale Additional Opportunities
Gathering and treatingopportunities in southern halfof the basin
Selling northbound capacityon our pipeline up to the 42”corridor for producercommitments made oncompeting lines
Of the competing projects inthe Haynesville, there are 2
new pipelines and 2 expansions,which all go to Perryville
Other pipelines are in directcompetition with each other

8/14/2019 EPD Enterprise Product Partners Jan 2010 Presentation
http://slidepdf.com/reader/full/epd-enterprise-product-partners-jan-2010-presentation 11/25
All rights reserved. Enterprise Products Partners L.P. All rights reserved. Enterprise Products Partners L.P. 11
Petrochemical / Ethylene Demand Has ReboundedNGLs are Preferred / Highest Margin Feedstock
0
200
400
600
800
1,000
1,200
1,400
0 0 0
B a r r e l s / D a y
Butane 80 106 83 49 45 71 115 52 36 62 61 64
Propane 385 403 370 337 332 376 333 206 245 335 377 375
Ethane 729 749 776 813 789 812 638 627 680 835 803 860
1Q07 2Q 3Q 4Q 1Q08 2Q 3Q 4Q 1Q09 2Q 3Q 4Q
Source: Pace Hodson, CMAI, quoted forward prices for feedstocks and company estimates on January 15, 2010.
Ethylene production from steamcrackers has rebounded from 4Q 2008to 52 billion pounds per year, whichequals the average ethylene
production for the last five years
NGL feedstocks – ethane and propaneare forecast to provide ethyleneproducers higher margins than more
costly crude oil derivatives over next12 months
Cracker modifications have accountedfor approximately 100 MBPD ofincremental ethane cracking
Daily ethane volumes projected toexceed 900 MBPD in the near-term ascracker operators continue to maximizeethane consumption-$0.16
-$0.12
-$0.08
-$0.04
$0.00
$0.04
$0.08
$0.12
$0.16
J a n - 1 0
F e b -
1 0
M a
r - 1 0
A p r - 1
0
M a y - 1 0
J u n - 1 0
J u l - 1 0
A u g - 1 0
S e p - 1 0
O c t -
1 0
N o
v - 1 0
D e
c - 1 0
Ethane Propane Butane Naphtha Gas Oil

8/14/2019 EPD Enterprise Product Partners Jan 2010 Presentation
http://slidepdf.com/reader/full/epd-enterprise-product-partners-jan-2010-presentation 12/25
All rights reserved. Enterprise Products Partners L.P. All rights reserved. Enterprise Products Partners L.P. 12
EPD’s NGL fractionation volumeshave increased by approximately50% over the last three years
Fractionators are operating atcapacity
Offloading volumes to ourfractionators in Louisiana that haveexceeded our available capacity atMont Belvieu
Hobbs NGL fractionator has beenoperating at capacity since first
quarter of 2008
Additional capacity will be needed toaccommodate incremental NGL
volumes expected from emergingEagle Ford Shale play
Strong Demand for NGL FractionationCapacity

8/14/2019 EPD Enterprise Product Partners Jan 2010 Presentation
http://slidepdf.com/reader/full/epd-enterprise-product-partners-jan-2010-presentation 13/25
All rights reserved. Enterprise Products Partners L.P. All rights reserved. Enterprise Products Partners L.P. 13
EPD will build a new75 MBPD NGL fractionatorat Mont Belvieu
Increase fractionationcapacity to 300 MBPD atMont Belvieu; over
600 MBPD system-wide Expansion supported by
long-term contracts
Leveraging existinginfrastructure and recentexperience with Hobbs
Estimated completion in first
quarter 2011
Mont Belvieu Fractionator Expansion

8/14/2019 EPD Enterprise Product Partners Jan 2010 Presentation
http://slidepdf.com/reader/full/epd-enterprise-product-partners-jan-2010-presentation 14/25
All rights reserved. Enterprise Products Partners L.P. All rights reserved. Enterprise Products Partners L.P. 14
Record Operating Performance(1)
…
3,855
3,704
3,574
3,405
3,000
3,200
3,400
3,600
3,800
4,000
2006 2007 2008 9 Mos 2009
M B P D
NGL, Crude Oil, Petrochemical & RefinedProducts Pipeline Volumes
621
585
563
462
375
425
475
525
575
625
2006 2007 2008 9 Mos 2009
M B P D
NGL / Propylene Fractionation &Butane Isomerization Volumes 116
108
88
63
40
60
80
100
120
2006 2007 2008 9 Mos 2009
M B P D
Equity NGL Production
7.0
8.0
9.0
10.0
11.0
12.0
13.0
2006 2007 2008 9 Mos 2009
T B t
u / d
Onshore & Offshore NaturalGas Pipeline Volumes
9.4
10.1
Offshore
Onshore
11.0
12.0
(1) Recasted to include TEPPCO for all periods.

8/14/2019 EPD Enterprise Product Partners Jan 2010 Presentation
http://slidepdf.com/reader/full/epd-enterprise-product-partners-jan-2010-presentation 15/25
All rights reserved. Enterprise Products Partners L.P. All rights reserved. Enterprise Products Partners L.P. 15
…Drives Strong Financial Results
Gross Operating Margin
$2.0
$2.6
$2.0
$1.8
$0.5
$1.0
$1.5
$2.0
$2.5
$3.0
2006 2007 2008 9M 2009
$ B i l l i o n s
$1.8
$2.3
$1.7$1.6
$0.0
$0.5
$1.0
$1.5
$2.0
$2.5
2006 2007 2008 9M 2009
$ B i l l i o n s
Adjusted EBITDA
$100
$314
$26
$98
$0
$50
$100
$150
$200
$250
$300
$350
2006 2007 2008 9M 2009
$ M i l l i o n
s
Retained DCF / Coverage
1.1x
1.0x
1.3x
1.1x
* Annualized
$1.5
$3.1
$2.8
$2.0
$1.0
$1.5
$2.0
$2.5
$3.0
$3.5
2006 2007 2008 2009
$ B i l l i o n s
Growth Capital Investment (1)
≈
Forecast
$1.54
$1.70
$1.83
$1.95
$2.08
$2.21
$1.25
$1.50
$1.75
$2.00
$2.25
2004 2005 2006 2007 2008 Current
D i s t r i b u t i o n s D
e c l a r e d
Distribution Rate
*
$1.1
$1.4
$1.0$1.0
$0.0
$0.4
$0.8
$1.2
$1.6
2006 2007 2008 9M 2009
$ B i l l i o n
s
Distributable Cash Flow
(2)
(1) Represents cash used in investing activities, excluding changes in restricted cash.(2) Includes distributable cash flow for TEPPCO for the 3 rd quarter 2009.

8/14/2019 EPD Enterprise Product Partners Jan 2010 Presentation
http://slidepdf.com/reader/full/epd-enterprise-product-partners-jan-2010-presentation 16/25
All rights reserved. Enterprise Products Partners L.P. All rights reserved. Enterprise Products Partners L.P. 16
History of Financial Discipline56% of Growth Investment Funded with Equity
(1) Growth capital investment includes the capital expenditures, cash used for business combinations, investments in and advances to unconsolidated affiliates, and acquisition of intangibleasset amounts as reflected on our Statements of Consolidated Cash Flows for the respective periods. The value of equity interests granted to complete the GTM merger, the ShellMidstream acquisition, the Encinal acquisition and equity interests TEPPCO granted to complete the Cenac acquisition, as reflected on our Statements of Consolidated Partners’ Equity, arealso included. In addition, capital investment includes $2.0 billion of debt assumed in connection with the GTM merger and $63 million of debt TEPPCO assumed in the Cenac acquisition.Sustaining capital expenditures are excluded.
(2) Equity issued includes net proceeds from the issuance of common units and Class B special units and cash contributions from noncontrolling interests as reflected on our Statements ofConsolidated Cash Flows for the respective periods. Cash contributions from noncontrolling interests primarily reflects the net proceeds from equity issued by DEP and TEPPCO. Alsoincluded is the value of equity issued as consideration for the GTM merger, the Shell Midstream acquisition, Encinal acquisition and Cenac acquisition as reflected on our Statements ofConsolidated Partners’ Equity. In addition, the equity content of our Hybrid securities is included in 2006 – 2007.
Note: Data recasted beginning with 2006 to include TEPPCO.
$ in Millions
Capital Equity Retained %
Investment Issued DCF Equity
1999 504$ 213$ 51$ 52%
2000 331 56 147 61%2001 610 118 128 40%
2002 1,712 181 (12) 10%2003 658 676 (52) 95%
2004 5,803 3,757 31 65%
2005 1,429 920 168 76%2006 1,951 1,585 98 86%
2007 2,752 957 26 36%2008 3,124 641 313 31%
9 mos. 2009 1,035 1,019 100 108%
Totals 19,909$ 10,123$ 998$ 56%
Growth Funded by Equity

8/14/2019 EPD Enterprise Product Partners Jan 2010 Presentation
http://slidepdf.com/reader/full/epd-enterprise-product-partners-jan-2010-presentation 17/25
All rights reserved. Enterprise Products Partners L.P. All rights reserved. Enterprise Products Partners L.P. 17
Substantial Financial Flexibility Addedby Eliminating GP’s 50% IDR
“Landmark” action taken byEPD’s GP in December 2002to cap GP’s IDRs at 25% forno consideration
3Q 2009 annualized savingsof $261 million (equivalent to
$0.43/unit)Enhances EPD’s financialflexibility by retaining cash
flow for debt retirement orcapital investment
Significantly lowers long-termcost of capital
$100
$125
$150
$175
$200
$225
$250
$275$300
$325
$350
$375
$400
$425
$450
$475
$500
3 Q 0 4
4 Q 0 4
1 Q 0 5
2 Q 0 5
3 Q 0 5
4 Q 0 5
1 Q 0 6
2 Q 0 6
3 Q 0 6
4 Q 0 6
1 Q 0 7
2 Q 0 7
3 Q 0 7
4 Q 0 7
1 Q 0 8
2 Q 0 8
3 Q 0 8
4 Q 0 8
1 Q 0 9
2 Q 0 9
3 Q 0 9
$ i n M
i l l i o n s
LP Distributions GP Distributions Avoided 50% Splits
Cumulative Savings: $524MM
(1)
(1) Includes 131 million newly issued units for the TEPPCO merger.

8/14/2019 EPD Enterprise Product Partners Jan 2010 Presentation
http://slidepdf.com/reader/full/epd-enterprise-product-partners-jan-2010-presentation 18/25
All rights reserved. Enterprise Products Partners L.P. All rights reserved. Enterprise Products Partners L.P. 18
$722
$999
$5,426
LP Distributions
GP Distributions
Retained DCF
($ in millions)
1.2x LP Distribution
Coverage
Generated $7.1 Billion of DCF (1999 – 3Q 2009)14% DCF Retained / Reinvested in Partnership
History of Providing Distribution Growth WhileRetaining Capital for Flexibility / Reinvestment
$2.20
$2.08
$1.95
$1.83
$1.70
$1.54$1.47
$1.36
$1.19
$1.05
$0.93
$0.00
$0.25
$0.50
$0.75
$1.00
$1.25
$1.50
$1.75
$2.00
$2.25
1999 2000 2001 2002 2003 2004 2005 2006 2007 2008 2009
D i s t r i b u t i o n s D e c l a r e d
8. 3 %
C A G R
E t i H G t d
8/14/2019 EPD Enterprise Product Partners Jan 2010 Presentation
http://slidepdf.com/reader/full/epd-enterprise-product-partners-jan-2010-presentation 19/25
All rights reserved. Enterprise Products Partners L.P. All rights reserved. Enterprise Products Partners L.P. 19
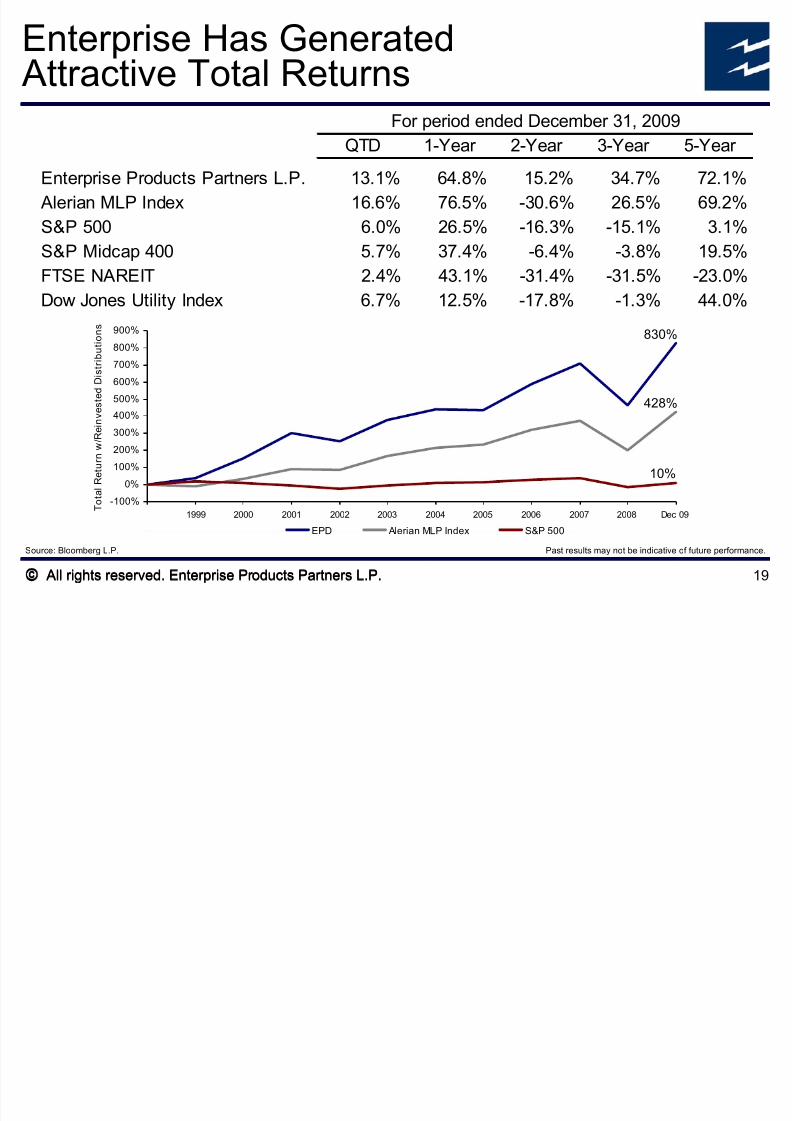
Enterprise Has Generated Attractive Total Returns
QTD 1-Year 2-Year 3-Year 5-Year
Enterprise Products Partners L.P. 13.1% 64.8% 15.2% 34.7% 72.1%
Alerian MLP Index 16.6% 76.5% -30.6% 26.5% 69.2%S&P 500 6.0% 26.5% -16.3% -15.1% 3.1%
S&P Midcap 400 5.7% 37.4% -6.4% -3.8% 19.5%
FTSE NAREIT 2.4% 43.1% -31.4% -31.5% -23.0%
Dow Jones Utility Index 6.7% 12.5% -17.8% -1.3% 44.0%
For period ended December 31, 2009
830%
428%
10%
-100%
0%
100%
200%
300%400%
500%
600%
700%
800%
900%
1999 2000 2001 2002 2003 2004 2005 2006 2007 2008 Dec 09
EPD Alerian MLP Index S&P 500
T o t a l R e t u r n w / R e i n v
e s t e d D i s t r i b u t i o n s
Source: Bloomberg L.P. Past results may not be indicative of future performance.

8/14/2019 EPD Enterprise Product Partners Jan 2010 Presentation
http://slidepdf.com/reader/full/epd-enterprise-product-partners-jan-2010-presentation 20/25
All rights reserved. Enterprise Products Partners L.P. All rights reserved. Enterprise Products Partners L.P.
Non-GAAP Reconciliations
8/14/2019 EPD Enterprise Product Partners Jan 2010 Presentation
http://slidepdf.com/reader/full/epd-enterprise-product-partners-jan-2010-presentation 21/25

8/14/2019 EPD Enterprise Product Partners Jan 2010 Presentation
http://slidepdf.com/reader/full/epd-enterprise-product-partners-jan-2010-presentation 22/25
All rights reserved. Enterprise Products Partners L.P. All rights reserved. Enterprise Products Partners L.P. 22
Non-GAAP Reconciliations
Enterprise Products Partners L .P.
Gross Operating Margin (Dollars in millions) For the Nine
Months Ended
September 30,
2006 2007 2008 2009
Gross operating margin by segment:NGL Pipelines & Services 785.7$ 848.0$ 1,325.0$ 1,118.1$
Onshore Natural Gas Pipelines & Services 478.9 493.2 589.9 391.5
Onshore Crude Oil Pipelines & Services 97.8 109.6 132.2 126.7 Offshore Pipelines & Services 103.4 171.6 187.0 83.0
Petrochemical & Refined Products Services 305.1 342.0 374.9 255.6
Total gross operating margin 1,770.9 1,964.4 2,609.0 1,974.9 Adjustments to reconcile gross operating margin to operating income:
Depreciation, amortization and accretion in operating cost and expenses (556.9) (647.9) (725.4) (602.9) Impairment charge included in operating costs and expenses - - - (26.3) Operating lease expense paid by EPCO in operating costs and expenses (2.1) (2.1) (2.0) (0.5)
Gain (loss) on asset sales and related transactions in
operating costs and expenses 5.1 7.8 4.0 0.5
General and administrative costs (95.9) (127.2) (137.2) (133.3) Operating income 1,121.1$ 1,195.0$ 1,748.4$ 1,212.4$
For the Year Ended December 31,

8/14/2019 EPD Enterprise Product Partners Jan 2010 Presentation
http://slidepdf.com/reader/full/epd-enterprise-product-partners-jan-2010-presentation 23/25

8/14/2019 EPD Enterprise Product Partners Jan 2010 Presentation
http://slidepdf.com/reader/full/epd-enterprise-product-partners-jan-2010-presentation 24/25

8/14/2019 EPD Enterprise Product Partners Jan 2010 Presentation
http://slidepdf.com/reader/full/epd-enterprise-product-partners-jan-2010-presentation 25/25
All rights reserved. Enterprise Products Partners L.P. All rights reserved. Enterprise Products Partners L.P.
UBS Wealth ManagementConference
January 27, 2010
Michael A. CreelPresident and CEO