epdm/ciir blends - cochin university of science and technology
TRANSCRIPT

EPDM/CIIR Blends: COIllpatibility, Morphology and Physical Properties
'Jhesis submilled /0
Cocliin Vniversity of 5ci£nce ant! %clinofogy
in par/ial/uJfiffmen/ 0/ /he reruiremen/s for /he award 0/ /he degree 0/ (/)octor of CFliifosopliy
under/he
Pacufty of rreclinofogy
Sunil Jose T
Deparhnent of Polymer Science and Rubber Technology
Cochin University of Science and Technology
Cochin- 682 022, Kerala, India www.cusat.ac.in
November 2006

~er1iftttltt
Certified that, the thesis entitled 'EPDMlCIIR Blends: Compatibility,
Morphology and Physical Properties' submitted to Cochin University of Science
and Technology under the Faculty of Technology, by Mr. Sunil Jose T, is an
authentic record of the original research carried out by him under my supervision
and guidance. The thesis has fulfilled all the requirements as per regulations and no
part of the results embodied has been submitted to any other institution for any
other degree/diploma.
Cochin 20th Nov 2006
Dr. Rani Joseph Professor
Dept. of Polymer Science and Rubber Technology Cochin University of Science and Technology
Cochin-22, Kerala

DECLARATION
I hereby declare that, the thesis entitled 'EPDMlCIIR Blends:
Compatibility, Morphology and Physical Properties' submitted to Cochin
University of Science and Technology, under the Faculty of Technology, is based
on the original research carried out by me under the supervision of Dr. Rani
Joseph, Professor, Dept. of Polymer Science and Rubber Technology, and further,
no part of the results presented has been submitted to any other institution for any
other degree/diploma.
Cochin 20th Nov 2006

_,_tb~g~,
~cnJ~'LL~~ ~~ , ~rrv'/:;;Jf'-

ACKNOWLEDGEMENTS
Witli deep pfeasure ana great satisfaction, I eJ(JJress tlie first ana foremost word of my
profouna gratitude to my supervisiTl{J teaclier, CJ)r. 1?g.ni Josepli, Professor, CDepartment
of Pofymer Science ana <J(u66er fJeclinofogy, for 6eiTl{J an enafess source of
encouragement ana for lier va{ua6fe guidance tlirougliout tlie course of tliis wor~
I am greatfy intfe6ted to Prof. CDr. '1G CE. qeorge, fonner J{ead of CDepartment of PS<J(7;
for liis inva{ua6fe liefp afftlirougli tliis wor~
I am eJj;remefy grateful to CDr. 'l1iomas 1(urian, J{ead of CDepartment of PS<J(7; for liis
advice ana morae encouragement. I afso wouU fiR! to eJj;ena my tlianRJ to Prof CJ)r.
./l. P. 1(uria/(syse (Professor CEmeritus), CDr. CE6y 'l1iomas 'l1iaclii{, CDr. Pliifip 1(urian, CDr.
Suni{ '1G :Narayananltutty, CJ)r. SOn£) 'Vargliese, tlie facu{ty mem6ers ana
administrative staff of tlie (])epartment of PS<J(r[ for tlieir wnofe-nearted cooperation
ana encouragement.
It is a pfeasure to convey my inae6tedness ana sincere tlianRJ to a{{ researcli scliorars,
past ana present from tlie CDepartment of PS<J(r[ for tlieir interest ana pricefess liefp
tnrougliout my period of researcli.
Witli a deep sense of gratitude, I tlianlt./lnoop for liis concern ana true support in
compfetiTl{J tliis tliesis. I rea((y appreciate a{{ of your liefp. 'l1ianRyou very mucli.
I eJj;ena my sincere tlianRJ to tne Principa{ ana Staff of St. 'l1iomas' J{SS, 'l1iope,
'l1irissur for tlieir encouragement ana liefp.
I 60w down to my parents ana famify mem6ers for tlieir mora{ encouragement, immense
patience ana foviTl{J care, wliicli couU give me tlie streTl{Jtli to pursue my goa{ witli
success ana dedication. CEspecia({y, tne unconditiona{ ana zeafous attitude of my wife,

Ylcl(powfediJements
Cl'reseetlia, who instifka 1IU! tlie ftrr;our to compfete my research war{ without any
hintfrance.
~ bove an; my praises are due to rrlie ~(miohty, without the orace of whom the wliofe
episode 'wouUf have reaucea to notfii1lfJ.
Suni(Jose rr

CONTENTS
Page No.
Preface vii·viii
1. Introduction ................................................................................................................ 1·36 1.1 (]3asic theory of pofymer 6ferufs 2 1.2 Properties of6ferufs 2
1.2.1 <Direct/Putllfamenta(varia6fes 4
1.2.1.1 Pofymer- pofymermisci(nfity 6 1.2.1.2 \Bfena compati6ifity 8 1.2.1.3 Compati6ifisation 9 1.2.1.4 Viscosity consiaerations 9
1.2.2 I ndi'rect/Processing 'variaofes 11 1.2.2.1 rr>istri6ution of fiffer 6etween ef=tomers 11 1.2.2.2 (Distri6ution of pf=ticizers 13 1.2.2.3 <Distri6ution of crossfinking agents 13 1.2.2.4 Crossfinl(type ana networ{structure oj-e;ufcanizea ef=tomer 6unas 16
1.3 (]3fendi11.lJ procetfure 18
1.3.1 Pre6fend'illg 18
1.3.1.1 'Mecnanicaf 6fenaing 1.3.1.2 Late::( 6unaing 1.3.1.3 Sofution 6fentfing 1.3.1.4 !J{?actil'e 6fending 1.3.1.5 rDynamic 'vufcanization
1.3.2 phase m~illg
1.4 Cfiaracterizatron of ru66er 6ferufs 1.5 jfppEications of ru66er 6ferufs 1.6 Some usefu{ ru66er 6ferufs 1.7 06jectives and scope of the present wor{
CJ<fferences
18 19 19 20 20
20
21 23 24 24 28
2. Experimental Techniques .......................................................................................... 37·64 2.1 9,lateriafs 37
2.2 Preparatron and moufdi11.lJ of specimens
2.2.1 :Mbdng and'homogenization 2.2.2 Cure characteristics 2.2.3 Compression mouCd'ing
2.3 Physica{ test metlWtfs
2.4 Cliemica{ test metlWtfs
CJ<fferences
41
41 42 45
45 60
62

Contents
3. Compatibility Studies on EPDM/CIIR Blends ........................................................... 65·86
3.1 Imroauctwn 65 3.2 ~rimenta( 66 3.3 ~su{ts ana dIScussion 68
3.3.1 Cure characteristics 68 3.3.2 'Mtchanica{ properties 69 3.3.3 '1fierm.af anafysis 72 3.3.4 'Morpliofogica{ studies 76 3.3.5 'Effect of compati6ifiser 79
3.4 Conc(usions 83 ~ferences 84
4. Studies on Sulphur Cured EPDM/CIIR Blends .......................................................... 81·102
4.1 Introauctwn 4.2 ~rimenta(
87 87 88 4.3 ~sufts ana dIScussion
4.3.1 Cure rate ana crossfinfufensity 4.3.2 :Meclianica{ properties
88 90
4.4 Conclusions 100 101 ~ferences
5. EPDM/CIIR Blends: Improved Mechanical Properties through Precuring .......................... l03·118
5.1. IntroauctWn 103 5.2. ~menta( 104
5.2.1 ([)etermination of optimum fe·tle{ of procuring 104 5.2.2 Swe[finfJ 6elia-viourof precured<EPDM/CIF1(6fenas 105 5.2.3 Preparation of sampfe specimens 105
5.3 1<!sufts ana dIScussion 106 5.3.1 Optimization of precuriltfJ conditions 106
5.3.2 Cure cliaracteristics ana crossfink.density 107
5.3.3 Comparison 6etween cOll'ventiona{fy cured awi precum[ Mend systems 109
5.4 Conc{usions 116 CJ?gferences 117
6. Effect of Resin Curing on the Mechanical Properties of EPDM/CIIR Blends ........................ 119·132
6.1 I ntroauctwn 119 6.1 ~menta{ 120 6.3 <l<fsu{ts ana dIScussion 121
6.3.1 Cure cliaracteristics and stress-strain properties 121 6.3.2 'TFIerma{ and Steam ageing resistance 123 6.3.3 pfzysica{ properties 126
6.4 Conc{usions 129 ~erences 130
Contents --------------------------------------------------------7. Rheology, Air Permeability, Thermal Stability and Thermal Diffusivity
Studies on EPDM/CIIR Blends ................................................................................... 133·148 7.1. Introauction 7.2. l£:q1erimenta( l~ ~5UusanldUnus.Wn
7.3.1 (j{heowoicaf characteristics 7.3.2. JIirPennea6ifity 7.3.3. rrfzennaf sta6ifity 7.3.4. fJhermaf tfiffusivity
7.4 Conc(usions ~ferences
133 134 135
135 138 140 143 144 146
8. Summary and Conclusions ............................................................................................................ 149·152
list of Abbreviations and Symbols
Publications and Presentations

PREFACE
Polymer blends are gaining technological importance due to their compromise set
of properties, advantages in processing and reduction in cost. One polymer may
possess a particular set of properties, while the other may have another set of
properties. By blending two such polymers, a desired set of properties can be
achieved. In the case of elastomers, blends are used in tires, belts, cables etc. For
the successful applications of such blends, component elastomers must be miscible
and compatible. The curing method adopted and the distribution of compounding
ingredients has a vital role on the ultimate properties. The distribution depends
mainly on the nature of the elastomers and the blending process. Therefore,
knowledge of these parameters will facilitate in obtaining a successful elastomer
blend.
In the present work, investigation has been carried out on the compatibility and
mechanical properties of blends consisting of ethylene propylene diene rubber
(EPDM) and chlorobutyl rubber (CUR). This blend finds application in the
manufacture of curing envelope and other high temperature performances.
This thesis is presented in seven chapters.
The various factors affecting the blend compatibility, the methods of blend
preparation and the advantages of blends are explained in chapter I. A review of
the earlier works in this field and the scope and objective of the present
investigation is also presented.
The specifications of the materials used in the study and the different experimental
techniques employed are described in the second chapter.
A detailed study of the compatibility behaviour of blends of EPDM with CIIR has
been reported in the third chapter. The extent of compatibility has been evaluated

Preface
based on mechanical, thermal and morphological studies. The effect of
compatibiliser on the blend properties is also studied.
The fourth chapter deals with extensive study on the physical properties of sulphur
cured EPDM/CIIR blends with respect to blend ratio and ageing.
The effect of precuring on the physical properties of sulphur cured blends of
EPDM with CIIR has been discussed in chapter five.
Chapter six explains the property studies of resin cured EPDM/CIIR blends with
special reference to their ageing resistance.
Finally, more technical features of the blends such as thermal diffusivity, thermal
degradation resistance, air permeability and rheological behaviour are presented in
the seventh chapter.
A summary of the whole investigation results is presented as the last chapter.

Introduction
The field of polymer science and technology has undergone an enormous
expansion over the last several decades primarily through chemical diversity. First,
there was the development of new polymers from a seemingly endless variety of
monomers. Next, random copolymerization was used as an effective technique for
tailoring or modifying polymers. Later, more controlled block and graft
copolymerization was introduced. The list of new concepts in polymer synthesis
has not been exhausted. Development of new molecules and chemical
modifications of existing ones have been the most common ways of facing new
challenges in this field. These routes have become increasingly complex and
expensive over the years and thus alternative ones have become interesting and
attractive.
In recent years, polymer blends are gaining technological importance due to their
great regulatable variability of properties despite the limited number of initial
components.!" By blending two or more elastomers, it is possible to attain
properties, that are not available with a single elastomer. The most important
concept in polymer blends is additivity of properties. By this we mean that when a
polymer is mixed with another polymer, the resulting blend has a property which is
the weighted average of the properties of the individual polymers. Modulus is one
of such properties that are expected to obey some additivity relationship.'
The success of a new material depends on several factors such as combination of
properties and cost dilution. For example, when we blend a high thermal resistant
polymer having poor processability with another polymer having good
processability and poor thermal stability, the resulting blend may be useful for
certain applications for which both the individual polymers are unsuitable. By

Cliapter 1
blending of polymers several properties can be improved, mostly without
sacrificing the others. For this, it is necessary to know which polymers can be
successfully blended and what undergoing factors influence the results. 10-16
1.1 Basic theory of polymer blends
A successful polymer blend is a cost effective mixture of two or more polymers
with a better combination of different properties. Processability and mechanical
properties of polymer blends depend mainly on their compatibility and miscibility.
Miscible blends are those which are homogenous throughout in microscopic scale.
Depending on the polymer miscibility, the blends can be classified as miscible,
partially miscible and immiscible, or in a technological sense as compatible,
semicompatible and incompatible. A large number of compatible polymer blends
and alloys have been investigated and successfully commerciaJized. 17-20 Alloys are
a class of polymer blends in which a large interpenetration of domains is secured
by physical and/or chemical means. Although the tenns alloys and blends are often
used synonymously, they differ in the level of thermodynamic compatibilities and
resulting properties. On the high end of the compatibility spectrum are the alloys.
Alloys are synergistic polymer systems. Alloys give a tighter, denser molecular
structure than blends.2J
1.2 Properties of blends
A wide range of properties can be achieved by blending which includes
mechanical, electrical and chemical properties along with processability.
Compatibility is the fundamental property deciding the practical utility of a
polymer blend.22-24 Two-component polymer blends, in general, can be described
by the following equation:22.25
(1.1 )
Introduction
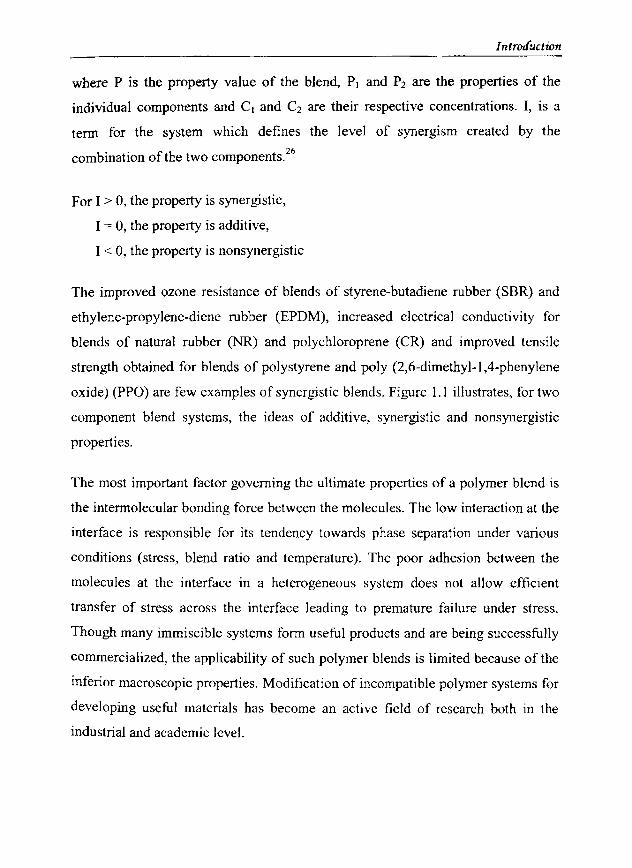
where P is the property value of the blend, PI and P2 are the properties of the
individual components and Cl and C2 are their respective concentrations. I, is a
term for the system which defines the level of synergism created by the
combination of the two components.26
For I > 0, the property is synergistic,
I = 0, the property is additive,
I < 0, the property is nonsynergistic
The improved ozone resistance of blends of styrene-butadiene rubber (SBR) and
ethylene-propylene-diene rubber (EPDM), increased electrical conductivity for
blends of natural rubber (NR) and polychloroprene (CR) and improved tensile
strength obtained for blends of polystyrene and poly (2,6-dimethyl-I,4-phenylene
oxide) (PPO) are few examples of synergistic blends. Figure 1.1 illustrates, for two
component blend systems, the ideas of additive, synergistic and nonsynergistic
properties.
The most important factor governing the ultimate properties of a polymer blend is
the intermolecular bonding force between the molecules. The low interaction at the
interface is responsible for its tendency towards phase separation under various
conditions (stress, blend ratio and temperature). The poor adhesion between the
molecules at the interface in a heterogeneous system does not allow efficient
transfer of stress across the interface leading to premature failure under stress.
Though many immiscible systems form useful products and are being successfully
commercialized, the applicability of such polymer blends is limited because of the
inferior macroscopic properties. Modification of incompatible polymer systems for
developing useful materials has become an active field of research both in the
industrial and academic level.

Cliapter 1
P, COMPOSITION
Figure 1.1 Variation of property with composition for a binary polymer blend
Several investigators have tried to correlate the morphology as revealed by electron
microscopic studies with the mechanical properties of the blends.27-30 It is
convenient to divide the variables of a blend system into two categories viz. direct
and indirect variables. 31
1.2.1 DirectIFundamental variables
The direct variables can be further subdivided into those which are important because
the pure component properties depend on them and those that are unique to the blend
systems. The direct variables are the fundamental ones and can be controlled by the
indirect or processing variables. The direct variables are the following:
• G lass transition temperature
• Molecular weight
• Crosslink density
• Blend ratio
• Morphology

lntroauction
• Interfacial adhesion
• Relative stiffness
• Miscibility between polymers
• Compatibility between polymers
• Viscosity ratio between polymers
The first three fundamental variables are those that also affect the pure components. In
general, the mutual solubility of two polymers decreases as the molecular weight of
either component increases. In order to achieve a single Tg which controls blend
properties such as resilience, some covulcanization between the different phases in the
blend is needed. 1bis explains the use of chlorobutyl in place of butyl rubber for
blending with diene elastomers which give better general physical properties. Among
the rubbery materials, a higher Tg or molecular weight generally increases toughness
for a given crosslink. density.32 In addition, it is well known that the mechanical
properties of elastomers depend very strongly on crosslink density.33 Specifically, the
energy required to rupture an elastomer in simple tension generally passes through a
maximum as a function of crosslink density.
The next four direct variables are unique to blends. lbe properties obviously depend
on the properties of each component in the blend. One of the major areas of studies on
polymer blends is the dependence of the mechanical properties on blend ratio.34.36 This
is due to the fact that these complex systems exhibit a behaviour which does not simply
fonow the sum of the properties of the components. Bulk morphology is another
important consideration which determines the physical properties of rubber blends.
The process of blending, the phase viscosity and other processing conditions influence
the morphology of the blend.37.39 Two methods have been reported in literature.
(I) Solutions of rubbers are stirred together, then dried or precipitated. (2) The bulk
rubbers are co-masticated in a Brabender or similar high shearing mixer. Most
investigators have used the latter method. With this technique, the mixing time,
temperature, and/or speed can be varied to obtain different morphologies. Another

Cfzapter 1
means of changing the morphology is by annealing after mixing. TIris can cause an
increase in dispersed particle size or phase inversion.
The interfacial adhesion between the two phases may determine the path that a
growing crack takes in a deformed rubber blend and also determines the extent to
which stresses can be transferred between the matrix and particle phases. If
interfacial adhesion is sufficiently low, small cavities may be opened up between
the dispersed domains and the matrix, when the blend is stressed leading to
premature failure under stress. Thus the interfacial adhesion plays a key role in
determining the mechanical properties. The interphase crosslinking is influenced
by the type of curative system used, including its solubility in each phase and the
response of the individual elastomers to the curatives.
The relative stiffness between the two phases is a function of molecular weight,
glass transition temperature and rate of crosslinking of the two rubber phases. The
micro-deformation of the blend will depend in part on this property. Tt is found in
many blends that the relative stiffness also affects the mechanical properties.
1.2.1.1 Po]ymer - po]ymer miscibility
From a thermodynamic point of view, every polymer has same solubility in every
other polymer, but the magnitude in most cases is exceedingly low.3 For example,
if polystyrene is fluxed in an internal mixer with poly (methyl methacrylate)
(PMMA), a two-phase mixture results, no matter how long or intensive is the
mixing. On the other hand, if one fluxes polystyrene with PPO as the second
component, one phase results. It is thermodynamically stable because no matter
how slowly the mixer turns or how long one waits there is still only one phase. The
first represents an example of an immiscible blend, the second a miscible blend.
The primary advantage of a miscible blend over its immiscible counterparts is the
assurance of mechanical compatibility. The simplified average of ultimate
mechanical properties is not always the observed or expected case, due to the

Introauction
importance of the position of the glass transition temperature (T g) andlor brittle
ductile behaviour.
The struc1ure and stability of polymer blends depends primarily on the miscibility
of polymers used in its preparation. Miscibility is governed by the Gibbs free
energy of mixing (6Gm). The thermodynamic condition for obtaining miscible
blend is that the free energy of mixing must be negative.
(1.2)
where 6Hm is the change in enthalpy on mixing, 6Sm, the change in entropy on
mixing and T, the absolute temperature. Since the entropy term is negligible for
polymers, the heat of mixing, 6Hm, is the key factor deciding the polymer-polymer
miscibility.4o,41 In the case of purely dispersive forces, 6Hm is always positive.
Consequently, high molecular weight systems with this type of interaction are
rarely miscible. Miscibility drops significantly with growing chain length,
However, if there exists the so-called specific interactions (lon-rlipole interactions,
hydrogen bond etc.) between the components, then 6Hm can be negative and the
polymers can be miscible. In other words, two polymers can be expected to be
miscible when a very close match in cohesive energy density or in specific
interactions, which produce a favourable enthalpy of mixing is involved.42•45 The
ability to co-crystallize can provide an additional driving force for polymer
miscibility. Knowledge of solubility parameters of component polymers will be
helpful in predicting miscibility. In the case of non-polar polymers, miscible blends
can be prepared if they have same solubility parameters (b'S).46 Compilation of the
solubility parameters of the polymers is presented e1sewhere.47 For non-polar
liquids the internal energy change on mixing is given by:
( 1.3)
where <PI and <P2 are volume fractions of the components. Realising that amorphous
polymers are essentially liquids and assuming that the volume change on mixing is

TTiirpter 1
negligible, equation 1.3 is an expression for the change in enthalpy of mixing since
6Em = 6Hm for constant volume, constant pressure process. Thus equation 1.3
always results in a positive .6Hm, indicating that for non-polar high polymers,
where the T 6Sm term is small, true solution will not occur unless the o's are
almost perfectly matched. Thus, in order to achieve a homogeneous blend, it is
necessary to choose polymer components that are capable of specific interactions
among each other, leading to negative heats of mixing.
1.2.1.2 Blend compatibility
Compatibility is often used to describe whether a desired or beneficial result occurs
when two polymers are combined together.48-54 Compatible rubber blends are
miscible only in a technological sense i.e., they can be covu1canised after blending
and the properties are improved. In most cases either of the two components (in the
case of a two-component blend system) forms the continuous phase in the matrix
with the other phase dispersed in it. Generally the component with lower viscosity
forms the continuous phase. The influence of structure on compatibility has been
discussed by Marsh et al. 55 Although homogeneity at a fairly fine level is necessary
for optimum performance, but certain degree of micro-heterogeneity is desirable to
preserve the individual properties of the respective polymer components. Based on
microscopic studies, it has been realized that almost all elastomer blends are micro
heterogeneous to varying degrees. 56
Compatibility of a low unsaturation elastomer with a high unsaturation one can be
improved by controlled interphase cross linking of the blends. Compatibility of
EPDM with high diene elastomers has been improved by this technique.57 It has
been found that better compatibility is possible if the component elastomers have
virtually identical cure rate. 5~ Baranwal et al. have shown that by grafting
accelerators into EPDM, the co-curing ability of EPDM with a highly unsaturated
diene can be improved, thus leading to good vulcanizate properties. 59 A few
workers have investigated the dynamic mechanical properties of SBRlBR blends.60

Introduction
It has been reported that interphase crosslinking causes a merging of the dynamic
mechanical loss peaks that are characteristics of the individual polymers.
1.2.1.3 Corn patibilisation
The addition of an interfacial agent called compatibiliser to immiscible blends is
found to increase interfacial adhesion, provide stability of morphology against
gross phase segregation and reduce the interfacial tension. 61 Several strategies of
compatibiiisation have been proposed. Normally, block or graft polymers,
functionalized polymers, and low molecular weight materials are added as
compatibilisers.62 It has been found that block copolymers are usually better
interfacial agents than graft copolymers because, in the latter, multiple branches
will restrict the penetration into similar homopolymer phases. For the same reason
diblocks are more effective than triblocks. Chlorinated polyethylene acts as a
compatibilising agent ID NBR/EPM or CRlEPDM blends.63 Chloroprene rubber
acts as a compatibiliser in NRJNBR blends.64 The addition of some polyfunctional
monomers in presence of peroxide is reported to be effective in blends of PVC
with polyethylene.65,66 Reactive compatibiiisaton by compounding blends in
presence of chemical reactants that leads to the modification of one of the
components, results in the fomlation of an in-situ compatibiliser. Formation of
maleic anhydride grafted polypropylene in polypropylene/nylon-6 blend was
reported by Ide and Hasegawa.67 Carboxyl terminated acrylonitrile-butadiene
rubber (NBR) has been utilised for the successful blending with epoxies.
Mechano-chemical blending that may lead chain break-up and recombination, thus
generation of copolymer. Blends of polystyrene and polyethylene lead to the
formation of styrene/ethylene graft copolymers. 68
1.2.1.4 Viscosity considerations
In addition to thermodynamic factors, viscosity and cure rate of the component
polymers must be taken into consideration. Tokita and A vergopou]os have
thoroughly investigated the mixing parameters required for the optimum blending

Cfiapter 1
of elastomers and found that if there is considerable difference in the viscosities of
component polymers, they will exist as separate domains.69,7o The shape of the
domains is more nearly spherical when the high viscosity component is the
disperse phase. A softer disperse phase typically gives elongated domains.
Extremely large domain size of the polybutadiene (BR) phase in NRJBR and
SBRJBR blends were related to significantly higher viscosity for the BR phase. 71 In
a blend of EPDMINR, it was concluded that smaller domain size was achieved
through a higher stress field during mixing, lower interfacial tension between the
phases, and diminishing concentration of the disperse phase. Higher mixing
temperature appeared to reduce domain size by diminishing the interfacial tension.
Since the temperature normally goes up during mixing, the high shear blending of
polymers with similar viscosities will give the most homogenous mixtures. Furthur
studies in EPDM/BR blends indicated that the driving force for blend homogeneity
was related to a similarity in the viscosities of the two phases under the specific
conditions of mixing. Because of the large difference in Tg between EPDM and
BR, it was possible to vary their relative viscosities simply by changing the shear
rate and/or mixing temperature; the domain size of the disperse phase could thus be
altered for the same blend. It was also possible to shift the disperse phase from one
polymer to another even though that polymer is the minor component. In this case,
the comparatively Iow viscous phase actually encapsulates the high viscous
component and then become continuous.
The viscosity mismatch between the component polymers also affects the
distribution of compounding ingredients in the blend. For example, when filler is
added to a two-component elastomer blend, it preferably migrates to the less
viscous polymer and when the viscosity becomes equal to that of the more viscous
polymer it would be taken up by both the polymers. So often the low viscosity
polymer gets highly loaded. It is evident that the distribution of fillers can
profoundly influence the modulus in elastomer blends. At lower strains, where the
filler network structure dominates the stiffness properties, an increase in the non
uniformity of this filler distribution results in a lower stock modulus. Hess et al.

Introduction
demonstrated that carbon black normally locates preferentially in the BR
component of 50/50 NRlBR blend.72 The viscosity mismatch which prevents or
greatly delays the formation of intimate mixture can be overcome by improving the
blending process either by adjusting oil or filler concentration In the two
elastomers or by adjusting the individual raw polymer viscosities, so that, the
effective viscosities of the phases will no longer be mismatched. 73
1.2.2 Indirect/Processing variables
Unlike plastics, since elastomers reqUlre a large number of compounding
ingredients, the problems related to these materials have also need be taken care of.
In particular, factors affecting properties of elastomcr blends are:
• Distribution of filler between elastomers
• Distribution of plasticizers
• Distribution of crosslinking agents
• Crosslink type and network structure of vulcanized elastomer blend
1.2.2.1 Distribution of filler between elastomers
A general question which comes up in the case of elastomer blends is regarding
the distribution of filler particles between the separate zones and how
perforrnace characteristics are affected. The effect of an appreciable volume
loading of filler on the properties of cured elastomeric vu1canizates depends on
whether the elastomer is stress crystallizing or not. Dinsmore et al. reported
that the ratios of the tensile strengths of black filled to that of gum vulcanizates
is I to 1.5 for NR vu1canizates and 5 to 10 for vulcanizatcs for SBR and similar
elastomers. 74 Thus appreciable improvements in strength properties may be
obtained for non-stress-crystallizing rubbers by incorporation of carbon black.
Further, certain clastomers have optimum filler loadings for particular
properties such as wear and tear resistance. 75 As different rubbers have

Cftapter 1
different responses to filler loadings for certain properties, control of filler
distribution in elastomer blends could have corresponding specific effects.
The distribution of filler particles between the separate phases of an elastomer
blend is affected by a number of factors like un saturation, viscosity, polarity,
molecular weight etc. 76 Carbon black has a tendency to migrate to the more
unsaturated polymers. Butadiene rubber has the greatest affinity towards carbon
black and it follows the order: BR>SBR>CR>NBR>NR>EPDM>lIR.77 Many
authors have shown that the properties of a blend can be improved by
preferential addition of carbon black in the blend.78.79 Methods of assessing the
reinforcing ability of the fillers have also been discussed elsewhere. 8o-s2 In
addition, black transfer during blending was observed from a mechanically
mixed HR masterbatch to a high unsaturation gum rubber but not from a NR
masterbatch.
It is apparent that the surface polarity of carbon black influences its distribution
in elastomer blends. Basic furnace blacks locate in the cis BR phase in cis
BRfNR blends but acidic channel blacks locate in the more polar NR phase.
Inorganic fillers also behave differently, e.g. in cis BRlNR blends, silica tends
to accumulate in the NR phase.55 Filler distribution is also influenced by the
point of addition of filler, the viscosity levels of the elastomers, and the
blending methods. The ability of rubbers to accept black and other fillers is said
to be an important factor in attaining good dispersion which in turn affects
reinforcement and ultimate performance properties. The reinforcing ability of a
filler in an elastomer can be assessed by bound rubber determination. s3
The compounding of carbon black is greatly dependent on the method of
mixing used. 84 The location of 40 phr GPF black in 50/50 NRJBR blends has
been controlled by mixing separate motherstocks and blending these_ The
normal mix is one in which the two rubbers are blended in a Banbury before
adding the black and the rest of the compounding ingredients. Tensile and tear

Introduction
properties showed improvement as more black located in the BR phase. 50/50
blends of BR and a high styrene SBR containing 50 phr black overall were
prepared by blending a 50150 BRlHAF black masterbatch and SBR gum. The
blends were found to exhibit higher abrasion resistance than identical
compounds mixed conventionally. It would hence be possible that by correct
filler distribution in rubber blends, vulcanizate properties can be improved.
1.2.2.2 Distribution of plasticizers
In the normal rubber vu1canizate the concentration of plasticizer is not very
high and does not much affect the properties of blends. However, when
substantial quantities of plasticizer must be used, the distribution of this
ingredient can affect the properties of rubber blends.
1.2.2.3 Distribution of crosslinking agents
It is of paramount importance in a binary elastomer blend that both the
constituents cure to an optimum level. Results of dynamic mechanical studies
and thermal analysis suggest that a two phase system is liable to change to a
more homogeneous one with curing. Blends of BR and SBR display two
dynamic mechanical loss peaks in the uncured state which are characteristic of
the individual rubbers. These peaks merge quickly to form an intermediate loss
peak on vulcanization of the blend probably due to interphase crosslinking. 85,86
Hence in a two-component elastomer blend, formation of interphase
crosslinking when the two rubber phases undergo crosslinking is a necessary
criterion for developing good mechanical properties.87 Formation of interphase
crosslinks is in competition with intraphase crosslinking. So interphase
crosslinking is possible only when the cure rates in the two rubbers are
comparable.88 The different possibilities of crossIinking in a binary eIastomer
blend are shown in figure 1.2.

Cfiapter 1
A is vulcanized B not and not coupled with each other
A is not vulcanized B is, not coupled wilh each other
A and B vulcanized but not coupled with each other
A and B vulcanized and coupled with each other
Figure l.2 Various modes of crosslinking in a binary elastomer blend
The most prominent factor which leads to the mismatch of cure rate in two rubbers
is the non proportional division of the curatives, since the solubility of the
compounding ingredients is different in the constituents of an elastomer blend.
This leads to diffusion of compounding ingredients before, during and after
vulcanization and this is recognized as an important factor in the overall properties
of the rubber article.89 In certain cases it can be of benefit since waxes and
p-phenylene diamine rely heavily on diffusion to provide optimum protection
against degradation by ozone.90,91
Curative migration should be of partit.'UJar concern in an uncured tire since it contains
many interfaces between different rubber compounds with differing cure systems. It is
an established fact that several commonly used curatives such as sulphur, CBS, TMID
and DPG will diffuse quite readily across a rubber to rubber interphase.92-95 As
solubility of the curatives is greater in highly unsaturated rubbers than in the less
Introauction
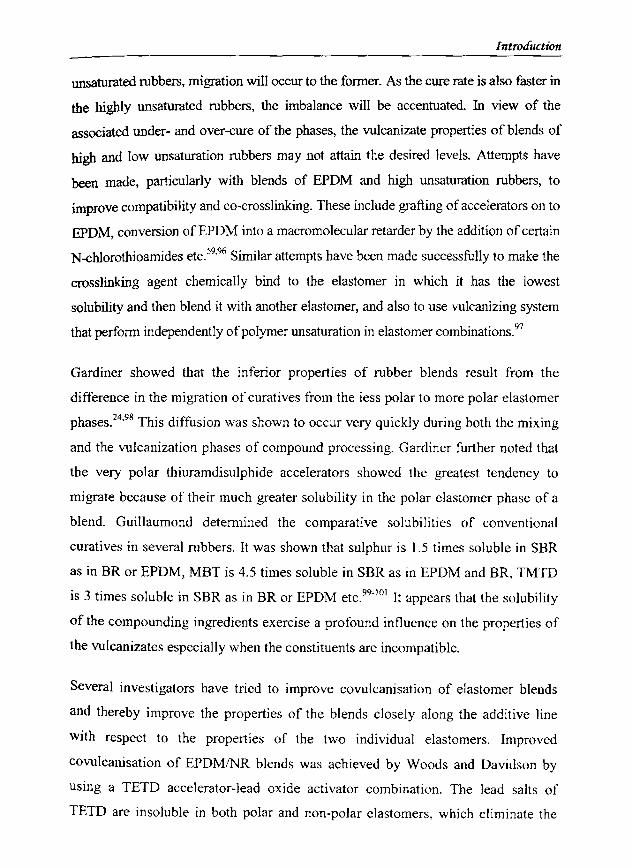
unsaturated rubbers, migration will occur to the former. As the cure rate is also faster in
the highly unsaturated rubbers, the imbalance will be accentuated. In view of the
associated under- and over-cure of the phases, the vulcanizate properties of blends of
high and low unsaturation rubbers may not attain the desired levels. Attempts have
been made, particularly with blends of EPDM and high unsaturation rubbers, to
improve compatibility and co-crosslinking. These include grafting of accelerators on to
EPDM, conversion ofEPDM into a macromolecular retarder by the addition of certain
N-chlorothioamides etc.59•96 Similar attempts have been made successfully to make the
crosslinking agent chemically bind to the elastomer in which it has the lowest
solubility and then blend it with another eJastomer, and also to use vulcanizing system
that perform independently of polymer unsaturation in elastomer combinations.97
Gardiner showed that the inferior properties of rubber blends result from the
difference in the migration of curatives from the less polar to more polar elastomer
phases.24•98 This diffusion was shown to occur very quickly during both the mixing
and the vulcanization phases of compound processing. Gardiner further noted that
the very polar thiuramdisulphide accelerators showed the greatest tendency to
migrate because of their much greater solubility in the polar elastomer phase of a
blend. Guillaumond determined the comparative solubilities of conventional
curatives in several rubbers. It was shown that sulphur is 1.5 times soluble in SBR
as in BR or EPDM, MBT is 4.5 times soluble in SBR as in EPDM and BR, TMTD
is 3 times soluble in SBR as in BR or EPDM etc.99•101 It appears that the solubility
of the compounding ingredients exercise a profound influence on the properties of
the vulcanizates especially when the constituents are incompatible.
Several investigators have tried to improve covulcanisation of elastomer blends
and thereby improve the properties of the blends closely along the additive line
with respect to the properties of the two individual elastomers. Improved
covu1canisation of EPDMINR blends was achieved by Woods and Davidson by
using a TETD accelerator-lead oxide activator combination. The lead salts of
TETD are insoluble in both polar and non-polar clastomers, which eliminate the

Cnapter 1
thermodynamic driving force for curative diffusion. 102 Coran achieved better cure
compatibility for EPDMINR blends by modifying the EPDM with maleic
anhydride which permits EPDM to be crosslinked independently with Zinc oxide
in the accelerated sulphur vulcanising system. An ionic crosslink network is
produced in the EPDM phase. This type of crosslinking is not competitive with the
accelerated sulphur system, which reacts rapidly with NR. Compared to
conventional NRlEPDM blends, those with the modified EPDM exhibited higher
tensile strength and the fatigue life along with reduced hysteresis and permanent
set, all of which reflect better covuIcanisation. The maleic anhydride treatment has
also been applied to HR and EPDM by Suma and coworkers for improved blending
with NR. 103 Zapp obtained interfacial bonding in the CIIRJSBR and CnRJBR
blends through the use of very active thiuram and thiuram tetrasulphide curative
systems, and also with bis alkyl phenol polysulphide as sulphur donor. 104
Apart from the migration of curing agents and fillers, the migration of other
ingredients has also been reported. Corman et al. demonstrated that migration of
oil on the eIastomer surface takes place depending on the structure of both
e1astomer and oi1. 105 In another study, Lewis et al. have shown that migration of
antiozonant takes place preferentially from EPDM to SBR during curing. 106 Such
diffusion across the rubber to rubber interphase can cause a change in the
distribution of materials, which may result in a change in physical properties, a loss
in adhesion or antidegradant protection and staining of light coloured compounds. bH
1.2.2.4 Crosslink type and network structure of vulcanized elastomer blends
The most important factor in determining the physical properties of rubber
vuIcanizates is the degree of crosslinking. In the case of sulphur vulcanization, the
nature of crosslinks and the presence of other rubber bound side products of
vulcanization may also influence physical properties. In the general case, diene
rubbers form not only mono-, di- and polysulphidic crosslinks but also, pendent
sulphide groups terminated by an accelerator residue, cyclo sulphides, conjugated

Introduction
diene and triene units, cis-trans isomerized olefin units and vicinal crosslinks
(figure 1.3).107-109
CROSSLlNKS
-c-I S I
-cMONOSULPHIDlC
-cI S I S I
-c-DISULPHIDIC
-cI Sx I
-cPOlYSUlPHlDlC
-cI SA I
-c- -c-I Ss I
--c-
MULTIFUNCTIONAL VICINAl
-c- -cI I S<I Ss I I
-c- -C-
VICINAL
OTHER MODlFICATONS
-c-I Sr I
-R-
PENDANT SIDE GROUP
-c-c-L~
CYCLIC SULPHIDlC
- C~C- C~C- C;C- C;C
CONJUGATED UN SATURATION
c;c--+c=c'" .,. , .,.
CISITRANS ISOMERIZATION
Figure 1.3 Structural features of SUlphur vulcanized diene rubbers
Polysulphidic crosslinks display poor thennal ageing resistance as a consequence of their
high chemical reactivity. Their enhancement of relaxation and swelling processes is
almost certainly due to their reaction ability to undergo rapid interchange which allows
crosslink breakage and refonnation to occur. 1 10. I I I 1be networks fonned with high
pro{X)rtions of polysulphidic cross links display higher tensile strength and tear strength
than networks prepared with monosulphidie or carbon-carbon crosslinks. II2-11
4 There is
also some evidence that resilience and resistance to fatigue failure are enhanced_ RO The
main chain modifications fonned by side reactions also appear to affect some properties.

Cliapter 1
Some of these are probably a consequence of an increase in polarity and/or an increase in
the glass transition temperature of the rubber. Others are a result of interruptions in the
stereo-regularity of the elastomeric backbone as a consequence of which the tendency to
crystallize is reduced. Thus the physical properties of sulphur vuIcanizates of diene
rubbers depend on the network structure which is composed of the degree of
crosslinking, crosslink structure and main chain modifications. Hence the primary
objective of the rubber compounder must be to select a mix composition and vulcanizing
conditions to achieve an appropriate network structure which will give and maintain
optimum physical properties. Achieving a desired network structure in vulcanizates of
elastomer blends is far too difficult than in individual rubbers due to the unproportional
migration of the curatives between the constituents and the varied response of the rubbers
towards them. However, arriving at optimum network structures in the constituent
rubbers of an elastomer blend is important since almost every property of the blend
vulcanizate depends upon the network structure.
1.3 Blending procedure
The general mixing methods for preparing elastomer blends include latex mixing,
solution mixing, mechanical mixing and mechanochemical mixing.63 These
methods may be further divided into two general categories of preblending and
phase mixing. In the first case, the compounding ingredients are generally added to
the premixed polymers in a manner similar to the mixing of a single elastomer. The
phase mixing method is generally accomplished by the preparation of separate
masterbatches which are then blended mechanically.
1.3.1 Preblending
1.3.1.1 Mechanical blending
The simplest preblending method IS mechanical blending. m .116 This is
accomplished either on a two roll mill or in an internal mixer, c.g. Banbury. Evans
and Partridge have showed that a single stage preblending procedure was a most

Introduction
cost effective method for preparing blends of NBR and chlorobutyl (eIIR).117 For
best results, the polymer components of a blend are usually mixed for a short
period prior to the addition of filler and rest of the compounding ingredients. 1lR
Bristow compared the properties of NR/BR blends as a function of blending
method. Firstly, by the addition of ingredients with no preblending, and secondly
by the blending of separate masterbatches which contained proportionate amounts
of the compounding ingredients. 1I9 No major differences in final compound
properties were observed. However, no studies were carried out with uneven
proportions of compounding ingredients added to the separate masterbatches. The
nature of the resulting dispersion depends on the period of mixing, temperature of
mixing, rheological properties of the component polymers etc.
1.3.1.2 Latex blending
When the individual components are available in latex form, they may be
conveniently combined by blending the latices.12o.12J The blend is then recovered
by coagulation or spray drying. This method results in an intimate and uniform
dispersion of the components. However one drawback is the difficulty in
completely removing the non polymeric materials (emulsifier etc.) that are present
in the latices.
1.3.1.3 Solution blending
Mixing of polymer solutions is mainly used for coatings, because it allows rapid
and easy mixing of the components at low energy costs, leads to simple
applications at normal temperatures and neither causes degradatlve colour changes
nor premature crosslinking reactions. m ,12] But for the preparation of the solid
polymer blends, this method requires removal of the solvent which usually leads to
phase separation. Furthermore, the use of solvents implies problems connected
with their price, toxicity, flammability, pollution and the economics of the whole
process. Usually only laboratory samples of solid polymer blends are prepared by
this method.

Cliapter 1
1.3.1.4 Reactive blending
Blends may also be prepared by dissolving a polymer in the monomer of the other
component and then polymerizing the second component. This may result in
appreciable grafting of the polymer in addition to good dispersion.
1.3.1.5 Dynamic vulcanization
Dynamic vulcanization is a comparatively new method of blending. This
concept was originally developed by Gessler for blends of CIIR and
polypropylene. With this mixing technique, the elastomer phase was
crosslinked to provide a vu1canizate within a thermoplastic matrix.
Dynamically vulcanized blends have been defined as elastomeric alloys (EA)
which represent a synergistic combination of an elastomer and thermoplastic.
The resultant properties are found to be superior than that would be expected
for a simple blend of the component polymers.
1.3.2 Phase mixing
Separate master batches are employed with this type of mixing in order to locate
specific types and amounts of curing agents or fillers in the separate polymer
h 51 S484 124-127 I f h l' d' f h' I" . P ases. . , , none 0 t e ear ler stu les 0 t IS type, so utJon mlxmg was
used to prepare NR and BR master batches at different carbon black loading. 51,128
This is a convenient method for difficult-to-mix polymers such as cis-I,4 BR. The
master batches were subsequently blended in a Banbury to produce tread
compounds with variation in carbon black phase distributions. The phase mixing
procedure assumes that the carbon black (or other ingredients) will remain in the
polymer to which it has been added. But this is not always true since there are
spccific conditions under which carbon black has been observed to migrate from
one polymer to another during mixing.

I ntroauction
Characterization of rubber blends 'n:~ JIbmogeneous or miscible blends are characterized by one value of any physical
parameter, whereas several values of the same parameters (corresponding to the
lt1bnber of components) are characteristic of immiscible or heterogeneous
SysteDlS.129 For example, blends of two incompatible materials show two or
~1tiple glass~transition temperatures. At the same time a homogeneous polymer
blend has only one glass transition temperature that lies in between those of the
two polymers. Thus many of the current methods employed to determine polymer
polymer miscibility depend on the transitional behaviour of polymer blends. In
mechanical methods, the polymer blend is subjected to small amplitude cyclic
deformations and the variations of elastic and the viscoelastic properties at the
transition point will yield necessary information. I30,131 Data obtained over a broad
temperature range can be used to ascertain the miscibility behaviour. In a highly
phase-separated polymer blend, the transitional behaviour of the individual
components will be unchanged. Likewise in a miscible blend a single and unique
transition will appear, In dielectric methods the transition data is obtained from
electrical measurements rather than dynamic mechanical testing.64 The advantage
is the ease with which the frequency can be changed. However, determination of
transitions of non-polar polymers is difficult. The variation of dielectric constant at
transition is measured in these methods. Dilatometric methods capitalize on the
discontinuity in the rate of volume change with temperature in the region of the
glass transition, while the calorimetric methods observe the change in specific heat
of polymers when passing through the glass transition. 132, 134
Various types of energy absorption or fluorescence spectroscopies have been
proven immensely useful for understanding the structure and dynamics of organic
molecules. These methods can also be applied to the structural studies of polymer
blends. NMR spectroscopy, infrared spectroscopy, energy dispersive X-ray
analysis etc. have seen wide application in blend studies.39. m ,137

CMpterl
For the detailed characterization of the phase morphology in blends, microscopy is
unmatched by any other technique. 13S In bulk, compatible polymers form transparent
films and fibers that exhibit no heterogeneity under considerable magnification in the
phase contrast microscope or in the electron microscope, no matter what staining
methods are employed. It should be noted that the films prepared from two
incompatible polymers can be transparent if the two component polymers have equal
refractive indices. Bolm et al. has indicated that, for transparency the critical difference
between refractive indices cannot be greater than 0.01.139 For example, Platzer reported
that transparent vinyl bottle compounds prepared from blends of polyvinyl chloride
(PVC) and methyl methacrylate-butadiene-styrene graft copolymers had matching
refractive indices. l40 Optical contrast can arise from a number of sources such as
colour, opacity, refractive index, orientation, absorption etc.141,142 With transmission
election microscope (TEM), electron scattering differences are the primary source of
contrast. The scanning electron microscope (SEM) on the other hand, depends
primarily on surface texture for contrast. SEM was used by 0' Conner to observe the
fracture surface of short fiber reinforced rubber composite with a view to fmd out the
degree of alignment, the uniformity of fiber dispersion and the extent of fiber-rubber
adhesion. 143 Bascom investigated fracture mechanism of rubber by using SEM.I44 The
fracture surface of a series of gum and filled rubber vulcanizates under different modes
of failure had been studied by Bhowmick et a1.145.147 Murty et al. and Chakraborty
et al. had used the SEM technique to study the fracture surface of short fiber-rubber
composites showing the fiber pull-out failure resulting from poor fiber-rubber
adhesion, the role of silica in promoting adhesion, the alignment of fibers in the matrix
and the nature of the fracture surfaces obtained in different types of failure tests.148.150
Akhtar et al. had predicted the extrusion characteristics of natural rubber/polyethylene
blend by observing the extrudate surface morphology using SEM. 1S1 Mathew et al. had
reported the fracture mechanism at different modes of fracture and the effect of
thermo-oxidative ageing of fracture surfaces of NR vulcanizate.152.154 The fracture
surface of unfilled NR vulcanizates showed a rough zone followed by a comparatively
smooth region. The presence of antioxidant or the change in vulcanizing system does

Introduction
not show any change in the mode of fracture as shown by their SEM studies. Deuri
et al. had studied the fracture surfaces of unaged and aged EPDM vulcanizates at
different modes of failure. 155,156 They correlated the tensile strength with the distance
between crack lines and tear lines.
Scattering methods depend on the principle that a stable homogeneous mixture is
transparent, whereas unstable non-homogeneous mixture is turbid unless the
components have identical refractive indices. 157 Probably the oldest and most used
method for determining polymer-polymer miscibility is the mutual-solvent
approach (ternary method).158 It consists of dissolving and thoroughly mixing a
50/50 mixture of two polymers at low to medium concentrations in a mutual
solvent. Miscibility is said to prevail if phase separation does not occur for a few
days. Other methods like inverse gas chromato!,'Taphy, solution viscosity, melt
rheology, melting point depression, sorption probes, spectroscopic techniques are
also employed for the study ofblends.39,9s,159,16o
1.5 Applications of rubber blends
Rubber-rubber blends are widely used for the manufacture of both small and large
rubber products. Examples include tire, belt, cable etc. Tire industry is consuming
almost more than half of the total consumption of rubber. It is interesting to note
that the major components of tire except tread ply have been successfully
compounded using rubber blends of two or three elastomers as shown below. 16!
Typical elastomers used in passenger and truck tires
Passenger Truck
Tread SBR-BR NR-BR or SBR-BR
Carcass NR-SBR-BR NR-BR
Black Sidewall NR-SBR or NR-BR NR-BR
Liner NR-SBR or NR-SBR-UR NR-IIR

In cable industry. the insulating cover is made mostly from elastomer-elastomer or
elastomer-thermoplastic blends for better resistance to abrasion. weathering. heat.
chemicals etc. Conveyor belts are another area in rubber industry using elastomer
blends. For top cover EPDM is blended with natural rubber (NR), chloroprene
rubber (CR), chlorobutyl rubber (CIIR). bromobutyl rubber (BIIR) etc.
1.6 Some useful rubber blends
The abrasion resistance and elasticity of natural rubber (NR) has been improved by
blending with polybutadiene (BR). finding application in tire tread.34 The
processing characteristics of car and truck tire tread recipes based on blends of BR
and SBR have also been reported. EPDM blended with SBR has shown
improvements in ozone and chemical resistance with better compression set
properties. 162 The poor processing properties of cis BR were improved by the use
of specific black and/or blending with NR or SBR. 163,164 One particular advantage
of blending BR with NR is the effect of high curing temperatures on physical
properties. This heat stability is conveyed by cis BR when blended with NR or
SBR.33 Butyl rubber is blended with NR for use as the inner liner of tubeless tires
for its good resistance to mechanical damping and permeability. Blends of EPDM
and nitrile rubber (NBR) have been cited as a compromise for obtaining moderate
oil and ozone resistance with improved low temperature properties. '65 Blends of
EPDM and chloroprene rubber are used in tire side wall. The blending of EPDM
with butyl rubber imparts enhanced heat resistant property. 53 A blend of silicone
and fluorosilicone polymers bonds easily with fluorosilicone adhesives and has
better physical properties, better processing and is cheaper than the unblended
polymer. 166
1.7 Objectives and scope of the present work
The use of blends of elastomers in place of single elastomer is increasing day-by
day due to several technical reasons. It is evident from the foregoing discussion

that the choice of elastomers depends on several factors. They must be cure
compatible and allow covulcanization. After blending, their processing
characteristics should be very good and product perfonnance better over the
component elastomers. All these properties must be understood fully to exploit
various rubber blends.
A detailed study of the blends of ethylene-propylene-diene rubber (EPDM) and
chlorobutyl rubber (CUR) is proposed in this study. These blends may find
application in the manufacture of curing diaphragms/curing envelopes for tire
curing applications. EPDM possesses better physical properties such as high heat
resistance, ozone resistance, cold and moisture resistance, high resistance to
permanent defonnation, very good resistance to flex cracking and impact. Because
of the low gas and moisture penneability, good weathering resistance and high
thermal stability of CIIR, blends of EPDM with CIlR may be attractive, if
sufficient mechanical strength can be developed. Although a lot of work has been
done on elastomer blends, studies on the blends of EPDM and CIIR rubbers are
meagre. Hence in this investigation it is proposed to make a systematic study on
the characteristics of EPDM and CIIR rubber blends.
The mechanical and physical properties of an elastomer blend depend mainly on the
blend compatibility. So in the first part of the study, it is proposed to develop
compatible blends of EPDM with CIIR. Various commercial grades of ethylene
propylene-diene rubber are proposed to be blended with a specific grade of chlorobutyl
rubber at varying proportions. The extent of compatibility in these blends is proposed
to be evaluated based on their mechanical properties such as tensile strength, tear
strength and ageing resistance. In addition to the physical property measurements,
blend compatibility is also proposed to be studied based on the glass transition
behavlour of the blends in relation to the Tg's of the individual components using
Differential Scanning Calorimetry (DSC) and Dynamic Mechanical Analysis (DMA).
The phase morphology of the blends is also proposed to be investigated by Scanning
Electron Microscopy (SEM) studies of the tensile fracture surfaces. In the case of

OUJpterf
incompatible blends, the effect of addition of chlorosulfonated polyethylene as a
compatibiliser is also proposed to be investigated.
In the second part of the study, the effect of sulphur curing and resin curing on the
curing behaviour and the vulcanizate properties of EPDM/CIIR blends are planned
to be evaluated. Since the properties of rubber vulcanizates are determined by their
network structures, it is proposed to determine the network structure of the
vulcanizates by chemical probes so as to correlate it with the mechanical
properties.
In the third part of the work, the effect of partial precuring of one of the
components prior to blending as a possible means of improving the properties of
the blend is proposed to be investigated. This procedure may also help to bring
down the viscosity mismatch between the constituent e1astomers and provide
covulcanization of the blend.
The rheological characteristics and processability of the blends are proposed to be
investigated in the last part of the study. To explore their possible applications, the
air permeability of the blend samples at varying temperatures is proposed to be
measured. The thermal diffusivity behaviour of EPDM/CIlR blends is also
proposed to be investigated using novel laser technique. The thermal diffusivity of
the blends along with the thermal degradation resistance may help to determine
whether the blends are suitable for high temperature applications such as in the
manufacturing of curing envelope.
This thesis is divided into the following eight chapters:
Chapter I
Chapter II
Chapter III
Chapter IV
Introduction
Experimental techniques
Compatibility studies on EPDM/CIIR blends
Studies on sulphur cured EPDM/CIIR blends

Chapter V
Chapter VI
Chapter VII
Chapter VIII
Introduction
EPDM/CIIR blends: Improved mechanical properties
through precuring
Effect of resin curing on the mechanical properties of
EPDM/CIIR blends
Rheology, air permeability, thermal stability and thermal
diffusivity studies on EPDM/CIIR blends
Summary and Conclusions

Cliapter 1
References
1 Paul and NeWJllaJl, Polymer blends, Academic Press, N.Y. (1978).
2 M. Kryszewski, A. Gateski and E. Martuscelli (eds.), Polymer blends:
Processing, morphology and properties, Plenum Press (1979).
3 O. Olabisi, L.M. Robeson and M.T. Shaw, Polymer-Polymer miscibility,
Academic Press, N. Y., Chapter 5 (1979).
4 J.W. Barlow and D.R Paul, Polym. Eng. Sci., 21, 985 (1981).
5 M.S. Sutton, Rubber World, 62 (1964).
6 M.H. Waiters and O.N. Keyte, Rubber Chem. TechnoL, 38, 62 (1965).
7 RF. Gould (eds.), Multicomponent polymer system, American Chemical
Society Publications (1971).
8 RP. Sheldon, Composite polymeric materials, Applied Science Publishers,
London (1982).
9 D.R Paul and J.W. Barlow, 1. Macromo!. Sci., Rev. Macramo!. Chem., 109,31
(1980).
10 AJ. Tinker, Rubber Chem. Technol., 68, 461 (1995).
11 A. Y. Coran, Rubber Chem. T echnol., 68, 351 (1995).
12 Andrew 1. Tinker, Rubber Chem. Techno!., 63, 503 (1990).
13 C.S.L. Baker, W.G. Hallam and LF. Smith, N.R. Technology, Vo1.5, part 2
(1974).
14 W. Witt and Lever Kusen, Kausch. Gummi. Kunstst., 73, 498 (1983).
15 lE. Callan, B. Topick and F.P. Ford, Rubber World, 60, 13 (1965).
16 F.G. Gharavi and A.A Katbab, RubberChem. Technol., 6, 129 (1990).
17 L.A Utracki and R.A Weiss (eds.), Multiphase Polymer Blends and
Ionomers (1989).

lntroauctwn
18 E. Martuscelli, R Palumbo and M. Kryszewski (eds.), Polymer Blends:
Processing, Morphology and Properties, Plenum Press, N. Y., Chapter I (1979).
19 L.H. Sperling (eds.), Recent Advances in Polymer Blends, Grafts and Blocks,
Plenum Press, N.Y., Chapter 2 (1974).
20 L.A. Utracki, Polym. Eng. Sci., 22, 1166 (1982).
21 A.S. Hay, 1. Am. Chem. Soc',,81, 6335 (1959).
22 L.A. Utracki, Polym. Plast. Technol. Eng., 22, 27 (1984).
23 Sarah Yarger Kienzle, Plast. Eng., 41,124(1987).
24 M. Xanthos and S.S. Dagli, Polym. Eng. Sci., 31, 929 (1991).
25 L.E. Nielson, Predicting the Properties of Mixtures, MarceI Dekker, N.Y.
(1978).
26 RL. Markham, Adv. Polym. Tech., 10,231 (1991).
27 J.B. Gardiner, Rubber Chem. Technol., 43, 370 (1970).
28 M.V. Kazhdan, N.F. Bakeyev and Z.L. Berestneva, 1. Polym. Sci., 38, 443
(1972).
29 PJ. Corish, Rubber Chem. Technol., 40, 324 (1967).
30 J. Rehnerand P.E. Wei, RubberChem. Technol., 42, 985 (1969).
31 G.R. Hamed, Rubber Chem. TechnoI., 55, 151 (1982).
32 AN. Gent, Science and Technology of Rubber, F.R. Eirich (eds.),
Academic Press (1978).
33 T.L. Smith and F.R. Eirich, Fracture, H.Liehbowitz (eds.), Academic
Press, N.Y. (1972).
34 B. Pukanszk.y and F.HJ. Maurer, Polymer, 36,1617 (1995).
35 C. Qin, J. Yin and B. Huang, Rubber Chem. Technol., 63, 77 (1989).
36 B. Kuriakose and S.K. De, Polym. Eng. Sci., 25, 630 (1985).
37 B. Ohlsson, H. Hassandcr and B. Tomell, PoJym. Eng. Sci., 36, 50 I (1996).

OIiPS 1
38 K.T. Varughese, G.B. Nando, P.P. De and S.K. De, J. Mater. Sci., 23, 3894
(1988).
39 B.D. Favis, J. Appl. Poiym. Sci., 39, 285 (1990).
40 e.M. Roland, Rubber Chem. Technol., 62, 456 (1989).
41 P.J. Fiory, Principles of Polymer Chemistry, Cornell Dniv. Press, Ithaca
(1953).
42 J. Kovar, 1. Fortelny and M. Bohdanecky, Int. Polym. Sci. Technol., 9,
50 (1982).
43 J.W. Barlow and D.R. Paul, Poiym. Eng. Sci., 24, 525 (1984).
44 L.M. Robeson, Polym. Eng. Sci., 24, 587 (1984).
45 M.T. Shaw, Polym. Eng. Sci., 22, 115 (1982).
46 M.M. Coleman, C.J. Serman, D.E. Bhagwager and D.e. Panita, Polymer,
31,1187 (1990).
47 J. Brandrup, E.H. Immergut, (eds.), Polymer Hand Book, 2nd edn., John Wiley
and Sons, N.Y. (1982).
48 M. Xanthos and S.S. Dagli, Polym. Eng. Sci., 31, 929 (1991).
49 L.M. GJanville and P.W. Milner, Rubb. Piast. Age, 48, 1059 (1957).
50 R Grimberg, Ind. Usoara, 13, 339 (1966).
51 e.S.L. Baker, W.G. Hallam and I.F. Smith, NR Technology, Vol. I, part 1,
5 (1974).
52 e.S.L. Baker, W.G. HaJlam and I.F. Smith, NR Technology, Vol. 5, part 2,
29 (1974).
53 AJ. Tinker, Proc. National Seminar on Rubber Blends, Rubber Research
Institute oflndia (RRII) (1995).
54 M. Imoto, J. Assoc. Rubb. Ind., 42, 439 (1969).
55 P.A Marsh, A Voet and L.D. Price, Rubber Chem. Technol., 40, 359
(1967).

I ntroauction
56 W.M. Hess, e.R Herd and P.e. Vegvari, Rubber Chem. Technol., 66, 329
(1993).
57 K. Hashimoto, T. Harada, I. Ando and N. Okubo, J. Soc. Rubb. Ind., 43,
652 (1970).
58 K. Fujimoto, 1. Soc. Rubb. Ind., 43, 54 (1970).
59 K.c. Baranwal and P.N. Son, Rubber Chem. Technol., 47, 88 (1974).
60 N. Yoshimura and K. Fujimoto, Rubber Chem. Technol., 42, 1009 (1969).
61 D.R. Paul and G.W. Barlow, Adv. Chem. Ser., 176,315 (1979).
62 M. Xanthos, Polym. Eng. Sci., 28, 1392 (1988).
63 A.1. Tinker, Blends of Natural Rubber with Specialty Synthetic Rubbers in
Industrial Composites based on Natural Rubber ( 1987).
64 W.M. Barentsen and D. Heikens, Polymer, 14,579 (1973).
65 Y. Nakarnura, Am. Chem. Soc. Prepr., 57, 684 (1987).
66 Nakarnura, Yoshoro, Watanabe, Akira, Mori, Ku inoi , Tarnura Kosaku and
Miyazaki Hitosi, J. Polym. Sci., 25,127 (1987).
67 F. Ide and A. Hascgawa, J. Appl. Polym. Sci., 18,963 (1974).
68 M. Hajian, C. Sadrrnohaghegh and G. Scott, Eur. Polym. 1., 20, 135
(1984).
69 N. Tokita, Rubber Chem. Technol., 50, 292 (1977).
70 G. Avergopoulos, RC. Weissert, P.H. Biddison and G.G.A. Bohm, Rubber
Chem. Technol., 49, 93 (1976).
71 W.M. Hess, RA. Swor and P.e. Vegvari, Rubber Chem. Technol., 58,
350 (1985).
72 W.M. Hess, c.E. Scott and J.E. Callan, Rubber Chcm. Tcchnol., 40, 371
(1967).
73 M.H. Watters and D.N. Keyte, Inst. Rubb. Ind., 38,40 (1962).

Cfiapter 1
74 RP. Dinsmore and RD. Juve, Synthetic Rubber, G.S. Whitby (eds.), John
Wiley & Sons, Corp. Inc., N.Y. (1954).
75 P.1. Corish and M.J. Palmer, IRT Conference, Loughborough, England,
(1969).
76 P.J. Corish, Rubber Chem. Technol., 47,481 (1974).
77 lE. Callan, W.M. Hess and C.E. Scott, Rubber Chem. Technol., 44, 814
(1971).
78 AK. Sircar, T.G. Lamond and P.E. Pinter, Rubber Chem. Technol., 47,
48 (1974).
79 P.A Marsh, T.1. MuIIens and L.D. Price, Rubber Chem. Technol., 43, 400
(1970).
80 G.lvan, G. Balan and M. Giurgiuca, Ind. Usoara, 19,665 (1972).
81, K. Abe, M. Ashida and T. Watanabe, l Soc. Rubb.lnd., 46, 397 (1973).
82 M. Ashida, Y. Inugai, T. Watanabe and K. Kobayashi, l. Soc. Rubb. Ind.,
46, 241 (1973).
83 AI. Medalia, RubberChem. Technol., 51, 437 (1978).
84 P.l. Corish, Science and Technology of Rubber, F.R Eirich (eds.),
Academic Press, N.Y., Chap. 12 (1978).
85 T. lnoue, Inl. Polym. Sci. TechnoL, 8, 65 (198 [).
86 K. Fujimoto and S. Yoshimura, Rubber Chem. Technol., 41, 699 ( 1968).
87 RL. Zapp, Rubber Chem. T echnol., 46, 251 (1973).
88 P.l. Corish, Polymer Blends and Mixtures, DJ. Walsh, lS. Higgins and A.
Maconnachie (eds.), Martinus Nijhoff Publishers, Dordrecht, (1985).
89 D.A. Lederer, K.F. Kear and G.H. Kuhls, Rubber Chem. Technol., 55, 1482
(1982).
90 P.l. Dimauro, ILL. Paris and M.A. Fath, Rubber Chem. Technol., 52, 973
(1979).

Introduction
91 D.A. Ledererand M. A Fath, RubberChem. Tedmol., 54, 415 (1981).
92 J.B. Gardiner, Rubber Chem. Technol., 42, 1058 (1969).
93 lB. Gardiner, Rubber Chem. Technol., 41,312 (1968).
94 J.E. Lewis, M.L. Deviney and L.L. Whittington, Rubber Chem. Technol.,
42, 892 (1969).
95 G.J. Van Amerongin, Rubber Chem. TechnoL, 37, 1065 (1964).
96 RJ. Hopper, Rubber Chem. TechnoI., 49,341 (1976).
97 K.V. Boguslavskii, Soviet Rubber Tecbnol., 29, 7 (1970).
98 M.E. Woods and TR. Mass, Copolymers, polyblends and composites,
N.A.J. Platzev (eds.), Advances in Chemistry Series No. 142., American
Chemical Society, Washington D.C. (1975).
99 M.E. Woods and lA. Davidson, Rubber Chem. Technol., 49,112 (1976).
100 W.H. Whittington,Rubb. Ind., 9,151 (1976).
10 1 F.X. Guillaumond, Rubber Chem. Technol., 49, 105 (1976).
1 02 AY. Coran, Rubber Chem. T echnol., 68, 281 (1988).
103 N. Suma, R Joseph and 0.1. Francis, Kautsch. Gummi. Kunstst., 43, 1095
(1990).
104 RL. Zapp, Rubber Chem. Tcchnol., 46, 251 (1973).
105 E.G. Corman, M.L. Devineyand L.E. Whittington, Division of Rubber Chem.,
American Chemical Society, Florida (1971).
106 lE. Lewis, M.L. Deviney and L.E. Whittington, Rubber Chem. Technol.,
42, 892 (1969).
107 A.M. Zaper and J.L. Koenig, Rubber Chem. TechnoI., 60, 252 (I 987).
108 P.M. Lewis, NR Technology, 174,57 (1986).
109 NJ. Morrison and M. Porter, Rubber Chem. Tcchnol., 57, 63 (1984).
110 Al. Parker and N. Kharasch, Chem. Rev., 59, 585 (1959).

Cnapter 1
III L. Field, Organic Chemistry of Sulphur, S. Oae (eels.), Plenum Press,
N.Y. (1977).
112 G.M. Bristow and G.F. Tiller, Kautsch. Gummi. Kunstst., 23, 55 (1970).
113 F.P. Baldwin and G. Verstrate, Rubber Chem. Technol., 45, 709 (1972).
114 E. Southern, Elastomers Criteria for Engineering Design, C. Hepburn
and R.J.W. Reynolels (eels.), Applied Sciences Publishers, London, Chap. 16
(1979).
115 T. Pazonyi and M. Dimitrov, Rubber Chem. Technol., 40, 1119 (1967).
116 L.T. Fan, S.l Chem and c.A. Watson, Ind. Engg. Chem., 62, 53 (1970).
117 L. Evansand E.G. Partridge, Rubber Age, 94, 272 (1963).
118 W.M. Hess and V.E. Chirico, Rubber Chem. Technol., 50, 301 (1977).
119 G.M. Bristow, NR Technolob'Y, 9, 1 (1978).
120 B.S. Gesner, Polyblends, Encyclopedia of Polymer Science and
Technology, N.M. Bikales, (eds.), Wiley Interscience, N.Y. (1969).
121 S.N. Angove, Rubb. l, 149, 37 (1967).
122 M.II. WaIters and D.N. Keyte, Trans. lust. Rubb. Ind., 38, 40 (1962).
123 DJ. Livington and RL. Rongone, Proc. lnst. Rubb. Coru., Brighton, p. 337
(1968).
124 V.A. Shershnev, RubberChem. Technol., 55, 537 (1982).
125 AK. Bhowmick and S.K. De, Rubber Chem. Technol., 53, 960 (1980).
126 R.F. Bauerand E.A. Dudley, Rubber Chem. Technol., 50, 35 (1977).
127 P.A. Marsh, A. Voet and L.D. Price, Rubber Chem. Technol., 40, 359
(1967).
128 F.A. Burgess, S.S. Thune and E. Palmese, Rubber World, 149,34 (1964).
129 F.E. Karaz, Polymer Blends and Mixtures, DJ. Walsh, J.S. Higgins and A.
Maconnachie (005.), Martinus Nijhoffl>Ublishers, Drodrecht, Chap. 3 (1985).

Introauction
130 RF. Boyer, Rubber Chern. Technol., 36,1303 (1963).
131 H.G. Weyland, PJ. Hoftyzer and D.W. Van Krevelen, Polymer, 11, 79
(1970).
132 lE. Harris, D.R Paul and lW. Barlow, Polym. Eng. Sci., 23, 676 (1983).
133 CA. Cruz, lW. Barlow and D.R Paul, Macromolecules, 12,726 (1979).
134 DJ. Walsh, 1.S. Higgins and C Zhikuan, Polymer, 23, 336 (1982).
135 J.K Clark and RA. Scott, Rubber Chem. Technol., 43, 1332 (1970).
136 P.R Lewis and C. Price, Polymer, 12, 258 (1971).
137 A. Douy and H.B. Gallot, Macromol. Chem., 156, 81 (1972).
138 M.T. Shaw, Polymer Blends and Mixtures, DJ. Walsh, l.S. Higgins
and A. Maconnachie (eds.), Martinus Nijhoff Publishers, Dordrecht
(1985).
139 L. Bohn, Polymer Handbook, 1. Brandrup and E.H. Irnmergut (cds.),
Wiley Interscience, 200 edn., N.Y. (1975).
140 N. Platzer, Chem. Technol., 56, 60 (1976).
141 G. Kraus and KW. Rothmann, Adv. Chem. Ser., 99, 189 (1971).
142 R Kuhn, S.B. Liang, HJ. Cantow and A Angew, Macromol. Chem., 18, 101
(1971).
143 lE. O'Conner, RubbcrChem. Technol., 50, 945 (1977).
144 W.D. Bascom, Rubber Chem. TechnoI., 50, 875 (1975).
145 AK. Bhowmick, S. Basu and S.K De, Rubber Chem. TechnoL, 53, 321
(1980).
146 AK. Bhowmick, G.B. Nando, S. Basu and S.K. De, Rubber Chem.
Technol., 53, 327 (1980)_
147 AK. Bhowmick, RubbcrChem. TechnoJ., 55, 1055 (1982)-
148 V.M. Murty, A.K Bhowmick and S.K. De, l. Mat. Sci., 17,709 (1982)_

Chapter 1
149 V.M. Murty and S.K. De, Rubber Chem. Technol., 55,287 (1982).
150 S.K. Chakraborty, D.K. Setu and S.K. De, Rubber Chem. TechnoL, 55,
1370 (1982).
151 Sania Akhtar, Baby Kuriakose, Prajna P. De and Sadhan K. De, Plast
Rubb. Process. Appl., 7, 11 (1987).
152 N.M. Mathew and S.K. De, Polymer, 23, 632 (1982).
153 N.M. Mathew, AK. Bhowmick, B.K. Dhinda and S.K. De, J. Mat. Sci.,
17,2554 (1982).
] 54 N.M. Mathew and S.K. De, Polymer, 24, 1042 (1983).
155 A Saha Deuri and AK. Bhowmick, J. Mat. Sci., 22, 4299 (1987).
] 56 A Saha Deuri and Anil K. Bhowmick, 1. Appl. Polym. Sci., 35, 30 (1988).
157 O. Olabisi, L.M. Robeson and M.T. Shaw, Polymer-Polymer
Miscibility, Academic Press, N.Y. (1979).
158 S.S. Voyutaky, Autohesion and Adhesion of H.igh Polymers, WiJey
Interscience, N.Y. (1953).
159 J.E. Guillet, J. Macromo!. Sci. Chem., 4, 1669 (1970).
160 D.R. Paul, Polymer Blends and Mixtures, DJ. Walsh, 1.S. H.iggins and
A Maconnachie (eds.), Martinus Nijhoff Publishers, Dordrecht ( J 985).
161 AY. Coran and R. Patel, Rubber Chem. Technol., 53, 141 (1980).
]62 M.S. Sutton, Rubber World, 149,62 (1964).
163 C.S.L Baker, W.G. Hallam and I.F. Smith, NR Technology, VoLl, part I,
5(1974).
164 C.S.L. Baker, W.G. Hallam and I.F. Smith, NR Technology, Vol.5, part 2,
29(1974).
165 RAPRA Material Evaluation Report File Sheets 9 and 10.
166 Dow Coming Corporation Adhesives Age, 14, 33 (1971).

Experimental Techniques
The materials used and the experimental procedures adopted III the present
investigation are given in this chapter.
2.1 Materials
2.1.1 Ethylene-propylene-diene rubber (EPDM)
Four grades of EPDM were used. (I) Herline 301-T, manufactured by Herdilia
Unimers Limited, Mumbai, (2) NDR-4640, manufactured by Nordel Dupont,
Beaumont, USA, (3) Royalene MRD-J 0, manufactured by UniroyaI, Inc.,
Geismar, USA and JSR EP-96, manufactured by Japan EPR Company,
Yokkaichi, Japan. The specifications of the four different grades of EPDM used
are given in table 2.1.
Table 2.1 Specifications of EPDM grades
EPDM grade 301-T NDR-4640
Mooney viscosity 47.8 53.4
[ML (l +8) @ 100°C]
E/P ratio 68/32 55/45
Diene type *DCPD #ENB
Iodine value 10.5 16.0
* Dicyclopentadiene
# Ethylidene norbornene
EP-96
74
63/27
#ENB
19.0
MRD-IO
14
64/36
#ENB
7.2

Cfiapter2
2.1.2 Chlorobutyl rubber (CUR)
Exxon Chlorobutyl (1066) manufactured by Exxon Chemical Company, Baton
Rouge, USA having the following specifications was used.
Table 2.2 Specifications of chlorobutyl
Raw Polymer viscosity [ML (1 +8) @ IOO°C] 56.3
Volatile matter (%) 0.20
Chlorine content (%) 1.20
Iodine value 8.4
2.1.3 Chlorosulfonated polyethylene (CSPE)
Chlorosulfonated polyethylene used was manufactured by Aldrich Chemicals,
USA. The CSPE was obtained as white chips and had a specific gravity of 1.12,
sulphur content of 1.4 % and chlorine content of 26 %.
2.1.4 Polychloroprene rubber (Neoprene-W)
Polychloroprene rubber used was MC 30 Butachlor, manufactured by Enichem
Elastomers, GRE Noble, France. The light cream flakes had a specific gravity 1.23,
volatile matter 1.3 % and Mooney viscosity [ML (I +8) @ 100°C] 46.
2.1.5 Zinc Oxide
Zinc oxide (ZnO) was supplied by Meta Zinc Ltd., Mumbai. It had the following
specifications.
Specific gravity
ZnO content
Acid content
Heat loss (2 hrs at 100°C)
5.5
98%
0.4 % max.
0.5 % max.

l£XPdfflithtat tilhhiijUi's
2.1.6 Stearic acid
Stearic acid used was supplied by Godrej Soaps Pvt. Ltd., Mumbai and had the
following specifications.
Melting point
Acid value
Iodine value
Specific gravity
Ash
2.1.7 Mercapto benzthiazole
50-69 QC
185-210
95 max.
0.85 ± 0.01
0.1 %max.
Mercapto benzthiazole (MBT) having the following specifications was supplied by
Bayer India Ltd., Mumbai.
Specific gravity
Melting point
2.1.8 Tetra methyl thiuram disulphide
1.50
161 QC
Tetra methyl thiuram disulphide (TMTD) used was supplied by po\yoJefin
Industries Ltd., Mumbai. It had the following specifications.
Melting point
Specific gravity
2.1.9 Zinc diethyl dithiocarbamate
136°C
1.4
Zinc diethyl dithiocarbamate (ZDC) was supplied by lCl India Ltd., Kolkata as a
creamy white powder, soluble in chloroform, CS2 and benzene and had the
fOllowing specifications.
Melting point 178 QC
Specific gravity 1.47

CHdpa; 2
2.1.10 N-cyclohexyl-2-benzthiazyl sulphenamide
N-cyclohexyl-2-benzthiazyl sulphenamide (CBS) used in the study was Santocure
CBS supplied by Polyolefin Industries Ltd., Mumbai, having the following
specifications.
Ash
Moisture
Specific Gravity
2.1.11 Sulphur
0.5 % max.
0.5 % max.
1.27
Sulphur was supplied by Standard Chemical Company PvC Ltd., Chennai and had
the following specifications.
Specific ~'Tavity
Acidity
Ash
Solubility in CS2
2.1.12 Accinox ZC
2.05
0.01 % max.
0.01 % max.
98 % max.
Accinox ZC was supplied by ICI India Ltd., Kolkata as dark brown granules. It had
the following specifications.
Specific gravity 1.02
Melting point
2.1.13 Methylol phenol resin
Methylol phenol resin was supplied by Apollo Tyres Limited, Cochin. It had the
following specifications
Specific gravity
Softening point
Methylol content
1.04
87.5 QC
9%

-- P.xperi:rtumta( tecfzniques
2.1.14 High abrasion furnace black
High abrasion furnace black (HAF N 330) was supplied by Carbon and Chemicals
(India) Ltd., Cocmn. It had the following specifications.
Iodine adsorpti09 number
DBP absorption
Mean particle diameter
2.1.15 Paraffinic oil
80 mglg
105 cm3/I00 g
32nm
Paraffinic oil was supplied by Hindustan Petroleum Ltd. It had the following
specifications
Colour
Aniline point
Viscosity gravity constant
Density
2.2 Preparation and moulding of specimens
2.2.1 Mixing and homogenisation
Light Yellow
198 cC
0.857
0.861 glem3
Mixing and homogenisation of elastomers and compounding ingredients were
done on a laboratory size (16 x 33 cm) two roll mill at a friction ratio of
I: 1.25. The elastomer was given one pass through the nip of (0.002 x 100)".
Then it was given 2 passes through the nip of (0.002 x 10)" and allowed to
band at the nip of (0.002 x 55)". After smooth band formation on the mill, the
compounding ingredients were added as per ASTM D 3184 (1980) and ASTM
D 3182 (1982) in the order: activators, fillers, accelerators and curing agents.
Before the addition of accelerators and sulphur, the batch was thoroughly
cooled to prevent scorching of the compound on the mill.
After incorporating all the ingredients, the compound was homogenized by
passing six times endwise through a tight nip and finally sheeted out at a nip

C/iapter2
gap of 3 mm. Blending of elastomers was done by banding EPDM first on the
roll followed by the addition of chlorobutyl and blending continued till visual
homogenization. The additives were then added as described above.
Properties of some partially pre-vulcanized EPDM/CIIR blends were also
studied. For this, CIlR was compounded first with the required additives and
precured to a Iow level. These precured samples were blended with EPDM on
the mill and then compounding ingredients for EPDM were added. The
mixing process was continued till visual homogenization to get the final mix.
2.2.2 Cure characteristics
Cure characteristics have been studied using a Rubber Process Analyzer (RPA
2000, Alpha Technologies) as per ASTM D 1646 (1981). The die type used was
biconical and the die gap was 0.487. It is a microprocessor controlled rotorless
cure meter with a quick temperature control mechanism and well defined
homogenous temperature distribution in the die or test chamber. In this
instrument, a specimen of definite size is kept in the lower half of the cavity
which is oscillated through a small deformation angle of 0.20 degree. The
optimum cure time of the samples was determined at 170°C at a frequency of
50.0 cpm. The torque is measured on the lower oscillating die half. A typical
elastograph cure curve is shown in figure 2.1 and the following data can be
taken from the torque - time graph.

~rimenta{ tecliniques
cL-- B
I
+- Optimum cure time -+ I I
Cure time
Figure 2.1 A typical cure &'11lph
(1). Minimum torque: Torque obtained by the mix after homogenising at the
test temperature before the onset of cure
(2). Maximum torque: Torque recorded after the complete curing of the mix
(3). Scorch time (t]O): Time taken for attaining 10 % of the maximum torque
(4). Optimum cure time (t90): Time taken for attaining 90 % of the maximum
torque
(5). Cure rate: Cure rate was detennined from the following equation
Lmax -Lmin Cure rate (Nmlmin) = (2.1 )

where Lmax and Lmin are the maximum torque and minimum torque respectively and
t90 and tlO are the times corresponding to the optimum cure time and scorch time
respectively. The Rubber Process Analyzer evaluates the vulcanization curve and
prints out the data after each measurement.
2.2.2.1 Cure time
On examination of the graph of torque vs. time (figure 2.1), one can observe that
the torque decreases initially with time due to reduction in viscosity and thixotropic
effect, but increases, steadily as vulcanization starts. As vulcanization proceeds this
torque shows a steady increase, attains a maximum value and then slowly
decreases due to polymer de.b'T3dation. For practical purposes cure time is taken as
the time for the development of 90 % of maximum torque and is denoted as t90. But
in the case of rheographs showing marching modulus, optimum cure time was
calculated as follows. Two tangents AC and BC were drawn on the rheographs as
shown in figure 2.1. They meet each other at point C. The points of contact (A and
B) of the tangents and the rheograph were connected by a straight line AB. The
middle point 0 of the straight line was connected with point C (point of
intersection of the two tangents). The line CO cuts the rheograph at point T. The
time corresponding to the torque at point T of the rheograph was taken as the
optimum cure time. A similar procedure was adopted by Chakraborty and De. I
2.2.2.2 Mooney viscosity measurements
The Mooney viscosities of the raw rubbers were measured on the Mooney
viscometer which is designed for measuring the shearing viscosity of rubber and
rubber like materials by a disc rotating (2 rev/min) in a cylindrical cavity set at
100°C and filled with rubber under test. In running a viscosity test, the sample was
allowed to warm up for one minute after the platens were closed and the motor was
then started. Reading taken after 8 minutes was reported as the Mooney viscosity
of rubber [ML( I +8) @ 100 DC]. The procedure given in ASTM D 1646 (1981) was
followed.

P.:{perimenta{ tecfmiques
~ Compression moulding
[- t·--~ test specimens for detennining the physical properties were prepared by
vulcanizing the blanks cut from unvu1canized sheets marked with the machine
~on at a temperature of 170 ± I °C in standard moulds by compression
~ulding on an electrically heated hydraulic press (Santosh model SMP- 50), ,: , 2 llaving 30 x 30 cm platens at a pressure of 200 kg/cm on the mould. The rubber
compounds were vulcanized upto their respective optimum cure times. Mouldings
were cooled quickly in water at the end of each curing cycle and stored in a cold
and dark place for 24 hours and were used for subsequent physicals tests. For
samples having thickness more than 4 mm (heat build-up, compression set,
abrasion resistance etc.) additional time based on the sample thickness was given
to obtain satisfactory mouldings.
2.3 Physical test methods
For the tests described below at least three specimens per sample were tested for
each property and mean values are reported.
2.3.1 Modulus, Tensile strength and Elongation at break
Tensile properties of the elastomer blends were determined according to ASTM
D 412 (1980) using dumbbell specimens on a Shimadzu Universal Testing
Machine (model-AG 1) with a load cell of 10 kN capacity. All the tests were
carried out at ambient temperature. Samples were punched out from
compression moulded sheets along the mill direction using a dumbbell die.
A bench thickness gauge was used to measure the thickness of the narrow
Portion. The sample was held tight by the two grips, the upper grip of which
was fixed. The gauge length between the jaws at the start of each test was
adjusted to 30 mm and the rate of separation of the power actuated upper grip
was fixed at 500 mm/min for elastomeric specimens. The tensile strength,
elongation at break and modulus were evaluated and printed out after each

oapterZ .
measurement by the microprocessor. The modulus and tensile strength are
reported in mega pascal (MPa) unit and elongation at break in percentage (%).
2.3.2 Tear strength
The tear strength of the samples was tested as per ASTM D 624 (1981) using
unnicked, 90° angle test pieces. The samples were cut from the compression
moulded sheets parallel to the mill grain direction. The test was carried out on a
Shimadzu Universal Testing Machine (model-AGl). The speed of extension was
500 mm/min and the test temperature 28 ± 2 qc. The tear strength values are
reported in Newton per millimeter (N/mm).
2.3.3 Hardness
The hardness of the moulded samples was tested using Zwick 3114 hardness tester
in accordance with ASTM D 2240 (1981). The tests were performed on
mechanically unstressed samples of 12 mm diameter and minimum 6 mm
thickness. A load of 12.5 Newton was applied and the readings were taken 10
seconds after the intender made a firm contact with the specimen. The mean value
of three measurements is reported. The hardness values are reported in Shore A
unit.
2.3.4 Compression set
The samples (6.5 mm thick and 18 mm diameter) in duplicate, compressed to
constant deflection (25 %) were kept 22 hours in an air oven at 70°C. After the
heating period, the samples were taken out, cooled to room temperature for half an
hour and the final thickness was measured. The compression set was calculated as
follows:
(t -[ ) Compression set (%) = i f xl 00
(t j -tJ (2.2)

tExperimenta[ tecfmiques
where ti and tf are the initial and final thickness of the specimen respectively and t.,
thickness of the spacer bar used. The procedure used was ASTM D 395 (1982)
methodB.
2.3.5 Abrasion resistance
The abrasion resistance of the samples was tested using a DIN abrader. Sample
baYing a diameter of 15 mm and a length 20 mm was kept on a rotating sample
holder and 10 Newton load was applied. Initially a pre-run was given for the
sample and its weight was taken. The sample was then given a complete run and
weight after final run was also noted. The difference in weight is the abrasion loss.
It is expressed as the weight of the test piece getting abraded away by its travel
through 42 cm on a standard abrasive surface and expressed as weight loss in
gram (g).
2.3.6 Thermal and Steam ageing studies
Dumbbell and angular test specimens for the evaluation of physical properties were
prepared and kept in a multi cell ageing oven at 100 DC temperature for specified
periods viz. 24, 48 and 72 hours. After taking out from the oven, the samples were
conditioned at 28 ± 2 DC and 50 % relative humidity for 24 hours. After
conditioning physical properties like tensile strength, tear strength, elongation at
break etc. were measured. The percentage retention of these properties was
evaluated for assessing the ageing resistance. The procedure given in ASTM D 573
was followed.
Steam ageing is also done at a steam temperature of 160 DC for 6, 18 and 36 hours.
After taking out from the steam chamber, the samples were conditioned at
28 ± 2 DC and SO % relative humidity for 24 hours and various properties were
tested.

CnapUf Z
2.3.7 Rebound resilience
The rebound resilience of the samples was tested as per AS1M D 1054 (1979) using
Scott Rebound Pendulum. This test is used for the determination of impact resilience
of solid rubber from measurement of vertical rebound of a dropped mass. Resilience is
determined as the ratio of rebound height to drop height of a metal plunger of
prescribed weight and shape, which is allowed to fall on the rubber specimen.
Resilience is a function of both dynamic modulus and internal friction of rubber. The
test specimen should have a thickness of 12.5 mm and the standard temperature is 23 ±
2 qc. Resilience is tested as follows. The instrument is leveled and the plunger is raised
to the top of the guide rod. The resilience scale is positioned so that its full weight rests
upon the specimen. It is locked in that position. The plunger is then released making
sure that it slides freely on its guide. The first three values are avoided. Recorded the
next three values. Since the resilience scale is divided into 100 parts, the rebound
height is equal to the resilience in percentage.
2.3.8 Tension set
Tension set properties of the elastomer blends were determined using dumbbell
specimens. Samples were punched out from the compression moulded sheets along
the mill direction using a dumbbell die. The sample was held tight by the two
grips, the left grip of which was fixed. The specimens were stretched to 300 % by
moving the right grip and clamped. The entire arrangement was kept in a multi cell
ageing oven at 100°C temperature for specified periods viz. 24, 48 and 72 hours.
After taking out from the oven, the samples were conditioned at 28 ± 2 °C and
50 % relative humidity for 24 hours. After conditioning, the final length was
measured. The tension set was calculated as follows
Tension Set (%) = (Fina! length -lnit011ength) x 100 (2.3) Initial length

'Experimenta{ tecliniques
l.3.9 Flex crack resistance
Resistance to flex crack of the vulcanizates was measured using De-Mattia flexing
machine as per ASTM D 430 (1973) test method. The machine operated at a
constant speed under load at 300 ± I flexing cycles per minute. The sample was 6"
long, I" wide and 0.25" thick with a groove moulded across the width with grain
direction perpendicular to the length of the specimen. The samples were held in a
special jig and a chisel cut was being applied exactly at the center of the groove by
a piercing tool of 2 mm width. The flexing is such that the specimen is bent almost
double at the groove then straightened out without extension. Crack growth is
measured at regular intervals with the point being the number of cycles required to
extend the crack to 20 mm. The test was conducted at room temperature and was
reported as the increment in cut length in millimeter.
2.3.10 Air permeability
The instrument consists of a gas cell divided into two chambers by the membrane
to be tested. The gas under test is admitted at known pressure from one side. The
permeability can be studied either by measuring the pressure decrease at the high
pressure side or the pressure increase at the low pressure side. A highly sensitive
heat conductivity cell with temperature compensation of the signal to standard
conditions, a chart recorder, a water cooling/heating thermostat for maintaining
constant temperature in the measuring chamber and a rotatory two stage vacuum
pump are the remaining portions of the measuring instrument. Permeability
measurements were carried out according to ASTM D 1434 (1982). Test
specimens of thickness 0.25 mm were moulded and used for measurements. The
equipment used was Lyssy Manometric Gas Permeability Tester L 100-2402.
The prepared film was used to divide the cell of the apparatus into two chambers
and air at a flow rate of 500 ml/min was admitted from the upper compartment.
The lower compartment was connected to a suction pump through a capillary

U tube. The conditioning of the test specimen for a defmite period is calculated
from the equation
T= b2 / 2D (2.4)
where b is the thickness of test piece in meter and D, the diffusion coefficient in
meter square per second. The preconditioning times will vary from few minutes to
several hours and even days depending on the type of the sample. In practice the
preconditioning time is the time taken for attaining 10-4 tOIT pressure in the lower
compartment. Then mercury is poured into the capillary to a fixed mark. The level
of mercury in the capillary steadily decreases as air permeates through the
membrane. This change is recorded in a chart moving at a speed of 180 cmlhour.
From the distance traveled by the pointer in the chart, the time taken for the
permeance of the sample (ts) is determined. Permeability of the sample is then
calculated by substituting the time taken by the standard PET sample (tT) in the
above chamber and under similar conditions using the equation;
Permeability of the sample, P =:: t, x P, m t
m
(2.5)
where Pr is the permeability of the standard PET sample. If air is used the value of
Pr is 30 mllm2.day_
2.3.11 Thermal diffusivity
Photo thermal deflection (PTD) technique is defined as the field in which the
thermal diffusivity of the material is probed using optical excitation of the matcrial
and optical probing of thermal energy, which results from this excitation. It is a
non-destructive technique that can be used for any kind of sample. The
photothermal method has a number of merits compared with other conventional
techniques for thermal diffusivity measurement using thermocouple or thermistor.
It is highly sensitive and absolute calibration is readily available i.e.; the observed
temperature rise can be directly measured and related to physical parameters like

'Ex.perimenta{ tecliniques
-ihenna1 diffusivity. It is applicable to different types of materials (gas, liquid,
liquid crystal and solid), transparent and opaque. It can be used in vacuum and in
air, and with samples of arbitrary shape.2-4 Radiation of any wavelength can be
used (radio frequency, microwave, JR, visible, UV, X-ray, etc.). Thennal
diffusivity (D) of the material is directly proportional to its thermal conductivity
(k) and are related as D = k/pC where p is the density of the material and C is the
h . 5
specific eat capacIty.
Photo thennal deflection technique depends on the detection of variations in the
infrared thennal radiation emitted from a sample that is excited by an
electromagnetic pump beam of varying intensity or wavelength6• A laser beam
(pump beam) passes through the material of interest. The material absorbs the laser
energy and in the presence of quenching collisions, some of this energy appears in
the translational or lattice modes (heating) of the molecules of the material. The
change in the refractive index of the medium in a thin layer adjacent to the sample
surface, which is produced as a result of heat emission from the sample, is detected
by a second laser beam (probe beam) passing perpendicular to the pump beam
axis.7-9 Here the refractive index change is measured directly by placing the sample
in a Fabry-Perot cavity. The refractive index change produces a change in the
optical path length, which is detected as a fringe shift.
The main components of photo thermal deflection technique are: JO
(1) Pump beam, which produces the refractive index change in the sample. The
excitation Source should be a light source with sufficient power density to
produce the refractive index change. Here, He-Ne laser of wavelength
6320 A 0 with output power 10 m W is used.
(2) Mechanical chopper, which modulates the pump beam. A variable frequency
chopper, which can be used in the range 0-4 kHz is used for the purpose. The
chopped light beam must be focused upon the sample.

(3) A probe laser beam to detect the refractive index change. A weak source
must be used as the probe beam because it should not cause any heating in
the sample. In the present case a He-Ne laser of power 1 mW is used as the
probe beam. The probe beam is arranged so that it just grazes through the
sample surface, perpendicular to the pump beam axis. Using a convex lens
such that its focal spot is at the point where the pump beam is incident on the
sample, the signal amplitude can be considerably increased.
(4) A closed sample cell, which can be rotated for correct alignment and IS
usually made of materials like quartz, so that the probe beam after passing
through the cell is not absorbed or scattered by the cell wall. By placing the
sample in the cell the noise due to room vibrations can be reduced to a
considerable extent. The cell is placed at an exact position so that the pump
and the probe beams fall at the correct position.
(5) A detector assembly and the associated electronics to measure the
deflection of the signal. The probe beam passing through the region of
varying index of refraction gets deflected and is detected using a
position sensor. A bicell detector is used for the purpose. There are two
photodiodes, which acts as the position sensors. The position sensor
converts deflection into a varying output voltage depending upon the
deflection of the beam. The output of the sensor is fed into a lock in
amplifier, which extract the signal. The output of the lock in amplifier
can be recorded on an x-y recorder. All the above optical components
are placed on an optical bread board placed on a vibration free table.
The alignment is made carefully and the detection is done.
The thermal diffusivity of the material is determined at a Iow frequency region,
between 2.5 Hz to 20 Hz using the equation, 11
In!cnl
,= constant _ xF ox J2D
(2.6)

P.Jcperimenta{ tecliniques .-where OnifJx is the time dependent deflection of a narrow probe beam propagating
through a non-homogeneous medium of refractive index n and temperature T. This
tenn is recorded by the detector as the amplitude signal. Through out the
experiment, the value of x remains the same as it represents the distance between
the probe source and the sample. ro is the chopping frequency and D, the thermal
diffusivity. By measuring the slope of the graph plotted between logarithms of
amplitude against square root of frequency, the thermal diffusivity of the material
can be calculated.
2.3.12 Differential scanning calorimeter
Direct calorimetric measurements, characterization and analysis of thermal
properties of the samples were made using a Differential Scanning Calorimeter
(DSC Q 100, TA instruments). About 20 mg of samples were used for the studies.
Samples were encapsulated in standard aluminium pans and sealed by crimping.
For purging the sample holders, pure dry nitrogen gas was used. The inlet gas
pressure was adjusted at 2 kg/cm2 to attain a flow rate of about 25 mllmin. Sub
ambient operation was carried out by cooling the specimen and the specimen
holder with liquid nitrogen. Samples were cooled to -80°C, maintained at that
temperature for 10 minutes and then heated at a constant rate of la °C/min in
nitrogen atmosphere.
2.3.13 Dynamic mechanical properties
The dynamic mechanical properties of EPDM/CIlR blends were measured using a
Dynamic Mechanical Analyzer (DMA Q-800, TA Instruments), which consist of a
temperature programmer and a controller. It measures dynamic modulii (both
storage and loss) and damping of the specimen under oscillatory load as a function
of temperature. The experiment was conducted at a dynamic strain of 4 % at a
frequency of I Hz. Liquid nitrogen was used to achieve subambient temperature
and a programmed heating rate of 3 °C min· l was used. Mechanical loss factor,

ClUlpter2
tan 0 and the dynamic moduli (E'and E") were calculated using a microcomputer.
Moulded samples of dimension 20 x 4 x 2 mm were prepared for testing. The
complex modulus E* was calculated using the following equation:
(2.7)
where L = length of the sample between the clamps, ~L = oscillating displacement,
S = cross-sectional area of the sample, Af = amplitude factor, Dv = values of
dynamic force dial and K = error constant.
The storage modulus E' and loss modulus E" were calculated using the following
equations:
E' = E* sin 0 and (2.8)
E" = E* cos cS (2.9)
where cS = loss angle.
Loss tangent, tan cS = E"I E' (2.10)
indicates the damping characteristics of the material.
2.3.14 Thermogravimetric analysis
The thennogravimetric analyzer used for the studies was TGA Q-50 (TA
Instruments). It is a computer-controlled instrument that pennits the measurement
of weight changes in the sample as a function of temperature or time. It is
programmed in the required temperature range to measure the weight change
resulting from chemical reaction, decomposition, solvent and water evolution,
Curie point transitions and oxidation of the sample materials. The temperature is
scanned at a linear rate. The instrument has two components, an ultra sensitive
microbalance and a furnace element. The balance is sensitive to 0.1 microgram and

'Experimentaf tecliniques .-
t;e furnace could be heated from ambient to 800 DC at rates of 0.1 to 200 QC per
romute. For purging platinum the sample holder. nitrogen gas is used so as to study
the oxidation. burning and thermal stability of the materials. The purge gas flows
direCtly over the sample. The recommended flow rate of the sample purge was kept
less than the flow rate of the balance purge at all times.
2.3.15 Rheological measurements
1.3.15.1 Equipment details
The rheological measurements were carried out using a capillary rheometer MCR
3210 attached to the Shimadzu Universal Testing Machine (model-AG 1). The
extrusion assembly consists of a barrel, made of hardened steel, mounted on a
special support underneath the moving crosshead of the UTM. The capillary made
of tungsten carbide material is inserted at the bottom of the barrel and locked using
a clamping unit. The material is fed in the barrel and is carried to the capillary by a
hardened steel plunger which is accurately ground to fit inside the barrel. The
plunger is driven by the movement of the cross-head of the UTM and is held to the
load cell extension with the help of a latch assembly. The barrel is mounted on a
ball and socket system on the support so that the system will be self-aligning. The
leakage of the material through the clearance between the barrel inner wall and the
plunger is prevented by inserting a Teflon O-ring and a split ring on the plunger.
Two identical Teflon rings are used in the capillary to prevent the leakage of the
material through the gap between the barrel and the capillary. The barrel was
heated electrically using a three zone temperature control system. The difference
between the successive temperature zones in the barrel was kept at 5 QC and the
temperature of the lower zone, where the capillary is located, is taken as the test
temperature.
The moving cross-head of the UTM runs the plunger at a constant speed
irrespective of the load on the material, maintaining a constant volumetric now rate
through the capillary. Using the UTM machine, the cross-head speed can be varied

from I mm min- ' to 500 mm min-I, giving a shear rate of 10 sec-I to 5010 sec-I for a
capillary of length to diameter ratio 40 (le = 2.0066 ± 0.0001 inch and de = 0.0495
± 0.005 inch) with 90° conical entry. Force corresponding to specific plunger speed
was recorded on a strip chart recorder and the shear stress was calculated from the
knowledge of capillary dimensions.
2.3.15.2 Test procedure
The whole capillary assembly was first heated to the desired temperature. The
sample was placed inside the barrel and forced down to the capillary using the
plunger attached to the moving cross-head. The samples were preheated to attain
uniform temperature. The volume of the sample for each run was maintained
constant. The machine was programmed to give six to nine different plunger
speeds, with a single charge of the material. Each plunger speed was continued
until the recorded force stabilized, before changing to the next speed. Force
corresponding to the specific plunger speeds was recorded. Considering the
geometry of the capillary and the plunger, the force and the cross-head speed were
converted into shear stress ('tw) and shear rate (r w) at the wall by using the
following equations: 12
where,
F
F = force applied at a particular shear rate.
Ap= cross sectional area of the plunger
le = length of the capillary
de = diameter of the capillary
n' = flow behaviour index, as defined in equation 2.4
q = volumetric flow rate = Ap X velocity of plunger.
(2.11 )
(2.12)

C£.x:perimenta( teclin;ques
be flow behaviour index n' was calculated by using the equation:
(2.13)
n' was detennined by the regression analysis of the values of Lw and r >V,a '
_1.+"'ned from the experimental data. r is the apparent shear rate at wall and was uu~ w,u
calculated from the relation
r = RJL w,a (2.14)
1t d/
The shear viscosity II was calculated from Lw and r w by using the equation:
(2.15)
The Bagley correction for the entry losses is assumed to be negligible for the
capillary used ( Lldc = 40 with 90° conical entry). J3 The temperatures of testing
were 90°C, 100 QC, 110 QC and 120°C. The following assumptions were made for
the analysis of the data:
a) The flow of the material was parallel to the axis
b) The viscosity of any fluid element was a function of radius only, giving
axial symmetry
c) The fluid was incompressible
d) The fluid velocity was zero at the walL i.e., there was no slip at the wall
e) All energy was consumed within the capillary and the flow was isothermal.
2.3.15.3 Measurement of extrudate die swell
The extrudate was collected for measurement of die-swell, taking care to avoid any
further deformation. The diameter of the extrudatc (d.,) was measured after 48 hrs

of extrusion. For measuring the diameter of an extrudate, a fixed length of the most
uniform portion of the extrudate was cut and its weight was taken as accurate as
possible. By measurement of the density of the sample, the diameter was calculated
using the following relations:
Jrd 2 1 Volume ofthe extrudate (Ve) = c· e (2.16)
4
. ) Me M /1id:.l e Density (De = V = e -4---e
(2.17)
Diameter of the extrudate, de = (4 Me / 1[ le De) ~ (2. I 8)
where le and Me are length and mass of the extrudate respectively. At least three
readings were taken for each extrudate diameter. The extrudate swelling index
(die-swell) was determined by using the following relation:
Extrudate swelling index = diameter of the extrudate ( de) diameter of the capillary (de>
2.3.16 Scanning electron microscope
(2.19)
Scanning electron microscope (SEM) was used to investigate the morphology of
fractured surfaces. 14.1 5 In SEM, electrons from an emission source or filament are
accelerated by voltage usually in the range of 1 to 30 kV and are directed down to
the centre of an electron optical colunm consisting of two or three magnetic lenses.
These lenses cause a fine electron beam to be focused on to the specimen surface.
Scanning coils placed before the final lens cause the electron spot to be scanned
across the specimen surface in the form of a square raster, similar to that of a
television screen. The current passing through the scanning coils is made to pass
through the corresponding deflection coils of a cathode Tay tube, so as to produce a
similar but larger rdster on the viewing screen in a synchronous manner.

'EXpenmental techniques
6.e electron beam incident on the specimen surface causes various phenomena, of
which the emission of secondary electrons is used in SEM. The emitted electrons
strike the collector and the resulting current is amplified and used to modulate the
brightness of the cathode ray tube. The time for the emission and collection of the
secondaIY electrons is negligibly small compared with the time for the scanning of
the incident electron beams across the specimen surface. Hence, there is one to one
correspondence between the number of secondary electrons collected from any
particwar point of the specimen surface and the brightness of the analogous point
on the screen and thus an image of the surface is progressively built up on the
screen. In SEM, the large image magnification is determined by the ratio of the
size of the rasters on the screen and on the specimen surface. In order to increase
the magnification, it is only necessary to reduce the current in the SEM scanning
coils.
The SEM observations reported in the present investigation were made using a
JEOL JSM 35C model scanning electron microscope. The fractured surfaces of the
tensile samples were carefully cut out without disturbing the surface. Care was
taken to keep the samples in dust and moisture free atmosphere. The surfaces were
then sputter coated with gold within 24 hours of testing. The gold-coated samples
were kept in desiccators before the SEM observations were made. 16 The
acceleration voltage used for image acquisition was 15 k V. The operation
conditions of SEM are given in table 2.3.
Table 2.3 Operation conditions of SEM
Specimen position tilt, degree
Maximum resolution, nm
Spot size, angstrom
Emission current, ampere
Aperature, microns
Depth of focus
o 0.5
640
26
200
High

2.4 Chemical test methods
2.4.1 Determination of iodine value
0.2 gm of sample was dissolved in 25 ml chloroform in a 500 ml conical flask. 20
ml of 0.1 N solution of iodine monochloride in glacial acetic acid was added. It
was then stoppered and allowed to stand in darkness for 30 minutes. After that 100
ml 10 % potassium iodide solution was added. The resultant solution was titrated
against thiosulphate using starch as indicator. Iodine value was calculated as;
. (V; -V2)xI2.69xn lodme value = -------- (2.20)
m
where n = normality of thiosulphate, m = weight of polymer sample, V, and V 2 =
volume of thiosulphate for the sample and blank.
2.4.2 Determination of chemical crosslink density
The concentration of chemical crosslink was estimated from the equilibrium
swelling data as follows. Samples of approximately 1 cm diameter, 0.20 cm
thickness and 0.20 g weight were punched out from the vuJcanizate and allowed to
swell in toluene. The swollen sample was taken out of the solvent after 24 hours
and weighed. Solvent was then removed in vacuum and the sample weighed again.
The volume fraction of rubber (Vr) in the swollen network was then calculated by
the method reported by Ellis and WeldingI7,'8 from the following equation:
V = (D-FT)p;' T (D-FT)p;'+Aup;'
(2.21)
where T is the initial weight of the test specimen, 0, the deswol1en weight of the
test specimen, F, the weight fraction of insoluble components and Ao. the weight of
the absorbed solvent corrected for the swelling increment. pr and ps represents the
60

P.:qJerimenta{ tecliniqueJ
density of rubber and solvent respectively. The densities of EPDM and CIIR
obtained were 0.856 g/cm3 and 0.917 g/cm3 respectively and that of toluene was
0.886 g/cm3. Densities of the blends were calculated by taking into consideration
the weight fraction of each component and the density of that component.
In the case of vu1canizate containing HAF black, the values of Vr obtained as
above, were converted into V to (the value of Vr in the absence of black) by means
ofthe following equation which was derived by Porter: 19
(2.22)
where z = weight fraction of filler.
The crosslink density (1/2 Mc) was then determined from V to using the Flory
Rehner equation: 20
li Mc= - [In(1- Vro + Vro + XVr~)] -.---_. -
v 2p V(V )0 r S TO
(2.23)
where Vs = molar volume of solvent. For toluene the value is 106.2 cm3/mol and
X is the parameter characteristic of interaction between rubber and solvent which is
given by Hildebrand equation as: 21
(2.24)
Where J3 = lattice constant, R = universal gas constant, T = absolute temperature,
Os ::: solubility parameter of solvent and c\ == solubility parameter of polymer. Valu f' . 2223 es 0 mteractlon parameters taken for calculations ' were the following: For
CUR-tOluene == 0.568, EPDM-tolucne == 0.490.

References
1. S.K. Chakraborty and S.K. De, Polymer, 24, 1055 (1983).
2. J. A. Sell (eds.), PhotothennaI Investigations of Solids and Fluids, Academic
Press, London (1989).
3. S. E. Bialkowski, Photothermal Spectroscopy Methods for Chemical Analysis,
John Wiley, N.Y. (1996).
4. D. Almond and P. Patel, Photothermal Science and Techniques, Chapman &
Hall, London (1996).
5. H. S. Carslaw and 1. C. Jaeger, Conduction of Heat in Solid,>, Clarendon, Oxford
(1960).
6. P. E. Nordal and S. O. Kanstadt, Phys. Ser., 20, 659 (1979).
7. A. Rosencwaig, J. OpsaI, W. L. Smith and D. L. Willenborg, Appl. Phys. Lett.,
46, 10 13 (1985).
8. S. V. Bondarenko, E. V. Ivakin, A. S. Rubanov, V. 1. Kabelka and A. V.
Mikhailov, Opt. Commun., 61,155 (1987).
9. G. L. Eesley, B. M. Clemens and C. A. Paddock, Appl. Phys. Lett., 50, 717
(1987).
10. M. J. Adams and G. F. Kirkbright, Analyst, 102,678 (1977).
11. G. M. Sessler and R. Gerhard, Radial. Phys. Chem., 23, 363 (1984).
12. Instron Manual, Part-2, No. MJO-49 1(C), Catalog No. 3210-001, lnstron
Limited, Buckinghamshire, England ( 1980).
13. E.B. Bagley, Trans. Soc. Rheol., 5, 355 (1961).
14. R.1. White and E.L. Thomas, Rubber Chem. TechnoI., 57, 457 (1985).
15. E. Balcerzyk, 1. Hochstim and S. Wlodarczyk, lnt. Polym. Sci. TechnoI., 12,
121 (1985).
16. S. K. De and B.K. Dhindaw, J. Scanning Electron Micros. ,3,973 (1982).

t£.vlerimentaf tecliniques
17. B. Ellis and G.N. Welding, Techniques of Polymer Science, Society for
Chemical Industry, London, (1964).
18. B. Ellis and G.N. Welding, Rubber Chem. Technol., 37, 571 (1964).
19. M. Porter, Rubber Chem. Teehnol., 40, 866 (1967).
20. PJ. Flory and J.Rehner,J. Chem. Phys., 11,512 (1943).
21. J.H. Hildebrand and R.L. SeoU, The Solubility of Non-electrolyte, 3Td edn.,
Van Nostrand Reinhold, N.Y. (1950).
22. C.J. Sheelan and A.L. Basio, Rubber Chem. Technol., 39, 149 (1966).
23. A. Ashagon, Rubber Chem. Technol., 59, 187 (1986).

QIlptpfer III Compatibility Studies on
EPDMlCIIR Blends
3.1 Introduction
Blending two or more elastomers is carried out for specific objectives such as
enhancement of technical properties, improvement of ageing resistance and
also processing characteristics. In the case of miscible blends, the overall
pbysico-mechanical properties depend on two structural parameters: (a) proper
interfacial tension which leads to a phase size small enough to allow the material to
be considered as macroscopically homogeneous, (b) an interphase adhesion strong
enough to assimilate stresses and strains without disruption of the established
morphology. Unfortunately, this is not the case for most polymer blends in which
the components are found to be immiscible and incompatible resulting in poor
mechanical properties. I-6 Several attempts have been made to minimize phase
separation and increase interfacial adhesion. These include addition of a
compatibilising agent such as a third polymer, which is, a graft or block copolymer
that reduces the interfacial tension between the two phases thereby developing
satisfactory network structure in each of the phases and in the interphase. 7· 13
Consequently, compatibility is a fundamental property in polymer blends, deciding
their practical utility.
The main objective of this part of the work is to explore the compatibility of
blends of EPDM with CIIR without any compatibilisers. Four commercial
grades of ethylene-propylene-diene rubber (EPDM) are proposed to be blended
with a specific grade of chlorobutyl (CUR) at various proportions. The cure
characteristics and mechanical properties such as tensile strength, tear strength
and ageing resistance of the blends arc planned to be studied for all the four

grades of EPDM blended with ClIR at various compositions. An idea about the
crosslinking within a phase and the crosslinking between the two phases can be
obtained from the cure characteristics and mechanical properties of rubbers.
There will be insufficient crosslinking between the phases if the two rubbers do
not mix properly, which will be reflected in poor mechanical properties. In
addition to the above mentioned physical property measurements, the extent of
compatibility of these rubber blends is also proposed to be studied with
different methods, such as glass transition measurements using Differential
Scanning Calorimetry (DSC) and Dynamic Mechanical Analyzer (DMA).14 The
determination of glass transition temperature of elastomer blends has been
widely used to assess compatibility, since individual thermal responses are
expected from each component in heterogeneous blends. The morphological
characterization of the blends is proposed to be studied using scanning electron
microscopy (SEM).1517 Due to differences in viscosity and un saturation
between EPDM and CIJR, the amount of curatives may not be optimum in the
two rubbers resulting in inferior mechanical properties. 18-21 It is now well
established that the phase morphology of immiscible polymer blends can be
controlled by the addition of compatibilisers. 22-25 The effect of chlorosulfonated
poiyethylene (CSPE) as a compatibiliser in EPDM/CIIR blends is also
proposed to be investigated.
3.2 Experimental
The four different grades of EPDM selected for the study are 301-T, EP-96,
MRD-IO and NDR-4640. The specifications of these four different grades of
EPDM are given in table 2. I and those of CIIR in table 2.2. Firstly, EPDM was
thoroughly masticated on a laboratory size two-roll mixing mill at a friction ratio of
I: 1.25 and was blended with CIIR at different compositions. The blends were
compounded according to ASTM-D 3182 (1982) as per formulations given in table
3. I. The samples were kept overnight for maturation.

~Ie 3.1 Compounding recipe
- Concentration Concentration Ingredients
(phr) Ingredients
(phr)
-EPDM Rubber 100 CIIRRubber 100
ZnO 4.0 ZnO 4.0
Stearic acid 1.5 Stearic acid 1.5
MBT 1.0 CBS 1.0
TMTD 0.5 Carbon black 40
ZDC 0.5 Paraffinic oil 5.0
Carbon black 40 Sulphur 1.5
Paraffinic oil 7.0 Antioxidant 1.0
Sulphur 1.0
Antioxidant 1.0
Cure characteristics have been investigated using Rubber Process Anal yzer (RP A
2000, Alpha Technologies). The optimum cure time of the samples was determined at
170 QC at a frequency of 50.0 cpm and a strain of 0.20 degree. The compounds were
wlcanized upto their optimum cure times in an electrically heated laboratory hydraulic
press at 170 QC. Dumb bell shaped tensile specimens and anb'1llar tear specimens were
punched out from the vulcanized sheets and the mechanical properties were studied
using a Shimadzu Universal Testing Machine (model- AGl). Ageing resistance of the
samples was studied by keeping the tensile and tear specimens at 100 QC for 24, 48 and
72 hours in a multi cell air oven and then measuring the retention in these properties.
The glass transition temperatures of the pure elastomers and the blends were
detennined by DSC and DMA. Samples for DMA were cut from the compression
moulded sheet with a size of 20 x 4 x 2 mm, and the measurements were conducted on
a Dynamic Mechanical Analyzer (DMA 0-800, TA Instruments) at a heating rate of
3 QC min- I and a frequency of I JIz. The themlal analysis measurements with
Differential Scanning Calorimeter were carried out using DSC Q-1 00, TA Instruments.

Samples with a weight of about 20 mg were sealed in aluminum pans, equilibrated at -
80°C, and then heated at a constant rate of 10 °C/min in nitrogen atmosphere to 20°C.
This allowed the identification of the glass transition temperatures (Tg's) of CIIR,
EPDM and their blends.
The microstructure of tensile fracture surfaces of the blends at varying
compositions were studied using a Scanning Electron Microscope (JEOL JSM
35C). The fracture surfaces of the test specimens were carefully cut from the test
pieces and were then sputter coated with gold before they were examined through
the SEM. The acceleration voltage used for image acquisition was 15 kV.
To improve the properties of blends of EP-96 and MRD-IO grades of EPDM with
CIIR, chlorosulfonated polyethylene (CSPE) was added at varying amounts as
compatibiliser. The compatibilisation effect was studied based on the improvement
in mechanical properties (such as tensile strength, tear strength, ageing resistance)
as well as surface morphology.
3.3 Results and discussion
3.3. t Cure characteristics
The cure characteristics of the blends are given in table 3.2. The optimum cure time of
blends of301-Tand NDR-4640 with CIJR increases as the EPDM content of the blend
increases. But beyond 60 % EPDM in the blend, the trend reverses. This may be due to
the unequal distribution of ingredients in the blend components.26,27 In the blends
containing upto 60 % EPDM, it can be assumed that preferential curative migration
occurs to the EPDM phase, so that the formation of greater number of interface
crosslinks gets prolonged. As the EPDM content increases further, it forms the
continuous phase and the effect of preferential migration is not so significant.28.29 Tbe
homogeneous distribution of curativcs enhances the extent of crosslinking thereby
causing a decrease in optimum cure time. For blends ofEP-96 and MRD-IO grades of
EPDM with CIIR there is no regular variation in optimum cure time which itself
indicates the inhomogenity in these blends.

... ,,:. Compati6itity stutfres on P/p:JYM/CIIrJl,.6femfs ~
.fable 3.2 Cure characteristics of EPDM/CIIR blends
..- Blend Scorch Maximum Minimum ~ Cure time time torque torque percentage (min) ~ of EPDM (min) (Nm) (Nm)
0 20 11.6 1.2 0.324 0.0386 v \0 ~ 40 14.4 1.3 0.329 0.0394
~ 60 15.6 1.3 0.332 0.0386 I
0.327 0.0412 ~ 80 12.4 1.2
fa 100 10.2 1.2 0.334 0.0412
20 9.8 1.0 0.293 0.0384 \0 0\ 40 9.1 1.0 0.287 0.0453 fa • 60 11.6 1.2 0.307 0.0333 :E 0 80 12.4 1.4 0.287 0.0387 I:loo ~ 100 8.6 1.1 0.286 0.0365
0 20 13.4 1.4 0.336 0.0352 -§ 40 12.9 l.l 0.317 0.0452 :E 60 16.9 lA 0.333 0.0463 I
:E 80 15.2 1.5 0.325 0.0332 0 t:J..
100 ~ 18.1 1.7 0.339 0.0312
E-< 20 12.2 1.0 0.339 0.0420
- 40 14.6 1.3 0.302 0.0361 0 f"l
• 60 18.8 lA 0.335 0.0337 ~ 0 80 13.0 1.2 0.324 0.0376 I:loo ~
100 11.0 1.2 0.346 0.0413
elIR 0 11.8 1.2 0.349 0.0460
3.3.2 Mechanical properties
Figure 3.1 shows the variation in tensile strength of the blends of different grades
of EPDM with CIIR at various proportions. It is evident that the tensile strength
under unaged conditions shows a synergistic behaviour for the grade NDR-4640
and an additive behaviour for 301-T. Hence these two grades of EPDM may be
considered as compatible with CIIR as it is known that compatible systems exhibit

tensile strengths as a function of blend composition that are at least a weighted
average of the values corresponding to the two components.30•31 Better co-curing
might be taking place in the case of NDR-4640/CIIR blends as the viscosity of
NDR-4640 is comparable with CIIR (table 2.1 and 2.2) leading to better molecular
packing and resulting in synergistic behaviour of mechanical properties.32 The
viscosity of 301-T is slightly lower than that of CIIR so that a perfect co
vulcanization probably is not taking place, which results only in an additive
behaviour in mechanical properties. For the remaining two different grades (EP-96
and MRO-10), the tensile properties show non-uniformity with respect to
composition or in other words a non-additive behaviour is observed. Hence these
are considered as incompatible with CIIR.33.)4 Since both EPOM and CHR are non
polar rubbers, the main reason for the incompatibility of these grades might be the
viscosity mismatch, which results in curative migration, so that co-curing of the
two phases of the blend is not taking place. Based upon these observations, it is
possible to correlate tensile strength versus composition plots with blend
homogeneity.
25 r---------------------------------~ li' a. ~ 20
~ x ~ 15 ~+-----I!! x~+-------+--+--+ r;; ..! 10 'iii x.____x i ---x-X ~ 5·L-----------~--------------------~
o 20 40 60 80 100
Percentage of EPDM
Figure 3.1 Variation of tensile strength of EPOM/CllR blends with percentage of
different grades of EPOM. ~, 301-T/CIIR, ., NDR-4640ICIIR, >K, MRD-lO/CIlR
and +, EP-96/CIlR
Figure 3.2 shows the variation of tear strength of the blends of different grades of
EPOM with CIIR at various proportions under unaged conditions. It is evident that tear

Compati6ifity studies on f£W'M/CIICJ{6fends
-resistance is the maximum for blends of CIIR with 301-T and NDR -4640. This also
confinns a rather increased compatibility between the two phases of the blends of these
two grades. For the EPDM grades, EP-96 and MRD-lO, a gradual variation in tear
properties is not observed indicating their non-compatibility with CUR.
E 46
x~ .E 42
~ 38 .s: ...
34 ell c: e ... 30 .~+-+ x CII ... 26
x ______ III G) x I-
22
0 20 40 60 80 100
Percentage of EPDM
Figure 3.2 Variation of tear strength of EPDM/CllR blends with percentage of
different grades of EPDM .• , 30l-T/CIlR, ., NDR-4640/CIIR, )1(, MRD-IO/CIIR
and +, EP-96/CIIR
Figure 3.3 is a plot of tensile strength against the composition of blends of
different grades of EPDM with CIIR after ageing the samples at 100 QC for 24
hours. As expected, the ageing resistance is found to be superior for blends
containing higher percentage of EPDM. For blends of NDR-4640, it seems to
have inferior ageing properties even though it shows synergistic behaviour in
mechanical properties under unaged conditions. Better ageing resistance is
observed for blends of 301-T, since it is a highly saturated rubber when
compared with the other grades of EPDM (table 2.1). For the rest of the blends
of two grades of EPDM (EP-96 and MRD-IO), poor ageing resistance is
observed. A similar effect in tear strength is also observed after ageing the
samples at 100 QC for 24 hours. The results are given in figure 3.4.

25-r-------------------------____ ~~
15
10
5 ~--~----------------------____ ~ o 20 40 60 80 100
Percentage of EPDM
Figure 3.3 Variation of tensile strength of EPDMlCIIR blends with percentage of
different grades of EPDM under aged conditions .&, 30I-T/CllR, ., NDR-4640ICIIR,
)1(, MRD-I O/CIIR and +, EP-96/CIIR
50
E 45
x~ E ~ 40 ~
0, 35 c: g 30 11)
'- 25 o:J ::K-x~+::::>< c» t-
20 +_______________ x +
+
0 20 40 60 80 100 Percentage of EPDM
Figure 3.4 Variation of tear strength of EPDMlClIR blends with percentage of
different grades of EPDM under aged conditions .&, 301-T/CIIR, ., NDR-4640/CIlR,
)1(, MRD-lO/ClIR and +, EP-96/CIIR
3.3.3 Thermal analysis
Figure 3.5 shows DSC thennograms for CIIR and four !,lfades of EPDM and figure
3.6 shows the DSC thennograms of their 50/50 blends. For all the SO/50
CIIRlEPDM blends, there is only single T g indicating molecular level
homogeneity. Although the occurrence of a single Tg may be a definitive test of
blend compatibility, there are certain circumstances under which the T g criterion
may be inapplicable or misleading. One such criterion requires that the Tg's of the
72

Compati6ifity studies on iECItIYM/ClI(j{6femfs --COIDponents be sufficiently displaced from each other so that resolution is possible.
The resolution of Tg's of the components less than about 20°C apart is poor.35,36
For all the 50/50 CHR! EPDM blends, the difference between the component Tg's
is less than 15° and therefore appear as a single transition irrespective of the fact
that whether they are compatible or not. Also if there is significant amount of
intermixing of both the components in the interfacial regions, the individual
transitions are significantly reduced in intensity resulting in a single transition. 37,38
This may be due to the molecular migration from well defined phases into broad
variable composition interfacial regions, whose detection, because of the broad
dispersion of the transition, may not be evident. The glass transition temperatures
obtained for the pure elastomers and their 50/50 blends are shown in table 3.3.
Table 3.3 T g values of pure eJastomers and their 50/50 blends
Elastomers Tg (0C) 50/50 blends of TgCC) EPDM/CIIR
CIIR -61.84 301-T/ClIR -58.87
301-T -54.46 NDR -4640/CIIR -56.97
NDR-4640 -49.44 EP-96/CIIR -60.82
EP-96 -58.15 MRD-IO/CIIR -58.41
MRD-IO -54.41
2
0 §'
-2 .s ~ -4 0 ;;:
iii -6
\,.-~--~-~~--------~~--'\."-~---"",," -~-:-------------- .... -.:::~... ---- ... _------
III J: -8
..... ': -. ..... ~ ..................... J: ,..., :
---- .... ---10
-100 -80 -60 -40 -20 o 20 40
Temperature (0C)
Figure 3.5 DSC plots of CHR and various grades of EPDM. --, CHR; _
EP-96; - - - -, MRD-lO; -------, 301-T; - -- - --, NDR-4640

2
§" 0
S -2 ~ ~ -4 -nI Cl!
-6 x -. ~----.-------
-8
-100 -80 -60 -40 -20 o 20 40
Temperature (QC)
Figure 3.6 DSC plots for 50/50 blends of CIIR with various grades of EPDM.
__ , 301-T/CIIR; - - -, NDR-4640/CIIR; ------, EP-96/CIIR; -
MRD-IO/CIIR
--,
Figures 3.7 and 3.8 shows the temperature dependence of the loss tangent (tan 8) at
1 Hz for EPDM, CIIR and their blends. The loss tangent (tan 8), which indicates
the damping ability of the material, is the ratio of the mechanical dissipation
energy to the storage energy. Thus, a high tan & value is essential for good damping
materials. CIIR shows a broad tan 8 peak, in which the efficient damping (tan (5 >
0.5) has a wide temperature range. But it should be noted that the effective
damping range of CIlR is at relatively low temperature. The different values of tan
(5 maximum in ClIRlEPDM blends may be attributed to the dissimilar interactions
between the chains of CIlR and EPDM molecules. As shown in the figures, the
damping efficiency decreases with increase in EPDM content in the blends. The
peak area under the tan (5 - temperature curves, can be considered to be the
damping index, which is a measure of the ener,!:,'Y dissipation during a transition
process.39 These values are also higher for CIIR and decreases with decrease in the
chlorobutyl content in the blends. In measurements of dynamic mechanical
properties over a temperature range, the apperance of intermediate tan & peaks and
the concomitant decrease of the tan 0 peaks of the individual polymers in a blend is
a useful criterion of blend compatibility.40 It can be seen from the figures that
blending of EPDM with chlorobutyI causes a shift in the position of Tg. Further

~_' ____ ----------------------~c~o_m~pa_t_w_ifi_J~~st_wU--~_s_on_£_~---5W~~~C_II_~~6k_n __ ~
J1l0re; increasing the CIIR percentage in the blend gradually causes a
corresponding continuous shift in the position of T g and a change in the half peak
width. The presence of single tan 0 peak coupled with the intermediate tan b value
oftbe blends points towards the compatibility between EPDM and CIIR.41 Similar
observations are obtained with respect to storage modulus and loss modulus
confirming compatibility between the two elastomers.
0.8 6 5 ~ 0.6 43 ~ "0 2 I: 0.4 1 ell I-
0.2
0
-100 -80 -60 -40 -20 0 20
Temperature (0C)
Figure 3.7 Variation of tan 0 with temperature for CUR, 301-T grade EPDM and
their blends. EPDM/CIIR (1), 100/0; (2), 80120; (3), 60/40; (4),40/60; (5), 20/80;
(6),01100
0.8
CII - 0.6 ~ "0 I: 0.4 CII I-
0.2
0
-100 -80 -60 -40 -20 o 20
Temperature (0C)
Figure 3.8 Variation of tan 0 with temperature for blends of CIIR, NDR-4640
grade EPDM and their blends. EPDM/CIIR (I), 10010; (2), 80/20; (3), 60/40; (4),
40/60; (5), 20/80; (6), 011 00

3.3.4 Morphological studies
Figures 3.9 - 3.12 show the SEM ~hotographs of the fractured surfaces of blends
of CUR with various grades of EPDM. The fractured surfaces of 301·T and
NDR-4640 show a more smooth and homogeneous pattern, justifying their higher
tensile strength and other mechanical properties. The inspection of the micrographs
of EP-96 and MRD·l 0 blends confmns two phases with irregular domain sizes and
shapes. This means that these blends were completely immiscible, large EPDM
domains being dispersed in CUR matrix.
EPDM/CIIR-20/80 (a) EPDMlCIIR-40/60 (b)
EPDM/CIIR-60/40 (c) EPDMlCIIR-80/20 (d)
Figure 3.9 [a-d] SEM photographs of301·T grade EPDM/CilR blends

ComptJtlmltty stUdus on 1EdWf/CIM{6tenlls'
EPDMlCIIR-20180 (a) EPDMICIIR-40160 (b)
EPDMlCIIR-60140 (c) EPDMICIIR-80120 (d)
Figure 3. 10 [a-d] SEM photographs ofMRD-IO grade EPDM/CIIR blends
EPDMICIIR-20180 (a) EPDMIC IIR-40160 (b)

EPDM/CIIR-60/40 (c) EPDM/CIIR-80/20 (d)
Figure 3. 11 [a-d] SEM photographs ofNDR-4640 grade EPDM/CIIR blends
EPDM/CIIR-20/80 (a) EPDMlCIIR-40/60 (b)
EPDM/CIIR-60/40 (c) EPDM/CIIR-80/20 (d)
Figure 3. 12 [a-d] SEM photographs of Ep·96 grade EPDM/CIIR blends
7R

Compati6ifity stutfies on P.lNXM/CIICJ{6ferufs
3.3.5 Effect of compatibiliser
The variation of mechanical properties with varying dosage of chlorosulfonated
polyethylene (CSPE) on 50/50 EPDMlCIIR blends is presented in table 3.4. It is
evident that the compatibiliser has no significant effect in the case of
MRD-IO/CIIR blends. In the compatibilised blends of EP-96, tensile strength
increases with increase in concentration of compatibiliser, upto a concentration of
10 phr, drops beyond this concentration. This may be due to the super saturation of
the interface with the compatibiliser which increases interfacial tension. Moreover,
with increased concentration the uniformly distributed domains may tend to
agglomerate forming bigger aggregates.
As in the case of tensile strength, tear resistance also improves with the addition of
chlorosulfonated polyethylene. The value gets maximized at a concentration of 10
phr of the compatibiliser. Formation of uniformly distributed finer domains tends
to elongate to higher strain and effectively prevents tear propagation. With increase
in the concentration of compatibiliser above 10 phr, the tear strength decreases.
Modulus and elongation at break also follow the same trend.
Table 3.4 Physical properties of EPDM/CIIR blends containing varying amounts of
chlorosulfonated polyethylene
Blend ratio 50/50 EP-96/CIIR blend 50/50 MRD-l O/CIIR blend
Chlorosulfonated 0 5 10 15 0 5 10 15 polyethylene (phr)
Tensile strength 13.8 14.7 15.3 14.5 8 8.4 7.8 6.2 (MPa)
Tear strength 29.4 31.8 33.4 32.1 25.8 27.1 26 22.3 (N/mm)
Modulus, 300% 6.6 7.2 7.9 6.8 4.7 5.2 4.8 3.2 (MPa)
Elongation at break 680 696 718 702 524 602 586 512 (%)

The effect of concentration of compatibiliser (CSPE) on the morphology of 50/50
EP-96 grade EPDMlCIIR blend is shown in figure 3.13. These SEM photographs
show changes in the phase morphology of blends containing 0, 5, 10 and 15 phr
compatibiliser, respectively. It is seen that with the addition of compatibiliser,
more homogeneous surface texture is observed upto 10 phr and afterwards the
homogeneity decreases. This is due to the reduction of interfacial tension between
CUR and EPDM phase. The equilibrium concentration at which the dispersed
EPDM domain size levels off is called critical micelle concentration (CMC). The
estimation of CMC from the plot of domain size vs. concentration is reported
elsewhere.42 The CMC corresponds to the critical amount of the compatibiliser to
saturate the unit volume of the interface. When compatibiliser concentration
exceeds CMC, micelle of the compatibiliser is fonned in the continuous CUR
phase. Several reports are available from the literature regarding the linear decrease
of dispersed domain size with increasing compatibiliser concentration.43-45
Therefore it can be confinned that a concentration of 15 phr of compatibiliser is
much above CMC and comparatively very good reduction of interfacial tension is
achieved at a concentration of 10 phr. This is in good agreement with the overall
improvement in mechanical properties observed.
(a) (b)
RO

Compati6ifity stutf'res on (BP1Y.M/Cl /rJt6fentfs __ ------------------~~~c=~~~~~=
(c) (d)
Figure 3.1 3 Scanning electron photographs of SO/50 EP-96 grade EPDM/CIIR
blends (a) without compatibiliser (b) with 5 phr CSPE (c) with 10 phr CSPE
(d) w;,h 15 phr CSPE
Based on the above results, 10 phr chlorosulfonated polyethylene is taken as the
optimum amount of compatibiliser required and is used for further studies of EP-96
grade EPDM blended with CIIR. The variation in mechanical properties with blend
composition for the compatibilised blends is given in table 3.5. Compared to the
uncompatibilised blends, the compatibilised sample shows an increase in the
overall mechanical properties. If the segments of the added compatibiliser are
chemically identical with those in the respective phases or adhered to one of the
phases, then they act as efficient compatibilisers.46-5 1 A comparatively higher
percentage increase in tensile strength is observed for 20/80 and 40/60
EPDM/CIIR blends showing that compatibilising action is efficient in these
compositions. The compatibilising action is due to the interaction of chlorine of
CIIR with chlorosulfonated domain of compatibiliser. There is structural similarity
between some segments of compatibiliser and EPDM. This also promotes
compatabilising action of chlorosulfonated polyethylene in the blends. As the
concentration of CIIR in the blend decreases, the probable interaction between the
blend component and compatibiliser decreases. The mechanical properties,
especially tensile strength are not governed by overall crosslinking alone, it
depends on crosslink distribution and phase size as well. There is higher

homogeneity of mixing of the rubbers in presence of compatiblisers as the CIIR
content in the blend is higher or equal to that of EPDM.
Table 3.5 Comparison of physical properties of compatibilised and uncompatibilised
EP-96/CIIR blends
Uncompatibilised blend Compatibilised blend
Percentage of EPDM/CIIR 20/80 40/60 60/40 80120 20/80 40/60 60/40 80120
blend
Tensile strength 15.6 14.7 12.6 13.8 16.8 16.4 14.6 14.2
(MPa)
Tear strength 30.8 29.8 29.1 31.6 34.2 33.6 32.9 32.4
(N/mm)
Modulus, 300 % 7.6 6.9 5.21 6.4 9.2 8.6 7.2 6.6
(MPa)
Elongation at break 664 686 672 654 734 726 709 682 (%)
Ageing resistance at 100c C, 24 hrs 14.7 13.8 11.9 13.1 15.8 15.6 13.8 13.5
(MPa)
Circular specimen of 6.5 mm thickness of uncompatibilised and compatibilised
blends were moulded and allowed to swell in n-hexane solvent for 120 hours and
the resulting changes in appearances are shown in Figure 3.16. In uncompatibilised
blends due to lack of interphase crosslinks, phase separation occurs while for
compatibilised blends uniform curing and presence of interphase crosslinks
prevents phase separation.

Compati6ility stual£S on 1£1XIY.M/OIIJ{.6fentfs --------------------~~~~~~~~~
1 2
(I) Uncompatibilised (2) Compatibilised
Figure 3. 14 Photographs of swollen samples of 50/50 EP-96 grade EPDM/CIIR
vu1canizates
3.4 Conclusions
The compatibility of different grades ofEPDM with a particular grade of CIIR was
studied. The analysis of mechanical properties and ageing resistance revealed that
two grades of EPDM (301-T and NDR-4640) were compatible with CIIR. The
thermal analysis and morphological characterisation justifies the results. This is
explained on the basis of their viscosities and unsaturation matching, so that
covulcanisation between the two components upto certain extent is possible in
these two cases. As far as the mechanical properties after ageing are concerned,
they are superior for blends of 30 1-T than that with NDR-4640. This may be
attributed to the less unsaturation of 30 I-T compared to that of NDR-4640. They
also possess promising ageing resistance. It may be concluded that a molecular
level homogeneity may be resu lted with the constituents of comparable viscosity
and unsaturation as is noticed with the blends of CIIR wit h EPDM 's of different
extents of unsaturation and different viscos ities. The incorporation of
compatibilisers into incompatible EPDM/CIlR blends greatly enhanced their
compatibility and improved the properties.

References
D.R. Paul, Polymer Blends, vol.2, D.R. Paul and S. Newman (eds.),
Academic Press, N.Y. (1978).
2 D.R. Paul, C.E. Vinson and C.E. Locke, Polym. Eng. Sci., 12, 157 (1972).
3 WJ. Schrenk and T. Alfrey, Polymer Blends, Vol. 2, D.R. Paul and
S. Newman (eds.), Academic Press, N.Y. (1978).
4 1.A Pomposo, E. Calahorra, I. Eguiazabal and M. Cortazar, Macromolecules,
26,2104 (1993).
5 l.W. Barlow and D.R. Paul, Polym. Eng. Sci., 27, 1482 (1987).
6 B. Ameduri and R.E. Prud'homme, Polymer, 29, 1052 (1988).
7 Andrew J. Tinker, Rubber Chem. Technol., 63, 503 (1990).
8 G. Riess, J. Kohler, C. Tournut and A Banderet, MacromoI. Chem., 58,
101 (1967).
9 J. Kohler, G. Riess and A Banderet, Eur. Polym. J., 6, 173 (1968).
10 M.E. Woods and J.A. Davidson, Rubber Chem. Technol., 49, 112 (1976).
II R. Fayt, R. Jerome and Ph. Teyssic, J. Polym. Sci., Polym. Lett. Ed., 24, 25
(1986).
12 V.A Shershnev, Rubber Chem. Technol., 55, 537 (1982).
13 G. Riess, J. Periad and Y. Jolivet, Ange. Chem. Int. Ed., I I, 339 (1972).
14 AA Yehia, AA. Mansour and B. Stoll, J. Thenn. Anal., 48, 1299 (1997).
15 N.M. Mathew and S.K. De, J. PoJym. Sci., Polym. Letter Ed., 22, 135
(1984).
16 W.M. Hess and V.E. Chiroco, Rubber Chem. Technol., 40, 359 (1967).
17 C.M. Roland, G.G.A. Bohm and P. Sadhukhan, J. Appl. Polym. Sci., 30,
202 I (1985).
18 W. Von Hellens, Kautsch. Gummi. Kunstst., 47, 124 (1994).

COmpatiI1ilitj stUdies on 'BN}.MJtll\K8ihid3
19 R.P. Mathur, P. Ghoshal, A Mitra and C.K. Dass, IRMRA lih Rubber
Conference Proc., 233 (1984).
20 AY. Coran, Rubber Chem. Technol., 61,281 (1988).
21 N. Suma, R. Joseph and D.J. Francis, Kautsch. Gummi. Kunstst., 43, 1095
(1990).
22 AE. Nesterov and Y.S. Lipatov, Polymer, 40, 1347 (1999).
23 S. El-Sabbagh, S.M. Mokhtar and S.L.A EI-Messieh, J. Appl. Polym. Sci.,
70, 2053 (1998).
24 AL.G. Saad and S. El-Sabbagh, J. Appl. Polym. Sci., 79, 60 (2001).
25 AA Yehia, F.M. Helaly and S. El-Sabbagh, Adv. Polym. Blends Alloys
Technol.,4, 102 (1993).
26 J.L. Leblanc, Plast. Rubb. Process. Appl., 2, 361 (1982).
27 J .B. Gardiner, Rubb. Chem. Technol., 41, 1312 (1968).
28 I.S. Miles and A. Zurek, Polym. Eng. Sci., 42, 1047 (1991).
29 Y.K. Lee, Y.T. Jeong, K.e. Kim, H.M. Jeong and B.K. Kim, Polym. Eng.
Sci., 31, 944 (1991).
30 Y.J. Shur and B. Ranby, J. Appl. Polym. Sci., 19, 1337 (1975).
31 C.H.M. Jacques and H.B. Hopfenberg, Polym. Eng. Sci., 14,441 (1974).
32 J.J. Hickman and R.M.lkeda, J. Polym. Sci., 11,1713 (1973).
33 E. Perry, J. Appl. Polym. Sci., 8,2605 (1964).
34 D. Feldrnan and M. Rasu, Eur. Polym. J., 10,41 (1974).
35 L.J. Hughes and G.L. Brown, J. Appl. Polym. Sci., 5, 580 (1961).
36 V.R. Landi, Rubber Chem. Technol., 45, 222 (1972).
37 G.N. Avgeropoulos, F.e. Weissert, P.H. Biddison and G.G.A Bohm,
Rubber Chem. Technol., 49, 93 (1976).

38 Y.V. Lebedev, Y.S. Lipatov and V.P. Privalko, Polym. Sei., 17, 171
(1972).
39 L. Thiraphattaraphun, S. Kiatkamjornwong, P. Prassarakieh and
S. Damronglerd, J. Appl. Polym. Sei., 81,428 (2001).
40 RF. Bauer, Polym. Eng. Sei., 22, 130 (1982).
41 C.G. Seefried and J.V. Koleske, J. Appl. Polym. Sci., Polym. Phys. Ed.,
13, 851 (1975).
42 S. Wu, Polym. Eng. Sci., 27, 335 (1987).
43 S. Thomas and R.E. Prud'homme, Polymer, 33, 4260 (1992).
44 J.M. Willis and B.D. Favis, Polym. Eng. Sei., 30, 1073 (I 990).
45 ItA. Spiros, I. Gancarz and J.T. Koberstein, Macromolecules, 22, 1449 (1989).
46 W.M. Barentsen, D. Heikens and P. Piet, Polymer, 15, 119 (1974).
47 P. Marie, J. Selb, A. Raman, R. Duples Six and Y. Gallot, Polymer Blends
and Mixtures, 18, 449 (1985).
48 A.R. Ramos and R.E.Cohen, Polym. Eng. Sci., 17, 639 (1977).
49 T. Ouhadi, R. Fayt, R. Jerome and Ph. Teyssie, J. Polym. Sei., Polym.
Phys. Ed., 24, 973 (1986).
50 T. Ouhadi, R. Fayt, R. Jerome and Ph. Teyssie, Polym. Commun., 27, 212
(1986).
51 T. Ouhadi, R. Fayt, R. Jerome and Ph. Teyssie, J. Appl. Polym. Sei., 32,
5647 (1986).

Studies on Sulphur Cured EPDMlCIIR Blends
4.1 Introduction
It has been recognized for some time that prospects of continued synthesis of
new rubbers with practical utility are limited. Efforts to develop blends for
diverse applications have continued to burgeon for several decades. Several
reviews on rubber-rubber blends are available in literature. I-4 Tires probably
represent the largest use of rubber blends. In non-tire industries, blends have
been introduced for critical applications. When compared with other blending
methods, blending of polymers by mechanical means is more important as
this produces, in a short time, macroscopically homogeneous blend which is
desired for better vulcanizate properties.5 Shundo et al. has reported that for
NR-SBR blend, mill mixing gives more homogeneous blend than Banbury
mixing. 6 In the previous chapter of this thesis, the compatibility between the
blends of EPDM and CIIR has been discussed. The compatibility study shows
that, of the four grades of EPDM used, only two grades, viz; 301-T and
NDR-4640 are compatible with CUR. They have comparable unsaturation and
viscosity which results in the covuIcanization and uniform mixing of the two
components. This covulcanization offers an effective molecular level mixing
or compatibility between the two phases without the help of any
compatibilisers. The mechanical properties of these two types of EPDM/CllR
blends are proposed to be investigated in this chapter.
4.2 Experimental
The compounding recipe is given in table 3.1. The compounds were prepared
according to ASTM-D 3182 on a laboratory mixing mill (16 x 33 cm) at a

friction ratio of I: 1.25. The cure curves of the mixes were taken at 170°C
using a Rubber Process Analyzer (RPA 2000, Alpha Technologies). The
compounds were vulcanized upto their respective optimum cure times in an
electrically heated laboratory hydraulic press at 170°C. The total crosslink
density was determined from the swelling data in toluene as per the
procedures outlined in chapter 2. The individual crosslink densities of the
EPDM and CIIR phases could not be measured because both had only
common true solvents. 7
The tensile properties of the vulcanizates were detennined as per ASTM D 412 using
dumbbell specimens at a cross head speed of 500 mm1min on a Shimadzu Universal
Testing Machine (model-AG I). The ageing resistance and tension set of the
vuIcanizates were determined after ageing the samples at 100 cC for 24, 48 and 72
hours in a laboratory air oven. The steam ageing resistance of the vulcanizates was
also studied using a steam chamber maintained at a pressure of one atmosphere and
temperature 100 cC for different time intervals of 6, 18 and 36 hours. Angular test
specimens were punched out of the compression moulded sheets and tear resistance of
the unaged and aged samples were measured on the UTM according to ASTM D 624.
The hardness of the vulcanizates was determined according to ASTM 2240
and expressed in shore A units. Samples for abrasion resistance were moulded
and weight loss/h was determined on a DIN abrader according to DIN 53514.
Samples for compression set, flex crack resistance and rebound resilience
were moulded and tested as per relevant ASTM standards.
4.3 Results and discussion
4.3.1 Cure rate and crosslink density
The cure rates of the blends of 301-T and NDR-4640 grades of EPDM with CllR
corresponding to various compositions are shown in figure 4.1. When compared
with 301-T/CIIR blends, cure rate is higher for NDR-4640/CIIR blends which may
be due to the higher unsaturation of NDR-4640 as well as the presence of the

Sttuf'res on sufpftur curea~q:tlXM/CII1{6fetufs
diene, ethylidene norbornene (ENB). In the case of 301-T grade EPDM, the diene
is dicylopentadiene (DCPD) which has the slowest cure rate among the
terIDonomers of EPOM. Also the unsaturation percentage of 301-T is lower than
that ofNDR-4640. The cure rates of pure EPOM and CIIR compounds were in the
same range. The cure rate decreased with increase in EPDM content in the blends
up to 60 % of EPDM and then increased. This may be attributed to the non
unifonn distribution of curatives in the blend components. 8 The distribution of
curatives enhances the extent of crosslinking. As longer time is needed for forming
larger number of crosslinks, cure time increases, resulting in decreased cure rate.
0.035 '2' :€ 0.031
E 0.027 e.
~ 0.023 I!! al ... 0.019 :::I 0
0.015
0 20 40 60 80 100
Percentage of EPDM
Figure 4.1 Variation of cure rate of EPDMlCllR blends with EPDM content.
., NOR-4640/CIIR and ... , 301-T/CIIR blends
Figure 4.2 shows the variation of crosslink density of the vulcanizates. The total
cross link density increases with increase in EPOM content in the blend. In the
20/80 and 40/60 EPDM/CIIR blends, major component is chlorobutyl and the
crosslink density shown is largely that of chlorobutyl, which is low due to curative
migration. In 60/40 EPOM/ClIR blend even though EPDM phase gets a higher
share of curatives, chlorobutyl phase also sufficiently gets cured.9-
11 In 80/20
EPDM/CIlR blend, EPOM forms the continuous phase and the effect of
preferential migration is not so significant. 12.13

3.8,------·------_____ --,
>. ~;:;-- 3.6
i 5 '0-~.f» 3.4 .5 co -:; 0- 3.2 ... (.)
.----- ---.--.....
3 ~-------~---------~ 20 40 60 80
Percentage of EPDM
Figure 4.2 Variation of crosslink density of EPDMlClIR blends with EPDM content.
., NDR-4640/CIIR and ..l, 301-T/CIIR blends
4.3.2 Mechanical properties
The variation in tensile strength and elongation at break with percentage of EPDM is
shown in figures 4.3, 4.4 and 4.5. The tensile strength of the unaged samples of 301-
T/CIIR blends show additive behaviour while NDR-4640/CIIR blends are exhibiting a
synergistic behaviour indicating that NDR-4640/CIIR blends are more compatible than
301-T/CIIR blends. The elongation at break is also close to the arithmetic average for
30I-T/CIIR blends and synergistic behaviour for NDR-4640/CIIR blends. As the rate
of vulcanization of the two phases is comparable, significant amount of interphase
crosslinking may take place and this might be the reason for the better values of tensile
strength and elongation at break. 14
20 'ii
19 ll. ~
.r; 18 -C) c 17 l!! -11> 16 ~ 'iii 15 c G)
I- 14
o 20 40 60 80 100
Percentage of EPDM
Figure 4.3 Variation of tensile strength ofNDR-4640/CIIR blends with EPDM content

StwfU!s on sulpliur cureaP.CP[)!M/CIPI{6ferufs
24 ~---------------------------------, ii" 23 c.. !. 22 oS 21 C» c 20 ! 19 III
J! 18 ';; ; 17
~ 16 ~. ------------------------~------~ o 20 40 60 80 100
Percentage of EPDM
Figure 4.4 Variation of tensile strength of301-TICIIR blends with EPDM content
1400 ~ :.... .It 1200 IG e J:l 1000 -IG C 800 0
j :;:; IG Cl 600 c 0 jjj
400 0 20 40 60 80 100
Percentage of EPDM
Figure 4.5 Variation of elongation at break of EPDMlCllR blends with EPDM
content. .4, 30l-TICILR and., NDR-4640/CIIR blends
The tensile strength and elongation at break of the vulcanizates after thennal ageing are
shown in tables 4.1 and 4.2 respectively. The drop in tensile strength and elongation at
break with ageing is observed more for NDR-4640/CIIR blends compared to 301-TICIIR
blends. This may be due to the higher unsaturation of NDR -4640 compared to 301-T, so
that, in addition to the usual breakage of sulphur crosslinks during ageing, main chain
scission may also occur more in NDR-4640. 15 Hot air ageing resistance is found to be
SUperior for blends containing higher percentage of EPDM in both blends. TIlls may be
due to the increase in crosslink density with ageing because of the continuing marching
cure of EPDM. CllR attains maximum torque faster than EPDM and then it reverts. As
ageing continues, the tensile stren!,>th values decrease. Ibe tensile strength values of the
vulcanizates are found to depend on the proportions of poly-, di- and mono-sulphidic

linkages in addition to the crosslink density. A higher percentage of polysulphidic
crosslinks is found to result in higher tensile strength. The decrease in values on
continued ageing might be due to the decrease in the concentration of polysulphidic
crosslinks. I6-18 The deterioration in the tensile strength of the vu1canizates with ageing
may be principally due to main chain scission. 19-22 The chain shortening of polysulphidic
crosslinks may also contribute to this effect.
Table 4.1 Variation of tensile strength with ageing for 301-T /CIIR and
NDR-4640ICIIR blends
Percentage Tensile strength of Tensile strength of
of EPDM in 301-T/CIIR blends (MPa) NDR-4640ICIIR blends (MPa) the blend 24 hrs 48 hrs 72 hrs 24 hrs 48 hrs 72 hrs
100 24.4 23.2 21.8 14.2 13.0 11.6
80 22.8 21.3 20.5 14.8 13.4 12.1
60 21.4 20.6 19.8 15.6 14.8 13.7
40 19.1 18.2 17.2 18.0 16.8 14.8
20 17.2 16.0 14.6 16.5 15.2 13.6
0 15.9 14.5 12.9 15.9 14.5 12.9
Table 4.2 Variation of elongation at break with ageing for 301-TICIIR and
NDR-4640/CIlR blends
Percentage Elongation at Break Elongation at Break
of EPDM in for 30I-TICIlR blends (%) for NDR-4640/CIIR blends (%)
the blend 24 hrs 48 hrs 72 hrs 24 hrs 48 hrs 72 hrs
100 928 860 812 412 356 278
80 864 786 708 528 343 242
60 812 718 654 582 396 316
40 676 584 532 608 412 338
20 570 472 418 520 406 326
0 474 397 306 474 397 306

Studies on sufpliur cureaPlPIXM/CII<R...6fenJS -Tables 4.3 and 4.4 show the steam ageing resistance of 301-T/CIIR and
NDR-4640/CIlR blends respectively. As in the case of hot air ageing, the steam
ageing resistance is also higher for blends with higher percentage of EPDM
probably due to the post vulcanization reaction strengthening the network. Among
the blends with two grades of EPDM, 301-T/CIIR blend is exhibiting better
retention in properties owing to its more saturated nature. A comparison of tensile
strength values of the vulcanizates of varying compositions subjected to hot air
ageing and steam ageing show a drastic loss in property during steam ageing and
the loss was higher for 100 % CIIR and blends containing higher percentage of
CIIR. The comparative result points to the fact that dehydrohalogenation, which is
the main problem for halogenated butyl compounds, is severe during steam ageing
than during thermal ageing.23,24
Table 4.3 Effect of steam ageing on tensile strength and elongation at break for
301-T ICIIR blends
Percentage Tensile Strength Elongation at Break of EPDM after steam ageing (MPa) after steam ageing (%)
in the blend 6 hrs 18 hrs 36 hrs 6 hrs 18 hrs 36 hrs
0 16.1 14.1 11.4 488 412 334
20 17.4 16.1 14.2 576 5]6 443
40 18.3 17.3 16. ] 690 645 584
60 19.6 18.8 17.5 822 786 710
80 21.3 20.8 19.7 895 823 786
100 23.6 23.4 22.6 910 886 854

Table 4.4 Effect of steam ageing on tensile strength and elongation at break for
NDR-4640/CIIR blends
Percentage Tensile Strength Elongation at Break of EPDM after steam ageing (MPa) after steam ageing (%)
in the blend 6 hrs 18 hrs 36 hrs 6 hrs 18 hrs 36 hrs
0 16.1 14.1 11.4 488 412 334
20 16.7 14.5 12.0 526 459 376
40 17.4 16.1 14.3 580 492 422
60 16.5 15.4 13.8 485 426 368
80 14.6 13.8 12.5 432 362 302
100 13.8 13.1 12.2 388 331 314
Tear strength is an important property which contributes towards resistance to
crack growth. It can be seen from the table 4.5 that the variation of tear
strength with the addition of EPDM is very similar to that observed in the
case of tensile strength. That is, tear strength increases gradually with an
increase in percentage of EPDM in the vuIcanizate. This observation is
associated with the ability of EPDM phase to transfer the tearing force and
also probably because of the optimum crosslink densities in the two rubber
phases and at the interphase. The variation of tear strength followed an
additive behaviour which points towards partial miscibility. Furthur reasons
for the improved strength may be uniform filler distribution due to the
similarity in the viscosities between EPDM and CIIR phases. Upon ageing,
the tear strength values decrease primarily due to the cross link scission.
94

StuateS on sufpliur cureaP.<¥IYM/CIlCJ{6fenas
Table 4.5 Variation of tear strength for 301-T/CIIR and NDR-4640ICIIR blends
under unaged and aged conditions
Tear strength Tear strength Percentage of301-T/CIIR blends ofNDR-4640ICIlR blends
ofEPDM in (N/rrun) (N/mm)
the blend 24 48 72 24 48 72 Unaged
hrs hrs hrs Un aged
hrs hrs hrs
0 31.8 28.6 24.1 21.2 31.8 28.6 24.1 21.2
20 33.4 30.1 28.5 24.8 32.4 29.4 25.7 22.0
40 37.0 33.6 30.7 28.0 34.0 31.8 29.4 23.6
60 41.2 38.8 35.0 32.1 33.2 31.1 29.0 25.9
80 43.4 41.4 40.8 37.2 32.1 30.2 28.7 26.7
100 46.7 45.8 43.6 40.8 31.3 29.6 28.8 27.3
Compression set and tension set values depend strongly on the elastic recovery of
the sample. Figure 4.6 shows the variation of compression set with percentage of
EPDM and table 4.6 shows the variation of tension set properties with blend
composition for 301-T/CIIR and NDR-4640/CIIR blends. In general, the
compression set and tension set values decrease with increase in CIIR content in
the blend. This is due to the more elastic nature of CIIR so that even after stress- ~
relaxation process, there is no significant change in dimensions resulting in lower
set values. When compared with 301-T/CIIR blends, the compression set values
are low for NDR-4640/CIIR blends due to its more compatible nature, but tension
set values show a drastic fall probably due to the highly unsaturated nature of
NDR-4640.

45 --~ ~
40 -QI 35 III c: .2 30 en III ! 25
! -" Q.
E 20 0 0
15 0 20 40 60 80 100
Percentage of EPDM
Figure 4.6 Variation of compression set of EPDMlCIIR blends with EPDM content.
., NDR-4640/CIIR and ., 301-T/CIIR blends
Table 4.6 Variation of tension set for NDR-4640/CIIR and 301-T/CIlR blends
Percentage Tension set for Tension set for
of EPDM in 301-T/CIIR blends (%) NDR-4640/CIIR blends (%)
the blend 24 hrs 48 hrs 72 hrs 24 hrs 48 hrs 72 hrs
0 - - - - - -20 76 - - 97.5 - -
40 102 - - 117 - -
60 116 125 - 128 - -80 123 131 144 136 - -100 130 136 141 141 158 -
Figure 4.7 shows the variation of hardness on increasing concentration of EPDM.
It is evident from the figure that the rubber vulcanizates become stiffer and harder
as the EPDM content increases. This is expected because, as more EPDM get into
the blend matrix, the elasticity of the rubber blend is reduced, resulting in more
rigid vulcanizates. Hardness values are higher for NDR-4640/CIIR blends probably
due to their higher crosslink density.
Q(;.

StualeS on sufpliur curet! t£P.IXM/CI It}{ 6fernfs
75
<' 70 ! 0 65 ..c::: ~ CIt 60 CIt ID c:: 'E 55 IQ ~
50 0 20 40 60 80 100
Percentage of EPDM
Figure 4.7 Variation of hardness of EPDMlCIIR blends with EPDM content.
A, 301-TICIIR and., NDR-4640/CIIR blends
Abrasion is another important factor leading to the failure of a number of rubber
products. 25 The results in fi&'Ure 4.8 reveal that EPDM as well as the samples
containing higher percentage of EPDM exhibit higher abrasion resistance. It has
been reported that crosslink density, hardness and modulus of the vulcanizate are
important factors controlling the abrasion resistance.26-30 The increased crosslink
density which results in increased hardness and modulus ultimately give rise to the
enhancement of abrasion resistance. On the contrary, lower the friction coefficient,
higher the abrasion resistance. From the results obtained, the greater abrasion
resistance ofNDR-4640/CIIR blend vulcanizates when compared with 30!-T/CIlR
blends can be attributed to their higher crosslink density.
:§ 0.45
III 0.4 III E 0.35 ... ..c::: CD 0.3 .; ~ c: 0.25 0 ';j 0.2 ~ .c < 0.15
0 20 40 60 80 100
Percentage of EPDM
Figure 4.8 Variation of abrasion resistance of EPDMlCfTR blends with EPDM
content. A, 301-T/CIIR and., NDRfCITR blends

Figure 4.9 shows the variation of rebound resilience with percentage of EPDM.
The rebound resilience decreases gradually with chlorobutyl content in the blends.
The reason can be explained on the basis of morphological features and high strain
energy density of chlorobuty1.3 1,32 Due to the low viscosity of301-T compared with
NDR-4640, black loading is higher in the former. This result in an increased flI1er
matrix interaction in the case of 301-T compared to NDR-4640 so that the
resilience is lower for 301-T/CIIR blends when compared with NDR-4640/CIIR
blends.
55 ~ ~ 45 c» 0 c ,g 35
I 'Vi { ".1- e 25 -c c
~ 15 0 .J:I c» ~ 5
0 20 40 60 80 100
Percentage of EPDM
Figure 4.9 Variation of rebound resilience of EPDMlCllR blends with EPDM
content. A, 301-T/CIIR and., NDR-4640ICIIR blends
During service, the rubber goods pass through repeated stress conditions. It is
desired that under these severe conditions the crack propagation should be
minimum or negligible to have better service life. Increment in cut length against
number of flexing cycles is shown in figures 4.10 and 4.11 for 301-T ICIIR blends
and NDR-4640ICIIR blends respectively. The samples were tested at room
temperature. It has been observed that, with the increase in chlorobutyl content in
the blends, the rate of crack growth decreased which is due to the inherently
superior viscoelastic nature of the CIIR.33-35 This same trend is observed for both
301-T/CIIR and NDR-4640ICIIR blends containing higher percentage of
chlorobutyl. The resistance to cut growth is better for 301-T/CIIR blends. This may
be due to different extent of filler distribution in the two grades of EPDM. It is
expected that reinforcing tillers like carbon black will get distributed more in the
oS(

StuaJeS on sufpfzur CUfea P,(p:JYM/CII'l{ 6fetufs
EPOM phase in the case of301-T/CIIR as compared with NDR-4640/CIIR, due to
the low viscosity of 301_T.36 This results in the formation of more active sites on
301-T surface when compared to NOR-4640 with the incorporation of the filler.
When the two surfaces are brought into molecular contact, adsorption takes place
in addition to the bonds formed by crosslinking. These bonds can absorb more
stress before rupture leading to better flex crack resistance for 301-T/CIIR blends.
.s: .... Cl c .! .... :::l~ t,) E .5 E c~ Q)
E e t,)
..s
25
20
15
10
5
0 5 10 15 20 25 30 35 40 45 50 55 60 65 67
Aexing cycles X 10000
Figure 4. 10 Plot of increment in cut length against flexing cycles for 301-T ICITR
blends at a precut of 2.0 mm. -, 100/0; +, 80120; )1(, 60/40; ... , 40/60; ., 20/80;
+,01100
.s: C, c: .! .... :::l~ U E .5 E c~
CII E e u ..s
25
20
15
10
5
0
~ /+ x/ /+
.~.~/+-+-+-+-+-+/+/+ x/ +---+---+-+/
5 10 15 20 25 30 35 40 45 50 55 60 65 67
Flexing cycles X 10000
Figure 4. 11 Plot of increment in cut length against flexing cycles for
NDR-4640ICIIR blends at a precut of 2.0 mm. -, 100/0; +, 80/20; )1(, 60/40;
"',40/60; .,20/80; +,0/100

4.4 Conclusions
The sulphur cured EPDM/CIIR vulcanizates at varying blend compositions were
found to exhibit good physical properties at all compositions. The properties are
found to be weighted average of the properties of component elastomers. Although
better mechanical properties are exhibited by NDR-4640/CIIR blends, they show a
drastic drop under severe conditions of thennal and steam ageing. On the other
hand, resilience, flex crack resistance and ageing resistances are better for
301-T/CIIR blends which is probably due to the low viscosity and saturated nature
of 301-T. Based on the physical property studies, it is inferred that 301-T/CIIR
blends can be used for high temperature applications such as curing bladder,
conveyor belts etc.

Studies on sufpfiur cured 1ECP:])'M/CIIIJ{ 6fentfs
References
C.M. Roland, Hand book of Elastomers-New Development and
Technology, A.K. Bhowmick and H.L. Stephens (eds.), Marcel Decker
Inc., N.Y. (1988).
2 PJ. Corish, Science and Technology of Rubber, F.R. Eirich (eds.),
Academic Press, N. Y. (1978).
3 Mondragon and J. Nazabal, Polym. Eng. ScL, 25, 178 (1985).
4 D.R. Paul and S. Newmann, Polymer Blends, vols. 1 and 2, Academic
Press, N.Y. (1978).
5 T. Pazonyi and M. Dimitrov, Rubber Chem. Technol., 40, 1119 (1967).
6 M. Shundo, M. Imoto and Y. Minoura, J. Appl. Polym. Sci., 10, 939
( 1966).
7 Andrew J. Tinker, Rubber Chem. Technol., 63, 503 (1990).
8 J.L. Leblanc, Plast. Rubb. Process. AppJ., 2, 36 J (1982).
9 J.L. Leblanc, VI th Int. Rubb. Conf., Paris (l982).
10 G.J. Amerogen, RubberChem. Technol., 37,1065 (1964).
11 J.B. Gardiner, Rubber Chem. Tecbnol., 41, J 312 (1968).
12 I.S. Miles and A. Zurek, Polym. Eng. ScL, 42,1047 (199]).
13 Y.K. Lee, YT. Jcong, K.c. Kim, H.M. Jeong and B.K. Kim, Polym. Eng.
Sci., 31, 944 (1991).
14 P.K. Pal, A.K. Bhowmick and S.K. De, Rubber Chem. Technol., 55, 23
(1982).
15 R.S. Lehrle, J.c. Robb and J.R. Suggate, Euro.Polym. J., 18, 443 (1982).
16 A.Y. Coran, Science and Technology of Rubber, F.R. Eirich (eds.),
Academic Press, N.Y. (1978).
17 D.S. Cambell, J. Appl. Polym. Sci., 14, 1409 (1970).

18 C.R. Parkes, D.K. Parker and D.A Chapman, Rubber Chem. Technol., 45,
467 (1972).
19 T. Co1elough, I.I. Cunneen and G.M.C. Higgins, I. Appl. Polym. Sei., 12,
295 (1968).
20 AG. Veith, J. Polym. Sei., 25, 355 (1957).
21 AV. Tobolsky, J. Appl. Polym. Sci., 27, 173 (1956).
22 E.]. Blackman and E.B. McCall, Rubber Chem. Technol., 43, 651 (1970).
23 N. Dadvand, RS. Lehrle, tW. Parsons and M. Rollinson, Polymer
Degradation and Stability, 66, 247 (1999).
24 M.R. GrimbJey and R.S. Lehrle, Polymer Degradation and Stability, 48,
441 (]995).
25 A.1. Sviridyonok, V.A Bely, V.A Smurugov and V.G. Savkin, Wear, 25,
301 (1973).
26 P. Thavamani and A.K. Bhowmick, Plast. Rubb. Compos. Process. Appl.,
20,29 (1993).
27 K. Cho and D. Lee, Polymer, 41, 133 (2001).
28 Y. Fukahori and H. Yamazaki, Wear, 171, 195 (1994).
29 Y. Fukahori and H. Yamazaki, Wear, 178, 109 (1994).
30 Y. Fukahori and 11. Yamazaki, Wear, ]88, 19 (1995).
31 D.F. Kruse and RC. Edwards, SAE Transactions, 77,1868 (1968).
32 R.C. Puydak and RS. Auda, SAE Transactions, 76, 817 (1967).
33 J.R. Beatty, J. Elast. Plast., 1], 147 (1979).
34 A.N. Gent, P.B. Lindley and AG. Thomas, J. Appl. Polym. Sci., 8, 455
(1964).
35 P.B. Lindley and AG. Thomas, Proc. 4th Int. Rubb. Conf., London (1962).
36. P.J. Corish, Polymer Blends and Mixtures, DJ. Walsh, J.S. Higgins and
AMaconnaehie (eds.), Mortinus Nijhoff Publishers, Dordrecht (1985).

EPDMlCIIR Blends: Improved Mechanical Properties through Precuring
5.1 Introduction
More than ever before, today, there is increased technological interest in the use of
blends of dissimilar rubbers. I-3 However such blends generally show inferior
mechanical properties compared to the average properties of the components. This
can be attributed to three types of incompatibility which exist between dissimilar
elastomers: viscosity mismatch, thennodynamic incompatibility and cure
mismatch. 4 As a result of incompatibility, after mixing, the curatives migrate to the
more unsaturated or more polar rubber which cures faster than the slow curing
rubber causing the latter remaining undercured.5-9 This phenomenon leads to poor
mechanical properties of the blends. Such migration can also occur due to the
difference between the reactivities of the eIastomers or due to the difference
between the solubilities of curatives in elastomers. 1o•l3 Several methods have been
suggested to improve the mechanical behaviour of elastomer blends. Lead oxide
activated curing and the use of long chain hydrocarbon dithiocarbamate accelerator
is beneficial in sulphur cure of EPDM's with highly unsaturated or more polar
rubbers like nitrile (NBR) rubber. 14
Another approach is the chemical modification of the slow curing phase or binding
of accelerators to the polymer backbone. 15 Preblending of curatives into respective
elastomers at optimal concentrations prior to blending can improve the blend
crosslink distribution, although the usual practice is to incorporate the curatives at
the last stage inorder to avoid scorch problems. 16 Inorder to reduce the diffusion of

curatives from one phase to the other, thereby improving the adhesion between the
components, a novel method is to partially prevulcanise one of the blend
components and then mixing the prevulcanised elastomer with the other
component. 17-19
In this part of the study, to improve the co-curing and hence the blend properties of
chlorobutyl rubber (CUR) with ethylene-propylene-diene rubber (EPDM), one of
the component elastomers in the EPDMICIIR blend is partially precured prior to
blending. The mechanical properties of the blends prepared by this novel route are
compared with those of conventional blends.
5.2 Experimental
5.2.1 Determination of optimum level of precuring
The optimum precuring required for the slow curing CIlR phase for making
successful blends with EPDM was determined by measuring the tensile
properties of 50/50 blends of EPDM/CIIR with ClIR phase precured to
different levels. ClIR was compounded according to ASTM-D 3182 on a
laboratory mixing mill at a friction ratio of 1: 1.25 as per the formulations
given in table 3.1. The compound was sheeted out from the mill at a thickness
of 3 mm and was precured for different periods viz. 10 %, 20 %, 30 % and
40 % of the optimum cure time at a temperature of 170 QC. These precured
samples were blended with masticated EPDM on the mill and then
compounding ingredients for EPDM were added. The compounds were cured
upto their respective optimum cure time. The tensile properties of the blends
were evaluated and the optimum precuring time was detemlined by comparing
the tensile strength_ In a similar manner, EPDM was compounded as per the
formulation given in table 3.1, precured to different levels, blended with CIJR
followed by the addition of its curatives, vulcanized and the tensile properties
of the resulting blends were compared.
104

P/PD:M/CII(j{6femfs: Improvea meclianica{ properties tnroUtJIi precuriTIfJ
5.2.2 Swelling behaviour of precured EPDMlClm blends
Chlorobutyl rubber, precured upto the optimum level, was blended with EPDM
rubber at various percentages. The compounding ingredients required for EPDM
were then added. The optimum cure time was then determined at 170 QC using
Rubber Process Analyzer. The compounds were then vulcanized upto their
respective optimum cure times on an electrically heated laboratory hydraulic press
at 170 QC. The total crosslink density was determined from the swelling data in
toluene as per the procedures outlined in chapter 2.20-22 The individual crosslink
densities of the EPDM and CIlR phases could not be measured because both have
common true solvents.23
5.2.3 Preparation of sample specimens
Dumbell shaped tensile test specimens were punched out from the compression
moulded sheets along the mill direction. The tensile properties of the vulcanizates
were measured as per ASTM D 412 at a cross head speed of 500 mm/min on a
Shimadzu Universal Testing Machine (model-AG 1). The ageing resistance and
tension set of the vulcanizatcs were determined after ageing the samples at 100°C
for 24, 48 and 72 hours in a laboratory air oven. The steam ageing resistance of the
vulcanizates were also studied after ageing in a steam chamber maintained at a
pressure of one atmosphere and temperature 100 QC for the time intervals 6,18 and
36 hours. Angular test pieces were punched out of the compression moulded sheets
and tear resistance of the unaged and aged samples were measured on the UTM as
per ASTM D 624.
The hardness of the vulcanizate was detemlined according to ASTM 2240 and
expressed in shore A units. Samples for abrasion resistance were moulded and
weight loss/h was detennined on a DIN abrader according to DIN 53514. Samples
for compression set, flex crack resistance and rebound rcsjlience were moulded and
tested as per relevant ASTM standards.

5.3 Results and discussion
5.3.1 Optimization of precuring conditions
Figure 5.1 is a plot of tensile strength versus percentage curing time (various
percentage of the optimum cure time) conditions for 50/50 EPDM/CIIR samples in
which the EPDM phase is precured. The results indicate that, with increase in state
of precuring, the tensile strength of the blend decreases. In the normal 50/50
EPDM/CIIR blend, owing to the low viscosity and more unsaturated nature of
EPDM when compared with CIIR, the curatives and carbon black prefer to diffuse
to the EPDM phase leading to slight overcuring. Hence in the case of the blend
consisting of precured EPDM, the EPDM phase gets overcured leading to poor
interfacial linking. Secondly, in the resulting blend, the CIlR phase remains
undercured which also contribute to the inferior properties. Thus the method of
precuring of EPDM followed by blending with CIIR was not found to be effective
for improving the blend properties.
21
l 20.5 20
~ 19.5 -'= ... 19 0) I: 18.5 e ... 18 11>
~ 17.5 '0
17 I: QI
r- 16.5
o 10 20 30 40 Percentage curing time
Figure 5.1 Variation of tensile strength for 50/50 EPDM/CIIR vulcanizates
(partially precured EPDM with CIlR) with percentage curing time
Figure 5.2 shows the variation in tensile strength of 50/50 EPDM/CUR blends at
varying precuring conditions. The tensile strength of the blends is found to increase
with the state of precuring of the CIIR phase initially, reach a maximum at 20 %
precuring and then decreases. This behaviour shows that precuring the CIIR phase

t£CP]):M/CIItJ(6fendS: Imprcrvea meclianicaf properties tliroueli precuri1lfJ
upto a certain degree of crosslinking assists co-crosslinking but nonhomogeneity
develops in the blend at higher percentage precuring. This shows that, after the
optimum level of precuring, chlorobutyl phase gets further cured and then it acts
similar to an overcured or scorchy rubber leading to poor interfacial linking.
Secondly, in the resulting blend one phase remains undercured. It also points
towards the necessity for an optimum degree of precuring in the CIIR phase for
preparing crosslinked blends with EPDM. Blends prepared by partially precuring
the chlorobutyl rubber and then blending with EPDM are hereafter referred as
'modified' blends to distinguish from the blends prepared by blending chlorobutyl
and EPDM by conventional method.
21.5 Iii'
21 a. :lE .:::: 20.5 .... Cl c: 20 Cl) .. ... III 19.5 ~ .;;
19 c: Cl)
I- 18.5
0 10 20 30 40 50 Percentage curing time
Figure 5.2 Variation of tensile strength of SO/50 EPDM/CIIR blends (EPDM with
partially precured CIIR) with percentage curing time
5.3.2 Cure characteristics and crosslink density
Furthur studies on EPDM/CIIR blends were carried out by precuring the CIIR
phase upto 20 % of the optimum cure time at 170 QC. The cure characteristics of
the blends are shown in table 5.1 and cure rates corresponding to various
compositions for conventional and modified blends are shown in figure 5.3. When
EPDM fonns the major constituent, there is no significant change in the cure time
between the conventional and modified blends. As chlorobutyl content increases,
cure time decreases for modified blends. This is expected, because the curing

behaviour is likely to be more influenced by the major constituent.24•25 Reduction in
cure time for modified blends indicates that there is no significant curative
migration to EPDM phase and curatives are trapped in the chlorobutyl phase itself
due to precuring. The modified blends show marginally higher torque and cure rate
which is related to the homogeneity of the modified blends. The processing safety
of the modified compounds remains unaltered by the precuring step as there is not
much variation in scorch time and cure time.
Table 5.1 Cure characteristics of conventional and modified EPDM/CIIR blends
EPDM (%) 20 40 60 80 20 40 60 80
CIIR(%) 80 60 40 20 - - - -Modified
80 60 40 20 CIIR (%) - - - -Cure time
12.2 14.6 18.8 13.0 11.7 14.0 19.1 13.2 (min)
Scorch time 1.0 1.3 1.4 1.2 1.0 1.3 1.4 1.2
(min) Maximum
0.34 0.30 0.33 0.32 0.39 0.35 0.38 0.36 torque (Nm)
Minimum 0.042 0.036 0.034 0.038 0.082 0.064 0.048 0.041
torque (Nm)
0.03
:E 0.027 .E • E 0.024 z
,. ~
Cl) - 0.021 IG "-Cl) "- 0.018 ::l 0
0.015
20 40 60 80
Percentage of EPDM
Figure 5.3 Variation of cure rate of EPDMlCIIR blends with EPDM content.
., conventional and 4, modified blends

PiPD9rt/CIJlI{6£enas: Improwd mecfzanicaf properties tfzroUfJ/i precuring
Crosslink densities of the conventional and modified blends are shown in figure
5.4. The modified blends show a higher crosslink density than the corresponding
conventional blends from swelling experiments in toluene. Higher crosslink
density values on modification are due to the equal distribution of crosslinks owing
to reduced curative migration. Improvement in values is more significant in the
case of 80/20 EPDM/CIIR blend. In this case the crosslink density of chlorobutyl
which is the major component is low due to curative migration. But on
modification, curative imbalance is reduced resulting in uniform crosslinking in the
component elastomers and at the interphase.
3.44
>. 3.39 ~ UI ~ C ...
3.34 (I) E "C~ ~ CD 3.29 C'1' := 0 UI .... 3.24 UlX 0_ .. 3.19 (.)
3.14 20 40 60 80
Percentage of EPDM (%)
Figure 5.4 Variation of crosslink density of EPDMlCITR blends with EPDM content.
., modified and A, conventional blends
5.3.3 Comparison between conventionally cured and preclIred blend systems
Figure 5.5 shows the variation in tensile strength of the modified and conventional
blends. The modified blends show better tensile strength compared to the
conventional blends. This improvement in tensile stren!,rth is probably due to the
optimum crosslink densities in both EPDM and CllR phases and in the
interphase.26 Improvement is found to be more pronounced in the 20/80
EPDM/CIIR blend which shows that it was this composition that was
comparatively most affected due to curative migration in conventional blending
leading to the EPOM phase to get overcured whereas the CIJR phase remains
undcrcured. The ageing resistance of the modified and conventional blends is given

in table 5.2. The results reveal that the ageing resistance of the blends is also found
to be better for the modified blends. This clearly shows the superiority of the
precured CIIR in resisting curative migration and in getting optimally cured at the
final curing stage along with EPDM.
23 ii' Co 22 :E --.c 21 .. Cl c 20 I!! -III 19 ~ .;;;
18 c Cl) I-
17
0 20 40 60 80 100
Percentage of EPDM
Figure 5.5 Variation of tensile strength of EPDM/CIIR blends with EPDM content.
., conventional and A, modified blends
Table 5.2 Variation of tensile strength with ageing for conventional and modified
EPDM/CIIR blends
Percentage Tensile strength of Tensile strength of
conventional blends (MPa) modified blends (MPa) of EPDM
24 hrs 48 hrs 72 hrs 24 hrs 48 hrs 72 hrs
20 17.2 16.0 14.6 17.8 16.3 14.8
40 19.1 18.2 17.2 19.6 18.4 17.4
60 21.4 20.6 19.8 21.7 20.8 19.8
80 22.8 21.3 20.5 23.0 21.4 20.5
Table 5.3 shows the elongation at break of the CIlRlEPDM blends. The modified
C]IRJEPDM blends show higher elongation compared to the conventional blends

PiPIXM/CII(j{6ferufs: Improved meclianicaf propertres tliroUfJIi precul'ino
before and after ageing. Since the elongation is controlled by the continuous
elastomer phase, the lower value in the case of conventional blends probably
results from the overcure of the continuous elastomer phase. In the conventional
curing method, EPDM gets a higher proportion of curing agents resulting in its
overcure. The 20/80 EPDM/CIIR blend shows higher elongation at break since
chlorobutyl rubber is the major component.
Tabel 5.3 Variation of elongation at break with blend composition for conventional
and modified EPDMlCIIR blends
Blending Composition of Elongation at break (%)
method EPDM/CIIR 24 hrs 48 hrs 72 hrs employed blend (%) unaged
ageing ageing ageing
~ 20/80 687 570 472 418 I:l .9 40/60 788 676 584 532 ...-I:l ~
60/40 885 812 718 654 >-I:l 0 u 80120 958 864 786 708
20/80 712 582 480 422 '"0
I!.) 40/60 802 685 591 536 t;:: ::0
60/40 896 818 722 659 0
:8 80120 964 870 790 713
The variation in tear strength for conventional and modified blends under unaged
and aged conditions are given in table 5.4. The modified blends show superior tear
strength compared to conventional blends before and after ageing as observed in
the case of tensile strength. The tear strength improvement with modification is
more pronounced, since tear strength has stronger correlation with optimum
crossslink densities in both rubber phases and in the interphase.27 Furthur reasons
for the improved strength may be attributed to the uniform filler distribution due to
the reduction in the viscosity mismatch between EPDM and CIIR phases in the
case of modified blends due to precuring.

Table 5.4 Variation of tear strength with blend composition for conventional and
modified EPDMlCIIR blends under unaged and aged conditions
Blending Composition of Tear strength (N/mm)
method EPDM/CIIR blend 24 hrs 48 hrs 72 hrs employed (%) unaged
ageing ageing agemg
.- 20/80 33.4 30.1 28.5 24.8 ro r:: 0 40/60 37.0 33.6 30.7 28.0 ..... 1:5 Q)
> 60/40 41.2 38.8 35.0 32.1 r:: 0
U 80120 43.4 41.4 40.8 37.2
20/80 39.2 36.8 31.1 26.4 '0 ~ 40/60 42.4 39.6 34.2 31.2 ~
:0 0 60/40 45.6 43.2 38.9 36.4 :g
80120 46.8 45.1 41.4 39.2
Figures 5.6 and 5.7 show the variation of abrasion loss and hardness with blend
composition respectively. The modified blends show better abrasion resistance than the
conventional blends. This is probably due to the uniform filler distribution in the two
eJastomer components which results from the better viscosity matching of the precured
CIIR and EPDM.28,29 Hardness is also found to be superior for modified blends due to
uniform crosslinking and uniform filler distribution in both phases.
§ 0.45
In ." 0.4 E ~ 0.35 .2> GI ~ 0.3 c .~ In 0.25 Cl! .. D « 0.2
20 40 60 80 Percentage of EPDM
Figure 5.6 Variation of abrasion resistance of EPDM/CHR blends with EPDM
content. ., conventional and 4, modified blends

t£CftIXM/CI JtI{ 6fentfs: I mprowa mecnanicaf properties tnroUIJIi precuring
63
;; 62 I!!
61 0 .c ~ 60 -11) 11) Cl) 59 c -e 58 lIS J:
57 20 40 60 80
Percentage of EPDM
Figure 5.7 Variation of hardness of EPDMlCllR blends with EPDM content.
a, conventional and &, modified blends
The steam ageing resistance of the conventional and modified vuIcanizates is
shown in table 5.5. The modified blends show only a marginal improvement in
steam ageing resistance compared to the usual sulphur cured blends (discussed in
chapter IV). This indicates that steam ageing resistance depends mainly on the
nature of the component elastomers. Chlorobutyl rubber when exposed to steam,
degrades easily due to the dehydrochlorination reaction resulting in inferior . ft . 3031 propertIes even a er precunng. '
Table 5.5 Variation of steam ageing resistance with blend composition for
conventional and modified EPDM/CIIR blends
Percentage Tensile strength of Tensile strength of
of EPDM in conventional blend (MPa) modified blend (MPa)
the blend 6 hrs 18 hrs 36 hrs 6 hrs 18 hrs 36 hrs
20 17.4 15.4 ]4.2 17.6 \5.2 14.3
40 18.3 17.3 16.1 18.4 17.5 16.2
60 19,6 18.8 ] 7.5 19.6 18.9 17.4
80 21.3 20.8 19.4 21.5 20.7 19.6

Figure 5.8 represents the variation of compression set properties and table 5.6
represents the variation of tension set properties with blend composition for
conventional and modified blends. As the chlorobutyl content increases
compression set and tension set decreases for both conventional and modified
blends which is an inherent property ofCIIR, but the modified blends, owing to the
better homogeneity, display lower set values compared to conventional blends.
:::e .. 38 ~ .... Cl) III
33 c: .S! III
28 III Cl) ... c. E 23 0 0
18 20 40 60 80
Percentage of EPDM
Figure 5.8 Variation of compression set ofEPDM/CTIR blends with EPDM content.
., conventional and A, modified blends
Table 5.6 Variation of tension set with ageing for conventional and modified
EPDMlCIIR blends
Percentage Tension set values Tension set values
ofEPDM in for conventional blend (%) for modified blend (%)
the blend 24 hrs 48 hrs 72 hrs 24 hrs 48 hrs 72 hrs
20 76 - - 64 - -
40 102 - - 95 118 -60 116 125 - 109 121 138
80 123 131 144 118 127 142
Figures 5.9 and 5. 10 represent the effect of precuring on the rebound resilience and
flex crack resistance of blends. Precured blends show lower resilience compared to
conventional blends. This is attributed to two reasons; one is higher crosslink

f£¥IXM/CIJll{6fends: Improvea meclianicaf properties tliroUfJIi precuring
density of the vulcanizate and second is the unifonn distribution of the filler in the
matrix, both due to the partial precuring. Flex crack resistance also exhibits
improvement with precuring, again due to the increased homogeneity in the blends
because of precuring.32
~
?f! 40
8 35
r: 30 ~ III 25 QI ...
"C c 20 ~ 0 15 .c ~ 10
20 40 60 80 Percentage of EPDM
Figure 5.9 Variation of rebound resilience of EPDMlCllR blends with EPDM
content. ., conventional blends and ., modified blends
20
16 :l~ o E 12 .!: E C ~ 8 GI
E E o
.E:
15 25 35 45 55 65 Flexing cycles X 10000
Figure 5.10 Increment in cut length Vs. flexing cycles for conventional (dotted
lines) and modified (continuous lines) EPDM/ClIR blends at a prccut of 2mm.
-,80/20; .,60/40; .,40/60; )1(, 20/80

5.4 Conclusions
Precuring chlorobutyl to a low level fonowed by blending with EPDM and then
curing the blend is an efficient way of obtaining optimum crosslink density in both
the elastomer phases and at the interphase. This may be due to the reduced curative
migration from one phase to another. This novel route is found to improve the
mechanical properties of EPDM/CIIR blends significantly over their conventional
counterparts. The processing safety of the blend compounds is not affected by
partial precuring.

P.<PIXM/CIIqz6fends: Impr01Jea mecfianica{ properties tfiroUfJIi precun'ug
References
H. 1smai! and RC. Leong, Polymer Testing, 20, 509 (2001).
2 K. Habeeb Rahiman, G. Unnikrishnan, A. Sujith and C.K. Radhakrishnan,
Materials Letters, 59, 633 (2005).
3 C Nakason, S. Saiwaree, S. Tatun and A. Kaesaman, Polymer Testing, 25,
656 (2006).
4 AY. Coran, Rubber Chem. Teehnol., 61,281 (1988).
5 J.B. Gardiner, Rubber Chem. Teehnol., 41,1312 (1968).
6 J.B. Gardiner, Rubber Chem. Teehnol., 42, 1058 (1969).
7 J.B. Gardiner, Rubber Chem. TeehnoI., 43, 370 (1970).
8 T. Inove, F. Shomura, T. Ougizauva and K. Miyasaka, Rubber Chem.
Teehnol., 58, 873 (1985).
9 V. Duehaeek, I. Polednik, A Kutta and J. Navara, Int. Polym. Sei.
TeehnoI., 10, 14 (1983).
10 M.E. Woods and 1.A. Davidson, Rubber Chem. TechnoI., 49, 112 (1976).
11 R.F. Bauer and F.A Dudley, Rubber Chem. TechnoI., 50, 35 (1977).
12 W.M. Hess, C.R. Herd and P.C Vegvari, Rubber Chem. Technol., 66,329
( 1993).
13 G. Gotton and L.J. Murphy, Kautseh. Gummi. Kunstst., 61,609 (1988).
14 N. Suma, R. Joseph and D.J. Franeis, Kautsch. Gummi. Kunstst., 43, 1095
(1990).
15 CM. Roland and G.G.A Bohm, J. Polym. Sei., Polym. Phys. Ed., 22, 79
(1984).
16 K.C. Baranwal and P.N. Son, Rubber Chem. TeehnoI., 47,88 (1974).
17 A.Y. Coran, Rubber Chem. Tcchnol., 68, 352 (1995).
18 N. Suma, RJosepb and K.E. George,J. Appl. Polym. Sei., 49, 549(1993).

19 Anil K. Bhowmick, P. Loha and S.N. Chakravarty, Int. Rubb. Conf.,
Harrogates (1987).
20 A Ashagon, Rubber Chem. Technol., 59, 187 (1986).
21 C.l. Sheelan and AL. Basio, Rubber Chem. Technol., 39, 149 (1966).
22 B. Savil1e and AA. Watson, Rubber Chem. Technol., 40, 100 (1967).
23 Andrew J. Tinker, Rubber Chem. TechnoI., 63, 503 (1990).
24 I.S. Miles, A Zurek, Polym. Eng. Sci., 42, lO47 (1991)
25 Y.K. Lee, Y.T. leong, K.C. Kim, H.M. Jeong, B.K. Kim, Polym. Eng. Sci.,
31,944 (1991).
26 P.K. Pal, A.K. Bhowmick and S.K. De, Rubber Chem. Technol., 55, 23
(1982).
27 C.M. Kok and V.H. Yee, Eur. Polym. J., 22, 341 (1986).
28 Y. Fukahori and H. Yamazaki, Wear, 171, 195 (1994).
29 K. Cho and D. Lee, Polymer, 41, 133 (2001).
30 R. Beatty, 1. Elast. Plast., 11, 147 (1979).
31 N. Dadvand, R.S. Lehrle, LW. Parsons and M. Rollinson, polymer
Degradation and Stability, 66, 247 (1999).
32 R. Grimbley and R.S. Lehrle, Polymer Degradation and Stability, 48,441
(1995).

Effect of Resin Curing on the Mechanical Properties of EPDMJCIIR Blends
6.1 Introduction
It has been a long tenn practice of the rubber technologist to find polymer
compounds of desired processing and vulcanizate properties, as well as high
performance. To achieve these objectives, rubber-rubber and rubber-plastic blends
were studied by many researchers. A blend can offer a set of properties that may
provide the potential of entering application areas not possible with either of the
polymers comprising the blend. The effect of sulphur curing on the mechanical,
thermal and steam ageing properties of ethylene-propylene-diene rubber (EPDM),
chlorobutyl rubber (CIIR) and their various blends are reported in the earlier
chapter. By chemical or physical processes, crosslinking forms a three-dimensional
network structure which has a strong influence on the physical properties of
polymers. Many scientists have established the factors which are important in
determining the mechanical properties of blends. I-4 It has been reported in the
fourth chapter that for sulphur cured EPDM/CIIR blends under severe conditions,
the properties, especially thermal ageing resistance and steam ageing resistance of
NDR-4640 grade EPDM/CIIR blends is found to be inferior to that of 301-T grade
EPDM/CIIR blends. This drop in properties may be due to the higher unsaturation
of NDR-4640 grade EPOM. To use for high temperature applications such as
curing bladder, conveyor belting for hot materials handling, high temperature
service hoses etc. the hot air ageing resistance of these blends should be improved.
It is known that, certain crosslinking systems, and specifically resin curing of
NDR-4640/CIlR blends, provide vulcanized networks of outstanding heat

resistance. It was not possible to vulcanize 301-T grade EPDM using resin, as it
contains the diene, dicyclopentadiene. On the other hand, NDR-4640 grade EPDM
contains the diene ethylidene norbomene and is resin curable. This chapter deals
with the evaluation of properties of resin cured EPDM/CIIR blends before and
after ageing, at various blend ratios and at various temperatures in comparison to
sulphur cured vu1canizates.
6.2 Experimental
Mixing was done according to ASTM D 3182 (1982) as per the formulations
given in tables 6.1. In this formulation neoprene serves as a halogen containing
activator and zinc chloride is used as Friedel Craft catalyst for better resin
curing in the case of EPDM. 5 The compounding was done on a laboratory two
roll mixing mill at a friction ratio of 1: 1.25 with cold water circulation. The
optimum cure times of the compounds were determined at 170 QC using a
Rubber Process Analyzer. The compounds were then vulcanized upto the
respective optimum cure times in an electrically heated laboratory hydraulic
press at 170 QC. The total crosslink density was determined by swelling in
toluene as per the procedure outlined in chapter 2.6,7
Dumbbell shaped tensile test specimens and angular tear test specimens were
punched out from the compression moulded sheets along the mill grain
direction and their properties were measured at a cross head speed of 500
mm/min on a Shimadzu Universal Testing Machine (model-AG I) as per
relevant ASTM standards. The ageing resistance and tension set of the
vuIcanizates were determined after ageing the samples at 100 QC for 24, 48, and
72 hours in a laboratory air oven. The steam ageing resistance of the
vulcanizates was also studied using a steam chamber maintained at a pressure
of one atmosphere and temperature of 100 QC for the time intervals 6, 18 and 36
hours.

'Effect of resin curing on tfie meclianicaf properties of'ECFIXM/CII1{6fentis
Table 6.1. Compounding recipe
Ingredients Concentration (phr) Ingredients Concentration (phr)
EPDM Rubber 95.0 CllR Rubber 95.0
Neoprene 5.0 Neoprene 5.0
Reactive- Reactive-
Phenolic resin 10.5 Phenolic resin 10.5
Zinc chloride 2.0 ZnO 4.0
ZnO 4.0 Stearic acid 1.5
Stearic acid 1.5 Carbon black 40.0
Carbon black 40.0 Paraffinic oil 5.0
Paraffinic oil 7.0 Antioxidant 1.0
Antioxidant 1.0
The hardness of the vuIcanizate was determined according to ASTM 2240 and
expressed in shore A units. Samples for abrasion resistance were moulded and
weight losslh was determined on a DIN abrader according to DIN 53514. Samples
for compression set, flex crack resistance and rebound resilience were moulded and
tested as per relevant ASTM standards.
6.3 Results and discussion
6.3.1 Cure characteristics and stress-strain properties
The cure characteristics and the physico-mechanical properties of resin cured NDR-
4640/CTIR blends are given in table 6.2. It is evident that the maximum torque of resin
cured blends is higher than those observed during sulphur curing. Also the cure times and
scorch times of resin cured vulcanizales are longer than that of sulphur cured
vuIcanizates. It can be seen from table 6.2 that the maximum torque, cure time and
scorch time increases with increase in NDR-4640 content of the blend while tensile
strength, elongation at break and tear strength decreases with increase in NDR-4640
'I

cnapuro
content. It is generally obseJVed that the mechanical response of the blend is closely
related to its compatibility and a synergistic effect is often obtained with miscible Or
partially compatible blends.8,9 The tensile strength, elongation at break and tear strength
values for resin cured vulcanizates show an additive variation indicating compatible
behaviour. The tensile strength and tear strength of resin cured vulcanizates are
remarkably higher than that of sulphur cured ones. When compared with sulphur cured
blends, curative migration from one phase to another owing to viscosity and unsaturation
differences is not significant in resin cured blends. This is probably due to the large size
of phenolic resin molecules. This results in increased homogeneity of the blends leading
to better properties. 5
Table 6.2 Cure characteristics and stress-strain properties of resin cured and
sulphur cured NDR-4640/CIIR blends
Blend Cure Scorch Max. Min. Tensile Elong. Tear percentage of
EPDM time time torque torque strength at break strength
(%) (min) (min) (Nm) (Nm) (MPa) (%) (N/mm)
0 17.4 2.7 0.380 0.048 20.1 596 37.1 '" "Cl
20 18.8 3.3 0.386 0.040 19.5 578 36.6 Q "Cl~ e::.n 40 19.6 3.8 0.395 0.042 18.9 562 35.8 ;:le:::: 0 ..... Q ......
60 20.4 3.8 0.410 0.040 18.4 542 35.1 ._ U
~~ ~~ 80 21.3 4.2 0.421 0.042 17.9 530 34.6
100 22.2 4.4 0.441 0.042 17.5 512 34.0
0 11.8 1.2 0.350 0.046 17.1 536 31.8
'" "Cl 20 11.6 1.2 0.324 0.039 18.1 1158 32.4 "Cl Q Cl,)~ .... .n G~ 40 14.4 1.3 0.329 0.039 19.0 1283 34.0 .......... ;:l ......
60 15.6 1.3 0.332 0.040 17.8 1061 33.2 ,..c::U .&~ ~2 80 12.4 1.2 0.327 0.041 16.3 868 32.1
100 10.2 1.2 0.334 0.041 15.3 473 31.3

'Effect of resin curinO on tlie meclianicaf properties ofP.CP:[YM/CII1{6fetufs
Figure 6.1 shows the variation of crosslink density of the vulcanizates with
percentage of EPDM in the blends under sulphur cured and resin cured
conditions. In both cases, the total crosslink density increases with increase in
EPDM content in the blend. But compared to the sulphur cured vulcanizates,
the extent of crosslinking is less for resin cured vuJcanizates probably due to
the decreased number of reactive sites in the case of phenolic resin curing.
3.7 -,---
l:' 3.65 i ·in ;::;' 3.6 : C E : .g ~ 3.55 ~l ..lI: Cl! .!: 1:, 3.5
-= E3A5 : e o 3.4-
3.351
o 20 40 60 80 100 Percentage of EPDM
Figure 6.1 Variation of crosslink density of EPDM/ClIR blends with EPDM
content. .&, resin cured and ., sulphur cured blends
6.3.2 Thermal and Steam ageing resistance
EPDM/CllR vulcanizates, with various compositions, were subjected to
thermal ageing at 100°C for periods of upto 72 hours. The results from aged
samples were plotted against percentage composition of EPDM as illustrated
in figures 6.2-6.4 respectively. As expected, the resin cured blends exhibit
outstanding heat resistance when compared with their sulphur cured
counterparts. 10 It can be seen that the tensile strength and tear strength values
of pure EPDM and blends containing higher percentage of EPDM exhibits
better retention in properties than that of pure CIIR and blends containing
higher percentage of chlorobutyl. This IS because the resin curing system
always shows a marching cure till it attains some saturation point.
ChJorobutyl compound attains the saturation point faster than the EPDM

compound and then it reverts. 1 1 The better retention in tensile strength and
tear strength values of pure EPDM and vulcanizates containing higher
percentage of EPDM can be explained on the basis of the increased crosslink
density achieved because of the marching cure. 12 The elongation at break
shows similar behaviour due to the increased crosslink density during ageing.
20 .r-----------------------------~ 'i ~ 19-r. -Cl c 2! '; .J!! 'jjj c ~
18
17 +---+--+
--+-16 -.r---------------~----~,--~+-----+
o 20 40 60 80 100
Percentage of EPDM
Figure 6.2 Variation of tensile strength with ageing for resin cured EPDM/CIIR
blends .• ,24 hours; 1..,48 hours and +, 72 hours of ageing
570 550 530 510 490 470 450 430
+ --+-+-+ -+-+
410 ~--------------------------------~ o 20 40 60 80 100
Percentage of EPDM
Figure 6.3 Variation of elongation at break with ageing for reSIn cured
EPDM/CIIR blends_ .,24 hours; 1..,48 hours and +, 72 hours of ageing
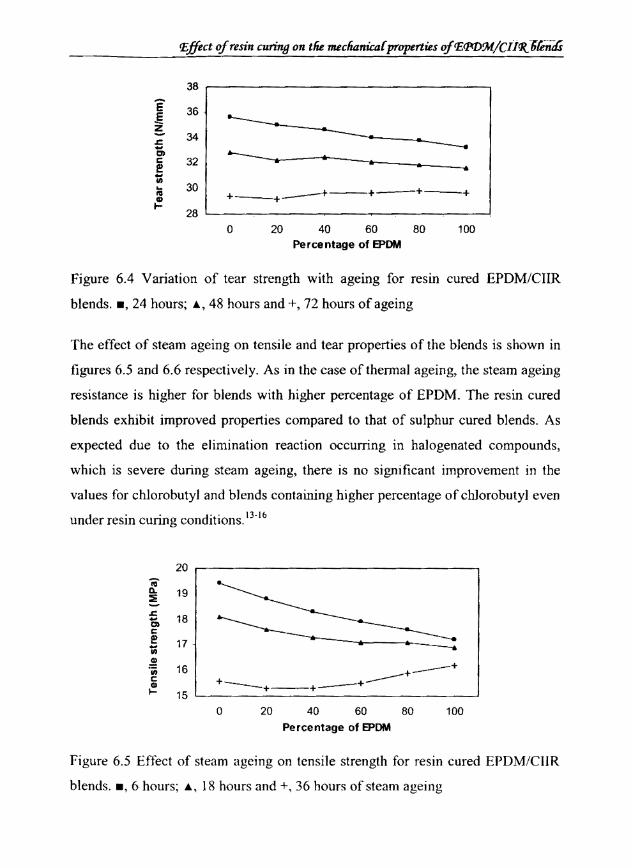
p.ffect of resin curing on tlie meclianica{ properties ofP.PC[)!M/CIiCJ{ofiiltli
38
E 36 .e ~ 34 .r:::: .. CD c 32 e ~~'.~----~.-----'.-----1 ____ ~ & • .. III
30 .. III
~ 28
+-+-+---+-+-+
o 20 40 60 80 100 Percentage of EPDM
Figure 6.4 Variation of tear strenblth with ageing for resin cured EPOM/CIIR
blends .• , 24 hours; .l, 48 hours and +, 72 hours of ageing
The effect of steam ageing on tensile and tear properties of the blends is shown in
figures 6.5 and 6.6 respectively. As in the case ofthennal ageing, the steam ageing
resistance is higher for blends with higher percentage of EPOM. The resin cured
blends exhibit improved properties compared to that of sulphur cured blends. As
expected due to the elimination reaction occurring in halogenated compounds,
which is severe during steam ageing. there is no significant improvement in the
values for chlorobutyl and blends containing higher percentage of chlorobutyl even
under resin curing conditions. 13-16
20 r--------------------------------, ii ~ 19 -
18
17·
16 --+ ----+ +----+----+----+ 15 ~-------------------------~
o 20 40 60 80 100
Percentage of EPDM
Figure 6.5 Effect of steam ageing on tensile strength for resin cured EPOM/CIIR
blends .• ,6 hours; A, 18 hours and +,36 hours of steam ageing

Chapter 6
E 35 - •
.E 33 • ..... ~ 31 • • • • • • ..c
---+ - 29 CD I: ---+ e 27 +----+----+----+ -;; :; 25 G)
I-23
o 20 40 60 80 100
Percentage of EPDM
Figure 6.6 Effect of steam ageing on tear strength for resin cured EPDMlCIIR
blends .• , 6 hours, A, 18 hours and +, 36 hours of steam ageing
6.3.3 Physical properties
Figure 6.7 and table 6.3 shows, respectively, the compression set and tension set
values of the resin cured blends with composition. As the chlorobutyl content
increases, compression set decreases which is an inherent property of chlorobutyl
rubber. The resin cured blends display higher compression set values compared to
sulphur cured blends, probably due to the less extent of crosslinking in the resin
cured blends. Although the resin cured blends exhibit inferior compression set
properties, the low tension set which is a major property required for a good
bladder compound is achieved by resin curing. The values are far better than that of
sulphur cured blends which may be due to the better ageing resistance of resin
cured vu\canizates strengthening the network by post curing.
23.5
>l! !L- 23
t 22.5 I:
·1 22
21.5 Co E 21 8
20.5
0 20 40 60 80 100 Percentage of EPDM
Figure 6.7 Variation of compression set with percentage of EPDM for resin cured
EPDM/CILR blends

I£ffect of resin curi11fJ on tlie meclianicaf properties ofl£q:t])9rf./CII~6fentfs
Table 6.3 Variation of tension set with percentage of EPDM for sulphur cured and
resin cured EPDM/CIIR blends
Percentage Tension set values for Tension set values for
of EPDM sulphur cured blends (%) resin cured blends (%)
(%) 24 hrs 48 hrs 72 hrs 24 hrs 48 hrs 72 hrs
0 - - - 76 122 -
20 97.5 - - 88 128 -
40 1 17 - - 94 136 144
60 128 - - 98 126 132
80 136 - - 112 132 136
100 141 158 - 118 138 142
Hardness and abrasion resistance of the resin cured vulcanizates are higher than
that of sulphur cured vulcanizates. Figure 6.8 shows the variation of hardness and
figure 6.9 shows the variations of abrasion resistance with blend composition for
sulphur cured and resin cured EPDM/CIIR blends. On increasing the concentration
of EPDM, the elasticity of rubber chains get reduced leading to increased hardness.
For a given rubber compound in addition to crosslink density, abrasion resistance
is influenced by hardness of the vulcanizate. 17.18 Hence the abrasion resistance also
increases with increase in EPDM content of the blend.
71
<" 69 e 67 0 .c 65 !!!. 63 Cl) Cl)
61 4> c: "E 59 ca 57 l:
55
o 20 40 60 80 100
Percentage of EPDM
Figure 6.8 Variation of hardness with percentage of EPDM for EPDM/ClIR
blends . • , sulphur cured and ... , resin cured blends

§ 0.4 III In
0.35 ..2 -J:. 0.3 01 'iij J 0.25 £: 0 ·in 0.2 ~
.J:l 0.15 < 0 20 40 60 80 100
Percentage of EPDM
Figure 6.9 Variation of abrasion weight loss with percentage of EPDM for
EPDMlCIIR blends .• , sulphur cured and ., resin cured blends
The results of rebound resilience with blend composition for resin cured and SUlphur
cured blends are shown in figure 6.10. Compared with sulphur cured blends there is only
slight variation for the resin cured blends because resilience is primarily an inherent
property of the elastomer. As expected, the resilience value decreases with increase in
chlorobutyl content related to the inherent high strain energy density of chlorobutyI. The
viscoelastic properties of CllR are a reflection of the molecular structure of the
polyisobutylene chain. This molecular chain with two methyl side groups on every other
chain carbon atom possesses greater delayed elastic response to deformation. 19,20
;i 49 ~ \\) u 39 c ~ 'iij 29 !!! '0 c 19 ::s 0
.J:l QI ~ 9
0 20 40 60 80 100
Percentage of EPDM
Figure 6.10 Variation of rebound resilience with percentage of EPDM for
EPDM/CIlR blends .• , sulphur cured and ., resin cured blends

'Effect of resin curine on tlie meclianica{ properties of'E®YM/CII<J{6fetufs
The Increment in cut length against number of flexing cycles is given in figure
6.11. The results showed that the resin cured vulcanizates have a higher cut growth
resistance than the sulphur cured ones. In addition to the improved interaction
between the rubber matrices, the crosslinking in resin curing was by activated
phenolic resin, so that the crosslinks formed are much flexible compared to the S-S
bonds formed in the case of sulphur curing. With the increase in chlorobutyl
content, the flex crack resistance increases which is due to its inherent high
viscoelastic nature. tt,22
.s::; 21 -Cl 18 c ~ 15 '5~ (.J E 12 .= E 9 -~ C GI 6 E ~ 3 (.J
£ 0
0 20 40 60 80 Flexing cycles X 10000
Figure 6.11 Plot of increment in cut length against flexing cycles for resin cured
EPDM/CIIR blends at a precut of 2.0 mm. -, 100/0; ., 80/20; >K, 60/40; ., 40/60;
.,20/80; +, 01100
6.4 Conclusions
The mechanical properties of EPDMJClIR blends, which are influenced by uniform
crosslinking of both the phases and in the interphase were remarkably improved by
resin curing. This is due to the reduced curative migration owing to the larger size
of the phenolic resin molecules when compared with the curatives used in sulphur
curing. The properties are found to be an average of the component elastomers. Of
all the properties studied the best performance by resin cured vulcanizates over
sulphur cured counterparts is in the outstanding thermal ageing resistance due to
the superior thennal deb'Tadation resistance of phenolic resin linkages.

References
G.R. Hamed, Rubber Chern. Technol., 55, ISI (1982).
2 AK. Bhowmick and S.K. De, J. Appl. Polym. Sci., 26, 529 (1980).
3 AK. Bhowmick and S.K. De, Rubber Chem. Technol., 53, 960 (1980).
4 AK. Bhowmick and S.K. De, Rubber Chem. Technol., 52, 985 (1979).
5 P.K. Pal, A.K. Bhowmick and S.K. De, Rubber Chem. Technol., 55, 23
(1982).
6 Shvorts, Kautsch. Rez., 7, 31 (1957).
7 AA Yehia, Colloid Polym. Sci., 265, 295 (1987).
8 D.R. Paul and S. Newman, Polymer Blends, vols. I and 11, Academic
Press, N. Y. (1978).
9 Mondragon and J. Nazabal, Polym. Eng. Sci., 25, 178 (1985).
ID P.O. Tawney, J.R. Little and P. Viohl, Rubber Age, 83, ID I (1958).
11 M. Berger, J. Appl. Polym. Sci., 5, 322 (1961).
12 D.M. Bate and RS. Lehrle, Polymer Degradation and Stability, 64, 75
(1999).
13 D. M. Bate and RS. Lehrle, Polymer Degradation and Stability, 62, 67
( 1998).
]4 M.R Grimbley and R.S. Lehrle, Polymer Degradation and Stability, 49,
223 (1995).
15 F.P. Baldwin, D.J. Buckley, 1. Kuntz and S.B. Robison, Rubber and
Plastics Age, 42, 500 (1961).
]6 V.M. Goncharov and LP. Cherenyuk, Khim. Tekhnol. Polim., 3, 13 (1974).
17 P. Thavamani and A.K. Bhowmick, Plast. Rubb. Compos. Process. Appl.,
20, 29 (1993).

l£ffect of resin curino on tlie meclianica{ properties of PlNY.M./CII~ 6femfs
18 Y. Fukahori and H. Yamazaki, Wear, 178,109 (1994).
19 D.F. Kruse and R.C. Edwards, SAE Transactions, 77, 1868 (1968).
20 RC. Puydak and RS. Auda, SAE Transactions, 76, 817 (1967).
21 J.R Beatty, J. Elast. Plast., 11, 147 (1979).
22 A.N. Gent, P.B. Lindley and A.G. Thomas, J. Appl. Polym. Sci., 8, 455
(1964).

aIlptphr VII
Rheology, Air Permeability, Thermal Stability and Thermal Diffusivity Studies on EPDMlCIIR Blends
7.1 Introduction
The processability and typical applications of the blends for use in envelope for
precured retreading are investigated in this chapter. It has been reported that flow
behaviour of polymer melts depends mainly on molecular characteristics,
flow geometry and processing conditions such as temperature, shear rate or
frequency. 1·18
The basic requirement for a pneumatic tube or an envelope is that it must be highly
impermeable to air. Several methods can be used for developing new materials for
commercial applications; among these are the synthesis of new polymers,
copolymerization and blending of miscible polymers etc. 19 Permeation properties
are sensitive to changes in membrane structure such as crystallinity, crosslinking,
additives and phase morpho]ogy.2o-26
Thermal degradation resistance of polymers is another important parameter for
testing the suitability of the material for retreading envelope. Fabrication of a
variety of articles and their end uses need a detailed understanding of the thermal
degradation of polymers.27•28 For products like curing envelope, curing diaphram
etc. the thermal conductivity is a significant parameter because it is the heat
generated within the envelope/diaphram that is transferred to the tyre during
vulcanization. In this study, photo thermal deflection (PTD) technique is used 10
detem1ine the thermal diffusivity of compounds. 29.31

Chaptiit
In the first part of this chapter, the rheological characteristics of EPDM and
chlorobutyl rubbers at different blend compositions over a wide range of
temperatures, shear rates and various curing conditions are investigated. The
extrudate die swell is also investigated to study the elastic behaviour of the blends.
In the second part of the chapter, the air permeation characteristics of EPDM/CIIR
blends under sulphur curing, pre-curing and resin curing conditions is investigated.
In the third part, the thermal stability of EPDM/CIIR blends under varying curing
conditions is investigated along with the effect of blending on thermal stability. In
the concluding part, the thermal diffusivity of various blend compounds 1S
evaluated and methods to improve the thermal diffusivity are also explored.
7.2 Experimental
The compounds for sulphur cured, precured and resin cured blends were prepared
according to ASTM-D 3182 on a laboratory mixing mill (16 x 33 cm) at a friction ratio
of I: 1.25. The rheological measurements were carried out using a capillary rheometer
MCR 3210 attached to the Shimadzu Universal Testing Machine (model-AGl). From
the recorded force and the cross head speed of the plunger, shear stress, shear rate and the
shear viscosity were calculated. The diameter of the extrudate after 48 hours of extrusion
and the swelling index were determined. The cure curves of the mixes were taken at
170°C using a Rubber Process Analyzer. The compounds were then vulcanized up to the
respective optimum cure times on an electrically heated laboratory hydraulic press at
170°C. Penneability measurements were carried out according to ASTM D 1434 (1982)
using air at a flow rate of 500 mVminute. Test specimens of thickness 2 mm were
moulded and used for measurements. The reading was taken at both 40°C and 70 °C
respectively. The equipment used was Lyssy Manomctric Gas Permeability Tester
(L 100-2402). The thermal stability of EPDM, chlorobutyl and their blends were studied
by thennogravimetric analyzer (TGA 0-50, TA Instruments). The thennogravimetric
analysis was carried out under nitrogen atmosphere and samples were scanned from
30-600 °C at a heating rate of 10 CC/minute. A constant sample weight was used in all
cases. Thermal diffusivity of the material is detennincd by photo thermal deflection
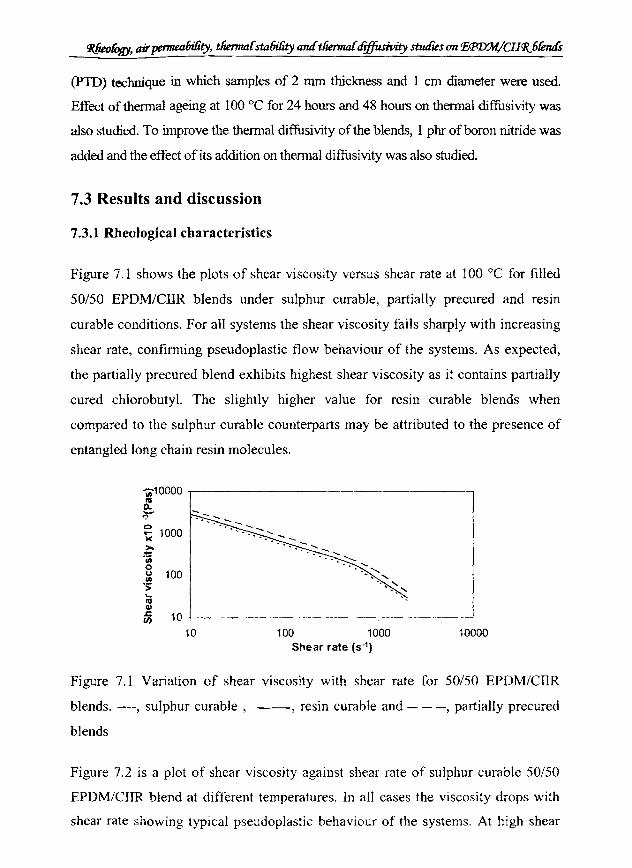
(PTO) technique in which samples of 2 mm thickness and 1 cm diameter were used.
Effect ofthennal ageing at 100°C for 24 hours and 48 hours on thennal diffusivity was
also studied. To improve the thermal diffusivity of the blends, I phr of boron nitride was
added and the effect of its addition on thermal diffusivity was also studied.
7.3 Results and discussion
7.3.1 Rhcological characteristics
Figure 7.1 shows the plots of shear viscosity versus shear rate at 100°C for filled
50/50 EPDM/CIIR blends under sulphur curable, partially precured and resin
curable conditions. For all systems the shear viscosity falls sharply with increasing
shear rate, confirming pseudop1astic flow behaviour of the systems. As expected,
the partially precured blend exhibits highest shear viscosity as it contains partially
cured chlorobutyl. The slightly higher value for resin curable blends when
compared to the sulphur curable counterparts may be attributed to the presence of
entangled long chain resin molecules.
fil10000 ,---------c.. ;r ~ 1000 >-;t: U) 0 CJ 100 U)
'::; '-
"' (I) ..c; 10 Cl)
10 100
...... ", :-.......
" "-'--, " . ....
"" .... '
1000 Shear rate (S·1)
10000
Figure 7.1 Variation of shear viscosity with shear rate for SO/50 EPDM/CIIR
blends. ----, sulphur curable, --, resin curable and - - -, partially precured
blends
Figure 7.2 is a plot of shear viscosity against shear rate of sulphur curable 50/50
EPDM/CIIR blend at different temperatures. In all cases the viscosity drops with
shear rate showing typical pseudoplastic behaviour of the systems. At high shear

rates the temperature has little effect on viscosity and all the points converges to a
small area. The convergence occurs at around 1000 S·I. SO it is clear that at high
shear rate (above 1000 S·l), temperature is not a critical parameter for controlling
the flow properties of blends of EPDM and CIIR. This may be due to the fact that
at higher shear rates, the stress alignment of the long and coiled chains occurs
thereby reducing the resistance to flow and thus lowering down the viscosity. This
shear effect is much higher than the temperature effect.
~ 1000
~ ·Ui o u .~ ... tG CII
.s::. en 10 ~--------------------------------~
10 100 1000 10000
Shear rate (S·l)
Figure 7.2 Shear viscosity against shear rate of sulphur curable SO/50 EPDM/CIIR
blends. ----, 120°C; --, 11 0 QC; - - -, 100°C; and - .. - .. , 90 QC
Figure 7.3 shows the effect of blend ratio on shear viscosity of sulphur curable
bJends at two different shear rates. At both shear rates, the shear viscosity increases
with EPDM content and show maximum value for 100 % EPDM. The viscosities
of the blends fall in between that of pure components which further indicates the
compatible behaviour of the blends. The change in viscosity with EPDM content is
much higher at higher shear rate (501 S·I) than that at lower shear rate (lOO S·I).
Since EPDM possesses higher viscosity than CIlR, the drop in viscosity with shear
rate is also high in the case of EPDM. This may be due to the severe wall slip
mechanism in the case of EPDM. ll At high shear rate, this wall slip is severe and
hence the reduction in viscosity is more compared to that at low shear rate.

i 1000.---------------------------------~
0.. ;r-e:> ..... )(
>. .t:: Cl)
o o Cl) . > ... :g
-
.. -- ........ ,-_ ... ,. .....
-
- - - ... -. - .. - . ~ ........ ........... - - _ ......
~ 100 L--------------------r------,-----~ o 20 40 60 80 100
Pe rce ntage of EPDM
i' "f :J
Figure 7.3 Variation of shear viscosity of EPDM/CIlR blends with percentage of
EPDM at 100°C. ----, shear rate of 501 S-I; --, shear rate of 100 S-I
The extrudate swell characteristics at 100°C for sulphur curable, resin curable and
partially precured 50/50 EPDM/CIJR blends at varying shear rates are shown in
figure 7.4. It is evident from the figure that die swell is maximum for sulphur
curable and least for the partially precured blend. Due to the partial crosslinking of
the CIIR phase, the partially precured blend exhibits better dimensional stability.
The low value of resin curable blend when compared with that of sulphur curable
may be due to the presence of entangled resin molecules which reduces the
dimensional fluctuation thereby lowering the swelling index.
1.8 ._ •.... -.-..... - ........ ---.-.----.. -... . ........ -.. ----.----... .. .. -... -.-._--...... _-_.-
1.7
~ 1.6
£ 1.5
~ 1.4 -; ~ 1.2
1.1
--
1 L-__________________________ ~----~
o 500 1000 1500 2000 2500
Shear rate (S-l)
Figure 7.4 Plot of extrudate swelling index against shear rate of 50/50
EPDM/CTIR blends at 100 QC under varying curing conditions. ----, patially
precured; --, resin curable ,md - - -, sulphur curable blends

0Uij1tif7
Figure 7.5 shows the variation of extrudate die swell for sulphur curable
blends at 100 QC at different rates of extrusion. At low shear rates, the die
swell decreases marginally with increase in CIIR content in the blends. But at
high rate of extrusion, a reverse trend results; the die swell increases sharply
with increasing CIIR content in the blends. This may be due to the fact that
the elastic response of CIIR is much higher than that of EPDM. At high shear
rates the behaviour is more significant as expected. This response gives rise
to high die swell at high rate of extrusion for pure CIIR and blends containing
higher amount of CUR.
2.2
2 >< ell 1.8 " .5 C» 1.6 ,§ Ql 1.4 ~
IIJ 1.2
.. -_ .... ----------------- --------., --".--."".-_ ... --'-------- --.--- ... --.-- ...... -~- .. -. -----. -._"-- ---a
100 80 60 40 20 o Percentage of EPDM
Figure 7.5 Plot of extrudate swelling index of EPDMlCIIR blends with percentage
of EPDM at varying shear rates. - -, 10 S·I; ---, 100 S·l; --,500 S·I; _-, 1000 S·I
and - - -,2000 S·l
7.3.2 Air permeability
The air permeabilities of sulphur cured, precured and resin cured EPDM/CIIR
blends at 40 QC for varying blend compositions are given in figure 7.6. There
is an almost linear variation in permeability with blend composition with
highest permeability for resin cured vuJcanizate and lowest for the precured
one. The air permeation behaviour for the various vuJcanizates follows the
order resin cured > sulphur cured > precured. In both sulphur cured and
precured vu1canizates, efficient vulcanizing system is used resulting in the
formation of higher percentage of stable monosulphidic crosslinks. By

precuring the curative migration is greatly reduced resulting in vulcanizates
with increased crosslink density. This results in stable and compact structure
when compared with the sulphur cured blends. For the resin cured
vulcanizates, the crosslink density is comparatively low. Moreover the
percentage free volume is more due to the bulkier phenolic resin linkages. As
the number of crosslinks per unit volume of the polymer molecules increases,
it becomes very difficult for the gas molecules to pass through the tightly
crosslinked system. Therefore, crosslink density and partly, the nature of
crosslinks, influence the gas permeation behaviour. The variation of
permeability values of the blends at 70 °C with EPDM content are shown in
figure 7.7. As expected, the permeability values increase for the three types of
vulcanizates with EPDM content, the significant increase being for resin
cured vulcanizate. With increase in temperature the flexibility of the chains
increases resulting in an increased free volume. This effect is more
pronounced in the resin cured vulcanizates as the chains are more flexible
leading to an increased air permeability when compared with sulphur cured
and precured blends.
600
500 :>. -~ :: :>. 400 .- III J:I-c III • G)N 300 E.E G)...J 200 c,e ... -~ 100
0 0 20 40 60 80 100
Percentage of EPDM
Figure 7.6 Variation of air permeability at 40 °C for EPDM/CIIR blends under
varying curing conditions. -----, precured; __ , sulphur cured and - - -, resin
cured blends

Cliapter7
600,---------------------------------.
500 >---:: ~ 400 ~~ § 1 300
CII -S 200 c. E '--
~ 100
o ~--~----------_.----------~-----J o 20 40 60 80 100
Percentage of B='OM
Figure 7.7 Variation of air penneability at 70 QC for EPDM/CIIR blends under
varying curing conditions. -----, precured; __ , sulphur cured and - - -, resin
cured blends
7.3.3 Thermal stability
Thennogravimetric plots for sulphur cured EPDM, CIIR and their blends are
given in Figure 7.8. The degradation behaviour of the blends is different from
that of the individual components. The blends are found to possess superior
stability compared to the components. It has been reported that improved stability
can be achieved by the incorporation of a second polymer.32 This is attributed to
the fact that in the pyrolysis of EPDM/CIIR blends, each component degrades in
a manner different from that observed when EPDM and CIIR are degraded
individually. It can be explained by assuming that small radicals that are
generated by chain scission in the first stage of degradation in one elastomer
phase diffuse into the second elastomer phase, hydrogen abstraction takes place,
and the radicals which would nonnally contribute to degradation of the elastomer
phases are thus stabilized.33 But the products of pyrolysis are identical both
qualitatively and quantitatively.

120 ,------------------,
G) 100 i c 80
~ Cl) 60 Cl. .... 40 .r; Cl
~ 20
o . 0 100 200 300 400 500 600
Temperature (QC)
Figure 7.8 TGA curves of sulphur cured EPDM, CIIR and their blends. (l), 100 %
CIIR; (2), 100 % EPDM; (3), 25175 EPDM/CIIR blend; (4), 50/50 EPDM/CIIR
blend and (5), 75/25 EPDM/CIIR blend
The onset decomposition temperatures (T IO), temperature corresponding to 50 %
degradation (T 50) and peak decomposition temperatures corresponding to the peak
value in the DTG curve (T(\) for sulphur cured EPDM, ClIR and their blends arc
given in figure 7.9. Both TIO and Td of the blends increase with increase of
percentage of EPDM in the blends. That is, the thermal stability of the various
blends and elastomers can be ranked as follows: 75/25 EPDM/CIIR blend, 50/50
EPDM/CIIR blend, 25175 EPDM/CIIR blend, EPDM, CIlR. This may be attributed
to the high degree of thermal resistance of EPDM compared to that of pure CIIR.
0-o
+- +--+ 500 -------.-.---.. ---.. -.... -..... -.-.-... ------.. ---.J 450 +
+
350 '----------------------'
o 25 50
Percentage of EPDM
75 100
Figure 7.9 Decomposition temperatures of sulphur cured EPDM, CIlR and their
blends . • , TJ(); ., Tso and +, Td

Figure 7.10 shows the TGA curves of sulphur cured, precured and resin cured
50/50 EPDM/CIIR blends. The characteristic degradation temperatures obtained
from TGA curves are summarized in table 7.1. The onset degradation temperature
i.e. after 10 % of degradation and the degradation temperature obtained from the
peak value of the DTG curve and temperature corresponding to 50 % of
degradation are found to be highest for resin cured and lowest for sulphur cured
vu1canizates. On comparing the decomposition pattern, resin cured blends exhibit
the highest degradation resistance, followed by precured and finally for sulphur
cured blends. The enhancement in thermal stability of precured blends than the
conventional sulphur cured blends may be due to the improved compatibility of the
component elastomers caused by the reduced curative migration. The superior
thermal stability of resin cross linked vu1canizates is due to the formation of C-O-C
linkages, which are more thennally stable than C-S-C linkages in conventional
sulphur cured and precured vulcanizates.
120
Cl) 100 C» 1\1 - 80 c: Cl)
e 60 -III Q.
Precured Sulphur cured --.... 't
:c 40 C»
~ 20
0 0 100 200 300 400 500 600
Temperature (OC)
Figure 7. \0 TGA curves for sulphur cured, precured and resm cured 50/50
EPDM/CIlR blends

Table 7.1 Decomposition temperatures of SO/50 EPDM/CIIR blends under varying
curing conditions
Onset degradation Temperature Peak
Curing corresponding to decomposi tion condition
temperature, T 10 50 % degradation, T 50 temperature, T,!
Cc) Cc) (0C)
Sulphur 374.63 468.39 479.28
curing
Precuring 383.72 477.54 483.22
Resin 416.79 484.55 486.03
cunng
7.3.4 Thermal diffusivity
Figure 7.11 shows the variation of thermal diffusivity of EPDMlCIIR blends under
unaged conditions and after 24 and 48 hours of ageing. Even though CIIR is slightly
polar, the thermal conductivity value is maximum for EPDM and blends containing
higher percentage of EPDM possibly due to the increased extent of interaction between
EPDM and carbon black. The thermal diffusivity values increase marginally with
ageing, This is probably due to the post vulcanization reaction which strengthens the
network thereby making the structure more rigid and compact so that the thermal
vibrdtions can more easily pass through the materiaL
0.16 r--------------------,
>. 0.14 :; 0.12 'iii ~ -;n 0.1 ;g 1 0.08 - IJ § _ 0.06
GJ 0.04 - " -. t= 0.02
o ~----------------~ o 20 40 60 80 100
Percentage of EPDM
Figure 7,11 Variation of thermal diffusivity of EPDM/CTTR blends with percentage
ofEPDM. ----, unaged; -, 24 hours of ageing and ---,48 hours of ageing

Cliapter 7
The effect of addition of one phr of boron nitride on thennal diffusivity of the
blend compounds is shown in figure 7.12. As seen from the figure, the addition of
boron nitride increases the thermal diffusivity of all the compounds abruptly. The
highest fluctuation is shown by EPDM. Boron nitride resembles graphite in its
structure and the presence of free electrons enhances the thermal diffusivity of the
samples. These results are highly attractive, especially for products like curing
diaphragms, envelopes etc. where the increased thermal diffusivity not only
enhances the green tyre curing rate but also may reduce the extent of bladder
degradation.
0.35·
0.3
0.25
0.2
0.15
0.1
0.05
o L-____ ~------~--~----------------~
o 20 40 60 80 100
Percentage of EPDM
Figure 7.12 Effect of boron nitride on thermal diffusivity of EPDM/CIIR blends.
---, samples containing boron nitride and ----, samples without boron nitride
7.4 Conclusions
The study shows that, among the precured, sulphur cured and resin cured blends,
highest shear viscosity, minimum die swell and lowest air permeability are
observed for precured blends which indicate the superiority of the precured blends
compared to the conventional blends while the thermal degradation resistance is
maximum for resin cured vu\canizates. Thus, it can be concluded that the thermal
degradation resistance of EPDM/CIIR blends can be improved by resin curing
whereas better air impermeability and retention of dimensional stability can be
achieved by precuring. Among the sulphur cured blends, lowest air permeability is

for chlorobutyl whereas highest thermal degradation resistance, thermal diffusivity
and shear viscosity is for EPDM. The thermal diffusivity can be improved by the
addition of boron nitride. In general, the blends exhibit an additive behaviour and a
compromise of properties can be attained by using a blend containing 60 % EPDM
and 40 % ClIR.

Cfiapter 7
References
1 J.A. Brydson, Flow Properties of Polymer Melts, Godwin, London (1981).
2 M.S. Jaeovie, D. Polloek and R.S. Porter, J. Appl. Polym. Sei., 23, 517
(1979).
3 D.C. Huang and R.N. Shroff, J. Rheol., 25, 605 (1981).
4 H.J. Yoo and C.D. Han, J. Rheol., 25, 115 (1981).
5 J.Z. Liang, Y.O. Huang, G.J. Tang and J.N. Ness, Plast. Rubb. Comp.
Proe. Appl., 18,311 (1992).
6 C.Y. Ma, J.L. White, F.e. Weisset and K. Min, J. Non-Newtonian Fluid
Meeh., 17,275 (1985).
7 C.Y. Ma, J.L. White, F.e. Weisset, K.A.T. Isayev, N. Nakajima and K.
Min, Rubber Chem. Teehnol., 58, 815 (1985).
8 J.D. Ferry, Viseoelastie Properties of Polymers, Wiley, N.Y. (1990).
9 M.L. Williams, R.F. Landel and J.O. Ferry, J. Am. Chem. Soc., 77, 3701
(1955).
lO Ajji, P. Sammut and M.A. Huneault, J. Appl. Polym. Sei., 88, 3070 (2003).
11 T. Hameed and lA. Hussein, Polymer, 43, 6911 (2002).
12 Moly, Z. Oommen and G. Bhagawan, J. Appl. Polym. Sei., 86, 32lO
(2002).
13 H. Lovisi, A.L. Silva, and L.e. Maria, 1. Appl. Polym. Sei., 89, 1690
(2003).
14 J.M. Huang, H.J. Cheng and J.S. Wu, J. Appl. Polym. Sei., 89, 1471
(2003).
15 A.L. Silva, M.e. Roeha and F.M. Coutinho, Polym. Test., 21, 289 (2002).
16 S. Li, P.K. Jarvela and P.A. Jarvela, J. Appl. Polym. Sei., 71,1649 (1999).
17 J. Yang, D. Shi and Y. Gao, J. Appl. Polym. Sei., 88, 206 (2003).

CJ(lieofooy, air permea6i£ty, tliemuJf sta6i£ty and tliermaf aiffusivity Stua1£S on 'FiPIYM!CII<1{6fetufs
18 J. Gao, D. Li and D. Wang, Eur. Polym. J., 36, 2517 (2000).
19 D.R. Paul, J.W. Barlow, H. Keskkula and M.B. Overberger-Menges,
Encyclopedia of Polymer Science and Engineering, Vo!. 12, Wiley, N.Y.
( 1998).
20 S.T. Hwang, e.K. Choi and K. Kammermeyer, Sep. Sci., 9,461 (1974).
21 K. Toi, G. Morel and D.R. Paul, J. Appl. Polym. Sci., 27, 2997 (1982).
22 RT. Chem, F.R Shes, L. Jion, V.T. Stannett and H.B. Hopfenberg,
J. Membr. Sci., 35, 103 (1987).
23 J.S. Chiou, Y. Maede and D.R Paul, J. Appl. Polym. Sci., 35, 1823 (1987).
24 K.E. Min and D.R. Paul, J. Polym. Sci., Phys. Ed., 26,1021 (1988).
25 D.R.B. Walker and W.J. Koros, 1. Membr. Sci., 55, 99 (1991).
26 Y. Ichiraku, S.S. Stem and T. Nakagawa, 1. Membr. Sei., 34, 5 (1987).
27 N. Grassie, Le. McNeil and I.F. McLaren, Eur. Polym. J., 6,679 (1970).
28 B. Dodson and I.C. McNeil, J. Polym. Sci., Polym. Chem. Edn., 14, 353
(1976).
29 Rosencwaig, J. OpsaJ, W. L. Smith and D. L. Willenborg, Appl. Phys.
Lett., 46, 10 I3 (1985).
30 R. W. Boyd, Nonlinear Optics, Academic Press, London (1992).
31 M. Terazima, Adv. Photochem., 24, 255 (1998).
32 N. Grassie, Encyl. of Polym. Sci. Technol., VoL 4., John Wiley and Sons,
Inc., N.Y. (1967).
33 I.e. McNcil and S.N. Gupts, Polym. Degrad. Stab., 2, 95 (1980).

(fflptpier VIII Summary and Conclusions
The main objective of this work has been to develop blends of EPDM and CllR
rubbers to utilize the high ageing resistance of EPDM and the air impenneability of
ClIR. Compatibility, morphology and physical properties of the blends were
investigated as a function of blend composition and curing systems. The major
conclusions of the study are summarized below.
The degree of compatibility of different grades of EPDM with a particular grade of
ClIR was investigated. From the analysis of mechanical properties and ageing
resistance it was found that, out of the four grades used, two grades of EPDM
(301-T and NDR-4640) are compatible with CIIR. The morphological studies
justified this observation. This behaviour is explained on the basis of the
comparable viscosities and extent of unsaturation of the components of these
blends. Both these blends give rise to an additive behaviour of mechanical
properties with blend composition suggesting covulcanisation. The effect of
cOIHpat!biIiser, chlorosulfonated polyethylene (CSPE), on the comparatively less
compatible EPDM/CIJR blends was investigated. The resulting blends were
characterized for their morphological and mechanical properties. The results
obtained from the various analysis suggest that 10 phr of CSPE can be effectively
used as a compatibiliscr for certain incompatible EPDM/CIIR blends.
A detailed study on the physical properties of sulphur cured blends of EPDM and
CIlR with respect to blend ratio, ageing resistance etc. have been conducted. The
sulphur cured EPDM/ClIR vulcanizates are found to display linear or bettcr
variation in mcchanical, physical and other properties with blend composition.
Although good mechanical properties are exhibited by NDR-4640ICITR blends,

CliapteT8
their thennal and steam ageing resistance is low. On the other hand, resilience, flex
crack resistance and ageing resistances are better for 301-T/CIIR blends which is
probably due to the comparatively Iow viscosity and more saturated nature of
301-T. Based on the physical property studies, 301-T/CIIR blends are found to be
most promising for high temperature applications such as curing envelopes,
conveyor belts etc.
Two methods have been tried to further improve the mechanical properties of
compatible blends of EPDM with CIIR. Both the methods directed at developing a
satisfactory network structure in each of the phases and at the interface.
First method investigated was precuring of the CIIR or EPDM phase to a Iow level
prior to blending so that optimum crosslink densities can develop in both elastomer
phases and at the interface after final curing. The distribution of curing agents and
fillers in both the components of an elastomer blend plays a vital role in
detennining the curing behaviour and vu1canizate properties of the blend. The
distribution of curatives and fillers largely depends on the nature of elastomers. It
was found that precuring chlorobutyl to a low level followed by blending with
EPDM and then curing the blend is an efficient way of obtaining optimum
crosslink density in both the elastomer phases and in the interphase. Precuring
possibly slowed down the migration of curatives from CIIR to EPDM. This novel
route is found to improve the mechanical properties of EPDM/CIlR blends
significantly over their conventional counterparts. The processing safety of the
blend compounds was not affected by precuring.
Second method adopted was resin curing of NDR-4640/CIIR blends. It is known
that resinous linkages provide vulcanized networks of outstanding heat resistance.
It was found that in addition to the improved ageing resistance, the mechanical
properties, which are influenced by unifonn crosslinking of both the phases and in
the interphase are remarkably improved by resin curing. This may be due to the
reduced curative migration owing to the larger size of phenolic resin molecules

Summary anti Concfusions
when compared with the curatives used in sulphur curing. The properties are found
to be a weighted average of the properties of the component elastomers.
Considering the remarkable improvement in the ageing resistance during resin
curing over sulphur cured counterparts, the resin cured blends form a very useful
class of rubbers for high temperature applications.
In the concluding chapter, investigations on the processability and the specific
requirements of the blends inorder to use them for fabrication of products such as
curing envelope are discussed.
The rheological evaluation showed that among the precured, sulphur cured and
resin cured blends, highest shear viscosity and minimum die swell are observed for
precured blends and maximum for sulphur cured blends. The shear viscosities of
both pure systems and blends decrease with increase in shear rate at all
temperatures. At high shear rates the temperature has little effect on viscosity and
all the points converges to a small area. This shows that effect of shear surpasses
the effect of temperature for controlling the flow properties of blends of EPDM and
CIlR- The viscosity of pure CIIR is lower than that of pure EPDM at higher shear
rates and the viscosities of the blends were in between that of pure components. At
low shear rate at 100 DC, the die swell decreased slowly with increase in CUR
content in the blends but at higher shear rate, the die swell increased with increase
in both temperature and CIIR content in the blends.
The thermal deb'Tadation resistance is the maximum for resin cured EPDM/CIIR
vulcanizates and highest thermal degradation resistance was for blends containing
higher percentage of EPDM than that of pure EPDM. Thus blending improved the
thermal degradation resistance of e1astomers. Air permeability was found to be
minimum for precurcd blends and among them, least air permeability was for
blends containing higher percentage of chlorobutyl.
The thennal diffusivity was highest for EPDM and blends containing higher
percentage of EPDM, possibly due to the increased extent of interaction between

Cliapter8
EPDM and carbon black. The thermal diffusivity values increased slightly with
ageing. The thermal diffusivity of elastomers and their blends can be improved
significantly by the addition of small amounts of boron nitride. This is highly
attractive, especially for products like curing diaphrams, envelopes etc. where the
increased thermal diffusivity not only enhances the green tyre curing rate but also
may reduce the extent of bladder degradation. In general, the blends exhibit an
additive behaviour and an optimum compromise of properties can be attained by
using a blend containing 60 % EPDM and 40 % CIIR.
It can be concluded that 60/40 EPDM/CIIR blend can be used for the high
temperature applications especially for the manufacture of hot air curing envelopes
as this particular blend composition satisfies the required envelope features in
terms of tensile strength, tear strength, ageing resistance, flex crack resistance,
thermal diffusivity and air permeability. Therefore it is possible to fabricate curing
envelopes having attractive properties with this blend.

ASTM
BUR
BR
CBS
CIIR
CR
CSPE
DPG
DCPD
DMA
DSC
EA
EPDM
EPM
ENB
HAF
HR
MBT
NBR
NR
PET
PTD
PMMA
PPO
PVC
SBR
SEM
TEM
LIST OF ABBREVIATIONS AND SYMBOLS
American society for testing and materials
Bromobutyl rubber
Polybutadiene rubber
N-cyclohexyl-2-benzthiazyl sulphenamide
Chlorobutyl rubber
Chloroprene rubber
Chlorosulfonated polyethylene
Diphenyl guanidine
Dicyclopentadiene
Dynamic mechanical analyzer
Differential scanning calorimeter
Elastomeric alloys
Ethylene-propy lene-diene terpolymer
Ethylene-propylene copolymer
Ethylidene norbomene
High abrasion fumance
Butyl rubber
Mercapto benzthiazole
Acrylonitrile-butadiene rubber
Natural rubber
Polyethylene terephalate
Photo thermal deflection
Poly methyl methacrylate
Poly (2,6-dimethyl-l,4-phenylene oxide)
Polyvinyl chloride
Styrene-butadiene rubber
Scanning electron microscope
Transmission electron microscope

List 0/ a66reviaitOrls antf sym60fs
TETD
TGA
TMTD
UTM
ZDC
C
D
de
En
F
1.: k
q
rpm
Tetra ethyl thiuram disulphide
Thermogravimetric analyzer
Tetramethyl thiuram disulphide
Universal testing machine
Zinc diethyl dithiocarbamate
Cross-sectional area of plunger
Weight of the absorbed solvent
Specific heat capacity
Thermal diffusivity
Diameter of the capillary
Diameter of the extrudate
Deswollen weight
Storage modulus
Loss modulus
Force applied at a particular shear rate
Length of the capillary
Thermal conductivity
Number average molecular weight of rubber chains between
crosslinks
Parts per hundred rubber
Air permeability of sample
Air permeability of reference
Volumetric flow rate
Revolutions per minute
Air permeance time for the reference
Air pcrmeance time for the sample
G lass transition temperature
Volume of extrudate
Volume fraction of rubber in the solvent swollen sample

Vro
Vs
~Em
~Gm
~Hm
~Sm
11
tan b
<p
X
Pr
Ps
8,
List of a55reviations and sym50fs
Value ofVr for filled vulcanizates
Molar volume of solvent
Internal energy change during mixing
Free energy change during mixing
Enthalpy change during mixing
Entropy change during mixing
Shear stress at wall
Shear rate at wall
Flow behaviour index
Apparent shear rate at wall
Shear viscosity
Loss tangent
Volume fraction of component
Polymer-solvent interaction parameter
Density of rubber
Density of solvent
Solubility parameter

PUBLICATIONS AND PRESENTATIONS
1. EPDM-CIIR blends: Improved mechanical properties through precuring
Sunil Jose T, Rani Joseph
International Journal of Polymeric Materials (2006, Accepted)
2. Compatibility studies on EPDM/CIIR blends
Sunil Jose T, Rani Joseph
European Polymer Journal (Communicated)
3. Studies on sulphur cured EPDM/CIIR blends
Sunil Jose T, Rani Joseph
Journal of Applied Polymer Science 2006 (Communicated)
4. Effect of resin curing on the mechanical properties of EPDM/CIIR blends
SuniI Jose T, Anoop Anand K, Rani Joseph
Polymer Bulletin 2006 (Communicated)
5. EPDM/CIIR blends: Thermal, RheologicaI and Permeability studies
Sunil Jose T, Rani Joscph
Polymer 2006 (to be submitted)
6. Sunil Jose T, Anoop Anand K, K.E. Gcorge and Rani Joseph
International conference, Asia Rub Teeh Expo '06
Nov 23-25, 2006, Cochin, India
7. Jose S, Anand A and Joseph R
I i" Annual General Meeting of Materials Research Society of India
AGM-MRSI
Feb 13-15,2006, University of Lueknow, India

List of pu6lications and presentations
8. Sunil Jose T and Rani Joseph
National Conference on Frontiers in Polymer Science and Technology
POLYMER 2006
Feb 10-12, 2006, Indian Association for the Cultivation of Science,
Jadavpur, Kolkata, India
9. Sunil Jose and Rani Joseph
15th Annual General Meeting of Materials Research Society of India,
AGM-MRSI
Feb 8-1 I, 2004, Banaras Hindu University, Varanasi, India
10. Sunil Jose T, Anoop Anand K, K.E. Gcorge and Rani Joseph
International Seminar on Advances in Polymer Technology- APT '04
Jan 16-17,2004, CUSAT, Cochin, India